
UNITED STATES
SECURITIES AND EXCHANGE COMMISSION
Washington, D.C. 20549
FORMN-CSRS
CERTIFIED SHAREHOLDER REPORT OF REGISTERED
MANAGEMENT INVESTMENT COMPANIES
Investment Company Act file number:811-09253
Wells Fargo Funds Trust
(Exact name of registrant as specified in charter)
525 Market St., San Francisco, CA 94105
(Address of principal executive offices) (Zip code)
Alexander Kymn
Wells Fargo Funds Management, LLC
525 Market St., San Francisco, CA 94105
(Name and address of agent for service)
Registrant’s telephone number, including area code:800-222-8222
Date of fiscal year end: June 30
Registrant is making a filing for 13 of its series:
Wells Fargo California Limited-TermTax-Free Fund, Wells Fargo CaliforniaTax-Free Fund, Wells Fargo ColoradoTax-Free Fund, Wells Fargo High Yield Municipal Bond Fund, Wells Fargo IntermediateTax/AMT-Free Fund, Wells Fargo MinnesotaTax-Free Fund, Wells Fargo Municipal Bond Fund, Wells Fargo North CarolinaTax-Free Fund, Wells Fargo PennsylvaniaTax-Free Fund, Wells Fargo Short-Term Municipal Bond Fund, Wells Fargo Strategic Municipal Bond Fund, Wells Fargo Ultra Short-Term Municipal Income Fund, and Wells Fargo WisconsinTax-Free Fund.
Date of reporting period: December 31, 2018
ITEM 1. REPORT TO STOCKHOLDERS
Semi-Annual Report
December 31, 2018

Wells Fargo
California Limited-Term Tax-Free Fund

Beginning on January 1, 2021, as permitted by new regulations adopted by the Securities and Exchange Commission, paper copies of the Wells Fargo Funds’ annual and semi-annual shareholder reports issued after this date will no longer be sent by mail, unless you specifically request paper copies of the reports. Instead, the reports will be made available on the Funds’ website, and you will be notified by mail each time a report is posted and provided with a website address to access the report.
If you already elected to receive shareholder reports electronically, you will not be affected by this change and you need not take any action. You may elect to receive shareholder reports and other communications from the Fund electronically at any time by contacting your financial intermediary (such as a broker-dealer or bank) or, if you are a direct investor, by calling 1-800-222-8222 or by enrolling at wellsfargo.com/advantagedelivery.
You may elect to receive all future reports in paper free of charge. If you invest through a financial intermediary, you can contact your financial intermediary to request that you continue to receive paper copies of your shareholder reports; if you invest directly with the Fund, you can call 1-800-222-8222. Your election to receive reports in paper will apply to all Wells Fargo Funds held in your account with your financial intermediary or, if you are a direct investor, to all Wells Fargo Funds that you hold.

Reduce clutter. Save trees.
Sign up for electronic delivery of prospectuses and shareholder reports atwellsfargo.com/advantagedelivery
Contents
The views expressed and any forward-looking statements are as of December 31, 2018, unless otherwise noted, and are those of the Fund managers and/or Wells Fargo Funds Management, LLC. Discussions of individual securities, or the markets generally, or any Wells Fargo Fund are not intended as individual recommendations. Future events or results may vary significantly from those expressed in any forward-looking statements. The views expressed are subject to change at any time in response to changing circumstances in the market. Wells Fargo Funds Management, LLC and the Fund disclaim any obligation to publicly update or revise any views expressed or forward-looking statements.
INVESTMENT PRODUCTS: NOT FDIC INSURED ◾ NO BANK GUARANTEE ◾ MAY LOSE VALUE
| | | | |
| 2 | | Wells Fargo California Limited-Term Tax-Free Fund | | Letter to shareholders (unaudited) |

Andrew Owen
President
Wells Fargo Funds
Global trade tensions escalated during the third quarter of 2018.
Dear Shareholder:
We are pleased to offer you this semi-annual report for the Wells Fargo California Limited-Term Tax-Free Fund for the six-month period that ended December 31, 2018. During the reporting period, the U.S. generated encouraging economic and business data that was offset by less positive and more inconsistent data from international markets. Investment returns were generally negative as geopolitical tensions and uncertainty tended to distract investors from more favorable underlying trends.
For the period, U.S. stocks, as measured by the S&P 500 Index,1 fell 6.85% and international stocks, as measured by the MSCI ACWI ex USA Index (Net),2 declined 10.84%. Based on the MSCI EM Index (Net),3 emerging market stocks lost 8.48%. For bond investors, the Bloomberg Barclays U.S. Aggregate Bond Index4 gained 1.65% while the Bloomberg Barclays Global Aggregate ex-USD Index5 fell 0.84%. The Bloomberg Barclays Municipal Bond Index6 gained 1.53% while the ICE BofAML U.S. High Yield Index7 declined 2.34%.
Global trade tensions prompted investor concerns.
Global trade tensions escalated during the third quarter of 2018. The U.S. imposed tariffs on a wide range of products manufactured overseas. Foreign governments retaliated with tariffs that punished U.S. commodity producers and product manufacturers. Investors wondered about next steps as divergence in global economic policies and growth prospects widened.
During the summer months, the U.S. economy strengthened. Revised second-quarter gross domestic product (GDP) growth data released in August showed the U.S. economy growing at a 4.2% rate. The unemployment rate in the U.S. was 3.7% by the end of September, according to the U.S. Department of Labor. Wages showed more consistent growth, and consumer confidence remained strong. Several U.S. equity market indices reached records during August, with the S&P 500 Index gaining 7.71% for the three-month period that ended September 30, 2018. In contrast, the MSCI ACWI ex USA Index (Net) gained 0.71% while the MSCI EM Index (Net) declined 1.09% during the same three-month period.
| 1 | The S&P 500 Index consists of 500 stocks chosen for market size, liquidity, and industry group representation. It is a market-value-weighted index with each stock’s weight in the index proportionate to its market value. You cannot invest directly in an index. |
| 2 | The Morgan Stanley Capital International (MSCI) All Country World Index (ACWI) ex USA Index (Net) is a free-float-adjusted market-capitalization-weighted index that is designed to measure the equity market performance of developed markets, excluding the United States and Canada. Source: MSCI. MSCI makes no express or implied warranties or representations and shall have no liability whatsoever with respect to any MSCI data contained herein. The MSCI data may not be further redistributed or used as a basis for other indices or any securities or financial products. This report is not approved, reviewed, or produced by MSCI. You cannot invest directly in an index. |
| 3 | The MSCI Emerging Markets (EM) Index (Net) is a free-float-adjusted market-capitalization-weighted index that is designed to measure large- and mid-cap equity market performance of emerging markets. The MSCI EM Index (Net) consists of the following 24 emerging market country indices: Brazil, Chile, China, Colombia, Czech Republic, Egypt, Greece, Hungary, India, Indonesia, Korea, Malaysia, Mexico, Pakistan, Peru, the Philippines, Poland, Qatar, Russia, South Africa, Taiwan, Thailand, Turkey, and the United Arab Emirates. You cannot invest directly in an index. |
| 4 | The Bloomberg Barclays U.S. Aggregate Bond Index is a broad-based benchmark that measures the investment-grade, U.S. dollar-denominated, fixed-rate taxable bond market, including Treasuries, government-related and corporate securities, mortgage-backed securities (agency fixed-rate and hybrid adjustable-rate mortgage pass-throughs), asset-backed securities, and commercial mortgage-backed securities. You cannot invest directly in an index. |
| 5 | The Bloomberg Barclays Global Aggregate ex-USD Index is an unmanaged index that provides a broad-based measure of the global investment-grade fixed-income markets excluding the U.S. dollar-denominated debt market. You cannot invest directly in an index. |
| 6 | The Bloomberg Barclays Municipal Bond Index is an unmanaged index composed of long-term tax-exempt bonds with a minimum credit rating of Baa. You cannot invest directly in an index. |
| 7 | The ICE BofAML U.S. High Yield Index is a market-capitalization-weighted index of domestic and Yankee high-yield bonds. The index tracks the performance of high-yield securities traded in the U.S. bond market. You cannot invest directly in an index. Copyright 2018. ICE Data Indices, LLC. All rights reserved. |
| | | | | | |
| Letter to shareholders (unaudited) | | Wells Fargo California Limited-Term Tax-Free Fund | | | 3 | |
Economic signals overseas were mixed as the third quarter ended and the fourth quarter began. In particular, signs of slowing economic growth in China created uncertainty for investors. Amid rising trade tensions, the People’s Bank of China cut reserve requirement ratios and accelerated infrastructure spending and tax cuts for business enterprises and individuals. Nevertheless, a strengthening U.S. dollar and trade tensions remained headwinds for investors overseas.
Equity markets were volatile during the fourth quarter.
Negative stock market performance during October and December bracketed a mildly positive November, as measured by the S&P 500 Index and the MSCI ACWI ex USA Index (Net). As interest rates and bond yields gained during October, stock markets struggled. Readings on consumer sentiment and business spending were mixed. Markets rebounded in November. The U.S. and China agreed to halt further increases in tariffs and engage in additional negotiations. While November returns were positive, the loss for the full fourth quarter was substantial for equity investors globally, with the S&P down 13.52% and the MSCI ACWI ex USA Index (Net) down 11.46%. December’s S&P 500 Index performance was the lowest since 1931. Globally, fixed income investments fared better than stocks during the last two months of the year as conflicting signals unsettled investors’ outlooks.
Equity investors confronted a number of changing conditions. In November’smid-term elections, control of the U.S. House of Representatives shifted from Republicans to Democrats, presaging potential partisan disputes. Progress on Brexit negotiations stalled in the UK. In China, the value of the yuan declined to low levels last seen in 2008. Oil prices continued to fall. The Fed increased the federal funds rate by 25 bps to a target range of between 2.25% and 2.50% in December 2018. A late-December dispute over spending and immigration policy resulted in a partial U.S. government shutdown that continued through the end of the period.
Don’t let short-term uncertainty derail long-term investment goals.
Periods of investment uncertainty can present challenges, but experience has taught us that maintaining long-term investment goals can be an effective way to plan for the future. To help you create a sound strategy based on your personal goals and risk tolerance, Wells Fargo Funds offers more than 100 mutual funds spanning a wide range of asset classes and investment styles. Although diversification cannot guarantee an investment profit or prevent losses, we believe it can be an effective way to manage investment risk and potentially smooth out overall portfolio performance. We encourage investors to know their investments and to understand that appropriate levels of risk-taking may unlock opportunities.
Thank you for choosing to invest with Wells Fargo Funds. We appreciate your confidence in us and remain committed to helping you meet your financial needs.
Sincerely,

Andrew Owen
President
Wells Fargo Funds
Economic signals overseas were mixed as the third quarter ended and the fourth quarter began.
For further information about your Fund, contact your investment professional, visit our website atwellsfargofunds.com, or call us directly at1-800-222-8222.
| | | | |
| 4 | | Wells Fargo California Limited-Term Tax-Free Fund | | Performance highlights (unaudited) |
Investment objective
The Fund seeks current income exempt from federal income tax and California individual income tax, consistent with capital preservation.
Manager
Wells Fargo Funds Management, LLC
Subadviser
Wells Capital Management Incorporated
Portfolio managers
Terry J. Goode
Adrian Van Poppel
Average annual total returns (%) as of December 31, 2018
| | | | | | | | | | | | | | | | | | | | | | | | | | | | | | | | | | |
| | | | | Including sales charge | | | Excluding sales charge | | | Expense ratios1 (%) | |
| | | Inception date | | 1 year | | | 5 year | | | 10 year | | | 1 year | | | 5 year | | | 10 year | | | Gross | | | Net2 | |
| | | | | | | | | |
| Class A (SFCIX) | | 11-18-1992 | | | -1.42 | | | | 1.05 | | | | 2.48 | | | | 0.61 | | | | 1.47 | | | | 2.69 | | | | 0.84 | | | | 0.80 | |
| | | | | | | | | |
| Class C (SFCCX) | | 8-30-2002 | | | -1.15 | | | | 0.73 | | | | 1.93 | | | | -0.15 | | | | 0.73 | | | | 1.93 | | | | 1.59 | | | | 1.55 | |
| | | | | | | | | |
| Administrator Class (SCTIX) | | 9-6-1996 | | | – | | | | – | | | | – | | | | 0.79 | | | | 1.69 | | | | 2.91 | | | | 0.78 | | | | 0.60 | |
| | | | | | | | | |
| Institutional Class (SFCNX)3 | | 10-31-2014 | | | – | | | | – | | | | – | | | | 0.89 | | | | 1.75 | | | | 2.94 | | | | 0.51 | | | | 0.50 | |
| | | | | | | | | |
| Bloomberg Barclays Municipal 1-5 Year Blend Index4 | | – | | | – | | | | – | | | | – | | | | 1.75 | | | | 1.38 | | | | 2.20 | | | | – | | | | – | |
| | | | | | | | | |
| Bloomberg Barclays California Municipal 1-5 Year Blend Index5 | | – | | | – | | | | – | | | | – | | | | 1.72 | | | | 1.29 | | | | 2.22 | | | | – | | | | – | |
Figures quoted represent past performance, which is no guarantee of future results, and do not reflect taxes that a shareholder may pay on fund distributions or the redemption of fund shares. Investment return and principal value of an investment will fluctuate so that an investor’s shares, when redeemed, may be worth more or less than their original cost. Performance shown without sales charges would be lower if sales charges were reflected. Current performance may be lower or higher than the performance data quoted, which assumes the reinvestment of dividends and capital gains. Current month-end performance is available on the Fund’s website, wellsfargofunds.com.
Index returns do not include transaction costs associated with buying and selling securities, any mutual fund fees or expenses, or any taxes. It is not possible to invest directly in an index.
For Class A shares, the maximum front-end sales charge is 2.00%. For Class C shares, the maximum contingent deferred sales charge is 1.00%. Performance including a contingent deferred sales charge assumes the sales charge for the corresponding time period. Administrator Class and Institutional Class shares are sold without a front-end sales charge or contingent deferred sales charge.
Bond values fluctuate in response to the financial condition of individual issuers, general market and economic conditions, and changes in interest rates. Changes in market conditions and government policies may lead to periods of heightened volatility in the bond market and reduced liquidity for certain bonds held by the Fund. In general, when interest rates rise, bond values fall and investors may lose principal value. Interest-rate changes and their impact on the Fund and its share price can be sudden and unpredictable. The use of derivatives may reduce returns and/or increase volatility. Certain investment strategies tend to increase the total risk of an investment (relative to the broader market). The Fund is exposed to California municipal securities risk and high-yield securities risk. Consult the Fund’s prospectus for additional information on these and other risks. A portion of the Fund’s income may be subject to federal, state, and/or local income taxes or the Alternative Minimum Tax (AMT). Any capital gains distributions may be taxable.
Please see footnotes on page 5.
| | | | | | |
| Performance highlights (unaudited) | | Wells Fargo California Limited-Term Tax-Free Fund | | | 5 | |
|
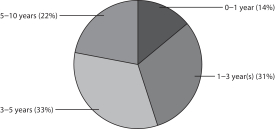
| Effective maturity distribution as of December 31, 20186 |
|
 |
|
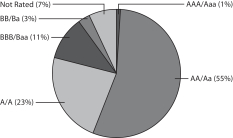
| Credit quality as of December 31, 20187 |
|
 |
| 1 | Reflects the expense ratios as stated in the most recent prospectuses. The expense ratios shown are subject to change and may differ from the annualized expense ratios shown in the financial highlights of this report. |
| 2 | The manager has contractually committed through October 31, 2019, to waive fees and/or reimburse expenses to the extent necessary to cap the Fund’s Total Annual Fund Operating Expenses After Fee Waivers at the amounts shown. After this time, the cap may be increased or the commitment to maintain the cap may be terminated only with the approval of the Board of Trustees. Brokerage commissions, stamp duty fees, interest, taxes, acquired fund fees and expenses (if any), and extraordinary expenses are excluded from the expense cap. Without this cap, the Fund’s returns would have been lower. The expense ratio paid by an investor is the net expense ratio (the total annual fund operating expenses after fee waivers) as stated in the prospectuses. |
| 3 | Historical performance shown for the Institutional Class shares prior to their inception reflects the performance of the Administrator Class shares, and is not adjusted to reflect the Institutional Class share expenses. If these expenses had been included, returns for the Institutional Class shares would be higher. |
| 4 | The Bloomberg Barclays Municipal 1–5 Year Blend Index is the 1–5 Year component of the Bloomberg Barclays Municipal Bond Index. The Bloomberg Barclays Municipal Bond Index is an unmanaged index composed of long-term tax-exempt bonds with a minimum credit rating of Baa. You cannot invest directly in an index. |
| 5 | The Bloomberg Barclays California Municipal 1-5 Year Blend Index is the 1-5 Year component of the Bloomberg Barclays California Municipal Bond Index. You cannot invest directly in an index. |
| 6 | Amounts are calculated based on the total long-term investments of the Fund. These amounts are subject to change and may have changed since the date specified. |
| 7 | The credit quality distribution of portfolio holdings reflected in the chart is based on ratings from Standard & Poor’s, Moody’s Investors Service, and/ or Fitch Ratings Ltd. Credit quality ratings apply to the underlying holdings of the Fund and not to the Fund itself. The percentages of the Fund’s portfolio with the ratings depicted in the chart are calculated based on the total market value of fixed income securities held by the Fund. If a security was rated by all three rating agencies, the middle rating was utilized. If rated by two of three rating agencies, the lower rating was utilized, and if rated by one of the rating agencies, that rating was utilized. Standard & Poor’s rates the creditworthiness of bonds, ranging from AAA (highest) to D (lowest). Ratings from A to CCC may be modified by the addition of a plus (+) or minus (-) sign to show relative standing within the rating categories. Standard & Poor’s rates the creditworthiness of short-term notes from SP-1 (highest) to SP-3 (lowest). Moody’s rates the creditworthiness of bonds, ranging from Aaa (highest) to C (lowest). Ratings Aa to B may be modified by the addition of a number 1 (highest) to 3 (lowest) to show relative standing within the ratings categories. Moody’s rates the creditworthiness of short-term U.S. tax-exempt municipal securities from MIG 1/VMIG 1 (highest) to SG (lowest). Fitch rates the creditworthiness of bonds, ranging from AAA (highest) to D (lowest). Credit quality distribution is subject to change and may have changed since the date specified. |
| | | | |
| 6 | | Wells Fargo California Limited-Term Tax-Free Fund | | Fund expenses (unaudited) |
As a shareholder of the Fund, you incur two types of costs: (1) transaction costs, including sales charges (loads) on purchase payments and contingent deferred sales charges (if any) on redemptions and (2) ongoing costs, including management fees, distribution (12b-1) and/or shareholder servicing fees, and other Fund expenses. This example is intended to help you understand your ongoing costs (in dollars) of investing in the Fund and to compare these costs with the ongoing costs of investing in other mutual funds.
The example is based on an investment of $1,000 invested at the beginning of the six-month period and held for the entire period from July 1, 2018 to December 31, 2018.
Actual expenses
The “Actual” line of the table below provides information about actual account values and actual expenses. You may use the information in this line, together with the amount you invested, to estimate the expenses that you paid over the period. Simply divide your account value by $1,000 (for example, an $8,600 account value divided by $1,000 = 8.6), then multiply the result by the number in the “Actual” line under the heading entitled “Expenses paid during period” for your applicable class of shares to estimate the expenses you paid on your account during this period.
Hypothetical example for comparison purposes
The “Hypothetical” line of the table below provides information about hypothetical account values and hypothetical expenses based on the Fund’s actual expense ratio and an assumed rate of return of 5% per year before expenses, which is not the Fund’s actual return. The hypothetical account values and expenses may not be used to estimate the actual ending account balance or expenses you paid for the period. You may use this information to compare the ongoing costs of investing in the Fund and other funds. To do so, compare this 5% hypothetical example with the 5% hypothetical examples that appear in the shareholder reports of the other funds.
Please note that the expenses shown in the table are meant to highlight your ongoing costs only and do not reflect any transactional costs, such as sales charges (loads) and contingent deferred sales charges. Therefore, the “Hypothetical” line of the table is useful in comparing ongoing costs only and will not help you determine the relative total costs of owning different funds. In addition, if these transactional costs were included, your costs would have been higher.
| | | | | | | | | | | | | | | | |
| | | Beginning
account value
7-1-2018 | | | Ending
account value
12-31-2018 | | | Expenses
paid during
the period¹ | | | Annualized net
expense ratio | |
Class A | | | | | | | | | | | | | | | | |
| | | | |
Actual | | $ | 1,000.00 | | | $ | 1,007.41 | | | $ | 4.05 | | | | 0.80 | % |
| | | | |
Hypothetical (5% return before expenses) | | $ | 1,000.00 | | | $ | 1,021.17 | | | $ | 4.08 | | | | 0.80 | % |
Class C | | | | | | | | | | | | | | | | |
| | | | |
Actual | | $ | 1,000.00 | | | $ | 1,003.61 | | | $ | 7.83 | | | | 1.55 | % |
| | | | |
Hypothetical (5% return before expenses) | | $ | 1,000.00 | | | $ | 1,017.39 | | | $ | 7.88 | | | | 1.55 | % |
Administrator Class | | | | | | | | | | | | | | | | |
| | | | |
Actual | | $ | 1,000.00 | | | $ | 1,008.39 | | | $ | 3.04 | | | | 0.60 | % |
| | | | |
Hypothetical (5% return before expenses) | | $ | 1,000.00 | | | $ | 1,022.18 | | | $ | 3.06 | | | | 0.60 | % |
Institutional Class | | | | | | | | | | | | | | | | |
| | | | |
Actual | | $ | 1,000.00 | | | $ | 1,008.90 | | | $ | 2.53 | | | | 0.50 | % |
| | | | |
Hypothetical (5% return before expenses) | | $ | 1,000.00 | | | $ | 1,022.68 | | | $ | 2.55 | | | | 0.50 | % |
| 1 | Expenses paid is equal to the annualized net expense ratio of each class multiplied by the average account value over the period, multiplied by the number of days in the most recent fiscal half-year divided by the number of days in the fiscal year (to reflect the one-half-year period). |
| | | | | | |
| Portfolio of investments—December 31, 2018 (unaudited) | | Wells Fargo California Limited-Term Tax-Free Fund | | | 7 | |
| | | | | | | | | | | | | | | | |
| Security name | | Interest rate | | | Maturity date | | | Principal | | | Value | |
| | | | |
Municipal Obligations: 97.90% | | | | | | | | | | | | | | | | |
| | | | |
California: 93.44% | | | | | | | | | | | | | | | | |
| | | | |
| Airport Revenue: 6.32% | | | | | | | | | | | | | | | | |
| | | | |
California Municipal Finance Authority Revenue Senior Lien Linxs APM Project Series A | | | 5.00 | % | | | 12-31-2023 | | | $ | 750,000 | | | $ | 831,542 | |
| | | | |
California Municipal Finance Authority Revenue Senior Lien Linxs APM Project Series A | | | 5.00 | | | | 6-30-2024 | | | | 950,000 | | | | 1,059,801 | |
| | | | |
California Municipal Finance Authority Revenue Senior Lien Linxs APM Project Series A | | | 5.00 | | | | 12-31-2024 | | | | 750,000 | | | | 841,793 | |
| | | | |
Los Angeles CA Department of Airports AMT Series B | | | 5.00 | | | | 5-15-2024 | | | | 5,000,000 | | | | 5,704,900 | |
| | | | |
Los Angeles CA Department of Airports AMT Series B | | | 5.00 | | | | 5-15-2025 | | | | 6,000,000 | | | | 6,946,500 | |
| | | | |
Los Angeles CA Department of Airports AMT Series B | | | 5.00 | | | | 5-15-2026 | | | | 2,500,000 | | | | 2,930,900 | |
| | | | |
Los Angeles CA Department of Airports AMT Subordinate Bond Series C | | | 5.00 | | | | 5-15-2024 | | | | 4,315,000 | | | | 4,918,625 | |
| | | | |
Sacramento County CA Airport System Refunding Bond AMT Subordinate Series F | | | 5.00 | | | | 7-1-2021 | | | | 2,585,000 | | | | 2,765,614 | |
| | | | |
Sacramento County CA Airport System Refunding Bond AMT Subordinate Series F | | | 5.00 | | | | 7-1-2022 | | | | 2,590,000 | | | | 2,831,725 | |
| | | | |
Sacramento County CA Airport System Refunding Bond AMT Subordinate Series F | | | 5.00 | | | | 7-1-2023 | | | | 2,585,000 | | | | 2,879,070 | |
| | | | |
Sacramento County CA Airport System Refunding Bond AMT Subordinate Series F | | | 5.00 | | | | 7-1-2024 | | | | 1,760,000 | | | | 1,992,302 | |
| | | | |
| | | | | | | | | | | | | | | 33,702,772 | |
| | | | | | | | | | | | | | | | |
| | | | |
| Education Revenue: 5.07% | | | | | | | | | | | | | | | | |
| | | | |
California Educational Facilities Authority Revenue Loma Linda University Series A | | | 5.00 | | | | 4-1-2024 | | | | 550,000 | | | | 627,622 | |
| | | | |
California Educational Facilities Authority Revenue Loma Linda University Series A | | | 5.00 | | | | 4-1-2026 | | | | 325,000 | | | | 383,000 | |
| | | | |
California Municipal Finance Authority California Baptist University Series A 144A | | | 4.00 | | | | 11-1-2021 | | | | 600,000 | | | | 613,242 | |
| | | | |
California Municipal Finance Authority Charter School Albert Einstein Academies Project Series A | | | 6.00 | | | | 8-1-2023 | | | | 705,000 | | | | 744,360 | |
| | | | |
California Municipal Finance Authority Charter School Revenue Palmdale Aerospace Academy Project Series A 144A | | | 3.88 | | | | 7-1-2028 | | | | 1,400,000 | | | | 1,388,464 | |
| | | | |
California Municipal Finance Authority Revenue Refunding Bond Biola University | | | 5.00 | | | | 10-1-2027 | | | | 790,000 | | | | 933,346 | |
| | | | |
California Municipal Finance Authority Revenue Refunding Bond California Lutheran University | | | 5.00 | | | | 10-1-2021 | | | | 250,000 | | | | 269,298 | |
| | | | |
California Municipal Finance Authority Revenue Refunding Bond California Lutheran University | | | 5.00 | | | | 10-1-2022 | | | | 250,000 | | | | 275,020 | |
| | | | |
California Municipal Finance Authority Revenue Refunding Bond California Lutheran University | | | 5.00 | | | | 10-1-2023 | | | | 225,000 | | | | 252,043 | |
| | | | |
California Municipal Finance Authority Revenue Refunding Bond California Lutheran University | | | 5.00 | | | | 10-1-2024 | | | | 275,000 | | | | 312,353 | |
| | | | |
California Municipal Finance Authority Revenue Refunding Bond California Lutheran University | | | 5.00 | | | | 10-1-2025 | | | | 275,000 | | | | 315,945 | |
| | | | |
California Municipal Finance Authority Revenue Refunding Bond California Lutheran University | | | 5.00 | | | | 10-1-2026 | | | | 300,000 | | | | 347,463 | |
| | | | |
California School Finance Authority Bright Star School Obligation Group 144A | | | 5.00 | | | | 6-1-2027 | | | | 1,860,000 | | | | 1,957,520 | |
| | | | |
California School Finance Authority Classical Academies Project Series A 144A | | | 3.25 | | | | 10-1-2022 | | | | 2,560,000 | | | | 2,538,522 | |
| | | | |
California School Finance Authority Coastal Academy Project Series A 144A | | | 5.00 | | | | 10-1-2022 | | | | 250,000 | | | | 260,265 | |
| | | | |
California School Finance Authority Rocketship Education Series A 144A | | | 5.00 | | | | 6-1-2021 | | | | 310,000 | | | | 316,544 | |
| | | | |
California School Finance Authority Rocketship Education Series A 144A | | | 5.00 | | | | 6-1-2026 | | | | 500,000 | | | | 529,170 | |
| | | | |
California Statewide CDA California Baptist University Series A | | | 5.13 | | | | 11-1-2023 | | | | 715,000 | | | | 757,135 | |
| | | | |
California Statewide CDA School Facilities | | | 5.88 | | | | 7-1-2022 | | | | 1,220,000 | | | | 1,291,175 | |
| | | | |
California Statewide Community Refunding Bond California Baptist University Series A 144A | | | 3.00 | | | | 11-1-2022 | | | | 1,665,000 | | | | 1,667,614 | |
| | | | |
University of California Series AK | | | 5.00 | | | | 5-15-2048 | | | | 10,000,000 | | | | 11,301,900 | |
| | | | |
| | | | | | | | | | | | | | | 27,082,001 | |
| | | | | | | | | | | | | | | | |
The accompanying notes are an integral part of these financial statements.
| | | | |
| 8 | | Wells Fargo California Limited-Term Tax-Free Fund | | Portfolio of investments—December 31, 2018 (unaudited) |
| | | | | | | | | | | | | | | | |
| Security name | | Interest rate | | | Maturity date | | | Principal | | | Value | |
| | | | |
| GO Revenue: 24.68% | | | | | | | | | | | | | | | | |
| | | | |
Alvord CA Unified School District Election of 2007 Series B (AGM Insured) | | | 6.50 | % | | | 8-1-2020 | | | $ | 1,605,000 | | | $ | 1,726,499 | |
| | | | |
Bassett CA Unified School District Refunding Bond Series B (Build America Mutual Assurance Company Insured) | | | 5.00 | | | | 8-1-2019 | | | | 420,000 | | | | 428,224 | |
| | | | |
Bassett CA Unified School District Refunding Bond Series B (Build America Mutual Assurance Company Insured) | | | 5.00 | | | | 8-1-2021 | | | | 550,000 | | | | 594,132 | |
| | | | |
Bassett CA Unified School District Refunding Bond Series B (Build America Mutual Assurance Company Insured) | | | 5.00 | | | | 8-1-2023 | | | | 725,000 | | | | 821,382 | |
| | | | |
California | | | 5.00 | | | | 10-1-2021 | | | | 6,795,000 | | | | 7,384,059 | |
| | | | |
California | | | 5.00 | | | | 11-1-2022 | | | | 2,500,000 | | | | 2,792,600 | |
| | | | |
California | | | 5.00 | | | | 10-1-2023 | | | | 8,400,000 | | | | 9,571,716 | |
| | | | |
California | | | 5.25 | | | | 10-1-2022 | | | | 2,750,000 | | | | 3,090,918 | |
| | | | |
California Refunding Bond Various Purpose Bidding Group C | | | 5.00 | | | | 9-1-2027 | | | | 8,500,000 | | | | 10,109,900 | |
| | | | |
California Series B (SIFMA Municipal Swap +0.38%) ± | | | 2.09 | | | | 12-1-2027 | | | | 5,000,000 | | | | 4,998,900 | |
| | | | |
California Series B | | | 5.00 | | | | 9-1-2023 | | | | 10,730,000 | | | | 12,206,770 | |
| | | | |
California Statewide Refunding Bond Various Purpose | | | 5.00 | | | | 8-1-2025 | | | | 3,500,000 | | | | 4,132,275 | |
| | | | |
California Statewide Series B (1 Month LIBOR +0.76%) ± | | | 2.40 | | | | 12-1-2031 | | | | 2,500,000 | | | | 2,518,925 | |
| | | | |
California Statewide Series E (SIFMA Municipal Swap +0.43%) ± | | | 2.14 | | | | 12-1-2029 | | | | 3,050,000 | | | | 3,045,486 | |
| | | | |
Central California Unified School District Refunding Bond (AGM Insured) | | | 4.00 | | | | 7-1-2020 | | | | 500,000 | | | | 517,050 | |
| | | | |
Central California Unified School District Refunding Bond (AGM Insured) | | | 5.00 | | | | 7-1-2021 | | | | 400,000 | | | | 433,228 | |
| | | | |
Central California Unified School District Refunding Bond (AGM Insured) | | | 5.00 | | | | 7-1-2022 | | | | 750,000 | | | | 833,895 | |
| | | | |
Coachella Valley CA Unified School District (Build America Mutual Assurance Company Insured) | | | 4.00 | | | | 8-1-2020 | | | | 2,455,000 | | | | 2,542,521 | |
| | | | |
Coachella Valley CA Unified School District (Build America Mutual Assurance Company Insured) | | | 4.00 | | | | 8-1-2021 | | | | 2,230,000 | | | | 2,357,645 | |
| | | | |
Coachella Valley CA Unified School District (Build America Mutual Assurance Company Insured) | | | 4.00 | | | | 8-1-2022 | | | | 1,000,000 | | | | 1,076,250 | |
| | | | |
Cotati Rohnert Park CA Unified School District Series B (AGM Insured) | | | 5.00 | | | | 8-1-2020 | | | | 2,275,000 | | | | 2,392,094 | |
| | | | |
Dixon CA Unified School District (AGM Insured) | | | 5.00 | | | | 8-1-2021 | | | | 1,210,000 | | | | 1,309,631 | |
| | | | |
Dixon CA Unified School District (AGM Insured) | | | 5.00 | | | | 8-1-2022 | | | | 1,285,000 | | | | 1,427,314 | |
| | | | |
El Monte CA City School District BAN (z) | | | 2.61 | | | | 4-1-2023 | | | | 2,000,000 | | | | 1,822,620 | |
| | | | |
El Monte CA Union High School Refunding Bond | | | 5.00 | | | | 6-1-2021 | | | | 1,315,000 | | | | 1,416,742 | |
| | | | |
Fowler CA Unified School District School Facilities Improvement District #1 (National Insured) | | | 5.20 | | | | 7-1-2020 | | | | 505,000 | | | | 513,540 | |
| | | | |
Hayward CA Unified School District Certificate of Participation (AGM Insured) | | | 5.00 | | | | 8-1-2022 | | | | 500,000 | | | | 557,215 | |
| | | | |
Hayward CA Unified School District Certificate of Participation (AGM Insured) | | | 5.00 | | | | 8-1-2023 | | | | 805,000 | | | | 918,457 | |
| | | | |
Huntington Beach CA City School District Election of 2002 | | | 4.00 | | | | 8-1-2021 | | | | 505,000 | | | | 534,563 | |
| | | | |
Inglewood CA Unified School District Election of 2012 Series B (Build America Mutual Assurance Company Insured) | | | 4.00 | | | | 8-1-2021 | | | | 320,000 | | | | 335,504 | |
| | | | |
Inglewood CA Unified School District Election of 2012 Series B (Build America Mutual Assurance Company Insured) | | | 4.00 | | | | 8-1-2022 | | | | 200,000 | | | | 212,602 | |
| | | | |
Inglewood CA Unified School District Election of 2012 Series B (Build America Mutual Assurance Company Insured) | | | 5.00 | | | | 8-1-2023 | | | | 195,000 | | | | 218,199 | |
| | | | |
Inglewood CA Unified School District Election of 2012 Series B (Build America Mutual Assurance Company Insured) | | | 5.00 | | | | 8-1-2024 | | | | 150,000 | | | | 170,580 | |
| | | | |
Inglewood CA Unified School District Election of 2012 Series B (Build America Mutual Assurance Company Insured) | | | 5.00 | | | | 8-1-2025 | | | | 170,000 | | | | 196,185 | |
| | | | |
Inglewood CA Unified School District Election of 2012 Series B (Build America Mutual Assurance Company Insured) | | | 5.00 | | | | 8-1-2026 | | | | 235,000 | | | | 274,616 | |
| | | | |
La Habra CA School District Refunding Bond | | | 5.00 | | | | 8-1-2019 | | | | 950,000 | | | | 968,991 | |
| | | | |
La Habra CA School District Refunding Bond | | | 5.00 | | | | 8-1-2020 | | | | 1,045,000 | | | | 1,100,793 | |
| | | | |
La Habra CA School District Refunding Bond | | | 5.00 | | | | 8-1-2021 | | | | 805,000 | | | | 871,284 | |
The accompanying notes are an integral part of these financial statements.
| | | | | | |
| Portfolio of investments—December 31, 2018 (unaudited) | | Wells Fargo California Limited-Term Tax-Free Fund | | | 9 | |
| | | | | | | | | | | | | | | | |
| Security name | | Interest rate | | | Maturity date | | | Principal | | | Value | |
| | | | |
| GO Revenue(continued) | | | | | | | | | | | | | | | | |
| | | | |
Los Angeles CA Unified School District Refunding Bond Series D | | | 5.00 | % | | | 7-1-2023 | | | $ | 6,180,000 | | | $ | 7,024,435 | |
| | | | |
Merced CA Union High School CAB Series A (National Insured) (z) | | | 5.54 | | | | 8-1-2019 | | | | 2,190,000 | | | | 2,166,698 | |
| | | | |
Mount Sanitary Antonio CA Community CAB College District (z) | | | 2.31 | | | | 4-1-2022 | | | | 10,000,000 | | | | 9,350,700 | |
| | | | |
Natomas CA Unified School District (AGM Insured) | | | 3.00 | | | | 9-1-2019 | | | | 1,000,000 | | | | 1,008,630 | |
| | | | |
Oak Valley CA Hospital District Refunding Bond Los Angeles County CA Redevelopment Refunding Bond Authority | | | 4.00 | | | | 7-1-2020 | | | | 500,000 | | | | 517,425 | |
| | | | |
Oak Valley CA Hospital District Refunding Bond Los Angeles County CA Redevelopment Refunding Bond Authority | | | 5.00 | | | | 7-1-2021 | | | | 950,000 | | | | 1,017,574 | |
| | | | |
Oak Valley CA Hospital District Refunding Bond Los Angeles County CA Redevelopment Refunding Bond Authority | | | 5.00 | | | | 7-1-2022 | | | | 750,000 | | | | 822,383 | |
| | | | |
Oak Valley CA Hospital District Refunding Bond Los Angeles County CA Redevelopment Refunding Bond Authority | | | 5.00 | | | | 7-1-2023 | | | | 755,000 | | | | 847,057 | |
| | | | |
Oakland CA Unified School District Alameda County Election of 2012 Series A | | | 5.00 | | | | 8-1-2022 | | | | 750,000 | | | | 830,588 | |
| | | | |
Oakland CA Unified School District Alameda County Election of 2012 Series A | | | 5.00 | | | | 8-1-2024 | | | | 600,000 | | | | 692,148 | |
| | | | |
Redondo Beach CA Unified School District CAB Election of 2008 Series E (z) | | | 4.52 | | | | 8-1-2020 | | | | 460,000 | | | | 446,269 | |
| | | | |
Riverside CA Community College District Election of 2004 Series D (z) | | | 8.91 | | | | 8-1-2020 | | | | 535,000 | | | | 519,924 | |
| | | | |
Salinas CA Union High School District CAB (z) | | | 2.12 | | | | 8-1-2020 | | | | 5,000,000 | | | | 4,836,500 | |
| | | | |
San Gorgonio CA Memorial Healthcare Refunding Bond | | | 5.00 | | | | 8-1-2021 | | | | 275,000 | | | | 294,404 | |
| | | | |
San Gorgonio CA Memorial Healthcare Refunding Bond | | | 5.00 | | | | 8-1-2022 | | | | 500,000 | | | | 546,825 | |
| | | | |
San Gorgonio CA Memorial Healthcare Refunding Bond | | | 5.00 | | | | 8-1-2023 | | | | 1,000,000 | | | | 1,112,980 | |
| | | | |
San Mateo Foster City CA School District | | | 5.00 | | | | 8-15-2020 | | | | 2,000,000 | | | | 2,109,380 | |
| | | | |
Santa Ana CA Unified School District CAB Election of 2008 Series A (z) | | | 4.76 | | | | 8-1-2020 | | | | 1,815,000 | | | | 1,760,278 | |
| | | | |
Sierra Kings CA Health Care Refunding Bond | | | 4.00 | | | | 8-1-2019 | | | | 225,000 | | | | 227,999 | |
| | | | |
Sierra Kings CA Health Care Refunding Bond | | | 4.00 | | | | 8-1-2021 | | | | 345,000 | | | | 363,316 | |
| | | | |
Sierra Kings CA Health Care Refunding Bond | | | 4.00 | | | | 8-1-2022 | | | | 425,000 | | | | 454,355 | |
| | | | |
Sierra Kings CA Health Care Refunding Bond | | | 4.00 | | | | 8-1-2023 | | | | 405,000 | | | | 438,230 | |
| | | | |
Sierra Kings CA Health Care Refunding Bond | | | 4.00 | | | | 8-1-2024 | | | | 420,000 | | | | 459,707 | |
| | | | |
Southern CA Mono Healthcare District | | | 4.00 | | | | 8-1-2019 | | | | 845,000 | | | | 855,039 | |
| | | | |
SouthWestern Community College District Refunding Bond | | | 5.00 | | | | 8-1-2020 | | | | 1,250,000 | | | | 1,316,138 | |
| | | | |
SouthWestern Community College District Refunding Bond | | | 5.00 | | | | 8-1-2021 | | | | 2,710,000 | | | | 2,936,719 | |
| | | | |
Sweetwater CA Union High School District PFA Refunding Bond (Build America Mutual Assurance Company Insured) | | | 5.00 | | | | 8-1-2021 | | | | 620,000 | | | | 670,400 | |
| | | | |
Twin Rivers CA Unified School District Series A (Build America Mutual Assurance Company Insured) | | | 4.00 | | | | 8-1-2019 | | | | 385,000 | | | | 390,155 | |
| | | | |
Twin Rivers CA Unified School District Series A (Build America Mutual Assurance Company Insured) | | | 5.00 | | | | 8-1-2020 | | | | 510,000 | | | | 536,005 | |
| | | | |
Vacaville CA Unified School District Series C (Build America Mutual Assurance Company Insured) | | | 5.00 | | | | 8-1-2022 | | | | 675,000 | | | | 750,256 | |
| | | | |
| | | | | | | | | | | | | | | 131,725,822 | |
| | | | | | | | | | | | | | | | |
| | | | |
| Health Revenue: 7.11% | | | | | | | | | | | | | | | | |
| | | | |
Association of Bay Area Governments Finance Authority for Nonprofit Corporations O’Connor Woods | | | 4.00 | | | | 1-1-2019 | | | | 955,000 | | | | 955,000 | |
| | | | |
Association of Bay Area Governments Finance Authority for Nonprofit Corporations Sharp Healthcare Series A | | | 5.00 | | | | 8-1-2019 | | | | 500,000 | | | | 509,295 | |
| | | | |
California HFFA Catholic Healthcare West Series A | | | 5.00 | | | | 3-1-2019 | | | | 700,000 | | | | 703,612 | |
| | | | |
California HFFA Catholic Healthcare West Series A | | | 5.25 | | | | 3-1-2023 | | | | 4,000,000 | | | | 4,263,000 | |
| | | | |
California HFFA Chinese Hospital Associates | | | 5.00 | | | | 6-1-2019 | | | | 200,000 | | | | 202,564 | |
| | | | |
California HFFA El Camino Hospital | | | 5.00 | | | | 2-1-2025 | | | | 1,000,000 | | | | 1,163,400 | |
| | | | |
California HFFA Fellowship Homes Incorporated | | | 5.00 | | | | 9-1-2019 | | | | 390,000 | | | | 397,297 | |
The accompanying notes are an integral part of these financial statements.
| | | | |
| 10 | | Wells Fargo California Limited-Term Tax-Free Fund | | Portfolio of investments—December 31, 2018 (unaudited) |
| | | | | | | | | | | | | | | | |
| Security name | | Interest rate | | | Maturity date | | | Principal | | | Value | |
| | | | |
| Health Revenue(continued) | | | | | | | | | | | | | | | | |
| | | | |
California HFFA Memorial Health Services Series A | | | 5.00 | % | | | 10-1-2023 | | | $ | 2,475,000 | | | $ | 2,742,449 | |
| | | | |
California HFFA Providence St. Joseph Series B1 | | | 1.25 | | | | 10-1-2036 | | | | 2,000,000 | | | | 1,979,480 | |
| | | | |
California HFFA Sutter Health Series A | | | 5.00 | | | | 11-15-2023 | | | | 2,500,000 | | | | 2,864,825 | |
| | | | |
California Municipal Finance Authority Community Medical Centers Series A | | | 5.00 | | | | 2-1-2023 | | | | 735,000 | | | | 813,020 | |
| | | | |
California Municipal Finance Authority Community Medical Centers Series A | | | 5.00 | | | | 2-1-2024 | | | | 500,000 | | | | 563,830 | |
| | | | |
California Municipal Finance Authority Revenue Community Medical Centers Series A | | | 5.00 | | | | 2-1-2025 | | | | 1,000,000 | | | | 1,145,600 | |
| | | | |
California Municipal Finance Authority Revenue Insured Channing House Project Series A | | | 5.00 | | | | 5-15-2022 | | | | 475,000 | | | | 525,084 | |
| | | | |
California Municipal Finance Authority Revenue Insured Channing House Project Series A | | | 5.00 | | | | 5-15-2023 | | | | 925,000 | | | | 1,047,498 | |
| | | | |
California Municipal Finance Authority Revenue Refunding Bond Community Medical Centers Series A | | | 5.00 | | | | 2-1-2022 | | | | 1,000,000 | | | | 1,083,180 | |
| | | | |
California Municipal Finance Authority Revenue Refunding Bond Eisenhower Medical Center Series A | | | 5.00 | | | | 7-1-2029 | | | | 400,000 | | | | 457,660 | |
| | | | |
California Statewide CDA Adventist Health Systems West Series A | | | 5.00 | | | | 3-1-2024 | | | | 800,000 | | | | 915,000 | |
| | | | |
California Statewide CDA Health Facilities Catholic Series F (AGM Insured) (m) | | | 2.04 | | | | 7-1-2040 | | | | 1,000,000 | | | | 1,000,000 | |
| | | | |
California Statewide CDA Henry Mayo Newhall Memorial Hospital Series A (AGM Insured) | | | 5.00 | | | | 10-1-2021 | | | | 500,000 | | | | 539,430 | |
| | | | |
California Statewide CDA Henry Mayo Newhall Memorial Hospital Series A (AGM Insured) | | | 5.00 | | | | 10-1-2022 | | | | 395,000 | | | | 436,179 | |
| | | | |
California Statewide CDA Henry Mayo Newhall Memorial Hospital Series A (AGM Insured) | | | 5.00 | | | | 10-1-2023 | | | | 500,000 | | | | 563,450 | |
| | | | |
California Statewide CDA Huntington Memorial Hospital | | | 5.00 | | | | 7-1-2025 | | | | 500,000 | | | | 577,745 | |
| | | | |
California Statewide CDA Huntington Memorial Hospital | | | 5.00 | | | | 7-1-2026 | | | | 500,000 | | | | 584,200 | |
| | | | |
California Statewide CDA Insured Viamonte Senior Living 1 Project | | | 3.00 | | | | 7-1-2025 | | | | 3,000,000 | | | | 3,037,200 | |
| | | | |
California Statewide CDA Revenue Loma Linda University Medical Center Series A 144A | | | 5.00 | | | | 12-1-2026 | | | | 250,000 | | | | 280,113 | |
| | | | |
California Statewide CDA Revenue Loma Linda University Medical Center Series A 144A | | | 5.00 | | | | 12-1-2027 | | | | 300,000 | | | | 337,608 | |
| | | | |
California Statewide CDA Revenue Loma Linda University Medical Center Series A 144A | | | 5.00 | | | | 12-1-2028 | | | | 250,000 | | | | 274,373 | |
| | | | |
Palomar Health California Certificate of Participation Health & Arch Health Partners Incorporated | | | 5.00 | | | | 11-1-2019 | | | | 400,000 | | | | 408,128 | |
| | | | |
Palomar Health California Certificate of Participation Health & Arch Health Partners Incorporated | | | 5.00 | | | | 11-1-2020 | | | | 250,000 | | | | 260,908 | |
| | | | |
Palomar Health California Certificate of Participation Health & Arch Health Partners Incorporated | | | 5.00 | | | | 11-1-2021 | | | | 275,000 | | | | 293,103 | |
| | | | |
Palomar Health California Certificate of Participation Health & Arch Health Partners Incorporated | | | 5.00 | | | | 11-1-2022 | | | | 375,000 | | | | 407,006 | |
| | | | |
Palomar Health California Certificate of Participation Health & Arch Health Partners Incorporated | | | 5.00 | | | | 11-1-2023 | | | | 300,000 | | | | 331,167 | |
| | | | |
Palomar Health California Certificate of Participation Health & Arch Health Partners Incorporated | | | 5.00 | | | | 11-1-2024 | | | | 300,000 | | | | 335,937 | |
| | | | |
Palomar Health California Certificate of Participation Health & Arch Health Partners Incorporated | | | 5.00 | | | | 11-1-2025 | | | | 330,000 | | | | 373,507 | |
| | | | |
San Buenaventura CA Community Mental Health System | | | 6.00 | | | | 12-1-2019 | | | | 2,000,000 | | | | 2,063,360 | |
| | | | |
San Buenaventura CA Community Mental Health System | | | 6.50 | | | | 12-1-2021 | | | | 2,585,000 | | | | 2,870,436 | |
| | | | |
Washington Township CA Health Care District Revenue Refunding Bond Series A | | | 5.00 | | | | 7-1-2023 | | | | 600,000 | | | | 661,512 | |
| | | | |
| | | | | | | | | | | | | | | 37,967,156 | |
| | | | | | | | | | | | | | | | |
The accompanying notes are an integral part of these financial statements.
| | | | | | |
| Portfolio of investments—December 31, 2018 (unaudited) | | Wells Fargo California Limited-Term Tax-Free Fund | | | 11 | |
| | | | | | | | | | | | | | | | |
| Security name | | Interest rate | | | Maturity date | | | Principal | | | Value | |
| | | | |
| Housing Revenue: 4.23% | | | | | | | | | | | | | | | | |
| | | | |
California Department of Veterans Affairs Home Purchase Series A | | | 3.50 | % | | | 12-1-2021 | | | $ | 855,000 | | | $ | 888,106 | |
| | | | |
California HFA Home Mortgage Series A (GNMA/FNMA/FHLMC Insured) | | | 3.75 | | | | 8-1-2020 | | | | 355,000 | | | | 355,809 | |
| | | | |
California Municipal Finance Authority Mobile Senior Caritas Affordable Housing Incorporated Projects Series A | | | 5.00 | | | | 8-15-2019 | | | | 515,000 | | | | 523,770 | |
| | | | |
California Municipal Finance Authority Multifamily 1 Church Street Series B | | | 2.19 | | | | 9-1-2021 | | | | 10,000,000 | | | | 10,025,900 | |
| | | | |
California Municipal Finance Authority Peppertree Senior Apartments Series A (FHLMC Insured, FHLMC LIQ) | | | 2.80 | | | | 6-1-2023 | | | | 2,500,000 | | | | 2,576,525 | |
| | | | |
California Municipal Finance Authority Student Housing Revenue Davis I LLC West Village Student Housing Project | | | 5.00 | | | | 5-15-2024 | | | | 1,200,000 | | | | 1,352,328 | |
| | | | |
California Municipal Finance Authority Student Housing Revenue Davis I LLC West Village Student Housing Project | | | 5.00 | | | | 5-15-2025 | | | | 3,435,000 | | | | 3,913,599 | |
| | | | |
California Municipal Finance Authority Village Grove Apartments Series A (FHLMC Insured, FHLMC LIQ) | | | 3.10 | | | | 12-1-2021 | | | | 1,000,000 | | | | 1,029,230 | |
| | | | |
California PFA NCCD-Claremont Properties LLC University Housing Project Series A 144A | | | 5.00 | | | | 7-1-2027 | | | | 1,825,000 | | | | 1,921,981 | |
| | | | |
| | | | | | | | | | | | | | | 22,587,248 | |
| | | | | | | | | | | | | | | | |
| | | | |
| Industrial Development Revenue: 0.39% | | | | | | | | | | | | | | | | |
| | | | |
California PCFA AMT Calplant I Project 144A | | | 7.00 | | | | 7-1-2022 | | | | 500,000 | | | | 515,200 | |
| | | | |
California PCFA AMT Calplant I Project 144A | | | 7.50 | | | | 7-1-2032 | | | | 1,500,000 | | | | 1,545,390 | |
| | | | |
| | | | | | | | | | | | | | | 2,060,590 | |
| | | | | | | | | | | | | | | | |
| | | | |
| Miscellaneous Revenue: 13.82% | | | | | | | | | | | | | | | | |
| | | | |
Alameda County CA Joint Powers Authority Multiple Capital Projects Series A | | | 4.00 | | | | 12-1-2019 | �� | | | 1,000,000 | | | | 1,022,530 | |
| | | | |
Alameda County CA Joint Powers Authority Multiple Capital Projects Series A | | | 5.00 | | | | 12-1-2021 | | | | 1,000,000 | | | | 1,095,720 | |
| | | | |
Albany CA Limited Obligation Improvement Bond Act of 1915 (Ambac Insured) | | | 4.75 | | | | 9-2-2019 | | | | 455,000 | | | | 457,689 | |
| | | | |
Association of Bay Area Governments California Finance Authority for Nonprofit Corporations Jackson Laboratory | | | 5.00 | | | | 7-1-2019 | | | | 730,000 | | | | 742,286 | |
| | | | |
Brentwood CA Infrastructure Financing Authority Subordinate Bond Series B | | | 4.00 | | | | 9-2-2021 | | | | 1,135,000 | | | | 1,197,209 | |
| | | | |
California | | | 5.00 | | | | 9-1-2022 | | | | 2,240,000 | | | | 2,491,978 | |
| | | | |
California Infrastructure & Economic Development Bank Refunding Bond California Academy of Sciences Project Series C (1 Month LIBOR +0.38%) ± | | | 2.13 | | | | 8-1-2047 | | | | 4,000,000 | | | | 3,993,200 | |
| | | | |
California Public Works Board Capital Project Series G | | | 5.00 | | | | 11-1-2020 | | | | 3,000,000 | | | | 3,176,250 | |
| | | | |
California Public Works Board Department of Corrections & Rehabilitation Series C | | | 5.00 | | | | 10-1-2022 | | | | 1,500,000 | | | | 1,668,405 | |
| | | | |
California Public Works Board Judicial Council Projects Series B | | | 5.00 | | | | 10-1-2022 | | | | 500,000 | | | | 556,135 | |
| | | | |
California Public Works Board Judicial Council Projects Series D | | | 5.00 | | | | 12-1-2019 | | | | 1,000,000 | | | | 1,030,520 | |
| | | | |
California Public Works Board Various Capital Projects Series I | | | 5.00 | | | | 11-1-2020 | | | | 1,250,000 | | | | 1,323,438 | |
| | | | |
California Statewide CDA Refunding Bond (AGM Insured) | | | 5.00 | | | | 11-15-2019 | | | | 250,000 | | | | 257,348 | |
| | | | |
California Statewide CDA Refunding Bond (AGM Insured) | | | 5.00 | | | | 11-15-2020 | | | | 210,000 | | | | 223,035 | |
| | | | |
California Statewide CDA Refunding Bond (AGM Insured) | | | 5.00 | | | | 11-15-2021 | | | | 200,000 | | | | 218,034 | |
| | | | |
California Statewide CDA Refunding Bond (AGM Insured) | | | 5.00 | | | | 11-15-2022 | | | | 200,000 | | | | 223,560 | |
| | | | |
California Statewide Community Monterey County Savers Bond (Build America Mutual Assurance Company Insured) | | | 5.00 | | | | 8-1-2027 | | | | 2,185,000 | | | | 2,623,355 | |
| | | | |
Carlsbad CA Improvement Bond Act of 1915 | | | 3.00 | | | | 9-2-2019 | | | | 540,000 | | | | 543,073 | |
| | | | |
Chula Vista CA Certificate of Participation Refunding Bond Police Facility Project | | | 5.00 | | | | 10-1-2021 | | | | 720,000 | | | | 784,037 | |
| | | | |
Compton CA PFA Lease Revenue 144A | | | 4.00 | | | | 9-1-2022 | | | | 2,000,000 | | | | 2,028,680 | |
| | | | |
Compton CA PFA Refunding Bond 144A | | | 4.00 | | | | 9-1-2027 | | | | 2,000,000 | | | | 1,994,120 | |
| | | | |
Desert Sands CA Unified School District Certificate of Participation (Build America Mutual Assurance Company Insured) | | | 5.00 | | | | 3-1-2024 | | | | 1,500,000 | | | | 1,721,970 | |
| | | | |
Fresno County CA Financing Authority Lease Series A (AGM Insured) | | | 3.00 | | | | 8-1-2019 | | | | 970,000 | | | | 978,051 | |
The accompanying notes are an integral part of these financial statements.
| | | | |
| 12 | | Wells Fargo California Limited-Term Tax-Free Fund | | Portfolio of investments—December 31, 2018 (unaudited) |
| | | | | | | | | | | | | | | | |
| Security name | | Interest rate | | | Maturity date | | | Principal | | | Value | |
| | | | |
| Miscellaneous Revenue(continued) | | | | | | | | | | | | | | | | |
| | | | |
Golden Empire School CA Financing Authority Refunding Bond Kern High School District | | | 5.00 | % | | | 5-1-2021 | | | $ | 1,000,000 | | | $ | 1,073,320 | |
| | | | |
Hayward CA Unified School District Certificate of Participation (AGM Insured) | | | 3.00 | | | | 6-1-2019 | | | | 750,000 | | | | 754,245 | |
| | | | |
Irvine CA Limited Obligation Improvement Bonds Reassessment District #15-2 | | | 5.00 | | | | 9-2-2023 | | | | 800,000 | | | | 888,624 | |
| | | | |
Irvine CA Limited Obligation Improvement Bonds Reassessment District #15-2 | | | 5.00 | | | | 9-2-2024 | | | | 850,000 | | | | 955,332 | |
| | | | |
Lodi CA Public Financing Authority Electric Refunding Bond (AGM Insured) | | | 5.00 | | | | 9-1-2024 | | | | 1,100,000 | | | | 1,275,131 | |
| | | | |
Los Angeles CA Public Works Series D | | | 5.00 | | | | 12-1-2027 | | | | 1,605,000 | | | | 1,904,076 | |
| | | | |
Los Angeles CA Unified School District Certificate of Participation Headquarters Building Projects Series B | | | 5.00 | | | | 10-1-2025 | | | | 1,875,000 | | | | 2,079,056 | |
| | | | |
Los Angeles County CA Public Works Multiple Capital Projects II | | | 5.00 | | | | 8-1-2020 | | | | 500,000 | | | | 526,940 | |
| | | | |
Los Angeles County CA Schools Pooled Financing Program Certificate of Participation Series A4 | | | 4.00 | | | | 7-1-2019 | | | | 5,000,000 | | | | 5,046,250 | |
| | | | |
Norwalk CA Community Facilities Financing Series A (AGM Insured) | | | 4.00 | | | | 6-1-2019 | | | | 280,000 | | | | 282,820 | |
| | | | |
Norwalk CA Community Facilities Financing Series A (AGM Insured) | | | 4.00 | | | | 6-1-2020 | | | | 350,000 | | | | 361,722 | |
| | | | |
Norwalk CA Community Facilities Financing Series B (AGM Insured) | | | 4.00 | | | | 6-1-2019 | | | | 625,000 | | | | 631,294 | |
| | | | |
Norwalk CA Community Facilities Financing Series B (AGM Insured) | | | 4.00 | | | | 6-1-2020 | | | | 650,000 | | | | 671,769 | |
| | | | |
Palo Alto CA Improvement Bond Act of 1915 University Area Off-Street Parking Assessment District | | | 4.00 | | | | 9-2-2021 | | | | 450,000 | | | | 475,628 | |
| | | | |
Riverside County CA Asset Leasing Corporation Riverside Hospital Project (National Insured) (z) | | | 4.86 | | | | 6-1-2019 | | | | 1,000,000 | | | | 992,090 | |
| | | | |
Riverside County CA Public Financing County Facilities Projects | | | 4.00 | | | | 5-1-2020 | | | | 795,000 | | | | 819,844 | |
| | | | |
Riverside County CA Public Financing County Facilities Projects | | | 5.00 | | | | 5-1-2019 | | | | 840,000 | | | | 849,416 | |
| | | | |
Sacramento CA City Financing Refunding Bond Master Lease Program Facilities (Build America Mutual Assurance Company Insured) | | | 5.00 | | | | 12-1-2022 | | | | 800,000 | | | | 895,608 | |
| | | | |
Sacramento CA City Schools Joint Powers Financing Authority Series A (Build America Mutual Assurance Company Insured) | | | 5.00 | | | | 3-1-2019 | | | | 1,050,000 | | | | 1,055,817 | |
| | | | |
Sacramento CA City Schools Joint Powers Financing Authority Series A (Build America Mutual Assurance Company Insured) | | | 5.00 | | | | 3-1-2020 | | | | 1,185,000 | | | | 1,231,144 | |
| | | | |
Sacramento CA City Schools Joint Powers Financing Authority Series A (Build America Mutual Assurance Company Insured) | | | 5.00 | | | | 3-1-2021 | | | | 830,000 | | | | 885,668 | |
| | | | |
Sacramento CA City Schools Joint Powers Financing Authority Series A (Build America Mutual Assurance Company Insured) | | | 5.00 | | | | 3-1-2022 | | | | 775,000 | | | | 848,850 | |
| | | | |
Sacramento CA City Schools Joint Powers Financing Authority Series A (Build America Mutual Assurance Company Insured) | | | 5.00 | | | | 3-1-2023 | | | | 815,000 | | | | 914,210 | |
| | | | |
San Bernardino County CA Certificate of Participation Arrowhead Project Series A | | | 5.50 | | | | 8-1-2020 | | | | 1,000,000 | | | | 1,022,090 | |
| | | | |
Santa Clara County CA Financing Authority Capital Projects Series A | | | 4.00 | | | | 2-1-2024 | | | | 6,000,000 | | | | 6,406,440 | |
| | | | |
Santa Cruz County CA Capital Financing Public Facilities Project (AGM Insured) | | | 4.00 | | | | 8-1-2020 | | | | 150,000 | | | | 155,394 | |
| | | | |
Santa Cruz County CA Capital Financing Public Facilities Project (AGM Insured) | | | 5.00 | | | | 8-1-2021 | | | | 125,000 | | | | 134,931 | |
| | | | |
Santa Cruz County CA Capital Financing Public Facilities Project (AGM Insured) | | | 5.00 | | | | 8-1-2022 | | | | 165,000 | | | | 182,609 | |
| | | | |
Soledad CA Unified School District BAN (z) | | | 2.63 | | | | 8-1-2021 | | | | 3,000,000 | | | | 2,818,200 | |
| | | | |
Sutter Butte CA Flood Agency Assessment (Build America Mutual Assurance Company Insured) | | | 5.00 | | | | 10-1-2023 | | | | 1,280,000 | | | | 1,446,131 | |
| | | | |
Sutter Butte CA Flood Agency Assessment (Build America Mutual Assurance Company Insured) | | | 5.00 | | | | 10-1-2024 | | | | 715,000 | | | | 822,043 | |
| | | | |
Sutter Butte CA Flood Agency Assessment (Build America Mutual Assurance Company Insured) | | | 5.00 | | | | 10-1-2025 | | | | 1,575,000 | | | | 1,835,993 | |
| | | | |
Sweetwater CA Union High School District PFA Refunding Bond (Build America Mutual Assurance Company Insured) | | | 5.00 | | | | 9-1-2019 | | | | 1,000,000 | | | | 1,022,320 | |
| | | | |
Ventura County CA PFA Series B | | | 5.00 | | | | 11-1-2019 | | | | 375,000 | | | | 385,751 | |
| | | | |
Ventura County CA PFA Series B | | | 5.00 | | | | 11-1-2020 | | | | 250,000 | | | | 265,525 | |
| | | | |
Visalia CA Certificate of Participation (AGM Insured) | | | 4.00 | | | | 12-1-2020 | | | | 250,000 | | | | 260,958 | |
The accompanying notes are an integral part of these financial statements.
| | | | | | |
| Portfolio of investments—December 31, 2018 (unaudited) | | Wells Fargo California Limited-Term Tax-Free Fund | | | 13 | |
| | | | | | | | | | | | | | | | |
| Security name | | Interest rate | | | Maturity date | | | Principal | | | Value | |
| | | | |
| Miscellaneous Revenue(continued) | | | | | | | | | | | | | | | | |
| | | | |
Visalia CA Certificate of Participation (AGM Insured) | | | 4.00 | % | | | 12-1-2021 | | | $ | 250,000 | | | $ | 266,040 | |
| | | | |
Visalia CA Certificate of Participation (AGM Insured) | | | 5.00 | | | | 12-1-2022 | | | | 335,000 | | | | 375,170 | |
| | | | |
West Sacramento CA Flood Control Agency | | | 2.75 | | | | 9-1-2019 | | | | 285,000 | | | | 287,257 | |
| | | | |
West Sacramento CA Flood Control Agency | | | 5.00 | | | | 9-1-2020 | | | | 290,000 | | | | 306,191 | |
| | | | |
| | | | | | | | | | | | | | | 73,762,520 | |
| | | | | | | | | | | | | | | | |
| | | | |
| Tax Revenue: 24.18% | | | | | | | | | | | | | | | | |
| | | | |
California School Infrastructure Financing Agency Refunding Bond (AGM Insured) | | | 5.00 | | | | 9-1-2021 | | | | 1,300,000 | | | | 1,405,469 | |
| | | | |
California Statewide Community Facilities District #2015-01 | | | 5.00 | | | | 9-1-2027 | | | | 500,000 | | | | 546,500 | |
| | | | |
Carson CA RDA Project Area #1 Series A (AGM Insured) | | | 5.00 | | | | 10-1-2020 | | | | 775,000 | | | | 818,757 | |
| | | | |
Carson CA RDA Project Area #1 Series A (AGM Insured) | | | 5.00 | | | | 10-1-2021 | | | | 855,000 | | | | 924,811 | |
| | | | |
Carson CA RDA Project Area #1 Series A (AGM Insured) | | | 5.00 | | | | 10-1-2022 | | | | 600,000 | | | | 665,064 | |
| | | | |
Cathedral City CA RDA Refunding Bond Merged Redevelopment Project Series A | | | 5.00 | | | | 8-1-2020 | | | | 2,295,000 | | | | 2,406,491 | |
| | | | |
Cathedral City CA RDA Refunding Bond Merged Redevelopment Project Series A | | | 5.00 | | | | 8-1-2021 | | | | 2,425,000 | | | | 2,620,843 | |
| | | | |
Cathedral City CA RDA Refunding Bond Merged Redevelopment Project Series A | | | 5.00 | | | | 8-1-2022 | | | | 2,550,000 | | | | 2,821,218 | |
| | | | |
Cathedral City CA RDA Refunding Bond Merged Redevelopment Project Series A | | | 5.00 | | | | 8-1-2023 | | | | 1,735,000 | | | | 1,964,020 | |
| | | | |
Cathedral City CA RDA Refunding Bond Merged Redevelopment Project Series A (AGM Insured) | | | 5.00 | | | | 8-1-2024 | | | | 1,770,000 | | | | 2,032,792 | |
| | | | |
Chino CA PFA Local Agency Series A (AGM Insured) | | | 5.00 | | | | 9-1-2022 | | | | 1,830,000 | | | | 2,014,665 | |
| | | | |
Chino CA PFA Local Agency Series A (AGM Insured) | | | 5.00 | | | | 9-1-2024 | | | | 660,000 | | | | 754,816 | |
| | | | |
Commerce CA RDA CAB Project #1 (z) | | | 5.32 | | | | 8-1-2021 | | | | 935,000 | | | | 833,992 | |
| | | | |
Commerce CA Successor Agency to the Community Development Commission Refunding Bond Series A (AGM Insured) | | | 5.00 | | | | 8-1-2023 | | | | 600,000 | | | | 678,078 | |
| | | | |
Culver City CA RDA CAB Tax Allocation Series A (z) | | | 6.57 | | | | 11-1-2019 | | | | 2,575,000 | | | | 2,534,392 | |
| | | | |
Dinuba CA RDA Successor Agency to Merged City Project #2 (Build America Mutual Assurance Company Insured) | | | 4.00 | | | | 9-1-2019 | | | | 210,000 | | | | 213,213 | |
| | | | |
Dinuba CA RDA Successor Agency to Merged City Project #2 (Build America Mutual Assurance Company Insured) | | | 5.00 | | | | 9-1-2021 | | | | 250,000 | | | | 270,418 | |
| | | | |
Dinuba CA RDA Successor Agency to Merged City Project #2 (Build America Mutual Assurance Company Insured) | | | 5.00 | | | | 9-1-2022 | | | | 250,000 | | | | 277,090 | |
| | | | |
Fairfield CA RDA Successor Agency Tax Allocation Refunding Bond | | | 5.00 | | | | 8-1-2020 | | | | 1,000,000 | | | | 1,052,270 | |
| | | | |
Fairfield CA RDA Successor Agency Tax Allocation Refunding Bond | | | 5.00 | | | | 8-1-2021 | | | | 3,170,000 | | | | 3,436,058 | |
| | | | |
Fairfield CA RDA Successor Agency Tax Allocation Refunding Bond | | | 5.00 | | | | 8-1-2022 | | | | 2,395,000 | | | | 2,665,539 | |
| | | | |
Fairfield CA RDA Successor Agency Tax Allocation Refunding Bond | | | 5.00 | | | | 8-1-2023 | | | | 1,025,000 | | | | 1,168,982 | |
| | | | |
Fremont CA Community Facilities District | | | 5.00 | | | | 9-1-2024 | | | | 1,000,000 | | | | 1,108,320 | |
| | | | |
Fullerton CA Community Facilities District | | | 4.00 | | | | 9-1-2019 | | | | 665,000 | | | | 674,822 | |
| | | | |
Garden Grove CA Agency Community Refunding Bond Garden Grove Community Project (Build America Mutual Assurance Company Insured) | | | 4.00 | | | | 10-1-2021 | | | | 770,000 | | | | 814,298 | |
| | | | |
Garden Grove CA Agency Community Refunding Bond Garden Grove Community Project (Build America Mutual Assurance Company Insured) | | | 5.00 | | | | 10-1-2022 | | | | 3,015,000 | | | | 3,351,173 | |
| | | | |
Imperial Beach CA RDA Palm Avenue Commercial Redevelopment Project (Build America Mutual Assurance Company Insured) | | | 4.00 | | | | 6-1-2020 | | | | 775,000 | | | | 798,754 | |
| | | | |
Inglewood CA Redevelopment Refunding Bond Subordinate Lien Merged Redevelopment Project (Build America Mutual Assurance Company Insured) | | | 5.00 | | | | 5-1-2025 | | | | 1,000,000 | | | | 1,164,530 | |
| | | | |
Inglewood CA Unified School District School Facilities Authority (AGM Insured) | | | 5.25 | | | | 10-15-2023 | | | | 8,670,000 | | | | 9,648,670 | |
| | | | |
Irwindale CA CDA City Industrial Development Project (AGM Insured) | | | 5.00 | | | | 7-15-2020 | | | | 320,000 | | | | 336,464 | |
| | | | |
Irwindale CA CDA City Industrial Development Project (AGM Insured) | | | 5.00 | | | | 7-15-2021 | | | | 340,000 | | | | 367,615 | |
| | | | |
Irwindale CA CDA City Industrial Development Project (AGM Insured) | | | 5.00 | | | | 7-15-2022 | | | | 365,000 | | | | 405,205 | |
| | | | |
Irwindale CA CDA City Industrial Development Project (AGM Insured) | | | 5.00 | | | | 7-15-2023 | | | | 375,000 | | | | 425,963 | |
| | | | |
Jurupa CA PFA Series A | | | 5.00 | | | | 9-1-2020 | | | | 750,000 | | | | 788,453 | |
The accompanying notes are an integral part of these financial statements.
| | | | |
| 14 | | Wells Fargo California Limited-Term Tax-Free Fund | | Portfolio of investments—December 31, 2018 (unaudited) |
| | | | | | | | | | | | | | | | |
| Security name | | Interest rate | | | Maturity date | | | Principal | | | Value | |
| | | | |
| Tax Revenue(continued) | | | | | | | | | | | | | | | | |
| | | | |
La Quinta CA RDA Project Areas #1 & 2 Series A | | | 5.00 | % | | | 9-1-2019 | | | $ | 1,150,000 | | | $ | 1,175,588 | |
| | | | |
La Quinta CA RDA Project Areas #1 & 2 Series A | | | 5.00 | | | | 9-1-2020 | | | | 1,045,000 | | | | 1,102,287 | |
| | | | |
La Quinta CA RDA Project Areas #1 & 2 Series A | | | 5.00 | | | | 9-1-2021 | | | | 565,000 | | | | 614,223 | |
| | | | |
La Quinta CA RDA Project Areas #1 & 2 Series A | | | 5.00 | | | | 9-1-2022 | | | | 615,000 | | | | 686,494 | |
| | | | |
Lancaster CA RDA Refunding Bond Combined Redevelopment Project Areas (AGM Insured) | | | 5.00 | | | | 8-1-2024 | | | | 870,000 | | | | 1,003,119 | |
| | | | |
Lancaster CA RDA Refunding Bond Combined Redevelopment Project Areas (AGM Insured) | | | 5.00 | | | | 8-1-2029 | | | | 400,000 | | | | 467,732 | |
| | | | |
Lincoln CA Special Tax Refunding Bond Community Facilities District #2003-1 Lincoln Crossing Project | | | 4.00 | | | | 9-1-2022 | | | | 450,000 | | | | 483,426 | |
| | | | |
Lincoln CA Special Tax Refunding Bond Community Facilities District #2003-1 Lincoln Crossing Project | | | 4.00 | | | | 9-1-2024 | | | | 600,000 | | | | 661,884 | |
| | | | |
Lincoln CA Special Tax Refunding Bond Community Facilities District #2003-1 Lincoln Crossing Project | | | 5.00 | | | | 9-1-2025 | | | | 550,000 | | | | 646,036 | |
| | | | |
Los Angeles County CA Community Facilities District #5 Rowland Heights Area (AGM Insured) | | | 5.00 | | | | 9-1-2019 | | | | 165,000 | | | | 165,800 | |
| | | | |
Los Angeles County CA Redevelopment Refunding Bond Authority Hollywood Redevelopment Project | | | 5.00 | | | | 7-1-2019 | | | | 1,780,000 | | | | 1,810,491 | |
| | | | |
Los Angeles County CA Redevelopment Refunding Bond Authority Series D | | | 5.00 | | | | 9-1-2019 | | | | 2,545,000 | | | | 2,599,234 | |
| | | | |
Menifee CA Union School District Public Series A | | | 4.00 | | | | 9-1-2022 | | | | 540,000 | | | | 572,432 | |
| | | | |
Modesto CA Community Facilities District #2004-1 Village One #2 | | | 4.50 | | | | 9-1-2019 | | | | 580,000 | | | | 589,234 | |
| | | | |
Monrovia CA RDA Subordinate Bond Central Project #1 | | | 4.00 | | | | 8-1-2019 | | | | 815,000 | | | | 825,579 | |
| | | | |
Oakdale CA Successor Agency to Oakdale Community RDA Series A (AGM Insured) | | | 5.00 | | | | 6-1-2027 | | | | 350,000 | | | | 413,368 | |
| | | | |
Orange County CA Community Facilities #2015-1 Esencia Village Series A | | | 5.00 | | | | 8-15-2023 | | | | 375,000 | | | | 410,655 | |
| | | | |
Orange County CA Community Facilities #2015-1 Esencia Village Series A | | | 5.00 | | | | 8-15-2025 | | | | 335,000 | | | | 373,227 | |
| | | | |
Orange County CA Development Agency Santa Ana Heights Project | | | 5.00 | | | | 9-1-2019 | | | | 1,085,000 | | | | 1,108,121 | |
| | | | |
Orange County CA Development Agency Santa Ana Heights Project | | | 5.00 | | | | 3-1-2020 | | | | 1,110,000 | | | | 1,151,259 | |
| | | | |
Orange County CA Development Agency Santa Ana Heights Project | | | 5.00 | | | | 9-1-2020 | | | | 1,140,000 | | | | 1,199,793 | |
| | | | |
Pittsburg CA Successor Agency of Los Medanos Community Development (AGM Insured) | | | 5.00 | | | | 8-1-2021 | | | | 1,885,000 | | | | 2,038,232 | |
| | | | |
Pittsburg CA Successor Agency of Los Medanos Community Development (AGM Insured) | | | 5.00 | | | | 8-1-2022 | | | | 1,305,000 | | | | 1,447,610 | |
| | | | |
Pittsburg CA Successor Agency of Los Medanos Community Development (AGM Insured) | | | 5.00 | | | | 8-1-2023 | | | | 780,000 | | | | 885,893 | |
| | | | |
Placentia CA RDA Project (Build America Mutual Assurance Company Insured) | | | 4.00 | | | | 8-1-2019 | | | | 580,000 | | | | 588,137 | |
| | | | |
Placentia CA RDA Project (Build America Mutual Assurance Company Insured) | | | 5.00 | | | | 8-1-2020 | | | | 600,000 | | | | 631,650 | |
| | | | |
Poway CA Unified School District PFA | | | 4.00 | | | | 9-15-2020 | | | | 335,000 | | | | 348,367 | |
| | | | |
Poway CA Unified School District PFA (Build America Mutual Assurance Company Insured) | | | 4.00 | | | | 10-1-2020 | | | | 300,000 | | | | 312,120 | |
| | | | |
Poway CA Unified School District PFA (Build America Mutual Assurance Company Insured) | | | 4.00 | | | | 10-1-2021 | | | | 185,000 | | | | 195,541 | |
| | | | |
Poway CA Unified School District PFA Series B (Build America Mutual Assurance Company Insured) | | | 5.00 | | | | 9-1-2024 | | | | 1,115,000 | | | | 1,281,570 | |
| | | | |
Poway CA Unified School District PFA Series B (Build America Mutual Assurance Company Insured) | | | 5.00 | | | | 9-1-2025 | | | | 775,000 | | | | 905,092 | |
| | | | |
Rialto CA RDA Successor Agency to Merged Project Area | | | 5.00 | | | | 9-1-2022 | | | | 475,000 | | | | 527,896 | |
| | | | |
Riverside CA PFA Local Measure Certificate of Participation Riverside Pavement Rehabilitation Project (AGM Insured) | | | 5.00 | | | | 6-1-2023 | | | | 845,000 | | | | 952,653 | |
| | | | |
Riverside County CA PFA Indian Wells Project Series A (AGM Insured) | | | 5.00 | | | | 9-1-2020 | | | | 1,610,000 | | | | 1,699,339 | |
| | | | |
Romoland CA School District Community Facilities District #2004-1 | | | 4.00 | | | | 9-1-2019 | | | | 850,000 | | | | 860,583 | |
| | | | |
Roseville CA Finance Authority Special Refunding Bond Series A | | | 5.00 | | | | 9-1-2023 | | | | 400,000 | | | | 458,708 | |
The accompanying notes are an integral part of these financial statements.
| | | | | | |
| Portfolio of investments—December 31, 2018 (unaudited) | | Wells Fargo California Limited-Term Tax-Free Fund | | | 15 | |
| | | | | | | | | | | | | | | | |
| Security name | | Interest rate | | | Maturity date | | | Principal | | | Value | |
| | | | |
| Tax Revenue(continued) | | | | | | | | | | | | | | | | |
| | | | |
Roseville CA Finance Authority Special Refunding Bond Series A | | | 5.00 | % | | | 9-1-2029 | | | $ | 300,000 | | | $ | 364,584 | |
| | | | |
Roseville CA Special Tax Refunding Bond Community Facilities District | | | 4.00 | | | | 9-1-2019 | | | | 875,000 | | | | 886,016 | |
| | | | |
Roseville CA Special Tax Refunding Bond Community Facilities District | | | 5.00 | | | | 9-1-2020 | | | | 1,050,000 | | | | 1,096,967 | |
| | | | |
Roseville CA Special Tax Refunding Bond Community Facilities District | | | 5.00 | | | | 9-1-2021 | | | | 500,000 | | | | 533,035 | |
| | | | |
Roseville CA Special Tax Refunding Bond Fiddyment Ranch Community | | | 5.00 | | | | 9-1-2024 | | | | 1,905,000 | | | | 2,125,047 | |
| | | | |
Roseville CA Special Tax Refunding Bond Fiddyment Ranch Community | | | 5.00 | | | | 9-1-2029 | | | | 1,595,000 | | | | 1,791,360 | |
| | | | |
San Francisco CA City & County RDA Successor Agency to Community Facilities District #6 Mission Bay South Series A | | | 5.00 | | | | 8-1-2019 | | | | 555,000 | | | | 565,090 | |
| | | | |
San Francisco CA City & County RDA Successor Agency to Community Facilities District #6 Mission Bay South Series A | | | 5.00 | | | | 8-1-2025 | | | | 1,600,000 | | | | 1,748,688 | |
| | | | |
San Francisco CA City & County RDA Successor Agency to Mission Bay South Redevelopment Project Series A | | | 5.00 | | | | 8-1-2020 | | | | 500,000 | | | | 524,930 | |
| | | | |
San Francisco CA City & County RDA Successor Agency to Mission Bay South Redevelopment Project Series A | | | 5.00 | | | | 8-1-2022 | | | | 375,000 | | | | 414,334 | |
| | | | |
San Francisco CA City & County RDA Successor Agency to Mission Bay South Redevelopment Project Subordinate Bond Series D 144A | | | 3.00 | | | | 8-1-2021 | | | | 4,000,000 | | | | 4,022,680 | |
| | | | |
San Jose CA Convention Center Expansion & Renovation Project | | | 5.25 | | | | 5-1-2023 | | | | 1,465,000 | | | | 1,577,585 | |
| | | | |
San Jose CA RDA Tax Refunding Bond Merged Area Redevelopment Project Series A-1 | | | 5.00 | | | | 8-1-2022 | | | | 800,000 | | | | 841,944 | |
| | | | |
San Marcos CA Unified School District Community Facilities District #5 (Build America Mutual Assurance Company Insured) | | | 5.00 | | | | 9-1-2020 | | | | 220,000 | | | | 232,098 | |
| | | | |
San Marcos CA Unified School District Community Facilities District #5 (Build America Mutual Assurance Company Insured) | | | 5.00 | | | | 9-1-2021 | | | | 270,000 | | | | 293,007 | |
| | | | |
San Marcos CA Unified School District Community Facilities District #5 (Build America Mutual Assurance Company Insured) | | | 5.00 | | | | 9-1-2022 | | | | 250,000 | | | | 278,310 | |
| | | | |
San Pablo CA RDA Series B (AGM Insured) | | | 5.00 | | | | 6-15-2021 | | | | 1,775,000 | | | | 1,907,415 | |
| | | | |
San Pablo CA RDA Series B (AGM Insured) | | | 5.00 | | | | 6-15-2022 | | | | 1,865,000 | | | | 2,055,193 | |
| | | | |
San Pablo CA RDA Series B (AGM Insured) | | | 5.00 | | | | 6-15-2023 | | | | 1,945,000 | | | | 2,191,354 | |
| | | | |
Santa Ana CA Community RDA Merged Project Area Series A | | | 5.25 | | | | 9-1-2019 | | | | 1,000,000 | | | | 1,023,890 | |
| | | | |
Santa Cruz County CA Redevelopment Successor Agency Tax Allocation Refunding Bond (Build America Mutual Assurance Company Insured) | | | 5.00 | | | | 9-1-2019 | | | | 625,000 | | | | 638,863 | |
| | | | |
Santa Cruz County CA Redevelopment Successor Agency Tax Allocation Refunding Bond (Build America Mutual Assurance Company Insured) | | | 5.00 | | | | 9-1-2020 | | | | 1,000,000 | | | | 1,054,650 | |
| | | | |
Solana Beach CA School District Special Tax PFA | | | 4.00 | | | | 9-1-2019 | | | | 735,000 | | | | 746,201 | |
| | | | |
Stockton CA RDA Refunding Bond Series A (AGM Insured) | | | 5.00 | | | | 9-1-2025 | | | | 1,675,000 | | | | 1,959,549 | |
| | | | |
Successor Agency to the Morgan Hill CA RDA Series A | | | 5.00 | | | | 9-1-2021 | | | | 1,055,000 | | | | 1,146,331 | |
| | | | |
Successor Agency to the Rancho Mirage CA RDA Refunding Bond Subordinate Lien Series A (Build America Mutual Assurance Company Insured) | | | 5.00 | | | | 4-1-2019 | | | | 580,000 | | | | 584,901 | |
| | | | |
Successor Agency to the Rancho Mirage CA RDA Series A (Build America Mutual Assurance Company Insured) | | | 5.00 | | | | 4-1-2019 | | | | 850,000 | | | | 857,183 | |
| | | | |
Successor Agency to the Rancho Mirage CA RDA Series A (Build America Mutual Assurance Company Insured) | | | 5.00 | | | | 4-1-2019 | | | | 600,000 | | | | 605,070 | |
| | | | |
Successor Agency to the Richmond CA Community RDA Series A (Build America Mutual Assurance Company Insured) | | | 4.50 | | | | 9-1-2025 | | | | 160,000 | | | | 177,682 | |
| | | | |
Successor Agency to the Richmond CA Community RDA Series A (Build America Mutual Assurance Company Insured) | | | 5.00 | | | | 9-1-2021 | | | | 310,000 | | | | 334,983 | |
| | | | |
Successor Agency to the Richmond CA Community RDA Series A (Build America Mutual Assurance Company Insured) | | | 5.00 | | | | 9-1-2022 | | | | 300,000 | | | | 332,061 | |
| | | | |
Successor Agency to the Richmond CA Community RDA Series A (Build America Mutual Assurance Company Insured) | | | 5.00 | | | | 9-1-2023 | | | | 265,000 | | | | 299,702 | |
| | | | |
Successor Agency to the Richmond CA Community RDA Series A (Build America Mutual Assurance Company Insured) | | | 5.00 | | | | 9-1-2025 | | | | 150,000 | | | | 170,100 | |
The accompanying notes are an integral part of these financial statements.
| | | | |
| 16 | | Wells Fargo California Limited-Term Tax-Free Fund | | Portfolio of investments—December 31, 2018 (unaudited) |
| | | | | | | | | | | | | | | | |
| Security name | | Interest rate | | | Maturity date | | | Principal | | | Value | |
| | | | |
| Tax Revenue(continued) | | | | | | | | | | | | | | | | |
| | | | |
Successor Agency to the Riverside County CA RDA Desert Communities Project Area Series D | | | 5.00 | % | | | 10-1-2022 | | | $ | 445,000 | | | $ | 493,598 | |
| | | | |
Successor Agency to the Riverside County CA RDA Desert Communities Project Area Series D | | | 5.00 | | | | 10-1-2023 | | | | 470,000 | | | | 532,595 | |
| | | | |
Successor Agency to the Riverside County CA RDA Project Area #1 Series A | | | 5.00 | | | | 10-1-2022 | | | | 240,000 | | | | 266,210 | |
| | | | |
Successor Agency to the Riverside County CA RDA Project Area #1 Series A | | | 5.00 | | | | 10-1-2023 | | | | 460,000 | | | | 521,263 | |
| | | | |
Sulphur Springs CA Union School District Prerefunded Bond Community Facilities District #2002-1 Series A | | | 3.00 | | | | 9-1-2019 | | | | 295,000 | | | | 297,487 | |
| | | | |
Sulphur Springs CA Union School District Unrefunded Bond Community Facilities District #2002-1 Series A | | | 3.00 | | | | 9-1-2019 | | | | 300,000 | | | | 302,865 | |
| | | | |
Tracy CA Community Facilities District #2016-1 | | | 4.00 | | | | 9-1-2021 | | | | 140,000 | | | | 144,603 | |
| | | | |
Tracy CA Community Facilities District #2016-1 | | | 4.00 | | | | 9-1-2022 | | | | 180,000 | | | | 186,952 | |
| | | | |
Tracy CA Community Facilities District #2016-1 | | | 4.00 | | | | 9-1-2024 | | | | 135,000 | | | | 140,760 | |
| | | | |
Tracy CA Community Facilities District #2016-1 | | | 4.00 | | | | 9-1-2025 | | | | 155,000 | | | | 162,096 | |
| | | | |
Tracy CA Community Facilities District #2016-1 | | | 5.00 | | | | 9-1-2028 | | | | 425,000 | | | | 475,388 | |
| | | | |
Tustin CA Community Facilities District #6-1 Legacy Columbus Villages Series A | | | 5.00 | | | | 9-1-2025 | | | | 1,000,000 | | | | 1,169,200 | |
| | | | |
Upland CA Successor Agency to Merged Project Tax Allocation Bond (AGM Insured) | | | 5.00 | | | | 9-1-2023 | | | | 1,000,000 | | | | 1,133,810 | |
| | | | |
Vacaville CA RDA Tax Allocation Refunding Bond Subordinate Redevelopment Projects | | | 5.00 | | | | 9-1-2020 | | | | 600,000 | | | | 632,484 | |
| | | | |
Vacaville CA RDA Tax Allocation Refunding Bond Subordinate Redevelopment Projects | | | 5.00 | | | | 9-1-2021 | | | | 600,000 | | | | 648,840 | |
| | | | |
Vacaville CA RDA Tax Allocation Refunding Bond Subordinate Redevelopment Projects | | | 5.00 | | | | 9-1-2022 | | | | 1,050,000 | | | | 1,164,177 | |
| | | | |
Val Verde CA Unified School District (Build America Mutual Assurance Company Insured) | | | 4.00 | | | | 10-1-2020 | | | | 350,000 | | | | 363,955 | |
| | | | |
Val Verde CA Unified School District (Build America Mutual Assurance Company Insured) | | | 4.00 | | | | 10-1-2021 | | | | 375,000 | | | | 395,438 | |
| | | | |
Val Verde CA Unified School District (Build America Mutual Assurance Company Insured) | | | 5.00 | | | | 10-1-2022 | | | | 665,000 | | | | 735,596 | |
| | | | |
Western Riverside County CA Regional Wastewater Authority Series A-1 | | | 4.00 | | | | 9-1-2019 | | | | 1,830,000 | | | | 1,856,425 | |
| | | | |
Yuba City CA RDA Refunding Bond (AGM Insured) | | | 5.00 | | | | 9-1-2025 | | | | 750,000 | | | | 883,500 | |
| | | | |
| | | | | | | | | | | | | | | 129,071,163 | |
| | | | | | | | | | | | | | | | |
| | | | |
| Tobacco Revenue: 0.63% | | | | | | | | | | | | | | | | |
| | | | |
Golden State Tobacco Securitization Corporation Tobacco Settlement Refunding Bond Series A1 | | | 5.00 | | | | 6-1-2026 | | | | 3,000,000 | | | | 3,343,230 | |
| | | | | | | | | | | | | | | | |
| | | | |
| Transportation Revenue: 0.65% | | | | | | | | | | | | | | | | |
| | | | |
Alameda County CA Corridor Transportation Authority Prerefunded Bond CAB Subordinate Lien Series A (Ambac Insured) (z) | | | 6.17 | | | | 10-1-2019 | | | | 2,780,000 | | | | 2,747,001 | |
| | | | |
Alameda County CA Corridor Transportation Authority Unrefunded Bond CAB Subordinate Lien Series A (Ambac Insured) (z) | | | 6.17 | | | | 10-1-2019 | | | | 220,000 | | | | 215,651 | |
| | | | |
Sacramento CA Regional Transportation District Farebox | | | 5.00 | | | | 3-1-2019 | | | | 500,000 | | | | 502,825 | |
| | | | |
| | | | | | | | | | | | | | | 3,465,477 | |
| | | | | | | | | | | | | | | | |
| | | | |
| Utilities Revenue: 2.35% | | | | | | | | | | | | | | | | |
| | | | |
Colton CA PFA Series A | | | 4.00 | | | | 4-1-2019 | | | | 415,000 | | | | 417,419 | |
| | | | |
Modesto CA Irrigation District Electric Refunding Bond Series A | | | 5.00 | | | | 7-1-2020 | | | | 500,000 | | | | 525,080 | |
| | | | |
Southern California Public Power Authority Refunding Bond Canyon Power Project Series A | | | 2.25 | | | | 7-1-2040 | | | | 6,000,000 | | | | 6,023,520 | |
| | | | |
Southern California Public Power Authority Refunding Bond Canyon Power Project Series A | | | 5.00 | | | | 7-1-2027 | | | | 1,000,000 | | | | 1,073,400 | |
The accompanying notes are an integral part of these financial statements.
| | | | | | |
| Portfolio of investments—December 31, 2018 (unaudited) | | Wells Fargo California Limited-Term Tax-Free Fund | | | 17 | |
| | | | | | | | | | | | | | | | |
| Security name | | Interest rate | | | Maturity date | | | Principal | | | Value | |
| | | | |
| Utilities Revenue(continued) | | | | | | | | | | | | | | | | |
| | | | |
Southern California Public Power Authority Refunding Bond Canyon Power Project Series B (SIFMA Municipal Swap +0.25%) ± | | | 1.96 | % | | | 7-1-2040 | | | $ | 4,000,000 | | | $ | 3,982,440 | |
| | | | |
Walnut CA Energy Center Authority Refunding Bond Series A | | | 5.00 | | | | 1-1-2021 | | | | 500,000 | | | | 533,340 | |
| | | | |
| | | | | | | | | | | | | | | 12,555,199 | |
| | | | | | | | | | | | | | | | |
| | | | |
| Water & Sewer Revenue: 4.01% | | | | | | | | | | | | | | | | |
| | | | |
Eastern California Municipal Water District Refunding Bond Series C (SIFMA Municipal Swap +0.25%) ± | | | 1.96 | | | | 7-1-2046 | | | | 3,000,000 | | | | 3,000,090 | |
| | | | |
Florin CA Resource Conservation District Series A (National Insured) | | | 5.00 | | | | 9-1-2019 | | | | 1,000,000 | | | | 1,021,310 | |
| | | | |
Florin CA Resource Conservation District Series A (National Insured) | | | 5.00 | | | | 9-1-2020 | | | | 1,000,000 | | | | 1,052,450 | |
| | | | |
Florin CA Resource Conservation District Series A (National Insured) | | | 5.00 | | | | 9-1-2021 | | | | 1,250,000 | | | | 1,349,725 | |
| | | | |
Florin CA Resource Conservation District Series A (National Insured) | | | 5.00 | | | | 9-1-2022 | | | | 1,250,000 | | | | 1,382,188 | |
| | | | |
Goleta CA Water District Certificate of Participation Series A (AGM Insured) | | | 5.00 | | | | 12-1-2019 | | | | 125,000 | | | | 128,700 | |
| | | | |
Goleta CA Water District Certificate of Participation Series A (AGM Insured) | | | 5.00 | | | | 12-1-2020 | | | | 140,000 | | | | 148,513 | |
| | | | |
Oxnard CA Financing Authority Refunding Bond (AGM Insured) | | | 5.00 | | | | 6-1-2021 | | | | 735,000 | | | | 791,691 | |
| | | | |
San Fransico City & County CA Public Utilities Commision Series C Green Bond | | | 2.13 | | | | 10-1-2048 | | | | 10,000,000 | | | | 10,018,100 | |
| | | | |
San Luis & Delta-Mendota CA Water Authority Delta Habitat Conservation & Conveyance Program Development Project Series A (Build America Mutual Assurance Company Insured) | | | 5.00 | | | | 3-1-2019 | | | | 100,000 | | | | 100,558 | |
| | | | |
San Luis & Delta-Mendota CA Water Authority Delta Habitat Conservation & Conveyance Program Development Project Series A (Build America Mutual Assurance Company Insured) | | | 5.00 | | | | 3-1-2020 | | | | 100,000 | | | | 103,929 | |
| | | | |
Vallejo CA Refunding Bond (National Insured) | | | 5.00 | | | | 5-1-2019 | | | | 790,000 | | | | 792,046 | |
| | | | |
Vallejo CA Refunding Bond (National Insured) | | | 5.00 | | | | 5-1-2021 | | | | 1,500,000 | | | | 1,503,315 | |
| | | | |
| | | | | | | | | | | | | | | 21,392,615 | |
| | | | | | | | | | | | | | | | |
| | | | |
| | | | | | | | | | | | | | | 498,715,793 | |
| | | | | | | | | | | | | | | | |
| | | | |
Guam: 0.58% | | | | | | | | | | | | | | | | |
| | | | |
| Airport Revenue: 0.26% | | | | | | | | | | | | | | | | |
| | | | |
Guam Port Authority AMT Series B | | | 5.00 | | | | 7-1-2023 | | | | 540,000 | | | | 585,803 | |
| | | | |
Guam Port Authority AMT Series B | | | 5.00 | | | | 7-1-2024 | | | | 750,000 | | | | 822,278 | |
| | | | |
| | | | | | | | | | | | | | | 1,408,081 | |
| | | | | | | | | | | | | | | | |
| | | | |
| Utilities Revenue: 0.32% | | | | | | | | | | | | | | | | |
| | | | |
Guam Power Authority Series A (AGM Insured) | | | 5.00 | | | | 10-1-2019 | | | | 1,640,000 | | | | 1,675,145 | |
| | | | | | | | | | | | | | | | |
| | | | |
| | | | | | | | | | | | | | | 3,083,226 | |
| | | | | | | | | | | | | | | | |
| | | | |
Illinois: 2.45% | | | | | | | | | | | | | | | | |
| | | | |
| Miscellaneous Revenue: 2.00% | | | | | | | | | | | | | | | | |
| | | | |
Illinois Series D | | | 5.00 | | | | 11-1-2025 | | | | 10,000,000 | | | | 10,690,400 | |
| | | | | | | | | | | | | | | | |
| | | | |
| Tax Revenue: 0.45% | | | | | | | | | | | | | | | | |
| | | | |
Metropolitan Pier & Exposition Authority McCormick Place Expansion Project Series B | | | 5.00 | | | | 12-15-2025 | | | | 650,000 | | | | 698,880 | |
| | | | |
Sales Tax Securitization Corporation Series 2017A | | | 5.00 | | | | 1-1-2026 | | | | 1,500,000 | | | | 1,680,975 | |
| | | | |
| | | | | | | | | | | | | | | 2,379,855 | |
| | | | | | | | | | | | | | | | |
| | | | |
| | | | | | | | | | | | | | | 13,070,255 | |
| | | | | | | | | | | | | | | | |
The accompanying notes are an integral part of these financial statements.
| | | | |
| 18 | | Wells Fargo California Limited-Term Tax-Free Fund | | Portfolio of investments—December 31, 2018 (unaudited) |
| | | | | | | | | | | | | | | | |
| Security name | | Interest rate | | | Maturity date | | | Principal | | | Value | |
| | | | |
New York: 1.05% | | | | | | | | | | | | | | | | |
| | | | |
| Industrial Development Revenue: 1.05% | | | | | | | | | | | | | | | | |
| | | | |
New York Transportation Development Corporation Special Facilities Revenue Delta Air Lines Incorporated LaGuardia Airport Terminals C&D Redevelopment | | | 5.00 | % | | | 1-1-2026 | | | $ | 5,000,000 | | | $ | 5,620,000 | |
| | | | | | | | | | | | | | | | |
| | | | |
Texas: 0.38% | | | | | | | | | | | | | | | | |
| | | | |
| Resource Recovery Revenue: 0.38% | | | | | | | | | | | | | | | | |
| | | | |
Port Arthur TX Navigation District Jefferson County Environmental Facilities Motiva Enterprises LLC Project Series A ø | | | 2.05 | | | | 4-1-2040 | | | | 2,000,000 | | | | 2,000,000 | |
| | | | | | | | | | | | | | | | |
| | | | |
Total Municipal Obligations (Cost $514,590,317) | | | | | | | | | | | | | | | 522,489,274 | |
| | | | | | | | | | | | | | | | |
| | | | |
Other: 0.94% | | | | | | | | | | | | | | | | |
| | | | |
Nuveen California AMT-Free Quality Municipal Income Fund Preferred Shares Series A 144A§øø | | | 2.01 | | | | 10-1-2047 | | | | 5,000,000 | | | | 5,000,000 | |
| | | | | | | | | | | | | | | | |
| | | | |
Total Other (Cost $5,000,000) | | | | | | | | | | | | | | | 5,000,000 | |
| | | | | | | | | | | | | | | | |
| | | | |
| | | Yield | | | | | | Shares | | | | |
| Short-Term Investments: 0.29% | | | | | | | | | | | | | | | | |
| | | | |
| Investment Companies: 0.29% | | | | | | | | | | | | | | | | |
| | | | |
Wells Fargo Municipal Cash Management Money Market Fund Institutional Class (l)(u) | | | 1.65 | | | | | | | | 1,563,394 | | | | 1,564,019 | |
| | | | | | | | | | | | | | | | |
| | | | |
Total Short-Term Investments (Cost $1,564,019) | | | | | | | | | | | | | | | 1,564,019 | |
| | | | | | | | | | | | | | | | |
| | | | | | | | |
| Total investments in securities (Cost $521,154,336) | | | 99.13 | % | | | 529,053,293 | |
| | |
Other assets and liabilities, net | | | 0.87 | | | | 4,670,016 | |
| | | | | | | | |
| Total net assets | | | 100.00 | % | | $ | 533,723,309 | |
| | | | | | | | |
| 144A | The security may be resold in transactions exempt from registration, normally to qualified institutional buyers, pursuant to Rule 144A under the Securities Act of 1933. |
| ± | Variable rate investment. The rate shown is the rate in effect at period end. |
| (z) | Zero coupon security. The rate represents the purchase yield to maturity. |
| (m) | The security is an auction-rate security which has an interest rate that resets at predetermined short-term intervals through a Dutch auction. The rate shown is the rate in effect at period end. |
| ø | Variable rate demand notes are subject to a demand feature which reduces the effective maturity. The maturity date shown represents the final maturity date of the security. The interest rate is determined and reset by the issuer daily, weekly, or monthly depending upon the terms of the security. The rate shown is the rate in effect at period end. |
| § | The security is subject to a demand feature which reduces the effective maturity. |
| øø | The interest rate is determined and reset by the issuer periodically depending upon the terms of the security. The rate shown is the rate in effect at period end. |
| (l) | The issuer of the security is an affiliated person of the Fund as defined in the Investment Company Act of 1940. |
| (u) | The rate represents the 7-day annualized yield at period end. |
The accompanying notes are an integral part of these financial statements.
| | | | | | |
| Portfolio of investments—December 31, 2018 (unaudited) | | Wells Fargo California Limited-Term Tax-Free Fund | | | 19 | |
Abbreviations:
| AGM | Assured Guaranty Municipal |
| Ambac | Ambac Financial Group Incorporated |
| AMT | Alternative minimum tax |
| BAN | Bond anticipation notes |
| CAB | Capital appreciation bond |
| CDA | Community Development Authority |
| FHLMC | Federal Home Loan Mortgage Corporation |
| FNMA | Federal National Mortgage Association |
| GNMA | Government National Mortgage Association |
| HFA | Housing Finance Authority |
| HFFA | Health Facilities Financing Authority |
| LIBOR | London Interbank Offered Rate |
| National | National Public Finance Guarantee Corporation |
| PCFA | Pollution Control Financing Authority |
| PFA | Public Finance Authority |
| RDA | Redevelopment Authority |
| SIFMA | Securities Industry and Financial Markets Association |
Investments in Affiliates
An affiliated investment is an investment in which the Fund owns at least 5% of the outstanding voting shares of the issuer or as a result of other relationships, such as the Fund and the issuer having the same investment manager. Transactions with issuers that were either affiliated persons of the Fund at the beginning of the period or the end of the period were as follows:
| | | | | | | | | | | | | | | | | | | | | | | | | | | | | | | | | | | | |
| | | Shares,
beginning of
period | | | Shares
purchased | | | Shares
sold | | | Shares,
end of
period | | | Net
realized gains
(losses) | | | Net
change in
unrealized gains
(losses) | | | Income
from
affiliated
securities | | | Value,
end
of period | | | % of
net assets | |
Short-Term Investments | | | | | | | | | | | | | | | | | | | | | | | | | | | | | | | | | | | | |
Investment Companies | | | | | | | | | | | | | | | | | | | | | | | | | | | | | | | | | | | | |
Wells Fargo Municipal Cash Management Money Market Fund Institutional Class | | | 1,529,712 | | | | 118,245,497 | | | | 118,211,815 | | | | 1,563,394 | | | $ | (852 | ) | | $ | 0 | | | $ | 14,761 | | | $ | 1,564,019 | | | | 0.29 | % |
The accompanying notes are an integral part of these financial statements.
| | | | |
| 20 | | Wells Fargo California Limited-Term Tax-Free Fund | | Statement of assets and liabilities—December 31, 2018 (unaudited) |
| | | | |
| | | | |
| |
Assets | | | | |
Investments in unaffiliated securities, at value (cost $519,590,317) | | $ | 527,489,274 | |
Investments in affiliated securities, at value (cost $1,564,019) | | | 1,564,019 | |
Receivable for investments sold | | | 250,078 | |
Receivable for Fund shares sold | | | 3,540,757 | |
Receivable for interest | | | 6,260,733 | |
Prepaid expenses and other assets | | | 30,479 | |
| | | | |
Total assets | | | 539,135,340 | |
| | | | |
| |
Liabilities | | | | |
Payable for Fund shares redeemed | | | 4,007,224 | |
Due to custodian bank | | | 763,849 | |
Dividends payable | | | 316,580 | |
Management fee payable | | | 160,279 | |
Administration fees payable | | | 49,804 | |
Distribution fee payable | | | 15,765 | |
Trustees’ fees and expenses payable | | | 741 | |
Accrued expenses and other liabilities | | | 97,789 | |
| | | | |
Total liabilities | | | 5,412,031 | |
| | | | |
Total net assets | | $ | 533,723,309 | |
| | | | |
| |
NET ASSETS CONSIST OF | | | | |
Paid-in capital | | $ | 533,296,086 | |
Total distributable earnings | | | 427,223 | |
| | | | |
Total net assets | | $ | 533,723,309 | |
| | | | |
| |
COMPUTATION OF NET ASSET VALUE AND OFFERING PRICE PER SHARE | | | | |
Net assets – Class A | | $ | 112,989,440 | |
Shares outstanding – Class A1 | | | 10,669,539 | |
Net asset value per share – Class A | | | $10.59 | |
Maximum offering price per share – Class A2 | | | $10.81 | |
Net assets – Class C | | $ | 23,656,606 | |
Shares outstanding – Class C1 | | | 2,234,450 | |
Net asset value per share – Class C | | | $10.59 | |
Net assets – Administrator Class | | $ | 101,311,900 | |
Shares outstanding – Administrator Class1 | | | 9,714,507 | |
Net asset value per share – Administrator Class | | | $10.43 | |
Net assets – Institutional Class | | $ | 295,762,363 | |
Shares outstanding – Institutional Class1 | | | 28,376,855 | |
Net asset value per share – Institutional Class | | | $10.42 | |
| 1 | The Fund has an unlimited number of authorized shares. |
| 2 | Maximum offering price is computed as 100/98 of net asset value. On investments of $50,000 or more, the offering price is reduced. |
The accompanying notes are an integral part of these financial statements.
| | | | | | |
| Statement of operations—six months ended December 31, 2018 (unaudited) | | Wells Fargo California Limited-Term Tax-Free Fund | | | 21 | |
| | | | |
| | | | |
| |
Investment income | | | | |
Interest | | $ | 7,710,312 | |
Income from affiliated securities | | | 14,761 | |
| | | | |
Total investment income | | | 7,725,073 | |
| | | | |
| |
Expenses | | | | |
Management fee | | | 1,162,295 | |
Administration fees | | | | |
Class A | | | 94,995 | |
Class C | | | 20,368 | |
Administrator Class | | | 59,660 | |
Institutional Class | | | 129,104 | |
Shareholder servicing fees | | | | |
Class A | | | 148,430 | |
Class C | | | 31,825 | |
Administrator Class | | | 148,933 | |
Distribution fee | | | | |
Class C | | | 95,475 | |
Custody and accounting fees | | | 7,091 | |
Professional fees | | | 28,590 | |
Registration fees | | | 44,986 | |
Shareholder report expenses | | | 10,039 | |
Trustees’ fees and expenses | | | 14,232 | |
Other fees and expenses | | | 14,036 | |
| | | | |
Total expenses | | | 2,010,059 | |
Less: Fee waivers and/or expense reimbursements | | | (172,910 | ) |
| | | | |
Net expenses | | | 1,837,149 | |
| | | | |
Net investment income | | | 5,887,924 | |
| | | | |
| |
REALIZED AND UNREALIZED GAINS (LOSSES) ON INVESTMENTS | | | | |
| |
| Net realized gains (losses) on: | | | | |
Unaffiliated securities | | | (790,196 | ) |
Affiliated securities | | | (852 | ) |
Futures contracts | | | 343,070 | |
| | | | |
Net realized losses on investments | | | (447,978 | ) |
Net change in unrealized gains (losses) on investments | | | (884,904 | ) |
| | | | |
Net realized and unrealized gains (losses) on investments | | | (1,332,882 | ) |
| | | | |
Net increase in net assets resulting from operations | | $ | 4,555,042 | |
| | | | |
The accompanying notes are an integral part of these financial statements.
| | | | |
| 22 | | Wells Fargo California Limited-Term Tax-Free Fund | | Statement of changes in net assets |
| | | | | | | | | | | | | | | | |
| | | Six months ended
December 31, 2018 (unaudited) | | | Year ended
June 30, 20181 | |
| | | | |
Operations | | | | | | | | | | | | | | | | |
Net investment income | | | | | | $ | 5,887,924 | | | | | | | $ | 12,429,693 | |
Net realized losses on investments | | | | | | | (447,978 | ) | | | | | | | (3,427,387 | ) |
Net change in unrealized gains (losses) on investments | | | | | | | (884,904 | ) | | | | | | | (8,011,347 | ) |
| | | | |
Net increase in net assets resulting from operations | | | | | | | 4,555,042 | | | | | | | | 990,959 | |
| | | | |
| | | | |
Distributions to shareholders from net investment income and net realized gains | | | | | | | | | | | | | | | | |
Class A | | | | | | | (1,091,565 | ) | | | | | | | (2,407,589 | ) |
Class C | | | | | | | (137,556 | ) | | | | | | | (297,433 | ) |
Administrator Class | | | | | | | (1,211,675 | ) | | | | | | | (2,899,311 | ) |
Institutional Class | | | | | | | (3,445,464 | ) | | | | | | | (6,825,360 | ) |
| | | | |
Total distributions to shareholders | | | | | | | (5,886,260 | ) | | | | | | | (12,429,693 | ) |
| | | | |
| | | | |
Capital share transactions | | | Shares | | | | | | | | Shares | | | | | |
Proceeds from shares sold | | | | | | | | | | | | | | | | |
Class A | | | 676,898 | | | | 7,162,566 | | | | 2,077,616 | | | | 22,303,849 | |
Class C | | | 34,788 | | | | 367,863 | | | | 177,303 | | | | 1,905,490 | |
Administrator Class | | | 1,402,334 | | | | 14,562,270 | | | | 1,932,144 | | | | 20,369,275 | |
Institutional Class | | | 7,889,141 | | | | 82,164,266 | | | | 16,566,094 | | | | 174,446,045 | |
| | | | |
| | | | |
| | | | | | | 104,256,965 | | | | | | | | 219,024,659 | |
| | | | |
Reinvestment of distributions | | | | | | | | | | | | | | | | |
Class A | | | 88,485 | | | | 934,796 | | | | 197,697 | | | | 2,114,653 | |
Class C | | | 12,029 | | | | 127,054 | | | | 25,519 | | | | 272,822 | |
Administrator Class | | | 115,520 | | | | 1,202,155 | | | | 273,523 | | | | 2,881,478 | |
Institutional Class | | | 152,820 | | | | 1,588,757 | | | | 298,293 | | | | 3,139,346 | |
| | | | |
| | | | |
| | | | | | | 3,852,762 | | | | | | | | 8,408,299 | |
| | | | |
Payment for shares redeemed | | | | | | | | | | | | | | | | |
Class A | | | (1,375,640 | ) | | | (14,526,601 | ) | | | (4,796,149 | ) | | | (51,144,759 | ) |
Class C | | | (345,606 | ) | | | (3,649,045 | ) | | | (831,210 | ) | | | (8,905,544 | ) |
Administrator Class | | | (4,590,060 | ) | | | (47,808,061 | ) | | | (4,731,716 | ) | | | (49,743,594 | ) |
Institutional Class | | | (10,887,538 | ) | | | (113,149,795 | ) | | | (20,555,577 | ) | | | (216,738,610 | ) |
| | | | |
| | | | |
| | | | | | | (179,133,502 | ) | | | | | | | (326,532,507 | ) |
| | | | |
Net decrease in net assets resulting from capital share transactions | | | | | | | (71,023,775 | ) | | | | | | | (99,099,549 | ) |
| | | | |
Total decrease in net assets | | | | | | | (72,354,993 | ) | | | | | | | (110,538,283 | ) |
| | | | |
| | | | |
Net assets | | | | | | | | | | | | | | | | |
Beginning of period | | | | | | | 606,078,302 | | | | | | | | 716,616,585 | |
| | | | |
End of period | | | | | | $ | 533,723,309 | | | | | | | $ | 606,078,302 | |
| | | | |
| 1 | Effective for all filings after November 4, 2018, the SEC prospectively eliminated the requirement to parenthetically disclose undistributed net investment income at the end of the period and permitted the aggregation of distributions, with the exception of tax basis returns of capital. Undistributed net investment income at June 30, 2018 was $475,690. The disaggregated distributions information for the year ended June 30, 2018 is included in Note 8,Distributions to Shareholders, in the notes to the financial statements. |
The accompanying notes are an integral part of these financial statements.
| | | | | | |
| Financial highlights | | Wells Fargo California Limited-Term Tax-Free Fund | | | 23 | |
(For a share outstanding throughout each period)
| | | | | | | | | | | | | | | | | | | | | | | | |
| | | Six months ended December 31, 2018 (unaudited) | | | Year ended June 30 | |
| CLASS A | | 2018 | | | 2017 | | | 2016 | | | 2015 | | | 2014 | |
Net asset value, beginning of period | | | $10.61 | | | | $10.79 | | | | $11.04 | | | | $10.83 | | | | $10.86 | | | | $10.66 | |
Net investment income | | | 0.10 | | | | 0.19 | | | | 0.18 | | | | 0.17 | | | | 0.16 | | | | 0.18 | |
Net realized and unrealized gains (losses) on investments | | | (0.02 | ) | | | (0.18 | ) | | | (0.25 | ) | | | 0.21 | | | | (0.03 | ) | | | 0.20 | |
| | | | | | | | | | | | | | | | | | | | | | | | |
Total from investment operations | | | 0.08 | | | | 0.01 | | | | (0.07 | ) | | | 0.38 | | | | 0.13 | | | | 0.38 | |
Distributions to shareholders from | | | | | | | | | | | | | | | | | | | | | | | | |
Net investment income | | | (0.10 | ) | | | (0.19 | ) | | | (0.18 | ) | | | (0.17 | ) | | | (0.16 | ) | | | (0.18 | ) |
Net asset value, end of period | | | $10.59 | | | | $10.61 | | | | $10.79 | | | | $11.04 | | | | $10.83 | | | | $10.86 | |
Total return1 | | | 0.74 | % | | | 0.05 | % | | | (0.64 | )% | | | 3.54 | % | | | 1.22 | % | | | 3.61 | % |
Ratios to average net assets (annualized) | | | | | | | | | | | | | | | | | | | | | | | | |
Gross expenses | | | 0.85 | % | | | 0.84 | % | | | 0.83 | % | | | 0.83 | % | | | 0.82 | % | | | 0.83 | % |
Net expenses | | | 0.80 | % | | | 0.80 | % | | | 0.80 | % | | | 0.80 | % | | | 0.80 | % | | | 0.80 | % |
Net investment income | | | 1.84 | % | | | 1.73 | % | | | 1.65 | % | | | 1.56 | % | | | 1.49 | % | | | 1.70 | % |
Supplemental data | | | | | | | | | | | | | | | | | | | | | | | | |
Portfolio turnover rate | | | 6 | % | | | 45 | % | | | 21 | % | | | 21 | % | | | 31 | % | | | 31 | % |
Net assets, end of period (000s omitted) | | | $112,989 | | | | $119,657 | | | | $148,933 | | | | $196,629 | | | | $198,402 | | | | $203,306 | |
| 1 | Total return calculations do not include any sales charges. Returns for periods of less than one year are not annualized. |
The accompanying notes are an integral part of these financial statements.
| | | | |
| 24 | | Wells Fargo California Limited-Term Tax-Free Fund | | Financial highlights |
(For a share outstanding throughout each period)
| | | | | | | | | | | | | | | | | | | | | | | | |
| | | Six months ended December 31, 2018 (unaudited) | | | Year ended June 30 | |
| CLASS C | | 2018 | | | 2017 | | | 2016 | | | 2015 | | | 2014 | |
Net asset value, beginning of period | | | $10.61 | | | | $10.79 | | | | $11.04 | | | | $10.83 | | | | $10.86 | | | | $10.65 | |
Net investment income | | | 0.06 | | | | 0.11 | | | | 0.10 | | | | 0.09 | | | | 0.08 | | | | 0.10 | |
Net realized and unrealized gains (losses) on investments | | | (0.02 | ) | | | (0.18 | ) | | | (0.25 | ) | | | 0.21 | | | | (0.03 | ) | | | 0.21 | |
| | | | | | | | | | | | | | | | | | | | | | | | |
Total from investment operations | | | 0.04 | | | | (0.07 | ) | | | (0.15 | ) | | | 0.30 | | | | 0.05 | | | | 0.31 | |
Distributions to shareholders from | | | | | | | | | | | | | | | | | | | | | | | | |
Net investment income | | | (0.06 | ) | | | (0.11 | ) | | | (0.10 | ) | | | (0.09 | ) | | | (0.08 | ) | | | (0.10 | ) |
Net asset value, end of period | | | $10.59 | | | | $10.61 | | | | $10.79 | | | | $11.04 | | | | $10.83 | | | | $10.86 | |
Total return1 | | | 0.36 | % | | | (0.70 | )% | | | (1.38 | )% | | | 2.76 | % | | | 0.47 | % | | | 2.94 | % |
Ratios to average net assets (annualized) | | | | | | | | | | | | | | | | | | | | | | | | |
Gross expenses | | | 1.60 | % | | | 1.59 | % | | | 1.58 | % | | | 1.58 | % | | | 1.57 | % | | | 1.58 | % |
Net expenses | | | 1.55 | % | | | 1.55 | % | | | 1.55 | % | | | 1.55 | % | | | 1.55 | % | | | 1.55 | % |
Net investment income | | | 1.09 | % | | | 0.98 | % | | | 0.90 | % | | | 0.81 | % | | | 0.74 | % | | | 0.95 | % |
Supplemental data | | | | | | | | | | | | | | | | | | | | | | | | |
Portfolio turnover rate | | | 6 | % | | | 45 | % | | | 21 | % | | | 21 | % | | | 31 | % | | | 31 | % |
Net assets, end of period (000s omitted) | | | $23,657 | | | | $26,868 | | | | $34,113 | | | | $40,098 | | | | $33,996 | | | | $34,920 | |
| 1 | Total return calculations do not include any sales charges. Returns for periods of less than one year are not annualized. |
The accompanying notes are an integral part of these financial statements.
| | | | | | |
| Financial highlights | | Wells Fargo California Limited-Term Tax-Free Fund | | | 25 | |
(For a share outstanding throughout each period)
| | | | | | | | | | | | | | | | | | | | | | | | |
| | | Six months ended December 31, 2018 (unaudited) | | | Year ended June 30 | |
| ADMINISTRATOR CLASS | | 2018 | | | 2017 | | | 2016 | | | 2015 | | | 2014 | |
Net asset value, beginning of period | | | $10.45 | | | | $10.63 | | | | $10.87 | | | | $10.66 | | | | $10.70 | | | | $10.49 | |
Net investment income | | | 0.11 | | | | 0.20 | 1 | | | 0.20 | | | | 0.19 | | | | 0.18 | | | | 0.20 | |
Net realized and unrealized gains (losses) on investments | | | (0.02 | ) | | | (0.18 | ) | | | (0.24 | ) | | | 0.21 | | | | (0.04 | ) | | | 0.21 | |
| | | | | | | | | | | | | | | | | | | | | | | | |
Total from investment operations | | | 0.09 | | | | 0.02 | | | | (0.04 | ) | | | 0.40 | | | | 0.14 | | | | 0.41 | |
Distributions to shareholders from | | | | | | | | | | | | | | | | | | | | | | | | |
Net investment income | | | (0.11 | ) | | | (0.20 | ) | | | (0.20 | ) | | | (0.19 | ) | | | (0.18 | ) | | | (0.20 | ) |
Net asset value, end of period | | | $10.43 | | | | $10.45 | | | | $10.63 | | | | $10.87 | | | | $10.66 | | | | $10.70 | |
Total return2 | | | 0.84 | % | | | 0.23 | % | | | (0.38 | )% | | | 3.78 | % | | | 1.33 | % | | | 3.95 | % |
Ratios to average net assets (annualized) | | | | | | | | | | | | | | | | | | | | | | | | |
Gross expenses | | | 0.79 | % | | | 0.78 | % | | | 0.77 | % | | | 0.77 | % | | | 0.76 | % | | | 0.77 | % |
Net expenses | | | 0.60 | % | | | 0.60 | % | | | 0.60 | % | | | 0.60 | % | | | 0.60 | % | | | 0.60 | % |
Net investment income | | | 2.03 | % | | | 1.93 | % | | | 1.84 | % | | | 1.75 | % | | | 1.69 | % | | | 1.90 | % |
Supplemental data | | | | | | | | | | | | | | | | | | | | | | | | |
Portfolio turnover rate | | | 6 | % | | | 45 | % | | | 21 | % | | | 21 | % | | | 31 | % | | | 31 | % |
Net assets, end of period (000s omitted) | | | $101,312 | | | | $133,581 | | | | $162,747 | | | | $226,581 | | | | $309,120 | | | | $550,156 | |
| 1 | Calculated based upon average shares outstanding |
| 2 | Returns for periods of less than one year are not annualized. |
The accompanying notes are an integral part of these financial statements.
| | | | |
| 26 | | Wells Fargo California Limited-Term Tax-Free Fund | | Financial highlights |
(For a share outstanding throughout each period)
| | | | | | | | | | | | | | | | | | | | |
| | | Six months ended December 31, 2018 (unaudited) | | | Year ended June 30 | |
| INSTITUTIONAL CLASS | | 2018 | | | 2017 | | | 2016 | | | 20151 | |
Net asset value, beginning of period | | | $10.44 | | | | $10.62 | | | | $10.86 | | | | $10.66 | | | | $10.75 | |
Net investment income | | | 0.11 | | | | 0.21 | | | | 0.21 | | | | 0.20 | | | | 0.13 | |
Net realized and unrealized gains (losses) on investments | | | (0.02 | ) | | | (0.18 | ) | | | (0.24 | ) | | | 0.20 | | | | (0.09 | ) |
| | | | | | | | | | | | | | | | | | | | |
Total from investment operations | | | 0.09 | | | | 0.03 | | | | (0.03 | ) | | | 0.40 | | | | 0.04 | |
Distributions to shareholders from | | | | | | | | | | | | | | | | | | | | |
Net investment income | | | (0.11 | ) | | | (0.21 | ) | | | (0.21 | ) | | | (0.20 | ) | | | (0.13 | ) |
Net asset value, end of period | | | $10.42 | | | | $10.44 | | | | $10.62 | | | | $10.86 | | | | $10.66 | |
Total return2 | | | 0.89 | % | | | 0.33 | % | | | (0.28 | )% | | | 3.79 | % | | | 0.35 | % |
Ratios to average net assets (annualized) | | | | | | | | | | | | | | | | | | | | |
Gross expenses | | | 0.52 | % | | | 0.51 | % | | | 0.50 | % | | | 0.50 | % | | | 0.50 | % |
Net expenses | | | 0.50 | % | | | 0.50 | % | | | 0.50 | % | | | 0.50 | % | | | 0.50 | % |
Net investment income | | | 2.14 | % | | | 2.03 | % | | | 1.95 | % | | | 1.86 | % | | | 1.82 | % |
Supplemental data | | | | | | | | | | | | | | | | | | | | |
Portfolio turnover rate | | | 6 | % | | | 45 | % | | | 21 | % | | | 21 | % | | | 31 | % |
Net assets, end of period (000s omitted) | | | $295,762 | | | | $325,973 | | | | $370,824 | | | | $351,080 | | | | $280,061 | |
| 1 | For the period from October 31, 2014 (commencement of class operations) to June 30, 2015 |
| 2 | Returns for periods of less than one year are not annualized. |
The accompanying notes are an integral part of these financial statements.
| | | | | | |
| Notes to financial statements (unaudited) | | Wells Fargo California Limited-Term Tax-Free Fund | | | 27 | |
1. ORGANIZATION
Wells Fargo Funds Trust (the “Trust”), a Delaware statutory trust organized on March 10, 1999, is an open-end management investment company registered under the Investment Company Act of 1940, as amended (the “1940 Act”). As an investment company, the Trust follows the accounting and reporting guidance in Financial Accounting Standards Board (“FASB”) Accounting Standards Codification Topic 946, Financial Services – Investment Companies. These financial statements report on the Wells Fargo California Limited-Term Tax-Free Fund (the “Fund”) which is a diversified series of the Trust.
2. SIGNIFICANT ACCOUNTING POLICIES
The following significant accounting policies, which are consistently followed in the preparation of the financial statements of the Fund, are in conformity with U.S. generally accepted accounting principles which require management to make estimates and assumptions that affect the reported amounts of assets and liabilities, disclosure of contingent assets and liabilities at the date of the financial statements, and the reported amounts of revenues and expenses during the reporting period. Actual results could differ from those estimates.
Securities valuation
All investments are valued each business day as of the close of regular trading on the New York Stock Exchange (generally 4 p.m. Eastern Time), although the Fund may deviate from this calculation time under unusual or unexpected circumstances.
Debt securities are valued at the evaluated bid price provided by an independent pricing service (e.g. taking into account various factors, including yields, maturities, or credit ratings) or, if a reliable price is not available, the quoted bid price from an independent broker-dealer.
Futures contracts that are listed on a foreign or domestic exchange or market are valued at the official closing price or, if none, the last sales price.
Investment in registered open-end investment are valued at net asset value.
Investments which are not valued using any of the methods discussed above are valued at their fair value, as determined in good faith by the Board of Trustees of the Fund. The Board of Trustees has established a Valuation Committee comprised of the Trustees and has delegated to it the authority to take any actions regarding the valuation of portfolio securities that the Valuation Committee deems necessary or appropriate, including determining the fair value of portfolio securities, unless the determination has been delegated to the Wells Fargo Asset Management Pricing Committee at Wells Fargo Funds Management, LLC (“Funds Management”). The Board of Trustees retains the authority to make or ratify any valuation decisions or approve any changes to the Valuation Procedures as it deems appropriate. On a quarterly basis, the Board of Trustees receives reports on any valuation actions taken by the Valuation Committee or the Wells Fargo Asset Management Pricing Committee which may include items for ratification.
When-issued transactions
The Fund may purchase securities on a forward commitment or when-issued basis. The Fund records a when-issued transaction on the trade date and will segregate assets in an amount at least equal in value to the Fund’s commitment to purchase when-issued securities. Securities purchased on a when-issued basis are marked-to-market daily and the Fund begins earning interest on the settlement date. Losses may arise due to changes in the market value of the underlying securities or if the counterparty does not perform under the contract.
Futures contracts
The Fund is subject to interest rate risk in the normal course of pursuing its investment objectives. Futures contracts are agreements between the Fund and a counterparty to buy or sell a specific amount of a commodity, financial instrument or currency at specified price and on a specified date. The Fund may buy and sell futures contracts in order to gain exposure to, or protect against, changes in interest rates. The primary risks associated with the use of futures contracts are the imperfect correlation between changes in market values of securities held by the Fund and the prices of futures contracts, and the possibility of an illiquid market. Futures contracts are generally entered into on a regulated futures exchange and cleared through a clearinghouse associated with the exchange. With futures contracts, there is minimal counterparty risk to the Fund since futures contracts are exchange traded and the exchange’s clearinghouse, as counterparty to all exchange traded futures, guarantees the futures contracts against default.
Upon entering into a futures contracts, the Fund is required to deposit either cash or securities (initial margin) with the broker in an amount equal to a certain percentage of the contract value. Subsequent payments (variation margin) are paid to or from the broker each day equal to the daily changes in the contract value. Such payments are recorded as unrealized gains or losses and, if any, shown as variation margin receivable (payable) in the Statement of Assets and Liabilities. Should the Fund fail to make requested variation margin payments, the broker can gain access to the initial margin to satisfy the Fund’s payment obligations. When the contracts are closed, a realized gain or loss is recorded in the Statement of Operations.
| | | | |
| 28 | | Wells Fargo California Limited-Term Tax-Free Fund | | Notes to financial statements (unaudited) |
Security transactions and income recognition
Securities transactions are recorded on a trade date basis. Realized gains or losses are recorded on the basis of identified cost.
Interest income is accrued daily and bond discounts are accreted and premiums are amortized daily. To the extent debt obligations are placed on non-accrual status, any related interest income may be reduced by writing off interest receivables when the collection of all or a portion of interest has been determined to be doubtful based on consistently applied procedures and the fair value has decreased. If the issuer subsequently resumes interest payments or when the collectability of interest is reasonably assured, the debt obligation is removed from non-accrual status.
Distributions to shareholders
Distributions to shareholders from net investment income are declared daily and paid monthly. Distributions from net realized gains, if any, are recorded on the ex-dividend date and paid at least annually. Such distributions are determined in accordance with income tax regulations and may differ from U.S. generally accepted accounting principles. Dividend sources are estimated at the time of declaration. The tax character of distributions is determined as of the Fund’s fiscal year end. Therefore, a portion of the Fund’s distributions made prior to the Fund’s fiscal year end may be categorized as a tax return of capital at year end.
Federal and other taxes
The Fund intends to continue to qualify as a regulated investment company by distributing substantially all of its investment company taxable and tax-exempt income and any net realized capital gains (after reduction for capital loss carryforwards) sufficient to relieve it from all, or substantially all, federal income taxes. Accordingly, no provision for federal income taxes was required.
The Fund’s income and federal excise tax returns and all financial records supporting those returns for the prior three fiscal years are subject to examination by the federal and Delaware revenue authorities. Management has analyzed the Fund’s tax positions taken on federal, state, and foreign tax returns for all open tax years and does not believe that there are any uncertain tax positions that require recognition of a tax liability.
As of December 31, 2018, the aggregate cost of all investments for federal income tax purposes was $521,094,736 and the unrealized gains (losses) consisted of:
| | | | |
| |
Gross unrealized gains | | $ | 8,779,613 | |
| |
Gross unrealized losses | | | (821,056 | ) |
| |
Net unrealized gains | | $ | 7,958,557 | |
Capital loss carryforwards that do not expire are required to be utilized prior to capital loss carryforwards that expire. As of June 30, 2018, capital loss carryforwards available to offset future net realized capital gains were as follows through the indicated expiration dates:
| | | | |
| | | No expiration |
| 2019 | | Short-term | | Long-term |
| | |
| $110,356 | | $3,281,449 | | $927,410 |
As of June 30, 2018, the Fund had current year net deferred post-October capital losses consisting of $2,990,327 in short-term losses and $190,637 in long-term which were recognized on the first day of the current fiscal year.
Class allocations
The separate classes of shares offered by the Fund differ principally in applicable sales charges, distribution, shareholder servicing, and administration fees. Class specific expenses are charged directly to that share class. Investment income, common expenses, and realized and unrealized gains (losses) on investments are allocated daily to each class of shares based on the relative proportion of net assets of each class.
3. FAIR VALUATION MEASUREMENTS
Fair value measurements of investments are determined within a framework that has established a fair value hierarchy based upon the various data inputs utilized in determining the value of the Fund’s investments. The three-level hierarchy gives the highest priority to unadjusted quoted prices in active markets for identical assets or liabilities (Level 1) and the lowest priority to unobservable inputs (Level 3). The Fund’s investments are classified within the fair value hierarchy based on the lowest level of input that is significant to the fair value measurement. The inputs are summarized into three broad levels as follows:
| | | | | | |
| Notes to financial statements (unaudited) | | Wells Fargo California Limited-Term Tax-Free Fund | | | 29 | |
| ∎ | | Level 1 – quoted prices in active markets for identical securities |
| ∎ | | Level 2 – other significant observable inputs (including quoted prices for similar securities, interest rates, prepayment speeds, credit risk, etc.) |
| ∎ | | Level 3 – significant unobservable inputs (including the Fund’s own assumptions in determining the fair value of investments) |
The inputs or methodologies used for valuing investments in securities are not necessarily an indication of the risk associated with investing in those securities.
The following is a summary of the inputs used in valuing the Fund’s assets and liabilities as of December 31, 2018:
| | | | | | | | | | | | | | | | |
| | | | |
| | | Quoted prices (Level 1) | | | Other significant observable inputs (Level 2) | | | Significant
unobservable inputs (Level 3) | | | Total | |
| | | | |
Assets | | | | | | | | | | | | | | | | |
Investments in: | | | | | | | | | | | | | | | | |
| | | | |
Municipal obligations | | $ | 0 | | | $ | 522,489,274 | | | $ | 0 | | | $ | 522,489,274 | |
| | | | |
Other | | | 0 | | | | 5,000,000 | | | | 0 | | | | 5,000,000 | |
| | | | |
Short-term investments | | | | | | | | | | | | | | | | |
| | | | |
Investment companies | | | 1,564,019 | | | | 0 | | | | 0 | | | | 1,564,019 | |
| | | | |
Total assets | | $ | 1,564,019 | | | $ | 527,489,274 | | | $ | 0 | | | $ | 529,053,293 | |
Additional sector, industry or geographic detail is included in the Portfolio of Investments.
At December 31, 2018, the Fund did not have any transfers into/out of Level 3.
4. TRANSACTIONS WITH AFFILIATES
Management fee
Funds Management, an indirect wholly owned subsidiary of (“Wells Fargo”), is the manager of the Fund and provides advisory and fund-level administrative services under an investment management agreement. Under the investment management agreement, Funds Management is responsible for, among other services, implementing the investment objectives and strategies of the Fund, supervising the subadviser and providing fund-level administrative services in connection with the Fund’s operations. As compensation for its services under the investment management agreement, Funds Management is entitled to receive an annual management fee starting at 0.40% and declining to 0.28% as the average daily net assets of the Fund increase. For the six months ended December 31, 2018, the management fee was equivalent to an annual rate of 0.40% of the Fund’s average daily net assets.
Funds Management has retained the services of a subadviser to provide daily portfolio management to the Fund. The fee for subadvisory services is borne by Funds Management. Wells Capital Management Incorporated, an affiliate of Funds Management and an indirect wholly owned subsidiary of Wells Fargo, is the subadviser to the Fund and is entitled to receive a fee from Funds Management at an annual rate starting at 0.15% and declining to 0.05% as the average daily net assets of the Fund increase.
Administration fees
Under a class-level administration agreement, Funds Management provides class-level administrative services to the Fund, which includes paying fees and expenses for services provided by the transfer agent, sub-transfer agents, omnibus account servicers and record-keepers. As compensation for its services under the class-level administration agreement, Funds Management receives an annual fee which is calculated based on the average daily net assets of each class as follows:
| | | | |
| | | Class-level
administration fee | |
| |
Class A, Class C | | | 0.16 | % |
| |
Administrator Class | | | 0.10 | |
| |
Institutional Class | | | 0.08 | |
| | | | |
| 30 | | Wells Fargo California Limited-Term Tax-Free Fund | | Notes to financial statements (unaudited) |
Funds Management has contractually waived and/or reimbursed management and administration fees to the extent necessary to maintain certain net operating expense ratios for the Fund. When each class of the Fund has exceeded its expense cap, Funds Management has waived fees and/or reimbursed expenses from fund level expenses on a proportionate basis and then from class specific expenses; otherwise, waivers and/or reimbursements are applied against class specific expenses before fund level expenses. Funds Management has committed through October 31, 2019 to waive fees and/or reimburse expenses to the extent necessary to cap the Fund’s expenses at 0.80% for Class A shares, 1.55% for Class C shares, 0.60% for Administrator Class shares, and 0.50% for Institutional Class shares. After this time, the cap may be increased or the commitment to maintain the cap may be terminated only with the approval of the Board of Trustees.
Distribution fee
The Trust has adopted a distribution plan for Class C shares of the Fund pursuant to Rule 12b-1 under the 1940 Act. A distribution fee is charged to Class C shares and paid to Wells Fargo Funds Distributor, LLC (“Funds Distributor”), the principal underwriter, at an annual rate of 0.75% of the average daily net assets of Class C shares.
In addition, Funds Distributor is entitled to receive the front-end sales charge from the purchase of Class A shares and a contingent deferred sales charge on the redemption of certain Class A shares. Funds Distributor is also entitled to receive the contingent deferred sales charges from redemptions of Class C shares. For the six months ended December 31, 2018, Funds Distributor received $69 from the sale of Class A shares. No contingent deferred sales charges were incurred by Class A and Class C shares for the six months ended December 31, 2018.
Shareholder servicing fees
The Trust has entered into contracts with one or more shareholder servicing agents, whereby Class A, Class C, and Administrator Class of the Fund are charged a fee at an annual rate of 0.25% of the average daily net assets of each respective class.
A portion of these total shareholder servicing fees were paid to affiliates of Wells Fargo.
Interfund transactions
The Fund may purchase or sell portfolio investment securities to certain other Wells Fargo affiliates pursuant to Rule 17a-7 under the 1940 Act and under procedures adopted by the Board of Trustees. The procedures have been designed to ensure that these interfund transactions, which do not incur broker commissions, are effected at current market prices. Pursuant to these procedures, the Fund had $41,546,984 and $84,780,000 in interfund purchases and sales, respectively, during the six months ended December 31. 2018.
5. INVESTMENT PORTFOLIO TRANSACTIONS
Purchases and sales of investments, excluding U.S. government obligations (if any) and short-term securities, for the six months ended December 31, 2018 were $94,031,882 and $33,212,164, respectively.
6. DERIVATIVE TRANSACTIONS
During the six months ended December 31, 2018, the Fund entered into futures contracts for to gain market exposure. The Fund had an average notional amount of $2,992,145 in short futures contracts during the six months ended December 31, 2018.
The fair value, realized gains or losses and change in unrealized gains or losses, if any, on derivative instruments are reflected in the corresponding financial statement captions.
7. BANK BORROWINGS
The Trust (excluding the money market funds), Wells Fargo Master Trust and Wells Fargo Variable Trust are parties to a $280,000,000 revolving credit agreement whereby the Fund is permitted to use bank borrowings for temporary or emergency purposes, such as to fund shareholder redemption requests. Interest under the credit agreement is charged to the Fund based on a borrowing rate equal to the higher of the Federal Funds rate in effect on that day plus 1.25% or the overnight LIBOR rate in effect on that day plus 1.25%. In addition, an annual commitment fee equal to 0.25% of the unused balance is allocated to each participating fund.
For the six months ended December 31, 2018, there were no borrowings by the Fund under the agreement.
| | | | | | |
| Notes to financial statements (unaudited) | | Wells Fargo California Limited-Term Tax-Free Fund | | | 31 | |
8. DISTRIBUTIONS TO SHAREHOLDERS
Effective for all filings after November 4, 2018, the Securities and Exchange Commission eliminated the requirement to separately state the components of distributions to shareholders under U.S. generally accepted accounting principles. The amounts of distributions to shareholders for the year ended June 30, 2018 were as follows:
| | | | |
| | | Net investment
income | |
| |
Class A | | | $2,407,589 | |
| |
Class C | | | 297,433 | |
| |
Administrator Class | | | 2,899,311 | |
| |
Institutional Class | | | 6,825,360 | |
9. CONCENTRATION RISK
The Fund invests a substantial portion of its assets in issuers of municipal debt securities located in a single state or territories of the U.S. Therefore, it may be more affected by economic and political developments in that state or region than would be a comparable general tax-exempt fund.
10. INDEMNIFICATION
Under the Trust’s organizational documents, the officers and Trustees have been granted certain indemnification rights against certain liabilities that may arise out of performance of their duties to the Trust. Additionally, in the normal course of business, the Trust may enter into contracts with service providers that contain a variety of indemnification clauses. The Trust’s maximum exposure under these arrangements is dependent on future claims that may be made against the Fund and, therefore, cannot be estimated.
11. NEW ACCOUNTING PRONOUNCEMENT
In August 2018, FASB issued Accounting Standards Update (“ASU”) No. 2018-13, Fair Value Measurement (Topic 820)Disclosure Framework – Changes to the Disclosure Requirements for Fair Value Measurement. ASU 2018-13 updates the disclosure requirements for fair value measurements by modifying or removing certain disclosures and adding certain new disclosures. The amendments are effective for fiscal years, and interim periods within those fiscal years, beginning after December 15, 2019. Early adoption is permitted. Management has adopted the removal and modification of disclosures early, as permitted, and will adopt the additional new disclosures at the effective date.
| | | | |
| 32 | | Wells Fargo California Limited-Term Tax-Free Fund | | Other information (unaudited) |
PROXY VOTING INFORMATION
A description of the policies and procedures used to determine how to vote proxies relating to portfolio securities is available, upon request, by calling1-800-222-8222, visiting our website at wellsfargofunds.com, or visiting the SEC website at sec.gov. Information regarding how the Fund voted proxies relating to portfolio securities during the most recent 12-month period ended June 30 is available on the Fund’s website atwellsfargofunds.comor by visiting the SEC website at sec.gov.
PORTFOLIO HOLDINGS INFORMATION
The complete portfolio holdings for the Fund are publicly available monthly on the Fund’s website (wellsfargofunds.com), on a one-month delayed basis. In addition, top ten holdings information (excluding derivative positions) for the Fund is publicly available on the Fund’s website on a monthly, seven-day or more delayed basis. The Fund files its complete schedule of portfolio holdings with the SEC for the first and third quarters of each fiscal year on Form N-Q, which is available by visiting the SEC website at sec.gov. In addition, the Fund’s Form N-Q may be reviewed and copied at the SEC’s Public Reference Room in Washington, DC, and at regional offices in New York City, at 233 Broadway, and in Chicago, at 175 West Jackson Boulevard, Suite 900. Information about the Public Reference Room may be obtained by calling 1-800-SEC-0330.
| | | | | | |
| Other information (unaudited) | | Wells Fargo California Limited-Term Tax-Free Fund | | | 33 | |
BOARD OF TRUSTEES AND OFFICERS
Each of the Trustees and Officers1 listed in the table below acts in identical capacities for each fund in the Wells Fargo family of funds, which consists of 152 mutual funds comprising the Wells Fargo Funds Trust, Wells Fargo Variable Trust, Wells Fargo Master Trust and four closed-end funds (collectively the “Fund Complex”). This table should be read in conjunction with the Prospectus and the Statement of Additional Information2. The mailing address of each Trustee and Officer is 525 Market Street, 12th Floor, San Francisco, CA 94105. Each Trustee and Officer serves an indefinite term, however, each Trustee serves such term until reaching the mandatory retirement age established by the Trustees.
Independent Trustees
| | | | | | |
Name and year of birth | | Position held and length of service* | | Principal occupations during past five years or longer | | Current other public company or
investment company
directorships |
| | | |
William R. Ebsworth (Born 1957) | | Trustee, since 2015 | | Retired. From 1984 to 2013, equities analyst, portfolio manager, research director and chief investment officer at Fidelity Management and Research Company in Boston, Tokyo, and Hong Kong, and retired in 2013 as Chief Investment Officer of Fidelity Strategic Advisers, Inc. where he led a team of investment professionals managing client assets. Prior thereto, Board member of Hong Kong Securities Clearing Co., Hong Kong Options Clearing Corp., the Thailand International Fund, Ltd., Fidelity Investments Life Insurance Company, and Empire Fidelity Investments Life Insurance Company. Board member of the Vincent Memorial Hospital Endowment (non-profit organization), where he serves on the Investment Committee and as a Chair of the Audit Committee. Mr. Ebsworth is a CFA® charterholder. | | N/A |
| | | |
Jane A. Freeman (Born 1953) | | Trustee, since 2015; Chair Liaison, since 2018 | | Retired. From 2012 to 2014 and 1999 to 2008, Chief Financial Officer of Scientific Learning Corporation. From 2008 to 2012, Ms. Freeman provided consulting services related to strategic business projects. Prior to 1999, Portfolio Manager at Rockefeller & Co. and Scudder, Stevens & Clark. Board member of the Harding Loevner Funds from 1996 to 2014, serving as both Lead Independent Director and chair of the Audit Committee. Board member of the Russell Exchange Traded Funds Trust from 2011 to 2012 and the chair of the Audit Committee. Ms. Freeman is a Board Member of The Ruth Bancroft Garden (non-profit organization). She is also an inactive Chartered Financial Analyst. | | N/A |
| | | |
Isaiah Harris, Jr.3 (Born 1952) | | Trustee, since 2009; Audit Committee Chairman, since 2019 | | Retired. Chairman of the Board of CIGNA Corporation since 2009, and Director since 2005. From 2003 to 2011, Director of Deluxe Corporation. Prior thereto, President and CEO of BellSouth Advertising and Publishing Corp. from 2005 to 2007, President and CEO of BellSouth Enterprises from 2004 to 2005 and President of BellSouth Consumer Services from 2000 to 2003. Emeritus member of the Iowa State University Foundation Board of Governors. Emeritus Member of the Advisory Board of Iowa State University School of Business. Advisory Board Member, Palm Harbor Academy (private school). Advisory Board Member, Child Evangelism Fellowship (non-profit). Mr. Harris is a certified public accountant (inactive status). | | CIGNA Corporation |
| | | |
Judith M. Johnson3 (Born 1949) | | Trustee, since 2008; Audit Committee Chairman, from 2009 to 2018 | | Retired. Prior thereto, Chief Executive Officer and Chief Investment Officer of Minneapolis Employees Retirement Fund from 1996 to 2008. Ms. Johnson is an attorney, certified public accountant and a certified managerial accountant. | | N/A |
| | | |
David F. Larcker (Born 1950) | | Trustee, since 2009 | | James Irvin Miller Professor of Accounting at the Graduate School of Business, Stanford University, Director of the Corporate Governance Research Initiative and Senior Faculty of The Rock Center for Corporate Governance since 2006. From 2005 to 2008, Professor of Accounting at the Graduate School of Business, Stanford University. Prior thereto, Ernst & Young Professor of Accounting at The Wharton School, University of Pennsylvania from 1985 to 2005. | | N/A |
| | | | |
| 34 | | Wells Fargo California Limited-Term Tax-Free Fund | | Other information (unaudited) |
| | | | | | |
Name and year of birth | | Position held and length of service* | | Principal occupations during past five years or longer | | Current other public company or
investment company
directorships |
| | | |
Olivia S. Mitchell (Born 1953) | | Trustee, since 2006; Nominating and Governance Committee Chairman, since 2018 | | International Foundation of Employee Benefit Plans Professor, Wharton School of the University of Pennsylvania since 1993. Director of Wharton’s Pension Research Council and Boettner Center on Pensions & Retirement Research, and Research Associate at the National Bureau of Economic Research. Previously, Cornell University Professor from 1978 to 1993. | | N/A |
| | | |
Timothy J. Penny (Born 1951) | | Trustee, since 1996; Chairman, since 2018; Vice Chairman, from 2017 to 2018 | | President and Chief Executive Officer of Southern Minnesota Initiative Foundation, a non-profit organization, since 2007. Member of the Board of Trustees of NorthStar Education Finance, Inc., a non-profit organization, since 2007. | | N/A |
| | | |
James G. Polisson (Born 1959) | | Trustee, since 2018; Advisory Board Member, from 2017 to 2018 | | Retired. Chief Marketing Officer, Source (ETF) UK Services, Ltd, from 2015 to 2017. From 2012 to 2015, Principal of The Polisson Group, LLC, a management consulting, corporate advisory and principal investing company. Chief Executive Officer and Managing Director at Russell Investments, Global Exchange Traded Funds from 2010 to 2012. Managing Director of Barclays Global Investors from 1998 to 2010 and Global Chief Marketing Officer for iShares and Barclays Global Investors from 2000 to 2010. Trustee of the San Francisco Mechanics’ Institute, a non-profit organization, from 2013 to 2015. Board member of the Russell Exchange Traded Fund Trust from 2011 to 2012. Director of Barclays Global Investors Holdings Deutschland GmbH from 2006 to 2009. Mr. Polisson is an attorney and has a retired status with the Massachusetts and District of Columbia Bar Associations. | | N/A |
| | | |
Michael S. Scofield4 (Born 1943) | | Trustee, since 2010 | | Served on the Investment Company Institute’s Board of Governors and Executive Committee from 2008-2011 as well the Governing Council of the Independent Directors Council from 2006-2011 and the Independent Directors Council Executive Committee from 2008-2011. Trustee of the Evergreen Fund complex (and its predecessors) from 1984 to 2010. Chairman of the Evergreen Funds from 2000-2010. Former Trustee of the Mentor Funds. Retired Attorney, Law Offices of Michael S. Scofield. | | N/A |
| | | |
Pamela Wheelock (Born 1959) | | Trustee, since 2018; Advisory Board Member, from 2017 to 2018 | | Chief Operating Officer, Twin Cities Habitat for Humanity, since January, 2017. Vice President of University Services, University of Minnesota from 2012 to 2017. Prior thereto, on the Board of Directors, Governance Committee and Finance Committee for the Minnesota Philanthropy Partners (Saint Paul Foundation) from 2012 to 2018, Interim President and Chief Executive Officer of Blue Cross Blue Shield of Minnesota from 2010 to 2011, Chairman of the Board from 2009 to 2011 and Board Director from 2003 to 2015. Vice President, Leadership and Community Engagement, Bush Foundation, Saint Paul, Minnesota (a private foundation) from 2009 to 2011. Executive Vice President and Chief Financial Officer, Minnesota Sports and Entertainment from 2004 to 2009 and Senior Vice President from 2002 to 2004. Commissioner of Finance, State of Minnesota, from 1999 to 2002. Currently the Board Chair of the Minnesota Wild Foundation since 2010. | | N/A |
| * | Length of service dates reflect the Trustee’s commencement of service with the Trust’s predecessor entities, where applicable. |
| | | | | | |
| Other information (unaudited) | | Wells Fargo California Limited-Term Tax-Free Fund | | | 35 | |
Officers
| | | | | | |
Name and year of birth | | Position held and length of service | | Principal occupations during past five years or longer | | |
| | | |
Andrew Owen (Born 1960) | | President, since 2017 | | Executive Vice President of Wells Fargo & Company and Head of Affiliated Managers, Wells Fargo Asset Management, since 2014. In addition, Mr. Owen is currently President, Chief Executive Officer and Director of Wells Fargo Funds Management, LLC since 2017. Prior thereto, Executive Vice President responsible for marketing, investments and product development for Wells Fargo Funds Management, LLC, from 2009 to 2014. | | |
| | | |
Nancy Wiser1 (Born 1967) | | Treasurer, since 2012 | | Executive Vice President of Wells Fargo Funds Management, LLC since 2011. Chief Operating Officer and Chief Compliance Officer at LightBox Capital Management LLC, from 2008 to 2011. | | |
| | | |
Alexander Kymn (Born 1973) | | Secretary, since 2018; Chief Legal Officer, since 2018 | | Senior Company Counsel of Wells Fargo Bank, N.A. since 2018 (previously Senior Counsel from 2007 to 2018). Vice President of Wells Fargo Funds Management, LLC from 2008 to 2014. | | |
| | | |
Michael H. Whitaker (Born 1967) | | Chief Compliance Officer, since 2016 | | Senior Vice President and Chief Compliance Officer since 2016. Senior Vice President and Chief Compliance Officer for Fidelity Investments from 2007 to 2016. | | |
| | | |
David Berardi (Born 1975) | | Assistant Treasurer, since 2009 | | Vice President of Wells Fargo Funds Management, LLC since 2009. Vice President of Evergreen Investment Management Company, LLC from 2008 to 2010. Manager of Fund Reporting and Control for Evergreen Investment Management Company, LLC from 2004 to 2010. | | |
| | | |
Jeremy DePalma1 (Born 1974) | | Assistant Treasurer, since 2009 | | Senior Vice President of Wells Fargo Funds Management, LLC since 2009. Senior Vice President of Evergreen Investment Management Company, LLC from 2008 to 2010 and head of the Fund Reporting and Control Team within Fund Administration from 2005 to 2010. | | |
| 1 | Nancy Wiser acts as Treasurer of 76 funds in the Fund Complex. Jeremy DePalma acts as Treasurer of 76 funds and Assistant Treasurer of 76 funds in the Fund Complex. |
| 2 | The Statement of Additional Information includes additional information about the Trustees and is available, without charge, upon request, by calling1-800-222-8222 or by visiting the website atwellsfargofunds.com. |
| 3 | Mr. Harris replaced Ms. Johnson as the Chairman of the Audit Committee effective January 1, 2019. |
| 4 | Mr. Scofield retired on December 31, 2018. |
| | | | |
| 36 | | Wells Fargo California Limited-Term Tax-Free Fund | | Appendix A (unaudited) |
SALES CHARGE REDUCTIONS AND WAIVERS FOR CERTAIN INTERMEDIARIES
Raymond James & Associates, Inc., Raymond James Financial Services & Raymond James affiliates (“Raymond James”)
Effective on or about March 1, 2019, shareholders purchasing Fund shares through a Raymond James platform or account will be eligible only for the following load waivers (front-end sales charge waivers and contingent deferred, or back-end, sales charge waivers) and discounts, which may differ from those disclosed elsewhere in the Fund’s Prospectus or SAI.
Front-end Sales Load Waivers on Class A shares Available at Raymond James
| | • | | Shares purchased in an investment advisory program. |
| | • | | Shares purchased through reinvestment of capital gains distributions and dividend reinvestment when purchasing shares of the same fund (but not any other fund within the fund family). |
| | • | | Employees and registered representatives of Raymond James or its affiliates and their family members as designated by Raymond James. |
| | • | | Shares purchased from the proceeds of redemptions within the same fund family, provided (1) the repurchase occurs within 90 days following the redemption, (2) the redemption and purchase occur in the same account, and (3) redeemed shares were subject to a front-end or deferred sales load (known as Rights of Reinstatement). |
| | • | | A shareholder in the fund’s Class C shares will have their shares automatically exchanged at net asset value to Class A shares (or the appropriate share class) of the fund if the shares are no longer subject to a CDSC and the exchange is in line with the policies and procedures of Raymond James. |
CDSC Waivers on Class A and C Shares Available at Raymond James
| | • | | Death or disability of the shareholder. |
| | • | | Shares sold as part of a systematic withdrawal plan as described in the Fund’s Prospectus. |
| | • | | Return of excess contributions from an IRA Account. |
| | • | | Shares sold as part of a required minimum distribution for IRA and retirement accounts due to the shareholder reaching age 70½ as described in the Fund’s prospectus. |
| | • | | Shares sold to pay Raymond James fees but only if the transaction is initiated by Raymond James. |
| | • | | Shares acquired through a right of reinstatement. |
Front-end Load Discounts Available at Raymond James: Breakpoints, and/or Rights of Accumulation
| | • | | Breakpoints as described in the Fund’s Prospectus. |
| | • | | Rights of accumulation which entitle shareholders to breakpoint discounts will be automatically calculated based on the aggregated holding of fund family assets held by accounts within the purchaser’s household at Raymond James. Eligible fund family assets not held at Raymond James may be included in the rights of accumulation calculation only if the shareholder notifies his or her financial advisor about such assets. |

For more information
More information about Wells Fargo Funds is available free upon request. To obtain literature, please write, visit the Fund’s website, or call:
Wells Fargo Funds
P.O. Box 219967
Kansas City, MO 64121-9967
Website: wellsfargofunds.com
Individual investors: 1-800-222-8222
Retail investment professionals: 1-888-877-9275
Institutional investment professionals:1-866-765-0778
This report and the financial statements contained herein are submitted for the general information of the shareholders of the Fund. If this report is used for promotional purposes, distribution of the report must be accompanied or preceded by a current prospectus. Before investing, please consider the investment objectives, risks, charges, and expenses of the investment. For a current prospectus and, if available, a summary prospectus, containing this information, call1-800-222-8222 or visit the Fund’s website atwellsfargofunds.com. Read the prospectus carefully before you invest or send money.
Wells Fargo Asset Management (WFAM) is the trade name for certain investment advisory/management firms owned by Wells Fargo & Company. These firms include but are not limited to Wells Capital Management Incorporated and Wells Fargo Funds Management, LLC. Certain products managed by WFAM entities are distributed by Wells Fargo Funds Distributor, LLC (a broker/dealer and Member FINRA).
This material is for general informational and educational purposes only and is NOT intended to provide investment advice or a recommendation of any kind—including a recommendation for any specific investment, strategy, or plan.
INVESTMENT PRODUCTS: NOT FDIC INSURED ◾ NO BANK GUARANTEE ◾ MAY LOSE VALUE
© 2019 Wells Fargo Funds Management, LLC. All rights reserved.
| | |
 | | 320442 02-19 SA248/SAR248 12-18 |
Semi-Annual Report
December 31, 2018

Wells Fargo California Tax-Free Fund

Beginning on January 1, 2021, as permitted by new regulations adopted by the Securities and Exchange Commission, paper copies of the Wells Fargo Funds’ annual and semi-annual shareholder reports issued after this date will no longer be sent by mail, unless you specifically request paper copies of the reports. Instead, the reports will be made available on the Funds’ website, and you will be notified by mail each time a report is posted and provided with a website address to access the report.
If you already elected to receive shareholder reports electronically, you will not be affected by this change and you need not take any action. You may elect to receive shareholder reports and other communications from the Fund electronically at any time by contacting your financial intermediary (such as a broker-dealer or bank) or, if you are a direct investor, by calling 1-800-222-8222 or by enrolling at wellsfargo.com/advantagedelivery.
You may elect to receive all future reports in paper free of charge. If you invest through a financial intermediary, you can contact your financial intermediary to request that you continue to receive paper copies of your shareholder reports; if you invest directly with the Fund, you can call 1-800-222-8222. Your election to receive reports in paper will apply to all Wells Fargo Funds held in your account with your financial intermediary or, if you are a direct investor, to all Wells Fargo Funds that you hold.

Reduce clutter. Save trees.
Sign up for electronic delivery of prospectuses and shareholder reports atwellsfargo.com/advantagedelivery
Contents
The views expressed and any forward-looking statements are as of December 31, 2018, unless otherwise noted, and are those of the Fund managers and/or Wells Fargo Funds Management, LLC. Discussions of individual securities, or the markets generally, or any Wells Fargo Fund are not intended as individual recommendations. Future events or results may vary significantly from those expressed in any forward-looking statements. The views expressed are subject to change at any time in response to changing circumstances in the market. Wells Fargo Funds Management, LLC and the Fund disclaim any obligation to publicly update or revise any views expressed or forward-looking statements.
INVESTMENT PRODUCTS: NOT FDIC INSURED ◾ NO BANK GUARANTEE ◾ MAY LOSE VALUE
| | | | |
| 2 | | Wells Fargo California Tax-Free Fund | | Letter to shareholders (unaudited) |

Andrew Owen
President
Wells Fargo Funds
Global trade tensions escalated during the third quarter of 2018.
Dear Shareholder:
We are pleased to offer you this semi-annual report for the Wells Fargo CaliforniaTax-Free Fund for thesix-month period that ended December 31, 2018. During the reporting period, the U.S. generated encouraging economic and business data that was offset by less positive and more inconsistent data from international markets. Investment returns were generally negative as geopolitical tensions and uncertainty tended to distract investors from more favorable underlying trends.
For the period, U.S. stocks, as measured by the S&P 500 Index,1 fell 6.85% and international stocks, as measured by the MSCI ACWI ex USA Index (Net),2 declined 10.84%. Based on the MSCI EM Index (Net),3 emerging market stocks lost 8.48%. For bond investors, the Bloomberg Barclays U.S. Aggregate Bond Index4 gained 1.65% while the Bloomberg Barclays Global Aggregateex-USD Index5 fell 0.84%. The Bloomberg Barclays Municipal Bond Index6 gained 1.53% while the ICE BofAML U.S. High Yield Index7 declined 2.34%.
Global trade tensions prompted investor concerns.
Global trade tensions escalated during the third quarter of 2018. The U.S. imposed tariffs on a wide range of products manufactured overseas. Foreign governments retaliated with tariffs that punished U.S. commodity producers and product manufacturers. Investors wondered about next steps as divergence in global economic policies and growth prospects widened.
During the summer months, the U.S. economy strengthened. Revised second-quarter gross domestic product (GDP) growth data released in August showed the U.S. economy growing at a 4.2% rate. The unemployment rate in the U.S. was 3.7% by the end of September, according to the U.S. Department of Labor. Wages showed more consistent growth, and consumer confidence remained strong. Several U.S. equity market indices reached records during August, with the S&P 500 Index gaining 7.71% for the three-month period that ended September 30, 2018. In contrast, the MSCI ACWI ex USA Index (Net) gained 0.71% while the MSCI EM Index (Net) declined 1.09% during the same three-month period.
| 1 | The S&P 500 Index consists of 500 stocks chosen for market size, liquidity, and industry group representation. It is a market-value-weighted index with each stock’s weight in the index proportionate to its market value. You cannot invest directly in an index. |
| 2 | The Morgan Stanley Capital International (MSCI) All Country World Index (ACWI) ex USA Index (Net) is a free-float-adjusted market-capitalization-weighted index that is designed to measure the equity market performance of developed markets, excluding the United States and Canada. Source: MSCI. MSCI makes no express or implied warranties or representations and shall have no liability whatsoever with respect to any MSCI data contained herein. The MSCI data may not be further redistributed or used as a basis for other indices or any securities or financial products. This report is not approved, reviewed, or produced by MSCI. You cannot invest directly in an index. |
| 3 | The MSCI Emerging Markets (EM) Index (Net) is a free-float-adjusted market-capitalization-weighted index that is designed to measure large- andmid-cap equity market performance of emerging markets. The MSCI EM Index (Net) consists of the following 24 emerging market country indices: Brazil, Chile, China, Colombia, Czech Republic, Egypt, Greece, Hungary, India, Indonesia, Korea, Malaysia, Mexico, Pakistan, Peru, the Philippines, Poland, Qatar, Russia, South Africa, Taiwan, Thailand, Turkey, and the United Arab Emirates. You cannot invest directly in an index. |
| 4 | The Bloomberg Barclays U.S. Aggregate Bond Index is a broad-based benchmark that measures the investment-grade, U.S. dollar-denominated, fixed-rate taxable bond market, including Treasuries, government-related and corporate securities, mortgage-backed securities (agency fixed-rate and hybrid adjustable-rate mortgage pass-throughs), asset-backed securities, and commercial mortgage-backed securities. You cannot invest directly in an index. |
| 5 | The Bloomberg Barclays Global Aggregateex-USD Index is an unmanaged index that provides a broad-based measure of the global investment-grade fixed-income markets excluding the U.S. dollar-denominated debt market. You cannot invest directly in an index. |
| 6 | The Bloomberg Barclays Municipal Bond Index is an unmanaged index composed of long-termtax-exempt bonds with a minimum credit rating of Baa. You cannot invest directly in an index. |
| 7 | The ICE BofAML U.S. High Yield Index is a market-capitalization-weighted index of domestic and Yankee high-yield bonds. The index tracks the performance of high-yield securities traded in the U.S. bond market. You cannot invest directly in an index. Copyright 2018. ICE Data Indices, LLC. All rights reserved. |
| | | | | | |
| Letter to shareholders (unaudited) | | Wells Fargo California Tax-Free Fund | | | 3 | |
Economic signals overseas were mixed as the third quarter ended and the fourth quarter began. In particular, signs of slowing economic growth in China created uncertainty for investors. Amid rising trade tensions, the People’s Bank of China cut reserve requirement ratios and accelerated infrastructure spending and tax cuts for business enterprises and individuals. Nevertheless, a strengthening U.S. dollar and trade tensions remained headwinds for investors overseas.
Equity markets were volatile during the fourth quarter.
Negative stock market performance during October and December bracketed a mildly positive November, as measured by the S&P 500 Index and the MSCI ACWI ex USA Index (Net). As interest rates and bond yields gained during October, stock markets struggled. Readings on consumer sentiment and business spending were mixed. Markets rebounded in November. The U.S. and China agreed to halt further increases in tariffs and engage in additional negotiations. While November returns were positive, the loss for the full fourth quarter was substantial for equity investors globally, with the S&P down 13.52% and the MSCI ACWI ex USA Index (Net) down 11.46%. December’s S&P 500 Index performance was the lowest since 1931. Globally, fixed income investments fared better than stocks during the last two months of the year as conflicting signals unsettled investors’ outlooks.
Equity investors confronted a number of changing conditions. In November’s mid-term elections, control of the U.S. House of Representatives shifted from Republicans to Democrats, presaging potential partisan disputes. Progress on Brexit negotiations stalled in the UK. In China, the value of the yuan declined to low levels last seen in 2008. Oil prices continued to fall. The Fed increased the federal funds rate by 25 bps to a target range of between 2.25% and 2.50% in December 2018. A late-December dispute over spending and immigration policy resulted in a partial U.S. government shutdown that continued through the end of the period.
Don’t let short-term uncertainty derail long-term investment goals.
Periods of investment uncertainty can present challenges, but experience has taught us that maintaining long-term investment goals can be an effective way to plan for the future. To help you create a sound strategy based on your personal goals and risk tolerance, Wells Fargo Funds offers more than 100 mutual funds spanning a wide range of asset classes and investment styles. Although diversification cannot guarantee an investment profit or prevent losses, we believe it can be an effective way to manage investment risk and potentially smooth out overall portfolio performance. We encourage investors to know their investments and to understand that appropriate levels of risk-taking may unlock opportunities.
Thank you for choosing to invest with Wells Fargo Funds. We appreciate your confidence in us and remain committed to helping you meet your financial needs.
Sincerely,

Andrew Owen
President
Wells Fargo Funds
Economic signals overseas were mixed as the third quarter ended and the fourth quarter began.
For further information about your Fund, contact your investment professional, visit our website atwellsfargofunds.com, or call us directly at1-800-222-8222.
| | | | |
| 4 | | Wells Fargo California Tax-Free Fund | | Performance highlights (unaudited) |
Investment objective
The Fund seeks current income exempt from federal income tax and California individual income tax.
Manager
Wells Fargo Funds Management, LLC
Subadviser
Wells Capital Management Incorporated
Portfolio managers
Terry J. Goode
Robert J. Miller
Adrian Van Poppel
Average annual total returns (%) as of December 31, 2018
| | | | | | | | | | | | | | | | | | | | | | | | | | | | | | | | | | |
| | | | | Including sales charge | | | Excluding sales charge | | | Expense ratios1 (%) | |
| | | Inception date | | 1 year | | | 5 year | | | 10 year | | | 1 year | | | 5 year | | | 10 year | | | Gross | | | Net2 | |
| | | | | | | | | |
| Class A (SCTAX) | | 10-6-1988 | | | -3.99 | | | | 3.05 | | | | 5.13 | | | | 0.54 | | | | 4.00 | | | | 5.61 | | | | 0.83 | | | | 0.75 | |
| | | | | | | | | |
| Class C (SCTCX) | | 7-1-1993 | | | -1.24 | | | | 3.22 | | | | 4.83 | | | | -0.24 | | | | 3.22 | | | | 4.83 | | | | 1.58 | | | | 1.50 | |
| | | | | | | | | |
| Administrator Class (SGCAX) | | 12-15-1997 | | | – | | | | – | | | | – | | | | 0.75 | | | | 4.18 | | | | 5.83 | | | | 0.77 | | | | 0.55 | |
| | | | | | | | | |
| Institutional Class (SGTIX)3 | | 10-31-2014 | | | – | | | | – | | | | – | | | | 0.91 | | | | 4.26 | | | | 5.87 | | | | 0.50 | | | | 0.48 | |
| | | | | | | | | |
| Bloomberg Barclays Municipal Bond Index4 | | – | | | – | | | | – | | | | – | | | | 1.28 | | | | 3.82 | | | | 4.85 | | | | – | | | | – | |
| | | | | | | | | |
| Bloomberg Barclays Municipal Bond: California Index5 | | – | | | – | | | | – | | | | – | | | | 1.11 | | | | 3.95 | | | | 5.28 | | | | – | | | | – | |
Figures quoted represent past performance, which is no guarantee of future results, and do not reflect taxes that a shareholder may pay on fund distributions or the redemption of fund shares. Investment return and principal value of an investment will fluctuate so that an investor’s shares, when redeemed, may be worth more or less than their original cost. Performance shown without sales charges would be lower if sales charges were reflected. Current performance may be lower or higher than the performance data quoted, which assumes the reinvestment of dividends and capital gains. Currentmonth-end performance is available on the Fund’s website,wellsfargofunds.com.
Index returns do not include transaction costs associated with buying and selling securities, any mutual fund fees or expenses, or any taxes. It is not possible to invest directly in an index.
For Class A shares, the maximumfront-end sales charge is 4.50%. For Class C shares, the maximum contingent deferred sales charge is 1.00%. Performance including a contingent deferred sales charge assumes the sales charge for the corresponding time period. Administrator Class and Institutional Class shares are sold without afront-end sales charge or contingent deferred sales charge.
Bond values fluctuate in response to the financial condition of individual issuers, general market and economic conditions, and changes in interest rates. Changes in market conditions and government policies may lead to periods of heightened volatility in the bond market and reduced liquidity for certain bonds held by the Fund. In general, when interest rates rise, bond values fall and investors may lose principal value. Interest-rate changes and their impact on the Fund and its share price can be sudden and unpredictable. The use of derivatives may reduce returns and/or increase volatility. Certain investment strategies tend to increase the total risk of an investment (relative to the broader market). The Fund is exposed to California municipal securities risk, high-yield securities risk, andnon-diversification risk. Consult the Fund’s prospectus for additional information on these and other risks. A portion of the Fund’s income may be subject to federal, state, and/or local income taxes or the Alternative Minimum Tax (AMT). Any capital gains distributions may be taxable.
Please see footnotes on page 5.
| | | | | | |
| Performance highlights (unaudited) | | Wells Fargo California Tax-Free Fund | | | 5 | |
|
| Effective maturity distribution as of December 31, 20186 |
|
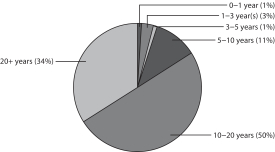 |
|
| Credit quality as of December 31, 20187 |
|
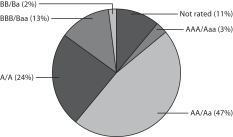
|
| 1 | Reflects the expense ratios as stated in the most recent prospectuses. The expense ratios shown are subject to change and may differ from the annualized expense ratios shown in the financial highlights of this report. |
| 2 | The manager has contractually committed through October 31, 2019, to waive fees and/or reimburse expenses to the extent necessary to cap the Fund’s Total Annual Fund Operating Expenses After Fee Waivers at the amounts shown. After this time, the cap may be increased or the commitment to maintain the cap may be terminated only with the approval of the Board of Trustees. Brokerage commissions, stamp duty fees, interest, taxes, acquired fund fees and expenses (if any), and extraordinary expenses are excluded from the expense cap. Without this cap, the Fund’s returns would have been lower. The expense ratio paid by an investor is the net expense ratio (the total annual fund operating expenses after fee waivers) as stated in the prospectuses. |
| 3 | Historical performance shown for the Institutional Class shares prior to their inception reflects the performance of the Administrator Class shares and includes the higher expenses applicable to Administrator Class shares. If these expenses had not been included, returns for Institutional Class shares would be higher. |
| 4 | The Bloomberg Barclays Municipal Bond Index is an unmanaged index composed of long-termtax-exempt bonds with a minimum credit rating of Baa. You cannot invest directly in an index. |
| 5 | The Bloomberg Barclays Municipal Bond: California Index is the California component of the Bloomberg Barclays Municipal Bond Index. You cannot invest directly in an index. |
| 6 | Amounts are calculated based on the total long-term investments of the Fund. These amounts are subject to change and may have changed since the date specified. |
| 7 | The credit quality distribution of portfolio holdings reflected in the chart is based on ratings from Standard & Poor’s, Moody’s Investors Service, and/or Fitch Ratings Ltd. Credit quality ratings apply to the underlying holdings of the Fund and not to the Fund itself. The percentages of the Fund’s portfolio with the ratings depicted in the chart are calculated based on the total market value of fixed income securities held by the Fund. If a security was rated by all three rating agencies, the middle rating was utilized. If rated by two of three rating agencies, the lower rating was utilized, and if rated by one of the rating agencies, that rating was utilized. Standard & Poor’s rates the creditworthiness of bonds, ranging from AAA (highest) to D (lowest). Ratings from A to CCC may be modified by the addition of a plus (+) or minus (-) sign to show relative standing within the rating categories. Standard & Poor’s rates the creditworthiness of short-term notes fromSP-1 (highest) toSP-3 (lowest). Moody’s rates the creditworthiness of bonds, ranging from Aaa (highest) to C (lowest). Ratings Aa to B may be modified by the addition of a number 1 (highest) to 3 (lowest) to show relative standing within the ratings categories. Moody’s rates the creditworthiness of short-term U.S.tax-exempt municipal securities from MIG 1/VMIG 1 (highest) to SG (lowest). Fitch rates the creditworthiness of bonds, ranging from AAA (highest) to D (lowest). Credit quality distribution is subject to change and may have changed since the date specified. |
| | | | |
| 6 | | Wells Fargo California Tax-Free Fund | | Fund expenses (unaudited) |
As a shareholder of the Fund, you incur two types of costs: (1) transaction costs, including sales charges (loads) on purchase payments and contingent deferred sales charges (if any) on redemptions and (2) ongoing costs, including management fees, distribution(12b-1) and/or shareholder servicing fees, and other Fund expenses. This example is intended to help you understand your ongoing costs (in dollars) of investing in the Fund and to compare these costs with the ongoing costs of investing in other mutual funds.
The example is based on an investment of $1,000 invested at the beginning of thesix-month period and held for the entire period from July 1, 2018 to December 31, 2018.
Actual expenses
The “Actual” line of the table below provides information about actual account values and actual expenses. You may use the information in this line, together with the amount you invested, to estimate the expenses that you paid over the period. Simply divide your account value by $1,000 (for example, an $8,600 account value divided by $1,000 = 8.6), then multiply the result by the number in the “Actual” line under the heading entitled “Expenses paid during period” for your applicable class of shares to estimate the expenses you paid on your account during this period.
Hypothetical example for comparison purposes
The “Hypothetical” line of the table below provides information about hypothetical account values and hypothetical expenses based on the Fund’s actual expense ratio and an assumed rate of return of 5% per year before expenses, which is not the Fund’s actual return. The hypothetical account values and expenses may not be used to estimate the actual ending account balance or expenses you paid for the period. You may use this information to compare the ongoing costs of investing in the Fund and other funds. To do so, compare this 5% hypothetical example with the 5% hypothetical examples that appear in the shareholder reports of the other funds.
Please note that the expenses shown in the table are meant to highlight your ongoing costs only and do not reflect any transactional costs, such as sales charges (loads) and contingent deferred sales charges. Therefore, the “Hypothetical” line of the table is useful in comparing ongoing costs only and will not help you determine the relative total costs of owning different funds. In addition, if these transactional costs were included, your costs would have been higher.
| | | | | | | | | | | | | | | | |
| | | Beginning
account value
7-1-2018 | | | Ending
account value
12-31-2018 | | | Expenses
paid during
the period¹ | | | Annualized net
expense ratio | |
Class A | | | | | | | | | | | | | | | | |
| | | | |
Actual | | $ | 1,000.00 | | | $ | 1,008.60 | | | $ | 3.80 | | | | 0.75 | % |
| | | | |
Hypothetical (5% return before expenses) | | $ | 1,000.00 | | | $ | 1,021.42 | | | $ | 3.82 | | | | 0.75 | % |
Class C | | | | | | | | | | | | | | | | |
| | | | |
Actual | | $ | 1,000.00 | | | $ | 1,004.95 | | | $ | 7.58 | | | | 1.50 | % |
| | | | |
Hypothetical (5% return before expenses) | | $ | 1,000.00 | | | $ | 1,017.64 | | | $ | 7.63 | | | | 1.50 | % |
Administrator Class | | | | | | | | | | | | | | | | |
| | | | |
Actual | | $ | 1,000.00 | | | $ | 1,009.63 | | | $ | 2.79 | | | | 0.55 | % |
| | | | |
Hypothetical (5% return before expenses) | | $ | 1,000.00 | | | $ | 1,022.43 | | | $ | 2.80 | | | | 0.55 | % |
Institutional Class | | | | | | | | | | | | | | | | |
| | | | |
Actual | | $ | 1,000.00 | | | $ | 1,010.85 | | | $ | 2.43 | | | | 0.48 | % |
| | | | |
Hypothetical (5% return before expenses) | | $ | 1,000.00 | | | $ | 1,022.79 | | | $ | 2.45 | | | | 0.48 | % |
| 1 | Expenses paid is equal to the annualized net expense ratio of each class multiplied by the average account value over the period, multiplied by the number of days in the most recent fiscal half-year divided by the number of days in the fiscal year (to reflect theone-half-year period). |
| | | | | | |
| Portfolio of investments—December 31, 2018 (unaudited) | | Wells Fargo California Tax-Free Fund | | | 7 | |
| | | | | | | | | | | | | | | | |
| Security name | | Interest rate | | | Maturity date | | | Principal | | | Value | |
| | | | |
Municipal Obligations: 98.05% | | | | | | | | | | | | | | | | |
| | | | |
California: 95.28% | | | | | | | | | | | | | | | | |
| | | | |
| Airport Revenue: 3.47% | | | | | | | | | | | | | | | | |
| | | | |
California Municipal Finance Authority AMT Senior Lien Linxs Apartment Project Series A | | | 5.00 | % | | | 12-31-2043 | | | $ | 5,730,000 | | | $ | 6,240,256 | |
| | | | |
Palm Springs CA Palm Springs International Airport | | | 6.40 | | | | 7-1-2023 | | | | 500,000 | | | | 500,450 | |
| | | | |
Sacramento County CA Airport System Refunding Bond AMT Senior Series C | | | 5.00 | | | | 7-1-2037 | | | | 7,300,000 | | | | 8,279,003 | |
| | | | |
Sacramento County CA Airport System Refunding Bond AMT Senior Series C | | | 5.00 | | | | 7-1-2038 | | | | 3,000,000 | | | | 3,389,310 | |
| | | | |
San Francisco CA City & County International Airport AMT Series A | | | 5.00 | | | | 5-1-2047 | | | | 7,715,000 | | | | 8,532,636 | |
| | | | |
San Jose CA Airport AMT Refunding Bond Series A | | | 5.00 | | | | 3-1-2047 | | | | 4,000,000 | | | | 4,431,560 | |
| | | | |
San Jose CA Airport Refunding Bond Series B | | | 5.00 | | | | 3-1-2042 | | | | 1,750,000 | | | | 1,977,290 | |
| | | | |
| | | | | | | | | | | | | | | 33,350,505 | |
| | | | | | | | | | | | | | | | |
| | | | |
| Education Revenue: 5.25% | | | | | | | | | | | | | | | | |
| | | | |
California Educational Facilities Authority Loma Linda University Series A | | | 5.00 | | | | 4-1-2042 | | | | 2,645,000 | | | | 2,954,968 | |
| | | | |
California Municipal Finance Authority California Baptist University Series A 144A | | | 4.00 | | | | 11-1-2021 | | | | 595,000 | | | | 608,132 | |
| | | | |
California Municipal Finance Authority California Baptist University Series A 144A | | | 5.00 | | | | 11-1-2025 | | | | 1,025,000 | | | | 1,106,375 | |
| | | | |
California Municipal Finance Authority Charter School Albert Einstein Academies Project Series A | | | 6.75 | | | | 8-1-2033 | | | | 1,525,000 | | | | 1,673,382 | |
| | | | |
California Municipal Finance Authority Charter School Albert Einstein Academies Project Series A | | | 7.13 | | | | 8-1-2043 | | | | 1,000,000 | | | | 1,098,360 | |
| | | | |
California Municipal Finance Authority Charter School Palmdale Aerospace Academy Project 144A | | | 5.00 | | | | 7-1-2041 | | | | 1,250,000 | | | | 1,281,387 | |
| | | | |
California Municipal Finance Authority Charter School Revenue Palmdale Aerospace Academy Series A 144A | | | 5.00 | | | | 7-1-2049 | | | | 1,800,000 | | | | 1,843,686 | |
| | | | |
California Municipal Finance Authority Refunding Bond Biola University Incorporated | | | 5.00 | | | | 10-1-2035 | | | | 600,000 | | | | 678,846 | |
| | | | |
California School Finance Authority Bright Star Schools Obligation Group 144A | | | 5.00 | | | | 6-1-2047 | | | | 1,000,000 | | | | 1,010,220 | |
| | | | |
California School Finance Authority Bright Star Schools Obligation Group 144A | | | 5.00 | | | | 6-1-2054 | | | | 1,000,000 | | | | 1,003,360 | |
| | | | |
California School Finance Authority Green Dot Public Schools Projects 144A | | | 4.00 | | | | 8-1-2025 | | | | 475,000 | | | | 495,363 | |
| | | | |
California School Finance Authority Green Dot Public Schools Projects 144A | | | 5.00 | | | | 8-1-2035 | | | | 2,525,000 | | | | 2,681,701 | |
| | | | |
California School Finance Authority KIPP Louisiana School Projects Series A 144A | | | 5.00 | | | | 7-1-2035 | | | | 1,000,000 | | | | 1,078,030 | |
| | | | |
California School Finance Authority Rocketship Education Series A 144A | | | 5.00 | | | | 6-1-2036 | | | | 945,000 | | | | 967,321 | |
| | | | |
California School Finance Authority Rocketship Education Series A 144A | | | 5.00 | | | | 6-1-2046 | | | | 2,100,000 | | | | 2,127,468 | |
| | | | |
California Statewide CDA California Baptist University Refunding Bond Series A 144A | | | 5.00 | | | | 11-1-2032 | | | | 1,135,000 | | | | 1,250,157 | |
| | | | |
California Statewide CDA California Baptist University Refunding Bond Series A 144A | | | 5.00 | | | | 11-1-2041 | | | | 2,875,000 | | | | 3,095,771 | |
| | | | |
California Statewide CDA School Facility Alliance for College-Ready Public Schools | | | 6.75 | | | | 7-1-2031 | | | | 1,625,000 | | | | 1,741,252 | |
| | | | |
California Statewide CDA School Facility Aspire Public Schools | | | 5.00 | | | | 7-1-2020 | | | | 670,000 | | | | 670,000 | |
| | | | |
California Statewide CDA School Facility Aspire Public Schools | | | 5.20 | | | | 7-1-2020 | | | | 135,000 | | | | 135,000 | |
| | | | |
California University Systemwide Refunding Bond Series A | | | 4.00 | | | | 11-1-2038 | | | | 8,000,000 | | | | 8,277,200 | |
| | | | |
California University Systemwide Refunding Bond Series A | | | 5.00 | | | | 11-1-2045 | | | | 6,400,000 | | | | 7,186,880 | |
| | | | |
University of California Series AI | | | 5.00 | | | | 5-15-2038 | | | | 2,000,000 | | | | 2,199,480 | |
| | | | |
University of California Series K | | | 4.00 | | | | 5-15-2046 | | | | 5,295,000 | | | | 5,375,908 | |
| | | | |
| | | | | | | | | | | | | | | 50,540,247 | |
| | | | | | | | | | | | | | | | |
|
| GO Revenue: 32.44% | |
| | | | |
Alhambra CA Unified School District Election of 2008 Series B (AGM Insured) | | | 6.00 | | | | 8-1-2029 | | | | 4,100,000 | | | | 4,548,253 | |
| | | | |
Alvord CA Unified School District Election of 2012 Series A (AGM Insured) | | | 5.25 | | | | 8-1-2037 | | | | 1,620,000 | | | | 1,812,278 | |
| | | | |
Bassett CA Unified School District Refunding Bond Series B (Build America Mutual Assurance Company Insured) | | | 5.00 | | | | 8-1-2027 | | | | 1,050,000 | | | | 1,215,879 | |
The accompanying notes are an integral part of these financial statements.
| | | | |
| 8 | | Wells Fargo California Tax-Free Fund | | Portfolio of investments—December 31, 2018 (unaudited) |
| | | | | | | | | | | | | | | | |
| Security name | | Interest rate | | | Maturity date | | | Principal | | | Value | |
|
| GO Revenue(continued) | |
| | | | |
Beaumont CA Unified School District Election of 2008 Series D (Build America Mutual Assurance Company Insured) | | | 5.25 | % | | | 8-1-2044 | | | $ | 2,000,000 | | | $ | 2,314,420 | |
| | | | |
Cabrillo CA Unified School District CAB Series A (Ambac Insured) (z) | | | 5.61 | | | | 8-1-2021 | | | | 1,500,000 | | | | 1,420,635 | |
| | | | |
California | | | 5.25 | | | | 11-1-2040 | | | | 3,000,000 | | | | 3,159,630 | |
| | | | |
California Prerefunded Bond | | | 6.00 | | | | 4-1-2035 | | | | 900,000 | | | | 909,972 | |
| | | | |
California Prerefunded Bond | | | 6.00 | | | | 4-1-2038 | | | | 8,300,000 | | | | 8,391,964 | |
| | | | |
California Statewide Series B (1 Month LIBOR +0.76%) ± | | | 2.40 | | | | 12-1-2031 | | | | 2,500,000 | | | | 2,518,925 | |
| | | | |
California Unrefunded Bond | | | 6.00 | | | | 4-1-2035 | | | | 1,240,000 | | | | 1,252,375 | |
| | | | |
California Unrefunded Bond | | | 6.00 | | | | 4-1-2038 | | | | 15,165,000 | | | | 15,311,039 | |
| | | | |
California Various Purposes | | | 5.00 | | | | 9-1-2029 | | | | 1,475,000 | | | | 1,585,905 | |
| | | | |
California Various Purposes | | | 5.00 | | | | 10-1-2029 | | | | 7,000,000 | | | | 7,149,450 | |
| | | | |
California Various Purposes | | | 5.00 | | | | 9-1-2032 | | | | 5,100,000 | | | | 5,667,018 | |
| | | | |
California Various Purposes | | | 5.00 | | | | 2-1-2038 | | | | 5,000,000 | | | | 5,441,150 | |
| | | | |
California Various Purposes | | | 5.00 | | | | 10-1-2039 | | | | 5,000,000 | | | | 5,646,550 | |
| | | | |
California Various Purposes | | | 5.00 | | | | 8-1-2046 | | | | 10,000,000 | | | | 11,259,800 | |
| | | | |
California Various Purposes | | | 5.25 | | | | 9-1-2028 | | | | 5,000,000 | | | | 5,413,550 | |
| | | | |
California Various Purposes | | | 5.25 | | | | 10-1-2029 | | | | 800,000 | | | | 818,552 | |
| | | | |
California Various Purposes | | | 5.25 | | | | 4-1-2035 | | | | 12,640,000 | | | | 13,761,674 | |
| | | | |
California Various Purposes | | | 5.60 | | | | 3-1-2036 | | | | 8,715,000 | | | | 9,057,674 | |
| | | | |
California Various Purposes | | | 5.75 | | | | 4-1-2029 | | | | 1,600,000 | | | | 1,615,392 | |
| | | | |
California Various Purposes | | | 5.75 | | | | 4-1-2031 | | | | 3,380,000 | | | | 3,411,840 | |
| | | | |
California Various Purposes Refunding Bond | | | 5.00 | | | | 9-1-2035 | | | | 35,000,000 | | | | 40,274,850 | |
| | | | |
Center Unified School District California CAB Series C (National Insured) (z) | | | 5.78 | | | | 9-1-2021 | | | | 5,000,000 | | | | 4,737,100 | |
| | | | |
Centinela Valley CA Union High School District Election of 2008 Series B | | | 6.00 | | | | 8-1-2036 | | | | 2,500,000 | | | | 2,970,275 | |
| | | | |
Centinela Valley CA Union High School District Election of 2008 Series C | | | 5.00 | | | | 8-1-2035 | | | | 2,000,000 | | | | 2,262,100 | |
| | | | |
Cerritos CA Community College CAB Election of 2004 (z) | | | 5.55 | | | | 8-1-2029 | | | | 1,750,000 | | | | 1,274,507 | |
| | | | |
Cerritos CA Community College CAB Election of 2004 (z) | | | 5.79 | | | | 8-1-2033 | | | | 1,500,000 | | | | 916,275 | |
| | | | |
College of the Sequoias Tulare Area Improvement District #3 CAB Election of 2008 Series A (AGC Insured) (z) | | | 6.31 | | | | 8-1-2024 | | | | 1,000,000 | | | | 869,160 | |
| | | | |
Compton CA Community College CAB Election of 2002 Series C (z) | | | 6.71 | | | | 8-1-2035 | | | | 3,445,000 | | | | 1,735,178 | |
| | | | |
Contra Costa County CA Community College District Election of 2006 | | | 5.00 | | | | 8-1-2038 | | | | 3,250,000 | | | | 3,620,175 | |
| | | | |
Delano CA Union High School Election of 2010 Series B (AGM Insured) | | | 5.75 | | | | 8-1-2035 | | | | 4,510,000 | | | | 4,777,849 | |
| | | | |
Escondido CA Union High School CAB Election of 2008 Series A (AGC Insured) (z) | | | 6.65 | | | | 8-1-2027 | | | | 8,385,000 | | | | 6,678,736 | |
| | | | |
Garden Grove CA Unified School District Election of 2010 Series C | | | 5.25 | | | | 8-1-2037 | | | | 2,000,000 | | | | 2,246,600 | |
| | | | |
Gilroy CA Unified School District Election of 2008 Series A (AGC Insured) | | | 6.00 | | | | 8-1-2027 | | | | 1,000,000 | | | | 1,025,890 | |
| | | | |
Hayward CA Unified School District Refunding Bond | | | 5.00 | | | | 8-1-2038 | | | | 6,000,000 | | | | 6,660,780 | |
| | | | |
Inglewood CA Unified School District Election of 2012 Series B (Build America Mutual Assurance Company Insured) | | | 5.00 | | | | 8-1-2036 | | | | 200,000 | | | | 223,622 | |
| | | | |
Inglewood CA Unified School District Election of 2012 Series B (Build America Mutual Assurance Company Insured) | | | 5.00 | | | | 8-1-2038 | | | | 500,000 | | | | 555,150 | |
| | | | |
Kentfield CA School District Election 2014 Series B | | | 5.00 | | | | 8-1-2043 | | | | 1,500,000 | | | | 1,680,690 | |
| | | | |
Long Beach CA Unified School District CAB Election of 2008 Series B (z) | | | 5.75 | | | | 8-1-2035 | | | | 2,000,000 | | | | 1,092,680 | |
| | | | |
Long Beach CA Unified School District Prerefunded Bond Election of 2008 Series A | | | 5.50 | | | | 8-1-2026 | | | | 1,435,000 | | | | 1,467,632 | |
| | | | |
Long Beach CA Unified School District Unrefunded Bond Election of 2008 Series A | | | 5.50 | | | | 8-1-2026 | | | | 95,000 | | | | 97,065 | |
| | | | |
Los Angeles CA Community College District Refunding Bond | | | 4.00 | | | | 8-1-2038 | | | | 10,000,000 | | | | 10,424,800 | |
| | | | |
Lynwood CA Unified School District Election of 2012 Series A (AGM Insured) | | | 5.00 | | | | 8-1-2033 | | | | 5,000 | | | | 5,517 | |
| | | | |
Merced CA City School District Election of 2014 | | | 5.00 | | | | 8-1-2045 | | | | 1,000,000 | | | | 1,137,750 | |
| | | | |
Merced CA Union High School District CAB Series C (z) | | | 6.64 | | | | 8-1-2032 | | | | 3,380,000 | | | | 2,132,814 | |
| | | | |
Mount San Antonio CA Community College District CAB Election of 2008 Series A (z) | | | 4.83 | | | | 8-1-2024 | | | | 1,610,000 | | | | 1,421,888 | |
| | | | |
Natomas CA Unified School District Series 1999 (National Insured) | | | 5.95 | | | | 9-1-2021 | | | | 360,000 | | | | 377,680 | |
The accompanying notes are an integral part of these financial statements.
| | | | | | |
| Portfolio of investments—December 31, 2018 (unaudited) | | Wells Fargo California Tax-Free Fund | | | 9 | |
| | | | | | | | | | | | | | | | |
| Security name | | Interest rate | | | Maturity date | | | Principal | | | Value | |
| | | | |
| GO Revenue (continued) | | | | | | | | | | | | | | | | |
| | | | |
Norwalk-La Mirada CA Unified School District CAB Election of 2002 Series D (AGM Insured) (z) | | | 6.35 | % | | | 8-1-2023 | | | $ | 1,500,000 | | | $ | 1,354,575 | |
| | | | |
Oakland CA Unified School District Election of 2012 Series 2013 | | | 5.50 | | | | 8-1-2023 | | | | 500,000 | | | | 568,745 | |
| | | | |
Oakland CA Unified School District Election of 2012 Series 2013 | | | 6.63 | | | | 8-1-2038 | | | | 7,750,000 | | | | 8,727,430 | |
| | | | |
Oakland CA Unified School District Election of 2012 Series A | | | 5.00 | | | | 8-1-2040 | | | | 3,500,000 | | | | 3,961,825 | |
| | | | |
Oxnard CA School District Election of 2012 Series D (AGM Insured) | | | 5.00 | | | | 8-1-2034 | | | | 1,695,000 | | | | 1,948,301 | |
| | | | |
Pajaro Valley CA Unified School District Election of 2012 Series A | | | 5.00 | | | | 8-1-2038 | | | | 1,700,000 | | | | 1,888,173 | |
| | | | |
Paramount CA Unified School District CAB Election of 2006 (z) | | | 6.88 | | | | 8-1-2033 | | | | 2,500,000 | | | | 1,483,975 | |
| | | | |
Pomona CA Unified School District Series A (National Insured) | | | 6.55 | | | | 8-1-2029 | | | | 1,480,000 | | | | 1,844,198 | |
| | | | |
Poway CA Unified School District CAB Election of 2008 ImprovementDistrict 07-1-A (z) | | | 5.83 | | | | 8-1-2024 | | | | 1,800,000 | | | | 1,582,686 | |
| | | | |
Rialto CA Unified School District CAB Election of 2010 Series A (AGM Insured) (z) | | | 6.78 | | | | 8-1-2026 | | | | 3,320,000 | | | | 2,727,712 | |
| | | | |
Sacramento CA Unified School District Election of 2012 Series A (Build America Mutual Assurance Company Insured) | | | 5.25 | | | | 8-1-2033 | | | | 1,000,000 | | | | 1,125,610 | |
| | | | |
Sacramento CA Unified School District Election of 2012 Series C (AGM Insured) | | | 5.00 | | | | 8-1-2033 | | | | 2,735,000 | | | | 3,129,469 | |
| | | | |
San Bernardino County CA Community Election of 2008 Series D | | | 5.00 | | | | 8-1-2045 | | | | 2,000,000 | | | | 2,253,660 | |
| | | | |
San Bernardino County CA Unified School District Election of 2012 Series C (AGM Insured) | | | 5.00 | | | | 8-1-2040 | | | | 8,000,000 | | | | 9,030,000 | |
| | | | |
San Diego CA Community College Election of 2002 | | | 5.00 | | | | 8-1-2031 | | | | 4,000,000 | | | | 4,514,920 | |
| | | | |
San Gorgonio CA Memorial Healthcare Refunding Bond | | | 5.00 | | | | 8-1-2032 | | | | 1,750,000 | | | | 1,906,905 | |
| | | | |
San Gorgonio CA Memorial Healthcare Refunding Bond | | | 5.50 | | | | 8-1-2028 | | | | 2,525,000 | | | | 2,848,326 | |
| | | | |
San Joaquin CA Delta Community College District Election of 2004 Series C | | | 5.00 | | | | 8-1-2033 | | | | 3,195,000 | | | | 3,610,158 | |
| | | | |
San Joaquin CA Delta Community College District Election of 2004 Series C | | | 5.00 | | | | 8-1-2034 | | | | 3,315,000 | | | | 3,740,248 | |
| | | | |
San Jose CA Libraries & Parks Project | | | 5.13 | | | | 9-1-2031 | | | | 2,040,000 | | | | 2,045,426 | |
| | | | |
San Mateo County CA Jefferson Union High School District CAB Election of 2006 Series D (z) | | | 7.98 | | | | 8-1-2033 | | | | 7,000,000 | | | | 2,518,950 | |
| | | | |
San Mateo County CA Jefferson Union High School District CAB Election of 2006 Series D (z) | | | 8.50 | | | | 8-1-2036 | | | | 11,130,000 | | | | 3,128,532 | |
| | | | |
San Mateo County CA Jefferson Union High School District Prerefunded CAB Election of 2006 Series D (z) | | | 8.49 | | | | 8-1-2034 | | | | 6,915,000 | | | | 2,291,216 | |
| | | | |
San Mateo County CA Jefferson Union High School District Unrefunded CAB Election of 2006 Series D (z) | | | 8.49 | | | | 8-1-2034 | | | | 2,990,000 | | | | 989,421 | |
| | | | |
San Rafael CA City High School District CAB Election of 2002 Series B (National Insured) (z) | | | 5.62 | | | | 8-1-2023 | | | | 1,260,000 | | | | 1,138,876 | |
| | | | |
Sanger CA Unified School District Refunding Bond (National Insured) | | | 5.60 | | | | 8-1-2023 | | | | 855,000 | | | | 896,656 | |
| | | | |
Santa Ana CA Unified School District CAB Election of 2008 Series B (AGC Insured) (z) | | | 7.22 | | | | 8-1-2038 | | | | 15,000,000 | | | | 7,082,550 | |
| | | | |
Santa Rosa CA High School District Prerefunded Bond | | | 5.00 | | | | 8-1-2024 | | | | 750,000 | | | | 834,165 | |
| | | | |
Santa Rosa CA High School District Unrefunded Bond | | | 5.00 | | | | 8-1-2024 | | | | 255,000 | | | | 281,841 | |
| | | | |
Sierra Kings CA Health Care District | | | 5.00 | | | | 8-1-2028 | | | | 1,000,000 | | | | 1,131,310 | |
| | | | |
Sierra Kings CA Health Care District | | | 5.00 | | | | 8-1-2032 | | | | 1,500,000 | | | | 1,671,210 | |
| | | | |
Sierra Kings CA Health Care District | | | 5.00 | | | | 8-1-2037 | | | | 1,750,000 | | | | 1,922,410 | |
| | | | |
Sonoma Valley CA Unified School District CAB Election of 2010 Series A (z) | | | 6.55 | | | | 8-1-2027 | | | | 1,020,000 | | | | 802,199 | |
| | | | |
South Pasadena CA Unified School District Series A (FGIC Insured) | | | 5.55 | | | | 11-1-2020 | | | | 220,000 | | | | 230,996 | |
| | | | |
Stockton CA Unified School District Election of 2012 Series A (AGM Insured) | | | 5.00 | | | | 8-1-2038 | | | | 1,025,000 | | | | 1,133,988 | |
| | | | |
Washington Township CA Health Care District Election of 2004 Series B | | | 5.50 | | | | 8-1-2038 | | | | 1,500,000 | | | | 1,735,440 | |
| | | | |
West Contra Costa CA Unified School District (AGM Insured) | | | 5.25 | | | | 8-1-2024 | | | | 1,350,000 | | | | 1,464,642 | |
| | | | |
West Contra Costa CA Unified School District CAB Election of 2005 Series B | | | 6.00 | | | | 8-1-2027 | | | | 1,080,000 | | | | 1,408,039 | |
| | | | |
West Contra Costa CA Unified School District CAB Election of 2005 SeriesC-1 (AGC Insured) (z) | | | 6.19 | | | | 8-1-2021 | | | | 6,000,000 | | | | 5,702,880 | |
| | | | |
Wiseburn CA School District CAB (AGC Insured) (z) | | | 5.63 | | | | 8-1-2027 | | | | 1,525,000 | | | | 1,201,395 | |
| | | | |
| | | | | | | | | | | | | | | 312,209,746 | |
| | | | | | | | | | | | | | | | |
The accompanying notes are an integral part of these financial statements.
| | | | |
| 10 | | Wells Fargo California Tax-Free Fund | | Portfolio of investments—December 31, 2018 (unaudited) |
| | | | | | | | | | | | | | | | |
| Security name | | Interest rate | | | Maturity date | | | Principal | | | Value | |
|
| Health Revenue: 12.09% | |
| | | | |
Antelope Valley CA Healthcare District Refunding Bond Series A | | | 5.25 | % | | | 3-1-2036 | | | $ | 3,000,000 | | | $ | 3,219,750 | |
| | | | |
Association of Bay Area Governments Finance Authority for Nonprofit Corporation Insured O’Connor Woods Project | | | 5.00 | | | | 1-1-2043 | | | | 5,000,000 | | | | 5,437,900 | |
| | | | |
Association of Bay Area Governments Finance Authority for Nonprofit Corporation Insured Senior Living Odd Fellows Home of California Series A | | | 5.00 | | | | 4-1-2042 | | | | 1,100,000 | | | | 1,192,499 | |
| | | | |
California HFFA Catholic Healthcare West Series A | | | 5.25 | | | | 3-1-2023 | | | | 3,000,000 | | | | 3,197,250 | |
| | | | |
California HFFA Catholic Healthcare West Series A | | | 6.00 | | | | 7-1-2029 | | | | 4,000,000 | | | | 4,087,920 | |
| | | | |
California HFFA El Camino Hospital | | | 5.00 | | | | 2-1-2035 | | | | 3,000,000 | | | | 3,399,900 | |
| | | | |
California HFFA LA Biomedical Research Institute at Harbor-UCLA Medical Center | | | 5.00 | | | | 9-1-2048 | | | | 5,000,000 | | | | 5,426,350 | |
| | | | |
California HFFA Nevada Methodist Homes | | | 5.00 | | | | 7-1-2030 | | | | 1,830,000 | | | | 2,119,323 | |
| | | | |
California HFFA Nevada Methodist Homes | | | 5.00 | | | | 7-1-2035 | | | | 1,000,000 | | | | 1,139,360 | |
| | | | |
California HFFA Nevada Methodist Homes | | | 5.00 | | | | 7-1-2045 | | | | 4,500,000 | | | | 5,035,950 | |
| | | | |
California HFFA Refunding Bond Cedars Sinai Medical Center Series B | | | 4.00 | | | | 8-15-2039 | | | | 10,500,000 | | | | 10,756,200 | |
| | | | |
California HFFA Refunding Bond Children’s Hospital Series A | | | 5.00 | | | | 8-15-2047 | | | | 5,000,000 | | | | 5,487,250 | |
| | | | |
California HFFA Sutter Health Series B | | | 5.00 | | | | 11-15-2046 | | | | 5,000,000 | | | | 5,522,500 | |
| | | | |
California HFFA Sutter Health Series D | | | 5.25 | | | | 8-15-2031 | | | | 3,100,000 | | | | 3,358,013 | |
| | | | |
California Municipal Finance Authority Channing House Project Refunding Bond Series A | | | 5.00 | | | | 5-15-2034 | | | | 1,000,000 | | | | 1,155,790 | |
| | | | |
California Municipal Finance Authority Community Medical Centers Refunding Bond Series A | | | 5.00 | | | | 2-1-2047 | | | | 4,000,000 | | | | 4,357,200 | |
| | | | |
California Municipal Finance Authority Eisenhower Medical Center Refunding Bond Series A | | | 5.00 | | | | 7-1-2047 | | | | 1,400,000 | | | | 1,522,052 | |
| | | | |
California PFA Henry Mayo Newhall Hospital Refunding Bond | | | 5.00 | | | | 10-15-2037 | | | | 500,000 | | | | 539,375 | |
| | | | |
California PFA Henry Mayo Newhall Hospital Refunding Bond | | | 5.00 | | | | 10-15-2047 | | | | 4,000,000 | | | | 4,267,800 | |
| | | | |
California Statewide CDA Adventist Health System Series A | | | 5.00 | | | | 3-1-2045 | | | | 2,500,000 | | | | 2,772,350 | |
| | | | |
California Statewide CDA Adventist Health System West Refunding Bond Series A | | | 5.00 | | | | 3-1-2048 | | | | 5,000,000 | | | | 5,612,450 | |
| | | | |
California Statewide CDA Enloe Medical Center (Ambac Insured) | | | 5.00 | | | | 8-15-2033 | | | | 1,650,000 | | | | 1,889,580 | |
| | | | |
California Statewide CDA Enloe Medical Center (Ambac Insured) | | | 5.00 | | | | 8-15-2035 | | | | 1,000,000 | | | | 1,136,890 | |
| | | | |
California Statewide CDA Enloe Medical Center (Ambac Insured) | | | 5.00 | | | | 8-15-2038 | | | | 2,000,000 | | | | 2,249,100 | |
| | | | |
California Statewide CDA Loma Linda University Medical Center Refunding Bond Series A | | | 5.25 | | | | 12-1-2044 | | | | 5,150,000 | | | | 5,422,023 | |
| | | | |
California Statewide CDA Redwoods Projects | | | 5.13 | | | | 11-15-2035 | | | | 1,500,000 | | | | 1,678,605 | |
| | | | |
California Statewide Communities Marin General Hospital Series A | | | 5.00 | | | | 8-1-2036 | | | | 700,000 | | | | 809,312 | |
| | | | |
California Statewide Communities Marin General Hospital Series A | | | 5.00 | | | | 8-1-2037 | | | | 500,000 | | | | 576,365 | |
| | | | |
California Statewide Communities Marin General Hospital Series A | | | 5.00 | | | | 8-1-2038 | | | | 450,000 | | | | 515,272 | |
| | | | |
Palomar Health CA Refunding Bond | | | 5.00 | | | | 11-1-2042 | | | | 4,000,000 | | | | 4,294,840 | |
| | | | |
San Buenaventura CA Community Mental Health System | | | 8.00 | | | | 12-1-2031 | | | | 1,615,000 | | | | 1,807,750 | |
| | | | |
University of California Regents Medical Center Prerefunded Bond Series J | | | 5.25 | | | | 5-15-2038 | | | | 7,790,000 | | | | 8,920,641 | |
| | | | |
University of California Regents Medical Center Series J | | | 5.00 | | | | 5-15-2033 | | | | 2,265,000 | | | | 2,575,169 | |
| | | | |
University of California Regents Medical Center Unrefunded Bond Series J | | | 5.25 | | | | 5-15-2038 | | | | 2,210,000 | | | | 2,469,565 | |
| | | | |
Washington Township CA Health Care District Series A | | | 5.00 | | | | 7-1-2026 | | | | 1,190,000 | | | | 1,340,714 | |
| | | | |
Washington Township CA Health Care District Series A | | | 5.00 | | | | 7-1-2042 | | | | 1,000,000 | | | | 1,087,180 | |
| | | | |
| | | | | | | | | | | | | | | 116,380,188 | |
| | | | | | | | | | | | | | | | |
|
| Housing Revenue: 1.61% | |
| | | | |
California Municipal Finance AuthorityLLC-West Village Student Housing Project | | | 5.00 | | | | 5-15-2048 | | | | 6,700,000 | | | | 7,298,511 | |
| | | | |
California Municipal Finance Authority Mobile Senior Caritas Projects Series A | | | 5.00 | | | | 8-15-2029 | | | | 500,000 | | | | 562,480 | |
| | | | |
California PFA NCCD-Claremont Properties LLC University Housing Project Series A 144A | | | 5.00 | | | | 7-1-2047 | | | | 2,950,000 | | | | 2,962,154 | |
The accompanying notes are an integral part of these financial statements.
| | | | | | |
| Portfolio of investments—December 31, 2018 (unaudited) | | Wells Fargo California Tax-Free Fund | | | 11 | |
| | | | | | | | | | | | | | | | |
| Security name | | Interest rate | | | Maturity date | | | Principal | | | Value | |
|
| Housing Revenue (continued) | |
| | | | |
California Statewide CDA Poway Retirement Housing Foundation Housing Incorporated Series A | | | 5.25 | % | | | 11-15-2035 | | | $ | 1,500,000 | | | $ | 1,693,005 | |
| | | | |
Contra Costa County CA Home Mortgage Revenue Bonds GNMA Mortgage-Backed Securities Program (GNMA Insured) | | | 7.75 | | | | 5-1-2022 | | | | 105,000 | | | | 115,310 | |
| | | | |
Independent Cities California Finance Refunding Bond Sanitary Juan Mobile Estates | | | 5.00 | | | | 8-15-2030 | | | | 1,000,000 | | | | 1,103,400 | |
| | | | |
Independent Cities California Finance Refunding Bond Santa Rose Leisure Mobile | | | 5.00 | | | | 8-15-2046 | | | | 1,570,000 | | | | 1,732,825 | |
| | | | |
| | | | | | | | | | | | | | | 15,467,685 | |
| | | | | | | | | | | | | | | | |
|
| Industrial Development Revenue: 0.22% | |
| | | | |
California PCFA Solid Waste Disposal AMT Green Bond Calplant I Project 144A | | | 8.00 | | | | 7-1-2039 | | | | 2,000,000 | | | | 2,118,560 | |
| | | | | | | | | | | | | | | | |
|
| Miscellaneous Revenue: 16.94% | |
| | | | |
Alameda CA Joint Powers Authority Multiple Capital Projects Series A | | | 5.00 | | | | 12-1-2034 | | | | 1,005,000 | | | | 1,126,836 | |
| | | | |
Anaheim CA PFA CAB Subordinate Lien Public Improvements Project Series C (AGM Insured) (z) | | | 6.51 | | | | 9-1-2025 | | | | 10,000,000 | | | | 8,309,200 | |
| | | | |
Anaheim CA PFA Convention Center Expansion Project Series A | | | 5.00 | | | | 5-1-2039 | | | | 3,000,000 | | | | 3,310,380 | |
| | | | |
Anaheim CA PFA Convention Center Expansion Project Series A | | | 5.00 | | | | 5-1-2046 | | | | 3,000,000 | | | | 3,294,840 | |
| | | | |
California Infrastructure & Economic Development King City Joint Union High School | | | 5.75 | | | | 8-15-2029 | | | | 2,150,000 | | | | 2,247,330 | |
| | | | |
California Public Works Board California State University Projects SeriesB-1 | | | 5.70 | | | | 3-1-2035 | | | | 2,210,000 | | | | 2,302,533 | |
| | | | |
California Public Works Board Judicial Council Projects Series A | | | 5.00 | | | | 3-1-2038 | | | | 7,000,000 | | | | 7,603,540 | |
| | | | |
California Public Works Board Various Capital Projects Series A | | | 5.00 | | | | 4-1-2037 | | | | 4,925,000 | | | | 5,303,043 | |
| | | | |
California Public Works Board Judicial Council Projects Series D | | | 5.25 | | | | 12-1-2025 | | | | 4,000,000 | | | | 4,377,680 | |
| | | | |
California Public Works Board Various Capital Projects Series G | | | 5.00 | | | | 11-1-2037 | | | | 23,000,000 | | | | 25,068,160 | |
| | | | |
California Public Works Board Various Capital Projects Series I | | | 5.50 | | | | 11-1-2033 | | | | 2,000,000 | | | | 2,267,300 | |
| | | | |
California Public Works University of California Board of Regents Series G | | | 5.00 | | | | 12-1-2030 | | | | 9,850,000 | | | | 10,798,752 | |
| | | | |
California Statewide Communities Series A | | | 5.00 | | | | 9-2-2047 | | | | 2,000,000 | | | | 2,103,180 | |
| | | | |
Compton CA PFA Refunding Bond 144A | | | 4.00 | | | | 9-1-2027 | | | | 3,800,000 | | | | 3,788,828 | |
| | | | |
Compton CA PFA Refunding Bond 144A | | | 4.50 | | | | 9-1-2032 | | | | 2,000,000 | | | | 2,014,800 | |
| | | | |
Emeryville CA PFA Assessment District Refinancing | | | 5.90 | | | | 9-2-2021 | | | | 765,000 | | | | 766,584 | |
| | | | |
Fullerton CA Joint Union High School Project Certificate of Participation (Build America Mutual Assurance Company Insured) | | | 5.00 | | | | 9-1-2035 | | | | 1,385,000 | | | | 1,556,408 | |
| | | | |
Irvine CA Improvement Bond Act 1915 Limited Obligation ReassessmentDistrict #15-2 | | | 5.00 | | | | 9-2-2025 | | | | 725,000 | | | | 821,795 | |
| | | | |
Irvine CA Improvement Bond Act 1915 Limited Obligation ReassessmentDistrict #15-2 | | | 5.00 | | | | 9-2-2026 | | | | 400,000 | | | | 450,552 | |
| | | | |
Irvine CA Improvement Bond Act 1915 Limited Obligation ReassessmentDistrict #15-2 | | | 5.00 | | | | 9-2-2042 | | | | 1,500,000 | | | | 1,609,575 | |
| | | | |
Los Angeles CA Certificate of Participation Sonneblick del Rio Project (Ambac Insured) | | | 6.00 | | | | 11-1-2019 | | | | 535,000 | | | | 536,856 | |
| | | | |
Los Angeles CA Community Redevelopment Vermont Manchester Social Services Project (Ambac Insured) | | | 5.00 | | | | 9-1-2025 | | | | 2,310,000 | | | | 2,316,029 | |
| | | | |
Los Angeles CA Public Works Financing Authority Series A | | | 5.00 | | | | 12-1-2039 | | | | 2,860,000 | | | | 3,220,417 | |
| | | | |
Montclair CA PFA Lease Refunding Bond (AGM Insured) | | | 5.00 | | | | 10-1-2035 | | | | 2,400,000 | | | | 2,687,736 | |
| | | | |
Richmond CA Joint Powers Financing Authority Civic Center Project Series A (AGC Insured) | | | 5.88 | | | | 8-1-2037 | | | | 5,000,000 | | | | 5,106,850 | |
| | | | |
Richmond CA Joint Powers Financing Authority Point Potrero Series A | | | 6.25 | | | | 7-1-2024 | | | | 7,500,000 | | | | 7,668,825 | |
| | | | |
Riverside County CA Asset Leasing Corporation Riverside County Hospital Project (National Insured) (z) | | | 5.69 | | | | 6-1-2026 | | | | 10,000,000 | | | | 8,049,100 | |
| | | | |
Sacramento CA City Financing Authority Refunding Bond Master Lease Program Facilities (Build America Mutual Assurance Company Insured) | | | 5.00 | | | | 12-1-2035 | | | | 1,300,000 | | | | 1,477,671 | |
| | | | |
Sacramento CA City Financing Authority Series A (Ambac Insured) | | | 5.40 | | | | 11-1-2020 | | | | 920,000 | | | | 958,806 | |
The accompanying notes are an integral part of these financial statements.
| | | | |
| 12 | | Wells Fargo California Tax-Free Fund | | Portfolio of investments—December 31, 2018 (unaudited) |
| | | | | | | | | | | | | | | | |
| Security name | | Interest rate | | | Maturity date | | | Principal | | | Value | |
|
| Miscellaneous Revenue(continued) | |
| | | | |
Sacramento CA City School Joint Refunding Bond Series A (Build America Mutual Assurance Company Insured) | | | 5.00 | % | | | 3-1-2040 | | | $ | 2,165,000 | | | $ | 2,382,496 | |
| | | | |
San Bernardino County CA Certificate of Participation Arrowhead Project Series A | | | 5.50 | | | | 8-1-2020 | | | | 6,000,000 | | | | 6,132,540 | |
| | | | |
San Bernardino County CA Certificate of Participation Medical Center Financing Project (National Insured) | | | 5.00 | | | | 8-1-2028 | | | | 5,720,000 | | | | 5,725,434 | |
| | | | |
San Francisco CA City & County Certificate of Participation Multiple Capital Improvement Projects Series A | | | 5.20 | | | | 4-1-2026 | | | | 3,000,000 | | | | 3,024,420 | |
| | | | |
San Jose CA Unified School District CAB (AGM Insured) (z) | | | 5.57 | | | | 1-1-2021 | | | | 1,205,000 | | | | 1,163,620 | |
| | | | |
San Jose CA Unified School District CAB (AGM Insured) (z) | | | 6.34 | | | | 1-1-2026 | | | | 3,175,000 | | | | 2,694,496 | |
| | | | |
San Marino CA Unified School District Certificate of Participation Los Angeles County Schools Pooled Financing Program Series A | | | 5.00 | | | | 12-1-2041 | | | | 500,000 | | | | 505,580 | |
| | | | |
San Ysidro CA School District Certificate of Participation School Facilities Bridge Funding Program (Build America Mutual Assurance Company Insured) | | | 5.00 | | | | 9-1-2037 | | | | 250,000 | | | | 272,920 | |
| | | | |
San Ysidro CA School District Certificate of Participation School Facilities Bridge Funding Program (Build America Mutual Assurance Company Insured) | | | 5.00 | | | | 9-1-2042 | | | | 625,000 | | | | 677,725 | |
| | | | |
San Ysidro CA School District Certificate of Participation School Facilities Bridge Funding Program (Build America Mutual Assurance Company Insured) | | | 5.00 | | | | 9-1-2047 | | | | 1,000,000 | | | | 1,078,910 | |
| | | | |
Simi Valley CA Unified School District Capital Improvement Projects (Ambac Insured) | | | 5.25 | | | | 8-1-2022 | | | | 1,710,000 | | | | 1,827,067 | |
| | | | |
Stockton CA Unified School District Community Improvement Project | | | 5.00 | | | | 2-1-2033 | | | | 550,000 | | | | 634,942 | |
| | | | |
Sutter Butte CA Flood Control Agency (Build America Mutual Assurance Company Insured) | | | 5.00 | | | | 10-1-2040 | | | | 3,545,000 | | | | 3,945,089 | |
| | | | |
Torrance CA Certificate of Participation | | | 5.25 | | | | 6-1-2039 | | | | 5,385,000 | | | | 6,103,790 | |
| | | | |
Tracy CA Operating Partnership Joint Powers Authority Capital Improvement Projects (AGC Insured) | | | 6.25 | | | | 10-1-2033 | | | | 1,000,000 | | | | 1,003,450 | |
| | | | |
Ventura County CA PFA Series A | | | 5.00 | | | | 11-1-2038 | | | | 4,250,000 | | | | 4,674,575 | |
| | | | |
| | | | | | | | | | | | | | | 162,990,660 | |
| | | | | | | | | | | | | | | | |
|
| Tax Revenue: 12.65% | |
| | | | |
Beaumont CA Community Facilities District#93-1 Special Tax Improvement Area #17C | | | 5.00 | | | | 9-1-2043 | | | | 750,000 | | | | 806,460 | |
| | | | |
Beaumont CA Community Facilities District#93-1 Special Tax Improvement Area #17C | | | 5.00 | | | | 9-1-2048 | | | | 1,100,000 | | | | 1,175,548 | |
| | | | |
Beaumont CA Community Facilities District#93-1 Special Tax Improvement Area #8D Series A | | | 5.00 | | | | 9-1-2043 | | | | 750,000 | | | | 806,460 | |
| | | | |
Beaumont CA Community Facilities District#93-1 Special Tax Improvement Area #8D Series A | | | 5.00 | | | | 9-1-2048 | | | | 1,035,000 | | | | 1,106,084 | |
| | | | |
Beaumont CA Special Tax Improvement Area #8C Series A | | | 5.00 | | | | 9-1-2048 | | | | 2,855,000 | | | | 3,051,081 | |
| | | | |
Belmont CA Community Facilities Special Tax District#2000-1 Library Project Series A (Ambac Insured) | | | 5.75 | | | | 8-1-2030 | | | | 3,190,000 | | | | 4,077,235 | |
| | | | |
California Statewide CDA Community Facilities District#2015-01 | | | 5.00 | | | | 9-1-2047 | | | | 1,420,000 | | | | 1,526,230 | |
| | | | |
California Statewide Communities Development Authority Special Tax Community Facilities District#2017-01 | | | 5.00 | | | | 9-1-2048 | | | | 5,000,000 | | | | 5,372,250 | |
| | | | |
Casitas CA Municipal Water District Community Facilities District#2013-1-OJAI Series B (Build America Mutual Assurance Company Insured) | | | 5.25 | | | | 9-1-2047 | | | | 5,000,000 | | | | 5,786,200 | |
| | | | |
Cathedral City CA RDA Successor Agency to Merged Redevelopment Project Tax Allocation Bond Series A (AGM Insured) | | | 5.00 | | | | 8-1-2032 | | | | 1,450,000 | | | | 1,616,808 | |
| | | | |
Cathedral City CA RDA Successor Agency to Merged Redevelopment Project Tax Allocation Bond Series A (AGM Insured) | | | 5.00 | | | | 8-1-2033 | | | | 880,000 | | | | 979,317 | |
| | | | |
Chino CA Community Facilities District Special Tax#2003-3 Improvement Area #7 | | | 5.00 | | | | 9-1-2048 | | | | 2,500,000 | | | | 2,706,900 | |
| | | | |
Chula Vista CA Community Facilities District Special Tax #16I Improvement Area #1 | | | 5.00 | | | | 9-1-2043 | | | | 500,000 | | | | 543,870 | |
| | | | |
Chula Vista CA Community Facilities District Special Tax #16I Improvement Area #1 | | | 5.00 | | | | 9-1-2048 | | | | 1,000,000 | | | | 1,085,890 | |
The accompanying notes are an integral part of these financial statements.
| | | | | | |
| Portfolio of investments—December 31, 2018 (unaudited) | | Wells Fargo California Tax-Free Fund | | | 13 | |
| | | | | | | | | | | | | | | | |
| Security name | | Interest rate | | | Maturity date | | | Principal | | | Value | |
|
| Tax Revenue (continued) | |
| | | | |
Compton CA Community College RDA Project 2nd Lien Series A | | | 5.00 | % | | | 8-1-2020 | | | $ | 1,140,000 | | | $ | 1,182,180 | |
| | | | |
Corona CA Community Facilities District#2018-1 (Improvement Area #1) 2018 Special Tax Bond Series A | | | 5.00 | | | | 9-1-2048 | | | | 1,000,000 | | | | 1,064,250 | |
| | | | |
Corona Norco CA Unified School Districts Special Tax Community FacilitiesDistrict #16-1 | | | 5.00 | | | | 9-1-2048 | | | | 1,500,000 | | | | 1,620,390 | |
| | | | |
Dinuba CA RDA Merged City Redevelopment Project (Build America Mutual Assurance Company Insured) | | | 5.00 | | | | 9-1-2033 | | | | 1,500,000 | | | | 1,696,755 | |
| | | | |
Elk Grove CA Financing Authority Special Tax Refunding Bond (Build America Mutual Assurance Company Insured) | | | 5.00 | | | | 9-1-2038 | | | | 1,500,000 | | | | 1,681,785 | |
| | | | |
Elk Grove CA Financing Authority Special Tax Refunding Bond (Build America Mutual Assurance Company Insured) | | | 5.00 | | | | 9-1-2048 | | | | 1,250,000 | | | | 1,327,475 | |
| | | | |
Folsom Ranch Financing Authority California Facilities District #20 (Russell Ranch) Series 2018 | | | 5.00 | | | | 9-1-2048 | | | | 1,650,000 | | | | 1,771,473 | |
| | | | |
Fremont CA Community Facilities District #1 Refunding Bond | | | 5.00 | | | | 9-1-2040 | | | | 2,700,000 | | | | 2,887,326 | |
| | | | |
Inglewood CA Redevelopment Successor Agency to Merged Redevelopment Project Tax Allocation Refunding Bond Subordinate Lien Series A (Build America Mutual Assurance Company Insured) | | | 5.00 | | | | 5-1-2034 | | | | 500,000 | | | | 572,000 | |
| | | | |
Inglewood CA Redevelopment Successor Agency to Merged Redevelopment Project Tax Allocation Refunding Bond Subordinate Lien Series A (Build America Mutual Assurance Company Insured) | | | 5.00 | | | | 5-1-2038 | | | | 305,000 | | | | 343,418 | |
| | | | |
Inland Valley CA Development Agency Series A | | | 5.25 | | | | 9-1-2037 | | | | 4,000,000 | | | | 4,453,520 | |
| | | | |
Irvine CA Community Facilities District#2013-3 Great Park Improvement Area #1 Special Tax Bond Series 2014 | | | 5.00 | | | | 9-1-2049 | | | | 1,000,000 | | | | 1,054,820 | |
| | | | |
Lafayette CA RDA Lafayette Redevelopment Project Refunding Bond (AGM Insured) | | | 5.00 | | | | 8-1-2033 | | | | 1,500,000 | | | | 1,683,285 | |
| | | | |
Lafayette CA RDA Lafayette Redevelopment Project Refunding Bond (AGM Insured) | | | 5.00 | | | | 8-1-2038 | | | | 1,635,000 | | | | 1,820,409 | |
| | | | |
Lancaster CA RDA Tax Allocation Combined Redevelopment Project Areas | | | 6.50 | | | | 8-1-2029 | | | | 2,000,000 | | | | 2,056,220 | |
| | | | |
Lancaster CA RDA Tax Allocation Refunding Bond Combined Redevelopment Project Areas (AGM Insured) | | | 5.00 | | | | 8-1-2033 | | | | 1,200,000 | | | | 1,379,988 | |
| | | | |
Oakland CA Redevelopment Successor Agency Refunding Bond Subordinate Series TE (AGM Insured) | | | 5.00 | | | | 9-1-2035 | | | | 2,545,000 | | | | 2,869,818 | |
| | | | |
Oakland CA Redevelopment Successor Agency Refunding Bond Subordinate Series TE (AGM Insured) | | | 5.00 | | | | 9-1-2036 | | | | 4,000,000 | | | | 4,497,600 | |
| | | | |
Orange County CA Community Facilities District#2015-1 Esencia Village Series A | | | 5.25 | | | | 8-15-2045 | | | | 2,000,000 | | | | 2,158,460 | |
| | | | |
Rancho Cucamonga CA RDA Rancho Redevelopment Project Area (AGM Insured) | | | 5.00 | | | | 9-1-2032 | | | | 1,870,000 | | | | 2,106,873 | |
| | | | |
Redwood City CA RDA CAB Redevelopment Project Area Series2-A (Ambac Insured) (z) | | | 6.35 | | | | 7-15-2030 | | | | 3,505,000 | | | | 2,370,467 | |
| | | | |
Rio Vista CA Community Facilities District Special Tax#2018-1 | | | 5.00 | | | | 9-1-2048 | | | | 1,190,000 | | | | 1,280,571 | |
| | | | |
Riverside County CA Community Facilities Districts Special Tax#05-8 | | | 5.00 | | | | 9-1-2048 | | | | 1,600,000 | | | | 1,715,152 | |
| | | | |
Romoland School District Community Facilities District#2004-1 Heritage Lake Improvement Area #4 Series 2018 Special Tax Bond | | | 5.00 | | | | 9-1-2048 | | | | 1,500,000 | | | | 1,619,145 | |
| | | | |
Roseville CA Special Tax Westbrook Community Facilities District #1 Series 2018 | | | 5.00 | | | | 9-1-2048 | | | | 2,030,000 | | | | 2,204,357 | |
| | | | |
Sacramento CA Transient Occupancy Tax Convention Center Complex Series A | | | 5.00 | | | | 6-1-2048 | | | | 3,750,000 | | | | 4,242,563 | |
| | | | |
San Bernardino CA Special Tax Community Facilities District#2006-1 Series 2018 | | | 5.00 | | | | 9-1-2048 | | | | 1,200,000 | | | | 1,300,320 | |
| | | | |
San Clemente CA Special Tax Community Facilities District#2006-1 | | | 5.00 | | | | 9-1-2040 | | | | 980,000 | | | | 1,043,837 | |
| | | | |
San Clemente CA Special Tax Community Facilities District#2006-1 | | | 5.00 | | | | 9-1-2046 | | | | 1,190,000 | | | | 1,263,923 | |
| | | | |
San Diego CA RDA CAB Tax Allocation Centre (AGM Insured) (z) | | | 5.58 | | | | 9-1-2023 | | | | 885,000 | | | | 794,420 | |
| | | | |
San Diego CA RDA Naval Training Center Series A | | | 5.00 | | | | 9-1-2025 | | | | 575,000 | | | | 606,711 | |
| | | | |
San Francisco CA City & County RDA Mission Bay South Redevelopment Project Series A | | | 5.00 | | | | 8-1-2043 | | | | 2,500,000 | | | | 2,746,900 | |
| | | | |
San Francisco CA City & County RDA Tax Transbay Infrastructure Project Third Lien Series B (AGM Insured) | | | 5.00 | | | | 8-1-2046 | | | | 1,500,000 | | | | 1,686,735 | |
| | | | |
San Francisco City & County CA RDA CAB Mission Bay South Redevelopment Project Subordinate Bond Series D 144A(z) | | | 5.28 | | | | 8-1-2026 | | | | 4,000,000 | | | | 2,804,760 | |
The accompanying notes are an integral part of these financial statements.
| | | | |
| 14 | | Wells Fargo California Tax-Free Fund | | Portfolio of investments—December 31, 2018 (unaudited) |
| | | | | | | | | | | | | | | | |
| Security name | | Interest rate | | | Maturity date | | | Principal | | | Value | |
|
| Tax Revenue (continued) | |
| | | | |
San Marcos CA Unified School District Special Tax Community Facilities District #4 (Build America Mutual Assurance Company Insured) | | | 5.00 | % | | | 9-1-2034 | | | $ | 1,710,000 | | | $ | 1,935,275 | |
| | | | |
San Marcos CA Unified School District Special Tax Community Facilities District #5 (Build America Mutual Assurance Company Insured) | | | 5.00 | | | | 9-1-2028 | | | | 1,290,000 | | | | 1,467,981 | |
| | | | |
San Marcos CA Unified School District Special Tax Community Facilities District #5 (Build America Mutual Assurance Company Insured) | | | 5.00 | | | | 9-1-2029 | | | | 1,325,000 | | | | 1,502,550 | |
| | | | |
Santa Ana CA Community Redevelopment Merged Project Area Series A | | | 6.00 | | | | 9-1-2022 | | | | 2,000,000 | | | | 2,183,460 | |
| | | | |
Santa Cruz County CA RDA Live Oak Soquel Community Improvement Project | | | 6.63 | | | | 9-1-2029 | | | | 2,100,000 | | | | 2,168,922 | |
| | | | |
Sonoma CA CDA Successor Agency to Sonoma Redevelopment Project Tax Allocation Bond (National Insured) | | | 5.00 | | | | 6-1-2033 | | | | 1,325,000 | | | | 1,507,439 | |
| | | | |
Successor Agency to the Marina Redevelopment Agency Tax Allocation Bonds Series A | | | 5.00 | | | | 9-1-2033 | | | | 340,000 | | | | 373,857 | |
| | | | |
Successor Agency to the Marina Redevelopment Agency Tax Allocation Bonds Series A | | | 5.00 | | | | 9-1-2038 | | | | 400,000 | | | | 433,776 | |
| | | | |
Successor Agency to the Marina Redevelopment Agency Tax Allocation Bonds Series B | | | 5.00 | | | | 9-1-2033 | | | | 250,000 | | | | 271,935 | |
| | | | |
Successor Agency to the Marina Redevelopment Agency Tax Allocation Bonds Series B | | | 5.00 | | | | 9-1-2038 | | | | 250,000 | | | | 267,580 | |
| | | | |
Tracy Hills CA Improvement Area #1 Community Facilities District#2016-1 Special Tax Bonds Series 2018 | | | 5.00 | | | | 9-1-2048 | | | | 2,750,000 | | | | 2,981,303 | |
| | | | |
Tustin CA Community Facilities District Special Tax#2014-1 Legacy/Standard Pacific Series A | | | 5.00 | | | | 9-1-2040 | | | | 750,000 | | | | 806,145 | |
| | | | |
Tustin CA Community Facilities District Special Tax#2014-1 Legacy/Standard Pacific Series A | | | 5.00 | | | | 9-1-2045 | | | | 1,000,000 | | | | 1,071,810 | |
| | | | |
Union City CA Community RDA Successor Agency to Community Redevelopment Project Tax Allocation Refunding Bond Series A | | | 5.00 | | | | 10-1-2036 | | | | 1,000,000 | | | | 1,127,760 | |
| | | | |
Union City CA Community RDA Successor Agency to Union City Community Redevelopment Project (AGC Insured) | | | 5.25 | | | | 10-1-2033 | | | | 8,000,000 | | | | 8,497,280 | |
| | | | |
Yorba Linda CA RDA CAB Series A (National Insured) (z) | | | 5.52 | | | | 9-1-2019 | | | | 630,000 | | | | 620,871 | |
| | | | |
| | | | | | | | | | | | | | | 121,766,183 | |
| | | | | | | | | | | | | | | | |
|
| Tobacco Revenue: 0.53% | |
| | | | |
Golden State Tobacco Securitization Corporation Tobacco Settlement Refunding BondSeries A-1 | | | 5.00 | | | | 6-1-2028 | | | | 2,000,000 | | | | 2,213,820 | |
| | | | |
Golden State Tobacco Securitization Corporation Tobacco Settlement Refunding BondSeries A-2 | | | 5.00 | | | | 6-1-2047 | | | | 3,000,000 | | | | 2,884,200 | |
| | | | |
| | | | | | | | | | | | | | | 5,098,020 | |
| | | | | | | | | | | | | | | | |
|
| Transportation Revenue: 1.92% | |
| | | | |
Alameda County CA Corridor Transportation Authority Prerefunded Bond CAB Subordinate Lien Series A (Ambac Insured) (z) | | | 6.17 | | | | 10-1-2019 | | | | 2,780,000 | | | | 2,747,001 | |
| | | | |
Alameda County CA Corridor Transportation Authority Unrefunded Bond CAB Subordinate Lien Series A (Ambac Insured) (z) | | | 6.17 | | | | 10-1-2019 | | | | 220,000 | | | | 215,651 | |
| | | | |
Bay Area CA Toll Authority Toll Bridge SeriesS-4 | | | 5.00 | | | | 4-1-2030 | | | | 2,000,000 | | | | 2,270,860 | |
| | | | |
Foothill-Eastern Corridor CA Transportation Agency Subordinate Bond SeriesB-3 | | | 5.50 | | | | 1-15-2053 | | | | 8,000,000 | | | | 8,863,920 | |
| | | | |
San Diego CA RDA Centre City Subordinate Refunding Bond Parking Series B | | | 5.30 | | | | 9-1-2020 | | | | 1,060,000 | | | | 1,063,169 | |
| | | | |
San Francisco CA Municipal Transportation | | | 5.00 | | | | 3-1-2039 | | | | 3,000,000 | | | | 3,348,630 | |
| | | | |
| | | | | | | | | | | | | | | 18,509,231 | |
| | | | | | | | | | | | | | | | |
|
| Utilities Revenue: 4.98% | |
| | | | |
Banning CA Financing Authority Refunding Bond Electric System Project (AGM Insured) | | | 5.00 | | | | 6-1-2037 | | | | 5,000,000 | | | | 5,619,500 | |
| | | | |
Imperial CA Irrigation District Electric System Refunding Bond Series A | | | 5.00 | | | | 11-1-2040 | | | | 3,715,000 | | | | 4,214,668 | |
| | | | |
Imperial CA Irrigation District Electric System Refunding Bond Series A | | | 5.00 | | | | 11-1-2045 | | | | 1,060,000 | | | | 1,198,351 | |
| | | | |
Imperial CA Irrigation District Electric System Refunding Bond Series C | | | 5.00 | | | | 11-1-2038 | | | | 2,500,000 | | | | 2,823,125 | |
The accompanying notes are an integral part of these financial statements.
| | | | | | |
| Portfolio of investments—December 31, 2018 (unaudited) | | Wells Fargo California Tax-Free Fund | | | 15 | |
| | | | | | | | | | | | | | | | |
| Security name | | Interest rate | | | Maturity date | | | Principal | | | Value | |
|
| Utilities Revenue (continued) | |
| | | | |
Los Angeles CA Department of Water and Power Series E | | | 5.00 | % | | | 7-1-2044 | | | $ | 12,475,000 | | | $ | 13,830,159 | |
| | | | |
M-S-R California Energy Authority Gas Series B | | | 7.00 | | | | 11-1-2034 | | | | 4,000,000 | | | | 5,564,440 | |
| | | | |
M-S-R California Energy Authority Gas Series C | | | 6.13 | | | | 11-1-2029 | | | | 1,060,000 | | | | 1,293,603 | |
| | | | |
Modesto CA Irrigation District Financing Authority Series A | | | 5.00 | | | | 10-1-2040 | | | | 3,500,000 | | | | 3,906,280 | |
| | | | |
Northern California Power Agency Public Power Prerefunded Bond (Ambac Insured) | | | 7.50 | | | | 7-1-2023 | | | | 35,000 | | | | 38,490 | |
| | | | |
Redding CA Joint Powers Financing Authority Election System Series A | | | 5.00 | | | | 6-1-2032 | | | | 440,000 | | | | 504,297 | |
| | | | |
Roseville CA Natural Gas Financing Authority | | | 5.00 | | | | 2-15-2025 | | | | 1,930,000 | | | | 2,186,825 | |
| | | | |
Southern California Public Power Authority Natural Gas Project #1 Series A | | | 5.25 | | | | 11-1-2025 | | | | 1,000,000 | | | | 1,133,320 | |
| | | | |
Turlock CA Irrigation District Refunding Bond Subordinate First Priority | | | 5.50 | | | | 1-1-2041 | | | | 2,000,000 | | | | 2,122,860 | |
| | | | |
Walnut CA Energy Center Authority Series A | | | 5.00 | | | | 1-1-2034 | | | | 3,115,000 | | | | 3,521,009 | |
| | | | |
| | | | | | | | | | | | | | | 47,956,927 | |
| | | | | | | | | | | | | | | | |
|
| Water & Sewer Revenue: 3.18% | |
| | | | |
Adelanto CA Public Utility Authority Refunding Bond (AGM Insured) | | | 5.00 | | | | 7-1-2039 | | | | 2,000,000 | | | | 2,277,080 | |
| | | | |
Bay Area CA Water Supply & Conservation Agency Series A | | | 5.00 | | | | 10-1-2034 | | | | 6,000,000 | | | | 6,625,740 | |
| | | | |
California Statewide CDA Water & Wastewater Pooled Financing Program Series B (AGM Insured) | | | 5.25 | | | | 10-1-2027 | | | | 1,040,000 | | | | 1,043,058 | |
| | | | |
El Dorado CA Irrigation District Refunding Bond Series A (AGM Insured) | | | 5.25 | | | | 3-1-2039 | | | | 2,000,000 | | | | 2,260,560 | |
| | | | |
Florin CA Resource Conservation Refunding Bond Second Senior Lien Series A (National Insured) | | | 5.00 | | | | 9-1-2032 | | | | 2,000,000 | | | | 2,241,040 | |
| | | | |
Merced CA Irrigation District Water & Hydroelectric System Series A (AGM Insured) | | | 5.00 | | | | 10-1-2038 | | | | 4,000,000 | | | | 4,457,040 | |
| | | | |
Pico Rivera CA Water Authority Series A (National Insured) | | | 5.50 | | | | 5-1-2019 | | | | 450,000 | | | | 454,923 | |
| | | | |
Pico Rivera CA Water Authority Series A | | | 6.25 | | | | 12-1-2032 | | | | 4,015,000 | | | | 4,052,540 | |
| | | | |
San Buenaventura CA PFFA Series B | | | 5.00 | | | | 7-1-2042 | | | | 4,000,000 | | | | 4,350,800 | |
| | | | |
Tulare CA Sewer Refunding Bond (AGM Insured) | | | 5.00 | | | | 11-15-2041 | | | | 1,500,000 | | | | 1,689,825 | |
| | | | |
Vallejo CA Refunding Bond | | | 5.25 | | | | 5-1-2031 | | | | 1,000,000 | | | | 1,114,710 | |
| | | | |
| | | | | | | | | | | | | | | 30,567,316 | |
| | | | | | | | | | | | | | | | |
| | | | |
| | | | | | | | | | | | | | | 916,955,268 | |
| | | | | | | | | | | | | | | | |
|
Guam: 0.76% | |
|
| Airport Revenue: 0.14% | |
| | | | |
Guam Port Authority AMT Series A | | | 5.00 | | | | 7-1-2048 | | | | 1,235,000 | | | | 1,342,951 | |
| | | | | | | | | | | | | | | | |
|
| Tax Revenue: 0.11% | |
| | | | |
Guam Government Business Privilege Tax Series A | | | 5.00 | | | | 1-1-2031 | | | | 1,000,000 | | | | 1,031,090 | |
| | | | | | | | | | | | | | | | |
|
| Water & Sewer Revenue: 0.51% | |
| | | | |
Guam Government Waterworks Authority | | | 5.25 | | | | 7-1-2033 | | | | 1,500,000 | | | | 1,594,185 | |
| | | | |
Guam Government Waterworks Authority | | | 5.50 | | | | 7-1-2043 | | | | 3,125,000 | | | | 3,329,312 | |
| | | | |
| | | | | | | | | | | | | | | 4,923,497 | |
| | | | | | | | | | | | | | | | |
| | | | |
| | | | | | | | | | | | | | | 7,297,538 | |
| | | | | | | | | | | | | | | | |
|
Illinois: 1.22% | |
|
| Miscellaneous Revenue: 1.11% | |
| | | | |
Illinois Series D | | | 5.00 | | | | 11-1-2025 | | | | 10,000,000 | | | | 10,690,400 | |
| | | | | | | | | | | | | | | | |
The accompanying notes are an integral part of these financial statements.
| | | | |
| 16 | | Wells Fargo California Tax-Free Fund | | Portfolio of investments—December 31, 2018 (unaudited) |
| | | | | | | | | | | | | | | | |
| Security name | | Interest rate | | | Maturity date | | | Principal | | | Value | |
|
| Tax Revenue: 0.11% | |
| | | | |
Metropolitan Pier & Exposition Authority McCormick Place Expansion Project Series A | | | 5.00 | % | | | 6-15-2057 | | | $ | 1,000,000 | | | $ | 1,023,160 | |
| | | | | | | | | | | | | | | | |
| | | | |
| | | | | | | | | | | | | | | 11,713,560 | |
| | | | | | | | | | | | | | | | |
|
New York: 0.58% | |
|
| Industrial Development Revenue: 0.58% | |
| | | | |
New York Transportation Development Corporation Special Facilities Revenue Delta Air Lines Incorporated LaGuardia Airport Terminals C&D Redevelopment | | | 5.00 | | | | 1-1-2026 | | | | 5,000,000 | | | | 5,620,000 | |
| | | | | | | | | | | | | | | | |
|
Texas: 0.21% | |
|
| Resource Recovery Revenue: 0.21% | |
| | | | |
Port Arthur TX Navigation District Jefferson County Environmental Facilities Motiva Enterprises LLC Project Series A ø | | | 2.05 | | | | 4-1-2040 | | | | 2,000,000 | | | | 2,000,000 | |
| | | | | | | | | | | | | | | | |
| |
Total Municipal Obligations (Cost $890,286,245) | | | | 943,586,366 | |
| | | | | | | | | | | | | | | | |
|
Other: 0.52% | |
| | | | |
Nuveen CaliforniaAMT-Free Quality Municipal Income Fund Preferred Shares Series A 144A§ øø | | | 2.01 | | | | 10-1-2047 | | | | 5,000,000 | | | | 5,000,000 | |
| | | | | | | | | | | | | | | | |
| |
Total Other (Cost $5,000,000) | | | | 5,000,000 | |
| | | | | | | | | | | | | | | | |
| | | | |
| | | Yield | | | | | | Shares | | | | |
| Short-Term Investments: 0.30% | |
|
| Investment Companies: 0.30% | |
| | | | |
Wells Fargo Municipal Cash Management Money Market Fund Institutional Class (l)(u) | | | 1.65 | | | | | | | | 2,883,764 | | | | 2,884,918 | |
| | | | | | | | | | | | | | | | |
| |
Total Short-Term Investments (Cost $2,884,918) | | | | 2,884,918 | |
| | | | | | | | | | | | | | | | |
| | | | | | | | |
| Total investments in securities (Cost $898,171,163) | | | 98.87 | % | | | 951,471,284 | |
| | |
Other assets and liabilities, net | | | 1.13 | | | | 10,891,655 | |
| | | | | | | | |
| Total net assets | | | 100.00 | % | | $ | 962,362,939 | |
| | | | | | | | |
| 144A | The security may be resold in transactions exempt from registration, normally to qualified institutional buyers, pursuant to Rule 144A under the Securities Act of 1933. |
| (z) | Zero coupon security. The rate represents the purchase yield to maturity. |
| ± | Variable rate investment. The rate shown is the rate in effect at period end. |
| ø | Variable rate demand notes are subject to a demand feature which reduces the effective maturity. The maturity date shown represents the final maturity date of the security. The interest rate is determined and reset by the issuer daily, weekly, or monthly depending upon the terms of the security. The rate shown is the rate in effect at period end. |
| § | The security is subject to a demand feature which reduces the effective maturity. |
| øø | The interest rate is determined and reset by the issuer periodically depending upon the terms of the security. The rate shown is the rate in effect at period end. |
| (l) | The issuer of the security is an affiliated person of the Fund as defined in the Investment Company Act of 1940. |
| (u) | The rate represents the7-day annualized yield at period end. |
The accompanying notes are an integral part of these financial statements.
| | | | | | |
| Portfolio of investments—December 31, 2018 (unaudited) | | Wells Fargo California Tax-Free Fund | | | 17 | |
Abbreviations:
| AGC | Assured Guaranty Corporation |
| AGM | Assured Guaranty Municipal |
| Ambac | Ambac Financial Group Incorporated |
| AMT | Alternative minimum tax |
| CAB | Capital appreciation bond |
| CDA | Community Development Authority |
| FGIC | Financial Guaranty Insurance Corporation |
| GNMA | Government National Mortgage Association |
| HFFA | Health Facilities Financing Authority |
| LIBOR | London Interbank Offered Rate |
| National | National Public Finance Guarantee Corporation |
| PCFA | Pollution Control Financing Authority |
| PFA | Public Finance Authority |
| PFFA | Public Facilities Financing Authority |
| RDA | Redevelopment Authority |
Investments in Affiliates
An affiliated investment is an investment in which the Fund owns at least 5% of the outstanding voting shares of the issuer or as a result of other relationships, such as the Fund and the issuer having the same investment manager. Transactions with issuers that were either affiliated persons of the Fund at the beginning of the period or the end of the period were as follows:
| | | | | | | | | | | | | | | | | | | | | | | | | | | | | | | | | | | | |
| | | Shares,
beginning of
period | | | Shares
purchased | | | Shares
sold | | | Shares,
end of
period | | | Net
realized
gains
(losses) | | | Net
change in
unrealized
gains
(losses) | | | Income
from
affiliated
securities | | | Value,
end
of period | | | % of
net
assets | |
Short-Term Investments | | | | | | | | | | | | | | | | | | | | | | | | | | | | | | | | | | | | |
Investment Companies | | | | | | | | | | | | | | | | | | | | | | | | | | | | | | | | | | | | |
Wells Fargo Municipal Cash Management Money Market Fund Institutional Class | | | 896,900 | | | | 78,421,183 | | | | 76,434,319 | | | | 2,883,764 | | | $ | 0 | | | $ | 0 | | | $ | 17,379 | | | $ | 2,884,918 | | | | 0.30 | % |
The accompanying notes are an integral part of these financial statements.
| | | | |
| 18 | | Wells Fargo California Tax-Free Fund | | Statement of assets and liabilities—December 31, 2018 (unaudited) |
| | | | |
| | | | |
| |
Assets | | | | |
Investments in unaffiliated securities, at value (cost $895,286,245) | | $ | 948,586,366 | |
Investments in affiliated securities, at value (cost $2,884,918) | | | 2,884,918 | |
Cash | | | 101,502 | |
Receivable for Fund shares sold | | | 1,405,287 | |
Receivable for interest | | | 12,693,180 | |
Prepaid expenses and other assets | | | 4,875 | |
| | | | |
Total assets | | | 965,676,128 | |
| | | | |
| |
Liabilities | | | | |
Payable for Fund shares redeemed | | | 2,061,632 | |
Dividends payable | | | 622,967 | |
Management fee payable | | | 243,762 | |
Administration fees payable | | | 104,537 | |
Distribution fee payable | | | 27,708 | |
Trustees’ fees and expenses payable | | | 527 | |
Accrued expenses and other liabilities | | | 252,056 | |
| | | | |
Total liabilities | | | 3,313,189 | |
| | | | |
Total net assets | | $ | 962,362,939 | |
| | | | |
| |
NET ASSETS CONSIST OF | | | | |
Paid-in capital | | $ | 931,598,399 | |
Total distributable earnings | | | 30,764,540 | |
| | | | |
Total net assets | | $ | 962,362,939 | |
| | | | |
| |
COMPUTATION OF NET ASSET VALUE AND OFFERING PRICE PER SHARE | | | | |
Net assets – Class A | | $ | 432,883,807 | |
Shares outstanding – Class A1 | | | 37,470,435 | |
Net asset value per share – Class A | | | $11.55 | |
Maximum offering price per share – Class A2 | | | $12.09 | |
Net assets – Class C | | $ | 42,083,868 | |
Shares outstanding – Class C1 | | | 3,572,140 | |
Net asset value per share – Class C | | | $11.78 | |
Net assets – Administrator Class | | $ | 226,556,605 | |
Shares outstanding – Administrator Class1 | | | 19,573,414 | |
Net asset value per share – Administrator Class | | | $11.57 | |
Net assets – Institutional Class | | $ | 260,838,659 | |
Shares outstanding – Institutional Class1 | | | 22,533,934 | |
Net asset value per share – Institutional Class | | | $11.58 | |
| 1 | The Fund has an unlimited number of authorized shares. |
| 2 | Maximum offering price is computed as 100/95.50 of net asset value. On investments of $50,000 or more, the offering price is reduced. |
The accompanying notes are an integral part of these financial statements.
| | | | | | |
| Statement of operations—six months ended December 31, 2018 (unaudited) | | Wells Fargo California Tax-Free Fund | | | 19 | |
| | | | |
| | | | |
| |
Investment income | | | | |
Interest | | $ | 19,605,730 | |
Income from affiliated securities | | | 17,379 | |
| | | | |
Total investment income | | | 19,623,109 | |
| | | | |
| |
Expenses | | | | |
Management fee | | | 1,907,847 | |
Administration fees | | | | |
Class A | | | 359,858 | |
Class C | | | 35,889 | |
Administrator Class | | | 104,692 | |
Institutional Class | | | 111,941 | |
Shareholder servicing fees | | | | |
Class A | | | 562,278 | |
Class C | | | 56,076 | |
Administrator Class | | | 260,374 | |
Distribution fee | | | | |
Class C | | | 168,229 | |
Custody and accounting fees | | | 10,190 | |
Professional fees | | | 35,646 | |
Registration fees | | | 52,422 | |
Shareholder report expenses | | | 37,753 | |
Trustees’ fees and expenses | | | 13,320 | |
Other fees and expenses | | | 15,371 | |
| | | | |
Total expenses | | | 3,731,886 | |
Less: Fee waivers and/or expense reimbursements | | | (461,143 | ) |
| | | | |
Net expenses | | | 3,270,743 | |
| | | | |
Net investment income | | | 16,352,366 | |
| | | | |
| |
REALIZED AND UNREALIZED GAINS (LOSSES) ON INVESTMENTS | | | | |
Net realized losses on investments | | | (1,101,373 | ) |
Net change in unrealized gains (losses) on investments | | | (6,798,518 | ) |
| | | | |
Net realized and unrealized gains (losses) on investments | | | (7,899,891 | ) |
| | | | |
Net increase in net assets resulting from operations | | $ | 8,452,475 | |
| | | | |
The accompanying notes are an integral part of these financial statements.
| | | | |
| 20 | | Wells Fargo California Tax-Free Fund | | Statement of changes in net assets |
| | | | | | | | | | | | | | | | |
| | | Six months ended
December 31, 2018 (unaudited) | | | Year ended
June 30, 2018¹ | |
| | | | |
Operations | | | | | | | | | | | | | | | | |
Net investment income | | | | | | $ | 16,352,366 | | | | | | | $ | 32,756,804 | |
Net realized losses on investments | | | | | | | (1,101,373 | ) | | | | | | | (397,135 | ) |
Net change in unrealized gains (losses) on investments | | | | | | | (6,798,518 | ) | | | | | | | (15,921,703 | ) |
| | | | |
Net increase in net assets resulting from operations | | | | | | | 8,452,475 | | | | | | | | 16,437,966 | |
| | | | |
| | | | |
Distributions to shareholders from net investment income and net realized gains | | | | | | | | | | | | | | | | |
Class A | | | | | | | (7,276,439 | ) | | | | | | | (14,178,372 | ) |
Class C | | | | | | | (558,334 | ) | | | | | | | (1,262,333 | ) |
Administrator Class | | | | | | | (3,609,650 | ) | | | | | | | (6,997,042 | ) |
Institutional Class | | | | | | | (4,908,743 | ) | | | | | | | (10,318,698 | ) |
| | | | |
Total distributions to shareholders | | | | | | | (16,353,166 | ) | | | | | | | (32,756,445 | ) |
| | | | |
| | | | |
Capital share transactions | | | Shares | | | | | | | | Shares | | | | | |
Proceeds from shares sold | | | | | | | | | | | | | | | | |
Class A | | | 3,979,153 | | | | 46,109,600 | | | | 5,412,756 | | | | 63,532,063 | |
Class C | | | 102,823 | | | | 1,211,501 | | | | 207,470 | | | | 2,494,341 | |
Administrator Class | | | 4,833,580 | | | | 55,726,406 | | | | 3,150,137 | | | | 37,468,056 | |
Institutional Class | | | 3,715,343 | | | | 42,988,326 | | | | 8,132,600 | | | | 95,793,566 | |
| | | | |
| | | | | | | 146,035,833 | | | | | | | | 199,289,026 | |
| | | | |
Reinvestment of distributions | | | | | | | | | | | | | | | | |
Class A | | | 588,908 | | | | 6,790,940 | | | | 1,121,916 | | | | 13,180,807 | |
Class C | | | 44,431 | | | | 522,611 | | | | 98,749 | | | | 1,183,379 | |
Administrator Class | | | 303,471 | | | | 3,505,177 | | | | 579,082 | | | | 6,823,267 | |
Institutional Class | | | 163,957 | | | | 1,894,716 | | | | 368,770 | | | | 4,342,226 | |
| | | | |
| | | | | | | 12,713,444 | | | | | | | | 25,529,679 | |
| | | | |
Payment for shares redeemed | | | | | | | | | | | | | | | | |
Class A | | | (5,165,121 | ) | | | (59,329,086 | ) | | | (8,403,699 | ) | | | (98,926,917 | ) |
Class C | | | (603,945 | ) | | | (7,103,795 | ) | | | (1,060,979 | ) | | | (12,741,782 | ) |
Administrator Class | | | (1,563,388 | ) | | | (17,990,624 | ) | | | (5,458,094 | ) | | | (64,458,360 | ) |
Institutional Class | | | (6,002,213 | ) | | | (69,299,978 | ) | | | (9,927,151 | ) | | | (116,905,096 | ) |
| | | | |
| | | | | | | (153,723,483 | ) | | | | | | | (293,032,155 | ) |
| | | | |
Net increase (decrease) in net assets resulting from capital share transactions | | | | | | | 5,025,794 | | | | | | | | (68,213,450 | ) |
| | | | |
Total decrease in net assets | | | | | | | (2,874,897 | ) | | | | | | | (84,531,929 | ) |
| | | | |
| | | | |
Net assets | | | | | | | | | | | | | | | | |
Beginning of period | | | | | | | 965,237,836 | | | | | | | | 1,049,769,765 | |
| | | | |
End of period | | | | | | $ | 962,362,939 | | | | | | | $ | 965,237,836 | |
| | | | |
| ¹ | Effective for all filings after November 4, 2018, the SEC prospectively eliminated the requirement to parenthetically disclose undistributed net investment income at the end of the period and permitted the aggregation of distributions, with the exception of tax basis returns of capital. Undistributed net investment income at June 30, 2018 was $59,885. The disaggregated distributions information for the year ended June 30, 2018 is included in Note 7,Distributions to Shareholders,in the notes to the financial statements. |
The accompanying notes are an integral part of these financial statements.
| | | | | | |
| Financial highlights | | Wells Fargo California Tax-Free Fund | | | 21 | |
(For a share outstanding throughout each period)
| | | | | | | | | | | | | | | | | | | | | | | | |
| | | Six months ended
December 31, 2018 (unaudited) | | | Year ended June 30 | |
| CLASS A | | 2018 | | | 2017 | | | 2016 | | | 2015 | | | 2014 | |
Net asset value, beginning of period | | | $11.64 | | | | $11.83 | | | | $12.45 | | | | $11.79 | | | | $11.73 | | | | $11.21 | |
Net investment income | | | 0.19 | | | | 0.37 | | | | 0.36 | | | | 0.36 | | | | 0.38 | | | | 0.42 | |
Net realized and unrealized gains (losses) on investments | | | (0.09 | ) | | | (0.19 | ) | | | (0.62 | ) | | | 0.66 | | | | 0.06 | | | | 0.52 | |
| | | | | | | | | | | | | | | | | | | | | | | | |
Total from investment operations | | | 0.10 | | | | 0.18 | | | | (0.26 | ) | | | 1.02 | | | | 0.44 | | | | 0.94 | |
Distributions to shareholders from | | | | | | | | | | | | | | | | | | | | | | | | |
Net investment income | | | (0.19 | ) | | | (0.37 | ) | | | (0.36 | ) | | | (0.36 | ) | | | (0.38 | ) | | | (0.42 | ) |
Net asset value, end of period | | | $11.55 | | | | $11.64 | | | | $11.83 | | | | $12.45 | | | | $11.79 | | | | $11.73 | |
Total return1 | | | 0.86 | % | | | 1.55 | % | | | (2.09 | )% | | | 8.77 | % | | | 3.74 | % | | | 8.58 | % |
Ratios to average net assets (annualized) | | | | | | | | | | | | | | | | | | | | | | | | |
Gross expenses | | | 0.83 | % | | | 0.83 | % | | | 0.82 | % | | | 0.82 | % | | | 0.83 | % | | | 0.83 | % |
Net expenses | | | 0.75 | % | | | 0.75 | % | | | 0.75 | % | | | 0.75 | % | | | 0.75 | % | | | 0.75 | % |
Net investment income | | | 3.24 | % | | | 3.15 | % | | | 2.99 | % | | | 2.96 | % | | | 3.17 | % | | | 3.71 | % |
Supplemental data | | | | | | | | | | | | | | | | | | | | | | | | |
Portfolio turnover rate | | | 5 | % | | | 33 | % | | | 48 | % | | | 17 | % | | | 30 | % | | | 41 | % |
Net assets, end of period (000s omitted) | | | $432,884 | | | | $443,165 | | | | $472,584 | | | | $528,238 | | | | $470,368 | | | | $466,411 | |
| 1 | Total return calculations do not include any sales charges. Returns for periods of less than one year are not annualized. |
The accompanying notes are an integral part of these financial statements.
| | | | |
| 22 | | Wells Fargo California Tax-Free Fund | | Financial highlights |
(For a share outstanding throughout each period)
| | | | | | | | | | | | | | | | | | | | | | | | |
| | | Six months ended
December 31, 2018 (unaudited) | | | Year ended June 30 | |
| CLASS C | | 2018 | | | 2017 | | | 2016 | | | 2015 | | | 2014 | |
Net asset value, beginning of period | | | $11.87 | | | | $12.07 | | | | $12.70 | | | | $12.02 | | | | $11.96 | | | | $11.43 | |
Net investment income | | | 0.15 | | | | 0.29 | | | | 0.27 | | | | 0.27 | | | | 0.29 | | | | 0.34 | |
Net realized and unrealized gains (losses) on investments | | | (0.09 | ) | | | (0.20 | ) | | | (0.63 | ) | | | 0.68 | | | | 0.06 | | | | 0.53 | |
| | | | | | | | | | | | | | | | | | | | | | | | |
Total from investment operations | | | 0.06 | | | | 0.09 | | | | (0.36 | ) | | | 0.95 | | | | 0.35 | | | | 0.87 | |
Distributions to shareholders from | | | | | | | | | | | | | | | | | | | | | | | | |
Net investment income | | | (0.15 | ) | | | (0.29 | ) | | | (0.27 | ) | | | (0.27 | ) | | | (0.29 | ) | | | (0.34 | ) |
Net asset value, end of period | | | $11.78 | | | | $11.87 | | | | $12.07 | | | | $12.70 | | | | $12.02 | | | | $11.96 | |
Total return1 | | | 0.50 | % | | | 0.74 | % | | | (2.80 | )% | | | 8.02 | % | | | 2.96 | % | | | 7.77 | % |
Ratios to average net assets (annualized) | | | | | | | | | | | | | | | | | | | | | | | | |
Gross expenses | | | 1.58 | % | | | 1.58 | % | | | 1.57 | % | | | 1.57 | % | | | 1.58 | % | | | 1.58 | % |
Net expenses | | | 1.50 | % | | | 1.50 | % | | | 1.50 | % | | | 1.50 | % | | | 1.50 | % | | | 1.50 | % |
Net investment income | | | 2.49 | % | | | 2.40 | % | | | 2.24 | % | | | 2.21 | % | | | 2.42 | % | | | 2.96 | % |
Supplemental data | | | | | | | | | | | | | | | | | | | | | | | | |
Portfolio turnover rate | | | 5 | % | | | 33 | % | | | 48 | % | | | 17 | % | | | 30 | % | | | 41 | % |
Net assets, end of period (000s omitted) | | | $42,084 | | | | $47,831 | | | | $57,727 | | | | $66,427 | | | | $50,787 | | | | $45,934 | |
| 1 | Total return calculations do not include any sales charges. Returns for periods of less than one year are not annualized. |
The accompanying notes are an integral part of these financial statements.
| | | | | | |
| Financial highlights | | Wells Fargo California Tax-Free Fund | | | 23 | |
(For a share outstanding throughout each period)
| | | | | | | | | | | | | | | | | | | | | | | | |
| | | Six months ended
December 31, 2018 (unaudited) | | | Year ended June 30 | |
| ADMINISTRATOR CLASS | | 2018 | | | 2017 | | | 2016 | | | 2015 | | | 2014 | |
Net asset value, beginning of period | | | $11.66 | | | | $11.86 | | | | $12.48 | | | | $11.81 | | | | $11.75 | | | | $11.23 | |
Net investment income | | | 0.20 | | | | 0.39 | | | | 0.38 | | | | 0.38 | | | | 0.40 | | | | 0.44 | |
Net realized and unrealized gains (losses) on investments | | | (0.09 | ) | | | (0.20 | ) | | | (0.62 | ) | | | 0.67 | | | | 0.06 | | | | 0.52 | |
| | | | | | | | | | | | | | | | | | | | | | | | |
Total from investment operations | | | 0.11 | | | | 0.19 | | | | (0.24 | ) | | | 1.05 | | | | 0.46 | | | | 0.96 | |
Distributions to shareholders from | | | | | | | | | | | | | | | | | | | | | | | | |
Net investment income | | | (0.20 | ) | | | (0.39 | ) | | | (0.38 | ) | | | (0.38 | ) | | | (0.40 | ) | | | (0.44 | ) |
Net asset value, end of period | | | $11.57 | | | | $11.66 | | | | $11.86 | | | | $12.48 | | | | $11.81 | | | | $11.75 | |
Total return1 | | | 0.96 | % | | | 1.67 | % | | | (1.88 | )% | | | 9.06 | % | | | 3.95 | % | | | 8.79 | % |
Ratios to average net assets (annualized) | | | | | | | | | | | | | | | | | | | | | | | | |
Gross expenses | | | 0.77 | % | | | 0.77 | % | | | 0.76 | % | | | 0.76 | % | | | 0.77 | % | | | 0.77 | % |
Net expenses | | | 0.55 | % | | | 0.55 | % | | | 0.55 | % | | | 0.55 | % | | | 0.55 | % | | | 0.55 | % |
Net investment income | | | 3.45 | % | | | 3.34 | % | | | 3.16 | % | | | 3.16 | % | | | 3.39 | % | | | 3.91 | % |
Supplemental data | | | | | | | | | | | | | | | | | | | | | | | | |
Portfolio turnover rate | | | 5 | % | | | 33 | % | | | 48 | % | | | 17 | % | | | 30 | % | | | 41 | % |
Net assets, end of period (000s omitted) | | | $226,557 | | | | $186,626 | | | | $210,209 | | | | $344,090 | | | | $210,265 | | | | $273,026 | |
| 1 | Returns for periods of less than one year are not annualized. |
The accompanying notes are an integral part of these financial statements.
| | | | |
| 24 | | Wells Fargo California Tax-Free Fund | | Financial highlights |
(For a share outstanding throughout each period)
| | | | | | | | | | | | | | | | | | | | |
| | | Six months ended
December 31, 2018 (unaudited) | | | Year ended June 30 | |
| INSTITUTIONAL CLASS | | 2018 | | | 2017 | | | 2016 | | | 20151 | |
Net asset value, beginning of period | | | $11.66 | | | | $11.86 | | | | $12.48 | | | | $11.81 | | | | $11.99 | |
Net investment income | | | 0.20 | | | | 0.40 | | | | 0.39 | | | | 0.39 | | | | 0.27 | |
Net realized and unrealized gains (losses) on investments | | | (0.07 | ) | | | (0.20 | ) | | | (0.62 | ) | | | 0.67 | | | | (0.18 | ) |
| | | | | | | | | | | | | | | | | | | | |
Total from investment operations | | | 0.13 | | | | 0.20 | | | | (0.23 | ) | | | 1.06 | | | | 0.09 | |
Distributions to shareholders from | | | | | | | | | | | | | | | | | | | | |
Net investment income | | | (0.21 | ) | | | (0.40 | ) | | | (0.39 | ) | | | (0.39 | ) | | | (0.27 | ) |
Net asset value, end of period | | | $11.58 | | | | $11.66 | | | | $11.86 | | | | $12.48 | | | | $11.81 | |
Total return2 | | | 1.09 | % | | | 1.74 | % | | | (1.81 | )% | | | 9.14 | % | | | 0.72 | % |
Ratios to average net assets (annualized) | | | | | | | | | | | | | | | | | | | | |
Gross expenses | | | 0.50 | % | | | 0.50 | % | | | 0.49 | % | | | 0.49 | % | | | 0.50 | % |
Net expenses | | | 0.48 | % | | | 0.48 | % | | | 0.48 | % | | | 0.48 | % | | | 0.48 | % |
Net investment income | | | 3.51 | % | | | 3.42 | % | | | 3.28 | % | | | 3.24 | % | | | 3.35 | % |
Supplemental data | | | | | | | | | | | | | | | | | | | | |
Portfolio turnover rate | | | 5 | % | | | 33 | % | | | 48 | % | | | 17 | % | | | 30 | % |
Net assets, end of period (000s omitted) | | | $260,839 | | | | $287,616 | | | | $309,253 | | | | $193,154 | | | | $149,368 | |
| 1 | For the period from October 31, 2014 (commencement of class operations) to June 30, 2015 |
| 2 | Returns for periods of less than one year are not annualized. |
The accompanying notes are an integral part of these financial statements.
| | | | | | |
| Notes to financial statements (unaudited) | | Wells Fargo California Tax-Free Fund | | | 25 | |
1. ORGANIZATION
Wells Fargo Funds Trust (the “Trust”), a Delaware statutory trust organized on March 10, 1999, is anopen-end management investment company registered under the Investment Company Act of 1940, as amended (the “1940 Act”). As an investment company, the Trust follows the accounting and reporting guidance in Financial Accounting Standards Board (“FASB”)Accounting Standards Codification Topic 946, Financial Services – Investment Companies. These financial statements report on the Wells Fargo CaliforniaTax-Free Fund (the “Fund”) which is anon-diversified series of the Trust.
2. SIGNIFICANT ACCOUNTING POLICIES
The following significant accounting policies, which are consistently followed in the preparation of the financial statements of the Fund, are in conformity with U.S. generally accepted accounting principles which require management to make estimates and assumptions that affect the reported amounts of assets and liabilities, disclosure of contingent assets and liabilities at the date of the financial statements, and the reported amounts of revenues and expenses during the reporting period. Actual results could differ from those estimates.
Securities valuation
All investments are valued each business day as of the close of regular trading on the New York Stock Exchange (generally 4 p.m. Eastern Time), although the Fund may deviate from this calculation time under unusual or unexpected circumstances.
Debt securities are valued at the evaluated bid price provided by an independent pricing service (e.g. taking into account various factors, including yields, maturities, or credit ratings) or, if a reliable price is not available, the quoted bid price from an independent broker-dealer.
Investments in registeredopen-end investment companies are valued at net asset value.
Investments which are not valued using any of the methods discussed above are valued at their fair value, as determined in good faith by the Board of Trustees of the Fund. The Board of Trustees has established a Valuation Committee comprised of the Trustees and has delegated to it the authority to take any actions regarding the valuation of portfolio securities that the Valuation Committee deems necessary or appropriate, including determining the fair value of portfolio securities, unless the determination has been delegated to the Wells Fargo Asset Management Pricing Committee at Wells Fargo Funds Management, LLC (“Funds Management”). The Board of Trustees retains the authority to make or ratify any valuation decisions or approve any changes to the Valuation Procedures as it deems appropriate. On a quarterly basis, the Board of Trustees receives reports on any valuation actions taken by the Valuation Committee or the Wells Fargo Asset Management Pricing Committee which may include items for ratification.
When-issued transactions
The Fund may purchase securities on a forward commitment or when-issued basis. The Fund records a when-issued transaction on the trade date and will segregate assets in an amount at least equal in value to the Fund’s commitment to purchase when-issued securities. Securities purchased on a when-issued basis aremarked-to-market daily and the Fund begins earning interest on the settlement date. Losses may arise due to changes in the market value of the underlying securities or if the counterparty does not perform under the contract.
Security transactions and income recognition
Securities transactions are recorded on a trade date basis. Realized gains or losses are recorded on the basis of identified cost.
Interest income is accrued daily and bond discounts are accreted and premiums are amortized daily. To the extent debt obligations are placed onnon-accrual status, any related interest income may be reduced by writing off interest receivables when the collection of all or a portion of interest has been determined to be doubtful based on consistently applied procedures and the fair value has decreased. If the issuer subsequently resumes interest payments or when the collectability of interest is reasonably assured, the debt obligation is removed fromnon-accrual status.
Distributions to shareholders
Distributions to shareholders from net investment income are declared daily and paid monthly. Distributions from net realized gains, if any, are recorded on theex-dividend date and paid at least annually. Such distributions are determined in accordance with income tax regulations and may differ from U.S. generally accepted accounting principles. Dividend sources are estimated at the time of declaration. The tax character of distributions is determined as of the Fund’s fiscal year end. Therefore, a portion of the Fund’s distributions made prior to the Fund’s fiscal year end may be categorized as a tax return of capital at year end.
| | | | |
| 26 | | Wells Fargo California Tax-Free Fund | | Notes to financial statements (unaudited) |
Federal and other taxes
The Fund intends to continue to qualify as a regulated investment company by distributing substantially all of its investment company taxable andtax-exempt income and any net realized capital gains (after reduction for capital loss carryforwards) sufficient to relieve it from all, or substantially all, federal income taxes. Accordingly, no provision for federal income taxes was required.
The Fund’s income and federal excise tax returns and all financial records supporting those returns for the prior three fiscal years are subject to examination by the federal and Delaware revenue authorities. Management has analyzed the Fund’s tax positions taken on federal, state, and foreign tax returns for all open tax years and does not believe that there are any uncertain tax positions that require recognition of a tax liability.
As of December 31, 2018, the aggregate cost of all investments for federal income tax purposes was $898,042,943 and the unrealized gains (losses) consisted of:
| | | | |
| |
Gross unrealized gains | | $ | 54,955,650 | |
| |
Gross unrealized losses | | | (1,527,309 | ) |
| |
Net unrealized gains | | $ | 53,428,341 | |
As of June 30, 2018, the Fund had capital loss carryforwards which consisted of $20,089,647 in short-term capital losses.
As of June 30, 2018, the Fund had current year deferred post-October capital losses consisting of $1,403,646 in short-term losses which was recognized on the first day of the current fiscal year.
Class allocations
The separate classes of shares offered by the Fund differ principally in applicable sales charges, distribution, shareholder servicing, and administration fees. Class specific expenses are charged directly to that share class. Investment income, common expenses, and realized and unrealized gains (losses) on investments are allocated daily to each class of shares based on the relative proportion of net assets of each class.
3. FAIR VALUATION MEASUREMENTS
Fair value measurements of investments are determined within a framework that has established a fair value hierarchy based upon the various data inputs utilized in determining the value of the Fund’s investments. The three-level hierarchy gives the highest priority to unadjusted quoted prices in active markets for identical assets or liabilities (Level 1) and the lowest priority to unobservable inputs (Level 3). The Fund’s investments are classified within the fair value hierarchy based on the lowest level of input that is significant to the fair value measurement. The inputs are summarized into three broad levels as follows:
| ∎ | | Level 1 – quoted prices in active markets for identical securities |
| ∎ | | Level 2 – other significant observable inputs (including quoted prices for similar securities, interest rates, prepayment speeds, credit risk, etc.) |
| ∎ | | Level 3 – significant unobservable inputs (including the Fund’s own assumptions in determining the fair value of investments) |
The inputs or methodologies used for valuing investments in securities are not necessarily an indication of the risk associated with investing in those securities.
| | | | | | |
| Notes to financial statements (unaudited) | | Wells Fargo California Tax-Free Fund | | | 27 | |
The following is a summary of the inputs used in valuing the Fund’s assets and liabilities as of December 31, 2018:
| | | | | | | | | | | | | | | | |
| | | | |
| | | Quoted prices (Level 1) | | | Other significant
observable inputs (Level 2) | | | Significant
unobservable inputs (Level 3) | | | Total | |
| | | | |
Assets | | | | | | | | | | | | | | | | |
Investments in: | | | | | | | | | | | | | | | | |
| | | | |
Municipal obligations | | $ | 0 | | | $ | 943,586,366 | | | $ | 0 | | | $ | 943,586,366 | |
| | | | |
Other | | | 0 | | | | 5,000,000 | | | | 0 | | | | 5,000,000 | |
| | | | |
Short-term investments | | | | | | | | | | | | | | | | |
| | | | |
Investment companies | | | 2,884,918 | | | | 0 | | | | 0 | | | | 2,884,918 | |
| | | | |
Total assets | | $ | 2,884,918 | | | $ | 948,586,366 | | | $ | 0 | | | $ | 951,471,284 | |
Additional sector, industry or geographic detail is included in the Portfolio of Investments.
At December 31, 2018, the Fund did not have any transfers into/out of Level 3.
4. TRANSACTIONS WITH AFFILIATES
Management fee
Funds Management, an indirect wholly owned subsidiary of Wells Fargo & Company (“Wells Fargo”), is the manager of the Fund and provides advisory and fund-level administrative services under an investment management agreement. Under the investment management agreement, Funds Management is responsible for, among other services, implementing the investment objectives and strategies of the Fund, supervising the subadviser and providing fund-level administrative services in connection with the Fund’s operations. As compensation for its services under the investment management agreement, Funds Management is entitled to receive an annual management fee starting at 0.40% and declining to 0.28% as the average daily net assets of the Fund increase. For the six months ended December 31, 2018, the management fee was equivalent to an annual rate of 0.39% of the Fund’s average daily net assets.
Funds Management has retained the services of a subadviser to provide daily portfolio management to the Fund. The fee for subadvisory services is borne by Funds Management. Wells Capital Management Incorporated, an affiliate of Funds Management and an indirect wholly owned subsidiary of Wells Fargo, is the subadviser to the Fund and is entitled to receive a fee from Funds Management at an annual rate starting at 0.20% and declining to 0.10% as the average daily net assets of the Fund increase.
Administration fees
Under a class-level administration agreement, Funds Management provides class-level administrative services to the Fund, which includes paying fees and expenses for services provided by the transfer agent,sub-transfer agents, omnibus account servicers and record-keepers. As compensation for its services under the class-level administration agreement, Funds Management receives an annual fee which is calculated based on the average daily net assets of each class as follows:
| | | | |
| | | Class-level
administration fee | |
| |
Class A, Class C | | | 0.16 | % |
| |
Administrator Class | | | 0.10 | |
| |
Institutional Class | | | 0.08 | |
Funds Management has contractually waived and/or reimbursed management and administration fees to the extent necessary to maintain certain net operating expense ratios for the Fund. When each class of the Fund has exceeded its expense cap, Funds Management has waived fees and/or reimbursed expenses from fund level expenses on a proportionate basis and then from class specific expenses; otherwise, waivers and/or reimbursements are applied against class specific expenses before fund level expenses. Funds Management has committed through October 31, 2019 to waive fees and/or reimburse expenses to the extent necessary to cap the Fund’s expenses at 0.75% for Class A shares, 1.50% for Class C shares, 0.55% for Administrator Class shares, and 0.48% for Institutional Class shares. After this time, the cap may be increased or the commitment to maintain the cap may be terminated only with the approval of the Board of Trustees.
| | | | |
| 28 | | Wells Fargo California Tax-Free Fund | | Notes to financial statements (unaudited) |
Distribution fee
The Trust has adopted a distribution plan for Class C shares of the Fund pursuant to Rule12b-1 under the 1940 Act. A distribution fee is charged to Class C shares and paid to Wells Fargo Funds Distributor, LLC (“Funds Distributor”), the principal underwriter, at an annual rate of 0.75% of the average daily net assets of Class C shares.
In addition, Funds Distributor is entitled to receive thefront-end sales charge from the purchase of Class A shares and a contingent deferred sales charge on the redemption of certain Class A shares. Funds Distributor is also entitled to receive the contingent deferred sales charges from redemptions of Class C shares. For the six months ended December 31, 2018, Funds Distributor received $2,641 from the sale of Class A shares. No contingent deferred sales charges were incurred by Class A and Class C shares for the six months ended December 31, 2018.
Shareholder servicing fees
The Trust has entered into contracts with one or more shareholder servicing agents, whereby Class A, Class C, and Administrator Class of the Fund are charged a fee at an annual rate of 0.25% of the average daily net assets of each respective class.
A portion of these total shareholder servicing fees were paid to affiliates of Wells Fargo.
Interfund transactions
The Fund may purchase or sell portfolio investment securities to certain other Wells Fargo affiliates pursuant to Rule17a-7 under the 1940 Act and under procedures adopted by the Board of Trustees. The procedures have been designed to ensure that these interfund transactions, which do not incur broker commissions, are effected at current market prices. Pursuant to these procedures, the Fund had $76,960,000 and $53,876,984 in interfund purchases and sales, respectively, during the six months ended December 31, 2018.
5. INVESTMENT PORTFOLIO TRANSACTIONS
Purchases and sales of investments, excluding U.S. government obligations (if any) and short-term securities, for the six months ended December 31, 2018 were $89,255,577 and $50,057,521, respectively.
6. BANK BORROWINGS
The Trust (excluding the money market funds), Wells Fargo Master Trust and Wells Fargo Variable Trust are parties to a $280,000,000 revolving credit agreement whereby the Fund is permitted to use bank borrowings for temporary or emergency purposes, such as to fund shareholder redemption requests. Interest under the credit agreement is charged to the Fund based on a borrowing rate equal to the higher of the Federal Funds rate in effect on that day plus 1.25% or the overnight LIBOR rate in effect on that day plus 1.25%. In addition, an annual commitment fee equal to 0.25% of the unused balance is allocated to each participating fund.
For the six months ended December 31, 2018, there were no borrowings by the Fund under the agreement.
7. DISTRIBUTIONS TO SHAREHOLDERS
Effective for all filings after November 4, 2018, the Securities and Exchange Commission eliminated the requirement to separately state the components of distributions to shareholders under U.S. generally accepted accounting principles.��The amounts of distributions to shareholders for the year ended June 30, 2018 were as follows:
| | | | |
| |
| | | Net investment income | |
| |
Class A | | | $14,178,372 | |
| |
Class C | | | 1,262,333 | |
| |
Administrator Class | | | 6,997,042 | |
| |
Institutional Class | | | 10,318,698 | |
8. CONCENTRATION RISK
The Fund invests a substantial portion of its assets in issuers of municipal debt securities located in a single state or territories of the U.S. Therefore, it may be more affected by economic and political developments in that state or region than would be a comparable generaltax-exempt fund.
| | | | | | |
| Notes to financial statements (unaudited) | | Wells Fargo California Tax-Free Fund | | | 29 | |
9. INDEMNIFICATION
Under the Trust’s organizational documents, the officers and Trustees have been granted certain indemnification rights against certain liabilities that may arise out of performance of their duties to the Trust. Additionally, in the normal course of business, the Trust may enter into contracts with service providers that contain a variety of indemnification clauses. The Trust’s maximum exposure under these arrangements is dependent on future claims that may be made against the Fund and, therefore, cannot be estimated.
10. NEW ACCOUNTING PRONOUNCEMENT
In August 2018, FASB issued Accounting Standards Update (“ASU”)No. 2018-13, Fair Value Measurement (Topic 820)Disclosure Framework—Changes to the Disclosure Requirements for Fair Value Measurement. ASU2018-13 updates the disclosure requirements for fair value measurements by modifying or removing certain disclosures and adding certain new disclosures. The amendments are effective for fiscal years, and interim periods within those fiscal years, beginning after December 15, 2019. Early adoption is permitted. Management has adopted the removal and modification of disclosures early, as permitted, and will adopt the additional new disclosures at the effective date.
| | | | |
| 30 | | Wells Fargo California Tax-Free Fund | | Other information (unaudited) |
PROXY VOTING INFORMATION
A description of the policies and procedures used to determine how to vote proxies relating to portfolio securities is available, upon request, by calling1-800-222-8222, visiting our website atwellsfargofunds.com, or visiting the SEC website at sec.gov. Information regarding how the Fund voted proxies relating to portfolio securities during the most recent12-month period ended June 30 is available on the Fund’s website atwellsfargofunds.comor by visiting the SEC website at sec.gov.
PORTFOLIO HOLDINGS INFORMATION
The complete portfolio holdings for the Fund are publicly available monthly on the Fund’s website (wellsfargofunds.com), on aone-month delayed basis. In addition, top ten holdings information (excluding derivative positions) for the Fund is publicly available on the Fund’s website on a monthly,seven-day or more delayed basis. The Fund files its complete schedule of portfolio holdings with the SEC for the first and third quarters of each fiscal year on FormN-Q, which is available by visiting the SEC website at sec.gov. In addition, the Fund’s FormN-Q may be reviewed and copied at the SEC’s Public Reference Room in Washington, DC, and at regional offices in New York City, at 233 Broadway, and in Chicago, at 175 West Jackson Boulevard, Suite 900. Information about the Public Reference Room may be obtained by calling1-800-SEC-0330.
| | | | | | |
| Other information (unaudited) | | Wells Fargo California Tax-Free Fund | | | 31 | |
BOARD OF TRUSTEES AND OFFICERS
Each of the Trustees and Officers1 listed in the table below acts in identical capacities for each fund in the Wells Fargo family of funds, which consists of 152 mutual funds comprising the Wells Fargo Funds Trust, Wells Fargo Variable Trust, Wells Fargo Master Trust and fourclosed-end funds (collectively the “Fund Complex”). This table should be read in conjunction with the Prospectus and the Statement of Additional Information2. The mailing address of each Trustee and Officer is 525 Market Street, 12th Floor, San Francisco, CA 94105. Each Trustee and Officer serves an indefinite term, however, each Trustee serves such term until reaching the mandatory retirement age established by the Trustees.
Independent Trustees
| | | | | | |
Name and
year of birth | | Position held and
length of service* | | Principal occupations during past five years or longer | | Current other
public company or
investment company
directorships |
| | | |
| William R. Ebsworth (Born 1957) | | Trustee, since 2015 | | Retired. From 1984 to 2013, equities analyst, portfolio manager, research director and chief investment officer at Fidelity Management and Research Company in Boston, Tokyo, and Hong Kong, and retired in 2013 as Chief Investment Officer of Fidelity Strategic Advisers, Inc. where he led a team of investment professionals managing client assets. Prior thereto, Board member of Hong Kong Securities Clearing Co., Hong Kong Options Clearing Corp., the Thailand International Fund, Ltd., Fidelity Investments Life Insurance Company, and Empire Fidelity Investments Life Insurance Company. Board member of the Vincent Memorial Hospital Endowment(non-profit organization), where he serves on the Investment Committee and as a Chair of the Audit Committee. Mr. Ebsworth is a CFA® charterholder. | | N/A |
| | | |
| Jane A. Freeman (Born 1953) | | Trustee, since 2015; Chair Liaison,
since 2018 | | Retired. From 2012 to 2014 and 1999 to 2008, Chief Financial Officer of Scientific Learning Corporation. From 2008 to 2012, Ms. Freeman provided consulting services related to strategic business projects. Prior to 1999, Portfolio Manager at Rockefeller & Co. and Scudder, Stevens & Clark. Board member of the Harding Loevner Funds from 1996 to 2014, serving as both Lead Independent Director and chair of the Audit Committee. Board member of the Russell Exchange Traded Funds Trust from 2011 to 2012 and the chair of the Audit Committee. Ms. Freeman is a Board Member of The Ruth Bancroft Garden(non-profit organization). She is also an inactive Chartered Financial Analyst. | | N/A |
| | | |
| Isaiah Harris, Jr.3 (Born 1952) | | Trustee, since 2009; Audit Committee Chairman, since 2019 | | Retired. Chairman of the Board of CIGNA Corporation since 2009, and Director since 2005. From 2003 to 2011, Director of Deluxe Corporation. Prior thereto, President and CEO of BellSouth Advertising and Publishing Corp. from 2005 to 2007, President and CEO of BellSouth Enterprises from 2004 to 2005 and President of BellSouth Consumer Services from 2000 to 2003. Emeritus member of the Iowa State University Foundation Board of Governors. Emeritus Member of the Advisory Board of Iowa State University School of Business. Advisory Board Member, Palm Harbor Academy (private school). Advisory Board Member, Child Evangelism Fellowship(non-profit). Mr. Harris is a certified public accountant (inactive status). | | CIGNA Corporation |
| | | |
| Judith M. Johnson3 (Born 1949) | | Trustee, since 2008; Audit Committee Chairman, from
2009 to 2018 | | Retired. Prior thereto, Chief Executive Officer and Chief Investment Officer of Minneapolis Employees Retirement Fund from 1996 to 2008. Ms. Johnson is an attorney, certified public accountant and a certified managerial accountant. | | N/A |
| | | |
| David F. Larcker (Born 1950) | | Trustee, since 2009 | | James Irvin Miller Professor of Accounting at the Graduate School of Business, Stanford University, Director of the Corporate Governance Research Initiative and Senior Faculty of The Rock Center for Corporate Governance since 2006. From 2005 to 2008, Professor of Accounting at the Graduate School of Business, Stanford University. Prior thereto, Ernst & Young Professor of Accounting at The Wharton School, University of Pennsylvania from 1985 to 2005. | | N/A |
| | | | |
| 32 | | Wells Fargo California Tax-Free Fund | | Other information (unaudited) |
| | | | | | |
Name and
year of birth | | Position held and
length of service* | | Principal occupations during past five years or longer | | Current other
public company or
investment company
directorships |
| | | |
| Olivia S. Mitchell (Born 1953) | | Trustee, since 2006; Nominating and Governance Committee Chairman, since 2018 | | International Foundation of Employee Benefit Plans Professor, Wharton School of the University of Pennsylvania since 1993. Director of Wharton’s Pension Research Council and Boettner Center on Pensions & Retirement Research, and Research Associate at the National Bureau of Economic Research. Previously, Cornell University Professor from 1978 to 1993. | | N/A |
| | | |
| Timothy J. Penny (Born 1951) | | Trustee, since 1996; Chairman, since 2018; Vice Chairman, from 2017 to 2018 | | President and Chief Executive Officer of Southern Minnesota Initiative Foundation, anon-profit organization, since 2007. Member of the Board of Trustees of NorthStar Education Finance, Inc., anon-profit organization, since 2007. | | N/A |
| | | |
| James G. Polisson (Born 1959) | | Trustee, since 2018; Advisory Board Member, from 2017 to 2018 | | Retired. Chief Marketing Officer, Source (ETF) UK Services, Ltd, from 2015 to 2017. From 2012 to 2015, Principal of The Polisson Group, LLC, a management consulting, corporate advisory and principal investing company. Chief Executive Officer and Managing Director at Russell Investments, Global Exchange Traded Funds from 2010 to 2012. Managing Director of Barclays Global Investors from 1998 to 2010 and Global Chief Marketing Officer for iShares and Barclays Global Investors from 2000 to 2010. Trustee of the San Francisco Mechanics’ Institute, anon-profit organization, from 2013 to 2015. Board member of the Russell Exchange Traded Fund Trust from 2011 to 2012. Director of Barclays Global Investors Holdings Deutschland GmbH from 2006 to 2009. Mr. Polisson is an attorney and has a retired status with the Massachusetts and District of Columbia Bar Associations. | | N/A |
| | | |
| Michael S. Scofield4 (Born 1943) | | Trustee, since 2010 | | Served on the Investment Company Institute’s Board of Governors and Executive Committee from 2008-2011 as well the Governing Council of the Independent Directors Council from 2006-2011 and the Independent Directors Council Executive Committee from 2008-2011. Trustee of the Evergreen Fund complex (and its predecessors) from 1984 to 2010. Chairman of the Evergreen Funds from 2000-2010. Former Trustee of the Mentor Funds. Retired Attorney, Law Offices of Michael S. Scofield. | | N/A |
| | | |
| Pamela Wheelock (Born 1959) | | Trustee, since 2018; Advisory Board Member, from 2017 to 2018 | | Chief Operating Officer, Twin Cities Habitat for Humanity, since January, 2017. Vice President of University Services, University of Minnesota from 2012 to 2017. Prior thereto, on the Board of Directors, Governance Committee and Finance Committee for the Minnesota Philanthropy Partners (Saint Paul Foundation) from 2012 to 2018, Interim President and Chief Executive Officer of Blue Cross Blue Shield of Minnesota from 2010 to 2011, Chairman of the Board from 2009 to 2011 and Board Director from 2003 to 2015. Vice President, Leadership and Community Engagement, Bush Foundation, Saint Paul, Minnesota (a private foundation) from 2009 to 2011. Executive Vice President and Chief Financial Officer, Minnesota Sports and Entertainment from 2004 to 2009 and Senior Vice President from 2002 to 2004. Commissioner of Finance, State of Minnesota, from 1999 to 2002. Currently the Board Chair of the Minnesota Wild Foundation since 2010. | | N/A |
| * | Length of service dates reflect the Trustee’s commencement of service with the Trust’s predecessor entities, where applicable. |
| | | | | | |
| Other information (unaudited) | | Wells Fargo California Tax-Free Fund | | | 33 | |
Officers
| | | | | | |
Name and
year of birth | | Position held and
length of service | | Principal occupations during past five years or longer | | |
| | | |
Andrew Owen
(Born 1960) | | President, since 2017 | | Executive Vice President of Wells Fargo & Company and Head of Affiliated Managers, Wells Fargo Asset Management, since 2014. In addition, Mr. Owen is currently President, Chief Executive Officer and Director of Wells Fargo Funds Management, LLC since 2017. Prior thereto, Executive Vice President responsible for marketing, investments and product development for Wells Fargo Funds Management, LLC, from 2009 to 2014. | | |
| | | |
Nancy Wiser1
(Born 1967) | | Treasurer, since 2012 | | Executive Vice President of Wells Fargo Funds Management, LLC since 2011. Chief Operating Officer and Chief Compliance Officer at LightBox Capital Management LLC, from 2008 to 2011. | | |
| | | |
| Alexander Kymn (Born 1973) | | Secretary, since 2018; Chief Legal Officer, since 2018 | | Senior Company Counsel of Wells Fargo Bank, N.A. since 2018 (previously Senior Counsel from 2007 to 2018). Vice President of Wells Fargo Funds Management, LLC from 2008 to 2014. | | |
| | | |
| Michael H. Whitaker(Born 1967) | | Chief Compliance Officer, since 2016 | | Senior Vice President and Chief Compliance Officer since 2016. Senior Vice President and Chief Compliance Officer for Fidelity Investments from 2007 to 2016. | | |
| | | |
David Berardi
(Born 1975) | | Assistant Treasurer, since 2009 | | Vice President of Wells Fargo Funds Management, LLC since 2009. Vice President of Evergreen Investment Management Company, LLC from 2008 to 2010. Manager of Fund Reporting and Control for Evergreen Investment Management Company, LLC from 2004 to 2010. | | |
| | | |
| Jeremy DePalma1 (Born 1974) | | Assistant Treasurer, since 2009 | | Senior Vice President of Wells Fargo Funds Management, LLC since 2009. Senior Vice President of Evergreen Investment Management Company, LLC from 2008 to 2010 and head of the Fund Reporting and Control Team within Fund Administration from 2005 to 2010. | | |
| 1 | Nancy Wiser acts as Treasurer of 76 funds in the Fund Complex. Jeremy DePalma acts as Treasurer of 76 funds and Assistant Treasurer of 76 funds in the Fund Complex. |
| 2 | The Statement of Additional Information includes additional information about the Trustees and is available, without charge, upon request, by calling1-800-222-8222 or by visiting the website atwellsfargofunds.com. |
| 3 | Mr. Harris replaced Ms. Johnson as the Chairman of the Audit Committee effective January 1, 2019. |
| 4 | Mr. Scofield retired on December 31, 2018. |
| | | | |
| 34 | | Wells Fargo California Tax-Free Fund | | Appendix A (unaudited) |
SALES CHARGE REDUCTIONS AND WAIVERS FOR CERTAIN INTERMEDIARIES
Raymond James & Associates, Inc., Raymond James Financial Services & Raymond James affiliates (“Raymond James”)
Effective on or about March 1, 2019, shareholders purchasing Fund shares through a Raymond James platform or account will be eligible only for the following load waivers(front-end sales charge waivers and contingent deferred, orback-end, sales charge waivers) and discounts, which may differ from those disclosed elsewhere in the Fund’s Prospectus or SAI.
Front-end Sales Load Waivers on Class A shares Available at Raymond James
| | • | | Shares purchased in an investment advisory program. |
| | • | | Shares purchased through reinvestment of capital gains distributions and dividend reinvestment when purchasing shares of the same fund (but not any other fund within the fund family). | |
| | • | | Employees and registered representatives of Raymond James or its affiliates and their family members as designated by Raymond James. | |
| | • | | Shares purchased from the proceeds of redemptions within the same fund family, provided (1) the repurchase occurs within 90 days following the redemption, (2) the redemption and purchase occur in the same account, and (3) redeemed shares were subject to afront-end or deferred sales load (known as Rights of Reinstatement). | |
| | • | | A shareholder in the fund’s Class C shares will have their shares automatically exchanged at net asset value to Class A shares (or the appropriate share class) of the fund if the shares are no longer subject to a CDSC and the exchange is in line with the policies and procedures of Raymond James. | |
CDSC Waivers on Class A and C Shares Available at Raymond James
| | • | | Death or disability of the shareholder. | |
| | • | | Shares sold as part of a systematic withdrawal plan as described in the Fund’s Prospectus. | |
| | • | | Return of excess contributions from an IRA Account. | |
| | • | | Shares sold as part of a required minimum distribution for IRA and retirement accounts due to the shareholder reaching age 70½ as described in the Fund’s prospectus. | |
| | • | | Shares sold to pay Raymond James fees but only if the transaction is initiated by Raymond James. | |
| | • | | Shares acquired through a right of reinstatement. | |
Front-end Load Discounts Available at Raymond James: Breakpoints, and/or Rights of Accumulation
| | • | | Breakpoints as described in the Fund’s Prospectus. | |
| | • | | Rights of accumulation which entitle shareholders to breakpoint discounts will be automatically calculated based on the aggregated holding of fund family assets held by accounts within the purchaser’s household at Raymond James. Eligible fund family assets not held at Raymond James may be included in the rights of accumulation calculation only if the shareholder notifies his or her financial advisor about such assets. | |
This page is intentionally left blank.
This page is intentionally left blank.

For more information
More information about Wells Fargo Funds is available free upon request. To obtain literature, please write, visit the Fund’s website, or call:
Wells Fargo Funds
P.O. Box 219967
Kansas City, MO 64121-9967
Website: wellsfargofunds.com
Individual investors: 1-800-222-8222
Retail investment professionals: 1-888-877-9275
Institutional investment professionals: 1-866-765-0778
This report and the financial statements contained herein are submitted for the general information of the shareholders of the Fund. If this report is used for promotional purposes, distribution of the report must be accompanied or preceded by a current prospectus. Before investing, please consider the investment objectives, risks, charges, and expenses of the investment. For a current prospectus and, if available, a summary prospectus, containing this information, call1-800-222-8222 or visit the Fund’s website atwellsfargofunds.com. Read the prospectus carefully before you invest or send money.
Wells Fargo Asset Management (WFAM) is the trade name for certain investment advisory/management firms owned by Wells Fargo & Company. These firms include but are not limited to Wells Capital Management Incorporated and Wells Fargo Funds Management, LLC. Certain products managed by WFAM entities are distributed by Wells Fargo Funds Distributor, LLC (a broker/dealer and Member FINRA).
This material is for general informational and educational purposes only and is NOT intended to provide investment advice or a recommendation of any kind—including a recommendation for any specific investment, strategy, or plan.
INVESTMENT PRODUCTS: NOT FDIC INSURED ◾ NO BANK GUARANTEE ◾ MAY LOSE VALUE
© 2019 Wells Fargo Funds Management, LLC. All rights reserved.
| | |
 | | 320443 02-19 SA249/SAR249 12-18 |
Semi-Annual Report
December 31, 2018

Wells Fargo Colorado Tax-Free Fund

Beginning on January 1, 2021, as permitted by new regulations adopted by the Securities and Exchange Commission, paper copies of the Wells Fargo Funds’ annual and semi-annual shareholder reports issued after this date will no longer be sent by mail, unless you specifically request paper copies of the reports. Instead, the reports will be made available on the Funds’ website, and you will be notified by mail each time a report is posted and provided with a website address to access the report.
If you already elected to receive shareholder reports electronically, you will not be affected by this change and you need not take any action. You may elect to receive shareholder reports and other communications from the Fund electronically at any time by contacting your financial intermediary (such as a broker-dealer or bank) or, if you are a direct investor, by calling 1-800-222-8222 or by enrolling at wellsfargo.com/advantagedelivery.
You may elect to receive all future reports in paper free of charge. If you invest through a financial intermediary, you can contact your financial intermediary to request that you continue to receive paper copies of your shareholder reports; if you invest directly with the Fund, you can call 1-800-222-8222. Your election to receive reports in paper will apply to all Wells Fargo Funds held in your account with your financial intermediary or, if you are a direct investor, to all Wells Fargo Funds that you hold.

Reduce clutter. Save trees.
Sign up for electronic delivery of prospectuses and shareholder reports atwellsfargo.com/advantagedelivery
Contents
The views expressed and any forward-looking statements are as of December 31, 2018, unless otherwise noted, and are those of the Fund managers and/or Wells Fargo Funds Management, LLC. Discussions of individual securities, or the markets generally, or any Wells Fargo Fund are not intended as individual recommendations. Future events or results may vary significantly from those expressed in any forward-looking statements. The views expressed are subject to change at any time in response to changing circumstances in the market. Wells Fargo Funds Management, LLC and the Fund disclaim any obligation to publicly update or revise any views expressed or forward-looking statements.
INVESTMENT PRODUCTS: NOT FDIC INSURED ◾ NO BANK GUARANTEE ◾ MAY LOSE VALUE
| | | | |
| 2 | | Wells Fargo Colorado Tax-Free Fund | | Letter to shareholders (unaudited) |

Andrew Owen
President
Wells Fargo Funds
Global trade tensions escalated during the third quarter of 2018.
Dear Shareholder:
We are pleased to offer you this semi-annual report for the Wells Fargo Colorado Tax-Free Fund for the six-month period that ended December 31, 2018. During the reporting period, the U.S. generated encouraging economic and business data that was offset by less positive and more inconsistent data from international markets. Investment returns were generally negative as geopolitical tensions and uncertainty tended to distract investors from more favorable underlying trends.
For the period, U.S. stocks, as measured by the S&P 500 Index,1 fell 6.85% and international stocks, as measured by the MSCI ACWI ex USA Index (Net),2 declined 10.84%. Based on the MSCI EM Index (Net),3 emerging market stocks lost 8.48%. For bond investors, the Bloomberg Barclays U.S. Aggregate Bond Index4 gained 1.65% while the Bloomberg Barclays Global Aggregate ex-USD Index5 fell 0.84%. The Bloomberg Barclays Municipal Bond Index6 gained 1.53% while the ICE BofAML U.S. High Yield Index7 declined 2.34%.
Global trade tensions prompted investor concerns.
Global trade tensions escalated during the third quarter of 2018. The U.S. imposed tariffs on a wide range of products manufactured overseas. Foreign governments retaliated with tariffs that punished U.S. commodity producers and product manufacturers. Investors wondered about next steps as divergence in global economic policies and growth prospects widened.
During the summer months, the U.S. economy strengthened. Revised second-quarter gross domestic product (GDP) growth data released in August showed the U.S. economy growing at a 4.2% rate. The unemployment rate in the U.S. was 3.7% by the end of September, according to the U.S. Department of Labor. Wages showed more consistent growth, and consumer confidence remained strong. Several U.S. equity market indices reached records during August, with the S&P 500 Index gaining 7.71% for the three-month period that ended September 30, 2018. In contrast, the MSCI ACWI ex USA Index (Net) gained 0.71% while the MSCI EM Index (Net) declined 1.09% during the same three-month period.
| 1 | The S&P 500 Index consists of 500 stocks chosen for market size, liquidity, and industry group representation. It is a market-value-weighted index with each stock’s weight in the index proportionate to its market value. You cannot invest directly in an index. |
| 2 | The Morgan Stanley Capital International (MSCI) All Country World Index (ACWI) ex USA Index (Net) is a free-float-adjusted market-capitalization-weighted index that is designed to measure the equity market performance of developed markets, excluding the United States and Canada. Source: MSCI. MSCI makes no express or implied warranties or representations and shall have no liability whatsoever with respect to any MSCI data contained herein. The MSCI data may not be further redistributed or used as a basis for other indices or any securities or financial products. This report is not approved, reviewed, or produced by MSCI. You cannot invest directly in an index. |
| 3 | The MSCI Emerging Markets (EM) Index (Net) is a free-float-adjusted market-capitalization-weighted index that is designed to measure large- and mid-cap equity market performance of emerging markets. The MSCI EM Index (Net) consists of the following 24 emerging market country indices: Brazil, Chile, China, Colombia, Czech Republic, Egypt, Greece, Hungary, India, Indonesia, Korea, Malaysia, Mexico, Pakistan, Peru, the Philippines, Poland, Qatar, Russia, South Africa, Taiwan, Thailand, Turkey, and the United Arab Emirates. You cannot invest directly in an index. |
| 4 | The Bloomberg Barclays U.S. Aggregate Bond Index is a broad-based benchmark that measures the investment-grade, U.S. dollar-denominated, fixed-rate taxable bond market, including Treasuries, government-related and corporate securities, mortgage-backed securities (agency fixed-rate and hybrid adjustable-rate mortgage pass-throughs), asset-backed securities, and commercial mortgage-backed securities. You cannot invest directly in an index. |
| 5 | The Bloomberg Barclays Global Aggregate ex-USD Index is an unmanaged index that provides a broad-based measure of the global investment-grade fixed-income markets excluding the U.S. dollar-denominated debt market. You cannot invest directly in an index. |
| 6 | The Bloomberg Barclays Municipal Bond Index is an unmanaged index composed of long-term tax-exempt bonds with a minimum credit rating of Baa. You cannot invest directly in an index. |
| 7 | The ICE BofAML U.S. High Yield Index is a market-capitalization-weighted index of domestic and Yankee high-yield bonds. The index tracks the performance of high-yield securities traded in the U.S. bond market. You cannot invest directly in an index. Copyright 2018. ICE Data Indices, LLC. All rights reserved. |
| | | | | | |
| Letter to shareholders (unaudited) | | Wells Fargo Colorado Tax-Free Fund | | | 3 | |
Economic signals overseas were mixed as the third quarter ended and the fourth quarter began. In particular, signs of slowing economic growth in China created uncertainty for investors. Amid rising trade tensions, the People’s Bank of China cut reserve requirement ratios and accelerated infrastructure spending and tax cuts for business enterprises and individuals. Nevertheless, a strengthening U.S. dollar and trade tensions remained headwinds for investors overseas.
Equity markets were volatile during the fourth quarter.
Negative stock market performance during October and December bracketed a mildly positive November, as measured by the S&P 500 Index and the MSCI ACWI ex USA Index (Net). As interest rates and bond yields gained during October, stock markets struggled. Readings on consumer sentiment and business spending were mixed. Markets rebounded in November. The U.S. and China agreed to halt further increases in tariffs and engage in additional negotiations. While November returns were positive, the loss for the full fourth quarter was substantial for equity investors globally, with the S&P down 13.52% and the MSCI ACWI ex USA Index (Net) down 11.46%. December’s S&P 500 Index performance was the lowest since 1931. Globally, fixed income investments fared better than stocks during the last two months of the year as conflicting signals unsettled investors’ outlooks.
Equity investors confronted a number of changing conditions. In November’smid-term elections, control of the U.S. House of Representatives shifted from Republicans to Democrats, presaging potential partisan disputes. Progress on Brexit negotiations stalled in the UK. In China, the value of the yuan declined to low levels last seen in 2008. Oil prices continued to fall. The Fed increased the federal funds rate by 25 bps to a target range of between 2.25% and 2.50% in December 2018. A late-December dispute over spending and immigration policy resulted in a partial U.S. government shutdown that continued through the end of the period.
Don’t let short-term uncertainty derail long-term investment goals.
Periods of investment uncertainty can present challenges, but experience has taught us that maintaining long-term investment goals can be an effective way to plan for the future. To help you create a sound strategy based on your personal goals and risk tolerance, Wells Fargo Funds offers more than 100 mutual funds spanning a wide range of asset classes and investment styles. Although diversification cannot guarantee an investment profit or prevent losses, we believe it can be an effective way to manage investment risk and potentially smooth out overall portfolio performance. We encourage investors to know their investments and to understand that appropriate levels of risk-taking may unlock opportunities.
Thank you for choosing to invest with Wells Fargo Funds. We appreciate your confidence in us and remain committed to helping you meet your financial needs.
Sincerely,

Andrew Owen
President
Wells Fargo Funds
Economic signals overseas were mixed as the third quarter ended and the fourth quarter began.
For further information about your Fund, contact your investment professional, visit our website atwellsfargofunds.com, or call us directly at1-800-222-8222.
| | | | |
| 4 | | Wells Fargo Colorado Tax-Free Fund | | Performance highlights (unaudited) |
Investment objective
The Fund seeks current income exempt from federal income tax and Colorado individual income tax.
Manager
Wells Fargo Funds Management, LLC
Subadviser
Wells Capital Management Incorporated
Portfolio managers
Terry J. Goode
Adrian Van Poppel
Average annual total returns (%) as of December 31, 2018
| | | | | | | | | | | | | | | | | | | | | | | | | | | | | | | | | | |
| | | | | Including sales charge | | | Excluding sales charge | | | Expense ratios1 (%) | |
| | | Inception date | | 1 year | | | 5 year | | | 10 year | | | 1 year | | | 5 year | | | 10 year | | | Gross | | | Net2 | |
| | | | | | | | | |
| Class A (NWCOX) | | 7-31-1995 | | | -3.75 | | | | 3.01 | | | | 4.32 | | | | 0.78 | | | | 3.97 | | | | 4.80 | | | | 0.85 | | | | 0.85 | |
| | | | | | | | | |
| Class C (WCOTX) | | 3-31-2008 | | | -1.06 | | | | 3.19 | | | | 4.02 | | | | -0.06 | | | | 3.19 | | | | 4.02 | | | | 1.60 | | | | 1.60 | |
| | | | | | | | | |
| Administrator Class (NCOTX) | | 8-23-1993 | | | – | | | | – | | | | – | | | | 1.03 | | | | 4.22 | | | | 5.06 | | | | 0.79 | | | | 0.60 | |
| | | | | | | | | |
| Institutional Class (WCITX)3 | | 10-31-2016 | | | – | | | | – | | | | – | | | | 1.02 | | | | 4.26 | | | | 5.08 | | | | 0.52 | | | | 0.52 | |
| | | | | | | | | |
| Bloomberg Barclays Municipal Bond Index4 | | – | | | – | | | | – | | | | – | | | | 1.28 | | | | 3.82 | | | | 4.85 | | | | – | | | | – | |
| | | | | | | | | |
| Bloomberg Barclays Colorado Municipal Bond Index5 | | – | | | – | | | | – | | | | – | | | | 1.15 | | | | 4.54 | | | | 5.46 | | | | – | | | | – | |
Figures quoted represent past performance, which is no guarantee of future results, and do not reflect taxes that a shareholder may pay on fund distributions or the redemption of fund shares. Investment return and principal value of an investment will fluctuate so that an investor’s shares, when redeemed, may be worth more or less than their original cost. Performance shown without sales charges would be lower if sales charges were reflected. Current performance may be lower or higher than the performance data quoted, which assumes the reinvestment of dividends and capital gains. Current month-end performance is available on the Fund’s website,wellsfargofunds.com.
Index returns do not include transaction costs associated with buying and selling securities, any mutual fund fees or expenses, or any taxes. It is not possible to invest directly in an index.
For Class A shares, the maximum front-end sales charge is 4.50%. For Class C shares, the maximum contingent deferred sales charge is 1.00%. Performance including a contingent deferred sales charge assumes the sales charge for the corresponding time period. Administrator Class and Institutional Class shares are sold without a front-end sales charge or contingent deferred sales charge.
Bond values fluctuate in response to the financial condition of individual issuers, general market and economic conditions, and changes in interest rates. Changes in market conditions and government policies may lead to periods of heightened volatility in the bond market and reduced liquidity for certain bonds held by the Fund. In general, when interest rates rise, bond values fall and investors may lose principal value. Interest-rate changes and their impact on the Fund and its share price can be sudden and unpredictable. The use of derivatives may reduce returns and/or increase volatility. Certain investment strategies tend to increase the total risk of an investment (relative to the broader market). The Fund is exposed to Colorado municipal securities risk and high-yield securities risk. Consult the Fund’s prospectus for additional information on these and other risks. A portion of the Fund’s income may be subject to federal, state, and/or local income taxes or the Alternative Minimum Tax (AMT). Any capital gains distributions may be taxable.
Please see footnotes on page 5.
| | | | | | |
| Performance highlights (unaudited) | | Wells Fargo Colorado Tax-Free Fund | | | 5 | |
|
| Effective maturity distribution as of December 31, 20186 |
|
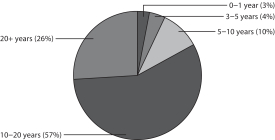 |
|
| Credit quality as of December 31, 20187 |
|
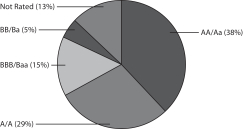
|
| 1 | Reflects the expense ratios as stated in the most recent prospectuses. The expense ratios shown are subject to change and may differ from the annualized expense ratios shown in the financial highlights of this report. |
| 2 | The manager has contractually committed through October 31, 2019, to waive fees and/or reimburse expenses to the extent necessary to cap the Fund’s Total Annual Fund Operating Expenses After Fee Waivers at the amounts shown. After this time, the cap may be increased or the commitment to maintain the cap may be terminated only with the approval of the Board of Trustees. Brokerage commissions, stamp duty fees, interest, taxes, acquired fund fees and expenses (if any), and extraordinary expenses are excluded from the expense cap. Without this cap, the Fund’s returns would have been lower. The expense ratio paid by an investor is the net expense ratio (the total annual fund operating expenses after fee waivers) as stated in the prospectuses. |
| 3 | Historical performance shown for the Institutional Class shares prior to their inception reflects the performance of the Administrator Class shares, and is not adjusted to reflect Institutional Class expenses. If these expenses had been included, returns for Institutional Class shares would be higher. |
| 4 | The Bloomberg Barclays Municipal Bond Index is an unmanaged index composed of long-term tax-exempt bonds with a minimum credit rating of Baa. You cannot invest directly in an index. |
| 5 | The Bloomberg Barclays Colorado Municipal Bond Index is the Colorado component of the Bloomberg Barclays Municipal Bond Index. You cannot invest directly in an index. |
| 6 | Amounts are calculated based on the total long-term investments of the Fund. These amounts are subject to change and may have changed since the date specified. |
| 7 | The credit quality distribution of portfolio holdings reflected in the chart is based on ratings from Standard & Poor’s, Moody’s Investors Service, and/ or Fitch Ratings Ltd. Credit quality ratings apply to the underlying holdings of the Fund and not to the Fund itself. The percentages of the Fund’s portfolio with the ratings depicted in the chart are calculated based on the total market value of fixed income securities held by the Fund. If a security was rated by all three rating agencies, the middle rating was utilized. If rated by two of three rating agencies, the lower rating was utilized, and if rated by one of the rating agencies, that rating was utilized. Standard & Poor’s rates the creditworthiness of bonds, ranging from AAA (highest) to D (lowest). Ratings from A to CCC may be modified by the addition of a plus (+) or minus (-) sign to show relative standing within the rating categories. Standard & Poor’s rates the creditworthiness of short-term notes from SP-1 (highest) to SP-3 (lowest). Moody’s rates the creditworthiness of bonds, ranging from Aaa (highest) to C (lowest). Ratings Aa to B may be modified by the addition of a number 1 (highest) to 3 (lowest) to show relative standing within the ratings categories. Moody’s rates the creditworthiness of short-term U.S. tax-exempt municipal securities from MIG 1/VMIG 1 (highest) to SG (lowest). Fitch rates the creditworthiness of bonds, ranging from AAA (highest) to D (lowest). Credit quality distribution is subject to change and may have changed since the date specified. |
| | | | |
| 6 | | Wells Fargo Colorado Tax-Free Fund | | Fund expenses (unaudited) |
As a shareholder of the Fund, you incur two types of costs: (1) transaction costs, including sales charges (loads) on purchase payments and contingent deferred sales charges (if any) on redemptions and (2) ongoing costs, including management fees, distribution (12b-1) and/or shareholder servicing fees, and other Fund expenses. This example is intended to help you understand your ongoing costs (in dollars) of investing in the Fund and to compare these costs with the ongoing costs of investing in other mutual funds.
The example is based on an investment of $1,000 invested at the beginning of the six-month period and held for the entire period from July 1, 2018 to December 31, 2018.
Actual expenses
The “Actual” line of the table below provides information about actual account values and actual expenses. You may use the information in this line, together with the amount you invested, to estimate the expenses that you paid over the period. Simply divide your account value by $1,000 (for example, an $8,600 account value divided by $1,000 = 8.6), then multiply the result by the number in the “Actual” line under the heading entitled “Expenses paid during period” for your applicable class of shares to estimate the expenses you paid on your account during this period.
Hypothetical example for comparison purposes
The “Hypothetical” line of the table below provides information about hypothetical account values and hypothetical expenses based on the Fund’s actual expense ratio and an assumed rate of return of 5% per year before expenses, which is not the Fund’s actual return. The hypothetical account values and expenses may not be used to estimate the actual ending account balance or expenses you paid for the period. You may use this information to compare the ongoing costs of investing in the Fund and other funds. To do so, compare this 5% hypothetical example with the 5% hypothetical examples that appear in the shareholder reports of the other funds.
Please note that the expenses shown in the table are meant to highlight your ongoing costs only and do not reflect any transactional costs, such as sales charges (loads) and contingent deferred sales charges. Therefore, the “Hypothetical” line of the table is useful in comparing ongoing costs only and will not help you determine the relative total costs of owning different funds. In addition, if these transactional costs were included, your costs would have been higher.
| | | | | | | | | | | | | | | | |
| | | Beginning
account value
7-1-2018 | | | Ending
account value
12-31-2018 | | | Expenses
paid during
the period¹ | | | Annualized net
expense ratio | |
Class A | | | | | | | | | | | | | | | | |
| | | | |
Actual | | $ | 1,000.00 | | | $ | 1,008.06 | | | $ | 4.30 | | | | 0.85 | % |
| | | | |
Hypothetical (5% return before expenses) | | $ | 1,000.00 | | | $ | 1,020.92 | | | $ | 4.33 | | | | 0.85 | % |
Class C | | | | | | | | | | | | | | | | |
| | | | |
Actual | | $ | 1,000.00 | | | $ | 1,004.27 | | | $ | 8.08 | | | | 1.60 | % |
| | | | |
Hypothetical (5% return before expenses) | | $ | 1,000.00 | | | $ | 1,017.14 | | | $ | 8.13 | | | | 1.60 | % |
Administrator Class | | | | | | | | | | | | | | | | |
| | | | |
Actual | | $ | 1,000.00 | | | $ | 1,009.33 | | | $ | 3.04 | | | | 0.60 | % |
| | | | |
Hypothetical (5% return before expenses) | | $ | 1,000.00 | | | $ | 1,022.18 | | | $ | 3.06 | | | | 0.60 | % |
Institutional Class | | | | | | | | | | | | | | | | |
| | | | |
Actual | | $ | 1,000.00 | | | $ | 1,009.73 | | | $ | 2.63 | | | | 0.52 | % |
| | | | |
Hypothetical (5% return before expenses) | | $ | 1,000.00 | | | $ | 1,022.58 | | | $ | 2.65 | | | | 0.52 | % |
| 1 | Expenses paid is equal to the annualized net expense ratio of each class multiplied by the average account value over the period, multiplied by the number of days in the most recent fiscal half-year divided by the number of days in the fiscal year (to reflect the one-half-year period). |
| | | | | | |
| Portfolio of investments—December 31, 2018 (unaudited) | | Wells Fargo Colorado Tax-Free Fund | | | 7 | |
| | | | | | | | | | | | | | | | |
| Security name | | Interest rate | | | Maturity date | | | Principal | | | Value | |
|
Municipal Obligations: 97.60% | |
| | | | |
Arizona: 1.52% | | | | | | | | | | | | | | | | |
| | | | |
| Education Revenue: 1.52% | | | | | | | | | | | | | | | | |
| | | | |
Phoenix AZ IDA Rowan University Project | | | 5.25 | % | | | 6-1-2034 | | | $ | 1,000,000 | | | $ | 1,083,220 | |
| | | | | | | | | | | | | | | | |
| | | | |
California: 1.65% | | | | | | | | | | | | | | | | |
| | | | |
| Tax Revenue: 1.65% | | | | | | | | | | | | | | | | |
| | | | |
Norco CA RDA Project Area #1 | | | 6.00 | | | | 3-1-2036 | | | | 1,120,000 | | | | 1,176,571 | |
| | | | | | | | | | | | | | | | |
| | | | |
Colorado: 85.13% | | | | | | | | | | | | | | | | |
| | | | |
| Airport Revenue: 3.06% | | | | | | | | | | | | | | | | |
| | | | |
Denver CO City & County Department of Aviation Airport System Bonds Series 2012B | | | 5.00 | | | | 11-15-2030 | | | | 2,000,000 | | | | 2,187,780 | |
| | | | | | | | | | | | | | | | |
| | | | |
| Education Revenue: 20.00% | | | | | | | | | | | | | | | | |
| | | | |
Colorado Board of Governors State University Enterprise System Revenue Bonds Series 2013C | | | 5.25 | | | | 3-1-2033 | | | | 725,000 | | | | 820,468 | |
| | | | |
Colorado Board of Governors State University Enterprise System Revenue Prerefunded Bond Series 2018 E-1 | | | 5.00 | | | | 3-1-2040 | | | | 555,000 | | | | 645,110 | |
| | | | |
Colorado Board of Governors State University Enterprise System Revenue Prerefunded Bond Series E-1 | | | 5.00 | | | | 3-1-2040 | | | | 390,000 | | | | 453,320 | |
| | | | |
Colorado Board of Governors State University Enterprise System Revenue Unrefunded Bond Series 2018 E-1 | | | 5.00 | | | | 3-1-2040 | | | | 1,055,000 | | | | 1,181,030 | |
| | | | |
Colorado ECFA Alexander Dawson School LLC Project | | | 5.00 | | | | 2-15-2040 | | | | 1,000,000 | | | | 1,027,790 | |
| | | | |
Colorado ECFA Charter School Aspen Ridge School Project Series 2015A 144A | | | 4.13 | | | | 7-1-2026 | | | | 595,000 | | | | 592,531 | |
| | | | |
Colorado ECFA Charter School Banning Lewis Ranch Academy Project Series A | | | 6.00 | | | | 12-15-2037 | | | | 500,000 | | | | 472,445 | |
| | | | |
Colorado ECFA Charter School Ben Franklin Academy Project | | | 5.00 | | | | 7-1-2036 | | | | 750,000 | | | | 809,423 | |
| | | | |
Colorado ECFA Charter School Collegiate Project (Syncora Guarantee Incorporated Insured) | | | 5.00 | | | | 6-15-2019 | | | | 230,000 | | | | 230,467 | |
| | | | |
Colorado ECFA Charter School Collegiate Project (Syncora Guarantee Incorporated Insured) | | | 5.25 | | | | 6-15-2024 | | | | 1,140,000 | | | | 1,141,949 | |
| | | | |
Colorado ECFA Charter School District Montessori Charter School Project | | | 5.00 | | | | 7-15-2037 | | | | 1,150,000 | | | | 1,222,186 | |
| | | | |
Colorado ECFA Charter School Pinnacle High School Project | | | 5.13 | | | | 12-1-2039 | | | | 500,000 | | | | 502,385 | |
| | | | |
Colorado ECFA Charter School Refunding and Improvement Bonds Skyview Academy Project 2014 144A | | | 4.13 | | | | 7-1-2024 | | | | 500,000 | | | | 500,120 | |
| | | | |
Colorado ECFA Charter School Refunding and Improvement Bonds University Laboratory School Project 2015 | | | 5.00 | | | | 12-15-2028 | | | | 600,000 | | | | 638,328 | |
| | | | |
Colorado ECFA Refunding Bonds The University Corporation for Atmosphere Research Project Series 2010 | | | 5.00 | | | | 9-1-2032 | | | | 1,265,000 | | | | 1,328,794 | |
| | | | |
Colorado ECFA Refunding Bonds The University Corporation for Atmosphere Research Project Series B | | | 5.00 | | | | 9-1-2030 | | | | 1,770,000 | | | | 1,925,778 | |
| | | | |
Colorado ECFA Union Colony School Project | | | 5.00 | | | | 4-1-2048 | | | | 715,000 | | | | 783,654 | |
| |
| | | | 14,275,778 | |
| | | | | | | | | | | | | | | | |
| | | | |
| GO Revenue: 9.44% | | | | | | | | | | | | | | | | |
| | | | |
Arapahoe County CO Copperleaf Metropolitan District #2 | | | 5.75 | | | | 12-1-2045 | | | | 500,000 | | | | 519,875 | |
| | | | |
Aurora CO Cornerstar Metropolitan District Refunding Bond Series A | | | 5.25 | | | | 12-1-2047 | | | | 1,000,000 | | | | 1,016,750 | |
| | | | |
Aurora CO Park 70 Metropolitan District | | | 5.00 | | | | 12-1-2046 | | | | 1,000,000 | | | | 1,049,220 | |
| | | | |
Broomfield CO Great Western Park Metropolitan District #2 | | | 5.00 | | | | 12-1-2046 | | | | 825,000 | | | | 804,359 | |
| | | | |
Colorado International Center Metropolitan District #3 Refunding Bonds | | | 4.63 | | | | 12-1-2031 | | | | 635,000 | | | | 613,105 | |
| | | | |
Colorado Parker Homestead Metropolitan District Refunding and Improvement Bonds | | | 5.63 | | | | 12-1-2044 | | | | 1,000,000 | | | | 1,038,330 | |
The accompanying notes are an integral part of these financial statements.
| | | | |
| 8 | | Wells Fargo Colorado Tax-Free Fund | | Portfolio of investments—December 31, 2018 (unaudited) |
| | | | | | | | | | | | | | | | |
| Security name | | Interest rate | | | Maturity date | | | Principal | | | Value | |
| | | | |
| GO Revenue(continued) | | | | | | | | | | | | | | | | |
| | | | |
Weld County CO Eaton Area Park & Recreation District Series 2015 | | | 5.50 | % | | | 12-1-2038 | | | $ | 1,075,000 | | | $ | 1,126,063 | |
| | | | |
Wheatlands CO Metropolitan District #2 (Build America Mutual Assurance Company Insured) | | | 5.00 | | | | 12-1-2030 | | | | 500,000 | | | | 569,345 | |
| |
| | | | 6,737,047 | |
| | | | | | | | | | | | | | | | |
| | | | |
| Health Revenue: 11.47% | | | | | | | | | | | | | | | | |
| | | | |
Aspen Valley Hospital District Refunding Bonds Series 2012 | | | 5.00 | | | | 10-15-2033 | | | | 600,000 | | | | 632,040 | |
| | | | |
Colorado Health Facilities Authority Catholic Health Initiatives Series D-1 | | | 6.25 | | | | 10-1-2033 | | | | 1,000,000 | | | | 1,003,840 | |
| | | | |
Colorado Health Facilities Authority Evangelical Lutheran Good Samaritan Society Series 2015A | | | 5.00 | | | | 6-1-2040 | | | | 1,000,000 | | | | 1,059,500 | |
| | | | |
Colorado Health Facilities Authority Fraiser Meadows Retirement Community Project Series 2017A | | | 5.25 | | | | 5-15-2047 | | | | 1,000,000 | | | | 1,061,060 | |
| | | | |
Colorado Health Facilities Authority Sisters of Charity Leavenworth Health System Series 2013A | | | 5.50 | | | | 1-1-2035 | | | | 1,000,000 | | | | 1,128,510 | |
| | | | |
Colorado Health Facilities Authority Sunny Vista Living Center Series 2015A 144A | | | 5.00 | | | | 12-1-2025 | | | | 670,000 | | | | 679,112 | |
| | | | |
Denver CO Health & Hospital Authority Refunding Bonds Series 2017A 144A | | | 5.00 | | | | 12-1-2034 | | | | 500,000 | | | | 553,345 | |
| | | | |
University of Colorado Hospital Authority Series A | | | 6.00 | | | | 11-15-2029 | | | | 2,000,000 | | | | 2,066,400 | |
| |
| | | | 8,183,807 | |
| | | | | | | | | | | | | | | | |
| | | | |
| Miscellaneous Revenue: 24.23% | | | | | | | | | | | | | | | | |
| | | | |
Aurora CO Certificate of Participation Refunding Bonds Series 2009A | | | 5.00 | | | | 12-1-2027 | | | | 2,000,000 | | | | 2,055,520 | |
| | | | |
Aurora CO E-470 Public Highway Authority CAB Series A (National Insured) (z) | | | 5.14 | | | | 9-1-2034 | | | | 4,000,000 | | | | 2,138,040 | |
| | | | |
Colorado Regional Transportation District Certificate of Participation Series 2014A | | | 5.00 | | | | 6-1-2044 | | | | 2,000,000 | | | | 2,170,100 | |
| | | | |
Colorado Regional Transportation District Certificate of Participation Series 2010A | | | 5.38 | | | | 6-1-2031 | | | | 2,500,000 | | | | 2,609,650 | |
| | | | |
Denver CO School District #1 Certificate of Participation Series B | | | 5.00 | | | | 12-15-2035 | | | | 1,000,000 | | | | 1,137,380 | |
| | | | |
Denver CO School District #1 Certificate of Participation Series B | | | 5.00 | | | | 12-15-2045 | | | | 1,200,000 | | | | 1,348,728 | |
| | | | |
Fremont County CO Finance Corporation Certificate of Participation Series 2013 | | | 5.25 | | | | 12-15-2038 | | | | 1,265,000 | | | | 1,365,188 | |
| | | | |
Garfield County CO Public Library District Lease Purchase Financing Program | | | 5.00 | | | | 12-1-2026 | | | | 715,000 | | | | 735,506 | |
| | | | |
Longmont CO Certificate of Participation Series 2014 | | | 5.00 | | | | 12-1-2034 | | | | 1,000,000 | | | | 1,114,350 | |
| | | | |
Platte Valley CO Fire Protection District | | | 5.00 | | | | 12-1-2036 | | | | 325,000 | | | | 342,703 | |
| | | | |
Westminster CO Certificate of Participation Series 2015A | | | 5.00 | | | | 12-1-2035 | | | | 2,000,000 | | | | 2,276,040 | |
| |
| | | | 17,293,205 | |
| | | | | | | | | | | | | | | | |
| | | | |
| Tax Revenue: 9.25% | | | | | | | | | | | | | | | | |
| | | | |
Colorado Park Creek Metropolitan District Refunding Bonds Series A | | | 5.00 | | | | 12-1-2045 | | | | 500,000 | | | | 539,305 | |
| | | | |
Colorado Regional Transportation District Fastracks Project Revenue Bonds Series 2013A | | | 5.00 | | | | 11-1-2031 | | | | 1,000,000 | | | | 1,094,900 | |
| | | | |
Commerce City CO Sales & Use Tax Bonds Series 2014 (AGM Insured) | | | 5.00 | | | | 8-1-2044 | | | | 1,250,000 | | | | 1,370,763 | |
| | | | |
Denver CO City & County Excise Tax Series A (AGC Insured) | | | 6.00 | | | | 9-1-2021 | | | | 2,000,000 | | | | 2,055,980 | |
| | | | |
Thornton CO Development Authority East 144th Avenue & I-25 Project Series B | | | 5.00 | | | | 12-1-2034 | | | | 1,375,000 | | | | 1,545,088 | |
| |
| | | | 6,606,036 | |
| | | | | | | | | | | | | | | | |
| | | | |
| Transportation Revenue: 1.81% | | | | | | | | | | | | | | | | |
| | | | |
Colorado High Performance Transportation Enterprise U.S. 36 & I-25 Managed Lanes | | | 5.75 | | | | 1-1-2044 | | | | 1,200,000 | | | | 1,290,564 | |
| | | | | | | | | | | | | | | | |
| | | | |
| Utilities Revenue: 4.67% | | | | | | | | | | | | | | | | |
| | | | |
Colorado Springs CO Utilities System Improvement Bonds Series 2013 B-2 | | | 5.00 | | | | 11-15-2038 | | | | 3,000,000 | | | | 3,332,847 | |
| | | | | | | | | | | | | | | | |
The accompanying notes are an integral part of these financial statements.
| | | | | | |
| Portfolio of investments—December 31, 2018 (unaudited) | | Wells Fargo Colorado Tax-Free Fund | | | 9 | |
| | | | | | | | | | | | | | | | |
| Security name | | Interest rate | | | Maturity date | | | Principal | | | Value | |
| | | | |
| Water & Sewer Revenue: 1.20% | | | | | | | | | | | | | | | | |
| | | | |
East Cherry Creek Valley CO Water & Sanitation District | | | 5.00 | % | | | 11-15-2032 | | | $ | 750,000 | | | $ | 858,953 | |
| | | | | | | | | | | | | | | | |
| | | | |
| | | | | | | | | | | | | | | 60,766,017 | |
| | | | | | | | | | | | | | | | |
| | | | |
Guam: 2.17% | | | | | | | | | | | | | | | | |
| | | | |
| Miscellaneous Revenue: 0.73% | | | | | | | | | | | | | | | | |
| | | | |
Guam Government Limited Obligation Section 30 Series A | | | 5.75 | | | | 12-1-2034 | | | | 500,000 | | | | 517,945 | |
| | | | | | | | | | | | | | | | |
| | | | |
| Tax Revenue: 1.44% | | | | | | | | | | | | | | | | |
| | | | |
Guam Government Business Privilege Tax Series A | | | 5.00 | | | | 1-1-2031 | | | | 1,000,000 | | | | 1,031,090 | |
| | | | | | | | | | | | | | | | |
| | | | |
| | | | | | | | | | | | | | | 1,549,035 | |
| | | | | | | | | | | | | | | | |
| | | | |
Maryland: 0.64% | | | | | | | | | | | | | | | | |
| | | | |
| Education Revenue: 0.64% | | | | | | | | | | | | | | | | |
| | | | |
Maryland Economic Development Corporation Salisbury University Project | | | 5.00 | | | | 6-1-2027 | | | | 235,000 | | | | 246,621 | |
| | | | |
Maryland Economic Development Corporation Salisbury University Project | | | 5.00 | | | | 6-1-2030 | | | | 200,000 | | | | 208,450 | |
| | | | |
| | | | | | | | | | | | | | | 455,071 | |
| | | | | | | | | | | | | | | | |
| | | | |
New York: 4.20% | | | | | | | | | | | | | | | | |
| | | | |
| Tax Revenue: 4.20% | | | | | | | | | | | | | | | | |
| | | | |
New York City NY Transitional Finance Authority Subordinated Series 2B (Dexia Credit Local SPA) ø | | | 1.75 | | | | 11-1-2022 | | | | 3,000,000 | | | | 3,000,000 | |
| | | | | | | | | | | | | | | | |
| | | | |
Pennsylvania: 2.29% | | | | | | | | | | | | | | | | |
| | | | |
| Education Revenue: 2.29% | | | | | | | | | | | | | | | | |
| | | | |
East Hempfield Township PA IDA Student Services Incorporated Student Housing Project of Millersville University | | | 5.00 | | | | 7-1-2029 | | | | 500,000 | | | | 531,285 | |
| | | | |
Pennsylvania HEFAR Indiana University Student Housing Project Series A | | | 5.00 | | | | 7-1-2032 | | | | 1,000,000 | | | | 1,099,350 | |
| | | | |
| | | | | | | | | | | | | | | 1,630,635 | |
| | | | | | | | | | | | | | | | |
| | | | |
Total Municipal Obligations (Cost $66,730,672) | | | | | | | | | | | | | | | 69,660,549 | |
| | | | | | | | | | | | | | | | |
| | | | |
| | | Yield | | | | | | Shares | | | | |
| Short-Term Investments: 1.69% | | | | | | | | | | | | | | | | |
| | | | |
| Investment Companies: 1.69% | | | | | | | | | | | | | | | | |
| | | | |
Wells Fargo Municipal Cash Management Money Market Fund Institutional Class (l)(u) | | | 1.65 | | | | | | | | 1,207,940 | | | | 1,208,423 | |
| | | | | | | | | | | | | | | | |
| | | |
Total Short-Term Investments (Cost $1,208,423) | | | | | | | | | | | | 1,208,423 | |
| | | | | | | | | | | | | | | | |
| | | | | | | | |
| Total investments in securities (Cost $67,939,095) | | | 99.29 | % | | | 70,868,972 | |
| | |
Other assets and liabilities, net | | | 0.71 | | | | 508,051 | |
| | | | | | | | |
| Total net assets | | | 100.00 | % | | $ | 71,377,023 | |
| | | | | | | | |
The accompanying notes are an integral part of these financial statements.
| | | | |
| 10 | | Wells Fargo Colorado Tax-Free Fund | | Portfolio of investments—December 31, 2018 (unaudited) |
| 144A | The security may be resold in transactions exempt from registration, normally to qualified institutional buyers, pursuant to Rule 144A under the Securities Act of 1933. |
| (z) | Zero coupon security. The rate represents the purchase yield to maturity. |
| ø | Variable rate demand notes are subject to a demand feature which reduces the effective maturity. The maturity date shown represents the final maturity date of the security. The interest rate is determined and reset by the issuer daily, weekly, or monthly depending upon the terms of the security. The rate shown is the rate in effect at period end. |
| (l) | The issuer of the security is an affiliated person of the Fund as defined in the Investment Company Act of 1940. |
| (u) | The rate represents the 7-day annualized yield at period end. |
Abbreviations:
| AGC | Assured Guaranty Corporation |
| AGM | Assured Guaranty Municipal |
| CAB | Capital appreciation bond |
| ECFA | Educational & Cultural Facilities Authority |
| HEFAR | Higher Education Facilities Authority Revenue |
| IDA | Industrial Development Authority |
| National | National Public Finance Guarantee Corporation |
| RDA | Redevelopment Authority |
| SPA | Standby purchase agreement |
Investments in Affiliates
An affiliated investment is an investment in which the Fund owns at least 5% of the outstanding voting shares of the issuer or as a result of other relationships, such as the Fund and the issuer having the same investment manager. Transactions with issuers that were either affiliated persons of the Fund at the beginning of the period or the end of the period were as follows:
| | | | | | | | | | | | | | | | | | | | | | | | | | | | | | | | | | | | |
| | | Shares,
beginning of
period | | | Shares
purchased | | | Shares
sold | | | Shares,
end of
period | | | Net
realized
gains
(losses) | | | Net
change in
unrealized
gains
(losses) | | | Income
from
affiliated
securities | | | Value,
end
of period | | | % of
net
assets | |
Short-Term Investments | | | | | | | | | | | | | | | | | | | | | | | | | | | | | | | | | | | | |
Investment Companies | | | | | | | | | | | | | | | | | | | | | | | | | | | | | | | | | | | | |
Wells Fargo Municipal Cash Management Money Market Fund Institutional Class | | | 1,429,900 | | | | 9,724,896 | | | | 9,946,856 | | | | 1,207,940 | | | $ | (227 | ) | | $ | 0 | | | $ | 2,131 | | | $ | 1,208,423 | | | | 1.69 | % |
The accompanying notes are an integral part of these financial statements.
| | | | | | |
| Statement of assets and liabilities—December 31, 2018 (unaudited) | | Wells Fargo Colorado Tax-Free Fund | | | 11 | |
| | | | |
| | | | |
| |
Assets | | | | |
Investments in unaffiliated securities, at value (cost $66,730,672) | | $ | 69,660,549 | |
Investments in affiliated securities, at value (cost $1,208,423) | | | 1,208,423 | |
Receivable for Fund shares sold | | | 365,736 | |
Receivable for interest | | | 626,875 | |
Prepaid expenses and other assets | | | 146,036 | |
| | | | |
Total assets | | | 72,007,619 | |
| | | | |
| |
Liabilities | | | | |
Payable for Fund shares redeemed | | | 431,762 | |
Due to custodian bank | | | 122,856 | |
Dividends payable | | | 37,658 | |
Administration fees payable | | | 7,777 | |
Management fee payable | | | 7,234 | |
Distribution fee payable | | | 4,402 | |
Trustees’ fees and expenses payable | | | 597 | |
Accrued expenses and other liabilities | | | 18,310 | |
| | | | |
Total liabilities | | | 630,596 | |
| | | | |
Total net assets | | $ | 71,377,023 | |
| | | | |
| |
NET ASSETS CONSIST OF | | | | |
Paid-in capital | | $ | 69,487,634 | |
Total distributable earnings | | | 1,889,389 | |
| | | | |
Total net assets | | $ | 71,377,023 | |
| | | | |
| |
COMPUTATION OF NET ASSET VALUE AND OFFERING PRICE PER SHARE | | | | |
Net assets – Class A | | $ | 29,238,091 | |
Shares outstanding – Class A1 | | | 2,732,207 | |
Net asset value per share – Class A | | | $10.70 | |
Maximum offering price per share – Class A2 | | | $11.20 | |
Net assets – Class C | | $ | 6,769,655 | |
Shares outstanding – Class C1 | | | 631,986 | |
Net asset value per share – Class C | | | $10.71 | |
Net assets – Administrator Class | | $ | 19,262,678 | |
Shares outstanding – Administrator Class1 | | | 1,800,215 | |
Net asset value per share – Administrator Class | | | $10.70 | |
Net assets – Institutional Class | | $ | 16,106,599 | |
Shares outstanding – Institutional Class1 | | | 1,504,960 | |
Net asset value per share – Institutional Class | | | $10.70 | |
| 1 | The Fund has an unlimited number of authorized shares. |
| 2 | Maximum offering price is computed as 100/95.50 of net asset value. On investments of $50,000 or more, the offering price is reduced. |
The accompanying notes are an integral part of these financial statements.
| | | | |
| 12 | | Wells Fargo Colorado Tax-Free Fund | | Statement of operations—six months ended December 31, 2018 (unaudited) |
| | | | |
| | | | |
| |
Investment income | | | | |
Interest | | $ | 1,598,656 | |
Income from affiliated securities | | | 2,131 | |
| | | | |
Total investment income | | | 1,600,787 | |
| | | | |
| |
Expenses | | | | |
Management fee | | | 149,480 | |
Administration fees | | | | |
Class A | | | 23,786 | |
Class C | | | 5,630 | |
Administrator Class | | | 10,586 | |
Institutional Class | | | 6,719 | |
Shareholder servicing fees | | | | |
Class A | | | 37,166 | |
Class C | | | 8,797 | |
Administrator Class | | | 26,464 | |
Distribution fee | | | | |
Class C | | | 26,390 | |
Custody and accounting fees | | | 5,054 | |
Professional fees | | | 24,100 | |
Registration fees | | | 35,546 | |
Shareholder report expenses | | | 11,849 | |
Trustees’ fees and expenses | | | 10,450 | |
Other fees and expenses | | | 5,523 | |
| | | | |
Total expenses | | | 387,540 | |
Less: Fee waivers and/or expense reimbursements | | | (97,698 | ) |
| | | | |
Net expenses | | | 289,842 | |
| | | | |
Net investment income | | | 1,310,945 | |
| | | | |
| |
REALIZED AND UNREALIZED GAINS (LOSSES) ON INVESTMENTS | | | | |
| |
| Net realized gains (losses) on: | | | | |
Unaffiliated securities | | | 133,663 | |
Affiliated securities | | | (227 | ) |
| | | | |
Net realized gains on investments | | | 133,436 | |
Net change in unrealized gains (losses) on investments | | | (875,777 | ) |
| | | | |
Net realized and unrealized gains (losses) on investments | | | (742,341 | ) |
| | | | |
Net increase in net assets resulting from operations | | $ | 568,604 | |
| | | | |
The accompanying notes are an integral part of these financial statements.
| | | | | | |
| Statement of changes in net assets | | Wells Fargo Colorado Tax-Free Fund | | | 13 | |
| | | | | | | | | | | | | | | | |
| | | Six months ended
December 31, 2018
(unaudited) | | | Year ended
June 30, 20181 | |
| | | |
Operations | | | | | | | | | | | | |
Net investment income | | | | | | $ | 1,310,945 | | | | | | | $ | 2,955,299 | |
Net realized gains on investments | | | | | | | 133,436 | | | | | | | | 307,712 | |
Net change in unrealized gains (losses) on investments | | | | | | | (875,777 | ) | | | | | | | (1,478,116 | ) |
| | | | |
Net increase in net assets resulting from operations | | | | | | | 568,604 | | | | | | | | 1,784,895 | |
| | | | |
| | | | |
Distributions to shareholders from net investment income and net realized gains | | | | | | | | | | | | | | | | |
Class A | | | | | | | (510,634 | ) | | | | | | | (1,145,737 | ) |
Class C | | | | | | | (94,114 | ) | | | | | | | (198,059 | ) |
Administrator Class | | | | | | | (389,912 | ) | | | | | | | (1,147,069 | ) |
Institutional Class | | | | | | | (316,599 | ) | | | | | | | (464,385 | ) |
| | | | |
Total distributions to shareholders | | | | | | | (1,311,259 | ) | | | | | | | (2,955,250 | ) |
| | | | |
| | | | |
Capital share transactions | | | Shares | | | | | | | | Shares | | | | | |
Proceeds from shares sold | | | | | | | | | | | | | | | | |
Class A | | | 274,537 | | | | 2,939,424 | | | | 259,505 | | | | 2,843,499 | |
Class C | | | 43,033 | | | | 461,505 | | | | 163,083 | | | | 1,787,412 | |
Administrator Class | | | 127,126 | | | | 1,363,224 | | | | 436,750 | | | | 4,746,505 | |
Institutional Class | | | 345,331 | | | | 3,691,574 | | | | 718,077 | | | | 7,818,931 | |
| | | | |
| | | | |
| | | | | | | 8,455,727 | | | | | | | | 17,196,347 | |
| | | | |
Reinvestment of distributions | | | | | | | | | | | | | | | | |
Class A | | | 43,558 | | | | 466,160 | | | | 100,750 | | | | 1,098,578 | |
Class C | | | 8,526 | | | | 91,326 | | | | 17,512 | | | | 191,074 | |
Administrator Class | | | 21,922 | | | | 234,661 | | | | 43,543 | | | | 474,529 | |
Institutional Class | | | 27,845 | | | | 298,017 | | | | 40,812 | | | | 444,651 | |
| | | | |
| | | | |
| | | | | | | 1,090,164 | | | | | | | | 2,208,832 | |
| | | | |
Payment for shares redeemed | | | | | | | | | | | | | | | | |
Class A | | | (508,779 | ) | | | (5,450,853 | ) | | | (693,757 | ) | | | (7,553,261 | ) |
Class C | | | (90,647 | ) | | | (970,424 | ) | | | (249,763 | ) | | | (2,729,066 | ) |
Administrator Class | | | (492,343 | ) | | | (5,270,069 | ) | | | (2,442,905 | ) | | | (26,754,627 | ) |
Institutional Class | | | (413,024 | ) | | | (4,414,771 | ) | | | (226,448 | ) | | | (2,472,137 | ) |
| | | | |
| | | | |
| | | | | | | (16,106,117 | ) | | | | | | | (39,509,091 | ) |
| | | | |
Net decrease in net assets resulting from capital share transactions | | | | | | | (6,560,226 | ) | | | | | | | (20,103,912 | ) |
| | | | |
Total decrease in net assets | | | | | | | (7,302,881 | ) | | | | | | | (21,274,267 | ) |
| | | | |
| | |
Net assets | | | | | | | | |
Beginning of period | | | | | | | 78,679,904 | | | | | | | | 99,954,171 | |
| | | | |
End of period | | | | | | $ | 71,377,023 | | | | | | | $ | 78,679,904 | |
| | | | |
| 1 | Effective for all filings after November 4, 2018, the SEC prospectively eliminated the requirement to parenthetically disclose undistributed net investment income at the end of the period and permitted the aggregation of distributions, with the exception of tax basis returns of capital. Undistributed net investment income at June 30, 2018 was $298,091. The disaggregated distributions information for the year ended June 30, 2018 is included in Note 7,Distributions to Shareholders, in the notes to the financial statements. |
The accompanying notes are an integral part of these financial statements.
| | | | |
| 14 | | Wells Fargo Colorado Tax-Free Fund | | Financial highlights |
(For a share outstanding throughout each period)
| | | | | | | | | | | | | | | | | | | | | | | | |
| | | Six months ended
December 31, 2018
(unaudited) | | | Year ended June 30 | |
| CLASS A | | 2018 | | | 2017 | | | 2016 | | | 2015 | | | 2014 | |
Net asset value, beginning of period | | | $10.80 | | | | $10.96 | | | | $11.50 | | | | $10.92 | | | | $10.85 | | | | $10.46 | |
Net investment income | | | 0.19 | | | | 0.36 | 1 | | | 0.34 | | | | 0.34 | 1 | | | 0.34 | 1 | | | 0.35 | 1 |
Net realized and unrealized gains (losses) on investments | | | (0.10 | ) | | | (0.16 | ) | | | (0.54 | ) | | | 0.58 | | | | 0.07 | | | | 0.39 | |
| | | | | | | | | | | | | | | | | | | | | | | | |
Total from investment operations | | | 0.09 | | | | 0.20 | | | | (0.20 | ) | | | 0.92 | | | | 0.41 | | | | 0.74 | |
Distributions to shareholders from | | | | | | | | | | | | | | | | | | | | | | | | |
Net investment income | | | (0.19 | ) | | | (0.36 | ) | | | (0.34 | ) | | | (0.34 | ) | | | (0.34 | ) | | | (0.35 | ) |
Net asset value, end of period | | | $10.70 | | | | $10.80 | | | | $10.96 | | | | $11.50 | | | | $10.92 | | | | $10.85 | |
Total return2 | | | 0.81 | % | | | 1.87 | % | | | (1.73 | )% | | | 8.53 | % | | | 3.82 | % | | | 7.26 | % |
Ratios to average net assets (annualized) | | | | | | | | | | | | | | | | | | | | | | | | |
Gross expenses | | | 1.06 | % | | | 0.85 | % | | | 0.94 | % | | | 0.93 | % | | | 0.93 | % | | | 0.94 | % |
Net expenses | | | 0.85 | % | | | 0.85 | % | | | 0.85 | % | | | 0.85 | % | | | 0.85 | % | | | 0.85 | % |
Net investment income | | | 3.43 | % | | | 3.32 | % | | | 3.05 | % | | | 3.02 | % | | | 3.12 | % | | | 3.35 | % |
Supplemental data | | | | | | | | | | | | | | | | | | | | | | | | |
Portfolio turnover rate | | | 0 | % | | | 10 | % | | | 25 | % | | | 13 | % | | | 23 | % | | | 33 | % |
Net assets, end of period (000s omitted) | | | $29,238 | | | | $31,576 | | | | $35,706 | | | | $41,341 | | | | $33,722 | | | | $35,088 | |
| 1 | Calculated based upon average shares outstanding |
| 2 | Total return calculations do not include any sales charges. Returns for periods of less than one year are not annualized. |
The accompanying notes are an integral part of these financial statements.
| | | | | | |
| Financial highlights | | Wells Fargo Colorado Tax-Free Fund | | | 15 | |
(For a share outstanding throughout each period)
| | | | | | | | | | | | | | | | | | | | | | | | |
| | | Six months ended
December 31, 2018
(unaudited) | | | Year ended June 30 | |
| CLASS C | | 2018 | | | 2017 | | | 2016 | | | 2015 | | | 2014 | |
Net asset value, beginning of period | | | $10.81 | | | | $10.98 | | | | $11.51 | | | | $10.93 | | | | $10.86 | | | | $10.47 | |
Net investment income | | | 0.15 | | | | 0.28 | | | | 0.26 | | | | 0.25 | | | | 0.26 | | | | 0.28 | |
Net realized and unrealized gains (losses) on investments | | | (0.10 | ) | | | (0.17 | ) | | | (0.53 | ) | | | 0.58 | | | | 0.07 | | | | 0.38 | |
| | | | | | | | | | | | | | | | | | | | | | | | |
Total from investment operations | | | 0.05 | | | | 0.11 | | | | (0.27 | ) | | | 0.83 | | | | 0.33 | | | | 0.66 | |
Distributions to shareholders from | | | | | | | | | | | | | | | | | | | | | | | | |
Net investment income | | | (0.15 | ) | | | (0.28 | ) | | | (0.26 | ) | | | (0.25 | ) | | | (0.26 | ) | | | (0.27 | ) |
Net asset value, end of period | | | $10.71 | | | | $10.81 | | | | $10.98 | | | | $11.51 | | | | $10.93 | | | | $10.86 | |
Total return1 | | | 0.43 | % | | | 1.02 | % | | | (2.37 | )% | | | 7.71 | % | | | 3.05 | % | | | 6.46 | % |
Ratios to average net assets (annualized) | | | | | | | | | | | | | | | | | | | | | | | | |
Gross expenses | | | 1.81 | % | | | 1.60 | % | | | 1.69 | % | | | 1.68 | % | | | 1.68 | % | | | 1.69 | % |
Net expenses | | | 1.60 | % | | | 1.60 | % | | | 1.60 | % | | | 1.60 | % | | | 1.60 | % | | | 1.60 | % |
Net investment income | | | 2.69 | % | | | 2.57 | % | | | 2.31 | % | | | 2.26 | % | | | 2.35 | % | | | 2.60 | % |
Supplemental data | | | | | | | | | | | | | | | | | | | | | | | | |
Portfolio turnover rate | | | 0 | % | | | 10 | % | | | 25 | % | | | 13 | % | | | 23 | % | | | 33 | % |
Net assets, end of period (000s omitted) | | | $6,770 | | | | $7,257 | | | | $8,125 | | | | $8,503 | | | | $4,173 | | | | $3,689 | |
| 1 | Total return calculations do not include any sales charges. Returns for periods of less than one year are not annualized. |
The accompanying notes are an integral part of these financial statements.
| | | | |
| 16 | | Wells Fargo Colorado Tax-Free Fund | | Financial highlights |
(For a share outstanding throughout each period)
| | | | | | | | | | | | | | | | | | | | | | | | |
| | | Six months ended
December 31, 2018
(unaudited) | | | Year ended June 30 | |
| ADMINISTRATOR CLASS | | 2018 | | | 2017 | | | 2016 | | | 2015 | | | 2014 | |
Net asset value, beginning of period | | | $10.80 | | | | $10.96 | | | | $11.50 | | | | $10.92 | | | | $10.85 | | | | $10.46 | |
Net investment income | | | 0.20 | 1 | | | 0.38 | 1 | | | 0.37 | 1 | | | 0.36 | | | | 0.37 | | | | 0.38 | |
Net realized and unrealized gains (losses) on investments | | | (0.10 | ) | | | (0.15 | ) | | | (0.54 | ) | | | 0.58 | | | | 0.07 | | | | 0.39 | |
| | | | | | | | | | | | | | | | | | | | | | | | |
Total from investment operations | | | 0.10 | | | | 0.23 | | | | (0.17 | ) | | | 0.94 | | | | 0.44 | | | | 0.77 | |
Distributions to shareholders from | | | | | | | | | | | | | | | | | | | | | | | | |
Net investment income | | | (0.20 | ) | | | (0.39 | ) | | | (0.37 | ) | | | (0.36 | ) | | | (0.37 | ) | | | (0.38 | ) |
Net asset value, end of period | | | $10.70 | | | | $10.80 | | | | $10.96 | | | | $11.50 | | | | $10.92 | | | | $10.85 | |
Total return2 | | | 0.93 | % | | | 2.12 | % | | | (1.49 | )% | | | 8.80 | % | | | 4.08 | % | | | 7.53 | % |
Ratios to average net assets (annualized) | | | | | | | | | | | | | | | | | | | | | | | | |
Gross expenses | | | 1.00 | % | | | 0.78 | % | | | 0.88 | % | | | 0.87 | % | | | 0.87 | % | | | 0.88 | % |
Net expenses | | | 0.60 | % | | | 0.60 | % | | | 0.60 | % | | | 0.60 | % | | | 0.60 | % | | | 0.60 | % |
Net investment income | | | 3.68 | % | | | 3.52 | % | | | 3.29 | % | | | 3.27 | % | | | 3.36 | % | | | 3.60 | % |
Supplemental data | | | | | | | | | | | | | | | | | | | | | | | | |
Portfolio turnover rate | | | 0 | % | | | 10 | % | | | 25 | % | | | 13 | % | | | 23 | % | | | 33 | % |
Net assets, end of period (000s omitted) | | | $19,263 | | | | $23,156 | | | | $45,022 | | | | $65,285 | | | | $52,294 | | | | $44,272 | |
| 1 | Calculated based upon average shares outstanding |
| 2 | Returns for periods of less than one year are not annualized. |
The accompanying notes are an integral part of these financial statements.
| | | | | | |
| Financial highlights | | Wells Fargo Colorado Tax-Free Fund | | | 17 | |
(For a share outstanding throughout each period)
| | | | | | | | | | | | |
| | | Six months ended
December 31, 2018
(unaudited) | | | Year ended June 30 | |
| INSTITUTIONAL CLASS | | 2018 | | | 20171 | |
Net asset value, beginning of period | | | $10.80 | | | | $10.97 | | | | $11.19 | |
Net investment income | | | 0.20 | | | | 0.40 | | | | 0.25 | |
Net realized and unrealized gains (losses) on investments | | | (0.10 | ) | | | (0.17 | ) | | | (0.22 | ) |
| | | | | | | | | | | | |
Total from investment operations | | | 0.10 | | | | 0.23 | | | | 0.03 | |
Distributions to shareholders from | | | | | | | | | | | | |
Net investment income | | | (0.20 | ) | | | (0.40 | ) | | | (0.25 | ) |
Net asset value, end of period | | | $10.70 | | | | $10.80 | | | | $10.97 | |
Total return2 | | | 0.97 | % | | | 2.11 | % | | | 0.33 | % |
Ratios to average net assets (annualized) | | | | | | | | | | | | |
Gross expenses | | | 0.73 | % | | | 0.52 | % | | | 0.55 | % |
Net expenses | | | 0.52 | % | | | 0.52 | % | | | 0.51 | % |
Net investment income | | | 3.77 | % | | | 3.67 | % | | | 3.49 | % |
Supplemental data | | | | | | | | | | | | |
Portfolio turnover rate | | | 0 | % | | | 10 | % | | | 25 | % |
Net assets, end of period (000s omitted) | | | $16,107 | | | | $16,691 | | | | $11,102 | |
| 1 | For the period from October 31, 2016 (commencement of class operations) to June 30, 2017 |
| 2 | Returns for periods of less than one year are not annualized. |
The accompanying notes are an integral part of these financial statements.
| | | | |
| 18 | | Wells Fargo Colorado Tax-Free Fund | | Notes to financial statements (unaudited) |
1. ORGANIZATION
Wells Fargo Funds Trust (the “Trust”), a Delaware statutory trust organized on March 10, 1999, is an open-end management investment company registered under the Investment Company Act of 1940, as amended (the “1940 Act”). As an investment company, the Trust follows the accounting and reporting guidance in Financial Accounting Standards Board (“FASB”) Accounting Standards Codification Topic 946, Financial Services – Investment Companies. These financial statements report on the Wells Fargo Colorado Tax-Free Fund (the “Fund”) which is a diversified series of the Trust.
2. SIGNIFICANT ACCOUNTING POLICIES
The following significant accounting policies, which are consistently followed in the preparation of the financial statements of the Fund, are in conformity with U.S. generally accepted accounting principles which require management to make estimates and assumptions that affect the reported amounts of assets and liabilities, disclosure of contingent assets and liabilities at the date of the financial statements, and the reported amounts of revenues and expenses during the reporting period. Actual results could differ from those estimates.
Securities valuation
All investments are valued each business day as of the close of regular trading on the New York Stock Exchange (generally 4 p.m. Eastern Time), although the Fund may deviate from this calculation time under unusual or unexpected circumstances.
Debt securities are valued at the evaluated bid price provided by an independent pricing service (e.g. taking into account various factors, including yields, maturities, or credit ratings) or, if a reliable price is not available, the quoted bid price from an independent broker-dealer.
Investments in registered open-end investment companies are valued at net asset value.
Investments which are not valued using any of the methods discussed above are valued at their fair value, as determined in good faith by the Board of Trustees of the Fund. The Board of Trustees has established a Valuation Committee comprised of the Trustees and has delegated to it the authority to take any actions regarding the valuation of portfolio securities that the Valuation Committee deems necessary or appropriate, including determining the fair value of portfolio securities, unless the determination has been delegated to the Wells Fargo Asset Management Pricing Committee at Wells Fargo Funds Management, LLC (“Funds Management”). The Board of Trustees retains the authority to make or ratify any valuation decisions or approve any changes to the Valuation Procedures as it deems appropriate. On a quarterly basis, the Board of Trustees receives reports on any valuation actions taken by the Valuation Committee or the Wells Fargo Asset Management Pricing Committee which may include items for ratification.
Security transactions and income recognition
Securities transactions are recorded on a trade date basis. Realized gains or losses are recorded on the basis of identified cost.
Interest income is accrued daily and bond discounts are accreted and premiums are amortized daily. To the extent debt obligations are placed on non-accrual status, any related interest income may be reduced by writing off interest receivables when the collection of all or a portion of interest has been determined to be doubtful based on consistently applied procedures and the fair value has decreased. If the issuer subsequently resumes interest payments or when the collectability of interest is reasonably assured, the debt obligation is removed from non-accrual status.
Distributions to shareholders
Distributions to shareholders from net investment income are declared daily and paid monthly. Distributions from net realized gains, if any, are recorded on the ex-dividend date and paid at least annually. Such distributions are determined in accordance with income tax regulations and may differ from U.S. generally accepted accounting principles. Dividend sources are estimated at the time of declaration. The tax character of distributions is determined as of the Fund’s fiscal year end. Therefore, a portion of the Fund’s distributions made prior to the Fund’s fiscal year end may be categorized as a tax return of capital at year end.
Federal and other taxes
The Fund intends to continue to qualify as a regulated investment company by distributing substantially all of its investment company taxable and tax-exempt income and any net realized capital gains (after reduction for capital loss carryforwards) sufficient to relieve it from all, or substantially all, federal income taxes. Accordingly, no provision for federal income taxes was required.
| | | | | | |
| Notes to financial statements (unaudited) | | Wells Fargo Colorado Tax-Free Fund | | | 19 | |
The Fund’s income and federal excise tax returns and all financial records supporting those returns for the prior three fiscal years are subject to examination by the federal and Delaware revenue authorities. Management has analyzed the Fund’s tax positions taken on federal, state, and foreign tax returns for all open tax years and does not believe that there are any uncertain tax positions that require recognition of a tax liability.
As of December 31, 2018, the aggregate cost of all investments for federal income tax purposes was $67,939,095 and the unrealized gains (losses) consisted of:
| | | | |
| |
Gross unrealized gains | | $ | 3,036,850 | |
| |
Gross unrealized losses | | | (106,973 | ) |
| |
Net unrealized gains | | $ | 2,929,877 | |
Capital loss carryforwards that do not expire are required to be utilized prior to capital loss carryforwards that expire. As of June 30, 2018, capital loss carryforwards available to offset future net realized capital gains were as follows through the indicated expiration dates:
| | |
| | | No expiration |
| 2019 | | Short-term |
| |
| $(57,793) | | $(1,414,113) |
Class allocations
The separate classes of shares offered by the Fund differ principally in applicable sales charges, distribution, shareholder servicing, and administration fees. Class specific expenses are charged directly to that share class. Investment income, common expenses, and realized and unrealized gains (losses) on investments are allocated daily to each class of shares based on the relative proportion of net assets of each class.
3. FAIR VALUATION MEASUREMENTS
Fair value measurements of investments are determined within a framework that has established a fair value hierarchy based upon the various data inputs utilized in determining the value of the Fund’s investments. The three-level hierarchy gives the highest priority to unadjusted quoted prices in active markets for identical assets or liabilities (Level 1) and the lowest priority to unobservable inputs (Level 3). The Fund’s investments are classified within the fair value hierarchy based on the lowest level of input that is significant to the fair value measurement. The inputs are summarized into three broad levels as follows:
| ∎ | | Level 1 – quoted prices in active markets for identical securities |
| ∎ | | Level 2 – other significant observable inputs (including quoted prices for similar securities, interest rates, prepayment speeds, credit risk, etc.) |
| ∎ | | Level 3 – significant unobservable inputs (including the Fund’s own assumptions in determining the fair value of investments) |
The inputs or methodologies used for valuing investments in securities are not necessarily an indication of the risk associated with investing in those securities.
The following is a summary of the inputs used in valuing the Fund’s assets and liabilities as of December 31, 2018:
| | | | | | | | | | | | | | | | |
| | | | |
| | | Quoted prices
(Level 1) | | | Other significant
observable inputs
(Level 2) | | | Significant
unobservable inputs
(Level 3) | | | Total | |
| | | | |
Assets | | | | | | | | | | | | | | | | |
Investments in: | | | | | | | | | | | | | | | | |
| | | | |
Municipal obligations | | $ | 0 | | | $ | 69,660,549 | | | $ | 0 | | | $ | 69,660,549 | |
| | | | |
Short-term investments | | | | | | | | | | | | | | | | |
| | | | |
Investment companies | | | 1,208,423 | | | | 0 | | | | 0 | | | | 1,208,423 | |
| | | | |
Total assets | | $ | 1,208,423 | | | $ | 69,660,549 | | | $ | 0 | | | $ | 70,868,972 | |
| | | | |
| 20 | | Wells Fargo Colorado Tax-Free Fund | | Notes to financial statements (unaudited) |
Additional sector, industry or geographic detail is included in the Portfolio of Investments.
At December 31, 2018, the Fund did not have any transfers into/out of Level 3.
4. TRANSACTIONS WITH AFFILIATES
Management fee
Funds Management, an indirect wholly owned subsidiary of Wells Fargo & Company (“Wells Fargo”), is the manager of the Fund and provides advisory and fund-level administrative services under an investment management agreement. Under the investment management agreement, Funds Management is responsible for, among other services, implementing the investment objectives and strategies of the Fund, supervising the subadviser and providing fund-level administrative services in connection with the Fund’s operations. As compensation for its services under the investment management agreement, Funds Management is entitled to receive an annual management fee starting at 0.40% and declining to 0.28% as the average daily net assets of the Fund increase. For the six months ended December 31, 2018, the management fee was equivalent to an annual rate of 0.40% of the Fund’s average daily net assets.
Funds Management has retained the services of a subadviser to provide daily portfolio management to the Fund. The fee for subadvisory services is borne by Funds Management. Wells Capital Management Incorporated , an affiliate of Funds Management and an indirect wholly owned subsidiary of Wells Fargo, is the subadviser to the Fund and is entitled to receive a fee from Funds Management at an annual rate starting at 0.20% and declining to 0.10% as the average daily net assets of the Fund increase.
Administration fees
Under a class-level administration agreement, Funds Management provides class-level administrative services to the Fund, which includes paying fees and expenses for services provided by the transfer agent, sub-transfer agents, omnibus account servicers and record-keepers. As compensation for its services under the class-level administration agreement, Funds Management receives an annual fee which is calculated based on the average daily net assets of each class as follows:
| | | | |
| | | Class-level
administration fee | |
| |
Class A, Class C | | | 0.16 | % |
| |
Administrator Class | | | 0.10 | |
| |
Institutional Class | | | 0.08 | |
Funds Management has contractually waived and/or reimbursed management and administration fees to the extent necessary to maintain certain net operating expense ratios for the Fund. When each class of the Fund has exceeded its expense cap, Funds Management has waived fees and/or reimbursed expenses from fund level expenses on a proportionate basis and then from class specific expenses; otherwise, waivers and/or reimbursements are applied against class specific expenses before fund level expenses. Funds Management has committed through October 31, 2019 to waive fees and/or reimburse expenses to the extent necessary to cap the Fund’s expenses at 0.85% for Class A shares, 1.60% for Class C shares, 0.60% for Administrator Class shares and 0.52% for Institutional Class shares. After this time, the cap may be increased or the commitment to maintain the cap may be terminated only with the approval of the Board of Trustees.
Distribution fee
The Trust has adopted a distribution plan for Class C shares of the Fund pursuant to Rule 12b-1 under the 1940 Act. A distribution fee is charged to Class C and paid to Wells Fargo Funds Distributor, LLC (“Funds Distributor”), the principal underwriter, at an annual rate of 0.75% of the average daily net assets of Class C shares.
In addition, Funds Distributor is entitled to receive the front-end sales charge from the purchase of Class A shares and a contingent deferred sales charge on the redemption of certain Class A shares. Funds Distributor is also entitled to receive the contingent deferred sales charges from redemptions of Class C shares. For the six months ended December 31, 2018, Funds Distributor received $924 from the sale of Class A shares and $2,379 in contingent deferred sales charges from redemptions of Class A shares. No contingent deferred sales charges were incurred by Class C shares for the six months ended December 31, 2018.
| | | | | | |
| Notes to financial statements (unaudited) | | Wells Fargo Colorado Tax-Free Fund | | | 21 | |
Shareholder servicing fees
The Trust has entered into contracts with one or more shareholder servicing agents, whereby Class A, Class C, and Administrator Class of the Fund are charged a fee at an annual rate of 0.25% of the average daily net assets of each respective class.
A portion of these total shareholder servicing fees were paid to affiliates of Wells Fargo.
Interfund transactions
The Fund may purchase or sell portfolio investment securities to certain other Wells Fargo affiliates pursuant toRule 17a-7 under the 1940 Act and under procedures adopted by the Board of Trustees. The procedures have been designed to ensure that these interfund transactions, which do not incur broker commissions, are effected at current market prices. Pursuant to these procedures, the Fund had $4,900,000 and $3,100,000 in interfund purchases and sales, respectively, during the six months ended December 31, 2018.
5. INVESTMENT PORTFOLIO TRANSACTIONS
Purchases and sales of investments, excluding U.S. government obligations (if any) and short-term securities, for the six months ended December 31, 2018 were $0 and $7,869,581, respectively.
6. BANK BORROWINGS
The Trust (excluding the money market funds), Wells Fargo Master Trust and Wells Fargo Variable Trust are parties to a $280,000,000 revolving credit agreement whereby the Fund is permitted to use bank borrowings for temporary or emergency purposes, such as to fund shareholder redemption requests. Interest under the credit agreement is charged to the Fund based on a borrowing rate equal to the higher of the Federal Funds rate in effect on that day plus 1.25% or the overnight LIBOR rate in effect on that day plus 1.25%. In addition, an annual commitment fee equal to 0.25% of the unused balance is allocated to each participating fund.
For the six months ended December 31, 2018, there were no borrowings by the Fund under the agreement.
7. DISTRIBUTIONS TO SHAREHOLDERS
Effective for all filings after November 4, 2018, the Securities and Exchange Commission eliminated the requirement to separately state the components of distributions to shareholders under U.S. generally accepted accounting principles. The amounts of distributions to shareholders for the year ended June 30, 2018 were as follows:
| | | | |
| | | Net investment
income | |
| |
Class A | | | $1,145,737 | |
| |
Class C | | | 198,059 | |
| |
Administrator Class | | | 1,147,069 | |
| |
Institutional Class | | | 464,385 | |
8. CONCENTRATION RISK
The Fund invests a substantial portion of its assets in issuers of municipal debt securities located in a single state or territories of the U.S. Therefore, it may be more affected by economic and political developments in that state or region than would be a comparable general tax-exempt fund.
9. INDEMNIFICATION
Under the Trust’s organizational documents, the officers and Trustees have been granted certain indemnification rights against certain liabilities that may arise out of performance of their duties to the Trust. Additionally, in the normal course of business, the Trust may enter into contracts with service providers that contain a variety of indemnification clauses. The Trust’s maximum exposure under these arrangements is dependent on future claims that may be made against the Fund and, therefore, cannot be estimated.
10. REORGANIZATION
At a regular meeting of the Board of Trustees held on November 8 and 9, 2018, the Trustees of the Fund approved a Plan of Reorganization (the “Plan”). Under the Plan, Wells Fargo Municipal Bond Fund will acquire the assets and assume the liabilities of the Fund in exchange for shares of Wells Fargo Municipal Bond Fund.
| | | | |
| 22 | | Wells Fargo Colorado Tax-Free Fund | | Notes to financial statements (unaudited) |
At a Special Meeting of Shareholders of the Fund held on February 19, 2019, the shareholders approved the Plan to merge the Fund into Wells Fargo Municipal Bond Fund. The merger is scheduled to take place on or about March 15, 2019.
11. NEW ACCOUNTING PRONOUNCEMENT
In August 2018, FASB issued Accounting Standards Update (“ASU”) No. 2018-13, Fair Value Measurement (Topic 820) Disclosure Framework—Changes to the Disclosure Requirements for Fair Value Measurement. ASU 2018-13 updates the disclosure requirements for fair value measurements by modifying or removing certain disclosures and adding certain new disclosures. The amendments are effective for fiscal years, and interim periods within those fiscal years, beginning after December 15, 2019. Early adoption is permitted. Management has adopted the removal and modification of disclosures early, as permitted, and will adopt the additional new disclosures at the effective date.
| | | | | | |
| Other information (unaudited) | | Wells Fargo Colorado Tax-Free Fund | | | 23 | |
PROXY VOTING INFORMATION
A description of the policies and procedures used to determine how to vote proxies relating to portfolio securities is available, upon request, by calling1-800-222-8222, visiting our website atwellsfargofunds.com, or visiting the SEC website at sec.gov. Information regarding how the Fund voted proxies relating to portfolio securities during the most recent 12-month period ended June 30 is available on the Fund’s website atwellsfargofunds.comor by visiting the SEC website at sec.gov.
PORTFOLIO HOLDINGS INFORMATION
The complete portfolio holdings for the Fund are publicly available monthly on the Fund’s website (wellsfargofunds.com), on a one-month delayed basis. In addition, top ten holdings information (excluding derivative positions) for the Fund is publicly available on the Fund’s website on a monthly, seven-day or more delayed basis. The Fund files its complete schedule of portfolio holdings with the SEC for the first and third quarters of each fiscal year on Form N-Q, which is available by visiting the SEC website at sec.gov. In addition, the Fund’s Form N-Q may be reviewed and copied at the SEC’s Public Reference Room in Washington, DC, and at regional offices in New York City, at 233 Broadway, and in Chicago, at 175 West Jackson Boulevard, Suite 900. Information about the Public Reference Room may be obtained by calling 1-800-SEC-0330.
| | | | |
| 24 | | Wells Fargo Colorado Tax-Free Fund | | Other information (unaudited) |
BOARD OF TRUSTEES AND OFFICERS
Each of the Trustees and Officers1 listed in the table below acts in identical capacities for each fund in the Wells Fargo family of funds, which consists of 152 mutual funds comprising the Wells Fargo Funds Trust, Wells Fargo Variable Trust, Wells Fargo Master Trust and four closed-end funds (collectively the “Fund Complex”). This table should be read in conjunction with the Prospectus and the Statement of Additional Information2. The mailing address of each Trustee and Officer is 525 Market Street, 12th Floor, San Francisco, CA 94105. Each Trustee and Officer serves an indefinite term, however, each Trustee serves such term until reaching the mandatory retirement age established by the Trustees.
Independent Trustees
| | | | | | |
Name and
year of birth | | Position held and
length of service* | | Principal occupations during past five years or longer | | Current other
public company or
investment company
directorships |
| | | |
William R. Ebsworth
(Born 1957) | | Trustee, since 2015 | | Retired. From 1984 to 2013, equities analyst, portfolio manager, research director and chief investment officer at Fidelity Management and Research Company in Boston, Tokyo, and Hong Kong, and retired in 2013 as Chief Investment Officer of Fidelity Strategic Advisers, Inc. where he led a team of investment professionals managing client assets. Prior thereto, Board member of Hong Kong Securities Clearing Co., Hong Kong Options Clearing Corp., the Thailand International Fund, Ltd., Fidelity Investments Life Insurance Company, and Empire Fidelity Investments Life Insurance Company. Board member of the Vincent Memorial Hospital Endowment (non-profit organization), where he serves on the Investment Committee and as a Chair of the Audit Committee. Mr. Ebsworth is a CFA® charterholder. | | N/A |
| | | |
Jane A. Freeman
(Born 1953) | | Trustee, since 2015; Chair Liaison, since 2018 | | Retired. From 2012 to 2014 and 1999 to 2008, Chief Financial Officer of Scientific Learning Corporation. From 2008 to 2012, Ms. Freeman provided consulting services related to strategic business projects. Prior to 1999, Portfolio Manager at Rockefeller & Co. and Scudder, Stevens & Clark. Board member of the Harding Loevner Funds from 1996 to 2014, serving as both Lead Independent Director and chair of the Audit Committee. Board member of the Russell Exchange Traded Funds Trust from 2011 to 2012 and the chair of the Audit Committee. Ms. Freeman is a Board Member of The Ruth Bancroft Garden (non-profit organization). She is also an inactive Chartered Financial Analyst. | | N/A |
| | | |
Isaiah Harris, Jr.3
(Born 1952) | | Trustee, since 2009; Audit Committee Chairman, since 2019 | | Retired. Chairman of the Board of CIGNA Corporation since 2009, and Director since 2005. From 2003 to 2011, Director of Deluxe Corporation. Prior thereto, President and CEO of BellSouth Advertising and Publishing Corp. from 2005 to 2007, President and CEO of BellSouth Enterprises from 2004 to 2005 and President of BellSouth Consumer Services from 2000 to 2003. Emeritus member of the Iowa State University Foundation Board of Governors. Emeritus Member of the Advisory Board of Iowa State University School of Business. Advisory Board Member, Palm Harbor Academy (private school). Advisory Board Member, Child Evangelism Fellowship (non-profit). Mr. Harris is a certified public accountant (inactive status). | | CIGNA Corporation |
| | | |
Judith M. Johnson3
(Born 1949) | | Trustee, since 2008; Audit Committee Chairman, from 2009 to 2018 | | Retired. Prior thereto, Chief Executive Officer and Chief Investment Officer of Minneapolis Employees Retirement Fund from 1996 to 2008. Ms. Johnson is an attorney, certified public accountant and a certified managerial accountant. | | N/A |
| | | |
David F. Larcker
(Born 1950) | | Trustee, since 2009 | | James Irvin Miller Professor of Accounting at the Graduate School of Business, Stanford University, Director of the Corporate Governance Research Initiative and Senior Faculty of The Rock Center for Corporate Governance since 2006. From 2005 to 2008, Professor of Accounting at the Graduate School of Business, Stanford University. Prior thereto, Ernst & Young Professor of Accounting at The Wharton School, University of Pennsylvania from 1985 to 2005. | | N/A |
| | | | | | |
| Other information (unaudited) | | Wells Fargo Colorado Tax-Free Fund | | | 25 | |
| | | | | | |
Name and
year of birth | | Position held and
length of service* | | Principal occupations during past five years or longer | | Current other
public company or
investment company
directorships |
| | | |
Olivia S. Mitchell
(Born 1953) | | Trustee, since 2006; Nominating and Governance Committee Chairman, since 2018 | | International Foundation of Employee Benefit Plans Professor, Wharton School of the University of Pennsylvania since 1993. Director of Wharton’s Pension Research Council and Boettner Center on Pensions & Retirement Research, and Research Associate at the National Bureau of Economic Research. Previously, Cornell University Professor from 1978 to 1993. | | N/A |
| | | |
Timothy J. Penny
(Born 1951) | | Trustee, since 1996; Chairman, since 2018; Vice Chairman, from 2017 to 2018 | | President and Chief Executive Officer of Southern Minnesota Initiative Foundation, a non-profit organization, since 2007. Member of the Board of Trustees of NorthStar Education Finance, Inc., a non-profit organization, since 2007. | | N/A |
| | | |
James G. Polisson
(Born 1959) | | Trustee, since 2018; Advisory Board Member, from 2017 to 2018 | | Retired. Chief Marketing Officer, Source (ETF) UK Services, Ltd, from 2015 to 2017. From 2012 to 2015, Principal of The Polisson Group, LLC, a management consulting, corporate advisory and principal investing company. Chief Executive Officer and Managing Director at Russell Investments, Global Exchange Traded Funds from 2010 to 2012. Managing Director of Barclays Global Investors from 1998 to 2010 and Global Chief Marketing Officer for iShares and Barclays Global Investors from 2000 to 2010. Trustee of the San Francisco Mechanics’ Institute, a non-profit organization, from 2013 to 2015. Board member of the Russell Exchange Traded Fund Trust from 2011 to 2012. Director of Barclays Global Investors Holdings Deutschland GmbH from 2006 to 2009. Mr. Polisson is an attorney and has a retired status with the Massachusetts and District of Columbia Bar Associations. | | N/A |
| | | |
Michael S. Scofield4
(Born 1943) | | Trustee, since 2010 | | Served on the Investment Company Institute’s Board of Governors and Executive Committee from 2008-2011 as well the Governing Council of the Independent Directors Council from 2006-2011 and the Independent Directors Council Executive Committee from 2008-2011. Trustee of the Evergreen Fund complex (and its predecessors) from 1984 to 2010. Chairman of the Evergreen Funds from 2000-2010. Former Trustee of the Mentor Funds. Retired Attorney, Law Offices of Michael S. Scofield. | | N/A |
| | | |
| Pamela Wheelock (Born 1959) | | Trustee, since 2018; Advisory Board Member, from 2017 to 2018 | | Chief Operating Officer, Twin Cities Habitat for Humanity, since January, 2017. Vice President of University Services, University of Minnesota from 2012 to 2017. Prior thereto, on the Board of Directors, Governance Committee and Finance Committee for the Minnesota Philanthropy Partners (Saint Paul Foundation) from 2012 to 2018, Interim President and Chief Executive Officer of Blue Cross Blue Shield of Minnesota from 2010 to 2011, Chairman of the Board from 2009 to 2011 and Board Director from 2003 to 2015. Vice President, Leadership and Community Engagement, Bush Foundation, Saint Paul, Minnesota (a private foundation) from 2009 to 2011. Executive Vice President and Chief Financial Officer, Minnesota Sports and Entertainment from 2004 to 2009 and Senior Vice President from 2002 to 2004. Commissioner of Finance, State of Minnesota, from 1999 to 2002. Currently the Board Chair of the Minnesota Wild Foundation since 2010. | | N/A |
| * | Length of service dates reflect the Trustee’s commencement of service with the Trust’s predecessor entities, where applicable. |
| | | | |
| 26 | | Wells Fargo Colorado Tax-Free Fund | | Other information (unaudited) |
Officers
| | | | | | |
Name and
year of birth | | Position held and
length of service | | Principal occupations during past five years or longer | | |
| | | |
Andrew Owen
(Born 1960) | | President, since 2017 | | Executive Vice President of Wells Fargo & Company and Head of Affiliated Managers, Wells Fargo Asset Management, since 2014. In addition, Mr. Owen is currently President, Chief Executive Officer and Director of Wells Fargo Funds Management, LLC since 2017. Prior thereto, Executive Vice President responsible for marketing, investments and product development for Wells Fargo Funds Management, LLC, from 2009 to 2014. | | |
| | | |
Nancy Wiser1
(Born 1967) | | Treasurer, since 2012 | | Executive Vice President of Wells Fargo Funds Management, LLC since 2011. Chief Operating Officer and Chief Compliance Officer at LightBox Capital Management LLC, from 2008 to 2011. | | |
| | | |
Alexander Kymn
(Born 1973) | | Secretary, since 2018; Chief Legal Officer, since 2018 | | Senior Company Counsel of Wells Fargo Bank, N.A. since 2018 (previously Senior Counsel from 2007 to 2018). Vice President of Wells Fargo Funds Management, LLC from 2008 to 2014. | | |
| | | |
Michael H. Whitaker
(Born 1967) | | Chief Compliance Officer, since 2016 | | Senior Vice President and Chief Compliance Officer since 2016. Senior Vice President and Chief Compliance Officer for Fidelity Investments from 2007 to 2016. | | |
| | | |
David Berardi
(Born 1975) | | Assistant Treasurer, since 2009 | | Vice President of Wells Fargo Funds Management, LLC since 2009. Vice President of Evergreen Investment Management Company, LLC from 2008 to 2010. Manager of Fund Reporting and Control for Evergreen Investment Management Company, LLC from 2004 to 2010. | | |
| | | |
Jeremy DePalma1
(Born 1974) | | Assistant Treasurer, since 2009 | | Senior Vice President of Wells Fargo Funds Management, LLC since 2009. Senior Vice President of Evergreen Investment Management Company, LLC from 2008 to 2010 and head of the Fund Reporting and Control Team within Fund Administration from 2005 to 2010. | | |
| 1 | Nancy Wiser acts as Treasurer of 76 funds in the Fund Complex. Jeremy DePalma acts as Treasurer of 76 funds and Assistant Treasurer of 76 funds in the Fund Complex. |
| 2 | The Statement of Additional Information includes additional information about the Trustees and is available, without charge, upon request, by calling1-800-222-8222 or by visiting the website atwellsfargofunds.com. |
| 3 | Mr. Harris replaced Ms. Johnson as the Chairman of the Audit Committee effective January 1, 2019. |
| 4 | Mr. Scofield retired on December 31, 2018. |
| | | | | | |
| Appendix A (unaudited) | | Wells Fargo Colorado Tax-Free Fund | | | 27 | |
SALES CHARGE REDUCTIONS AND WAIVERS FOR CERTAIN INTERMEDIARIES
Raymond James & Associates, Inc., Raymond James Financial Services & Raymond James affiliates (“Raymond James”)
Effective on or about March 1, 2019, shareholders purchasing Fund shares through a Raymond James platform or account will be eligible only for the following load waivers (front-end sales charge waivers and contingent deferred, or back-end, sales charge waivers) and discounts, which may differ from those disclosed elsewhere in the Fund’s Prospectus or SAI.
Front-end Sales Load Waivers on Class A shares Available at Raymond James
| | • | | Shares purchased in an investment advisory program. |
| | • | | Shares purchased through reinvestment of capital gains distributions and dividend reinvestment when purchasing shares of the same fund (but not any other fund within the fund family). |
| | • | | Employees and registered representatives of Raymond James or its affiliates and their family members as designated by Raymond James. |
| | • | | Shares purchased from the proceeds of redemptions within the same fund family, provided (1) the repurchase occurs within 90 days following the redemption, (2) the redemption and purchase occur in the same account, and (3) redeemed shares were subject to a front-end or deferred sales load (known as Rights of Reinstatement). |
| | • | | A shareholder in the fund’s Class C shares will have their shares automatically exchanged at net asset value to Class A shares (or the appropriate share class) of the fund if the shares are no longer subject to a CDSC and the exchange is in line with the policies and procedures of Raymond James. |
CDSC Waivers on Class A and C Shares Available at Raymond James
| | • | | Death or disability of the shareholder. |
| | • | | Shares sold as part of a systematic withdrawal plan as described in the Fund’s Prospectus. |
| | • | | Return of excess contributions from an IRA Account. |
| | • | | Shares sold as part of a required minimum distribution for IRA and retirement accounts due to the shareholder reaching age 70½ as described in the Fund’s prospectus. |
| | • | | Shares sold to pay Raymond James fees but only if the transaction is initiated by Raymond James. |
| | • | | Shares acquired through a right of reinstatement. |
Front-end Load Discounts Available at Raymond James: Breakpoints, and/or Rights of Accumulation
| | • | | Breakpoints as described in the Fund’s Prospectus. |
| | • | | Rights of accumulation which entitle shareholders to breakpoint discounts will be automatically calculated based on the aggregated holding of fund family assets held by accounts within the purchaser’s household at Raymond James. Eligible fund family assets not held at Raymond James may be included in the rights of accumulation calculation only if the shareholder notifies his or her financial advisor about such assets. |
This page is intentionally left blank.

For more information
More information about Wells Fargo Funds is available free upon request. To obtain literature, please write, visit the Fund’s website, or call:
Wells Fargo Funds
P.O. Box 219967
Kansas City, MO 64121-9967
Website: wellsfargofunds.com
Individual investors: 1-800-222-8222
Retail investment professionals: 1-888-877-9275
Institutional investment professionals:1-866-765-0778
This report and the financial statements contained herein are submitted for the general information of the shareholders of the Fund. If this report is used for promotional purposes, distribution of the report must be accompanied or preceded by a current prospectus. Before investing, please consider the investment objectives, risks, charges, and expenses of the investment. For a current prospectus and, if available, a summary prospectus, containing this information, call1-800-222-8222 or visit the Fund’s website atwellsfargofunds.com. Read the prospectus carefully before you invest or send money.
Wells Fargo Asset Management (WFAM) is the trade name for certain investment advisory/management firms owned by Wells Fargo & Company. These firms include but are not limited to Wells Capital Management Incorporated and Wells Fargo Funds Management, LLC. Certain products managed by WFAM entities are distributed by Wells Fargo Funds Distributor, LLC (a broker/dealer and Member FINRA).
This material is for general informational and educational purposes only and is NOT intended to provide investment advice or a recommendation of any kind—including a recommendation for any specific investment, strategy, or plan.
INVESTMENT PRODUCTS: NOT FDIC INSURED ◾ NO BANK GUARANTEE ◾ MAY LOSE VALUE
© 2019 Wells Fargo Funds Management, LLC. All rights reserved.
| | |
 | | 320444 02-19 SA250/SAR250 12-18 |
Semi-Annual Report
December 31, 2018

Wells Fargo High Yield Municipal Bond Fund

Beginning on January 1, 2021, as permitted by new regulations adopted by the Securities and Exchange Commission, paper copies of the Wells Fargo Funds’ annual and semi-annual shareholder reports issued after this date will no longer be sent by mail, unless you specifically request paper copies of the reports. Instead, the reports will be made available on the Funds’ website, and you will be notified by mail each time a report is posted and provided with a website address to access the report.
If you already elected to receive shareholder reports electronically, you will not be affected by this change and you need not take any action. You may elect to receive shareholder reports and other communications from the Fund electronically at any time by contacting your financial intermediary (such as a broker-dealer or bank) or, if you are a direct investor, by calling 1-800-222-8222 or by enrolling at wellsfargo.com/advantagedelivery.
You may elect to receive all future reports in paper free of charge. If you invest through a financial intermediary, you can contact your financial intermediary to request that you continue to receive paper copies of your shareholder reports; if you invest directly with the Fund, you can call 1-800-222-8222. Your election to receive reports in paper will apply to all Wells Fargo Funds held in your account with your financial intermediary or, if you are a direct investor, to all Wells Fargo Funds that you hold.

Reduce clutter. Save trees.
Sign up for electronic delivery of prospectuses and shareholder reports atwellsfargo.com/advantagedelivery
Contents
The views expressed and any forward-looking statements are as of December 31, 2018, unless otherwise noted, and are those of the Fund managers and/or Wells Fargo Funds Management, LLC. Discussions of individual securities, or the markets generally, or any Wells Fargo Fund are not intended as individual recommendations. Future events or results may vary significantly from those expressed in any forward-looking statements. The views expressed are subject to change at any time in response to changing circumstances in the market. Wells Fargo Funds Management, LLC and the Fund disclaim any obligation to publicly update or revise any views expressed or forward-looking statements.
INVESTMENT PRODUCTS: NOT FDIC INSURED ◾ NO BANK GUARANTEE ◾ MAY LOSE VALUE
| | | | |
| 2 | | Wells Fargo High Yield Municipal Bond Fund | | Letter to shareholders (unaudited) |

Andrew Owen
President
Wells Fargo Funds
Global trade tensions escalated during the third quarter of 2018.
Dear Shareholder:
We are pleased to offer you this semi-annual report for the Wells Fargo High Yield Municipal Bond Fund for thesix-month period that ended December 31, 2018. During the reporting period, the U.S. generated encouraging economic and business data that was offset by less positive and more inconsistent data from international markets. Investment returns were generally negative as geopolitical tensions and uncertainty tended to distract investors from more favorable underlying trends.
For the period, U.S. stocks, as measured by the S&P 500 Index,1 fell 6.85% and international stocks, as measured by the MSCI ACWI ex USA Index (Net),2 declined 10.84%. Based on the MSCI EM Index (Net),3 emerging market stocks lost 8.48%. For bond investors, the Bloomberg Barclays U.S. Aggregate Bond Index4 gained 1.65% while the Bloomberg Barclays Global Aggregateex-USD Index5 fell 0.84%. The Bloomberg Barclays Municipal Bond Index6 gained 1.53% while the ICE BofAML U.S. High Yield Index7 declined 2.34%.
Global trade tensions prompted investor concerns.
Global trade tensions escalated during the third quarter of 2018. The U.S. imposed tariffs on a wide range of products manufactured overseas. Foreign governments retaliated with tariffs that punished U.S. commodity producers and product manufacturers. Investors wondered about next steps as divergence in global economic policies and growth prospects widened.
During the summer months, the U.S. economy strengthened. Revised second-quarter gross domestic product (GDP) growth data released in August showed the U.S. economy growing at a 4.2% rate. The unemployment rate in the U.S. was 3.7% by the end of September, according to the U.S. Department of Labor. Wages showed more consistent growth, and consumer confidence remained strong. Several U.S. equity market indices reached records during August, with the S&P 500 Index gaining 7.71% for the three-month period that ended September 30, 2018. In contrast, the MSCI ACWI ex USA Index (Net) gained 0.71% while the MSCI EM Index (Net) declined 1.09% during the same three-month period.
| 1 | The S&P 500 Index consists of 500 stocks chosen for market size, liquidity, and industry group representation. It is a market-value-weighted index with each stock’s weight in the index proportionate to its market value. You cannot invest directly in an index. |
| 2 | The Morgan Stanley Capital International (MSCI) All Country World Index (ACWI) ex USA Index (Net) is a free-float-adjusted market-capitalization-weighted index that is designed to measure the equity market performance of developed markets, excluding the United States and Canada. Source: MSCI. MSCI makes no express or implied warranties or representations and shall have no liability whatsoever with respect to any MSCI data contained herein. The MSCI data may not be further redistributed or used as a basis for other indices or any securities or financial products. This report is not approved, reviewed, or produced by MSCI. You cannot invest directly in an index. |
| 3 | The MSCI Emerging Markets (EM) Index (Net) is a free-float-adjusted market-capitalization-weighted index that is designed to measure large- andmid-cap equity market performance of emerging markets. The MSCI EM Index (Net) consists of the following 24 emerging market country indices: Brazil, Chile, China, Colombia, Czech Republic, Egypt, Greece, Hungary, India, Indonesia, Korea, Malaysia, Mexico, Pakistan, Peru, the Philippines, Poland, Qatar, Russia, South Africa, Taiwan, Thailand, Turkey, and the United Arab Emirates. You cannot invest directly in an index. |
| 4 | The Bloomberg Barclays U.S. Aggregate Bond Index is a broad-based benchmark that measures the investment-grade, U.S. dollar-denominated, fixed-rate taxable bond market, including Treasuries, government-related and corporate securities, mortgage-backed securities (agency fixed-rate and hybrid adjustable-rate mortgage pass-throughs), asset-backed securities, and commercial mortgage-backed securities. You cannot invest directly in an index. |
| 5 | The Bloomberg Barclays Global Aggregateex-USD Index is an unmanaged index that provides a broad-based measure of the global investment-grade fixed-income markets excluding the U.S. dollar-denominated debt market. You cannot invest directly in an index. |
| 6 | The Bloomberg Barclays Municipal Bond Index is an unmanaged index composed of long-termtax-exempt bonds with a minimum credit rating of Baa. You cannot invest directly in an index. |
| 7 | The ICE BofAML U.S. High Yield Index is a market-capitalization-weighted index of domestic and Yankee high-yield bonds. The index tracks the performance of high-yield securities traded in the U.S. bond market. You cannot invest directly in an index. Copyright 2018. ICE Data Indices, LLC. All rights reserved. |
| | | | | | |
| Letter to shareholders (unaudited) | | Wells Fargo High Yield Municipal Bond Fund | | | 3 | |
Economic signals overseas were mixed as the third quarter ended and the fourth quarter began. In particular, signs of slowing economic growth in China created uncertainty for investors. Amid rising trade tensions, the People’s Bank of China cut reserve requirement ratios and accelerated infrastructure spending and tax cuts for business enterprises and individuals. Nevertheless, a strengthening U.S. dollar and trade tensions remained headwinds for investors overseas.
Equity markets were volatile during the fourth quarter.
Negative stock market performance during October and December bracketed a mildly positive November, as measured by the S&P 500 Index and the MSCI ACWI ex USA Index (Net). As interest rates and bond yields gained during October, stock markets struggled. Readings on consumer sentiment and business spending were mixed. Markets rebounded in November. The U.S. and China agreed to halt further increases in tariffs and engage in additional negotiations. While November returns were positive, the loss for the full fourth quarter was substantial for equity investors globally, with the S&P down 13.52% and the MSCI ACWI ex USA Index (Net) down 11.46%. December’s S&P 500 Index performance was the lowest since 1931. Globally, fixed income investments fared better than stocks during the last two months of the year as conflicting signals unsettled investors’ outlooks.
Equity investors confronted a number of changing conditions. In November’smid-term elections, control of the U.S. House of Representatives shifted from Republicans to Democrats, presaging potential partisan disputes. Progress on Brexit negotiations stalled in the UK. In China, the value of the yuan declined to low levels last seen in 2008. Oil prices continued to fall. The Fed increased the federal funds rate by 25 bps to a target range of between 2.25% and 2.50% in December 2018. A late-December dispute over spending and immigration policy resulted in a partial U.S. government shutdown that continued through the end of the period.
Don’t let short-term uncertainty derail long-term investment goals.
Periods of investment uncertainty can present challenges, but experience has taught us that maintaining long-term investment goals can be an effective way to plan for the future. To help you create a sound strategy based on your personal goals and risk tolerance, Wells Fargo Funds offers more than 100 mutual funds spanning a wide range of asset classes and investment styles. Although diversification cannot guarantee an investment profit or prevent losses, we believe it can be an effective way to manage investment risk and potentially smooth out overall portfolio performance. We encourage investors to know their investments and to understand that appropriate levels of risk-taking may unlock opportunities.
Thank you for choosing to invest with Wells Fargo Funds. We appreciate your confidence in us and remain committed to helping you meet your financial needs.
Sincerely,

Andrew Owen
President
Wells Fargo Funds
Economic signals overseas were mixed as the third quarter ended and the fourth quarter began.
For further information about your Fund, contact your investment professional, visit our website atwellsfargofunds.com, or call us directly at1-800-222-8222.
| | | | |
| 4 | | Wells Fargo High Yield Municipal Bond Fund | | Performance highlights (unaudited) |
Investment objective
The Fund seeks high current income exempt from federal income tax, and capital appreciation.
Manager
Wells Fargo Funds Management, LLC
Subadviser
Wells Capital Management Incorporated
Portfolio managers
Dennis Derby
Lyle J. Fitterer, CFA®‡, CPA
Terry J. Goode
Average annual total returns (%) as of December 31, 2018
| | | | | | | | | | | | | | | | | | | | | | | | | | | | | | | | | | |
| | | | | Including sales charge | | | Excluding sales charge | | | Expense ratios1 (%) | |
| | | Inception date | | 1 year | | | 5 year | | | Since Inception | | | 1 year | | | 5 year | | | Since Inception | | | Gross | | | Net2 | |
| | | | | | | | | |
| Class A (WHYMX) | | 1-31-2013 | | | -1.17 | | | | 5.27 | | | | 4.14 | | | | 3.49 | | | | 6.25 | | | | 4.95 | | | | 1.07 | | | | 0.80 | |
| | | | | | | | | |
| Class C (WHYCX) | | 1-31-2013 | | | 1.72 | | | | 5.46 | | | | 4.17 | | | | 2.72 | | | | 5.46 | | | | 4.17 | | | | 1.82 | | | | 1.55 | |
| | | | | | | | | |
| Class R63 | | 7-31-2018 | | | – | | | | – | | | | – | | | | 3.78 | | | | 6.52 | | | | 5.22 | | | | 0.69 | | | | 0.50 | |
| | | | | | | | | |
| Administrator Class (WHYDX) | | 1-31-2013 | | | – | | | | – | | | | – | | | | 3.50 | | | | 6.34 | | | | 5.06 | | | | 1.01 | | | | 0.70 | |
| | | | | | | | | |
| Institutional Class (WHYIX) | | 1-31-2013 | | | – | | | | – | | | | – | | | | 3.75 | | | | 6.52 | | | | 5.21 | | | | 0.74 | | | | 0.55 | |
| | | | | | | | | |
| Bloomberg Barclays Municipal Bond Index4 | | – | | | – | | | | – | | | | – | | | | 1.28 | | | | 3.82 | | | | 2.70 | | | | – | | | | – | |
| | | | | | | | | |
| Bloomberg Barclays High Yield Municipal Bond Index5 | | – | | | – | | | | – | | | | – | | | | 4.76 | | | | 6.53 | | | | 4.28 | | | | – | | | | – | |
Figures quoted represent past performance, which is no guarantee of future results, and do not reflect taxes that a shareholder may pay on fund distributions or the redemption of fund shares. Investment return and principal value of an investment will fluctuate so that an investor’s shares, when redeemed, may be worth more or less than their original cost. Performance shown without sales charges would be lower if sales charges were reflected. Current performance may be lower or higher than the performance data quoted, which assumes the reinvestment of dividends and capital gains. Currentmonth-end performance is available on the Fund’s website,wellsfargofunds.com.
Index returns do not include transaction costs associated with buying and selling securities, any mutual fund fees or expenses, or any taxes. It is not possible to invest directly in an index.
For Class A shares, the maximumfront-end sales charge is 4.50%. For Class C shares, the maximum contingent deferred sales charge is 1.00%. Performance including a contingent deferred sales charge assumes the sales charge for the corresponding time period. Class R6, Administrator Class, and Institutional Class shares are sold without afront-end sales charge or contingent deferred sales charge.
Bond values fluctuate in response to the financial condition of individual issuers, general market and economic conditions, and changes in interest rates. Changes in market conditions and government policies may lead to periods of heightened volatility in the bond market and reduced liquidity for certain bonds held by the Fund. In general, when interest rates rise, bond values fall and investors may lose principal value. Interest rate changes and their impact on the Fund and its share price can be sudden and unpredictable. High-yield securities have a greater risk of default and tend to be more volatile than higher-rated debt securities. The use of derivatives may reduce returns and/or increase volatility. Certain investment strategies tend to increase the total risk of an investment (relative to the broader market). The Fund is exposed to municipal securities risk. Consult the Fund’s prospectus for additional information on these and other risks. A portion of the Fund’s income may be subject to federal, state, and/or local income taxes or the Alternative Minimum Tax (AMT). Any capital gains distributions may be taxable.
Please see footnotes on page 5.
| | | | | | |
| Performance highlights (unaudited) | | Wells Fargo High Yield Municipal Bond Fund | | | 5 | |
|
| Effective maturity distribution as of December 31, 20186 |
|
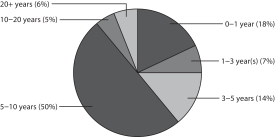 |
|
| Credit quality as of December 31, 20187 |
|
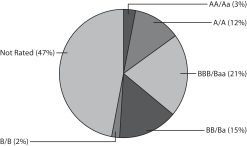 |
| ‡ | CFA® and Chartered Financial Analyst® are trademarks owned by CFA Institute. |
| 1 | Reflects the expense ratios as stated in the most recent prospectuses. The expense ratios shown are subject to change and may differ from the annualized expense ratios shown in the financial highlights of this report. |
| 2 | The manager has contractually committed through October 31, 2019, to waive fees and/or reimburse expenses to the extent necessary to cap the Fund’s Total Annual Fund Operating Expenses After Fee Waivers at the amounts shown. After this time, the cap may be increased or the commitment to maintain the cap may be terminated only with the approval of the Board of Trustees. Brokerage commissions, stamp duty fees, interest, taxes, acquired fund fees and expenses (if any), and extraordinary expenses are excluded from the expense cap. Without this cap, the Fund’s returns would have been lower. The he expense ratio paid by an investor is the net expense ratio (the total annual fund operating expenses after fee waivers) as stated in the prospectuses. |
| 3 | Historical performance shown for Class R6 shares prior to their inception reflects the performance of the Institutional Class shares, and includes the higher expenses applicable to Institutional Class shares. |
| 4 | The Bloomberg Barclays Municipal Bond Index is an unmanaged index composed of long-termtax-exempt bonds with a minimum credit rating of Baa. You cannot invest directly in an index. |
| 5 | The Bloomberg Barclays High Yield Municipal Bond Index measures thenon-investment-grade and nonrated U.S. dollar–denominated, fixed-rate,tax-exempt bond market within the 50 United States and four other qualifying regions (Washington, D.C.; Puerto Rico; Guam; and the Virgin Islands). The index allows state and local general obligation, revenue, insured, and prefunded bonds; however, historically the index has been composed of mostly revenue bonds. You cannot invest directly in an index. |
| 6 | Amounts are calculated based on the total long-term investments of the Fund. These amounts are subject to change and may have changed since the date specified. |
| 7 | The credit quality distribution of portfolio holdings reflected in the chart is based on ratings from Standard & Poor’s, Moody’s Investors Service, and/or Fitch Ratings Ltd. Credit quality ratings apply to the underlying holdings of the Fund and not to the Fund itself. The percentages of the Fund’s portfolio with the ratings depicted in the chart are calculated based on the total market value of fixed income securities held by the Fund. If a security was rated by all three rating agencies, the middle rating was utilized. If rated by two of three rating agencies, the lower rating was utilized, and if rated by one of the rating agencies, that rating was utilized. Standard & Poor’s rates the creditworthiness of bonds, ranging from AAA (highest) to D (lowest). Ratings from A to CCC may be modified by the addition of a plus (+) or minus (-) sign to show relative standing within the rating categories. Standard & Poor’s rates the creditworthiness of short-term notes fromSP-1 (highest) toSP-3 (lowest). Moody’s rates the creditworthiness of bonds, ranging from Aaa (highest) to C (lowest). Ratings Aa to B may be modified by the addition of a number 1 (highest) to 3 (lowest) to show relative standing within the ratings categories. Moody’s rates the creditworthiness of short-term U.S.tax-exempt municipal securities from MIG 1/VMIG 1 (highest) to SG (lowest). Fitch rates the creditworthiness of bonds, ranging from AAA (highest) to D (lowest). Credit quality distribution is subject to change and may have changed since the date specified. |
| | | | |
| 6 | | Wells Fargo High Yield Municipal Bond Fund | | Fund expenses (unaudited) |
As a shareholder of the Fund, you incur two types of costs: (1) transaction costs, including sales charges (loads) on purchase payments and contingent deferred sales charges (if any) on redemptions and (2) ongoing costs, including management fees, distribution(12b-1) and/or shareholder servicing fees, and other Fund expenses. This example is intended to help you understand your ongoing costs (in dollars) of investing in the Fund and to compare these costs with the ongoing costs of investing in other mutual funds.
The example is based on an investment of $1,000 invested at the beginning of thesix-month period and held for the entire period from July 1, 2018 to December 31, 2018.
Actual expenses
The “Actual” line of the table below provides information about actual account values and actual expenses. You may use the information in this line, together with the amount you invested, to estimate the expenses that you paid over the period. Simply divide your account value by $1,000 (for example, an $8,600 account value divided by $1,000 = 8.6), then multiply the result by the number in the “Actual” line under the heading entitled “Expenses paid during period” for your applicable class of shares to estimate the expenses you paid on your account during this period.
Hypothetical example for comparison purposes
The “Hypothetical” line of the table below provides information about hypothetical account values and hypothetical expenses based on the Fund’s actual expense ratio and an assumed rate of return of 5% per year before expenses, which is not the Fund’s actual return. The hypothetical account values and expenses may not be used to estimate the actual ending account balance or expenses you paid for the period. You may use this information to compare the ongoing costs of investing in the Fund and other funds. To do so, compare this 5% hypothetical example with the 5% hypothetical examples that appear in the shareholder reports of the other funds.
Please note that the expenses shown in the table are meant to highlight your ongoing costs only and do not reflect any transactional costs, such as sales charges (loads) and contingent deferred sales charges. Therefore, the “Hypothetical” line of the table is useful in comparing ongoing costs only and will not help you determine the relative total costs of owning different funds. In addition, if these transactional costs were included, your costs would have been higher.
| | | | | | | | | | | | | | | | |
| | | Beginning
account value
7-1-2018 | | | Ending
account value
12-31-2018 | | | Expenses
paid during
the period¹ | | | Annualized net
expense ratio | |
Class A | | | | | | | | | | | | | | | | |
| | | | |
Actual | | $ | 1,000.00 | | | $ | 1,014.52 | | | $ | 4.11 | | | | 0.81 | % |
| | | | |
Hypothetical (5% return before expenses) | | $ | 1,000.00 | | | $ | 1,021.12 | | | $ | 4.13 | | | | 0.81 | % |
Class C | | | | | | | | | | | | | | | | |
| | | | |
Actual | | $ | 1,000.00 | | | $ | 1,010.71 | | | $ | 7.91 | | | | 1.56 | % |
| | | | |
Hypothetical (5% return before expenses) | | $ | 1,000.00 | | | $ | 1,017.34 | | | $ | 7.93 | | | | 1.56 | % |
Class R6 | | | | | | | | | | | | | | | | |
| | | | |
Actual | | $ | 1,000.00 | | | $ | 1,016.02 | | | $ | 2.49 | | | | 0.49 | % |
| | | | |
Hypothetical (5% return before expenses) | | $ | 1,000.00 | | | $ | 1,022.74 | | | $ | 2.50 | | | | 0.49 | % |
Administrator Class | | | | | | | | | | | | | | | | |
| | | | |
Actual | | $ | 1,000.00 | | | $ | 1,015.02 | | | $ | 3.61 | | | | 0.71 | % |
| | | | |
Hypothetical (5% return before expenses) | | $ | 1,000.00 | | | $ | 1,021.63 | | | $ | 3.62 | | | | 0.71 | % |
Institutional Class | | | | | | | | | | | | | | | | |
| | | | |
Actual | | $ | 1,000.00 | | | $ | 1,015.79 | | | $ | 2.85 | | | | 0.56 | % |
| | | | |
Hypothetical (5% return before expenses) | | $ | 1,000.00 | | | $ | 1,022.38 | | | $ | 2.85 | | | | 0.56 | % |
| 1 | Expenses paid is equal to the annualized net expense ratio of each class multiplied by the average account value over the period, multiplied by the number of days in the most recent fiscal half-year divided by the number of days in the fiscal year (to reflect theone-half-year period). |
| | | | | | |
| Portfolio of investments—December 31, 2018 (unaudited) | | Wells Fargo High Yield Municipal Bond Fund | | | 7 | |
| | | | | | | | | | | | | | | | |
| Security name | | Interest rate | | | Maturity date | | | Principal | | | Value | |
|
Municipal Obligations: 96.80% | |
|
Alabama: 0.51% | |
|
| Water & Sewer Revenue: 0.51% | |
| | | | |
Jefferson County AL Warrants CAB Senior Lien Series B (AGM Insured) (z) | | | 5.27 | % | | | 10-1-2027 | | | $ | 920,000 | | | $ | 655,334 | |
| | | | | | | | | | | | | | | | |
|
Arizona: 3.40% | |
|
| Education Revenue: 1.47% | |
| | | | |
Florence AZ IDA Legacy Traditional School Project Queen Creek & Casa Grande Campuses | | | 5.00 | | | | 7-1-2023 | | | | 250,000 | | | | 259,215 | |
| | | | |
Phoenix AZ IDA Great Hearts Academies Project | | | 5.20 | | | | 7-1-2022 | | | | 110,000 | | | | 115,706 | |
| | | | |
Phoenix AZ IDA Legacy Traditional Schools Project Series A 144A | | | 6.50 | | | | 7-1-2034 | | | | 500,000 | | | | 544,395 | |
| | | | |
Pima County AZ IDA Desert Heights Charter School Facility Refunding Bond | | | 6.00 | | | | 5-1-2024 | | | | 460,000 | | | | 480,700 | |
| | | | |
Pima County AZ IDA New Plan Learning Project Series A | | | 8.13 | | | | 7-1-2041 | | | | 495,000 | | | | 495,381 | |
| | | | |
| | | | | | | | | | | | | | | 1,895,397 | |
| | | | | | | | | | | | | | | | |
|
| Health Revenue: 1.93% | |
| | | | |
Maricopa County AZ IDA Senior Living Facility Series 2016 144A | | | 6.00 | | | | 1-1-2048 | | | | 1,000,000 | | | | 1,003,140 | |
| | | | |
Tempe AZ IDA Mirabella at ASU Incorporated Project Series A 144A | | | 6.13 | | | | 10-1-2052 | | | | 1,400,000 | | | | 1,499,078 | |
| | | | |
| | | | | | | | | | | | | | | 2,502,218 | |
| | | | | | | | | | | | | | | | |
| | | | |
| | | | | | | | | | | | | | | 4,397,615 | |
| | | | | | | | | | | | | | | | |
|
California: 5.11% | |
|
| Education Revenue: 1.02% | |
| | | | |
California Municipal Finance Authority Charter School Albert Einstein Academies Project Series A | | | 7.13 | | | | 8-1-2043 | | | | 250,000 | | | | 274,590 | |
| | | | |
California School Finance Authority View Park Elementary & Middle Schools Series A | | | 5.88 | | | | 10-1-2044 | | | | 1,000,000 | | | | 1,044,660 | |
| | | | |
| | | | | | | | | | | | | | | 1,319,250 | |
| | | | | | | | | | | | | | | | |
|
| Health Revenue: 0.81% | |
| | | | |
California Statewide CDA Loma Linda University Medical Center Refunding Bond Series A | | | 5.25 | | | | 12-1-2044 | | | | 1,000,000 | | | | 1,052,820 | |
| | | | | | | | | | | | | | | | |
|
| Industrial Development Revenue: 0.82% | |
| | | | |
California PCFA Solid Waste Disposal AMT Green Bond Calplant I Project 144A | | | 8.00 | | | | 7-1-2039 | | | | 1,000,000 | | | | 1,059,280 | |
| | | | | | | | | | | | | | | | |
|
| Miscellaneous Revenue: 1.66% | |
| | | | |
Anaheim CA PFA Convention Center Expansion Project Series A | | | 5.00 | | | | 5-1-2046 | | | | 500,000 | | | | 549,140 | |
| | | | |
Compton CA PFA Refunding Bond 144A | | | 4.50 | | | | 9-1-2032 | | | | 1,585,000 | | | | 1,596,729 | |
| | | | |
| | | | | | | | | | | | | | | 2,145,869 | |
| | | | | | | | | | | | | | | | |
|
| Tax Revenue: 0.80% | |
| | | | |
Compton CA Community College RDA Project 2nd Lien Series A | | | 4.75 | | | | 8-1-2019 | | | | 225,000 | | | | 227,972 | |
| | | | |
Compton CA Community College RDA Project 2nd Lien Series A | | | 5.00 | | | | 8-1-2020 | | | | 100,000 | | | | 103,700 | |
| | | | |
San Francisco City & County CA RDA CAB Mission Bay South Redevelopment Project Subordinate Bond Series D 144A(z) | | | 4.80 | | | | 8-1-2026 | | | | 1,000,000 | | | | 701,190 | |
| | | | |
| | | | | | | | | | | | | | | 1,032,862 | |
| | | | | | | | | | | | | | | | |
| | | | |
| | | | | | | | | | | | | | | 6,610,081 | |
| | | | | | | | | | | | | | | | |
The accompanying notes are an integral part of these financial statements.
| | | | |
| 8 | | Wells Fargo High Yield Municipal Bond Fund | | Portfolio of investments—December 31, 2018 (unaudited) |
| | | | | | | | | | | | | | | | |
| Security name | | Interest rate | | | Maturity date | | | Principal | | | Value | |
|
Colorado: 8.74% | |
|
| GO Revenue: 5.98% | |
| | | | |
Arapahoe County CO Copperleaf Metropolitan District #2 | | | 5.75 | % | | | 12-1-2045 | | | $ | 500,000 | | | $ | 519,875 | |
| | | | |
Aurora CO Cornerstar Metropolitan District Refunding Bond Series A | | | 5.25 | | | | 12-1-2047 | | | | 1,000,000 | | | | 1,016,750 | |
| | | | |
Brighton CO Crossing Metropolitan District #4 Series A | | | 5.00 | | | | 12-1-2047 | | | | 1,220,000 | | | | 1,229,868 | |
| | | | |
Colorado Big Dry Creek Metropolitan District Refunding & Improvement Bonds Limited Tax Series A | | | 5.75 | | | | 12-1-2047 | | | | 1,000,000 | | | | 981,970 | |
| | | | |
Colorado Copperleaf Metropolitan District #3 Series A | | | 5.13 | | | | 12-1-2047 | | | | 1,200,000 | | | | 1,157,028 | |
| | | | |
Colorado Whispering Pines Metropolitan District #1 Series A | | | 5.00 | | | | 12-1-2047 | | | | 1,000,000 | | | | 979,000 | |
| | | | |
Eaton CO Area Park & Recreation District | | | 5.00 | | | | 12-1-2023 | | | | 810,000 | | | | 858,592 | |
| | | | |
Eaton CO Area Park & Recreation District | | | 5.50 | | | | 12-1-2030 | | | | 475,000 | | | | 502,479 | |
| | | | |
Southlands CO Metropolitan District #1 Series A1 | | | 3.50 | | | | 12-1-2027 | | | | 500,000 | | | | 489,850 | |
| | | | |
| | | | | | | | | | | | | | | 7,735,412 | |
| | | | | | | | | | | | | | | | |
|
| Miscellaneous Revenue: 0.77% | |
| | | | |
Denver CO City and County Certificate of Participation Series A2 (JPMorgan Chase & Company SPA) ø | | | 1.70 | | | | 12-1-2029 | | | | 1,000,000 | | | | 1,000,000 | |
| | | | | | | | | | | | | | | | |
|
| Tax Revenue: 1.57% | |
| | | | |
Colorado Centerra Metropolitan District #1 Special Revenue Refunding & Improvement Bonds 144A | | | 5.00 | | | | 12-1-2029 | | | | 1,000,000 | | | | 1,051,200 | |
| | | | |
Pueblo CO Urban Renewal Authority Regional Tourism Act Project | | | 5.00 | | | | 6-1-2036 | | | | 1,000,000 | | | | 986,240 | |
| | | | |
| | | | | | | | | | | | | | | 2,037,440 | |
| | | | | | | | | | | | | | | | |
|
| Transportation Revenue: 0.42% | |
| | | | |
Colorado High Performance Transportation Enterprise U.S. 36 &I-25 Managed Lanes | | | 5.75 | | | | 1-1-2044 | | | | 500,000 | | | | 537,735 | |
| | | | | | | | | | | | | | | | |
| | | | |
| | | | | | | | | | | | | | | 11,310,587 | |
| | | | | | | | | | | | | | | | |
|
Connecticut: 0.48% | |
|
| GO Revenue: 0.48% | |
| | | | |
Hartford CT Series A | | | 4.00 | | | | 4-1-2032 | | | | 325,000 | | | | 332,504 | |
| | | | |
Hartford CT Series A | | | 5.00 | | | | 4-1-2024 | | | | 105,000 | | | | 114,928 | |
| | | | |
Hartford CT Series B | | | 5.00 | | | | 4-1-2033 | | | | 50,000 | | | | 53,196 | |
| | | | |
Hartford CT Unrefunded Bond Series A | | | 5.00 | | | | 4-1-2029 | | | | 45,000 | | | | 47,675 | |
| | | | |
Hartford CT Unrefunded Bond Series A | | | 5.00 | | | | 4-1-2030 | | | | 70,000 | | | | 74,005 | |
| | | | |
| | | | | | | | | | | | | | | 622,308 | |
| | | | | | | | | | | | | | | | |
|
Delaware: 0.80% | |
|
| Education Revenue: 0.80% | |
| | | | |
Delaware EDA Odyssey Charter School Incorporated Project Series A 144A | | | 7.00 | | | | 9-1-2045 | | | | 1,000,000 | | | | 1,037,750 | |
| | | | | | | | | | | | | | | | |
|
District of Columbia: 0.35% | |
|
| Tobacco Revenue: 0.35% | |
| | | | |
District of Columbia Tobacco Settlement Financing Corporation | | | 6.75 | | | | 5-15-2040 | | | | 435,000 | | | | 449,533 | |
| | | | | | | | | | | | | | | | |
|
Florida: 1.58% | |
|
| Education Revenue: 1.39% | |
| | | | |
Florida Development Finance Corporation Educational Facilities Renaissance Charter School Project Series A | | | 8.50 | | | | 6-15-2044 | | | | 250,000 | | | | 283,983 | |
| | | | |
Florida Higher Educational Facilities Financing Authority Jacksonville University 144A | | | 4.50 | | | | 6-1-2033 | | | | 500,000 | | | | 508,430 | |
The accompanying notes are an integral part of these financial statements.
| | | | | | |
| Portfolio of investments—December 31, 2018 (unaudited) | | Wells Fargo High Yield Municipal Bond Fund | | | 9 | |
| | | | | | | | | | | | | | | | |
| Security name | | Interest rate | | | Maturity date | | | Principal | | | Value | |
|
| Education Revenue(continued) | |
| | | | |
Miami-Dade County FL IDA YouthCo-Op Charter Schools Project Series A 144A | | | 6.00 | % | | | 9-15-2045 | | | $ | 1,000,000 | | | $ | 1,007,790 | |
| | | | |
| | | | | | | | | | | | | | | 1,800,203 | |
| | | | | | | | | | | | | | | | |
|
| Health Revenue: 0.19% | |
| | | | |
Holmes County FL Hospital Corporation Doctors Memorial Hospital Project | | | 6.00 | | | | 11-1-2038 | | | | 250,000 | | | | 238,023 | |
| | | | | | | | | | | | | | | | |
|
Georgia: 1.20% | |
|
| Housing Revenue: 0.67% | |
| | | | |
Cobb County GA Development Authority Student Housing Kennesaw State University Foundation Project Refunding Bond Series C | | | 5.00 | | | | 7-15-2028 | | | | 800,000 | | | | 868,680 | |
| | | | | | | | | | | | | | | | |
|
| Transportation Revenue: 0.53% | |
| | | | |
Georgia Road & Tollway Authority CCABI-75 South Expressway Lanes Project Series B (z)144A | | | 1.97 | | | | 6-1-2049 | | | | 1,000,000 | | | | 677,590 | |
| | | | | | | | | | | | | | | | |
| | | | |
| | | | | | | | | | | | | | | 1,546,270 | |
| | | | | | | | | | | | | | | | |
|
Guam: 0.23% | |
|
| Airport Revenue: 0.23% | |
| | | | |
Guam International Airport Authority Series C | | | 6.38 | | | | 10-1-2043 | | | | 260,000 | | | | 295,685 | |
| | | | | | | | | | | | | | | | |
|
Idaho: 0.19% | |
|
| Education Revenue: 0.19% | |
| | | | |
Idaho Housing & Finance Association Legacy Public Charter School Incorporated Project Series A | | | 6.25 | | | | 5-1-2043 | | | | 250,000 | | | | 251,383 | |
| | | | | | | | | | | | | | | | |
|
Illinois: 17.79% | |
|
| Airport Revenue: 0.96% | |
| | | | |
Chicago IL Midway Airport Second Lien Refunding Bond Series A | | | 5.00 | | | | 1-1-2031 | | | | 1,000,000 | | | | 1,084,880 | |
| | | | |
Chicago IL O’Hare International Airport Revenue Bond Series B | | | 6.00 | | | | 1-1-2041 | | | | 150,000 | | | | 162,288 | |
| | | | |
| | | | | | | | | | | | | | | 1,247,168 | |
| | | | | | | | | | | | | | | | |
|
| Education Revenue: 1.15% | |
| | | | |
Illinois Finance Authority Charter School Aid Intrinsic Schools Belmont School Project Series A 144A | | | 5.25 | | | | 12-1-2025 | | | | 800,000 | | | | 811,048 | |
| | | | |
Illinois Finance Authority Charter Schools Refunding & Improvement Bonds Series A | | | 6.88 | | | | 10-1-2031 | | | | 640,000 | | | | 671,859 | |
| | | | |
| | | | | | | | | | | | | | | 1,482,907 | |
| | | | | | | | | | | | | | | | |
|
| GO Revenue: 7.86% | |
| | | | |
Chicago IL Board of Education CAB School Reform Series A (National Insured) (z) | | | 4.81 | | | | 12-1-2025 | | | | 500,000 | | | | 382,600 | |
| | | | |
Chicago IL Neighborhoods Alive 21 Program Series B | | | 5.50 | | | | 1-1-2032 | | | | 700,000 | | | | 743,589 | |
| | | | |
Chicago IL Series A | | | 5.00 | | | | 1-1-2033 | | | | 310,000 | | | | 315,599 | |
| | | | |
Chicago IL Series A | | | 6.00 | | | | 1-1-2038 | | | | 1,500,000 | | | | 1,668,825 | |
| | | | |
Cook County IL School District #144 Prairie Hills CAB Refunding Bond Series C (AGM Insured) (z) | | | 4.73 | | | | 12-1-2025 | | | | 730,000 | | | | 584,197 | |
| | | | |
Cook County IL School District #148 Dolton Series E (AGM Insured) | | | 4.75 | | | | 12-1-2025 | | | | 450,000 | | | | 450,617 | |
| | | | |
Illinois Series A (AGM Insured) | | | 5.00 | | | | 4-1-2024 | | | | 500,000 | | | | 542,460 | |
| | | | |
Illinois | | | 5.00 | | | | 3-1-2033 | | | | 2,000,000 | | | | 2,039,660 | |
| | | | |
Lake County IL Community Unit School District #187 North Chicago Series A (AGM Insured) (z) | | | 4.65 | | | | 1-1-2023 | | | | 590,000 | | | | 517,489 | |
The accompanying notes are an integral part of these financial statements.
| | | | |
| 10 | | Wells Fargo High Yield Municipal Bond Fund | | Portfolio of investments—December 31, 2018 (unaudited) |
| | | | | | | | | | | | | | | | |
| Security name | | Interest rate | | | Maturity date | | | Principal | | | Value | |
|
| GO Revenue(continued) | |
| | | | |
Will County ILLincoln-Way Community High School District #210 | | | 4.00 | % | | | 1-1-2022 | | | $ | 525,000 | | | $ | 525,058 | |
| | | | |
Will County ILLincoln-Way Community High School District #210 CAB Series B (z) | | | 4.91 | | | | 1-1-2033 | | | | 1,000,000 | | | | 522,690 | |
| | | | |
Will County ILLincoln-Way Community High School District #210 CAB Series B (z) | | | 5.20 | | | | 1-1-2027 | | | | 685,000 | | | | 494,426 | |
| | | | |
Will County ILLincoln-Way Community High School District #210 Series A | | | 3.25 | | | | 1-1-2030 | | | | 450,000 | | | | 378,900 | |
| | | | |
Will County ILLincoln-Way Community High School District #210 Series A | | | 5.00 | | | | 1-1-2030 | | | | 1,000,000 | | | | 1,002,510 | |
| | | | |
| | | | | | | | | | | | | | | 10,168,620 | |
| | | | | | | | | | | | | | | | |
|
| Miscellaneous Revenue: 0.75% | |
| | | | |
Illinois | | | 5.50 | | | | 7-1-2025 | | | | 250,000 | | | | 269,980 | |
| | | | |
Illinois Finance Authority Educational Facility Senior Rogers Park Montessori School | | | 6.00 | | | | 2-1-2034 | | | | 680,000 | | | | 703,970 | |
| | | | |
| | | | | | | | | | | | | | | 973,950 | |
| | | | | | | | | | | | | | | | |
|
| Tax Revenue: 7.07% | |
| | | | |
Chicago IL Certificate of Participation River Point Plaza Redevelopment Project Series A 144A | | | 4.84 | | | | 4-15-2028 | | | | 2,000,000 | | | | 1,966,100 | |
| | | | |
Chicago IL Sales Tax | | | 5.00 | | | | 1-1-2032 | | | | 1,500,000 | | | | 1,739,235 | |
| | | | |
Chicago IL Sales Tax Series A | | | 5.00 | | | | 1-1-2041 | | | | 1,000,000 | | | | 1,088,300 | |
| | | | |
Chicago IL Transit Authority Sales Tax Receipts Bonds (AGM Insured) | | | 5.00 | | | | 12-1-2044 | | | | 1,000,000 | | | | 1,083,880 | |
| | | | |
Hillside IL Tax Increment Refunding Bond | | | 5.00 | | | | 1-1-2030 | | | | 1,345,000 | | | | 1,351,160 | |
| | | | |
Illinois Sports Facilities Authority State Tax Supported CAB (Ambac Insured) (z) | | | 4.54 | | | | 6-15-2025 | | | | 1,140,000 | | | | 889,166 | |
| | | | |
Metropolitan Pier & Exposition Authority McCormick Place Expansion Project Series A | | | 5.00 | | | | 6-15-2057 | | | | 1,000,000 | | | | 1,023,160 | |
| | | | |
| | | | | | | | | | | | | | | 9,141,001 | |
| | | | | | | | | | | | | | | | |
| | | | |
| | | | | | | | | | | | | | | 23,013,646 | |
| | | | | | | | | | | | | | | | |
|
Indiana: 0.90% | |
|
| Health Revenue: 0.90% | |
| | | | |
Indiana Business Finance Authority Marquette Project Refunding Bond Series A | | | 5.00 | | | | 3-1-2030 | | | | 1,100,000 | | | | 1,161,325 | |
| | | | | | | | | | | | | | | | |
|
Iowa: 1.33% | |
|
| Health Revenue: 1.33% | |
| | | | |
Iowa Finance Authority Senior Housing Northcrest Incorporated Project Series A | | | 5.00 | | | | 3-1-2028 | | | | 1,640,000 | | | | 1,722,836 | |
| | | | | | | | | | | | | | | | |
|
Kansas: 2.25% | |
|
| Health Revenue: 0.79% | |
| | | | |
Kansas State Development Finance Authority Revenue Bond Series A | | | 5.25 | | | | 11-15-2033 | | | | 1,000,000 | | | | 1,023,920 | |
| | | | | | | | | | | | | | | | |
|
| Tax Revenue: 1.46% | |
| | | | |
Wyandotte County & Kansas City KS Special Obligation Refunding & Improvement Bonds Plaza Redevelopment Project | | | 4.00 | | | | 12-1-2028 | | | | 805,000 | | | | 794,599 | |
| | | | |
Wyandotte County & Kansas City KS Special Obligation Vacation Village Project Area 4 Major Multi-Sport Athletic Complex Project CAB Series 2015 144A(z) | | | 6.86 | | | | 9-1-2034 | | | | 2,965,000 | | | | 1,085,961 | |
| | | | |
| | | | | | | | | | | | | | | 1,880,560 | |
| | | | | | | | | | | | | | | | |
| | | | |
| | | | | | | | | | | | | | | 2,904,480 | |
| | | | | | | | | | | | | | | | |
|
Kentucky: 0.78% | |
|
| Health Revenue: 0.78% | |
| | | | |
Kentucky EDFA Rosedale Green Project Refunding Bond | | | 5.50 | | | | 11-15-2035 | | | | 1,000,000 | | | | 1,014,760 | |
| | | | | | | | | | | | | | | | |
The accompanying notes are an integral part of these financial statements.
| | | | | | |
| Portfolio of investments—December 31, 2018 (unaudited) | | Wells Fargo High Yield Municipal Bond Fund | | | 11 | |
| | | | | | | | | | | | | | | | |
| Security name | | Interest rate | | | Maturity date | | | Principal | | | Value | |
|
Maryland: 0.78% | |
|
| Education Revenue: 0.78% | |
| | | | |
Prince George’s County MD Chesapeake Lighthouse Charter School ProjectSeries 2016-A 144A | | | 6.90 | % | | | 8-1-2041 | | | $ | 1,000,000 | | | $ | 1,013,960 | |
| | | | | | | | | | | | | | | | |
|
Massachusetts: 1.04% | |
|
| Health Revenue: 1.04% | |
| | | | |
Massachusetts Development Finance Agency Linden Ponds Incorporated Facility 144A | | | 4.00 | | | | 11-15-2023 | | | | 1,335,000 | | | | 1,344,946 | |
| | | | | | | | | | | | | | | | |
|
Michigan: 7.69% | |
|
| Education Revenue: 1.41% | |
| | | | |
Michigan Finance Authority Limited Obligation Public School Academy Cesar Chavez Academy Project | | | 5.00 | | | | 2-1-2022 | | | | 155,000 | | | | 156,240 | |
| | | | |
Michigan Public Educational Facilities Authority Limited Obligation Bradford Academy Project 144A | | | 6.50 | | | | 9-1-2037 | | | | 190,000 | | | | 140,119 | |
| | | | |
Michigan Public Educational Facilities Authority Limited Obligation Crescent Academy Project | | | 7.00 | | | | 10-1-2036 | | | | 292,500 | | | | 292,617 | |
| | | | |
Oakland County MI Economic Development Corporation The Academy of The Sacred Heart Project Series A | | | 6.50 | | | | 12-15-2036 | | | | 235,000 | | | | 235,961 | |
| | | | |
RBC Municipal Products Incorporated Trust SeriesE-127 (Royal Bank of Canada LOC, Royal Bank of Canada LIQ) 144Aø | | | 1.74 | | | | 7-1-2020 | | | | 1,000,000 | | | | 1,000,000 | |
| | | | |
| | | | | | | | | | | | | | | 1,824,937 | |
| | | | | | | | | | | | | | | | |
|
| GO Revenue: 1.12% | |
| | | | |
Detroit MI | | | 5.00 | | | | 4-1-2027 | | | | 500,000 | | | | 536,605 | |
| | | | |
Wayne County MI Building Improvement Series A | | | 6.75 | | | | 11-1-2039 | | | | 900,000 | | | | 909,009 | |
| | | | |
| | | | | | | | | | | | | | | 1,445,614 | |
| | | | | | | | | | | | | | | | |
|
| Miscellaneous Revenue: 1.16% | |
| | | | |
Charyl Stockwell Academy Michigan Public School Refunding Bond | | | 4.88 | | | | 10-1-2023 | | | | 330,000 | | | | 328,528 | |
| | | | |
Michigan Municipal Bond Authority Local Government Loan Program Series C (Ambac Insured) | | | 4.75 | | | | 5-1-2027 | | | | 950,000 | | | | 950,048 | |
| | | | |
Michigan Public Educational Facilities Authority Chandler Park Academy | | | 6.35 | | | | 11-1-2028 | | | | 225,000 | | | | 225,286 | |
| | | | |
| | | | | | | | | | | | | | | 1,503,862 | |
| | | | | | | | | | | | | | | | |
|
| Tax Revenue: 2.29% | |
| | | | |
Detroit MI Downtown Development Authority CAB (z) | | | 7.08 | | | | 7-1-2020 | | | | 285,000 | | | | 266,429 | |
| | | | |
Detroit MI Downtown Development Authority CAB (z) | | | 7.34 | | | | 7-1-2021 | | | | 170,000 | | | | 151,326 | |
| | | | |
Detroit MI Downtown Development Authority CAB (z) | | | 7.38 | | | | 7-1-2025 | | | | 580,000 | | | | 411,116 | |
| | | | |
Detroit MI Downtown Development Authority CAB (z) | | | 8.81 | | | | 7-1-2024 | | | | 20,000 | | | | 15,044 | |
| | | | |
Michigan Finance Authority Local Government Loan Program City of Detroit Financial Recovery Refunding Bond Series F | | | 4.50 | | | | 10-1-2029 | | | | 1,000,000 | | | | 1,059,060 | |
| | | | |
Michigan Finance Authority Local Government Loan Program Public Lighting Authority Refunding Bond Series B | | | 5.00 | | | | 7-1-2044 | | | | 1,000,000 | | | | 1,063,590 | |
| | | | |
| | | | | | | | | | | | | | | 2,966,565 | |
| | | | | | | | | | | | | | | | |
|
| Water & Sewer Revenue: 1.71% | |
| | | | |
Detroit MI Finance Authority Local Government Loan Program Refunding BondSeries D-4 | | | 5.00 | | | | 7-1-2031 | | | | 1,015,000 | | | | 1,119,291 | |
The accompanying notes are an integral part of these financial statements.
| | | | |
| 12 | | Wells Fargo High Yield Municipal Bond Fund | | Portfolio of investments—December 31, 2018 (unaudited) |
| | | | | | | | | | | | | | | | |
| Security name | | Interest rate | | | Maturity date | | | Principal | | | Value | |
|
| Water & Sewer Revenue(continued) | |
| | | | |
Detroit MI Finance Authority Local Government Loan Program Refunding BondSeries D-6 (National Insured) | | | 5.00 | % | | | 7-1-2036 | | | $ | 1,000,000 | | | $ | 1,084,790 | |
| | | | |
| | | | | | | | | | | | | | | 2,204,081 | |
| | | | | | | | | | | | | | | | |
| | | | |
| | | | | | | | | | | | | | | 9,945,059 | |
| | | | | | | | | | | | | | | | |
|
Minnesota: 1.03% | |
|
| Education Revenue: 0.44% | |
| | | | |
Deephaven MN Charter School Eagle Ridge Academy Project Series A | | | 4.40 | | | | 7-1-2025 | | | | 160,000 | | | | 165,200 | |
| | | | |
Deephaven MN Charter School Eagle Ridge Academy Project Series A | | | 5.00 | | | | 7-1-2030 | | | | 195,000 | | | | 202,550 | |
| | | | |
Deephaven MN Charter School Eagle Ridge Academy Project Series A | | | 5.25 | | | | 7-1-2037 | | | | 190,000 | | | | 197,298 | |
| | | | |
| | | | | | | | | | | | | | | 565,048 | |
| | | | | | | | | | | | | | | | |
|
| Housing Revenue: 0.59% | |
| | | | |
Minneapolis MN Student Housing Riverton Community Housing Project Refunding Bond | | | 4.70 | | | | 8-1-2026 | | | | 335,000 | | | | 350,876 | |
| | | | |
Minneapolis MN Student Housing Riverton Community Housing Project Refunding Bond | | | 4.80 | | | | 8-1-2027 | | | | 400,000 | | | | 419,104 | |
| | | | |
| | | | | | | | | | | | | | | 769,980 | |
| | | | | | | | | | | | | | | | |
| | | | |
| | | | | | | | | | | | | | | 1,335,028 | |
| | | | | | | | | | | | | | | | |
|
Mississippi: 1.19% | |
|
| Resource Recovery Revenue: 1.19% | |
| | | | |
Mississippi Business Finance Corporation AMT Waste Pro USA Incorporated Project 144A | | | 5.00 | | | | 2-1-2036 | | | | 1,500,000 | | | | 1,536,930 | |
| | | | | | | | | | | | | | | | |
|
Missouri: 1.23% | |
|
| Tax Revenue: 1.23% | |
| | | | |
Blue Springs MO Special Obligation Tax Refunding & Improvement Bonds Adams Farm Project Series A | | | 4.00 | | | | 6-1-2026 | | | | 595,000 | | | | 585,236 | |
| | | | |
Richmond Heights MO Francis Place Redevelopment Project | | | 5.63 | | | | 11-1-2025 | | | | 1,000,000 | | | | 999,990 | |
| | | | |
| | | | | | | | | | | | | | | 1,585,226 | |
| | | | | | | | | | | | | | | | |
|
Nevada: 1.23% | |
|
| Industrial Development Revenue: 1.23% | |
| | | | |
Director of the State of Nevada Department of Business & Industry AMT Fulcrum Sierra Biofuels LLC Project 144A | | | 6.25 | | | | 12-15-2037 | | | | 1,500,000 | | | | 1,586,220 | |
| | | | | | | | | | | | | | | | |
|
New Jersey: 4.12% | |
|
| GO Revenue: 0.82% | |
| | | | |
Newark NJ Qualified General Improvement Series A | | | 5.00 | | | | 7-15-2027 | | | | 1,000,000 | | | | 1,062,890 | |
| | | | | | | | | | | | | | | | |
|
| Industrial Development Revenue: 0.21% | |
| | | | |
New Jersey EDA Continental Airlines Incorporated Project | | | 5.25 | | | | 9-15-2029 | | | | 250,000 | | | | 270,190 | |
| | | | | | | | | | | | | | | | |
|
| Miscellaneous Revenue: 0.98% | |
| | | | |
Essex County NJ Improvement Authority Lease Newark Project Series A | | | 6.25 | | | | 11-1-2030 | | | | 200,000 | | | | 208,164 | |
| | | | |
New Jersey EDA School Facilities Construction Project Series NN (National Insured) | | | 5.00 | | | | 3-1-2030 | | | | 1,000,000 | | | | 1,056,780 | |
| | | | |
| | | | | | | | | | | | | | | 1,264,944 | |
| | | | | | | | | | | | | | | | |
The accompanying notes are an integral part of these financial statements.
| | | | | | |
| Portfolio of investments—December 31, 2018 (unaudited) | | Wells Fargo High Yield Municipal Bond Fund | | | 13 | |
| | | | | | | | | | | | | | | | |
| Security name | | Interest rate | | | Maturity date | | | Principal | | | Value | |
|
| Transportation Revenue: 2.11% | |
| | | | |
New Jersey TTFA CAB Series A (z) | | | 5.85 | % | | | 12-15-2031 | | | $ | 1,000,000 | | | $ | 572,040 | |
| | | | |
New Jersey TTFA Series C | | | 5.25 | | | | 6-15-2032 | | | | 2,000,000 | | | | 2,163,060 | |
| | | | |
| | | | | | | | | | | | | | | 2,735,100 | |
| | | | | | | | | | | | | | | | |
| | | | |
| | | | | | | | | | | | | | | 5,333,124 | |
| | | | | | | | | | | | | | | | |
|
New York: 6.88% | |
|
| Education Revenue: 0.79% | |
| | | | |
Hempstead Town NY Local Development Corporation The Academy Charter School Project Series A | | | 7.65 | | | | 2-1-2044 | | | | 1,000,000 | | | | 1,022,130 | |
| | | | | | | | | | | | | | | | |
|
| GO Revenue: 1.53% | |
| | | | |
New York NY Subordinate Bond SeriesH-5 (Dexia Credit Local LOC) ø | | | 1.79 | | | | 3-1-2034 | | | | 1,975,000 | | | | 1,975,000 | |
| | | | | | | | | | | | | | | | |
|
| Tax Revenue: 3.09% | |
| | | | |
New York NY Transitional Finance Authority Recovery Subordinate Bond Series C3 (Dexia Credit Local SPA) ø | | | 1.77 | | | | 8-1-2031 | | | | 4,000,000 | | | | 4,000,000 | |
| | | | | | | | | | | | | | | | |
|
| Utilities Revenue: 1.47% | |
| | | | |
Green Island NY Power Authority Power System | | | 6.00 | | | | 12-15-2020 | | | | 385,000 | | | | 386,401 | |
| | | | |
New York NY IDA Brooklyn Navy Yard Cogeneration Partners LP | | | 5.65 | | | | 10-1-2028 | | | | 1,500,000 | | | | 1,514,415 | |
| | | | |
| | | | | | | | | | | | | | | 1,900,816 | |
| | | | | | | | | | | | | | | | |
| | | | |
| | | | | | | | | | | | | | | 8,897,946 | |
| | | | | | | | | | | | | | | | |
|
Ohio: 1.62% | |
|
| Miscellaneous Revenue: 0.84% | |
| | | | |
Ohio Private Activity Bond AMT Portsmouth Bypass Project (AGM Insured) | | | 5.00 | | | | 12-31-2039 | | | | 1,000,000 | | | | 1,085,830 | |
| | | | | | | | | | | | | | | | |
|
| Resource Recovery Revenue: 0.78% | |
| | | | |
Ohio Air Quality Development Authority Ohio Valley Electric Corporation Series E | | | 5.63 | | | | 10-1-2019 | | | | 1,000,000 | | | | 1,014,530 | |
| | | | | | | | | | | | | | | | |
| | | | |
| | | | | | | | | | | | | | | 2,100,360 | |
| | | | | | | | | | | | | | | | |
|
Oklahoma: 0.42% | |
|
| Health Revenue: 0.42% | |
| | | | |
Oklahoma Development Finance Authority Oklahoma University Medicine Project Series B | | | 5.50 | | | | 8-15-2057 | | | | 500,000 | | | | 547,650 | |
| | | | | | | | | | | | | | | | |
|
Oregon: 0.54% | |
|
| Health Revenue: 0.54% | |
| | | | |
Multnomah County OR Hospital Facilities Authority Mirabella South Waterfront Project Refunding Bond Series A | | | 5.00 | | | | 10-1-2019 | | | | 120,000 | | | | 122,195 | |
| | | | |
Polk County OR Hospital Facility Authority Revenue Bond Dallas Retirement Village Project Series2015-A | | | 5.00 | | | | 7-1-2025 | | | | 550,000 | | | | 580,217 | |
| | | | |
| | | | | | | | | | | | | | | 702,412 | |
| | | | | | | | | | | | | | | | |
|
Pennsylvania: 5.31% | |
|
| Education Revenue: 2.25% | |
| | | | |
Allegheny County PA IDA Propel Charter School Sunrise Project | | | 5.25 | | | | 7-15-2023 | | | | 115,000 | | | | 119,549 | |
| | | | |
East Hempfield Township PA IDA Student Services Incorporated Student Housing Project of Millersville University | | | 5.00 | | | | 7-1-2029 | | | | 500,000 | | | | 531,285 | |
The accompanying notes are an integral part of these financial statements.
| | | | |
| 14 | | Wells Fargo High Yield Municipal Bond Fund | | Portfolio of investments—December 31, 2018 (unaudited) |
| | | | | | | | | | | | | | | | |
| Security name | | Interest rate | | | Maturity date | | | Principal | | | Value | |
|
| Education Revenue(continued) | |
| | | | |
Montgomery County PA Higher Education & Health Authority Arcadia University | | | 5.00 | % | | | 4-1-2026 | | | $ | 1,655,000 | | | $ | 1,853,004 | |
| | | | |
Philadelphia PA IDA Tacony Academy Charter School Project | | | 6.88 | | | | 6-15-2033 | | | | 375,000 | | | | 404,280 | |
| | | | |
| | | | | | | | | | | | | | | 2,908,118 | |
| | | | | | | | | | | | | | | | |
|
| Health Revenue: 0.74% | |
| | | | |
Quakertown PA General Authority Health LifeQuest Obligated Group Refunding Bond Series C | | | 5.30 | | | | 7-1-2042 | | | | 1,000,000 | | | | 962,320 | |
| | | | | | | | | | | | | | | | |
|
| Miscellaneous Revenue: 2.32% | |
| | | | |
Chester County PA IDA Woodlands at Graystone Project Series 2018 144A | | | 5.13 | | | | 3-1-2048 | | | | 1,050,000 | | | | 1,051,827 | |
| | | | |
Philadelphia PA State Public School Building Authority School District Project | | | 5.00 | | | | 4-1-2031 | | | | 1,000,000 | | | | 1,051,540 | |
| | | | |
Scranton PA RDA Series A (Municipal Government Guaranty Insured) | | | 5.00 | | | | 11-15-2021 | | | | 880,000 | | | | 899,501 | |
| | | | |
| | | | | | | | | | | | | | | 3,002,868 | |
| | | | | | | | | | | | | | | | |
| | | | |
| | | | | | | | | | | | | | | 6,873,306 | |
| | | | | | | | | | | | | | | | |
|
South Carolina: 2.06% | |
|
| Education Revenue: 0.52% | |
| | | | |
South Carolina Jobs EDA York Preparatory Academy Project Series A | | | 5.75 | | | | 11-1-2023 | | | | 130,000 | | | | 133,422 | |
| | | | |
South Carolina Jobs EDA York Preparatory Academy Project Series A | | | 7.25 | | | | 11-1-2045 | | | | 500,000 | | | | 535,110 | |
| | | | |
| | | | | | | | | | | | | | | 668,532 | |
| | | | | | | | | | | | | | | | |
|
| Health Revenue: 0.77% | |
| | | | |
South Carolina Jobs EDA Residential Facilities Revenue Episcopal Home Still Hopes Refunding Bond | | | 5.00 | | | | 4-1-2048 | | | | 1,000,000 | | | | 998,400 | |
| | | | | | | | | | | | | | | | |
|
| Resource Recovery Revenue: 0.77% | |
| | | | |
South Carolina Jobs EDA Solid Waste Disposal AMT RePower South Berkeley LLC Project Green Bond 144A | | | 6.25 | | | | 2-1-2045 | | | | 1,000,000 | | | | 1,001,820 | |
| | | | | | | | | | | | | | | | |
| | | | |
| | | | | | | | | | | | | | | 2,668,752 | |
| | | | | | | | | | | | | | | | |
|
Tennessee: 1.13% | |
|
| Tax Revenue: 1.13% | |
| | | | |
Bristol TN Industrial Development Board Sales Tax CAB Series B 144A(z) | | | 6.09 | | | | 12-1-2031 | | | | 2,000,000 | | | | 950,560 | |
| | | | |
Nashville TN Metropolitan Development & Housing Agency Tax Increment Fifth & Broadway Development Project 144A | | | 5.13 | | | | 6-1-2036 | | | | 500,000 | | | | 516,760 | |
| | | | |
| | | | | | | | | | | | | | | 1,467,320 | |
| | | | | | | | | | | | | | | | |
|
Texas: 8.59% | |
|
| Education Revenue: 1.52% | |
| | | | |
Arlington TX Higher Education Finance Corporation Universal Academy Series A | | | 7.00 | | | | 3-1-2034 | | | | 320,000 | | | | 326,742 | |
| | | | |
Pottsboro TX Higher Education Finance Corporation Imagine International Academy of North Texas Series A | | | 3.88 | | | | 8-15-2026 | | | | 1,015,000 | | | | 987,839 | |
| | | | |
Pottsboro TX Higher Education Finance Corporation Imagine International Academy of North Texas Series A | | | 5.00 | | | | 8-15-2036 | | | | 655,000 | | | | 656,415 | |
| | | | |
| | | | | | | | | | | | | | | 1,970,996 | |
| | | | | | | | | | | | | | | | |
The accompanying notes are an integral part of these financial statements.
| | | | | | |
| Portfolio of investments—December 31, 2018 (unaudited) | | Wells Fargo High Yield Municipal Bond Fund | | | 15 | |
| | | | | | | | | | | | | | | | |
| Security name | | Interest rate | | | Maturity date | | | Principal | | | Value | |
|
| Health Revenue: 1.40% | |
| | | | |
New Hope TX Cultural Education Facilities Finance Corporation Retirement Facility Presbyterian Village North Project Series 2018 | | | 5.00 | % | | | 10-1-2025 | | | $ | 1,730,000 | | | $ | 1,808,386 | |
| | | | | | | | | | | | | | | | |
|
| Miscellaneous Revenue: 1.84% | |
| | | | |
Hackberry TX Special Assessment Public Improvement District #3 Phase #13 | | | 6.00 | | | | 9-1-2026 | | | | 185,000 | | | | 195,094 | |
| | | | |
Lewisville TX Combination Contract Castle Hills Public Improvement Bonds District #5 144A | | | 6.50 | | | | 9-1-2034 | | | | 905,000 | | | | 914,113 | |
| | | | |
Lewisville TX Combination Contract Castle Hills Public Improvement Bonds District #6 144A | | | 6.00 | | | | 9-1-2037 | | | | 1,250,000 | | | | 1,276,950 | |
| | | | |
| | | | | | | | | | | | | | | 2,386,157 | |
| | | | | | | | | | | | | | | | |
|
| Resource Recovery Revenue: 3.48% | |
| | | | |
Port Arthur TX Navigation District Jefferson County Environmental Facilities Motiva Enterprises LLC Project Series A ø | | | 2.05 | | | | 4-1-2040 | | | | 4,500,000 | | | | 4,500,000 | |
| | | | | | | | | | | | | | | | |
|
| Transportation Revenue: 0.18% | |
| | | | |
Texas Private Activity Bond Surface Transportation Corporation Project NTE Mobility Partners Segments LLC | | | 7.00 | | | | 12-31-2038 | | | | 200,000 | | | | 231,342 | |
| | | | | | | | | | | | | | | | |
|
| Utilities Revenue: 0.17% | |
| | | | |
Texas Gas Supply SA Energy Acquisition Public Facilities Corporation | | | 5.50 | | | | 8-1-2027 | | | | 190,000 | | | | 220,847 | |
| | | | | | | | | | | | | | | | |
| | | | |
| | | | | | | | | | | | | | | 11,117,728 | |
| | | | | | | | | | | | | | | | |
|
Utah: 0.78% | |
|
| Education Revenue: 0.78% | |
| | | | |
Utah Finance Authority Charter School Revenue Spectrum Academy Project 144A | | | 5.00 | | | | 4-15-2030 | | | | 1,000,000 | | | | 1,007,470 | |
| | | | | | | | | | | | | | | | |
|
Virginia: 1.06% | |
|
| Miscellaneous Revenue: 1.06% | |
| | | | |
Stafford County & Staunton VA IDA Community Services Boards League/Central Series B | | | 6.50 | | | | 8-1-2028 | | | | 1,370,000 | | | | 1,371,178 | |
| | | | | | | | | | | | | | | | |
|
Washington: 0.84% | |
|
| Health Revenue: 0.84% | |
| | | | |
Skagit County WA Public Hospital District #1 Skagit Valley Hospital Project | | | 5.25 | | | | 12-1-2025 | | | | 250,000 | | | | 260,555 | |
| | | | |
Washington Housing Finance Commission Bayview Manor Homes Series A 144A | | | 4.00 | | | | 7-1-2026 | | | | 825,000 | | | | 824,472 | |
| | | | |
| | | | | | | | | | | | | | | 1,085,027 | |
| | | | | | | | | | | | | | | | |
|
West Virginia: 1.19% | |
|
| Tax Revenue: 1.19% | |
| | | | |
Monongalia County WV Commission Refunding & Improvement Bonds University Town Center Series A 144A | | | 5.75 | | | | 6-1-2043 | | | | 1,500,000 | | | | 1,533,000 | |
| | | | | | | | | | | | | | | | |
|
Wisconsin: 2.43% | |
|
| Education Revenue: 1.29% | |
| | | | |
Wisconsin PFA Charter School Voyager Funding Incorporated Project Series A | | | 4.13 | | | | 10-1-2024 | | | | 230,000 | | | | 234,586 | |
| | | | |
Wisconsin PFA Coral Academy Science Las Vegas Series A | | | 5.00 | | | | 7-1-2024 | | | | 435,000 | | | | 454,301 | |
| | | | |
Wisconsin PFA Research Triangle High School Project Series2015-A 144A | | | 5.63 | | | | 7-1-2045 | | | | 1,000,000 | | | | 982,300 | |
| | | | |
| | | | | | | | | | | | | | | 1,671,187 | |
| | | | | | | | | | | | | | | | |
The accompanying notes are an integral part of these financial statements.
| | | | |
| 16 | | Wells Fargo High Yield Municipal Bond Fund | | Portfolio of investments—December 31, 2018 (unaudited) |
| | | | | | | | | | | | | | | | |
| Security name | | Interest rate | | | Maturity date | | | Principal | | | Value | |
|
| Health Revenue: 1.14% | |
| | | | |
Wisconsin HEFA Wisconsin IIllionis Senior Housing Incorporated Series2018-A | | | 5.25 | % | | | 8-1-2048 | | | $ | 1,500,000 | | | $ | 1,471,230 | |
| | | | | | | | | | | | | | | | |
| | | | |
| | | | | | | | | | | | | | | 3,142,417 | |
| | | | | | | | | | | | | | | | |
| |
Total Municipal Obligations (Cost $122,189,399) | | | | 125,226,878 | |
| | | | | | | | | | | | | | | | |
| | | | |
| | | Yield | | | | | | Shares | | | | |
| Short-Term Investments: 1.92% | | | | | | | | | | | | | | | | |
| | | | |
| Investment Companies: 1.92% | | | | | | | | | | | | | | | | |
| | | | |
Wells Fargo Municipal Cash Management Money Market Fund Institutional Class (l)(u) | | | 1.65 | | | | | | | | 2,489,611 | | | | 2,490,607 | |
| | | | | | | | | | | | | | | | |
| | | | |
Total Short-Term Investments (Cost $2,490,607) | | | | | | | | | | | | | | | 2,490,607 | |
| | | | | | | | | | | | | | | | |
| | | | | | | | |
| Total investments in securities (Cost $124,680,006) | | | 98.72 | % | | | 127,717,485 | |
| | |
Other assets and liabilities, net | | | 1.28 | | | | 1,650,568 | |
| | | | | | | | |
| Total net assets | | | 100.00 | % | | $ | 129,368,053 | |
| | | | | | | | |
| (z) | Zero coupon security. The rate represents the purchase yield to maturity. |
| 144A | The security may be resold in transactions exempt from registration, normally to qualified institutional buyers, pursuant to Rule 144A under the Securities Act of 1933. |
| ø | Variable rate demand notes are subject to a demand feature which reduces the effective maturity. The maturity date shown represents the final maturity date of the security. The interest rate is determined and reset by the issuer daily, weekly, or monthly depending upon the terms of the security. The rate shown is the rate in effect at period end. |
| (l) | The issuer of the security is an affiliated person of the Fund as defined in the Investment Company Act of 1940. |
| (u) | The rate represents the7-day annualized yield at period end. |
Abbreviations:
| AGM | Assured Guaranty Municipal |
| Ambac | Ambac Financial Group Incorporated |
| AMT | Alternative minimum tax |
| CAB | Capital appreciation bond |
| CCAB | Convertible capital appreciation bond |
| CDA | Community Development Authority |
| EDA | Economic Development Authority |
| EDFA | Economic Development Finance Authority |
| HEFA | Health & Educational Facilities Authority |
| IDA | Industrial Development Authority |
| National | National Public Finance Guarantee Corporation |
| PCFA | Pollution Control Financing Authority |
| PFA | Public Finance Authority |
| RDA | Redevelopment Authority |
| SPA | Standby purchase agreement |
| TTFA | Transportation Trust Fund Authority |
The accompanying notes are an integral part of these financial statements.
| | | | | | |
| Portfolio of investments—December 31, 2018 (unaudited) | | Wells Fargo High Yield Municipal Bond Fund | | | 17 | |
Investments in Affiliates
An affiliated investment is an investment in which the Fund owns at least 5% of the outstanding voting shares of the issuer or as a result of other relationships, such as the Fund and the issuer having the same investment manager. Transactions with issuers that were either affiliated persons of the Fund at the beginning of the period or the end of the period were as follows:
| | | | | | | | | | | | | | | | | | | | | | | | | | | | | | | | | | | | |
| | | Shares,
beginning of
period | | | Shares
purchased | | | Shares
sold | | | Shares,
end of
period | | | Net
realized
gains
(losses) | | | Net
change in
unrealized
gains
(losses) | | | Income
from
affiliated
securities | | | Value,
end
of period | | | % of
net
assets | |
Short-Term Investments | | | | | | | | | | | | | | | | | | | | | | | | | | | | | | | | | | | | |
Investment Companies | | | | | | | | | | | | | | | | | | | | | | | | | | | | | | | | | | | | |
Wells Fargo Municipal Cash Management Money Market Fund Institutional Class | | | 193,315 | | | | 25,199,895 | | | | 22,903,599 | | | | 2,489,611 | | | $ | (91 | ) | | $ | 0 | | | $ | 4,739 | | | $ | 2,490,607 | | | | 1.92 | % |
The accompanying notes are an integral part of these financial statements.
| | | | |
| 18 | | Wells Fargo High Yield Municipal Bond Fund | | Statement of assets and liabilities—December 31, 2018 (unaudited) |
| | | | |
| | | | |
| |
Assets | | | | |
Investments in unaffiliated securities, at value (cost $122,189,399) | | $ | 125,226,878 | |
Investments in affiliated securities, at value (cost $2,490,607) | | | 2,490,607 | |
Cash | | | 373,283 | |
Receivable for investments sold | | | 50,000 | |
Receivable for Fund shares sold | | | 192,232 | |
Receivable for interest | | | 1,575,870 | |
Prepaid expenses and other assets | | | 67,771 | |
| | | | |
Total assets | | | 129,976,641 | |
| | | | |
| |
Liabilities | | | | |
Payable for Fund shares redeemed | | | 458,159 | |
Dividends payable | | | 41,210 | |
Professional fees payable | | | 31,370 | |
Management fee payable | | | 27,533 | |
Administration fees payable | | | 11,384 | |
Distribution fee payable | | | 5,924 | |
Trustees’ fees and expenses payable | | | 845 | |
Accrued expenses and other liabilities | | | 32,163 | |
| | | | |
Total liabilities | | | 608,588 | |
| | | | |
Total net assets | | $ | 129,368,053 | |
| | | | |
| |
NET ASSETS CONSIST OF | | | | |
Paid-in capital | | $ | 127,341,259 | |
Total distributable earnings | | | 2,026,794 | |
| | | | |
Total net assets | | $ | 129,368,053 | |
| | | | |
| |
COMPUTATION OF NET ASSET VALUE AND OFFERING PRICE PER SHARE | | | | |
Net assets – Class A | | $ | 20,080,604 | |
Shares outstanding – Class A1 | | | 1,902,447 | |
Net asset value per share – Class A | | | $10.56 | |
Maximum offering price per share – Class A2 | | | $11.06 | |
Net assets – Class C | | $ | 9,298,169 | |
Shares outstanding – Class C1 | | | 880,795 | |
Net asset value per share – Class C | | | $10.56 | |
Net assets – Class R6 | | $ | 24,882 | |
Shares outstanding – Class R61 | | | 2,356 | |
Net asset value per share – Class R6 | | | $10.56 | |
Net assets – Administrator Class | | $ | 19,366,913 | |
Shares outstanding – Administrator Class1 | | | 1,834,040 | |
Net asset value per share – Administrator Class | | | $10.56 | |
Net assets – Institutional Class | | $ | 80,597,485 | |
Shares outstanding – Institutional Class1 | | | 7,635,647 | |
Net asset value per share – Institutional Class | | | $10.56 | |
| 1 | The Fund has an unlimited number of authorized shares. |
| 2 | Maximum offering price is computed as 100/95.50 of net asset value. On investments of $50,000 or more, the offering price is reduced. |
The accompanying notes are an integral part of these financial statements.
| | | | | | |
| Statement of operations—six months ended December 31, 2018 (unaudited) | | Wells Fargo High Yield Municipal Bond Fund | | | 19 | |
| | | | |
| | | | |
| |
Investment income | | | | |
Interest | | $ | 2,725,764 | |
Income from affiliated securities | | | 4,739 | |
| | | | |
Total investment income | | | 2,730,503 | |
| | | | |
| |
Expenses | | | | |
Management fee | | | 322,804 | |
Administration fees | | | | |
Class A | | | 14,947 | |
Class C | | | 7,249 | |
Class R6 | | | 3 | 1 |
Administrator Class | | | 11,539 | |
Institutional Class | | | 31,311 | |
Shareholder servicing fees | | | | |
Class A | | | 23,355 | |
Class C | | | 11,326 | |
Administrator Class | | | 28,634 | |
Distribution fee | | | | |
Class C | | | 33,979 | |
Custody and accounting fees | | | 8,849 | |
Professional fees | | | 32,097 | |
Registration fees | | | 49,997 | |
Shareholder report expenses | | | 16,253 | |
Trustees’ fees and expenses | | | 10,619 | |
Other fees and expenses | | | 6,391 | |
| | | | |
Total expenses | | | 609,353 | |
Less: Fee waivers and/or expense reimbursements | | | (163,070 | ) |
| | | | |
Net expenses | | | 446,283 | |
| | | | |
Net investment income | | | 2,284,220 | |
| | | | |
| |
REALIZED AND UNREALIZED GAINS (LOSSES) ON INVESTMENTS | | | | |
| |
| Net realized gains (losses) on: | | | | |
Unaffiliated securities | | | 151,266 | |
Affiliated securities | | | (91 | ) |
| | | | |
Net realized gains on investments | | | 151,175 | |
Net change in unrealized gains (losses) on investments | | | (596,734 | ) |
| | | | |
Net realized and unrealized gains (losses) on investments | | | (445,559 | ) |
| | | | |
Net increase in net assets resulting from operations | | $ | 1,838,661 | |
| | | | |
| 1 | For the period from July 31, 2018 (commencement of operations) to December 31, 2018 |
The accompanying notes are an integral part of these financial statements.
| | | | |
| 20 | | Wells Fargo High Yield Municipal Bond Fund | | Statement of changes in net assets |
| | | | | | | | | | | | | | | | |
| | | Six months ended
December 31, 2018 (unaudited) | | | Year ended
June 30, 20181 | |
| | | | |
Operations | | | | | | | | | | | | | | | | |
Net investment income | | | | | | $ | 2,284,220 | | | | | | | $ | 4,902,547 | |
Net realized gains (losses) on investments | | | | | | | 151,175 | | | | | | | | (18,833 | ) |
Net change in unrealized gains (losses) on investments | | | | | | | (596,734 | ) | | | | | | | 2,722,837 | |
| | | | |
Net increase in net assets resulting from operations | | | | | | | 1,838,661 | | | | | | | | 7,606,551 | |
| | | | |
| | | | |
Distributions to shareholders from net investment income and net realized gains | | | | | | | | | | | | | | | | |
Class A | | | | | | | (320,624 | ) | | | | | | | (674,381 | ) |
Class C | | | | | | | (120,853 | ) | | | | | | | (262,165 | ) |
Class R6 | | | | | | | (384 | )2 | | | | | | | N/A | |
Administrator Class | | | | | | | (401,603 | ) | | | | | | | (900,885 | ) |
Institutional Class | | | | | | | (1,440,099 | ) | | | | | | | (3,065,373 | ) |
| | | | |
Total distributions to shareholders | | | | | | | (2,283,563 | ) | | | | | | | (4,902,804 | ) |
| | | | |
| | | | |
Capital share transactions | | | Shares | | | | | | | | Shares | | | | | |
Proceeds from shares sold | | | | | | | | | | | | | | | | |
Class A | | | 424,040 | | | | 4,479,737 | | | | 523,458 | | | | 5,507,807 | |
Class C | | | 163,409 | | | | 1,724,571 | | | | 243,083 | | | | 2,563,225 | |
Class R6 | | | 2,356 | 2 | | | 25,000 | 2 | | | N/A | | | | N/A | |
Administrator Class | | | 294,580 | | | | 3,122,025 | | | | 823,935 | | | | 8,665,436 | |
Institutional Class | | | 2,240,536 | | | | 23,592,525 | | | | 2,688,557 | | | | 28,274,124 | |
| | | | |
| | | | | | | 32,943,858 | | | | | | | | 45,010,592 | |
| | | | |
Reinvestment of distributions | | | | | | | | | | | | | | | | |
Class A | | | 28,633 | | | | 302,164 | | | | 60,416 | | | | 635,499 | |
Class C | | | 10,960 | | | | 115,671 | | | | 23,038 | | | | 242,387 | |
Administrator Class | | | 31,164 | | | | 329,150 | | | | 72,339 | | | | 761,162 | |
Institutional Class | | | 128,574 | | | | 1,356,955 | | | | 267,171 | | | | 2,810,697 | |
| | | | |
| | | | | | | 2,103,940 | | | | | | | | 4,449,745 | |
| | | | |
Payment for shares redeemed | | | | | | | | | | | | | | | | |
Class A | | | (163,730 | ) | | | (1,725,910 | ) | | | (928,806 | ) | | | (9,778,906 | ) |
Class C | | | (133,528 | ) | | | (1,410,232 | ) | | | (265,986 | ) | | | (2,799,324 | ) |
Administrator Class | | | (816,306 | ) | | | (8,591,435 | ) | | | (773,657 | ) | | | (8,148,860 | ) |
Institutional Class | | | (1,868,766 | ) | | | (19,677,315 | ) | | | (2,956,600 | ) | | | (31,109,401 | ) |
| | | | |
| | | | | | | (31,404,892 | ) | | | | | | | (51,836,491 | ) |
| | | | |
Net increase (decrease) in net assets resulting from capital share transactions | | | | | | | 3,642,906 | | | | | | | | (2,376,154 | ) |
| | | | |
Total increase in net assets | | | | | | | 3,198,004 | | | | | | | | 327,593 | |
| | | | |
| | | | |
Net assets | | | | | | | | | | | | | | | | |
Beginning of period | | | | | | | 126,170,049 | | | | | | | | 125,842,456 | |
| | | | |
End of period | | | | | | $ | 129,368,053 | | | | | | | $ | 126,170,049 | |
| | | | |
| 1 | Effective for all filings after November 4, 2018, the SEC prospectively eliminated the requirement to parenthetically disclose undistributed net investment income at the end of the period and permitted the aggregation of distributions, with the exception of tax basis returns of capital. Overdistributed net investment income at June 30, 2018 was $5,672. The disaggregated distributions information for the year ended June 30, 2018 is included in Note 7,Distributions to Shareholders, in the notes to the financial statements. |
| 2 | For the period from July 31, 2018 (commencement of operations) to December 31, 2018 |
The accompanying notes are an integral part of these financial statements.
| | | | | | |
| Financial highlights | | Wells Fargo High Yield Municipal Bond Fund | | | 21 | |
(For a share outstanding throughout each period)
| | | | | | | | | | | | | | | | | | | | | | | | |
| | | Six months ended
December 31, 2018 (unaudited) | | | Year ended June 30 | |
| CLASS A | | 2018 | | | 2017 | | | 2016 | | | 2015 | | | 2014 | |
Net asset value, beginning of period | | | $10.59 | | | | $10.37 | | | | $10.91 | | | | $10.34 | | | | $10.25 | | | | $9.52 | |
Net investment income | | | 0.18 | | | | 0.40 | | | | 0.37 | | | | 0.35 | | | | 0.34 | | | | 0.40 | |
Net realized and unrealized gains (losses) on investments | | | (0.03 | ) | | | 0.22 | | | | (0.46 | ) | | | 0.60 | | | | 0.18 | | | | 0.75 | |
| | | | | | | | | | | | | | | | | | | | | | | | |
Total from investment operations | | | 0.15 | | | | 0.62 | | | | (0.09 | ) | | | 0.95 | | | | 0.52 | | | | 1.15 | |
Distributions to shareholders from | | | | | | | | | | | | | | | | | | | | | | | | |
Net investment income | | | (0.18 | ) | | | (0.40 | ) | | | (0.37 | ) | | | (0.35 | ) | | | (0.34 | ) | | | (0.40 | ) |
Net realized gains | | | 0.00 | | | | 0.00 | | | | (0.08 | ) | | | (0.03 | ) | | | (0.09 | ) | | | (0.02 | ) |
| | | | | | | | | | | | | | | | | | | | | | | | |
Total distributions to shareholders | | | (0.18 | ) | | | (0.40 | ) | | | (0.45 | ) | | | (0.38 | ) | | | (0.43 | ) | | | (0.42 | ) |
Net asset value, end of period | | | $10.56 | | | | $10.59 | | | | $10.37 | | | | $10.91 | | | | $10.34 | | | | $10.25 | |
Total return1 | | | 1.45 | % | | | 6.11 | % | | | (0.76 | )% | | | 9.44 | % | | | 5.06 | % | | | 12.41 | % |
Ratios to average net assets (annualized) | | | | | | | | | | | | | | | | | | | | | | | | |
Gross expenses | | | 1.10 | % | | | 1.07 | % | | | 1.06 | % | | | 1.07 | % | | | 1.07 | % | | | 1.90 | % |
Net expenses | | | 0.81 | % | | | 0.85 | % | | | 0.85 | % | | | 0.85 | % | | | 0.85 | % | | | 0.85 | % |
Net investment income | | | 3.43 | % | | | 3.82 | % | | | 3.51 | % | | | 3.28 | % | | | 3.26 | % | | | 3.98 | % |
Supplemental data | | | | | | | | | | | | | | | | | | | | | | | | |
Portfolio turnover rate | | | 11 | % | | | 50 | % | | | 82 | % | | | 61 | % | | | 62 | % | | | 65 | % |
Net assets, end of period (000s omitted) | | | $20,081 | | | | $17,086 | | | | $20,305 | | | | $38,018 | | | | $21,100 | | | | $4,022 | |
| 1 | Total return calculations do not include any sales charges. Returns for periods of less than one year are not annualized. |
The accompanying notes are an integral part of these financial statements.
| | | | |
| 22 | | Wells Fargo High Yield Municipal Bond Fund | | Financial highlights |
(For a share outstanding throughout each period)
| | | | | | | | | | | | | | | | | | | | | | | | |
| | | Six months ended
December 31, 2018 (unaudited) | | | Year ended June 30 | |
| CLASS C | | 2018 | | | 2017 | | | 2016 | | | 2015 | | | 2014 | |
Net asset value, beginning of period | | | $10.59 | | | | $10.37 | | | | $10.91 | | | | $10.34 | | | | $10.25 | | | | $9.52 | |
Net investment income | | | 0.14 | | | | 0.32 | | | | 0.29 | | | | 0.27 | | | | 0.26 | | | | 0.33 | |
Net realized and unrealized gains (losses) on investments | | | (0.03 | ) | | | 0.22 | | | | (0.46 | ) | | | 0.60 | | | | 0.18 | | | | 0.75 | |
| | | | | | | | | | | | | | | | | | | | | | | | |
Total from investment operations | | | 0.11 | | | | 0.54 | | | | (0.17 | ) | | | 0.87 | | | | 0.44 | | | | 1.08 | |
Distributions to shareholders from | | | | | | | | | | | | | | | | | | | | | | | | |
Net investment income | | | (0.14 | ) | | | (0.32 | ) | | | (0.29 | ) | | | (0.27 | ) | | | (0.26 | ) | | | (0.33 | ) |
Net realized gains | | | 0.00 | | | | 0.00 | | | | (0.08 | ) | | | (0.03 | ) | | | (0.09 | ) | | | (0.02 | ) |
| | | | | | | | | | | | | | | | | | | | | | | | |
Total distributions to shareholders | | | (0.14 | ) | | | (0.32 | ) | | | (0.37 | ) | | | (0.30 | ) | | | (0.35 | ) | | | (0.35 | ) |
Net asset value, end of period | | | $10.56 | | | | $10.59 | | | | $10.37 | | | | $10.91 | | | | $10.34 | | | | $10.25 | |
Total return1 | | | 1.07 | % | | | 5.32 | % | | | (1.50 | )% | | | 8.62 | % | | | 4.28 | % | | | 11.58 | % |
Ratios to average net assets (annualized) | | | | | | | | | | | | | | | | | | | | | | | | |
Gross expenses | | | 1.85 | % | | | 1.82 | % | | | 1.81 | % | | | 1.82 | % | | | 1.82 | % | | | 2.58 | % |
Net expenses | | | 1.56 | % | | | 1.60 | % | | | 1.60 | % | | | 1.60 | % | | | 1.60 | % | | | 1.60 | % |
Net investment income | | | 2.67 | % | | | 3.09 | % | | | 2.79 | % | | | 2.49 | % | | | 2.50 | % | | | 3.15 | % |
Supplemental data | | | | | | | | | | | | | | | | | | | | | | | | |
Portfolio turnover rate | | | 11 | % | | | 50 | % | | | 82 | % | | | 61 | % | | | 62 | % | | | 65 | % |
Net assets, end of period (000s omitted) | | | $9,298 | | | | $8,896 | | | | $8,709 | | | | $10,573 | | | | $4,522 | | | | $2,323 | |
| 1 | Total return calculations do not include any sales charges. Returns for periods of less than one year are not annualized. |
The accompanying notes are an integral part of these financial statements.
| | | | | | |
| Financial highlights | | Wells Fargo High Yield Municipal Bond Fund | | | 23 | |
(For a share outstanding throughout the period)
| | | | |
| CLASS R6 | | Period ended December 31, 20181
(unaudited) | |
Net asset value, beginning of period | | | $10.61 | |
Net investment income | | | 0.17 | |
Net realized and unrealized gains (losses) on investments | | | (0.06 | ) |
| | | | |
Total from investment operations | | | 0.11 | |
Distributions to shareholders from | | | | |
Net investment income | | | (0.16 | ) |
Net asset value, end of period | | | $10.56 | |
Total return2 | | | 1.08 | % |
Ratios to average net assets (annualized) | | | | |
Gross expenses | | | 0.72 | % |
Net expenses | | | 0.49 | % |
Net investment income | | | 3.69 | % |
Supplemental data | | | | |
Portfolio turnover rate | | | 11 | % |
Net assets, end of period (000s omitted) | | | $25 | |
| 1 | For the period from July, 31, 2018 (commencement of class operations) to December 31, 2018 |
| 2 | Returns for periods of less than one year are not annualized. |
The accompanying notes are an integral part of these financial statements.
| | | | |
| 24 | | Wells Fargo High Yield Municipal Bond Fund | | Financial highlights |
(For a share outstanding throughout each period)
| | | | | | | | | | | | | | | | | | | | | | | | |
| | | Six months ended
December 31, 2018 (unaudited) | | | Year ended June 30 | |
| ADMINISTRATOR CLASS | | 2018 | | | 2017 | | | 2016 | | | 2015 | | | 2014 | |
Net asset value, beginning of period | | | $10.59 | | | | $10.37 | | | | $10.92 | | | | $10.34 | | | | $10.26 | | | | $9.52 | |
Net investment income | | | 0.19 | | | | 0.41 | | | | 0.38 | | | | 0.36 | | | | 0.35 | | | | 0.41 | |
Net realized and unrealized gains (losses) on investments | | | (0.03 | ) | | | 0.22 | | | | (0.47 | ) | | | 0.61 | | | | 0.17 | | | | 0.76 | |
| | | | | | | | | | | | | | | | | | | | | | | | |
Total from investment operations | | | 0.16 | | | | 0.63 | | | | (0.09 | ) | | | 0.97 | | | | 0.52 | | | | 1.17 | |
Distributions to shareholders from | | | | | | | | | | | | | | | | | | | | | | | | |
Net investment income | | | (0.19 | ) | | | (0.41 | ) | | | (0.38 | ) | | | (0.36 | ) | | | (0.35 | ) | | | (0.41 | ) |
Net realized gains | | | 0.00 | | | | 0.00 | | | | (0.08 | ) | | | (0.03 | ) | | | (0.09 | ) | | | (0.02 | ) |
| | | | | | | | | | | | | | | | | | | | | | | | |
Total distributions to shareholders | | | (0.19 | ) | | | (0.41 | ) | | | (0.46 | ) | | | (0.39 | ) | | | (0.44 | ) | | | (0.43 | ) |
Net asset value, end of period | | | $10.56 | | | | $10.59 | | | | $10.37 | | | | $10.92 | | | | $10.34 | | | | $10.26 | |
Total return1 | | | 1.50 | % | | | 6.21 | % | | | (0.75 | )% | | | 9.65 | % | | | 5.07 | % | | | 12.63 | % |
Ratios to average net assets (annualized) | | | | | | | | | | | | | | | | | | | | | | | | |
Gross expenses | | | 1.04 | % | | | 1.01 | % | | | 1.00 | % | | | 1.00 | % | | | 1.00 | % | | | 1.80 | % |
Net expenses | | | 0.71 | % | | | 0.75 | % | | | 0.75 | % | | | 0.75 | % | | | 0.75 | % | | | 0.75 | % |
Net investment income | | | 3.49 | % | | | 3.93 | % | | | 3.60 | % | | | 3.39 | % | | | 3.35 | % | | | 4.14 | % |
Supplemental data | | | | | | | | | | | | | | | | | | | | | | | | |
Portfolio turnover rate | | | 11 | % | | | 50 | % | | | 82 | % | | | 61 | % | | | 62 | % | | | 65 | % |
Net assets, end of period (000s omitted) | | | $19,367 | | | | $24,627 | | | | $22,839 | | | | $25,179 | | | | $13,768 | | | | $3,282 | |
| 1 | Returns for periods of less than one year are not annualized. |
The accompanying notes are an integral part of these financial statements.
| | | | | | |
| Financial highlights | | Wells Fargo High Yield Municipal Bond Fund | | | 25 | |
(For a share outstanding throughout each period)
| | | | | | | | | | | | | | | | | | | | | | | | |
| | | Six months ended
December 31, 2018 (unaudited) | | | Year ended June 30 | |
| INSTITUTIONAL CLASS | | 2018 | | | 2017 | | | 2016 | | | 2015 | | | 2014 | |
Net asset value, beginning of period | | | $10.59 | | | | $10.37 | | | | $10.91 | | | | $10.34 | | | | $10.25 | | | | $9.52 | |
Net investment income | | | 0.20 | | | | 0.43 | | | | 0.40 | | | | 0.38 | | | | 0.37 | | | | 0.42 | |
Net realized and unrealized gains (losses) on investments | | | (0.03 | ) | | | 0.22 | | | | (0.46 | ) | | | 0.60 | | | | 0.18 | | | | 0.75 | |
| | | | | | | | | | | | | | | | | | | | | | | | |
Total from investment operations | | | 0.17 | | | | 0.65 | | | | (0.06 | ) | | | 0.98 | | | | 0.55 | | | | 1.17 | |
Distributions to shareholders from | | | | | | | | | | | | | | | | | | | | | | | | |
Net investment income | | | (0.20 | ) | | | (0.43 | ) | | | (0.40 | ) | | | (0.38 | ) | | | (0.37 | ) | | | (0.42 | ) |
Net realized gains | | | 0.00 | | | | 0.00 | | | | (0.08 | ) | | | (0.03 | ) | | | (0.09 | ) | | | (0.02 | ) |
| | | | | | | | | | | | | | | | | | | | | | | | |
Total distributions to shareholders | | | (0.20 | ) | | | (0.43 | ) | | | (0.48 | ) | | | (0.41 | ) | | | (0.46 | ) | | | (0.44 | ) |
Net asset value, end of period | | | $10.56 | | | | $10.59 | | | | $10.37 | | | | $10.91 | | | | $10.34 | | | | $10.25 | |
Total return1 | | | 1.58 | % | | | 6.37 | % | | | (0.51 | )% | | | 9.71 | % | | | 5.33 | % | | | 12.70 | % |
Ratios to average net assets (annualized) | | | | | | | | | | | | | | | | | | | | | | | | |
Gross expenses | | | 0.77 | % | | | 0.74 | % | | | 0.73 | % | | | 0.74 | % | | | 0.74 | % | | | 1.53 | % |
Net expenses | | | 0.56 | % | | | 0.60 | % | | | 0.60 | % | | | 0.60 | % | | | 0.60 | % | | | 0.60 | % |
Net investment income | | | 3.68 | % | | | 4.09 | % | | | 3.82 | % | | | 3.58 | % | | | 3.51 | % | | | 4.26 | % |
Supplemental data | | | | | | | | | | | | | | | | | | | | | | | | |
Portfolio turnover rate | | | 11 | % | | | 50 | % | | | 82 | % | | | 61 | % | | | 62 | % | | | 65 | % |
Net assets, end of period (000s omitted) | | | $80,597 | | | | $75,560 | | | | $73,989 | | | | $67,867 | | | | $76,118 | | | | $31,105 | |
| 1 | Returns for periods of less than one year are not annualized. |
The accompanying notes are an integral part of these financial statements.
| | | | |
| 26 | | Wells Fargo High Yield Municipal Bond Fund | | Notes to financial statements (unaudited) |
1. ORGANIZATION
Wells Fargo Funds Trust (the “Trust”), a Delaware statutory trust organized on March 10, 1999, is anopen-end management investment company registered under the Investment Company Act of 1940, as amended (the “1940 Act”). As an investment company, the Trust follows the accounting and reporting guidance in Financial Accounting Standards Board(“FASB”) Accounting Standards Codification Topic 946, Financial Services – Investment Companies. These financial statements report on the Wells Fargo High Yield Municipal Bond Fund (the “Fund”) which is a diversified series of the Trust.
2. SIGNIFICANT ACCOUNTING POLICIES
The following significant accounting policies, which are consistently followed in the preparation of the financial statements of the Fund, are in conformity with U.S. generally accepted accounting principles which require management to make estimates and assumptions that affect the reported amounts of assets and liabilities, disclosure of contingent assets and liabilities at the date of the financial statements, and the reported amounts of revenues and expenses during the reporting period. Actual results could differ from those estimates.
Securities valuation
All investments are valued each business day as of the close of regular trading on the New York Stock Exchange (generally 4 p.m. Eastern Time), although the Fund may deviate from this calculation time under unusual or unexpected circumstances.
Debt securities are valued at the evaluated bid price provided by an independent pricing service (e.g. taking into account various factors, including yields, maturities, or credit ratings) or, if a reliable price is not available, the quoted bid price from an independent broker-dealer.
Investments in registeredopen-end investment companies are valued at net asset value.
Investments which are not valued using any of the methods discussed above are valued at their fair value, as determined in good faith by the Board of Trustees of the Fund. The Board of Trustees has established a Valuation Committee comprised of the Trustees and has delegated to it the authority to take any actions regarding the valuation of portfolio securities that the Valuation Committee deems necessary or appropriate, including determining the fair value of portfolio securities, unless the determination has been delegated to the Wells Fargo Asset Management Pricing Committee at Wells Fargo Funds Management, LLC (“Funds Management”). The Board of Trustees retains the authority to make or ratify any valuation decisions or approve any changes to the Valuation Procedures as it deems appropriate. On a quarterly basis, the Board of Trustees receives reports on any valuation actions taken by the Valuation Committee or the Wells Fargo Asset Management Pricing Committee which may include items for ratification.
When-issued transactions
The Fund may purchase securities on a forward commitment or when-issued basis. The Fund records a when-issued transaction on the trade date and will segregate assets in an amount at least equal in value to the Fund’s commitment to purchase when-issued securities. Securities purchased on a when-issued basis aremarked-to-market daily and the Fund begins earning interest on the settlement date. Losses may arise due to changes in the market value of the underlying securities or if the counterparty does not perform under the contract.
Security transactions and income recognition
Securities transactions are recorded on a trade date basis. Realized gains or losses are recorded on the basis of identified cost.
Interest income is accrued daily and bond discounts are accreted and premiums are amortized daily.To the extent debt obligations are placed onnon-accrual status, any related interest income may be reduced by writing off interest receivables when the collection of all or a portion of interest has been determined to be doubtful based on consistently applied procedures and the fair value has decreased. If the issuer subsequently resumes interest payments or when the collectability of interest is reasonably assured, the debt obligation is removed fromnon-accrual status.
Distributions to shareholders
Distributions to shareholders from net investment income are declared daily and paid monthly. Distributions from net realized gains, if any, are recorded on the ex-dividend date and paid at least annually. Such distributions are determined in accordance with income tax regulations and may differ from U.S. generally accepted accounting principles. Dividend sources are estimated at the time of declaration. The tax character of distributions is determined as of the Fund’s fiscal year end. Therefore, a portion of the Fund’s distributions made prior to the Fund’s fiscal year end may be categorized as a tax return of capital at year end.
| | | | | | |
| Notes to financial statements (unaudited) | | Wells Fargo High Yield Municipal Bond Fund | | | 27 | |
Federal and other taxes
The Fund intends to continue to qualify as a regulated investment company by distributing substantially all of its investment company taxable and tax-exempt income and any net realized capital gains (after reduction for capital loss carryforwards) sufficient to relieve it from all, or substantially all, federal income taxes. Accordingly, no provision for federal income taxes was required.
The Fund’s income and federal excise tax returns and all financial records supporting those returns for the prior three fiscal years are subject to examination by the federal and Delaware revenue authorities. Management has analyzed the Fund’s tax positions taken on federal, state, and foreign tax returns for all open tax years and does not believe that there are any uncertain tax positions that require recognition of a tax liability.
As of December 31, 2018, the aggregate cost of all investments for federal income tax purposes was $124,680,006 and the unrealized gains (losses) consisted of:
| | | | |
| |
Gross unrealized gains | | $ | 3,448,542 | |
| |
Gross unrealized losses | | | (411,063 | ) |
| |
Net unrealized gains | | $ | 3,037,479 | |
As of June 30, 2018, the Fund had capital loss carryforwards which consisted of $486,729 in short-term capital losses.
As of June 30, 2018, the Fund had current year deferred post-October capital losses consisting of $670,116 in netlong-term losses which was recognized on the first day of the current fiscal year.
Class allocations
The separate classes of shares offered by the Fund differ principally in applicable sales charges, distribution, shareholder servicing, and administration fees. Class specific expenses are charged directly to that share class. Investment income, common expenses, and realized and unrealized gains (losses) on investments are allocated daily to each class of shares based on the relative proportion of net assets of each class.
3. FAIR VALUATION MEASUREMENTS
Fair value measurements of investments are determined within a framework that has established a fair value hierarchy based upon the various data inputs utilized in determining the value of the Fund’s investments. The three-level hierarchy gives the highest priority to unadjusted quoted prices in active markets for identical assets or liabilities (Level 1) and the lowest priority to unobservable inputs (Level 3). The Fund’s investments are classified within the fair value hierarchy based on the lowest level of input that is significant to the fair value measurement. The inputs are summarized into three broad levels as follows:
| ∎ | | Level 1 – quoted prices in active markets for identical securities |
| ∎ | | Level 2 – other significant observable inputs (including quoted prices for similar securities, interest rates, prepayment speeds, credit risk, etc.) |
| ∎ | | Level 3 – significant unobservable inputs (including the Fund’s own assumptions in determining the fair value of investments) |
The inputs or methodologies used for valuing investments in securities are not necessarily an indication of the risk associated with investing in those securities.
The following is a summary of the inputs used in valuing the Fund’s assets and liabilities as of December 31, 2018:
| | | | | | | | | | | | | | | | |
| | | | |
| | | Quoted prices
(Level 1) | | | Other significant
observable inputs
(Level 2) | | | Significant
unobservable inputs
(Level 3) | | | Total | |
| | | | |
Assets | | | | | | | | | | | | | | | | |
Investments in: | | | | | | | | | | | | | | | | |
| | | | |
Municipal obligations | | $ | 0 | | | $ | 125,226,878 | | | $ | 0 | | | $ | 125,226,878 | |
| | | | |
Short-term investments | | | | | | | | | | | | | | | | |
| | | | |
Investment companies | | | 2,490,607 | | | | 0 | | | | 0 | | | | 2,490,607 | |
| | | | |
Total assets | | $ | 2,490,607 | | | $ | 125,226,878 | | | $ | 0 | | | $ | 127,717,485 | |
| | | | |
| 28 | | Wells Fargo High Yield Municipal Bond Fund | | Notes to financial statements (unaudited) |
Additional sector, industry or geographic detail is included in the Portfolio of Investments.
At December 31, 2018, the Fund did not have any transfers into/out of Level 3.
4. TRANSACTIONS WITH AFFILIATES
Management fee
Funds Management, an indirect wholly owned subsidiary of Wells Fargo & Company (“Wells Fargo”), is the manager of the Fund and provides advisory and fund-level administrative services under an investment management agreement. Under the investment management agreement, Funds Management is responsible for, among other services, implementing the investment objectives and strategies of the Fund, supervising the subadviser and providing fund-level administrative services in connection with the Fund’s operations. As compensation for its services under the investment management agreement, Funds Management is entitled to receive an annual management fee starting at 0.50% and declining to 0.38% as the average daily net assets of the Fund increase. For the six months ended December 31, 2018, the management fee was equivalent to an annual rate of 0.50% of the Fund’s average daily net assets.
Funds Management has retained the services of a subadviser to provide daily portfolio management to the Fund. The fee for subadvisory services is borne by Funds Management. WellsCap is the subadviser to the Fund and is entitled to receive a fee from Funds Management at an annual rate starting at 0.35% and declining to 0.20% as the average daily net assets of the Fund increase.
Administration fees
Under a class-level administration agreement, Funds Management provides class-level administrative services to the Fund, which includes paying fees and expenses for services provided by the transfer agent,sub-transfer agents, omnibus account servicers and record-keepers. As compensation for its services under the class-level administration agreement, Funds Management receives an annual fee which is calculated based on the average daily net assets of each class as follows:
| | | | |
| | | Class-level
administration fee | |
| |
Class A, Class C | | | 0.16 | % |
| |
Class R6 | | | 0.03 | |
| |
Administrator Class | | | 0.10 | |
| |
Institutional Class | | | 0.08 | |
Funds Management has contractually waived and/or reimbursed management and administration fees to the extent necessary to maintain certain net operating expense ratios for the Fund. When each class of the Fund has exceeded its expense cap, Funds Management has waived fees and/or reimbursed expenses from fund level expenses on a proportionate basis and then from class specific expenses; otherwise, waivers and/or reimbursements are applied against class specific expenses before fund level expenses. Funds Management has committed through October 31, 2019 to waive fees and/or reimburse expenses to the extent necessary to cap the Fund’s expenses at 0.80% for Class A shares, 1.55% for Class C shares, 0.50% for Class R6 shares, 0.70% for Administrator shares, and 0.55% for Institutional Class shares. After this time, the cap may be increased or the commitment to maintain the cap may be terminated only with the approval of the Board of Trustees.Prior to August 1, 2018, the Fund’s expenses were capped at 0.85% for Class A shares, 1.60% for Class C shares, 0.75% for Administrator Class shares and 0.60% for Institutional Class shares.
Distribution fee
The Trust has adopted a distribution plan for Class C shares of the Fund pursuant to Rule12b-1 under the 1940 Act. A distribution fee is charged to Class C shares and paid to Wells Fargo Funds Distributor, LLC (“Funds Distributor”), the principal underwriter, at an annual rate of 0.75% of the average daily net assets of Class C shares.
In addition, Funds Distributor is entitled to receive thefront-end sales charge from the purchase of Class A shares and a contingent deferred sales charge on the redemption of certain Class A shares. Funds Distributor is also entitled to receive the contingent deferred sales charges from redemptions of Class C shares. For the six months ended December 31, 2018, Funds Distributor received $1,443 from the sale of Class A shares. No contingent deferred sales charges were incurred by Class A and Class C shares for the six months ended December 31, 2018.
| | | | | | |
| Notes to financial statements (unaudited) | | Wells Fargo High Yield Municipal Bond Fund | | | 29 | |
Shareholder servicing fees
The Trust has entered into contracts with one or more shareholder servicing agents, whereby Class A, Class C and Administrator Class of the Fund are charged a fee at an annual rate of 0.25% of the average daily net assets of each respective class.
A portion of these total shareholder servicing fees were paid to affiliates of Wells Fargo.
Interfund transactions
The Fund may purchase or sell portfolio investment securities to certain other Wells Fargo affiliates pursuant to Rule17a-7 under the 1940 Act and under procedures adopted by the Board of Trustees. The procedures have been designed to ensure that these interfund transactions, which do not incur broker commissions, are effected at current market prices. Pursuant to these procedures, the Fund had $18,550,000 and $17,600,000 in interfund purchases and sales, respectively, during the six months ended December 31, 2018.
5. INVESTMENT PORTFOLIO TRANSACTIONS
Purchases and sales of investments, excluding U.S. government obligations (if any) and short-term securities, for the six months ended December 31, 2018 were $14,066,321 and $12,002,690, respectively.
6. BANK BORROWINGS
The Trust (excluding the money market funds), Wells Fargo Master Trust and Wells Fargo Variable Trust are parties to a $280,000,000 revolving credit agreement whereby the Fund is permitted to use bank borrowings for temporary or emergency purposes, such as to fund shareholder redemption requests. Interest under the credit agreement is charged to the Fund based on a borrowing rate equal to the higher of the Federal Funds rate in effect on that day plus 1.25% or the overnight LIBOR rate in effect on that day plus 1.25%. In addition, an annual commitment fee equal to 0.25% of the unused balance is allocated to each participating fund.
For the six months ended December 31, 2018, there were no borrowings by the Fund under the agreement.
7. DISTRIBUTIONS TO SHAREHOLDERS
Effective for all filings after November 4, 2018, the Securities and Exchange Commission eliminated the requirement to separately state the components of distributions to shareholders under U.S. generally accepted accounting principles. The amounts of distributions to shareholders for the year ended June 30, 2018 were as follows:
| | | | |
| | | Net investment income | |
| |
Class A | | | $674,381 | |
| |
Class C | | | 262,165 | |
| |
Administrator Class | | | 900,885 | |
| |
Institutional Class | | | 3,065,373 | |
8. INDEMNIFICATION
Under the Trust’s organizational documents, the officers and Trustees have been granted certain indemnification rights against certain liabilities that may arise out of performance of their duties to the Trust. Additionally, in the normal course of business, the Trust may enter into contracts with service providers that contain a variety of indemnification clauses. The Trust’s maximum exposure under these arrangements is dependent on future claims that may be made against the Fund and, therefore, cannot be estimated.
9. NEW ACCOUNTING PRONOUNCEMENT
In August 2018, FASB issued Accounting Standards Update (“ASU”)No. 2018-13, Fair Value Measurement (Topic 820)Disclosure Framework—Changes to the Disclosure Requirements for Fair Value Measurement. ASU2018-13 updates the
disclosure requirements for fair value measurements by modifying or removing certain disclosures and adding certain new disclosures. The amendments are effective for fiscal years, and interim periods within those fiscal years, beginning after December 15, 2019. Early adoption is permitted. Management has adopted the removal and modification of disclosures early, as permitted, and will adopt the additional new disclosures at the effective date.
| | | | |
| 30 | | Wells Fargo High Yield Municipal Bond Fund | | Other information (unaudited) |
PROXY VOTING INFORMATION
A description of the policies and procedures used to determine how to vote proxies relating to portfolio securities is available, upon request, by calling1-800-222-8222, visiting our website atwellsfargofunds.com, or visiting the SEC website at sec.gov. Information regarding how the Fund voted proxies relating to portfolio securities during the most recent12-month period ended June 30 is available on the Fund’s website atwellsfargofunds.comor by visiting the SEC website at sec.gov.
PORTFOLIO HOLDINGS INFORMATION
The complete portfolio holdings for the Fund are publicly available monthly on the Fund’s website (wellsfargofunds.com), on aone-month delayed basis. In addition, top ten holdings information (excluding derivative positions) for the Fund is publicly available on the Fund’s website on a monthly,seven-day or more delayed basis. The Fund files its complete schedule of portfolio holdings with the SEC for the first and third quarters of each fiscal year on FormN-Q, which is available by visiting the SEC website at sec.gov. In addition, the Fund’s FormN-Q may be reviewed and copied at the SEC’s Public Reference Room in Washington, DC, and at regional offices in New York City, at 233 Broadway, and in Chicago, at 175 West Jackson Boulevard, Suite 900. Information about the Public Reference Room may be obtained by calling1-800-SEC-0330.
| | | | | | |
| Other information (unaudited) | | Wells Fargo High Yield Municipal Bond Fund | | | 31 | |
BOARD OF TRUSTEES AND OFFICERS
Each of the Trustees and Officers1 listed in the table below acts in identical capacities for each fund in the Wells Fargo family of funds, which consists of 152 mutual funds comprising the Wells Fargo Funds Trust, Wells Fargo Variable Trust, Wells Fargo Master Trust and fourclosed-end funds (collectively the “Fund Complex”). This table should be read in conjunction with the Prospectus and the Statement of Additional Information2. The mailing address of each Trustee and Officer is 525 Market Street, 12th Floor, San Francisco, CA 94105. Each Trustee and Officer serves an indefinite term, however, each Trustee serves such term until reaching the mandatory retirement age established by the Trustees.
Independent Trustees
| | | | | | |
Name and
year of birth | | Position held and
length of service* | | Principal occupations during past five years or longer | | Current other
public company or
investment company
directorships |
| | | |
William R. Ebsworth
(Born 1957) | | Trustee, since 2015 | | Retired. From 1984 to 2013, equities analyst, portfolio manager, research director and chief investment officer at Fidelity Management and Research Company in Boston, Tokyo, and Hong Kong, and retired in 2013 as Chief Investment Officer of Fidelity Strategic Advisers, Inc. where he led a team of investment professionals managing client assets. Prior thereto, Board member of Hong Kong Securities Clearing Co., Hong Kong Options Clearing Corp., the Thailand International Fund, Ltd., Fidelity Investments Life Insurance Company, and Empire Fidelity Investments Life Insurance Company. Board member of the Vincent Memorial Hospital Endowment(non-profit organization), where he serves on the Investment Committee and as a Chair of the Audit Committee. Mr. Ebsworth is a CFA® charterholder. | | N/A |
| | | |
Jane A. Freeman
(Born 1953) | | Trustee, since 2015; Chair Liaison, since 2018 | | Retired. From 2012 to 2014 and 1999 to 2008, Chief Financial Officer of Scientific Learning Corporation. From 2008 to 2012, Ms. Freeman provided consulting services related to strategic business projects. Prior to 1999, Portfolio Manager at Rockefeller & Co. and Scudder, Stevens & Clark. Board member of the Harding Loevner Funds from 1996 to 2014, serving as both Lead Independent Director and chair of the Audit Committee. Board member of the Russell Exchange Traded Funds Trust from 2011 to 2012 and the chair of the Audit Committee. Ms. Freeman is a Board Member of The Ruth Bancroft Garden(non-profit organization). She is also an inactive Chartered Financial Analyst. | | N/A |
| | | |
Isaiah Harris, Jr.3
(Born 1952) | | Trustee, since 2009; Audit Committee Chairman, since 2019 | | Retired. Chairman of the Board of CIGNA Corporation since 2009, and Director since 2005. From 2003 to 2011, Director of Deluxe Corporation. Prior thereto, President and CEO of BellSouth Advertising and Publishing Corp. from 2005 to 2007, President and CEO of BellSouth Enterprises from 2004 to 2005 and President of BellSouth Consumer Services from 2000 to 2003. Emeritus member of the Iowa State University Foundation Board of Governors. Emeritus Member of the Advisory Board of Iowa State University School of Business. Advisory Board Member, Palm Harbor Academy (private school). Advisory Board Member, Child Evangelism Fellowship(non-profit). Mr. Harris is a certified public accountant (inactive status). | | CIGNA Corporation |
| | | |
Judith M. Johnson3
(Born 1949) | | Trustee, since 2008; Audit Committee Chairman, from 2009 to 2018 | | Retired. Prior thereto, Chief Executive Officer and Chief Investment Officer of Minneapolis Employees Retirement Fund from 1996 to 2008. Ms. Johnson is an attorney, certified public accountant and a certified managerial accountant. | | N/A |
| | | |
David F. Larcker
(Born 1950) | | Trustee, since 2009 | | James Irvin Miller Professor of Accounting at the Graduate School of Business, Stanford University, Director of the Corporate Governance Research Initiative and Senior Faculty of The Rock Center for Corporate Governance since 2006. From 2005 to 2008, Professor of Accounting at the Graduate School of Business, Stanford University. Prior thereto, Ernst & Young Professor of Accounting at The Wharton School, University of Pennsylvania from 1985 to 2005. | | N/A |
| | | | |
| 32 | | Wells Fargo High Yield Municipal Bond Fund | | Other information (unaudited) |
| | | | | | |
Name and
year of birth | | Position held and
length of service* | | Principal occupations during past five years or longer | | Current other
public company or
investment company
directorships |
| | | |
Olivia S. Mitchell
(Born 1953) | | Trustee, since 2006; Nominating and Governance Committee Chairman, since 2018 | | International Foundation of Employee Benefit Plans Professor, Wharton School of the University of Pennsylvania since 1993. Director of Wharton’s Pension Research Council and Boettner Center on Pensions & Retirement Research, and Research Associate at the National Bureau of Economic Research. Previously, Cornell University Professor from 1978 to 1993. | | N/A |
| | | |
Timothy J. Penny
(Born 1951) | | Trustee, since 1996; Chairman, since 2018; Vice Chairman, from 2017 to 2018 | | President and Chief Executive Officer of Southern Minnesota Initiative Foundation, anon-profit organization, since 2007. Member of the Board of Trustees of NorthStar Education Finance, Inc., anon-profit organization, since 2007. | | N/A |
| | | |
James G. Polisson
(Born 1959) | | Trustee, since 2018; Advisory Board Member, from 2017 to 2018 | | Retired. Chief Marketing Officer, Source (ETF) UK Services, Ltd, from 2015 to 2017. From 2012 to 2015, Principal of The Polisson Group, LLC, a management consulting, corporate advisory and principal investing company. Chief Executive Officer and Managing Director at Russell Investments, Global Exchange Traded Funds from 2010 to 2012. Managing Director of Barclays Global Investors from 1998 to 2010 and Global Chief Marketing Officer for iShares and Barclays Global Investors from 2000 to 2010. Trustee of the San Francisco Mechanics’ Institute, anon-profit organization, from 2013 to 2015. Board member of the Russell Exchange Traded Fund Trust from 2011 to 2012. Director of Barclays Global Investors Holdings Deutschland GmbH from 2006 to 2009. Mr. Polisson is an attorney and has a retired status with the Massachusetts and District of Columbia Bar Associations. | | N/A |
| | | |
Michael S. Scofield4
(Born 1943) | | Trustee, since 2010 | | Served on the Investment Company Institute’s Board of Governors and Executive Committee from 2008-2011 as well the Governing Council of the Independent Directors Council from 2006-2011 and the Independent Directors Council Executive Committee from 2008-2011. Trustee of the Evergreen Fund complex (and its predecessors) from 1984 to 2010. Chairman of the Evergreen Funds from 2000-2010. Former Trustee of the Mentor Funds. Retired Attorney, Law Offices of Michael S. Scofield. | | N/A |
| | | |
Pamela Wheelock
(Born 1959) | | Trustee, since 2018; Advisory Board Member, from 2017 to 2018 | | Chief Operating Officer, Twin Cities Habitat for Humanity, since January, 2017. Vice President of University Services, University of Minnesota from 2012 to 2017. Prior thereto, on the Board of Directors, Governance Committee and Finance Committee for the Minnesota Philanthropy Partners (Saint Paul Foundation) from 2012 to 2018, Interim President and Chief Executive Officer of Blue Cross Blue Shield of Minnesota from 2010 to 2011, Chairman of the Board from 2009 to 2011 and Board Director from 2003 to 2015. Vice President, Leadership and Community Engagement, Bush Foundation, Saint Paul, Minnesota (a private foundation) from 2009 to 2011. Executive Vice President and Chief Financial Officer, Minnesota Sports and Entertainment from 2004 to 2009 and Senior Vice President from 2002 to 2004. Commissioner of Finance, State of Minnesota, from 1999 to 2002. Currently the Board Chair of the Minnesota Wild Foundation since 2010. | | N/A |
| * | Length of service dates reflect the Trustee’s commencement of service with the Trust’s predecessor entities, where applicable. |
| | | | | | |
| Other information (unaudited) | | Wells Fargo High Yield Municipal Bond Fund | | | 33 | |
Officers
| | | | | | |
Name and
year of birth | | Position held and
length of service | | Principal occupations during past five years or longer | | |
| | | |
Andrew Owen
(Born 1960) | | President, since 2017 | | Executive Vice President of Wells Fargo & Company and Head of Affiliated Managers, Wells Fargo Asset Management, since 2014. In addition, Mr. Owen is currently President, Chief Executive Officer and Director of Wells Fargo Funds Management, LLC since 2017. Prior thereto, Executive Vice President responsible for marketing, investments and product development for Wells Fargo Funds Management, LLC, from 2009 to 2014. | | |
| | | |
Nancy Wiser1
(Born 1967) | | Treasurer, since 2012 | | Executive Vice President of Wells Fargo Funds Management, LLC since 2011. Chief Operating Officer and Chief Compliance Officer at LightBox Capital Management LLC, from 2008 to 2011. | | |
| | | |
Alexander Kymn
(Born 1973) | | Secretary, since 2018; Chief Legal Officer, since 2018 | | Senior Company Counsel of Wells Fargo Bank, N.A. since 2018 (previously Senior Counsel from 2007 to 2018). Vice President of Wells Fargo Funds Management, LLC from 2008 to 2014. | | |
| | | |
Michael H. Whitaker
(Born 1967) | | Chief Compliance Officer, since 2016 | | Senior Vice President and Chief Compliance Officer since 2016. Senior Vice President and Chief Compliance Officer for Fidelity Investments from 2007 to 2016. | | |
| | | |
David Berardi
(Born 1975) | | Assistant Treasurer, since 2009 | | Vice President of Wells Fargo Funds Management, LLC since 2009. Vice President of Evergreen Investment Management Company, LLC from 2008 to 2010. Manager of Fund Reporting and Control for Evergreen Investment Management Company, LLC from 2004 to 2010. | | |
| | | |
Jeremy DePalma1
(Born 1974) | | Assistant Treasurer, since 2009 | | Senior Vice President of Wells Fargo Funds Management, LLC since 2009. Senior Vice President of Evergreen Investment Management Company, LLC from 2008 to 2010 and head of the Fund Reporting and Control Team within Fund Administration from 2005 to 2010. | | |
| 1 | Nancy Wiser acts as Treasurer of 76 funds in the Fund Complex. Jeremy DePalma acts as Treasurer of 76 funds and Assistant Treasurer of 76 funds in the Fund Complex. |
| 2 | The Statement of Additional Information includes additional information about the Trustees and is available, without charge, upon request, by calling1-800-222-8222 or by visiting the website atwellsfargofunds.com. |
| 3 | Mr. Harris replaced Ms. Johnson as the Chairman of the Audit Committee effective January 1, 2019. |
| 4 | Mr. Scofield retired on December 31, 2018. |
| | | | |
| 34 | | Wells Fargo High Yield Municipal Bond Fund | | Appendix A (unaudited) |
SALES CHARGE REDUCTIONS AND WAIVERS FOR CERTAIN INTERMEDIARIES
Raymond James & Associates, Inc., Raymond James Financial Services & Raymond James affiliates (“Raymond James”)
Effective on or about March 1, 2019, shareholders purchasing Fund shares through a Raymond James platform or account will be eligible only for the following load waivers(front-end sales charge waivers and contingent deferred, orback-end, sales charge waivers) and discounts, which may differ from those disclosed elsewhere in the Fund’s Prospectus or SAI.
Front-end Sales Load Waivers on Class A shares Available at Raymond James
| | • | | Shares purchased in an investment advisory program. | |
| | • | | Shares purchased through reinvestment of capital gains distributions and dividend reinvestment when purchasing shares of the same fund (but not any other fund within the fund family). | |
| | • | | Employees and registered representatives of Raymond James or its affiliates and their family members as designated by Raymond James. | |
| | • | | Shares purchased from the proceeds of redemptions within the same fund family, provided (1) the repurchase occurs within 90 days following the redemption, (2) the redemption and purchase occur in the same account, and (3) redeemed shares were subject to afront-end or deferred sales load (known as Rights of Reinstatement). | |
| | • | | A shareholder in the fund’s Class C shares will have their shares automatically exchanged at net asset value to Class A shares (or the appropriate share class) of the fund if the shares are no longer subject to a CDSC and the exchange is in line with the policies and procedures of Raymond James. | |
CDSC Waivers on Class A and C Shares Available at Raymond James
| | • | | Death or disability of the shareholder. | |
| | • | | Shares sold as part of a systematic withdrawal plan as described in the Fund’s Prospectus. | |
| | • | | Return of excess contributions from an IRA Account. | |
| | • | | Shares sold as part of a required minimum distribution for IRA and retirement accounts due to the shareholder reaching age 70½ as described in the Fund’s prospectus. | |
| | • | | Shares sold to pay Raymond James fees but only if the transaction is initiated by Raymond James. | |
| | • | | Shares acquired through a right of reinstatement. | |
Front-end Load Discounts Available at Raymond James: Breakpoints, and/or Rights of Accumulation
| | • | | Breakpoints as described in the Fund’s Prospectus. | |
| | • | | Rights of accumulation which entitle shareholders to breakpoint discounts will be automatically calculated based on the aggregated holding of fund family assets held by accounts within the purchaser’s household at Raymond James. Eligible fund family assets not held at Raymond James may be included in the rights of accumulation calculation only if the shareholder notifies his or her financial advisor about such assets. | |
This page is intentionally left blank.
This page is intentionally left blank.

For more information
More information about Wells Fargo Funds is available free upon request. To obtain literature, please write, visit the Fund’s website, or call:
Wells Fargo Funds
P.O. Box 219967
Kansas City, MO 64121-9967
Website: wellsfargofunds.com
Individual investors: 1-800-222-8222
Retail investment professionals: 1-888-877-9275
Institutional investment professionals: 1-866-765-0778
This report and the financial statements contained herein are submitted for the general information of the shareholders of the Fund. If this report is used for promotional purposes, distribution of the report must be accompanied or preceded by a current prospectus. Before investing, please consider the investment objectives, risks, charges, and expenses of the investment. For a current prospectus and, if available, a summary prospectus, containing this information, call1-800-222-8222 or visit the Fund’s website atwellsfargofunds.com. Read the prospectus carefully before you invest or send money.
Wells Fargo Asset Management (WFAM) is the trade name for certain investment advisory/management firms owned by Wells Fargo & Company. These firms include but are not limited to Wells Capital Management Incorporated and Wells Fargo Funds Management, LLC. Certain products managed by WFAM entities are distributed by Wells Fargo Funds Distributor, LLC (a broker/dealer and Member FINRA).
This material is for general informational and educational purposes only and is NOT intended to provide investment advice or a recommendation of any kind—including a recommendation for any specific investment, strategy, or plan.
INVESTMENT PRODUCTS: NOT FDIC INSURED ◾ NO BANK GUARANTEE ◾ MAY LOSE VALUE
© 2019 Wells Fargo Funds Management, LLC. All rights reserved.
| | |
 | | 320445 02-19 SA264/SAR264 12-18 |
Semi-Annual Report
December 31, 2018

Wells Fargo Intermediate Tax/AMT-Free Fund

Beginning on January 1, 2021, as permitted by new regulations adopted by the Securities and Exchange Commission, paper copies of the Wells Fargo Funds’ annual and semi-annual shareholder reports issued after this date will no longer be sent by mail, unless you specifically request paper copies of the reports. Instead, the reports will be made available on the Funds’ website, and you will be notified by mail each time a report is posted and provided with a website address to access the report.
If you already elected to receive shareholder reports electronically, you will not be affected by this change and you need not take any action. You may elect to receive shareholder reports and other communications from the Fund electronically at any time by contacting your financial intermediary (such as a broker-dealer or bank) or, if you are a direct investor, by calling 1-800-222-8222 or by enrolling at wellsfargo.com/advantagedelivery.
You may elect to receive all future reports in paper free of charge. If you invest through a financial intermediary, you can contact your financial intermediary to request that you continue to receive paper copies of your shareholder reports; if you invest directly with the Fund, you can call 1-800-222-8222. Your election to receive reports in paper will apply to all Wells Fargo Funds held in your account with your financial intermediary or, if you are a direct investor, to all Wells Fargo Funds that you hold.

Reduce clutter. Save trees.
Sign up for electronic delivery of prospectuses and shareholder reports atwellsfargo.com/advantagedelivery
Contents
The views expressed and any forward-looking statements are as of December 31, 2018, unless otherwise noted, and are those of the Fund managers and/or Wells Fargo Funds Management, LLC. Discussions of individual securities, or the markets generally, or any Wells Fargo Fund are not intended as individual recommendations. Future events or results may vary significantly from those expressed in any forward-looking statements. The views expressed are subject to change at any time in response to changing circumstances in the market. Wells Fargo Funds Management, LLC and the Fund disclaim any obligation to publicly update or revise any views expressed or forward-looking statements.
INVESTMENT PRODUCTS: NOT FDIC INSURED ◾ NO BANK GUARANTEE ◾ MAY LOSE VALUE
| | | | |
| 2 | | Wells Fargo Intermediate Tax/AMT-Free Fund | | Letter to shareholders (unaudited) |

Andrew Owen
President
Wells Fargo Funds
Global trade tensions escalated during the third quarter of 2018.
Dear Shareholder:
We are pleased to offer you this semi-annual report for the Wells Fargo IntermediateTax/AMT-Free Fund for thesix-month period that ended December 31, 2018. During the reporting period, the U.S. generated encouraging economic and business data that was offset by less positive and more inconsistent data from international markets. Investment returns were generally negative as geopolitical tensions and uncertainty tended to distract investors from more favorable underlying trends.
For the period, U.S. stocks, as measured by the S&P 500 Index,1 fell 6.85% and international stocks, as measured by the MSCI ACWI ex USA Index (Net),2 declined 10.84%. Based on the MSCI EM Index (Net),3 emerging market stocks lost 8.48%. For bond investors, the Bloomberg Barclays U.S. Aggregate Bond Index4 gained 1.65% while the Bloomberg Barclays Global Aggregateex-USD Index5 fell 0.84%. The Bloomberg Barclays Municipal Bond Index6 gained 1.53% while the ICE BofAML U.S. High Yield Index7 declined 2.34%.
Global trade tensions prompted investor concerns.
Global trade tensions escalated during the third quarter of 2018. The U.S. imposed tariffs on a wide range of products manufactured overseas. Foreign governments retaliated with tariffs that punished U.S. commodity producers and product manufacturers. Investors wondered about next steps as divergence in global economic policies and growth prospects widened.
During the summer months, the U.S. economy strengthened. Revised second-quarter gross domestic product (GDP) growth data released in August showed the U.S. economy growing at a 4.2% rate. The unemployment rate in the U.S. was 3.7% by the end of September, according to the U.S. Department of Labor. Wages showed more consistent growth, and consumer confidence remained strong. Several U.S. equity market indices reached records during August, with the S&P 500 Index gaining 7.71% for the three-month period that ended September 30, 2018. In contrast, the MSCI ACWI ex USA Index (Net) gained 0.71% while the MSCI EM Index (Net) declined 1.09% during the same three-month period.
| 1 | The S&P 500 Index consists of 500 stocks chosen for market size, liquidity, and industry group representation. It is a market-value-weighted index with each stock’s weight in the index proportionate to its market value. You cannot invest directly in an index. |
| 2 | The Morgan Stanley Capital International (MSCI) All Country World Index (ACWI) ex USA Index (Net) is a free-float-adjusted market-capitalization-weighted index that is designed to measure the equity market performance of developed markets, excluding the United States and Canada. Source: MSCI. MSCI makes no express or implied warranties or representations and shall have no liability whatsoever with respect to any MSCI data contained herein. The MSCI data may not be further redistributed or used as a basis for other indices or any securities or financial products. This report is not approved, reviewed, or produced by MSCI. You cannot invest directly in an index. |
| 3 | The MSCI Emerging Markets (EM) Index (Net) is a free-float-adjusted market-capitalization-weighted index that is designed to measure large- andmid-cap equity market performance of emerging markets. The MSCI EM Index (Net) consists of the following 24 emerging market country indices: Brazil, Chile, China, Colombia, Czech Republic, Egypt, Greece, Hungary, India, Indonesia, Korea, Malaysia, Mexico, Pakistan, Peru, the Philippines, Poland, Qatar, Russia, South Africa, Taiwan, Thailand, Turkey, and the United Arab Emirates. You cannot invest directly in an index. |
| 4 | The Bloomberg Barclays U.S. Aggregate Bond Index is a broad-based benchmark that measures the investment-grade, U.S. dollar-denominated, fixed-rate taxable bond market, including Treasuries, government-related and corporate securities, mortgage-backed securities (agency fixed-rate and hybrid adjustable-rate mortgage pass-throughs), asset-backed securities, and commercial mortgage-backed securities. You cannot invest directly in an index. |
| 5 | The Bloomberg Barclays Global Aggregateex-USD Index is an unmanaged index that provides a broad-based measure of the global investment-grade fixed-income markets excluding the U.S. dollar-denominated debt market. You cannot invest directly in an index. |
| 6 | The Bloomberg Barclays Municipal Bond Index is an unmanaged index composed of long-termtax-exempt bonds with a minimum credit rating of Baa. You cannot invest directly in an index. |
| 7 | The ICE BofAML U.S. High Yield Index is a market-capitalization-weighted index of domestic and Yankee high-yield bonds. The index tracks the performance of high-yield securities traded in the U.S. bond market. You cannot invest directly in an index. Copyright 2018. ICE Data Indices, LLC. All rights reserved. |
| | | | | | |
| Letter to shareholders (unaudited) | | Wells Fargo Intermediate Tax/AMT-Free Fund | | | 3 | |
Economic signals overseas were mixed as the third quarter ended and the fourth quarter began. In particular, signs of slowing economic growth in China created uncertainty for investors. Amid rising trade tensions, the People’s Bank of China cut reserve requirement ratios and accelerated infrastructure spending and tax cuts for business enterprises and individuals. Nevertheless, a strengthening U.S. dollar and trade tensions remained headwinds for investors overseas.
Equity markets were volatile during the fourth quarter.
Negative stock market performance during October and December bracketed a mildly positive November, as measured by the S&P 500 Index and the MSCI ACWI ex USA Index (Net). As interest rates and bond yields gained during October, stock markets struggled. Readings on consumer sentiment and business spending were mixed. Markets rebounded in November. The U.S. and China agreed to halt further increases in tariffs and engage in additional negotiations. While November returns were positive, the loss for the full fourth quarter was substantial for equity investors globally, with the S&P down 13.52% and the MSCI ACWI ex USA Index (Net) down 11.46%. December’s S&P 500 Index performance was the lowest since 1931. Globally, fixed income investments fared better than stocks during the last two months of the year as conflicting signals unsettled investors’ outlooks.
Equity investors confronted a number of changing conditions. In November’s mid-term elections, control of the U.S. House of Representatives shifted from Republicans to Democrats, presaging potential partisan disputes. Progress on Brexit negotiations stalled in the UK. In China, the value of the yuan declined to low levels last seen in 2008. Oil prices continued to fall. The Fed increased the federal funds rate by 25 bps to a target range of between 2.25% and 2.50% in December 2018. A late-December dispute over spending and immigration policy resulted in a partial U.S. government shutdown that continued through the end of the period.
Don’t let short-term uncertainty derail long-term investment goals.
Periods of investment uncertainty can present challenges, but experience has taught us that maintaining long-term investment goals can be an effective way to plan for the future. To help you create a sound strategy based on your personal goals and risk tolerance, Wells Fargo Funds offers more than 100 mutual funds spanning a wide range of asset classes and investment styles. Although diversification cannot guarantee an investment profit or prevent losses, we believe it can be an effective way to manage investment risk and potentially smooth out overall portfolio performance. We encourage investors to know their investments and to understand that appropriate levels of risk-taking may unlock opportunities.
Thank you for choosing to invest with Wells Fargo Funds. We appreciate your confidence in us and remain committed to helping you meet your financial needs.
Sincerely,

Andrew Owen
President
Wells Fargo Funds
Economic signals overseas were mixed as the third quarter ended and the fourth quarter began.
For further information about your Fund, contact your investment professional, visit our website atwellsfargofunds.com, or call us directly at1-800-222-8222.
| | | | |
| 4 | | Wells Fargo Intermediate Tax/AMT-Free Fund | | Performance highlights (unaudited) |
Investment objective
The Fund seeks current income exempt from federal income tax.
Manager
Wells Fargo Funds Management, LLC
Subadviser
Wells Capital Management Incorporated
Portfolio managers
Lyle J. Fitterer, CFA®‡, CPA
Robert J. Miller
Average annual total returns (%) as of December 31, 2018
| | | | | | | | | | | | | | | | | | | | | | | | | | | | | | | | | | |
| | | | | Including sales charge | | | Excluding sales charge | | | Expense ratios1 (%) | |
| | | Inception date | | 1 year | | | 5 year | | | 10 year | | | 1 year | | | 5 year | | | 10 year | | | Gross | | | Net2 | |
| | | | | | | | | |
| Class A (WFTAX) | | 7-31-2007 | | | -2.12 | | | | 2.08 | | | | 4.21 | | | | 0.91 | | | | 2.71 | | | | 4.53 | | | | 0.79 | | | | 0.70 | |
| | | | | | | | | |
| Class C (WFTFX) | | 7-31-2007 | | | -0.84 | | | | 1.94 | | | | 3.75 | | | | 0.16 | | | | 1.94 | | | | 3.75 | | | | 1.54 | | | | 1.45 | |
| | | | | | | | | |
| Class R63 | | 7-31-2018 | | | – | | | | – | | | | – | | | | 1.19 | | | | 2.96 | | | | 4.82 | | | | 0.41 | | | | 0.40 | |
| | | | | | | | | |
| Administrator Class (WFITX) | | 3-31-2008 | | | – | | | | – | | | | – | | | | 1.01 | | | | 2.79 | | | | 4.64 | | | | 0.73 | | | | 0.60 | |
| | | | | | | | | |
| Institutional Class (WITIX) | | 3-31-2008 | | | – | | | | – | | | | – | | | | 1.16 | | | | 2.96 | | | | 4.81 | | | | 0.46 | | | | 0.45 | |
| | | | | | | | | |
| Bloomberg Barclays Municipal Bond1-15 Year Blend Index4 | | – | | | – | | | | – | | | | – | | | | 1.58 | | | | 3.00 | | | | 3.89 | | | | – | | | | – | |
Figures quoted represent past performance, which is no guarantee of future results, and do not reflect taxes that a shareholder may pay on fund distributions or the redemption of fund shares. Investment return and principal value of an investment will fluctuate so that an investor’s shares, when redeemed, may be worth more or less than their original cost. Performance shown without sales charges would be lower if sales charges were reflected. Current performance may be lower or higher than the performance data quoted, which assumes the reinvestment of dividends and capital gains. Currentmonth-end performance is available on the Fund’s website,wellsfargofunds.com.
Index returns do not include transaction costs associated with buying and selling securities, any mutual fund fees or expenses, or any taxes. It is not possible to invest directly in an index.
For Class A shares, the maximumfront-end sales charge is 3.00%. For Class C shares, the maximum contingent deferred sales charge is 1.00%. Performance including a contingent deferred sales charge assumes the sales charge for the corresponding time period. Class R6, Administrator Class, and Institutional Class shares are sold without afront-end sales charge or contingent deferred sales charge.
Bond values fluctuate in response to the financial condition of individual issuers, general market and economic conditions, and changes in interest rates. Changes in market conditions and government policies may lead to periods of heightened volatility in the bond market and reduced liquidity for certain bonds held by the Fund. In general, when interest rates rise, bond values fall and investors may lose principal value. Interest-rate changes and their impact on the Fund and its share price can be sudden and unpredictable. High-yield securities have a greater risk of default and tend to be more volatile than higher-rated debt securities. The use of derivatives may reduce returns and/or increase volatility. Certain investment strategies tend to increase the total risk of an investment (relative to the broader market). The Fund is exposed to municipal securities risk. Consult the Fund’s prospectus for additional information on these and other risks. A portion of the Fund’s income may be subject to federal, state, and/or local income taxes or the Alternative Minimum Tax (AMT). Any capital gains distributions may be taxable.
Please see footnotes on page 5.
| | | | | | |
| Performance highlights (unaudited) | | Wells Fargo Intermediate Tax/AMT-Free Fund | | | 5 | |
|
| Effective maturity distribution as of December 31, 20185 |
|
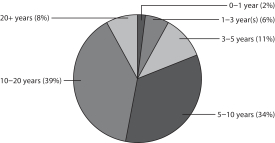
|
|
| Credit quality as of December 31, 20186 |
|
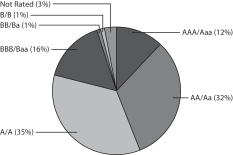 |
| ‡ | CFA® and Chartered Financial Analyst® are trademarks owned by CFA Institute. |
| 1 | Reflects the expense ratios as stated in the most recent prospectuses. The expense ratios shown are subject to change and may differ from the annualized expense ratios shown in the financial highlights of this report. |
| 2 | The manager has contractually committed through October 31, 2019, to waive fees and/or reimburse expenses to the extent necessary to cap the Fund’s Total Annual Fund Operating Expenses After Fee Waivers at the amounts shown. After this time, the cap may be increased or the commitment to maintain the cap may be terminated only with the approval of the Board of Trustees. Brokerage commissions, stamp duty fees, interest, taxes, acquired fund fees and expenses (if any), and extraordinary expenses are excluded from the expense cap. Without this cap, the Fund’s returns would have been lower. The expense ratio paid by an investor is the net expense ratio (the total annual fund operating expenses after fee waivers) as stated in the prospectuses. |
| 3 | Historical performance shown for Class R6 shares prior to their inception reflects the performance of the Institutional Class shares, and includes the higher expenses applicable to Institutional Class shares. If these expenses had not been included, returns for Class R6 shares would be higher. |
| 4 | The Bloomberg Barclays Municipal Bond 1–15 Year Blend Index is the 1–15 year component of the Bloomberg Barclays Municipal Bond Index. The Bloomberg Barclays Municipal Bond Index is an unmanaged index composed of long-termtax-exempt bonds with a minimum credit rating of Baa. You cannot invest directly in an index. |
| 5 | Amounts are calculated based on the total long-term investments of the Fund. These amounts are subject to change and may have changed since the date specified. |
| 6 | The credit quality distribution of portfolio holdings reflected in the chart is based on ratings from Standard & Poor’s, Moody’s Investors Service, and/or Fitch Ratings Ltd. Credit quality ratings apply to the underlying holdings of the Fund and not to the Fund itself. The percentages of the Fund’s portfolio with the ratings depicted in the chart are calculated based on the total market value of fixed income securities held by the Fund. If a security was rated by all three rating agencies, the middle rating was utilized. If rated by two of three rating agencies, the lower rating was utilized, and if rated by one of the rating agencies, that rating was utilized. Standard & Poor’s rates the creditworthiness of bonds, ranging from AAA (highest) to D (lowest). Ratings from A to CCC may be modified by the addition of a plus (+) or minus (-) sign to show relative standing within the rating categories. Standard & Poor’s rates the creditworthiness of short-term notes fromSP-1 (highest) toSP-3 (lowest). Moody’s rates the creditworthiness of bonds, ranging from Aaa (highest) to C (lowest). Ratings Aa to B may be modified by the addition of a number 1 (highest) to 3 (lowest) to show relative standing within the ratings categories. Moody’s rates the creditworthiness of short-term U.S.tax-exempt municipal securities from MIG 1/VMIG 1 (highest) to SG (lowest). Fitch rates the creditworthiness of bonds, ranging from AAA (highest) to D (lowest). Credit quality distribution is subject to change and may have changed since the date specified. |
| | | | |
| 6 | | Wells Fargo Intermediate Tax/AMT-Free Fund | | Fund expenses (unaudited) |
As a shareholder of the Fund, you incur two types of costs: (1) transaction costs, including sales charges (loads) on purchase payments and contingent deferred sales charges (if any) on redemptions and (2) ongoing costs, including management fees, distribution(12b-1) and/or shareholder servicing fees, and other Fund expenses. This example is intended to help you understand your ongoing costs (in dollars) of investing in the Fund and to compare these costs with the ongoing costs of investing in other mutual funds.
The example is based on an investment of $1,000 invested at the beginning of thesix-month period and held for the entire period from July 1, 2018 to December 31, 2018.
Actual expenses
The “Actual” line of the table below provides information about actual account values and actual expenses. You may use the information in this line, together with the amount you invested, to estimate the expenses that you paid over the period. Simply divide your account value by $1,000 (for example, an $8,600 account value divided by $1,000 = 8.6), then multiply the result by the number in the “Actual” line under the heading entitled “Expenses paid during period” for your applicable class of shares to estimate the expenses you paid on your account during this period.
Hypothetical example for comparison purposes
The “Hypothetical” line of the table below provides information about hypothetical account values and hypothetical expenses based on the Fund’s actual expense ratio and an assumed rate of return of 5% per year before expenses, which is not the Fund’s actual return. The hypothetical account values and expenses may not be used to estimate the actual ending account balance or expenses you paid for the period. You may use this information to compare the ongoing costs of investing in the Fund and other funds. To do so, compare this 5% hypothetical example with the 5% hypothetical examples that appear in the shareholder reports of the other funds.
Please note that the expenses shown in the table are meant to highlight your ongoing costs only and do not reflect any transactional costs, such as sales charges (loads) and contingent deferred sales charges. Therefore, the “Hypothetical” line of the table is useful in comparing ongoing costs only and will not help you determine the relative total costs of owning different funds. In addition, if these transactional costs were included, your costs would have been higher.
| | | | | | | | | | | | | | | | |
| | | Beginning
account value
7-1-2018 | | | Ending
account value
12-31-2018 | | | Expenses
paid during
the period¹ | | | Annualized net
expense ratio | |
Class A | | | | | | | | | | | | | | | | |
| | | | |
Actual | | $ | 1,000.00 | | | $ | 1,013.61 | | | $ | 3.55 | | | | 0.70 | % |
| | | | |
Hypothetical (5% return before expenses) | | $ | 1,000.00 | | | $ | 1,021.68 | | | $ | 3.57 | | | | 0.70 | % |
Class C | | | | | | | | | | | | | | | | |
| | | | |
Actual | | $ | 1,000.00 | | | $ | 1,009.80 | | | $ | 7.35 | | | | 1.45 | % |
| | | | |
Hypothetical (5% return before expenses) | | $ | 1,000.00 | | | $ | 1,017.90 | | | $ | 7.38 | | | | 1.45 | % |
Class R6 | | | | | | | | | | | | | | | | |
| | | | |
Actual | | $ | 1,000.00 | | | $ | 1,014.21 | | | $ | 2.03 | | | | 0.40 | % |
| | | | |
Hypothetical (5% return before expenses) | | $ | 1,000.00 | | | $ | 1,023.19 | | | $ | 2.04 | | | | 0.40 | % |
Administrator Class | | | | | | | | | | | | | | | | |
| | | | |
Actual | | $ | 1,000.00 | | | $ | 1,013.22 | | | $ | 3.04 | | | | 0.60 | % |
| | | | |
Hypothetical (5% return before expenses) | | $ | 1,000.00 | | | $ | 1,022.18 | | | $ | 3.06 | | | | 0.60 | % |
Institutional Class | | | | | | | | | | | | | | | | |
| | | | |
Actual | | $ | 1,000.00 | | | $ | 1,013.99 | | | $ | 2.28 | | | | 0.45 | % |
| | | | |
Hypothetical (5% return before expenses) | | $ | 1,000.00 | | | $ | 1,022.94 | | | $ | 2.29 | | | | 0.45 | % |
| 1 | Expenses paid is equal to the annualized net expense ratio of each class multiplied by the average account value over the period, multiplied by the number of days in the most recent fiscal half-year divided by the number of days in the fiscal year (to reflect theone-half-year period). |
| | | | | | |
| Portfolio of investments—December 31, 2018 (unaudited) | | Wells Fargo Intermediate Tax/AMT-Free Fund | | | 7 | |
| | | | | | | | | | | | | | | | |
| Security name | | Interest rate | | | Maturity date | | | Principal | | | Value | |
| | | | |
Municipal Obligations: 98.70% | | | | | | | | | | | | | | | | |
| | | | |
Alabama: 0.30% | | | | | | | | | | | | | | | | |
| | | | |
| GO Revenue: 0.03% | | | | | | | | | | | | | | | | |
| | | | |
Jefferson County AL Unrefunded Bond Series A | | | 4.90 | % | | | 4-1-2021 | | | $ | 665,000 | | | $ | 679,344 | |
| | | | | | | | | | | | | | | | |
| | | | |
| Utilities Revenue: 0.27% | | | | | | | | | | | | | | | | |
| | | | |
SouthEast Alabama Gas Supply District Series A | | | 4.00 | | | | 4-1-2049 | | | | 6,180,000 | | | | 6,456,246 | |
| | | | | | | | | | | | | | | | |
| | | | |
| | | | | | | | | | | | | | | 7,135,590 | |
| | | | | | | | | | | | | | | | |
| | | | |
Alaska: 0.04% | | | | | | | | | | | | | | | | |
| | | | |
| Industrial Development Revenue: 0.04% | | | | | | | | | | | | | | | | |
| | | | |
Valdez AK Marine Terminal BP Pipelines Project Series B | | | 5.00 | | | | 1-1-2021 | | | | 1,000,000 | | | | 1,053,740 | |
| | | | | | | | | | | | | | | | |
| | | | |
Arizona: 1.81% | | | | | | | | | | | | | | | | |
| | | | |
| Airport Revenue: 0.56% | | | | | | | | | | | | | | | | |
| | | | |
Phoenix AZ Civic Improvement Corporation Series A | | | 5.00 | | | | 7-1-2029 | | | | 5,000,000 | | | | 5,234,900 | |
| | | | |
Phoenix AZ Civic Improvement Corporation Series D | | | 5.00 | | | | 7-1-2036 | | | | 7,000,000 | | | | 8,014,720 | |
| | | | |
| | | | | | | | | | | | | | | 13,249,620 | |
| | | | | | | | | | | | | | | | |
| | | | |
| Education Revenue: 0.26% | | | | | | | | | | | | | | | | |
| | | | |
McAllister AZ Arizona State University Hassayampa Academic Village Project | | | 5.00 | | | | 7-1-2025 | | | | 750,000 | | | | 875,453 | |
| | | | |
Pima County AZ IDA New Plan Learning Project Series A | | | 7.00 | | | | 7-1-2021 | | | | 525,000 | | | | 527,368 | |
| | | | |
Pima County AZ IDA New Plan Learning Project Series A | | | 7.75 | | | | 7-1-2035 | | | | 4,920,000 | | | | 4,927,626 | |
| | | | |
| | | | | | | | | | | | | | | 6,330,447 | |
| | | | | | | | | | | | | | | | |
| | | | |
| GO Revenue: 0.42% | | | | | | | | | | | | | | | | |
| | | | |
Estrella Mountain Ranch AZ Community Facilities District Refunding Bond (AGM Insured) | | | 5.00 | | | | 7-15-2025 | | | | 585,000 | | | | 663,215 | |
| | | | |
Maricopa County AZ Elementary School District #28 Kyrene Elementary School Project 2010 Series B | | | 4.50 | | | | 7-1-2024 | | | | 1,575,000 | | | | 1,745,588 | |
| | | | |
Maricopa County AZ Elementary School District #28 Kyrene Elementary School Project 2010 Series B | | | 4.50 | | | | 7-1-2025 | | | | 1,270,000 | | | | 1,407,554 | |
| | | | |
Maricopa County AZ Elementary School District #28 Kyrene Elementary School Project 2010 Series B | | | 5.00 | | | | 7-1-2027 | | | | 420,000 | | | | 474,482 | |
| | | | |
Maricopa County AZ Elementary School District #28 Kyrene Elementary School Project 2010 Series B | | | 5.50 | | | | 7-1-2029 | | | | 960,000 | | | | 1,105,075 | |
| | | | |
Phoenix AZ | | | 5.00 | | | | 7-1-2026 | | | | 3,810,000 | | | | 4,534,662 | |
| | | | |
| | | | | | | | | | | | | | | 9,930,576 | |
| | | | | | | | | | | | | | | | |
| | | | |
| Health Revenue: 0.05% | | | | | | | | | | | | | | | | |
| | | | |
Maricopa County AZ IDA Bond | | | 5.00 | | | | 1-1-2048 | | | | 1,000,000 | | | | 1,143,260 | |
| | | | | | | | | | | | | | | | |
| | | | |
| Miscellaneous Revenue: 0.15% | | | | | | | | | | | | | | | | |
| | | | |
Arizona Refunding Certificate of Participation | | | 5.00 | | | | 9-1-2027 | | | | 3,040,000 | | | | 3,503,570 | |
| | | | | | | | | | | | | | | | |
| | | | |
| Tax Revenue: 0.37% | | | | | | | | | | | | | | | | |
| | | | |
Arizona Sports & Tourism Authority Series A | | | 4.00 | | | | 7-1-2020 | | | | 1,365,000 | | | | 1,398,497 | |
| | | | |
Arizona Sports & Tourism Authority Series A | | | 5.00 | | | | 7-1-2021 | | | | 795,000 | | | | 844,560 | |
| | | | |
Arizona Sports & Tourism Authority Series A | | | 5.00 | | | | 7-1-2022 | | | | 1,000,000 | | | | 1,082,460 | |
The accompanying notes are an integral part of these financial statements.
| | | | |
| 8 | | Wells Fargo Intermediate Tax/AMT-Free Fund | | Portfolio of investments—December 31, 2018 (unaudited) |
| | | | | | | | | | | | | | | | |
| Security name | | Interest rate | | | Maturity date | | | Principal | | | Value | |
|
| Tax Revenue(continued) | |
| | | | |
San Luis AZ Pledged Excise Tax Series A (Build America Mutual Assurance Company Insured) | | | 5.00 | % | | | 7-1-2027 | | | $ | 450,000 | | | $ | 508,406 | |
| | | | |
San Luis AZ Pledged Excise Tax Series A (Build America Mutual Assurance Company Insured) | | | 5.00 | | | | 7-1-2028 | | | | 700,000 | | | | 789,705 | |
| | | | |
San Luis AZ Pledged Excise Tax Series A (Build America Mutual Assurance Company Insured) | | | 5.00 | | | | 7-1-2034 | | | | 3,680,000 | | | | 4,101,544 | |
| | | | |
| | | | | | | | | | | | | | | 8,725,172 | |
| | | | | | | | | | | | | | | | |
| | | | |
| | | | | | | | | | | | | | | 42,882,645 | |
| | | | | | | | | | | | | | | | |
|
California: 8.33% | |
|
| Airport Revenue: 0.19% | |
| | | | |
Sacramento CA Airport System Senior Bond | | | 5.00 | | | | 7-1-2025 | | | | 2,000,000 | | | | 2,094,860 | |
| | | | |
Sacramento CA Airport System Senior Bond Series B | | | 5.00 | | | | 7-1-2032 | | | | 600,000 | | | | 708,288 | |
| | | | |
Sacramento CA Airport System Senior Bond Series B | | | 5.00 | | | | 7-1-2033 | | | | 500,000 | | | | 587,505 | |
| | | | |
Sacramento CA Airport System Senior Bond Series B | | | 5.00 | | | | 7-1-2034 | | | | 1,000,000 | | | | 1,169,580 | |
| | | | |
| | | | | | | | | | | | | | | 4,560,233 | |
| | | | | | | | | | | | | | | | |
|
| Education Revenue: 0.57% | |
| | | | |
California Statewide CDA Series A | | | 6.90 | | | | 8-1-2031 | | | | 1,860,000 | | | | 2,046,856 | |
| | | | |
University of California General Project Unrefunded Bond Series Q | | | 5.25 | | | | 5-15-2024 | | | | 65,000 | | | | 65,181 | |
| | | | |
University of California Limited Project Prerefunded Bond Series G | | | 5.00 | | | | 5-15-2037 | | | | 5,180,000 | | | | 5,742,341 | |
| | | | |
University of California Limited Project Unrefunded Bond Series G | | | 5.00 | | | | 5-15-2037 | | | | 5,210,000 | | | | 5,624,403 | |
| | | | |
| | | | | | | | | | | | | | | 13,478,781 | |
| | | | | | | | | | | | | | | | |
|
| GO Revenue: 3.68% | |
| | | | |
California | | | 5.25 | | | | 3-1-2024 | | | | 5,000,000 | | | | 5,196,600 | |
| | | | |
California | | | 5.25 | | | | 3-1-2030 | | | | 1,440,000 | | | | 1,491,883 | |
| | | | |
California | | | 6.00 | | | | 3-1-2033 | | | | 2,510,000 | | | | 2,633,191 | |
| | | | |
California Prerefunded Bond | | | 6.00 | | | | 4-1-2038 | | | | 2,850,000 | | | | 2,881,578 | |
| | | | |
California Unrefunded Bond | | | 6.00 | | | | 4-1-2038 | | | | 5,205,000 | | | | 5,255,124 | |
| | | | |
California Various Purposes | | | 5.00 | | | | 8-1-2030 | | | | 1,500,000 | | | | 1,753,995 | |
| | | | |
California Various Purposes | | | 5.00 | | | | 8-1-2032 | | | | 6,700,000 | | | | 7,779,370 | |
| | | | |
Cerritos CA Community College District CAB Series D (z) | | | 5.08 | | | | 8-1-2025 | | | | 1,800,000 | | | | 1,529,604 | |
| | | | |
Compton CA Community College District Election of 2002 CAB Series C (z) | | | 6.39 | | | | 8-1-2029 | | | | 1,565,000 | | | | 1,095,563 | |
| | | | |
Compton CA Community College District Election of 2002 CAB Series C (z) | | | 6.50 | | | | 8-1-2031 | | | | 2,400,000 | | | | 1,515,240 | |
| | | | |
Emery CA Unified School District Election of 2010 Series A (AGM Insured) | | | 6.25 | | | | 8-1-2031 | | | | 4,500,000 | | | | 5,020,245 | |
| | | | |
Monterey County CA Alisal Union School District Series A (Build America Mutual Assurance Company Insured) | | | 5.25 | | | | 8-1-2042 | | | | 1,500,000 | | | | 1,743,690 | |
| | | | |
New Haven CA Unified School District CAB Project (AGC Insured) (z) | | | 6.41 | | | | 8-1-2033 | | | | 5,590,000 | | | | 3,342,037 | |
| | | | |
Northern Humboldt CA High School District Election of 2010 Series A | | | 6.50 | | | | 8-1-2034 | | | | 1,145,000 | | | | 1,284,255 | |
| | | | |
Oakland CA Unified School District Alameda County Election of 2006 Series A | | | 6.50 | | | | 8-1-2020 | | | | 1,730,000 | | | | 1,779,651 | |
| | | | |
Oakland CA Unified School District Alameda County Election of 2009 Series A | | | 6.25 | | | | 8-1-2019 | | | | 1,285,000 | | | | 1,319,515 | |
| | | | |
Oakland CA Unified School District Alameda County Election of 2012 | | | 6.25 | | | | 8-1-2028 | | | | 2,000,000 | | | | 2,233,900 | |
| | | | |
Oakland CA Unified School District Alameda County Election of 2012 | | | 6.25 | | | | 8-1-2030 | | | | 2,000,000 | | | | 2,233,900 | |
| | | | |
Oxnard CA School District Series A (National Insured) | | | 5.75 | | | | 8-1-2030 | | | | 1,825,000 | | | | 2,085,117 | |
| | | | |
Patterson CA Unified School District CAB Election of 2008 Project Series B (AGM Insured) (z) | | | 6.45 | | | | 8-1-2033 | | | | 3,000,000 | | | | 1,796,130 | |
| | | | |
Peralta CA Community College District Alameda County | | | 5.00 | | | | 8-1-2023 | | | | 3,045,000 | | | | 3,376,661 | |
The accompanying notes are an integral part of these financial statements.
| | | | | | |
| Portfolio of investments—December 31, 2018 (unaudited) | | Wells Fargo Intermediate Tax/AMT-Free Fund | | | 9 | |
| | | | | | | | | | | | | | | | |
| Security name | | Interest rate | | | Maturity date | | | Principal | | | Value | |
|
| GO Revenue(continued) | |
| | | | |
Peralta CA Community College District Alameda County | | | 5.00 | % | | | 8-1-2024 | | | $ | 3,000,000 | | | $ | 3,322,350 | |
| | | | |
Rio Hondo CA Community College District (z) | | | 6.78 | | | | 8-1-2030 | | | | 2,315,000 | | | | 1,601,147 | |
| | | | |
San Diego CA Community College District Election of 2012 | | | 5.00 | | | | 8-1-2032 | | | | 3,095,000 | | | | 3,490,510 | |
| | | | |
San Diego CA Unified School District Election of 1998 SeriesE-2 (AGM Insured) | | | 5.50 | | | | 7-1-2027 | | | | 5,000,000 | | | | 6,356,400 | |
| | | | |
San Jose CA Libraries & Parks Project | | | 5.13 | | | | 9-1-2031 | | | | 6,110,000 | | | | 6,126,253 | |
| | | | |
Sylvan CA Unified School District CAB Election of 2006 (AGM Insured) (z) | | | 6.11 | | | | 8-1-2031 | | | | 2,590,000 | | | | 1,692,772 | |
| | | | |
Sylvan CA Unified School District CAB Election of 2006 (AGM Insured) (z) | | | 6.19 | | | | 8-1-2032 | | | | 2,800,000 | | | | 1,745,744 | |
| | | | |
Tustin CA Unified School District#88-1 Election of 2008 Series B | | | 6.00 | | | | 8-1-2036 | | | | 1,500,000 | | | | 1,663,995 | |
| | | | |
West Contra Costa CA Unified School District Election of 2005 SeriesC-1 (AGC Insured) (z) | | | 6.48 | | | | 8-1-2026 | | | | 4,620,000 | | | | 3,798,656 | |
| | | | |
| | | | | | | | | | | | | | | 87,145,076 | |
| | | | | | | | | | | | | | | | |
|
| Health Revenue: 1.00% | |
| | | | |
California Municipal Finance Authority Institute of Aging Project | | | 5.00 | | | | 8-15-2032 | | | | 975,000 | | | | 1,146,347 | |
| | | | |
California Municipal Finance Authority Institute of Aging Project | | | 5.00 | | | | 8-15-2033 | | | | 1,150,000 | | | | 1,344,396 | |
| | | | |
California Statewide CDA Series C | | | 5.25 | | | | 8-15-2031 | | | | 3,000,000 | | | | 3,249,690 | |
| | | | |
University of California Medical Center Prerefunded Bond Series J | | | 5.25 | | | | 5-15-2030 | | | | 13,135,000 | | | | 15,041,414 | |
| | | | |
University of California Medical Center Unrefunded Bond Series J | | | 5.25 | | | | 5-15-2030 | | | | 1,865,000 | | | | 2,103,869 | |
| | | | |
Washington Township CA Health Care District Series A | | | 5.00 | | | | 7-1-2019 | | | | 905,000 | | | | 917,127 | |
| | | | |
| | | | | | | | | | | | | | | 23,802,843 | |
| | | | | | | | | | | | | | | | |
|
| Miscellaneous Revenue: 1.12% | |
| | | | |
Anaheim CA PFA Convention Center Expansion Project Series A | | | 5.00 | | | | 5-1-2039 | | | | 2,500,000 | | | | 2,758,650 | |
| | | | |
California Public Works Board Department of General Services Buildings 8 & 9A | | | 6.25 | | | | 4-1-2034 | | | | 2,750,000 | | | | 2,782,148 | |
| | | | |
California Public Works Board Various Judicial Council Project Series D | | | 5.25 | | | | 12-1-2026 | | | | 1,000,000 | | | | 1,094,420 | |
| | | | |
California Public Works University of California Board of Regents Series G | | | 5.00 | | | | 12-1-2030 | | | | 12,110,000 | | | | 13,276,435 | |
| | | | |
Foothill De Anza CA Community College District Certificate of Participation | | | 5.00 | | | | 4-1-2033 | | | | 500,000 | | | | 565,625 | |
| | | | |
Gold Coast Transit District California Transit Finance Corporation Certificate of Participation | | | 5.00 | | | | 7-1-2027 | | | | 520,000 | | | | 615,878 | |
| | | | |
Richmond CA Joint Powers Financing Authority Point Potrero Series A | | | 6.25 | | | | 7-1-2024 | | | | 2,700,000 | | | | 2,760,777 | |
| | | | |
San Diego CA PFFA Capital Improvement Projects Series B | | | 5.00 | | | | 10-15-2027 | | | | 500,000 | | | | 593,300 | |
| | | | |
San Diego CA PFFA Capital Improvement Projects Series B | | | 5.00 | | | | 10-15-2028 | | | | 1,000,000 | | | | 1,184,510 | |
| | | | |
Santa Ana CA Financing Authority Police Administration and Holding Facilities Prerefunded Balance Bond (National Insured) | | | 6.25 | | | | 7-1-2019 | | | | 500,000 | | | | 511,480 | |
| | | | |
Santa Ana CA Financing Authority Police Administration and Holding Facilities Unrefunded Balance Bond (National Insured) | | | 6.25 | | | | 7-1-2019 | | | | 500,000 | | | | 511,055 | |
| | | | |
| | | | | | | | | | | | | | | 26,654,278 | |
| | | | | | | | | | | | | | | | |
|
| Tax Revenue: 0.06% | |
| | | | |
San Jose CA RDA SeriesA-1 | | | 5.50 | | | | 8-1-2030 | | | | 1,355,000 | | | | 1,436,557 | |
| | | | | | | | | | | | | | | | |
|
| Transportation Revenue: 0.43% | |
| | | | |
Bay Area CA Toll Authority Toll Bridge Series A (SIFMA Municipal Swap +1.25%) ± | | | 2.96 | | | | 4-1-2036 | | | | 9,810,000 | | | | 10,151,192 | |
| | | | | | | | | | | | | | | | |
|
| Utilities Revenue: 0.86% | |
| | | | |
California Municipal Finance Authority | | | 5.00 | �� | | | 10-1-2025 | | | | 1,500,000 | | | | 1,783,605 | |
| | | | |
M-S-R California Energy Authority Gas Series B | | | 7.00 | | | | 11-1-2034 | | | | 2,000,000 | | | | 2,782,220 | |
| | | | |
M-S-R California Energy Authority Gas Series C | | | 7.00 | | | | 11-1-2034 | | | | 3,000,000 | | | | 4,173,330 | |
| | | | |
Northern California Power Agency Series A | | | 5.25 | | | | 8-1-2023 | | | | 5,150,000 | | | | 5,335,349 | |
| | | | |
Sacramento CA MUD Series B | | | 5.00 | | | | 8-15-2030 | | | | 1,075,000 | | | | 1,215,513 | |
The accompanying notes are an integral part of these financial statements.
| | | | |
| 10 | | Wells Fargo Intermediate Tax/AMT-Free Fund | | Portfolio of investments—December 31, 2018 (unaudited) |
| | | | | | | | | | | | | | | | |
| Security name | | Interest rate | | | Maturity date | | | Principal | | | Value | |
|
| Utilities Revenue(continued) | |
| | | | |
Southern California Public Power Authority Milford Wind Corridor Project #1 | | | 5.00 | % | | | 7-1-2024 | | | $ | 5,000,000 | | | $ | 5,161,500 | |
| | | | |
| | | | | | | | | | | | | | | 20,451,517 | |
| | | | | | | | | | | | | | | | |
|
| Water & Sewer Revenue: 0.42% | |
| | | | |
California Department of Water Resources Central Valley Project Series AT (SIFMA Municipal Swap +0.37%) ± | | | 2.08 | | | | 12-1-2035 | | | | 10,000,000 | | | | 9,988,800 | |
| | | | | | | | | | | | | | | | |
| | | | |
| | | | | | | | | | | | | | | 197,669,277 | |
| | | | | | | | | | | | | | | | |
|
Colorado: 0.77% | |
|
| Education Revenue: 0.29% | |
| | | | |
Colorado ECFA University of Denver Project (National Insured) | | | 5.25 | | | | 3-1-2025 | | | | 1,110,000 | | | | 1,275,557 | |
| | | | |
Regents of the University of Colorado Certificate of Participation Series 2013A | | | 5.00 | | | | 11-1-2028 | | | | 5,000,000 | | | | 5,608,500 | |
| | | | |
| | | | | | | | | | | | | | | 6,884,057 | |
| | | | | | | | | | | | | | | | |
|
| GO Revenue: 0.30% | |
| | | | |
Adams County CO 12 Five Star Schools Series B | | | 5.00 | | | | 12-15-2028 | | | | 3,800,000 | | | | 4,502,088 | |
| | | | |
Mesa County CO Valley School District # 51 Grand Junction | | | 5.50 | | | | 12-1-2035 | | | | 2,175,000 | | | | 2,642,886 | |
| | | | |
| | | | | | | | | | | | | | | 7,144,974 | |
| | | | | | | | | | | | | | | | |
|
| Industrial Development Revenue: 0.14% | |
| | | | |
Denver CO Convention Center Hotel Authority Refunding Bond | | | 5.00 | | | | 12-1-2023 | | | | 3,000,000 | | | | 3,276,300 | |
| | | | | | | | | | | | | | | | |
|
| Miscellaneous Revenue: 0.04% | |
| | | | |
Adams County CO Refunding & Improvement Certificate of Participation | | | 5.00 | | | | 12-1-2021 | | | | 830,000 | | | | 900,309 | |
| | | | | | | | | | | | | | | | |
| | | | |
| | | | | | | | | | | | | | | 18,205,640 | |
| | | | | | | | | | | | | | | | |
|
Connecticut: 3.35% | |
|
| Education Revenue: 1.85% | |
| | | | |
Connecticut HEFAR Yale University Issue Series A | | | 1.00 | | | | 7-1-2042 | | | | 25,000,000 | | | | 24,897,000 | |
| | | | |
Connecticut HEFAR Yale University Issue Series A | | | 2.05 | | | | 7-1-2035 | | | | 10,000,000 | | | | 10,029,400 | |
| | | | |
Connecticut HEFAR Yale University Issue SeriesA-2 | | | 2.00 | | | | 7-1-2042 | | | | 3,425,000 | | | | 3,166,070 | |
| | | | |
University of Connecticut Series A | | | 5.00 | | | | 3-15-2027 | | | | 1,000,000 | | | | 1,132,760 | |
| | | | |
University of Connecticut Series A | | | 5.00 | | | | 3-15-2032 | | | | 4,355,000 | | | | 4,805,263 | |
| | | | |
| | | | | | | | | | | | | | | 44,030,493 | |
| | | | | | | | | | | | | | | | |
|
| GO Revenue: 1.00% | |
| | | | |
Connecticut Series A | | | 5.00 | | | | 3-1-2029 | | | | 2,500,000 | | | | 2,717,375 | |
| | | | |
Connecticut Series B | | | 5.00 | | | | 6-15-2027 | | | | 3,000,000 | | | | 3,312,420 | |
| | | | |
Connecticut Series F | | | 5.00 | | | | 11-15-2032 | | | | 300,000 | | | | 327,054 | |
| | | | |
Hamden CT | | | 4.00 | | | | 8-15-2020 | | | | 1,235,000 | | | | 1,276,076 | |
| | | | |
Hamden CT | | | 4.00 | | | | 8-15-2021 | | | | 1,235,000 | | | | 1,299,578 | |
| | | | |
Hamden CT (AGM Insured) | | | 5.00 | | | | 8-15-2022 | | | | 1,000,000 | | | | 1,090,250 | |
| | | | |
Hamden CT Prerefunded Bond (AGM Insured) | | | 5.00 | | | | 8-15-2021 | | | | 125,000 | | | | 134,710 | |
| | | | |
Hamden CT Refunding Bond Series A (Build America Mutual Assurance Company Insured) | | | 5.00 | | | | 8-15-2029 | | | | 500,000 | | | | 573,980 | |
| | | | |
Hamden CT Refunding Bond Series A (Build America Mutual Assurance Company Insured) | | | 5.00 | | | | 8-15-2030 | | | | 1,200,000 | | | | 1,369,008 | |
The accompanying notes are an integral part of these financial statements.
| | | | | | |
| Portfolio of investments—December 31, 2018 (unaudited) | | Wells Fargo Intermediate Tax/AMT-Free Fund | | | 11 | |
| | | | | | | | | | | | | | | | |
| Security name | | Interest rate | | | Maturity date | | | Principal | | | Value | |
|
| GO Revenue(continued) | |
| | | | |
Hamden CT Series A (Build America Mutual Assurance Company Insured) | | | 5.00 | % | | | 8-15-2026 | | | $ | 2,000,000 | | | $ | 2,299,860 | |
| | | | |
Hamden CT Series A (Build America Mutual Assurance Company Insured) | | | 5.00 | | | | 8-15-2027 | | | | 1,200,000 | | | | 1,383,960 | |
| | | | |
Hamden CT Unrefunded Bond (AGM Insured) | | | 5.00 | | | | 8-15-2021 | | | | 875,000 | | | | 933,949 | |
| | | | |
Hartford CT Series A (AGM Insured) | | | 5.00 | | | | 4-1-2022 | | | | 3,010,000 | | | | 3,260,613 | |
| | | | |
Hartford CT Series A (AGM Insured) | | | 5.00 | | | | 7-1-2026 | | | | 1,000,000 | | | | 1,136,810 | |
| | | | |
Hartford CT Series C (AGM Insured) | | | 5.00 | | | | 7-15-2022 | | | | 2,320,000 | | | | 2,527,269 | |
| | | | |
| | | | | | | | | | | | | | | 23,642,912 | |
| | | | | | | | | | | | | | | | |
|
| Miscellaneous Revenue: 0.45% | |
| | | | |
Connecticut Series A (SIFMA Municipal Swap +0.85%) ± | | | 2.56 | | | | 3-1-2022 | | | | 3,000,000 | | | | 3,012,450 | |
| | | | |
Connecticut Series A (SIFMA Municipal Swap +1.10%) ± | | | 2.81 | | | | 4-15-2019 | | | | 2,300,000 | | | | 2,304,554 | |
| | | | |
Connecticut Series A (SIFMA Municipal Swap +1.25%) ± | | | 2.96 | | | | 4-15-2020 | | | | 3,300,000 | | | | 3,329,205 | |
| | | | |
Connecticut Series G | | | 4.00 | | | | 10-15-2026 | | | | 1,985,000 | | | | 2,061,919 | |
| | | | |
| | | | | | | | | | | | | | | 10,708,128 | |
| | | | | | | | | | | | | | | | |
|
| Tax Revenue: 0.05% | |
| | | | |
Connecticut Special Tax Obligation Bonds Transportation Infrastructure Purposes Series A | | | 5.00 | | | | 8-1-2030 | | | | 1,000,000 | | | | 1,107,860 | |
| | | | | | | | | | | | | | | | |
| | | | |
| | | | | | | | | | | | | | | 79,489,393 | |
| | | | | | | | | | | | | | | | |
|
Delaware: 0.09% | |
|
| Education Revenue: 0.09% | |
| | | | |
Delaware EDA Odyssey Charter School Project Series B 144A | | | 6.75 | | | | 9-1-2035 | | | | 2,000,000 | | | | 2,077,140 | |
| | | | | | | | | | | | | | | | |
|
District of Columbia: 1.41% | |
|
| Education Revenue: 0.11% | |
| | | | |
District of Columbia Howard University Series A | | | 5.75 | | | | 10-1-2026 | | | | 2,510,000 | | | | 2,620,239 | |
| | | | | | | | | | | | | | | | |
|
| GO Revenue: 0.58% | |
| | | | |
District of Columbia Series 2016A | | | 5.00 | | | | 6-1-2033 | | | | 5,000,000 | | | | 5,771,250 | |
| | | | |
District of Columbia Series 2017A | | | 5.00 | | | | 6-1-2033 | | | | 2,400,000 | | | | 2,801,016 | |
| | | | |
District of Columbia Series 2014C | | | 5.00 | | | | 6-1-2034 | | | | 3,000,000 | | | | 3,351,540 | |
| | | | |
District of Columbia Series 2014C | | | 5.00 | | | | 6-1-2035 | | | | 1,620,000 | | | | 1,805,506 | |
| | | | |
| | | | | | | | | | | | | | | 13,729,312 | |
| | | | | | | | | | | | | | | | |
|
| Miscellaneous Revenue: 0.46% | |
| | | | |
District of Columbia Federal Highway Grant Anticipation Bond | | | 5.00 | | | | 12-1-2023 | | | | 1,000,000 | | | | 1,103,970 | |
| | | | |
District of Columbia Federal Highway Grant Anticipation Bond | | | 5.00 | | | | 12-1-2025 | | | | 3,520,000 | | | | 3,866,544 | |
| | | | |
District of Columbia Federal Highway Grant Anticipation Bond | | | 5.25 | | | | 12-1-2025 | | | | 2,630,000 | | | | 2,782,303 | |
| | | | |
District of Columbia Medical Association of Colleges Series B | | | 5.00 | | | | 10-1-2024 | | | | 3,095,000 | | | | 3,301,437 | |
| | | | |
| | | | | | | | | | | | | | | 11,054,254 | |
| | | | | | | | | | | | | | | | |
|
| Transportation Revenue: 0.15% | |
| | | | |
Washington Metropolitan Area Transit Authority Series B | | | 5.00 | | | | 7-1-2032 | | | | 3,000,000 | | | | 3,508,230 | |
| | | | | | | | | | | | | | | | |
|
| Water & Sewer Revenue: 0.11% | |
| | | | |
District of Columbia Water & Sewer Authority Public Utility Senior Lien Series A | | | 5.00 | | | | 10-1-2037 | | | | 2,260,000 | | | | 2,608,650 | |
| | | | | | | | | | | | | | | | |
| | | | |
| | | | | | | | | | | | | | | 33,520,685 | |
| | | | | | | | | | | | | | | | |
The accompanying notes are an integral part of these financial statements.
| | | | |
| 12 | | Wells Fargo Intermediate Tax/AMT-Free Fund | | Portfolio of investments—December 31, 2018 (unaudited) |
| | | | | | | | | | | | | | | | |
| Security name | | Interest rate | | | Maturity date | | | Principal | | | Value | |
|
Florida: 3.70% | |
|
| Airport Revenue: 0.10% | |
| | | | |
Jacksonville FL Port Authority Series B | | | 5.00 | % | | | 11-1-2035 | | | $ | 2,045,000 | | | $ | 2,364,409 | |
| | | | | | | | | | | | | | | | |
|
| Education Revenue: 0.20% | |
| | | | |
Florida Development Finance Corporation Renaissance Charter School Series A | | | 5.00 | | | | 9-15-2020 | | | | 880,000 | | | | 888,061 | |
| | | | |
Florida HEFAR | | | 4.00 | | | | 4-1-2021 | | | | 1,000,000 | | | | 1,035,840 | |
| | | | |
University of South Florida Financing Corporation Certificate of Participation Master Lease Program Series A | | | 5.00 | | | | 7-1-2022 | | | | 1,730,000 | | | | 1,898,796 | |
| | | | |
University of South Florida Financing Corporation Certificate of Participation Master Lease Program Series A | | | 5.00 | | | | 7-1-2023 | | | | 815,000 | | | | 911,773 | |
| | | | |
| | | | | | | | | | | | | | | 4,734,470 | |
| | | | | | | | | | | | | | | | |
|
| GO Revenue: 0.06% | |
| | | | |
Plantation FL Ad Valorem Bond | | | 5.00 | | | | 7-1-2031 | | | | 1,155,000 | | | | 1,363,131 | |
| | | | | | | | | | | | | | | | |
|
| Health Revenue: 0.10% | |
| | | | |
Miami-Dade County FL Health Facilities Authority Nicklaus Children’s Hospital Project | | | 5.00 | | | | 8-1-2031 | | | | 500,000 | | | | 569,445 | |
| | | | |
Miami-Dade County FL Health Facilities Authority Nicklaus Children’s Hospital Project | | | 5.00 | | | | 8-1-2033 | | | | 1,645,000 | | | | 1,857,633 | |
| | | | |
| | | | | | | | | | | | | | | 2,427,078 | |
| | | | | | | | | | | | | | | | |
|
| Miscellaneous Revenue: 2.02% | |
| | | | |
Boynton FL PFA Capital Improvement Series 2018 | | | 5.00 | | | | 7-1-2035 | | | | 3,590,000 | | | | 4,055,874 | |
| | | | |
Broward County FL School Board Certificate of Participation Series A | | | 5.00 | | | | 7-1-2024 | | | | 5,000,000 | | | | 5,720,800 | |
| | | | |
Cityplace Florida Community Development District Special Assessment | | | 5.00 | | | | 5-1-2021 | | | | 2,945,000 | | | | 3,132,420 | |
| | | | |
Duval County FL School Board Certificate of Participation Series B | | | 5.00 | | | | 7-1-2028 | | | | 2,500,000 | | | | 2,861,225 | |
| | | | |
Duval County FL School Board Certificate of Participation Series B | | | 5.00 | | | | 7-1-2029 | | | | 5,000,000 | | | | 5,709,650 | |
| | | | |
Miami-Dade County FL School Board Certificate of Participation Series A | | | 5.00 | | | | 5-1-2031 | | | | 3,000,000 | | | | 3,383,010 | |
| | | | |
Miami-Dade County FL School Board Certificate of Participation Series D | | | 5.00 | | | | 11-1-2027 | | | | 6,600,000 | | | | 7,508,622 | |
| | | | |
Monroe County FL School Board Certificate of Participation Series A | | | 5.00 | | | | 6-1-2034 | | | | 1,500,000 | | | | 1,723,920 | |
| | | | |
Monroe County FL School Board Certificate of Participation Series A | | | 5.00 | | | | 6-1-2035 | | | | 1,000,000 | | | | 1,145,280 | |
| | | | |
Orange County FL School Board Certificate of Participation Series C | | | 5.00 | | | | 8-1-2029 | | | | 2,000,000 | | | | 2,287,160 | |
| | | | |
Orlando FL Senior Tourist Development 6th Cent Contract Payment Bond Series A (AGM Insured) | | | 5.00 | | | | 11-1-2032 | | | | 2,000,000 | | | | 2,293,080 | |
| | | | |
Orlando FL Senior Tourist Development 6th Cent Contract Payment Bond Series A (AGM Insured) | | | 5.00 | | | | 11-1-2033 | | | | 4,500,000 | | | | 5,125,860 | |
| | | | |
Orlando FL Senior Tourist Development 6th Cent Contract Payment Bond Series A (AGM Insured) | | | 5.00 | | | | 11-1-2034 | | | | 600,000 | | | | 680,484 | |
| | | | |
Palm Beach County FL Refunding Bond | | | 5.00 | | | | 5-1-2029 | | | | 2,000,000 | | | | 2,341,580 | |
| | | | |
| | | | | | | | | | | | | | | 47,968,965 | |
| | | | | | | | | | | | | | | | |
|
| Tax Revenue: 0.62% | |
| | | | |
Miami-Dade County FL Public Services (AGM Insured) | | | 4.00 | | | | 10-1-2019 | | | | 3,440,000 | | | | 3,494,111 | |
| | | | |
Miami-Dade County FL Public Services (AGM Insured) | | | 4.00 | | | | 10-1-2020 | | | | 3,600,000 | | | | 3,730,284 | |
| | | | |
Miami-Dade County FL Public Services (AGM Insured) | | | 4.00 | | | | 4-1-2021 | | | | 2,485,000 | | | | 2,596,850 | |
| | | | |
Miami-Dade County FL Special Obligation Series A | | | 5.00 | | | | 10-1-2023 | | | | 700,000 | | | | 769,524 | |
| | | | |
Tampa FL Sports Authority Stadium Project | | | 5.00 | | | | 1-1-2025 | | | | 3,550,000 | | | | 4,116,190 | |
| | | | |
| | | | | | | | | | | | | | | 14,706,959 | |
| | | | | | | | | | | | | | | | |
The accompanying notes are an integral part of these financial statements.
| | | | | | |
| Portfolio of investments—December 31, 2018 (unaudited) | | Wells Fargo Intermediate Tax/AMT-Free Fund | | | 13 | |
| | | | | | | | | | | | | | | | |
| Security name | | Interest rate | | | Maturity date | | | Principal | | | Value | |
|
| Transportation Revenue: 0.49% | |
| | | | |
Florida Department of Transportation Turnpike System Series A | | | 5.00 | % | | | 7-1-2023 | | | $ | 3,910,000 | | | $ | 4,420,802 | |
| | | | |
Florida Department of Transportation Turnpike System Series A | | | 5.00 | | | | 7-1-2025 | | | | 4,950,000 | | | | 5,800,856 | |
| | | | |
FloridaMid-Bay Bridge Authority Series A | | | 5.00 | | | | 10-1-2025 | | | | 1,250,000 | | | | 1,423,663 | |
| | | | |
| | | | | | | | | | | | | | | 11,645,321 | |
| | | | | | | | | | | | | | | | |
|
| Water & Sewer Revenue: 0.11% | |
| | | | |
Daytona Beach FL Utility System (AGM Insured) | | | 5.00 | | | | 11-1-2022 | | | | 2,205,000 | | | | 2,434,673 | |
| | | | | | | | | | | | | | | | |
| | | | |
| | | | | | | | | | | | | | | 87,645,006 | |
| | | | | | | | | | | | | | | | |
|
Georgia: 1.71% | |
|
| Education Revenue: 0.15% | |
| | | | |
Private Colleges & Universities Authority of Georgia Series A | | | 5.00 | | | | 10-1-2021 | | | | 3,330,000 | | | | 3,538,425 | |
| | | | | | | | | | | | | | | | |
|
| Housing Revenue: 0.13% | |
| | | | |
Atlanta GA Urban Residential Finance Authority MFHR Wheat Street Towers Project | | | 1.40 | | | | 5-1-2020 | | | | 3,000,000 | | | | 2,995,260 | |
| | | | | | | | | | | | | | | | |
|
| Industrial Development Revenue: 0.08% | |
| | | | |
Monroe County GA PCR Georgia Power Company Plant Scherer Project | | | 2.35 | | | | 10-1-2048 | | | | 2,000,000 | | | | 1,983,480 | |
| | | | | | | | | | | | | | | | |
|
| Utilities Revenue: 1.35% | |
| | | | |
Burke County GA PCR Oglethorpe Power Corporation Vogtle Project Series E | | | 3.25 | | | | 11-1-2045 | | | | 6,000,000 | | | | 5,976,900 | |
| | | | |
Floyd County GA PCR Georgia Power Company Plant Hammond Project | | | 2.35 | | | | 7-1-2022 | | | | 1,000,000 | | | | 991,740 | |
| | | | |
Georgia Public Gas Partners Incorporated Series A | | | 5.00 | | | | 10-1-2019 | | | | 5,000,000 | | | | 5,111,250 | |
| | | | |
Main Street Natural Gas Incorporated Georgia Gas Project Series A (Royal Bank of Canada LIQ) | | | 4.00 | | | | 4-1-2048 | | | | 15,500,000 | | | | 16,327,855 | |
| | | | |
Main Street Natural Gas Incorporated Georgia Gas Project Series A | | | 5.50 | | | | 9-15-2022 | | | | 1,000,000 | | | | 1,104,610 | |
| | | | |
Main Street Natural Gas Incorporated Georgia Gas Project Subordinate Bond Series C | | | 4.00 | | | | 8-1-2048 | | | | 2,500,000 | | | | 2,639,800 | |
| | | | |
| | | | | | | | | | | | | | | 32,152,155 | |
| | | | | | | | | | | | | | | | |
| | | | |
| | | | | | | | | | | | | | | 40,669,320 | |
| | | | | | | | | | | | | | | | |
|
Guam: 0.30% | |
|
| Airport Revenue: 0.11% | |
| | | | |
Guam International Airport Authority | | | 5.00 | | | | 10-1-2022 | | | | 1,000,000 | | | | 1,069,930 | |
| | | | |
Guam International Airport Authority | | | 5.00 | | | | 10-1-2023 | | | | 1,500,000 | | | | 1,588,920 | |
| | | | |
| | | | | | | | | | | | | | | 2,658,850 | |
| | | | | | | | | | | | | | | | |
|
| Tax Revenue: 0.06% | |
| | | | |
Guam Government Business Privilege Tax Bond Series A | | | 5.00 | | | | 1-1-2020 | | | | 1,345,000 | | | | 1,375,814 | |
| | | | | | | | | | | | | | | | |
|
| Water & Sewer Revenue: 0.13% | |
| | | | |
Guam Government Waterworks Authority | | | 5.25 | | | | 7-1-2020 | | | | 350,000 | | | | 363,300 | |
| | | | |
Guam Government Waterworks Authority | | | 5.25 | | | | 7-1-2033 | | | | 2,500,000 | | | | 2,656,975 | |
| | | | |
| | | | | | | | | | | | | | | 3,020,275 | |
| | | | | | | | | | | | | | | | |
| | | | |
| | | | | | | | | | | | | | | 7,054,939 | |
| | | | | | | | | | | | | | | | |
The accompanying notes are an integral part of these financial statements.
| | | | |
| 14 | | Wells Fargo Intermediate Tax/AMT-Free Fund | | Portfolio of investments—December 31, 2018 (unaudited) |
| | | | | | | | | | | | | | | | |
| Security name | | Interest rate | | | Maturity date | | | Principal | | | Value | |
|
Hawaii: 0.42% | |
|
| GO Revenue: 0.42% | |
| | | | |
Honolulu HI Rail Transit Project Series H (SIFMA Municipal Swap +0.30%) ± | | | 2.01 | % | | | 9-1-2022 | | | $ | 2,500,000 | | | $ | 2,499,025 | |
| | | | |
Honolulu HI Rail Transit Project Series H (SIFMA Municipal Swap +0.32%) ± | | | 2.03 | | | | 9-1-2025 | | | | 2,500,000 | | | | 2,499,025 | |
| | | | |
Honolulu HI Rail Transit Project Series H (SIFMA Municipal Swap +0.32%) ± | | | 2.03 | | | | 9-1-2028 | | | | 5,000,000 | | | | 4,998,050 | |
| | | | |
| | | | | | | | | | | | | | | 9,996,100 | |
| | | | | | | | | | | | | | | | |
|
Illinois: 14.54% | |
|
| Airport Revenue: 1.40% | |
| | | | |
Chicago IL O’Hare International Airport Senior Lien (AGM Insured) | | | 5.13 | | | | 1-1-2030 | | | | 2,610,000 | | | | 2,864,736 | |
| | | | |
Chicago IL O’Hare International Airport Senior Lien (AGM Insured) | | | 5.13 | | | | 1-1-2031 | | | | 3,335,000 | | | | 3,653,859 | |
| | | | |
Chicago IL O’Hare International Airport Senior Lien | | | 5.25 | | | | 1-1-2032 | | | | 8,755,000 | | | | 9,584,536 | |
| | | | |
Chicago IL O’Hare International Airport Senior Lien Series B | | | 5.00 | | | | 1-1-2030 | | | | 8,000,000 | | | | 8,941,600 | |
| | | | |
Chicago IL O’Hare International Airport Senior Lien Series B | | | 5.00 | | | | 1-1-2036 | | | | 500,000 | | | | 570,950 | |
| | | | |
Chicago IL O’Hare International Airport Third Lien Series C (AGC Insured) | | | 5.25 | | | | 1-1-2025 | | | | 4,075,000 | | | | 4,197,821 | |
| | | | |
Chicago IL O’Hare International Airport Third Lien Series F | | | 4.25 | | | | 1-1-2021 | | | | 735,000 | | | | 752,081 | |
| | | | |
Peoria IL Metropolitan Airport Authority Series D | | | 5.00 | | | | 12-1-2027 | | | | 2,250,000 | | | | 2,607,683 | |
| | | | |
| | | | | | | | | | | | | | | 33,173,266 | |
| | | | | | | | | | | | | | | | |
|
| Education Revenue: 0.70% | |
| | | | |
Illinois Finance Authority Bradley University Project Series C | | | 5.00 | | | | 8-1-2032 | | | | 1,250,000 | | | | 1,405,613 | |
| | | | |
Illinois Finance Authority Student Housing Illinois State University Project | | | 5.50 | | | | 4-1-2021 | | | | 2,760,000 | | | | 2,859,608 | |
| | | | |
Illinois Finance Authority Wesleyan University | | | 5.00 | | | | 9-1-2026 | | | | 680,000 | | | | 773,935 | |
| | | | |
Northern Illinois University Board of Trustees Auxiliary Facilities (AGM Insured) | | | 5.00 | | | | 4-1-2019 | | | | 1,000,000 | | | | 1,007,140 | |
| | | | |
Northern Illinois University Board of Trustees Certificate of Participation (AGM Insured) | | | 5.00 | | | | 9-1-2022 | | | | 1,325,000 | | | | 1,442,104 | |
| | | | |
Northern Illinois University Board of Trustees Certificate of Participation (AGM Insured) | | | 5.00 | | | | 9-1-2024 | | | | 1,000,000 | | | | 1,116,060 | |
| | | | |
University of Illinois Auxiliary Facilities Systems CAB (z) | | | 4.50 | | | | 4-1-2020 | | | | 8,270,000 | | | | 8,027,110 | |
| | | | |
| | | | | | | | | | | | | | | 16,631,570 | |
| | | | | | | | | | | | | | | | |
|
| GO Revenue: 5.04% | |
| | | | |
Bolingbrook, Will & DuPage Counties IL Series A (AGM Insured) | | | 5.00 | | | | 1-1-2023 | | | | 650,000 | | | | 712,186 | |
| | | | |
Chicago IL Board of Education CAB School Reform Series B-1 (National Insured) (z) | | | 5.00 | | | | 12-1-2025 | | | | 3,380,000 | | | | 2,586,376 | |
| | | | |
Chicago IL Board of Education CAB School Reform Series B-1 (National Insured) (z) | | | 5.17 | | | | 12-1-2026 | | | | 4,030,000 | | | | 2,945,970 | |
| | | | |
Chicago IL Board of Education Series F | | | 5.00 | | | | 12-1-2020 | | | | 2,375,000 | | | | 2,444,231 | |
| | | | |
Chicago IL CAB Series C (z) | | | 5.04 | | | | 1-1-2023 | | | | 2,500,000 | | | | 2,173,875 | |
| | | | |
Chicago IL Metropolitan Reclamation Series B | | | 5.00 | | | | 12-1-2025 | | | | 2,500,000 | | | | 2,698,500 | |
| | | | |
Chicago IL Park District Series A | | | 5.00 | | | | 1-1-2036 | | | | 2,250,000 | | | | 2,329,605 | |
| | | | |
Chicago IL Park District Series B | | | 5.00 | | | | 1-1-2021 | | | | 3,765,000 | | | | 3,932,053 | |
| | | | |
Chicago IL Park District Series B (Build America Mutual Assurance Company Insured) | | | 5.00 | | | | 1-1-2029 | | | | 2,000,000 | | | | 2,183,280 | |
| | | | |
Chicago IL Park District Series C | | | 5.00 | | | | 1-1-2022 | | | | 1,615,000 | | | | 1,715,421 | |
| | | | |
Chicago IL Series A | | | 5.00 | | | | 1-1-2027 | | | | 1,000,000 | | | | 1,041,650 | |
| | | | |
Chicago IL Series A | | | 5.00 | | | | 1-1-2025 | | | | 750,000 | | | | 788,498 | |
| | | | |
Chicago IL Series C | | | 4.00 | | | | 1-1-2020 | | | | 1,505,000 | | | | 1,517,281 | |
| | | | |
Chicago IL Series C | | | 5.00 | | | | 1-1-2024 | | | | 90,000 | | | | 90,131 | |
| | | | |
Chicago IL Series C | | | 5.00 | | | | 1-1-2026 | | | | 5,000,000 | | | | 5,343,300 | |
| | | | |
Chicago IL Series G (Ambac Insured) | | | 5.00 | | | | 12-1-2024 | | | | 13,465,000 | | | | 13,512,666 | |
The accompanying notes are an integral part of these financial statements.
| | | | | | |
| Portfolio of investments—December 31, 2018 (unaudited) | | Wells Fargo Intermediate Tax/AMT-Free Fund | | | 15 | |
| | | | | | | | | | | | | | | | |
| Security name | | Interest rate | | | Maturity date | | | Principal | | | Value | |
|
| GO Revenue(continued) | |
| | | | |
Cook County IL | | | 5.00 | % | | | 11-15-2035 | | | $ | 1,300,000 | | | $ | 1,415,310 | |
| | | | |
Cook County IL Community College District #508 | | | 5.25 | | | | 12-1-2025 | | | | 1,425,000 | | | | 1,510,828 | |
| | | | |
Cook County IL Community College District #508 | | | 5.25 | | | | 12-1-2027 | | | | 1,295,000 | | | | 1,361,770 | |
| | | | |
Cook County IL Community College District #508 | | | 5.25 | | | | 12-1-2028 | | | | 1,250,000 | | | | 1,311,038 | |
| | | | |
Cook County IL Community College District #508 | | | 5.25 | | | | 12-1-2030 | | | | 3,000,000 | | | | 3,131,610 | |
| | | | |
Cook County IL Community College District #508 | | | 5.25 | | | | 12-1-2031 | | | | 3,200,000 | | | | 3,334,624 | |
| | | | |
Cook County IL Series A | | | 5.00 | | | | 11-15-2031 | | | | 1,000,000 | | | | 1,101,610 | |
| | | | |
Cook County IL Series A | | | 5.25 | | | | 11-15-2022 | | | | 7,240,000 | | | | 7,611,557 | |
| | | | |
Cook County IL Series A | | | 5.25 | | | | 11-15-2023 | | | | 7,680,000 | | | | 8,066,918 | |
| | | | |
Cook County IL Series A | | | 5.25 | | | | 11-15-2024 | | | | 2,200,000 | | | | 2,353,692 | |
| | | | |
Cook County IL Series B | | | 5.00 | | | | 11-15-2023 | | | | 600,000 | | | | 666,858 | |
| | | | |
Cook County IL Series C | | | 5.00 | | | | 11-15-2021 | | | | 1,460,000 | | | | 1,564,930 | |
| | | | |
Cook County IL Series C | | | 5.00 | | | | 11-15-2024 | | | | 2,175,000 | | | | 2,357,439 | |
| | | | |
Cook County IL Series C | | | 5.00 | | | | 11-15-2025 | | | | 2,450,000 | | | | 2,643,354 | |
| | | | |
DuPage, Cook & Will Counties IL Community College District #502 Series A | | | 5.00 | | | | 6-1-2022 | | | | 2,650,000 | | | | 2,903,473 | |
| | | | |
Homer, Glen, Will & Cook Village Counties IL Series A | | | 4.00 | | | | 12-1-2019 | | | | 1,000,000 | | | | 1,018,770 | |
| | | | |
Homer, Glen, Will & Cook Village Counties IL Series A | | | 5.00 | | | | 12-1-2021 | | | | 1,015,000 | | | | 1,043,836 | |
| | | | |
Illinois (AGM Insured) | | | 5.00 | | | | 1-1-2023 | | | | 2,450,000 | | | | 2,510,025 | |
| | | | |
Illinois (AGM Insured) | | | 5.00 | | | | 4-1-2026 | | | | 5,000,000 | | | | 5,489,350 | |
| | | | |
Illinois | | | 4.75 | | | | 4-1-2020 | | | | 2,650,000 | | | | 2,654,055 | |
| | | | |
Illinois Series A | | | 5.00 | | | | 4-1-2023 | | | | 4,500,000 | | | | 4,754,745 | |
| | | | |
Illinois Series A (AGM Insured) | | | 5.00 | | | | 4-1-2024 | | | | 2,500,000 | | | | 2,712,300 | |
| | | | |
Kane, Cook & DuPage Counties IL School District #46 Prerefunded Balance Bond Series B | | | 4.50 | | | | 1-1-2024 | | | | 1,170,000 | | | | 1,256,369 | |
| | | | |
Kane, Cook & DuPage Counties IL School District #46 Unrefunded Balance Bond Series B | | | 4.50 | | | | 1-1-2024 | | | | 3,100,000 | | | | 3,299,020 | |
| | | | |
Kendall, Kane & Will Counties IL Unified School District Series A | | | 5.00 | | | | 2-1-2023 | | | | 1,000,000 | | | | 1,058,220 | |
| | | | |
McHenry & Kane Counties IL Community Consolidated School District #158 | | | 5.63 | | | | 1-15-2031 | | | | 2,000,000 | | | | 2,194,360 | |
| | | | |
McHenry & Lake Counties IL Community Consolidated School District #26 (AGM Insured) | | | 5.00 | | | | 2-1-2020 | | | | 1,455,000 | | | | 1,500,032 | |
| | | | |
Springfield IL | | | 5.00 | | | | 12-1-2021 | | | | 850,000 | | �� | | 907,809 | |
| | | | |
Springfield IL | | | 5.00 | | | | 12-1-2023 | | | | 570,000 | | | | 629,907 | |
| | | | |
Waukegan IL Series B (AGM Insured) | | | 4.00 | | | | 12-30-2024 | | | | 1,030,000 | | | | 1,105,386 | |
| | | | |
| | | | | | | | | | | | | | | 119,484,218 | |
| | | | | | | | | | | | | | | | |
|
| Health Revenue: 0.10% | |
| | | | |
Illinois Finance Authority Ann & Robert H. Laurie Children’s Hospital Project of Chicago | | | 5.00 | | | | 8-15-2034 | | | | 1,000,000 | | | | 1,135,390 | |
| | | | |
Illinois Finance Authority Edward Elmhurst Healthcare Series A | | | 5.00 | | | | 1-1-2026 | | | | 1,000,000 | | | | 1,134,790 | |
| | | | |
| | | | | | | | | | | | | | | 2,270,180 | |
| | | | | | | | | | | | | | | | |
|
| Miscellaneous Revenue: 0.87% | |
| | | | |
Chicago IL Board of Education Series C | | | 5.00 | | | | 12-1-2021 | | | | 5,000,000 | | | | 5,191,650 | |
| | | | |
Illinois | | | 5.00 | | | | 7-1-2023 | | | | 5,065,000 | | | | 5,365,456 | |
| | | | |
Illinois | | | 5.00 | | | | 8-1-2024 | | | | 1,000,000 | | | | 1,043,160 | |
| | | | |
Illinois | | | 5.50 | | | | 7-1-2026 | | | | 2,300,000 | | | | 2,474,915 | |
| | | | |
Peoria IL Public Building Commission Illinois School District Facilities Refunding Bond (Build America Mutual Assurance Company Insured) | | | 5.00 | | | | 12-1-2023 | | | | 4,040,000 | | | | 4,529,769 | |
| | | | |
Peoria IL Public Building Commission Illinois School District Facilities Refunding Bond (Build America Mutual Assurance Company Insured) | | | 5.00 | | | | 12-1-2024 | | | | 1,000,000 | | | | 1,137,740 | |
The accompanying notes are an integral part of these financial statements.
| | | | |
| 16 | | Wells Fargo Intermediate Tax/AMT-Free Fund | | Portfolio of investments—December 31, 2018 (unaudited) |
| | | | | | | | | | | | | | | | |
| Security name | | Interest rate | | | Maturity date | | | Principal | | | Value | |
|
| Miscellaneous Revenue(continued) | |
| | | | |
University of Illinois Board of Trustees Certificate of Participation Unrefunded Bond Series B (AGM Insured) | | | 5.00 | % | | | 10-1-2020 | | | $ | 955,000 | | | $ | 957,493 | |
| | | | |
| | | | | | | | | | | | | | | 20,700,183 | |
| | | | | | | | | | | | | | | | |
|
| Tax Revenue: 5.11% | |
| | | | |
Chicago IL Sales Tax Refunding Bond | | | 5.00 | | | | 1-1-2026 | | | | 5,140,000 | | | | 5,959,779 | |
| | | | |
Chicago IL Sales Tax Refunding Bond | | | 5.00 | | | | 1-1-2027 | | | | 3,000,000 | | | | 3,478,470 | |
| | | | |
Chicago IL Sales Tax Refunding Bond | | | 5.00 | | | | 1-1-2030 | | | | 2,075,000 | | | | 2,405,942 | |
| | | | |
Chicago IL Sales Tax Securitization Bond Series C | | | 5.25 | | | | 1-1-2035 | | | | 4,700,000 | | | | 5,320,823 | |
| | | | |
Chicago IL Transit Authority Sales Tax Receipts | | | 5.25 | | | | 12-1-2027 | | | | 2,600,000 | | | | 2,765,568 | |
| | | | |
Cook County IL Sales Tax Bond | | | 5.00 | | | | 11-15-2033 | | | | 4,000,000 | | | | 4,551,840 | |
| | | | |
Illinois | | | 5.00 | | | | 6-15-2023 | | | | 16,150,000 | | | | 17,291,129 | |
| | | | |
Illinois Junior Obligation | | | 5.00 | | | | 6-15-2025 | | | | 6,000,000 | | | | 6,398,340 | |
| | | | |
Illinois Regional Transportation Authority (National Insured) | | | 6.50 | | | | 7-1-2026 | | | | 8,615,000 | | | | 10,669,247 | |
| | | | |
Illinois Sales Tax Revenue Build Illinois Bond | | | 5.00 | | | | 6-15-2029 | | | | 1,000,000 | | | | 1,035,380 | |
| | | | |
Illinois Series A | | | 5.00 | | | | 1-1-2027 | | | | 10,625,000 | | | | 10,958,306 | |
| | | | |
Illinois Sports Facilities Authority State Tax Supported Refunding Bond (AGM Insured) | | | 5.00 | | | | 6-15-2028 | | | | 2,500,000 | | | | 2,726,000 | |
| | | | |
Illinois Sports Facilities Authority State Tax Supported Refunding Bond (AGM Insured) | | | 5.25 | | | | 6-15-2030 | | | | 4,000,000 | | | | 4,409,160 | |
| | | | |
Illinois Sports Facilities Authority State Tax Supported Refunding Bond (AGM Insured) | | | 5.25 | | | | 6-15-2032 | | | | 3,000,000 | | | | 3,291,120 | |
| | | | |
Metropolitan Pier & Exposition Authority CAB McCormick Place Expansion Project Series A (National Insured) (z) | | | 4.26 | | | | 12-15-2029 | | | | 35,200,000 | | | | 22,186,208 | |
| | | | |
Metropolitan Pier & Exposition Authority CAB McCormick Place Expansion Project Series A (National Insured) (z) | | | 4.33 | | | | 12-15-2030 | | | | 12,800,000 | | | | 7,662,720 | |
| | | | |
Metropolitan Pier & Exposition Authority CAB McCormick Place Expansion Project Series B (National Insured) (z) | | | 4.25 | | | | 6-15-2029 | | | | 10,000,000 | | | | 6,463,600 | |
| | | | |
Metropolitan Pier & Exposition Authority McCormick Place Expansion Project Series B | | | 5.00 | | | | 12-15-2028 | | | | 1,945,000 | | | | 2,012,122 | |
| | | | |
Southwestern Illinois Development Authority Local Government Program Collinsville Limited | | | 5.00 | | | | 3-1-2025 | | | | 1,875,000 | | | | 1,498,894 | |
| | | | |
| | | | | | | | | | | | | | | 121,084,648 | |
| | | | | | | | | | | | | | | | |
|
| Tobacco Revenue: 0.14% | |
| | | | |
Railsplitter IL Tobacco Settlement Authority | | | 5.00 | | | | 6-1-2024 | | | | 3,000,000 | | | | 3,357,960 | |
| | | | | | | | | | | | | | | | |
|
| Transportation Revenue: 0.15% | |
| | | | |
Illinois Toll Highway Authority SeriesA-1 | | | 5.25 | | | | 1-1-2026 | | | | 3,500,000 | | | | 3,612,840 | |
| | | | | | | | | | | | | | | | |
|
| Water & Sewer Revenue: 1.03% | |
| | | | |
Chicago IL Second Lien | | | 5.00 | | | | 11-1-2022 | | | | 1,730,000 | | | | 1,889,523 | |
| | | | |
Chicago IL Second Lien | | | 5.00 | | | | 11-1-2023 | | | | 1,515,000 | | | | 1,648,335 | |
| | | | |
Chicago IL Second Lien | | | 5.00 | | | | 11-1-2025 | | | | 620,000 | | | | 670,096 | |
| | | | |
Chicago IL Second Lien | | | 5.00 | | | | 11-1-2026 | | | | 2,000,000 | | | | 2,157,080 | |
| | | | |
Chicago IL Second Lien | | | 5.00 | | | | 11-1-2028 | | | | 3,000,000 | | | | 3,213,090 | |
| | | | |
Chicago IL Second Lien | | | 5.00 | | | | 11-1-2029 | | | | 1,490,000 | | | | 1,592,497 | |
| | | | |
Chicago IL Second Lien | | | 5.00 | | | | 11-1-2033 | | | | 1,000,000 | | | | 1,091,080 | |
| | | | |
Chicago IL Waste Water Transmission Second Lien | | | 5.00 | | | | 1-1-2022 | | | | 1,340,000 | | | | 1,439,683 | |
| | | | |
Chicago IL Waste Water Transmission Second Lien | | | 5.00 | | | | 1-1-2023 | | | | 2,335,000 | | | | 2,501,719 | |
The accompanying notes are an integral part of these financial statements.
| | | | | | |
| Portfolio of investments—December 31, 2018 (unaudited) | | Wells Fargo Intermediate Tax/AMT-Free Fund | | | 17 | |
| | | | | | | | | | | | | | | | |
| Security name | | Interest rate | | | Maturity date | | | Principal | | | Value | |
|
| Water & Sewer Revenue(continued) | |
| | | | |
Chicago IL Waste Water Transmission Second Lien | | | 5.00 | % | | | 1-1-2024 | | | $ | 2,000,000 | | | $ | 2,141,000 | |
| | | | |
Chicago IL Waste Water Transmission Second Lien | | | 5.00 | | | | 1-1-2027 | | | | 2,670,000 | | | | 2,931,553 | |
| | | | |
Chicago IL Waste Water Transmission Second Lien | | | 5.00 | | | | 1-1-2032 | | | | 1,000,000 | | | | 1,081,520 | |
| | | | |
Chicago IL Waste Water Transmission Second Lien | | | 5.00 | | | | 1-1-2033 | | | | 1,000,000 | | | | 1,079,120 | |
| | | | |
Chicago IL Waste Water Transmission Second Lien | | | 5.00 | | | | 1-1-2034 | | | | 1,000,000 | | | | 1,077,210 | |
| | | | |
| | | | | | | | | | | | | | | 24,513,506 | |
| | | | | | | | | | | | | | | | |
| | | | |
| | | | | | | | | | | | | | | 344,828,371 | |
| | | | | | | | | | | | | | | | |
|
Indiana: 1.25% | |
|
| Education Revenue: 0.05% | |
| | | | |
University of Southern Indiana Student Fee Series J (AGC Insured) | | | 5.00 | | | | 10-1-2019 | | | | 1,000,000 | | | | 1,022,780 | |
| | | | | | | | | | | | | | | | |
|
| Health Revenue: 0.24% | |
| | | | |
Indiana Finance Authority Parkview Health Project Prerefunded Bond | | | 5.50 | | | | 5-1-2024 | | | | 30,000 | | | | 30,354 | |
| | | | |
Indiana Finance Authority Parkview Health Project Unrefunded Bond | | | 5.50 | | | | 5-1-2024 | | | | 780,000 | | | | 789,204 | |
| | | | |
Indiana HFFA Ascension Health Subordinate Bond Credit Group SeriesA-3 | | | 1.35 | | | | 11-1-2027 | | | | 2,500,000 | | | | 2,463,575 | |
| | | | |
Knox County IN EDA Series A | | | 5.00 | | | | 4-1-2022 | | | | 925,000 | | | | 974,710 | |
| | | | |
Knox County IN EDA Series A | | | 5.00 | | | | 4-1-2023 | | | | 665,000 | | | | 702,839 | |
| | | | |
Knox County IN EDA Series A | | | 5.00 | | | | 4-1-2026 | | | | 750,000 | | | | 786,765 | |
| | | | |
| | | | | | | | | | | | | | | 5,747,447 | |
| | | | | | | | | | | | | | | | |
|
| Miscellaneous Revenue: 0.69% | |
| | | | |
Dubois IN Greater Jasper School Building Corporation First Mortgage Bond | | | 5.00 | | | | 7-15-2029 | | | | 1,500,000 | | | | 1,799,430 | |
| | | | |
Indiana Bond Bank Special Program Series A (AGM Insured) | | | 5.00 | | | | 9-1-2022 | | | | 1,545,000 | | | | 1,673,899 | |
| | | | |
Indiana Finance Authority Stadium Project Series A | | | 5.25 | | | | 2-1-2028 | | | | 2,000,000 | | | | 2,343,560 | |
| | | | |
Indianapolis IN Local Public Improvement Bond Bank Series E | | | 5.00 | | | | 1-1-2027 | | | | 760,000 | | | | 895,637 | |
| | | | |
Indianapolis IN Local Public Improvement Bond Bank Series E | | | 5.00 | | | | 1-1-2028 | | | | 1,000,000 | | | | 1,170,710 | |
| | | | |
Indianapolis IN Local Public Improvement Bond Bank Series E | | | 5.00 | | | | 1-1-2029 | | | | 735,000 | | | | 855,827 | |
| | | | |
Indianapolis IN Local Public Improvement Bond Bank Series E | | | 5.00 | | | | 1-1-2030 | | | | 1,375,000 | | | | 1,593,378 | |
| | | | |
Indianapolis IN Local Public Improvement Bond Bank Series E | | | 5.00 | | | | 1-1-2031 | | | | 1,000,000 | | | | 1,153,970 | |
| | | | |
Indianapolis IN Local Public Improvement Bond Bank Series E | | | 5.00 | | | | 1-1-2033 | | | | 1,545,000 | | | | 1,771,173 | |
| | | | |
Indianapolis IN Local Public Improvement Bond Bank Series E | | | 5.00 | | | | 1-1-2034 | | | | 2,000,000 | | | | 2,283,200 | |
| | | | |
Valparaiso IN Multi-Schools Building Corporation | | | 5.00 | | | | 7-15-2024 | | | | 750,000 | | | | 858,420 | |
| | | | |
| | | | | | | | | | | | | | | 16,399,204 | |
| | | | | | | | | | | | | | | | |
|
| Water & Sewer Revenue: 0.27% | |
| | | | |
Indiana Finance Authority First Lien Wastewater Utility Clean Water Project Series A | | | 5.00 | | | | 10-1-2030 | | | | 2,315,000 | | | | 2,612,246 | |
| | | | |
Indiana Finance Authority First Lien Wastewater Utility Clean Water Project Series A | | | 5.00 | | | | 10-1-2031 | | | | 1,035,000 | | | | 1,166,124 | |
| | | | |
Indiana Finance Authority Wastewater Utilities Clean Water Act Authority Project Series A | | | 5.25 | | | | 10-1-2038 | | | | 2,500,000 | | | | 2,680,475 | |
| | | | |
| | | | | | | | | | | | | | | 6,458,845 | |
| | | | | | | | | | | | | | | | |
| | | | |
| | | | | | | | | | | | | | | 29,628,276 | |
| | | | | | | | | | | | | | | | |
|
Iowa: 0.47% | |
|
| GO Revenue: 0.11% | |
| | | | |
Altoona IA Annual Appropriation Urban Renewal Refunding Bond | | | 5.00 | | | | 6-1-2027 | | | | 2,310,000 | | | | 2,641,300 | |
| | | | | | | | | | | | | | | | |
The accompanying notes are an integral part of these financial statements.
| | | | |
| 18 | | Wells Fargo Intermediate Tax/AMT-Free Fund | | Portfolio of investments—December 31, 2018 (unaudited) |
| | | | | | | | | | | | | | | | |
| Security name | | Interest rate | | | Maturity date | | | Principal | | | Value | |
|
| Industrial Development Revenue: 0.36% | |
| | | | |
Iowa Finance Authority Midwestern Disaster Area Project (Korea Development Bank LOC) ø | | | 2.07 | % | | | 4-1-2022 | | | $ | 8,600,000 | | | $ | 8,600,000 | |
| | | | | | | | | | | | | | | | |
| | | | |
| | | | | | | | | | | | | | | 11,241,300 | |
| | | | | | | | | | | | | | | | |
|
Kansas: 0.41% | |
|
| Health Revenue: 0.23% | |
| | | | |
Kansas Development Finance Authority Health Facilities Series F | | | 5.00 | | | | 11-15-2021 | | | | 1,300,000 | | | | 1,404,325 | |
| | | | |
University of Kansas Hospital Authority Health System (U.S. Bank NA LOC) ø | | | 1.71 | | | | 9-1-2034 | | | | 4,000,000 | | | | 4,000,000 | |
| | | | |
| | | | | | | | | | | | | | | 5,404,325 | |
| | | | | | | | | | | | | | | | |
|
| Miscellaneous Revenue: 0.12% | |
| | | | |
Kansas Development Finance Authority Agro-Defense Facility Series G | | | 5.00 | | | | 4-1-2030 | | | | 2,650,000 | | | | 2,917,359 | |
| | | | | | | | | | | | | | | | |
|
| Tax Revenue: 0.06% | |
| | | | |
Wyandotte County & Kansas City KS Special Obligation Vacation Village Project Area 4 Major Multi-Sport Athletic Complex Project CAB Series 2015 144A (z) | | | 6.86 | | | | 9-1-2034 | | | | 3,930,000 | | | | 1,439,402 | |
| | | | | | | | | | | | | | | | |
| | | | |
| | | | | | | | | | | | | | | 9,761,086 | |
| | | | | | | | | | | | | | | | |
|
Kentucky: 0.88% | |
|
| Health Revenue: 0.05% | |
| | | | |
Kentucky EDFA Catholic Health Initiative Series B2 (1 Month LIBOR +0.90%) ± | | | 2.50 | | | | 2-1-2046 | | | | 1,250,000 | | | | 1,250,363 | |
| | | | | | | | | | | | | | | | |
|
| Transportation Revenue: 0.38% | |
| | | | |
Kentucky Public Transportation Infrastructure Authority Downtown Crossing Project CAB Series B (z) | | | 4.24 | | | | 7-1-2021 | | | | 2,750,000 | | | | 2,533,163 | |
| | | | |
Kentucky Public Transportation Infrastructure Authority Downtown Crossing Project CAB Series B (z) | | | 4.28 | | | | 7-1-2020 | | | | 1,000,000 | | | | 955,490 | |
| | | | |
Kentucky Public Transportation Infrastructure Authority Downtown Crossing Project CAB Series B (z) | | | 4.59 | | | | 7-1-2022 | | | | 4,320,000 | | | | 3,835,944 | |
| | | | |
Kentucky Public Transportation Infrastructure Authority Downtown Crossing Project CAB Series B (z) | | | 5.78 | | | | 7-1-2025 | | | | 1,020,000 | | | | 772,732 | |
| | | | |
Kentucky Public Transportation Infrastructure Authority Downtown Crossing Project CAB Series B (z) | | | 6.47 | | | | 7-1-2029 | | | | 1,400,000 | | | | 877,086 | |
| | | | |
| | | | | | | | | | | | | | | 8,974,415 | |
| | | | | | | | | | | | | | | | |
|
| Utilities Revenue: 0.45% | |
| | | | |
Kentucky Public Energy Authority Gas Supply Series B | | | 4.00 | | | | 1-1-2049 | | | | 10,000,000 | | | | 10,571,300 | |
| | | | | | | | | | | | | | | | |
| | | | |
| | | | | | | | | | | | | | | 20,796,078 | |
| | | | | | | | | | | | | | | | |
|
Louisiana: 1.62% | |
|
| Airport Revenue: 0.13% | |
| | | | |
New Orleans LA Aviation Board Consolidated Rental Car Project (AGM Insured) | | | 5.00 | | | | 1-1-2035 | | | | 2,000,000 | | | | 2,257,760 | |
| | | | |
New Orleans LA Aviation Board North Terminal Project Series A | | | 5.00 | | | | 1-1-2033 | | | | 750,000 | | | | 850,785 | |
| | | | |
| | | | | | | | | | | | | | | 3,108,545 | |
| | | | | | | | | | | | | | | | |
The accompanying notes are an integral part of these financial statements.
| | | | | | |
| Portfolio of investments—December 31, 2018 (unaudited) | | Wells Fargo Intermediate Tax/AMT-Free Fund | | | 19 | |
| | | | | | | | | | | | | | | | |
| Security name | | Interest rate | | | Maturity date | | | Principal | | | Value | |
|
| Education Revenue: 0.22% | |
| | | | |
Louisiana Public Facilities Authority Loyola University Project CAB (z) | | | 1.91 | % | | | 10-1-2028 | | | $ | 2,500,000 | | | $ | 2,228,550 | |
| | | | |
Louisiana Public Facilities Authority Loyola University Project CAB (z) | | | 2.07 | | | | 10-1-2027 | | | | 3,380,000 | | | | 2,993,903 | |
| | | | |
| | | | | | | | | | | | | | | 5,222,453 | |
| | | | | | | | | | | | | | | | |
|
| Miscellaneous Revenue: 0.82% | |
| | | | |
Lafayette LA Communications System (AGM Insured) | | | 5.00 | | | | 11-1-2025 | | | | 1,500,000 | | | | 1,736,025 | |
| | | | |
Louisiana Correctional Facilities Corporation (Ambac Insured) | | | 5.00 | | | | 9-1-2019 | | | | 1,000,000 | | | | 1,020,110 | |
| | | | |
Louisiana Public Facilities Authority Archdiocese of New Orleans Project | | | 5.00 | | | | 7-1-2024 | | | | 1,000,000 | | | | 1,121,050 | |
| | | | |
Louisiana Public Facilities Authority Archdiocese of New Orleans Project | | | 5.00 | | | | 7-1-2025 | | | | 600,000 | | | | 680,172 | |
| | | | |
Louisiana Public Facilities Authority Archdiocese of New Orleans Project | | | 5.00 | | | | 7-1-2026 | | | | 500,000 | | | | 571,355 | |
| | | | |
Louisiana Unclaimed Property Special Bond1-49 South Project | | | 5.00 | | | | 9-1-2026 | | | | 2,000,000 | | | | 2,311,620 | |
| | | | |
Louisiana Unclaimed Property Special Bond1-49 South Project | | | 5.00 | | | | 9-1-2027 | | | | 2,700,000 | | | | 3,117,096 | |
| | | | |
Louisiana Unclaimed Property Special Bond1-49 South Project | | | 5.00 | | | | 9-1-2028 | | | | 2,405,000 | | | | 2,771,738 | |
| | | | |
Louisiana Unclaimed Property Special Bond1-49 South Project | | | 5.00 | | | | 9-1-2029 | | | | 2,695,000 | | | | 3,095,261 | |
| | | | |
Louisiana Unclaimed Property Special Bond1-49 South Project | | | 5.00 | | | | 9-1-2030 | | | | 2,700,000 | | | | 3,088,557 | |
| | | | |
| | | | | | | | | | | | | | | 19,512,984 | |
| | | | | | | | | | | | | | | | |
|
| Tax Revenue: 0.25% | |
| | | | |
Jefferson LA Sales Tax District Series B (AGM Insured) | | | 5.00 | | | | 12-1-2031 | | | | 1,000,000 | | | | 1,165,550 | |
| | | | |
Jefferson LA Sales Tax District Series B (AGM Insured) | | | 5.00 | | | | 12-1-2032 | | | | 1,000,000 | | | | 1,162,990 | |
| | | | |
St. Bernard Parish LA Sales Tax Refunding Bond | | | 4.00 | | | | 3-1-2023 | | | | 3,405,000 | | | | 3,605,555 | |
| | | | |
| | | | | | | | | | | | | | | 5,934,095 | |
| | | | | | | | | | | | | | | | |
|
| Transportation Revenue: 0.15% | |
| | | | |
Greater New Orleans LA Expressway Commission Toll Subordinate Lien Bond (AGM Insured) | | | 5.00 | | | | 11-1-2031 | | | | 1,000,000 | | | | 1,141,830 | |
| | | | |
Greater New Orleans LA Expressway Commission Toll Subordinate Lien Bond (AGM Insured) | | | 5.00 | | | | 11-1-2032 | | | | 1,000,000 | | | | 1,139,830 | |
| | | | |
Greater New Orleans LA Expressway Commission Toll Subordinate Lien Bond (AGM Insured) | | | 5.00 | | | | 11-1-2033 | | | | 1,000,000 | | | | 1,136,490 | |
| | | | |
| | | | | | | | | | | | | | | 3,418,150 | |
| | | | | | | | | | | | | | | | |
|
| Water & Sewer Revenue: 0.05% | |
| | | | |
Louisiana Local Government Environmental Facilities & CDA East Baton Rouge Series A | | | 5.00 | | | | 2-1-2030 | | | | 1,000,000 | | | | 1,114,460 | |
| | | | | | | | | | | | | | | | |
| | | | |
| | | | | | | | | | | | | | | 38,310,687 | |
| | | | | | | | | | | | | | | | |
|
Maine: 0.25% | |
|
| Education Revenue: 0.25% | |
| | | | |
Maine Health and HEFAR University of New England Issue Series A | | | 5.00 | | | | 7-1-2029 | | | | 1,015,000 | | | | 1,169,513 | |
| | | | |
Maine Health and HEFAR University of New England Issue Series A | | | 5.00 | | | | 7-1-2030 | | | | 1,200,000 | | | | 1,374,912 | |
| | | | |
Maine Health and HEFAR University of New England Issue Series A | | | 5.00 | | | | 7-1-2032 | | | | 1,415,000 | | | | 1,612,166 | |
| | | | |
Maine Health and HEFAR University of New England Issue Series A | | | 5.00 | | | | 7-1-2033 | | | | 1,485,000 | | | | 1,683,619 | |
| | | | |
| | | | | | | | | | | | | | | 5,840,210 | |
| | | | | | | | | | | | | | | | |
The accompanying notes are an integral part of these financial statements.
| | | | |
| 20 | | Wells Fargo Intermediate Tax/AMT-Free Fund | | Portfolio of investments—December 31, 2018 (unaudited) |
| | | | | | | | | | | | | | | | |
| Security name | | Interest rate | | | Maturity date | | | Principal | | | Value | |
|
Maryland: 2.04% | |
|
| Education Revenue: 0.14% | |
| | | | |
Maryland Economic Development Corporation Salisbury University Project | | | 5.00 | % | | | 6-1-2027 | | | $ | 500,000 | | | $ | 524,725 | |
| | | | |
Westminster MD Educational Facilities McDaniel College | | | 5.00 | | | | 11-1-2026 | | | | 2,450,000 | | | | 2,760,366 | |
| | | | |
| | | | | | | | | | | | | | | 3,285,091 | |
| | | | | | | | | | | | | | | | |
|
| GO Revenue: 1.70% | |
| | | | |
Maryland Series B | | | 4.00 | | | | 8-1-2023 | | | | 5,000,000 | | | | 5,439,900 | |
| | | | |
Maryland Series B | | | 4.00 | | | | 8-1-2024 | | | | 15,000,000 | | | | 16,525,800 | |
| | | | |
Maryland Series C | | | 5.00 | | | | 8-1-2022 | | | | 2,975,000 | | | | 3,296,836 | |
| | | | |
Prince Georges County MD Consolidated Public Improvement Bonds Series C | | | 4.00 | | | | 8-1-2027 | | | | 6,000,000 | | | | 6,451,500 | |
| | | | |
Prince Georges County MD Consolidated Public Improvement Bonds Series C | | | 4.00 | | | | 8-1-2029 | | | | 8,000,000 | | | | 8,544,480 | |
| | | | |
| | | | | | | | | | | | | | | 40,258,516 | |
| | | | | | | | | | | | | | | | |
|
| Miscellaneous Revenue: 0.14% | |
| | | | |
Maryland CDA Local Government Infrastructure Bond SeriesA-2 | | | 2.00 | | | | 6-1-2022 | | | | 460,000 | | | | 458,790 | |
| | | | |
Prince Georges County MD Upper Marlboro Courthouse Project Series A | | | 5.00 | | | | 5-1-2028 | | | | 1,215,000 | | | | 1,461,803 | |
| | | | |
Prince Georges County MD Upper Marlboro Courthouse Project Series A | | | 5.00 | | | | 5-1-2029 | | | | 1,275,000 | | | | 1,525,793 | |
| | | | |
| | | | | | | | | | | | | | | 3,446,386 | |
| | | | | | | | | | | | | | | | |
|
| Tax Revenue: 0.06% | |
| | | | |
Howard County MD Downtown Columbia Project Series A 144A | | | 4.00 | | | | 2-15-2028 | | | | 500,000 | | | | 504,925 | |
| | | | |
Howard County MD Downtown Columbia Project Series A 144A | | | 4.13 | | | | 2-15-2034 | | | | 1,000,000 | | | | 981,750 | |
| | | | |
| | | | | | | | | | | | | | | 1,486,675 | |
| | | | | | | | | | | | | | | | |
| | | | |
| | | | | | | | | | | | | | | 48,476,668 | |
| | | | | | | | | | | | | | | | |
|
Massachusetts: 1.62% | |
|
| Education Revenue: 0.23% | |
| | | | |
Massachusetts Development Finance Agency Lasell College | | | 5.00 | | | | 7-1-2021 | | | | 1,780,000 | | | | 1,846,323 | |
| | | | |
Massachusetts Development Finance Agency Merrimack College Series A | | | 5.00 | | | | 7-1-2021 | | | | 1,035,000 | | | | 1,096,169 | |
| | | | |
Massachusetts Development Finance Agency Sabis International Charter Series A | | | 6.55 | | | | 4-15-2020 | | | | 615,000 | | | | 637,847 | |
| | | | |
Massachusetts HEFA Harvard University Series A | | | 5.00 | | | | 12-15-2029 | | | | 1,890,000 | | | | 1,947,418 | |
| | | | |
| | | | | | | | | | | | | | | 5,527,757 | |
| | | | | | | | | | | | | | | | |
|
| GO Revenue: 0.85% | |
| | | | |
Boston MA Series A | | | 4.00 | | | | 4-1-2031 | | | | 1,500,000 | | | | 1,638,585 | |
| | | | |
Boston MA Series A | | | 5.00 | | | | 4-1-2026 | | | | 5,790,000 | | | | 6,789,875 | |
| | | | |
Massachusetts Consolidated Loan Series D | | | 5.00 | | | | 9-1-2028 | | | | 10,000,000 | | | | 11,618,200 | |
| | | | |
| | | | | | | | | | | | | | | 20,046,660 | |
| | | | | | | | | | | | | | | | |
|
| Miscellaneous Revenue: 0.54% | |
| | | | |
Massachusetts Consolidated Loan Series D | | | 1.05 | | | | 8-1-2043 | | | | 10,000,000 | | | | 9,847,800 | |
| | | | |
Massachusetts Consolidated Loan Series I | | | 5.00 | | | | 12-1-2030 | | | | 2,570,000 | | | | 3,016,460 | |
| | | | |
| | | | | | | | | | | | | | | 12,864,260 | |
| | | | | | | | | | | | | | | | |
| | | | |
| | | | | | | | | | | | | | | 38,438,677 | |
| | | | | | | | | | | | | | | | |
The accompanying notes are an integral part of these financial statements.
| | | | | | |
| Portfolio of investments—December 31, 2018 (unaudited) | | Wells Fargo Intermediate Tax/AMT-Free Fund | | | 21 | |
| | | | | | | | | | | | | | | | |
| Security name | | Interest rate | | | Maturity date | | | Principal | | | Value | |
|
Michigan: 2.80% | |
|
| Airport Revenue: 0.07% | |
| | | | |
Wayne County MI Airport Authority Detroit Metropolitan Bond Series A | | | 5.00 | % | | | 12-1-2032 | | | $ | 800,000 | | | $ | 919,552 | |
| | | | |
Wayne County MI Airport Authority Detroit Metropolitan Bond Series A | | | 5.00 | | | | 12-1-2034 | | | | 600,000 | | �� | | 688,152 | |
| | | | |
| | | | | | | | | | | | | | | 1,607,704 | |
| | | | | | | | | | | | | | | | |
|
| Education Revenue: 0.34% | |
| | | | |
Flint MI International Academy | | | 5.38 | | | | 10-1-2022 | | | | 1,870,000 | | | | 1,870,524 | |
| | | | |
Flint MI International Academy | | | 5.50 | | | | 10-1-2027 | | | | 1,985,000 | | | | 1,984,901 | |
| | | | |
Michigan Finance Authority Limited Obligation Public School Academy Cesar Chavez Academy Project | | | 5.00 | | | | 2-1-2022 | | | | 1,600,000 | | | | 1,612,800 | |
| | | | |
Western Michigan University Board of Trustees | | | 5.25 | | | | 11-15-2027 | | | | 600,000 | | | | 677,202 | |
| | | | |
Western Michigan University Board of Trustees | | | 5.25 | | | | 11-15-2029 | | | | 1,000,000 | | | | 1,126,710 | |
| | | | |
Western Michigan University Board of Trustees (AGM Insured) | | | 5.25 | | | | 11-15-2033 | | | | 750,000 | | | | 845,400 | |
| | | | |
| | | | | | | | | | | | | | | 8,117,537 | |
| | | | | | | | | | | | | | | | |
|
| GO Revenue: 0.51% | |
| | | | |
Eaton Rapids MI Public Schools (Qualified School Board Loan Fund Insured) | | | 5.00 | | | | 5-1-2022 | | | | 1,785,000 | | | | 1,954,111 | |
| | | | |
Hazel Park MI School District (AGM/Qualified School Board Loan Fund Insured) | | | 5.00 | | | | 5-1-2020 | | | | 1,160,000 | | | | 1,208,766 | |
| | | | |
Kent County MI | | | 5.00 | | | | 1-1-2025 | | | | 1,000,000 | | | | 1,000,000 | |
| | | | |
Kent County MI Limited Tax Capital Improvement Bond | | | 5.00 | | | | 6-1-2030 | | | | 1,040,000 | | | | 1,211,818 | |
| | | | |
Pinckney MI Community School District (Qualified School Board Loan Fund Insured) | | | 5.00 | | | | 5-1-2025 | | | | 2,040,000 | | | | 2,298,284 | |
| | | | |
Pinckney MI Community School District (Qualified School Board Loan Fund Insured) | | | 5.00 | | | | 5-1-2026 | | | | 2,505,000 | | | | 2,810,184 | |
| | | | |
Southfield MI 2015 Street Improvement | | | 4.00 | | | | 5-1-2025 | | | | 1,490,000 | | | | 1,627,318 | |
| | | | |
| | | | | | | | | | | | | | | 12,110,481 | |
| | | | | | | | | | | | | | | | |
|
| Health Revenue: 0.33% | |
| | | | |
Michigan Finance Authority Sparrow Obligated Group | | | 5.00 | | | | 11-15-2023 | | | | 400,000 | | | | 441,600 | |
| | | | |
Michigan Finance Authority Sparrow Obligated Group | | | 5.00 | | | | 11-15-2026 | | | | 800,000 | | | | 877,592 | |
| | | | |
Michigan Hospital Finance Authority Ascension Health Senior Credit GroupSeries F-2 | | | 1.90 | | | | 11-15-2047 | | | | 6,570,000 | | | | 6,516,980 | |
| | | | |
| | | | | | | | | | | | | | | 7,836,172 | |
| | | | | | | | | | | | | | | | |
|
| Miscellaneous Revenue: 0.43% | |
| | | | |
Macomb MI Interceptor Drainage | | | 5.00 | | | | 5-1-2024 | | | | 1,750,000 | | | | 1,819,808 | |
| | | | |
Macomb MI Interceptor Drainage | | | 5.00 | | | | 5-1-2025 | | | | 1,750,000 | | | | 1,819,808 | |
| | | | |
Macomb MI Interceptor Drainage | | | 5.00 | | | | 5-1-2026 | | | | 1,930,000 | | | | 2,006,988 | |
| | | | |
Michigan Strategic Fund Limited Obligation Cadillac Place Office Building Project | | | 5.25 | | | | 10-15-2025 | | | | 4,165,000 | | | | 4,529,562 | |
| | | | |
| | | | | | | | | | | | | | | 10,176,166 | |
| | | | | | | | | | | | | | | | |
|
| Tax Revenue: 0.13% | |
| | | | |
Michigan Finance Authority Local Government Loan Program Series F | | | 4.00 | | | | 10-1-2024 | | | | 3,000,000 | | | | 3,158,730 | |
| | | | | | | | | | | | | | | | |
|
| Water & Sewer Revenue: 0.99% | |
| | | | |
Great Lakes MI Water Authority Sewage Disposal System Series C | | | 5.00 | | | | 7-1-2030 | | | | 3,350,000 | | | | 3,832,936 | |
| | | | |
Michigan Finance Authority Local Government Loan Program Series D (National Insured) | | | 5.00 | | | | 7-1-2025 | | | | 1,000,000 | | | | 1,125,960 | |
| | | | |
Michigan Finance Authority Local Government Loan Program Series D | | | 5.00 | | | | 7-1-2030 | | | | 12,000,000 | | | | 13,265,040 | |
The accompanying notes are an integral part of these financial statements.
| | | | |
| 22 | | Wells Fargo Intermediate Tax/AMT-Free Fund | | Portfolio of investments—December 31, 2018 (unaudited) |
| | | | | | | | | | | | | | | | |
| Security name | | Interest rate | | | Maturity date | | | Principal | | | Value | |
|
| Water & Sewer Revenue(continued) | |
| | | | |
Michigan Finance Authority Local Government Loan Program Series D (AGM Insured) | | | 5.00 | % | | | 7-1-2035 | | | $ | 2,750,000 | | | $ | 3,029,620 | |
| | | | |
Michigan Finance Authority Local Government Loan Program Series D (AGM Insured) | | | 5.00 | | | | 7-1-2037 | | | | 2,000,000 | | | | 2,195,920 | |
| | | | |
| | | | | | | | | | | | | | | 23,449,476 | |
| | | | | | | | | | | | | | | | |
| | | | |
| | | | | | | | | | | | | | | 66,456,266 | |
| | | | | | | | | | | | | | | | |
|
Minnesota: 0.12% | |
|
| Miscellaneous Revenue: 0.12% | |
| | | | |
Minneapolis & St. Paul MN Housing & RDA Children’s Hospital Clinics Series A (AGM Insured, U.S. Bank NA SPA) | | | 1.65 | | | | 8-15-2037 | | | | 2,725,000 | | | | 2,725,000 | |
| | | | | | | | | | | | | | | | |
|
Mississippi: 1.61% | |
|
| GO Revenue: 0.04% | |
| | | | |
Mississippi Development Bank Special Obligation Jackson Public School District Project Series A | | | 5.00 | | | | 4-1-2020 | | | | 1,000,000 | | | | 1,036,410 | |
| | | | | | | | | | | | | | | | |
|
| Industrial Development Revenue: 0.93% | |
| | | | |
Mississippi Business Finance Commission Gulf Opportunity Zone Chevron USA Incorporated Project Series A ø | | | 1.67 | | | | 12-1-2030 | | | | 22,000,000 | | | | 22,000,000 | |
| | | | | | | | | | | | | | | | |
|
| Miscellaneous Revenue: 0.46% | |
| | | | |
Mississippi Development Bank Special Obligation Jackson Water & Sewer System Project Series A (AGM Insured) | | | 5.00 | | | | 9-1-2030 | | | | 10,000,000 | | | | 10,785,400 | |
| | | | | | | | | | | | | | | | |
|
| Water & Sewer Revenue: 0.18% | |
| | | | |
Mississippi Development Bank Special Obligation Jackson Water & Sewer System Project (AGM Insured) | | | 6.00 | | | | 12-1-2023 | | | | 1,145,000 | | | | 1,320,517 | |
| | | | |
West Rankin MS Utility Authority Series 2018 (AGM Insured) | | | 5.00 | | | | 1-1-2026 | | | | 525,000 | | | | 602,049 | |
| | | | |
West Rankin MS Utility Authority Series 2018 (AGM Insured) | | | 5.00 | | | | 1-1-2027 | | | | 435,000 | | | | 497,275 | |
| | | | |
West Rankin MS Utility Authority Series 2018 (AGM Insured) | | | 5.00 | | | | 1-1-2034 | | | | 750,000 | | | | 840,908 | |
| | | | |
West Rankin MS Utility Authority Series 2018 (AGM Insured) | | | 5.00 | | | | 1-1-2035 | | | | 1,000,000 | | | | 1,118,870 | |
| | | | |
| | | | | | | | | | | | | | | 4,379,619 | |
| | | | | | | | | | | | | | | | |
| | | | |
| | | | | | | | | | | | | | | 38,201,429 | |
| | | | | | | | | | | | | | | | |
|
Missouri: 0.44% | |
|
| Airport Revenue: 0.02% | |
| | | | |
St. Louis MO Lambert St. Louis International Airport SeriesA-1 | | | 6.00 | | | | 7-1-2019 | | | | 415,000 | | | | 423,333 | |
| | | | | | | | | | | | | | | | |
|
| Education Revenue: 0.10% | |
| | | | |
Missouri HEFA Webster University Project | | | 5.00 | | | | 4-1-2027 | | | | 2,155,000 | | | | 2,432,370 | |
| | | | | | | | | | | | | | | | |
|
| GO Revenue: 0.06% | |
| | | | |
Belton MO School District #124 Missouri Direct Deposit Program Project | | | 5.00 | | | | 3-1-2026 | | | | 750,000 | | | | 884,603 | |
| | | | |
Belton MO School District #124 Missouri Direct Deposit Program Project | | | 5.50 | | | | 3-1-2029 | | | | 400,000 | | | | 492,060 | |
| | | | |
| | | | | | | | | | | | | | | 1,376,663 | |
| | | | | | | | | | | | | | | | |
The accompanying notes are an integral part of these financial statements.
| | | | | | |
| Portfolio of investments—December 31, 2018 (unaudited) | | Wells Fargo Intermediate Tax/AMT-Free Fund | | | 23 | |
| | | | | | | | | | | | | | | | |
| Security name | | Interest rate | | | Maturity date | | | Principal | | | Value | |
|
| Miscellaneous Revenue: 0.26% | |
| | | | |
Kansas City MO Municipal Assistance Corporation CAB Series B-1 (Ambac Insured) (z) | | | 3.19 | % | | | 4-15-2022 | | | $ | 3,640,000 | | | $ | 3,342,903 | |
| | | | |
Poplar Bluff MO School District (AGM Insured) | | | 5.00 | | | | 3-1-2032 | | | | 1,500,000 | | | | 1,672,770 | |
| | | | |
Poplar Bluff MO School District (AGM Insured) | | | 5.00 | | | | 3-1-2034 | | | | 1,000,000 | | | | 1,110,080 | |
| | | | |
| | | | | | | | | | | | | | | 6,125,753 | |
| | | | | | | | | | | | | | | | |
|
| Tax Revenue: 0.00% | |
| | | | |
Manchester MO Highway 141 Manchester Road Project | | | 6.00 | | | | 11-1-2025 | | | | 115,000 | | | | 113,975 | |
| | | | | | | | | | | | | | | | |
| | | | |
| | | | | | | | | | | | | | | 10,472,094 | |
| | | | | | | | | | | | | | | | |
|
Nebraska: 0.22% | |
|
| Health Revenue: 0.05% | |
| | | | |
Lincoln County NE Hospital Authority Great Plains Regional Medical Center | | | 5.00 | | | | 11-1-2024 | | | | 1,000,000 | | | | 1,071,770 | |
| | | | | | | | | | | | | | | | |
|
| Utilities Revenue: 0.17% | |
| | | | |
Municipal Energy Agency of Nebraska Series A (BHAC Insured) | | | 5.00 | | | | 4-1-2019 | | | | 500,000 | | | | 503,980 | |
| | | | |
Nebraska Central Plains Energy Gas Project #3 | | | 5.00 | | | | 9-1-2027 | | | | 1,290,000 | | | | 1,378,313 | |
| | | | |
Nebraska Central Plains Energy Gas Project #4 | | | 5.00 | | | | 3-1-2050 | | | | 2,000,000 | | | | 2,180,320 | |
| | | | |
| | | | | | | | | | | | | | | 4,062,613 | |
| | | | | | | | | | | | | | | | |
| | | | |
| | | | | | | | | | | | | | | 5,134,383 | |
| | | | | | | | | | | | | | | | |
|
Nevada: 1.57% | |
|
| Airport Revenue: 0.36% | |
| | | | |
Clark County NV Airport Series C (AGM Insured) | | | 5.00 | | | | 7-1-2023 | | | | 5,600,000 | | | | 5,682,264 | |
| | | | |
Clark County NV Airport Series D | | | 5.00 | | | | 7-1-2024 | | | | 2,750,000 | | | | 2,828,073 | |
| | | | |
| | | | | | | | | | | | | | | 8,510,337 | |
| | | | | | | | | | | | | | | | |
|
| GO Revenue: 1.12% | |
| | | | |
Clark County NV Refunding Bond | | | 5.00 | | | | 6-1-2030 | | | | 3,905,000 | | | | 4,612,117 | |
| | | | |
Clark County NV Refunding Bond Series B | | | 5.00 | | | | 11-1-2028 | | | | 5,000,000 | | | | 5,895,200 | |
| | | | |
Clark County NV Stadium Improvement Bond Series A | | | 5.00 | | | | 6-1-2032 | | | | 1,615,000 | | | | 1,917,409 | |
| | | | |
Clark County NV Water Reclamation District | | | 5.00 | | | | 7-1-2027 | | | | 4,155,000 | | | | 4,828,193 | |
| | | | |
Clark County NV Water Reclamation District Series A | | | 5.25 | | | | 7-1-2038 | | | | 2,880,000 | | | | 2,930,256 | |
| | | | |
Las Vegas NV Series A | | | 5.00 | | | | 5-1-2031 | | | | 1,985,000 | | | | 2,239,477 | |
| | | | |
Las Vegas NV Valley Water District Series A | | | 4.00 | | | | 6-1-2028 | | | | 1,665,000 | | | | 1,811,037 | |
| | | | |
Las Vegas NV Valley Water District Series B | | | 5.00 | | | | 6-1-2030 | | | | 1,945,000 | | | | 2,266,333 | |
| | | | |
| | | | | | | | | | | | | | | 26,500,022 | |
| | | | | | | | | | | | | | | | |
|
| Miscellaneous Revenue: 0.09% | |
| | | | |
Las Vegas NV Special Improvement District #607 | | | 4.00 | | | | 6-1-2019 | | | | 645,000 | | | | 647,619 | |
| | | | |
Las Vegas NV Special Improvement District #607 | | | 4.00 | | | | 6-1-2020 | | | | 540,000 | | | | 547,171 | |
| | | | |
Las Vegas NV Special Improvement District #607 | | | 4.00 | | | | 6-1-2021 | | | | 700,000 | | | | 713,209 | |
| | | | |
Las Vegas NV Special Improvement District #607 | | | 4.25 | | | | 6-1-2024 | | | | 200,000 | | | | 203,282 | |
| | | | |
| | | | | | | | | | | | | | | 2,111,281 | |
| | | | | | | | | | | | | | | | |
| | | | |
| | | | | | | | | | | | | | | 37,121,640 | |
| | | | | | | | | | | | | | | | |
The accompanying notes are an integral part of these financial statements.
| | | | |
| 24 | | Wells Fargo Intermediate Tax/AMT-Free Fund | | Portfolio of investments—December 31, 2018 (unaudited) |
| | | | | | | | | | | | | | | | |
| Security name | | Interest rate | | | Maturity date | | | Principal | | | Value | |
|
New Hampshire: 0.04% | |
|
| Housing Revenue: 0.04% | |
| | | | |
New Hampshire HFA Single Family Mortgage Acquisition Series E & F | | | 4.80 | % | | | 7-1-2028 | | | $ | 950,000 | | | $ | 954,427 | |
| | | | | | | | | | | | | | | | |
|
New Jersey: 3.76% | |
|
| Airport Revenue: 0.20% | |
| | | | |
South Jersey NJ Port Corporation Marine Terminal Refunding Bond Series S | | | 5.00 | | | | 1-1-2028 | | | | 2,130,000 | | | | 2,389,839 | |
| | | | |
South Jersey NJ Port Corporation Marine Terminal Refunding Bond Series S | | | 5.00 | | | | 1-1-2029 | | | | 2,200,000 | | | | 2,456,630 | |
| | | | |
| | | | | | | | | | | | | | | 4,846,469 | |
| | | | | | | | | | | | | | | | |
|
| Education Revenue: 0.42% | |
| | | | |
New Jersey HEFAR Student Assistance Authority Series A | | | 5.00 | | | | 6-1-2019 | | | | 9,860,000 | | | | 9,973,291 | |
| | | | | | | | | | | | | | | | |
|
| GO Revenue: 0.50% | |
| | | | |
Montclair NJ School Refunding Bond Series B | | | 4.00 | | | | 3-1-2026 | | | | 500,000 | | | | 560,020 | |
| | | | |
Trenton City NJ (Build America Mutual Assurance Company Insured) | | | 5.00 | | | | 12-1-2022 | | | | 1,630,000 | | | | 1,784,084 | |
| | | | |
Trenton City NJ (Build America Mutual Assurance Company Insured) | | | 5.00 | | | | 12-1-2024 | | | | 1,775,000 | | | | 1,999,733 | |
| | | | |
Trenton City NJ (Build America Mutual Assurance Company Insured) | | | 5.00 | | | | 12-1-2025 | | | | 1,860,000 | | | | 2,117,963 | |
| | | | |
Trenton City NJ (Build America Mutual Assurance Company Insured) | | | 5.00 | | | | 12-1-2026 | | | | 1,000,000 | | | | 1,159,820 | |
| | | | |
Union County NJ General Improvement Bond | | | 3.00 | | | | 3-1-2026 | | | | 4,165,000 | | | | 4,304,902 | |
| | | | |
| | | | | | | | | | | | | | | 11,926,522 | |
| | | | | | | | | | | | | | | | |
|
| Miscellaneous Revenue: 2.08% | |
| | | | |
Essex County NJ Import Authority Series A | | | 6.00 | | | | 11-1-2025 | | | | 5,000,000 | | | | 5,240,900 | |
| | | | |
New Jersey EDA Motor Vehicle Surcharges Prerefunded Bond Series A (National Insured) | | | 5.25 | | | | 7-1-2026 | | | | 540,000 | | | | 651,980 | |
| | | | |
New Jersey EDA Motor Vehicle Surcharges Series A | | | 3.13 | | | | 7-1-2029 | | | | 1,000,000 | | | | 1,000,070 | |
| | | | |
New Jersey EDA Motor Vehicle Surcharges Series A | | | 5.00 | | | | 7-1-2033 | | | | 2,500,000 | | | | 2,693,475 | |
| | | | |
New Jersey EDA Motor Vehicle Surcharges Unrefunded Bond Series A (National Insured) | | | 5.25 | | | | 7-1-2026 | | | | 2,320,000 | | | | 2,664,659 | |
| | | | |
New Jersey EDA School Facilities Construction Refunding Bond Series NN | | | 5.00 | | | | 3-1-2021 | | | | 4,315,000 | | | | 4,532,994 | |
| | | | |
New Jersey EDA School Facilities Construction Refunding Bond Series NN | | | 5.00 | | | | 3-1-2023 | | | | 3,000,000 | | | | 3,253,740 | |
| | | | |
New Jersey EDA School Facilities Construction Refunding Bond Series NN | | | 5.00 | | | | 3-1-2026 | | | | 9,830,000 | | | | 10,549,458 | |
| | | | |
New Jersey EDA Series XX | | | 5.00 | | | | 6-15-2022 | | | | 5,020,000 | | | | 5,394,392 | |
| | | | |
New Jersey Educational Facilities Authority | | | 5.00 | | | | 6-15-2026 | | | | 3,015,000 | | | | 3,282,822 | |
| | | | |
New Jersey Sports & Exposition Authority (National Insured) | | | 5.50 | | | | 3-1-2022 | | | | 1,755,000 | | | | 1,945,628 | |
| | | | |
New Jersey TTFA Series A | | | 5.00 | | | | 6-15-2020 | | | | 4,000,000 | | | | 4,150,200 | |
| | | | |
New Jersey TTFA Series A | | | 5.25 | | | | 6-15-2024 | | | | 1,695,000 | | | | 1,795,530 | |
| | | | |
New Jersey TTFA Series A | | | 5.25 | | | | 6-15-2025 | | | | 2,000,000 | | | | 2,115,220 | |
| | | | |
| | | | | | | | | | | | | | | 49,271,068 | |
| | | | | | | | | | | | | | | | |
|
| Tobacco Revenue: 0.11% | |
| | | | |
New Jersey EDA Cigarette Tax Refunding Bond | | | 5.00 | | | | 6-15-2021 | | | | 2,500,000 | | | | 2,646,375 | |
| | | | | | | | | | | | | | | | |
|
| Transportation Revenue: 0.45% | |
| | | | |
New Jersey TTFA Series A | | | 5.25 | | | | 12-15-2020 | | | | 1,305,000 | | | | 1,376,188 | |
| | | | |
New Jersey TTFA Series C | | | 5.25 | | | | 6-15-2032 | | | | 2,500,000 | | | | 2,703,825 | |
| | | | |
New Jersey TTFA Unrefunded Balance Bond (National Insured) | | | 5.25 | | | | 12-15-2021 | | | | 6,000,000 | | | | 6,469,920 | |
| | | | |
| | | | | | | | | | | | | | | 10,549,933 | |
| | | | | | | | | | | | | | | | |
| | | | |
| | | | | | | | | | | | | | | 89,213,658 | |
| | | | | | | | | | | | | | | | |
The accompanying notes are an integral part of these financial statements.
| | | | | | |
| Portfolio of investments—December 31, 2018 (unaudited) | | Wells Fargo Intermediate Tax/AMT-Free Fund | | | 25 | |
| | | | | | | | | | | | | | | | |
| Security name | | Interest rate | | | Maturity date | | | Principal | | | Value | |
|
New Mexico: 0.71% | |
|
| GO Revenue: 0.14% | |
| | | | |
Albuquerque, Bernalillo & Sandoval Counties NM Municipal School District #12 | | | 5.00 | % | | | 8-1-2025 | | | $ | 400,000 | | | $ | 469,036 | |
| | | | |
Albuquerque, Bernalillo & Sandoval Counties NM Municipal School District #12 | | | 5.00 | | | | 8-1-2026 | | | | 1,205,000 | | | | 1,431,889 | |
| | | | |
Albuquerque, Bernalillo & Sandoval Counties NM Municipal School District #12 | | | 5.00 | | | | 8-1-2034 | | | | 1,150,000 | | | | 1,360,174 | |
| | | | |
| | | | | | | | | | | | | | | 3,261,099 | |
| | | | | | | | | | | | | | | | |
|
| Housing Revenue: 0.04% | |
| | | | |
New Mexico Mortgage Finance Authority SFMR Class I Series A (GNMA/FNMA/FHLMC Insured) | | | 4.63 | | | | 9-1-2025 | | | | 795,000 | | | | 806,058 | |
| | | | |
New Mexico Mortgage Finance Authority SFMR Class I Series B (GNMA/FNMA/FHLMC Insured) | | | 5.00 | | | | 3-1-2028 | | | | 285,000 | | | | 295,331 | |
| | | | |
| | | | | | | | | | | | | | | 1,101,389 | |
| | | | | | | | | | | | | | | | |
|
| Miscellaneous Revenue: 0.48% | |
| | | | |
Clayton NM Jail Project Improvement & Refunding Bond (National Insured) | | | 5.00 | | | | 11-1-2028 | | | | 9,265,000 | | | | 10,316,300 | |
| | | | |
Clayton NM Jail Project Improvement & Refunding Bond (National Insured) | | | 5.00 | | | | 11-1-2029 | | | | 1,000,000 | | | | 1,108,930 | |
| | | | |
| | | | | | | | | | | | | | | 11,425,230 | |
| | | | | | | | | | | | | | | | |
|
| Water & Sewer Revenue: 0.05% | |
| | | | |
Albuquerque & Bernalillo Counties NM Water Utility Authority Series B | | | 5.00 | | | | 7-1-2024 | | | | 1,000,000 | | | | 1,146,390 | |
| | | | | | | | | | | | | | | | |
| | | | |
| | | | | | | | | | | | | | | 16,934,108 | |
| | | | | | | | | | | | | | | | |
|
New York: 9.51% | |
|
| Airport Revenue: 0.13% | |
| | | | |
Port Authority New York & New Jersey Special Obligation | | | 5.00 | | | | 12-1-2020 | | | | 3,070,000 | | | | 3,200,045 | |
| | | | | | | | | | | | | | | | |
|
| Education Revenue: 0.79% | |
| | | | |
Dutchess County NY Local Development Corporation The Culinary Institute of America Project SeriesA-1 | | | 5.00 | | | | 7-1-2027 | | | | 335,000 | | | | 380,393 | |
| | | | |
Dutchess County NY Local Development Corporation The Culinary Institute of America Project SeriesA-1 | | | 5.00 | | | | 7-1-2030 | | | | 365,000 | | | | 408,986 | |
| | | | |
Hempstead Town NY Local Development Corporation The Academy Charter School Project Series A | | | 5.89 | | | | 2-1-2032 | | | | 2,745,000 | | | | 2,566,740 | |
| | | | |
Hempstead Town NY Local Development Corporation The Academy Charter School Project Series A | | | 6.24 | | | | 2-1-2047 | | | | 1,750,000 | | | | 1,585,430 | |
| | | | |
Hempstead Town NY Local Development Corporation The Academy Charter School Project Series A | | | 7.65 | | | | 2-1-2044 | | | | 2,720,000 | | | | 2,780,194 | |
| | | | |
Monroe County NY Industrial Development Monroe Community College Project Series A (AGM Insured) | | | 5.00 | | | | 1-15-2022 | | | | 790,000 | | | | 853,595 | |
| | | | |
Monroe County NY Industrial Development Monroe Community College Project Series A (AGM Insured) | | | 5.00 | | | | 1-15-2023 | | | | 645,000 | | | | 710,403 | |
| | | | |
Monroe County NY Industrial Development Monroe Community College Project Series A (AGM Insured) | | | 5.00 | | | | 1-15-2024 | | | | 905,000 | | | | 1,014,559 | |
| | | | |
Monroe County NY Industrial Development St. John Fisher College Project Series A | | | 5.00 | | | | 6-1-2020 | | | | 2,125,000 | | | | 2,215,653 | |
| | | | |
New York Dormitory Authority Mount Sinai School of Medicine | | | 5.50 | | | | 7-1-2022 | | | | 2,000,000 | | | | 2,036,960 | |
| | | | |
Niagara NY Area Development Corporation | | | 5.00 | | | | 5-1-2020 | | | | 1,160,000 | | | | 1,204,405 | |
| | | | |
Niagara NY Area Development Corporation | | | 5.00 | | | | 5-1-2022 | | | | 1,350,000 | | | | 1,469,259 | |
| | | | |
Troy NY Capital Resource Corporation Rensselaer Polytechnic Series B | | | 5.00 | | | | 9-1-2020 | | | | 1,430,000 | | | | 1,499,226 | |
| | | | |
| | | | | | | | | | | | | | | 18,725,803 | |
| | | | | | | | | | | | | | | | |
The accompanying notes are an integral part of these financial statements.
| | | | |
| 26 | | Wells Fargo Intermediate Tax/AMT-Free Fund | | Portfolio of investments—December 31, 2018 (unaudited) |
| | | | | | | | | | | | | | | | |
| Security name | | Interest rate | | | Maturity date | | | Principal | | | Value | |
|
| GO Revenue: 1.29% | |
| | | | |
Hempstead Town Nassau County NY Public Improvement Series A | | | 4.00 | % | | | 6-15-2028 | | | $ | 5,000,000 | | | $ | 5,481,900 | |
| | | | |
Nassau County NY | | | 5.00 | | | | 10-1-2024 | | | | 7,965,000 | | | | 9,101,924 | |
| | | | |
New York NY Series B | | | 5.00 | | | | 12-1-2032 | | | | 2,000,000 | | | | 2,314,860 | |
| | | | |
New York NY Series C | | | 5.00 | | | | 8-1-2031 | | | | 5,000,000 | | | | 5,652,500 | |
| | | | |
New York NY Series I (State Street Bank & Trust Company SPA) ø | | | 1.73 | | | | 4-1-2036 | | | | 5,860,000 | | | | 5,860,000 | |
| | | | |
Suffolk NY Public Improvement Serial Bond Series A (AGM Insured) | | | 3.00 | | | | 6-1-2019 | | | | 1,180,000 | | | | 1,185,806 | |
| | | | |
Yonkers NY Series A (AGM Insured) | | | 5.00 | | | | 10-1-2024 | | | | 1,000,000 | | | | 1,086,690 | |
| | | | |
| | | | | | | | | | | | | | | 30,683,680 | |
| | | | | | | | | | | | | | | | |
|
| Miscellaneous Revenue: 0.54% | |
| | | | |
New York Dormitory Authority Non State Supported Debt Prerefunded Bond | | | 4.00 | | | | 7-1-2019 | | | | 70,000 | | | | 70,000 | |
| | | | |
New York Dormitory Authority Non State Supported Debt Unrefunded Bond | | | 4.00 | | | | 7-1-2019 | | | | 670,000 | | | | 677,156 | |
| | | | |
New York Dormitory Authority Series D | | | 5.00 | | | | 10-1-2031 | | | | 2,005,000 | | | | 2,351,745 | |
| | | | |
New York Dormitory Authority State University Educational Facilities Series A | | | 5.50 | | | | 5-15-2019 | | | | 1,235,000 | | | | 1,252,414 | |
| | | | |
New York NY Transitional Finance Authority Building Aid Bond SeriesS-1 | | | 5.00 | | | | 7-15-2032 | | | | 2,500,000 | | | | 2,906,650 | |
| | | | |
New York NY Trust for Cultural Resources SeriesA-1 | | | 5.00 | | | | 7-1-2031 | | | | 2,475,000 | | | | 2,606,522 | |
| | | | |
New York Urban Development Corporation Series D (AGC Insured) | | | 5.50 | | | | 1-1-2019 | | | | 3,000,000 | | | | 3,000,000 | |
| | | | |
| | | | | | | | | | | | | | | 12,864,487 | |
| | | | | | | | | | | | | | | | |
|
| Tax Revenue: 2.89% | |
| | | | |
New York Convention Center Development Corporation | | | 5.00 | | | | 11-15-2028 | | | | 8,000,000 | | | | 9,243,600 | |
| | | | |
New York Dormitory Authority Series A | | | 5.00 | | | | 3-15-2028 | | | | 5,000,000 | | | | 5,747,700 | |
| | | | |
New York Dormitory Authority Series A | | | 5.00 | | | | 2-15-2031 | | | | 3,000,000 | | | | 3,474,300 | |
| | | | |
New York Dormitory Authority Series B (Ambac Insured) | | | 5.50 | | | | 3-15-2025 | | | | 3,885,000 | | | | 4,621,635 | |
| | | | |
New York Dormitory Authority Series E | | | 5.00 | | | | 3-15-2035 | | | | 15,000,000 | | | | 17,590,800 | |
| | | | |
New York Metropolitan Transportation Authority Dedicated Tax Fund Series A | | | 5.00 | | | | 11-15-2024 | | | | 6,010,000 | | | | 6,670,439 | |
| | | | |
New York NY Transitional Finance Authority Prerefunded Balance Bond Series A | | | 5.00 | | | | 5-1-2023 | | | | 2,875,000 | | | | 2,906,740 | |
| | | | |
New York NY Transitional Finance Authority Series B | | | 5.00 | | | | 8-1-2027 | | | | 1,115,000 | | | | 1,269,851 | |
| | | | |
New York NY Transitional Finance Authority Series C | | | 5.00 | | | | 11-1-2027 | | | | 5,000,000 | | | | 5,771,500 | |
| | | | |
New York NY Transitional Finance Authority Subordinate Bond SeriesB-1 | | | 5.00 | | | | 11-1-2028 | | | | 1,000,000 | | | | 1,160,760 | |
| | | | |
New York Urban Development Corporation Personal Income Tax Series A | | | 5.00 | | | | 3-15-2031 | | | | 3,815,000 | | | | 4,291,112 | |
| | | | |
New York Urban Development Corporation Personal income Tax Series A | | | 5.00 | | | | 3-15-2032 | | | | 5,000,000 | | | | 5,716,050 | |
| | | | |
| | | | | | | | | | | | | | | 68,464,487 | |
| | | | | | | | | | | | | | | | |
|
| Tobacco Revenue: 0.04% | |
| | | | |
Suffolk NY Tobacco Asset Securitization Corporation Tobacco Settlement Series B | | | 4.00 | | | | 6-1-2022 | | | | 420,000 | | | | 434,755 | |
| | | | |
Suffolk NY Tobacco Asset Securitization Corporation Tobacco Settlement Series B | | | 5.00 | | | | 6-1-2023 | | | | 500,000 | | | | 533,185 | |
| | | | |
| | | | | | | | | | | | | | | 967,940 | |
| | | | | | | | | | | | | | | | |
|
| Transportation Revenue: 2.67% | |
| | | | |
New York Metropolitan Transportation Authority Series A | | | 5.00 | | | | 11-15-2030 | | | | 4,010,000 | | | | 4,317,326 | |
| | | | |
New York Metropolitan Transportation Authority Series C | | | 5.25 | | | | 11-15-2028 | | | | 5,000,000 | | | | 5,760,250 | |
| | | | |
New York Metropolitan Transportation Authority Series C | | | 5.25 | | | | 11-15-2029 | | | | 11,100,000 | | | | 12,728,037 | |
| | | | |
New York Metropolitan Transportation Authority Series C | | | 5.25 | | | | 11-15-2030 | | | | 8,350,000 | | | | 9,518,833 | |
| | | | |
New York Metropolitan Transportation Authority Series C | | | 5.25 | | | | 11-15-2031 | | | | 4,500,000 | | | | 5,112,000 | |
| | | | |
New York Metropolitan Transportation Authority Series D | | | 5.00 | | | | 11-15-2027 | | | | 2,000,000 | | | | 2,263,960 | |
| | | | |
New York Metropolitan Transportation Authority Series F | | | 5.00 | | | | 11-15-2025 | | | | 2,490,000 | | | | 2,871,966 | |
| | | | |
New York Metropolitan Transportation Authority Series F | | | 5.00 | | | | 11-15-2028 | | | | 2,450,000 | | | | 2,654,575 | |
| | | | |
Triborough NY MTA Bridges & Tunnels Authority Series B | | | 5.00 | | | | 11-15-2030 | | | | 6,000,000 | | | | 7,441,260 | |
The accompanying notes are an integral part of these financial statements.
| | | | | | |
| Portfolio of investments—December 31, 2018 (unaudited) | | Wells Fargo Intermediate Tax/AMT-Free Fund | | | 27 | |
| | | | | | | | | | | | | | | | |
| Security name | | Interest rate | | | Maturity date | | | Principal | | | Value | |
|
| Transportation Revenue(continued) | |
| | | | |
Triborough NY MTA Bridges & Tunnels Authority Series C | | | 5.00 | % | | | 11-15-2034 | | | $ | 4,000,000 | | | $ | 4,746,360 | |
| | | | |
Triborough NY MTA Bridges & Tunnels Authority Series C | | | 5.00 | | | | 11-15-2035 | | | | 5,000,000 | | | | 5,899,900 | |
| | | | |
| | | | | | | | | | | | | | | 63,314,467 | |
| | | | | | | | | | | | | | | | |
|
| Utilities Revenue: 0.80% | |
| | | | |
Long Island NY Power Authority Electric System Series C (1 Month LIBOR +0.75%) ± | | | 2.39 | | | | 5-1-2033 | | | | 10,000,000 | | | | 9,995,500 | |
| | | | |
New York Utility Debt Securitization Authority | | | 5.00 | | | | 12-15-2032 | | | | 1,250,000 | | | | 1,397,100 | |
| | | | |
New York Utility Debt Securitization Authority | | | 5.00 | | | | 12-15-2033 | | | | 6,575,000 | | | | 7,531,860 | |
| | | | |
| | | | | | | | | | | | | | | 18,924,460 | |
| | | | | | | | | | | | | | | | |
|
| Water & Sewer Revenue: 0.36% | |
| | | | |
Nassau NY Water Authority Series A | | | 5.00 | | | | 4-1-2027 | | | | 350,000 | | | | 401,373 | |
| | | | |
Nassau NY Water Authority Series A | | | 5.00 | | | | 4-1-2028 | | | | 300,000 | | | | 342,729 | |
| | | | |
Nassau NY Water Authority Series B | | | 5.00 | | | | 4-1-2024 | | | | 400,000 | | | | 455,600 | |
| | | | |
Nassau NY Water Authority Series B | | | 5.00 | | | | 4-1-2026 | | | | 755,000 | | | | 869,126 | |
| | | | |
New York NY Municipal Water Finance Authority Series GG | | | 5.00 | | | | 6-15-2029 | | | | 1,645,000 | | | | 1,899,153 | |
| | | | |
New York NY Municipal Water Finance Authority Series HH | | | 5.00 | | | | 6-15-2037 | | | | 4,000,000 | | | | 4,485,840 | |
| | | | |
| | | | | | | | | | | | | | | 8,453,821 | |
| | | | | | | | | | | | | | | | |
| | | | |
| | | | | | | | | | | | | | | 225,599,190 | |
| | | | | | | | | | | | | | | | |
|
North Carolina: 0.52% | |
|
| Airport Revenue: 0.34% | |
| | | | |
Raleigh Durham NC Airport Series C (TD Bank NA LOC) ø | | | 1.69 | | | | 5-1-2036 | | | | 8,120,000 | | | | 8,120,000 | |
| | | | | | | | | | | | | | | | |
|
| Health Revenue: 0.06% | |
| | | | |
New Hanover County NC Regional Medical Center | | | 5.00 | | | | 10-1-2022 | | | | 250,000 | | | | 275,588 | |
| | | | |
New Hanover County NC Regional Medical Center | | | 5.00 | | | | 10-1-2023 | | | | 1,000,000 | | | | 1,122,580 | |
| | | | |
| | | | | | | | | | | | | | | 1,398,168 | |
| | | | | | | | | | | | | | | | |
|
| Miscellaneous Revenue: 0.12% | |
| | | | |
North Carolina Grant Anticipation Vehicle Bond | | | 5.00 | | | | 3-1-2029 | | | | 2,470,000 | | | | 2,809,897 | |
| | | | |
Onslow County NC Limited Obligation Series A | | | 4.00 | | | | 6-1-2022 | | | | 90,000 | | | | 95,813 | |
| | | | |
| | | | | | | | | | | | | | | 2,905,710 | |
| | | | | | | | | | | | | | | | |
| | | | |
| | | | | | | | | | | | | | | 12,423,878 | |
| | | | | | | | | | | | | | | | |
|
North Dakota: 0.01% | |
|
| Housing Revenue: 0.01% | |
| | | | |
North Dakota Housing Finance Agency Series D | | | 4.50 | | | | 1-1-2029 | | | | 170,000 | | | | 171,044 | |
| | | | | | | | | | | | | | | | |
|
Ohio: 1.74% | |
|
| Education Revenue: 0.04% | |
| | | | |
Summit County OH Port Authority University of Akron Student Housing Project | | | 5.25 | | | | 1-1-2024 | | | | 685,000 | | | | 729,703 | |
| | | | |
Summit County OH Port Authority University of Akron Student Housing Project | | | 5.25 | | | | 1-1-2024 | | | | 315,000 | | | | 332,949 | |
| | | | |
| | | | | | | | | | | | | | | 1,062,652 | |
| | | | | | | | | | | | | | | | |
The accompanying notes are an integral part of these financial statements.
| | | | |
| 28 | | Wells Fargo Intermediate Tax/AMT-Free Fund | | Portfolio of investments—December 31, 2018 (unaudited) |
| | | | | | | | | | | | | | | | |
| Security name | | Interest rate | | | Maturity date | | | Principal | | | Value | |
|
| GO Revenue: 0.09% | |
| | | | |
Columbus OH Various Purposes Series 2 | | | 5.00 | % | | | 7-1-2026 | | | $ | 1,775,000 | | | $ | 2,111,256 | |
| | | | | | | | | | | | | | | | |
|
| Miscellaneous Revenue: 0.64% | |
| | | | |
Cincinnati OH City School District Improvement Project Certificate of Participation | | | 5.00 | | | | 12-15-2024 | | | | 4,815,000 | | | | 5,536,913 | |
| | | | |
Cincinnati OH City School District Improvement Project Certificate of Participation | | | 5.00 | | | | 12-15-2025 | | | | 2,095,000 | | | | 2,387,839 | |
| | | | |
Clermont County OH Port Authority West Clermont Local School District Project (Build America Mutual Assurance Company Insured) | | | 5.00 | | | | 12-1-2025 | | | | 500,000 | | | | 577,160 | |
| | | | |
Clermont County OH Port Authority West Clermont Local School District Project (Build America Mutual Assurance Company Insured) | | | 5.00 | | | | 12-1-2026 | | | | 600,000 | | | | 689,316 | |
| | | | |
Clermont County OH Port Authority West Clermont Local School District Project (Build America Mutual Assurance Company Insured) | | | 5.00 | | | | 12-1-2028 | | | | 1,250,000 | | | | 1,435,213 | |
| | | | |
JobsOhio Beverage System Statewide Liquor Profits Senior Lien Series A | | | 5.00 | | | | 1-1-2022 | | | | 2,500,000 | | | | 2,721,500 | |
| | | | |
Ohio Building Authority Series A | | | 5.00 | | | | 10-1-2024 | | | | 1,000,000 | | | | 1,074,420 | |
| | | | |
RiverSouth OH Lazarus Building Redevelopment Series A | | | 5.75 | | | | 12-1-2027 | | | | 835,000 | | | | 836,670 | |
| | | | |
| | | | | | | | | | | | | | | 15,259,031 | |
| | | | | | | | | | | | | | | | |
|
| Tax Revenue: 0.12% | |
| | | | |
Cleveland OH Subordinate Lien Income Tax Refunding Bond SeriesB-1 | | | 5.00 | | | | 10-1-2030 | | | | 2,500,000 | | | | 2,936,225 | |
| | | | | | | | | | | | | | | | |
|
| Transportation Revenue: 0.05% | |
| | | | |
Ohio Turnpike Commission Junior Lien Infrastructure Projects SeriesA-1 | | | 5.25 | | | | 2-15-2029 | | | | 1,000,000 | | | | 1,111,880 | |
| | | | | | | | | | | | | | | | |
|
| Utilities Revenue: 0.03% | |
| | | | |
Cleveland OH Public Power System Refunding Bond (AGM Insured) | | | 5.00 | | | | 11-15-2033 | | | | 625,000 | | | | 721,975 | |
| | | | | | | | | | | | | | | | |
|
| Water & Sewer Revenue: 0.77% | |
| | | | |
Ohio Water Development Authority Fresh Water | | | 5.00 | | | | 6-1-2028 | | | | 14,000,000 | | | | 16,964,360 | |
| | | | |
Ohio Water Development Authority Pollution Control Series A | | | 5.00 | | | | 12-1-2031 | | | | 1,000,000 | | | | 1,180,250 | |
| | | | |
| | | | | | | | | | | | | | | 18,144,610 | |
| | | | | | | | | | | | | | | | |
| | | | |
| | | | | | | | | | | | | | | 41,347,629 | |
| | | | | | | | | | | | | | | | |
|
Oklahoma: 2.77% | |
|
| Airport Revenue: 0.31% | |
| | | | |
Tulsa OK Airports Improvement Trust Series D (Build America Mutual Assurance Company Insured) | | | 5.00 | | | | 6-1-2019 | | | | 1,500,000 | | | | 1,517,985 | |
| | | | |
Tulsa OK Airports Improvement Trust Series D (Build America Mutual Assurance Company Insured) | | | 5.00 | | | | 6-1-2021 | | | | 1,185,000 | | | | 1,231,334 | |
| | | | |
Tulsa OK Airports Improvement Trust Series D (Build America Mutual Assurance Company Insured) | | | 5.00 | | | | 6-1-2022 | | | | 520,000 | | | | 540,036 | |
| | | | |
Tulsa OK Airports Improvement Trust Series D (Build America Mutual Assurance Company Insured) | | | 5.00 | | | | 6-1-2025 | | | | 1,200,000 | | | | 1,245,900 | |
| | | | |
Tulsa OK Airports Improvement Trust Series D (Build America Mutual Assurance Company Insured) | | | 5.00 | | | | 6-1-2026 | | | | 1,250,000 | | | | 1,297,813 | |
| | | | |
Tulsa OK Airports Improvement Trust Series D (Build America Mutual Assurance Company Insured) | | | 5.00 | | | | 6-1-2027 | | | | 1,000,000 | | | | 1,038,250 | |
| | | | |
Tulsa OK Airports Improvement Trust Series D (Build America Mutual Assurance Company Insured) | | | 5.00 | | | | 6-1-2028 | | | | 500,000 | | | | 519,125 | |
| | | | |
| | | | | | | | | | | | | | | 7,390,443 | |
| | | | | | | | | | | | | | | | |
The accompanying notes are an integral part of these financial statements.
| | | | | | |
| Portfolio of investments—December 31, 2018 (unaudited) | | Wells Fargo Intermediate Tax/AMT-Free Fund | | | 29 | |
| | | | | | | | | | | | | | | | |
| Security name | | Interest rate | | | Maturity date | | | Principal | | | Value | |
|
| Health Revenue: 0.07% | |
| | | | |
Oklahoma Development Finance Authority Health System Revenue Oklahoma University Medicine Project Series B | | | 5.00 | % | | | 8-15-2025 | | | $ | 600,000 | | | $ | 673,428 | |
| | | | |
Oklahoma Development Finance Authority Health System Revenue Oklahoma University Medicine Project Series B | | | 5.00 | | | | 8-15-2027 | | | | 900,000 | | | | 1,027,683 | |
| | | | |
| | | | | | | | | | | | | | | 1,701,111 | |
| | | | | | | | | | | | | | | | |
|
| Miscellaneous Revenue: 2.00% | |
| | | | |
Cache OK Educational Facilities Authority Cache Public Schools Project Series A | | | 5.00 | | | | 9-1-2024 | | | | 2,905,000 | | | | 3,300,835 | |
| | | | |
Cache OK Educational Facilities Authority Cache Public Schools Project Series A | | | 5.00 | | | | 9-1-2025 | | | | 3,055,000 | | | | 3,522,904 | |
| | | | |
Canadian County OK Education Facilities Authority Mustang Public Schools Project | | | 4.00 | | | | 9-1-2025 | | | | 1,110,000 | | | | 1,212,264 | |
| | | | |
Canadian County OK Education Facilities Authority Mustang Public Schools Project | | | 5.00 | | | | 9-1-2027 | | | | 2,000,000 | | | | 2,322,360 | |
| | | | |
Canadian County OK Education Facilities Authority Mustang Public Schools Project | | | 5.00 | | | | 9-1-2028 | | | | 2,180,000 | | | | 2,513,431 | |
| | | | |
Carter County OK Public Facilities Authority Educational Facilities Plainview Public School Project | | | 5.00 | | | | 12-1-2026 | | | | 1,000,000 | | | | 1,169,030 | |
| | | | |
Carter County OK Public Facilities Authority Educational Facilities Plainview Public School Project | | | 5.00 | | | | 12-1-2027 | | | | 1,000,000 | | | | 1,158,970 | |
| | | | |
Carter County OK Public Facilities Authority Educational Facilities Plainview Public School Project | | | 5.00 | | | | 12-1-2028 | | | | 1,285,000 | | | | 1,476,465 | |
| | | | |
Cleveland County OK Educational Facilities Authority Noble Public Schools Project | | | 5.00 | | | | 9-1-2027 | | | | 700,000 | | | | 820,624 | |
| | | | |
Cleveland County OK Educational Facilities Authority Noble Public Schools Project | | | 5.00 | | | | 9-1-2028 | | | | 400,000 | | | | 465,912 | |
| | | | |
Cleveland County OK Educational Facilities Authority Noble Public Schools Project | | | 5.00 | | | | 9-1-2029 | | | | 250,000 | | | | 289,738 | |
| | | | |
Cleveland County OK Educational Facilities Authority Noble Public Schools Project | | | 5.00 | | | | 9-1-2030 | | | | 625,000 | | | | 720,725 | |
| | | | |
Cleveland County OK Educational Facilities Authority Noble Public Schools Project | | | 5.00 | | | | 9-1-2031 | | | | 675,000 | | | | 774,495 | |
| | | | |
Comanche County OK Educational Facilities Authority Elgin Public Schools Project Series A | | | 5.00 | | | | 12-1-2032 | | | | 1,600,000 | | | | 1,823,040 | |
| | | | |
Creek County OK Educational Facilities Sapulpa Public Schools Project | | | 5.00 | | | | 9-1-2023 | | | | 3,000,000 | | | | 3,360,210 | |
| | | | |
Cushing OK Educational Facilities Authority | | | 5.00 | | | | 9-1-2022 | | | | 2,210,000 | | | | 2,427,287 | |
| | | | |
Dewey County OK Educational Facilities Authority Seiling Public Schools Project | | | 5.00 | | | | 9-1-2026 | | | | 1,230,000 | | | | 1,426,406 | |
| | | | |
Dewey County OK Educational Facilities Authority Seiling Public Schools Project | | | 5.00 | | | | 9-1-2027 | | | | 1,240,000 | | | | 1,425,033 | |
| | | | |
Garvin County OK Educational Facilities Authority Lindsay Public Schools Project | | | 5.00 | | | | 9-1-2019 | | | | 860,000 | | | | 877,467 | |
| | | | |
Garvin County OK Educational Facilities Authority Lindsay Public Schools Project | | | 5.00 | | | | 9-1-2020 | | | | 455,000 | | | | 474,742 | |
| | | | |
Garvin County OK Educational Facilities Authority Lindsay Public Schools Project | | | 5.00 | | | | 9-1-2026 | | | | 1,000,000 | | | | 1,139,330 | |
| | | | |
Garvin County OK Educational Facilities Authority Lindsay Public Schools Project | | | 5.00 | | | | 9-1-2027 | | | | 1,245,000 | | | | 1,416,835 | |
| | | | |
Grady County OK Educational Facilities Tuttle Public Schools Project | | | 5.00 | | | | 9-1-2023 | | | | 1,000,000 | | | | 1,121,010 | |
| | | | |
Grady County OK Educational Facilities Tuttle Public Schools Project | | | 5.00 | | | | 9-1-2024 | | | | 1,075,000 | | | | 1,223,920 | |
| | | | |
Grady County OK Educational Facilities Tuttle Public Schools Project | | | 5.00 | | | | 9-1-2025 | | | | 500,000 | | | | 577,575 | |
| | | | |
Grady County OK Educational Facilities Tuttle Public Schools Project | | | 5.00 | | | | 9-1-2028 | | | | 1,160,000 | | | | 1,333,049 | |
| | | | |
Muskogee OK Industrial Trust Educational Facilities | | | 5.00 | | | | 9-1-2020 | | | | 1,250,000 | | | | 1,300,075 | |
| | | | |
Muskogee OK Industrial Trust Educational Facilities | | | 5.00 | | | | 9-1-2021 | | | | 1,000,000 | | | | 1,060,490 | |
| | | | |
Muskogee OK Industrial Trust Educational Facilities | | | 5.00 | | | | 9-1-2022 | | | | 1,000,000 | | | | 1,078,540 | |
| | | | |
Oklahoma Development Finance Authority | | | 4.00 | | | | 6-1-2023 | | | | 1,270,000 | | | | 1,362,266 | |
| | | | |
Oklahoma Development Finance Authority | | | 5.00 | | | | 6-1-2023 | | | | 1,230,000 | | | | 1,377,846 | |
| | | | |
Oklahoma Development Finance Authority Higher Education Master Real Property Series B | | | 4.00 | | | | 6-1-2024 | | | | 1,270,000 | | | | 1,373,861 | |
| | | | |
Tulsa County OK Industrial Authority Educational Facilities Glenpool Public Schools Project Series A | | | 5.00 | | | | 9-1-2025 | | | | 1,280,000 | | | | 1,481,997 | |
| | | | |
| | | | | | | | | | | | | | | 47,408,732 | |
| | | | | | | | | | | | | | | | |
|
| Tax Revenue: 0.19% | |
| | | | |
Oklahoma City OK Public Property Authority | | | 5.00 | | | | 10-1-2026 | | | | 1,495,000 | | | | 1,729,610 | |
| | | | |
Oklahoma City OK Public Property Authority | | | 5.00 | | | | 10-1-2027 | | | | 1,140,000 | | | | 1,317,361 | |
The accompanying notes are an integral part of these financial statements.
| | | | |
| 30 | | Wells Fargo Intermediate Tax/AMT-Free Fund | | Portfolio of investments—December 31, 2018 (unaudited) |
| | | | | | | | | | | | | | | | |
| Security name | | Interest rate | | | Maturity date | | | Principal | | | Value | |
|
| Tax Revenue(continued) | |
| | | | |
Oklahoma City OK Public Property Authority | | | 5.00 | % | | | 10-1-2028 | | | $ | 1,265,000 | | | $ | 1,459,266 | |
| | | | |
| | | | | | | | | | | | | | | 4,506,237 | |
| | | | | | | | | | | | | | | | |
|
| Utilities Revenue: 0.16% | |
| | | | |
Claremore OK Public Works Authority | | | 4.00 | | | | 6-1-2022 | | | | 2,595,000 | | | | 2,746,782 | |
| | | | |
Claremore OK Public Works Authority | | | 4.00 | | | | 6-1-2023 | | | | 1,010,000 | | | | 1,066,681 | |
| | | | |
| | | | | | | | | | | | | | | 3,813,463 | |
| | | | | | | | | | | | | | | | |
|
| Water & Sewer Revenue: 0.04% | |
| | | | |
McGee Creek OK Authority (National Insured) | | | 6.00 | | | | 1-1-2023 | | | | 920,000 | | | | 983,820 | |
| | | | | | | | | | | | | | | | |
| | | | |
| | | | | | | | | | | | | | | 65,803,806 | |
| | | | | | | | | | | | | | | | |
|
Oregon: 0.70% | |
|
| GO Revenue: 0.58% | |
| | | | |
Benton & Linn Counties OR Corvallis School District Series B (AGM Insured) | | | 5.00 | | | | 6-15-2031 | | | | 5,110,000 | | | | 6,122,138 | |
| | | | |
Washington & Multnomah Counties OR Beaverton School District Series D (AGM Insured) | | | 5.00 | | | | 6-15-2035 | | | | 1,500,000 | | | | 1,736,985 | |
| | | | |
Washington County OR Full Faith & Credit Obligations Series B | | | 5.00 | | | | 3-1-2022 | | | | 5,345,000 | | | | 5,856,089 | |
| | | | |
| | | | | | | | | | | | | | | 13,715,212 | |
| | | | | | | | | | | | | | | | |
|
| Health Revenue: 0.12% | |
| | | | |
Medford OR Hospital Facilities Authority | | | 5.00 | | | | 10-1-2020 | | | | 1,155,000 | | | | 1,211,029 | |
| | | | |
Oregon Facilities Authority Samaritan Health Services Project Series A | | | 5.00 | | | | 10-1-2026 | | | | 1,500,000 | | | | 1,727,130 | |
| | | | |
| | | | | | | | | | | | | | | 2,938,159 | |
| | | | | | | | | | | | | | | | |
| | | | |
| | | | | | | | | | | | | | | 16,653,371 | |
| | | | | | | | | | | | | | | | |
|
Pennsylvania: 9.76% | |
|
| Education Revenue: 1.58% | |
| | | | |
Adams County PA IDA Gettysburg College Project | | | 5.00 | | | | 8-15-2024 | | | | 1,500,000 | | | | 1,568,025 | |
| | | | |
Adams County PA IDA Gettysburg College Project | | | 5.00 | | | | 8-15-2025 | | | | 1,500,000 | | | | 1,567,290 | |
| | | | |
Chester County PA IDA Collegium Charter School Project Series A | | | 5.00 | | | | 10-15-2027 | | | | 1,500,000 | | | | 1,562,865 | |
| | | | |
Lycoming County PA Authority Pennsylvania College of Technology | | | 5.50 | | | | 7-1-2026 | | | | 4,000,000 | | | | 4,323,760 | |
| | | | |
Northampton County PA General Purpose Authority College Refunding Bond | | | 5.00 | | | | 11-1-2027 | | | | 1,000,000 | | | | 1,200,410 | |
| | | | |
Northeastern Pennsylvania Hospital & Education Authority Series A | | | 5.00 | | | | 3-1-2026 | | | | 885,000 | | | | 975,474 | |
| | | | |
Northeastern Pennsylvania Hospital & Education Authority Series A | | | 5.00 | | | | 3-1-2028 | | | | 660,000 | | | | 719,143 | |
| | | | |
Pennsylvania HEFAR Series AQ | | | 5.00 | | | | 6-15-2023 | | | | 6,090,000 | | | | 6,820,008 | |
| | | | |
Pennsylvania HEFAR Series AR | | | 5.00 | | | | 6-15-2025 | | | | 1,000,000 | | | | 1,153,850 | |
| | | | |
Pennsylvania HEFAR Series AS | | | 5.00 | | | | 6-15-2025 | | | | 1,575,000 | | | | 1,817,314 | |
| | | | |
Pennsylvania HEFAR Series AS | | | 5.00 | | | | 6-15-2027 | | | | 2,190,000 | | | | 2,537,444 | |
| | | | |
Pennsylvania HEFAR Series LL1 | | | 5.00 | | | | 11-1-2019 | | | | 880,000 | | | | 889,337 | |
| | | | |
Pennsylvania HEFAR Series LL1 | | | 5.00 | | | | 11-1-2020 | | | | 590,000 | | | | 601,835 | |
| | | | |
Pennsylvania HEFAR Series LL1 | | | 5.00 | | | | 11-1-2022 | | | | 1,310,000 | | | | 1,349,431 | |
| | | | |
Pennsylvania Public School Building Authority | | | 5.00 | | | | 5-1-2023 | | | | 2,185,000 | | | | 2,438,089 | |
| | | | |
Pennsylvania Public School Building Authority | | | 5.00 | | | | 6-15-2025 | | | | 2,265,000 | | | | 2,582,961 | |
| | | | |
Philadelphia PA IDA | | | 5.88 | | | | 6-15-2022 | | | | 950,000 | | | | 988,295 | |
| | | | |
Philadelphia PA IDA | | | 6.13 | | | | 6-15-2023 | | | | 930,000 | | | | 984,926 | |
| | | | |
Philadelphia PA IDA | | | 7.00 | | | | 5-1-2026 | | | | 740,000 | | | | 783,416 | |
The accompanying notes are an integral part of these financial statements.
| | | | | | |
| Portfolio of investments—December 31, 2018 (unaudited) | | Wells Fargo Intermediate Tax/AMT-Free Fund | | | 31 | |
| | | | | | | | | | | | | | | | |
| Security name | | Interest rate | | | Maturity date | | | Principal | | | Value | |
|
| Education Revenue(continued) | |
| | | | |
Philadelphia PA IDA Master Charter School Aid | | | 5.00 | % | | | 8-1-2020 | | | $ | 220,000 | | | $ | 226,459 | |
| | | | |
Philadelphia PA IDA West Philadelphia Achievement Charter Elementary School Project | | | 6.25 | | | | 5-1-2021 | | | | 185,000 | | | | 192,272 | |
| | | | |
Philadelphia PA Public School Building Authority (Build America Mutual Assurance Company Insured) | | | 5.00 | | | | 6-15-2026 | | | | 2,000,000 | | | | 2,282,040 | |
| | | | |
| | | | | | | | | | | | | | | 37,564,644 | |
| | | | | | | | | | | | | | | | |
|
| GO Revenue: 3.76% | |
| | | | |
Allegheny County PA Moon Area School District Series A | | | 5.00 | | | | 11-15-2024 | | | | 3,400,000 | | | | 3,839,280 | |
| | | | |
Allegheny County PA Series 72 | | | 5.25 | | | | 12-1-2033 | | | | 4,000,000 | | | | 4,489,600 | |
| | | | |
Central Dauphin PA School District | | | 5.00 | | | | 2-1-2029 | | | | 825,000 | | | | 959,756 | |
| | | | |
Central Dauphin PA School District | | | 5.00 | | | | 2-1-2030 | | | | 1,110,000 | | | | 1,284,692 | |
| | | | |
Central Greene PA School District Series B (Build America Mutual Assurance Company Insured) | | | 5.00 | | | | 2-15-2019 | | | | 865,000 | | | | 868,252 | |
| | | | |
Johnstown PA School District (AGM Insured) | | | 5.00 | | | | 8-1-2024 | | | | 2,730,000 | | | | 2,913,401 | |
| | | | |
Norristown PA Area School District Montgomery County Series 2018 (Build America Mutual Assurance Company Insured) | | | 5.00 | | | | 9-1-2035 | | | | 2,035,000 | | | | 2,290,881 | |
| | | | |
Pennsylvania Hills PA School District (Build America Mutual Assurance Company Insured) | | | 4.00 | | | | 10-1-2021 | | | | 1,460,000 | | | | 1,541,979 | |
| | | | |
Pennsylvania Series 2 | | | 5.00 | | | | 4-15-2023 | | | | 2,000,000 | | | | 2,018,800 | |
| | | | |
Philadelphia PA (AGM Insured) | | | 5.00 | | | | 8-1-2025 | | | | 7,000,000 | | | | 8,064,420 | |
| | | | |
Philadelphia PA School District Refunding Bond Series C | | | 5.00 | | | | 9-1-2021 | | | | 2,200,000 | | | | 2,358,312 | |
| | | | |
Philadelphia PA School District Refunding Bond Series D | | | 5.00 | | | | 9-1-2022 | | | | 3,750,000 | | | | 4,095,150 | |
| | | | |
Philadelphia PA School District Refunding Bond Series E | | | 5.25 | | | | 9-1-2021 | | | | 1,490,000 | | | | 1,559,449 | |
| | | | |
Philadelphia PA School District Refunding Bond Series F | | | 5.00 | | | | 9-1-2028 | | | | 5,000,000 | | | | 5,676,050 | |
| | | | |
Philadelphia PA School District Refunding Bond Series F | | | 5.00 | | | | 9-1-2029 | | | | 5,000,000 | | | | 5,657,800 | |
| | | | |
Philadelphia PA School District Refunding Bond Series F | | | 5.00 | | | | 9-1-2031 | | | | 1,240,000 | | | | 1,389,643 | |
| | | | |
Philadelphia PA School District Refunding Bond Series F | | | 5.00 | | | | 9-1-2032 | | | | 1,000,000 | | | | 1,118,520 | |
| | | | |
Philadelphia PA Series A | | | 5.00 | | | | 8-1-2024 | | | | 1,000,000 | | | | 1,131,610 | |
| | | | |
Philadelphia PA Series A | | | 5.00 | | | | 7-15-2026 | | | | 3,000,000 | | | | 3,330,120 | |
| | | | |
Philadelphia PA Series A | | | 5.00 | | | | 8-1-2027 | | | | 1,500,000 | | | | 1,745,085 | |
| | | | |
Philadelphia PA Series A | | | 5.00 | | | | 8-1-2033 | | | | 2,000,000 | | | | 2,244,220 | |
| | | | |
Philadelphia PA Series A | | | 5.25 | | | | 7-15-2028 | | | | 2,590,000 | | | | 2,897,563 | |
| | | | |
Philadelphia PA Series A | | | 5.25 | | | | 7-15-2029 | | | | 4,410,000 | | | | 4,924,868 | |
| | | | |
Philadelphia PA Series A | | | 5.25 | | | | 7-15-2032 | | | | 4,380,000 | | | | 4,863,114 | |
| | | | |
Pittsburgh PA Moon Area School District Series A | | | 5.00 | | | | 11-15-2029 | | | | 1,000,000 | | | | 1,112,510 | |
| | | | |
Pittsburgh PA Series A | | | 4.00 | | | | 9-1-2022 | | | | 1,000,000 | | | | 1,060,790 | |
| | | | |
Pittsburgh PA Series A | | | 5.00 | | | | 9-1-2022 | | | | 2,060,000 | | | | 2,257,204 | |
| | | | |
Pittsburgh PA Series A | | | 5.00 | | | | 9-1-2023 | | | | 3,810,000 | | | | 4,187,419 | |
| | | | |
Reading Berks PA Series A (Build America Mutual Assurance Company Insured) | | | 5.00 | | | | 11-1-2026 | | | | 1,000,000 | | | | 1,146,830 | |
| | | | |
Reading PA School District | | | 5.00 | | | | 4-1-2021 | | | | 3,120,000 | | | | 3,296,810 | |
| | | | |
Reading PA School District (AGM Insured) | | | 5.00 | | | | 3-1-2037 | | | | 2,000,000 | | | | 2,246,000 | |
| | | | |
Reading PA School District (AGM Insured) | | | 5.00 | | | | 3-1-2038 | | | | 1,735,000 | | | | 1,941,812 | |
| | | | |
Scranton Lackawanna County PA School District Bond Series A (Build America Mutual Assurance Company Insured) | | | 5.00 | | | | 6-1-2037 | | | | 500,000 | | | | 553,760 | |
| | | | |
| | | | | | | | | | | | | | | 89,065,700 | |
| | | | | | | | | | | | | | | | |
|
| Health Revenue: 0.74% | |
| | | | |
Allegheny County PA Hospital Development Authority Series B (National Insured) | | | 6.00 | | | | 7-1-2025 | | | | 2,605,000 | | | | 3,151,920 | |
| | | | |
Berks County PA Municipal Authority Reading Hospital & Medical Center Project Series B (SIFMA Municipal Swap +1.50%) ± | | | 3.21 | | | | 11-1-2039 | | | | 10,000,000 | | | | 10,152,400 | |
The accompanying notes are an integral part of these financial statements.
| | | | |
| 32 | | Wells Fargo Intermediate Tax/AMT-Free Fund | | Portfolio of investments—December 31, 2018 (unaudited) |
| | | | | | | | | | | | | | | | |
| Security name | | Interest rate | | | Maturity date | | | Principal | | | Value | |
|
| Health Revenue(continued) | |
| | | | |
Cumberland County PA Diakon Lutheran Social Ministries Project | | | 5.00 | % | | | 1-1-2025 | | | $ | 1,340,000 | | | $ | 1,467,555 | |
| | | | |
Cumberland County PA Diakon Lutheran Social Ministries Project | | | 5.00 | | | | 1-1-2026 | | | | 1,370,000 | | | | 1,492,615 | |
| | | | |
Cumberland County PA Diakon Lutheran Social Ministries Project | | | 5.00 | | | | 1-1-2027 | | | | 1,225,000 | | | | 1,330,485 | |
| | | | |
| | | | | | | | | | | | | | | 17,594,975 | |
| | | | | | | | | | | | | | | | |
|
| Miscellaneous Revenue: 2.13% | |
| | | | |
Delaware County PA Vocational & Technical School Authority (Build America Mutual Assurance Company Insured) | | | 5.25 | | | | 11-1-2033 | | | | 2,000,000 | | | | 2,214,040 | |
| | | | |
Pennsylvania Certificate of Participation Municipal Real Estate Payment Series A | | | 5.00 | | | | 7-1-2028 | | | | 400,000 | | | | 462,104 | |
| | | | |
Pennsylvania Certificate of Participation Municipal Real Estate Payment Series A | | | 5.00 | | | | 7-1-2029 | | | | 300,000 | | | | 345,294 | |
| | | | |
Pennsylvania Certificate of Participation Municipal Real Estate Payment Series A | | | 5.00 | | | | 7-1-2030 | | | | 375,000 | | | | 429,064 | |
| | | | |
Pennsylvania Certificate of Participation Retained Basic Lease Payment (AGM Insured) | | | 5.00 | | | | 11-1-2022 | | | | 3,015,000 | | | | 3,306,912 | |
| | | | |
Pennsylvania Certificate of Participation Retained Basic Lease Payment (AGM Insured) | | | 5.00 | | | | 11-1-2023 | | | | 1,900,000 | | | | 2,122,946 | |
| | | | |
Pennsylvania Certificate of Participation Retained Basic Lease Payment (AGM Insured) | | | 5.00 | | | | 11-1-2024 | | | | 1,660,000 | | | | 1,884,664 | |
| | | | |
Pennsylvania Public School Building Authority (Build America Mutual Assurance Company Insured) | | | 4.00 | | | | 5-15-2021 | | | | 500,000 | | | | 522,285 | |
| | | | |
Pennsylvania Public School Building Authority (Build America Mutual Assurance Company Insured) | | | 4.00 | | | | 5-15-2022 | | | | 1,000,000 | | | | 1,043,860 | |
| | | | |
Pennsylvania Public School Building Authority | | | 5.00 | | | | 4-1-2020 | | | | 5,600,000 | | | | 5,793,368 | |
| | | | |
Pennsylvania Public School Building Authority | | | 5.00 | | | | 4-1-2029 | | | | 1,000,000 | | | | 1,056,270 | |
| | | | |
Pennsylvania Public School Building Authority Chester Upland School District Project Series B | | | 5.25 | | | | 9-15-2030 | | | | 2,000,000 | | | | 2,268,480 | |
| | | | |
Pennsylvania Public School Building Authority City of Harrisburg Project Series A (AGM Insured) | | | 5.00 | | | | 12-1-2028 | | | | 3,500,000 | | | | 4,034,870 | |
| | | | |
Pennsylvania Public School Building Authority City of Harrisburg Project Series A (AGM Insured) | | | 5.00 | | | | 12-1-2033 | | | | 4,425,000 | | | | 5,004,100 | |
| | | | |
Pennsylvania Public School Building Authority Philadelphia School District Project | | | 5.00 | | | | 4-1-2024 | | | | 2,000,000 | | | | 2,141,260 | |
| | | | |
Pennsylvania Public School Building Authority Series B (AGM Insured) | | | 5.00 | | | | 6-1-2029 | | | | 2,000,000 | | | | 2,333,940 | |
| | | | |
Pennsylvania Public School Building Authority Series B-2 (Build America Mutual Assurance Company Insured) | | | 5.00 | | | | 12-1-2024 | | | | 1,250,000 | | | | 1,419,238 | |
| | | | |
Pennsylvania Public School Building Authority Series B-2 (Build America Mutual Assurance Company Insured) | | | 5.00 | | | | 12-1-2025 | | | | 1,250,000 | | | | 1,412,638 | |
| | | | |
Pennsylvania Public School Building Authority Series B-2 (Build America Mutual Assurance Company Insured) | | | 5.00 | | | | 12-1-2026 | | | | 1,250,000 | | | | 1,408,263 | |
| | | | |
Pennsylvania Public School Building Authority Series B-2 (Build America Mutual Assurance Company Insured) | | | 5.00 | | | | 12-1-2027 | | | | 1,010,000 | | | | 1,134,351 | |
| | | | |
Philadelphia PA Municipal Authority Juvenile Justice Services Center | | | 5.00 | | | | 4-1-2031 | | | | 3,630,000 | | | | 4,080,447 | |
| | | | |
Philadelphia PA Municipal Authority Juvenile Justice Services Center | | | 5.00 | | | | 4-1-2034 | | | | 1,800,000 | | | | 1,998,630 | |
| | | | |
Southeastern Pennsylvania Transportation Authority | | | 5.00 | | | | 3-1-2028 | | | | 725,000 | | | | 862,235 | |
| | | | |
York County PA School of Technology Authority Series A (Build America Mutual Assurance Company Insured) | | | 5.00 | | | | 2-15-2024 | | | | 1,590,000 | | | | 1,796,064 | |
| | | | |
York County PA School of Technology Authority Series B (Build America Mutual Assurance Company Insured) | | | 5.00 | | | | 2-15-2027 | | | | 800,000 | | | | 903,728 | |
| | | | |
York County PA School of Technology Authority Series B (Build America Mutual Assurance Company Insured) | | | 5.00 | | | | 2-15-2029 | | | | 500,000 | | | | 561,485 | |
| | | | |
| | | | | | | | | | | | | | | 50,540,536 | |
| | | | | | | | | | | | | | | | |
The accompanying notes are an integral part of these financial statements.
| | | | | | |
| Portfolio of investments—December 31, 2018 (unaudited) | | Wells Fargo Intermediate Tax/AMT-Free Fund | | | 33 | |
| | | | | | | | | | | | | | | | |
| Security name | | Interest rate | | | Maturity date | | | Principal | | | Value | |
|
| Resource Recovery Revenue: 0.27% | |
| | | | |
Lancaster County PA Solid Waste Management Authority Series A | | | 5.25 | % | | | 12-15-2028 | | | $ | 5,665,000 | | | $ | 6,288,490 | |
| | | | | | | | | | | | | | | | |
|
| Tobacco Revenue: 0.25% | |
| | | | |
Commonwealth Financing Authority Tobacco Master Settlement Payment | | | 5.00 | | | | 6-1-2027 | | | | 2,500,000 | | | | 2,893,350 | |
| | | | |
Commonwealth Financing Authority Tobacco Master Settlement Payment | | | 5.00 | | | | 6-1-2028 | | | | 2,500,000 | | | | 2,909,475 | |
| | | | |
| | | | | | | | | | | | | | | 5,802,825 | |
| | | | | | | | | | | | | | | | |
|
| Transportation Revenue: 0.63% | |
| | | | |
Pennsylvania Turnpike Commission Motor License Fund-Enhanced Refunding Bond | | | 5.00 | | | | 6-1-2027 | | | | 1,000,000 | | | | 1,164,640 | |
| | | | |
Pennsylvania Turnpike Commission Refunding Bond | | | 5.00 | | | | 12-1-2033 | | | | 3,780,000 | | | | 4,169,378 | |
| | | | |
Pennsylvania Turnpike Commission Subordinate Bond Series B | | | 5.00 | | | | 6-1-2031 | | | | 5,000,000 | | | | 5,596,350 | |
| | | | |
Pennsylvania Turnpike Commission Subordinate Bond Series C (AGM Insured) | | | 6.25 | | | | 6-1-2033 | | | | 1,350,000 | | | | 1,651,631 | |
| | | | |
Pennsylvania Turnpike Commission Subordinate Bond Series E | | | 6.38 | | | | 12-1-2038 | | | | 2,000,000 | | | | 2,460,960 | |
| | | | |
| | | | | | | | | | | | | | | 15,042,959 | |
| | | | | | | | | | | | | | | | |
|
| Water & Sewer Revenue: 0.40% | |
| | | | |
Bucks County PA Water & Sewer Authority Water System (AGM Insured) | | | 5.00 | | | | 12-1-2026 | | | | 2,400,000 | | | | 2,613,984 | |
| | | | |
Pennsylvania Capital Region Water Sewer System | | | 5.00 | | | | 7-15-2030 | | | | 1,180,000 | | | | 1,359,384 | |
| | | | |
Pennsylvania Capital Region Water System | | | 5.00 | | | | 7-15-2030 | | | | 1,500,000 | | | | 1,751,190 | |
| | | | |
Philadelphia PA Water and Wastewater Bond Series B | | | 5.00 | | | | 11-1-2027 | | | | 1,535,000 | | | | 1,827,878 | |
| | | | |
Philadelphia PA Water and Wastewater Bond Series B | | | 5.00 | | | | 11-1-2033 | | | | 1,760,000 | | | | 2,029,667 | |
| | | | |
| | | | | | | | | | | | | | | 9,582,103 | |
| | | | | | | | | | | | | | | | |
| | | | |
| | | | | | | | | | | | | | | 231,482,232 | |
| | | | | | | | | | | | | | | | |
|
South Carolina: 0.75% | |
|
| Education Revenue: 0.48% | |
| | | | |
South Carolina Education Assistance Authority Student Loan Series I | | | 5.00 | | | | 10-1-2024 | | | | 1,805,000 | | | | 1,834,241 | |
| | | | |
South Carolina Jobs EDA East Point Academy Project Series A 144A | | | 2.25 | | | | 5-1-2019 | | | | 2,875,000 | | | | 2,867,439 | |
| | | | |
South Carolina Jobs EDA Furman University Project | | | 5.00 | | | | 10-1-2028 | | | | 700,000 | | | | 807,030 | |
| | | | |
South Carolina Jobs EDA Furman University Project | | | 5.00 | | | | 10-1-2030 | | | | 1,885,000 | | | | 2,165,658 | |
| | | | |
South Carolina Jobs EDA Furman University Project | | | 5.00 | | | | 10-1-2031 | | | | 2,155,000 | | | | 2,472,970 | |
| | | | |
South Carolina Jobs EDA York Preparatory Academy Project Series A | | | 7.00 | | | | 11-1-2033 | | | | 1,000,000 | | | | 1,078,470 | |
| | | | |
| | | | | | | | | | | | | | | 11,225,808 | |
| | | | | | | | | | | | | | | | |
|
| Miscellaneous Revenue: 0.27% | |
| | | | |
Laurens County SC Education Assistance for District #55 | | | 5.00 | | | | 12-1-2021 | | | | 1,000,000 | | | | 1,070,330 | |
| | | | |
Laurens County SC Education Assistance for District #55 | | | 5.00 | | | | 12-1-2022 | | | | 1,250,000 | | | | 1,362,313 | |
| | | | |
Laurens County SC Education Assistance for District #55 | | | 5.00 | | | | 12-1-2025 | | | | 1,000,000 | | | | 1,138,690 | |
| | | | |
Scago SC Educational Facilities Corporation for Sumter County School District #17 | | | 4.00 | | | | 12-1-2019 | | | | 1,000,000 | | | | 1,014,590 | |
| | | | |
Scago SC Educational Facilities Corporation for Sumter County School District #17 | | | 5.00 | | | | 12-1-2022 | | | | 1,720,000 | | | | 1,877,225 | |
| | | | |
| | | | | | | | | | | | | | | 6,463,148 | |
| | | | | | | | | | | | | | | | |
| | | | |
| | | | | | | | | | | | | | | 17,688,956 | |
| | | | | | | | | | | | | | | | |
|
South Dakota: 0.04% | |
|
| Airport Revenue: 0.04% | |
| | | | |
Rapid City SD Airport Project | | | 6.25 | | | | 12-1-2026 | | | | 920,000 | | | | 955,705 | |
| | | | | | | | | | | | | | | | |
The accompanying notes are an integral part of these financial statements.
| | | | |
| 34 | | Wells Fargo Intermediate Tax/AMT-Free Fund | | Portfolio of investments—December 31, 2018 (unaudited) |
| | | | | | | | | | | | | | | | |
| Security name | | Interest rate | | | Maturity date | | | Principal | | | Value | |
|
Tennessee: 0.95% | |
|
| Education Revenue: 0.04% | |
| | | | |
Franklin County TN HEFA | | | 4.00 | % | | | 9-1-2024 | | | $ | 250,000 | | | $ | 263,395 | |
| | | | |
Franklin County TN HEFA | | | 5.00 | | | | 9-1-2030 | | | | 560,000 | | | | 610,518 | |
| | | | |
| | | | | | | | | | | | | | | 873,913 | |
| | | | | | | | | | | | | | | | |
|
| GO Revenue: 0.04% | |
| | | | |
White County TN | | | 4.05 | | | | 6-1-2020 | | | | 1,010,000 | | | | 1,029,746 | |
| | | | | | | | | | | | | | | | |
|
| Health Revenue: 0.01% | |
| | | | |
Shelby County TN Health Educational & Housing Facilities Board Le Bonheur Children’s Medical Center Series D (National Insured) | | | 5.50 | | | | 8-15-2019 | | | | 125,000 | | | | 127,860 | |
| | | | | | | | | | | | | | | | |
|
| Housing Revenue: 0.03% | |
| | | | |
Chattanooga TN Health Educational & Housing Facilities University of Tennessee at Chattanooga Project | | | 5.00 | | | | 10-1-2023 | | | | 750,000 | | | | 829,823 | |
| | | | | | | | | | | | | | | | |
|
| Utilities Revenue: 0.83% | |
| | | | |
Tennessee Energy Acquisition Corporation | | | 4.00 | | | | 11-1-2049 | | | | 11,000,000 | | | | 11,535,480 | |
| | | | |
Tennessee Energy Acquisition Corporation Series A | | | 4.00 | | | | 5-1-2048 | | | | 7,820,000 | | | | 8,125,215 | |
| | | | |
| | | | | | | | | | | | | | | 19,660,695 | |
| | | | | | | | | | | | | | | | |
| | | | |
| | | | | | | | | | | | | | | 22,522,037 | |
| | | | | | | | | | | | | | | | |
|
Texas: 9.48% | |
|
| Airport Revenue: 0.50% | |
| | | | |
Galveston TX Wharves & Terminal | | | 5.00 | | | | 2-1-2026 | | | | 2,000,000 | | | | 2,086,520 | |
| | | | |
Houston TX Airport System Subordinate Lien Refunding Bonds Series D | | | 5.00 | | | | 7-1-2033 | | | | 3,000,000 | | | | 3,503,340 | |
| | | | |
Houston TX Airport System Subordinate Lien Refunding Bonds Series D | | | 5.00 | | | | 7-1-2034 | | | | 3,500,000 | | | | 4,068,330 | |
| | | | |
Houston TX Airport System Subordinate Lien Refunding Bonds Series D | | | 5.00 | | | | 7-1-2035 | | | | 2,000,000 | | | | 2,317,600 | |
| | | | |
| | | | | | | | | | | | | | | 11,975,790 | |
| | | | | | | | | | | | | | | | |
|
| Education Revenue: 0.91% | |
| | | | |
Houston TX Higher Education Finance Corporation Series A | | | 4.00 | | | | 2-15-2022 | | | | 515,000 | | | | 526,927 | |
| | | | |
North Texas Higher Education Authority Incoming Student Loan SeriesA-2 (3 Month LIBOR +0.90%) ± | | | 3.30 | | | | 7-1-2030 | | | | 5,105,000 | | | | 5,107,757 | |
| | | | |
Texas Woman’s University Financing System | | | 4.00 | | | | 7-1-2020 | | | | 1,000,000 | | | | 1,032,000 | |
| | | | |
University of Houston Texas | | | 5.00 | | | | 2-15-2024 | | | | 2,700,000 | | | | 2,710,665 | |
| | | | |
University of Houston Texas Series B | | | 5.25 | | | | 7-1-2026 | | | | 4,225,000 | | | | 5,094,674 | |
| | | | |
University of Texas Refinancing Series B ø | | | 1.71 | | | | 8-1-2033 | | | | 7,150,000 | | | | 7,150,000 | |
| | | | |
| | | | | | | | | | | | | | | 21,622,023 | |
| | | | | | | | | | | | | | | | |
|
| GO Revenue: 4.52% | |
| | | | |
Austin TX Independent School District Series B | | | 5.00 | | | | 8-1-2023 | | | | 3,805,000 | | | | 4,294,818 | |
| | | | |
Austin TX Independent School District Series B | | | 5.00 | | | | 8-1-2024 | | | | 3,970,000 | | | | 4,568,438 | |
| | | | |
Austin TX Independent School District Series B | | | 5.00 | | | | 8-1-2025 | | | | 2,050,000 | | | | 2,399,689 | |
| | | | |
Austin TX Independent School District Series B | | | 5.00 | | | | 8-1-2026 | | | | 1,450,000 | | | | 1,686,727 | |
| | | | |
Austin TX Public Improvement Bond | | | 5.00 | | | | 9-1-2030 | | | | 960,000 | | | | 1,134,355 | |
| | | | |
Bexar County TX Combination Tax Certificate of Obligation | | | 5.00 | | | | 6-15-2024 | | | | 1,000,000 | | | | 1,151,380 | |
| | | | |
Collin County TX Unlimited Tax Road & Refunding Bond | | | 5.00 | | | | 2-15-2023 | | | | 1,350,000 | | | | 1,507,559 | |
The accompanying notes are an integral part of these financial statements.
| | | | | | |
| Portfolio of investments—December 31, 2018 (unaudited) | | Wells Fargo Intermediate Tax/AMT-Free Fund | | | 35 | |
| | | | | | | | | | | | | | | | |
| Security name | | Interest rate | | | Maturity date | | | Principal | | | Value | |
|
| GO Revenue(continued) | |
| | | | |
Collin County TX Unlimited Tax Road & Refunding Bond | | | 5.00 | % | | | 2-15-2026 | | | $ | 1,000,000 | | | $ | 1,163,130 | |
| | | | |
Collin County TX Unlimited Tax Road & Refunding Bond | | | 5.00 | | | | 2-15-2027 | | | | 1,300,000 | | | | 1,509,638 | |
| | | | |
Crane County TX Water District Unlimited Tax Bond | | | 5.00 | | | | 2-15-2023 | | | | 1,395,000 | | | | 1,547,892 | |
| | | | |
Crane County TX Water District Unlimited Tax Bond | | | 5.00 | | | | 2-15-2026 | | | | 1,000,000 | | | | 1,138,520 | |
| | | | |
Crane County TX Water District Unlimited Tax Bond | | | 5.00 | | | | 2-15-2030 | | | | 1,130,000 | | | | 1,265,453 | |
| | | | |
Crane County TX Water District Unlimited Tax Bond | | | 5.00 | | | | 2-15-2031 | | | | 1,000,000 | | | | 1,114,520 | |
| | | | |
Dallas County TX Combination Tax and Parking Garage Certification of Obligation | | | 5.00 | | | | 8-15-2024 | | | | 5,600,000 | | | | 6,446,440 | |
| | | | |
Dallas County TX Combination Tax and Parking Garage Certification of Obligation | | | 5.00 | | | | 8-15-2025 | | | | 3,235,000 | | | | 3,789,835 | |
| | | | |
Del Rio TX Refunding Bond (Build America Mutual Assurance Company Insured) | | | 4.00 | | | | 6-1-2023 | | | | 720,000 | | | | 774,504 | |
| | | | |
Del Rio TX Refunding Bond (Build America Mutual Assurance Company Insured) | | | 4.00 | | | | 6-1-2024 | | | | 745,000 | | | | 809,077 | |
| | | | |
Denton County TX Permanent Improvement & Refunding Bond | | | 5.00 | | | | 7-15-2023 | | | | 1,990,000 | | | | 2,246,571 | |
| | | | |
Denton County TX Permanent Improvement & Refunding Bond | | | 5.00 | | | | 7-15-2024 | | | | 1,145,000 | | | | 1,318,891 | |
| | | | |
Denton County TX Permanent Improvement & Refunding Bond | | | 5.00 | | | | 7-15-2025 | | | | 1,000,000 | | | | 1,154,700 | |
| | | | |
Denton County TX Permanent Improvement & Refunding Bond | | | 5.00 | | | | 7-15-2030 | | | | 1,000,000 | | | | 1,145,120 | |
| | | | |
El Paso County TX Hospital District | | | 5.00 | | | | 8-15-2028 | | | | 2,045,000 | | | | 2,200,829 | |
| | | | |
El Paso County TX Refunding Bond Series A | | | 5.00 | | | | 2-15-2031 | | | | 2,000,000 | | | | 2,298,760 | |
| | | | |
El Paso County TX Refunding Bond Series A | | | 5.00 | | | | 2-15-2032 | | | | 2,120,000 | | | | 2,426,340 | |
| | | | |
Flower Mound, Denton & Tarrant Counties TX Refunding Bond | | | 4.00 | | | | 3-1-2026 | | | | 755,000 | | | | 824,234 | |
| | | | |
Flower Mound, Denton & Tarrant Counties TX Refunding Bond | | | 5.00 | | | | 3-1-2022 | | | | 1,000,000 | | | | 1,093,360 | |
| | | | |
Flower Mound, Denton & Tarrant Counties TX Refunding Bond | | | 5.00 | | | | 3-1-2023 | | | | 620,000 | | | | 693,104 | |
| | | | |
Flower Mound, Denton & Tarrant Counties TX Refunding Bond | | | 5.00 | | | | 3-1-2024 | | | | 1,660,000 | | | | 1,892,516 | |
| | | | |
Fort Worth TX Independent School District Unlimited Tax Refunding and School Building Bond | | | 5.00 | | | | 2-15-2026 | | | | 3,000,000 | | | | 3,537,510 | |
| | | | |
Harris County TX Cypress-Fairbanks Independent High School SeriesB-1 | | | 2.13 | | | | 2-15-2040 | | | | 10,000,000 | | | | 9,983,400 | |
| | | | |
Harris County TX Tax Road Refunding Bond Series2014-A | | | 5.00 | | | | 10-1-2025 | | | | 8,445,000 | | | | 9,798,227 | |
| | | | |
Harris County TX Tax Road Refunding Bond Series2015-A | | | 5.00 | | | | 10-1-2025 | | | | 4,215,000 | | | | 4,947,946 | |
| | | | |
Harris County TX Toll Road Project Series C (AGM Insured) | | | 5.25 | | | | 8-15-2027 | | | | 4,000,000 | | | | 4,889,480 | |
| | | | |
Hays County TX Limited Tax Bond | | | 5.00 | | | | 2-15-2026 | | | | 650,000 | | | | 759,480 | |
| | | | |
Hays County TX Limited Tax Bond | | | 5.00 | | | | 2-15-2027 | | | | 1,000,000 | | | | 1,183,400 | |
| | | | |
Hays County TX Limited Tax Refunding Bond | | | 5.00 | | | | 2-15-2023 | | | | 1,750,000 | | | | 1,947,645 | |
| | | | |
Northwest TX Independent School District Refunding Bond | | | 5.00 | | | | 2-15-2030 | | | | 4,000,000 | | | | 4,561,400 | |
| | | | |
Plano TX | | | 5.00 | | | | 9-1-2030 | | | | 2,155,000 | | | | 2,524,389 | |
| | | | |
San Antonio TX Certificate of Obligation | | | 5.00 | | | | 8-1-2036 | | | | 3,990,000 | | | | 4,668,061 | |
| | | | |
San Antonio TX Independent School District Unlimited Tax Series 2018 | | | 5.00 | | | | 8-15-2037 | | | | 2,000,000 | | | | 2,251,160 | |
| | | | |
Texas Independent School District Refunding Bond | | | 5.00 | | | | 8-15-2025 | | | | 2,260,000 | | | | 2,643,070 | |
| | | | |
| | | | | | | | | | | | | | | 107,291,568 | |
| | | | | | | | | | | | | | | | |
|
| Miscellaneous Revenue: 0.59% | |
| | | | |
Austin TX Community College District Public Facility Corporation Bond Series C | | | 5.00 | | | | 8-1-2026 | | | | 565,000 | | | | 658,976 | |
| | | | |
Austin TX Community College District Public Facility Corporation Bond Series C | | | 5.00 | | | | 8-1-2029 | | | | 400,000 | | | | 466,352 | |
| | | | |
Austin TX Community College District Public Facility Corporation Bond Series C | | | 5.00 | | | | 8-1-2030 | | | | 500,000 | | | | 580,045 | |
| | | | |
Lower Colorado River TX Authority | | | 5.50 | | | | 5-15-2031 | | | | 2,500,000 | | | | 2,822,725 | |
| | | | |
Texas Transportation Commission Refunding Bond Series B | | | 5.00 | | | | 10-1-2031 | | | | 5,000,000 | | | | 5,894,450 | |
| | | | |
Texas Water Development Board Series A | | | 5.00 | | | | 10-15-2031 | | | | 3,000,000 | | | | 3,567,210 | |
| | | | |
| | | | | | | | | | | | | | | 13,989,758 | |
| | | | | | | | | | | | | | | | |
|
| Resource Recovery Revenue: 0.23% | |
| | | | |
Port Arthur TX Navigation District Jefferson County Environmental Facilities Motiva Enterprises LLC Project Series C ø | | | 2.05 | | | | 4-1-2040 | | | | 5,500,000 | | | | 5,500,000 | |
| | | | | | | | | | | | | | | | |
The accompanying notes are an integral part of these financial statements.
| | | | |
| 36 | | Wells Fargo Intermediate Tax/AMT-Free Fund | | Portfolio of investments—December 31, 2018 (unaudited) |
| | | | | | | | | | | | | | | | |
| Security name | | Interest rate | | | Maturity date | | | Principal | | | Value | |
|
| Tax Revenue: 0.47% | |
| | | | |
Midtown TX RDA (Build America Mutual Assurance Company Insured) | | | 5.25 | % | | | 1-1-2027 | | | $ | 1,880,000 | | | $ | 2,064,860 | |
| | | | |
Midtown TX RDA (Build America Mutual Assurance Company Insured) | | | 5.25 | | | | 1-1-2029 | | | | 2,390,000 | | | | 2,619,297 | |
| | | | |
Midtown TX RDA (Build America Mutual Assurance Company Insured) | | | 5.25 | | | | 1-1-2030 | | | | 1,500,000 | | | | 1,643,325 | |
| | | | |
Midtown TX RDA (Build America Mutual Assurance Company Insured) | | | 5.25 | | | | 1-1-2031 | | | | 1,000,000 | | | | 1,095,550 | |
| | | | |
Texas Transportation Commission Highway Fund Series A | | | 5.00 | | | | 10-1-2025 | | | | 3,250,000 | | | | 3,819,595 | |
| | | | |
| | | | | | | | | | | | | | | 11,242,627 | |
| | | | | | | | | | | | | | | | |
|
| Transportation Revenue: 0.83% | |
| | | | |
Central Texas Regional Mobility Authority Prerefunded Bond Senior Lien | | | 5.75 | | | | 1-1-2019 | | | | 985,000 | | | | 985,000 | |
| | | | |
Central Texas Regional Mobility Authority Series B | | | 5.00 | | | | 1-1-2045 | | | | 8,000,000 | | | | 8,303,520 | |
| | | | |
Central Texas Regional Mobility Authority Unrefunded Bond Senior Lien | | | 5.75 | | | | 1-1-2019 | | | | 325,000 | | | | 325,000 | |
| | | | |
Texas Grand Parkway Transportation Corporation System Series A | | | 5.00 | | | | 10-1-2034 | | | | 1,500,000 | | | | 1,744,515 | |
| | | | |
Texas Private Activity Bond Surface Transportation Corporation | | | 7.50 | | | | 6-30-2032 | | | | 2,000,000 | | | | 2,143,380 | |
| | | | |
Texas Private Activity Bond Surface Transportation Corporation | | | 7.50 | | | | 6-30-2033 | | | | 2,000,000 | | | | 2,142,160 | |
| | | | |
Texas Private Activity Bond Surface Transportation Corporation Senior Lien Note | | | 7.50 | | | | 12-31-2031 | | | | 3,745,000 | | | | 3,927,793 | |
| | | | |
| | | | | | | | | | | | | | | 19,571,368 | |
| | | | | | | | | | | | | | | | |
|
| Utilities Revenue: 0.91% | |
| | | | |
Austin TX Refunding Bond (National Insured) | | | 5.25 | | | | 5-15-2025 | | | | 1,400,000 | | | | 1,581,874 | |
| | | | |
Brownsville TX Utilities System Refunding Bond | | | 5.00 | | | | 9-1-2026 | | | | 2,190,000 | | | | 2,518,150 | |
| | | | |
Brownsville TX Utilities System Refunding Bond | | | 5.00 | | | | 9-1-2029 | | | | 1,500,000 | | | | 1,716,855 | |
| | | | |
Brownsville TX Utilities System Refunding Bond | | | 5.00 | | | | 9-1-2030 | | | | 2,500,000 | | | | 2,853,225 | |
| | | | |
Texas Municipal Gas Acquisition & Supply Corporation III Gas Supply Series 2012 | | | 5.00 | | | | 12-15-2021 | | | | 3,945,000 | | | | 4,249,396 | |
| | | | |
Texas Municipal Gas Acquisition & Supply Corporation Series B | | | 5.00 | | | | 12-15-2022 | | | | 5,000,000 | | | | 5,500,950 | |
| | | | |
Texas SA Energy Acquisition Public Facility Corporation Gas Supply | | | 5.50 | | | | 8-1-2019 | | | | 1,465,000 | | | | 1,490,110 | |
| | | | |
Weatherford TX Utility System Refunding & Improvement Bond (AGM Insured) | | | 5.00 | | | | 9-1-2025 | | | | 1,000,000 | | | | 1,154,480 | |
| | | | |
Weatherford TX Utility System Refunding & Improvement Bond (AGM Insured) | | | 5.00 | | | | 9-1-2026 | | | | 375,000 | | | | 432,683 | |
| | | | |
| | | | | | | | | | | | | | | 21,497,723 | |
| | | | | | | | | | | | | | | | |
|
| Water & Sewer Revenue: 0.52% | |
| | | | |
Amarillo TX Waterworks and Sewer System Bond Series B | | | 5.00 | | | | 4-1-2028 | | | | 645,000 | | | | 775,567 | |
| | | | |
Houston TX Utilities Systems Series A | | | 5.25 | | | | 11-15-2031 | | | | 3,000,000 | | | | 3,186,240 | |
| | | | |
North Harris County TX Regional Water Authority Senior Lien (Build America Mutual Assurance Company Insured) | | | 5.00 | | | | 12-15-2029 | | | | 1,215,000 | | | | 1,334,313 | |
| | | | |
Nueces River TX Water Supply Facility Corpus Christi Lake Texana Project | | | 5.00 | | | | 7-15-2026 | | | | 1,000,000 | | | | 1,162,250 | |
| | | | |
Nueces River TX Water Supply Facility Corpus Christi Lake Texana Project | | | 5.00 | | | | 7-15-2027 | | | | 1,250,000 | | | | 1,443,800 | |
| | | | |
Texas Water Development Board State Implementation Series 2018A | | | 4.00 | | | | 10-15-2032 | | | | 3,000,000 | | | | 3,236,370 | |
| | | | |
Trinity River TX Authority Electric Company Project Series A | | | 4.00 | | | | 2-1-2027 | | | | 1,000,000 | | | | 1,097,420 | |
| | | | |
| | | | | | | | | | | | | | | 12,235,960 | |
| | | | | | | | | | | | | | | | |
| | | | |
| | | | | | | | | | | | | | | 224,926,817 | |
| | | | | | | | | | | | | | | | |
|
Utah: 0.67% | |
|
| Education Revenue: 0.13% | |
| | | | |
Utah Charter School Finance Authority Refunding Bond (CSCE Insured) | | | 4.00 | | | | 4-15-2020 | | | | 250,000 | | | | 255,785 | |
| | | | |
Utah Charter School Finance Authority Refunding Bond (CSCE Insured) | | | 4.00 | | | | 4-15-2021 | | | | 400,000 | | | | 414,580 | |
| | | | |
Utah Charter School Finance Authority Refunding Bond (CSCE Insured) | | | 4.00 | | | | 4-15-2022 | | | | 400,000 | | | | 419,564 | |
| | | | |
Utah Charter School Finance Authority Refunding Bond (CSCE Insured) | | | 4.00 | | | | 4-15-2023 | | | | 400,000 | | | | 424,216 | |
| | | | |
Utah Charter School Finance Authority Refunding Bond (CSCE Insured) | | | 4.00 | | | | 4-15-2024 | | | | 450,000 | | | | 481,590 | |
The accompanying notes are an integral part of these financial statements.
| | | | | | |
| Portfolio of investments—December 31, 2018 (unaudited) | | Wells Fargo Intermediate Tax/AMT-Free Fund | | | 37 | |
| | | | | | | | | | | | | | | | |
| Security name | | Interest rate | | | Maturity date | | | Principal | | | Value | |
|
| Education Revenue(continued) | |
| | | | |
Utah Charter School Finance Authority Refunding Bond (Charter School Credit Enhancement Insured) 144A | | | 4.50 | % | | | 6-15-2027 | | | $ | 1,025,000 | | | $ | 1,007,309 | |
| | | | |
| | | | | | | | | | | | | | | 3,003,044 | |
| | | | | | | | | | | | | | | | |
|
| GO Revenue: 0.09% | |
| | | | |
Canyons UT Board of Education Utah School Bond Guaranty Program (AGM Insured) | | | 5.00 | | | | 6-15-2022 | | | | 1,860,000 | | | | 2,053,607 | |
| | | | | | | | | | | | | | | | |
|
| Health Revenue: 0.29% | |
| | | | |
Murray City UT Hospital Health Services Series D ø | | | 1.68 | | | | 5-15-2036 | | | | 7,000,000 | | | | 7,000,000 | |
| | | | | | | | | | | | | | | | |
|
| Miscellaneous Revenue: 0.16% | |
| | | | |
West Valley City UT Municipal Building Authority (AGM Insured) | | | 5.00 | | | | 2-1-2028 | | | | 1,000,000 | | | | 1,175,420 | |
| | | | |
West Valley City UT Municipal Building Authority (AGM Insured) | | | 5.00 | | | | 2-1-2032 | | | | 1,555,000 | | | | 1,794,672 | |
| | | | |
West Valley City UT Municipal Building Authority (AGM Insured) | | | 5.00 | | | | 2-1-2033 | | | | 645,000 | | | | 741,905 | |
| | | | |
| | | | | | | | | | | | | | | 3,711,997 | |
| | | | | | | | | | | | | | | | |
| | | | |
| | | | | | | | | | | | | | | 15,768,648 | |
| | | | | | | | | | | | | | | | |
|
Virginia: 0.47% | |
|
| Education Revenue: 0.14% | |
| | | | |
Virginia Small Business Financing Authority | | | 5.25 | | | | 10-1-2029 | | | | 3,000,000 | | | | 3,424,980 | |
| | | | | | | | | | | | | | | | |
|
| Housing Revenue: 0.21% | |
| | | | |
Prince William County VA IDA Glen Arbor Apartments Project Series A | | | 1.35 | | | | 7-1-2019 | | | | 5,000,000 | | | | 5,000,000 | |
| | | | | | | | | | | | | | | | |
|
| Miscellaneous Revenue: 0.02% | |
| | | | |
Watkins Centre VA CDA | | | 5.40 | | | | 3-1-2020 | | | | 415,000 | | | | 415,427 | |
| | | | | | | | | | | | | | | | |
|
| Tax Revenue: 0.10% | |
| | | | |
Greater Richmond VA Convention Center | | | 5.00 | | | | 6-15-2025 | | | | 1,000,000 | | | | 1,155,140 | |
| | | | |
Marquis VA CDA CAB Series C (z) | | | 6.25 | | | | 9-1-2041 | | | | 1,772,000 | | | | 88,884 | |
| | | | |
Marquis VA CDA Series 2015 (z)144A | | | 1.32 | | | | 9-1-2045 | | | | 386,000 | | | | 270,779 | |
| | | | |
Marquis VA CDA Series B | | | 5.63 | | | | 9-1-2041 | | | | 1,274,000 | | | | 853,695 | |
| | | | |
| | | | | | | | | | | | | | | 2,368,498 | |
| | | | | | | | | | | | | | | | |
| | | | |
| | | | | | | | | | | | | | | 11,208,905 | |
| | | | | | | | | | | | | | | | |
|
Washington: 3.49% | |
|
| Education Revenue: 0.05% | |
| | | | |
Washington EDFA | | | 5.00 | | | | 6-1-2028 | | | | 1,000,000 | | | | 1,133,350 | |
| | | | | | | | | | | | | | | | |
|
| GO Revenue: 1.56% | |
| | | | |
King County WA Federal Way School District #210 (AGM Insured) | | | 4.00 | | | | 12-1-2023 | | | | 4,085,000 | | | | 4,467,315 | |
| | | | |
King County WA Public Hospital District #1 Valley Medical Center Refunding Bond | | | 5.00 | | | | 12-1-2029 | | | | 1,600,000 | | | | 1,825,040 | |
| | | | |
King County WA Public Hospital District #1 Valley Medical Center Refunding Bond | | | 5.00 | | | | 12-1-2031 | | | | 6,665,000 | | | | 7,512,321 | |
| | | | |
King County WA Public Hospital District #1 Valley Medical Center Refunding Bond | | | 5.00 | | | | 12-1-2032 | | | | 2,905,000 | | | | 3,267,835 | |
| | | | |
King County WA Public Hospital District #1 Valley Medical Center Refunding Bond | | | 5.00 | | | | 12-1-2033 | | | | 7,045,000 | | | | 7,898,784 | |
| | | | |
Seattle WA Refunding Bond Series A | | | 5.00 | | | | 6-1-2024 | | | | 6,345,000 | | | | 7,316,546 | |
| | | | |
Washington Various Purposes Refunding Bond Series B | | | 5.00 | | | | 7-1-2028 | | | | 4,000,000 | | | | 4,657,560 | |
| | | | |
| | | | | | | | | | | | | | | 36,945,401 | |
| | | | | | | | | | | | | | | | |
The accompanying notes are an integral part of these financial statements.
| | | | |
| 38 | | Wells Fargo Intermediate Tax/AMT-Free Fund | | Portfolio of investments—December 31, 2018 (unaudited) |
| | | | | | | | | | | | | | | | |
| Security name | | Interest rate | | | Maturity date | | | Principal | | | Value | |
|
| Health Revenue: 0.84% | |
| | | | |
Washington HCFR Fred Hutchinson Cancer Research Center (SIFMA Municipal Swap +1.05%) ± | | | 2.76 | % | | | 1-1-2042 | | | $ | 10,000,000 | | | $ | 10,175,600 | |
| | | | |
Washington HCFR Fred Hutchinson Cancer Research Center | | | 5.00 | | | | 1-1-2023 | | | | 4,000,000 | | | | 4,405,120 | |
| | | | |
Washington HCFR Fred Hutchinson Cancer Research Center | | | 5.00 | | | | 1-1-2026 | | | | 2,250,000 | | | | 2,576,565 | |
| | | | |
Washington HCFR Fred Hutchinson Cancer Research Center | | | 5.00 | | | | 1-1-2027 | | | | 1,050,000 | | | | 1,196,328 | |
| | | | |
Washington HCFR Fred Hutchinson Cancer Research Center | | | 5.00 | | | | 1-1-2028 | | | | 1,350,000 | | | | 1,528,673 | |
| | | | |
| | | | | | | | | | | | | | | 19,882,286 | |
| | | | | | | | | | | | | | | | |
|
| Miscellaneous Revenue: 0.47% | |
| | | | |
Washington Motor Vehicle Fuel Tax Refunding Bond Series D | | | 5.00 | | | | 7-1-2031 | | | | 5,830,000 | | | | 6,602,009 | |
| | | | |
Washington Office Building Refunding Bond | | | 5.00 | | | | 7-1-2026 | | | | 2,750,000 | | | | 3,131,178 | |
| | | | |
Washington TES Properties | | | 5.50 | | | | 12-1-2029 | | | | 1,400,000 | | | | 1,421,784 | |
| | | | |
| | | | | | | | | | | | | | | 11,154,971 | |
| | | | | | | | | | | | | | | | |
|
| Resource Recovery Revenue: 0.23% | |
| | | | |
Seattle WA Solid Waste System Improvement & Refunding Bond | | | 4.00 | | | | 6-1-2033 | | | | 1,175,000 | | | | 1,248,520 | |
| | | | |
Tacoma WA Solid Waste Refunding Bond Series B | | | 5.00 | | | | 12-1-2027 | | | | 620,000 | | | | 722,430 | |
| | | | |
Tacoma WA Solid Waste Refunding Bond Series B | | | 5.00 | | | | 12-1-2028 | | | | 1,455,000 | | | | 1,685,792 | |
| | | | |
Tacoma WA Solid Waste Refunding Bond Series B | | | 5.00 | | | | 12-1-2029 | | | | 1,525,000 | | | | 1,760,231 | |
| | | | |
| | | | | | | | | | | | | | | 5,416,973 | |
| | | | | | | | | | | | | | | | |
|
| Utilities Revenue: 0.34% | |
| | | | |
Energy Northwest Washington Wind Project | | | 5.00 | | | | 7-1-2022 | | | | 1,185,000 | | | | 1,293,084 | |
| | | | |
Lewis County WA Public Utility District Refunding Bond | | | 5.25 | | | | 4-1-2032 | | | | 6,115,000 | | | | 6,924,137 | |
| | | | |
| | | | | | | | | | | | | | | 8,217,221 | |
| | | | | | | | | | | | | | | | |
| | | | |
| | | | | | | | | | | | | | | 82,750,202 | |
| | | | | | | | | | | | | | | | |
|
West Virginia: 0.50% | |
|
| GO Revenue: 0.20% | |
| | | | |
West Virginia State Road Bond Series 2018 B | | | 5.00 | | | | 12-1-2036 | | | | 4,000,000 | | | | 4,648,040 | |
| | | | | | | | | | | | | | | | |
|
| Health Revenue: 0.06% | |
| | | | |
West Virginia Hospital Finance Authority West Virginia University Health System Series A | | | 5.00 | | | | 6-1-2031 | | | | 375,000 | | | | 423,536 | |
| | | | |
West Virginia Hospital Finance Authority West Virginia University Health System Series A | | | 5.00 | | | | 6-1-2032 | | | | 950,000 | | | | 1,067,002 | |
| | | | |
| | | | | | | | | | | | | | | 1,490,538 | |
| | | | | | | | | | | | | | | | |
|
| Miscellaneous Revenue: 0.24% | |
| | | | |
West Virginia School Building Authority Capital Improvement Bond Series A | | | 5.00 | | | | 7-1-2026 | | | | 1,520,000 | | | | 1,758,321 | |
| | | | |
West Virginia School Building Authority Capital Improvement Bond Series A | | | 5.00 | | | | 7-1-2027 | | | | 1,595,000 | | | | 1,838,860 | |
| | | | |
West Virginia School Building Authority Capital Improvement Bond Series A | | | 5.00 | | | | 7-1-2029 | | | | 1,755,000 | | | | 2,010,844 | |
| | | | |
| | | | | | | | | | | | | | | 5,608,025 | |
| | | | | | | | | | | | | | | | |
| | | | |
| | | | | | | | | | | | | | | 11,746,603 | |
| | | | | | | | | | | | | | | | |
The accompanying notes are an integral part of these financial statements.
| | | | | | |
| Portfolio of investments—December 31, 2018 (unaudited) | | Wells Fargo Intermediate Tax/AMT-Free Fund | | | 39 | |
| | | | | | | | | | | | | | | | |
| Security name | | Interest rate | | | Maturity date | | | Principal | | | Value | |
|
Wisconsin: 0.76% | |
|
| Education Revenue: 0.27% | |
| | | | |
Wisconsin PFA Charter School Voyager Foundation Incorporate Project Series A | | | 6.00 | % | | | 10-1-2032 | | | $ | 1,475,000 | | | $ | 1,573,368 | |
| | | | |
Wisconsin PFA KU Campus Development Corporation Central District Development Project | | | 5.00 | | | | 3-1-2032 | | | | 4,315,000 | | | | 4,870,211 | |
| | | | |
| | | | | | | | | | | | | | | 6,443,579 | |
| | | | | | | | | | | | | | | | |
|
| GO Revenue: 0.09% | |
| | | | |
Wisconsin Series A | | | 4.00 | | | | 5-1-2032 | | | | 2,000,000 | | | | 2,085,400 | |
| | | | | | | | | | | | | | | | |
|
| Health Revenue: 0.35% | |
| | | | |
Wisconsin HEFA Bellin Memorial Hospital Obligated Group (Ambac Insured) | | | 5.50 | | | | 2-15-2019 | | | | 210,000 | | | | 210,874 | |
| | | | |
Wisconsin HEFA Mercy Alliance Incorporated Project Series A | | | 5.00 | | | | 6-1-2019 | | | | 255,000 | | | | 257,930 | |
| | | | |
Wisconsin HEFA Series A | | | 5.00 | | | | 7-15-2021 | | | | 3,500,000 | | | | 3,768,905 | |
| | | | |
Wisconsin HEFA Series A | | | 5.00 | | | | 11-15-2023 | | | | 3,500,000 | | | | 3,932,635 | |
| | | | |
| | | | | | | | | | | | | | | 8,170,344 | |
| | | | | | | | | | | | | | | | |
|
| Miscellaneous Revenue: 0.05% | |
| | | | |
Milwaukee WI RDA Public Schools | | | 5.00 | | | | 11-15-2029 | | | | 420,000 | | | | 481,627 | |
| | | | |
Milwaukee WI RDA Public Schools | | | 5.00 | | | | 11-15-2030 | | | | 635,000 | | | | 724,814 | |
| | | | |
| | | | | | | | | | | | | | | 1,206,441 | |
| | | | | | | | | | | | | | | | |
| | | | |
| | | | | | | | | | | | | | | 17,905,764 | |
| | | | | | | | | | | | | | | | |
| |
Total Municipal Obligations (Cost $2,286,447,501) | | | | 2,340,888,620 | |
| | | | | | | | | | | | | | | | |
| | | | | | | | |
| Total investments in securities (Cost $2,286,447,501) | | | 98.70 | % | | | 2,340,888,620 | |
| | |
Other assets and liabilities, net | | | 1.30 | | | | 30,893,957 | |
| | | | | | | | |
| Total net assets | | | 100.00 | % | | $ | 2,371,782,577 | |
| | | | | | | | |
| (z) | Zero coupon security. The rate represents the purchase yield to maturity. |
| ± | Variable rate investment. The rate shown is the rate in effect at period end. |
| 144A | The security may be resold in transactions exempt from registration, normally to qualified institutional buyers, pursuant to Rule 144A under the Securities Act of 1933. |
| ø | Variable rate demand notes are subject to a demand feature which reduces the effective maturity. The maturity date shown represents the final maturity date of the security. The interest rate is determined and reset by the issuer daily, weekly, or monthly depending upon the terms of the security. The rate shown is the rate in effect at period end. |
The accompanying notes are an integral part of these financial statements.
| | | | |
| 40 | | Wells Fargo Intermediate Tax/AMT-Free Fund | | Portfolio of investments—December 31, 2018 (unaudited) |
Abbreviations:
| AGC | Assured Guaranty Corporation |
| AGM | Assured Guaranty Municipal |
| Ambac | Ambac Financial Group Incorporated |
| BHAC | Berkshire Hathaway Assurance Corporation |
| CAB | Capital appreciation bond |
| CDA | Community Development Authority |
| ECFA | Educational & Cultural Facilities Authority |
| EDA | Economic Development Authority |
| EDFA | Economic Development Finance Authority |
| FHLMC | Federal Home Loan Mortgage Corporation |
| FNMA | Federal National Mortgage Association |
| GNMA | Government National Mortgage Association |
| HCFR | Healthcare facilities revenue |
| HEFA | Health & Educational Facilities Authority |
| HEFAR | Higher Education Facilities Authority Revenue |
| HFA | Housing Finance Authority |
| HFFA | Health Facilities Financing Authority |
| IDA | Industrial Development Authority |
| LIBOR | London Interbank Offered Rate |
| MFHR | Multifamily housing revenue |
| MUD | Municipal Utility District |
| National | National Public Finance Guarantee Corporation |
| PCR | Pollution control revenue |
| PFA | Public Finance Authority |
| PFFA | Public Facilities Financing Authority |
| RDA | Redevelopment Authority |
| SFMR | Single-family mortgage revenue |
| SIFMA | Securities Industry and Financial Markets Association |
| TTFA | Transportation Trust Fund Authority |
The accompanying notes are an integral part of these financial statements.
| | | | | | |
| Statement of assets and liabilities—December 31, 2018 (unaudited) | | Wells Fargo Intermediate Tax/AMT-Free Fund | | | 41 | |
| | | | |
| | | | |
| |
Assets | | | | |
Investments in unaffiliated securities, at value (cost $2,286,447,501) | | $ | 2,340,888,620 | |
Cash | | | 4,733,148 | |
Receivable for investments sold | | | 4,645,000 | |
Receivable for Fund shares sold | | | 7,808,379 | |
Receivable for interest | | | 26,498,099 | |
Prepaid expenses and other assets | | | 70,022 | |
| | | | |
Total assets | | | 2,384,643,268 | |
| | | | |
| |
Liabilities | | | | |
Payable for Fund shares redeemed | | | 10,194,764 | |
Dividends payable | | | 1,572,412 | |
Management fee payable | | | 682,275 | |
Administration fees payable | | | 156,446 | |
Distribution fee payable | | | 21,426 | |
Trustees’ fees and expenses payable | | | 494 | |
Accrued expenses and other liabilities | | | 232,874 | |
| | | | |
Total liabilities | | | 12,860,691 | |
| | | | |
Total net assets | | $ | 2,371,782,577 | |
| | | | |
| |
NET ASSETS CONSIST OF | | | | |
Paid-in capital | | $ | 2,349,858,997 | |
Total distributable earnings | | | 21,923,580 | |
| | | | |
Total net assets | | $ | 2,371,782,577 | |
| | | | |
| |
COMPUTATION OF NET ASSET VALUE AND OFFERING PRICE PER SHARE | | | | |
Net assets – Class A | | $ | 263,885,365 | |
Shares outstanding – Class A1 | | | 23,317,136 | |
Net asset value per share – Class A | | | $11.32 | |
Maximum offering price per share – Class A2 | | | $11.67 | |
Net assets – Class C | | $ | 32,733,176 | |
Shares outstanding – Class C1 | | | 2,892,498 | |
Net asset value per share – Class C | | | $11.32 | |
Net assets – Class R6 | | $ | 728,521,487 | |
Shares outstanding – Class R61 | | | 64,304,525 | |
Net asset value per share – Class R6 | | | $11.33 | |
Net assets – Administrator Class | | $ | 143,643,791 | |
Shares outstanding – Administrator Class1 | | | 12,684,882 | |
Net asset value per share – Administrator Class | | | $11.32 | |
Net assets – Institutional Class | | $ | 1,202,998,758 | |
Shares outstanding – Institutional Class1 | | | 106,148,491 | |
Net asset value per share – Institutional Class | | | $11.33 | |
| 1 | The Fund has an unlimited number of authorized shares. |
| 2 | Maximum offering price is computed as 100/97 of net asset value. On investments of $50,000 or more, the offering price is reduced. |
The accompanying notes are an integral part of these financial statements.
| | | | |
| 42 | | Wells Fargo Intermediate Tax/AMT-Free Fund | | Statement of operations—six months ended December 31, 2018 (unaudited) |
| | | | |
| | | | |
| |
Investment income | | | | |
Interest | | $ | 38,950,542 | |
| | | | |
| |
Expenses | | | | |
Management fee | | | 4,447,487 | |
Administration fees | | | | |
Class A | | | 221,309 | |
Class C | | | 27,124 | |
Class R6 | | | 28,651 | 1 |
Administrator Class | | | 85,408 | |
Institutional Class | | | 704,412 | |
Shareholder servicing fees | | | | |
Class A | | | 345,796 | |
Class C | | | 42,381 | |
Administrator Class | | | 213,069 | |
Distribution fee | | | | |
Class C | | | 127,143 | |
Custody and accounting fees | | | 20,332 | |
Professional fees | | | 39,126 | |
Registration fees | | | 76,772 | |
Shareholder report expenses | | | 77,124 | |
Trustees’ fees and expenses | | | 10,697 | |
Other fees and expenses | | | 40,981 | |
| | | | |
Total expenses | | | 6,507,812 | |
Less: Fee waivers and/or expense reimbursements | | | (438,622 | ) |
| | | | |
Net expenses | | | 6,069,190 | |
| | | | |
Net investment income | | | 32,881,352 | |
| | | | |
| |
REALIZED AND UNREALIZED GAINS (LOSSES) ON INVESTMENTS | | | | |
Net realized losses on investments | | | (4,188,985 | ) |
Net change in unrealized gains (losses) on investments | | | 3,590,986 | |
| | | | |
Net realized and unrealized gains (losses) on investments | | | (597,999 | ) |
| | | | |
Net increase in net assets resulting from operations | | $ | 32,283,353 | |
| | | | |
| 1 | For the period from July 31, 2018 (commencement of operations) to December 31, 2018. |
The accompanying notes are an integral part of these financial statements.
| | | | | | |
| Statement of changes in net assets | | Wells Fargo Intermediate Tax/AMT-Free Fund | | | 43 | |
| | | | | | | | | | | | | | | | |
| | | Six months ended
December 31, 2018
(unaudited) | | | Year ended
June 30, 20181 | |
| | | | |
Operations | | | | | | | | | | | | | | | | |
Net investment income | | | | | | $ | 32,881,352 | | | | | | | $ | 64,629,670 | |
Net realized losses on investments | | | | | | | (4,188,985 | ) | | | | | | | (20,159,193 | ) |
Net change in unrealized gains (losses) on investments | | | | | | | 3,590,986 | | | | | | | | (11,473,459 | ) |
| | | | |
Net increase in net assets resulting from operations | | | | | | | 32,283,353 | | | | | | | | 32,997,018 | |
| | | | |
| | | | |
Distributions to shareholders from net investment income and net realized gains | | | | | | | | | | | | | | | | |
Class A | | | | | | | (3,469,239 | ) | | | | | | | (7,895,731 | ) |
Class C | | | | | | | (298,157 | ) | | | | | | | (658,860 | ) |
Class R6 | | | | | | | (2,701,113 | )2 | | | | | | | N/A | |
Administrator Class | | | | | | | (2,226,514 | ) | | | | | | | (5,042,057 | ) |
Institutional Class | | | | | | | (24,187,944 | ) | | | | | | | (51,032,969 | ) |
| | | | |
Total distributions to shareholders | | | | | | | (32,882,967 | ) | | | | | | | (64,629,617 | ) |
| | | | |
| | | | |
Capital share transactions | | | Shares | | | | | | | | Shares | | | | | |
Proceeds from shares sold | | | | | | | | | | | | | | | | |
Class A | | | 854,225 | | | | 9,631,517 | | | | 1,632,641 | | | | 18,704,577 | |
Class C | | | 140,478 | | | | 1,581,038 | | | | 197,033 | | | | 2,251,627 | |
Class R6 | | | 67,703,798 | 2 | | | 756,908,966 | 2 | | | N/A | | | | N/A | |
Administrator Class | | | 2,365,777 | | | | 26,674,169 | | | | 5,587,566 | | | | 63,999,285 | |
Institutional Class | | | 31,275,466 | | | | 352,774,218 | | | | 64,629,532 | | | | 740,609,789 | |
| | | | |
| | | | | | | 1,147,569,908 | | | | | | | | 825,565,278 | |
| | | | |
Reinvestment of distributions | | | | | | | | | | | | | | | | |
Class A | | | 293,860 | | | | 3,308,617 | | | | 661,923 | | | | 7,556,467 | |
Class C | | | 24,257 | | | | 273,106 | | | | 53,280 | | | | 608,195 | |
Class R6 | | | 126,600 | 2 | | | 1,429,031 | 2 | | | N/A | | | | N/A | |
Administrator Class | | | 190,751 | | | | 2,149,095 | | | | 427,778 | | | | 4,887,456 | |
Institutional Class | | | 1,445,679 | | | | 16,290,762 | | | | 2,842,189 | | | | 32,483,030 | |
| | | | |
| | | | | | | 23,450,611 | | | | | | | | 45,535,148 | |
| | | | |
Payment for shares redeemed | | | | | | | | | | | | | | | | |
Class A | | | (3,232,456 | ) | | | (36,358,314 | ) | | | (8,283,850 | ) | | | (94,494,393 | ) |
Class C | | | (402,958 | ) | | | (4,529,824 | ) | | | (1,000,458 | ) | | | (11,414,204 | ) |
Class R6 | | | (3,525,873 | )2 | | | (39,758,349 | )2 | | | N/A | | | | N/A | |
Administrator Class | | | (6,091,250 | ) | | | (68,384,351 | ) | | | (16,814,971 | ) | | | (193,295,593 | ) |
Institutional Class | | | (97,141,235 | ) | | | (1,088,442,538 | ) | | | (55,101,625 | ) | | | (630,172,565 | ) |
| | | | |
| | | | | | | (1,237,473,376 | ) | | | | | | | (929,376,755 | ) |
| | | | |
Net decrease in net assets resulting from capital share transactions | | | | | | | (66,452,857 | ) | | | | | | | (58,276,329 | ) |
| | | | |
Total decrease in net assets | | | | | | | (67,052,471 | ) | | | | | | | (89,908,928 | ) |
| | | | |
| | | | |
Net assets | | | | | | | | | | | | | | | | |
Beginning of period | | | | | | | 2,438,835,048 | | | | | | | | 2,528,743,976 | |
| | | | |
End of period | | | | | | $ | 2,371,782,577 | | | | | | | $ | 2,438,835,048 | |
| | | | |
| 1 | Effective for all filings after November 4, 2018, the SEC prospectively eliminated the requirement to parenthetically disclose undistributed net investment income at the end of the period and permitted the aggregation of distributions, with the exception of tax basis returns of capital. Overdistributed net investment income at June 30, 2018 was $54,682. The disaggregated distributions information for the year ended June 30, 2018 is included in Note 7,Distributions to Shareholders, in the notes to the financial statements. |
| 2 | For the period from July 31, 2018 (commencement of operations) to December 31, 2018. |
The accompanying notes are an integral part of these financial statements.
| | | | |
| 44 | | Wells Fargo Intermediate Tax/AMT-Free Fund | | Financial highlights |
(For a share outstanding throughout each period)
| | | | | | | | | | | | | | | | | | | | | | | | |
| | | Six months ended
December 31, 2018 (unaudited) | | | Year ended June 30 | |
| CLASS A | | 2018 | | | 2017 | | | 2016 | | | 2015 | | | 2014 | |
Net asset value, beginning of period | | | $11.31 | | | | $11.46 | | | | $11.89 | | | | $11.47 | | | | $11.53 | | | | $11.31 | |
Net investment income | | | 0.14 | | | | 0.27 | | | | 0.27 | | | | 0.26 | | | | 0.25 | | | | 0.30 | |
Net realized and unrealized gains (losses) on investments | | | 0.01 | | | | (0.15 | ) | | | (0.42 | ) | | | 0.42 | | | | (0.06 | ) | | | 0.29 | |
| | | | | | | | | | | | | | | | | | | | | | | | |
Total from investment operations | | | 0.15 | | | | 0.12 | | | | (0.15 | ) | | | 0.68 | | | | 0.19 | | | | 0.59 | |
Distributions to shareholders from | | | | | | | | | | | | | | | | | | | | | | | | |
Net investment income | | | (0.14 | ) | | | (0.27 | ) | | | (0.27 | ) | | | (0.26 | ) | | | (0.25 | ) | | | (0.30 | ) |
Net realized gains | | | 0.00 | | | | 0.00 | | | | (0.01 | ) | | | 0.00 | | | | 0.00 | | | | (0.07 | ) |
| | | | | | | | | | | | | | | | | | | | | | | | |
Total distributions to shareholders | | | (0.14 | ) | | | (0.27 | ) | | | (0.28 | ) | | | (0.26 | ) | | | (0.25 | ) | | | (0.37 | ) |
Net asset value, end of period | | | $11.32 | | | | $11.31 | | | | $11.46 | | | | $11.89 | | | | $11.47 | | | | $11.53 | |
Total return1 | | | 1.36 | % | | | 1.08 | % | | | (1.27 | )% | | | 5.99 | % | | | 1.68 | % | | | 5.37 | % |
Ratios to average net assets (annualized) | | | | | | | | | | | | | | | | | | | | | | | | |
Gross expenses | | | 0.80 | % | | | 0.80 | % | | | 0.79 | % | | | 0.80 | % | | | 0.80 | % | | | 0.81 | % |
Net expenses | | | 0.70 | % | | | 0.70 | % | | | 0.70 | % | | | 0.70 | % | | | 0.70 | % | | | 0.70 | % |
Net investment income | | | 2.51 | % | | | 2.38 | % | | | 2.31 | % | | | 2.23 | % | | | 2.19 | % | | | 2.66 | % |
Supplemental data | | | | | | | | | | | | | | | | | | | | | | | | |
Portfolio turnover rate | | | 12 | % | | | 14 | % | | | 19 | % | | | 14 | % | | | 38 | % | | | 29 | % |
Net assets, end of period (000s omitted) | | | $263,885 | | | | $287,408 | | | | $359,649 | | | | $556,673 | | | | $214,880 | | | | $264,796 | |
| 1 | Total return calculations do not include any sales charges. Returns for periods of less than one year are not annualized. |
The accompanying notes are an integral part of these financial statements.
| | | | | | |
| Financial highlights | | Wells Fargo Intermediate Tax/AMT-Free Fund | | | 45 | |
(For a share outstanding throughout each period)
| | | | | | | | | | | | | | | | | | | | | | | | |
| | | Six months ended
December 31, 2018 (unaudited) | | | Year ended June 30 | |
| CLASS C | | 2018 | | | 2017 | | | 2016 | | | 2015 | | | 2014 | |
Net asset value, beginning of period | | | $11.31 | | | | $11.46 | | | | $11.89 | | | | $11.47 | | | | $11.53 | | | | $11.31 | |
Net investment income | | | 0.10 | | | | 0.19 | | | | 0.18 | | | | 0.17 | | | | 0.17 | | | | 0.22 | |
Net realized and unrealized gains (losses) on investments | | | 0.01 | | | | (0.15 | ) | | | (0.42 | ) | | | 0.42 | | | | (0.06 | ) | | | 0.29 | |
| | | | | | | | | | | | | | | | | | | | | | | | |
Total from investment operations | | | 0.11 | | | | 0.04 | | | | (0.24 | ) | | | 0.59 | | | | 0.11 | | | | 0.51 | |
Distributions to shareholders from | | | | | | | | | | | | | | | | | | | | | | | | |
Net investment income | | | (0.10 | ) | | | (0.19 | ) | | | (0.18 | ) | | | (0.17 | ) | | | (0.17 | ) | | | (0.22 | ) |
Net realized gains | | | 0.00 | | | | 0.00 | | | | (0.01 | ) | | | 0.00 | | | | 0.00 | | | | (0.07 | ) |
| | | | | | | | | | | | | | | | | | | | | | | | |
Total distributions to shareholders | | | (0.10 | ) | | | (0.19 | ) | | | (0.19 | ) | | | (0.17 | ) | | | (0.17 | ) | | | (0.29 | ) |
Net asset value, end of period | | | $11.32 | | | | $11.31 | | | | $11.46 | | | | $11.89 | | | | $11.47 | | | | $11.53 | |
Total return1 | | | 0.98 | % | | | 0.32 | % | | | (2.01 | )% | | | 5.20 | % | | | 0.92 | % | | | 4.59 | % |
Ratios to average net assets (annualized) | | | | | | | | | | | | | | | | | | | | | | | | |
Gross expenses | | | 1.55 | % | | | 1.55 | % | | | 1.54 | % | | | 1.55 | % | | | 1.55 | % | | | 1.56 | % |
Net expenses | | | 1.45 | % | | | 1.45 | % | | | 1.45 | % | | | 1.45 | % | | | 1.45 | % | | | 1.45 | % |
Net investment income | | | 1.76 | % | | | 1.63 | % | | | 1.56 | % | | | 1.48 | % | | | 1.44 | % | | | 1.92 | % |
Supplemental data | | | | | | | | | | | | | | | | | | | | | | | | |
Portfolio turnover rate | | | 12 | % | | | 14 | % | | | 19 | % | | | 14 | % | | | 38 | % | | | 29 | % |
Net assets, end of period (000s omitted) | | | $32,733 | | | | $35,421 | | | | $44,462 | | | | $56,601 | | | | $56,703 | | | | $57,580 | |
| 1 | Total return calculations do not include any sales charges. Returns for periods of less than one year are not annualized. |
The accompanying notes are an integral part of these financial statements.
| | | | |
| 46 | | Wells Fargo Intermediate Tax/AMT-Free Fund | | Financial highlights |
(For a share outstanding throughout the period)
| | | | |
| CLASS R6 | | Period ended December 31, 2018 (unaudited)1 | |
Net asset value, beginning of period | | | $11.33 | |
Net investment income | | | 0.13 | |
Net realized and unrealized gains (losses) on investments | | | 0.00 | 2 |
| | | | |
Total from investment operations | | | 0.13 | |
Distributions to shareholders from | | | | |
Net investment income | | | (0.13 | ) |
Net asset value, end of period | | | $11.33 | |
Total return3 | | | 1.20 | % |
Ratios to average net assets (annualized) | | | | |
Gross expenses | | | 0.42 | % |
Net expenses | | | 0.40 | % |
Net investment income | | | 2.83 | % |
Supplemental data | | | | |
Portfolio turnover rate | | | 12 | % |
Net assets, end of period (000s omitted) | | | $728,521 | |
| 1 | For the period from July 31, 2018 (commencement of operations) to December 31, 2018. |
| 2 | Amount is less than $0.005. |
| 3 | Returns for periods of less than one year are not annualized. |
The accompanying notes are an integral part of these financial statements.
| | | | | | |
| Financial highlights | | Wells Fargo Intermediate Tax/AMT-Free Fund | | | 47 | |
(For a share outstanding throughout each period)
| | | | | | | | | | | | | | | | | | | | | | | | |
| | | Six months ended
December 31, 2018 (unaudited) | | | Year ended June 30 | |
| ADMINISTRATOR CLASS | | 2018 | | | 2017 | | | 2016 | | | 2015 | | | 2014 | |
Net asset value, beginning of period | | | $11.32 | | | | $11.47 | | | | $11.90 | | | | $11.48 | | | | $11.54 | | | | $11.32 | |
Net investment income | | | 0.15 | | | | 0.28 | | | | 0.28 | | | | 0.27 | | | | 0.27 | | | | 0.31 | |
Net realized and unrealized gains (losses) on investments | | | (0.00 | )1 | | | (0.15 | ) | | | (0.42 | ) | | | 0.42 | | | | (0.06 | ) | | | 0.29 | |
| | | | | | | | | | | | | | | | | | | | | | | | |
Total from investment operations | | | 0.15 | | | | 0.13 | | | | (0.14 | ) | | | 0.69 | | | | 0.21 | | | | 0.60 | |
Distributions to shareholders from | | | | | | | | | | | | | | | | | | | | | | | | |
Net investment income | | | (0.15 | ) | | | (0.28 | ) | | | (0.28 | ) | | | (0.27 | ) | | | (0.27 | ) | | | (0.31 | ) |
Net realized gains | | | 0.00 | | | | 0.00 | | | | (0.01 | ) | | | 0.00 | | | | 0.00 | | | | (0.07 | ) |
| | | | | | | | | | | | | | | | | | | | | | | | |
Total distributions to shareholders | | | (0.15 | ) | | | (0.28 | ) | | | (0.29 | ) | | | (0.27 | ) | | | (0.27 | ) | | | (0.38 | ) |
Net asset value, end of period | | | $11.32 | | | | $11.32 | | | | $11.47 | | | | $11.90 | | | | $11.48 | | | | $11.54 | |
Total return2 | | | 1.32 | % | | | 1.18 | % | | | (1.17 | )% | | | 6.09 | % | | | 1.78 | % | | | 5.47 | % |
Ratios to average net assets (annualized) | | | | | | | | | | | | | | | | | | | | | | | | |
Gross expenses | | | 0.74 | % | | | 0.73 | % | | | 0.73 | % | | | 0.74 | % | | | 0.74 | % | | | 0.75 | % |
Net expenses | | | 0.60 | % | | | 0.60 | % | | | 0.60 | % | | | 0.60 | % | | | 0.60 | % | | | 0.60 | % |
Net investment income | | | 2.61 | % | | | 2.48 | % | | | 2.39 | % | | | 2.33 | % | | | 2.29 | % | | | 2.76 | % |
Supplemental data | | | | | | | | | | | | | | | | | | | | | | | | |
Portfolio turnover rate | | | 12 | % | | | 14 | % | | | 19 | % | | | 14 | % | | | 38 | % | | | 29 | % |
Net assets, end of period (000s omitted) | | | $143,644 | | | | $183,624 | | | | $309,793 | | | | $802,527 | | | | $773,770 | | | | $668,517 | |
| 1 | Amount is more than $(0.005). |
| 2 | Returns for periods of less than one year are not annualized. |
The accompanying notes are an integral part of these financial statements.
| | | | |
| 48 | | Wells Fargo Intermediate Tax/AMT-Free Fund | | Financial highlights |
(For a share outstanding throughout each period)
��
| | | | | | | | | | | | | | | | | | | | | | | | |
| | | Six months ended
December 31, 2018 (unaudited) | | | Year ended June 30 | |
| INSTITUTIONAL CLASS | | 2018 | | | 2017 | | | 2016 | | | 2015 | | | 2014 | |
Net asset value, beginning of period | | | $11.33 | | | | $11.47 | | | | $11.91 | | | | $11.49 | | | | $11.55 | | | | $11.32 | |
Net investment income | | | 0.16 | | | | 0.30 | | | | 0.30 | | | | 0.29 | | | | 0.29 | | | | 0.33 | |
Net realized and unrealized gains (losses) on investments | | | (0.00 | )1 | | | (0.14 | ) | | | (0.43 | ) | | | 0.42 | | | | (0.06 | ) | | | 0.30 | |
| | | | | | | | | | | | | | | | | | | | | | | | |
Total from investment operations | | | 0.16 | | | | 0.16 | | | | (0.13 | ) | | | 0.71 | | | | 0.23 | | | | 0.63 | |
Distributions to shareholders from | | | | | | | | | | | | | | | | | | | | | | | | |
Net investment income | | | (0.16 | ) | | | (0.30 | ) | | | (0.30 | ) | | | (0.29 | ) | | | (0.29 | ) | | | (0.33 | ) |
Net realized gains | | | 0.00 | | | | 0.00 | | | | (0.01 | ) | | | 0.00 | | | | 0.00 | | | | (0.07 | ) |
| | | | | | | | | | | | | | | | | | | | | | | | |
Total distributions to shareholders | | | (0.16 | ) | | | (0.30 | ) | | | (0.31 | ) | | | (0.29 | ) | | | (0.29 | ) | | | (0.40 | ) |
Net asset value, end of period | | | $11.33 | | | | $11.33 | | | | $11.47 | | | | $11.91 | | | | $11.49 | | | | $11.55 | |
Total return2 | | | 1.40 | % | | | 1.42 | % | | | (1.10 | )% | | | 6.26 | % | | | 1.97 | % | | | 5.75 | % |
Ratios to average net assets (annualized) | | | | | | | | | | | | | | | | | | | | | | | | |
Gross expenses | | | 0.47 | % | | | 0.47 | % | | | 0.47 | % | | | 0.47 | % | | | 0.47 | % | | | 0.48 | % |
Net expenses | | | 0.45 | % | | | 0.45 | % | | | 0.45 | % | | | 0.44 | % | | | 0.42 | % | | | 0.42 | % |
Net investment income | | | 2.75 | % | | | 2.64 | % | | | 2.58 | % | | | 2.49 | % | | | 2.47 | % | | | 2.94 | % |
Supplemental data | | | | | | | | | | | | | | | | | | | | | | | | |
Portfolio turnover rate | | | 12 | % | | | 14 | % | | | 19 | % | | | 14 | % | | | 38 | % | | | 29 | % |
Net assets, end of period (000s omitted) | | | $1,202,999 | | | | $1,932,382 | | | | $1,814,841 | | | | $1,260,636 | | | | $878,585 | | | | $599,686 | |
| 1 | Amount is more than $(0.005). |
| 2 | Returns for periods of less than one year are not annualized. |
The accompanying notes are an integral part of these financial statements.
| | | | | | |
| Notes to financial statements (unaudited) | | Wells Fargo Intermediate Tax/AMT-Free Fund | | | 49 | |
1. ORGANIZATION
Wells Fargo Funds Trust (the “Trust”), a Delaware statutory trust organized on March 10, 1999, is anopen-end management investment company registered under the Investment Company Act of 1940, as amended (the “1940 Act”). As an investment company, the Trust follows the accounting and reporting guidance in Financial Accounting Standards Board (“FASB”)Accounting Standards Codification Topic 946, Financial Services – Investment Companies. These financial statements report on the Wells Fargo IntermediateTax\AMT-Free Fund (the “Fund”) which is a diversified series of the Trust.
2. SIGNIFICANT ACCOUNTING POLICIES
The following significant accounting policies, which are consistently followed in the preparation of the financial statements of the Fund, are in conformity with U.S. generally accepted accounting principles which require management to make estimates and assumptions that affect the reported amounts of assets and liabilities, disclosure of contingent assets and liabilities at the date of the financial statements, and the reported amounts of revenues and expenses during the reporting period. Actual results could differ from those estimates.
Securities valuation
All investments are valued each business day as of the close of regular trading on the New York Stock Exchange (generally 4 p.m. Eastern Time), although the Fund may deviate from this calculation time under unusual or unexpected circumstances.
Debt securities are valued at the evaluated bid price provided by an independent pricing service (e.g. taking into account various factors, including yields, maturities, or credit ratings) or, if a reliable price is not available, the quoted bid price from an independent broker-dealer.
Investments which are not valued using any of the methods discussed above are valued at their fair value, as determined in good faith by the Board of Trustees of the Fund. The Board of Trustees has established a Valuation Committee comprised of the Trustees and has delegated to it the authority to take any actions regarding the valuation of portfolio securities that the Valuation Committee deems necessary or appropriate, including determining the fair value of portfolio securities, unless the determination has been delegated to the Wells Fargo Asset Management Pricing Committee at Wells Fargo Funds Management, LLC (“Funds Management”). The Board of Trustees retains the authority to make or ratify any valuation decisions or approve any changes to the Valuation Procedures as it deems appropriate. On a quarterly basis, the Board of Trustees receives reports on any valuation actions taken by the Valuation Committee or the Wells Fargo Asset Management Pricing Committee which may include items for ratification.
When-issued transactions
The Fund may purchase securities on a forward commitment or when-issued basis. The Fund records a when-issued transaction on the trade date and will segregate assets in an amount at least equal in value to the Fund’s commitment to purchase when-issued securities. Securities purchased on a when-issued basis aremarked-to-market daily and the Fund begins earning interest on the settlement date. Losses may arise due to changes in the market value of the underlying securities or if the counterparty does not perform under the contract.
Security transactions and income recognition
Securities transactions are recorded on a trade date basis. Realized gains or losses are recorded on the basis of identified cost.
Interest income is accrued daily and bond discounts are accreted and premiums are amortized daily. To the extent debt obligations are placed onnon-accrual status, any related interest income may be reduced by writing off interest receivables when the collection of all or a portion of interest has been determined to be doubtful based on consistently applied procedures and the fair value has decreased. If the issuer subsequently resumes interest payments or when the collectability of interest is reasonably assured, the debt obligation is removed fromnon-accrual status.
Distributions to shareholders
Distributions to shareholders from net investment income are declared daily and paid monthly. Distributions from net realized gains, if any, are recorded on theex-dividend date and paid at least annually. Such distributions are determined in accordance with income tax regulations and may differ from U.S. generally accepted accounting principles. Dividend sources are estimated at the time of declaration. The tax character of distributions is determined as of the Fund’s fiscal year end. Therefore, a portion of the Fund’s distributions made prior to the Fund’s fiscal year end may be categorized as a tax return of capital at year end.
| | | | |
| 50 | | Wells Fargo Intermediate Tax/AMT-Free Fund | | Notes to financial statements (unaudited) |
Federal and other taxes
The Fund intends to continue to qualify as a regulated investment company by distributing substantially all of its investment company taxable andtax-exempt income and any net realized capital gains (after reduction for capital loss carryforwards) sufficient to relieve it from all, or substantially all, federal income taxes. Accordingly, no provision for federal income taxes was required.
The Fund’s income and federal excise tax returns and all financial records supporting those returns for the prior three fiscal years are subject to examination by the federal and Delaware revenue authorities. Management has analyzed the Fund’s tax positions taken on federal, state, and foreign tax returns for all open tax years and does not believe that there are any uncertain tax positions that require recognition of a tax liability.
As of December 31, 2018, the aggregate cost of all investments for federal income tax purposes was $2,286,446,823 and the unrealized gains (losses) consisted of:
| | | | |
| |
Gross unrealized gains | | $ | 60,618,093 | |
| |
Gross unrealized losses | | | (6,176,296 | ) |
| |
Net unrealized gains | | $ | 54,441,797 | |
As of June 30, 2018, the Fund had capital loss carryforwards which consisted of $7,545,192 in short-term capital losses and $5,534,301 in long-term capital losses.
As of June 30, 2018, the Fund had current year deferred post-October capital losses consisting of $15,193,445 inlong-term losses which were recognized on the first day of the current fiscal year.
Class allocations
The separate classes of shares offered by the Fund differ principally in applicable sales charges, distribution, shareholder servicing, and administration fees. Class specific expenses are charged directly to that share class. Investment income, common expenses, and realized and unrealized gains (losses) on investments are allocated daily to each class of shares based on the relative proportion of net assets of each class.
3. FAIR VALUATION MEASUREMENTS
Fair value measurements of investments are determined within a framework that has established a fair value hierarchy based upon the various data inputs utilized in determining the value of the Fund’s investments. The three-level hierarchy gives the highest priority to unadjusted quoted prices in active markets for identical assets or liabilities (Level 1) and the lowest priority to unobservable inputs (Level 3). The Fund’s investments are classified within the fair value hierarchy based on the lowest level of input that is significant to the fair value measurement. The inputs are summarized into three broad levels as follows:
| ∎ | | Level 1 – quoted prices in active markets for identical securities |
| ∎ | | Level 2 – other significant observable inputs (including quoted prices for similar securities, interest rates, prepayment speeds, credit risk, etc.) |
| ∎ | | Level 3 – significant unobservable inputs (including the Fund’s own assumptions in determining the fair value of investments) |
The inputs or methodologies used for valuing investments in securities are not necessarily an indication of the risk associated with investing in those securities.
The following is a summary of the inputs used in valuing the Fund’s assets and liabilities as of December 31, 2018:
| | | | | | | | | | | | | | | | |
| | | | |
| | | Quoted prices
(Level 1) | | | Other significant
observable inputs
(Level 2) | | | Significant
unobservable inputs (Level 3) | | | Total | |
| | | | |
Assets | | | | | | | | | | | | | | | | |
Investments in: | | | | | | | | | | | | | | | | |
| | | | |
Municipal obligations | | $ | 0 | | | $ | 2,340,888,620 | | | $ | 0 | | | $ | 2,340,888,620 | |
| | | | | | |
| Notes to financial statements (unaudited) | | Wells Fargo Intermediate Tax/AMT-Free Fund | | | 51 | |
Additional sector, industry or geographic detail is included in the Portfolio of Investments.
At December 31 2018, the Fund did not have any transfers into/out of Level 3.
4. TRANSACTIONS WITH AFFILIATES
Management fee
Funds Management, an indirect wholly owned subsidiary of Wells Fargo & Company (“Wells Fargo”), is the manager of the Fund and provides advisory and fund-level administrative services under an investment management agreement. Under the investment management agreement, Funds Management is responsible for, among other services, implementing the investment objectives and strategies of the Fund, supervising the subadviser and providing fund-level administrative services in connection with the Fund’s operations. As compensation for its services under the investment management agreement, Funds Management is entitled to receive an annual management fee starting at 0.40% and declining to 0.28% as the average daily net assets of the Fund increase. For the six months ended December 31, 2018, the management fee was equivalent to an annual rate of 0.37% of the Fund’s average daily net assets.
Funds Management has retained the services of a subadviser to provide daily portfolio management to the Fund. The fee for subadvisory services is borne by Funds Management. Wells Capital Management Incorporated, an affiliate of Funds Management and an indirect wholly owned subsidiary of Wells Fargo, is the subadviser to the Fund and is entitled to receive a fee from Funds Management at an annual rate starting at 0.20% and declining to 0.10% as the average daily net assets of the Fund increase.
Administration fees
Under a class-level administration agreement, Funds Management provides class-level administrative services to the Fund, which includes paying fees and expenses for services provided by the transfer agent,sub-transfer agents, omnibus account servicers and record-keepers. As compensation for its services under the class-level administration agreement, Funds Management receives an annual fee which is calculated based on the average daily net assets of each class as follows:
| | | | |
| | | Class-level
administration fee | |
| |
Class A, Class C | | | 0.16 | % |
| |
Class R6 | | | 0.03 | |
| |
Administrator Class | | | 0.10 | |
| |
Institutional Class | | | 0.08 | |
Funds Management has contractually waived and/or reimbursed management and administration fees to the extent necessary to maintain certain net operating expense ratios for the Fund. When each class of the Fund has exceeded its expense cap, Funds Management has waived fees and/or reimbursed expenses from fund level expenses on a proportionate basis and then from class specific expenses; otherwise, waivers and/or reimbursements are applied against class specific expenses before fund level expenses. Funds Management has committed through October 31, 2019 to waive fees and/or reimburse expenses to the extent necessary to cap the Fund’s expenses at 0.70% for Class A shares, 1.45% for Class C shares, 0.40% for Class R6 shares, 0.60% for Administrator Class shares, and 0.45% for Institutional Class shares. After this time, the cap may be increased or the commitment to maintain the cap may be terminated only with the approval of the Board of Trustees.
Distribution fee
The Trust has adopted a distribution plan for Class C shares of the Fund pursuant to Rule12b-1 under the 1940 Act. A distribution fee is charged to Class C shares and paid to Wells Fargo Funds Distributor, LLC (“Funds Distributor”), the principal underwriter, at an annual rate of 0.75% of the average daily net assets of Class C shares.
In addition, Funds Distributor is entitled to receive thefront-end sales charge from the purchase of Class A shares and a contingent deferred sales charge on the redemption of certain Class A shares. Funds Distributor is also entitled to receive the contingent deferred sales charges from redemptions of Class C shares. For the six months ended December 31, 2018, Funds Distributor received $865 from the sale of Class A shares. No contingent deferred sales charges were incurred by Class A and Class C shares for the six months ended December 31, 2018.
| | | | |
| 52 | | Wells Fargo Intermediate Tax/AMT-Free Fund | | Notes to financial statements (unaudited) |
Shareholder servicing fees
The Trust has entered into contracts with one or more shareholder servicing agents, whereby Class A, Class C, and Administrator Class of the Fund are charged a fee at an annual rate of 0.25% of the average daily net assets of each respective class.
A portion of these total shareholder servicing fees were paid to affiliates of Wells Fargo.
Interfund transactions
The Fund may purchase or sell portfolio investment securities to certain other Wells Fargo affiliates pursuant to Rule17a-7 under the 1940 Act and under procedures adopted by the Board of Trustees. The procedures have been designed to ensure that these interfund transactions, which do not incur broker commissions, are effected at current market prices. Pursuant to these procedures, the Fund had $192,950,000 and $231,220,000 in interfund purchases and sales, respectively, during the six months ended December 31, 2018.
5. INVESTMENT PORTFOLIO TRANSACTIONS
Purchases and sales of investments, excluding U.S. government obligations (if any) and short-term securities, for the six months ended December 31, 2018 were $314,947,507 and $275,787,894, respectively.
6. BANK BORROWINGS
The Trust (excluding the money market funds), Wells Fargo Master Trust and Wells Fargo Variable Trust are parties to a $280,000,000 revolving credit agreement whereby the Fund is permitted to use bank borrowings for temporary or emergency purposes, such as to fund shareholder redemption requests. Interest under the credit agreement is charged to the Fund based on a borrowing rate equal to the higher of the Federal Funds rate in effect on that day plus 1.25% or the overnight LIBOR rate in effect on that day plus 1.25%. In addition, an annual commitment fee equal to 0.25% of the unused balance is allocated to each participating fund.
For the six months ended December 31, 2018, there were no borrowings by the Fund under the agreement.
7. DISTRIBUTIONS TO SHAREHOLDERS
Effective for all filings after November 4, 2018, the Securities and Exchange Commission eliminated the requirement to separately state the components of distributions to shareholders under U.S. generally accepted accounting principles. The amounts of distributions to shareholders for the year ended June 30, 2018 were as follows:
| | | | |
| |
| | | Net investment income | |
| |
Class A | | $ | 7,895,731 | |
| |
Class C | | | 658,860 | |
| |
Administrator Class | | | 5,042,057 | |
| |
Institutional Class | | | 51,032,969 | |
8. INDEMNIFICATION
Under the Trust’s organizational documents, the officers and Trustees have been granted certain indemnification rights against certain liabilities that may arise out of performance of their duties to the Trust. Additionally, in the normal course of business, the Trust may enter into contracts with service providers that contain a variety of indemnification clauses. The Trust’s maximum exposure under these arrangements is dependent on future claims that may be made against the Fund and, therefore, cannot be estimated.
9. NEW ACCOUNTING PRONOUNCEMENT
In August 2018, FASB issued Accounting Standards Update (“ASU”)No. 2018-13, Fair Value Measurement (Topic 820)Disclosure Framework—Changes to the Disclosure Requirements for Fair Value Measurement. ASU2018-13 updates the disclosure requirements for fair value measurements by modifying or removing certain disclosures and adding certain new disclosures. The amendments are effective for fiscal years, and interim periods within those fiscal years, beginning after December 15, 2019. Early adoption is permitted. Management has adopted the removal and modification of disclosures early, as permitted, and will adopt the additional new disclosures at the effective date.
| | | | | | |
| Other information (unaudited) | | Wells Fargo Intermediate Tax/AMT-Free Fund | | | 53 | |
PROXY VOTING INFORMATION
A description of the policies and procedures used to determine how to vote proxies relating to portfolio securities is available, upon request, by calling1-800-222-8222, visiting our website atwellsfargofunds.com, or visiting the SEC website at sec.gov. Information regarding how the Fund voted proxies relating to portfolio securities during the most recent12-month period ended June 30 is available on the Fund’s website atwellsfargofunds.comor by visiting the SEC website at sec.gov.
PORTFOLIO HOLDINGS INFORMATION
The complete portfolio holdings for the Fund are publicly available monthly on the Fund’s website (wellsfargofunds.com), on aone-month delayed basis. In addition, top ten holdings information (excluding derivative positions) for the Fund is publicly available on the Fund’s website on a monthly,seven-day or more delayed basis. The Fund files its complete schedule of portfolio holdings with the SEC for the first and third quarters of each fiscal year on FormN-Q, which is available by visiting the SEC website at sec.gov. In addition, the Fund’s FormN-Q may be reviewed and copied at the SEC’s Public Reference Room in Washington, DC, and at regional offices in New York City, at 233 Broadway, and in Chicago, at 175 West Jackson Boulevard, Suite 900. Information about the Public Reference Room may be obtained by calling1-800-SEC-0330.
| | | | |
| 54 | | Wells Fargo Intermediate Tax/AMT-Free Fund | | Other information (unaudited) |
BOARD OF TRUSTEES AND OFFICERS
Each of the Trustees and Officers1 listed in the table below acts in identical capacities for each fund in the Wells Fargo family of funds, which consists of 152 mutual funds comprising the Wells Fargo Funds Trust, Wells Fargo Variable Trust, Wells Fargo Master Trust and fourclosed-end funds (collectively the “Fund Complex”). This table should be read in conjunction with the Prospectus and the Statement of Additional Information2. The mailing address of each Trustee and Officer is 525 Market Street, 12th Floor, San Francisco, CA 94105. Each Trustee and Officer serves an indefinite term, however, each Trustee serves such term until reaching the mandatory retirement age established by the Trustees.
Independent Trustees
| | | | | | |
Name and
year of birth | | Position held and
length of service* | | Principal occupations during past five years or longer | | Current other
public company or
investment company
directorships |
| | | |
| William R. Ebsworth (Born 1957) | | Trustee, since 2015 | | Retired. From 1984 to 2013, equities analyst, portfolio manager, research director and chief investment officer at Fidelity Management and Research Company in Boston, Tokyo, and Hong Kong, and retired in 2013 as Chief Investment Officer of Fidelity Strategic Advisers, Inc. where he led a team of investment professionals managing client assets. Prior thereto, Board member of Hong Kong Securities Clearing Co., Hong Kong Options Clearing Corp., the Thailand International Fund, Ltd., Fidelity Investments Life Insurance Company, and Empire Fidelity Investments Life Insurance Company. Board member of the Vincent Memorial Hospital Endowment(non-profit organization), where he serves on the Investment Committee and as a Chair of the Audit Committee. Mr. Ebsworth is a CFA® charterholder. | | N/A |
| | | |
Jane A. Freeman
(Born 1953) | | Trustee, since 2015; Chair Liaison, since 2018 | | Retired. From 2012 to 2014 and 1999 to 2008, Chief Financial Officer of Scientific Learning Corporation. From 2008 to 2012, Ms. Freeman provided consulting services related to strategic business projects. Prior to 1999, Portfolio Manager at Rockefeller & Co. and Scudder, Stevens & Clark. Board member of the Harding Loevner Funds from 1996 to 2014, serving as both Lead Independent Director and chair of the Audit Committee. Board member of the Russell Exchange Traded Funds Trust from 2011 to 2012 and the chair of the Audit Committee. Ms. Freeman is a Board Member of The Ruth Bancroft Garden(non-profit organization). She is also an inactive Chartered Financial Analyst. | | N/A |
| | | |
Isaiah Harris, Jr.3
(Born 1952) | | Trustee, since 2009; Audit Committee Chairman, since 2019 | | Retired. Chairman of the Board of CIGNA Corporation since 2009, and Director since 2005. From 2003 to 2011, Director of Deluxe Corporation. Prior thereto, President and CEO of BellSouth Advertising and Publishing Corp. from 2005 to 2007, President and CEO of BellSouth Enterprises from 2004 to 2005 and President of BellSouth Consumer Services from 2000 to 2003. Emeritus member of the Iowa State University Foundation Board of Governors. Emeritus Member of the Advisory Board of Iowa State University School of Business. Advisory Board Member, Palm Harbor Academy (private school). Advisory Board Member, Child Evangelism Fellowship(non-profit). Mr. Harris is a certified public accountant (inactive status). | | CIGNA Corporation |
| | | |
Judith M. Johnson3
(Born 1949) | | Trustee, since 2008; Audit Committee Chairman, from 2009 to 2018 | | Retired. Prior thereto, Chief Executive Officer and Chief Investment Officer of Minneapolis Employees Retirement Fund from 1996 to 2008. Ms. Johnson is an attorney, certified public accountant and a certified managerial accountant. | | N/A |
| | | |
David F. Larcker
(Born 1950) | | Trustee, since 2009 | | James Irvin Miller Professor of Accounting at the Graduate School of Business, Stanford University, Director of the Corporate Governance Research Initiative and Senior Faculty of The Rock Center for Corporate Governance since 2006. From 2005 to 2008, Professor of Accounting at the Graduate School of Business, Stanford University. Prior thereto, Ernst & Young Professor of Accounting at The Wharton School, University of Pennsylvania from 1985 to 2005. | | N/A |
| | | | | | |
| Other information (unaudited) | | Wells Fargo Intermediate Tax/AMT-Free Fund | | | 55 | |
| | | | | | |
Name and
year of birth | | Position held and
length of service* | | Principal occupations during past five years or longer | | Current other
public company or
investment company
directorships |
| | | |
| Olivia S. Mitchell (Born 1953) | | Trustee, since 2006; Nominating and Governance Committee Chairman, since 2018 | | International Foundation of Employee Benefit Plans Professor, Wharton School of the University of Pennsylvania since 1993. Director of Wharton’s Pension Research Council and Boettner Center on Pensions & Retirement Research, and Research Associate at the National Bureau of Economic Research. Previously, Cornell University Professor from 1978 to 1993. | | N/A |
| | | |
| Timothy J. Penny (Born 1951) | | Trustee, since 1996; Chairman, since 2018; Vice Chairman, from 2017 to 2018 | | President and Chief Executive Officer of Southern Minnesota Initiative Foundation, anon-profit organization, since 2007. Member of the Board of Trustees of NorthStar Education Finance, Inc., anon-profit organization, since 2007. | | N/A |
| | | |
| James G. Polisson (Born 1959) | | Trustee, since 2018; Advisory Board Member, from 2017 to 2018 | | Retired. Chief Marketing Officer, Source (ETF) UK Services, Ltd, from 2015 to 2017. From 2012 to 2015, Principal of The Polisson Group, LLC, a management consulting, corporate advisory and principal investing company. Chief Executive Officer and Managing Director at Russell Investments, Global Exchange Traded Funds from 2010 to 2012. Managing Director of Barclays Global Investors from 1998 to 2010 and Global Chief Marketing Officer for iShares and Barclays Global Investors from 2000 to 2010. Trustee of the San Francisco Mechanics’ Institute, anon-profit organization, from 2013 to 2015. Board member of the Russell Exchange Traded Fund Trust from 2011 to 2012. Director of Barclays Global Investors Holdings Deutschland GmbH from 2006 to 2009. Mr. Polisson is an attorney and has a retired status with the Massachusetts and District of Columbia Bar Associations. | | N/A |
| | | |
| Michael S. Scofield4(Born 1943) | | Trustee, since 2010 | | Served on the Investment Company Institute’s Board of Governors and Executive Committee from 2008-2011 as well the Governing Council of the Independent Directors Council from 2006-2011 and the Independent Directors Council Executive Committee from 2008-2011. Trustee of the Evergreen Fund complex (and its predecessors) from 1984 to 2010. Chairman of the Evergreen Funds from 2000-2010. Former Trustee of the Mentor Funds. Retired Attorney, Law Offices of Michael S. Scofield. | | N/A |
| | | |
| Pamela Wheelock (Born 1959) | | Trustee, since 2018; Advisory Board Member, from 2017 to 2018 | | Chief Operating Officer, Twin Cities Habitat for Humanity, since January, 2017. Vice President of University Services, University of Minnesota from 2012 to 2017. Prior thereto, on the Board of Directors, Governance Committee and Finance Committee for the Minnesota Philanthropy Partners (Saint Paul Foundation) from 2012 to 2018, Interim President and Chief Executive Officer of Blue Cross Blue Shield of Minnesota from 2010 to 2011, Chairman of the Board from 2009 to 2011 and Board Director from 2003 to 2015. Vice President, Leadership and Community Engagement, Bush Foundation, Saint Paul, Minnesota (a private foundation) from 2009 to 2011. Executive Vice President and Chief Financial Officer, Minnesota Sports and Entertainment from 2004 to 2009 and Senior Vice President from 2002 to 2004. Commissioner of Finance, State of Minnesota, from 1999 to 2002. Currently the Board Chair of the Minnesota Wild Foundation since 2010. | | N/A |
| * | Length of service dates reflect the Trustee’s commencement of service with the Trust’s predecessor entities, where applicable. |
| | | | |
| 56 | | Wells Fargo Intermediate Tax/AMT-Free Fund | | Other information (unaudited) |
Officers
| | | | | | |
Name and
year of birth | | Position held and
length of service | | Principal occupations during past five years or longer | | |
| | | |
Andrew Owen
(Born 1960) | | President, since 2017 | | Executive Vice President of Wells Fargo & Company and Head of Affiliated Managers, Wells Fargo Asset Management, since 2014. In addition, Mr. Owen is currently President, Chief Executive Officer and Director of Wells Fargo Funds Management, LLC since 2017. Prior thereto, Executive Vice President responsible for marketing, investments and product development for Wells Fargo Funds Management, LLC, from 2009 to 2014. | | |
| | | |
Nancy Wiser1
(Born 1967) | | Treasurer, since 2012 | | Executive Vice President of Wells Fargo Funds Management, LLC since 2011. Chief Operating Officer and Chief Compliance Officer at LightBox Capital Management LLC, from 2008 to 2011. | | |
| | | |
Alexander Kymn
(Born 1973) | | Secretary, since 2018; Chief Legal Officer, since 2018 | | Senior Company Counsel of Wells Fargo Bank, N.A. since 2018 (previously Senior Counsel from 2007 to 2018). Vice President of Wells Fargo Funds Management, LLC from 2008 to 2014. | | |
| | | |
Michael H. Whitaker
(Born 1967) | | Chief Compliance Officer, since 2016 | | Senior Vice President and Chief Compliance Officer since 2016. Senior Vice President and Chief Compliance Officer for Fidelity Investments from 2007 to 2016. | | |
| | | |
David Berardi
(Born 1975) | | Assistant Treasurer, since 2009 | | Vice President of Wells Fargo Funds Management, LLC since 2009. Vice President of Evergreen Investment Management Company, LLC from 2008 to 2010. Manager of Fund Reporting and Control for Evergreen Investment Management Company, LLC from 2004 to 2010. | | |
| | | |
Jeremy DePalma1
(Born 1974) | | Assistant Treasurer, since 2009 | | Senior Vice President of Wells Fargo Funds Management, LLC since 2009. Senior Vice President of Evergreen Investment Management Company, LLC from 2008 to 2010 and head of the Fund Reporting and Control Team within Fund Administration from 2005 to 2010. | | |
| 1 | Nancy Wiser acts as Treasurer of 76 funds in the Fund Complex. Jeremy DePalma acts as Treasurer of 76 funds and Assistant Treasurer of 76 funds in the Fund Complex. |
| 2 | The Statement of Additional Information includes additional information about the Trustees and is available, without charge, upon request, by calling1-800-222-8222 or by visiting the website atwellsfargofunds.com. |
| 3 | Mr. Harris replaced Ms. Johnson as the Chairman of the Audit Committee effective January 1, 2019. |
| 4 | Mr. Scofield retired on December 31, 2018. |
| | | | | | |
| Appendix A (unaudited) | | Wells Fargo Intermediate Tax/AMT-Free Fund | | | 57 | |
SALES CHARGE REDUCTIONS AND WAIVERS FOR CERTAIN INTERMEDIARIES
Raymond James & Associates, Inc., Raymond James Financial Services & Raymond James affiliates (“Raymond James”)
Effective on or about March 1, 2019, shareholders purchasing Fund shares through a Raymond James platform or account will be eligible only for the following load waivers(front-end sales charge waivers and contingent deferred, orback-end, sales charge waivers) and discounts, which may differ from those disclosed elsewhere in the Fund’s Prospectus or SAI.
Front-end Sales Load Waivers on Class A shares Available at Raymond James
| | • | | Shares purchased in an investment advisory program. | |
| | • | | Shares purchased through reinvestment of capital gains distributions and dividend reinvestment when purchasing shares of the same fund (but not any other fund within the fund family). | |
| | • | | Employees and registered representatives of Raymond James or its affiliates and their family members as designated by Raymond James. | |
| | • | | Shares purchased from the proceeds of redemptions within the same fund family, provided (1) the repurchase occurs within 90 days following the redemption, (2) the redemption and purchase occur in the same account, and (3) redeemed shares were subject to afront-end or deferred sales load (known as Rights of Reinstatement). | |
| | • | | A shareholder in the fund’s Class C shares will have their shares automatically exchanged at net asset value to Class A shares (or the appropriate share class) of the fund if the shares are no longer subject to a CDSC and the exchange is in line with the policies and procedures of Raymond James. | |
CDSC Waivers on Class A and C Shares Available at Raymond James
| | • | | Death or disability of the shareholder. | |
| | • | | Shares sold as part of a systematic withdrawal plan as described in the Fund’s Prospectus. | |
| | • | | Return of excess contributions from an IRA Account. | |
| | • | | Shares sold as part of a required minimum distribution for IRA and retirement accounts due to the shareholder reaching age 70½ as described in the Fund’s prospectus. | |
| | • | | Shares sold to pay Raymond James fees but only if the transaction is initiated by Raymond James. | |
| | • | | Shares acquired through a right of reinstatement. | |
Front-end Load Discounts Available at Raymond James: Breakpoints, and/or Rights of Accumulation
| | • | | Breakpoints as described in the Fund’s Prospectus. | |
| | • | | Rights of accumulation which entitle shareholders to breakpoint discounts will be automatically calculated based on the aggregated holding of fund family assets held by accounts within the purchaser’s household at Raymond James. Eligible fund family assets not held at Raymond James may be included in the rights of accumulation calculation only if the shareholder notifies his or her financial advisor about such assets. | |
This page is intentionally left blank.
This page is intentionally left blank.
This page is intentionally left blank.

For more information
More information about Wells Fargo Funds is available free upon request. To obtain literature, please write, visit the Fund’s website, or call:
Wells Fargo Funds
P.O. Box 219967
Kansas City, MO 64121-9967
Website: wellsfargofunds.com
Individual investors: 1-800-222-8222
Retail investment professionals: 1-888-877-9275
Institutional investment professionals: 1-866-765-0778
This report and the financial statements contained herein are submitted for the general information of the shareholders of the Fund. If this report is used for promotional purposes, distribution of the report must be accompanied or preceded by a current prospectus. Before investing, please consider the investment objectives, risks, charges, and expenses of the investment. For a current prospectus and, if available, a summary prospectus, containing this information, call1-800-222-8222 or visit the Fund’s website atwellsfargofunds.com. Read the prospectus carefully before you invest or send money.
Wells Fargo Asset Management (WFAM) is the trade name for certain investment advisory/management firms owned by Wells Fargo & Company. These firms include but are not limited to Wells Capital Management Incorporated and Wells Fargo Funds Management, LLC. Certain products managed by WFAM entities are distributed by Wells Fargo Funds Distributor, LLC (a broker/dealer and Member FINRA).
This material is for general informational and educational purposes only and is NOT intended to provide investment advice or a recommendation of any kind—including a recommendation for any specific investment, strategy, or plan.
INVESTMENT PRODUCTS: NOT FDIC INSURED ◾ NO BANK GUARANTEE ◾ MAY LOSE VALUE
© 2019 Wells Fargo Funds Management, LLC. All rights reserved.
| | |
 | | 320446 02-19 SA251/SAR251 12-18 |
Semi-Annual Report
December 31, 2018

Wells Fargo Minnesota Tax-Free Fund

Beginning on January 1, 2021, as permitted by new regulations adopted by the Securities and Exchange Commission, paper copies of the Wells Fargo Funds’ annual and semi-annual shareholder reports issued after this date will no longer be sent by mail, unless you specifically request paper copies of the reports. Instead, the reports will be made available on the Funds’ website, and you will be notified by mail each time a report is posted and provided with a website address to access the report.
If you already elected to receive shareholder reports electronically, you will not be affected by this change and you need not take any action. You may elect to receive shareholder reports and other communications from the Fund electronically at any time by contacting your financial intermediary (such as a broker-dealer or bank) or, if you are a direct investor, by calling 1-800-222-8222 or by enrolling at wellsfargo.com/advantagedelivery.
You may elect to receive all future reports in paper free of charge. If you invest through a financial intermediary, you can contact your financial intermediary to request that you continue to receive paper copies of your shareholder reports; if you invest directly with the Fund, you can call 1-800-222-8222. Your election to receive reports in paper will apply to all Wells Fargo Funds held in your account with your financial intermediary or, if you are a direct investor, to all Wells Fargo Funds that you hold.

Reduce clutter. Save trees.
Sign up for electronic delivery of prospectuses and shareholder reports atwellsfargo.com/advantagedelivery
Contents
The views expressed and any forward-looking statements are as of December 31, 2018, unless otherwise noted, and are those of the Fund managers and/or Wells Fargo Funds Management, LLC. Discussions of individual securities, or the markets generally, or any Wells Fargo Fund are not intended as individual recommendations. Future events or results may vary significantly from those expressed in any forward-looking statements. The views expressed are subject to change at any time in response to changing circumstances in the market. Wells Fargo Funds Management, LLC and the Fund disclaim any obligation to publicly update or revise any views expressed or forward-looking statements.
INVESTMENT PRODUCTS: NOT FDIC INSURED ◾ NO BANK GUARANTEE ◾ MAY LOSE VALUE
| | | | |
| 2 | | Wells Fargo Minnesota Tax-Free Fund | | Letter to shareholders (unaudited) |

Andrew Owen
President
Wells Fargo Funds
Global trade tensions escalated during the third quarter of 2018.
Dear Shareholder:
We are pleased to offer you this semi-annual report for the Wells Fargo Minnesota Tax-Free Fund for the six-month period that ended December 31, 2018. During the reporting period, the U.S. generated encouraging economic and business data that was offset by less positive and more inconsistent data from international markets. Investment returns were generally negative as geopolitical tensions and uncertainty tended to distract investors from more favorable underlying trends.
For the period, U.S. stocks, as measured by the S&P 500 Index,1 fell 6.85% and international stocks, as measured by the MSCI ACWI ex USA Index (Net),2 declined 10.84%. Based on the MSCI EM Index (Net),3 emerging market stocks lost 8.48%. For bond investors, the Bloomberg Barclays U.S. Aggregate Bond Index4 gained 1.65% while the Bloomberg Barclays Global Aggregate ex-USD Index5 fell 0.84%. The Bloomberg Barclays Municipal Bond Index6 gained 1.53% while the ICE BofAML U.S. High Yield Index7 declined 2.34%.
Global trade tensions prompted investor concerns.
Global trade tensions escalated during the third quarter of 2018. The U.S. imposed tariffs on a wide range of products manufactured overseas. Foreign governments retaliated with tariffs that punished U.S. commodity producers and product manufacturers. Investors wondered about next steps as divergence in global economic policies and growth prospects widened.
During the summer months, the U.S. economy strengthened. Revised second-quarter gross domestic product (GDP) growth data released in August showed the U.S. economy growing at a 4.2% rate. The unemployment rate in the U.S. was 3.7% by the end of September, according to the U.S. Department of Labor. Wages showed more consistent growth, and consumer confidence remained strong. Several U.S. equity market indices reached records during August, with the S&P 500 Index gaining 7.71% for the three-month period that ended September 30, 2018. In contrast, the MSCI ACWI ex USA Index (Net) gained 0.71% while the MSCI EM Index (Net) declined 1.09% during the same three-month period.
| 1 | The S&P 500 Index consists of 500 stocks chosen for market size, liquidity, and industry group representation. It is a market-value-weighted index with each stock’s weight in the index proportionate to its market value. You cannot invest directly in an index. |
| 2 | The Morgan Stanley Capital International (MSCI) All Country World Index (ACWI) ex USA Index (Net) is a free-float-adjusted market-capitalization-weighted index that is designed to measure the equity market performance of developed markets, excluding the United States and Canada. Source: MSCI. MSCI makes no express or implied warranties or representations and shall have no liability whatsoever with respect to any MSCI data contained herein. The MSCI data may not be further redistributed or used as a basis for other indices or any securities or financial products. This report is not approved, reviewed, or produced by MSCI. You cannot invest directly in an index. |
| 3 | The MSCI Emerging Markets (EM) Index (Net) is a free-float-adjusted market-capitalization-weighted index that is designed to measure large- and mid-cap equity market performance of emerging markets. The MSCI EM Index (Net) consists of the following 24 emerging market country indices: Brazil, Chile, China, Colombia, Czech Republic, Egypt, Greece, Hungary, India, Indonesia, Korea, Malaysia, Mexico, Pakistan, Peru, the Philippines, Poland, Qatar, Russia, South Africa, Taiwan, Thailand, Turkey, and the United Arab Emirates. You cannot invest directly in an index. |
| 4 | The Bloomberg Barclays U.S. Aggregate Bond Index is a broad-based benchmark that measures the investment-grade, U.S. dollar-denominated, fixed-rate taxable bond market, including Treasuries, government-related and corporate securities, mortgage-backed securities (agency fixed-rate and hybrid adjustable-rate mortgage pass-throughs), asset-backed securities, and commercial mortgage-backed securities. You cannot invest directly in an index. |
| 5 | The Bloomberg Barclays Global Aggregate ex-USD Index is an unmanaged index that provides a broad-based measure of the global investment-grade fixed-income markets excluding the U.S. dollar-denominated debt market. You cannot invest directly in an index. |
| 6 | The Bloomberg Barclays Municipal Bond Index is an unmanaged index composed of long-term tax-exempt bonds with a minimum credit rating of Baa. You cannot invest directly in an index. |
| 7 | The ICE BofAML U.S. High Yield Index is a market-capitalization-weighted index of domestic and Yankee high-yield bonds. The index tracks the performance of high-yield securities traded in the U.S. bond market. You cannot invest directly in an index. Copyright 2018. ICE Data Indices, LLC. All rights reserved. |
| | | | | | |
| Letter to shareholders (unaudited) | | Wells Fargo Minnesota Tax-Free Fund | | | 3 | |
Economic signals overseas were mixed as the third quarter ended and the fourth quarter began. In particular, signs of slowing economic growth in China created uncertainty for investors. Amid rising trade tensions, the People’s Bank of China cut reserve requirement ratios and accelerated infrastructure spending and tax cuts for business enterprises and individuals. Nevertheless, a strengthening U.S. dollar and trade tensions remained headwinds for investors overseas.
Equity markets were volatile during the fourth quarter.
Negative stock market performance during October and December bracketed a mildly positive November, as measured by the S&P 500 Index and the MSCI ACWI ex USA Index (Net). As interest rates and bond yields gained during October, stock markets struggled. Readings on consumer sentiment and business spending were mixed. Markets rebounded in November. The U.S. and China agreed to halt further increases in tariffs and engage in additional negotiations. While November returns were positive, the loss for the full fourth quarter was substantial for equity investors globally, with the S&P down 13.52% and the MSCI ACWI ex USA Index (Net) down 11.46%. December’s S&P 500 Index performance was the lowest since 1931. Globally, fixed income investments fared better than stocks during the last two months of the year as conflicting signals unsettled investors’ outlooks.
Equity investors confronted a number of changing conditions. In November’s mid-term elections, control of the U.S. House of Representatives shifted from Republicans to Democrats, presaging potential partisan disputes. Progress on Brexit negotiations stalled in the UK. In China, the value of the yuan declined to low levels last seen in 2008. Oil prices continued to fall. The Fed increased the federal funds rate by 25 bps to a target range of between 2.25% and 2.50% in December 2018. A late-December dispute over spending and immigration policy resulted in a partial U.S. government shutdown that continued through the end of the period.
Don’t let short-term uncertainty derail long-term investment goals.
Periods of investment uncertainty can present challenges, but experience has taught us that maintaining long-term investment goals can be an effective way to plan for the future. To help you create a sound strategy based on your personal goals and risk tolerance, Wells Fargo Funds offers more than 100 mutual funds spanning a wide range of asset classes and investment styles. Although diversification cannot guarantee an investment profit or prevent losses, we believe it can be an effective way to manage investment risk and potentially smooth out overall portfolio performance. We encourage investors to know their investments and to understand that appropriate levels of risk-taking may unlock opportunities.
Thank you for choosing to invest with Wells Fargo Funds. We appreciate your confidence in us and remain committed to helping you meet your financial needs.
Sincerely,

Andrew Owen
President
Wells Fargo Funds
Economic signals overseas were mixed as the third quarter ended and the fourth quarter began.
For further information about your Fund, contact your investment professional, visit our website atwellsfargofunds.com, or call us directly at1-800-222-8222.
| | | | |
| 4 | | Wells Fargo Minnesota Tax-Free Fund | | Performance highlights (unaudited) |
Investment objective
The Fund seeks current income exempt from federal income tax and Minnesota individual income tax.
Manager
Wells Fargo Funds Management, LLC
Subadviser
Wells Capital Management Incorporated
Portfolio managers
Wendy Casetta
Bruce R. Johns
Average annual total returns (%) as of December 31, 2018
| | | | | | | | | | | | | | | | | | | | | | | | | | | | | | | | | | |
| | | | | Including sales charge | | | Excluding sales charge | | | Expense ratios1 (%) | |
| | | Inception date | | 1 year | | | 5 year | | | 10 year | | | 1 year | | | 5 year | | | 10 year | | | Gross | | | Net2 | |
| | | | | | | | | |
| Class A (NMTFX) | | 1-12-1988 | | | -3.82 | | | | 1.90 | | | | 3.72 | | | | 0.72 | | | | 2.84 | | | | 4.20 | | | | 0.84 | | | | 0.84 | |
| | | | | | | | | |
| Class C (WMTCX) | | 4-8-2005 | | | -1.03 | | | | 2.08 | | | | 3.43 | | | | -0.03 | | | | 2.08 | | | | 3.43 | | | | 1.59 | | | | 1.59 | |
| | | | | | | | | |
| Administrator Class (NWMIX) | | 8-2-1993 | | | – | | | | – | | | | – | | | | 0.97 | | | | 3.10 | | | | 4.47 | | | | 0.78 | | | | 0.60 | |
| | | | | | | | | |
| Institutional Class (WMTIX)3 | | 10-31-2016 | | | – | | | | – | | | | – | | | | 1.05 | | | | 3.15 | | | | 4.49 | | | | 0.51 | | | | 0.51 | |
| | | | | | | | | |
| Bloomberg Barclays Municipal Bond Index4 | | – | | | – | | | | – | | | | – | | | | 1.28 | | | | 3.82 | | | | 4.85 | | | | – | | | | – | |
| | | | | | | | | |
| Bloomberg Barclays Minnesota Municipal Bond Index5 | | – | | | – | | | | – | | | | – | | | | 1.37 | | | | 3.06 | | | | 4.22 | | | | – | | | | – | |
Figures quoted represent past performance, which is no guarantee of future results, and do not reflect taxes that a shareholder may pay on fund distributions or the redemption of fund shares. Investment return and principal value of an investment will fluctuate so that an investor’s shares, when redeemed, may be worth more or less than their original cost. Performance shown without sales charges would be lower if sales charges were reflected. Current performance may be lower or higher than the performance data quoted, which assumes the reinvestment of dividends and capital gains. Current month-end performance is available on the Fund’s website,wellsfargofunds.com.
Index returns do not include transaction costs associated with buying and selling securities, any mutual fund fees or expenses, or any taxes. It is not possible to invest directly in an index.
For Class A shares, the maximum front-end sales charge is 4.50%. For Class C shares, the maximum contingent deferred sales charge is 1.00%. Performance including a contingent deferred sales charge assumes the sales charge for the corresponding time period. Administrator Class and Institutional Class shares are sold without a front-end sales charge or contingent deferred sales charge.
Bond values fluctuate in response to the financial condition of individual issuers, general market and economic conditions, and changes in interest rates. Changes in market conditions and government policies may lead to periods of heightened volatility in the bond market and reduced liquidity for certain bonds held by the Fund. In general, when interest rates rise, bond values fall and investors may lose principal value. Interest rate changes and their impact on the Fund and its share price can be sudden and unpredictable. The use of derivatives may reduce returns and/or increase volatility. Certain investment strategies tend to increase the total risk of an investment (relative to the broader market). The Fund is exposed to Minnesota municipal securities risk and high-yield securities risk. Consult the Fund’s prospectus for additional information on these and other risks. A portion of the Fund’s income may be subject to federal, state, and/ or local income taxes or the Alternative Minimum Tax (AMT). Any capital gains distributions may be taxable.
Please see footnotes on page 5.
| | | | | | |
| Performance highlights (unaudited) | | Wells Fargo Minnesota Tax-Free Fund | | | 5 | |
|
| Effective maturity distribution as of December 31, 20186 |
|
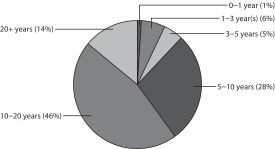 |
|
| Credit quality as of December 31, 20187 |
|
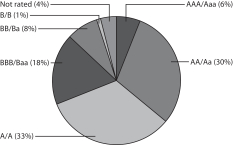 |
| 1 | Reflects the expense ratios as stated in the most recent prospectuses. The expense ratios shown are subject to change and may differ from the annualized expense ratios shown in the financial highlights of this report. |
| 2 | The manager has contractually committed through October 31, 2019, to waive fees and/or reimburse expenses to the extent necessary to cap the Fund’s Total Annual Fund Operating Expenses After Fee Waivers at 0.85% for Class A, 1.60% for Class C, 0.60% for Administrator Class, and 0.52% for Institutional Class. After this time, the cap may be increased or the commitment to maintain the cap may be terminated only with the approval of the Board of Trustees. Brokerage commissions, stamp duty fees, interest, taxes, acquired fund fees and expenses (if any), and extraordinary expenses are excluded from the expense cap. Without this cap, the Fund’s returns would have been lower. The expense ratio paid by an investor is the net expense ratio (the total annual fund operating expenses after fee waivers) as stated in the prospectuses. |
| 3 | Historical performance shown for the Institutional Class shares prior to their inception reflects the performance of the Administrator Class shares, and is not adjusted to reflect Institutional Class expenses. If these expenses had been included, returns for Institutional Class shares would be higher. |
| 4 | The Bloomberg Barclays Municipal Bond Index is an unmanaged index composed of long-term tax-exempt bonds with a minimum credit rating of Baa. You cannot invest directly in an index. |
| 5 | The Bloomberg Barclays Minnesota Municipal Bond Index is the Minnesota component of the Bloomberg Barclays Municipal Bond Index. You cannot invest directly in an index. |
| 6 | Amounts are calculated based on the total long-term investments of the Fund. These amounts are subject to change and may have changed since the date specified. |
| 7 | The credit quality distribution of portfolio holdings reflected in the chart is based on ratings from Standard & Poor’s, Moody’s Investors Service, and/ or Fitch Ratings Ltd. Credit quality ratings apply to the underlying holdings of the Fund and not to the Fund itself. The percentages of the Fund’s portfolio with the ratings depicted in the chart are calculated based on the total market value of fixed income securities held by the Fund. If a security was rated by all three rating agencies, the middle rating was utilized. If rated by two of three rating agencies, the lower rating was utilized, and if rated by one of the rating agencies, that rating was utilized. Standard & Poor’s rates the creditworthiness of bonds, ranging from AAA (highest) to D (lowest). Ratings from A to CCC may be modified by the addition of a plus (+) or minus (-) sign to show relative standing within the rating categories. Standard & Poor’s rates the creditworthiness of short-term notes from SP-1 (highest) to SP-3 (lowest). Moody’s rates the creditworthiness of bonds, ranging from Aaa (highest) to C (lowest). Ratings Aa to B may be modified by the addition of a number 1 (highest) to 3 (lowest) to show relative standing within the ratings categories. Moody’s rates the creditworthiness of short-term U.S. tax-exempt municipal securities from MIG 1/VMIG 1 (highest) to SG (lowest). Fitch rates the creditworthiness of bonds, ranging from AAA (highest) to D (lowest). Credit quality distribution is subject to change and may have changed since the date specified. |
| | | | |
| 6 | | Wells Fargo Minnesota Tax-Free Fund | | Fund expenses (unaudited) |
As a shareholder of the Fund, you incur two types of costs: (1) transaction costs, including sales charges (loads) on purchase payments and contingent deferred sales charges (if any) on redemptions and (2) ongoing costs, including management fees, distribution (12b-1) and/or shareholder servicing fees, and other Fund expenses. This example is intended to help you understand your ongoing costs (in dollars) of investing in the Fund and to compare these costs with the ongoing costs of investing in other mutual funds.
The example is based on an investment of $1,000 invested at the beginning of the six-month period and held for the entire period from July 1, 2018 to December 31, 2018.
Actual expenses
The “Actual” line of the table below provides information about actual account values and actual expenses. You may use the information in this line, together with the amount you invested, to estimate the expenses that you paid over the period. Simply divide your account value by $1,000 (for example, an $8,600 account value divided by $1,000 = 8.6), then multiply the result by the number in the “Actual” line under the heading entitled “Expenses paid during period” for your applicable class of shares to estimate the expenses you paid on your account during this period.
Hypothetical example for comparison purposes
The “Hypothetical” line of the table below provides information about hypothetical account values and hypothetical expenses based on the Fund’s actual expense ratio and an assumed rate of return of 5% per year before expenses, which is not the Fund’s actual return. The hypothetical account values and expenses may not be used to estimate the actual ending account balance or expenses you paid for the period. You may use this information to compare the ongoing costs of investing in the Fund and other funds. To do so, compare this 5% hypothetical example with the 5% hypothetical examples that appear in the shareholder reports of the other funds.
Please note that the expenses shown in the table are meant to highlight your ongoing costs only and do not reflect any transactional costs, such as sales charges (loads) and contingent deferred sales charges. Therefore, the “Hypothetical” line of the table is useful in comparing ongoing costs only and will not help you determine the relative total costs of owning different funds. In addition, if these transactional costs were included, your costs would have been higher.
| | | | | | | | | | | | | | | | |
| | | Beginning
account value
7-1-2018 | | | Ending
account value
12-31-2018 | | | Expenses
paid during
the period¹ | | | Annualized net
expense ratio | |
Class A | | | | | | | | | | | | | | | | |
| | | | |
Actual | | $ | 1,000.00 | | | $ | 1,009.73 | | | $ | 4.31 | | | | 0.85 | % |
| | | | |
Hypothetical (5% return before expenses) | | $ | 1,000.00 | | | $ | 1,020.92 | | | $ | 4.33 | | | | 0.85 | % |
Class C | | | | | | | | | | | | | | | | |
| | | | |
Actual | | $ | 1,000.00 | | | $ | 1,005.93 | | | $ | 8.09 | | | | 1.60 | % |
| | | | |
Hypothetical (5% return before expenses) | | $ | 1,000.00 | | | $ | 1,017.14 | | | $ | 8.13 | | | | 1.60 | % |
Administrator Class | | | | | | | | | | | | | | | | |
| | | | |
Actual | | $ | 1,000.00 | | | $ | 1,011.00 | | | $ | 3.04 | | | | 0.60 | % |
| | | | |
Hypothetical (5% return before expenses) | | $ | 1,000.00 | | | $ | 1,022.18 | | | $ | 3.06 | | | | 0.60 | % |
Institutional Class | | | | | | | | | | | | | | | | |
| | | | |
Actual | | $ | 1,000.00 | | | $ | 1,011.41 | | | $ | 2.64 | | | | 0.52 | % |
| | | | |
Hypothetical (5% return before expenses) | | $ | 1,000.00 | | | $ | 1,022.58 | | | $ | 2.65 | | | | 0.52 | % |
| 1 | Expenses paid is equal to the annualized net expense ratio of each class multiplied by the average account value over the period, multiplied by the number of days in the most recent fiscal half-year divided by the number of days in the fiscal year (to reflect the one-half-year period). |
| | | | | | |
| Portfolio of investments—December 31, 2018 (unaudited) | | Wells Fargo Minnesota Tax-Free Fund | | | 7 | |
| | | | | | | | | | | | | | | | |
| Security name | | Interest rate | | | Maturity date | | | Principal | | | Value | |
| | | | |
Municipal Obligations: 99.39% | | | | | | | | | | | | | | | | |
| | | | |
Guam: 1.31% | | | | | | | | | | | | | | | | |
| | | | |
| Airport Revenue: 0.64% | | | | | | | | | | | | | | | | |
| | | | |
Guam Port Authority Series 2018B | | | 5.00 | % | | | 7-1-2019 | | | $ | 250,000 | | | $ | 252,965 | |
| | | | |
Guam Port Authority Series 2018B | | | 5.00 | | | | 7-1-2035 | | | | 605,000 | | | | 653,394 | |
| | | | |
| | | | | | | | | | | | | | | 906,359 | |
| | | | | | | | | | | | | | | | |
| | | | |
| Water & Sewer Revenue: 0.67% | | | | | | | | | | | | | | | | |
| | | | |
Guam Government Waterworks Authority Water & Wastewater System Project Series 2013 | | | 5.25 | | | | 7-1-2022 | | | | 865,000 | | | | 937,478 | |
| | | | | | | | | | | | | | | | |
| | | | |
| | | | | | | | | | | | | | | 1,843,837 | |
| | | | | | | | | | | | | | | | |
| | | | |
Illinois: 1.13% | | | | | | | | | | | | | | | | |
| | | | |
| GO Revenue: 1.13% | | | | | | | | | | | | | | | | |
| | | | |
Illinois Refunding Bond Series 2018A | | | 5.00 | | | | 10-1-2021 | | | | 500,000 | | | | 522,105 | |
| | | | |
Kane, Cook and DuPage Counties IL School District #46 Series 2015D | | | 5.00 | | | | 1-1-2027 | | | | 965,000 | | | | 1,066,151 | |
| | | | |
| | | | | | | | | | | | | | | 1,588,256 | |
| | | | | | | | | | | | | | | | |
| | | | |
Minnesota: 96.59% | | | | | | | | | | | | | | | | |
| | | | |
| Airport Revenue: 2.38% | | | | | | | | | | | | | | | | |
| | | | |
Minneapolis & St. Paul MN Metropolitan Airports Commission Series 2014A | | | 5.00 | | | | 1-1-2032 | | | | 750,000 | | | | 830,093 | |
| | | | |
Minneapolis & St. Paul MN Metropolitan Airports Commission Series 2016C | | | 5.00 | | | | 1-1-2046 | | | | 1,000,000 | | | | 1,132,870 | |
| | | | |
Minneapolis & St. Paul MN Metropolitan Airports Commission Series 2016D | | | 5.00 | | | | 1-1-2041 | | | | 250,000 | | | | 277,980 | |
| | | | |
Minneapolis & St. Paul MN Metropolitan Airports Commission Subordinate Bond Series 2014A | | | 5.00 | | | | 1-1-2029 | | | | 500,000 | | | | 557,355 | |
| | | | |
Minneapolis & St. Paul MN Metropolitan Airports Commission Subordinate Bond Series 2014B | | | 5.00 | | | | 1-1-2026 | | | | 500,000 | | | | 556,360 | |
| | | | |
| | | | | | | | | | | | | | | 3,354,658 | |
| | | | | | | | | | | | | | | | |
| | | | |
| Education Revenue: 26.21% | | | | | | | | | | | | | | | | |
| | | | |
Anoka County MN Charter School Series A | | | 3.40 | | | | 6-1-2019 | | | | 225,000 | | | | 226,427 | |
| | | | |
Anoka County MN Charter School Series A | | | 3.65 | | | | 6-1-2020 | | | | 185,000 | | | | 189,381 | |
| | | | |
Anoka County MN Charter School Series A | | | 3.75 | | | | 6-1-2021 | | | | 245,000 | | | | 255,907 | |
| | | | |
Anoka County MN Charter School Series A | | | 5.00 | | | | 6-1-2027 | | | | 510,000 | | | | 541,906 | |
| | | | |
Anoka County MN Charter School Series A | | | 5.00 | | | | 6-1-2032 | | | | 300,000 | | | | 318,768 | |
| | | | |
Anoka County MN Charter School Series A | | | 5.00 | | | | 6-1-2043 | | | | 1,100,000 | | | | 1,168,816 | |
| | | | |
Brooklyn Park MN Charter School Athlos Leadership Academy Project Series 2015A | | | 4.00 | | | | 7-1-2020 | | | | 190,000 | | | | 189,455 | |
| | | | |
Brooklyn Park MN Charter School Athlos Leadership Academy Project Series 2015A | | | 5.50 | | | | 7-1-2040 | | | | 750,000 | | | | 757,328 | |
| | | | |
Brooklyn Park MN Charter School Prairie Seeds Academy Project Series 2015A | | | 5.00 | | | | 3-1-2034 | | | | 1,500,000 | | | | 1,504,635 | |
| | | | |
Cologne MN Charter School Cologne Academy Project Series 2014A | | | 5.00 | | | | 7-1-2029 | | | | 590,000 | | | | 615,069 | |
| | | | |
Cologne MN Charter School Cologne Academy Project Series 2014A | | | 5.00 | | | | 7-1-2034 | | | | 500,000 | | | | 509,165 | |
| | | | |
Columbus MN Charter School New Millennium Academy Project Series 2015A | | | 5.50 | | | | 7-1-2030 | | | | 1,000,000 | | | | 891,590 | |
| | | | |
Deephaven MN Charter School Eagle Ridge Academy Project Series 2015A | | | 5.25 | | | | 7-1-2040 | | | | 500,000 | | | | 516,935 | |
| | | | |
Deephaven MN Charter School Eagle Ridge Academy Project Series 2016A | | | 4.00 | | | | 7-1-2025 | | | | 125,000 | | | | 127,003 | |
| | | | |
Deephaven MN Charter School Eagle Ridge Academy Project Series 2016A | | | 4.00 | | | | 7-1-2026 | | | | 100,000 | | | | 100,569 | |
| | | | |
Deephaven MN Charter School Eagle Ridge Academy Project Series 2016A | | | 4.00 | | | | 7-1-2027 | | | | 100,000 | | | | 100,227 | |
The accompanying notes are an integral part of these financial statements.
| | | | |
| 8 | | Wells Fargo Minnesota Tax-Free Fund | | Portfolio of investments—December 31, 2018 (unaudited) |
| | | | | | | | | | | | | | | | |
| Security name | | Interest rate | | | Maturity date | | | Principal | | | Value | |
| | | | |
| Education Revenue(continued) | | | | | | | | | | | | | | | | |
| | | | |
Deephaven MN Charter School Eagle Ridge Academy Project Series A | | | 5.25 | % | | | 7-1-2037 | | | $ | 400,000 | | | $ | 415,364 | |
| | | | |
Forest Lakes MN Charter School Lakes International Language Academy Project Series 2014A | | | 5.50 | | | | 8-1-2036 | | | | 500,000 | | | | 523,135 | |
| | | | |
Ham Lake MN Charter School DaVinci Academy Project Series 2012A | | | 4.00 | | | | 7-1-2028 | | | | 370,000 | | | | 354,453 | |
| | | | |
Ham Lake MN Charter School DaVinci Academy Project Series 2016A | | | 5.00 | | | | 7-1-2031 | | | | 625,000 | | | | 635,150 | |
| | | | |
Hugo MN Charter School Lease Revenue Bonds Noble Academy Project Series 2014A | | | 5.00 | | | | 7-1-2029 | | | | 600,000 | | | | 625,128 | |
| | | | |
Minneapolis MN Charter School Yinghua Academy Project Series 2013A | | | 5.00 | | | | 7-1-2023 | | | | 300,000 | | | | 307,560 | |
| | | | |
Minnesota HEFAR Bethel University Series 2017 | | | 5.00 | | | | 5-1-2037 | | | | 1,250,000 | | | | 1,329,813 | |
| | | | |
Minnesota HEFAR College of St. Scholastica Series 7R | | | 4.25 | | | | 12-1-2027 | | | | 400,000 | | | | 415,912 | |
| | | | |
Minnesota HEFAR Hamline University Series 2017B | | | 5.00 | | | | 10-1-2035 | | | | 1,000,000 | | | | 1,066,660 | |
| | | | |
Minnesota HEFAR Hamline University Series 7E | | | 4.50 | | | | 10-1-2021 | | | | 300,000 | | | | 313,314 | |
| | | | |
Minnesota HEFAR Hamline University Series 7E | | | 5.00 | | | | 10-1-2029 | | | | 500,000 | | | | 526,455 | |
| | | | |
Minnesota HEFAR St. Benedict College Series 2017 | | | 4.00 | | | | 3-1-2036 | | | | 410,000 | | | | 410,607 | |
| | | | |
Minnesota HEFAR St. Benedict College Series 7M | | | 5.13 | | | | 3-1-2036 | | | | 275,000 | | | | 285,227 | |
| | | | |
Minnesota HEFAR St. Catherine University Series A | | | 5.00 | | | | 10-1-2045 | | | | 2,000,000 | | | | 2,175,120 | |
| | | | |
Minnesota HEFAR St. Olaf College Series 8N | | | 4.50 | | | | 10-1-2030 | | | | 500,000 | | | | 509,590 | |
| | | | |
Minnesota HEFAR St. Thomas University Series 7U | | | 5.00 | | | | 4-1-2023 | | | | 750,000 | | | | 837,855 | |
| | | | |
Minnesota HEFAR St. Thomas University Series 8L | | | 5.00 | | | | 4-1-2028 | | | | 920,000 | | | | 1,064,900 | |
| | | | |
Minnesota HEFAR St. Thomas University Series 8L | | | 5.00 | | | | 4-1-2029 | | | | 750,000 | | | | 864,383 | |
| | | | |
Minnesota HEFAR St. Thomas University Series 8L | | | 5.00 | | | | 4-1-2035 | | | | 750,000 | | | | 846,465 | |
| | | | |
Minnesota Office of Higher Education supplemental Student Loan Program Revenue Bonds Series 2018 | | | 5.00 | | | | 11-1-2026 | | | | 700,000 | | | | 799,099 | |
| | | | |
Minnesota State Colleges & Universities Revenue Fund & Refunding Bonds Series 2017A | | | 5.00 | | | | 10-1-2027 | | | | 500,000 | | | | 592,590 | |
| | | | |
Moorhead MN Educational Facilities Bond The Concordia College Corporation Project Series 2016 | | | 5.00 | | | | 12-1-2025 | | | | 2,000,000 | | | | 2,204,900 | |
| | | | |
Otsego MN Charter School Kaleidoscope Charter School Project Series 2014A | | | 4.15 | | | | 9-1-2024 | | | | 515,000 | | | | 512,662 | |
| | | | |
Otsego MN Charter School Kaleidoscope Charter School Project Series 2014A | | | 5.00 | | | | 9-1-2034 | | | | 1,100,000 | | | | 1,099,923 | |
| | | | |
Rice County MN Educational Facilities Shattuck-St. Mary’s School Project 144A | | | 5.00 | | | | 8-1-2022 | | | | 960,000 | | | | 1,003,008 | |
| | | | |
St. Cloud MN Charter School Lease Revenue Bonds Stride Academy Project Series 2016A | | | 5.00 | | | | 4-1-2036 | | | | 750,000 | | | | 411,960 | |
| | | | |
St. Paul MN Housing & RDA Charter School Hmong College Preparatory Academy Project Series 2016A | | | 5.25 | | | | 9-1-2031 | | | | 1,000,000 | | | | 1,046,760 | |
| | | | |
St. Paul MN Housing & RDA Charter School Lease Revenue German Immersion School Project Series 2013A | | | 4.00 | | | | 7-1-2023 | | | | 225,000 | | | | 225,486 | |
| | | | |
St. Paul MN Housing & RDA Charter School Lease Revenue Twin Cities Academy Project Series 2015A | | | 5.00 | | | | 7-1-2035 | | | | 925,000 | | | | 938,311 | |
| | | | |
St. Paul MN Housing & RDA Conservatory for Performing Artists Series A | | | 4.00 | | | | 3-1-2028 | | | | 150,000 | | | | 141,714 | |
| | | | |
St. Paul MN Housing & RDA Hope Community Academy Project Series 2015A | | | 5.00 | | | | 12-1-2034 | | | | 1,645,000 | | | | 1,653,274 | |
| | | | |
University of Minnesota Series 2009A | | | 5.00 | | | | 4-1-2021 | | | | 1,180,000 | | | | 1,189,558 | |
| | | | |
University of Minnesota Series 2009A | | | 5.13 | | | | 4-1-2034 | | | | 1,000,000 | | | | 1,008,410 | |
| | | | |
University of Minnesota Series 2017A | | | 5.00 | | | | 9-1-2042 | | | | 770,000 | | | | 879,094 | |
| | | | |
University of Minnesota State Supported Biomedical Science Series 2011B | | | 5.00 | | | | 8-1-2036 | | | | 1,000,000 | | | | 1,066,150 | |
| | | | |
Woodbury MN Charter School Series A | | | 3.90 | | | | 12-1-2022 | | | | 220,000 | | | | 227,993 | |
| | | | |
Woodbury MN Charter School Series A | | | 5.00 | | | | 12-1-2027 | | | | 215,000 | | | | 226,242 | |
| | | | |
Woodbury MN Charter School Series A | | | 5.00 | | | | 12-1-2032 | | | | 220,000 | | | | 229,533 | |
| | | | |
| | | | | | | | | | | | | | | 36,976,939 | |
| | | | | | | | | | | | | | | | |
| | | | |
| GO Revenue: 12.67% | | | | | | | | | | | | | | | | |
| | | | |
Hastings MN Independent School District #200 CAB Series A (South Dakota Credit Program Insured) (z) | | | 3.42 | | | | 2-1-2032 | | | | 1,305,000 | | | | 840,511 | |
The accompanying notes are an integral part of these financial statements.
| | | | | | |
| Portfolio of investments—December 31, 2018 (unaudited) | | Wells Fargo Minnesota Tax-Free Fund | | | 9 | |
| | | | | | | | | | | | | | | | |
| Security name | | Interest rate | | | Maturity date | | | Principal | | | Value | |
| | | | |
| GO Revenue(continued) | | | | | | | | | | | | | | | | |
| | | | |
Hastings MN Independent School District #200 CAB Series A (South Dakota Credit Program Insured) (z) | | | 3.49 | % | | | 2-1-2033 | | | $ | 1,145,000 | | | $ | 706,213 | |
| | | | |
Hennepin County MN Series 2016B | | | 5.00 | | | | 12-1-2029 | | | | 450,000 | | | | 533,840 | |
| | | | |
Hennepin County MN Series 2017C | | | 5.00 | | | | 12-1-2031 | | | | 2,000,000 | | | | 2,353,700 | |
| | | | |
Long Prairie MN Sewer Revenue Bond Series 2018A (Minnesota Credit Program Insured) | | | 5.00 | | | | 2-1-2025 | | | | 160,000 | | | | 181,360 | |
| | | | |
Long Prairie MN Sewer Revenue Bond Series 2018A (Minnesota Credit Program Insured) | | | 5.00 | | | | 2-1-2026 | | | | 185,000 | | | | 212,371 | |
| | | | |
Minnesota Various Purpose Bonds Series 2015A | | | 5.00 | | | | 8-1-2028 | | | | 3,400,000 | | | | 3,964,128 | |
| | | | |
Mounds View MN Independent School District #621 Series A (South Dakota Credit Program Insured) | | | 4.00 | | | | 2-1-2022 | | | | 530,000 | | | | 530,885 | |
| | | | |
Rosemount MN Independent School District #196 School Building Series 2016A (South Dakota Credit Program Insured) | | | 5.00 | | | | 2-1-2027 | | | | 1,500,000 | | | | 1,762,050 | |
| | | | |
Roseville MN Independent School District #623 School Building Series A (South Dakota Credit Program Insured) | | | 5.00 | | | | 2-1-2031 | | | | 2,090,000 | | | | 2,412,132 | |
| | | | |
Sartell MN Independent School District #748 St. Stephen Public Schools GO Series 2016A (South Dakota Credit Program Insured) | | | 5.00 | | | | 2-1-2027 | | | | 1,250,000 | | | | 1,434,275 | |
| | | | |
Shakopee MN Independent School District #720 Series 2015A (South Dakota Credit Program Insured) | | | 5.00 | | | | 2-1-2023 | | | | 1,000,000 | | | | 1,106,150 | |
| | | | |
St. Francis MN Independent School District #15 Series A (South Dakota Credit Program Insured) | | | 5.00 | | | | 2-1-2027 | | | | 485,000 | | | | 538,078 | |
| | | | |
St. Francis MN Independent School District #15 Series A (South Dakota Credit Program Insured) | | | 5.00 | | | | 2-1-2028 | | | | 220,000 | | | | 243,987 | |
| | | | |
Willmar MN Rice Memorial Hospital Project Series 2012A | | | 5.00 | | | | 2-1-2026 | | | | 1,000,000 | | | | 1,059,480 | |
| | | | |
| | | | | | | | | | | | | | | 17,879,160 | |
| | | | | | | | | | | | | | | | |
| | | | |
| Health Revenue: 20.35% | | | | | | | | | | | | | | | | |
| | | | |
Center City MN Health Care Facilities Hazelden Betty Ford Foundation Project Series 2014 | | | 5.00 | | | | 11-1-2026 | | | | 750,000 | | | | 826,253 | |
| | | | |
Center City MN Health Care Facilities Hazelden Betty Ford Foundation Project Series 2014 | | | 5.00 | | | | 11-1-2027 | | | | 500,000 | | | | 547,760 | |
| | | | |
Center City MN Health Care Facilities Hazelden Betty Ford Foundation Project Series 2014 | | | 5.00 | | | | 11-1-2029 | | | | 300,000 | | | | 325,335 | |
| | | | |
Duluth MN Economic Development Authority Health Care Facilities Revenue Bonds Series 2018A | | | 5.00 | | | | 2-15-2048 | | | | 650,000 | | | | 706,986 | |
| | | | |
Glencoe MN HCFR Glencoe Regional Health Services Project Series 2013 | | | 4.00 | | | | 4-1-2022 | | | | 735,000 | | | | 769,133 | |
| | | | |
Maple Grove MN HCFR Maple Grove Hospital Corporation | | | 5.00 | | | | 5-1-2030 | | | | 850,000 | | | | 971,720 | |
| | | | |
Maple Grove MN HCFR North Memorial Health Care Series 2015 | | | 5.00 | | | | 9-1-2023 | | | | 655,000 | | | | 718,437 | |
| | | | |
Maple Grove MN HCFR Series 2017 | | | 5.00 | | | | 5-1-2031 | | | | 500,000 | | | | 568,055 | |
| | | | |
Maple Grove MN HCFR Series 2017 | | | 5.00 | | | | 5-1-2032 | | | | 500,000 | | | | 564,925 | |
| | | | |
Minneapolis & St. Paul MN Housing & RDA Allina Health System Series 2017A | | | 5.00 | | | | 11-15-2029 | | | | 1,000,000 | | | | 1,167,920 | |
| | | | |
Minneapolis & St. Paul MN Housing & RDA Children’s Health Care Facilities Series A | | | 5.25 | | | | 8-15-2025 | | | | 1,000,000 | | | | 1,048,970 | |
| | | | |
Minneapolis & St. Paul MN Housing & RDA Children’s Health Care Facilities Series A | | | 5.25 | | | | 8-15-2035 | | | | 1,000,000 | | | | 1,048,810 | |
| | | | |
Minneapolis MN Health Care System Fairview Health Services Series 2015A | | | 5.00 | | | | 11-15-2033 | | | | 2,000,000 | | | | 2,239,900 | |
| | | | |
Minneapolis MN Health Care System Revenue Refunded Bond Fairview Health Services Series A | | | 5.00 | | | | 11-15-2049 | | | | 1,000,000 | | | | 1,094,480 | |
| | | | |
Minnesota Agricultural & Economic Development Board Health Care Essentia Health Series C1 (AGC Insured) | | | 4.00 | | | | 2-15-2020 | | | | 50,000 | | | | 51,233 | |
| | | | |
Minnesota Agricultural & Economic Development Board Health Care Essentia Health Series C1 (AGC Insured) | | | 5.00 | | | | 2-15-2030 | | | | 2,000,000 | | | | 2,055,120 | |
The accompanying notes are an integral part of these financial statements.
| | | | |
| 10 | | Wells Fargo Minnesota Tax-Free Fund | | Portfolio of investments—December 31, 2018 (unaudited) |
| | | | | | | | | | | | | | | | |
| Security name | | Interest rate | | | Maturity date | | | Principal | | | Value | |
| | | | |
| Health Revenue(continued) | | | | | | | | | | | | | | | | |
| | | | |
Plato MN Health Care Facilities Bond Glencoe Regional Health Services Project Series 2017 | | | 5.00 | % | | | 4-1-2041 | | | $ | 550,000 | | | $ | 584,694 | |
| | | | |
Red Wing MN Senior Housing Deer Crest Project Series A | | | 5.00 | | | | 11-1-2032 | | | | 660,000 | | | | 680,460 | |
| | | | |
Red Wing MN Senior Housing Deer Crest Project Series A | | | 5.00 | | | | 11-1-2042 | | | | 560,000 | | | | 575,954 | |
| | | | |
Shakopee MN St. Francis Regional Medical Center Series 2014 | | | 5.00 | | | | 9-1-2027 | | | | 700,000 | | | | 779,303 | |
| | | | |
Shakopee MN St. Francis Regional Medical Center Series 2014 | | | 5.00 | | | | 9-1-2029 | | | | 725,000 | | | | 801,538 | |
| | | | |
St. Cloud MN Health Care Revenue Bonds Series 2016A | | | 5.00 | | | | 5-1-2030 | | | | 2,000,000 | | | | 2,291,020 | |
| | | | |
St. Cloud MN Health Care Revenue Bonds Series 2016A | | | 5.00 | | | | 5-1-2031 | | | | 2,000,000 | | | | 2,279,640 | |
| | | | |
St. Cloud MN Health Care Unrefunded Revenue Bonds CentraCare Health | | | 5.13 | | | | 5-1-2030 | | | | 125,000 | | | | 130,056 | |
| | | | |
St. Louis Park MN Nicollett Health Services Series 2009 | | | 5.50 | | | | 7-1-2029 | | | | 1,000,000 | | | | 1,017,930 | |
| | | | |
St. Paul MN Housing & RDA Fairview Health Services Series 2017A | | | 5.00 | | | | 11-15-2034 | | | | 565,000 | | | | 640,151 | |
| | | | |
St. Paul MN Housing & RDA Health Care Facilities Refunding Bonds Series 2015A | | | 5.00 | | | | 7-1-2025 | | | | 250,000 | | | | 290,015 | |
| | | | |
St. Paul MN Housing & RDA HealthEast Care Systems Project Series 2015A | | | 5.00 | | | | 11-15-2027 | | | | 1,000,000 | | | | 1,173,340 | |
| | | | |
St. Paul MN Housing & RDA HealthPartners Obligated Group Series 2015A | | | 5.00 | | | | 7-1-2031 | | | | 2,010,000 | | | | 2,246,879 | |
| | | | |
Winona MN Health Care Facilities Refunding Bond Series 2012 | | | 5.00 | | | | 7-1-2034 | | | | 500,000 | | | | 513,790 | |
| | | | |
| | | | | | | | | | | | | | | 28,709,807 | |
| | | | | | | | | | | | | | | | |
| | | | |
| Housing Revenue: 4.84% | | | | | | | | | | | | | | | | |
| | | | |
Austin MN Housing & RDA Courtyard Residence Project Series A | | | 5.00 | | | | 1-1-2031 | | | | 1,500,000 | | | | 1,500,000 | |
| | | | |
Dakota County MN Community Development Agency SFMR (GNMA/FNMA/FHLMC Insured) | | | 5.30 | | | | 12-1-2039 | | | | 12,282 | | | | 12,294 | |
| | | | |
Minneapolis MN Student Housing Riverton Community Housing Project Series 2014 | | | 5.00 | | | | 8-1-2032 | | | | 860,000 | | | | 893,437 | |
| | | | |
Minnesota HFA Series D (SIFMA Municipal Swap +0.43%) (GNMA/FNMA/FHLMC Insured) ± | | | 2.14 | | | | 1-1-2045 | | | | 1,000,000 | | | | 1,000,000 | |
| | | | |
Minnesota Housing Finance Agency Residential Housing Series 2009E | | | 4.20 | | | | 7-1-2021 | | | | 680,000 | | | | 682,496 | |
| | | | |
Minnesota Housing Finance Agency Residential Housing Series 2012D (GNMA/FNMA/FHLMC Insured) | | | 4.00 | | | | 7-1-2040 | | | | 290,000 | | | | 295,754 | |
| | | | |
Minnesota Housing Finance Agency Series 2015A | | | 5.00 | | | | 8-1-2027 | | | | 1,665,000 | | | | 1,889,708 | |
| | | | |
Minnesota Housing Finance Agency State Appropriation Bonds Series 2015A | | | 5.00 | | | | 8-1-2032 | | | | 500,000 | | | | 561,370 | |
| | | | |
| | | | | | | | | | | | | | | 6,835,059 | |
| | | | | | | | | | | | | | | | |
| | | | |
| Miscellaneous Revenue: 15.93% | | | | | | | | | | | | | | | | |
| | | | |
Anoka Hennepin MN Independent School District #11 Certificate of Participation Series 2014A | | | 5.00 | | | | 2-1-2034 | | | | 1,000,000 | | | | 1,113,960 | |
| | | | |
Center City MN Health Care Facilities Hazelden Betty Ford Foundation Project Series 2011 | | | 5.00 | | | | 11-1-2041 | | | | 3,000,000 | | | | 3,041,910 | |
| | | | |
Goodhue County MN Education District #6051 Red Wing Certificate of Participation Series 2014A | | | 5.00 | | | | 2-1-2029 | | | | 750,000 | | | | 826,088 | |
| | | | |
Minneapolis MN Development Limited Tax Supported Common Bond Series 2A | | | 6.00 | | | | 12-1-2040 | | | | 1,000,000 | | | | 1,072,660 | |
| | | | |
Minnesota Certificate of Participation Legislative Office Facility Project Series 2014 | | | 5.00 | | | | 6-1-2023 | | | | 435,000 | | | | 488,653 | |
| | | | |
Minnesota General Fund Appropriation Bonds Series 2012B | | | 5.00 | | | | 3-1-2027 | | | | 2,000,000 | | | | 2,173,240 | |
| | | | |
Minnesota General Fund Appropriation Bonds Series 2012B | | | 5.00 | | | | 3-1-2029 | | | | 2,000,000 | | | | 2,171,960 | |
| | | | |
Minnesota General Fund Appropriation Bonds Series 2014A | | | 5.00 | | | | 6-1-2033 | | | | 1,000,000 | | | | 1,108,630 | |
| | | | |
Minnetonka MN Independent School District #276 Series C | | | 5.75 | | | | 2-1-2042 | | | | 2,145,000 | | | | 2,475,459 | |
| | | | |
Minnetonka MN Independent School District #276 Series F | | | 5.00 | | | | 2-1-2025 | | | | 205,000 | | | | 227,351 | |
| | | | |
Northeastern Minnesota Metropolitan Intermediate School District #916 Certificate of Participation Series 2013A | | | 4.00 | | | | 2-1-2024 | | | | 1,100,000 | | | | 1,172,820 | |
| | | | |
Northeastern Minnesota Metropolitan Intermediate School District #916 Certificate of Participation Series 2015B | | | 5.00 | | | | 2-1-2034 | | | | 1,500,000 | | | | 1,678,770 | |
| | | | |
Plymouth MN Certificate of Participation Intermediate School District #287 Series A | | | 5.00 | | | | 2-1-2024 | | | | 250,000 | | | | 250,590 | |
The accompanying notes are an integral part of these financial statements.
| | | | | | |
| Portfolio of investments—December 31, 2018 (unaudited) | | Wells Fargo Minnesota Tax-Free Fund | | | 11 | |
| | | | | | | | | | | | | | | | |
| Security name | | Interest rate | | | Maturity date | | | Principal | | | Value | |
| | | | |
| Miscellaneous Revenue(continued) | | | | | | | | | | | | | | | | |
| | | | |
Plymouth MN Intermediate School District #287 Certificate of Participation Series 2016A | | | 4.00 | % | | | 5-1-2026 | | | $ | 500,000 | | | $ | 542,715 | |
| | | | |
Plymouth MN Intermediate School District #287 Certificate of Participation Series 2016A | | | 4.00 | | | | 5-1-2027 | | | | 1,000,000 | | | | 1,076,930 | |
| | | | |
St. Cloud MN Independent School District #742 Series 2017A | | | 5.00 | | | | 2-1-2032 | | | | 500,000 | | | | 562,560 | |
| | | | |
St. Cloud MN Independent School District #742 Series 2017A | | | 5.00 | | | | 2-1-2034 | | | | 350,000 | | | | 391,713 | |
| | | | |
St. Paul MN Housing & RDA Charter School Nova Classical Academy Project Series 2011A | | | 6.63 | | | | 9-1-2042 | | | | 865,000 | | | | 968,143 | |
| | | | |
White Bear Lake MN Revenue Refunding Bonds YMCA of Greater Twin Cities Project Series 2018 | | | 5.00 | | | | 6-1-2032 | | | | 1,000,000 | | | | 1,127,910 | |
| | | | |
| | | | | | | | | | | | | | | 22,472,062 | |
| | | | | | | | | | | | | | | | |
| | | | |
| Transportation Revenue: 1.24% | | | | | | | | | | | | | | | | |
| | | | |
St. Paul MN Housing & RDA Parking Enterprise Refunding Bonds Series 2017A | | | 4.00 | | | | 8-1-2026 | | | | 525,000 | | | | 574,487 | |
| | | | |
St. Paul MN Housing & RDA Parking Enterprise Refunding Bonds Series 2017A | | | 4.00 | | | | 8-1-2027 | | | | 545,000 | | | | 591,881 | |
| | | | |
St. Paul MN Housing & RDA Parking Enterprise Refunding Bonds Series 2017A | | | 5.00 | | | | 8-1-2025 | | | | 500,000 | | | | 584,625 | |
| | | | |
| | | | | | | | | | | | | | | 1,750,993 | |
| | | | | | | | | | | | | | | | |
| | | | |
| Utilities Revenue: 12.97% | | | | | | | | | | | | | | | | |
| | | | |
Central Minnesota Municipal Power Agency Brookings Southeast Twin Cities Transmission Project Series 2012 | | | 5.00 | | | | 1-1-2042 | | | | 1,500,000 | | | | 1,598,595 | |
| | | | |
Hutchinson MN Public Utility Revenue Refunding Bonds Series 2012A | | | 5.00 | | | | 12-1-2026 | | | | 700,000 | | | | 767,816 | |
| | | | |
Minnesota Municipal Power Agency Series 2010A & Series 2010B | | | 5.00 | | | | 10-1-2025 | | | | 2,335,000 | | | | 2,457,728 | |
| | | | |
Northern Minnesota Municipal Power Agency Series 2013A | | | 4.00 | | | | 1-1-2028 | | | | 450,000 | | | | 470,966 | |
| | | | |
Northern Minnesota Municipal Power Agency Series 2016 | | | 5.00 | | | | 1-1-2030 | | | | 520,000 | | | | 589,384 | |
| | | | |
Northern Minnesota Municipal Power Agency Series 2016 | | | 5.00 | | | | 1-1-2031 | | | | 350,000 | | | | 394,576 | |
| | | | |
Northern Minnesota Municipal Power Agency Series 2017 | | | 5.00 | | | | 1-1-2041 | | | | 400,000 | | | | 444,472 | |
| | | | |
Rochester MN Electric Utility Revenue Series 2013B | | | 5.00 | | | | 12-1-2025 | | | | 315,000 | | | | 357,412 | |
| | | | |
Rochester MN Electric Utility Revenue Series 2013B | | | 5.00 | | | | 12-1-2026 | | | | 250,000 | | | | 282,288 | |
| | | | |
Rochester MN Electric Utility Revenue Series 2017A | | | 5.00 | | | | 12-1-2037 | | | | 500,000 | | | | 568,440 | |
| | | | |
Southern Minnesota Municipal Power Agency CAB Series A (National Insured) (z) | | | 2.00 | | | | 1-1-2020 | | | | 5,100,000 | | | | 4,999,570 | |
| | | | |
Western Minnesota Municipal Power Agency Series A | | | 5.00 | | | | 1-1-2027 | | | | 1,565,000 | | | | 1,731,688 | |
| | | | |
Western Minnesota Municipal Power Agency Series A | | | 5.00 | | | | 1-1-2030 | | | | 1,000,000 | | | | 1,102,880 | |
| | | | |
Western Minnesota Municipal Power Agency Series A | | | 5.00 | | | | 1-1-2031 | | | | 1,000,000 | | | | 1,150,510 | |
| | | | |
Western Minnesota Municipal Power Agency Series A | | | 5.00 | | | | 1-1-2032 | | | | 1,250,000 | | | | 1,392,763 | |
| | | | |
| | | | | | | | | | | | | | | 18,309,088 | |
| | | | | | | | | | | | | | | | |
| | | | |
| | | | | | | | | | | | | | | 136,287,766 | |
| | | | | | | | | | | | | | | | |
| | | | |
Virgin Islands: 0.36% | | | | | | | | | | | | | | | | |
| | | | |
| Tax Revenue: 0.36% | | | | | | | | | | | | | | | | |
| | | | |
Virgin Islands PFA Matching Fund Loan Notes Senior Lien Series B (AGM Insured) | | | 5.00 | | | | 10-1-2025 | | | | 500,000 | | | | 511,015 | |
| | | | | | | | | | | | | | | | |
| | | | |
Total Municipal Obligations (Cost $138,934,140) | | | | | | | | | | | | | | | 140,230,874 | |
| | | | | | | | | | | | | | | | |
| | | | | | | | |
| Total investments in securities (Cost $138,934,140) | | | 99.39 | % | | | 140,230,874 | |
| | |
Other assets and liabilities, net | | | 0.61 | | | | 860,995 | |
| | | | | | | | |
| Total net assets | | | 100.00 | % | | $ | 141,091,869 | |
| | | | | | | | |
| 144A | The security may be resold in transactions exempt from registration, normally to qualified institutional buyers, pursuant to Rule 144A under the Securities Act of 1933. |
| (z) | Zero coupon security. The rate represents the purchase yield to maturity. |
| ± | Variable rate investment. The rate shown is the rate in effect at period end. |
The accompanying notes are an integral part of these financial statements.
| | | | |
| 12 | | Wells Fargo Minnesota Tax-Free Fund | | Portfolio of investments—December 31, 2018 (unaudited) |
Abbreviations:
| AGC | Assured Guaranty Corporation |
| AGM | Assured Guaranty Municipal |
| CAB | Capital appreciation bond |
| FHLMC | Federal Home Loan Mortgage Corporation |
| FNMA | Federal National Mortgage Association |
| GNMA | Government National Mortgage Association |
| HCFR | Healthcare facilities revenue |
| HEFAR | Higher Education Facilities Authority Revenue |
| HFA | Housing Finance Authority |
| National | National Public Finance Guarantee Corporation |
| PFA | Public Finance Authority |
| RDA | Redevelopment Authority |
| SFMR | Single-family mortgage revenue |
| SIFMA | Securities Industry and Financial Markets Association |
The accompanying notes are an integral part of these financial statements.
| | | | | | |
| Statement of assets and liabilities—December 31, 2018 (unaudited) | | Wells Fargo Minnesota Tax-Free Fund | | | 13 | |
| | | | |
| | | | |
| |
Assets | | | | |
Investments in unaffiliated securities, at value (cost $138,934,140) | | $ | 140,230,874 | |
Cash | | | 176,741 | |
Receivable for investments sold | | | 40,071 | |
Receivable for Fund shares sold | | | 34,284 | |
Receivable for interest | | | 1,960,737 | |
Prepaid expenses and other assets | | | 102,828 | |
| | | | |
Total assets | | | 142,545,535 | |
| | | | |
| |
Liabilities | | | | |
Payable for Fund shares redeemed | | | 1,332,374 | |
Dividends payable | | | 65,662 | |
Management fee payable | | | 25,856 | |
Administration fees payable | | | 14,085 | |
Distribution fee payable | | | 4,653 | |
Trustees’ fees and expenses payable | | | 206 | |
Accrued expenses and other liabilities | | | 10,830 | |
| | | | |
Total liabilities | | | 1,453,666 | |
| | | | |
Total net assets | | $ | 141,091,869 | |
| | | | |
| |
NET ASSETS CONSIST OF | | | | |
Paid-in capital | | $ | 138,970,106 | |
Total distributable earnings | | | 2,121,763 | |
| | | | |
Total net assets | | $ | 141,091,869 | |
| | | | |
| |
COMPUTATION OF NET ASSET VALUE AND OFFERING PRICE PER SHARE | | | | |
Net assets – Class A | | $ | 26,014,330 | |
Shares outstanding – Class A1 | | | 2,484,048 | |
Net asset value per share – Class A2 | | | $10.47 | |
Maximum offering price per share – Class A | | | $10.96 | |
Net assets – Class C | | $ | 7,097,566 | |
Shares outstanding – Class C1 | | | 677,805 | |
Net asset value per share – Class C | | | $10.47 | |
Net assets – Administrator Class | | $ | 76,356,456 | |
Shares outstanding – Administrator Class1 | | | 7,294,183 | |
Net asset value per share – Administrator Class | | | $10.47 | |
Net assets – Institutional Class | | $ | 31,623,517 | |
Shares outstanding – Institutional Class1 | | | 3,017,776 | |
Net asset value per share – Institutional Class | | | $10.48 | |
| 1 | The Fund has an unlimited number of authorized shares. |
| 2 | Maximum offering price is computed as 100/95.50 of net asset value. On investments of $50,000 or more, the offering price is reduced. |
The accompanying notes are an integral part of these financial statements.
| | | | |
| 14 | | Wells Fargo Minnesota Tax-Free Fund | | Statement of operations—six months ended December 31, 2018 (unaudited) |
| | | | |
| | | | |
| |
Investment income | | | | |
Interest | | $ | 2,671,770 | |
| | | | |
| |
Expenses | | | | |
Management fee | | | 302,901 | |
Administration fees | | | | |
Class A | | | 22,920 | |
Class C | | | 5,758 | |
Administrator Class | | | 42,694 | |
Institutional Class | | | 12,086 | |
Shareholder servicing fees | | | | |
Class A | | | 35,812 | |
Class C | | | 8,996 | |
Administrator Class | | | 106,735 | |
Distribution fee | | | | |
Class C | | | 26,988 | |
Custody and accounting fees | | | 2,300 | |
Professional fees | | | 29,334 | |
Registration fees | | | 35,546 | |
Shareholder report expenses | | | 10,008 | |
Trustees’ fees and expenses | | | 10,427 | |
Other fees and expenses | | | 6,023 | |
| | | | |
Total expenses | | | 658,528 | |
Less: Fee waivers and/or expense reimbursements | | | (144,509 | ) |
| | | | |
Net expenses | | | 514,019 | |
| | | | |
Net investment income | | | 2,157,751 | |
| | | | |
| |
REALIZED AND UNREALIZED GAINS (LOSSES) ON INVESTMENTS | | | | |
Net realized gains on investments | | | 69,700 | |
Net change in unrealized gains (losses) on investments | | | (698,521 | ) |
| | | | |
Net realized and unrealized gains (losses) on investments | | | (628,821 | ) |
| | | | |
Net increase in net assets resulting from operations | | $ | 1,528,930 | |
| | | | |
The accompanying notes are an integral part of these financial statements.
| | | | | | |
| Statement of changes in net assets | | Wells Fargo Minnesota Tax-Free Fund | | | 15 | |
| | | | | | | | | | | | | | | | |
| | | Six months ended
December 31, 2018 (unaudited) | | | Year ended
June 30, 20181 | |
| | | | |
Operations | | | | | | | | | | | | | | | | |
Net investment income | | | | | | $ | 2,157,751 | | | | | | | $ | 4,586,522 | |
Net realized gains on investments | | | | | | | 69,700 | | | | | | | | 195,726 | |
Net change in unrealized gains (losses) on investments | | | | | | | (698,521 | ) | | | | | | | (2,825,310 | ) |
| | | | |
Net increase in net assets resulting from operations | | | | | | | 1,528,930 | | | | | | | | 1,956,938 | |
| | | | |
| | | | |
Distributions to shareholders from net investment income and net realized gains | | | | | | | | | | | | | | | | |
Class A | | | | | | | (383,882 | ) | | | | | | | (872,744 | ) |
Class C | | | | | | | (69,417 | ) | | | | | | | (162,373 | ) |
Administrator Class | | | | | | | (1,249,760 | ) | | | | | | | (2,841,350 | ) |
Institutional Class | | | | | | | (454,692 | ) | | | | | | | (793,549 | ) |
| | | | |
Total distributions to shareholders | | | | | | | (2,157,751 | ) | | | | | | | (4,670,016 | ) |
| | | | |
| | | | |
Capital share transactions | | | Shares | | | | | | | | Shares | | | | | |
Proceeds from shares sold | | | | | | | | | | | | | | | | |
Class A | | | 85,605 | | | | 892,326 | | | | 171,297 | | | | 1,824,591 | |
Class C | | | 3,191 | | | | 33,200 | | | | 30,242 | | | | 320,610 | |
Administrator Class | | | 974,704 | | | | 10,186,572 | | | | 1,645,104 | | | | 17,459,103 | |
Institutional Class | | | 851,018 | | | | 8,882,327 | | | | 1,450,392 | | | | 15,399,618 | |
| | | | |
| | | | |
| | | | | | | 19,994,425 | | | | | | | | 35,003,922 | |
| | | | |
Reinvestment of distributions | | | | | | | | | | | | | | | | |
Class A | | | 36,409 | | | | 380,242 | | | | 80,361 | | | | 852,641 | |
Class C | | | 6,613 | | | | 69,062 | | | | 15,294 | | | | 162,268 | |
Administrator Class | | | 80,981 | | | | 845,180 | | | | 181,284 | | | | 1,922,161 | |
Institutional Class | | | 43,218 | | | | 451,666 | | | | 74,672 | | | | 792,417 | |
| | | | |
| | | | |
| | | | | | | 1,746,150 | | | | | | | | 3,729,487 | |
| | | | |
Payment for shares redeemed | | | | | | | | | | | | | | | | |
Class A | | | (449,300 | ) | | | (4,680,789 | ) | | | (689,876 | ) | | | (7,312,506 | ) |
Class C | | | (34,736 | ) | | | (363,971 | ) | | | (234,385 | ) | | | (2,490,668 | ) |
Administrator Class | | | (1,874,957 | ) | | | (19,571,981 | ) | | | (3,535,508 | ) | | | (37,420,099 | ) |
Institutional Class | | | (694,041 | ) | | | (7,241,959 | ) | | | (838,851 | ) | | | (8,894,018 | ) |
| | | | |
| | | | |
| | | | | | | (31,858,700 | ) | | | | | | | (56,117,291 | ) |
| | | | |
Net decrease in net assets resulting from capital share transactions | | | | | | | (10,118,125 | ) | | | | | | | (17,383,882 | ) |
| | | | |
Total decrease in net assets | | | | | | | (10,746,946 | ) | | | | | | | (20,096,960 | ) |
| | | | |
| | | | |
Net assets | | | | | | | | | | | | | | | | |
Beginning of period | | | | | | | 151,838,815 | | | | | | | | 171,935,775 | |
| | | | |
End of period | | | | | | $ | 141,091,869 | | | | | | | $ | 151,838,815 | |
| | | | |
| 1 | Effective for all filings after November 4, 2018, the SEC prospectively eliminated the requirement to parenthetically disclose undistributed net investment income at the end of the period and permitted the aggregation of distributions, with the exception of tax basis returns of capital. Undistributed net investment income at June 30, 2018 was $830,755. The disaggregated distributions information for the year ended June 30, 2018 is included in Note 7,Distributions to Shareholders, in the notes to the financial statements. |
The accompanying notes are an integral part of these financial statements.
| | | | |
| 16 | | Wells Fargo Minnesota Tax-Free Fund | | Financial highlights |
(For a share outstanding throughout each period)
| | | | | | | | | | | | | | | | | | | | | | | | |
| | | Six months ended December 30, 2018 (unaudited) | | | Year ended June 30 | |
| CLASS A | | 2018 | | | 2017 | | | 2016 | | | 2015 | | | 2014 | |
Net asset value, beginning of period | | | $10.51 | | | | $10.68 | | | | $11.07 | | | | $10.79 | | | | $10.86 | | | | $10.74 | |
Net investment income | | | 0.14 | 1 | | | 0.28 | 1 | | | 0.28 | 1 | | | 0.33 | | | | 0.33 | | | | 0.35 | |
Net realized and unrealized gains (losses) on investments | | | (0.04 | ) | | | (0.16 | ) | | | (0.34 | ) | | | 0.28 | | | | (0.04 | ) | | | 0.20 | |
| | | | | | | | | | | | | | | | | | | | | | | | |
Total from investment operations | | | 0.10 | | | | 0.12 | | | | (0.06 | ) | | | 0.61 | | | | 0.29 | | | | 0.55 | |
Distributions to shareholders from | | | | | | | | | | | | | | | | | | | | | | | | |
Net investment income | | | (0.14 | ) | | | (0.28 | ) | | | (0.28 | ) | | | (0.33 | ) | | | (0.33 | ) | | | (0.35 | ) |
Net realized gains | | | 0.00 | | | | (0.01 | ) | | | (0.05 | ) | | | (0.00 | )2 | | | (0.03 | ) | | | (0.08 | ) |
| | | | | | | | | | | | | | | | | | | | | | | | |
Total distributions to shareholders | | | (0.14 | ) | | | (0.29 | ) | | | (0.33 | ) | | | (0.33 | ) | | | (0.36 | ) | | | (0.43 | ) |
Net asset value, end of period | | | $10.47 | | | | $10.51 | | | | $10.68 | | | | $11.07 | | | | $10.79 | | | | $10.86 | |
Total return3 | | | 0.97 | % | | | 1.10 | % | | | (0.53 | )% | | | 5.74 | % | | | 2.72 | % | | | 5.29 | % |
Ratios to average net assets (annualized) | | | | | | | | | | | | | | | | | | | | | | | | |
Gross expenses | | | 0.93 | % | | | 0.85 | % | | | 0.91 | % | | | 0.89 | % | | | 0.89 | % | | | 0.89 | % |
Net expenses | | | 0.85 | % | | | 0.84 | % | | | 0.85 | % | | | 0.85 | % | | | 0.85 | % | | | 0.85 | % |
Net investment income | | | 2.68 | % | | | 2.64 | % | | | 2.63 | % | | | 2.99 | % | | | 3.03 | % | | | 3.28 | % |
Supplemental data | | | | | | | | | | | | | | | | | | | | | | | | |
Portfolio turnover rate | | | 8 | % | | | 15 | % | | | 22 | % | | | 16 | % | | | 20 | % | | | 15 | % |
Net assets, end of period (000s omitted) | | | $26,014 | | | | $29,554 | | | | $34,720 | | | | $45,437 | | | | $45,437 | | | | $44,499 | |
| 1 | Calculated based upon average shares outstanding |
| 2 | Amount is less than $0.005. |
| 3 | Total return calculations do not include any sales charges. Returns for periods of less than one year are not annualized. |
The accompanying notes are an integral part of these financial statements.
| | | | | | |
| Financial highlights | | Wells Fargo Minnesota Tax-Free Fund | | | 17 | |
(For a share outstanding throughout each period)
| | | | | | | | | | | | | | | | | | | | | | | | |
| | | Six months ended December 30, 2018 (unaudited) | | | Year ended June 30 | |
| CLASS C | | 2018 | | | 2017 | | | 2016 | | | 2015 | | | 2014 | |
Net asset value, beginning of period | | | $10.51 | | | | $10.68 | | | | $11.07 | | | | $10.79 | | | | $10.86 | | | | $10.74 | |
Net investment income | | | 0.10 | | | | 0.20 | | | | 0.20 | | | | 0.24 | | | | 0.25 | | | | 0.27 | |
Net realized and unrealized gains (losses) on investments | | | (0.04 | ) | | | (0.16 | ) | | | (0.34 | ) | | | 0.28 | | | | (0.04 | ) | | | 0.20 | |
| | | | | | | | | | | | | | | | | | | | | | | | |
Total from investment operations | | | 0.06 | | | | 0.04 | | | | (0.14 | ) | | | 0.52 | | | | 0.21 | | | | 0.47 | |
Distributions to shareholders from | | | | | | | | | | | | | | | | | | | | | | | | |
Net investment income | | | (0.10 | ) | | | (0.20 | ) | | | (0.20 | ) | | | (0.24 | ) | | | (0.25 | ) | | | (0.27 | ) |
Net realized gains | | | 0.00 | | | | (0.01 | ) | | | (0.05 | ) | | | (0.00 | )1 | | | (0.03 | ) | | | (0.08 | ) |
| | | | | | | | | | | | | | | | | | | | | | | | |
Total distributions to shareholders | | | (0.10 | ) | | | (0.21 | ) | | | (0.25 | ) | | | (0.24 | ) | | | (0.28 | ) | | | (0.35 | ) |
Net asset value, end of period | | | $10.47 | | | | $10.51 | | | | $10.68 | | | | $11.07 | | | | $10.79 | | | | $10.86 | |
Total return2 | | | 0.59 | % | | | 0.34 | % | | | (1.27 | )% | | | 4.95 | % | | | 1.96 | % | | | 4.50 | % |
Ratios to average net assets (annualized) | | | | | | | | | | | | | | | | | | | | | | | | |
Gross expenses | | | 1.68 | % | | | 1.59 | % | | | 1.65 | % | | | 1.64 | % | | | 1.64 | % | | | 1.64 | % |
Net expenses | | | 1.60 | % | | | 1.59 | % | | | 1.60 | % | | | 1.60 | % | | | 1.60 | % | | | 1.60 | % |
Net investment income | | | 1.93 | % | | | 1.89 | % | | | 1.88 | % | | | 2.24 | % | | | 2.28 | % | | | 2.53 | % |
Supplemental data | | | | | | | | | | | | | | | | | | | | | | | | |
Portfolio turnover rate | | | 8 | % | | | 15 | % | | | 22 | % | | | 16 | % | | | 20 | % | | | 15 | % |
Net assets, end of period (000s omitted) | | | $7,098 | | | | $7,387 | | | | $9,525 | | | | $10,358 | | | | $10,061 | | | | $8,768 | |
| 1 | Amount is less than $0.005. |
| 2 | Total return calculations do not include any sales charges. Returns for periods of less than one year are not annualized. |
The accompanying notes are an integral part of these financial statements.
| | | | |
| 18 | | Wells Fargo Minnesota Tax-Free Fund | | Financial highlights |
(For a share outstanding throughout each period)
| | | | | | | | | | | | | | | | | | | | | | | | |
| | | Six months ended December 30, 2018 (unaudited) | | | Year ended June 30 | |
| ADMINISTRATOR CLASS | | 2018 | | | 2017 | | | 2016 | | | 2015 | | | 2014 | |
Net asset value, beginning of period | | | $10.51 | | | | $10.68 | | | | $11.07 | | | | $10.78 | | | | $10.86 | | | | $10.74 | |
Net investment income | | | 0.15 | 1 | | | 0.31 | 1 | | | 0.31 | 1 | | | 0.35 | | | | 0.36 | | | | 0.38 | |
Net realized and unrealized gains (losses) on investments | | | (0.04 | ) | | | (0.16 | ) | | | (0.34 | ) | | | 0.29 | | | | (0.05 | ) | | | 0.20 | |
| | | | | | | | | | | | | | | | | | | | | | | | |
Total from investment operations | | | 0.11 | | | | 0.15 | | | | (0.03 | ) | | | 0.64 | | | | 0.31 | | | | 0.58 | |
Distributions to shareholders from | | | | | | | | | | | | | | | | | | | | | | | | |
Net investment income | | | (0.15 | ) | | | (0.31 | ) | | | (0.31 | ) | | | (0.35 | ) | | | (0.36 | ) | | | (0.38 | ) |
Net realized gains | | | 0.00 | | | | (0.01 | ) | | | (0.05 | ) | | | (0.00 | )2 | | | (0.03 | ) | | | (0.08 | ) |
| | | | | | | | | | | | | | | | | | | | | | | | |
Total distributions to shareholders | | | (0.15 | ) | | | (0.32 | ) | | | (0.36 | ) | | | (0.35 | ) | | | (0.39 | ) | | | (0.46 | ) |
Net asset value, end of period | | | $10.47 | | | | $10.51 | | | | $10.68 | | | | $11.07 | | | | $10.78 | | | | $10.86 | |
Total return3 | | | 1.10 | % | | | 1.34 | % | | | (0.28 | )% | | | 6.10 | % | | | 2.88 | % | | | 5.55 | % |
Ratios to average net assets (annualized) | | | | | | | | | | | | | | | | | | | | | | | | |
Gross expenses | | | 0.87 | % | | | 0.78 | % | | | 0.84 | % | | | 0.83 | % | | | 0.83 | % | | | 0.83 | % |
Net expenses | | | 0.60 | % | | | 0.60 | % | | | 0.60 | % | | | 0.60 | % | | | 0.60 | % | | | 0.60 | % |
Net investment income | | | 2.93 | % | | | 2.89 | % | | | 2.87 | % | | | 3.24 | % | | | 3.28 | % | | | 3.53 | % |
Supplemental data | | | | | | | | | | | | | | | | | | | | | | | | |
Portfolio turnover rate | | | 8 | % | | | 15 | % | | | 22 | % | | | 16 | % | | | 20 | % | | | 15 | % |
Net assets, end of period (000s omitted) | | | $76,356 | | | | $85,259 | | | | $104,906 | | | | $124,485 | | | | $111,475 | | | | $98,483 | |
| 1 | Calculated based upon average shares outstanding |
| 2 | Amount is less than $0.005. |
| 3 | Returns for periods of less than one year are not annualized. |
The accompanying notes are an integral part of these financial statements.
| | | | | | |
| Financial highlights | | Wells Fargo Minnesota Tax-Free Fund | | | 19 | |
(For a share outstanding throughout each period)
| | | | | | | | | | | | |
| | | Six months ended December 30, 2018 (unaudited) | | | Year ended June 30 | |
| INSTITUTIONAL CLASS | | 2018 | | | 20171 | |
Net asset value, beginning of period | | | $10.52 | | | | $10.69 | | | | $10.88 | |
Net investment income | | | 0.16 | | | | 0.32 | | | | 0.21 | |
Net realized and unrealized gains (losses) on investments | | | (0.04 | ) | | | (0.16 | ) | | | (0.14 | ) |
| | | | | | | | | | | | |
Total from investment operations | | | 0.12 | | | | 0.16 | | | | 0.07 | |
Distributions to shareholders from | | | | | | | | | | | | |
Net investment income | | | (0.16 | ) | | | (0.32 | ) | | | (0.21 | ) |
Net realized gains | | | 0.00 | | | | (0.01 | ) | | | (0.05 | ) |
| | | | | | | | | | | | |
Total distributions to shareholders | | | (0.16 | ) | | | (0.33 | ) | | | (0.26 | ) |
Net asset value, end of period | | | $10.48 | | | | $10.52 | | | | $10.69 | |
Total return2 | | | 1.14 | % | | | 1.43 | % | | | 0.62 | % |
Ratios to average net assets (annualized) | | | | | | | | | | | | |
Gross expenses | | | 0.60 | % | | | 0.52 | % | | | 0.52 | % |
Net expenses | | | 0.52 | % | | | 0.52 | % | | | 0.51 | % |
Net investment income | | | 3.01 | % | | | 2.98 | % | | | 2.91 | % |
Supplemental data | | | | | | | | | | | | |
Portfolio turnover rate | | | 8 | % | | | 15 | % | | | 22 | % |
Net assets, end of period (000s omitted) | | | $31,624 | | | | $29,639 | | | | $22,785 | |
| 1 | For the period from October 31, 2016 (commencement of class operations) to June 30, 2017 |
| 2 | Returns for periods of less than one year are not annualized. |
The accompanying notes are an integral part of these financial statements.
| | | | |
| 20 | | Wells Fargo Minnesota Tax-Free Fund | | Notes to financial statements (unaudited) |
1. ORGANIZATION
Wells Fargo Funds Trust (the “Trust”), a Delaware statutory trust organized on March 10, 1999, is an open-end management investment company registered under the Investment Company Act of 1940, as amended (the “1940 Act”). As an investment company, the Trust follows the accounting and reporting guidance in Financial Accounting Standards Board (“FASB”) Accounting Standards Codification Topic 946, Financial Services – Investment Companies. These financial statements report on the Wells Fargo Minnesota Tax-Free Fund (the “Fund”) which is a diversified series of the Trust.
2. SIGNIFICANT ACCOUNTING POLICIES
The following significant accounting policies, which are consistently followed in the preparation of the financial statements of the Fund, are in conformity with U.S. generally accepted accounting principles which require management to make estimates and assumptions that affect the reported amounts of assets and liabilities, disclosure of contingent assets and liabilities at the date of the financial statements, and the reported amounts of revenues and expenses during the reporting period. Actual results could differ from those estimates.
Securities valuation
All investments are valued each business day as of the close of regular trading on the New York Stock Exchange (generally 4 p.m. Eastern Time), although the Fund may deviate from this calculation time under unusual or unexpected circumstances.
Debt securities are valued at the evaluated bid price provided by an independent pricing service (e.g. taking into account various factors, including yields, maturities, or credit ratings) or, if a reliable price is not available, the quoted bid price from an independent broker-dealer.
Investments which are not valued using any of the methods discussed above are valued at their fair value, as determined in good faith by the Board of Trustees of the Fund. The Board of Trustees has established a Valuation Committee comprised of the Trustees and has delegated to it the authority to take any actions regarding the valuation of portfolio securities that the Valuation Committee deems necessary or appropriate, including determining the fair value of portfolio securities, unless the determination has been delegated to the Wells Fargo Asset Management Pricing Committee at Wells Fargo Funds Management, LLC (“Funds Management”). The Board of Trustees retains the authority to make or ratify any valuation decisions or approve any changes to the Valuation Procedures as it deems appropriate. On a quarterly basis, the Board of Trustees receives reports on any valuation actions taken by the Valuation Committee or the Wells Fargo Asset Management Pricing Committee which may include items for ratification.
When-issued transactions
The Fund may purchase securities on a forward commitment or when-issued basis. The Fund records a when-issued transaction on the trade date and will segregate assets in an amount at least equal in value to the Fund’s commitment to purchase when-issued securities. Securities purchased on a when-issued basis are marked-to-market daily and the Fund begins earning interest on the settlement date. Losses may arise due to changes in the market value of the underlying securities or if the counterparty does not perform under the contract.
Security transactions and income recognition
Securities transactions are recorded on a trade date basis. Realized gains or losses are recorded on the basis of identified cost.
Interest income is accrued daily and bond discounts are accreted and premiums are amortized daily. To the extent debt obligations are placed on non-accrual status, any related interest income may be reduced by writing off interest receivables when the collection of all or a portion of interest has been determined to be doubtful based on consistently applied procedures and the fair value has decreased. If the issuer subsequently resumes interest payments or when the collectability of interest is reasonably assured, the debt obligation is removed from non-accrual status.
Distributions to shareholders
Distributions to shareholders from net investment income are declared daily and paid monthly. Distributions from net realized gains, if any, are recorded on the ex-dividend date and paid at least annually. Such distributions are determined in accordance with income tax regulations and may differ from U.S. generally accepted accounting principles. Dividend sources are estimated at the time of declaration. The tax character of distributions is determined as of the Fund’s fiscal year end. Therefore, a portion of the Fund’s distributions made prior to the Fund’s fiscal year end may be categorized as a tax return of capital at year end.
Federal and other taxes
The Fund intends to continue to qualify as a regulated investment company by distributing substantially all of its investment company taxable and tax-exempt income and any net realized capital gains (after reduction for capital loss carryforwards) sufficient to relieve it from all, or substantially all, federal income taxes. Accordingly, no provision for federal income taxes was required.
| | | | | | |
| Notes to financial statements (unaudited) | | Wells Fargo Minnesota Tax-Free Fund | | | 21 | |
The Fund’s income and federal excise tax returns and all financial records supporting those returns for the prior three fiscal years are subject to examination by the federal and Delaware revenue authorities. Management has analyzed the Fund’s tax positions taken on federal, state, and foreign tax returns for all open tax years and does not believe that there are any uncertain tax positions that require recognition of a tax liability.
As of December 31, 2018, the aggregate cost of all investments for federal income tax purposes was $138,934,140 and the unrealized gains (losses) consisted of:
| | | | |
| |
Gross unrealized gains | | $ | 2,405,695 | |
| |
Gross unrealized losses | | | (1,108,961 | ) |
| |
Net unrealized gains | | $ | 1,296,734 | |
As of June 30, 2018, the Fund had current year deferred post-October capital losses consisting of $71,454 in short-term losses and $3,972 in long-term losses which were recognized on the first day of the current fiscal year.
Class allocations
The separate classes of shares offered by the Fund differ principally in applicable sales charges, distribution, shareholder servicing, and administration fees. Class specific expenses are charged directly to that share class. Investment income, common expenses, and realized and unrealized gains (losses) on investments are allocated daily to each class of shares based on the relative proportion of net assets of each class.
3. FAIR VALUATION MEASUREMENTS
Fair value measurements of investments are determined within a framework that has established a fair value hierarchy based upon the various data inputs utilized in determining the value of the Fund’s investments. The three-level hierarchy gives the highest priority to unadjusted quoted prices in active markets for identical assets or liabilities (Level 1) and the lowest priority to unobservable inputs (Level 3). The Fund’s investments are classified within the fair value hierarchy based on the lowest level of input that is significant to the fair value measurement. The inputs are summarized into three broad levels as follows:
| ∎ | | Level 1 – quoted prices in active markets for identical securities |
| ∎ | | Level 2 – other significant observable inputs (including quoted prices for similar securities, interest rates, prepayment speeds, credit risk, etc.) |
| ∎ | | Level 3 – significant unobservable inputs (including the Fund’s own assumptions in determining the fair value of investments) |
The inputs or methodologies used for valuing investments in securities are not necessarily an indication of the risk associated with investing in those securities.
The following is a summary of the inputs used in valuing the Fund’s assets and liabilities as of December 31, 2018:
| | | | | | | | | | | | | | | | |
| | | | |
| | | Quoted prices (Level 1) | | | Other significant observable inputs (Level 2) | | | Significant
unobservable inputs (Level 3) | | | Total | |
| | | | |
Assets | | | | | | | | | | | | | | | | |
Investments in: | | | | | | | | | | | | | | | | |
| | | | |
Municipal obligations | | $ | 0 | | | $ | 140,230,874 | | | $ | 0 | | | $ | 140,230,874 | |
Additional sector, industry or geographic detail is included in the Portfolio of Investments.
At December 31, 2018, the Fund did not have any transfers into/out of Level 3.
4. TRANSACTIONS WITH AFFILIATES
Management fee
Funds Management, an indirect wholly owned subsidiary of Wells Fargo & Company (“Wells Fargo”), is the manager of the Fund and provides advisory and fund-level administrative services under an investment management agreement. Under the investment management agreement, Funds Management is responsible for, among other services, implementing the
| | | | |
| 22 | | Wells Fargo Minnesota Tax-Free Fund | | Notes to financial statements (unaudited) |
investment objectives and strategies of the Fund, supervising the subadviser and providing fund-level administrative services in connection with the Fund’s operations. As compensation for its services under the investment management agreement, Funds Management is entitled to receive an annual management fee starting at 0.40% and declining to 0.28% as the average daily net assets of the Fund increase. For the six months ended December 31, 2018, the management fee was equivalent to an annual rate of 0.40% of the Fund’s average daily net assets.
Funds Management has retained the services of a subadviser to provide daily portfolio management to the Fund. The fee for subadvisory services is borne by Funds Management. Wells Capital Management Incorporated, an affiliate of Funds Management and an indirect wholly owned subsidiary of Wells Fargo, is the subadviser to the Fund and is entitled to receive a fee from Funds Management at an annual rate starting at 0.20% and declining to 0.10% as the average daily net assets of the Fund increase.
Administration fees
Under a class-level administration agreement, Funds Management provides class-level administrative services to the Fund, which includes paying fees and expenses for services provided by the transfer agent, sub-transfer agents, omnibus account servicers and record-keepers. As compensation for its services under the class-level administration agreement, Funds Management receives an annual fee which is calculated based on the average daily net assets of each class as follows:
| | | | |
| | | Class-level
administration fee | |
| |
Class A, Class C | | | 0.16 | % |
| |
Administrator Class | | | 0.10 | |
| |
Institutional Class | | | 0.08 | |
Funds Management has contractually waived and/or reimbursed management and administration fees to the extent necessary to maintain certain net operating expense ratios for the Fund. When each class of the Fund has exceeded its expense cap, Funds Management has waived fees and/or reimbursed expenses from fund level expenses on a proportionate basis and then from class specific expenses; otherwise, waivers and/or reimbursements are applied against class specific expenses before fund level expenses. Funds Management has committed through October 31, 2019 to waive fees and/or reimburse expenses to the extent necessary to cap the Fund’s expenses at 0.85% for Class A shares, 1.60% for Class C shares, 0.60% for Administrator Class shares and 0.52% for Institutional Class shares. After this time, the cap may be increased or the commitment to maintain the cap may be terminated only with the approval of the Board of Trustees.
Distribution fee
The Trust has adopted a distribution plan for Class C shares of the Fund pursuant to Rule 12b-1 under the 1940 Act. A distribution fee is charged to Class C and paid to Wells Fargo Funds Distributor, LLC (“Funds Distributor”), the principal underwriter, at an annual rate of 0.75% of the average daily net assets of Class C shares.
In addition, Funds Distributor is entitled to receive the front-end sales charge from the purchase of Class A shares and a contingent deferred sales charge on the redemption of certain Class A shares. Funds Distributor is also entitled to receive the contingent deferred sales charges from redemptions of Class C shares. For the six months ended December 31, 2018, Funds Distributor received $1,254 from the sale of Class A shares. No contingent deferred sales charges were incurred by Class A and Class C shares for the six months ended December 31, 2018.
Shareholder servicing fees
The Trust has entered into contracts with one or more shareholder servicing agents, whereby Class A, Class C, and Administrator Class of the Fund are charged a fee at an annual rate of 0.25% of the average daily net assets of each respective class.
A portion of these total shareholder servicing fees were paid to affiliates of Wells Fargo.
Interfund transactions
The Fund may purchase or sell portfolio investment securities to certain other Wells Fargo affiliates pursuant to Rule 17a-7 under the 1940 Act and under procedures adopted by the Board of Trustees. The procedures have been designed to ensure that these interfund transactions, which do not incur broker commissions, are effected at current market prices. Pursuant to these procedures, the Fund had $6,500,000 and $14,725,000 in interfund purchases and sales, respectively, during the six months ended December 31, 2018.
| | | | | | |
| Notes to financial statements (unaudited) | | Wells Fargo Minnesota Tax-Free Fund | | | 23 | |
5. INVESTMENT PORTFOLIO TRANSACTIONS
Purchases and sales of investments, excluding U.S. government obligations (if any) and short-term securities, for the six months ended December 31, 2018 were $12,072,543 and $21,000,931, respectively.
6. BANK BORROWINGS
The Trust (excluding the money market funds), Wells Fargo Master Trust and Wells Fargo Variable Trust are parties to a $280,000,000 revolving credit agreement whereby the Fund is permitted to use bank borrowings for temporary or emergency purposes, such as to fund shareholder redemption requests. Interest under the credit agreement is charged to the Fund based on a borrowing rate equal to the higher of the Federal Funds rate in effect on that day plus 1.25% or the overnight LIBOR rate in effect on that day plus 1.25%. In addition, an annual commitment fee equal to 0.25% of the unused balance is allocated to each participating fund.
For the six months ended December 31, 2018, there were no borrowings by the Fund under the agreement.
7. DISTRIBUTIONS TO SHAREHOLDERS
Effective for all filings after November 4, 2018, the Securities and Exchange Commission eliminated the requirement to separately state the components of distributions to shareholders under U.S. generally accepted accounting principles. The amounts of distributions to shareholders for the year ended June 30, 2018 were as follows:
| | | | | | | | |
| | | Net investment income | | | Net realized gains | |
| | |
Class A | | $ | 855,881 | | | $ | 16,863 | |
| | |
Class C | | | 158,147 | | | | 4,226 | |
| | |
Administrator Class | | | 2,792,428 | | | | 48,922 | |
| | |
Institutional Class | | | 780,067 | | | | 13,482 | |
8. CONCENTRATION RISK
The Fund invests a substantial portion of its assets in issuers of municipal debt securities located in a single state or territories of the U.S. Therefore, it may be more affected by economic and political developments in that state or region than would be a comparable general tax-exempt fund.
9. INDEMNIFICATION
Under the Trust’s organizational documents, the officers and Trustees have been granted certain indemnification rights against certain liabilities that may arise out of performance of their duties to the Trust. Additionally, in the normal course of business, the Trust may enter into contracts with service providers that contain a variety of indemnification clauses. The Trust’s maximum exposure under these arrangements is dependent on future claims that may be made against the Fund and, therefore, cannot be estimated.
10. REORGANIZATION
At a regular meeting of the Board of Trustees held on November 8 and 9, 2018, the Trustees of the Fund approved a Plan of Reorganization (the “Plan”). Under the Plan, Wells Fargo Municipal Bond Fund will acquire the assets and assume the liabilities of the Fund in exchange for shares of Wells Fargo Municipal Bond Fund.
At a Special Meeting of Shareholders of the Fund held on February 19, 2019, the shareholders approved the Plan to merge the Fund into Wells Fargo Municipal Bond Fund. The merger is scheduled to take place on or about March 15, 2019.
11. NEW ACCOUNTING PRONOUNCEMENT
In August 2018, FASB issued Accounting Standards Update (“ASU”) No. 2018-13, Fair Value Measurement (Topic 820)Disclosure Framework—Changes to the Disclosure Requirements for Fair Value Measurement. ASU 2018-13 updates the disclosure requirements for fair value measurements by modifying or removing certain disclosures and adding certain new disclosures. The amendments are effective for fiscal years, and interim periods within those fiscal years, beginning after December 15, 2019. Early adoption is permitted. Management has adopted the removal and modification of disclosures early, as permitted, and will adopt the additional new disclosures at the effective date.
| | | | |
| 24 | | Wells Fargo Minnesota Tax-Free Fund | | Other information (unaudited) |
PROXY VOTING INFORMATION
A description of the policies and procedures used to determine how to vote proxies relating to portfolio securities is available, upon request, by calling1-800-222-8222, visiting our website atwellsfargofunds.com, or visiting the SEC website at sec.gov. Information regarding how the Fund voted proxies relating to portfolio securities during the most recent 12-month period ended June 30 is available on the Fund’s website atwellsfargofunds.comor by visiting the SEC website at sec.gov.
PORTFOLIO HOLDINGS INFORMATION
The complete portfolio holdings for the Fund are publicly available monthly on the Fund’s website (wellsfargofunds.com), on a one-month delayed basis. In addition, top ten holdings information (excluding derivative positions) for the Fund is publicly available on the Fund’s website on a monthly, seven-day or more delayed basis. The Fund files its complete schedule of portfolio holdings with the SEC for the first and third quarters of each fiscal year on Form N-Q, which is available by visiting the SEC website at sec.gov. In addition, the Fund’s Form N-Q may be reviewed and copied at the SEC’s Public Reference Room in Washington, DC, and at regional offices in New York City, at 233 Broadway, and in Chicago, at 175 West Jackson Boulevard, Suite 900. Information about the Public Reference Room may be obtained by calling 1-800-SEC-0330.
| | | | | | |
| Other information (unaudited) | | Wells Fargo Minnesota Tax-Free Fund | | | 25 | |
BOARD OF TRUSTEES AND OFFICERS
Each of the Trustees and Officers1 listed in the table below acts in identical capacities for each fund in the Wells Fargo family of funds, which consists of 152 mutual funds comprising the Wells Fargo Funds Trust, Wells Fargo Variable Trust, Wells Fargo Master Trust and four closed-end funds (collectively the “Fund Complex”). This table should be read in conjunction with the Prospectus and the Statement of Additional Information2. The mailing address of each Trustee and Officer is 525 Market Street, 12th Floor, San Francisco, CA 94105. Each Trustee and Officer serves an indefinite term, however, each Trustee serves such term until reaching the mandatory retirement age established by the Trustees.
Independent Trustees
| | | | | | |
Name and year of birth | | Position held and length of service* | | Principal occupations during past five years or longer | | Current other public company or investment company
directorships |
| | | |
William R. Ebsworth (Born 1957) | | Trustee, since 2015 | | Retired. From 1984 to 2013, equities analyst, portfolio manager, research director and chief investment officer at Fidelity Management and Research Company in Boston, Tokyo, and Hong Kong, and retired in 2013 as Chief Investment Officer of Fidelity Strategic Advisers, Inc. where he led a team of investment professionals managing client assets. Prior thereto, Board member of Hong Kong Securities Clearing Co., Hong Kong Options Clearing Corp., the Thailand International Fund, Ltd., Fidelity Investments Life Insurance Company, and Empire Fidelity Investments Life Insurance Company. Board member of the Vincent Memorial Hospital Endowment (non-profit organization), where he serves on the Investment Committee and as a Chair of the Audit Committee. Mr. Ebsworth is a CFA® charterholder. | | N/A |
| | | |
Jane A. Freeman (Born 1953) | | Trustee, since 2015; Chair Liaison, since 2018 | | Retired. From 2012 to 2014 and 1999 to 2008, Chief Financial Officer of Scientific Learning Corporation. From 2008 to 2012, Ms. Freeman provided consulting services related to strategic business projects. Prior to 1999, Portfolio Manager at Rockefeller & Co. and Scudder, Stevens & Clark. Board member of the Harding Loevner Funds from 1996 to 2014, serving as both Lead Independent Director and chair of the Audit Committee. Board member of the Russell Exchange Traded Funds Trust from 2011 to 2012 and the chair of the Audit Committee. Ms. Freeman is a Board Member of The Ruth Bancroft Garden (non-profit organization). She is also an inactive Chartered Financial Analyst. | | N/A |
| | | |
Isaiah Harris, Jr.3 (Born 1952) | | Trustee, since 2009; Audit Committee Chairman, since 2019 | | Retired. Chairman of the Board of CIGNA Corporation since 2009, and Director since 2005. From 2003 to 2011, Director of Deluxe Corporation. Prior thereto, President and CEO of BellSouth Advertising and Publishing Corp. from 2005 to 2007, President and CEO of BellSouth Enterprises from 2004 to 2005 and President of BellSouth Consumer Services from 2000 to 2003. Emeritus member of the Iowa State University Foundation Board of Governors. Emeritus Member of the Advisory Board of Iowa State University School of Business. Advisory Board Member, Palm Harbor Academy (private school). Advisory Board Member, Child Evangelism Fellowship (non-profit). Mr. Harris is a certified public accountant (inactive status). | | CIGNA Corporation |
| | | |
Judith M. Johnson3 (Born 1949) | | Trustee, since 2008; Audit Committee Chairman, from 2009 to 2018 | | Retired. Prior thereto, Chief Executive Officer and Chief Investment Officer of Minneapolis Employees Retirement Fund from 1996 to 2008. Ms. Johnson is an attorney, certified public accountant and a certified managerial accountant. | | N/A |
| | | |
David F. Larcker (Born 1950) | | Trustee, since 2009 | | James Irvin Miller Professor of Accounting at the Graduate School of Business, Stanford University, Director of the Corporate Governance Research Initiative and Senior Faculty of The Rock Center for Corporate Governance since 2006. From 2005 to 2008, Professor of Accounting at the Graduate School of Business, Stanford University. Prior thereto, Ernst & Young Professor of Accounting at The Wharton School, University of Pennsylvania from 1985 to 2005. | | N/A |
| | | | |
| 26 | | Wells Fargo Minnesota Tax-Free Fund | | Other information (unaudited) |
| | | | | | |
Name and year of birth | | Position held and length of service* | | Principal occupations during past five years or longer | | Current other public company or investment company
directorships |
| | | |
Olivia S. Mitchell (Born 1953) | | Trustee, since 2006; Nominating and Governance Committee Chairman, since 2018 | | International Foundation of Employee Benefit Plans Professor, Wharton School of the University of Pennsylvania since 1993. Director of Wharton’s Pension Research Council and Boettner Center on Pensions & Retirement Research, and Research Associate at the National Bureau of Economic Research. Previously, Cornell University Professor from 1978 to 1993. | | N/A |
| | | |
Timothy J. Penny (Born 1951) | | Trustee, since 1996; Chairman, since 2018; Vice Chairman, from 2017 to 2018 | | President and Chief Executive Officer of Southern Minnesota Initiative Foundation, a non-profit organization, since 2007. Member of the Board of Trustees of NorthStar Education Finance, Inc., a non-profit organization, since 2007. | | N/A |
| | | |
James G. Polisson (Born 1959) | | Trustee, since 2018; Advisory Board Member, from 2017 to 2018 | | Retired. Chief Marketing Officer, Source (ETF) UK Services, Ltd, from 2015 to 2017. From 2012 to 2015, Principal of The Polisson Group, LLC, a management consulting, corporate advisory and principal investing company. Chief Executive Officer and Managing Director at Russell Investments, Global Exchange Traded Funds from 2010 to 2012. Managing Director of Barclays Global Investors from 1998 to 2010 and Global Chief Marketing Officer for iShares and Barclays Global Investors from 2000 to 2010. Trustee of the San Francisco Mechanics’ Institute, a non-profit organization, from 2013 to 2015. Board member of the Russell Exchange Traded Fund Trust from 2011 to 2012. Director of Barclays Global Investors Holdings Deutschland GmbH from 2006 to 2009. Mr. Polisson is an attorney and has a retired status with the Massachusetts and District of Columbia Bar Associations. | | N/A |
| | | |
Michael S. Scofield4 (Born 1943) | | Trustee, since 2010 | | Served on the Investment Company Institute’s Board of Governors and Executive Committee from 2008-2011 as well the Governing Council of the Independent Directors Council from 2006-2011 and the Independent Directors Council Executive Committee from 2008-2011. Trustee of the Evergreen Fund complex (and its predecessors) from 1984 to 2010. Chairman of the Evergreen Funds from 2000-2010. Former Trustee of the Mentor Funds. Retired Attorney, Law Offices of Michael S. Scofield. | | N/A |
| | | |
Pamela Wheelock (Born 1959) | | Trustee, since 2018; Advisory Board Member, from 2017 to 2018 | | Chief Operating Officer, Twin Cities Habitat for Humanity, since January, 2017. Vice President of University Services, University of Minnesota from 2012 to 2017. Prior thereto, on the Board of Directors, Governance Committee and Finance Committee for the Minnesota Philanthropy Partners (Saint Paul Foundation) from 2012 to 2018, Interim President and Chief Executive Officer of Blue Cross Blue Shield of Minnesota from 2010 to 2011, Chairman of the Board from 2009 to 2011 and Board Director from 2003 to 2015. Vice President, Leadership and Community Engagement, Bush Foundation, Saint Paul, Minnesota (a private foundation) from 2009 to 2011. Executive Vice President and Chief Financial Officer, Minnesota Sports and Entertainment from 2004 to 2009 and Senior Vice President from 2002 to 2004. Commissioner of Finance, State of Minnesota, from 1999 to 2002. Currently the Board Chair of the Minnesota Wild Foundation since 2010. | | N/A |
| * | Length of service dates reflect the Trustee’s commencement of service with the Trust’s predecessor entities, where applicable. |
| | | | | | |
| Other information (unaudited) | | Wells Fargo Minnesota Tax-Free Fund | | | 27 | |
Officers
| | | | | | |
Name and year of birth | | Position held and length of service | | Principal occupations during past five years or longer | | |
| | | |
Andrew Owen (Born 1960) | | President, since 2017 | | Executive Vice President of Wells Fargo & Company and Head of Affiliated Managers, Wells Fargo Asset Management, since 2014. In addition, Mr. Owen is currently President, Chief Executive Officer and Director of Wells Fargo Funds Management, LLC since 2017. Prior thereto, Executive Vice President responsible for marketing, investments and product development for Wells Fargo Funds Management, LLC, from 2009 to 2014. | | |
| | | |
Nancy Wiser1 (Born 1967) | | Treasurer, since 2012 | | Executive Vice President of Wells Fargo Funds Management, LLC since 2011. Chief Operating Officer and Chief Compliance Officer at LightBox Capital Management LLC, from 2008 to 2011. | | |
| | | |
Alexander Kymn (Born 1973) | | Secretary, since 2018; Chief Legal Officer, since 2018 | | Senior Company Counsel of Wells Fargo Bank, N.A. since 2018 (previously Senior Counsel from 2007 to 2018). Vice President of Wells Fargo Funds Management, LLC from 2008 to 2014. | | |
| | | |
Michael H. Whitaker (Born 1967) | | Chief Compliance Officer, since 2016 | | Senior Vice President and Chief Compliance Officer since 2016. Senior Vice President and Chief Compliance Officer for Fidelity Investments from 2007 to 2016. | | |
| | | |
David Berardi (Born 1975) | | Assistant Treasurer, since 2009 | | Vice President of Wells Fargo Funds Management, LLC since 2009. Vice President of Evergreen Investment Management Company, LLC from 2008 to 2010. Manager of Fund Reporting and Control for Evergreen Investment Management Company, LLC from 2004 to 2010. | | |
| | | |
Jeremy DePalma1 (Born 1974) | | Assistant Treasurer, since 2009 | | Senior Vice President of Wells Fargo Funds Management, LLC since 2009. Senior Vice President of Evergreen Investment Management Company, LLC from 2008 to 2010 and head of the Fund Reporting and Control Team within Fund Administration from 2005 to 2010. | | |
| 1 | Nancy Wiser acts as Treasurer of 76 funds in the Fund Complex. Jeremy DePalma acts as Treasurer of 76 funds and Assistant Treasurer of 76 funds in the Fund Complex. |
| 2 | The Statement of Additional Information includes additional information about the Trustees and is available, without charge, upon request, by calling1-800-222-8222 or by visiting the website atwellsfargofunds.com. |
| 3 | Mr. Harris replaced Ms. Johnson as the Chairman of the Audit Committee effective January 1, 2019. |
| 4 | Mr. Scofield retired on December 31, 2018. |
| | | | |
| 28 | | Wells Fargo Minnesota Tax-Free Fund | | Appendix A (unaudited) |
SALES CHARGE REDUCTIONS AND WAIVERS FOR CERTAIN INTERMEDIARIES
Raymond James & Associates, Inc., Raymond James Financial Services & Raymond James affiliates (“Raymond James”)
Effective on or about March 1, 2019, shareholders purchasing Fund shares through a Raymond James platform or account will be eligible only for the following load waivers (front-end sales charge waivers and contingent deferred, or back-end, sales charge waivers) and discounts, which may differ from those disclosed elsewhere in the Fund’s Prospectus or SAI.
Front-end Sales Load Waivers on Class A shares Available at Raymond James
| | • | | Shares purchased in an investment advisory program. |
| | • | | Shares purchased through reinvestment of capital gains distributions and dividend reinvestment when purchasing shares of the same fund (but not any other fund within the fund family). |
| | • | | Employees and registered representatives of Raymond James or its affiliates and their family members as designated by Raymond James. |
| | • | | Shares purchased from the proceeds of redemptions within the same fund family, provided (1) the repurchase occurs within 90 days following the redemption, (2) the redemption and purchase occur in the same account, and (3) redeemed shares were subject to a front-end or deferred sales load (known as Rights of Reinstatement). |
| | • | | A shareholder in the fund’s Class C shares will have their shares automatically exchanged at net asset value to Class A shares (or the appropriate share class) of the fund if the shares are no longer subject to a CDSC and the exchange is in line with the policies and procedures of Raymond James. |
CDSC Waivers on Class A and C Shares Available at Raymond James
| | • | | Death or disability of the shareholder. |
| | • | | Shares sold as part of a systematic withdrawal plan as described in the Fund’s Prospectus. |
| | • | | Return of excess contributions from an IRA Account. |
| | • | | Shares sold as part of a required minimum distribution for IRA and retirement accounts due to the shareholder reaching age 70½ as described in the Fund’s prospectus. |
| | • | | Shares sold to pay Raymond James fees but only if the transaction is initiated by Raymond James. |
| | • | | Shares acquired through a right of reinstatement. |
Front-end Load Discounts Available at Raymond James: Breakpoints, and/or Rights of Accumulation
| | • | | Breakpoints as described in the Fund’s Prospectus. |
| | • | | Rights of accumulation which entitle shareholders to breakpoint discounts will be automatically calculated based on the aggregated holding of fund family assets held by accounts within the purchaser’s household at Raymond James. Eligible fund family assets not held at Raymond James may be included in the rights of accumulation calculation only if the shareholder notifies his or her financial advisor about such assets. |

For more information
More information about Wells Fargo Funds is available free upon request. To obtain literature, please write, visit the Fund’s website, or call:
Wells Fargo Funds
P.O. Box 219967
Kansas City, MO 64121-9967
Website: wellsfargofunds.com
Individual investors: 1-800-222-8222
Retail investment professionals: 1-888-877-9275
Institutional investment professionals:1-866-765-0778
This report and the financial statements contained herein are submitted for the general information of the shareholders of the Fund. If this report is used for promotional purposes, distribution of the report must be accompanied or preceded by a current prospectus. Before investing, please consider the investment objectives, risks, charges, and expenses of the investment. For a current prospectus and, if available, a summary prospectus, containing this information, call1-800-222-8222 or visit the Fund’s website atwellsfargofunds.com. Read the prospectus carefully before you invest or send money.
Wells Fargo Asset Management (WFAM) is the trade name for certain investment advisory/management firms owned by Wells Fargo & Company. These firms include but are not limited to Wells Capital Management Incorporated and Wells Fargo Funds Management, LLC. Certain products managed by WFAM entities are distributed by Wells Fargo Funds Distributor, LLC (a broker/dealer and Member FINRA).
This material is for general informational and educational purposes only and is NOT intended to provide investment advice or a recommendation of any kind—including a recommendation for any specific investment, strategy, or plan.
INVESTMENT PRODUCTS: NOT FDIC INSURED ◾ NO BANK GUARANTEE ◾ MAY LOSE VALUE
© 2019 Wells Fargo Funds Management, LLC. All rights reserved.
| | |
 | | 320447 02-19 SA252/SAR252 12-18 |
Semi-Annual Report
December 31, 2018

Wells Fargo Municipal Bond Fund

Beginning on January 1, 2021, as permitted by new regulations adopted by the Securities and Exchange Commission, paper copies of the Wells Fargo Funds’ annual and semi-annual shareholder reports issued after this date will no longer be sent by mail, unless you specifically request paper copies of the reports. Instead, the reports will be made available on the Funds’ website, and you will be notified by mail each time a report is posted and provided with a website address to access the report.
If you already elected to receive shareholder reports electronically, you will not be affected by this change and you need not take any action. You may elect to receive shareholder reports and other communications from the Fund electronically at any time by contacting your financial intermediary (such as a broker-dealer or bank) or, if you are a direct investor, by calling 1-800-222-8222 or by enrolling at wellsfargo.com/advantagedelivery.
You may elect to receive all future reports in paper free of charge. If you invest through a financial intermediary, you can contact your financial intermediary to request that you continue to receive paper copies of your shareholder reports; if you invest directly with the Fund, you can call 1-800-222-8222. Your election to receive reports in paper will apply to all Wells Fargo Funds held in your account with your financial intermediary or, if you are a direct investor, to all Wells Fargo Funds that you hold.

Reduce clutter. Save trees.
Sign up for electronic delivery of prospectuses and shareholder reports atwellsfargo.com/advantagedelivery
Contents
The views expressed and any forward-looking statements are as of December 31, 2018, unless otherwise noted, and are those of the Fund managers and/or Wells Fargo Funds Management, LLC. Discussions of individual securities, or the markets generally, or any Wells Fargo Fund are not intended as individual recommendations. Future events or results may vary significantly from those expressed in any forward-looking statements. The views expressed are subject to change at any time in response to changing circumstances in the market. Wells Fargo Funds Management, LLC and the Fund disclaim any obligation to publicly update or revise any views expressed or forward-looking statements.
INVESTMENT PRODUCTS: NOT FDIC INSURED ◾ NO BANK GUARANTEE ◾ MAY LOSE VALUE
| | | | |
| 2 | | Wells Fargo Municipal Bond Fund | | Letter to shareholders (unaudited) |

Andrew Owen
President
Wells Fargo Funds
Global trade tensions escalated during the third quarter of 2018.
Dear Shareholder:
We are pleased to offer you this semi-annual report for the Wells Fargo Municipal Bond Fund for the six-month period that ended December 31, 2018. During the reporting period, the U.S. generated encouraging economic and business data that was offset by less positive and more inconsistent data from international markets. Investment returns were generally negative as geopolitical tensions and uncertainty tended to distract investors from more favorable underlying trends.
For the period, U.S. stocks, as measured by the S&P 500 Index,1 fell 6.85% and international stocks, as measured by the MSCI ACWI ex USA Index (Net),2 declined 10.84%. Based on the MSCI EM Index (Net),3 emerging market stocks lost 8.48%. For bond investors, the Bloomberg Barclays U.S. Aggregate Bond Index4 gained 1.65% while the Bloomberg Barclays Global Aggregate ex-USD Index5 fell 0.84%. The Bloomberg Barclays Municipal Bond Index6 gained 1.53% while the ICE BofAML U.S. High Yield Index7 declined 2.34%.
Global trade tensions prompted investor concerns.
Global trade tensions escalated during the third quarter of 2018. The U.S. imposed tariffs on a wide range of products manufactured overseas. Foreign governments retaliated with tariffs that punished U.S. commodity producers and product manufacturers. Investors wondered about next steps as divergence in global economic policies and growth prospects widened.
During the summer months, the U.S. economy strengthened. Revised second-quarter gross domestic product (GDP) growth data released in August showed the U.S. economy growing at a 4.2% rate. The unemployment rate in the U.S. was 3.7% by the end of September, according to the U.S. Department of Labor. Wages showed more consistent growth, and consumer confidence remained strong. Several U.S. equity market indices reached records during August, with the S&P 500 Index gaining 7.71% for the three-month period that ended September 30, 2018. In contrast, the MSCI ACWI ex USA Index (Net) gained 0.71% while the MSCI EM Index (Net) declined 1.09% during the same three-month period.
| 1 | The S&P 500 Index consists of 500 stocks chosen for market size, liquidity, and industry group representation. It is a market-value-weighted index with each stock’s weight in the index proportionate to its market value. You cannot invest directly in an index. |
| 2 | The Morgan Stanley Capital International (MSCI) All Country World Index (ACWI) ex USA Index (Net) is a free-float-adjusted market-capitalization-weighted index that is designed to measure the equity market performance of developed markets, excluding the United States and Canada. Source: MSCI. MSCI makes no express or implied warranties or representations and shall have no liability whatsoever with respect to any MSCI data contained herein. The MSCI data may not be further redistributed or used as a basis for other indices or any securities or financial products. This report is not approved, reviewed, or produced by MSCI. You cannot invest directly in an index. |
| 3 | The MSCI Emerging Markets (EM) Index (Net) is a free-float-adjusted market-capitalization-weighted index that is designed to measure large- and mid-cap equity market performance of emerging markets. The MSCI EM Index (Net) consists of the following 24 emerging market country indices: Brazil, Chile, China, Colombia, Czech Republic, Egypt, Greece, Hungary, India, Indonesia, Korea, Malaysia, Mexico, Pakistan, Peru, the Philippines, Poland, Qatar, Russia, South Africa, Taiwan, Thailand, Turkey, and the United Arab Emirates. You cannot invest directly in an index. |
| 4 | The Bloomberg Barclays U.S. Aggregate Bond Index is a broad-based benchmark that measures the investment-grade, U.S. dollar-denominated, fixed-rate taxable bond market, including Treasuries, government-related and corporate securities, mortgage-backed securities (agency fixed-rate and hybrid adjustable-rate mortgage pass-throughs), asset-backed securities, and commercial mortgage-backed securities. You cannot invest directly in an index. |
| 5 | The Bloomberg Barclays Global Aggregate ex-USD Index is an unmanaged index that provides a broad-based measure of the global investment-grade fixed-income markets excluding the U.S. dollar-denominated debt market. You cannot invest directly in an index. |
| 6 | The Bloomberg Barclays Municipal Bond Index is an unmanaged index composed of long-term tax-exempt bonds with a minimum credit rating of Baa. You cannot invest directly in an index. |
| 7 | The ICE BofAML U.S. High Yield Index is a market-capitalization-weighted index of domestic and Yankee high-yield bonds. The index tracks the performance of high-yield securities traded in the U.S. bond market. You cannot invest directly in an index. Copyright 2018. ICE Data Indices, LLC. All rights reserved. |
| | | | | | |
| Letter to shareholders (unaudited) | | Wells Fargo Municipal Bond Fund | | | 3 | |
Economic signals overseas were mixed as the third quarter ended and the fourth quarter began. In particular, signs of slowing economic growth in China created uncertainty for investors. Amid rising trade tensions, the People’s Bank of China cut reserve requirement ratios and accelerated infrastructure spending and tax cuts for business enterprises and individuals. Nevertheless, a strengthening U.S. dollar and trade tensions remained headwinds for investors overseas.
Equity markets were volatile during the fourth quarter.
Negative stock market performance during October and December bracketed a mildly positive November, as measured by the S&P 500 Index and the MSCI ACWI ex USA Index (Net). As interest rates and bond yields gained during October, stock markets struggled. Readings on consumer sentiment and business spending were mixed. Markets rebounded in November. The U.S. and China agreed to halt further increases in tariffs and engage in additional negotiations. While November returns were positive, the loss for the full fourth quarter was substantial for equity investors globally, with the S&P down 13.52% and the MSCI ACWI ex USA Index (Net) down 11.46%. December’s S&P 500 Index performance was the lowest since 1931. Globally, fixed income investments fared better than stocks during the last two months of the year as conflicting signals unsettled investors’ outlooks.
Equity investors confronted a number of changing conditions. In November’smid-term elections, control of the U.S. House of Representatives shifted from Republicans to Democrats, presaging potential partisan disputes. Progress on Brexit negotiations stalled in the UK. In China, the value of the yuan declined to low levels last seen in 2008. Oil prices continued to fall. The Fed increased the federal funds rate by 25 bps to a target range of between 2.25% and 2.50% in December 2018. A late-December dispute over spending and immigration policy resulted in a partial U.S. government shutdown that continued through the end of the period.
Don’t let short-term uncertainty derail long-term investment goals.
Periods of investment uncertainty can present challenges, but experience has taught us that maintaining long-term investment goals can be an effective way to plan for the future. To help you create a sound strategy based on your personal goals and risk tolerance, Wells Fargo Funds offers more than 100 mutual funds spanning a wide range of asset classes and investment styles. Although diversification cannot guarantee an investment profit or prevent losses, we believe it can be an effective way to manage investment risk and potentially smooth out overall portfolio performance. We encourage investors to know their investments and to understand that appropriate levels of risk-taking may unlock opportunities.
Thank you for choosing to invest with Wells Fargo Funds. We appreciate your confidence in us and remain committed to helping you meet your financial needs.
Sincerely,

Andrew Owen
President
Wells Fargo Funds
Economic signals overseas were mixed as the third quarter ended and the fourth quarter began.
For further information about your Fund, contact your investment professional, visit our website atwellsfargofunds.com, or call us directly at1-800-222-8222.
| | | | |
| 4 | | Wells Fargo Municipal Bond Fund | | Performance highlights (unaudited) |
Investment objective
The Fund seeks current income exempt from federal income tax.
Manager
Wells Fargo Funds Management, LLC
Subadviser
Wells Capital Management Incorporated
Portfolio managers
Lyle J. Fitterer, CFA®‡, CPA
Robert J. Miller
Average annual total returns (%) as of December 31, 2018
| | | | | | | | | | | | | | | | | | | | | | | | | | | | | | | | | | |
| | | | | Including sales charge | | | Excluding sales charge | | | Expense ratios1 (%) | |
| | | Inception date | | 1 year | | | 5 year | | | 10 year | | | 1 year | | | 5 year | | | 10 year | | | Gross | | | Net2 | |
| | | | | | | | | |
| Class A (WMFAX) | | 4-8-2005 | | | -2.78 | | | | 3.43 | | | | 6.17 | | | | 1.83 | | | | 4.39 | | | | 6.65 | | | | 0.79 | | | | 0.75 | |
| | | | | | | | | |
| Class C (WMFCX) | | 4-8-2005 | | | 0.07 | | | | 3.61 | | | | 5.86 | | | | 1.07 | | | | 3.61 | | | | 5.86 | | | | 1.54 | | | | 1.50 | |
| | | | | | | | | |
| Class R63 | | 7-31-2018 | | | – | | | | – | | | | – | | | | 2.15 | | | | 4.69 | | | | 6.96 | | | | 0.41 | | | | 0.41 | |
| | | | | | | | | |
| Administrator Class (WMFDX) | | 4-8-2005 | | | – | | | | – | | | | – | | | | 1.89 | | | | 4.55 | | | | 6.81 | | | | 0.73 | | | | 0.60 | |
| | | | | | | | | |
| Institutional Class (WMBIX) | | 3-31-2008 | | | – | | | | – | | | | – | | | | 2.13 | | | | 4.69 | | | | 6.96 | | | | 0.46 | | | | 0.46 | |
| | | | | | | | | |
| Bloomberg Barclays Municipal Bond Index4 | | – | | | – | | | | – | | | | – | | | | 1.28 | | | | 3.82 | | | | 4.85 | | | | – | | | | – | |
Figures quoted represent past performance, which is no guarantee of future results, and do not reflect taxes that a shareholder may pay on fund distributions or the redemption of fund shares. Investment return and principal value of an investment will fluctuate so that an investor’s shares, when redeemed, may be worth more or less than their original cost. Performance shown without sales charges would be lower if sales charges were reflected. Current performance may be lower or higher than the performance data quoted, which assumes the reinvestment of dividends and capital gains. Current month-end performance is available on the Fund’s website,wellsfargofunds.com.
Index returns do not include transaction costs associated with buying and selling securities, any mutual fund fees or expenses, or any taxes. It is not possible to invest directly in an index.
For Class A shares, the maximum front-end sales charge is 4.50%. For Class C shares, the maximum contingent deferred sales charge is 1.00%. Performance including a contingent deferred sales charge assumes the sales charge for the corresponding time period. Class R6, Administrator Class, and Institutional Class shares are sold without a front-end sales charge or contingent deferred sales charge.
Bond values fluctuate in response to the financial condition of individual issuers, general market and economic conditions, and changes in interest rates. Changes in market conditions and government policies may lead to periods of heightened volatility in the bond market and reduced liquidity for certain bonds held by the Fund. In general, when interest rates rise, bond values fall and investors may lose principal value. Interest rate changes and their impact on the Fund and its share price can be sudden and unpredictable. The use of derivatives may reduce returns and/or increase volatility. Certain investment strategies tend to increase the total risk of an investment (relative to the broader market). The Fund is exposed to high-yield securities risk and municipal securities risk. Consult the Fund’s prospectus for additional information on these and other risks. A portion of the Fund’s income may be subject to federal, state, and/ or local income taxes or the Alternative Minimum Tax (AMT). Any capital gains distributions may be taxable.
Please see footnotes on page 5.
| | | | | | |
| Performance highlights (unaudited) | | Wells Fargo Municipal Bond Fund | | | 5 | |
|
| Effective maturity distribution as of December 31, 20185 |
|
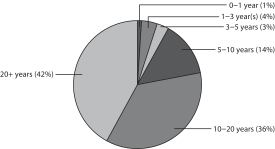 |
|
| Credit quality as of December 31, 20186 |
|
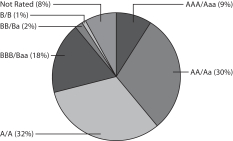
|
| ‡ | CFA® and Chartered Financial Analyst® are trademarks owned by CFA Institute. |
| 1 | Reflects the expense ratios as stated in the most recent prospectuses. The expense ratios shown are subject to change and may differ from the annualized expense ratios shown in the financial highlights of this report. |
| 2 | The manager has contractually committed through October 31, 2019, to waive fees and/or reimburse expenses to the extent necessary to cap the Fund’s Total Annual Fund Operating Expenses After Fee Waivers at 0.75% for Class A, 1.50% for Class C, 0.43% for Class R6, 0.60% for Administrator Class, and 0.48% for Institutional Class. After this time, the cap may be increased or the commitment to maintain the cap may be terminated only with the approval of the Board of Trustees. Brokerage commissions, stamp duty fees, interest, taxes, acquired fund fees and expenses (if any), and extraordinary expenses are excluded from the expense cap. Without this cap, the Fund’s returns would have been lower. The expense ratio paid by an investor is the net expense ratio (the total annual fund operating expenses after fee waivers) as stated in the prospectuses. |
| 3 | Historical performance shown for Class R6 shares prior to their inception reflects the performance of the Institutional Class shares, and includes the higher expenses applicable to Institutional Class shares. If these expenses had not been included, returns for Class R6 shares would be higher. |
| 4 | The Bloomberg Barclays Municipal Bond Index is an unmanaged index composed of long-term tax-exempt bonds with a minimum credit rating of Baa. You cannot invest directly in an index. |
| 5 | Amounts are calculated based on the total long-term investments of the Fund. These amounts are subject to change and may have changed since the date specified. |
| 6 | The credit quality distribution of portfolio holdings reflected in the chart is based on ratings from Standard & Poor’s, Moody’s Investors Service, and/ or Fitch Ratings Ltd. Credit quality ratings apply to the underlying holdings of the Fund and not to the Fund itself. The percentages of the Fund’s portfolio with the ratings depicted in the chart are calculated based on the total market value of fixed income securities held by the Fund. If a security was rated by all three rating agencies, the middle rating was utilized. If rated by two of three rating agencies, the lower rating was utilized, and if rated by one of the rating agencies, that rating was utilized. Standard & Poor’s rates the creditworthiness of bonds, ranging from AAA (highest) to D (lowest). Ratings from A to CCC may be modified by the addition of a plus (+) or minus (-) sign to show relative standing within the rating categories. Standard & Poor’s rates the creditworthiness of short-term notes from SP-1 (highest) to SP-3 (lowest). Moody’s rates the creditworthiness of bonds, ranging from Aaa (highest) to C (lowest). Ratings Aa to B may be modified by the addition of a number 1 (highest) to 3 (lowest) to show relative standing within the ratings categories. Moody’s rates the creditworthiness of short-term U.S. tax-exempt municipal securities from MIG 1/VMIG 1 (highest) to SG (lowest). Fitch rates the creditworthiness of bonds, ranging from AAA (highest) to D (lowest). Credit quality distribution is subject to change and may have changed since the date specified. |
| | | | |
| 6 | | Wells Fargo Municipal Bond Fund | | Fund expenses (unaudited) |
As a shareholder of the Fund, you incur two types of costs: (1) transaction costs, including sales charges (loads) on purchase payments and contingent deferred sales charges (if any) on redemptions and (2) ongoing costs, including management fees, distribution (12b-1) and/or shareholder servicing fees, and other Fund expenses. This example is intended to help you understand your ongoing costs (in dollars) of investing in the Fund and to compare these costs with the ongoing costs of investing in other mutual funds.
The example is based on an investment of $1,000 invested at the beginning of the six-month period and held for the entire period from July 1, 2018 to December 31, 2018.
Actual expenses
The “Actual” line of the table below provides information about actual account values and actual expenses. You may use the information in this line, together with the amount you invested, to estimate the expenses that you paid over the period. Simply divide your account value by $1,000 (for example, an $8,600 account value divided by $1,000 = 8.6), then multiply the result by the number in the “Actual” line under the heading entitled “Expenses paid during period” for your applicable class of shares to estimate the expenses you paid on your account during this period.
Hypothetical example for comparison purposes
The “Hypothetical” line of the table below provides information about hypothetical account values and hypothetical expenses based on the Fund’s actual expense ratio and an assumed rate of return of 5% per year before expenses, which is not the Fund’s actual return. The hypothetical account values and expenses may not be used to estimate the actual ending account balance or expenses you paid for the period. You may use this information to compare the ongoing costs of investing in the Fund and other funds. To do so, compare this 5% hypothetical example with the 5% hypothetical examples that appear in the shareholder reports of the other funds.
Please note that the expenses shown in the table are meant to highlight your ongoing costs only and do not reflect any transactional costs, such as sales charges (loads) and contingent deferred sales charges. Therefore, the “Hypothetical” line of the table is useful in comparing ongoing costs only and will not help you determine the relative total costs of owning different funds. In addition, if these transactional costs were included, your costs would have been higher.
| | | | | | | | | | | | | | | | |
| | | Beginning
account value
7-1-2018 | | | Ending
account value
12-31-2018 | | | Expenses
paid during
the period¹ | | | Annualized net
expense ratio | |
Class A | | | | | | | | | | | | | | | | |
| | | | |
Actual | | $ | 1,000.00 | | | $ | 1,013.14 | | | $ | 3.81 | | | | 0.75 | % |
| | | | |
Hypothetical (5% return before expenses) | | $ | 1,000.00 | | | $ | 1,021.42 | | | $ | 3.82 | | | | 0.75 | % |
Class C | | | | | | | | | | | | | | | | |
| | | | |
Actual | | $ | 1,000.00 | | | $ | 1,009.33 | | | $ | 7.60 | | | | 1.50 | % |
| | | | |
Hypothetical (5% return before expenses) | | $ | 1,000.00 | | | $ | 1,017.64 | | | $ | 7.63 | | | | 1.50 | % |
Class R6 | | | | | | | | | | | | | | | | |
| | | | |
Actual | | $ | 1,000.00 | | | $ | 1,014.87 | | | $ | 2.08 | | | | 0.41 | % |
| | | | |
Hypothetical (5% return before expenses) | | $ | 1,000.00 | | | $ | 1,023.14 | | | $ | 2.09 | | | | 0.41 | % |
Administrator Class | | | | | | | | | | | | | | | | |
| | | | |
Actual | | $ | 1,000.00 | | | $ | 1,013.93 | | | $ | 3.05 | | | | 0.60 | % |
| | | | |
Hypothetical (5% return before expenses) | | $ | 1,000.00 | | | $ | 1,022.18 | | | $ | 3.06 | | | | 0.60 | % |
Institutional Class | | | | | | | | | | | | | | | | |
| | | | |
Actual | | $ | 1,000.00 | | | $ | 1,014.62 | | | $ | 2.34 | | | | 0.46 | % |
| | | | |
Hypothetical (5% return before expenses) | | $ | 1,000.00 | | | $ | 1,022.89 | | | $ | 2.35 | | | | 0.46 | % |
| 1 | Expenses paid is equal to the annualized net expense ratio of each class multiplied by the average account value over the period, multiplied by the number of days in the most recent fiscal half-year divided by the number of days in the fiscal year (to reflect the one-half-year period). |
| | | | | | |
| Portfolio of investments—December 31, 2018 (unaudited) | | Wells Fargo Municipal Bond Fund | | | 7 | |
| | | | | | | | | | | | | | | | |
| Security name | | Interest rate | | | Maturity date | | | Principal | | | Value | |
| | | | |
Municipal Obligations: 98.77% | | | | | | | | | | | | | | | | |
| | | | |
Alabama: 1.19% | | | | | | | | | | | | | | | | |
| | | | |
| GO Revenue: 0.14% | | | | | | | | | | | | | | | | |
| | | | |
Birmingham AL CAB Series A1 | | | 5.00 | % | | | 3-1-2045 | | | $ | 3,000,000 | | | $ | 3,233,910 | |
| | | | |
Jefferson County AL Series A | | | 4.90 | | | | 4-1-2021 | | | | 1,095,000 | | | | 1,118,619 | |
| | | | |
Jefferson County AL Series C | | | 4.90 | | | | 4-1-2021 | | | | 635,000 | | | | 648,697 | |
| | | | |
| | | | | | | | | | | | | | | 5,001,226 | |
| | | | | | | | | | | | | | | | |
| | | | |
| Miscellaneous Revenue: 0.60% | | | | | | | | | | | | | | | | |
| | | | |
Alabama Federal Aid Highway Finance Authority Series A | | | 5.00 | | | | 9-1-2035 | | | | 19,000,000 | | | | 21,920,110 | |
| | | | | | | | | | | | | | | | |
| | | | |
| Utilities Revenue: 0.30% | | | | | | | | | | | | | | | | |
| | | | |
Southeast Alabama Gas Supply District Project #2 Series A | | | 4.00 | | | | 6-1-2049 | | | | 9,000,000 | | | | 9,409,590 | |
| | | | |
SouthEast Alabama Gas Supply District Series A | | | 4.00 | | | | 4-1-2049 | | | | 1,410,000 | | | | 1,473,027 | |
| | | | |
| | | | | | | | | | | | | | | 10,882,617 | |
| | | | | | | | | | | | | | | | |
| | | | |
| Water & Sewer Revenue: 0.15% | | | | | | | | | | | | | | | | |
| | | | |
Jefferson County AL CAB Series B (AGM Insured) (z) | | | 5.48 | | | | 10-1-2025 | | | | 710,000 | | | | 577,415 | |
| | | | |
Jefferson County AL CAB Series B (AGM Insured) (z) | | | 5.50 | | | | 10-1-2029 | | | | 4,115,000 | | | | 2,557,102 | |
| | | | |
Jefferson County AL CAB Series B (AGM Insured) (z) | | | 5.80 | | | | 10-1-2026 | | | | 3,000,000 | | | | 2,279,610 | |
| | | | |
| | | | | | | | | | | | | | | 5,414,127 | |
| | | | | | | | | | | | | | | | |
| | | | |
| | | | | | | | | | | | | | | 43,218,080 | |
| | | | | | | | | | | | | | | | |
| | | | |
Alaska: 0.31% | | | | | | | | | | | | | | | | |
| | | | |
| Health Revenue: 0.31% | | | | | | | | | | | | | | | | |
| | | | |
Alaska IDA Loan Anticipation YKHC Project | | | 3.50 | | | | 12-1-2020 | | | | 11,300,000 | | | | 11,384,750 | |
| | | | | | | | | | | | | | | | |
| | | | |
Arizona: 1.41% | | | | | | | | | | | | | | | | |
| | | | |
| Education Revenue: 0.73% | | | | | | | | | | | | | | | | |
| | | | |
Arizona Board Regents Certificates Refunding University Arizona Series C | | | 5.00 | | | | 6-1-2028 | | | | 3,250,000 | | | | 3,530,670 | |
| | | | |
La Paz County AZ IDA Educational Facility Imagine Schools West Middle Project Series A 144A | | | 5.75 | | | | 6-15-2038 | | | | 1,085,000 | | | | 1,065,047 | |
| | | | |
La Paz County AZ IDA Educational Facility Imagine Schools West Middle Project Series A 144A | | | 5.88 | | | | 6-15-2048 | | | | 2,435,000 | | | | 2,375,002 | |
| | | | |
Phoenix AZ IDA Legacy Traditional Schools Project Series A 144A | | | 6.50 | | | | 7-1-2034 | | | | 2,000,000 | | | | 2,177,580 | |
| | | | |
Pima County AZ IDA New Plan Learning Project Series A | | | 7.75 | | | | 7-1-2035 | | | | 7,390,000 | | | | 7,401,455 | |
| | | | |
Pima County AZ IDA New Plan Learning Project Series A | | | 8.13 | | | | 7-1-2041 | | | | 6,395,000 | | | | 6,399,924 | |
| | | | |
Pima County AZ IDA Noah Webster Schools-Pima Project | | | 7.00 | | | | 12-15-2043 | | | | 3,225,000 | | | | 3,447,848 | |
| | | | |
| | | | | | | | | | | | | | | 26,397,526 | |
| | | | | | | | | | | | | | | | |
| | | | |
| Health Revenue: 0.09% | | | | | | | | | | | | | | | | |
| | | | |
Tempe AZ IDA Friendship Village Project Series A | | | 5.25 | | | | 12-1-2020 | | | | 1,000,000 | | | | 1,045,260 | |
| | | | |
Tempe AZ IDA Friendship Village Project Series A | | | 5.38 | | | | 12-1-2021 | | | | 1,000,000 | | | | 1,065,130 | |
| | | | |
Tempe AZ IDA Friendship Village Project Series A | | | 5.50 | | | | 12-1-2022 | | | | 1,000,000 | | | | 1,064,560 | |
| | | | |
| | | | | | | | | | | | | | | 3,174,950 | |
| | | | | | | | | | | | | | | | |
| | | | |
| Miscellaneous Revenue: 0.22% | | | | | | | | | | | | | | | | |
| | | | |
Navajo Nation AZ Refunding Bond Series A 144A | | | 5.50 | | | | 12-1-2030 | | | | 7,275,000 | | | | 8,010,939 | |
| | | | | | | | | | | | | | | | |
The accompanying notes are an integral part of these financial statements.
| | | | |
| 8 | | Wells Fargo Municipal Bond Fund | | Portfolio of investments—December 31, 2018 (unaudited) |
| | | | | | | | | | | | | | | | |
| Security name | | Interest rate | | | Maturity date | | | Principal | | | Value | |
| | | | |
| Resource Recovery Revenue: 0.09% | | | | | | | | | | | | | | | | |
| | | | |
Yavapai County AZ IDA Waste Management Incorporated Project | | | 2.80 | % | | | 6-1-2027 | | | $ | 3,200,000 | | | $ | 3,207,392 | |
| | | | | | | | | | | | | | | | |
| | | | |
| Utilities Revenue: 0.00% | | | | | | | | | | | | | | | | |
| | | | |
Maricopa County AZ PCR Public Service Company of New Mexico Palo Verde Project Series B | | | 5.20 | | | | 6-1-2043 | | | | 100,000 | | | | 103,225 | |
| | | | | | | | | | | | | | | | |
| | | | |
| Water & Sewer Revenue: 0.28% | | | | | | | | | | | | | | | | |
| | | | |
Phoenix AZ Civic Improvement Corporation Junior Lien Refunding Bond | | | 5.00 | | | | 7-1-2034 | | | | 8,805,000 | | | | 10,132,090 | |
| | | | | | | | | | | | | | | | |
| | | | |
| | | | | | | | | | | | | | | 51,026,122 | |
| | | | | | | | | | | | | | | | |
| | | | |
California: 5.29% | | | | | | | | | | | | | | | | |
| | | | |
| Airport Revenue: 1.89% | | | | | | | | | | | | | | | | |
| | | | |
California Municipal Finance Authority AMT Senior Lien-Linxs Apartment Project Series A | | | 5.00 | | | | 12-31-2043 | | | | 9,485,000 | | | | 10,329,639 | |
| | | | |
California Municipal Finance Authority Senior Lien Airport Project Series A | | | 5.00 | | | | 12-31-2047 | | | | 5,600,000 | | | | 6,080,144 | |
| | | | |
Los Angeles CA Department of Airports Subordinate Revenue Bonds | | | 4.00 | | | | 5-15-2036 | | | | 2,000,000 | | | | 2,063,060 | |
| | | | |
Los Angeles CA Department of Airports Subordinate Revenue Bonds Series A | | | 5.25 | | | | 5-15-2048 | | | | 15,000,000 | | | | 17,093,250 | |
| | | | |
San Francisco CA City & County Airport Commission San Francisco International Airport Series B | | | 5.00 | | | | 5-1-2046 | | | | 30,000,000 | | | | 32,905,200 | |
| | | | |
| | | | | | | | | | | | | | | 68,471,293 | |
| | | | | | | | | | | | | | | | |
| | | | |
| Education Revenue: 0.18% | | | | | | | | | | | | | | | | |
| | | | |
California Municipal Finance Authority Charter School Albert Einstein Academies Project Series A | | | 7.13 | | | | 8-1-2043 | | | | 2,230,000 | | | | 2,449,343 | |
| | | | |
California Statewide CDA School Facility Aspire Public Schools | | | 5.00 | | | | 7-1-2020 | | | | 275,000 | | | | 275,000 | |
| | | | |
University of California Series K | | | 4.00 | | | | 5-15-2046 | | | | 3,880,000 | | | | 3,939,286 | |
| | | | |
| | | | | | | | | | | | | | | 6,663,629 | |
| | | | | | | | | | | | | | | | |
| | | | |
| GO Revenue: 0.93% | | | | | | | | | | | | | | | | |
| | | | |
Alhambra CA Unified School District CAB Election of 2008 Series B (AGC Insured) (z) | | | 6.18 | | | | 8-1-2031 | | | | 7,500,000 | | | | 5,018,475 | |
| | | | |
Alhambra CA Unified School District CAB Election of 2008 Series B (AGM Insured) (z) | | | 7.45 | | | | 8-1-2031 | | | | 2,175,000 | | | | 1,455,358 | |
| | | | |
Alhambra CA Unified School District CAB Election of 2008 Series B (AGM Insured) (z) | | | 7.46 | | | | 8-1-2032 | | | | 3,795,000 | | | | 2,426,865 | |
| | | | |
Alhambra CA Unified School District CAB Election of 2008 Series B (AGM Insured) (z) | | | 7.73 | | | | 8-1-2034 | | | | 5,000,000 | | | | 2,921,200 | |
| | | | |
Alhambra CA Unified School District CAB Election of 2008 Series B (AGM Insured) (z) | | | 7.77 | | | | 8-1-2035 | | | | 6,700,000 | | | | 3,738,801 | |
| | | | |
California Tender Option Bond Trust Receipts/Certificates Santa Clara County CA San Jose Unified School District Series 2015 (JPMorgan Chase & Company LIQ) 144Aø | | | 1.78 | | | | 8-1-2022 | | | | 2,050,000 | | | | 2,050,000 | |
| | | | |
Colton CA Unified School District CAB Series B (AGM Insured) (z) | | | 6.13 | | | | 8-1-2031 | | | | 1,000,000 | | | | 661,720 | |
| | | | |
Colton CA Unified School District CAB Series B (AGM Insured) (z) | | | 6.21 | | | | 8-1-2032 | | | | 1,000,000 | | | | 631,850 | |
| | | | |
Colton CA Unified School District CAB Series B (AGM Insured) (z) | | | 6.29 | | | | 8-1-2033 | | | | 1,000,000 | | | | 603,020 | |
| | | | |
Compton CA Community College District CAB Election of 2002 Series C (z) | | | 6.55 | | | | 8-1-2032 | | | | 2,515,000 | | | | 1,504,548 | |
| | | | |
Compton CA Community College District CAB Election of 2002 Series C (z) | | | 6.60 | | | | 8-1-2033 | | | | 2,000,000 | | | | 1,130,820 | |
| | | | |
El Monte CA Union High School District CAB Election of 2008 (AGM Insured) (z) | | | 5.40 | | | | 6-1-2030 | | | | 2,000,000 | | | | 1,400,040 | |
| | | | |
El Monte CA Union High School District CAB Election of 2008 (AGM Insured) (z) | | | 5.46 | | | | 6-1-2031 | | | | 2,000,000 | | | | 1,333,940 | |
| | | | |
El Monte CA Union High School District CAB Election of 2008 (AGM Insured) (z) | | | 5.52 | | | | 6-1-2032 | | | | 1,660,000 | | | | 1,053,419 | |
| | | | |
El Monte CA Union High School District CAB Election of 2008 (AGM Insured) (z) | | | 5.59 | | | | 6-1-2033 | | | | 1,230,000 | | | | 747,065 | |
| | | | |
Ontario Montclair CA School District CAB (AGC Insured) (z) | | | 5.83 | | | | 8-1-2028 | | | | 1,500,000 | | | | 1,131,000 | |
| | | | |
Ontario Montclair CA School District CAB (AGC Insured) (z) | | | 6.66 | | | | 8-1-2030 | | | | 2,000,000 | | | | 1,350,580 | |
| | | | |
San Diego CA Unified School District CAB Series C (z) | | | 6.31 | | | | 7-1-2031 | | | | 2,000,000 | | | | 1,330,320 | |
| | | | |
San Diego CA Unified School District CAB Series C (z) | | | 6.51 | | | | 7-1-2033 | | | | 1,000,000 | | | | 609,960 | |
The accompanying notes are an integral part of these financial statements.
| | | | | | |
| Portfolio of investments—December 31, 2018 (unaudited) | | Wells Fargo Municipal Bond Fund | | | 9 | |
| | | | | | | | | | | | | | | | |
| Security name | | Interest rate | | | Maturity date | | | Principal | | | Value | |
| | | | |
| GO Revenue(continued) | | | | | | | | | | | | | | | | |
| | | | |
San Diego CA Unified School District CAB Series C (z) | | | 6.54 | % | | | 7-1-2034 | | | $ | 2,000,000 | | | $ | 1,166,500 | |
| | | | |
Wiseburn CA School District CAB Election of 2010 Series B (AGM Insured) (z) | | | 6.63 | | | | 8-1-2034 | | | | 2,530,000 | | | | 1,427,477 | |
| | | | |
| | | | | | | | | | | | | | | 33,692,958 | |
| | | | | | | | | | | | | | | | |
| | | | |
| Health Revenue: 0.23% | | | | | | | | | | | | | | | | |
| | | | |
California Statewide CDA Sutter Health Series A | | | 6.00 | | | | 8-15-2042 | | | | 4,900,000 | | | | 5,236,924 | |
| | | | |
San Buenaventura CA Community Mental Health System | | | 6.00 | | | | 12-1-2019 | | | | 1,040,000 | | | | 1,072,947 | |
| | | | |
San Buenaventura CA Community Mental Health System | | | 6.25 | | | | 12-1-2020 | | | | 2,000,000 | | | | 2,139,060 | |
| | | | |
| | | | | | | | | | | | | | | 8,448,931 | |
| | | | | | | | | | | | | | | | |
| | | | |
| Industrial Development Revenue: 0.10% | | | | | | | | | | | | | | | | |
| | | | |
California PCFA Solid Waste Disposal AMT Green Bond Calplant I Project 144A | | | 8.00 | | | | 7-1-2039 | | | | 3,270,000 | | | | 3,463,846 | |
| | | | | | | | | | | | | | | | |
| | | | |
| Miscellaneous Revenue: 1.08% | | | | | | | | | | | | | | | | |
| | | | |
Alameda County CA CAB Certificate of Participation (National Insured) (z) | | | 6.85 | | | | 6-15-2019 | | | | 1,400,000 | | | | 1,385,468 | |
| | | | |
Anaheim CA PFA Convention Center Expansion Project Series A | | | 5.00 | | | | 5-1-2046 | | | | 8,500,000 | | | | 9,335,380 | |
| | | | |
California Public Works Board Department of General Services Buildings 8 & 9A | | | 6.25 | | | | 4-1-2034 | | | | 4,000,000 | | | | 4,046,760 | |
| | | | |
California Public Works Board Judicial Council Project Series A | | | 5.00 | | | | 3-1-2031 | | | | 3,260,000 | | | | 3,580,067 | |
| | | | |
Golden State Tobacco Securitization Corporation California Tobacco Settlement Revenue Series A | | | 5.00 | | | | 6-1-2030 | | | | 970,000 | | | | 1,070,240 | |
| | | | |
Pasadena CA PFA CAB Rose Bowl Series A (z) | | | 5.95 | | | | 3-1-2032 | | | | 2,000,000 | | | | 1,291,620 | |
| | | | |
Pasadena CA PFA CAB Rose Bowl Series A (z) | | | 6.07 | | | | 3-1-2033 | | | | 4,295,000 | | | | 2,668,226 | |
| | | | |
Pasadena CA PFA CAB Rose Bowl Series A (z) | | | 6.52 | | | | 3-1-2027 | | | | 2,095,000 | | | | 1,680,462 | |
| | | | |
Pasadena CA PFA CAB Rose Bowl Series A (z) | | | 6.62 | | | | 3-1-2028 | | | | 4,450,000 | | | | 3,430,639 | |
| | | | |
Pasadena CA PFA CAB Rose Bowl Series A (z) | | | 6.70 | | | | 3-1-2029 | | | | 4,520,000 | | | | 3,356,688 | |
| | | | |
Pasadena CA PFA CAB Rose Bowl Series A (z) | | | 6.87 | | | | 3-1-2031 | | | | 2,185,000 | | | | 1,478,087 | |
| | | | |
Richmond CA Joint Powers Financing Authority Civic Center Project Series A (AGC Insured) | | | 5.88 | | | | 8-1-2037 | | | | 25,000 | | | | 25,534 | |
| | | | |
Richmond CA Joint Powers Financing Authority Point Potrero Series A | | | 6.25 | | | | 7-1-2024 | | | | 5,420,000 | | | | 5,542,004 | |
| | | | |
| | | | | | | | | | | | | | | 38,891,175 | |
| | | | | | | | | | | | | | | | |
| | | | |
| Transportation Revenue: 0.34% | | | | | | | | | | | | | | | | |
| | | | |
Bay Area CA Toll Authority Toll Bridge Series A (SIFMA Municipal Swap +1.25%) ± | | | 2.88 | | | | 4-1-2036 | | | | 12,000,000 | | | | 12,417,360 | |
| | | | | | | | | | | | | | | | |
| | | | |
| Utilities Revenue: 0.54% | | | | | | | | | | | | | | | | |
| | | | |
M-S-R California Energy Authority Gas Series B | | | 6.13 | | | | 11-1-2029 | | | | 15,925,000 | | | | 19,451,114 | |
| | | | | | | | | | | | | | | | |
| | | | |
| | | | | | | | | | | | | | | 191,500,306 | |
| | | | | | | | | | | | | | | | |
| | | | |
Colorado: 1.86% | | | | | | | | | | | | | | | | |
| | | | |
| Education Revenue: 0.92% | | | | | | | | | | | | | | | | |
| | | | |
Colorado ECFA Charter School Banning Lewis Ranch Academy Project Series A | | | 6.00 | | | | 12-15-2037 | | | | 2,900,000 | | | | 2,740,181 | |
| | | | |
Colorado ECFA Charter School Banning Lewis Ranch Academy Project Series B-2 | | | 7.00 | | | | 12-15-2046 | | | | 3,940,000 | | | | 3,930,189 | |
| | | | |
Colorado ECFA Charter School Community Leadership Academy | | | 5.75 | | | | 7-1-2019 | | | | 195,000 | | | | 195,367 | |
| | | | |
Colorado ECFA Charter School Community Leadership Academy Second Campus Project | | | 7.00 | | | | 8-1-2033 | | | | 1,240,000 | | | | 1,383,728 | |
| | | | |
Colorado ECFA Charter School Rocky Mountain Classical Academy Project Series A | | | 7.50 | | | | 9-1-2033 | | | | 5,015,000 | | | | 6,231,489 | |
| | | | |
Colorado ECFA Charter School Rocky Mountain Classical Academy Project Series A | | | 8.00 | | | | 9-1-2043 | | | | 5,930,000 | | | | 7,484,550 | |
| | | | |
Colorado ECFA Charter School Rocky Mountain Classical Academy Project Series A | | | 8.13 | | | | 9-1-2048 | | | | 3,795,000 | | | | 4,810,846 | |
| | | | |
Colorado ECFA Charter School Twin Peaks Charter Academy | | | 6.50 | | | | 3-15-2043 | | | | 1,290,000 | | | | 1,354,397 | |
The accompanying notes are an integral part of these financial statements.
| | | | |
| 10 | | Wells Fargo Municipal Bond Fund | | Portfolio of investments—December 31, 2018 (unaudited) |
| | | | | | | | | | | | | | | | |
| Security name | | Interest rate | | | Maturity date | | | Principal | | | Value | |
| | | | |
| Education Revenue(continued) | | | | | | | | | | | | | | | | |
| | | | |
Colorado PFA Charter School Highline Academy Project | | | 6.25 | % | | | 12-15-2020 | | | $ | 150,000 | | | $ | 158,117 | |
| | | | |
Colorado PFA Charter School Highline Academy Project | | | 6.75 | | | | 12-15-2025 | | | | 455,000 | | | | 496,951 | |
| | | | |
Colorado PFA Charter School Highline Academy Project | | | 7.38 | | | | 12-15-2040 | | | | 4,010,000 | | | | 4,424,193 | |
| | | | |
| | | | | | | | | | | | | | | 33,210,008 | |
| | | | | | | | | | | | | | | | |
| | | | |
| Health Revenue: 0.51% | | | | | | | | | | | | | | | | |
| | | | |
Colorado Health Facilities Authority Catholic Health Initiatives Series A | | | 5.00 | | | | 7-1-2039 | | | | 14,260,000 | | | | 14,394,757 | |
| | | | |
Colorado Health Facilities Authority Catholic Health Initiatives Series D-1 | | | 6.25 | | | | 10-1-2033 | | | | 4,000,000 | | | | 4,015,360 | |
| | | | |
| | | | | | | | | | | | | | | 18,410,117 | |
| | | | | | | | | | | | | | | | |
| | | | |
| Tax Revenue: 0.09% | | | | | | | | | | | | | | | | |
| | | | |
Denver CO City & County Refunding and Improvement Bonds Series A | | | 5.00 | | | | 8-1-2044 | | | | 3,000,000 | | | | 3,360,750 | |
| | | | | | | | | | | | | | | | |
| | | | |
| Transportation Revenue: 0.18% | | | | | | | | | | | | | | | | |
| | | | |
Colorado E-470 Public Highway Authority CAB Series B (National Insured) (z) | | | 4.67 | | | | 9-1-2022 | | | | 4,600,000 | | | | 4,181,860 | |
| | | | |
Colorado High Performance Transportation Enterprise U.S. 36 & I-25 Managed Lanes | | | 5.75 | | | | 1-1-2044 | | | | 2,160,000 | | | | 2,323,015 | |
| | | | |
| | | | | | | | | | | | | | | 6,504,875 | |
| | | | | | | | | | | | | | | | |
| | | | |
| Water & Sewer Revenue: 0.16% | | | | | | | | | | | | | | | | |
| | | | |
Aurora Colorado Water Revenue Refunding Bonds First Lien | | | 5.00 | | | | 8-1-2046 | | | | 5,000,000 | | | | 5,633,500 | |
| | | | | | | | | | | | | | | | |
| | | | |
| | | | | | | | | | | | | | | 67,119,250 | |
| | | | | | | | | | | | | | | | |
| | | | |
Connecticut: 0.63% | | | | | | | | | | | | | | | | |
| | | | |
| GO Revenue: 0.24% | | | | | | | | | | | | | | | | |
| | | | |
Hamden CT BAN | | | 5.00 | | | | 8-15-2026 | | | | 1,235,000 | | | | 1,365,898 | |
| | | | |
Hartford CT Series A | | | 5.00 | | | | 4-1-2028 | | | | 3,165,000 | | | | 3,407,502 | |
| | | | |
Hartford CT Series B | | | 5.00 | | | | 4-1-2025 | | | | 1,220,000 | | | | 1,329,214 | |
| | | | |
Hartford CT Series B | | | 5.00 | | | | 4-1-2026 | | | | 1,470,000 | | | | 1,594,215 | |
| | | | |
Hartford CT Series B | | | 5.00 | | | | 4-1-2027 | | | | 1,000,000 | | | | 1,079,100 | |
| | | | |
| | | | | | | | | | | | | | | 8,775,929 | |
| | | | | | | | | | | | | | | | |
| | | | |
| Tax Revenue: 0.39% | | | | | | | | | | | | | | | | |
| | | | |
Connecticut Special Tax Obligation Revenue Transportation Infrastructure Purpose | | | 5.00 | | | | 10-1-2036 | | | | 5,000,000 | | | | 5,588,200 | |
| | | | |
Connecticut Special Tax Obligation Revenue Transportation Infrastructure Purpose | | | 5.00 | | | | 10-1-2037 | | | | 7,500,000 | | | | 8,343,075 | |
| | | | |
| | | | | | | | | | | | | | | 13,931,275 | |
| | | | | | | | | | | | | | | | |
| | | | |
| | | | | | | | | | | | | | | 22,707,204 | |
| | | | | | | | | | | | | | | | |
| | | | |
Delaware: 0.40% | | | | | | | | | | | | | | | | |
| | | | |
| Education Revenue: 0.28% | | | | | | | | | | | | | | | | |
| | | | |
Delaware EDA Odyssey Charter School Incorporated Project Series A 144A | | | 7.00 | | | | 9-1-2045 | | | | 7,500,000 | | | | 7,783,125 | |
| | | | |
Kent County DE Charter School Incorporated Project | | | 7.38 | | | | 5-1-2037 | | | | 2,110,000 | | | | 2,233,372 | |
| | | | |
| | | | | | | | | | | | | | | 10,016,497 | |
| | | | | | | | | | | | | | | | |
| | | | |
| Transportation Revenue: 0.12% | | | | | | | | | | | | | | | | |
| | | | |
Delaware Transportation Authority US 301 Project | | | 5.00 | | | | 6-1-2055 | | | | 3,950,000 | | | | 4,320,708 | |
| | | | | | | | | | | | | | | | |
| | | | |
| | | | | | | | | | | | | | | 14,337,205 | |
| | | | | | | | | | | | | | | | |
The accompanying notes are an integral part of these financial statements.
| | | | | | |
| Portfolio of investments—December 31, 2018 (unaudited) | | Wells Fargo Municipal Bond Fund | | | 11 | |
| | | | | | | | | | | | | | | | |
| Security name | | Interest rate | | | Maturity date | | | Principal | | | Value | |
| | | | |
District of Columbia: 0.51% | | | | | | | | | | | | | | | | |
| | | | |
| Education Revenue: 0.07% | | | | | | | | | | | | | | | | |
| | | | |
District of Columbia Cesar Chavez Public Charter School | | | 6.50 | % | | | 11-15-2021 | | | $ | 2,265,000 | | | $ | 2,301,263 | |
| | | | | | | | | | | | | | | | |
| | | | |
| Tax Revenue: 0.44% | | | | | | | | | | | | | | | | |
| | | | |
District of Columbia Income Tax Secured Series G | | | 5.00 | | | | 12-1-2036 | | | | 15,000,000 | | | | 16,041,900 | |
| | | | | | | | | | | | | | | | |
| | | | |
| | | | | | | | | | | | | | | 18,343,163 | |
| | | | | | | | | | | | | | | | |
| | | | |
Florida: 7.31% | | | | | | | | | | | | | | | | |
| | | | |
| Airport Revenue: 1.51% | | | | | | | | | | | | | | | | |
| | | | |
Hillsborough County FL Aviation Authority Revenue Tampa International Airport | | | 5.00 | | | | 10-1-2048 | | | | 7,000,000 | | | | 7,756,560 | |
| | | | |
Hillsborough County FL Aviation Authority Revenue Tampa International Airport Series E | | | 5.00 | | | | 10-1-2048 | | | | 10,000,000 | | | | 11,124,100 | |
| | | | |
Hillsborough County FL Aviation Authority Revenue Tampa International Airport Series F | | | 5.00 | | | | 10-1-2048 | | | | 17,000,000 | | | | 19,284,460 | |
| | | | |
Jacksonville FL Port Authority Series B | | | 5.00 | | | | 11-1-2044 | | | | 4,080,000 | | | | 4,592,244 | |
| | | | |
Jacksonville FL Port Authority Series B | | | 5.00 | | | | 11-1-2048 | | | | 9,870,000 | | | | 11,083,023 | |
| | | | |
Miami-Dade County FL Seaport AMT Series B | | | 6.00 | | | | 10-1-2033 | | | | 500,000 | | | | 569,170 | |
| | | | |
| | | | | | | | | | | | | | | 54,409,557 | |
| | | | | | | | | | | | | | | | |
| | | | |
| Education Revenue: 0.72% | | | | | | | | | | | | | | | | |
| | | | |
Florida Development Finance Corporation Educational Facilities Renaissance Charter School Project Series A | | | 8.50 | | | | 6-15-2044 | | | | 13,290,000 | | | | 15,096,510 | |
| | | | |
Florida Higher Educational Facilities Authority Jacksonville University Project Series A-1 144A | | | 5.00 | | | | 6-1-2048 | | | | 2,000,000 | | | | 2,063,540 | |
| | | | |
Lakeland FL Educational Facilities Authority Florida Southern College Project Series A | | | 5.00 | | | | 9-1-2025 | | | | 530,000 | | | | 573,550 | |
| | | | |
Lakeland FL Educational Facilities Authority Florida Southern College Project Series A | | | 5.00 | | | | 9-1-2028 | | | | 1,195,000 | | | | 1,281,530 | |
| | | | |
Pinellas County FL Educational Facilities Authority Barry University Project | | | 5.00 | | | | 10-1-2027 | | | | 1,600,000 | | | | 1,677,728 | |
| | | | |
Seminole County FL IDA Choices in Learning Series A | | | 6.20 | | | | 11-15-2026 | | | | 1,535,000 | | | | 1,604,643 | |
| | | | |
Seminole County FL IDA Choices in Learning Series A | | | 7.38 | | | | 11-15-2041 | | | | 3,525,000 | | | | 3,734,103 | |
| | | | |
| | | | | | | | | | | | | | | 26,031,604 | |
| | | | | | | | | | | | | | | | |
| | | | |
| GO Revenue: 0.86% | | | | | | | | | | | | | | | | |
| | | | |
Miami-Dade County FL School District | | | 5.00 | | | | 3-15-2046 | | | | 15,000,000 | | | | 16,672,350 | |
| | | | |
Miami-Dade County FL Series 2014-A | | | 5.00 | | | | 7-1-2043 | | | | 12,935,000 | | | | 14,475,559 | |
| | | | |
| | | | | | | | | | | | | | | 31,147,909 | |
| | | | | | | | | | | | | | | | |
| | | | |
| Health Revenue: 1.24% | | | | | | | | | | | | | | | | |
| | | | |
Atlantic Beach FL Health Care Facilities Fleet Landing Project Series B | | | 5.63 | | | | 11-15-2043 | | | | 5,000,000 | | | | 5,401,700 | |
| | | | |
Collier County Florida IDA NCH Healthcare System Project | | | 6.25 | | | | 10-1-2039 | | | | 17,015,000 | | | | 18,476,248 | |
| | | | |
Florida Tender Option Bond Trust Receipts/Floater Certificates Series 2017-XF2517 (Morgan Stanley Bank LIQ) 144Aø | | | 1.73 | | | | 8-15-2047 | | | | 2,920,000 | | | | 2,920,000 | |
| | | | |
Holmes County FL Hospital Corporation Doctors Memorial Hospital Project | | | 6.00 | | | | 11-1-2038 | | | | 2,500,000 | | | | 2,380,225 | |
| | | | |
Miami FL HFA Babtist Health South Florida Obligated Group | | | 4.00 | | | | 8-15-2047 | | | | 10,000,000 | | | | 10,065,000 | |
| | | | |
St. Petersburg FL Health Facilities Authority All Children’s Project Series A | | | 6.50 | | | | 11-15-2039 | | | | 5,500,000 | | | | 5,718,240 | |
| | | | |
| | | | | | | | | | | | | | | 44,961,413 | |
| | | | | | | | | | | | | | | | |
The accompanying notes are an integral part of these financial statements.
| | | | |
| 12 | | Wells Fargo Municipal Bond Fund | | Portfolio of investments—December 31, 2018 (unaudited) |
| | | | | | | | | | | | | | | | |
| Security name | | Interest rate | | | Maturity date | | | Principal | | | Value | |
| | | | |
| Housing Revenue: 0.10% | | | | | | | | | | | | | | | | |
| | | | |
Florida Housing Finance Corporation Journet Place Apartments Series 1 | | | 7.60 | % | | | 12-15-2047 | | | $ | 795,000 | | | $ | 935,341 | |
| | | | |
Florida Housing Finance Corporation Villa Capri Phase III | | | 7.60 | | | | 12-15-2042 | | | | 2,635,000 | | | | 2,757,396 | |
| | | | |
| | | | | | | | | | | | | | | 3,692,737 | |
| | | | | | | | | | | | | | | | |
| | | | |
| Miscellaneous Revenue: 0.38% | | | | | | | | | | | | | | | | |
| | | | |
Championsgate FL Community Development District Capital Improvement Series A | | | 6.25 | | | | 5-1-2020 | | | | 540,000 | | | | 541,161 | |
| | | | |
CityPlace Florida Community Development District | | | 5.00 | | | | 5-1-2022 | | | | 1,000,000 | | | | 1,083,980 | |
| | | | |
Collier County FL School Board Refunding Bond Certificate of Participation (AGM Insured) | | | 5.25 | | | | 2-15-2021 | | | | 1,000,000 | | | | 1,068,730 | |
| | | | |
Crossings at Fleming Island Florida Community Development District Refunding Bond Senior Lien Series A-1 | | | 2.63 | | | | 5-1-2019 | | | | 1,285,000 | | | | 1,286,773 | |
| | | | |
Indigo FL Community Development District Series C †† | | | 7.00 | | | | 5-1-2030 | | | | 2,536,248 | | | | 1,141,312 | |
| | | | |
Lakeside Plantation FL Community Development District Series A | | | 6.95 | | | | 5-1-2031 | | | | 1,091,000 | | | | 1,091,840 | |
| | | | |
Marshall Creek Florida Community Development District †† | | | 5.00 | | | | 5-1-2032 | | | | 1,960,000 | | | | 1,846,928 | |
| | | | |
Marshall Creek Florida Community Development District | | | 6.32 | | | | 5-1-2045 | | | | 130,000 | | | | 120,740 | |
| | | | |
Orlando FL Capital Improvement Special Revenue Series B | | | 5.00 | | | | 10-1-2033 | | | | 1,525,000 | | | | 1,740,040 | |
| | | | |
Orlando FL Capital Improvement Special Revenue Series B | | | 5.00 | | | | 10-1-2035 | | | | 1,680,000 | | | | 1,905,305 | |
| | | | |
Orlando FL Capital Improvement Special Revenue Series B | | | 5.00 | | | | 10-1-2036 | | | | 1,765,000 | | | | 2,000,698 | |
| | | | |
| | | | | | | | | | | | | | | 13,827,507 | |
| | | | | | | | | | | | | | | | |
| | | | |
| Resource Recovery Revenue: 0.11% | | | | | | | | | | | | | | | | |
| | | | |
Florida Development Finance Corporation Solid Waste AMT Pro USA Incorporated 144A | | | 5.00 | | | | 8-1-2029 | | | | 4,000,000 | | | | 4,098,480 | |
| | | | | | | | | | | | | | | | |
| | | | |
| Tax Revenue: 1.75% | | | | | | | | | | | | | | | | |
| | | | |
Florida Board of Education Public Education Refunding Capital Outlay Series D | | | 4.00 | | | | 6-1-2031 | | | | 8,000,000 | | | | 8,355,200 | |
| | | | |
Florida Series B | | | 4.00 | | | | 7-1-2048 | | | | 53,365,000 | | | | 55,068,944 | |
| | | | |
| | | | | | | | | | | | | | | 63,424,144 | |
| | | | | | | | | | | | | | | | |
| | | | |
| Transportation Revenue: 0.37% | | | | | | | | | | | | | | | | |
| | | | |
Miami-Dade County FL Expressway Authority Toll System Series DCL-2012-003 (Dexia Credit Local LOC, Ambac Insured, Dexia Credit Local LIQ) 144Aø | | | 1.96 | | | | 7-1-2029 | | | | 13,180,000 | | | | 13,180,000 | |
| | | | | | | | | | | | | | | | |
| | | | |
| Water & Sewer Revenue: 0.27% | | | | | | | | | | | | | | | | |
| | | | |
Daytona Beach FL Refunding & Improvement Bonds Project (AGM Insured) | | | 5.00 | | | | 11-1-2031 | | | | 1,155,000 | | | | 1,261,953 | |
| | | | |
Daytona Beach FL Refunding & Improvement Bonds Project (AGM Insured) | | | 5.00 | | | | 11-1-2032 | | | | 1,465,000 | | | | 1,597,290 | |
| | | | |
Viera East Florida Community Development District Water Management Project (National Insured) | | | 5.75 | | | | 5-1-2020 | | | | 2,020,000 | | | | 2,095,710 | |
| | | | |
Viera East Florida Community Development District Water Management Project (National Insured) | | | 5.75 | | | | 5-1-2021 | | | | 2,140,000 | | | | 2,275,740 | |
| | | | |
Viera East Florida Community Development District Water Management Project (National Insured) | | | 5.75 | | | | 5-1-2022 | | | | 2,265,000 | | | | 2,468,261 | |
| | | | |
| | | | | | | | | | | | | | | 9,698,954 | |
| | | | | | | | | | | | | | | | |
| | | | |
| | | | | | | | | | | | | | | 264,472,305 | |
| | | | | | | | | | | | | | | | |
The accompanying notes are an integral part of these financial statements.
| | | | | | |
| Portfolio of investments—December 31, 2018 (unaudited) | | Wells Fargo Municipal Bond Fund | | | 13 | |
| | | | | | | | | | | | | | | | |
| Security name | | Interest rate | | | Maturity date | | | Principal | | | Value | |
| | | | |
Georgia: 1.96% | | | | | | | | | | | | | | | | |
| | | | |
| Education Revenue: 0.26% | | | | | | | | | | | | | | | | |
| | | | |
Cobb County GA Development Authority Charter Learning Center Foundation Central Project Series A †† | | | 4.38 | % | | | 7-1-2025 | | | $ | 1,705,000 | | | $ | 1,429,216 | |
| | | | |
Georgia Private Colleges & Universities Authority Series A | | | 5.25 | | | | 10-1-2027 | | | | 2,655,000 | | | | 2,825,557 | |
| | | | |
Georgia Private Colleges & Universitities Authority Mercer University Project | | | 5.00 | | | | 10-1-2040 | | | | 5,000,000 | | | | 5,274,550 | |
| | | | |
| | | | | | | | | | | | | | | 9,529,323 | |
| | | | | | | | | | | | | | | | |
| | | | |
| Health Revenue: 0.25% | | | | | | | | | | | | | | | | |
| | | | |
Fulton County GA Development Authority Hospital Revenue Bond Series A | | | 5.00 | | | | 4-1-2047 | | | | 2,250,000 | | | | 2,424,578 | |
| | | | |
Gainesville GA Hospital Authority Series C ø | | | 1.88 | | | | 2-15-2047 | | | | 6,645,000 | | | | 6,645,000 | |
| | | | |
| | | | | | | | | | | | | | | 9,069,578 | |
| | | | | | | | | | | | | | | | |
| | | | |
| Transportation Revenue: 0.14% | | | | | | | | | | | | | | | | |
| | | | |
Georgia Road & Tollway Authority CAB I-75 South Expressway Lanes Project Series A (z)144A | | | 6.86 | | | | 6-1-2034 | | | | 3,750,000 | | | | 1,340,063 | |
| | | | |
Georgia Road & Tollway Authority CCAB I-75 South Expressway Lanes Project Series B (z)144A | | | 1.97 | | | | 6-1-2049 | | | | 5,600,000 | | | | 3,794,504 | |
| | | | |
| | | | | | | | | | | | | | | 5,134,567 | |
| | | | | | | | | | | | | | | | |
| | | | |
| Utilities Revenue: 1.31% | | | | | | | | | | | | | | | | |
| | | | |
Appling County GA Development Authority Oglethorpe Power Corporation Hatch Project | | | 2.40 | | | | 1-1-2038 | | | | 16,530,000 | | | | 16,451,317 | |
| | | | |
Burke County GA Development Authority Oglethorpe Power Corporation Vogtle Project Series F | | | 3.00 | | | | 11-1-2045 | | | | 5,000,000 | | | | 4,960,100 | |
| | | | |
Georgia Municipal Electric Authority Power Series EE (Ambac Insured) | | | 7.25 | | | | 1-1-2024 | | | | 400,000 | | | | 485,336 | |
| | | | |
Main Street Natural Gas Incorporated Georgia Gas Project Series A (Royal Bank of Canada LIQ) | | | 4.00 | | | | 3-1-2023 | | | | 1,000,000 | | | | 1,062,160 | |
| | | | |
Main Street Natural Gas Incorporated Georgia Gas Project Series C | | | 4.00 | | | | 8-1-2048 | | | | 15,000,000 | | | | 15,838,800 | |
| | | | |
Main Street Natural Gas Incorporated Georgia Gas Project Subordinate Bond Series A (Royal Bank of Canada LIQ) | | | 4.00 | | | | 4-1-2048 | | | | 8,000,000 | | | | 8,427,280 | |
| | | | |
| | | | | | | | | | | | | | | 47,224,993 | |
| | | | | | | | | | | | | | | | |
| | | | |
| | | | | | | | | | | | | | | 70,958,461 | |
| | | | | | | | | | | | | | | | |
| | | | |
Guam: 0.09% | | | | | | | | | | | | | | | | |
| | | | |
| Housing Revenue: 0.00% | | | | | | | | | | | | | | | | |
| | | | |
Guam Housing Corporation Guaranteed Mortgage-Backed Securities Series A (FHLMC Insured) | | | 5.75 | | | | 9-1-2031 | | | | 60,000 | | | | 60,598 | |
| | | | | | | | | | | | | | | | |
| | | | |
| Miscellaneous Revenue: 0.09% | | | | | | | | | | | | | | | | |
| | | | |
Guam Government Limited Obligation Bonds Section 30 Series A | | | 5.38 | | | | 12-1-2024 | | | | 3,195,000 | | | | 3,298,901 | |
| | | | | | | | | | | | | | | | |
| | | | |
| | | | | | | | | | | | | | | 3,359,499 | |
| | | | | | | | | | | | | | | | |
| | | | |
Hawaii: 0.30% | | | | | | | | | | | | | | | | |
| | | | |
| Airport Revenue: 0.22% | | | | | | | | | | | | | | | | |
| | | | |
Hawaii Airports System Revenue Series A | | | 5.00 | | | | 7-1-2048 | | | | 7,000,000 | | | | 7,752,500 | |
| | | | | | | | | | | | | | | | |
The accompanying notes are an integral part of these financial statements.
| | | | |
| 14 | | Wells Fargo Municipal Bond Fund | | Portfolio of investments—December 31, 2018 (unaudited) |
| | | | | | | | | | | | | | | | |
| Security name | | Interest rate | | | Maturity date | | | Principal | | | Value | |
| | | | |
| GO Revenue: 0.08% | | | | | | | | | | | | | | | | |
| | | | |
Hawaii Prerefunded Bond Series DZ | | | 5.00 | % | | | 12-1-2031 | | | $ | 1,670,000 | | | $ | 1,816,409 | |
| | | | |
Hawaii Unrefunded Bond Series DZ | | | 5.00 | | | | 12-1-2031 | | | | 1,030,000 | | | | 1,121,835 | |
| | | | |
| | | | | | | | | | | | | | | 2,938,244 | |
| | | | | | | | | | | | | | | | |
| | | | |
| | | | | | | | | | | | | | | 10,690,744 | |
| | | | | | | | | | | | | | | | |
| | | | |
Idaho: 0.13% | | | | | | | | | | | | | | | | |
| | | | |
| Education Revenue: 0.13% | | | | | | | | | | | | | | | | |
| | | | |
Idaho Housing & Finance Association Idaho Arts Charter School Incorporated Project Series A | | | 5.75 | | | | 12-1-2032 | | | | 500,000 | | | | 533,610 | |
| | | | |
Idaho Housing & Finance Association Legacy Public Charter School Incorporated Project Series A | | | 5.85 | | | | 5-1-2033 | | | | 700,000 | | | | 700,994 | |
| | | | |
Idaho Housing & Finance Association Legacy Public Charter School Incorporated Project Series A | | | 6.25 | | | | 5-1-2043 | | | | 1,365,000 | | | | 1,372,548 | |
| | | | |
Idaho Housing & Finance Association Liberty Charter School Series A | | | 6.00 | | | | 6-1-2038 | | | | 500,000 | | | | 500,665 | |
| | | | |
Idaho Housing & Finance Association Nonprofit CAB North Star Charter School Series B 144A(z) | | | 0.00 | | | | 7-1-2049 | | | | 1,276,564 | | | | 158,473 | |
| | | | |
Idaho Housing & Finance Association Nonprofit North Star Charter School Series A | | | 6.75 | | | | 7-1-2048 | | | | 1,322,876 | | | | 1,347,653 | |
| | | | |
| | | | | | | | | | | | | | | 4,613,943 | |
| | | | | | | | | | | | | | | | |
| | | | |
Illinois: 14.75% | | | | | | | | | | | | | | | | |
| | | | |
| Airport Revenue: 0.82% | | | | | | | | | | | | | | | | |
| | | | |
Chicago IL O’Hare International Airport AMT Passenger Facility Charge Series B | | | 5.00 | | | | 1-1-2026 | | | | 5,000,000 | | | | 5,354,000 | |
| | | | |
Chicago IL O’Hare International Airport AMT Senior Lien Series C | | | 5.50 | | | | 1-1-2044 | | | | 4,000,000 | | | | 4,342,400 | |
| | | | |
Chicago IL O’Hare International Airport Customer Facility Charge Senior Lien (AGM Insured) | | | 5.50 | | | | 1-1-2043 | | | | 4,530,000 | | | | 4,969,410 | |
| | | | |
Chicago IL O’Hare International Airport Customer Facility Charge Senior Lien Series D | | | 5.75 | | | | 1-1-2043 | | | | 4,500,000 | | | | 5,005,575 | |
| | | | |
Chicago IL O’Hare International Airport Senior Lien Series B | | | 5.00 | | | | 1-1-2039 | | | | 8,000,000 | | | | 8,865,840 | |
| | | | |
Chicago IL O’Hare International Airport Transportation Infrastructure Properties Obligated Group | | | 5.00 | | | | 7-1-2038 | | | | 1,000,000 | | | | 1,100,760 | |
| | | | |
| | | | | | | | | | | | | | | 29,637,985 | |
| | | | | | | | | | | | | | | | |
| | | | |
| Education Revenue: 1.14% | | | | | | | | | | | | | | | | |
| | | | |
Illinois Finance Authority Charter Schools Project Series A | | | 6.25 | | | | 9-1-2039 | | | | 7,955,000 | | | | 8,719,396 | |
| | | | |
Illinois Finance Authority Charter Schools Refunding & Improvement Bonds Series A | | | 6.88 | | | | 10-1-2031 | | | | 1,655,000 | | | | 1,737,386 | |
| | | | |
Illinois Finance Authority Charter Schools Refunding & Improvement Bonds Series A | | | 7.13 | | | | 10-1-2041 | | | | 3,800,000 | | | | 3,978,486 | |
| | | | |
Illinois Finance Authority Student Housing Illinois State University | | | 6.75 | | | | 4-1-2031 | | | | 8,000,000 | | | | 8,835,200 | |
| | | | |
University of Illinois Auxiliary Facilities Systems CAB Series A (National Insured) (z) | | | 6.01 | | | | 4-1-2026 | | | | 2,355,000 | | | | 1,891,277 | |
| | | | |
University of Illinois Auxiliary Facilities Systems CAB Series A (National Insured) (z) | | | 6.05 | | | | 4-1-2027 | | | | 2,435,000 | | | | 1,877,312 | |
| | | | |
University of Illinois Auxiliary Facilities Systems Series A | | | 5.75 | | | | 4-1-2038 | | | | 14,000,000 | | | | 14,133,700 | |
| | | | |
| | | | | | | | | | | | | | | 41,172,757 | |
| | | | | | | | | | | | | | | | |
| | | | |
| GO Revenue: 4.97% | | | | | | | | | | | | | | | | |
| | | | |
Chicago IL Board of Education CAB City Colleges (National Insured) (z) | | | 4.96 | | | | 1-1-2025 | | | | 9,935,000 | | | | 8,003,139 | |
| | | | |
Chicago IL Board of Education CAB School Reform Series A (National Insured) (z) | | | 5.01 | | | | 12-1-2020 | | | | 1,000,000 | | | | 944,500 | |
| | | | |
Chicago IL Board of Education CAB School Reform Series B-1 (National Insured) (z) | | | 4.59 | | | | 12-1-2023 | | | | 2,930,000 | | | | 2,454,315 | |
The accompanying notes are an integral part of these financial statements.
| | | | | | |
| Portfolio of investments—December 31, 2018 (unaudited) | | Wells Fargo Municipal Bond Fund | | | 15 | |
| | | | | | | | | | | | | | | | |
| Security name | | Interest rate | | | Maturity date | | | Principal | | | Value | |
| | | | |
| GO Revenue(continued) | | | | | | | | | | | | | | | | |
| | | | |
Chicago IL Board of Education CAB School Reform Series B-1 (National Insured) (z) | | | 4.96 | % | | | 12-1-2026 | | | $ | 4,245,000 | | | $ | 3,103,137 | |
| | | | |
Chicago IL CAB City Colleges (National Insured) (z) | | | 5.30 | | | | 1-1-2030 | | | | 5,995,000 | | | | 3,820,554 | |
| | | | |
Chicago IL CAB Project & Refunding Bond Series C (AGM Insured) (z) | | | 4.77 | | | | 1-1-2026 | | | | 7,360,000 | | | | 5,746,320 | |
| | | | |
Chicago IL Neighborhoods Alive 21 Program Series B | | | 5.50 | | | | 1-1-2032 | | | | 1,285,000 | | | | 1,365,017 | |
| | | | |
Chicago IL Neighborhoods Alive 21 Program Series B | | | 5.50 | | | | 1-1-2034 | | | | 1,500,000 | | | | 1,586,115 | |
| | | | |
Chicago IL Series A (National Insured) | | | 5.00 | | | | 1-1-2029 | | | | 3,835,000 | | | | 3,844,741 | |
| | | | |
Chicago IL Series A | | | 5.50 | | | | 1-1-2034 | | | | 7,175,000 | | | | 7,583,042 | |
| | | | |
Chicago IL Series A | | | 5.50 | | | | 1-1-2035 | | | | 1,715,000 | | | | 1,808,828 | |
| | | | |
Chicago IL Series A (AGM Insured) | | | 5.00 | | | | 1-1-2028 | | | | 9,550,000 | | | | 9,804,890 | |
| | | | |
Chicago IL Series A | | | 5.50 | | | | 1-1-2033 | | | | 12,730,000 | | | | 13,488,326 | |
| | | | |
Cook County IL Series A | | | 5.25 | | | | 11-15-2022 | | | | 3,000,000 | | | | 3,153,960 | |
| | | | |
Cook County IL Series C (AGM Insured) | | | 5.00 | | | | 11-15-2024 | | | | 4,240,000 | | | | 4,647,930 | |
| | | | |
Cook County IL Series C | | | 5.00 | | | | 11-15-2025 | | | | 2,140,000 | | | | 2,308,889 | |
| | | | |
Cook County IL Series C | | | 5.00 | | | | 11-15-2027 | | | | 325,000 | | | | 348,797 | |
| | | | |
Cook County IL Series G | | | 5.00 | | | | 11-15-2028 | | | | 27,000,000 | | | | 28,007,100 | |
| | | | |
DeKalb, Kane & Lasalle Counties IL CAB Kishwaukee Community College District #523 Series B (z) | | | 3.46 | | | | 2-1-2019 | | | | 725,000 | | | | 723,782 | |
| | | | |
Illinois (AGM Insured) | | | 5.00 | | | | 4-1-2026 | | | | 3,000,000 | | | | 3,293,610 | |
| | | | |
Illinois | | | 5.50 | | | | 1-1-2030 | | | | 2,900,000 | | | | 3,229,237 | |
| | | | |
Illinois Series 1 (National Insured) | | | 6.00 | | | | 11-1-2026 | | | | 3,200,000 | | | | 3,646,656 | |
| | | | |
Illinois Series A (AGM Insured) | | | 5.00 | | | | 4-1-2024 | | | | 3,000,000 | | | | 3,254,760 | |
| | | | |
Kane, Cook & DuPage Counties IL Refunding Bond Series D | | | 5.00 | | | | 1-1-2028 | | | | 800,000 | | | | 877,200 | |
| | | | |
Kane, Cook & DuPage Counties IL School District #46 CAB Series B (Ambac Insured) (z) | | | 5.06 | | | | 1-1-2023 | | | | 8,215,000 | | | | 7,518,614 | |
| | | | |
Kane, Cook & DuPage Counties IL School District #46 CAB Series B (Ambac Insured) (z) | | | 4.78 | | | | 1-1-2023 | | | | 16,725,000 | | | | 15,008,179 | |
| | | | |
Kendall, Kane & Will Counties IL CAB School District #308 (AGM Insured) (z) | | | 3.95 | | | | 2-1-2025 | | | | 805,000 | | | | 677,391 | |
| | | | |
Kendall, Kane & Will Counties IL CAB School District #308 (AGM Insured) (z) | | | 5.21 | | | | 2-1-2026 | | | | 5,050,000 | | | | 4,090,349 | |
| | | | |
Kendall, Kane & Will Counties IL CAB School District #308 (AGM Insured) (z) | | | 5.33 | | | | 2-1-2027 | | | | 12,050,000 | | | | 9,383,817 | |
| | | | |
Lake County IL School District #24 Millburn CAB (National Insured) (z) | | | 4.41 | | | | 1-1-2024 | | | | 2,000,000 | | | | 1,699,220 | |
| | | | |
Lake County IL School District #38 Big Hollow CAB (Ambac Insured) (z) | | | 4.95 | | | | 2-1-2021 | | | | 1,325,000 | | | | 1,239,657 | |
| | | | |
Lake County IL School District #38 Big Hollow CAB (Ambac Insured) (z) | | | 5.43 | | | | 2-1-2020 | | | | 1,250,000 | | | | 1,209,363 | |
| | | | |
Lake County IL School District #38 Big Hollow CAB (Ambac Insured) (z) | | | 5.78 | | | | 2-1-2024 | | | | 5,385,000 | | | | 4,497,121 | |
| | | | |
Lake County IL School District #38 Big Hollow CAB (Ambac Insured) (z) | | | 2.53 | | | | 2-1-2019 | | | | 675,000 | | | | 673,488 | |
| | | | |
Lake County IL Township High School District #126 Zion-Benton CAB (National Insured) (z) | | | 9.25 | | | | 2-1-2020 | | | | 910,000 | | | | 887,559 | |
| | | | |
McHenry & Kane Counties IL Community Consolidated School District #158 | | | 5.63 | | | | 1-15-2032 | | | | 2,500,000 | | | | 2,742,950 | |
| | | | |
McHenry & Kane Counties IL Community Consolidated School District #158 CAB (National Insured) (z) | | | 0.00 | | | | 1-1-2019 | | | | 765,000 | | | | 765,000 | |
| | | | |
McHenry & Kane Counties IL Community Consolidated School District #158 CAB (AGM/FGIC Insured) (z) | | | 4.08 | | | | 1-1-2023 | | | | 1,035,000 | | | | 928,757 | |
| | | | |
Tazewell County IL School District #51 (National Insured) | | | 9.00 | | | | 12-1-2023 | | | | 350,000 | | | | 448,168 | |
| | | | |
Will & Cook Counties IL Lincoln-Way Community High School District #210 CAB Series B (z) | | | 5.69 | | | | 1-1-2032 | | | | 400,000 | | | | 221,232 | |
| | | | |
Will & Cook Counties IL Lincoln-Way Community High School District #210 Refunding Bond Series A | | | 5.00 | | | | 1-1-2028 | | | | 500,000 | | | | 509,595 | |
| | | | |
Will County IL Community Unit School (National Insured) (z) | | | 2.76 | | | | 11-1-2020 | | | | 2,110,000 | | | | 2,017,055 | |
| | | | |
Will County IL Community Unit School District #201 Crete-Monee Prerefunded Bond CAB (National Insured) (z) | | | 5.35 | | | | 11-1-2023 | | | | 430,000 | | | | 381,758 | |
| | | | |
Will County IL Community Unit School District #201 Crete-Monee Unrefunded Bond CAB (National Insured) (z) | | | 5.35 | | | | 11-1-2023 | | | | 1,070,000 | | | | 932,922 | |
The accompanying notes are an integral part of these financial statements.
| | | | |
| 16 | | Wells Fargo Municipal Bond Fund | | Portfolio of investments—December 31, 2018 (unaudited) |
| | | | | | | | | | | | | | | | |
| Security name | | Interest rate | | | Maturity date | | | Principal | | | Value | |
| | | | |
| GO Revenue(continued) | | | | | | | | | | | | | | | | |
| | | | |
Will County IL Lincoln-Way Community High School District #210 CAB Series B (z) | | | 6.13 | % | | | 1-1-2033 | | | $ | 2,830,000 | | | $ | 1,479,213 | |
| | | | |
Will County IL Lincoln-Way Community High School District #210 Unrefunded CAB (AGM Insured) (z) | | | 3.64 | | | | 1-1-2026 | | | | 7,000,000 | | | | 5,461,470 | |
| | | | |
| | | | | | | | | | | | | | | 179,817,723 | |
| | | | | | | | | | | | | | | | |
| | | | |
| Health Revenue: 0.23% | | | | | | | | | | | | | | | | |
| | | | |
Illinois Finance Authority Centegra Health System Project | | | 5.00 | | | | 9-1-2020 | | | | 1,465,000 | | | | 1,537,400 | |
| | | | |
Illinois Finance Authority Friendship Village of Schaumberg | | | 5.00 | | | | 2-15-2022 | | | | 1,680,000 | | | | 1,703,604 | |
| | | | |
Illinois Finance Authority Northwestern Memorial Hospital Project Series A | | | 6.00 | | | | 8-15-2039 | | | | 5,000,000 | | | | 5,128,100 | |
| | | | |
| | | | | | | | | | | | | | | 8,369,104 | |
| | | | | | | | | | | | | | | | |
| | | | |
| Housing Revenue: 0.08% | | | | | | | | | | | | | | | | |
| | | | |
Illinois Housing Development Authority Multifamily Housing Revenue Bonds | | | 1.80 | | | | 12-1-2020 | | | | 2,900,000 | | | | 2,896,781 | |
| | | | | | | | | | | | | | | | |
| | | | |
| Miscellaneous Revenue: 1.32% | | | | | | | | | | | | | | | | |
| | | | |
Chicago IL Board of Education Series C | | | 5.00 | | | | 12-1-2021 | | | | 7,240,000 | | | | 7,517,509 | |
| | | | |
Chicago Illinois Board Education Series C | | | 5.00 | | | | 12-1-2020 | | | | 4,600,000 | | | | 4,734,090 | |
| | | | |
Cook County IL Community Unit School District #401 Elmwood Park Limited Tax Debt Certificates Series A | | | 5.00 | | | | 12-1-2028 | | | | 9,000,000 | | | | 9,039,420 | |
| | | | |
Illinois | | | 5.00 | | | | 8-1-2024 | | | | 2,000,000 | | | | 2,086,320 | |
| | | | |
Illinois | | | 5.00 | | | | 8-1-2025 | | | | 6,165,000 | | | | 6,416,409 | |
| | | | |
Illinois | | | 5.25 | | | | 7-1-2030 | | | | 2,500,000 | | | | 2,621,100 | |
| | | | |
Illinois | | | 5.50 | | | | 7-1-2025 | | | | 6,000,000 | | | | 6,479,520 | |
| | | | |
Illinois | | | 5.50 | | | | 7-1-2026 | | | | 4,450,000 | | | | 4,788,423 | |
| | | | |
Illinois Series 2013 | | | 5.50 | | | | 7-1-2038 | | | | 4,000,000 | | | | 4,184,280 | |
| | | | |
| | | | | | | | | | | | | | | 47,867,071 | |
| | | | | | | | | | | | | | | | |
| | | | |
| Tax Revenue: 4.84% | | | | | | | | | | | | | | | | |
| | | | |
Chicago IL Certificate of Participation River Point Plaza Redevelopment Project Series A 144A | | | 4.84 | | | | 4-15-2028 | | | | 5,250,000 | | | | 5,161,013 | |
| | | | |
Chicago IL Motor Fuel Refunding Bond | | | 5.00 | | | | 1-1-2026 | | | | 4,000,000 | | | | 4,194,240 | |
| | | | |
Chicago IL Motor Fuel Refunding Bond | | | 5.00 | | | | 1-1-2028 | | | | 1,000,000 | | | | 1,044,400 | |
| | | | |
Chicago IL Motor Fuel Tax Refunding Bonds Series 2013 | | | 5.00 | | | | 1-1-2024 | | | | 680,000 | | | | 719,977 | |
| | | | |
Chicago IL Motor Fuel Tax Refunding Bonds Series 2013 | | | 5.00 | | | | 1-1-2025 | | | | 2,595,000 | | | | 2,733,028 | |
| | | | |
Chicago IL Refunding Bonds Series 2002 | | | 5.00 | | | | 1-1-2028 | | | | 4,430,000 | | | | 5,136,541 | |
| | | | |
Chicago IL Refunding Bonds Series 2002 | | | 5.00 | | | | 1-1-2029 | | | | 1,500,000 | | | | 1,739,235 | |
| | | | |
Chicago IL Series A | | | 5.25 | | | | 1-1-2038 | | | | 6,000,000 | | | | 6,573,180 | |
| | | | |
Chicago IL Transit Authority Sales Tax Receipts Bonds (AGM Insured) | | | 5.00 | | | | 12-1-2044 | | | | 4,000,000 | | | | 4,335,520 | |
| | | | |
Chicago IL Transit Authority Sales Tax Receipts Bonds | | | 5.00 | | | | 12-1-2046 | | | | 18,250,000 | | | | 19,540,458 | |
| | | | |
Illinois Regional Transportation Authority (AGM Insured) | | | 5.75 | | | | 6-1-2023 | | | | 400,000 | | | | 449,044 | |
| | | | |
Illinois Sales Tax Revenue Build Illinois Bond | | | 5.00 | | | | 6-15-2029 | | | | 3,000,000 | | | | 3,106,140 | |
| | | | |
Illinois Sales Tax Revenue Build Illinois Bonds Junior Obligation Series C | | | 4.00 | | | | 6-15-2029 | | | | 10,580,000 | | | | 10,600,102 | |
| | | | |
Illinois Sales Tax Securitization Series C | | | 5.00 | | | | 1-1-2022 | | | | 2,000,000 | | | | 2,132,660 | |
| | | | |
Illinois Sales Tax Securitization Series C | | | 5.00 | | | | 1-1-2023 | | | | 2,500,000 | | | | 2,710,425 | |
| | | | |
Illinois Sales Tax Securitization Series C | | | 5.00 | | | | 1-1-2024 | | | | 2,500,000 | | | | 2,744,900 | |
| | | | |
Illinois Sales Tax Series C | | | 4.00 | | | | 6-15-2031 | | | | 5,000,000 | | | | 4,927,550 | |
| | | | |
Illinois Sports Facilities Authority State Tax Supported CAB (Ambac Insured) (z) | | | 3.26 | | | | 6-15-2022 | | | | 2,295,000 | | | | 2,022,331 | |
| | | | |
Illinois Sports Facilities Authority State Tax Supported CAB (Ambac Insured) (z) | | | 3.99 | | | | 6-15-2025 | | | | 2,575,000 | | | | 2,008,423 | |
| | | | |
Illinois Sports Facilities Authority State Tax Supported CAB (Ambac Insured) (z) | | | 4.12 | | | | 6-15-2026 | | | | 2,020,000 | | | | 1,506,072 | |
The accompanying notes are an integral part of these financial statements.
| | | | | | |
| Portfolio of investments—December 31, 2018 (unaudited) | | Wells Fargo Municipal Bond Fund | | | 17 | |
| | | | | | | | | | | | | | | | |
| Security name | | Interest rate | | | Maturity date | | | Principal | | | Value | |
| | | | |
| Tax Revenue(continued) | | | | | | | | | | | | | | | | |
| | | | |
Illinois Sports Facilities Authority State Tax Supported CAB (Ambac Insured) (z) | | | 4.50 | % | | | 6-15-2024 | | | $ | 17,570,000 | | | $ | 14,295,831 | |
| | | | |
Illinois Sports Facilities Authority State Tax Supported CAB (Ambac Insured) (z) | | | 4.78 | | | | 6-15-2021 | | | | 7,705,000 | | | | 7,056,701 | |
| | | | |
Illinois Sports Facilities Authority State Tax Supported Refunding Bond (AGM Insured) | | | 5.00 | | | | 6-15-2025 | | | | 3,745,000 | | | | 4,138,787 | |
| | | | |
Illinois Sports Facilities Authority State Tax Supported Refunding Bond (AGM Insured) | | | 5.00 | | | | 6-15-2026 | | | | 4,775,000 | | | | 5,246,770 | |
| | | | |
Illinois Sports Facilities Authority State Tax Supported Refunding Bond (AGM Insured) | | | 5.00 | | | | 6-15-2027 | | | | 8,845,000 | | | | 9,676,961 | |
| | | | |
Illinois Sports Facilities Authority State Tax Supported Refunding Bond (AGM Insured) | | | 5.00 | | | | 6-15-2028 | | | | 4,030,000 | | | | 4,394,312 | |
| | | | |
Illinois Sports Facilities Authority State Tax Supported Refunding Bond (AGM Insured) | | | 5.25 | | | | 6-15-2032 | | | | 3,500,000 | | | | 3,839,640 | |
| | | | |
Metropolitan Pier & Exposition Authority CAB McCormick Place Expansion Project Series A (National Insured) (z) | | | 3.44 | | | | 12-15-2026 | | | | 12,245,000 | | | | 8,916,687 | |
| | | | |
Metropolitan Pier & Exposition Authority CAB McCormick Place Expansion Project Series B (National Insured) (z) | | | 4.25 | | | | 6-15-2029 | | | | 8,000,000 | | | | 5,170,880 | |
| | | | |
Metropolitan Pier & Exposition Authority CAB McCormick Place Expansion Project Series A (National Insured) (z) | | | 4.38 | | | | 6-15-2031 | | | | 10,035,000 | | | | 5,844,083 | |
| | | | |
Metropolitan Pier & Exposition Authority CAB McCormick Place Expansion Project Series A (National Insured) (z) | | | 4.33 | | | | 12-15-2030 | | | | 25,700,000 | | | | 15,385,305 | |
| | | | |
Metropolitan Pier & Exposition Authority CAB McCormick Place Expansion Project Series A (National Insured) (z) | | | 4.38 | | | | 12-15-2031 | | | | 9,800,000 | | | | 5,570,516 | |
| | | | |
Southwestern Illinois Development Authority Local Government Program Collinsville Limited | | | 5.00 | | | | 3-1-2025 | | | | 2,400,000 | | | | 1,918,584 | |
| | | | |
| | | | | | | | | | | | | | | 174,840,296 | |
| | | | | | | | | | | | | | | | |
| | | | |
| Tobacco Revenue: 0.09% | | | | | | | | | | | | | | | | |
| | | | |
Railsplitter IL Tobacco Settlement Authority | | | 5.00 | | | | 6-1-2024 | | | | 3,000,000 | | | | 3,357,960 | |
| | | | | | | | | | | | | | | | |
| | | | |
| Transportation Revenue: 0.24% | | | | | | | | | | | | | | | | |
| | | | |
Chicago IL Public Building Commission Transit Authority (Ambac Insured) | | | 5.25 | | | | 3-1-2025 | | | | 2,960,000 | | | | 3,310,790 | |
| | | | |
Chicago IL Public Building Commission Transit Authority (Ambac Insured) | | | 5.25 | | | | 3-1-2027 | | | | 3,400,000 | | | | 3,831,936 | |
| | | | |
Illinois Toll Highway Authority Toll Senior Series B | | | 5.00 | | | | 1-1-2039 | | | | 1,500,000 | | | | 1,646,940 | |
| | | | |
| | | | | | | | | | | | | | | 8,789,666 | |
| | | | | | | | | | | | | | | | |
| | | | |
| Utilities Revenue: 0.47% | | | | | | | | | | | | | | | | |
| | | | |
Illinois Municipal Electric Agency Power Supply System Series A | | | 5.00 | | | | 2-1-2030 | | | | 7,000,000 | | | | 7,919,170 | |
| | | | |
Illinois Municipal Electric Agency Power Supply System Series A | | | 5.00 | | | | 2-1-2031 | | | | 8,000,000 | | | | 9,024,880 | |
| | | | |
| | | | | | | | | | | | | | | 16,944,050 | |
| | | | | | | | | | | | | | | | |
| | | | |
| Water & Sewer Revenue: 0.55% | | | | | | | | | | | | | | | | |
| | | | |
Chicago IL Second Lien | | | 5.00 | | | | 11-1-2029 | | | | 4,600,000 | | | | 4,916,434 | |
| | | | |
Chicago IL Wastewater Refunding Bond Second Lien Series C | | | 5.00 | | | | 1-1-2039 | | | | 5,000,000 | | | | 5,338,300 | |
| | | | |
Chicago IL Wastewater Transmission Second Lien | | | 5.00 | | | | 1-1-2027 | | | | 4,000,000 | | | | 4,260,560 | |
| | | | |
Chicago IL Waterworks Second Lien | | | 5.00 | | | | 11-1-2030 | | | | 5,000,000 | | | | 5,338,350 | |
| | | | |
| | | | | | | | | | | | | | | 19,853,644 | |
| | | | | | | | | | | | | | | | |
| | | | |
| | | | | | | | | | | | | | | 533,547,037 | |
| | | | | | | | | | | | | | | | |
The accompanying notes are an integral part of these financial statements.
| | | | |
| 18 | | Wells Fargo Municipal Bond Fund | | Portfolio of investments—December 31, 2018 (unaudited) |
| | | | | | | | | | | | | | | | |
| Security name | | Interest rate | | | Maturity date | | | Principal | | | Value | |
| | | | |
Indiana: 1.23% | | | | | | | | | | | | | | | | |
| | | | |
| Health Revenue: 0.46% | | | | | | | | | | | | | | | | |
| | | | |
Indiana Finance Authority Health System Revenue Bonds Franciscan Alliance Incorporated Obligated Group Series C | | | 4.00 | % | | | 11-1-2033 | | | $ | 12,885,000 | | | $ | 13,320,642 | |
| | | | |
Indiana Health Facility Financing Authority Ascension Health Credit Group | | | 5.00 | | | | 11-15-2034 | | | | 2,750,000 | | | | 3,099,828 | |
| | | | |
| | | | | | | | | | | | | | | 16,420,470 | |
| | | | | | | | | | | | | | | | |
| | | | |
| Industrial Development Revenue: 0.49% | | | | | | | | | | | | | | | | |
| | | | |
Indiana Finance Authority Duke Energy Indiana Incorporated Series 2009A-4 (Sumitomo Mitsui Banking LOC) ø | | | 1.32 | | | | 12-1-2039 | | | | 900,000 | | | | 900,000 | |
| | | | |
Indiana Finance Authority Ohio River Bridges East End Crossing Project Series A | | | 5.00 | | | | 7-1-2035 | | | | 9,970,000 | | | | 10,603,992 | |
| | | | |
Indiana Finance Authority Ohio River Bridges East End Crossing Project Series A | | | 5.00 | | | | 7-1-2040 | | | | 2,470,000 | | | | 2,610,222 | |
| | | | |
Valparaiso IN Pratt Paper LLC Project | | | 5.88 | | | | 1-1-2024 | | | | 905,000 | | | | 986,133 | |
| | | | |
Whiting IN | | | 5.00 | | | | 3-1-2046 | | | | 2,500,000 | | | | 2,719,650 | |
| | | | |
| | | | | | | | | | | | | | | 17,819,997 | |
| | | | | | | | | | | | | | | | |
| | | | |
| Miscellaneous Revenue: 0.19% | | | | | | | | | | | | | | | | |
| | | | |
Carmel IN Local Public Impovement Multipurpose Bonds | | | 5.00 | | | | 7-15-2031 | | | | 6,000,000 | | | | 6,926,100 | |
| | | | | | | | | | | | | | | | |
| | | | |
| Resource Recovery Revenue: 0.09% | | | | | | | | | | | | | | | | |
| | | | |
Whiting IN BP Products North America Incorporated Project (SIFMA Municipal Swap +0.75%)± | | | 2.38 | | | | 12-1-2044 | | | | 3,155,000 | | | | 3,158,881 | |
| | | | | | | | | | | | | | | | |
| | | | |
| | | | | | | | | | | | | | | 44,325,448 | |
| | | | | | | | | | | | | | | | |
| | | | |
Iowa: 0.17% | | | | | | | | | | | | | | | | |
| | | | |
| GO Revenue: 0.06% | | | | | | | | | | | | | | | | |
| | | | |
Altoona IA Annual Appropriation Urban Renewal Series C | | | 5.00 | | | | 6-1-2031 | | | | 1,805,000 | | | | 2,026,672 | |
| | | | | | | | | | | | | | | | |
| | | | |
| Industrial Development Revenue: 0.11% | | | | | | | | | | | | | | | | |
| | | | |
Iowa Finance Authority Midwestern Disaster Area Project (Korea Development Bank LOC) ø | | | 1.96 | | | | 4-1-2022 | | | | 4,000,000 | | | | 4,000,000 | |
| | | | | | | | | | | | | | | | |
| | | | |
| | | | | | | | | | | | | | | 6,026,672 | |
| | | | | | | | | | | | | | | | |
| | | | |
Kansas: 0.40% | | | | | | | | | | | | | | | | |
| | | | |
| Tax Revenue: 0.40% | | | | | | | | | | | | | | | | |
| | | | |
Wyandotte County & Kansas City KS Special Obligation Vacation Village Project Area 4 Major Multi-Sport Athletic Complex Project CAB Series 2015 144A(z) | | | 6.86 | | | | 9-1-2034 | | | | 39,510,000 | | | | 14,470,933 | |
| | | | | | | | | | | | | | | | |
| | | | |
Kentucky: 1.45% | | | | | | | | | | | | | | | | |
| | | | |
| Health Revenue: 0.31% | | | | | | | | | | | | | | | | |
| | | | |
Kentucky EDFA Norton Healthcare Incorporated Series B (National Insured) (z) | | | 5.13 | | | | 10-1-2024 | | | | 9,260,000 | | | | 7,746,916 | |
| | | | |
Kentucky EDFA Norton Healthcare Incorporated Series B (National Insured) (z) | | | 6.31 | | | | 10-1-2028 | | | | 5,140,000 | | | | 3,665,437 | |
| | | | |
| | | | | | | | | | | | | | | 11,412,353 | |
| | | | | | | | | | | | | | | | |
| | | | |
| Transportation Revenue: 0.18% | | | | | | | | | | | | | | | | |
| | | | |
Kentucky Public Transportation Infrastructure Authority Downtown Crossing Project CAB Series B (z) | | | 6.60 | | | | 7-1-2030 | | | | 2,000,000 | | | | 1,169,560 | |
| | | | |
Kentucky Public Transportation Infrastructure Authority Downtown Crossing Project CAB Series B (z) | | | 6.70 | | | | 7-1-2031 | | | | 2,780,000 | | | | 1,512,098 | |
The accompanying notes are an integral part of these financial statements.
| | | | | | |
| Portfolio of investments—December 31, 2018 (unaudited) | | Wells Fargo Municipal Bond Fund | | | 19 | |
| | | | | | | | | | | | | | | | |
| Security name | | Interest rate | | | Maturity date | | | Principal | | | Value | |
| | | | |
| Transportation Revenue(continued) | | | | | | | | | | | | | | | | |
| | | | |
Kentucky Public Transportation Infrastructure Authority Downtown Crossing Project CAB Series B (z) | | | 6.76 | % | | | 7-1-2032 | | | $ | 2,500,000 | | | $ | 1,263,600 | |
| | | | |
Kentucky Public Transportation Infrastructure Authority Downtown Crossing Project CAB Series C | | | 3.12 | | | | 7-1-2033 | | | | 1,000,000 | | | | 977,520 | |
| | | | |
Kentucky Public Transportation Infrastructure Authority Downtown Crossing Project CAB Series C | | | 2.99 | | | | 7-1-2034 | | | | 1,505,000 | | | | 1,465,930 | |
| | | | |
| | | | | | | | | | | | | | | 6,388,708 | |
| | | | | | | | | | | | | | | | |
| | | | |
| Utilities Revenue: 0.96% | | | | | | | | | | | | | | | | |
| | | | |
Kentucky Public Energy Authority Gas Supply Series B | | | 4.00 | | | | 1-1-2049 | | | | 15,000,000 | | | | 15,856,950 | |
| | | | |
Kentucky Public Energy Authority Gas Supply Series C | | | 4.00 | | | | 12-1-2049 | | | | 15,000,000 | | | | 15,731,400 | |
| | | | |
Kentucky Public Energy Gas Supply Series A-2 | | | 4.00 | | | | 4-1-2048 | | | | 3,000,000 | | | | 3,135,570 | |
| | | | |
| | | | | | | | | | | | | | | 34,723,920 | |
| | | | | | | | | | | | | | | | |
| | | | |
| | | | | | | | | | | | | | | 52,524,981 | |
| | | | | | | | | | | | | | | | |
| | | | |
Louisiana: 1.23% | | | | | | | | | | | | | | | | |
| | | | |
| Airport Revenue: 0.54% | | | | | | | | | | | | | | | | |
| | | | |
New Orleans LA Aviation Board AMT Series B (AGM Insured) | | | 5.00 | | | | 1-1-2033 | | | | 3,000,000 | | | | 3,271,920 | |
| | | | |
New Orleans LA Aviation Board AMT Series B | | | 5.00 | | | | 1-1-2034 | | | | 4,500,000 | | | | 4,884,930 | |
| | | | |
New Orleans LA Aviation Board Gulf Opportunity Zone Consolidated Rental Car Project (AGM Insured) | | | 5.00 | | | | 1-1-2036 | | | | 1,250,000 | | | | 1,405,925 | |
| | | | |
New Orleans LA Aviation Board Gulf Opportunity Zone Consolidated Rental Car Project (AGM Insured) | | | 5.00 | | | | 1-1-2037 | | | | 1,750,000 | | | | 1,959,650 | |
| | | | |
New Orleans LA Aviation Board Gulf Opportunity Zone Consolidated Rental Car Project (AGM Insured) | | | 5.00 | | | | 1-1-2038 | | | | 1,500,000 | | | | 1,674,780 | |
| | | | |
New Orleans LA Aviation Board Gulf Opportunity Zone Consolidated Rental Car Series A | | | 6.50 | | | | 1-1-2040 | | | | 6,500,000 | | | | 6,500,000 | |
| | | | |
| | | | | | | | | | | | | | | 19,697,205 | |
| | | | | | | | | | | | | | | | |
| | | | |
| GO Revenue: 0.06% | | | | | | | | | | | | | | | | |
| | | | |
New Orleans LA (FGIC Insured) | | | 5.50 | | | | 12-1-2021 | | | | 2,050,000 | | | | 2,163,898 | |
| | | | | | | | | | | | | | | | |
| | | | |
| Industrial Development Revenue: 0.42% | | | | | | | | | | | | | | | | |
| | | | |
St. James Parish LA Nucor Steel LLC Project Gulf Opportunity Zone Series A-1 ø | | | 1.88 | | | | 11-1-2040 | | | | 15,000,000 | | | | 15,000,000 | |
| | | | | | | | | | | | | | | | |
| | | | |
| Miscellaneous Revenue: 0.21% | | | | | | | | | | | | | | | | |
| | | | |
Louisiana Series D | | | 4.00 | | | | 9-1-2032 | | | | 7,005,000 | | | | 7,451,429 | |
| | | | | | | | | | | | | | | | |
| | | | |
| | | | | | | | | | | | | | | 44,312,532 | |
| | | | | | | | | | | | | | | | |
| | | | |
Maine: 0.03% | | | | | | | | | | | | | | | | |
| | | | |
| Education Revenue: 0.03% | | | | | | | | | | | | | | | | |
| | | | |
Maine Educational Loan Authority Student Loan Series A-3 Class A (AGC Insured) | | | 5.88 | | | | 12-1-2039 | | | | 1,190,000 | | | | 1,205,292 | |
| | | | | | | | | | | | | | | | |
| | | | |
Maryland: 1.38% | | | | | | | | | | | | | | | | |
| | | | |
| Education Revenue: 0.45% | | | | | | | | | | | | | | | | |
| | | | |
Prince George’s County MD Chesapeake Lighthouse Charter School Project Series 2016-A | | | 5.75 | | | | 8-1-2033 | | | | 1,585,000 | | | | 1,499,664 | |
The accompanying notes are an integral part of these financial statements.
| | | | |
| 20 | | Wells Fargo Municipal Bond Fund | | Portfolio of investments—December 31, 2018 (unaudited) |
| | | | | | | | | | | | | | | | |
| Security name | | Interest rate | | | Maturity date | | | Principal | | | Value | |
| | | | |
| Education Revenue(continued) | | | | | | | | | | | | | | | | |
| | | | |
Prince George’s County MD Chesapeake Lighthouse Charter School Project Series 2016-A 144A | | | 6.90 | % | | | 8-1-2041 | | | $ | 8,480,000 | | | $ | 8,598,381 | |
| | | | |
Prince George’s County MD Chesapeake Lighthouse Charter School Project Series 2016-A | | | 7.00 | | | | 8-1-2046 | | | | 6,085,000 | | | | 6,195,199 | |
| | | | |
| | | | | | | | | | | | | | | 16,293,244 | |
| | | | | | | | | | | | | | | | |
| | | | |
| GO Revenue: 0.30% | | | | | | | | | | | | | | | | |
| | | | |
Montgomery County MD Consolidated Public Improvement Series A | | | 4.00 | | | | 11-1-2030 | | | | 10,000,000 | | | | 10,713,100 | |
| | | | | | | | | | | | | | | | |
| | | | |
| Housing Revenue: 0.17% | | | | | | | | | | | | | | | | |
| | | | |
Maryland CDA Belnor Senior Residences Series D | | | 1.83 | | | | 6-1-2019 | | | | 6,200,000 | | | | 6,175,076 | |
| | | | | | | | | | | | | | | | |
| | | | |
| Miscellaneous Revenue: 0.01% | | | | | | | | | | | | | | | | |
| | | | |
Howard County MD Certificate of Participation Agricultural Land Preservation #90-23 Series A | | | 8.00 | | | | 8-15-2020 | | | | 290,000 | | | | 314,479 | |
| | | | | | | | | | | | | | | | |
| | | | |
| Tax Revenue: 0.45% | | | | | | | | | | | | | | | | |
| | | | |
Maryland Consolidated Department of Transportation | | | 4.00 | | | | 2-1-2030 | | | | 15,280,000 | | | | 16,266,935 | |
| | | | | | | | | | | | | | | | |
| | | | |
| | | | | | | | | | | | | | | 49,762,834 | |
| | | | | | | | | | | | | | | | |
| | | | |
Massachusetts: 1.84% | | | | | | | | | | | | | | | | |
| | | | |
| Education Revenue: 0.30% | | | | | | | | | | | | | | | | |
| | | | |
Massachusetts Development Finance Agency Sabis International Charter Series A | | | 8.00 | | | | 4-15-2031 | | | | 2,150,000 | | | | 2,252,426 | |
| | | | |
Massachusetts Development Finance Agency Sabis International Charter Series A | | | 8.00 | | | | 4-15-2039 | | | | 3,900,000 | | | | 4,085,796 | |
| | | | |
Massachusetts Educational Financing Authority AMT Issue J | | | 5.00 | | | | 7-1-2021 | | | | 3,000,000 | | | | 3,190,020 | |
| | | | |
Massachusetts Educational Financing Authority AMT Series B | | | 5.38 | | | | 1-1-2020 | | | | 110,000 | | | | 112,530 | |
| | | | |
Massachusetts Educational Financing Authority Series I | | | 6.00 | | | | 1-1-2028 | | | | 965,000 | | | | 989,521 | |
| | | | |
| | | | | | | | | | | | | | | 10,630,293 | |
| | | | | | | | | | | | | | | | |
| | | | |
| GO Revenue: 0.29% | | | | | | | | | | | | | | | | |
| | | | |
Massachusetts | | | 5.00 | | | | 3-1-2041 | | | | 7,500,000 | | | | 8,257,200 | |
| | | | |
Massachusetts Series E | | | 5.25 | | | | 9-1-2048 | | | | 1,765,000 | | | | 2,063,585 | |
| | | | |
| | | | | | | | | | | | | | | 10,320,785 | |
| | | | | | | | | | | | | | | | |
| | | | |
| Miscellaneous Revenue: 0.32% | | | | | | | | | | | | | | | | |
| | | | |
Massachusetts Series A | | | 5.00 | | | | 12-1-2036 | | | | 10,850,000 | | | | 11,632,068 | |
| | | | | | | | | | | | | | | | |
| | | | |
| Tax Revenue: 0.73% | | | | | | | | | | | | | | | | |
| | | | |
Massachusetts Series D | | | 4.00 | | | | 5-1-2036 | | | | 15,000,000 | | | | 15,713,700 | |
| | | | |
Massachusetts Transportation Fund | | | 5.00 | | | | 6-1-2048 | | | | 9,425,000 | | | | 10,752,888 | |
| | | | |
| | | | | | | | | | | | | | | 26,466,588 | |
| | | | | | | | | | | | | | | | |
| | | | |
| Transportation Revenue: 0.20% | | | | | | | | | | | | | | | | |
| | | | |
Massachusetts Transportation Fund Revenue Rail Enhancement & Accelerated Bridge Programs Series A | | | 5.00 | | | | 6-1-2047 | | | | 6,485,000 | | | | 7,324,354 | |
| | | | | | | | | | | | | | | | |
| | | | |
| | | | | | | | | | | | | | | 66,374,088 | |
| | | | | | | | | | | | | | | | |
The accompanying notes are an integral part of these financial statements.
| | | | | | |
| Portfolio of investments—December 31, 2018 (unaudited) | | Wells Fargo Municipal Bond Fund | | | 21 | |
| | | | | | | | | | | | | | | | |
| Security name | | Interest rate | | | Maturity date | | | Principal | | | Value | |
| | | | |
Michigan: 5.86% | | | | | | | | | | | | | | | | |
| | | | |
| Education Revenue: 0.56% | | | | | | | | | | | | | | | | |
| | | | |
Michigan Finance Authority Limited Obligation Public School Holly Academy | | | 6.50 | % | | | 10-1-2020 | | | $ | 70,000 | | | $ | 72,070 | |
| | | | |
Michigan Finance Authority Limited Obligation Public School Holly Academy | | | 8.00 | | | | 10-1-2040 | | | | 1,350,000 | | | | 1,440,059 | |
| | | | |
Michigan Finance Authority Public School Academy University Learning | | | 6.25 | | | | 11-1-2020 | | | | 190,000 | | | | 193,823 | |
| | | | |
Michigan Public Educational Facilities Authority Limited Obligation Bradford Academy Project 144A | | | 6.50 | | | | 9-1-2037 | | | | 3,565,000 | | | | 2,629,081 | |
| | | | |
Michigan Public Educational Facilities Authority Limited Obligation Bradford Academy Project | | | 8.50 | | | | 9-1-2029 | | | | 1,500,000 | | | | 1,249,365 | |
| | | | |
Michigan Public Educational Facilities Authority Limited Obligation Bradford Academy Project | | | 8.75 | | | | 9-1-2039 | | | | 3,500,000 | | | | 2,689,925 | |
| | | | |
Michigan Public Educational Facilities Authority Limited Obligation Crescent Academy Project | | | 7.00 | | | | 10-1-2036 | | | | 1,082,500 | | | | 1,082,933 | |
| | | | |
Michigan Public Educational Facilities Authority Limited Obligation Madison Academy Project | | | 8.38 | | | | 12-1-2030 | | | | 2,085,000 | | | | 2,181,410 | |
| | | | |
Michigan Public Educational Facilities Authority Limited Obligation Madison Academy Project | | | 8.63 | | | | 12-1-2039 | | | | 4,170,000 | | | | 4,346,933 | |
| | | | |
Oakland County MI Economic Development Corporation The Academy of The Sacred Heart Project Series A | | | 6.50 | | | | 12-15-2036 | | | | 4,350,000 | | | | 4,367,792 | |
| | | | |
| | | | | | | | | | | | | | | 20,253,391 | |
| | | | | | | | | | | | | | | | |
| | | | |
| GO Revenue: 0.45% | | | | | | | | | | | | | | | | |
| | | | |
Livonia MI Public Schools School District Building & Site Series I | | | 5.00 | | | | 5-1-2026 | | | | 1,075,000 | | | | 1,176,695 | |
| | | | |
Livonia MI Public Schools School District Building & Site Series I | | | 5.00 | | | | 5-1-2028 | | | | 1,450,000 | | | | 1,577,876 | |
| | | | |
Livonia MI Public Schools School District Building & Site Series I | | | 5.00 | | | | 5-1-2029 | | | | 1,350,000 | | | | 1,467,342 | |
| | | | |
Livonia MI Public Schools School District Building & Site Series I | | | 5.00 | | | | 5-1-2030 | | | | 1,775,000 | | | | 1,920,248 | |
| | | | |
Livonia MI Public Schools School District Building & Site Series I | | | 5.00 | | | | 5-1-2031 | | | | 1,425,000 | | | | 1,538,601 | |
| | | | |
Wayne County MI Building Improvement Series A | | | 6.75 | | | | 11-1-2039 | | | | 8,345,000 | | | | 8,428,533 | |
| | | | |
| | | | | | | | | | | | | | | 16,109,295 | |
| | | | | | | | | | | | | | | | |
| | | | |
| Health Revenue: 0.73% | | | | | | | | | | | | | | | | |
| | | | |
Michigan Finance Authority Trinity Health Credit Group Series A | | | 5.00 | | | | 12-1-2047 | | | | 24,620,000 | | | | 26,283,081 | |
| | | | | | | | | | | | | | | | |
| | | | |
| Housing Revenue: 0.27% | | | | | | | | | | | | | | | | |
| | | | |
Michigan Housing Developement Authority Multifamily Housing Revenue Bonds Renaissance Estates of Ecorse Phase II Project | | | 1.78 | | | | 11-1-2020 | | | | 9,800,000 | | | | 9,785,006 | |
| | | | | | | | | | | | | | | | |
| | | | |
| Miscellaneous Revenue: 0.43% | | | | | | | | | | | | | | | | |
| | | | |
Michigan Finance Authority Charter Company Wayne Criminal Justice Center Project | | | 4.00 | | | | 11-1-2048 | | | | 6,000,000 | | | | 6,077,700 | |
| | | | |
Michigan Finance Authority Limited Obligation Public School Madison Academy Project Series A | | | 7.50 | | | | 12-1-2020 | | | | 140,000 | | | | 144,250 | |
| | | | |
Michigan Finance Authority Limited Obligation Public School Madison Academy Project Series A | | | 8.00 | | | | 12-1-2030 | | | | 1,135,000 | | | | 1,179,889 | |
| | | | |
Michigan Finance Authority Limited Obligation Public School Madison Academy Project Series A | | | 8.25 | | | | 12-1-2039 | | | | 2,220,000 | | | | 2,299,432 | |
| | | | |
Michigan Municipal Bond Authority Local Government Loan Program CAB Series G (Ambac Insured) (z) | | | 5.46 | | | | 5-1-2020 | | | | 205,000 | | | | 197,698 | |
| | | | |
Michigan Municipal Bond Authority Local Government Loan Program CAB Series G (Ambac Insured) (z) | | | 7.08 | | | | 5-1-2019 | | | | 75,000 | | | | 74,364 | |
| | | | |
Michigan Municipal Bond Authority Local Government Loan Program Series A (Ambac Insured) | | | 4.00 | | | | 11-1-2021 | | | | 80,000 | | | | 79,998 | |
The accompanying notes are an integral part of these financial statements.
| | | | |
| 22 | | Wells Fargo Municipal Bond Fund | | Portfolio of investments—December 31, 2018 (unaudited) |
| | | | | | | | | | | | | | | | |
| Security name | | Interest rate | | | Maturity date | | | Principal | | | Value | |
| | | | |
| Miscellaneous Revenue(continued) | | | | | | | | | | | | | | | | |
| | | | |
Michigan Municipal Bond Authority Local Government Loan Program Series B Group A (Ambac Insured) | | | 5.25 | % | | | 12-1-2023 | | | $ | 920,000 | | | $ | 923,413 | |
| | | | |
Michigan Municipal Bond Authority Local Government Loan Program Series C (Ambac Insured) | | | 4.00 | | | | 5-1-2019 | | | | 100,000 | | | | 100,042 | |
| | | | |
Michigan Municipal Bond Authority Local Government Loan Program Series C (Ambac Insured) | | | 4.75 | | | | 5-1-2027 | | | | 4,610,000 | | | | 4,610,231 | |
| | | | |
| | | | | | | | | | | | | | | 15,687,017 | |
| | | | | | | | | | | | | | | | |
| | | | |
| Tax Revenue: 1.36% | | | | | | | | | | | | | | | | |
| | | | |
Detroit MI Downtown Development Authority CAB (z) | | | 4.44 | | | | 7-1-2020 | | | | 2,070,000 | | | | 1,935,119 | |
| | | | |
Detroit MI Downtown Development Authority CAB (z) | | | 5.36 | | | | 7-1-2019 | | | | 3,050,000 | | | | 2,984,639 | |
| | | | |
Detroit MI Downtown Development Authority Tax Increment Revenue Refunding Bond Catalyst Development Project Series A (AGM Insured) | | | 5.00 | | | | 7-1-2021 | | | | 400,000 | | | | 425,636 | |
| | | | |
Michigan Finance Authority Local Government Loan Program Series H-1 | | | 5.00 | | | | 10-1-2031 | | | | 1,340,000 | | | | 1,487,105 | |
| | | | |
Michigan Finance Authority Local Government Loan Program Series H-1 | | | 5.00 | | | | 10-1-2032 | | | | 2,000,000 | | | | 2,217,340 | |
| | | | |
Michigan Finance Authority Local Government Loan Program Series H-1 | | | 5.00 | | | | 10-1-2033 | | | | 2,975,000 | | | | 3,294,961 | |
| | | | |
Michigan Finance Authority Local Government Loan Program Series H-1 | | | 5.00 | | | | 10-1-2034 | | | | 6,615,000 | | | | 7,322,739 | |
| | | | |
Michigan Finance Authority Local Government Loan Program Series H-1 | | | 5.00 | | | | 10-1-2039 | | | | 7,955,000 | | | | 8,801,730 | |
| | | | |
Michigan Finance Authority Refunding Bond Local Government Loan Program City of Detroit Financial Recovery Series F | | | 4.50 | | | | 10-1-2029 | | | | 7,000,000 | | | | 7,413,420 | |
| | | | |
Michigan Finance Authority Refunding Bond Local Government Loan Program Public Lighting Authority Series B | | | 5.00 | | | | 7-1-2044 | | | | 12,625,000 | | | | 13,427,824 | |
| | | | |
| | | | | | | | | | | | | | | 49,310,513 | |
| | | | | | | | | | | | | | | | |
| | | | |
| Utilities Revenue: 0.03% | | | | | | | | | | | | | | | | |
| | | | |
Michigan Strategic Fund Limited Obligation Detroit Edison Company Exempt Facilities Project Series KT | | | 5.63 | | | | 7-1-2020 | | | | 1,200,000 | | | | 1,259,736 | |
| | | | | | | | | | | | | | | | |
| | | | |
| Water & Sewer Revenue: 2.03% | | | | | | | | | | | | | | | | |
| | | | |
Detroit MI Water Supply System Second Lien Series B (AGM Insured) | | | 7.00 | | | | 7-1-2036 | | | | 9,675,000 | | | | 9,922,003 | |
| | | | |
Great Lakes Michigan Water Authority Sewage Disposal System Series 2016-C | | | 5.00 | | | | 7-1-2036 | | | | 8,500,000 | | | | 9,458,460 | |
| | | | |
Great Lakes Michigan Water Authority Water Supply System Series 2016-D | | | 4.00 | | | | 7-1-2032 | | | | 11,000,000 | | | | 11,411,290 | |
| | | | |
Great Lakes Michigan Water Authority Water Supply System Series 2016-D (AGM Insured) | | | 4.00 | | | | 7-1-2033 | | | | 11,000,000 | | | | 11,418,660 | |
| | | | |
Michigan Finance Authority Local Government Loan Program Series C (National Insured) | | | 5.00 | | | | 7-1-2025 | | | | 2,000,000 | | | | 2,251,920 | |
| | | | |
Michigan Finance Authority Local Government Loan Program Series C (National Insured) | | | 5.00 | | | | 7-1-2026 | | | | 1,945,000 | | | | 2,180,442 | |
| | | | |
Michigan Finance Authority Local Government Loan Program Series C (National Insured) | | | 5.00 | | | | 7-1-2027 | | | | 2,260,000 | | | | 2,523,765 | |
| | | | |
Michigan Finance Authority Local Government Loan Program Series C (National Insured) | | | 5.00 | | | | 7-1-2028 | | | | 3,480,000 | | | | 3,871,117 | |
| | | | |
Michigan Finance Authority Local Government Loan Program Series C (National Insured) | | | 5.00 | | | | 7-1-2032 | | | | 5,750,000 | | | | 6,313,270 | |
| | | | |
Michigan Finance Authority Local Government Loan Program Series C | | | 5.00 | | | | 7-1-2035 | | | | 2,000,000 | | | | 2,203,440 | |
| | | | |
Michigan Finance Authority Refunding Bond Local Government Loan Program Detroit Series D-4 | | | 5.00 | | | | 7-1-2031 | | | | 6,500,000 | | | | 7,167,875 | |
| | | | |
Michigan Finance Authority Refunding Bond Local Government Loan Program Detroit Series D-6 (National Insured) | | | 5.00 | | | | 7-1-2027 | | | | 1,000,000 | | | | 1,116,710 | |
The accompanying notes are an integral part of these financial statements.
| | | | | | |
| Portfolio of investments—December 31, 2018 (unaudited) | | Wells Fargo Municipal Bond Fund | | | 23 | |
| | | | | | | | | | | | | | | | |
| Security name | | Interest rate | | | Maturity date | | | Principal | | | Value | |
| | | | |
| Water & Sewer Revenue(continued) | | | | | | | | | | | | | | | | |
| | | | |
Michigan Finance Authority Refunding Bond Local Government Loan Program Detroit Series D-6 (National Insured) | | | 5.00 | % | | | 7-1-2036 | | | $ | 3,250,000 | | | $ | 3,525,568 | |
| | | | |
| | | | | | | | | | | | | | | 73,364,520 | |
| | | | | | | | | | | | | | | | |
| | | | |
| | | | | | | | | | | | | | | 212,052,559 | |
| | | | | | | | | | | | | | | | |
| | | | |
Minnesota: 0.12% | | | | | | | | | | | | | | | | |
| | | | |
| Utilities Revenue: 0.12% | | | | | | | | | | | | | | | | |
| | | | |
Rochester Minnesota Electric Utility Revenue Refunding Bond Series A | | | 5.00 | | | | 12-1-2042 | | | | 3,895,000 | | | | 4,384,368 | |
| | | | | | | | | | | | | | | | |
| | | | |
Mississippi: 0.24% | | | | | | | | | | | | | | | | |
| | | | |
| Miscellaneous Revenue: 0.24% | | | | | | | | | | | | | | | | |
| | | | |
Mississippi Development Bank Special Obligation Jackson Water & Sewer System Project Series A (AGM Insured) | | | 5.00 | | | | 9-1-2030 | | | | 8,155,000 | | | | 8,795,494 | |
| | | | | | | | | | | | | | | | |
| | | | |
Missouri: 0.92% | | | | | | | | | | | | | | | | |
| | | | |
| Airport Revenue: 0.06% | | | | | | | | | | | | | | | | |
| | | | |
St. Louis MO Lambert St. Louis International Airport Series A-1 | | | 6.25 | | | | 7-1-2029 | | | | 2,000,000 | | | | 2,040,800 | |
| | | | | | | | | | | | | | | | |
| | | | |
| GO Revenue: 0.14% | | | | | | | | | | | | | | | | |
| | | | |
St. Louis MO Special Adminstrative Board of The St. Louis School District | | | 4.00 | | | | 4-1-2030 | | | | 4,840,000 | | | | 5,192,013 | |
| | | | | | | | | | | | | | | | |
| | | | |
| Health Revenue: 0.45% | | | | | | | | | | | | | | | | |
| | | | |
St. Joseph MO IDA Heartland Regional Medical Center Series 2009A (U.S. Bank NA LOC) ø | | | 1.38 | | | | 11-15-2043 | | | | 16,075,000 | | | | 16,075,000 | |
| | | | | | | | | | | | | | | | |
| | | | |
| Miscellaneous Revenue: 0.07% | | | | | | | | | | | | | | | | |
| | | | |
St. Louis MO IDA Convention Center Hotel (Ambac Insured) (z) | | | 6.29 | | | | 7-15-2019 | | | | 2,475,000 | | | | 2,439,829 | |
| | | | | | | | | | | | | | | | |
| | | | |
| Tax Revenue: 0.20% | | | | | | | | | | | | | | | | |
| | | | |
Blue Springs MO Special Obligation Tax Refunding & Improvement Bonds Adams Farm Project Series A | | | 4.00 | | | | 6-1-2026 | | | | 7,110,000 | | | | 6,993,325 | |
| | | | |
Manchester MO Highway 141 Manchester Road Project | | | 6.00 | | | | 11-1-2025 | | | | 360,000 | | | | 356,792 | |
| | | | |
| | | | | | | | | | | | | | | 7,350,117 | |
| | | | | | | | | | | | | | | | |
| | | | |
| | | | | | | | | | | | | | | 33,097,759 | |
| | | | | | | | | | | | | | | | |
| | | | |
Nebraska: 0.61% | | | | | | | | | | | | | | | | |
| | | | |
| Utilities Revenue: 0.61% | | | | | | | | | | | | | | | | |
| | | | |
Central Plains Energy Project Nebraska Refunding Project #3 | | | 5.00 | | | | 9-1-2027 | | | | 1,020,000 | | | | 1,089,829 | |
| | | | |
Central Plains Energy Project Nebraska Refunding Project #3 Series A | | | 5.00 | | | | 9-1-2033 | | | | 6,000,000 | | | | 6,846,960 | |
| | | | |
Omaha NE Public Power District Series B | | | 4.00 | | | | 2-1-2032 | | | | 13,675,000 | | | | 14,171,813 | |
| | | | |
| | | | | | | | | | | | | | | 22,108,602 | |
| | | | | | | | | | | | | | | | |
| | | | |
Nevada: 0.03% | | | | | | | | | | | | | | | | |
| | | | |
| Miscellaneous Revenue: 0.03% | | | | | | | | | | | | | | | | |
| | | | |
Las Vegas NV Special Improvement District #60 Local Improvement | | | 5.00 | | | | 6-1-2022 | | | | 425,000 | | | | 447,415 | |
| | | | |
Las Vegas NV Special Improvement District #60 Local Improvement | | | 5.00 | | | | 6-1-2023 | | | | 335,000 | | | | 354,802 | |
| | | | |
Las Vegas NV Special Improvement District #60 Local Improvement | | | 5.00 | | | | 6-1-2024 | | | | 210,000 | | | | 221,584 | |
| | | | |
| | | | | | | | | | | | | | | 1,023,801 | |
| | | | | | | | | | | | | | | | |
The accompanying notes are an integral part of these financial statements.
| | | | |
| 24 | | Wells Fargo Municipal Bond Fund | | Portfolio of investments—December 31, 2018 (unaudited) |
| | | | | | | | | | | | | | | | |
| Security name | | Interest rate | | | Maturity date | | | Principal | | | Value | |
| | | | |
New Jersey: 3.67% | | | | | | | | | | | | | | | | |
| | | | |
| Education Revenue: 0.29% | | | | | | | | | | | | | | | | |
| | | | |
New Jersey Educational Facilities Authority Higher Education Facilities Trust Fund | | | 5.00 | % | | | 6-15-2025 | | | $ | 5,830,000 | | | $ | 6,381,460 | |
| | | | |
Rutgers State University Series L | | | 5.00 | | | | 5-1-2033 | | | | 3,560,000 | | | | 3,930,489 | |
| | | | |
| | | | | | | | | | | | | | | 10,311,949 | |
| | | | | | | | | | | | | | | | |
| | | | |
| GO Revenue: 0.55% | | | | | | | | | | | | | | | | |
| | | | |
Bayonne NJ School Refunding Bonds (AGM Insured) | | | 5.00 | | | | 7-15-2023 | | | | 2,505,000 | | | | 2,802,594 | |
| | | | |
Newark NJ Qualified General Improvement Series A | | | 5.00 | | | | 7-15-2025 | | | | 5,000,000 | | | | 5,326,300 | |
| | | | |
Newark NJ Qualified General Improvement Series A | | | 5.00 | | | | 7-15-2026 | | | | 2,205,000 | | | | 2,348,898 | |
| | | | |
Newark NJ Qualified General Improvement Series A | | | 5.00 | | | | 7-15-2027 | | | | 6,035,000 | | | | 6,414,541 | |
| | | | |
Newark NJ Qualified General Improvement Series A | | | 5.25 | | | | 7-15-2024 | | | | 1,325,000 | | | | 1,420,731 | |
| | | | |
Newark NJ Qualified General Improvement Series B | | | 5.00 | | | | 7-15-2025 | | | | 385,000 | | | | 410,125 | |
| | | | |
Newark NJ Qualified General Improvement Series B | | | 5.00 | | | | 7-15-2026 | | | | 395,000 | | | | 420,075 | |
| | | | |
Newark NJ Qualified General Improvement Series B | | | 5.00 | | | | 7-15-2027 | | | | 405,000 | | | | 429,511 | |
| | | | |
Newark NJ Qualified General Improvement Series B | | | 5.25 | | | | 7-15-2024 | | | | 375,000 | | | | 403,061 | |
| | | | |
| | | | | | | | | | | | | | | 19,975,836 | |
| | | | | | | | | | | | | | | | |
| | | | |
| Housing Revenue: 0.25% | | | | | | | | | | | | | | | | |
| | | | |
New Jersey Housing & Mortgage Finance Agency Villa Victoria Apartments Project Series F | | | 2.43 | | | | 11-1-2021 | | | | 9,000,000 | | | | 9,036,720 | |
| | | | | | | | | | | | | | | | |
| | | | |
| Miscellaneous Revenue: 1.39% | | | | | | | | | | | | | | | | |
| | | | |
New Jersey EDA Motor Vehicle Surcharge Revenue Refunding Bond Series A | | | 3.13 | | | | 7-1-2029 | | | | 5,905,000 | | | | 5,905,413 | |
| | | | |
New Jersey EDA School Facilities Construction Refunding Bond Project Series II | | | 5.00 | | | | 3-1-2026 | | | | 4,225,000 | | | | 4,485,725 | |
| | | | |
New Jersey EDA School Facilities Construction Refunding Bond Series NN | | | 5.00 | | | | 3-1-2026 | | | | 15,000,000 | | | | 16,097,850 | |
| | | | |
New Jersey TTFA Series A (National Insured) | | | 5.75 | | | | 6-15-2023 | | | | 2,000,000 | | | | 2,246,980 | |
| | | | |
New Jersey TTFA Series A (National Insured) | | | 5.75 | | | | 6-15-2025 | | | | 10,000,000 | | | | 11,697,500 | |
| | | | |
Newark NJ Housing Authority Port Authority Port Newark Marine Terminal Rental Refunding Bond Newark Redevelopment Project (National Insured) | | | 5.25 | | | | 1-1-2024 | | | | 1,000,000 | | | | 1,114,440 | |
| | | | |
Newark NJ Housing Authority Port Newark Marine Terminal Rental (National Insured) | | | 5.00 | | | | 1-1-2032 | | | | 7,620,000 | | | | 8,813,825 | |
| | | | |
| | | | | | | | | | | | | | | 50,361,733 | |
| | | | | | | | | | | | | | | | |
| | | | |
| Transportation Revenue: 1.19% | | | | | | | | | | | | | | | | |
| | | | |
New Jersey TTFA CAB Series A (z) | | | 4.47 | | | | 12-15-2026 | | | | 1,150,000 | | | | 849,908 | |
| | | | |
New Jersey TTFA CAB Series A (z) | | | 5.42 | | | | 12-15-2029 | | | | 11,875,000 | | | | 7,557,369 | |
| | | | |
New Jersey TTFA CAB Series A (z) | | | 5.85 | | | | 12-15-2031 | | | | 4,500,000 | | | | 2,574,180 | |
| | | | |
New Jersey TTFA Series A | | | 5.00 | | | | 6-15-2042 | | | | 5,540,000 | | | | 5,725,756 | |
| | | | |
New Jersey TTFA Series AA | | | 5.00 | | | | 6-15-2044 | | | | 1,000,000 | | | | 1,044,530 | |
| | | | |
New Jersey TTFA Series AA | | | 5.25 | | | | 6-15-2033 | | | | 10,000,000 | | | | 10,779,300 | |
| | | | |
New Jersey TTFA Series B | | | 5.25 | | | | 6-15-2036 | | | | 5,575,000 | | | | 5,828,774 | |
| | | | |
New Jersey TTFA Series C | | | 5.25 | | | | 6-15-2032 | | | | 8,000,000 | | | | 8,652,240 | |
| | | | |
| | | | | | | | | | | | | | | 43,012,057 | |
| | | | | | | | | | | | | | | | |
| | | | |
| | | | | | | | | | | | | | | 132,698,295 | |
| | | | | | | | | | | | | | | | |
| | | | |
New Mexico: 0.01% | | | | | | | | | | | | | | | | |
| | | | |
| Housing Revenue: 0.01% | | | | | | | | | | | | | | | | |
| | | | |
New Mexico Mortgage Finance Authority SFMR Class I (GNMA/FNMA/FHLMC Insured) | | | 5.35 | | | | 3-1-2030 | | | | 450,000 | | | | 467,177 | |
| | | | | | | | | | | | | | | | |
The accompanying notes are an integral part of these financial statements.
| | | | | | |
| Portfolio of investments—December 31, 2018 (unaudited) | | Wells Fargo Municipal Bond Fund | | | 25 | |
| | | | | | | | | | | | | | | | |
| Security name | | Interest rate | | | Maturity date | | | Principal | | | Value | |
| | | | |
New York: 8.42% | | | | | | | | | | | | | | | | |
| | | | |
| Education Revenue: 0.51% | | | | | | | | | | | | | | | | |
| | | | |
Hempstead Town NY Local Development Corporation The Academy Charter School Project Series A | | | 7.65 | % | | | 2-1-2044 | | | $ | 3,500,000 | | | $ | 3,577,455 | |
| | | | |
Hempstead Town NY Local Development Corporation The Academy Charter School Project Series A | | | 8.25 | | | | 2-1-2041 | | | | 9,510,000 | | | | 9,838,951 | |
| | | | |
Westchester County NY Local Development Pace University Series B ø | | | 2.28 | | | | 5-1-2044 | | | | 5,000,000 | | | | 5,000,000 | |
| | | | |
| | | | | | | | | | | | | | | 18,416,406 | |
| | | | | | | | | | | | | | | | |
| | | | |
| GO Revenue: 0.09% | | | | | | | | | | | | | | | | |
| | | | |
New York NY Series F-1 | | | 5.00 | | | | 3-1-2032 | | | | 3,000,000 | | | | 3,295,800 | |
| | | | | | | | | | | | | | | | |
| | | | |
| Health Revenue: 0.21% | | | | | | | | | | | | | | | | |
| | | | |
Nassau County NY Local Economic Catholic Health Services | | | 5.00 | | | | 7-1-2021 | | | | 7,000,000 | | | | 7,471,450 | |
| | | | | | | | | | | | | | | | |
| | | | |
| Industrial Development Revenue: 0.15% | | | | | | | | | | | | | | | | |
| | | | |
New York Transporation Development Corporation Special Facilities Revenue AMT | | | 5.00 | | | | 1-1-2036 | | | | 5,000,000 | | | | 5,489,450 | |
| | | | | | | | | | | | | | | | |
| | | | |
| Miscellaneous Revenue: 0.07% | | | | | | | | | | | | | | | | |
| | | | |
New York NY Transitional Finance Authority Building Aid Fiscal Year 2009 Series S4 | | | 5.75 | | | | 1-15-2039 | | | | 2,500,000 | | | | 2,503,450 | |
| | | | | | | | | | | | | | | | |
| | | | |
| Tax Revenue: 2.75% | | | | | | | | | | | | | | | | |
| | | | |
New York City NY Transitional Finance Authority Building Aid Revenue Fiscal 2019 Subordinate Bond Series S 3 A | | | 4.00 | | | | 7-15-2038 | | | | 4,500,000 | | | | 4,651,470 | |
| | | | |
New York City NY Transitional Finance Authority Building Aid Revenue Fiscal Year 2015 Series S1 | | | 5.00 | | | | 7-15-2040 | | | | 3,155,000 | | | | 3,477,031 | |
| | | | |
New York City NY Transitional Finance Authority Future Tax Secured Revenue Series A2 | | | 5.00 | | | | 8-1-2037 | | | | 12,140,000 | | | | 13,904,792 | |
| | | | |
New York City NY Transitional Future Tax Secured Subordinate Bond Series F 1 | | | 5.00 | | | | 5-1-2042 | | | | 2,390,000 | | | | 2,698,477 | |
| | | | |
New York Dormitory Authority Series A | | | 5.00 | | | | 2-15-2034 | | | | 3,790,000 | | | | 4,333,107 | |
| | | | |
New York Dormitory Authority Series B | | | 5.75 | | | | 3-15-2036 | | | | 10,000,000 | | | | 10,081,800 | |
| | | | |
New York Dormitory Authority Series B Group C | | | 5.00 | | | | 2-15-2045 | | | | 7,330,000 | | | | 8,091,734 | |
| | | | |
New York Dormitory Authority Series B Group C | | | 5.00 | | | | 2-15-2044 | | | | 14,860,000 | | | | 16,412,870 | |
| | | | |
New York Dormitory Authority Series E | | | 5.00 | | | | 2-15-2044 | | | | 9,600,000 | | | | 10,603,200 | |
| | | | |
New York NY Transitional Finance Authority Future Tax Secured Revenue Series I | | | 5.00 | | | | 5-1-2033 | | | | 5,395,000 | | | | 5,903,047 | |
| | | | |
New York NY Transitional Finance Authority Future Tax Secured Subordinate Bond Series A | | | 5.00 | | | | 8-1-2031 | | | | 17,075,000 | | | | 19,227,475 | |
| | | | |
| | | | | | | | | | | | | | | 99,385,003 | |
| | | | | | | | | | | | | | | | |
| | | | |
| Tobacco Revenue: 0.01% | | | | | | | | | | | | | | | | |
| | | | |
Suffolk NY Tobacco Securitization Corporation Series B | | | 4.50 | | | | 6-1-2026 | | | | 520,000 | | | | 539,453 | |
| | | | | | | | | | | | | | | | |
| | | | |
| Transportation Revenue: 1.32% | | | | | | | | | | | | | | | | |
| | | | |
New York Metropolitan Transportation Authority Series A | | | 5.00 | | | | 11-15-2030 | | | | 11,000,000 | | | | 11,843,040 | |
| | | | |
New York Metropolitan Transportation Authority Subordinate Bond Series D (1 Month LIBOR +0.65%) ± | | | 2.34 | | | | 11-1-2035 | | | | 28,000,000 | | | | 28,000,000 | |
| | | | |
Niagara Falls NY Bridge Commission (National Insured) | | | 6.25 | | | | 10-1-2021 | | | | 7,230,000 | | | | 8,029,927 | |
| | | | |
| | | | | | | | | | | | | | | 47,872,967 | |
| | | | | | | | | | | | | | | | |
| | | | |
| Utilities Revenue: 1.07% | | | | | | | | | | | | | | | | |
| | | | |
New York NY IDA Brooklyn Navy Yard Cogeneration Partners LP | | | 5.65 | | | | 10-1-2028 | | | | 3,350,000 | | | | 3,382,194 | |
| | | | |
New York NY IDA Brooklyn Navy Yard Cogeneration Partners LP | | | 5.75 | | | | 10-1-2036 | | | | 5,000,000 | | | | 5,048,050 | |
The accompanying notes are an integral part of these financial statements.
| | | | |
| 26 | | Wells Fargo Municipal Bond Fund | | Portfolio of investments—December 31, 2018 (unaudited) |
| | | | | | | | | | | | | | | | |
| Security name | | Interest rate | | | Maturity date | | | Principal | | | Value | |
| | | | |
| Utilities Revenue(continued) | | | | | | | | | | | | | | | | |
| | | | |
New York Utility Debt Securitization Authority Restructuring Bonds | | | 5.00 | % | | | 12-15-2037 | | | $ | 3,655,000 | | | $ | 4,137,387 | |
| | | | |
New York Utility Debt Securitization Authority Restructuring Bonds | | | 5.00 | | | | 12-15-2032 | | | | 22,785,000 | | | | 26,209,813 | |
| | | | |
| | | | | | | | | | | | | | | 38,777,444 | |
| | | | | | | | | | | | | | | | |
| | | | |
| Water & Sewer Revenue: 2.24% | | | | | | | | | | | | | | | | |
| | | | |
New York NY Municipal Water Finance Authority 2nd General Resolution Series AA | | | 5.00 | | | | 6-15-2044 | | | | 17,400,000 | | | | 18,732,840 | |
| | | | |
New York NY Municipal Water Finance Authority 2nd General Resolution Series BB | | | 5.00 | | | | 6-15-2044 | | | | 30,265,000 | | | | 32,403,525 | |
| | | | |
New York NY Municipal Water Finance Authority 2nd General Resolution Series BB | | | 5.00 | | | | 6-15-2047 | | | | 2,330,000 | | | | 2,556,965 | |
| | | | |
New York NY Municipal Water Finance Authority 2nd General Resolution Series BB | | | 5.25 | | | | 6-15-2044 | | | | 9,800,000 | | | | 10,614,086 | |
| | | | |
New York NY Municipal Water Finance Authority Water & Sewer System Series DD | | | 5.00 | | | | 6-15-2026 | | | | 3,255,000 | | | | 3,479,237 | |
| | | | |
New York NY Water Finance Authority Series DD | | | 5.25 | | | | 6-15-2047 | | | | 11,490,000 | | | | 13,149,041 | |
| | | | |
| | | | | | | | | | | | | | | 80,935,694 | |
| | | | | | | | | | | | | | | | |
| | | | |
| | | | | | | | | | | | | | | 304,687,117 | |
| | | | | | | | | | | | | | | | |
| | | | |
North Carolina: 1.50% | | | | | | | | | | | | | | | | |
| | | | |
| Health Revenue: 0.91% | | | | | | | | | | | | | | | | |
| | | | |
Charlotte Mecklenburg NC Hospital Authority Atrium Health Series B | | | 5.00 | | | | 1-15-2048 | | | | 10,000,000 | | | | 10,863,000 | |
| | | | |
Charlotte Mecklenburg NC Hospital Authority Atrium Health Series C | | | 5.00 | | | | 1-15-2048 | | | | 20,000,000 | | | | 22,180,800 | |
| | | | |
| | | | | | | | | | | | | | | 33,043,800 | |
| | | | | | | | | | | | | | | | |
| | | | |
| Housing Revenue: 0.50% | | | | | | | | | | | | | | | | |
| | | | |
Wake County NC Housing Authority Sunnybrook Pointe Apartments | | | 1.86 | | | | 12-1-2020 | | | | 18,100,000 | | | | 18,044,614 | |
| | | | | | | | | | | | | | | | |
| | | | |
| Utilities Revenue: 0.09% | | | | | | | | | | | | | | | | |
| | | | |
North Carolina Eastern Municipal Power Agency Series A | | | 5.50 | | | | 1-1-2026 | | | | 1,250,000 | | | | 1,250,000 | |
| | | | |
North Carolina Eastern Municipal Power Agency Series C | | | 6.75 | | | | 1-1-2024 | | | | 2,000,000 | | | | 2,000,000 | |
| | | | |
| | | | | | | | | | | | | | | 3,250,000 | |
| | | | | | | | | | | | | | | | |
| | | | |
| | | | | | | | | | | | | | | 54,338,414 | |
| | | | | | | | | | | | | | | | |
| | | | |
North Dakota: 0.39% | | | | | | | | | | | | | | | | |
| | | | |
| Education Revenue: 0.27% | | | | | | | | | | | | | | | | |
| | | | |
University of North Dakota Infrastructure Energy Improvement Project Green Certificares Series A | | | 5.00 | | | | 4-1-2057 | | | | 9,000,000 | | | | 9,834,750 | |
| | | | | | | | | | | | | | | | |
| | | | |
| Water & Sewer Revenue: 0.12% | | | | | | | | | | | | | | | | |
| | | | |
North Dakota PFA Revolving Fund Program Series A | | | 5.00 | | | | 10-1-2038 | | | | 3,780,000 | | | | 4,421,466 | |
| | | | | | | | | | | | | | | | |
| | | | |
| | | | | | | | | | | | | | | 14,256,216 | |
| | | | | | | | | | | | | | | | |
| | | | |
Ohio: 2.84% | | | | | | | | | | | | | | | | |
| | | | |
| Airport Revenue: 0.23% | | | | | | | | | | | | | | | | |
| | | | |
Cleveland OH Airport System Revenue Series A | | | 5.00 | | | | 1-1-2025 | | | | 4,015,000 | | | | 4,323,312 | |
| | | | |
Cleveland OH Airport System Revenue Series A (AGM Insured) | | | 5.00 | | | | 1-1-2031 | | | | 3,600,000 | | | | 3,855,960 | |
| | | | |
| | | | | | | | | | | | | | | 8,179,272 | |
| | | | | | | | | | | | | | | | |
The accompanying notes are an integral part of these financial statements.
| | | | | | |
| Portfolio of investments—December 31, 2018 (unaudited) | | Wells Fargo Municipal Bond Fund | | | 27 | |
| | | | | | | | | | | | | | | | |
| Security name | | Interest rate | | | Maturity date | | | Principal | | | Value | |
| | | | |
| GO Revenue: 0.34% | | | | | | | | | | | | | | | | |
| | | | |
Highland OH Local School District Medina County School Improvement Series A | | | 5.25 | % | | | 12-1-2048 | | | $ | 9,435,000 | | | $ | 10,482,945 | |
| | | | |
Highland OH Local School District Medina County School Improvement Series A | | | 5.25 | | | | 12-1-2054 | | | | 1,500,000 | | | | 1,658,685 | |
| | | | |
| | | | | | | | | | | | | | | 12,141,630 | |
| | | | | | | | | | | | | | | | |
| | | | |
| Health Revenue: 0.89% | | | | | | | | | | | | | | | | |
| | | | |
Allen County OH Catholic Healthcare Series B | | | 5.25 | | | | 9-1-2027 | | | | 3,825,000 | | | | 4,030,211 | |
| | | | |
Allen County OH Hospital Facilities Revenue Bonds Series B | | | 5.00 | | | | 8-1-2047 | | | | 5,000,000 | | | | 5,470,150 | |
| | | | |
Cleveland Cuyahoga County OH Facilities Improvement Centers for Dialysis | | | 5.00 | | | | 12-1-2047 | | | | 5,205,000 | | | | 5,294,630 | |
| | | | |
Lucas County Ohio Hospital Revenue Promedica Healthcare Obligation | | | 5.25 | | | | 11-15-2048 | | | | 15,000,000 | | | | 16,110,300 | |
| | | | |
Montgomery County OH Hospital Kettering Medical Center (National Insured) | | | 6.25 | | | | 4-1-2020 | | | | 1,330,000 | | | | 1,362,106 | |
| | | | |
| | | | | | | | | | | | | | | 32,267,397 | |
| | | | | | | | | | | | | | | | |
| | | | |
| Miscellaneous Revenue: 0.85% | | | | | | | | | | | | | | | | |
| | | | |
Ohio Private Activity Bond AMT Portsmouth Bypass Project (AGM Insured) | | | 5.00 | | | | 12-31-2026 | | | | 2,030,000 | | | | 2,289,556 | |
| | | | |
Ohio Private Activity Bond AMT Portsmouth Bypass Project (AGM Insured) | | | 5.00 | | | | 12-31-2028 | | | | 1,600,000 | | | | 1,791,488 | |
| | | | |
Ohio Private Activity Bond AMT Portsmouth Bypass Project (AGM Insured) | | | 5.00 | | | | 12-31-2030 | | | | 2,250,000 | | | | 2,501,033 | |
| | | | |
Ohio Private Activity Bond AMT Portsmouth Bypass Project (AGM Insured) | | | 5.00 | | | | 12-31-2035 | | | | 12,000,000 | | | | 13,183,320 | |
| | | | |
Ohio Private Activity Bond AMT Portsmouth Bypass Project (AGM Insured) | | | 5.00 | | | | 12-31-2039 | | | | 2,500,000 | | | | 2,714,575 | |
| | | | |
Ohio Series A | | | 5.00 | | | | 2-1-2036 | | | | 4,265,000 | | | | 4,848,879 | |
| | | | |
RiverSouth OH Lazarus Building Redevelopment Series A | | | 5.75 | | | | 12-1-2027 | | | | 3,415,000 | | | | 3,421,830 | |
| | | | |
| | | | | | | | | | | | | | | 30,750,681 | |
| | | | | | | | | | | | | | | | |
| | | | |
| Resource Recovery Revenue: 0.00% | | | | | | | | | | | | | | | | |
| | | | |
Ohio Air Quality Development Authority Ohio Valley Electric Corporation Series E | | | 5.63 | | | | 10-1-2019 | | | | 100,000 | | | | 101,453 | |
| | | | | | | | | | | | | | | | |
| | | | |
| Transportation Revenue: 0.23% | | | | | | | | | | | | | | | | |
| | | | |
Ohio Turnpike Commission CAB Series A-4 | | | 5.70 | | | | 2-15-2034 | | | | 8,500,000 | | | | 8,500,255 | |
| | | | | | | | | | | | | | | | |
| | | | |
| Water & Sewer Revenue: 0.30% | | | | | | | | | | | | | | | | |
| | | | |
Ohio Water Development Authority Drinking Water Assistance Fund | | | 5.00 | | | | 12-1-2035 | | | | 5,390,000 | | | | 6,234,397 | |
| | | | |
Ohio Water Development Authority Drinking Water Assistance Fund | | | 5.00 | | | | 12-1-2036 | | | | 2,000,000 | | | | 2,304,120 | |
| | | | |
Ohio Water Development Authority Fresh Water Series B | | | 5.00 | | | | 12-1-2034 | | | | 1,895,000 | | | | 2,197,707 | |
| | | | |
| | | | | | | | | | | | | | | 10,736,224 | |
| | | | | | | | | | | | | | | | |
| | | | |
| | | | | | | | | | | | | | | 102,676,912 | |
| | | | | | | | | | | | | | | | |
| | | | |
Oklahoma: 0.98% | | | | | | | | | | | | | | | | |
| | | | |
| Airport Revenue: 0.67% | | | | | | | | | | | | | | | | |
| | | | |
Oklahoma City OK Airport Trust Series 33 | | | 5.00 | | | | 7-1-2043 | | | | 5,000,000 | | | | 5,537,500 | |
| | | | |
Oklahoma City OK Airport Trust Series 33 | | | 5.00 | | | | 7-1-2047 | | | | 7,500,000 | | | | 8,287,275 | |
| | | | |
Tulsa OK Airports Improvement Trust AMT Series A (Build America Mutual Assurance Company Insured) | | | 5.00 | | | | 6-1-2035 | | | | 1,055,000 | | | | 1,137,754 | |
| | | | |
Tulsa OK Airports Improvement Trust Series A (AGM Insured) | | | 5.00 | | | | 6-1-2043 | | | | 4,485,000 | | | | 4,948,435 | |
| | | | |
Tulsa OK Airports Improvement Trust Series A (AGM Insured) | | | 5.25 | | | | 6-1-2048 | | | | 3,770,000 | | | | 4,230,732 | |
| | | | |
| | | | | | | | | | | | | | | 24,141,696 | |
| | | | | | | | | | | | | | | | |
| | | | |
| Health Revenue: 0.05% | | | | | | | | | | | | | | | | |
| | | | |
Oklahoma Development Finance Authority Oklahoma University Medicine Project Series B | | | 5.50 | | | | 8-15-2057 | | | | 1,750,000 | | | | 1,916,775 | |
| | | | | | | | | | | | | | | | |
The accompanying notes are an integral part of these financial statements.
| | | | |
| 28 | | Wells Fargo Municipal Bond Fund | | Portfolio of investments—December 31, 2018 (unaudited) |
| | | | | | | | | | | | | | | | |
| Security name | | Interest rate | | | Maturity date | | | Principal | | | Value | |
| | | | |
| Miscellaneous Revenue: 0.10% | | | | | | | | | | | | | | | | |
| | | | |
Garfield County OK Educational Facilities Authority Enid Public Schools Project Series A | | | 5.00 | % | | | 9-1-2030 | | | $ | 2,000,000 | | | $ | 2,276,280 | |
| | | | |
Garfield County OK Educational Facilities Authority Enid Public Schools Project Series A | | | 5.00 | | | | 9-1-2031 | | | | 1,145,000 | | | | 1,298,980 | |
| | | | |
| | | | | | | | | | | | | | | 3,575,260 | |
| | | | | | | | | | | | | | | | |
| | | | |
| Transportation Revenue: 0.09% | | | | | | | | | | | | | | | | |
| | | | |
Oklahoma Turnpike Authority Series C | | | 5.00 | | | | 1-1-2047 | | | | 3,000,000 | | | | 3,375,990 | |
| | | | | | | | | | | | | | | | |
| | | | |
| Water & Sewer Revenue: 0.07% | | | | | | | | | | | | | | | | |
| | | | |
McGee Creek Authority Oklahoma Water Revenue (National Insured) | | | 6.00 | | | | 1-1-2023 | | | | 2,360,000 | | | | 2,523,713 | |
| | | | | | | | | | | | | | | | |
| | | | |
| | | | | | | | | | | | | | | 35,533,434 | |
| | | | | | | | | | | | | | | | |
| | | | |
Pennsylvania: 5.78% | | | | | | | | | | | | | | | | |
| | | | |
| Airport Revenue: 0.39% | | | | | | | | | | | | | | | | |
| | | | |
Philadelphia PA Airport Series A | | | 5.00 | | | | 7-1-2047 | | | | 7,300,000 | | | | 8,003,063 | |
| | | | |
Philadelphia PA Airport Series B | | | 5.00 | | | | 7-1-2042 | | | | 5,500,000 | | | | 6,046,535 | |
| | | | |
| | | | | | | | | | | | | | | 14,049,598 | |
| | | | | | | | | | | | | | | | |
| | | | |
| Education Revenue: 0.33% | | | | | | | | | | | | | | | | |
| | | | |
Montgomery County PA Higher Education & Health Authority Arcadia University | | | 5.00 | | | | 4-1-2024 | | | | 1,540,000 | | | | 1,693,861 | |
| | | | |
Montgomery County PA Higher Education & Health Authority Arcadia University | | | 5.00 | | | | 4-1-2025 | | | | 1,625,000 | | | | 1,804,839 | |
| | | | |
Philadelphia PA IDA 1st Philadelphia Preparatory Charter School Project Series A | | | 7.00 | | | | 6-15-2033 | | | | 2,000,000 | | | | 2,208,740 | |
| | | | |
Philadelphia PA IDA New Foundations Charter School Project | | | 6.00 | | | | 12-15-2027 | | | | 280,000 | | | | 301,431 | |
| | | | |
Philadelphia PA IDA Thomas Jefferson University Series B ø | | | 1.91 | | | | 9-1-2050 | | | | 6,000,000 | | | | 6,000,000 | |
| | | | |
| | | | | | | | | | | | | | | 12,008,871 | |
| | | | | | | | | | | | | | | | |
| | | | |
| GO Revenue: 0.44% | | | | | | | | | | | | | | | | |
| | | | |
Allegheny County PA West Mifflin Area School District (AGM Insured) | | | 5.00 | | | | 4-1-2025 | | | | 1,180,000 | | | | 1,324,857 | |
| | | | |
Allegheny County PA West Mifflin Area School District (AGM Insured) | | | 5.00 | | | | 4-1-2026 | | | | 1,200,000 | | | | 1,361,028 | |
| | | | |
Allegheny County PA West Mifflin Area School District (AGM Insured) | | | 5.00 | | | | 4-1-2027 | | | | 1,000,000 | | | | 1,136,510 | |
| | | | |
Luzerne County PA Series E (AGM Insured) | | | 8.00 | | | | 11-1-2027 | | | | 135,000 | | | | 135,624 | |
| | | | |
Philadelphia PA School District Series A | | | 5.00 | | | | 9-1-2024 | | | | 2,075,000 | | | | 2,330,868 | |
| | | | |
Philadelphia PA School District Series D | | | 5.00 | | | | 9-1-2021 | | | | 5,000,000 | | | | 5,359,800 | |
| | | | |
Philadelphia PA School District Series F | | | 5.00 | | | | 9-1-2035 | | | | 3,820,000 | | | | 4,229,007 | |
| | | | |
| | | | | | | | | | | | | | | 15,877,694 | |
| | | | | | | | | | | | | | | | |
| | | | |
| Health Revenue: 0.75% | | | | | | | | | | | | | | | | |
| | | | |
Allegheny County PA Hospital Development Authority University of Pittsburgh Medical Center Series A | | | 5.63 | | | | 8-15-2039 | | | | 5,130,000 | | | | 5,229,881 | |
| | | | |
Berks County PA Municipal Authority Reading Hospital & Medical Center Project Series B (SIFMA Municipal Swap +1.50%)± | | | 3.13 | | | | 11-1-2039 | | | | 20,000,000 | | | | 20,304,800 | |
| | | | |
Quakertown PA General Authority Health LifeQuest Obligated Group Series C | | | 4.50 | | | | 7-1-2027 | | | | 750,000 | | | | 722,790 | |
| | | | |
Quakertown PA General Authority Health LifeQuest Obligated Group Series C | | | 5.00 | | | | 7-1-2032 | | | | 1,000,000 | | | | 963,870 | |
| | | | |
| | | | | | | | | | | | | | | 27,221,341 | |
| | | | | | | | | | | | | | | | |
| | | | |
| Industrial Development Revenue: 0.83% | | | | | | | | | | | | | | | | |
| | | | |
Montgomery County PA IDA Exelon Generation Company LLC Project Series A | | | 2.55 | | | | 12-1-2029 | | | | 11,530,000 | | | | 11,491,836 | |
| | | | |
Pennsylvania EDFA Bridges Finco LP | | | 5.00 | | | | 12-31-2030 | | | | 600,000 | | | | 659,274 | |
The accompanying notes are an integral part of these financial statements.
| | | | | | |
| Portfolio of investments—December 31, 2018 (unaudited) | | Wells Fargo Municipal Bond Fund | | | 29 | |
| | | | | | | | | | | | | | | | |
| Security name | | Interest rate | | | Maturity date | | | Principal | | | Value | |
| | | | |
| Industrial Development Revenue(continued) | | | | | | | | | | | | | | | | |
| | | | |
Pennsylvania EDFA Bridges Finco LP | | | 5.00 | % | | | 12-31-2034 | | | $ | 14,275,000 | | | $ | 15,489,232 | |
| | | | |
Pennsylvania EDFA Bridges Finco LP | | | 5.00 | | | | 12-31-2038 | | | | 2,100,000 | | | | 2,250,234 | |
| | | | |
| | | | | | | | | | | | | | | 29,890,576 | |
| | | | | | | | | | | | | | | | |
| | | | |
| Miscellaneous Revenue: 1.73% | | | | | | | | | | | | | | | | |
| | | | |
Delaware Valley PA Regional Finance Authority Local Government Public Improvements Project | | | 5.75 | | | | 7-1-2032 | | | | 5,000,000 | | | | 6,344,200 | |
| | | | |
Delaware Valley PA Regional Finance Authority Local Government Series A (Ambac Insured) | | | 5.50 | | | | 8-1-2028 | | | | 16,420,000 | | | | 19,814,835 | |
| | | | |
Delaware Valley PA Regional Finance Authority Local Government Series C (Ambac Insured) | | | 7.75 | | | | 7-1-2027 | | | | 4,025,000 | | | | 5,460,074 | |
| | | | |
Pennsylvania Finance Authority Pennsylvania Hills Project Series B (National Insured) (z) | | | 4.73 | | | | 12-1-2025 | | | | 1,160,000 | | | | 941,676 | |
| | | | |
Pennsylvania Public School Building Authority Philadelphia School District Project | | | 5.00 | | | | 4-1-2024 | | | | 3,960,000 | | | | 4,239,695 | |
| | | | |
State Public School Building Authority Pennsylvania Philadelphia School District Project | | | 5.00 | | | | 4-1-2022 | | | | 2,635,000 | | | | 2,844,957 | |
| | | | |
State Public School Building Authority Pennsylvania Philadelphia School District Project Series A | | | 5.00 | | | | 6-1-2024 | | | | 2,250,000 | | | | 2,512,463 | |
| | | | |
State Public School Building Authority Pennsylvania Philadelphia School District Project Series A | | | 5.00 | | | | 6-1-2034 | | | | 1,915,000 | | | | 2,125,918 | |
| | | | |
State Public School Building Authority Pennsylvania Philadelphia School District Project Series A | | | 5.00 | | | | 6-1-2035 | | | | 16,715,000 | | | | 18,494,813 | |
| | | | |
| | | | | | | | | | | | | | | 62,778,631 | |
| | | | | | | | | | | | | | | | |
| | | | |
| Resource Recovery Revenue: 0.00% | | | | | | | | | | | | | | | | |
| | | | |
Delaware County PA IDA Resource Recovery Facility Series A | | | 6.20 | | | | 7-1-2019 | | | | 80,000 | | | | 80,192 | |
| | | | | | | | | | | | | | | | |
| | | | |
| Tobacco Revenue: 0.06% | | | | | | | | | | | | | | | | |
| | | | |
Commonwealth Financing Authority Tobacco Master Settlement Payment Revenue Bonds | | | 5.00 | | | | 6-1-2035 | | | | 2,000,000 | | | | 2,242,140 | |
| | | | | | | | | | | | | | | | |
| | | | |
| Transportation Revenue: 1.00% | | | | | | | | | | | | | | | | |
| | | | |
Pennsylvania Turnpike Commission Motor License Series B-1 | | | 5.00 | | | | 12-1-2040 | | | | 12,410,000 | | | | 13,140,453 | |
| | | | |
Pennsylvania Turnpike Commission Motor License Series B-2 | | | 5.00 | | | | 12-1-2035 | | | | 9,900,000 | | | | 11,084,436 | |
| | | | |
Pennsylvania Turnpike Commission Series A-1 | | | 5.00 | | | | 12-1-2047 | | | | 1,750,000 | | | | 1,926,890 | |
| | | | |
Pennsylvania Turnpike Commission Subordinate Bond Series B-1 | | | 5.00 | | | | 6-1-2027 | | | | 1,000,000 | | | | 1,156,530 | |
| | | | |
Pennsylvania Turnpike Commission Subordinate Bond Series B-1 | | | 5.00 | | | | 6-1-2028 | | | | 1,450,000 | | | | 1,654,871 | |
| | | | |
Pennsylvania Turnpike Commission Subordinate Bond Series B-2 | | | 5.00 | | | | 6-1-2027 | | | | 1,200,000 | | | | 1,387,836 | |
| | | | |
Pennsylvania Turnpike Commission Subordinate Bond Series B-2 | | | 5.00 | | | | 6-1-2028 | | | | 5,000,000 | | | | 5,706,450 | |
| | | | |
| | | | | | | | | | | | | | | 36,057,466 | |
| | | | | | | | | | | | | | | | |
| | | | |
| Water & Sewer Revenue: 0.25% | | | | | | | | | | | | | | | | |
| | | | |
Philadelphia PA Series B | | | 5.00 | | | | 7-1-2033 | | | | 8,000,000 | | | | 9,013,200 | |
| | | | | | | | | | | | | | | | |
| | | | |
| | | | | | | | | | | | | | | 209,219,709 | |
| | | | | | | | | | | | | | | | |
| | | | |
Puerto Rico: 0.09% | | | | | | | | | | | | | | | | |
| | | | |
| Transportation Revenue: 0.09% | | | | | | | | | | | | | | | | |
| | | | |
Puerto Rico Highway & Transportation Authority Series AA (National Insured) | | | 5.50 | | | | 7-1-2020 | | | | 3,015,000 | | | | 3,098,516 | |
| | | | | | | | | | | | | | | | |
The accompanying notes are an integral part of these financial statements.
| | | | |
| 30 | | Wells Fargo Municipal Bond Fund | | Portfolio of investments—December 31, 2018 (unaudited) |
| | | | | | | | | | | | | | | | |
| Security name | | Interest rate | | | Maturity date | | | Principal | | | Value | |
| | | | |
South Carolina: 1.44% | | | | | | | | | | | | | | | | |
| | | | |
| Education Revenue: 0.08% | | | | | | | | | | | | | | | | |
| | | | |
South Carolina Education Assistance Authority Student Loan Series I | | | 5.10 | % | | | 10-1-2029 | | | $ | 1,200,000 | | | $ | 1,220,592 | |
| | | | |
South Carolina Jobs EDA York Preparatory Academy Project Series A | | | 7.25 | | | | 11-1-2045 | | | | 1,500,000 | | | | 1,605,330 | |
| | | | |
| | | | | | | | | | | | | | | 2,825,922 | |
| | | | | | | | | | | | | | | | |
| | | | |
| Resource Recovery Revenue: 0.13% | | | | | | | | | | | | | | | | |
| | | | |
South Carolina Jobs EDA Solid Waste Disposal AMT RePower South Berkeley LLC Project Green Bond 144A | | | 6.00 | | | | 2-1-2035 | | | | 1,880,000 | | | | 1,866,502 | |
| | | | |
South Carolina Jobs EDA Solid Waste Disposal AMT RePower South Berkeley LLC Project Green Bond 144A | | | 6.25 | | | | 2-1-2045 | | | | 2,750,000 | | | | 2,755,005 | |
| | | | |
| | | | | | | | | | | | | | | 4,621,507 | |
| | | | | | | | | | | | | | | | |
| | | | |
| Utilities Revenue: 0.92% | | | | | | | | | | | | | | | | |
| | | | |
Patriots Energy Group Financing Agency South Carolina Series A | | | 4.00 | | | | 10-1-2048 | | | | 26,000,000 | | | | 27,466,660 | |
| | | | |
Piedmont SC Municipal Power Agency (FGIC Insured) | | | 6.75 | | | | 1-1-2019 | | | | 210,000 | | | | 210,000 | |
| | | | |
South Carolina Public Service Authority Series C | | | 5.00 | | | | 12-1-2028 | | | | 1,230,000 | | | | 1,381,794 | |
| | | | |
South Carolina Public Service Authority Series C | | | 5.00 | | | | 12-1-2034 | | | | 1,825,000 | | | | 1,998,174 | |
| | | | |
South Carolina Public Service Authority Series C | | | 5.00 | | | | 12-1-2035 | | | | 2,000,000 | | | | 2,184,020 | |
| | | | |
| | | | | | | | | | | | | | | 33,240,648 | |
| | | | | | | | | | | | | | | | |
| | | | |
| Water & Sewer Revenue: 0.31% | | | | | | | | | | | | | | | | |
| | | | |
Columbia SC Waterworks & Sewer System | | | 5.00 | | | | 2-1-2043 | | | | 10,380,000 | | | | 11,274,860 | |
| | | | | | | | | | | | | | | | |
| | | | |
| | | | | | | | | | | | | | | 51,962,937 | |
| | | | | | | | | | | | | | | | |
| | | | |
South Dakota: 0.79% | | | | | | | | | | | | | | | | |
| | | | |
| Airport Revenue: 0.05% | | | | | | | | | | | | | | | | |
| | | | |
Rapid City SD Series A | | | 6.75 | | | | 12-1-2031 | | | | 1,020,000 | | | | 1,063,126 | |
| | | | |
Rapid City SD Series A | | | 7.00 | | | | 12-1-2035 | | | | 750,000 | | | | 783,323 | |
| | | | |
| | | | | | | | | | | | | | | 1,846,449 | |
| | | | | | | | | | | | | | | | |
| | | | |
| Health Revenue: 0.53% | | | | | | | | | | | | | | | | |
| | | | |
South Dakota HEFA Sanford Health Project | | | 5.50 | | | | 11-1-2040 | | | | 5,000,000 | | | | 5,129,850 | |
| | | | |
South Dakota HEFA Sanford Health Project Series E | | | 5.00 | | | | 11-1-2042 | | | | 13,125,000 | | | | 14,086,669 | |
| | | | |
| | | | | | | | | | | | | | | 19,216,519 | |
| | | | | | | | | | | | | | | | |
| | | | |
| Housing Revenue: 0.21% | | | | | | | | | | | | | | | | |
| | | | |
South Dakota Board of Regents Housing & Auxiliary Facilities System | | | 5.00 | | | | 4-1-2023 | | | | 750,000 | | | | 833,018 | |
| | | | |
South Dakota Board of Regents Housing & Auxiliary Facilities System | | | 5.00 | | | | 4-1-2024 | | | | 1,100,000 | | | | 1,243,000 | |
| | | | |
South Dakota Board of Regents Housing & Auxiliary Facilities System | | | 5.00 | | | | 4-1-2025 | | | | 1,000,000 | | | | 1,147,410 | |
| | | | |
South Dakota Board of Regents Housing & Auxiliary Facilities System | | | 5.00 | | | | 4-1-2026 | | | | 1,540,000 | | | | 1,790,281 | |
| | | | |
South Dakota Board of Regents Housing & Auxiliary Facilities System | | | 5.00 | | | | 4-1-2032 | | | | 1,010,000 | | | | 1,165,995 | |
| | | | |
South Dakota Board of Regents Housing & Auxiliary Facilities System | | | 5.00 | | | | 4-1-2033 | | | | 1,250,000 | | | | 1,438,900 | |
| | | | |
| | | | | | | | | | | | | | | 7,618,604 | |
| | | | | | | | | | | | | | | | |
| | | | |
| | | | | | | | | | | | | | | 28,681,572 | |
| | | | | | | | | | | | | | | | |
The accompanying notes are an integral part of these financial statements.
| | | | | | |
| Portfolio of investments—December 31, 2018 (unaudited) | | Wells Fargo Municipal Bond Fund | | | 31 | |
| | | | | | | | | | | | | | | | |
| Security name | | Interest rate | | | Maturity date | | | Principal | | | Value | |
| | | | |
Tennessee: 1.27% | | | | | | | | | | | | | | | | |
| | | | |
| Utilities Revenue: 1.27% | | | | | | | | | | | | | | | | |
| | | | |
Tennessee Energy Acquisition Corporation Gas Project | | | 4.00 | % | | | 11-1-2049 | | | $ | 20,000,000 | | | $ | 20,973,600 | |
| | | | |
Tennessee Energy Acquisition Corporation Series A | | | 4.00 | | | | 5-1-2048 | | | | 24,155,000 | | | | 25,097,770 | |
| | | | |
| | | | | | | | | | | | | | | 46,071,370 | |
| | | | | | | | | | | | | | | | |
| | | | |
Texas: 11.19% | | | | | | | | | | | | | | | | |
| | | | |
| Airport Revenue: 1.48% | | | | | | | | | | | | | | | | |
| | | | |
Austin TX Airport System AMT | | | 5.00 | | | | 11-15-2039 | | | | 8,000,000 | | | | 8,791,360 | |
| | | | |
Austin TX Airport System AMT | | | 5.00 | | | | 11-15-2044 | | | | 3,500,000 | | | | 3,836,385 | |
| | | | |
Dallas-Fort Worth TX International Airport AMT Series D | | | 5.00 | | | | 11-1-2038 | | | | 13,250,000 | | | | 13,867,450 | |
| | | | |
Dallas-Fort Worth TX International Airport Series H | | | 5.00 | | | | 11-1-2042 | | | | 20,765,000 | | | | 21,692,573 | |
| | | | |
Houston TX Airport System Subordinate Bond Lien AMT Series A | | | 5.00 | | | | 7-1-2041 | | | | 4,750,000 | | | | 5,296,963 | |
| | | | |
| | | | | | | | | | | | | | | 53,484,731 | |
| | | | | | | | | | | | | | | | |
| | | | |
| Education Revenue: 1.18% | | | | | | | | | | | | | | | | |
| | | | |
Beasley TX Higher Education Finance Corporation Focus Learning Academy Series A †† | | | 7.75 | | | | 8-15-2041 | | | | 2,000,000 | | | | 1,320,000 | |
| | | | |
Clifton TX Higher Education Finance Corporation International Leadership Texas Series D | | | 6.00 | | | | 8-15-2038 | | | | 6,000,000 | | | | 6,080,100 | |
| | | | |
Clifton TX Higher Education Finance Corporation International Leadership Texas Series D | | | 6.13 | | | | 8-15-2048 | | | | 6,750,000 | | | | 6,820,605 | |
| | | | |
Clifton TX Higher Educational Finance Corporation International Leadership Series A | | | 5.75 | | | | 8-15-2038 | | | | 2,000,000 | | | | 1,999,860 | |
| | | | |
La Vernia TX Higher Education Finance Corporation Lifeschool of Dallas Series A | | | 6.25 | | | | 8-15-2021 | | | | 2,000,000 | | | | 2,055,920 | |
| | | | |
La Vernia TX Higher Education Finance Corporation Lifeschool of Dallas Series A | | | 7.50 | | | | 8-15-2041 | | | | 6,500,000 | | | | 6,729,320 | |
| | | | |
Newark TX Higher Education Finance Corporation Austin Achieve Public Schools Incorporated | | | 5.00 | | | | 6-15-2048 | | | | 750,000 | | | | 752,303 | |
| | | | |
Southwest Texas Higher Education Authority Incorporated Southern Methodist University Project | | | 5.00 | | | | 10-1-2030 | | | | 1,460,000 | | | | 1,718,697 | |
| | | | |
Southwest Texas Higher Education Authority Incorporated Southern Methodist University Project | | | 5.00 | | | | 10-1-2032 | | | | 650,000 | | | | 759,655 | |
| | | | |
Southwest Texas Higher Education Authority Incorporated Southern Methodist University Project | | | 5.00 | | | | 10-1-2039 | | | | 750,000 | | | | 854,685 | |
| | | | |
Southwest Texas Higher Education Authority Incorporated Southern Methodist University Project | | | 5.00 | | | | 10-1-2040 | | | | 1,000,000 | | | | 1,137,120 | |
| | | | |
Southwest Texas Higher Education Authority Incorporated Southern Methodist University Project | | | 5.00 | | | | 10-1-2041 | | | | 900,000 | | | | 1,021,941 | |
| | | | |
University of Texas Board of Regents Refunding Bonds Series C | | | 5.00 | | | | 8-15-2024 | | | | 10,000,000 | | | | 11,540,100 | |
| | | | |
| | | | | | | | | | | | | | | 42,790,306 | |
| | | | | | | | | | | | | | | | |
| | | | |
| GO Revenue: 2.08% | | | | | | | | | | | | | | | | |
| | | | |
Houston TX Public Improvement Refunding Bonds Series A | | | 4.00 | | | | 3-1-2034 | | | | 1,000,000 | | | | 1,054,820 | |
| | | | |
Houston TX Public Improvement Refunding Bonds Series A | | | 5.00 | | | | 3-1-2025 | | | | 3,070,000 | | | | 3,560,740 | |
| | | | |
Houston TX Public Improvement Refunding Bonds Series A | | | 5.00 | | | | 3-1-2029 | | | | 2,000,000 | | | | 2,354,060 | |
| | | | |
Lewisville TX Independent School District Unlimited Tax Refunding Bonds Series A | | | 5.00 | | | | 8-15-2021 | | | | 2,200,000 | | | | 2,372,656 | |
| | | | |
Lewisville TX Independent School District Unlimited Tax Refunding Bonds Series A | | | 5.00 | | | | 8-15-2022 | | | | 2,640,000 | | | | 2,916,883 | |
| | | | |
Lewisville TX Independent School District Unlimited Tax Refunding Bonds Series A | | | 5.00 | | | | 8-15-2023 | | | | 3,000,000 | | | | 3,386,460 | |
| | | | |
North East Independent School District | | | 4.00 | | | | 8-1-2048 | | | | 10,450,000 | | | | 10,662,971 | |
| | | | |
San Antonio TX Independent School District | | | 5.00 | | | | 8-15-2048 | | | | 13,000,000 | | | | 14,442,350 | |
The accompanying notes are an integral part of these financial statements.
| | | | |
| 32 | | Wells Fargo Municipal Bond Fund | | Portfolio of investments—December 31, 2018 (unaudited) |
| | | | | | | | | | | | | | | | |
| Security name | | Interest rate | | | Maturity date | | | Principal | | | Value | |
| | | | |
| GO Revenue(continued) | | | | | | | | | | | | | | | | |
| | | | |
Sugar Land TX Refunding Bonds | | | 5.00 | % | | | 2-15-2030 | | | $ | 1,250,000 | | | $ | 1,463,225 | |
| | | | |
Texas City TX Independent School District | | | 4.00 | | | | 8-15-2048 | | | | 5,000,000 | | | | 5,108,100 | |
| | | | |
Texas Refunding Bond Series B | | | 5.00 | | | | 10-1-2036 | | | | 24,500,000 | | | | 27,952,295 | |
| | | | |
| | | | | | | | | | | | | | | 75,274,560 | |
| | | | | | | | | | | | | | | | |
| | | | |
| Health Revenue: 0.06% | | | | | | | | | | | | | | | | |
| | | | |
New Hope ECFA Children’s Health System of Texas Project Series A | | | 4.00 | | | | 8-15-2033 | | | | 2,000,000 | | | | 2,099,600 | |
| | | | | | | | | | | | | | | | |
| | | | |
| Housing Revenue: 0.47% | | | | | | | | | | | | | | | | |
| | | | |
Alamito TX Public Facility Corporation Cramer Three Apartments Project | | | 2.50 | | | | 11-1-2021 | | | | 7,000,000 | | | | 7,050,470 | |
| | | | |
Austin TX Affordable Public Facility Corporation Incorporated Commons at Goodnight Apartments | | | 1.85 | | | | 1-1-2021 | | | | 10,000,000 | | | | 9,948,400 | |
| | | | |
| | | | | | | | | | | | | | | 16,998,870 | |
| | | | | | | | | | | | | | | | |
| | | | |
| Miscellaneous Revenue: 1.84% | | | | | | | | | | | | | | | | |
| | | | |
Lewisville TX Combination Contract Special Assessment Capital Improvement District #4 | | | 6.75 | | | | 10-1-2032 | | | | 100,000 | | | | 100,103 | |
| | | | |
Lewisville TX Combination Contract Castle Hills Public Improvement Bonds District #5 144A | | | 6.50 | | | | 9-1-2034 | | | | 6,120,000 | | | | 6,181,628 | |
| | | | |
Lewisville TX Combination Contract Castle Hills Public Improvement Bonds District #6 144A | | | 6.00 | | | | 9-1-2037 | | | | 13,240,000 | | | | 13,525,454 | |
| | | | |
Lower Colorado TX River Authority Series A | | | 5.00 | | | | 5-15-2033 | | | | 2,475,000 | | | | 2,719,703 | |
| | | | |
Texas Series A | | | 4.00 | | | | 10-15-2036 | | | | 5,000,000 | | | | 5,272,600 | |
| | | | |
Texas Series A | | | 5.00 | | | | 4-15-2023 | | | | 16,195,000 | | | | 18,179,373 | |
| | | | |
Texas Transportation Commission Highway Improvement | | | 5.00 | | | | 4-1-2028 | | | | 7,280,000 | | | | 8,234,117 | |
| | | | |
Texas Water Development Board Series A | | | 4.00 | | | | 10-15-2037 | | | | 11,650,000 | | | | 12,239,723 | |
| | | | |
| | | | | | | | | | | | | | | 66,452,701 | |
| | | | | | | | | | | | | | | | |
| | | | |
| Resource Recovery Revenue: 0.51% | | | | | | | | | | | | | | | | |
| | | | |
Port Arthur TX Navigation District Jefferson County Environmental Facilities Motiva Enterprises LLC Project Series C ø | | | 1.55 | | | | 4-1-2040 | | | | 9,300,000 | | | | 9,300,000 | |
| | | | |
Port Arthur TX Navigation District Jefferson County Environmental Facilities Motiva Enterprises LLC Project Subordinate Bond Series E ø | | | 1.97 | | | | 11-1-2040 | | | | 9,100,000 | | | | 9,100,000 | |
| | | | |
| | | | | | | | | | | | | | | 18,400,000 | |
| | | | | | | | | | | | | | | | |
| | | | |
| Tax Revenue: 1.03% | | | | | | | | | | | | | | | | |
| | | | |
Dallas TX Area Rapid Transit Sales Tax Revenue Series A | | | 5.00 | | | | 12-1-2048 | | | | 5,000,000 | | | | 5,560,500 | |
| | | | |
Dallas TX Area Rapid Transit Sales Tax Revenue Series A | | | 5.00 | | | | 12-1-2046 | | | | 28,430,000 | | | | 31,673,010 | |
| | | | |
| | | | | | | | | | | | | | | 37,233,510 | |
| | | | | | | | | | | | | | | | |
| | | | |
| Transportation Revenue: 1.01% | | | | | | | | | | | | | | | | |
| | | | |
Central Texas Regional Mobility Authority Senior Lien | | | 5.75 | | | | 1-1-2025 | | | | 2,000,000 | | | | 2,077,320 | |
| | | | |
Central Texas Regional Mobility Authority Senior Lien Series A | | | 5.00 | | | | 1-1-2033 | | | | 3,740,000 | | | | 4,023,978 | |
| | | | |
Grand Parkway Transportation Corporation Texas CAB Series B | | | 3.12 | | | | 10-1-2029 | | | | 1,015,000 | | | | 987,189 | |
| | | | |
Grand Parkway Transportation Corporation Texas Series B | | | 5.05 | | | | 10-1-2030 | | | | 2,000,000 | | | | 1,940,940 | |
| | | | |
North Texas Tollway Authority Series A | | | 5.00 | | | | 1-1-2033 | | | | 3,600,000 | | | | 3,992,328 | |
| | | | |
North Texas Tollway Authority Series A | | | 5.00 | | | | 1-1-2035 | | | | 4,000,000 | | | | 4,401,360 | |
The accompanying notes are an integral part of these financial statements.
| | | | | | |
| Portfolio of investments—December 31, 2018 (unaudited) | | Wells Fargo Municipal Bond Fund | | | 33 | |
| | | | | | | | | | | | | | | | |
| Security name | | Interest rate | | | Maturity date | | | Principal | | | Value | |
| | | | |
| Transportation Revenue(continued) | | | | | | | | | | | | | | | | |
| | | | |
Texas Private Activity Bond Surface Transportation Corporation Project NTE Mobility Partners Segments LLC | | | 6.75 | % | | | 6-30-2043 | | | $ | 4,000,000 | | | $ | 4,565,480 | |
| | | | |
Texas Private Activity Bond Surface Transportation Corporation Project NTE Mobility Partners Segments LLC | | | 7.00 | | | | 12-31-2038 | | | | 12,500,000 | | | | 14,458,875 | |
| | | | |
| | | | | | | | | | | | | | | 36,447,470 | |
| | | | | | | | | | | | | | | | |
| | | | |
| Utilities Revenue: 0.61% | | | | | | | | | | | | | | | | |
| | | | |
San Antonio TX Electric & Gas Systems Junior Lien Refunding Bond | | | 2.75 | | | | 2-1-2048 | | | | 11,000,000 | | | | 11,155,100 | |
| | | | |
Texas Municipal Gas Acquisition & Supply Corporation III | | | 5.00 | | | | 12-15-2029 | | | | 5,115,000 | | | | 5,534,942 | |
| | | | |
Texas Municipal Gas Acquisition & Supply Corporation III | | | 5.00 | | | | 12-15-2031 | | | | 5,000,000 | | | | 5,385,250 | |
| | | | |
| | | | | | | | | | | | | | | 22,075,292 | |
| | | | | | | | | | | | | | | | |
| | | | |
| Water & Sewer Revenue: 0.92% | | | | | | | | | | | | | | | | |
| | | | |
Austin Texas Water & Wastewater Refunding Bond | | | 5.00 | | | | 11-15-2045 | | | | 15,065,000 | | | | 16,925,979 | |
| | | | |
Tarrant TX Regional Water District | | | 5.00 | | | | 3-1-2049 | | | | 15,000,000 | | | | 16,423,950 | |
| | | | |
| | | | | | | | | | | | | | | 33,349,929 | |
| | | | | | | | | | | | | | | | |
| | | | |
| | | | | | | | | | | | | | | 404,606,969 | |
| | | | | | | | | | | | | | | | |
| | | | |
Utah: 0.56% | | | | | | | | | | | | | | | | |
| | | | |
| Airport Revenue: 0.56% | | | | | | | | | | | | | | | | |
| | | | |
Salt Lake City UT Series A | | | 5.00 | | | | 7-1-2036 | | | | 2,500,000 | | | | 2,826,600 | |
| | | | |
Salt Lake City UT Series A | | | 5.00 | | | | 7-1-2043 | | | | 2,500,000 | | | | 2,781,475 | |
| | | | |
Salt Lake City UT Series A | | | 5.00 | | | | 7-1-2043 | | | | 1,500,000 | | | | 1,701,165 | |
| | | | |
Salt Lake City UT Series A | | | 5.00 | | | | 7-1-2048 | | | | 5,500,000 | | | | 6,095,925 | |
| | | | |
Salt Lake City UT Series A | | | 5.00 | | | | 7-1-2048 | | | | 3,000,000 | | | | 3,389,310 | |
| | | | |
Salt Lake City UT Series A | | | 5.25 | | | | 7-1-2048 | | | | 3,000,000 | | | | 3,397,680 | |
| | | | |
| | | | | | | | | | | | | | | 20,192,155 | |
| | | | | | | | | | | | | | | | |
| | | | |
Vermont: 0.43% | | | | | | | | | | | | | | | | |
| | | | |
| Education Revenue: 0.43% | | | | | | | | | | | | | | | | |
| | | | |
Vermont Student Assistance Corporation Series B Class B (1 Month LIBOR +1.00%) ± | | | 3.52 | | | | 6-2-2042 | | | | 15,750,109 | | | | 15,673,406 | |
| | | | | | | | | | | | | | | | |
| | | | |
Virginia: 1.21% | | | | | | | | | | | | | | | | |
| | | | |
| GO Revenue: 0.17% | | | | | | | | | | | | | | | | |
| | | | |
Norfolk VA Series C | | | 4.00 | | | | 9-1-2032 | | | | 5,810,000 | | | | 6,210,251 | |
| | | | | | | | | | | | | | | | |
| | | | |
| Housing Revenue: 0.51% | | | | | | | | | | | | | | | | |
| | | | |
Loudoun County VA EDA Multifamily Housing Revenue Bonds Stone Springs Apartments (GNMA/FHA Insured) | | | 1.84 | | | | 12-1-2020 | | | | 16,500,000 | | | | 16,452,480 | |
| | | | |
Newport News VA Redevelopment & Housing Authority Multifamily Housing Series A | | | 1.82 | | | | 11-1-2020 | | | | 2,010,000 | | | | 2,006,201 | |
| | | | |
| | | | | | | | | | | | | | | 18,458,681 | |
| | | | | | | | | | | | | | | | |
| | | | |
| Miscellaneous Revenue: 0.23% | | | | | | | | | | | | | | | | |
| | | | |
Virginia Resources Authority | | | 4.00 | | | | 11-1-2035 | | | | 1,635,000 | | | | 1,750,202 | |
| | | | |
Virginia Resources Authority | | | 4.00 | | | | 11-1-2037 | | | | 2,410,000 | | | | 2,538,092 | |
The accompanying notes are an integral part of these financial statements.
| | | | |
| 34 | | Wells Fargo Municipal Bond Fund | | Portfolio of investments—December 31, 2018 (unaudited) |
| | | | | | | | | | | | | | | | |
| Security name | | Interest rate | | | Maturity date | | | Principal | | | Value | |
| | | | |
| Miscellaneous Revenue(continued) | | | | | | | | | | | | | | | | |
| | | | |
Virginia Resources Authority | | | 4.00 | % | | | 11-1-2038 | | | $ | 3,405,000 | | | $ | 3,556,965 | |
| | | | |
Watkins Centre VA CDA | | | 5.40 | | | | 3-1-2020 | | | | 333,000 | | | | 333,343 | |
| | | | |
| | | | | | | | | | | | | | | 8,178,602 | |
| | | | | | | | | | | | | | | | |
| | | | |
| Tax Revenue: 0.03% | | | | | | | | | | | | | | | | |
| | | | |
Marquis VA CDA CAB Series 2015 144A | | | 7.50 | | | | 9-1-2045 | | | | 397,000 | | | | 278,496 | |
| | | | |
Marquis VA CDA CAB Series C (z) | | | 6.25 | | | | 9-1-2041 | | | | 1,824,000 | | | | 91,492 | |
| | | | |
Marquis VA CDA Series B | | | 5.63 | | | | 9-1-2041 | | | | 1,310,000 | | | | 877,818 | |
| | | | |
| | | | | | | | | | | | | | | 1,247,806 | |
| | | | | | | | | | | | | | | | |
| | | | |
| Transportation Revenue: 0.27% | | | | | | | | | | | | | | | | |
| | | | |
Virginia Commonwealth Transportation Board Refunding Bond Capital Projects Series A | | | 5.00 | | | | 5-15-2029 | | | | 4,500,000 | | | | 5,421,330 | |
| | | | |
Virginia Small Business Financing Authority Senior Lien 95 Express Lanes LLC Project | | | 5.00 | | | | 7-1-2034 | | | | 4,000,000 | | | | 4,168,000 | |
| | | | |
| | | | | | | | | | | | | | | 9,589,330 | |
| | | | | | | | | | | | | | | | |
| | | | |
| | | | | | | | | | | | | | | 43,684,670 | |
| | | | | | | | | | | | | | | | |
| | | | |
Washington: 2.91% | | | | | | | | | | | | | | | | |
| | | | |
| GO Revenue: 1.38% | | | | | | | | | | | | | | | | |
| | | | |
Clark County WA School District #114 (AGM Insured) | | | 4.00 | | | | 12-1-2031 | | | | 9,000,000 | | | | 9,717,660 | |
| | | | |
Clark County WA School District #114 (AGM Insured) | | | 4.00 | | | | 12-1-2034 | | | | 2,500,000 | | | | 2,669,750 | |
| | | | |
King County WA Public Hospital District #1 Valley Medical Center Refunding Bond | | | 5.00 | | | | 12-1-2029 | | | | 8,940,000 | | | | 10,197,411 | |
| | | | |
King County WA Public Hospital District #1 Valley Medical Center Refunding Bond | | | 5.00 | | | | 12-1-2035 | | | | 9,430,000 | | | | 10,468,620 | |
| | | | |
King County WA School District No. 414 Lake Washington (AGM Insured) | | | 5.00 | | | | 12-1-2033 | | | | 570,000 | | | | 675,176 | |
| | | | |
King County WA School District No. 414 Lake Washington (AGM Insured) | | | 5.00 | | | | 12-1-2034 | | | | 1,000,000 | | | | 1,178,160 | |
| | | | |
Washington Series 2017-A | | | 5.00 | | | | 8-1-2040 | | | | 3,500,000 | | | | 3,951,010 | |
| | | | |
Washington Series 2017-A | | | 5.00 | | | | 8-1-2041 | | | | 2,500,000 | | | | 2,814,950 | |
| | | | |
Washington Series RA | | | 4.00 | | | | 7-1-2030 | | | | 7,950,000 | | | | 8,335,734 | |
| | | | |
| | | | | | | | | | | | | | | 50,008,471 | |
| | | | | | | | | | | | | | | | |
| | | | |
| Health Revenue: 0.17% | | | | | | | | | | | | | | | | |
| | | | |
Spokane WA Housing Finance Commission Riverview Retirement Community Project | | | 5.00 | | | | 1-1-2023 | | | | 945,000 | | | | 984,378 | |
| | | | |
Washington HCFR Central Washington Health Service Association | | | 7.00 | | | | 7-1-2039 | | | | 5,000,000 | | | | 5,125,150 | |
| | | | |
| | | | | | | | | | | | | | | 6,109,528 | |
| | | | | | | | | | | | | | | | |
| | | | |
| Miscellaneous Revenue: 0.10% | | | | | | | | | | | | | | | | |
| | | | |
Washington Certificate of Participation Series A | | | 5.00 | | | | 7-1-2038 | | | | 3,265,000 | | | | 3,657,845 | |
| | | | | | | | | | | | | | | | |
| | | | |
| Tax Revenue: 0.50% | | | | | | | | | | | | | | | | |
| | | | |
Central Puget Sound WA Regional Transportation Authority Series S1 | | | 5.00 | | | | 11-1-2035 | | | | 9,485,000 | | | | 10,785,963 | |
| | | | |
Washington Series B | | | 5.00 | | | | 8-1-2037 | | | | 6,400,000 | | | | 7,280,320 | |
| | | | |
| | | | | | | | | | | | | | | 18,066,283 | |
| | | | | | | | | | | | | | | | |
The accompanying notes are an integral part of these financial statements.
| | | | | | |
| Portfolio of investments—December 31, 2018 (unaudited) | | Wells Fargo Municipal Bond Fund | | | 35 | |
| | | | | | | | | | | | | | | | |
| Security name | | Interest rate | | | Maturity date | | | Principal | | | Value | |
| | | | |
| Water & Sewer Revenue: 0.76% | | | | | | | | | | | | | | | | |
| | | | |
King County WA | | | 2.60 | % | | | 1-1-2043 | | | $ | 19,000,000 | | | $ | 19,115,140 | |
| | | | |
King County WA | | | 5.00 | | | | 7-1-2047 | | | | 7,510,000 | | | | 8,285,107 | |
| | | | |
| | | | | | | | | | | | | | | 27,400,247 | |
| | | | | | | | | | | | | | | | |
| | | | |
| | | | | | | | | | | | | | | 105,242,374 | |
| | | | | | | | | | | | | | | | |
| | | | |
West Virginia: 0.09% | | | | | | | | | | | | | | | | |
| | | | |
| Tax Revenue: 0.09% | | | | | | | | | | | | | | | | |
| | | | |
Monongalia County WV Commission Refunding & Improvement Bonds University Town Center Series A 144A | | | 5.50 | | | | 6-1-2037 | | | | 2,500,000 | | | | 2,541,925 | |
| | | | |
Monongalia County WV Commission Refunding & Improvement Bonds University Town Center Series A 144A | | | 5.75 | | | | 6-1-2043 | | | | 675,000 | | | | 689,850 | |
| | | | |
| | | | | | | | | | | | | | | 3,231,775 | |
| | | | | | | | | | | | | | | | |
| | | | |
Wisconsin: 3.49% | | | | | | | | | | | | | | | | |
| | | | |
| Education Revenue: 0.46% | | | | | | | | | | | | | | | | |
| | | | |
Milwaukee WI RDA Science Education Consortium Incorporated Project Series A | | | 6.00 | | | | 8-1-2033 | | | | 2,120,000 | | | | 2,280,993 | |
| | | | |
Milwaukee WI RDA Science Education Consortium Incorporated Project Series A | | | 6.25 | | | | 8-1-2043 | | | | 4,650,000 | | | | 4,996,983 | |
| | | | |
Public Finance Authority Wisland Revenue Northwest Nazarene University | | | 4.25 | | | | 10-1-2049 | | | | 5,410,000 | | | | 4,737,591 | |
| | | | |
Wisconsin PFA Carolina International School Series A 144A | | | 6.00 | | | | 8-1-2023 | | | | 375,000 | | | | 394,166 | |
| | | | |
Wisconsin PFA Carolina International School Series A 144A | | | 6.75 | | | | 8-1-2033 | | | | 1,430,000 | | | | 1,563,562 | |
| | | | |
Wisconsin PFA Carolina International School Series A 144A | | | 7.00 | | | | 8-1-2043 | | | | 1,575,000 | | | | 1,711,096 | |
| | | | |
Wisconsin PFA Carolina International School Series A 144A | | | 7.20 | | | | 8-1-2048 | | | | 940,000 | | | | 1,026,847 | |
| | | | |
| | | | | | | | | | | | | | | 16,711,238 | |
| | | | | | | | | | | | | | | | |
| | | | |
| GO Revenue: 0.63% | | | | | | | | | | | | | | | | |
| | | | |
Verona WI Area School District Building & Improvement Bonds | | | 4.00 | | | | 4-1-2027 | | | | 3,385,000 | | | | 3,710,028 | |
| | | | |
Verona WI Area School District Building & Improvement Bonds | | | 4.00 | | | | 4-1-2028 | | | | 1,380,000 | | | | 1,497,286 | |
| | | | |
Verona WI Area School District Building & Improvement Bonds | | | 5.00 | | | | 4-1-2026 | | | | 3,310,000 | | | | 3,910,401 | |
| | | | |
Wisconsin Series A | | | 4.00 | | | | 5-1-2032 | | | | 13,000,000 | | | | 13,555,100 | |
| | | | |
| | | | | | | | | | | | | | | 22,672,815 | |
| | | | | | | | | | | | | | | | |
| | | | |
| Health Revenue: 0.40% | | | | | | | | | | | | | | | | |
| | | | |
Wisconsin HEFA Ascension Senior Credit Group Series A | | | 5.00 | | | | 11-15-2035 | | | | 12,000,000 | | | | 13,432,200 | |
| | | | |
Wisconsin HEFA Aurora Health Care Incorporated Series A | | | 5.25 | | | | 4-15-2024 | | | | 1,025,000 | | | | 1,069,096 | |
| | | | |
| | | | | | | | | | | | | | | 14,501,296 | |
| | | | | | | | | | | | | | | | |
| | | | |
| Housing Revenue: 0.91% | | | | | | | | | | | | | | | | |
| | | | |
Wisconsin Public Finance Authority Student Housing Revenue (AGM Insured) | | | 4.00 | | | | 7-1-2023 | | | | 350,000 | | | | 372,953 | |
| | | | |
Wisconsin Public Finance Authority Student Housing Revenue (AGM Insured) | | | 4.00 | | | | 7-1-2024 | | | | 800,000 | | | | 858,272 | |
| | | | |
Wisconsin Public Finance Authority Student Housing Revenue (AGM Insured) | | | 4.00 | | | | 7-1-2025 | | | | 920,000 | | | | 991,374 | |
| | | | |
Wisconsin Public Finance Authority Student Housing Revenue (AGM Insured) | | | 5.00 | | | | 7-1-2026 | | | | 1,360,000 | | | | 1,558,043 | |
| | | | |
Wisconsin Public Finance Authority Student Housing Revenue (AGM Insured) | | | 5.00 | | | | 7-1-2027 | | | | 1,675,000 | | | | 1,932,699 | |
| | | | |
Wisconsin Public Finance Authority Student Housing Revenue (AGM Insured) | | | 5.00 | | | | 7-1-2028 | | | | 2,025,000 | | | | 2,346,570 | |
| | | | |
Wisconsin Public Finance Authority Student Housing Revenue (AGM Insured) | | | 5.00 | | | | 7-1-2029 | | | | 2,190,000 | | | | 2,516,376 | |
| | | | |
Wisconsin Public Finance Authority Student Housing Revenue (AGM Insured) | | | 5.00 | | | | 7-1-2030 | | | | 2,300,000 | | | | 2,620,505 | |
| | | | |
Wisconsin Public Finance Authority Student Housing Revenue (AGM Insured) | | | 5.00 | | | | 7-1-2031 | | | | 1,415,000 | | | | 1,604,766 | |
| | | | |
Wisconsin Public Finance Authority Student Housing Revenue (AGM Insured) | | | 5.00 | | | | 7-1-2048 | | | | 16,775,000 | | | | 18,144,511 | |
| | | | |
| | | | | | | | | | | | | | | 32,946,069 | |
| | | | | | | | | | | | | | | | |
The accompanying notes are an integral part of these financial statements.
| | | | |
| 36 | | Wells Fargo Municipal Bond Fund | | Portfolio of investments—December 31, 2018 (unaudited) |
| | | | | | | | | | | | | | | | |
| Security name | | Interest rate | | | Maturity date | | | Principal | | | Value | |
| | | | |
| Miscellaneous Revenue: 0.06% | | | | | | | | | | | | | | | | |
| | | | |
Wisconsin Series 1 | | | 4.50 | % | | | 7-1-2033 | | | $ | 2,085,000 | | | $ | 2,212,936 | |
| | | | | | | | | | | | | | | | |
| | | | |
| Tax Revenue: 1.03% | | | | | | | | | | | | | | | | |
| | | | |
Mount Pleasant WI Series A | | | 5.00 | | | | 4-1-2038 | | | | 5,495,000 | | | | 6,163,961 | |
| | | | |
Mount Pleasant WI Series A | | | 5.00 | | | | 4-1-2043 | | | | 20,205,000 | | | | 22,478,669 | |
| | | | |
Mount Pleasant WI Series A | | | 5.00 | | | | 4-1-2048 | | | | 7,855,000 | | | | 8,706,325 | |
| | | | |
| | | | | | | | | | | | | | | 37,348,955 | |
| | | | | | | | | | | | | | | | |
| | | | |
| | | | | | | | | | | | | | | 126,393,309 | |
| | | | | | | | | | | | | | | | |
| | | | |
Wyoming: 0.06% | | | | | | | | | | | | | | | | |
| | | | |
| Education Revenue: 0.05% | | | | | | | | | | | | | | | | |
| | | | |
Wyoming CDA | | | 6.50 | | | | 7-1-2043 | | | | 1,600,000 | | | | 1,676,624 | |
| | | | | | | | | | | | | | | | |
| | | | |
| Health Revenue: 0.01% | | | | | | | | | | | | | | | | |
| | | | |
West Park Hospital District Wyoming Series B | | | 6.50 | | | | 6-1-2027 | | | | 500,000 | | | | 534,135 | |
| | | | | | | | | | | | | | | | |
| | | | |
| | | | | | | | | | | | | | | 2,210,759 | |
| | | | | | | | | | | | | | | | |
| | | | |
Total Municipal Obligations (Cost $3,479,827,691) | | | | | | | | | | | | | | | 3,572,670,518 | |
| | | | | | | | | | | | | | | | |
| | | | |
| | | Yield | | | | | | Shares | | | | |
| Short-Term Investments: 0.44% | | | | | | | | | | | | | | | | |
| | | | |
| Investment Companies: 0.40% | | | | | | | | | | | | | | | | |
| | | | |
Wells Fargo Municipal Cash Management Money Market Fund Institutional Class (l)(u) | | | 1.65 | | | | | | | | 14,419,069 | | | | 14,424,836 | |
| | | | | | | | | | | | | | | | |
| | | | |
| | | | | | | | | Principal | | | | |
| U.S. Treasury Securities: 0.04% | | | | | | | | | | | | | | | | |
| | | | |
U.S. Treasury Bill (z) | | | 2.32 | | | | 3-14-2019 | | | $ | 1,445,000 | | | | 1,438,080 | |
| | | | | | | | | | | | | | | | |
| | | | |
Total Short-Term Investments (Cost $15,863,068) | | | | | | | | | | | | | | | 15,862,916 | |
| | | | | | | | | | | | | | | | |
| | | | | | | | |
| Total investments in securities (Cost $3,495,690,759) | | | 99.21 | % | | | 3,588,533,434 | |
| | |
Other assets and liabilities, net | | | 0.79 | | | | 28,540,808 | |
| | | | | | | | |
| Total net assets | | | 100.00 | % | | $ | 3,617,074,242 | |
| | | | | | | | |
| (z) | Zero coupon security. The rate represents the purchase yield to maturity. |
| 144A | The security may be resold in transactions exempt from registration, normally to qualified institutional buyers, pursuant to Rule 144A under the Securities Act of 1933. |
| ø | Variable rate demand notes are subject to a demand feature which reduces the effective maturity. The maturity date shown represents the final maturity date of the security. The interest rate is determined and reset by the issuer daily, weekly, or monthly depending upon the terms of the security. The rate shown is the rate in effect at period end. |
| ± | Variable rate investment. The rate shown is the rate in effect at period end. |
| †† | On the last interest date, partial interest was paid. |
| (l) | The issuer of the security is an affiliated person of the Fund as defined in the Investment Company Act of 1940. |
| (u) | The rate represents the 7-day annualized yield at period end. |
The accompanying notes are an integral part of these financial statements.
| | | | | | |
| Portfolio of investments—December 31, 2018 (unaudited) | | Wells Fargo Municipal Bond Fund | | | 37 | |
Abbreviations:
| AGC | Assured Guaranty Corporation |
| AGM | Assured Guaranty Municipal |
| Ambac | Ambac Financial Group Incorporated |
| AMT | Alternative minimum tax |
| BAN | Bond anticipation notes |
| CAB | Capital appreciation bond |
| CCAB | Convertible capital appreciation bond |
| CDA | Community Development Authority |
| ECFA | Educational & Cultural Facilities Authority |
| EDA | Economic Development Authority |
| EDFA | Economic Development Finance Authority |
| FGIC | Financial Guaranty Insurance Corporation |
| FHA | Federal Housing Administration |
| FHLMC | Federal Home Loan Mortgage Corporation |
| FNMA | Federal National Mortgage Association |
| GNMA | Government National Mortgage Association |
| HCFR | Healthcare facilities revenue |
| HEFA | Health & Educational Facilities Authority |
| IDA | Industrial Development Authority |
| LIBOR | London Interbank Offered Rate |
| National | National Public Finance Guarantee Corporation |
| PCFA | Pollution Control Financing Authority |
| PCR | Pollution control revenue |
| PFA | Public Finance Authority |
| RDA | Redevelopment Authority |
| SFMR | Single-family mortgage revenue |
| SIFMA | Securities Industry and Financial Markets Association |
| TTFA | Transportation Trust Fund Authority |
Investments in Affiliates
An affiliated investment is an investment in which the Fund owns at least 5% of the outstanding voting shares of the issuer or as a result of other relationships, such as the Fund and the issuer having the same investment manager. Transactions with issuers that were either affiliated persons of the Fund at the beginning of the period or the end of the period were as follows:
| | | | | | | | | | | | | | | | | | | | | | | | | | | | | | | | | | | | |
| | | Shares, beginning of period | | | Shares
purchased | | | Shares
sold | | | Shares,
end of
period | | | Net
realized
gains
(losses) | | | Net
change in
unrealized
gains
(losses) | | | Income
from
affiliated
securities | | | Value,
end
of period | | | % of
net
assets | |
Short-Term Investments | | | | | | | | | | | | | | | | | | | | | | | | | | | | | | | | | | | | |
Investment Companies | | | | | | | | | | | | | | | | | | | | | | | | | | | | | | | | | | | | |
Wells Fargo Municipal Cash Management Money Market Fund Institutional Class | | | 10,597,584 | | | | 518,233,045 | | | | 514,411,560 | | | | 14,419,069 | | | $ | (10,026 | ) | | $ | (172 | ) | | $ | 150,692 | | | $ | 14,424,836 | | | | 0.40 | % |
The accompanying notes are an integral part of these financial statements.
| | | | |
| 38 | | Wells Fargo Municipal Bond Fund | | Statement of assets and liabilities—December 31, 2018 (unaudited) |
| | | | |
| | | | |
| |
Assets | | | | |
Investments in unaffiliated securities, at value (cost $3,481,265,923) | | $ | 3,574,108,598 | |
Investments in affiliated securities, at value (cost $14,424,836) | | | 14,424,836 | |
Cash | | | 2,327,865 | |
Receivable for investments sold | | | 1,140,326 | |
Receivable for Fund shares sold | | | 11,150,747 | |
Receivable for interest | | | 37,060,074 | |
Prepaid expenses and other assets | | | 407,611 | |
| | | | |
Total assets | | | 3,640,620,057 | |
| | | | |
| |
Liabilities | | | | |
Payable for Fund shares redeemed | | | 19,911,199 | |
Dividends payable | | | 1,605,165 | |
Management fee payable | | | 1,003,824 | |
Administration fees payable | | | 350,877 | |
Distribution fee payable | | | 80,304 | |
Trustees’ fees and expenses payable | | | 453 | |
Accrued expenses and other liabilities | | | 593,993 | |
| | | | |
Total liabilities | | | 23,545,815 | |
| | | | |
Total net assets | | $ | 3,617,074,242 | |
| | | | |
| |
NET ASSETS CONSIST OF | | | | |
Paid-in capital | | $ | 3,530,567,248 | |
Total distributable earnings | | | 86,506,994 | |
| | | | |
Total net assets | | $ | 3,617,074,242 | |
| | | | |
| |
COMPUTATION OF NET ASSET VALUE AND OFFERING PRICE PER SHARE | | | | |
Net assets – Class A | | $ | 1,129,800,032 | |
Shares outstanding – Class A1 | | | 110,880,173 | |
Net asset value per share – Class A | | | $10.19 | |
Maximum offering price per share – Class A2 | | | $10.67 | |
Net assets – Class C | | $ | 121,623,930 | |
Shares outstanding – Class C1 | | | 11,939,362 | |
Net asset value per share – Class C | | | $10.19 | |
Net assets – Class R6 | | $ | 43,087,125 | |
Shares outstanding – Class R61 | | | 4,227,984 | |
Net asset value per share – Class R6 | | | $10.19 | |
Net assets – Administrator Class | | $ | 745,550,181 | |
Shares outstanding – Administrator Class1 | | | 73,145,113 | |
Net asset value per share – Administrator Class | | | $10.19 | |
Net assets – Institutional Class | | $ | 1,577,012,974 | |
Shares outstanding – Institutional Class1 | | | 154,788,380 | |
Net asset value per share – Institutional Class | | | $10.19 | |
| 1 | The Fund has an unlimited number of authorized shares. |
| 2 | Maximum offering price is computed as 100/95.50 of net asset value. On investments of $50,000 or more, the offering price is reduced. |
The accompanying notes are an integral part of these financial statements.
| | | | | | |
| Statement of operations—six months ended December 31, 2018 (unaudited) | | Wells Fargo Municipal Bond Fund | | | 39 | |
| | | | |
| | | | |
| |
Investment income | | | | |
Interest | | $ | 60,705,000 | |
Income from affiliated securities | | | 150,692 | |
| | | | |
Total investment income | | | 60,855,692 | |
| | | | |
| |
Expenses | | | | |
Management fee | | | 5,862,466 | |
Administration fees | | | | |
Class A | | | 929,076 | |
Class C | | | 101,908 | |
Class R6 | | | 1,715 | 1 |
Administrator Class | | | 226,710 | |
Institutional Class | | | 602,175 | |
Shareholder servicing fees | | | | |
Class A | | | 1,451,681 | |
Class C | | | 159,231 | |
Administrator Class | | | 566,776 | |
Distribution fee | | | | |
Class C | | | 477,693 | |
Custody and accounting fees | | | 72,199 | |
Professional fees | | | 46,872 | |
Registration fees | | | 77,815 | |
Shareholder report expenses | | | 84,365 | |
Trustees’ fees and expenses | | | 10,427 | |
Other fees and expenses | | | 19,336 | |
| | | | |
Total expenses | | | 10,690,445 | |
Less: Fee waivers and/or expense reimbursements | | | (542,653 | ) |
| | | | |
Net expenses | | | 10,147,792 | |
| | | | |
Net investment income | | | 50,707,900 | |
| | | | |
| |
REALIZED AND UNREALIZED GAINS (LOSSES) ON INVESTMENTS | | | | |
| |
Net realized gains (losses) on: | | | | |
Unaffiliated securities | | | (556,433 | ) |
Affiliated securities | | | (10,026 | ) |
Futures contracts | | | 1,827,864 | |
| | | | |
Net realized gains on investments | | | 1,261,405 | |
| | | | |
| |
Net change in unrealized gains (losses) on: | | | | |
Unaffiliated securities | | | (4,836 | ) |
Affiliated securities | | | (172 | ) |
| | | | |
Net change in unrealized gains (losses) on investments | | | (5,008 | ) |
| | | | |
Net realized and unrealized gains (losses) on investments | | | 1,256,397 | |
| | | | |
Net increase in net assets resulting from operations | | $ | 51,964,297 | |
| | | | |
| 1 | For the period from July 31, 2018 (commencement of class operations) to December 31, 2018 |
The accompanying notes are an integral part of these financial statements.
| | | | |
| 40 | | Wells Fargo Municipal Bond Fund | | Statement of changes in net assets |
| | | | | | | | | | | | | | | | |
| | | Six months ended
December 31, 2018
(unaudited) | | | Year ended
June 30, 20181 | |
| | | | |
Operations | | | | | | | | | | | | | | | | |
Net investment income | | | | | | $ | 50,707,900 | | | | | | | $ | 88,997,373 | |
Net realized gains on investments | | | | | | | 1,261,405 | | | | | | | | 1,726,727 | |
Net change in unrealized gains (losses) on investments | | | | | | | (5,008 | ) | | | | | | | (5,965,184 | ) |
| | | | |
Net increase in net assets resulting from operations | | | | | | | 51,964,297 | | | | | | | | 84,758,916 | |
| | | | |
| | | | |
Distributions to shareholders from net investment income and net realized gains | | | | | | | | | | | | | | | | |
Class A | | | | | | | (17,315,587 | ) | | | | | | | (40,706,034 | ) |
Class C | | | | | | | (1,422,024 | ) | | | | | | | (3,631,086 | ) |
Class R6 | | | | | | | (188,970 | )2 | | | | | | | N/A | |
Administrator Class | | | | | | | (7,128,795 | ) | | | | | | | (4,561,156 | ) |
Institutional Class | | | | | | | (24,660,552 | ) | | | | | | | (46,129,775 | ) |
| | | | |
Total distributions to shareholders | | | | | | | (50,715,928 | ) | | | | | | | (95,028,051 | ) |
| | | | |
| | | | |
Capital share transactions | | | Shares | | | | | | | | Shares | | | | | |
Proceeds from shares sold | | | | | | | | | | | | | | | | |
Class A | | | 3,545,924 | | | | 36,018,277 | | | | 9,607,411 | | | | 98,713,016 | |
Class C | | | 476,964 | | | | 4,839,747 | | | | 1,091,279 | | | | 11,235,517 | |
Class R6 | | | 4,295,038 | 2 | | | 43,224,705 | 2 | | | N/A | | | | N/A | |
Administrator Class | | | 56,541,399 | | | | 569,104,609 | | | | 14,191,031 | | | | 144,623,050 | |
Institutional Class | | | 48,766,675 | | | | 493,888,365 | | | | 56,339,637 | | | | 577,870,177 | |
| | | | |
| | | | |
| | | | | | | 1,147,075,703 | | | | | | | | 832,441,760 | |
| | | | |
Reinvestment of distributions | | | | | | | | | | | | | | | | |
Class A | | | 1,485,440 | | | | 15,063,394 | | | | 3,487,196 | | | | 35,780,840 | |
Class C | | | 125,944 | | | | 1,276,754 | | | | 317,077 | | | | 3,252,773 | |
Administrator Class | | | 669,199 | | | | 6,779,644 | | | | 402,677 | | | | 4,127,649 | |
Institutional Class | | | 1,966,938 | | | | 19,940,385 | | | | 3,728,548 | | | | 38,233,492 | |
| | | | |
| | | | |
| | | | | | | 43,060,177 | | | | | | | | 81,394,754 | |
| | | | |
Payment for shares redeemed | | | | | | | | | | | | | | | | |
Class A | | | (9,711,635 | ) | | | (98,332,898 | ) | | | (18,978,396 | ) | | | (194,665,238 | ) |
Class C | | | (1,647,874 | ) | | | (16,698,099 | ) | | | (2,964,994 | ) | | | (30,428,033 | ) |
Class R6 | | | (67,054 | )2 | | | (680,584 | )2 | | | N/A | | | | N/A | |
Administrator Class | | | (6,306,150 | ) | | | (63,709,286 | ) | | | (2,961,504 | ) | | | (30,373,516 | ) |
Institutional Class | | | (35,604,929 | ) | | | (360,037,031 | ) | | | (32,651,728 | ) | | | (334,789,494 | ) |
| | | | |
| | | | |
| | | | | | | (539,457,898 | ) | | | | | | | (590,256,281 | ) |
| | | | |
Net increase in net assets resulting from capital share transactions | | | | | | | 650,677,982 | | | | | | | | 323,580,233 | |
| | | | |
Total increase in net assets | | | | | | | 651,926,351 | | | | | | | | 313,311,098 | |
| | | | |
| | | | |
Net assets | | | | | | | | | | | | | | | | |
Beginning of period | | | | | | | 2,965,147,891 | | | | | | | | 2,651,836,793 | |
| | | | |
End of period | | | | | | $ | 3,617,074,242 | | | | | | | $ | 2,965,147,891 | |
| | | | |
| 1 | Effective for all filings after November 4, 2018, the SEC prospectively eliminated the requirement to parenthetically disclose undistributed net investment income at the end of the period and permitted the aggregation of distributions, with the exception of tax basis returns of capital. Overdistributed net investment income at June 30, 2018 was $845,178. The disaggregated distributions information for the year ended June 30, 2018 is included in Note 8,Distributions to Shareholders, in the notes to the financial statements. |
| 2 | For the period from July 31, 2018 (commencement of class operations) to December 31, 2018 |
The accompanying notes are an integral part of these financial statements.
| | | | | | |
| Financial highlights | | Wells Fargo Municipal Bond Fund | | | 41 | |
(For a share outstanding throughout each period)
| | | | | | | | | | | | | | | | | | | | | | | | |
| | | Six months ended
December 31, 2018
(unaudited) | | | Year ended June 30 | |
| CLASS A | | 2018 | | | 2017 | | | 2016 | | | 2015 | | | 2014 | |
Net asset value, beginning of period | | | $10.21 | | | | $10.25 | | | | $10.70 | | | | $10.25 | | | | $10.33 | | | | $10.00 | |
Net investment income | | | 0.15 | | | | 0.32 | | | | 0.33 | | | | 0.31 | | | | 0.28 | | | | 0.33 | |
Net realized and unrealized gains (losses) on investments | | | (0.02 | ) | | | (0.02 | ) | | | (0.38 | ) | | | 0.50 | | | | 0.01 | | | | 0.40 | |
| | | | | | | | | | | | | | | | | | | | | | | | |
Total from investment operations | | | 0.13 | | | | 0.30 | | | | (0.05 | ) | | | 0.81 | | | | 0.29 | | | | 0.73 | |
Distributions to shareholders from | | | | | | | | | | | | | | | | | | | | | | | | |
Net investment income | | | (0.15 | ) | | | (0.32 | ) | | | (0.33 | ) | | | (0.31 | ) | | | (0.28 | ) | | | (0.33 | ) |
Net realized gains | | | 0.00 | | | | (0.02 | ) | | | (0.07 | ) | | | (0.05 | ) | | | (0.09 | ) | | | (0.07 | ) |
| | | | | | | | | | | | | | | | | | | | | | | | |
Total distributions to shareholders | | | (0.15 | ) | | | (0.34 | ) | | | (0.40 | ) | | | (0.36 | ) | | | (0.37 | ) | | | (0.40 | ) |
Net asset value, end of period | | | $10.19 | | | | $10.21 | | | | $10.25 | | | | $10.70 | | | | $10.25 | | | | $10.33 | |
Total return1 | | | 1.31 | % | | | 2.97 | % | | | (0.47 | )% | | | 8.04 | % | | | 2.81 | % | | | 7.60 | % |
Ratios to average net assets (annualized) | | | | | | | | | | | | | | | | | | | | | | | | |
Gross expenses | | | 0.79 | % | | | 0.79 | % | | | 0.79 | % | | | 0.79 | % | | | 0.80 | % | | | 0.80 | %2 |
Net expenses | | | 0.75 | % | | | 0.75 | % | | | 0.75 | % | | | 0.75 | % | | | 0.75 | % | | | 0.76 | %2 |
Net investment income | | | 2.98 | % | | | 3.10 | % | | | 3.13 | % | | | 2.99 | % | | | 2.71 | % | | | 3.36 | %2 |
Supplemental data | | | | | | | | | | | | | | | | | | | | | | | | |
Portfolio turnover rate | | | 12 | % | | | 19 | % | | | 24 | % | | | 16 | % | | | 27 | % | | | 37 | % |
Net assets, end of period (000s omitted) | | | $1,129,800 | | | | $1,179,800 | | | | $1,244,267 | | | | $1,529,884 | | | | $1,612,212 | | | | $1,661,362 | |
| 1 | Total return calculations do not include any sales charges. Returns for periods of less than one year are not annualized. |
| 2 | Ratios include 0.01% in interest and fee expense relating to inverse floating-rate obligations. |
The accompanying notes are an integral part of these financial statements.
| | | | |
| 42 | | Wells Fargo Municipal Bond Fund | | Financial highlights |
(For a share outstanding throughout each period)
| | | | | | | | | | | | | | | | | | | | | | | | |
| | | Six months ended
December 31, 2018
(unaudited) | | | Year ended June 30 | |
| CLASS C | | 2018 | | | 2017 | | | 2016 | | | 2015 | | | 2014 | |
Net asset value, beginning of period | | | $10.21 | | | | $10.24 | | | | $10.69 | | | | $10.25 | | | | $10.33 | | | | $10.00 | |
Net investment income | | | 0.11 | | | | 0.24 | | | | 0.25 | | | | 0.23 | | | | 0.20 | | | | 0.26 | |
Net realized and unrealized gains (losses) on investments | | | (0.02 | ) | | | (0.01 | ) | | | (0.38 | ) | | | 0.49 | | | | 0.01 | | | | 0.40 | |
| | | | | | | | | | | | | | | | | | | | | | | | |
Total from investment operations | | | 0.09 | | | | 0.23 | | | | (0.13 | ) | | | 0.72 | | | | 0.21 | | | | 0.66 | |
Distributions to shareholders from | | | | | | | | | | | | | | | | | | | | | | | | |
Net investment income | | | (0.11 | ) | | | (0.24 | ) | | | (0.25 | ) | | | (0.23 | ) | | | (0.20 | ) | | | (0.26 | ) |
Net realized gains | | | 0.00 | | | | (0.02 | ) | | | (0.07 | ) | | | (0.05 | ) | | | (0.09 | ) | | | (0.07 | ) |
| | | | | | | | | | | | | | | | | | | | | | | | |
Total distributions to shareholders | | | (0.11 | ) | | | (0.26 | ) | | | (0.32 | ) | | | (0.28 | ) | | | (0.29 | ) | | | (0.33 | ) |
Net asset value, end of period | | | $10.19 | | | | $10.21 | | | | $10.24 | | | | $10.69 | | | | $10.25 | | | | $10.33 | |
Total return1 | | | 0.93 | % | | | 2.30 | % | | | (1.21 | )% | | | 7.14 | % | | | 2.05 | % | | | 6.80 | % |
Ratios to average net assets (annualized) | | | | | | | | | | | | | | | | | | | | | | | | |
Gross expenses | | | 1.54 | % | | | 1.54 | % | | | 1.54 | % | | | 1.54 | % | | | 1.55 | % | | | 1.55 | %2 |
Net expenses | | | 1.50 | % | | | 1.50 | % | | | 1.50 | % | | | 1.50 | % | | | 1.50 | % | | | 1.51 | %2 |
Net investment income | | | 2.23 | % | | | 2.35 | % | | | 2.38 | % | | | 2.24 | % | | | 1.97 | % | | | 2.60 | %2 |
Supplemental data | | | | | | | | | | | | | | | | | | | | | | | | |
Portfolio turnover rate | | | 12 | % | | | 19 | % | | | 24 | % | | | 16 | % | | | 27 | % | | | 37 | % |
Net assets, end of period (000s omitted) | | | $121,624 | | | | $132,529 | | | | $148,944 | | | | $186,036 | | | | $164,703 | | | | $154,863 | |
| 1 | Total return calculations do not include any sales charges. Returns for periods of less than one year are not annualized. |
| 2 | Ratios include 0.01% in interest and fee expense relating to inverse floating-rate obligations. |
The accompanying notes are an integral part of these financial statements.
| | | | | | |
| Financial highlights | | Wells Fargo Municipal Bond Fund | | | 43 | |
(For a share outstanding throughout the period)
| | | | |
| CLASS R6 | | Period ended
December 31, 2018
(unaudited)1 | |
Net asset value, beginning of period | | | $10.21 | |
Net investment income | | | 0.14 | |
Net realized and unrealized gains (losses) on investments | | | (0.02 | ) |
| | | | |
Total from investment operations | | | 0.12 | |
Distributions to shareholders from | | | | |
Net investment income | | | (0.14 | ) |
Net asset value, end of period | | | $10.19 | |
Total return2 | | | 1.21 | % |
Ratios to average net assets (annualized) | | | | |
Gross expenses | | | 0.41 | % |
Net expenses | | | 0.41 | % |
Net investment income | | | 3.30 | % |
Supplemental data | | | | |
Portfolio turnover rate | | | 12 | % |
Net assets, end of period (000s omitted) | | | $43,087 | |
| 1 | For the period from July 31, 2018 (commencement of class operations) to December 31, 2018. |
| 2 | Returns for periods of less than one year are not annualized. |
The accompanying notes are an integral part of these financial statements.
| | | | |
| 44 | | Wells Fargo Municipal Bond Fund | | Financial highlights |
(For a share outstanding throughout each period)
| | | | | | | | | | | | | | | | | | | | | | | | |
| | | Six months ended
December 31, 2018
(unaudited) | | | Year ended June 30 | |
| ADMINISTRATOR CLASS | | 2018 | | | 2017 | | | 2016 | | | 2015 | | | 2014 | |
Net asset value, beginning of period | | | $10.21 | | | | $10.25 | | | | $10.70 | | | | $10.26 | | | | $10.34 | | | | $10.01 | |
Net investment income | | | 0.16 | 1 | | | 0.33 | 1 | | | 0.34 | | | | 0.33 | | | | 0.30 | | | | 0.35 | |
Net realized and unrealized gains (losses) on investments | | | (0.02 | ) | | | (0.02 | ) | | | (0.38 | ) | | | 0.49 | | | | 0.01 | | | | 0.40 | |
| | | | | | | | | | | | | | | | | | | | | | | | |
Total from investment operations | | | 0.14 | | | | 0.31 | | | | (0.04 | ) | | | 0.82 | | | | 0.31 | | | | 0.75 | |
Distributions to shareholders from | | | | | | | | | | | | | | | | | | | | | | | | |
Net investment income | | | (0.16 | ) | | | (0.33 | ) | | | (0.34 | ) | | | (0.33 | ) | | | (0.30 | ) | | | (0.35 | ) |
Net realized gains | | | 0.00 | | | | (0.02 | ) | | | (0.07 | ) | | | (0.05 | ) | | | (0.09 | ) | | | (0.07 | ) |
| | | | | | | | | | | | | | | | | | | | | | | | |
Total distributions to shareholders | | | (0.16 | ) | | | (0.35 | ) | | | (0.41 | ) | | | (0.38 | ) | | | (0.39 | ) | | | (0.42 | ) |
Net asset value, end of period | | | $10.19 | | | | $10.21 | | | | $10.25 | | | | $10.70 | | | | $10.26 | | | | $10.34 | |
Total return2 | | | 1.39 | % | | | 3.13 | % | | | (0.32 | )% | | | 8.10 | % | | | 2.97 | % | | | 7.75 | % |
Ratios to average net assets (annualized) | | | | | | | | | | | | | | | | | | | | | | | | |
Gross expenses | | | 0.73 | % | | | 0.73 | % | | | 0.73 | % | | | 0.73 | % | | | 0.73 | % | | | 0.74 | %3 |
Net expenses | | | 0.60 | % | | | 0.60 | % | | | 0.60 | % | | | 0.60 | % | | | 0.60 | % | | | 0.61 | %3 |
Net investment income | | | 3.14 | % | | | 3.27 | % | | | 3.18 | % | | | 3.15 | % | | | 2.86 | % | | | 3.49 | %3 |
Supplemental data | | | | | | | | | | | | | | | | | | | | | | | | |
Portfolio turnover rate | | | 12 | % | | | 19 | % | | | 24 | % | | | 16 | % | | | 27 | % | | | 37 | % |
Net assets, end of period (000s omitted) | | | $745,550 | | | | $227,116 | | | | $108,715 | | | | $270,304 | | | | $384,884 | | | | $362,896 | |
| 1 | Calculated based upon average shares outstanding |
| 2 | Returns for periods of less than one year are not annualized. |
| 3 | Ratios include 0.01% in interest and fee expense relating to inverse floating-rate obligations. |
The accompanying notes are an integral part of these financial statements.
| | | | | | |
| Financial highlights | | Wells Fargo Municipal Bond Fund | | | 45 | |
(For a share outstanding throughout each period)
| | | | | | | | | | | | | | | | | | | | | | | | |
| | | Six months ended
December 31, 2018
(unaudited) | | | Year ended June 30 | |
| INSTITUTIONAL CLASS | | 2018 | | | 2017 | | | 2016 | | | 2015 | | | 2014 | |
Net asset value, beginning of period | | | $10.21 | | | | $10.24 | | | | $10.70 | | | | $10.25 | | | | $10.33 | | | | $10.00 | |
Net investment income | | | 0.17 | | | | 0.35 | | | | 0.36 | | | | 0.34 | | | | 0.31 | | | | 0.36 | |
Net realized and unrealized gains (losses) on investments | | | (0.02 | ) | | | (0.01 | ) | | | (0.39 | ) | | | 0.50 | | | | 0.01 | | | | 0.40 | |
| | | | | | | | | | | | | | | | | | | | | | | | |
Total from investment operations | | | 0.15 | | | | 0.34 | | | | (0.03 | ) | | | 0.84 | | | | 0.32 | | | | 0.76 | |
Distributions to shareholders from | | | | | | | | | | | | | | | | | | | | | | | | |
Net investment income | | | (0.17 | ) | | | (0.35 | ) | | | (0.36 | ) | | | (0.34 | ) | | | (0.31 | ) | | | (0.36 | ) |
Net realized gains | | | 0.00 | | | | (0.02 | ) | | | (0.07 | ) | | | (0.05 | ) | | | (0.09 | ) | | | (0.07 | ) |
| | | | | | | | | | | | | | | | | | | | | | | | |
Total distributions to shareholders | | | (0.17 | ) | | | (0.37 | ) | | | (0.43 | ) | | | (0.39 | ) | | | (0.40 | ) | | | (0.43 | ) |
Net asset value, end of period | | | $10.19 | | | | $10.21 | | | | $10.24 | | | | $10.70 | | | | $10.25 | | | | $10.33 | |
Total return1 | | | 1.46 | % | | | 3.37 | % | | | (0.28 | )% | | | 8.35 | % | | | 3.11 | % | | | 7.90 | % |
Ratios to average net assets (annualized) | | | | | | | | | | | | | | | | | | | | | | | | |
Gross expenses | | | 0.46 | % | | | 0.46 | % | | | 0.46 | % | | | 0.46 | % | | | 0.47 | % | | | 0.47 | %2 |
Net expenses | | | 0.46 | % | | | 0.46 | % | | | 0.46 | % | | | 0.46 | % | | | 0.47 | % | | | 0.47 | %2 |
Net investment income | | | 3.28 | % | | | 3.40 | % | | | 3.44 | % | | | 3.27 | % | | | 3.02 | % | | | 3.58 | %2 |
Supplemental data | | | | | | | | | | | | | | | | | | | | | | | | |
Portfolio turnover rate | | | 12 | % | | | 19 | % | | | 24 | % | | | 16 | % | | | 27 | % | | | 37 | % |
Net assets, end of period (000s omitted) | | | $1,577,013 | | | | $1,425,703 | | | | $1,149,911 | | | | $961,289 | | | | $523,736 | | | | $255,112 | |
| 1 | Returns for periods of less than one year are not annualized. |
| 2 | Ratios include 0.01% in interest and fee expense relating to inverse floating-rate obligations. |
The accompanying notes are an integral part of these financial statements.
| | | | |
| 46 | | Wells Fargo Municipal Bond Fund | | Notes to financial statements (unaudited) |
1. ORGANIZATION
Wells Fargo Funds Trust (the “Trust”), a Delaware statutory trust organized on March 10, 1999, is an open-end management investment company registered under the Investment Company Act of 1940, as amended (the “1940 Act”). As an investment company, the Trust follows the accounting and reporting guidance in Financial Accounting Standards Board (“FASB”) Accounting Standards Codification Topic 946, Financial Services – Investment Companies. These financial statements report on the Wells Fargo Municipal Bond Fund (the “Fund”) which is a diversified series of the Trust.
2. SIGNIFICANT ACCOUNTING POLICIES
The following significant accounting policies, which are consistently followed in the preparation of the financial statements of the Fund, are in conformity with U.S. generally accepted accounting principles which require management to make estimates and assumptions that affect the reported amounts of assets and liabilities, disclosure of contingent assets and liabilities at the date of the financial statements, and the reported amounts of revenues and expenses during the reporting period. Actual results could differ from those estimates.
Securities valuation
All investments are valued each business day as of the close of regular trading on the New York Stock Exchange (generally 4 p.m. Eastern Time), although the Fund may deviate from this calculation time under unusual or unexpected circumstances.
Debt securities are valued at the evaluated bid price provided by an independent pricing service (e.g. taking into account various factors, including yields, maturities, or credit ratings) or, if a reliable price is not available, the quoted bid price from an independent broker-dealer.
Futures contracts that are listed on a foreign or domestic exchange or market are valued at the official closing price or, if none, the last sales price.
Investments in registered open-end investment companies are valued at net asset value.
Investments which are not valued using any of the methods discussed above are valued at their fair value, as determined in good faith by the Board of Trustees of the Fund. The Board of Trustees has established a Valuation Committee comprised of the Trustees and has delegated to it the authority to take any actions regarding the valuation of portfolio securities that the Valuation Committee deems necessary or appropriate, including determining the fair value of portfolio securities, unless the determination has been delegated to the Wells Fargo Asset Management Pricing Committee at Wells Fargo Funds Management, LLC (“Funds Management”). The Board of Trustees retains the authority to make or ratify any valuation decisions or approve any changes to the Valuation Procedures as it deems appropriate. On a quarterly basis, the Board of Trustees receives reports on any valuation actions taken by the Valuation Committee or the Wells Fargo Asset Management Pricing Committee which may include items for ratification.
When-issued transactions
The Fund may purchase securities on a forward commitment or when-issued basis. The Fund records a when-issued transaction on the trade date and will segregate assets in an amount at least equal in value to the Fund’s commitment to purchase when-issued securities. Securities purchased on a when-issued basis are marked-to-market daily and the Fund begins earning interest on the settlement date. Losses may arise due to changes in the market value of the underlying securities or if the counterparty does not perform under the contract.
Futures contracts
The Fund is subject to interest rate risk in the normal course of pursuing its investment objectives. Futures contracts are agreements between the Fund and a counterparty to buy or sell a specific amount of a commodity, financial instrument or currency at specified price and on a specified date. The Fund may buy and sell futures contracts in order to gain exposure to, or protect against, changes in interest rates. The primary risks associated with the use of futures contracts are the imperfect correlation between changes in market values of securities held by the Fund and the prices of futures contracts, and the possibility of an illiquid market. Futures contracts are generally entered into on a regulated futures exchange and cleared through a clearinghouse associated with the exchange. With futures contracts, there is minimal counterparty risk to the Fund since futures contracts are exchange traded and the exchange’s clearinghouse, as counterparty to all exchange traded futures, guarantees the futures contracts against default.
Upon entering into a futures contracts, the Fund is required to deposit either cash or securities (initial margin) with the broker in an amount equal to a certain percentage of the contract value. Subsequent payments (variation margin) are paid to or from the broker each day equal to the daily changes in the contract value. Such payments are recorded as
| | | | | | |
| Notes to financial statements (unaudited) | | Wells Fargo Municipal Bond Fund | | | 47 | |
unrealized gains or losses and, if any, shown as variation margin receivable (payable) in the Statement of Assets and Liabilities. Should the Fund fail to make requested variation margin payments, the broker can gain access to the initial margin to satisfy the Fund’s payment obligations. When the contracts are closed, a realized gain or loss is recorded in the Statement of Operations.
Swap contracts
Swap contracts are agreements between the Fund and a counterparty to exchange a series of cash flows over a specified period. Swap agreements are privately negotiated contracts between the Fund and a counterparty in the OTC market and may be entered into as a bilateral contract (“OTC swaps”) or centrally cleared (“centrally cleared swaps”) with a central clearinghouse.
For OTC swaps, any upfront premiums paid and any upfront fees received are shown as swap premiums paid and swap premiums received, respectively, in the Statement of Assets and Liabilities and amortized over the term of the contract. The daily fluctuations in market value are recorded as unrealized gains or losses on OTC swaps in the Statement of Assets and Liabilities. Payments received or paid are recorded in the Statement of Operations as realized gains or losses, respectively. When an OTC swap is terminated, a realized gain or loss is recorded in the Statement of Operations equal to the difference between the proceeds from (or cost of) the closing transaction and the Fund’s basis in the contract, if any. Generally, the basis of the contract is the premium received or paid.
In a centrally cleared swap, immediately following execution of the swap contract, the swap contract is novated to a central counterparty (the “CCP”) and the Fund’s counterparty on the swap agreement becomes the CCP. Upon entering into a centrally cleared swap, the Fund is required to deposit an initial margin with the broker in the form of cash or securities. Securities deposited as initial margin are designated in the Portfolio of Investments and cash deposited is shown as cash segregated for centrally cleared swaps in the Statement of Assets and Liabilities. Pursuant to the contract, the Fund agrees to receive from or pay to the broker an amount of cash equal to the daily fluctuation in market value of the contract (“variation margin”). The variation margin is recorded as an unrealized gain (or loss) and shown as variation margin receivable (or payable) on centrally cleared swaps in the Statement of Assets and Liabilities. Payments received from (paid to) the counterparty, including at termination, are recorded as realized gains (losses) in the Statement of Operations.
Credit default swaps
The Fund is subject to credit risk in the normal course of pursuing its investment objectives. The Fund may enter into credit default swaps for hedging or speculative purposes to provide or receive a measure of protection against default on a referenced entity, obligation or index or a basket of single-name issuers or traded indexes. An index credit default swap references all the names in the index, and if a credit event is triggered, the credit event is settled based on that name’s weight in the index. Credit default swaps are agreements in which the protection buyer pays fixed periodic payments to the protection seller in consideration for a promise from the protection seller to make a specific payment should a negative credit event take place with respect to the referenced entity (e.g., bankruptcy, failure to pay, obligation acceleration, repudiation, moratorium or restructuring).
The Fund may enter into credit default swaps as either the seller of protection or the buyer of protection. If the Fund is the buyer of protection and a credit event occurs, the Fund will either receive from the seller an amount equal to the notional amount of the swap and deliver the referenced security or underlying securities comprising the index, or receive a net settlement of cash equal to the notional amount of the swap less the recovery value of the security or underlying securities comprising the index. If the Fund is the seller of protection and a credit event occurs, the Fund will either pay the buyer an amount equal to the notional amount of the swap and take delivery of the referenced security or underlying securities comprising the index or pay a net settlement of cash equal to the notional amount of the swap less the recovery value of the security or underlying securities comprising the index.
As the seller of protection, the Fund is subject to investment exposure on the notional amount of the swap and has assumed the risk of default of the underlying security or index. As the buyer of protection, the Fund could be exposed to risks if the seller of the protection defaults on its obligation to perform, or if there are unfavorable changes in the fluctuation of interest rates.
Security transactions and income recognition
Securities transactions are recorded on a trade date basis. Realized gains or losses are recorded on the basis of identified cost.
Interest income is accrued daily and bond discounts are accreted and premiums are amortized daily. To the extent debt obligations are placed on non-accrual status, any related interest income may be reduced by writing off interest
| | | | |
| 48 | | Wells Fargo Municipal Bond Fund | | Notes to financial statements (unaudited) |
receivables when the collection of all or a portion of interest has been determined to be doubtful based on consistently applied procedures and the fair value has decreased. If the issuer subsequently resumes interest payments or when the collectability of interest is reasonably assured, the debt obligation is removed from non-accrual status.
Distributions to shareholders
Distributions to shareholders from net investment income are declared daily and paid monthly. Distributions from net realized gains, if any, are recorded on the ex-dividend date and paid at least annually. Such distributions are determined in accordance with income tax regulations and may differ from U.S. generally accepted accounting principles. Dividend sources are estimated at the time of declaration. The tax character of distributions is determined as of the Fund’s fiscal year end. Therefore, a portion of the Fund’s distributions made prior to the Fund’s fiscal year end may be categorized as a tax return of capital at year end.
Federal and other taxes
The Fund intends to continue to qualify as a regulated investment company by distributing substantially all of its investment company taxable and tax-exempt income and any net realized capital gains (after reduction for capital loss carryforwards) sufficient to relieve it from all, or substantially all, federal income taxes. Accordingly, no provision for federal income taxes was required.
The Fund’s income and federal excise tax returns and all financial records supporting those returns for the prior three fiscal years are subject to examination by the federal and Delaware revenue authorities. Management has analyzed the Fund’s tax positions taken on federal, state, and foreign tax returns for all open tax years and does not believe that there are any uncertain tax positions that require recognition of a tax liability.
As of December 31, 2018, the aggregate cost of all investments for federal income tax purposes was $3,494,088,799 and the unrealized gains (losses) consisted of:
| | | | |
| |
Gross unrealized gains | | $ | 106,410,982 | |
| |
Gross unrealized losses | | | (11,966,347 | ) |
| |
Net unrealized gains | | $ | 94,444,635 | |
As of December 31, 2018, the Fund had capital loss carryforwards available to offset future net realized capital gains in the amount of $130,027 which expires in 2019.
As of December 31, 2018, the Fund had current year deferred post-October capital losses consisting of $5,899,085 in net long-term losses which were recognized on the first day of the current fiscal year.
Class allocations
The separate classes of shares offered by the Fund differ principally in applicable sales charges, distribution, shareholder servicing, and administration fees. Class specific expenses are charged directly to that share class. Investment income, common expenses, and realized and unrealized gains (losses) on investments are allocated daily to each class of shares based on the relative proportion of net assets of each class.
3. FAIR VALUATION MEASUREMENTS
Fair value measurements of investments are determined within a framework that has established a fair value hierarchy based upon the various data inputs utilized in determining the value of the Fund’s investments. The three-level hierarchy gives the highest priority to unadjusted quoted prices in active markets for identical assets or liabilities (Level 1) and the lowest priority to unobservable inputs (Level 3). The Fund’s investments are classified within the fair value hierarchy based on the lowest level of input that is significant to the fair value measurement. The inputs are summarized into three broad levels as follows:
| ∎ | | Level 1 – quoted prices in active markets for identical securities |
| ∎ | | Level 2 – other significant observable inputs (including quoted prices for similar securities, interest rates, prepayment speeds, credit risk, etc.) |
| ∎ | | Level 3 – significant unobservable inputs (including the Fund’s own assumptions in determining the fair value of investments) |
The inputs or methodologies used for valuing investments in securities are not necessarily an indication of the risk associated with investing in those securities.
| | | | | | |
| Notes to financial statements (unaudited) | | Wells Fargo Municipal Bond Fund | | | 49 | |
The following is a summary of the inputs used in valuing the Fund’s assets and liabilities as of December 31, 2018:
| | | | | | | | | | | | | | | | |
| | | | |
| | | Quoted prices
(Level 1) | | | Other significant
observable inputs
(Level 2) | | | Significant
unobservable inputs
(Level 3) | | | Total | |
| | | | |
Assets | | | | | | | | | | | | | | | | |
Investments in: | | | | | | | | | | | | | | | | |
| | | | |
Municipal obligations | | $ | 0 | | | $ | 3,572,670,518 | | | $ | 0 | | | $ | 3,572,670,518 | |
| | | | |
Short-term investments | | | | | | | | | | | | | | | | |
| | | | |
Investment companies | | | 14,424,836 | | | | 0 | | | | 0 | | | | 14,424,836 | |
| | | | |
U.S. Treasury securities | | | 1,438,080 | | | | 0 | | | | 0 | | | | 1,438,080 | |
| | | | |
Total assets | | $ | 15,862,916 | | | $ | 3,572,670,518 | | | $ | 0 | | | $ | 3,588,533,434 | |
Additional sector, industry or geographic detail is included in the Portfolio of Investments.
At December 31, 2018, the Fund did not have any transfers into/out of Level 3.
4. TRANSACTIONS WITH AFFILIATES
Management fee
Funds Management, an indirect wholly owned subsidiary of Wells Fargo & Company (“Wells Fargo”), is the manager of the Fund and provides advisory and fund-level administrative services under an investment management agreement. Under the investment management agreement, Funds Management is responsible for, among other services, implementing the investment objectives and strategies of the Fund, supervising the subadviser and providing fund-level administrative services in connection with the Fund’s operations. As compensation for its services under the investment management agreement, Funds Management is entitled to receive an annual management fee starting at 0.40% and declining to 0.28% as the average daily net assets of the Fund increase. For the six months ended December 31, 2018, the management fee was equivalent to an annual rate of 0.36% of the Fund’s average daily net assets.
Funds Management has retained the services of a subadviser to provide daily portfolio management to the Fund. The fee for subadvisory services is borne by Funds Management. Wells Capital Management Incorporated, an affiliate of Funds Management and an indirect wholly owned subsidiary of Wells Fargo, is the subadviser to the Fund and is entitled to receive a fee from Funds Management at an annual rate starting at 0.20% and declining to 0.10% as the average daily net assets of the Fund increase.
Administration fees
Under a class-level administration agreement, Funds Management provides class-level administrative services to the Fund, which includes paying fees and expenses for services provided by the transfer agent, sub-transfer agents, omnibus account servicers and record-keepers. As compensation for its services under the class-level administration agreement, Funds Management receives an annual fee which is calculated based on the average daily net assets of each class as follows:
| | | | |
| | | Class-level
administration fee | |
| |
Class A, Class C | | | 0.16 | % |
| |
Class R6 | | | 0.03 | |
| |
Administrator Class | | | 0.10 | |
| |
Institutional Class | | | 0.08 | |
Funds Management has contractually waived and/or reimbursed management and administration fees to the extent necessary to maintain certain net operating expense ratios for the Fund. When each class of the Fund has exceeded its expense cap, Funds Management has waived fees and/or reimbursed expenses from fund level expenses on a proportionate basis and then from class specific expenses; otherwise, waivers and/or reimbursements are applied against class specific expenses before fund level expenses. Funds Management has committed through October 31, 2019 to waive fees and/or reimburse expenses to the extent necessary to cap the Fund’s expenses at 0.75% for Class A shares, 1.50% for Class C shares, 0.43% for Class R6 shares, 0.60% for Administrator Class shares, and 0.48% for Institutional Class shares. After this time, the cap may be increased or the commitment to maintain the cap may be terminated only with the approval of the Board of Trustees.
| | | | |
| 50 | | Wells Fargo Municipal Bond Fund | | Notes to financial statements (unaudited) |
Distribution fee
The Trust has adopted a distribution plan for Class C shares of the Fund pursuant to Rule 12b-1 under the 1940 Act. A distribution fee is charged to Class C shares and paid to Wells Fargo Funds Distributor, LLC (“Funds Distributor”), the principal underwriter, at an annual rate of 0.75% of the average daily net assets of Class C shares.
In addition, Funds Distributor is entitled to receive the front-end sales charge from the purchase of Class A shares and a contingent deferred sales charge on the redemption of certain Class A shares. Funds Distributor is also entitled to receive the contingent deferred sales charges from redemptions of Class C shares. For the six months ended December 31, 2018, Funds Distributor received $12,041 from the sale of Class A shares and $140 in contingent deferred sales charges from redemptions of Class A shares. No contingent deferred sales were incurred by Class C shares for the six months ended December 31, 2018.
Shareholder servicing fees
The Trust has entered into contracts with one or more shareholder servicing agents, whereby Class A, Class C, and Administrator Class of the Fund are charged a fee at an annual rate of 0.25% of the average daily net assets of each respective class.
A portion of these total shareholder servicing fees were paid to affiliates of Wells Fargo.
Interfund transactions
The Fund may purchase or sell portfolio investment securities to certain other Wells Fargo affiliates pursuant toRule 17a-7 under the 1940 Act and under procedures adopted by the Board of Trustees. The procedures have been designed to ensure that these interfund transactions, which do not incur broker commissions, are effected at current market prices. Pursuant to these procedures, the Fund had $359,675,000 and $191,475,000 in interfund purchases and sales, respectively, during the six months ended December 31, 2018.
5. INVESTMENT PORTFOLIO TRANSACTIONS
Purchases and sales of investments, excluding U.S. government obligations (if any) and short-term securities, for the six months ended December 31, 2018 were $1,096,489,428 and $359,719,144, respectively.
6. DERIVATIVE TRANSACTIONS
During the six months ended December 31, 2018, the Fund entered into futures contracts to take advantage of the differences between municipal and treasury yields and to help manage the duration of the portfolio. The Fund had an average notional amount of $108,276,271 in long futures contracts during the six months ended December 31, 2018.
The fair value, realized gains or losses and change in unrealized gains or losses, if any, on derivative instruments are reflected in the corresponding financial statement captions.
7. BANK BORROWINGS
The Trust (excluding the money market funds), Wells Fargo Master Trust and Wells Fargo Variable Trust are parties to a $280,000,000 revolving credit agreement whereby the Fund is permitted to use bank borrowings for temporary or emergency purposes, such as to fund shareholder redemption requests. Interest under the credit agreement is charged to the Fund based on a borrowing rate equal to the higher of the Federal Funds rate in effect on that day plus 1.25% or the overnight LIBOR rate in effect on that day plus 1.25%. In addition, an annual commitment fee equal to 0.25% of the unused balance is allocated to each participating fund.
For the six months ended December 31, 2018, there were no borrowings by the Fund under the agreement.
8. DISTRIBUTIONS TO SHAREHOLDERS
Effective for all filings after November 4, 2018, the Securities and Exchange Commission eliminated the requirement to separately state the components of distributions to shareholders under U.S. generally accepted accounting principles. The amounts of distributions to shareholders for the year ended June 30, 2018 were as follows:
| | | | | | | | |
| | | Net investment
income | | | Net realized
gains | |
| | |
Class A | | | $37,790,314 | | | | $2,915,720 | |
| | |
Class C | | | 3,290,591 | | | | 340,495 | |
| | |
Administrator Class | | | 4,313,164 | | | | 247,992 | |
| | |
Institutional Class | | | 43,127,825 | | | | 3,001,950 | |
| | | | | | |
| Notes to financial statements (unaudited) | | Wells Fargo Municipal Bond Fund | | | 51 | |
9. INDEMNIFICATION
Under the Trust’s organizational documents, the officers and Trustees have been granted certain indemnification rights against certain liabilities that may arise out of performance of their duties to the Trust. Additionally, in the normal course of business, the Trust may enter into contracts with service providers that contain a variety of indemnification clauses. The Trust’s maximum exposure under these arrangements is dependent on future claims that may be made against the Fund and, therefore, cannot be estimated.
10. NEW ACCOUNTING PRONOUNCEMENT
In August 2018, FASB issued Accounting Standards Update (“ASU”) No. 2018-13, Fair Value Measurement (Topic 820)Disclosure Framework—Changes to the Disclosure Requirements for Fair Value Measurement. ASU 2018-13 updates the disclosure requirements for fair value measurements by modifying or removing certain disclosures and adding certain new disclosures. The amendments are effective for fiscal years, and interim periods within those fiscal years, beginning after December 15, 2019. Early adoption is permitted. Management has adopted the removal and modification of disclosures early, as permitted, and will adopt the additional new disclosures at the effective date.
| | | | |
| 52 | | Wells Fargo Municipal Bond Fund | | Other information (unaudited) |
PROXY VOTING INFORMATION
A description of the policies and procedures used to determine how to vote proxies relating to portfolio securities is available, upon request, by calling1-800-222-8222, visiting our website atwellsfargofunds.com, or visiting the SEC website at sec.gov. Information regarding how the Fund voted proxies relating to portfolio securities during the most recent 12-month period ended June 30 is available on the Fund’s website atwellsfargofunds.comor by visiting the SEC website at sec.gov.
PORTFOLIO HOLDINGS INFORMATION
The complete portfolio holdings for the Fund are publicly available monthly on the Fund’s website (wellsfargofunds.com), on a one-month delayed basis. In addition, top ten holdings information (excluding derivative positions) for the Fund is publicly available on the Fund’s website on a monthly, seven-day or more delayed basis. The Fund files its complete schedule of portfolio holdings with the SEC for the first and third quarters of each fiscal year on Form N-Q, which is available by visiting the SEC website at sec.gov. In addition, the Fund’s Form N-Q may be reviewed and copied at the SEC’s Public Reference Room in Washington, DC, and at regional offices in New York City, at 233 Broadway, and in Chicago, at 175 West Jackson Boulevard, Suite 900. Information about the Public Reference Room may be obtained by calling 1-800-SEC-0330.
| | | | | | |
| Other information (unaudited) | | Wells Fargo Municipal Bond Fund | | | 53 | |
BOARD OF TRUSTEES AND OFFICERS
Each of the Trustees and Officers1 listed in the table below acts in identical capacities for each fund in the Wells Fargo family of funds, which consists of 152 mutual funds comprising the Wells Fargo Funds Trust, Wells Fargo Variable Trust, Wells Fargo Master Trust and four closed-end funds (collectively the “Fund Complex”). This table should be read in conjunction with the Prospectus and the Statement of Additional Information2. The mailing address of each Trustee and Officer is 525 Market Street, 12th Floor, San Francisco, CA 94105. Each Trustee and Officer serves an indefinite term, however, each Trustee serves such term until reaching the mandatory retirement age established by the Trustees.
Independent Trustees
| | | | | | |
Name and
year of birth | | Position held and
length of service* | | Principal occupations during past five years or longer | | Current other
public company or
investment company
directorships |
| | | |
William R. Ebsworth
(Born 1957) | | Trustee, since 2015 | | Retired. From 1984 to 2013, equities analyst, portfolio manager, research director and chief investment officer at Fidelity Management and Research Company in Boston, Tokyo, and Hong Kong, and retired in 2013 as Chief Investment Officer of Fidelity Strategic Advisers, Inc. where he led a team of investment professionals managing client assets. Prior thereto, Board member of Hong Kong Securities Clearing Co., Hong Kong Options Clearing Corp., the Thailand International Fund, Ltd., Fidelity Investments Life Insurance Company, and Empire Fidelity Investments Life Insurance Company. Board member of the Vincent Memorial Hospital Endowment (non-profit organization), where he serves on the Investment Committee and as a Chair of the Audit Committee. Mr. Ebsworth is a CFA® charterholder. | | N/A |
| | | |
Jane A. Freeman
(Born 1953) | | Trustee, since 2015; Chair Liaison, since 2018 | | Retired. From 2012 to 2014 and 1999 to 2008, Chief Financial Officer of Scientific Learning Corporation. From 2008 to 2012, Ms. Freeman provided consulting services related to strategic business projects. Prior to 1999, Portfolio Manager at Rockefeller & Co. and Scudder, Stevens & Clark. Board member of the Harding Loevner Funds from 1996 to 2014, serving as both Lead Independent Director and chair of the Audit Committee. Board member of the Russell Exchange Traded Funds Trust from 2011 to 2012 and the chair of the Audit Committee. Ms. Freeman is a Board Member of The Ruth Bancroft Garden (non-profit organization). She is also an inactive Chartered Financial Analyst. | | N/A |
| | | |
Isaiah Harris, Jr.3
(Born 1952) | | Trustee, since 2009; Audit Committee Chairman, since 2019 | | Retired. Chairman of the Board of CIGNA Corporation since 2009, and Director since 2005. From 2003 to 2011, Director of Deluxe Corporation. Prior thereto, President and CEO of BellSouth Advertising and Publishing Corp. from 2005 to 2007, President and CEO of BellSouth Enterprises from 2004 to 2005 and President of BellSouth Consumer Services from 2000 to 2003. Emeritus member of the Iowa State University Foundation Board of Governors. Emeritus Member of the Advisory Board of Iowa State University School of Business. Advisory Board Member, Palm Harbor Academy (private school). Advisory Board Member, Child Evangelism Fellowship (non-profit). Mr. Harris is a certified public accountant (inactive status). | | CIGNA Corporation |
| | | |
Judith M. Johnson3
(Born 1949) | | Trustee, since 2008; Audit Committee Chairman, from 2009 to 2018 | | Retired. Prior thereto, Chief Executive Officer and Chief Investment Officer of Minneapolis Employees Retirement Fund from 1996 to 2008. Ms. Johnson is an attorney, certified public accountant and a certified managerial accountant. | | N/A |
| | | |
David F. Larcker
(Born 1950) | | Trustee, since 2009 | | James Irvin Miller Professor of Accounting at the Graduate School of Business, Stanford University, Director of the Corporate Governance Research Initiative and Senior Faculty of The Rock Center for Corporate Governance since 2006. From 2005 to 2008, Professor of Accounting at the Graduate School of Business, Stanford University. Prior thereto, Ernst & Young Professor of Accounting at The Wharton School, University of Pennsylvania from 1985 to 2005. | | N/A |
| | | | |
| 54 | | Wells Fargo Municipal Bond Fund | | Other information (unaudited) |
| | | | | | |
Name and
year of birth | | Position held and
length of service* | | Principal occupations during past five years or longer | | Current other
public company or
investment company
directorships |
| | | |
Olivia S. Mitchell
(Born 1953) | | Trustee, since 2006; Nominating and Governance Committee Chairman, since 2018 | | International Foundation of Employee Benefit Plans Professor, Wharton School of the University of Pennsylvania since 1993. Director of Wharton’s Pension Research Council and Boettner Center on Pensions & Retirement Research, and Research Associate at the National Bureau of Economic Research. Previously, Cornell University Professor from 1978 to 1993. | | N/A |
| | | |
Timothy J. Penny
(Born 1951) | | Trustee, since 1996; Chairman, since 2018; Vice Chairman, from 2017 to 2018 | | President and Chief Executive Officer of Southern Minnesota Initiative Foundation, a non-profit organization, since 2007. Member of the Board of Trustees of NorthStar Education Finance, Inc., a non-profit organization, since 2007. | | N/A |
| | | |
James G. Polisson
(Born 1959) | | Trustee, since 2018; Advisory Board Member, from 2017 to 2018 | | Retired. Chief Marketing Officer, Source (ETF) UK Services, Ltd, from 2015 to 2017. From 2012 to 2015, Principal of The Polisson Group, LLC, a management consulting, corporate advisory and principal investing company. Chief Executive Officer and Managing Director at Russell Investments, Global Exchange Traded Funds from 2010 to 2012. Managing Director of Barclays Global Investors from 1998 to 2010 and Global Chief Marketing Officer for iShares and Barclays Global Investors from 2000 to 2010. Trustee of the San Francisco Mechanics’ Institute, a non-profit organization, from 2013 to 2015. Board member of the Russell Exchange Traded Fund Trust from 2011 to 2012. Director of Barclays Global Investors Holdings Deutschland GmbH from 2006 to 2009. Mr. Polisson is an attorney and has a retired status with the Massachusetts and District of Columbia Bar Associations. | | N/A |
| | | |
Michael S. Scofield4
(Born 1943) | | Trustee, since 2010 | | Served on the Investment Company Institute’s Board of Governors and Executive Committee from 2008-2011 as well the Governing Council of the Independent Directors Council from 2006-2011 and the Independent Directors Council Executive Committee from 2008-2011. Trustee of the Evergreen Fund complex (and its predecessors) from 1984 to 2010. Chairman of the Evergreen Funds from 2000-2010. Former Trustee of the Mentor Funds. Retired Attorney, Law Offices of Michael S. Scofield. | | N/A |
| | | |
Pamela Wheelock
(Born 1959) | | Trustee, since 2018; Advisory Board Member, from 2017 to 2018 | | Chief Operating Officer, Twin Cities Habitat for Humanity, since January, 2017. Vice President of University Services, University of Minnesota from 2012 to 2017. Prior thereto, on the Board of Directors, Governance Committee and Finance Committee for the Minnesota Philanthropy Partners (Saint Paul Foundation) from 2012 to 2018, Interim President and Chief Executive Officer of Blue Cross Blue Shield of Minnesota from 2010 to 2011, Chairman of the Board from 2009 to 2011 and Board Director from 2003 to 2015. Vice President, Leadership and Community Engagement, Bush Foundation, Saint Paul, Minnesota (a private foundation) from 2009 to 2011. Executive Vice President and Chief Financial Officer, Minnesota Sports and Entertainment from 2004 to 2009 and Senior Vice President from 2002 to 2004. Commissioner of Finance, State of Minnesota, from 1999 to 2002. Currently the Board Chair of the Minnesota Wild Foundation since 2010. | | N/A |
| * | Length of service dates reflect the Trustee’s commencement of service with the Trust’s predecessor entities, where applicable. |
| | | | | | |
| Other information (unaudited) | | Wells Fargo Municipal Bond Fund | | | 55 | |
Officers
| | | | | | |
Name and
year of birth | | Position held and
length of service | | Principal occupations during past five years or longer | | |
| | | |
Andrew Owen
(Born 1960) | | President, since 2017 | | Executive Vice President of Wells Fargo & Company and Head of Affiliated Managers, Wells Fargo Asset Management, since 2014. In addition, Mr. Owen is currently President, Chief Executive Officer and Director of Wells Fargo Funds Management, LLC since 2017. Prior thereto, Executive Vice President responsible for marketing, investments and product development for Wells Fargo Funds Management, LLC, from 2009 to 2014. | | |
| | | |
Nancy Wiser1
(Born 1967) | | Treasurer, since 2012 | | Executive Vice President of Wells Fargo Funds Management, LLC since 2011. Chief Operating Officer and Chief Compliance Officer at LightBox Capital Management LLC, from 2008 to 2011. | | |
| | | |
Alexander Kymn
(Born 1973) | | Secretary, since 2018; Chief Legal Officer, since 2018 | | Senior Company Counsel of Wells Fargo Bank, N.A. since 2018 (previously Senior Counsel from 2007 to 2018). Vice President of Wells Fargo Funds Management, LLC from 2008 to 2014. | | |
| | | |
Michael H. Whitaker
(Born 1967) | | Chief Compliance Officer, since 2016 | | Senior Vice President and Chief Compliance Officer since 2016. Senior Vice President and Chief Compliance Officer for Fidelity Investments from 2007 to 2016. | | |
| | | |
David Berardi
(Born 1975) | | Assistant Treasurer, since 2009 | | Vice President of Wells Fargo Funds Management, LLC since 2009. Vice President of Evergreen Investment Management Company, LLC from 2008 to 2010. Manager of Fund Reporting and Control for Evergreen Investment Management Company, LLC from 2004 to 2010. | | |
| | | |
Jeremy DePalma1
(Born 1974) | | Assistant Treasurer, since 2009 | | Senior Vice President of Wells Fargo Funds Management, LLC since 2009. Senior Vice President of Evergreen Investment Management Company, LLC from 2008 to 2010 and head of the Fund Reporting and Control Team within Fund Administration from 2005 to 2010. | | |
| 1 | Nancy Wiser acts as Treasurer of 76 funds in the Fund Complex. Jeremy DePalma acts as Treasurer of 76 funds and Assistant Treasurer of 76 funds in the Fund Complex. |
| 2 | The Statement of Additional Information includes additional information about the Trustees and is available, without charge, upon request, by calling1-800-222-8222 or by visiting the website atwellsfargofunds.com. |
| 3 | Mr. Harris replaced Ms. Johnson as the Chairman of the Audit Committee effective January 1, 2019. |
| 4 | Mr. Scofield retired on December 31, 2018. |
| | | | |
| 56 | | Wells Fargo Municipal Bond Fund | | Appendix A (unaudited) |
SALES CHARGE REDUCTIONS AND WAIVERS FOR CERTAIN INTERMEDIARIES
Raymond James & Associates, Inc., Raymond James Financial Services & Raymond James affiliates (“Raymond James”)
Effective on or about March 1, 2019, shareholders purchasing Fund shares through a Raymond James platform or account will be eligible only for the following load waivers (front-end sales charge waivers and contingent deferred, or back-end, sales charge waivers) and discounts, which may differ from those disclosed elsewhere in the Fund’s Prospectus or SAI.
Front-end Sales Load Waivers on Class A shares Available at Raymond James
| | • | | Shares purchased in an investment advisory program. |
| | • | | Shares purchased through reinvestment of capital gains distributions and dividend reinvestment when purchasing shares of the same fund (but not any other fund within the fund family). |
| | • | | Employees and registered representatives of Raymond James or its affiliates and their family members as designated by Raymond James. |
| | • | | Shares purchased from the proceeds of redemptions within the same fund family, provided (1) the repurchase occurs within 90 days following the redemption, (2) the redemption and purchase occur in the same account, and (3) redeemed shares were subject to a front-end or deferred sales load (known as Rights of Reinstatement). |
| | • | | A shareholder in the fund’s Class C shares will have their shares automatically exchanged at net asset value to Class A shares (or the appropriate share class) of the fund if the shares are no longer subject to a CDSC and the exchange is in line with the policies and procedures of Raymond James. |
CDSC Waivers on Class A and C Shares Available at Raymond James
| | • | | Death or disability of the shareholder. |
| | • | | Shares sold as part of a systematic withdrawal plan as described in the Fund’s Prospectus. |
| | • | | Return of excess contributions from an IRA Account. |
| | • | | Shares sold as part of a required minimum distribution for IRA and retirement accounts due to the shareholder reaching age 70½ as described in the Fund’s prospectus. |
| | • | | Shares sold to pay Raymond James fees but only if the transaction is initiated by Raymond James. |
| | • | | Shares acquired through a right of reinstatement. |
Front-end Load Discounts Available at Raymond James: Breakpoints, and/or Rights of Accumulation
| | • | | Breakpoints as described in the Fund’s Prospectus. |
| | • | | Rights of accumulation which entitle shareholders to breakpoint discounts will be automatically calculated based on the aggregated holding of fund family assets held by accounts within the purchaser’s household at Raymond James. Eligible fund family assets not held at Raymond James may be included in the rights of accumulation calculation only if the shareholder notifies his or her financial advisor about such assets. |

For more information
More information about Wells Fargo Funds is available free upon request. To obtain literature, please write, visit the Fund’s website, or call:
Wells Fargo Funds
P.O. Box 219967
Kansas City, MO 64121-9967
Website: wellsfargofunds.com
Individual investors: 1-800-222-8222
Retail investment professionals: 1-888-877-9275
Institutional investment professionals:
1-866-765-0778
This report and the financial statements contained herein are submitted for the general information of the shareholders of the Fund. If this report is used for promotional purposes, distribution of the report must be accompanied or preceded by a current prospectus. Before investing, please consider the investment objectives, risks, charges, and expenses of the investment. For a current prospectus and, if available, a summary prospectus, containing this information, call1-800-222-8222 or visit the Fund’s website atwellsfargofunds.com. Read the prospectus carefully before you invest or send money.
Wells Fargo Asset Management (WFAM) is the trade name for certain investment advisory/management firms owned by Wells Fargo & Company. These firms include but are not limited to Wells Capital Management Incorporated and Wells Fargo Funds Management, LLC. Certain products managed by WFAM entities are distributed by Wells Fargo Funds Distributor, LLC (a broker/dealer and Member FINRA).
This material is for general informational and educational purposes only and is NOT intended to provide investment advice or a recommendation of any kind—including a recommendation for any specific investment, strategy, or plan.
INVESTMENT PRODUCTS: NOT FDIC INSURED ◾ NO BANK GUARANTEE ◾ MAY LOSE VALUE
© 2019 Wells Fargo Funds Management, LLC. All rights reserved.
| | |
 | | 320448 02-19 SA253/SAR253 12-18 |
Semi-Annual Report
December 31, 2018

Wells Fargo North Carolina Tax-Free Fund

Beginning on January 1, 2021, as permitted by new regulations adopted by the Securities and Exchange Commission, paper copies of the Wells Fargo Funds’ annual and semi-annual shareholder reports issued after this date will no longer be sent by mail, unless you specifically request paper copies of the reports. Instead, the reports will be made available on the Funds’ website, and you will be notified by mail each time a report is posted and provided with a website address to access the report.
If you already elected to receive shareholder reports electronically, you will not be affected by this change and you need not take any action. You may elect to receive shareholder reports and other communications from the Fund electronically at any time by contacting your financial intermediary (such as a broker-dealer or bank) or, if you are a direct investor, by calling 1-800-222-8222 or by enrolling at wellsfargo.com/advantagedelivery.
You may elect to receive all future reports in paper free of charge. If you invest through a financial intermediary, you can contact your financial intermediary to request that you continue to receive paper copies of your shareholder reports; if you invest directly with the Fund, you can call 1-800-222-8222. Your election to receive reports in paper will apply to all Wells Fargo Funds held in your account with your financial intermediary or, if you are a direct investor, to all Wells Fargo Funds that you hold.

Reduce clutter. Save trees.
Sign up for electronic delivery of prospectuses and shareholder reports atwellsfargo.com/advantagedelivery
Contents
The views expressed and any forward-looking statements are as of December 31, 2018, unless otherwise noted, and are those of the Fund managers and/or Wells Fargo Funds Management, LLC. Discussions of individual securities, or the markets generally, or any Wells Fargo Fund are not intended as individual recommendations. Future events or results may vary significantly from those expressed in any forward-looking statements. The views expressed are subject to change at any time in response to changing circumstances in the market. Wells Fargo Funds Management, LLC and the Fund disclaim any obligation to publicly update or revise any views expressed or forward-looking statements.
INVESTMENT PRODUCTS: NOT FDIC INSURED ◾ NO BANK GUARANTEE ◾ MAY LOSE VALUE
| | | | |
| 2 | | Wells Fargo North Carolina Tax-Free Fund | | Letter to shareholders (unaudited) |

Andrew Owen
President
Wells Fargo Funds
Global trade tensions escalated during the third quarter of 2018.
Dear Shareholder:
We are pleased to offer you this semi-annual report for the Wells Fargo North Carolina Tax-Free Fund for the six-month period that ended December 31, 2018. During the reporting period, the U.S. generated encouraging economic and business data that was offset by less positive and more inconsistent data from international markets. Investment returns were generally negative as geopolitical tensions and uncertainty tended to distract investors from more favorable underlying trends.
For the period, U.S. stocks, as measured by the S&P 500 Index,1 fell 6.85% and international stocks, as measured by the MSCI ACWI ex USA Index (Net),2 declined 10.84%. Based on the MSCI EM Index (Net),3 emerging market stocks lost 8.48%. For bond investors, the Bloomberg Barclays U.S. Aggregate Bond Index4 gained 1.65% while the Bloomberg Barclays Global Aggregate ex-USD Index5 fell 0.84%. The Bloomberg Barclays Municipal Bond Index6 gained 1.53% while the ICE BofAML U.S. High Yield Index7 declined 2.34%.
Global trade tensions prompted investor concerns.
Global trade tensions escalated during the third quarter of 2018. The U.S. imposed tariffs on a wide range of products manufactured overseas. Foreign governments retaliated with tariffs that punished U.S. commodity producers and product manufacturers. Investors wondered about next steps as divergence in global economic policies and growth prospects widened.
During the summer months, the U.S. economy strengthened. Revised second-quarter gross domestic product (GDP) growth data released in August showed the U.S. economy growing at a 4.2% rate. The unemployment rate in the U.S. was 3.7% by the end of September, according to the U.S. Department of Labor. Wages showed more consistent growth, and consumer confidence remained strong. Several U.S. equity market indices reached records during August, with the S&P 500 Index gaining 7.71% for the three-month period that ended September 30, 2018. In contrast, the MSCI ACWI ex USA Index (Net) gained 0.71% while the MSCI EM Index (Net) declined 1.09% during the same three-month period.
| 1 | The S&P 500 Index consists of 500 stocks chosen for market size, liquidity, and industry group representation. It is a market-value-weighted index with each stock’s weight in the index proportionate to its market value. You cannot invest directly in an index. |
| 2 | The Morgan Stanley Capital International (MSCI) All Country World Index (ACWI) ex USA Index (Net) is a free-float-adjusted market-capitalization-weighted index that is designed to measure the equity market performance of developed markets, excluding the United States and Canada. Source: MSCI. MSCI makes no express or implied warranties or representations and shall have no liability whatsoever with respect to any MSCI data contained herein. The MSCI data may not be further redistributed or used as a basis for other indices or any securities or financial products. This report is not approved, reviewed, or produced by MSCI. You cannot invest directly in an index. |
| 3 | The MSCI Emerging Markets (EM) Index (Net) is a free-float-adjusted market-capitalization-weighted index that is designed to measure large- and mid-cap equity market performance of emerging markets. The MSCI EM Index (Net) consists of the following 24 emerging market country indices: Brazil, Chile, China, Colombia, Czech Republic, Egypt, Greece, Hungary, India, Indonesia, Korea, Malaysia, Mexico, Pakistan, Peru, the Philippines, Poland, Qatar, Russia, South Africa, Taiwan, Thailand, Turkey, and the United Arab Emirates. You cannot invest directly in an index. |
| 4 | The Bloomberg Barclays U.S. Aggregate Bond Index is a broad-based benchmark that measures the investment-grade, U.S. dollar-denominated, fixed-rate taxable bond market, including Treasuries, government-related and corporate securities, mortgage-backed securities (agency fixed-rate and hybrid adjustable-rate mortgage pass-throughs), asset-backed securities, and commercial mortgage-backed securities. You cannot invest directly in an index. |
| 5 | The Bloomberg Barclays Global Aggregate ex-USD Index is an unmanaged index that provides a broad-based measure of the global investment-grade fixed-income markets excluding the U.S. dollar-denominated debt market. You cannot invest directly in an index. |
| 6 | The Bloomberg Barclays Municipal Bond Index is an unmanaged index composed of long-term tax-exempt bonds with a minimum credit rating of Baa. You cannot invest directly in an index. |
| 7 | The ICE BofAML U.S. High Yield Index is a market-capitalization-weighted index of domestic and Yankee high-yield bonds. The index tracks the performance of high-yield securities traded in the U.S. bond market. You cannot invest directly in an index. Copyright 2018. ICE Data Indices, LLC. All rights reserved. |
| | | | | | |
| Letter to shareholders (unaudited) | | Wells Fargo North Carolina Tax-Free Fund | | | 3 | |
Economic signals overseas were mixed as the third quarter ended and the fourth quarter began. In particular, signs of slowing economic growth in China created uncertainty for investors. Amid rising trade tensions, the People’s Bank of China cut reserve requirement ratios and accelerated infrastructure spending and tax cuts for business enterprises and individuals. Nevertheless, a strengthening U.S. dollar and trade tensions remained headwinds for investors overseas.
Equity markets were volatile during the fourth quarter.
Negative stock market performance during October and December bracketed a mildly positive November, as measured by the S&P 500 Index and the MSCI ACWI ex USA Index (Net). As interest rates and bond yields gained during October, stock markets struggled. Readings on consumer sentiment and business spending were mixed. Markets rebounded in November. The U.S. and China agreed to halt further increases in tariffs and engage in additional negotiations. While November returns were positive, the loss for the full fourth quarter was substantial for equity investors globally, with the S&P down 13.52% and the MSCI ACWI ex USA Index (Net) down 11.46%. December’s S&P 500 Index performance was the lowest since 1931. Globally, fixed income investments fared better than stocks during the last two months of the year as conflicting signals unsettled investors’ outlooks.
Equity investors confronted a number of changing conditions. In November’s mid-term elections, control of the U.S. House of Representatives shifted from Republicans to Democrats, presaging potential partisan disputes. Progress on Brexit negotiations stalled in the UK. In China, the value of the yuan declined to low levels last seen in 2008. Oil prices continued to fall. The Fed increased the federal funds rate by 25 bps to a target range of between 2.25% and 2.50% in December 2018. A late-December dispute over spending and immigration policy resulted in a partial U.S. government shutdown that continued through the end of the period.
Don’t let short-term uncertainty derail long-term investment goals.
Periods of investment uncertainty can present challenges, but experience has taught us that maintaining long-term investment goals can be an effective way to plan for the future. To help you create a sound strategy based on your personal goals and risk tolerance, Wells Fargo Funds offers more than 100 mutual funds spanning a wide range of asset classes and investment styles. Although diversification cannot guarantee an investment profit or prevent losses, we believe it can be an effective way to manage investment risk and potentially smooth out overall portfolio performance. We encourage investors to know their investments and to understand that appropriate levels of risk-taking may unlock opportunities.
Thank you for choosing to invest with Wells Fargo Funds. We appreciate your confidence in us and remain committed to helping you meet your financial needs.
Sincerely,

Andrew Owen
President
Wells Fargo Funds
Economic signals overseas were mixed as the third quarter ended and the fourth quarter began.
For further information about your Fund, contact your investment professional, visit our website atwellsfargofunds.com, or call us directly at1-800-222-8222.
| | | | |
| 4 | | Wells Fargo North Carolina Tax-Free Fund | | Performance highlights (unaudited) |
Investment objective
The Fund seeks current income exempt from federal income tax and North Carolina individual income tax.
Manager
Wells Fargo Funds Management, LLC
Subadviser
Wells Capital Management Incorporated
Portfolio managers
Bruce R. Johns
Robert J. Miller
Average annual total returns (%) as of December 31, 20181
| | | | | | | | | | | | | | | | | | | | | | | | | | | | | | | | | | |
| | | | | Including sales charge | | | Excluding sales charge | | | Expense ratios2 (%) | |
| | | Inception date | | 1 year | | | 5 year | | | 10 year | | | 1 year | | | 5 year | | | 10 year | | | Gross | | | Net3 | |
| | | | | | | | | |
| Class A (ENCMX) | | 1-11-1993 | | | -3.42 | | | | 2.15 | | | | 3.90 | | | | 1.14 | | | | 3.10 | | | | 4.38 | | | | 1.01 | | | | 0.85 | |
| | | | | | | | | |
| Class C (ENCCX) | | 3-27-2002 | | | -0.62 | | | | 2.31 | | | | 3.60 | | | | 0.38 | | | | 2.31 | | | | 3.60 | | | | 1.76 | | | | 1.60 | |
| | | | | | | | | |
| Institutional Class (ENCYX) | | 2-28-1994 | | | – | | | | – | | | | – | | | | 1.45 | | | | 3.40 | | | | 4.69 | | | | 0.68 | | | | 0.54 | |
| | | | | | | | | |
| Bloomberg Barclays Municipal Bond Index4 | | – | | | – | | | | – | | | | – | | | | 1.28 | | | | 3.82 | | | | 4.85 | | | | – | | | | – | |
| | | | | | | | | |
| Bloomberg Barclays North Carolina Municipal Bond Index5 | | – | | | – | | | | – | | | | – | | | | 1.31 | | | | 3.16 | | | | 4.18 | | | | – | | | | – | |
Figures quoted represent past performance, which is no guarantee of future results, and do not reflect taxes that a shareholder may pay on fund distributions or the redemption of fund shares. Investment return and principal value of an investment will fluctuate so that an investor’s shares, when redeemed, may be worth more or less than their original cost. Performance shown without sales charges would be lower if sales charges were reflected. Current performance may be lower or higher than the performance data quoted, which assumes the reinvestment of dividends and capital gains. Current month-end performance is available on the Fund’s website,wellsfargofunds.com.
Index returns do not include transaction costs associated with buying and selling securities, any mutual fund fees or expenses, or any taxes. It is not possible to invest directly in an index.
For Class A shares, the maximum front-end sales charge is 4.50%. For Class C shares, the maximum contingent deferred sales charge is 1.00%. Performance including a contingent deferred sales charge assumes the sales charge for the corresponding time period. Institutional Class shares are sold without a front-end sales charge or contingent deferred sales charge.
Bond values fluctuate in response to the financial condition of individual issuers, general market and economic conditions, and changes in interest rates. Changes in market conditions and government policies may lead to periods of heightened volatility in the bond market and reduced liquidity for certain bonds held by the Fund. In general, when interest rates rise, bond values fall and investors may lose principal value. Interest rate changes and their impact on the Fund and its share price can be sudden and unpredictable. The use of derivatives may reduce returns and/or increase volatility. Certain investment strategies tend to increase the total risk of an investment (relative to the broader market). The Fund is exposed to North Carolina municipal securities risk, high-yield securities risk, and non-diversification risk. Consult the Fund’s prospectus for additional information on these and other risks. A portion of the Fund’s income may be subject to federal, state, and/or local income taxes or the Alternative Minimum Tax (AMT). Any capital gains distributions may be taxable.
Please see footnotes on page 5.
| | | | | | |
| Performance highlights (unaudited) | | Wells Fargo North Carolina Tax-Free Fund | | | 5 | |
|
| Effective maturity distribution as of December 31, 20186 |
|
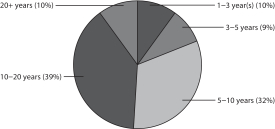 |
|
| Credit quality as of December 31, 20187 |
|
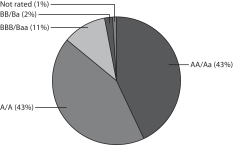 |
| 1 | Historical performance shown for all classes of the Fund prior to July 12, 2010, is based on the performance of the Fund’s predecessor, Evergreen North Carolina Municipal Bond Fund. |
| 2 | Reflects the expense ratios as stated in the most recent prospectuses. The expense ratios shown are subject to change and may differ from the annualized expense ratios shown in the financial highlights of this report. |
| 3 | The manager has contractually committed through October 31, 2019, to waive fees and/or reimburse expenses to the extent necessary to cap the Fund’s Total Annual Fund Operating Expenses After Fee Waivers at the amounts shown. After this time, the cap may be increased or the commitment to maintain the cap may be terminated only with the approval of the Board of Trustees. Brokerage commissions, stamp duty fees, interest, taxes, acquired fund fees and expenses (if any), and extraordinary expenses are excluded from the expense cap. Without this cap, the Fund’s returns would have been lower. The expense ratio paid by an investor is the net expense ratio (the total annual fund operating expenses after fee waivers) as stated in the prospectuses. |
| 4 | The Bloomberg Barclays Municipal Bond Index is an unmanaged index composed of long-term tax-exempt bonds with a minimum credit rating of Baa. You cannot invest directly in an index. |
| 5 | The Bloomberg Barclays North Carolina Municipal Bond Index includes investment-grade, tax-exempt, and fixed-rate bonds issued in the state of North Carolina; all securities have long-term maturities (greater than two years) and are selected from issues larger than $50 million. You cannot invest directly in an index. |
| 6 | Amounts are calculated based on the total long-term investments of the Fund. These amounts are subject to change and may have changed since the date specified. |
| 7 | The credit quality distribution of portfolio holdings reflected in the chart is based on ratings from Standard & Poor’s, Moody’s Investors Service, and/ or Fitch Ratings Ltd. Credit quality ratings apply to the underlying holdings of the Fund and not to the Fund itself. The percentages of the Fund’s portfolio with the ratings depicted in the chart are calculated based on the total market value of fixed income securities held by the Fund. If a security was rated by all three rating agencies, the middle rating was utilized. If rated by two of three rating agencies, the lower rating was utilized, and if rated by one of the rating agencies, that rating was utilized. Standard & Poor’s rates the creditworthiness of bonds, ranging from AAA (highest) to D (lowest). Ratings from A to CCC may be modified by the addition of a plus (+) or minus (-) sign to show relative standing within the rating categories. Standard & Poor’s rates the creditworthiness of short-term notes from SP-1 (highest) to SP-3 (lowest). Moody’s rates the creditworthiness of bonds, ranging from Aaa (highest) to C (lowest). Ratings Aa to B may be modified by the addition of a number 1 (highest) to 3 (lowest) to show relative standing within the ratings categories. Moody’s rates the creditworthiness of short-term U.S. tax-exempt municipal securities from MIG 1/VMIG 1 (highest) to SG (lowest). Fitch rates the creditworthiness of bonds, ranging from AAA (highest) to D (lowest). Credit quality distribution is subject to change and may have changed since the date specified. |
| | | | |
| 6 | | Wells Fargo North Carolina Tax-Free Fund | | Fund expenses (unaudited) |
As a shareholder of the Fund, you incur two types of costs: (1) transaction costs, including sales charges (loads) on purchase payments and contingent deferred sales charges (if any) on redemptions and (2) ongoing costs, including management fees, distribution (12b-1) and/or shareholder servicing fees, and other Fund expenses. This example is intended to help you understand your ongoing costs (in dollars) of investing in the Fund and to compare these costs with the ongoing costs of investing in other mutual funds.
The example is based on an investment of $1,000 invested at the beginning of the six-month period and held for the entire period from July 1, 2018 to December 31, 2018.
Actual expenses
The “Actual” line of the table below provides information about actual account values and actual expenses. You may use the information in this line, together with the amount you invested, to estimate the expenses that you paid over the period. Simply divide your account value by $1,000 (for example, an $8,600 account value divided by $1,000 = 8.6), then multiply the result by the number in the “Actual” line under the heading entitled “Expenses paid during period” for your applicable class of shares to estimate the expenses you paid on your account during this period.
Hypothetical example for comparison purposes
The “Hypothetical” line of the table below provides information about hypothetical account values and hypothetical expenses based on the Fund’s actual expense ratio and an assumed rate of return of 5% per year before expenses, which is not the Fund’s actual return. The hypothetical account values and expenses may not be used to estimate the actual ending account balance or expenses you paid for the period. You may use this information to compare the ongoing costs of investing in the Fund and other funds. To do so, compare this 5% hypothetical example with the 5% hypothetical examples that appear in the shareholder reports of the other funds.
Please note that the expenses shown in the table are meant to highlight your ongoing costs only and do not reflect any transactional costs, such as sales charges (loads) and contingent deferred sales charges. Therefore, the “Hypothetical” line of the table is useful in comparing ongoing costs only and will not help you determine the relative total costs of owning different funds. In addition, if these transactional costs were included, your costs would have been higher.
| | | | | | | | | | | | | | | | |
| | | Beginning
account value
7-1-2018 | | | Ending
account value
12-31-2018 | | | Expenses
paid during
the period¹ | | | Annualized net
expense ratio | |
Class A | | | | | | | | | | | | | | | | |
| | | | |
Actual | | $ | 1,000.00 | | | $ | 1,007.68 | | | $ | 4.30 | | | | 0.85 | % |
| | | | |
Hypothetical (5% return before expenses) | | $ | 1,000.00 | | | $ | 1,020.92 | | | $ | 4.33 | | | | 0.85 | % |
Class C | | | | | | | | | | | | | | | | |
| | | | |
Actual | | $ | 1,000.00 | | | $ | 1,003.89 | | | $ | 8.08 | | | | 1.60 | % |
| | | | |
Hypothetical (5% return before expenses) | | $ | 1,000.00 | | | $ | 1,017.14 | | | $ | 8.13 | | | | 1.60 | % |
Institutional Class | | | | | | | | | | | | | | | | |
| | | | |
Actual | | $ | 1,000.00 | | | $ | 1,009.25 | | | $ | 2.73 | | | | 0.54 | % |
| | | | |
Hypothetical (5% return before expenses) | | $ | 1,000.00 | | | $ | 1,022.48 | | | $ | 2.75 | | | | 0.54 | % |
| 1 | Expenses paid is equal to the annualized net expense ratio of each class multiplied by the average account value over the period, multiplied by the number of days in the most recent fiscal half-year divided by the number of days in the fiscal year (to reflect the one-half-year period). |
| | | | | | |
| Portfolio of investments—December 31, 2018 (unaudited) | | Wells Fargo North Carolina Tax-Free Fund | | | 7 | |
| | | | | | | | | | | | | | | | |
| Security name | | Interest rate | | | Maturity date | | | Principal | | | Value | |
| | | | |
Municipal Obligations: 97.07% | | | | | | | | | | | | | | | | |
| | | | |
Guam: 2.88% | | | | | | | | | | | | | | | | |
| | | | |
| Airport Revenue: 0.96% | | | | | | | | | | | | | | | | |
| | | | |
Guam Port Authority Series B | | | 5.00 | % | | | 7-1-2030 | | | $ | 500,000 | | | $ | 551,220 | |
| | | | | | | | | | | | | | | | |
| | | | |
| Water & Sewer Revenue: 1.92% | | | | | | | | | | | | | | | | |
| | | | |
Guam Government Waterworks Authority Series 2013 | | | 5.25 | | | | 7-1-2023 | | | | 1,000,000 | | | | 1,101,460 | |
| | | | | | | | | | | | | | | | |
| | | | |
| | | | | | | | | | | | | | | 1,652,680 | |
| | | | | | | | | | | | | | | | |
| | | | |
Indiana: 1.96% | | | | | | | | | | | | | | | | |
| | | | |
| Water & Sewer Revenue: 1.96% | | | | | | | | | | | | | | | | |
| | | | |
Indiana Finance Authority First Lien Wastewater Utility Clean Water Project Series A | | | 5.00 | | | | 10-1-2031 | | | | 1,000,000 | | | | 1,126,690 | |
| | | | | | | | | | | | | | | | |
| | | | |
New York: 2.79% | | | | | | | | | | | | | | | | |
| | | | |
| Tax Revenue: 2.79% | | | | | | | | | | | | | | | | |
| | | | |
New York Dormitory Authority Personal Income Tax Series B | | | 5.00 | | | | 3-15-2042 | | | | 1,500,000 | | | | 1,601,700 | |
| | | | | | | | | | | | | | | | |
| | | | |
North Carolina: 83.69% | | | | | | | | | | | | | | | | |
| | | | |
| Airport Revenue: 18.21% | | | | | | | | | | | | | | | | |
| | | | |
Charlotte NC Airport Series A | | | 5.50 | | | | 7-1-2034 | | | | 2,500,000 | | | | 2,633,875 | |
| | | | |
Charlotte NC AMT Series B | | | 5.00 | | | | 7-1-2020 | | | | 1,480,000 | | | | 1,543,936 | |
| | | | |
Charlotte NC AMT Series B | | | 5.50 | | | | 7-1-2024 | | | | 810,000 | | | | 850,921 | |
| | | | |
Charlotte NC Douglas Airport Series A | | | 5.00 | | | | 7-1-2025 | | | | 1,645,000 | | | | 1,762,831 | |
| | | | |
North Carolina Port Authority Series B | | | 5.00 | | | | 2-1-2025 | | | | 3,540,000 | | | | 3,660,325 | |
| | | | |
| | | | | | | | | | | | | | | 10,451,888 | |
| | | | | | | | | | | | | | | | |
| | | | |
| Education Revenue: 11.24% | | | | | | | | | | | | | | | | |
| | | | |
North Carolina Capital Facilities Finance Agency Forest University Series 2016 | | | 5.00 | | | | 1-1-2033 | | | | 1,000,000 | | | | 1,153,640 | |
| | | | |
North Carolina Capital Facilities Finance Agency Meredith College Series 2018 | | | 5.00 | | | | 6-1-2038 | | | | 500,000 | | | | 538,755 | |
| | | | |
University of North Carolina at Ashville Series 2017 | | | 5.00 | | | | 6-1-2042 | | | | 625,000 | | | | 691,300 | |
| | | | |
University of North Carolina at Greensboro Series 2014 | | | 5.00 | | | | 4-1-2033 | | | | 2,000,000 | | | | 2,252,640 | |
| | | | |
University of North Carolina at Greensboro Series 2014 | | | 5.00 | | | | 4-1-2039 | | | | 1,620,000 | | | | 1,813,622 | |
| | | | |
| | | | | | | | | | | | | | | 6,449,957 | |
| | | | | | | | | | | | | | | | |
| | | | |
| Health Revenue: 20.43% | | | | | | | | | | | | | | | | |
| | | | |
Charlotte Mecklenburg Hospital Authority Health Care Refunding Bonds Series 2018 | | | 5.00 | | | | 1-15-2036 | | | | 500,000 | | | | 574,860 | |
| | | | |
New Hanover County NC New Hanover Regional Medical Center | | | 5.00 | | | | 10-1-2047 | | | | 1,000,000 | | | | 1,102,600 | |
| | | | |
New Hanover County NC New Hanover Regional Medical Center Series 2011 | | | 5.00 | | | | 10-1-2028 | | | | 3,000,000 | | | | 3,214,140 | |
| | | | |
North Carolina Medical Care Commission Baptist Hospital Project Series 2017 | | | 5.25 | | | | 6-1-2029 | | | | 2,000,000 | | | | 2,087,680 | |
| | | | |
North Carolina Medical Care Commission Deerfield Episcopal Retirement Community Project Series 2016 | | | 5.00 | | | | 11-1-2031 | | | | 1,500,000 | | | | 1,686,690 | |
| | | | |
North Carolina Medical Care Commission Presbyterian Homes Project Series 2016C | | | 4.00 | | | | 10-1-2031 | | | | 1,500,000 | | | | 1,585,905 | |
| | | | |
North Carolina Medical Care Commission Southeastern Regional Medical Center Series 2012 | | | 5.00 | | | | 6-1-2026 | | | | 385,000 | | | | 419,304 | |
| | | | |
North Carolina Medical Care Commission Southeastern Regional Medical Center Series 2012 | | | 5.00 | | | | 6-1-2032 | | | | 500,000 | | | | 538,750 | |
| | | | |
North Carolina Medical Care Commission Southminster Series 2016 | | | 5.00 | | | | 10-1-2037 | | | | 500,000 | | | | 514,515 | |
| | | | |
| | | | | | | | | | | | | | | 11,724,444 | |
| | | | | | | | | | | | | | | | |
| | | | |
| Housing Revenue: 5.30% | | | | | | | | | | | | | | | | |
| | | | |
North Carolina Facilities Finance Agency Series 2015A (AGC Insured) | | | 5.00 | | | | 6-1-2027 | | | | 1,000,000 | | | | 1,133,290 | |
| | | | |
North Carolina Facilities Finance Agency The Arc of North Carolina Project Series 2017A (HUD Insured) | | | 5.00 | | | | 10-1-2034 | | | | 1,000,000 | | | | 1,100,230 | |
| | | | |
North Carolina HFA Series 2 | | | 4.25 | | | | 1-1-2028 | | | | 795,000 | | | | 807,227 | |
| | | | |
| | | | | | | | | | | | | | | 3,040,747 | |
| | | | | | | | | | | | | | | | |
The accompanying notes are an integral part of these financial statements.
| | | | |
| 8 | | Wells Fargo North Carolina Tax-Free Fund | | Portfolio of investments—December 31, 2018 (unaudited) |
| | | | | | | | | | | | | | | | |
| Security name | | Interest rate | | | Maturity date | | | Principal | | | Value | |
| | | | |
| Miscellaneous Revenue: 20.28% | | | | | | | | | | | | | | | | |
| | | | |
Cabarrus County NC Limited Obligation Installment Financing Contract Series 2017 | | | 5.00 | % | | | 6-1-2031 | | | $ | 500,000 | | | $ | 588,470 | |
| | | | |
Charlotte NC Certificate of Participation Series A | | | 5.00 | | | | 12-1-2026 | | | | 1,160,000 | | | | 1,255,862 | |
| | | | |
Charlotte NC Certificate of Participation Series A | | | 5.00 | | | | 6-1-2030 | | | | 1,000,000 | | | | 1,112,180 | |
| | | | |
Charlotte NC Certificate of Participation Series E | | | 5.00 | | | | 6-1-2023 | | | | 3,650,000 | | | | 3,695,881 | |
| | | | |
Cumberland County NC Limited Obligation Series B | | | 5.00 | | | | 11-1-2025 | | | | 1,000,000 | | | | 1,104,180 | |
| | | | |
Cumberland County NC Limited Obligation Series B | | | 5.00 | | | | 11-1-2026 | | | | 1,000,000 | | | | 1,104,180 | |
| | | | |
Henderson County NC Limited Obligation Series A | | | 5.00 | | | | 10-1-2030 | | | | 500,000 | | | | 577,970 | |
| | | | |
Orange County NC Limited Obligation Series 2018 | | | 5.00 | | | | 10-1-2032 | | | | 215,000 | | | | 258,338 | |
| | | | |
Orange County NC Limited Obligation Series 2018 | | | 5.00 | | | | 10-1-2033 | | | | 220,000 | | | | 263,091 | |
| | | | |
Orange County NC Limited Obligation Series 2018 | | | 5.00 | | | | 10-1-2034 | | | | 65,000 | | | | 77,119 | |
| | | | |
Raleigh NC Limited Obligation Series A | | | 5.00 | | | | 10-1-2033 | | | | 1,000,000 | | | | 1,133,540 | |
| | | | |
Wilmington NC Limited Obligation Series A | | | 5.00 | | | | 6-1-2030 | | | | 400,000 | | | | 465,788 | |
| | | | |
| | | | | | | | | | | | | | | 11,636,599 | |
| | | | | | | | | | | | | | | | |
| | | | |
| Transportation Revenue: 3.35% | | | | | | | | | | | | | | | | |
| | | | |
North Carolina Department of Transportation I-77 Hot Lanes Project Series 2015 | | | 5.00 | | | | 6-30-2028 | | | | 1,275,000 | | | | 1,387,519 | |
| | | | |
North Carolina Turnpike Authority Monroe Expressway Toll Revenue Bonds Series 2016A | | | 5.00 | | | | 7-1-2042 | | | | 500,000 | | | | 535,445 | |
| | | | |
| | | | | | | | | | | | | | | 1,922,964 | |
| | | | | | | | | | | | | | | | |
| | | | |
| Utilities Revenue: 4.88% | | | | | | | | | | | | | | | | |
| | | | |
North Carolina Municipal Power Agency #1 Catawba Nuclear Power Project Series A | | | 5.00 | | | | 1-1-2021 | | | | 2,720,000 | | | | 2,802,117 | |
| | | | | | | | | | | | | | | | |
| | | | |
| | | | | | | | | | | | | | | 48,028,716 | |
| | | | | | | | | | | | | | | | |
| | | | |
Tennessee: 3.85% | | | | | | | | | | | | | | | | |
| | | | |
| Utilities Revenue: 3.85% | | | | | | | | | | | | | | | | |
| | | | |
Tennessee Energy Acquisition Corporation Series A | | | 5.25 | | | | 9-1-2026 | | | | 1,020,000 | | | | 1,158,057 | |
| | | | |
Tennessee Energy Acquisition Corporation Series C | | | 5.00 | | | | 2-1-2021 | | | | 1,000,000 | | | | 1,049,250 | |
| | | | |
| | | | | | | | | | | | | | | 2,207,307 | |
| | | | | | | | | | | | | | | | |
| | | | |
Wisconsin: 1.90% | | | | | | | | | | | | | | | | |
| | | | |
| Education Revenue: 1.90% | | | | | | | | | | | | | | | | |
| | | | |
Wisconsin PFA Carolina International School Series A 144A | | | 6.75 | | | | 8-1-2033 | | | | 1,000,000 | | | | 1,093,400 | |
| | | | | | | | | | | | | | | | |
| | | | |
Total Municipal Obligations (Cost $54,135,856) | | | | | | | | | | | | | | | 55,710,493 | |
| | | | | | | | | | | | | | | | |
| | | | |
| | | Yield | | | | | | Shares | | | | |
| Short-Term Investments: 1.54% | | | | | | | | | | | | | | | | |
| | | | |
| Investment Companies: 1.54% | | | | | | | | | | | | | | | | |
| | | | |
Wells Fargo Municipal Cash Management Money Market Fund Institutional Class (l)(u) | | | 1.65 | | | | | | | | 882,277 | | | | 882,629 | |
| | | | | | | | | | | | | | | | |
| | | | |
Total Short-Term Investments (Cost $882,629) | | | | | | | | | | | | | | | 882,629 | |
| | | | | | | | | | | | | | | | |
| | | | | | | | |
| Total investments in securities (Cost $55,018,485) | | | 98.61 | % | | | 56,593,122 | |
| | |
Other assets and liabilities, net | | | 1.39 | | | | 798,613 | |
| | | | | | | | |
| Total net assets | | | 100.00 | % | | $ | 57,391,735 | |
| | | | | | | | |
The accompanying notes are an integral part of these financial statements.
| | | | | | |
| Portfolio of investments—December 31, 2018 (unaudited) | | Wells Fargo North Carolina Tax-Free Fund | | | 9 | |
| 144A | The security may be resold in transactions exempt from registration, normally to qualified institutional buyers, pursuant to Rule 144A under the Securities Act of 1933. |
| (l) | The issuer of the security is an affiliated person of the Fund as defined in the Investment Company Act of 1940. |
| (u) | The rate represents the 7-day annualized yield at period end. |
Abbreviations:
| AGC | Assured Guaranty Corporation |
| AMT | Alternative minimum tax |
| HFA | Housing Finance Authority |
| HUD | Department of Housing and Urban Development |
| PFA | Public Finance Authority |
Investments in Affiliates
An affiliated investment is an investment in which the Fund owns at least 5% of the outstanding voting shares of the issuer or as a result of other relationships, such as the Fund and the issuer having the same investment manager. Transactions with issuers that were either affiliated persons of the Fund at the beginning of the period or the end of the period were as follows:
| | | | | | | | | | | | | | | | | | | | | | | | | | | | | | | | | | | | |
| | | Shares,
beginning of
period | | | Shares
purchased | | | Shares
sold | | | Shares,
end of
period | | | Net
realized
gains | | | Net
change in
unrealized
gains | | | Income
from
affiliated
securities | | | Value,
end
of period | | | % of
net
assets | |
Short-Term Investments | | | | | | | | | | | | | | | | | | | | | | | | | | | | | | | | | | | | |
Investment Companies | | | | | | | | | | | | | | | | | | | | | | | | | | | | | | | | | | | | |
Wells Fargo Municipal Cash Management Money Market Fund Institutional Class | | | 130,501 | | | | 7,150,826 | | | | 6,399,050 | | | | 882,277 | | | $ | (354 | ) | | $ | 0 | | | $ | 3,276 | | | $ | 882,629 | | | | 1.54 | % |
The accompanying notes are an integral part of these financial statements.
| | | | |
| 10 | | Wells Fargo North Carolina Tax-Free Fund | | Statement of assets and liabilities—December 31, 2018 (unaudited) |
| | | | |
| | | | |
| |
Assets | | | | |
Investments in unaffiliated securities, at value (cost $54,135,856) | | $ | 55,710,493 | |
Investments in affiliated securities, at value (cost $882,629) | | | 882,629 | |
Receivable for investments sold | | | 145,000 | |
Receivable for Fund shares sold | | | 1,557 | |
Receivable for interest | | | 758,177 | |
Prepaid expenses and other assets | | | 53,847 | |
| | | | |
Total assets | | | 57,551,703 | |
| | | | |
| |
Liabilities | | | | |
Payable for Fund shares redeemed | | | 55,185 | |
Dividends payable | | | 49,698 | |
Due to custodian bank | | | 10,948 | |
Professional fees payable | | | 10,261 | |
Management fee payable | | | 6,707 | |
Administration fee payable | | | 6,081 | |
Distribution fee payable | | | 1,866 | |
Trustees’ fees and expenses payable | | | 753 | |
Accrued expenses and other liabilities | | | 18,469 | |
| | | | |
Total liabilities | | | 159,968 | |
| | | | |
Total net assets | | $ | 57,391,735 | |
| | | | |
| |
NET ASSETS CONSIST OF | | | | |
Paid-in capital | | $ | 55,947,679 | |
Total distributable earnings | | | 1,444,056 | |
| | | | |
Total net assets | | $ | 57,391,735 | |
| | | | |
| |
COMPUTATION OF NET ASSET VALUE AND OFFERING PRICE PER SHARE | | | | |
Net assets – Class A | | $ | 24,866,518 | |
Shares outstanding – Class A1 | | | 2,492,445 | |
Net asset value per share – Class A | | | $9.98 | |
Maximum offering price per share – Class A2 | | | $10.45 | |
Net assets – Class C | | $ | 2,839,140 | |
Shares outstanding – Class C1 | | | 284,596 | |
Net asset value per share – Class C | | | $9.98 | |
Net assets – Institutional Class | | $ | 29,686,077 | |
Shares outstanding – Institutional Class1 | | | 2,975,501 | |
Net asset value per share – Institutional Class | | | $9.98 | |
| 1 | The Fund has an unlimited number of authorized shares. |
| 2 | Maximum offering price is computed as 100/95.50 of net asset value. On investments of $50,000 or more, the offering price is reduced. |
The accompanying notes are an integral part of these financial statements.
| | | | | | |
| Statement of operations—six months ended December 31, 2018 (unaudited) | | Wells Fargo North Carolina Tax-Free Fund | | | 11 | |
| | | | |
| | | | |
| |
Investment income | | | | |
Interest | | $ | 1,177,925 | |
Income from affiliated securities | | | 3,276 | |
| | | | |
Total investment income | | | 1,181,201 | |
| | | | |
| |
Expenses | | | | |
Management fee | | | 125,843 | |
Administration fees | | | | |
Class A | | | 21,253 | |
Class C | | | 2,491 | |
Institutional Class | | | 13,297 | |
Shareholder servicing fees | | | | |
Class A | | | 33,208 | |
Class C | | | 3,892 | |
Distribution fee | | | | |
Class C | | | 11,676 | |
Custody and accounting fees | | | 3,739 | |
Professional fees | | | 25,080 | |
Registration fees | | | 36,370 | |
Shareholder report expenses | | | 13,257 | |
Trustees’ fees and expenses | | | 10,629 | |
Other fees and expenses | | | 4,634 | |
| | | | |
Total expenses | | | 305,369 | |
Less: Fee waivers and/or expense reimbursements | | | (77,800 | ) |
| | | | |
Net expenses | | | 227,569 | |
| | | | |
Net investment income | | | 953,632 | |
| | | | |
| |
REALIZED AND UNREALIZED GAINS (LOSSES) ON INVESTMENTS | | | | |
| |
| Net realized gains (losses) on: | | | | |
Unaffiliated securities | | | 87,013 | |
Affiliated securities | | | (354 | ) |
| | | | |
Net realized gains on investments | | | 86,659 | |
Net change in unrealized gains (losses) on investments | | | (571,985 | ) |
| | | | |
Net realized and unrealized gains (losses) on investments | | | (485,326 | ) |
| | | | |
Net increase in net assets resulting from operations | | $ | 468,306 | |
| | | | |
The accompanying notes are an integral part of these financial statements.
| | | | |
| 12 | | Wells Fargo North Carolina Tax-Free Fund | | Statement of changes in net assets |
| | | | | | | | | | | | | | | | |
| | | Six months ended
December 31, 2018
(unaudited) | | | Year ended
June 30, 20181 | |
| | | |
Operations | | | | | | | | | | | | |
Net investment income | | | | | | $ | 953,632 | | | | | | | $ | 2,056,460 | |
Net realized gains on investments | | | | | | | 86,659 | | | | | | | | 168,714 | |
Net change in unrealized gains (losses) on investments | | | | | | | (571,985 | ) | | | | | | | (1,106,887 | ) |
| | | | |
Net increase in net assets resulting from operations | | | | | | | 468,306 | | | | | | | | 1,118,287 | |
| | | | |
| | | |
Distributions to shareholders from net investment income and net realized gains | | | | | | | | | | | | |
Class A | | | | | | | (386,063 | ) | | | | | | | (820,342 | ) |
Class C | | | | | | | (33,578 | ) | | | | | | | (87,164 | ) |
Institutional Class | | | | | | | (534,000 | ) | | | | | | | (1,148,953 | ) |
| | | | |
Total distributions to shareholders | | | | | | | (953,641 | ) | | | | | | | (2,056,459 | ) |
| | | | |
| | | | |
Capital share transactions | | | Shares | | | | | | | | Shares | | | | | |
Proceeds from shares sold | | | | | | | | | | | | | | | | |
Class A | | | 75,756 | | | | 758,589 | | | | 93,001 | | | | 939,364 | |
Class C | | | 12,665 | | | | 125,686 | | | | 22,773 | | | | 232,140 | |
Institutional Class | | | 167,100 | | | | 1,662,138 | | | | 277,422 | | | | 2,801,086 | |
| | | | |
| | | | |
| | | | | | | 2,546,413 | | | | | | | | 3,972,590 | |
| | | | |
Reinvestment of distributions | | | | | | | | | | | | | | | | |
Class A | | | 37,602 | | | | 374,760 | | | | 77,623 | | | | 785,225 | |
Class C | | | 3,084 | | | | 30,741 | | | | 8,078 | | | | 81,751 | |
Institutional Class | | | 21,951 | | | | 218,781 | | | | 44,047 | | | | 445,532 | |
| | | | |
| | | | |
| | | | | | | 624,282 | | | | | | | | 1,312,508 | |
| | | | |
Payment for shares redeemed | | | | | | | | | | | | | | | | |
Class A | | | (331,621 | ) | | | (3,298,805 | ) | | | (474,571 | ) | | | (4,796,525 | ) |
Class C | | | (57,660 | ) | | | (572,159 | ) | | | (192,691 | ) | | | (1,951,128 | ) |
Institutional Class | | | (672,037 | ) | | | (6,694,035 | ) | | | (730,480 | ) | | | (7,407,625 | ) |
| | | | |
| | | | |
| | | | | | | (10,564,999 | ) | | | | | | | (14,155,278 | ) |
| | | | |
Net decrease in net assets resulting from capital share transactions | | | | | | | (7,394,304 | ) | | | | | | | (8,870,180 | ) |
| | | | |
Total decrease in net assets | | | | | | | (7,879,639 | ) | | | | | | | (9,808,352 | ) |
| | | | |
| | |
Net assets | | | | | | | | |
Beginning of period | | | | | | | 65,271,374 | | | | | | | | 75,079,726 | |
| | | | |
End of period | | | | | | $ | 57,391,735 | | | | | | | $ | 65,271,374 | |
| | | | |
| 1 | Effective for all filings after November 4, 2018, the SEC prospectively eliminated the requirement to parenthetically disclose undistributed net investment income at the end of the period and permitted the aggregation of distributions, with the exception of tax basis returns of capital. Overdistributed net investment income at June 30, 2018 was $59,560. The disaggregated distributions information for the year ended June 30, 2018 is included in Note 7,Distributions to Shareholders, in the notes to the financial statements. |
The accompanying notes are an integral part of these financial statements.
| | | | | | |
| Financial highlights | | Wells Fargo North Carolina Tax-Free Fund | | | 13 | |
(For a share outstanding throughout each period)
| | | | | | | | | | | | | | | | | | | | | | | | |
| | | Six months ended
December 31, 2018
(unaudited) | | | Year ended June 30 | |
| CLASS A | | 2018 | | | 2017 | | | 2016 | | | 2015 | | | 2014 | |
Net asset value, beginning of period | | | $10.05 | | | | $10.19 | | | | $10.60 | | | | $10.36 | | | | $10.33 | | | | $10.08 | |
Net investment income | | | 0.15 | | | | 0.29 | | | | 0.30 | | | | 0.31 | | | | 0.32 | | | | 0.33 | |
Net realized and unrealized gains (losses) on investments | | | (0.07 | ) | | | (0.14 | ) | | | (0.41 | ) | | | 0.24 | | | | 0.03 | | | | 0.25 | |
| | | | | | | | | | | | | | | | | | | | | | | | |
Total from investment operations | | | 0.08 | | | | 0.15 | | | | (0.11 | ) | | | 0.55 | | | | 0.35 | | | | 0.58 | |
Distributions to shareholders from | | | | | | | | | | | | | | | | | | | | | | | | |
Net investment income | | | (0.15 | ) | | | (0.29 | ) | | | (0.30 | ) | | | (0.31 | ) | | | (0.32 | ) | | | (0.33 | ) |
Net asset value, end of period | | | $9.98 | | | | $10.05 | | | | $10.19 | | | | $10.60 | | | | $10.36 | | | | $10.33 | |
Total return1 | | | 0.77 | % | | | 1.46 | % | | | (1.03 | )% | | | 5.43 | % | | | 3.35 | % | | | 5.92 | % |
Ratios to average net assets (annualized) | | | | | | | | | | | | | | | | | | | | | | | | |
Gross expenses | | | 1.11 | % | | | 1.01 | % | | | 0.97 | % | | | 0.96 | % | | | 0.94 | % | | | 0.94 | % |
Net expenses | | | 0.85 | % | | | 0.85 | % | | | 0.85 | % | | | 0.85 | % | | | 0.85 | % | | | 0.85 | % |
Net investment income | | | 2.91 | % | | | 2.83 | % | | | 2.91 | % | | | 3.00 | % | | | 3.01 | % | | | 3.32 | % |
Supplemental data | | | | | | | | | | | | | | | | | | | | | | | | |
Portfolio turnover rate | | | 5 | % | | | 5 | % | | | 11 | % | | | 7 | % | | | 12 | % | | | 15 | % |
Net assets, end of period (000s omitted) | | | $24,867 | | | | $27,239 | | | | $30,710 | | | | $36,890 | | | | $33,969 | | | | $37,067 | |
| 1 | Total return calculations do not include any sales charges. Returns for periods of less than one year are not annualized. |
The accompanying notes are an integral part of these financial statements.
| | | | |
| 14 | | Wells Fargo North Carolina Tax-Free Fund | | Financial highlights |
(For a share outstanding throughout each period)
| | | | | | | | | | | | | | | | | | | | | | | | |
| | | Six months ended
December 31, 2018
(unaudited) | | | Year ended June 30 | |
| CLASS C | | 2018 | | | 2017 | | | 2016 | | | 2015 | | | 2014 | |
Net asset value, beginning of period | | | $10.05 | | | | $10.19 | | | | $10.60 | | | | $10.36 | | | | $10.33 | | | | $10.08 | |
Net investment income | | | 0.11 | | | | 0.21 | | | | 0.22 | | | | 0.24 | | | | 0.24 | | | | 0.26 | |
Net realized and unrealized gains (losses) on investments | | | (0.07 | ) | | | (0.14 | ) | | | (0.41 | ) | | | 0.24 | | | | 0.03 | | | | 0.25 | |
| | | | | | | | | | | | | | | | | | | | | | | | |
Total from investment operations | | | 0.04 | | | | 0.07 | | | | (0.19 | ) | | | 0.48 | | | | 0.27 | | | | 0.51 | |
Distributions to shareholders from | | | | | | | | | | | | | | | | | | | | | | | | |
Net investment income | | | (0.11 | ) | | | (0.21 | ) | | | (0.22 | ) | | | (0.24 | ) | | | (0.24 | ) | | | (0.26 | ) |
Net asset value, end of period | | | $9.98 | | | | $10.05 | | | | $10.19 | | | | $10.60 | | | | $10.36 | | | | $10.33 | |
Total return1 | | | 0.39 | % | | | 0.70 | % | | | (1.77 | )% | | | 4.65 | % | | | 2.58 | % | | | 5.13 | % |
Ratios to average net assets (annualized) | | | | | | | | | | | | | | | | | | | | | | | | |
Gross expenses | | | 1.86 | % | | | 1.75 | % | | | 1.72 | % | | | 1.71 | % | | | 1.69 | % | | | 1.69 | % |
Net expenses | | | 1.60 | % | | | 1.60 | % | | | 1.60 | % | | | 1.60 | % | | | 1.60 | % | | | 1.60 | % |
Net investment income | | | 2.16 | % | | | 2.07 | % | | | 2.15 | % | | | 2.25 | % | | | 2.26 | % | | | 2.56 | % |
Supplemental data | | | | | | | | | | | | | | | | | | | | | | | | |
Portfolio turnover rate | | | 5 | % | | | 5 | % | | | 11 | % | | | 7 | % | | | 12 | % | | | 15 | % |
Net assets, end of period (000s omitted) | | | $2,839 | | | | $3,281 | | | | $4,974 | | | | $6,121 | | | | $4,431 | | | | $4,566 | |
| 1 | Total return calculations do not include any sales charges. Returns for periods of less than one year are not annualized. |
The accompanying notes are an integral part of these financial statements.
| | | | | | |
| Financial highlights | | Wells Fargo North Carolina Tax-Free Fund | | | 15 | |
(For a share outstanding throughout each period)
| | | | | | | | | | | | | | | | | | | | | | | | |
| | | Six months ended December 31, 2018 (unaudited) | | | Year ended June 30 | |
| INSTITUTIONAL CLASS | | 2018 | | | 2017 | | | 2016 | | | 2015 | | | 2014 | |
Net asset value, beginning of period | | | $10.05 | | | | $10.19 | | | | $10.60 | | | | $10.36 | | | | $10.33 | | | | $10.08 | |
Net investment income | | | 0.16 | | | | 0.32 | | | | 0.33 | | | | 0.35 | | | | 0.35 | | | | 0.36 | |
Net realized and unrealized gains (losses) on investments | | | (0.07 | ) | | | (0.14 | ) | | | (0.41 | ) | | | 0.24 | | | | 0.03 | | | | 0.26 | |
| | | | | | | | | | | | | | | | | | | | | | | | |
Total from investment operations | | | 0.09 | | | | 0.18 | | | | (0.08 | ) | | | 0.59 | | | | 0.38 | | | | 0.62 | |
Distributions to shareholders from | | | | | | | | | | | | | | | | | | | | | | | | |
Net investment income | | | (0.16 | ) | | | (0.32 | ) | | | (0.33 | ) | | | (0.35 | ) | | | (0.35 | ) | | | (0.37 | ) |
Net asset value, end of period | | | $9.98 | | | | $10.05 | | | | $10.19 | | | | $10.60 | | | | $10.36 | | | | $10.33 | |
Total return1 | | | 0.93 | % | | | 1.77 | % | | | (0.72 | )% | | | 5.76 | % | | | 3.67 | % | | | 6.25 | % |
Ratios to average net assets (annualized) | | | | | | | | | | | | | | | | | | | | | | | | |
Gross expenses | | | 0.78 | % | | | 0.68 | % | | | 0.64 | % | | | 0.63 | % | | | 0.61 | % | | | 0.61 | % |
Net expenses | | | 0.54 | % | | | 0.54 | % | | | 0.54 | % | | | 0.54 | % | | | 0.54 | % | | | 0.54 | % |
Net investment income | | | 3.21 | % | | | 3.14 | % | | | 3.20 | % | | | 3.32 | % | | | 3.32 | % | | | 3.61 | % |
Supplemental data | | | | | | | | | | | | | | | | | | | | | | | | |
Portfolio turnover rate | | | 5 | % | | | 5 | % | | | 11 | % | | | 7 | % | | | 12 | % | | | 15 | % |
Net assets, end of period (000s omitted) | | | $29,686 | | | | $34,752 | | | | $39,395 | | | | $62,793 | | | | $60,844 | | | | $72,479 | |
| 1 | Returns for periods of less than one year are not annualized. |
The accompanying notes are an integral part of these financial statements.
| | | | |
| 16 | | Wells Fargo North Carolina Tax-Free Fund | | Notes to financial statements (unaudited) |
1. ORGANIZATION
Wells Fargo Funds Trust (the “Trust”), a Delaware statutory trust organized on March 10, 1999, is an open-end management investment company registered under the Investment Company Act of 1940, as amended (the “1940 Act”). As an investment company, the Trust follows the accounting and reporting guidance in Financial Accounting Standards Board (“FASB”) Accounting Standards Codification Topic 946, Financial Services – Investment Companies. These financial statements report on the Wells Fargo North Carolina Tax-Free Fund (the “Fund”) which is a non-diversified series of the Trust.
2. SIGNIFICANT ACCOUNTING POLICIES
The following significant accounting policies, which are consistently followed in the preparation of the financial statements of the Fund, are in conformity with U.S. generally accepted accounting principles which require management to make estimates and assumptions that affect the reported amounts of assets and liabilities, disclosure of contingent assets and liabilities at the date of the financial statements, and the reported amounts of revenues and expenses during the reporting period. Actual results could differ from those estimates.
Securities valuation
All investments are valued each business day as of the close of regular trading on the New York Stock Exchange (generally 4 p.m. Eastern Time), although the Fund may deviate from this calculation time under unusual or unexpected circumstances.
Debt securities are valued at the evaluated bid price provided by an independent pricing service (e.g. taking into account various factors, including yields, maturities, or credit ratings) or, if a reliable price is not available, the quoted bid price from an independent broker-dealer.
Investments in registered open-end investment companies are valued at net asset value.
Investments which are not valued using any of the methods discussed above are valued at their fair value, as determined in good faith by the Board of Trustees of the Fund. The Board of Trustees has established a Valuation Committee comprised of the Trustees and has delegated to it the authority to take any actions regarding the valuation of portfolio securities that the Valuation Committee deems necessary or appropriate, including determining the fair value of portfolio securities, unless the determination has been delegated to the Wells Fargo Asset Management Pricing Committee at Wells Fargo Funds Management, LLC (“Funds Management”). The Board of Trustees retains the authority to make or ratify any valuation decisions or approve any changes to the Valuation Procedures as it deems appropriate. On a quarterly basis, the Board of Trustees receives reports on any valuation actions taken by the Valuation Committee or the Wells Fargo Asset Management Pricing Committee which may include items for ratification.
Security transactions and income recognition
Securities transactions are recorded on a trade date basis. Realized gains or losses are recorded on the basis of identified cost.
Interest income is accrued daily and bond discounts are accreted and premiums are amortized daily. To the extent debt obligations are placed on non-accrual status, any related interest income may be reduced by writing off interest receivables when the collection of all or a portion of interest has been determined to be doubtful based on consistently applied procedures and the fair value has decreased. If the issuer subsequently resumes interest payments or when the collectability of interest is reasonably assured, the debt obligation is removed from non-accrual status.
Distributions to shareholders
Distributions to shareholders from net investment income are declared daily and paid monthly. Distributions from net realized gains, if any, are recorded on the ex-dividend date and paid at least annually. Such distributions are determined in accordance with income tax regulations and may differ from U.S. generally accepted accounting principles. Dividend sources are estimated at the time of declaration. The tax character of distributions is determined as of the Fund’s fiscal year end. Therefore, a portion of the Fund’s distributions made prior to the Fund’s fiscal year end may be categorized as a tax return of capital at year end.
Federal and other taxes
The Fund intends to continue to qualify as a regulated investment company by distributing substantially all of its investment company taxable and tax-exempt income and any net realized capital gains (after reduction for capital loss carryforwards) sufficient to relieve it from all, or substantially all, federal income taxes. Accordingly, no provision for federal income taxes was required.
| | | | | | |
| Notes to financial statements (unaudited) | | Wells Fargo North Carolina Tax-Free Fund | | | 17 | |
The Fund’s income and federal excise tax returns and all financial records supporting those returns for the prior three fiscal years are subject to examination by the federal and Delaware revenue authorities. Management has analyzed the Fund’s tax positions taken on federal, state, and foreign tax returns for all open tax years and does not believe that there are any uncertain tax positions that require recognition of a tax liability.
As of December 31, 2018, the aggregate cost of all investments for federal income tax purposes was $55,018,485 and the unrealized gains (losses) consisted of:
| | | | |
| |
Gross unrealized gains | | $ | 1,755,918 | |
| |
Gross unrealized losses | | | (181,281 | ) |
| |
Net unrealized gains | | $ | 1,574,637 | |
As of June 30, 2018, the Fund had capital loss carryforwards which consisted of $113,445 in short-term capital losses.
As of June 30, 2018, the Fund had current year deferred post-October capital losses consisting of $44,225 in net long-term losses which were recognized on the first day of the current fiscal year.
Class allocations
The separate classes of shares offered by the Fund differ principally in applicable sales charges, distribution, shareholder servicing, and administration fees. Class specific expenses are charged directly to that share class. Investment income, common expenses, and realized and unrealized gains (losses) on investments are allocated daily to each class of shares based on the relative proportion of net assets of each class.
3. FAIR VALUATION MEASUREMENTS
Fair value measurements of investments are determined within a framework that has established a fair value hierarchy based upon the various data inputs utilized in determining the value of the Fund’s investments. The three-level hierarchy gives the highest priority to unadjusted quoted prices in active markets for identical assets or liabilities (Level 1) and the lowest priority to unobservable inputs (Level 3). The Fund’s investments are classified within the fair value hierarchy based on the lowest level of input that is significant to the fair value measurement. The inputs are summarized into three broad levels as follows:
| ∎ | | Level 1 – quoted prices in active markets for identical securities |
| ∎ | | Level 2 – other significant observable inputs (including quoted prices for similar securities, interest rates, prepayment speeds, credit risk, etc.) |
| ∎ | | Level 3 – significant unobservable inputs (including the Fund’s own assumptions in determining the fair value of investments) |
The inputs or methodologies used for valuing investments in securities are not necessarily an indication of the risk associated with investing in those securities.
The following is a summary of the inputs used in valuing the Fund’s assets and liabilities as of December 31, 2018:
| | | | | | | | | | | | | | | | |
| | | | |
| | | Quoted prices
(Level 1) | | | Other significant
observable inputs
(Level 2) | | | Significant
unobservable inputs
(Level 3) | | | Total | |
| | | | |
Assets | | | | | | | | | | | | | | | | |
Investments in: | | | | | | | | | | | | | | | | |
| | | | |
Municipal obligations | | $ | 0 | | | $ | 55,710,493 | | | $ | 0 | | | $ | 55,710,493 | |
| | | | |
Short-term investments | | | | | | | | | | | | | | | | |
| | | | |
Investment companies | | | 882,629 | | | | 0 | | | | 0 | | | | 882,629 | |
| | | | |
Total assets | | $ | 882,629 | | | $ | 55,710,493 | | | $ | 0 | | | $ | 56,593,122 | |
Additional sector, industry or geographic detail is included in the Portfolio of Investments.
At December 31, 2018, the Fund did not have any transfers into/out of Level 3.
| | | | |
| 18 | | Wells Fargo North Carolina Tax-Free Fund | | Notes to financial statements (unaudited) |
4. TRANSACTIONS WITH AFFILIATES
Management fee
Funds Management, an indirect wholly owned subsidiary of Wells Fargo & Company (“Wells Fargo”), is the manager of the Fund and provides advisory and fund-level administrative services under an investment management agreement. Under the investment management agreement, Funds Management is responsible for, among other services, implementing the investment objectives and strategies of the Fund, supervising the subadviser and providing fund-level administrative services in connection with the Fund’s operations. As compensation for its services under the investment management agreement, Funds Management is entitled to receive an annual management fee starting at 0.40% and declining to 0.28% as the average daily net assets of the Fund increase. For the six months ended December 31, 2018, the management fee was equivalent to an annual rate of 0.40% of the Fund’s average daily net assets.
Funds Management has retained the services of a subadviser to provide daily portfolio management to the Fund. The fee for subadvisory services is borne by Funds Management. Wells Capital Management Incorporated, an affiliate of Funds Management and an indirect wholly owned subsidiary of Wells Fargo, is the subadviser to the Fund and is entitled to receive a fee from Funds Management at an annual rate starting at 0.20% and declining to 0.10% as the average daily net assets of the Fund increase.
Administration fees
Under a class-level administration agreement, Funds Management provides class-level administrative services to the Fund, which includes paying fees and expenses for services provided by the transfer agent, sub-transfer agents, omnibus account servicers and record-keepers. As compensation for its services under the class-level administration agreement, Funds Management receives an annual fee which is calculated based on the average daily net assets of each class as follows:
| | | | |
| | | Class-level
administration fee | |
| |
Class A, Class C | | | 0.16 | % |
| |
Institutional Class | | | 0.08 | |
Funds Management has contractually waived and/or reimbursed management and administration fees to the extent necessary to maintain certain net operating expense ratios for the Fund. When each class of the Fund has exceeded its expense cap, Funds Management has waived fees and/or reimbursed expenses from fund level expenses on a proportionate basis and then from class specific expenses; otherwise, waivers and/or reimbursements are applied against class specific expenses before fund level expenses. Funds Management has committed through October 31, 2019 to waive fees and/or reimburse expenses to the extent necessary to cap the Fund’s expenses at 0.85% for Class A shares, 1.60% for Class C shares, and 0.54% for Institutional Class shares. After this time, the cap may be increased or the commitment to maintain the cap may be terminated only with the approval of the Board of Trustees.
Distribution fee
The Trust has adopted a distribution plan for Class C shares of the Fund pursuant to Rule 12b-1 under the 1940 Act. A distribution fee is charged to Class C and paid to Wells Fargo Funds Distributor, LLC (“Funds Distributor”), the principal underwriter, at an annual rate of 0.75% of the average daily net assets of Class C shares.
In addition, Funds Distributor is entitled to receive the front-end sales charge from the purchase of Class A shares and a contingent deferred sales charge on the redemption of certain Class A shares. Funds Distributor is also entitled to receive the contingent deferred sales charges from redemptions of Class C shares. For the six months ended December 31, 2018, Funds Distributor received $1,246 from the sale of Class A shares. No contingent deferred sales charges were incurred by Class A and Class C shares for the six months ended December 31, 2018.
Shareholder servicing fees
The Trust has entered into contracts with one or more shareholder servicing agents, whereby Class A and Class C of the Fund are charged a fee at an annual rate of 0.25% of the average daily net assets of each respective class.
A portion of these total shareholder servicing fees were paid to affiliates of Wells Fargo.
Interfund transactions
The Fund may purchase or sell portfolio investment securities to certain other Wells Fargo affiliates pursuant toRule 17a-7 under the 1940 Act and under procedures adopted by the Board of Trustees. The procedures have been designed to ensure that these interfund transactions, which do not incur broker commissions, are effected at current market prices. Pursuant to these procedures, the Fund had $100,000 in interfund sales during the six months ended December 31, 2018.
| | | | | | |
| Notes to financial statements (unaudited) | | Wells Fargo North Carolina Tax-Free Fund | | | 19 | |
5. INVESTMENT PORTFOLIO TRANSACTIONS
Purchases and sales of investments, excluding U.S. government obligations (if any) and short-term securities, for the six months ended December 31, 2018 were $2,890,175 and $9,568,469, respectively.
6. BANK BORROWINGS
The Trust (excluding the money market funds), Wells Fargo Master Trust and Wells Fargo Variable Trust are parties to a $280,000,000 revolving credit agreement whereby the Fund is permitted to use bank borrowings for temporary or emergency purposes, such as to fund shareholder redemption requests. Interest under the credit agreement is charged to the Fund based on a borrowing rate equal to the higher of the Federal Funds rate in effect on that day plus 1.25% or the overnight LIBOR rate in effect on that day plus 1.25%. In addition, an annual commitment fee equal to 0.25% of the unused balance is allocated to each participating fund.
For the six months ended December 31, 2018, there were no borrowings by the Fund under the agreement.
7. DISTRIBUTIONS TO SHAREHOLDERS
Effective for all filings after November 4, 2018, the Securities and Exchange Commission eliminated the requirement to separately state the components of distributions to shareholders under U.S. generally accepted accounting principles. The amounts of distributions to shareholders for the year ended June 30, 2018 were as follows:
| | | | |
| | | Net investment
income | |
| |
Class A | | | $ 820,342 | |
| |
Class C | | | 87,164 | |
| |
Institutional Class | | | 1,148,953 | |
8. CONCENTRATION RISK
The Fund invests a substantial portion of its assets in issuers of municipal debt securities located in a single state or territories of the U.S. Therefore, it may be more affected by economic and political developments in that state or region than would be a comparable general tax-exempt fund.
9. INDEMNIFICATION
Under the Trust’s organizational documents, the officers and Trustees have been granted certain indemnification rights against certain liabilities that may arise out of performance of their duties to the Trust. Additionally, in the normal course of business, the Trust may enter into contracts with service providers that contain a variety of indemnification clauses. The Trust’s maximum exposure under these arrangements is dependent on future claims that may be made against the Fund and, therefore, cannot be estimated.
10. REORGANIZATION
At a regular meeting of the Board of Trustees held on November 8 and 9, 2018, the Trustees of the Fund approved a Plan of Reorganization (the “Plan”). Under the Plan, Wells Fargo Municipal Bond Fund will acquire the assets and assume the liabilities of the Fund in exchange for shares of Wells Fargo Municipal Bond Fund.
At a Special Meeting of Shareholders of the Fund held on February 19, 2019, the shareholders approved the Plan to merge the Fund into Wells Fargo Municipal Bond Fund. The merger is scheduled to take place on or about March 15, 2019.
11. NEW ACCOUNTING PRONOUNCEMENT
In August 2018, FASB issued Accounting Standards Update (“ASU”) No. 2018-13, Fair Value Measurement (Topic 820)Disclosure Framework—Changes to the Disclosure Requirements for Fair Value Measurement. ASU 2018-13 updates the disclosure requirements for fair value measurements by modifying or removing certain disclosures and adding certain new disclosures. The amendments are effective for fiscal years, and interim periods within those fiscal years, beginning after December 15, 2019. Early adoption is permitted. Management has adopted the removal and modification of disclosures early, as permitted, and will adopt the additional new disclosures at the effective date.
| | | | |
| 20 | | Wells Fargo North Carolina Tax-Free Fund | | Other information (unaudited) |
PROXY VOTING INFORMATION
A description of the policies and procedures used to determine how to vote proxies relating to portfolio securities is available, upon request, by calling1-800-222-8222, visiting our website atwellsfargofunds.com, or visiting the SEC website at sec.gov. Information regarding how the Fund voted proxies relating to portfolio securities during the most recent 12-month period ended June 30 is available on the Fund’s website atwellsfargofunds.comor by visiting the SEC website at sec.gov.
PORTFOLIO HOLDINGS INFORMATION
The complete portfolio holdings for the Fund are publicly available monthly on the Fund’s website (wellsfargofunds.com), on a one-month delayed basis. In addition, top ten holdings information (excluding derivative positions) for the Fund is publicly available on the Fund’s website on a monthly, seven-day or more delayed basis. The Fund files its complete schedule of portfolio holdings with the SEC for the first and third quarters of each fiscal year on Form N-Q, which is available by visiting the SEC website at sec.gov. In addition, the Fund’s Form N-Q may be reviewed and copied at the SEC’s Public Reference Room in Washington, DC, and at regional offices in New York City, at 233 Broadway, and in Chicago, at 175 West Jackson Boulevard, Suite 900. Information about the Public Reference Room may be obtained by calling 1-800-SEC-0330.
| | | | | | |
| Other information (unaudited) | | Wells Fargo North Carolina Tax-Free Fund | | | 21 | |
BOARD OF TRUSTEES AND OFFICERS
Each of the Trustees and Officers1 listed in the table below acts in identical capacities for each fund in the Wells Fargo family of funds, which consists of 152 mutual funds comprising the Wells Fargo Funds Trust, Wells Fargo Variable Trust, Wells Fargo Master Trust and four closed-end funds (collectively the “Fund Complex”). This table should be read in conjunction with the Prospectus and the Statement of Additional Information2. The mailing address of each Trustee and Officer is 525 Market Street, 12th Floor, San Francisco, CA 94105. Each Trustee and Officer serves an indefinite term, however, each Trustee serves such term until reaching the mandatory retirement age established by the Trustees.
Independent Trustees
| | | | | | |
Name and
year of birth | | Position held and
length of service* | | Principal occupations during past five years or longer | | Current other
public company or
investment company
directorships |
| | | |
William R. Ebsworth
(Born 1957) | | Trustee, since 2015 | | Retired. From 1984 to 2013, equities analyst, portfolio manager, research director and chief investment officer at Fidelity Management and Research Company in Boston, Tokyo, and Hong Kong, and retired in 2013 as Chief Investment Officer of Fidelity Strategic Advisers, Inc. where he led a team of investment professionals managing client assets. Prior thereto, Board member of Hong Kong Securities Clearing Co., Hong Kong Options Clearing Corp., the Thailand International Fund, Ltd., Fidelity Investments Life Insurance Company, and Empire Fidelity Investments Life Insurance Company. Board member of the Vincent Memorial Hospital Endowment (non-profit organization), where he serves on the Investment Committee and as a Chair of the Audit Committee. Mr. Ebsworth is a CFA® charterholder. | | N/A |
| | | |
Jane A. Freeman
(Born 1953) | | Trustee, since 2015; Chair Liaison, since 2018 | | Retired. From 2012 to 2014 and 1999 to 2008, Chief Financial Officer of Scientific Learning Corporation. From 2008 to 2012, Ms. Freeman provided consulting services related to strategic business projects. Prior to 1999, Portfolio Manager at Rockefeller & Co. and Scudder, Stevens & Clark. Board member of the Harding Loevner Funds from 1996 to 2014, serving as both Lead Independent Director and chair of the Audit Committee. Board member of the Russell Exchange Traded Funds Trust from 2011 to 2012 and the chair of the Audit Committee. Ms. Freeman is a Board Member of The Ruth Bancroft Garden (non-profit organization). She is also an inactive Chartered Financial Analyst. | | N/A |
| | | |
Isaiah Harris, Jr.3
(Born 1952) | | Trustee, since 2009; Audit Committee Chairman, since 2019 | | Retired. Chairman of the Board of CIGNA Corporation since 2009, and Director since 2005. From 2003 to 2011, Director of Deluxe Corporation. Prior thereto, President and CEO of BellSouth Advertising and Publishing Corp. from 2005 to 2007, President and CEO of BellSouth Enterprises from 2004 to 2005 and President of BellSouth Consumer Services from 2000 to 2003. Emeritus member of the Iowa State University Foundation Board of Governors. Emeritus Member of the Advisory Board of Iowa State University School of Business. Advisory Board Member, Palm Harbor Academy (private school). Advisory Board Member, Child Evangelism Fellowship (non-profit). Mr. Harris is a certified public accountant (inactive status). | | CIGNA Corporation |
| | | |
Judith M. Johnson3
(Born 1949) | | Trustee, since 2008; Audit Committee Chairman, from 2009 to 2018 | | Retired. Prior thereto, Chief Executive Officer and Chief Investment Officer of Minneapolis Employees Retirement Fund from 1996 to 2008. Ms. Johnson is an attorney, certified public accountant and a certified managerial accountant. | | N/A |
| | | |
David F. Larcker
(Born 1950) | | Trustee, since 2009 | | James Irvin Miller Professor of Accounting at the Graduate School of Business, Stanford University, Director of the Corporate Governance Research Initiative and Senior Faculty of The Rock Center for Corporate Governance since 2006. From 2005 to 2008, Professor of Accounting at the Graduate School of Business, Stanford University. Prior thereto, Ernst & Young Professor of Accounting at The Wharton School, University of Pennsylvania from 1985 to 2005. | | N/A |
| | | | |
| 22 | | Wells Fargo North Carolina Tax-Free Fund | | Other information (unaudited) |
| | | | | | |
Name and
year of birth | | Position held and
length of service* | | Principal occupations during past five years or longer | | Current other
public company or
investment company
directorships |
| | | |
Olivia S. Mitchell
(Born 1953) | | Trustee, since 2006; Nominating and Governance Committee Chairman, since 2018 | | International Foundation of Employee Benefit Plans Professor, Wharton School of the University of Pennsylvania since 1993. Director of Wharton’s Pension Research Council and Boettner Center on Pensions & Retirement Research, and Research Associate at the National Bureau of Economic Research. Previously, Cornell University Professor from 1978 to 1993. | | N/A |
| | | |
Timothy J. Penny
(Born 1951) | | Trustee, since 1996; Chairman, since 2018; Vice Chairman, from 2017 to 2018 | | President and Chief Executive Officer of Southern Minnesota Initiative Foundation, a non-profit organization, since 2007. Member of the Board of Trustees of NorthStar Education Finance, Inc., a non-profit organization, since 2007. | | N/A |
| | | |
James G. Polisson
(Born 1959) | | Trustee, since 2018; Advisory Board Member, from 2017 to 2018 | | Retired. Chief Marketing Officer, Source (ETF) UK Services, Ltd, from 2015 to 2017. From 2012 to 2015, Principal of The Polisson Group, LLC, a management consulting, corporate advisory and principal investing company. Chief Executive Officer and Managing Director at Russell Investments, Global Exchange Traded Funds from 2010 to 2012. Managing Director of Barclays Global Investors from 1998 to 2010 and Global Chief Marketing Officer for iShares and Barclays Global Investors from 2000 to 2010. Trustee of the San Francisco Mechanics’ Institute, a non-profit organization, from 2013 to 2015. Board member of the Russell Exchange Traded Fund Trust from 2011 to 2012. Director of Barclays Global Investors Holdings Deutschland GmbH from 2006 to 2009. Mr. Polisson is an attorney and has a retired status with the Massachusetts and District of Columbia Bar Associations. | | N/A |
| | | |
Michael S. Scofield4
(Born 1943) | | Trustee, since 2010 | | Served on the Investment Company Institute’s Board of Governors and Executive Committee from 2008-2011 as well the Governing Council of the Independent Directors Council from 2006-2011 and the Independent Directors Council Executive Committee from 2008-2011. Trustee of the Evergreen Fund complex (and its predecessors) from 1984 to 2010. Chairman of the Evergreen Funds from 2000-2010. Former Trustee of the Mentor Funds. Retired Attorney, Law Offices of Michael S. Scofield. | | N/A |
| | | |
Pamela Wheelock
(Born 1959) | | Trustee, since 2018; Advisory Board Member, from 2017 to 2018 | | Chief Operating Officer, Twin Cities Habitat for Humanity, since January, 2017. Vice President of University Services, University of Minnesota from 2012 to 2017. Prior thereto, on the Board of Directors, Governance Committee and Finance Committee for the Minnesota Philanthropy Partners (Saint Paul Foundation) from 2012 to 2018, Interim President and Chief Executive Officer of Blue Cross Blue Shield of Minnesota from 2010 to 2011, Chairman of the Board from 2009 to 2011 and Board Director from 2003 to 2015. Vice President, Leadership and Community Engagement, Bush Foundation, Saint Paul, Minnesota (a private foundation) from 2009 to 2011. Executive Vice President and Chief Financial Officer, Minnesota Sports and Entertainment from 2004 to 2009 and Senior Vice President from 2002 to 2004. Commissioner of Finance, State of Minnesota, from 1999 to 2002. Currently the Board Chair of the Minnesota Wild Foundation since 2010. | | N/A |
| * | Length of service dates reflect the Trustee’s commencement of service with the Trust’s predecessor entities, where applicable. |
| | | | | | |
| Other information (unaudited) | | Wells Fargo North Carolina Tax-Free Fund | | | 23 | |
Officers
| | | | | | |
Name and
year of birth | | Position held and
length of service | | Principal occupations during past five years or longer | | |
| | | |
Andrew Owen (Born 1960) | | President, since 2017 | | Executive Vice President of Wells Fargo & Company and Head of Affiliated Managers, Wells Fargo Asset Management, since 2014. In addition, Mr. Owen is currently President, Chief Executive Officer and Director of Wells Fargo Funds Management, LLC since 2017. Prior thereto, Executive Vice President responsible for marketing, investments and product development for Wells Fargo Funds Management, LLC, from 2009 to 2014. | | |
| | | |
Nancy Wiser1 (Born 1967) | | Treasurer, since 2012 | | Executive Vice President of Wells Fargo Funds Management, LLC since 2011. Chief Operating Officer and Chief Compliance Officer at LightBox Capital Management LLC, from 2008 to 2011. | | |
| | | |
Alexander Kymn
(Born 1973) | | Secretary, since 2018; Chief Legal Officer, since 2018 | | Senior Company Counsel of Wells Fargo Bank, N.A. since 2018 (previously Senior Counsel from 2007 to 2018). Vice President of Wells Fargo Funds Management, LLC from 2008 to 2014. | | |
| | | |
Michael H. Whitaker
(Born 1967) | | Chief Compliance Officer, since 2016 | | Senior Vice President and Chief Compliance Officer since 2016. Senior Vice President and Chief Compliance Officer for Fidelity Investments from 2007 to 2016. | | |
| | | |
David Berardi (Born 1975) | | Assistant Treasurer, since 2009 | | Vice President of Wells Fargo Funds Management, LLC since 2009. Vice President of Evergreen Investment Management Company, LLC from 2008 to 2010. Manager of Fund Reporting and Control for Evergreen Investment Management Company, LLC from 2004 to 2010. | | |
| | | |
Jeremy DePalma1 (Born 1974) | | Assistant Treasurer, since 2009 | | Senior Vice President of Wells Fargo Funds Management, LLC since 2009. Senior Vice President of Evergreen Investment Management Company, LLC from 2008 to 2010 and head of the Fund Reporting and Control Team within Fund Administration from 2005 to 2010. | | |
| 1 | Nancy Wiser acts as Treasurer of 76 funds in the Fund Complex. Jeremy DePalma acts as Treasurer of 76 funds and Assistant Treasurer of 76 funds in the Fund Complex. |
| 2 | The Statement of Additional Information includes additional information about the Trustees and is available, without charge, upon request, by calling1-800-222-8222 or by visiting the website atwellsfargofunds.com. |
| 3 | Mr. Harris replaced Ms. Johnson as the Chairman of the Audit Committee effective January 1, 2019. |
| 4 | Mr. Scofield retired on December 31, 2018. |
| | | | |
| 24 | | Wells Fargo North Carolina Tax-Free Fund | | Appendix A (unaudited) |
SALES CHARGE REDUCTIONS AND WAIVERS FOR CERTAIN INTERMEDIARIES
Raymond James & Associates, Inc., Raymond James Financial Services & Raymond James affiliates (“Raymond James”)
Effective on or about March 1, 2019, shareholders purchasing Fund shares through a Raymond James platform or account will be eligible only for the following load waivers (front-end sales charge waivers and contingent deferred, or back-end, sales charge waivers) and discounts, which may differ from those disclosed elsewhere in the Fund’s Prospectus or SAI.
Front-end Sales Load Waivers on Class A shares Available at Raymond James
| | • | | Shares purchased in an investment advisory program. |
| | • | | Shares purchased through reinvestment of capital gains distributions and dividend reinvestment when purchasing shares of the same fund (but not any other fund within the fund family). |
| | • | | Employees and registered representatives of Raymond James or its affiliates and their family members as designated by Raymond James. |
| | • | | Shares purchased from the proceeds of redemptions within the same fund family, provided (1) the repurchase occurs within 90 days following the redemption, (2) the redemption and purchase occur in the same account, and (3) redeemed shares were subject to a front-end or deferred sales load (known as Rights of Reinstatement). |
| | • | | A shareholder in the fund’s Class C shares will have their shares automatically exchanged at net asset value to Class A shares (or the appropriate share class) of the fund if the shares are no longer subject to a CDSC and the exchange is in line with the policies and procedures of Raymond James. |
CDSC Waivers on Class A and C Shares Available at Raymond James
| | • | | Death or disability of the shareholder. |
| | • | | Shares sold as part of a systematic withdrawal plan as described in the Fund’s Prospectus. |
| | • | | Return of excess contributions from an IRA Account. |
| | • | | Shares sold as part of a required minimum distribution for IRA and retirement accounts due to the shareholder reaching age 70½ as described in the Fund’s prospectus. |
| | • | | Shares sold to pay Raymond James fees but only if the transaction is initiated by Raymond James. |
| | • | | Shares acquired through a right of reinstatement. |
Front-end Load Discounts Available at Raymond James: Breakpoints, and/or Rights of Accumulation
| | • | | Breakpoints as described in the Fund’s Prospectus. |
| | • | | Rights of accumulation which entitle shareholders to breakpoint discounts will be automatically calculated based on the aggregated holding of fund family assets held by accounts within the purchaser’s household at Raymond James. Eligible fund family assets not held at Raymond James may be included in the rights of accumulation calculation only if the shareholder notifies his or her financial advisor about such assets. |

For more information
More information about Wells Fargo Funds is available free upon request. To obtain literature, please write, visit the Fund’s website, or call:
Wells Fargo Funds
P.O. Box 219967
Kansas City, MO 64121-9967
Website: wellsfargofunds.com
Individual investors: 1-800-222-8222
Retail investment professionals: 1-888-877-9275
Institutional investment professionals:1-866-765-0778
This report and the financial statements contained herein are submitted for the general information of the shareholders of the Fund. If this report is used for promotional purposes, distribution of the report must be accompanied or preceded by a current prospectus. Before investing, please consider the investment objectives, risks, charges, and expenses of the investment. For a current prospectus and, if available, a summary prospectus, containing this information, call1-800-222-8222 or visit the Fund’s website atwellsfargofunds.com. Read the prospectus carefully before you invest or send money.
Wells Fargo Asset Management (WFAM) is the trade name for certain investment advisory/management firms owned by Wells Fargo & Company. These firms include but are not limited to Wells Capital Management Incorporated and Wells Fargo Funds Management, LLC. Certain products managed by WFAM entities are distributed by Wells Fargo Funds Distributor, LLC (a broker/dealer and Member FINRA).
This material is for general informational and educational purposes only and is NOT intended to provide investment advice or a recommendation of any kind—including a recommendation for any specific investment, strategy, or plan.
INVESTMENT PRODUCTS: NOT FDIC INSURED ◾ NO BANK GUARANTEE ◾ MAY LOSE VALUE
© 2019 Wells Fargo Funds Management, LLC. All rights reserved.
| | |
 | | 320449 02-19 SA254/SAR254 12-18 |
Semi-Annual Report
December 31, 2018

Wells Fargo Pennsylvania Tax-Free Fund

Beginning on January 1, 2021, as permitted by new regulations adopted by the Securities and Exchange Commission, paper copies of the Wells Fargo Funds’ annual and semi-annual shareholder reports issued after this date will no longer be sent by mail, unless you specifically request paper copies of the reports. Instead, the reports will be made available on the Funds’ website, and you will be notified by mail each time a report is posted and provided with a website address to access the report.
If you already elected to receive shareholder reports electronically, you will not be affected by this change and you need not take any action. You may elect to receive shareholder reports and other communications from the Fund electronically at any time by contacting your financial intermediary (such as a broker-dealer or bank) or, if you are a direct investor, by calling 1-800-222-8222 or by enrolling at wellsfargo.com/advantagedelivery.
You may elect to receive all future reports in paper free of charge. If you invest through a financial intermediary, you can contact your financial intermediary to request that you continue to receive paper copies of your shareholder reports; if you invest directly with the Fund, you can call 1-800-222-8222. Your election to receive reports in paper will apply to all Wells Fargo Funds held in your account with your financial intermediary or, if you are a direct investor, to all Wells Fargo Funds that you hold.

Reduce clutter. Save trees.
Sign up for electronic delivery of prospectuses and shareholder reports atwellsfargo.com/advantagedelivery
Contents
The views expressed and any forward-looking statements are as of December 31, 2018, unless otherwise noted, and are those of the Fund managers and/or Wells Fargo Funds Management, LLC. Discussions of individual securities, or the markets generally, or any Wells Fargo Fund are not intended as individual recommendations. Future events or results may vary significantly from those expressed in any forward-looking statements. The views expressed are subject to change at any time in response to changing circumstances in the market. Wells Fargo Funds Management, LLC and the Fund disclaim any obligation to publicly update or revise any views expressed or forward-looking statements.
INVESTMENT PRODUCTS: NOT FDIC INSURED ◾ NO BANK GUARANTEE ◾ MAY LOSE VALUE
| | | | |
| 2 | | Wells Fargo Pennsylvania Tax-Free Fund | | Letter to shareholders (unaudited) |

Andrew Owen
President
Wells Fargo Funds
Global trade tensions escalated during the third quarter of 2018.
Dear Shareholder:
We are pleased to offer you this semi-annual report for the Wells Fargo PennsylvaniaTax-Free Fund for thesix-month period that ended December 31, 2018. During the reporting period, the U.S. generated encouraging economic and business data that was offset by less positive and more inconsistent data from international markets. Investment returns were generally negative as geopolitical tensions and uncertainty tended to distract investors from more favorable underlying trends.
For the period, U.S. stocks, as measured by the S&P 500 Index,1 fell 6.85% and international stocks, as measured by the MSCI ACWI ex USA Index (Net),2 declined 10.84%. Based on the MSCI EM Index (Net),3 emerging market stocks lost 8.48%. For bond investors, the Bloomberg Barclays U.S. Aggregate Bond Index4 gained 1.65% while the Bloomberg Barclays Global Aggregateex-USD Index5 fell 0.84%. The Bloomberg Barclays Municipal Bond Index6 gained 1.53% while the ICE BofAML U.S. High Yield Index7 declined 2.34%.
Global trade tensions prompted investor concerns.
Global trade tensions escalated during the third quarter of 2018. The U.S. imposed tariffs on a wide range of products manufactured overseas. Foreign governments retaliated with tariffs that punished U.S. commodity producers and product manufacturers. Investors wondered about next steps as divergence in global economic policies and growth prospects widened.
During the summer months, the U.S. economy strengthened. Revised second-quarter gross domestic product (GDP) growth data released in August showed the U.S. economy growing at a 4.2% rate. The unemployment rate in the U.S. was 3.7% by the end of September, according to the U.S. Department of Labor. Wages showed more consistent growth, and consumer confidence remained strong. Several U.S. equity market indices reached records during August, with the S&P 500 Index gaining 7.71% for the three-month period that ended September 30, 2018. In contrast, the MSCI ACWI ex USA Index (Net) gained 0.71% while the MSCI EM Index (Net) declined 1.09% during the samethree-month period.
| 1 | The S&P 500 Index consists of 500 stocks chosen for market size, liquidity, and industry group representation. It is a market-value-weighted index with each stock’s weight in the index proportionate to its market value. You cannot invest directly in an index. |
| 2 | The Morgan Stanley Capital International (MSCI) All Country World Index (ACWI) ex USA Index (Net) is a free-float-adjusted market-capitalization-weighted index that is designed to measure the equity market performance of developed markets, excluding the United States and Canada. Source: MSCI. MSCI makes no express or implied warranties or representations and shall have no liability whatsoever with respect to any MSCI data contained herein. The MSCI data may not be further redistributed or used as a basis for other indices or any securities or financial products. This report is not approved, reviewed, or produced by MSCI. You cannot invest directly in an index. |
| 3 | The MSCI Emerging Markets (EM) Index (Net) is a free-float-adjusted market-capitalization-weighted index that is designed to measure large- andmid-cap equity market performance of emerging markets. The MSCI EM Index (Net) consists of the following 24 emerging market country indices: Brazil, Chile, China, Colombia, Czech Republic, Egypt, Greece, Hungary, India, Indonesia, Korea, Malaysia, Mexico, Pakistan, Peru, the Philippines, Poland, Qatar, Russia, South Africa, Taiwan, Thailand, Turkey, and the United Arab Emirates. You cannot invest directly in an index. |
| 4 | The Bloomberg Barclays U.S. Aggregate Bond Index is a broad-based benchmark that measures the investment-grade, U.S. dollar-denominated, fixed-rate taxable bond market, including Treasuries, government-related and corporate securities, mortgage-backed securities (agency fixed-rate and hybrid adjustable-rate mortgage pass-throughs), asset-backed securities, and commercial mortgage-backed securities. You cannot invest directly in an index. |
| 5 | The Bloomberg Barclays Global Aggregateex-USD Index is an unmanaged index that provides a broad-based measure of the global investment-grade fixed-income markets excluding the U.S. dollar-denominated debt market. You cannot invest directly in an index. |
| 6 | The Bloomberg Barclays Municipal Bond Index is an unmanaged index composed of long-termtax-exempt bonds with a minimum credit rating of Baa. You cannot invest directly in an index. |
| 7 | The ICE BofAML U.S. High Yield Index is a market-capitalization-weighted index of domestic and Yankee high-yield bonds. The index tracks the performance of high-yield securities traded in the U.S. bond market. You cannot invest directly in an index. Copyright 2018. ICE Data Indices, LLC. All rights reserved. |
| | | | | | |
| Letter to shareholders (unaudited) | | Wells Fargo Pennsylvania Tax-Free Fund | | | 3 | |
Economic signals overseas were mixed as the third quarter ended and the fourth quarter began. In particular, signs of slowing economic growth in China created uncertainty for investors. Amid rising trade tensions, the People’s Bank of China cut reserve requirement ratios and accelerated infrastructure spending and tax cuts for business enterprises and individuals. Nevertheless, a strengthening U.S. dollar and trade tensions remained headwinds for investors overseas.
Equity markets were volatile during the fourth quarter.
Negative stock market performance during October and December bracketed a mildly positive November, as measured by the S&P 500 Index and the MSCI ACWI ex USA Index (Net). As interest rates and bond yields gained during October, stock markets struggled. Readings on consumer sentiment and business spending were mixed. Markets rebounded in November. The U.S. and China agreed to halt further increases in tariffs and engage in additional negotiations. While November returns were positive, the loss for the full fourth quarter was substantial for equity investors globally, with the S&P down 13.52% and the MSCI ACWI ex USA Index (Net) down 11.46%. December’s S&P 500 Index performance was the lowest since 1931. Globally, fixed income investments fared better than stocks during the last two months of the year as conflicting signals unsettled investors’ outlooks.
Equity investors confronted a number of changing conditions. In November’smid-term elections, control of the U.S. House of Representatives shifted from Republicans to Democrats, presaging potential partisan disputes. Progress on Brexit negotiations stalled in the UK. In China, the value of the yuan declined to low levels last seen in 2008. Oil prices continued to fall. The Fed increased the federal funds rate by 25 bps to a target range of between 2.25% and 2.50% in December 2018. A late-December dispute over spending and immigration policy resulted in a partial U.S. government shutdown that continued through the end of the period.
Don’t let short-term uncertainty derail long-term investment goals.
Periods of investment uncertainty can present challenges, but experience has taught us that maintaining long-term investment goals can be an effective way to plan for the future. To help you create a sound strategy based on your personal goals and risk tolerance, Wells Fargo Funds offers more than 100 mutual funds spanning a wide range of asset classes and investment styles. Although diversification cannot guarantee an investment profit or prevent losses, we believe it can be an effective way to manage investment risk and potentially smooth out overall portfolio performance. We encourage investors to know their investments and to understand that appropriate levels of risk-taking may unlock opportunities.
Thank you for choosing to invest with Wells Fargo Funds. We appreciate your confidence in us and remain committed to helping you meet your financial needs.
Sincerely,

Andrew Owen
President
Wells Fargo Funds
Economic signals overseas were mixed as the third quarter ended and the fourth quarter began.
For further information about your Fund, contact your investment professional, visit our website atwellsfargofunds.com, or call us directly at1-800-222-8222.
| | | | |
| 4 | | Wells Fargo Pennsylvania Tax-Free Fund | | Performance highlights (unaudited) |
Investment objective
The Fund seeks current income exempt from federal income tax and Pennsylvania individual income tax.
Manager
Wells Fargo Funds Management, LLC
Subadviser
Wells Capital Management Incorporated
Portfolio managers
Bruce R. Johns
Robert J. Miller
Average annual total returns (%) as of December 31, 20181
| | | | | | | | | | | | | | | | | | | | | | | | | | | | | | | | | | |
| | | | | Including sales charge | | | Excluding sales charge | | | Expense ratios2 (%) | |
| | | Inception date | | 1 year | | | 5 year | | | 10 year | | | 1 year | | | 5 year | | | 10 year | | | Gross | | | Net3 | |
| | | | | | | | | |
| Class A (EKVAX) | | 12-27-1990 | | | -3.29 | | | | 2.89 | | | | 5.07 | | | | 1.26 | | | | 3.85 | | | | 5.55 | | | | 0.91 | | | | 0.74 | |
| | | | | | | | | |
| Class C (EKVCX) | | 2-1-1993 | | | -0.50 | | | | 3.08 | | | | 4.77 | | | | 0.50 | | | | 3.08 | | | | 4.77 | | | | 1.66 | | | | 1.49 | |
| | | | | | | | | |
| Institutional Class (EKVYX) | | 11-24-1997 | | | – | | | | – | | | | – | | | | 1.51 | | | | 4.11 | | | | 5.81 | | | | 0.58 | | | | 0.49 | |
| | | | | | | | | |
| Bloomberg Barclays Municipal Bond Index4 | | – | | | – | | | | – | | | | – | | | | 1.28 | | | | 3.82 | | | | 4.85 | | | | – | | | | – | |
| | | | | | | | | |
| Bloomberg Barclays Pennsylvania Municipal Bond Index5 | | – | | | – | | | | – | | | | – | | | | 1.46 | | | | 4.01 | | | | 4.88 | | | | – | | | | – | |
Figures quoted represent past performance, which is no guarantee of future results, and do not reflect taxes that a shareholder may pay on fund distributions or the redemption of fund shares. Investment return and principal value of an investment will fluctuate so that an investor’s shares, when redeemed, may be worth more or less than their original cost. Performance shown without sales charges would be lower if sales charges were reflected. Current performance may be lower or higher than the performance data quoted, which assumes the reinvestment of dividends and capital gains. Currentmonth-end performance is available on the Fund’s website,wellsfargofunds.com.
Index returns do not include transaction costs associated with buying and selling securities, any mutual fund fees or expenses, or any taxes. It is not possible to invest directly in an index.
For Class A shares, the maximumfront-end sales charge is 4.50%. For Class C shares, the maximum contingent deferred sales charge is 1.00%. Performance including a contingent deferred sales charge assumes the sales charge for the corresponding time period. Institutional Class shares are sold without afront-end sales charge or contingent deferred sales charge.
Bond values fluctuate in response to the financial condition of individual issuers, general market and economic conditions, and changes in interest rates. Changes in market conditions and government policies may lead to periods of heightened volatility in the bond market and reduced liquidity for certain bonds held by the Fund. In general, when interest rates rise, bond values fall and investors may lose principal value. Interest rate changes and their impact on the Fund and its share price can be sudden and unpredictable. The use of derivatives may reduce returns and/or increase volatility. Certain investment strategies tend to increase the total risk of an investment (relative to the broader market). The Fund is exposed to Pennsylvania municipal securities risk and high-yield securities risk. Consult the Fund’s prospectus for additional information on these and other risks. A portion of the Fund’s income may be subject to federal, state, and/or local income taxes or the Alternative Minimum Tax (AMT). Any capital gains distributions may be taxable.
Please see footnotes on page 5.
| | | | | | |
| Performance highlights (unaudited) | | Wells Fargo Pennsylvania Tax-Free Fund | | | 5 | |
|
| Effective maturity distribution as of December 31, 20186 |
|
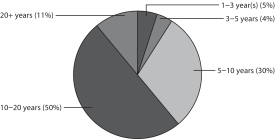 |
|
| Credit quality as of December 31, 20187 |
|
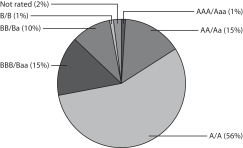 |
| 1 | Historical performance shown for all classes of the Fund prior to July 12, 2010, is based on the performance of the Fund’s predecessor, Evergreen Pennsylvania Municipal Bond Fund. |
| 2 | Reflects the expense ratios as stated in the most recent prospectuses. The expense ratios shown are subject to change and may differ from the annualized expense ratios shown in the financial highlights of this report. |
| 3 | The manager has contractually committed through October 31, 2019, to waive fees and/or reimburse expenses to the extent necessary to cap the Fund’s Total Annual Fund Operating Expenses After Fee Waivers at the amounts shown. After this time, the cap may be increased or the commitment to maintain the cap may be terminated only with the approval of the Board of Trustees. Brokerage commissions, stamp duty fees, interest, taxes, acquired fund fees and expenses (if any), and extraordinary expenses are excluded from the expense cap. Without this cap, the Fund’s returns would have been lower. The expense ratio paid by an investor is the net expense ratio (the total annual fund operating expenses after fee waivers) as stated in the prospectuses. |
| 4 | The Bloomberg Barclays Municipal Bond Index is an unmanaged index composed of long-termtax-exempt bonds with a minimum credit rating of Baa. You cannot invest directly in an index. |
| 5 | The Bloomberg Barclays Pennsylvania Municipal Bond Index is a Pennsylvania-specific total return index. The index is composed of Pennsylvania bonds. The bonds are all investment-grade, fixed-rate, long-term maturities (greater than two years) and are selected from issues larger than $50 million dated since January 1984. Bonds are added to the index and weighted and updated monthly, with aone-month lag. You cannot invest directly in an index. |
| 6 | Amounts are calculated based on the total long-term investments of the Fund. These amounts are subject to change and may have changed since the date specified. |
| 7 | The credit quality distribution of portfolio holdings reflected in the chart is based on ratings from Standard & Poor’s, Moody’s Investors Service, and/or Fitch Ratings Ltd. Credit quality ratings apply to the underlying holdings of the Fund and not to the Fund itself. The percentages of the Fund’s portfolio with the ratings depicted in the chart are calculated based on the total market value of fixed income securities held by the Fund. If a security was rated by all three rating agencies, the middle rating was utilized. If rated by two of three rating agencies, the lower rating was utilized, and if rated by one of the rating agencies, that rating was utilized. Standard & Poor’s rates the creditworthiness of bonds, ranging from AAA (highest) to D (lowest). Ratings from A to CCC may be modified by the addition of a plus (+) or minus (-) sign to show relative standing within the rating categories. Standard & Poor’s rates the creditworthiness of short-term notes fromSP-1 (highest) toSP-3 (lowest). Moody’s rates the creditworthiness of bonds, ranging from Aaa (highest) to C (lowest). Ratings Aa to B may be modified by the addition of a number 1 (highest) to 3 (lowest) to show relative standing within the ratings categories. Moody’s rates the creditworthiness of short-term U.S.tax-exempt municipal securities from MIG 1/VMIG 1 (highest) to SG (lowest). Fitch rates the creditworthiness of bonds, ranging from AAA (highest) to D (lowest). Credit quality distribution is subject to change and may have changed since the date specified. |
| | | | |
| 6 | | Wells Fargo Pennsylvania Tax-Free Fund | | Fund expenses (unaudited) |
As a shareholder of the Fund, you incur two types of costs: (1) transaction costs, including sales charges (loads) on purchase payments and contingent deferred sales charges (if any) on redemptions and (2) ongoing costs, including management fees, distribution(12b-1) and/or shareholder servicing fees, and other Fund expenses. This example is intended to help you understand your ongoing costs (in dollars) of investing in the Fund and to compare these costs with the ongoing costs of investing in other mutual funds.
The example is based on an investment of $1,000 invested at the beginning of thesix-month period and held for the entire period from July 1, 2018 to December 31, 2018.
Actual expenses
The “Actual” line of the table below provides information about actual account values and actual expenses. You may use the information in this line, together with the amount you invested, to estimate the expenses that you paid over the period. Simply divide your account value by $1,000 (for example, an $8,600 account value divided by $1,000 = 8.6), then multiply the result by the number in the “Actual” line under the heading entitled “Expenses paid during period” for your applicable class of shares to estimate the expenses you paid on your account during this period.
Hypothetical example for comparison purposes
The “Hypothetical” line of the table below provides information about hypothetical account values and hypothetical expenses based on the Fund’s actual expense ratio and an assumed rate of return of 5% per year before expenses, which is not the Fund’s actual return. The hypothetical account values and expenses may not be used to estimate the actual ending account balance or expenses you paid for the period. You may use this information to compare the ongoing costs of investing in the Fund and other funds. To do so, compare this 5% hypothetical example with the 5% hypothetical examples that appear in the shareholder reports of the other funds.
Please note that the expenses shown in the table are meant to highlight your ongoing costs only and do not reflect any transactional costs, such as sales charges (loads) and contingent deferred sales charges. Therefore, the “Hypothetical” line of the table is useful in comparing ongoing costs only and will not help you determine the relative total costs of owning different funds. In addition, if these transactional costs were included, your costs would have been higher.
| | | | | | | | | | | | | | | | |
| | | Beginning account value 7-1-2018 | | | Ending account value 12-31-2018 | | | Expenses paid during the period¹ | | | Annualized net expense ratio | |
Class A | | | | | | | | | | | | | | | | |
| | | | |
Actual | | $ | 1,000.00 | | | $ | 1,013.18 | | | $ | 3.75 | | | | 0.74 | % |
| | | | |
Hypothetical (5% return before expenses) | | $ | 1,000.00 | | | $ | 1,021.48 | | | $ | 3.77 | | | | 0.74 | % |
Class C | | | | | | | | | | | | | | | | |
| | | | |
Actual | | $ | 1,000.00 | | | $ | 1,010.24 | | | $ | 7.55 | | | | 1.49 | % |
| | | | |
Hypothetical (5% return before expenses) | | $ | 1,000.00 | | | $ | 1,017.69 | | | $ | 7.58 | | | | 1.49 | % |
Institutional Class | | | | | | | | | | | | | | | | |
| | | | |
Actual | | $ | 1,000.00 | | | $ | 1,014.45 | | | $ | 2.49 | | | | 0.49 | % |
| | | | |
Hypothetical (5% return before expenses) | | $ | 1,000.00 | | | $ | 1,022.74 | | | $ | 2.50 | | | | 0.49 | % |
| 1 | Expenses paid is equal to the annualized net expense ratio of each class multiplied by the average account value over the period, multiplied by the number of days in the most recent fiscal half-year divided by the number of days in the fiscal year (to reflect theone-half-year period). |
| | | | | | |
| Portfolio of investments—December 31, 2018 (unaudited) | | Wells Fargo Pennsylvania Tax-Free Fund | | | 7 | |
| | | | | | | | | | | | | | | | |
| Security name | | Interest rate | | | Maturity date | | | Principal | | | Value | |
| | | | |
Municipal Obligations: 99.11% | | | | | | | | | | | | | | | | |
| | | | |
Florida: 0.78% | | | | | | | | | | | | | | | | |
| | | | |
| Industrial Development Revenue: 0.78% | | | | | | | | | | | | | | | | |
| | | | |
Jacksonville FL Economic Development AMT Metropolitan Parking Solutions Project (ACA Insured) | | | 5.50 | % | | | 10-1-2030 | | | $ | 1,000,000 | | | $ | 1,001,470 | |
| | | | | | | | | | | | | | | | |
| | | | |
Guam: 0.47% | | | | | | | | | | | | | | | | |
| | | | |
| Airport Revenue: 0.47% | | | | | | | | | | | | | | | | |
| | | | |
Guam Port Authority AMT Series B | | | 5.00 | | | | 7-1-2032 | | | | 550,000 | | | | 601,733 | |
| | | | | | | | | | | | | | | | |
| | | | |
Pennsylvania: 97.86% | | | | | | | | | | | | | | | | |
| | | | |
| Airport Revenue: 1.30% | | | | | | | | | | | | | | | | |
| | | | |
Philadelphia PA Airport Refunding Bond AMT Series A | | | 5.00 | | | | 6-15-2030 | | | | 1,500,000 | | | | 1,670,070 | |
| | | | | | | | | | | | | | | | |
| | | | |
| Education Revenue: 33.40% | | | | | | | | | | | | | | | | |
| | | | |
Allegheny County PA Higher Education Building Authority Refunding Bond Duquesne University of The Holy Spirit Series A | | | 5.00 | | | | 3-1-2029 | | | | 1,135,000 | | | | 1,280,155 | |
| | | | |
Chester County PA IDA Avon Grove Charter School Project Refunding Bond Series A | | | 5.00 | | | | 12-15-2047 | | | | 1,160,000 | | | | 1,181,762 | |
| | | | |
Chester County PA IDA Collegium Charter School Project Refunding Bond Series A | | | 5.00 | | | | 10-15-2022 | | | | 1,390,000 | | | | 1,423,277 | |
| | | | |
Chester County PA IDA Collegium Charter School Project Series A | | | 5.13 | | | | 10-15-2037 | | | | 1,000,000 | | | | 1,011,020 | |
| | | | |
Chester County PA IDA Renaissance Academy Charter School Project | | | 3.75 | | | | 10-1-2024 | | | | 705,000 | | | | 713,636 | |
| | | | |
Delaware County PA IDA Chester Community Charter School Series A | | | 5.00 | | | | 8-15-2020 | | | | 1,230,000 | | | | 1,206,064 | |
| | | | |
General Authority of South Central Pennsylvania Association of Independent Colleges & Universities | | | 6.00 | | | | 11-1-2031 | | | | 2,500,000 | | | | 2,731,050 | |
| | | | |
Lycoming County PA Authority Pennsylvania College of Technology | | | 5.50 | | | | 7-1-2026 | | | | 3,000,000 | | | | 3,242,820 | |
| | | | |
Montgomery County PA Higher Education & Health Authority Refunding Bond Arcadia University | | | 5.00 | | | | 4-1-2030 | | | | 1,500,000 | | | | 1,631,295 | |
| | | | |
North Eastern PA Hospital & Education Authority Refunding Bond Wilkes University Project Series B | | | 5.25 | | | | 3-1-2037 | | | | 1,000,000 | | | | 1,078,990 | |
| | | | |
Pennsylvania HEFAR Shippensburg University Project | | | 5.00 | | | | 10-1-2020 | | | | 1,075,000 | | | | 1,126,385 | |
| | | | |
Pennsylvania HEFAR Shippensburg University Project | | | 6.00 | | | | 10-1-2031 | | | | 3,000,000 | | | | 3,319,650 | |
| | | | |
Pennsylvania HEFAR Temple University First Series | | | 5.00 | | | | 4-1-2032 | | | | 1,000,000 | | | | 1,075,460 | |
| | | | |
Pennsylvania Public School Building Authority Northampton County Area Community College Project | | | 5.50 | | | | 3-1-2031 | | | | 5,000,000 | | | | 5,334,200 | |
| | | | |
Pennsylvania Public School Building Authority Northampton County Area Community College Project Series A (Build America Mutual Assurance Company Insured) | | | 5.00 | | | | 6-15-2027 | | | | 1,610,000 | | | | 1,742,793 | |
| | | | |
Pennsylvania State University Refunding Bond Series B | | | 5.00 | | | | 9-1-2034 | | | | 2,175,000 | | | | 2,517,410 | |
| | | | |
Philadelphia PA Authority for Industrial Louisiana Salle University | | | 5.00 | | | | 5-1-2036 | | | | 1,355,000 | | | | 1,423,983 | |
| | | | |
Philadelphia PA IDA 1st Philadelphia Preparatory Charter School Project Series A | | | 7.00 | | | | 6-15-2033 | | | | 1,000,000 | | | | 1,104,370 | |
| | | | |
Philadelphia PA IDA Charter School Project Series A | | | 5.30 | | | | 9-15-2027 | | | | 4,750,000 | | | | 4,752,850 | |
| | | | |
Philadelphia PA IDA Global Leadership Academy Project | | | 5.13 | | | | 11-15-2020 | | | | 525,000 | | | | 533,416 | |
| | | | |
Philadelphia PA IDA Global Leadership Academy Project | | | 5.75 | | | | 11-15-2030 | | | | 1,000,000 | | | | 1,014,920 | |
| | | | |
Philadelphia PA IDA Tacony Academy Charter School Project | | | 6.88 | | | | 6-15-2033 | | | | 1,000,000 | | | | 1,078,080 | |
| | | | |
Philadelphia PA IDA Temple University 1st Series 2016 | | | 5.00 | | | | 4-1-2029 | | | | 1,000,000 | | | | 1,137,470 | |
| | | | |
Philadelphia PA IDA West Philadelphia Achievement Charter Elementary School Project | | | 7.50 | | | | 5-1-2031 | | | | 1,285,000 | | | | 1,371,815 | |
| | | | |
| | | | | | | | | | | | | | | 43,032,871 | |
| | | | | | | | | | | | | | | | |
| | | | |
| GO Revenue: 15.31% | | | | | | | | | | | | | | | | |
| | | | |
Allegheny County PA SeriesC-65 | | | 5.50 | | | | 5-1-2024 | | | | 2,000,000 | | | | 2,166,940 | |
| | | | |
Central Dauphin PA School District | | | 5.00 | | | | 2-1-2037 | | | | 2,075,000 | | | | 2,312,505 | |
The accompanying notes are an integral part of these financial statements.
| | | | |
| 8 | | Wells Fargo Pennsylvania Tax-Free Fund | | Portfolio of investments—December 31, 2018 (unaudited) |
| | | | | | | | | | | | | | | | |
| Security name | | Interest rate | | | Maturity date | | | Principal | | | Value | |
|
| GO Revenue(continued) | |
| | | | |
Downingtown PA Area School District Series C | | | 5.00 | % | | | 8-1-2032 | | | $ | 1,000,000 | | | $ | 1,159,610 | |
| | | | |
Philadelphia PA Refunding Bond Series A | | | 5.25 | | | | 7-15-2033 | | | | 1,500,000 | | | | 1,662,480 | |
| | | | |
Philadelphia PA School District Refunding Bond Series A (AGM/FGIC Insured) | | | 5.00 | | | | 6-1-2024 | | | | 1,420,000 | | | | 1,563,420 | |
| | | | |
Philadelphia PA School District Refunding Bond Series C | | | 5.00 | | | | 9-1-2021 | | | | 1,395,000 | | | | 1,495,384 | |
| | | | |
Philadelphia PA School District Series B | | | 5.00 | | | | 9-1-2043 | | | | 1,235,000 | | | | 1,345,495 | |
| | | | |
Philadelphia PA Series A | | | 5.00 | | | | 8-1-2036 | | | | 1,250,000 | | | | 1,381,038 | |
| | | | |
Pittsburgh PA (Build America Mutual Assurance Company Insured) | | | 5.00 | | | | 9-1-2030 | | | | 500,000 | | | | 559,980 | |
| | | | |
Pittsburgh PA Moon Area School District Series A | | | 5.00 | | | | 11-15-2029 | | | | 1,445,000 | | | | 1,607,577 | |
| | | | |
Reading PA School District Series A (AGM Insured) | | | 5.00 | | | | 2-1-2033 | | | | 1,500,000 | | | | 1,671,690 | |
| | | | |
West Mifflin PA Area School District (AGM Insured) | | | 5.00 | | | | 4-1-2028 | | | | 1,000,000 | | | | 1,129,880 | |
| | | | |
West Shore PA School District | | | 5.00 | | | | 11-15-2048 | | | | 1,500,000 | | | | 1,666,515 | |
| | | | |
| | | | | | | | | | | | | | | 19,722,514 | |
| | | | | | | | | | | | | | | | |
|
| Health Revenue: 9.92% | |
| | | | |
Allegheny County PA Hospital Development Authority Health Center Series B (National Insured) | | | 6.00 | | | | 7-1-2027 | | | | 1,800,000 | | | | 2,252,862 | |
| | | | |
Berks County PA IDA Tower Health Project | | | 5.00 | | | | 11-1-2037 | | | | 1,295,000 | | | | 1,428,942 | |
| | | | |
Cumberland County PA Municipal Authority Diakon Lutheran Ministries Project | | | 5.00 | | | | 1-1-2028 | | | | 2,090,000 | | | | 2,258,203 | |
| | | | |
Dauphin County PA General Authority Pinnacle Health System Project | | | 5.00 | | | | 6-1-2042 | | | | 500,000 | | | | 530,180 | |
| | | | |
Dauphin County PA General Authority Pinnacle Health System Project Series A | | | 5.00 | | | | 6-1-2035 | | | | 1,000,000 | | | | 1,109,540 | |
| | | | |
East Hempfield Township PA IDA Willow Valley Communities Project Refunding Bond | | | 5.00 | | | | 12-1-2028 | | | | 450,000 | | | | 504,297 | |
| | | | |
East Hempfield Township PA IDA Willow Valley Communities Project Refunding Bond | | | 5.00 | | | | 12-1-2029 | | | | 375,000 | | | | 418,268 | |
| | | | |
Montgomery County PA IDA Jefferson Health System Series A | | | 5.00 | | | | 10-1-2027 | | | | 1,000,000 | | | | 1,078,700 | |
| | | | |
Northampton County PA St. Luke’s Hospital of Bethlehem Series A | | | 5.00 | | | | 8-15-2033 | | | | 1,435,000 | | | | 1,540,530 | |
| | | | |
Pennsylvania Higher Educational University Pennsylvania Health System Series A | | | 5.00 | | | | 8-15-2047 | | | | 1,500,000 | | | | 1,655,505 | |
| | | | |
| | | | | | | | | | | | | | | 12,777,027 | |
| | | | | | | | | | | | | | | | |
| | | | |
| Housing Revenue: 1.05% | | | | | | | | | | | | | | | | |
| | | | |
Chester County PA IDA University Student Housing LLC Project Series A | | | 5.00 | | | | 8-1-2030 | | | | 555,000 | | | | 582,966 | |
| | | | |
Pennsylvania Housing Finance Agency SFMR Series 112 | | | 5.00 | | | | 4-1-2028 | | | | 755,000 | | | | 776,578 | |
| | | | |
| | | | | | | | | | | | | | | 1,359,544 | |
| | | | | | | | | | | | | | | | |
| | | | |
| Miscellaneous Revenue: 18.77% | | | | | | | | | | | | | | | | |
| | | | |
Delaware County PA Authority Neumann University Refunding Bond | | | 5.00 | | | | 10-1-2031 | | | | 1,500,000 | | | | 1,617,225 | |
| | | | |
Delaware County PA Vocational & Technical School Authority (Build America Mutual Assurance Company Insured) | | | 5.25 | | | | 11-1-2033 | | | | 1,000,000 | | | | 1,107,020 | |
| | | | |
Delaware Valley PA Regional Finance Authority Local Government Series A (Ambac Insured) | | | 5.50 | | | | 8-1-2028 | | | | 4,390,000 | | | | 5,297,633 | |
| | | | |
Pennsylvania Certificate of Participation Series A | | | 5.00 | | | | 7-1-2038 | | | | 1,000,000 | | | | 1,109,170 | |
| | | | |
Pennsylvania Financing Authority Pennsylvania Hills Project CAB Series B (National Insured) (z) | | | 4.37 | | | | 12-1-2022 | | | | 1,200,000 | | | | 1,077,588 | |
| | | | |
Pennsylvania Financing Authority Pennsylvania Hills Project CAB Series B (National Insured) (z) | | | 4.51 | | | | 12-1-2023 | | | | 3,790,000 | | | | 3,296,656 | |
| | | | |
Pennsylvania Public School Building Authority Chester Upland School District Project Series B | | | 5.25 | | | | 9-15-2030 | | | | 540,000 | | | | 612,490 | |
| | | | |
Pennsylvania Public School Building Authority Chester Upland School District Project Series C (AGM Insured) | | | 5.00 | | | | 9-15-2026 | | | | 875,000 | | | | 927,973 | |
| | | | |
Pennsylvania Public School Building Authority SeriesB-2 (Build America Mutual Assurance Company Insured) | | | 5.00 | | | | 12-1-2027 | | | | 1,010,000 | | | | 1,134,351 | |
| | | | |
Pennsylvania Turnpike Commission Series A (AGM Insured) | | | 5.25 | | | | 7-15-2021 | | | | 2,000,000 | | | | 2,161,840 | |
The accompanying notes are an integral part of these financial statements.
| | | | | | |
| Portfolio of investments—December 31, 2018 (unaudited) | | Wells Fargo Pennsylvania Tax-Free Fund | | | 9 | |
| | | | | | | | | | | | | | | | |
| Security name | | Interest rate | | | Maturity date | | | Principal | | | Value | |
|
| Miscellaneous Revenue(continued) | |
| | | | |
Philadelphia PA Authority for Industrial Development City Agreement Green Bond Museum Art Energy Saving Program Series A | | | 5.00 | % | | | 2-15-2038 | | | $ | 785,000 | | | $ | 869,097 | |
| | | | |
Philadelphia PA IDA Refunding Bond Cultural & Commercial Corridors Program Series A | | | 5.00 | | | | 12-1-2028 | | | | 2,500,000 | | | | 2,816,575 | |
| | | | |
Southeastern Pennsylvania Transportation Authority | | | 5.00 | | | | 6-1-2028 | | | | 2,000,000 | | | | 2,146,380 | |
| | | | |
| | | | | | | | | | | | | | | 24,173,998 | |
| | | | | | | | | | | | | | | | |
|
| Tax Revenue: 4.93% | |
| | | | |
Allegheny County PA Port Authority Refunding Bond | | | 5.75 | | | | 3-1-2029 | | | | 3,000,000 | | | | 3,232,710 | |
| | | | |
Pittsburgh & Allegheny Counties PA Sports & Exhibition Authority (AGM Insured) | | | 5.00 | | | | 2-1-2031 | | | | 3,000,000 | | | | 3,120,000 | |
| | | | |
| | | | | | | | | | | | | | | 6,352,710 | |
| | | | | | | | | | | | | | | | |
|
| Transportation Revenue: 5.75% | |
| | | | |
Delaware River PA Joint Toll Bridge Commission | | | 5.00 | | | | 7-1-2042 | | | | 580,000 | | | | 652,523 | |
| | | | |
Pennsylvania Turnpike Commission SeriesA-1 | | | 5.00 | | | | 12-1-2047 | | | | 1,000,000 | | | | 1,101,080 | |
| | | | |
Pennsylvania Turnpike Commission SeriesA-2 | | | 5.00 | | | | 12-1-2048 | | | | 2,000,000 | | | | 2,219,280 | |
| | | | |
Pennsylvania Turnpike Commission Subordinate Bond Series A | | | 5.50 | | | | 12-1-2042 | | | | 3,000,000 | | | | 3,435,930 | |
| | | | |
| | | | | | | | | | | | | | | 7,408,813 | |
| | | | | | | | | | | | | | | | |
|
| Water & Sewer Revenue: 7.43% | |
| | | | |
Capital Region Pennsylvania Water and Sewer System Refunding Bond | | | 5.00 | | | | 7-15-2037 | | | | 1,000,000 | | | | 1,123,940 | |
| | | | |
Lehigh County PA General Purpose Authority CAB Allentown Project (z) | | | 5.91 | | | | 12-1-2030 | | | | 2,000,000 | | | | 1,289,340 | |
| | | | |
McKeesport PA Municipal Authority (AGM Insured) | | | 5.50 | | | | 12-15-2027 | | | | 2,405,000 | | | | 2,652,953 | |
| | | | |
Pennsylvania Commonwealth Financing Authority Series B | | | 5.00 | | | | 6-1-2026 | | | | 1,000,000 | | | | 1,081,580 | |
| | | | |
Philadelphia PA Water & Wastewater Refunding Bond | | | 5.00 | | | | 10-1-2030 | | | | 1,000,000 | | | | 1,152,180 | |
| | | | |
Philadelphia PA Water & Wastewater Refunding Bond Series A | | | 5.00 | | | | 10-1-2038 | | | | 2,000,000 | | | | 2,274,100 | |
| | | | |
| | | | | | | | | | | | | | | 9,574,093 | |
| | | | | | | | | | | | | | | | |
| |
Total Municipal Obligations (Cost $123,109,061) | | | | 127,674,843 | |
| | | | | | | | | | | | | | | | |
| | | | |
| | | Yield | | | | | | Shares | | | | |
| Short-Term Investments: 0.54% | |
|
| Investment Companies: 0.54% | |
| | | | |
Wells Fargo Municipal Cash Management Money Market Fund Institutional Class (l)(u) | | | 1.65 | | | | | | | | 695,856 | | | | 696,134 | |
| | | | | | | | | | | | | | | | |
| |
Total Short-Term Investments (Cost $696,134) | | | | 696,134 | |
| | | | | | | | | | | | | | | | |
| | | | | | | | |
| Total investments in securities (Cost $123,805,195) | | | 99.65 | % | | | 128,370,977 | |
| | |
Other assets and liabilities, net | | | 0.35 | | | | 449,301 | |
| | | | | | | | |
| Total net assets | | | 100.00 | % | | $ | 128,820,278 | |
| | | | | | | | |
| (z) | Zero coupon security. The rate represents the purchase yield to maturity. |
| (l) | The issuer of the security is an affiliated person of the Fund as defined in the Investment Company Act of 1940. |
| (u) | The rate represents the7-day annualized yield at period end. |
The accompanying notes are an integral part of these financial statements.
| | | | |
| 10 | | Wells Fargo Pennsylvania Tax-Free Fund | | Portfolio of investments—December 31, 2018 (unaudited) |
Abbreviations:
| ACA | ACA Financial Guaranty Corporation |
| AGM | Assured Guaranty Municipal |
| Ambac | Ambac Financial Group Incorporated |
| AMT | Alternative minimum tax |
| CAB | Capital appreciation bond |
| FGIC | Financial Guaranty Insurance Corporation |
| HEFAR | Higher Education Facilities Authority Revenue |
| IDA | Industrial Development Authority |
| National | National Public Finance Guarantee Corporation |
| SFMR | Single-family mortgage revenue |
Investments in Affiliates
An affiliated investment is an investment in which the Fund owns at least 5% of the outstanding voting shares of the issuer or as a result of other relationships, such as the Fund and the issuer having the same investment manager. Transactions with issuers that were either affiliated persons of the Fund at the beginning of the period or the end of the period were as follows:
| | | | | | | | | | | | | | | | | | | | | | | | | | | | | | | | | | | | |
| | | Shares,
beginning of
period | | | Shares
purchased | | | Shares
sold | | | Shares,
end of
period | | | Net
realized
gains
(losses) | | | Net
change in
unrealized
gains
(losses) | | | Income
from
affiliated
securities | | | Value,
end
of period | | | % of
net
assets | |
Short-Term Investments | | | | | | | | | | | | | | | | | | | | | | | | | | | | | | | | | | | | |
Investment Companies | | | | | | | | | | | | | | | | | | | | | | | | | | | | | | | | | | | | |
Wells Fargo Municipal Cash Management Money Market Fund Institutional Class | | | 610,062 | | | | 15,370,099 | | | | 15,284,305 | | | | 695,856 | | | $ | (507 | ) | | $ | 0 | | | $ | 5,236 | | | $ | 696,134 | | | | 0.54 | % |
The accompanying notes are an integral part of these financial statements.
| | | | | | |
| Statement of assets and liabilities—December 31, 2018 (unaudited) | | Wells Fargo Pennsylvania Tax-Free Fund | | | 11 | |
| | | | |
| | | | |
| |
Assets | | | | |
Investments in unaffiliated securities, at value (cost $123,109,061) | | $ | 127,674,843 | |
Investments in affiliated securities, at value (cost $696,134) | | | 696,134 | |
Cash | | | 103,582 | |
Receivable for Fund shares sold | | | 172,300 | |
Receivable for interest | | | 1,532,164 | |
Prepaid expenses and other assets | | | 63,283 | |
| | | | |
Total assets | | | 130,242,306 | |
| | | | |
| |
Liabilities | | | | |
Payable for Fund shares redeemed | | | 1,187,225 | |
Dividends payable | | | 157,081 | |
Management fee payable | | | 27,990 | |
Administration fees payable | | | 12,711 | |
Distribution fee payable | | | 7,961 | |
Trustees’ fees and expenses payable | | | 677 | |
Accrued expenses and other liabilities | | | 28,383 | |
| | | | |
Total liabilities | | | 1,422,028 | |
| | | | |
Total net assets | | $ | 128,820,278 | |
| | | | |
| |
NET ASSETS CONSIST OF | | | | |
Paid-in capital | | $ | 125,272,981 | |
Total distributable earnings | | | 3,547,297 | |
| | | | |
Total net assets | | $ | 128,820,278 | |
| | | | |
| |
COMPUTATION OF NET ASSET VALUE AND OFFERING PRICE PER SHARE | | | | |
Net assets – Class A | | $ | 37,559,797 | |
Shares outstanding – Class A1 | | | 3,282,907 | |
Net asset value per share – Class A | | | $11.44 | |
Maximum offering price per share – Class A2 | | | $11.98 | |
Net assets – Class C | | $ | 12,087,074 | |
Shares outstanding – Class C1 | | | 1,058,422 | |
Net asset value per share – Class C | | | $11.42 | |
Net assets – Institutional Class | | $ | 79,173,407 | |
Shares outstanding – Institutional Class1 | | | 6,920,071 | |
Net asset value per share – Institutional Class | | | $11.44 | |
| 1 | The Fund has an unlimited number of authorized shares. |
| 2 | Maximum offering price is computed as 100/95.50 of net asset value. On investments of $50,000 or more, the offering price is reduced. |
The accompanying notes are an integral part of these financial statements.
| | | | |
| 12 | | Wells Fargo Pennsylvania Tax-Free Fund | | Statement of operations—six months ended December 31, 2018 (unaudited) |
| | | | |
| | | | |
| |
Investment income | | | | |
Interest | | $ | 2,757,550 | |
Income from affiliated securities | | | 5,236 | |
| | | | |
Total investment income | | | 2,762,786 | |
| | | | |
| |
Expenses | | | | |
Management fee | | | 274,133 | |
Administration fees | |
Class A | | | 31,588 | |
Class C | | | 10,147 | |
Institutional Class | | | 33,959 | |
Shareholder servicing fees | |
Class A | | | 49,356 | |
Class C | | | 15,855 | |
Distribution fee | |
Class C | | | 47,566 | |
Custody and accounting fees | | | 5,128 | |
Professional fees | | | 28,169 | |
Registration fees | | | 30,573 | |
Shareholder report expenses | | | 5,671 | |
Trustees’ fees and expenses | | | 10,454 | |
Other fees and expenses | | | 8,326 | |
| | | | |
Total expenses | | | 550,925 | |
Less: Fee waivers and/or expense reimbursements | | | (102,334 | ) |
| | | | |
Net expenses | | | 448,591 | |
| | | | |
Net investment income | | | 2,314,195 | |
| | | | |
| |
REALIZED AND UNREALIZED GAINS (LOSSES) ON INVESTMENTS | | | | |
|
Net realized gains (losses) on: | |
Unaffiliated securities | | | 574,997 | |
Affiliated securities | | | (507 | ) |
| | | | |
Net realized gains on investments | | | 574,490 | |
Net change in unrealized gains (losses) on investments | | | (1,058,911 | ) |
| | | | |
Net realized and unrealized gains (losses) on investments | | | (484,421 | ) |
| | | | |
Net increase in net assets resulting from operations | | $ | 1,829,774 | |
| | | | |
The accompanying notes are an integral part of these financial statements.
| | | | | | |
| Statement of changes in net assets | | Wells Fargo Pennsylvania Tax-Free Fund | | | 13 | |
| | | | | | | | | | | | | | | | |
| | | Six months ended
December 31, 2018 (unaudited) | | | Year ended
June 30, 20181 | |
| | | | |
Operations | | | | | | | | | | | | | | | | |
Net investment income | | | | | | $ | 2,314,195 | | | | | | | $ | 5,180,475 | |
Net realized gains (losses) on investments | | | | | | | 574,490 | | | | | | | | (508,073 | ) |
Net change in unrealized gains (losses) on investments | | | | | | | (1,058,911 | ) | | | | | | | (2,064,312 | ) |
| | | | |
Net increase in net assets resulting from operations | | | | | | | 1,829,774 | | | | | | | | 2,608,090 | |
| | | | |
| | | | |
Distributions to shareholders from net investment income and net realized gains | | | | | | | | | | | | | | | | |
Class A | | | | | | | (650,193 | ) | | | | | | | (1,414,368 | ) |
Class C | | | | | | | (161,244 | ) | | | | | | | (375,013 | ) |
Institutional Class | | | | | | | (1,502,758 | ) | | | | | | | (3,391,139 | ) |
| | | | |
Total distributions to shareholders | | | | | | | (2,314,195 | ) | | | | | | | (5,180,520 | ) |
| | | | |
| | | | |
Capital share transactions | | | Shares | | | | | | | | Shares | | | | | |
Proceeds from shares sold | | | | | | | | | | | | | | | | |
Class A | | | 69,786 | | | | 795,705 | | | | 118,953 | | | | 1,379,864 | |
Class C | | | 29,822 | | | | 340,437 | | | | 82,087 | | | | 955,484 | |
Institutional Class | | | 230,957 | | | | 2,626,027 | | | | 744,498 | | | | 8,653,257 | |
| | | | |
| | | | | | | 3,762,169 | | | | | | | | 10,988,605 | |
| | | | |
Reinvestment of distributions | | | | | | | | | | | | | | | | |
Class A | | | 53,302 | | | | 607,370 | | | | 114,924 | | | | 1,331,480 | |
Class C | | | 13,550 | | | | 154,126 | | | | 30,457 | | | | 352,246 | |
Institutional Class | | | 47,913 | | | | 545,945 | | | | 97,749 | | | | 1,132,476 | |
| | | | |
| | | | | | | 1,307,441 | | | | | | | | 2,816,202 | |
| | | | |
Payment for shares redeemed | | | | | | | | | | | | | | | | |
Class A | | | (383,657 | ) | | | (4,374,252 | ) | | | (579,470 | ) | | | (6,706,633 | ) |
Class C | | | (158,256 | ) | | | (1,800,367 | ) | | | (340,707 | ) | | | (3,941,718 | ) |
Institutional Class | | | (1,084,930 | ) | | | (12,357,706 | ) | | | (1,914,913 | ) | | | (22,193,663 | ) |
| | | | |
| | | | | | | (18,532,325 | ) | | | | | | | (32,842,014 | ) |
| | | | |
Net decrease in net assets resulting from capital share transactions | | | | | | | (13,462,715 | ) | | | | | | | (19,037,207 | ) |
| | | | |
Total decrease in net assets | | | | | | | (13,947,136 | ) | | | | | | | (21,609,637 | ) |
| | | | |
| | | | |
Net assets | | | | | | | | | | | | | | | | |
Beginning of period | | | | | | | 142,767,414 | | | | | | | | 164,377,051 | |
| | | | |
End of period | | | | | | $ | 128,820,278 | | | | | | | $ | 142,767,414 | |
| | | | |
| 1 | Effective for all filings after November 4, 2018, the SEC prospectively eliminated the requirement to parenthetically disclose undistributed net investment income at the end of the period and permitted the aggregation of distributions, with the exception of tax basis returns of capital. Overdistributed net investment income at June 30, 2018 was $200,538. The disaggregated distributions information for the year ended June 30, 2018 is included in Note 7,Distributions to Shareholders,in the notes to the financial statements. |
The accompanying notes are an integral part of these financial statements.
| | | | |
| 14 | | Wells Fargo Pennsylvania Tax-Free Fund | | Financial highlights |
(For a share outstanding throughout each period)
| | | | | | | | | | | | | | | | | | | | | | | | |
| | | Six months ended
December 31, 2018 (unaudited) | | | Year ended June 30 | |
| CLASS A | | 2018 | | | 2017 | | | 2016 | | | 2015 | | | 2014 | |
Net asset value, beginning of period | | | $11.48 | | | | $11.67 | | | | $12.13 | | | | $11.75 | | | | $11.65 | | | | $11.36 | |
Net investment income | | | 0.19 | | | | 0.38 | | | | 0.36 | | | | 0.38 | | | | 0.42 | | | | 0.43 | |
Net realized and unrealized gains (losses) on investments | | | (0.04 | ) | | | (0.19 | ) | | | (0.46 | ) | | | 0.38 | | | | 0.09 | | | | 0.29 | |
| | | | | | | | | | | | | | | | | | | | | | | | |
Total from investment operations | | | 0.15 | | | | 0.19 | | | | (0.10 | ) | | | 0.76 | | | | 0.51 | | | | 0.72 | |
Distributions to shareholders from | | | | | | | | | | | | | | | | | | | | | | | | |
Net investment income | | | (0.19 | ) | | | (0.38 | ) | | | (0.36 | ) | | | (0.38 | ) | | | (0.41 | ) | | | (0.43 | ) |
Net asset value, end of period | | | $11.44 | | | | $11.48 | | | | $11.67 | | | | $12.13 | | | | $11.75 | | | | $11.65 | |
Total return1 | | | 1.32 | % | | | 1.62 | % | | | (0.83 | )% | | | 6.62 | % | | | 4.44 | % | | | 6.45 | % |
Ratios to average net assets (annualized) | | | | | | | | | | | | | | | | | | | | | | | | |
Gross expenses | | | 0.94 | % | | | 0.91 | % | | | 0.90 | % | | | 0.90 | % | | | 0.90 | % | | | 0.91 | % |
Net expenses | | | 0.74 | % | | | 0.74 | % | | | 0.74 | % | | | 0.74 | % | | | 0.74 | % | | | 0.74 | % |
Net investment income | | | 3.29 | % | | | 3.25 | % | | | 3.02 | % | | | 3.23 | % | | | 3.54 | % | | | 3.75 | % |
Supplemental data | | | | | | | | | | | | | | | | | | | | | | | | |
Portfolio turnover rate | | | 4 | % | | | 10 | % | | | 20 | % | | | 13 | % | | | 15 | % | | | 15 | % |
Net assets, end of period (000s omitted) | | | $37,560 | | | | $40,664 | | | | $45,381 | | | | $55,352 | | | | $47,323 | | | | $44,500 | |
| 1 | Total return calculations do not include any sales charges. Returns for periods of less than one year are not annualized. |
The accompanying notes are an integral part of these financial statements.
| | | | | | |
| Financial highlights | | Wells Fargo Pennsylvania Tax-Free Fund | | | 15 | |
(For a share outstanding throughout each period)
| | | | | | | | | | | | | | | | | | | | | | | | |
| | | Six months ended
December 31, 2018 (unaudited) | | | Year ended June 30 | |
| CLASS C | | 2018 | | | 2017 | | | 2016 | | | 2015 | | | 2014 | |
Net asset value, beginning of period | | | $11.45 | | | | $11.65 | | | | $12.11 | | | | $11.73 | | | | $11.63 | | | | $11.34 | |
Net investment income | | | 0.15 | 1 | | | 0.29 | 1 | | | 0.27 | 1 | | | 0.29 | 1 | | | 0.33 | | | | 0.34 | |
Net realized and unrealized gains (losses) on investments | | | (0.03 | ) | | | (0.20 | ) | | | (0.46 | ) | | | 0.38 | | | | 0.09 | | | | 0.29 | |
| | | | | | | | | | | | | | | | | | | | | | | | |
Total from investment operations | | | 0.12 | | | | 0.09 | | | | (0.19 | ) | | | 0.67 | | | | 0.42 | | | | 0.63 | |
Distributions to shareholders from | | | | | | | | | | | | | | | | | | | | | | | | |
Net investment income | | | (0.15 | ) | | | (0.29 | ) | | | (0.27 | ) | | | (0.29 | ) | | | (0.32 | ) | | | (0.34 | ) |
Net asset value, end of period | | | $11.42 | | | | $11.45 | | | | $11.65 | | | | $12.11 | | | | $11.73 | | | | $11.63 | |
Total return2 | | | 1.02 | % | | | 0.77 | % | | | (1.58 | )% | | | 5.83 | % | | | 3.66 | % | | | 5.67 | % |
Ratios to average net assets (annualized) | | | | | | | | | | | | | | | | | | | | | | | | |
Gross expenses | | | 1.69 | % | | | 1.66 | % | | | 1.65 | % | | | 1.65 | % | | | 1.65 | % | | | 1.66 | % |
Net expenses | | | 1.49 | % | | | 1.49 | % | | | 1.49 | % | | | 1.49 | % | | | 1.49 | % | | | 1.49 | % |
Net investment income | | | 2.54 | % | | | 2.50 | % | | | 2.27 | % | | | 2.46 | % | | | 2.78 | % | | | 3.00 | % |
Supplemental data | | | | | | | | | | | | | | | | | | | | | | | | |
Portfolio turnover rate | | | 4 | % | | | 10 | % | | | 20 | % | | | 13 | % | | | 15 | % | | | 15 | % |
Net assets, end of period (000s omitted) | | | $12,087 | | | | $13,440 | | | | $16,323 | | | | $19,493 | | | | $13,062 | | | | $11,192 | |
| 1 | Calculated based upon average shares outstanding |
| 2 | Total return calculations do not include any sales charges. Returns for periods of less than one year are not annualized. |
The accompanying notes are an integral part of these financial statements.
| | | | |
| 16 | | Wells Fargo Pennsylvania Tax-Free Fund | | Financial highlights |
(For a share outstanding throughout each period)
| | | | | | | | | | | | | | | | | | | | | | | | |
| | | Six months ended
December 31, 2018 (unaudited) | | | Year ended June 30 | |
| INSTITUTIONAL CLASS | | 2018 | | | 2017 | | | 2016 | | | 2015 | | | 2014 | |
Net asset value, beginning of period | | | $11.48 | | | | $11.67 | | | | $12.13 | | | | $11.75 | | | | $11.65 | | | | $11.36 | |
Net investment income | | | 0.20 | | | | 0.40 | | | | 0.39 | 1 | | | 0.41 | 1 | | | 0.44 | | | | 0.45 | |
Net realized and unrealized gains (losses) on investments | | | (0.04 | ) | | | (0.18 | ) | | | (0.46 | ) | | | 0.38 | | | | 0.10 | | | | 0.29 | |
| | | | | | | | | | | | | | | | | | | | | | | | |
Total from investment operations | | | 0.16 | | | | 0.22 | | | | (0.07 | ) | | | 0.79 | | | | 0.54 | | | | 0.74 | |
Distributions to shareholders from | | | | | | | | | | | | | | | | | | | | | | | | |
Net investment income | | | (0.20 | ) | | | (0.41 | ) | | | (0.39 | ) | | | (0.41 | ) | | | (0.44 | ) | | | (0.45 | ) |
Net asset value, end of period | | | $11.44 | | | | $11.48 | | | | $11.67 | | | | $12.13 | | | | $11.75 | | | | $11.65 | |
Total return2 | | | 1.45 | % | | | 1.88 | % | | | (0.58 | )% | | | 6.88 | % | | | 4.70 | % | | | 6.72 | % |
Ratios to average net assets (annualized) | | | | | | | | | | | | | | | | | | | | | | | | |
Gross expenses | | | 0.61 | % | | | 0.58 | % | | | 0.57 | % | | | 0.57 | % | | | 0.57 | % | | | 0.58 | % |
Net expenses | | | 0.49 | % | | | 0.49 | % | | | 0.49 | % | | | 0.49 | % | | | 0.49 | % | | | 0.49 | % |
Net investment income | | | 3.54 | % | | | 3.50 | % | | | 3.27 | % | | | 3.47 | % | | | 3.78 | % | | | 4.00 | % |
Supplemental data | | | | | | | | | | | | | | | | | | | | | | | | |
Portfolio turnover rate | | | 4 | % | | | 10 | % | | | 20 | % | | | 13 | % | | | 15 | % | | | 15 | % |
Net assets, end of period (000s omitted) | | | $79,173 | | | | $88,663 | | | | $102,672 | | | | $132,844 | | | | $106,769 | | | | $119,276 | |
| 1 | Calculated based upon average shares outstanding |
| 2 | Returns for periods of less than one year are not annualized. |
The accompanying notes are an integral part of these financial statements.
| | | | | | |
| Notes to financial statements (unaudited) | | Wells Fargo Pennsylvania Tax-Free Fund | | | 17 | |
1. ORGANIZATION
Wells Fargo Funds Trust (the “Trust”), a Delaware statutory trust organized on March 10, 1999, is anopen-end management investment company registered under the Investment Company Act of 1940, as amended (the “1940 Act”). As an investment company, the Trust follows the accounting and reporting guidance in Financial Accounting Standards Board(“FASB”) Accounting Standards Codification Topic 946, Financial Services – Investment Companies. These financial statements report on the Wells Fargo PennsylvaniaTax-Free Fund (the “Fund”) which is a diversified series of the Trust.
2. SIGNIFICANT ACCOUNTING POLICIES
The following significant accounting policies, which are consistently followed in the preparation of the financial statements of the Fund, are in conformity with U.S. generally accepted accounting principles which require management to make estimates and assumptions that affect the reported amounts of assets and liabilities, disclosure of contingent assets and liabilities at the date of the financial statements, and the reported amounts of revenues and expenses during the reporting period. Actual results could differ from those estimates.
Securities valuation
All investments are valued each business day as of the close of regular trading on the New York Stock Exchange (generally 4 p.m. Eastern Time), although the Fund may deviate from this calculation time under unusual or unexpected circumstances.
Debt securities are valued at the evaluated bid price provided by an independent pricing service (e.g. taking into account various factors, including yields, maturities, or credit ratings) or, if a reliable price is not available, the quoted bid price from an independent broker-dealer.
Investments in registeredopen-end investment companies are valued at net asset value.
Investments which are not valued using any of the methods discussed above are valued at their fair value, as determined in good faith by the Board of Trustees of the Fund. The Board of Trustees has established a Valuation Committee comprised of the Trustees and has delegated to it the authority to take any actions regarding the valuation of portfolio securities that the Valuation Committee deems necessary or appropriate, including determining the fair value of portfolio securities, unless the determination has been delegated to the Wells Fargo Asset Management Pricing Committee at Wells Fargo Funds Management, LLC (“Funds Management”).The Board of Trustees retains the authority to make or ratify any valuation decisions or approve any changes to the Valuation Procedures as it deems appropriate. On a quarterly basis, the Board of Trustees receives reports on any valuation actions taken by the Valuation Committee or the Wells Fargo Asset Management Pricing Committee which may include items for ratification.
When-issued transactions
The Fund may purchase securities on a forward commitment or when-issued basis. The Fund records a when-issued transaction on the trade date and will segregate assets in an amount at least equal in value to the Fund’s commitment to purchase when-issued securities. Securities purchased on a when-issued basis aremarked-to-market daily and the Fund begins earning interest on the settlement date. Losses may arise due to changes in the market value of the underlying securities or if the counterparty does not perform under the contract.
Security transactions and income recognition
Securities transactions are recorded on a trade date basis. Realized gains or losses are recorded on the basis of identified cost.
Interest income is accrued daily and bond discounts are accreted and premiums are amortized daily. To the extent debt obligations are placed onnon-accrual status, any related interest income may be reduced by writing off interest receivables when the collection of all or a portion of interest has been determined to be doubtful based on consistently applied procedures and the fair value has decreased. If the issuer subsequently resumes interest payments or when the collectability of interest is reasonably assured, the debt obligation is removed fromnon-accrual status.
Distributions to shareholders
Distributions to shareholders from net investment income are declared daily and paid monthly. Distributions from net realized gains, if any, are recorded on theex-dividend date and paid at least annually. Such distributions are determined in accordance with income tax regulations and may differ from U.S. generally accepted accounting principles. Dividend sources are estimated at the time of declaration. The tax character of distributions is determined as of the Fund’s fiscal year end. Therefore, a portion of the Fund’s distributions made prior to the Fund’s fiscal year end may be categorized as a tax return of capital at year end.
| | | | |
| 18 | | Wells Fargo Pennsylvania Tax-Free Fund | | Notes to financial statements (unaudited) |
Federal and other taxes
The Fund intends to continue to qualify as a regulated investment company by distributing substantially all of its investment company taxable andtax-exempt income and any net realized capital gains (after reduction for capital loss carryforwards) sufficient to relieve it from all, or substantially all, federal income taxes. Accordingly, no provision for federal income taxes was required.
The Fund’s income and federal excise tax returns and all financial records supporting those returns for the prior three fiscal years are subject to examination by the federal and Delaware revenue authorities. Management has analyzed the Fund’s tax positions taken on federal, state, and foreign tax returns for all open tax years and does not believe that there are any uncertain tax positions that require recognition of a tax liability.
As of December 31, 2018, the aggregate cost of all investments for federal income tax purposes was $123,859,620 and the unrealized gains (losses) consisted of:
| | | | |
| |
Gross unrealized gains | | $ | 4,888,358 | |
| |
Gross unrealized losses | | | (377,001 | ) |
| |
Net unrealized gains | | $ | 4,511,357 | |
As of June 30, 2018, the Fund had capital loss carryforwards which consisted of $829,419 in short-term capital losses and $491,395 in long-term capital losses.
As of June 30, 2018, the Fund had current year deferred post-October capital losses consisting of $17,197 in short-term losses which were recognized on the first day of the current fiscal year.
Class allocations
The separate classes of shares offered by the Fund differ principally in applicable sales charges, distribution, shareholder servicing, and administration fees. Class specific expenses are charged directly to that share class. Investment income, common expenses, and realized and unrealized gains (losses) on investments are allocated daily to each class of shares based on the relative proportion of net assets of each class.
3. FAIR VALUATION MEASUREMENTS
Fair value measurements of investments are determined within a framework that has established a fair value hierarchy based upon the various data inputs utilized in determining the value of the Fund’s investments. The three-level hierarchy gives the highest priority to unadjusted quoted prices in active markets for identical assets or liabilities (Level 1) and the lowest priority to unobservable inputs (Level 3). The Fund’s investments are classified within the fair value hierarchy based on the lowest level of input that is significant to the fair value measurement. The inputs are summarized into three broad levels as follows:
| ∎ | | Level 1 – quoted prices in active markets for identical securities |
| ∎ | | Level 2 – other significant observable inputs (including quoted prices for similar securities, interest rates, prepayment speeds, credit risk, etc.) |
| ∎ | | Level 3 – significant unobservable inputs (including the Fund’s own assumptions in determining the fair value of investments) |
The inputs or methodologies used for valuing investments in securities are not necessarily an indication of the risk associated with investing in those securities.
| | | | | | |
| Notes to financial statements (unaudited) | | Wells Fargo Pennsylvania Tax-Free Fund | | | 19 | |
The following is a summary of the inputs used in valuing the Fund’s assets and liabilities as of December 31, 2018:
| | | | | | | | | | | | | | | | |
| | | | |
| | | Quoted prices
(Level 1) | | | Other significant
observable inputs
(Level 2) | | | Significant
unobservable inputs (Level 3) | | | Total | |
| | | | |
Assets | | | | | | | | | | | | | | | | |
Investments in: | | | | | | | | | | | | | | | | |
| | | | |
Municipal obligations | | $ | 0 | | | $ | 127,674,843 | | | $ | 0 | | | $ | 127,674,843 | |
| | | | |
Short-term investments | | | | | | | | | | | | | | | | |
| | | | |
Investment companies | | | 696,134 | | | | 0 | | | | 0 | | | | 696,134 | |
| | | | |
Total assets | | $ | 696,134 | | | $ | 127,674,843 | | | $ | 0 | | | $ | 128,370,977 | |
Additional sector, industry or geographic detail is included in the Portfolio of Investments.
At December 31, 2018, the Fund did not have any transfers into/out of Level 3.
4. TRANSACTIONS WITH AFFILIATES
Management fee
Funds Management, an indirect wholly owned subsidiary of Wells Fargo & Company (“Wells Fargo”), is the manager of the Fund and provides advisory and fund-level administrative services under an investment management agreement. Under the investment management agreement, Funds Management is responsible for, among other services, implementing the investment objectives and strategies of the Fund, supervising the subadviser and providing fund-level administrative services in connection with the Fund’s operations. As compensation for its services under the investment management agreement, Funds Management is entitled to receive an annual management fee starting at 0.40% and declining to 0.28% as the average daily net assets of the Fund increase. For the six months ended December 31, 2018, the management fee was equivalent to an annual rate of 0.40% of the Fund’s average daily net assets.
Funds Management has retained the services of a subadviser to provide daily portfolio management to the Fund. The fee for subadvisory services is borne by Funds Management. Wells Capital Management Incorporated, an affiliate of Funds Management and an indirect wholly owned subsidiary of Wells Fargo, is the subadviser to the Fund and is entitled to receive a fee from Funds Management at an annual rate starting at 0.20% and declining to 0.10% as the average daily net assets of the Fund increase.
Administration fees
Under a class-level administration agreement, Funds Management provides class-level administrative services to the Fund, which includes paying fees and expenses for services provided by the transfer agent,sub-transfer agents, omnibus account servicers and record-keepers. As compensation for its services under the class-level administration agreement, Funds Management receives an annual fee which is calculated based on the average daily net assets of each class as follows:
| | | | |
| | | Class-level
administration fee | |
| |
Class A, Class C | | | 0.16 | % |
| |
Institutional Class | | | 0.08 | |
Funds Management has contractually waived and/or reimbursed management and administration fees to the extent necessary to maintain certain net operating expense ratios for the Fund. When each class of the Fund has exceeded its expense cap, Funds Management has waived fees and/or reimbursed expenses from fund level expenses on a proportionate basis and then from class specific expenses; otherwise, waivers and/or reimbursements are applied against class specific expenses before fund level expenses. Funds Management has committed through October 31, 2019 to waive fees and/or reimburse expenses to the extent necessary to cap the Fund’s expenses at 0.74% for Class A shares, 1.49% for Class C shares, and 0.49% for Institutional Class shares. After this time, the cap may be increased or the commitment to maintain the cap may be terminated only with the approval of the Board of Trustees.
| | | | |
| 20 | | Wells Fargo Pennsylvania Tax-Free Fund | | Notes to financial statements (unaudited) |
Distribution fee
The Trust has adopted a distribution plan for Class C shares of the Fund pursuant to Rule12b-1 under the 1940 Act. A distribution fee is charged to Class C shares and paid to Wells Fargo Funds Distributor, LLC (“Funds Distributor”), the principal underwriter, at an annual rate of 0.75% of the average daily net assets of Class C shares.
In addition, Funds Distributor is entitled to receive thefront-end sales charge from the purchase of Class A shares and a contingent deferred sales charge on the redemption of certain Class A shares. Funds Distributor is also entitled to receive the contingent deferred sales charges from redemptions of Class C shares. For the six months ended December 31, 2018, Funds Distributor received $1,316 from the sale of Class A shares. No contingent deferred sales charges were incurred by Class A and Class C shares for the six months ended December 31, 2018.
Shareholder servicing fees
The Trust has entered into contracts with one or more shareholder servicing agents, whereby Class A and Class C of the Fund are charged a fee at an annual rate of 0.25% of the average daily net assets of each respective class.
A portion of these total shareholder servicing fees were paid to affiliates of Wells Fargo.
Interfund transactions
The Fund may purchase or sell portfolio investment securities to certain other Wells Fargo affiliates pursuant to Rule17a-7 under the 1940 Act and under procedures adopted by the Board of Trustees. The procedures have been designed to ensure that these interfund transactions, which do not incur broker commissions, are effected at current market prices. Pursuant to these procedures, the Fund had $1,000,000 and $700,000 in interfund purchases and sales, respectively, during the six months ended December 31, 2018.
5. INVESTMENT PORTFOLIO TRANSACTIONS
Purchases and sales of investments, excluding U.S. government obligations (if any) and short-term securities, for the six months ended December 31, 2018 were $5,508,875 and $18,509,930, respectively.
6. BANK BORROWINGS
The Trust (excluding the money market funds), Wells Fargo Master Trust and Wells Fargo Variable Trust are parties to a $280,000,000 revolving credit agreement whereby the Fund is permitted to use bank borrowings for temporary or emergency purposes, such as to fund shareholder redemption requests. Interest under the credit agreement is charged to the Fund based on a borrowing rate equal to the higher of the Federal Funds rate in effect on that day plus 1.25% or the overnight LIBOR rate in effect on that day plus 1.25%. In addition, an annual commitment fee equal to 0.25% of the unused balance is allocated to each participating fund.
For the six months ended December 31, 2018, there were no borrowings by the Fund under the agreement.
7. DISTRIBUTIONS TO SHAREHOLDERS
Effective for all filings after November 4, 2018, the Securities and Exchange Commission eliminated the requirement to separately state the components of distributions to shareholders under U.S. generally accepted accounting principles. The amounts of distributions to shareholders for the year ended June 30, 2018 were as follows:
| | | | |
| | | Net investment income | |
| |
Class A | | $ | 1,414,368 | |
| |
Class C | | | 375,013 | |
| |
Institutional Class | | | 3,391,139 | |
8. CONCENTRATION RISK
The Fund invests a substantial portion of its assets in issuers of municipal debt securities located in a single state or territories of the U.S. Therefore, it may be more affected by economic and political developments in that state or region than would be a comparable generaltax-exempt fund.
9. INDEMNIFICATION
Under the Trust’s organizational documents, the officers and Trustees have been granted certain indemnification rights against certain liabilities that may arise out of performance of their duties to the Trust. Additionally, in the normal course of business, the Trust may enter into contracts with service providers that contain a variety of indemnification clauses. The Trust’s maximum exposure under these arrangements is dependent on future claims that may be made against the Fund and, therefore, cannot be estimated.
| | | | | | |
| Notes to financial statements (unaudited) | | Wells Fargo Pennsylvania Tax-Free Fund | | | 21 | |
10. NEW ACCOUNTING PRONOUNCEMENT
In August 2018, FASB issued Accounting Standards Update (“ASU”)No. 2018-13, Fair Value Measurement (Topic 820)Disclosure Framework—Changes to the Disclosure Requirements for Fair Value Measurement.ASU2018-13 updates the disclosure requirements for fair value measurements by modifying or removing certain disclosures and adding certain new disclosures. The amendments are effective for fiscal years, and interim periods within those fiscal years, beginning after December 15, 2019. Early adoption is permitted. Management has adopted the removal and modification of disclosures early, as permitted, and will adopt the additional new disclosures at the effective date.
| | | | |
| 22 | | Wells Fargo Pennsylvania Tax-Free Fund | | Other information (unaudited) |
PROXY VOTING INFORMATION
A description of the policies and procedures used to determine how to vote proxies relating to portfolio securities is available, upon request, by calling1-800-222-8222, visiting our website atwellsfargofunds.com, or visiting the SEC website at sec.gov. Information regarding how the Fund voted proxies relating to portfolio securities during the most recent12-month period ended June 30 is available on the Fund’s website atwellsfargofunds.comor by visiting the SEC website at sec.gov.
PORTFOLIO HOLDINGS INFORMATION
The complete portfolio holdings for the Fund are publicly available monthly on the Fund’s website (wellsfargofunds.com), on aone-month delayed basis. In addition, top ten holdings information (excluding derivative positions) for the Fund is publicly available on the Fund’s website on a monthly,seven-day or more delayed basis. The Fund files its complete schedule of portfolio holdings with the SEC for the first and third quarters of each fiscal year on FormN-Q, which is available by visiting the SEC website at sec.gov. In addition, the Fund’s FormN-Q may be reviewed and copied at the SEC’s Public Reference Room in Washington, DC, and at regional offices in New York City, at 233 Broadway, and in Chicago, at 175 West Jackson Boulevard, Suite 900. Information about the Public Reference Room may be obtained by calling1-800-SEC-0330.
| | | | | | |
| Other information (unaudited) | | Wells Fargo Pennsylvania Tax-Free Fund | | | 23 | |
BOARD OF TRUSTEES AND OFFICERS
Each of the Trustees and Officers1 listed in the table below acts in identical capacities for each fund in the Wells Fargo family of funds, which consists of 152 mutual funds comprising the Wells Fargo Funds Trust, Wells Fargo Variable Trust, Wells Fargo Master Trust and fourclosed-end funds (collectively the “Fund Complex”). This table should be read in conjunction with the Prospectus and the Statement of Additional Information2. The mailing address of each Trustee and Officer is 525 Market Street, 12th Floor, San Francisco, CA 94105. Each Trustee and Officer serves an indefinite term, however, each Trustee serves such term until reaching the mandatory retirement age established by the Trustees.
Independent Trustees
| | | | | | |
Name and
year of birth | | Position held and
length of service* | | Principal occupations during past five years or longer | | Current other
public company or
investment company
directorships |
| | | |
William R. Ebsworth (Born 1957) | | Trustee, since 2015 | | Retired. From 1984 to 2013, equities analyst, portfolio manager, research director and chief investment officer at Fidelity Management and Research Company in Boston, Tokyo, and Hong Kong, and retired in 2013 as Chief Investment Officer of Fidelity Strategic Advisers, Inc. where he led a team of investment professionals managing client assets. Prior thereto, Board member of Hong Kong Securities Clearing Co., Hong Kong Options Clearing Corp., the Thailand International Fund, Ltd., Fidelity Investments Life Insurance Company, and Empire Fidelity Investments Life Insurance Company. Board member of the Vincent Memorial Hospital Endowment(non-profit organization), where he serves on the Investment Committee and as a Chair of the Audit Committee. Mr. Ebsworth is a CFA® charterholder. | | N/A |
| | | |
| Jane A. Freeman (Born 1953) | | Trustee, since 2015; Chair Liaison,
since 2018 | | Retired. From 2012 to 2014 and 1999 to 2008, Chief Financial Officer of Scientific Learning Corporation. From 2008 to 2012, Ms. Freeman provided consulting services related to strategic business projects. Prior to 1999, Portfolio Manager at Rockefeller & Co. and Scudder, Stevens & Clark. Board member of the Harding Loevner Funds from 1996 to 2014, serving as both Lead Independent Director and chair of the Audit Committee. Board member of the Russell Exchange Traded Funds Trust from 2011 to 2012 and the chair of the Audit Committee. Ms. Freeman is a Board Member of The Ruth Bancroft Garden(non-profit organization). She is also an inactive Chartered Financial Analyst. | | N/A |
| | | |
| Isaiah Harris, Jr.3 (Born 1952) | | Trustee, since 2009;
Audit Committee Chairman, since 2019 | | Retired. Chairman of the Board of CIGNA Corporation since 2009, and Director since 2005. From 2003 to 2011, Director of Deluxe Corporation. Prior thereto, President and CEO of BellSouth Advertising and Publishing Corp. from 2005 to 2007, President and CEO of BellSouth Enterprises from 2004 to 2005 and President of BellSouth Consumer Services from 2000 to 2003. Emeritus member of the Iowa State University Foundation Board of Governors. Emeritus Member of the Advisory Board of Iowa State University School of Business. Advisory Board Member, Palm Harbor Academy (private school). Advisory Board Member, Child Evangelism Fellowship(non-profit). Mr. Harris is a certified public accountant (inactive status). | | CIGNA Corporation |
| | | |
Judith M. Johnson3 (Born 1949) | | Trustee, since 2008;
Audit Committee Chairman, from
2009 to 2018 | | Retired. Prior thereto, Chief Executive Officer and Chief Investment Officer of Minneapolis Employees Retirement Fund from 1996 to 2008. Ms. Johnson is an attorney, certified public accountant and a certified managerial accountant. | | N/A |
| | | |
| David F. Larcker (Born 1950) | | Trustee, since 2009 | | James Irvin Miller Professor of Accounting at the Graduate School of Business, Stanford University, Director of the Corporate Governance Research Initiative and Senior Faculty of The Rock Center for Corporate Governance since 2006. From 2005 to 2008, Professor of Accounting at the Graduate School of Business, Stanford University. Prior thereto, Ernst & Young Professor of Accounting at The Wharton School, University of Pennsylvania from 1985 to 2005. | | N/A |
| | | | |
| 24 | | Wells Fargo Pennsylvania Tax-Free Fund | | Other information (unaudited) |
| | | | | | |
Name and
year of birth | | Position held and
length of service* | | Principal occupations during past five years or longer | | Current other
public company or
investment company
directorships |
| | | |
| Olivia S. Mitchell (Born 1953) | | Trustee, since 2006; Nominating and Governance Committee Chairman, since 2018 | | International Foundation of Employee Benefit Plans Professor, Wharton School of the University of Pennsylvania since 1993. Director of Wharton’s Pension Research Council and Boettner Center on Pensions & Retirement Research, and Research Associate at the National Bureau of Economic Research. Previously, Cornell University Professor from 1978 to 1993. | | N/A |
| | | |
| Timothy J. Penny (Born 1951) | | Trustee, since 1996; Chairman, since 2018; Vice Chairman, from 2017 to 2018 | | President and Chief Executive Officer of Southern Minnesota Initiative Foundation, anon-profit organization, since 2007. Member of the Board of Trustees of NorthStar Education Finance, Inc., anon-profit organization, since 2007. | | N/A |
| | | |
| James G. Polisson (Born 1959) | | Trustee, since 2018; Advisory Board Member, from 2017 to 2018 | | Retired. Chief Marketing Officer, Source (ETF) UK Services, Ltd, from 2015 to 2017. From 2012 to 2015, Principal of The Polisson Group, LLC, a management consulting, corporate advisory and principal investing company. Chief Executive Officer and Managing Director at Russell Investments, Global Exchange Traded Funds from 2010 to 2012. Managing Director of Barclays Global Investors from 1998 to 2010 and Global Chief Marketing Officer for iShares and Barclays Global Investors from 2000 to 2010. Trustee of the San Francisco Mechanics’ Institute, anon-profit organization, from 2013 to 2015. Board member of the Russell Exchange Traded Fund Trust from 2011 to 2012. Director of Barclays Global Investors Holdings Deutschland GmbH from 2006 to 2009. Mr. Polisson is an attorney and has a retired status with the Massachusetts and District of Columbia Bar Associations. | | N/A |
| | | |
Michael S. Scofield4 (Born 1943) | | Trustee, since 2010 | | Served on the Investment Company Institute’s Board of Governors and Executive Committee from 2008-2011 as well the Governing Council of the Independent Directors Council from 2006-2011 and the Independent Directors Council Executive Committee from 2008-2011. Trustee of the Evergreen Fund complex (and its predecessors) from 1984 to 2010. Chairman of the Evergreen Funds from 2000-2010. Former Trustee of the Mentor Funds. Retired Attorney, Law Offices of Michael S. Scofield. | | N/A |
| | | |
| Pamela Wheelock (Born 1959) | | Trustee, since 2018; Advisory Board Member, from 2017 to 2018 | | Chief Operating Officer, Twin Cities Habitat for Humanity, since January, 2017. Vice President of University Services, University of Minnesota from 2012 to 2017. Prior thereto, on the Board of Directors, Governance Committee and Finance Committee for the Minnesota Philanthropy Partners (Saint Paul Foundation) from 2012 to 2018, Interim President and Chief Executive Officer of Blue Cross Blue Shield of Minnesota from 2010 to 2011, Chairman of the Board from 2009 to 2011 and Board Director from 2003 to 2015. Vice President, Leadership and Community Engagement, Bush Foundation, Saint Paul, Minnesota (a private foundation) from 2009 to 2011. Executive Vice President and Chief Financial Officer, Minnesota Sports and Entertainment from 2004 to 2009 and Senior Vice President from 2002 to 2004. Commissioner of Finance, State of Minnesota, from 1999 to 2002. Currently the Board Chair of the Minnesota Wild Foundation since 2010. | | N/A |
| * | Length of service dates reflect the Trustee’s commencement of service with the Trust’s predecessor entities, where applicable. |
| | | | | | |
| Other information (unaudited) | | Wells Fargo Pennsylvania Tax-Free Fund | | | 25 | |
Officers
| | | | | | |
Name and
year of birth | | Position held and
length of service | | Principal occupations during past five years or longer | | |
| | | |
Andrew Owen
(Born 1960) | | President, since 2017 | | Executive Vice President of Wells Fargo & Company and Head of Affiliated Managers, Wells Fargo Asset Management, since 2014. In addition, Mr. Owen is currently President, Chief Executive Officer and Director of Wells Fargo Funds Management, LLC since 2017. Prior thereto, Executive Vice President responsible for marketing, investments and product development for Wells Fargo Funds Management, LLC, from 2009 to 2014. | | |
| | | |
Nancy Wiser1
(Born 1967) | | Treasurer, since 2012 | | Executive Vice President of Wells Fargo Funds Management, LLC since 2011. Chief Operating Officer and Chief Compliance Officer at LightBox Capital Management LLC, from 2008 to 2011. | | |
| | | |
| Alexander Kymn (Born 1973) | | Secretary, since 2018; Chief Legal Officer, since 2018 | | Senior Company Counsel of Wells Fargo Bank, N.A. since 2018 (previously Senior Counsel from 2007 to 2018). Vice President of Wells Fargo Funds Management, LLC from 2008 to 2014. | | |
| | | |
| Michael H. Whitaker(Born 1967) | | Chief Compliance Officer, since 2016 | | Senior Vice President and Chief Compliance Officer since 2016. Senior Vice President and Chief Compliance Officer for Fidelity Investments from 2007 to 2016. | | |
| | | |
David Berardi
(Born 1975) | | Assistant Treasurer, since 2009 | | Vice President of Wells Fargo Funds Management, LLC since 2009. Vice President of Evergreen Investment Management Company, LLC from 2008 to 2010. Manager of Fund Reporting and Control for Evergreen Investment Management Company, LLC from 2004 to 2010. | | |
| | | |
| Jeremy DePalma1 (Born 1974) | | Assistant Treasurer, since 2009 | | Senior Vice President of Wells Fargo Funds Management, LLC since 2009. Senior Vice President of Evergreen Investment Management Company, LLC from 2008 to 2010 and head of the Fund Reporting and Control Team within Fund Administration from 2005 to 2010. | | |
| 1 | Nancy Wiser acts as Treasurer of 76 funds in the Fund Complex. Jeremy DePalma acts as Treasurer of 76 funds and Assistant Treasurer of 76 funds in the Fund Complex. |
| 2 | The Statement of Additional Information includes additional information about the Trustees and is available, without charge, upon request, by calling1-800-222-8222 or by visiting the website atwellsfargofunds.com. |
| 3 | Mr. Harris replaced Ms. Johnson as the Chairman of the Audit Committee effective January 1, 2019. |
| 4 | Mr. Scofield retired on December 31, 2018. |
| | | | |
| 26 | | Wells Fargo Pennsylvania Tax-Free Fund | | Appendix A (unaudited) |
SALES CHARGE REDUCTIONS AND WAIVERS FOR CERTAIN INTERMEDIARIES
Raymond James & Associates, Inc., Raymond James Financial Services & Raymond James affiliates (“Raymond James”)
Effective on or about March 1, 2019, shareholders purchasing Fund shares through a Raymond James platform or account will be eligible only for the following load waivers(front-end sales charge waivers and contingent deferred, orback-end, sales charge waivers) and discounts, which may differ from those disclosed elsewhere in the Fund’s Prospectus or SAI.
Front-end Sales Load Waivers on Class A shares Available at Raymond James
| | • | | Shares purchased in an investment advisory program. |
| | • | | Shares purchased through reinvestment of capital gains distributions and dividend reinvestment when purchasing shares of the same fund (but not any other fund within the fund family). |
| | • | | Employees and registered representatives of Raymond James or its affiliates and their family members as designated by Raymond James. |
| | • | | Shares purchased from the proceeds of redemptions within the same fund family, provided (1) the repurchase occurs within 90 days following the redemption, (2) the redemption and purchase occur in the same account, and (3) redeemed shares were subject to afront-end or deferred sales load (known as Rights of Reinstatement). |
| | • | | A shareholder in the fund’s Class C shares will have their shares automatically exchanged at net asset value to Class A shares (or the appropriate share class) of the fund if the shares are no longer subject to a CDSC and the exchange is in line with the policies and procedures of Raymond James. |
CDSC Waivers on Class A and C Shares Available at Raymond James
| | • | | Death or disability of the shareholder. |
| | • | | Shares sold as part of a systematic withdrawal plan as described in the Fund’s Prospectus. |
| | • | | Return of excess contributions from an IRA Account. |
| | • | | Shares sold as part of a required minimum distribution for IRA and retirement accounts due to the shareholder reaching age 70½ as described in the Fund’s prospectus. |
| | • | | Shares sold to pay Raymond James fees but only if the transaction is initiated by Raymond James. |
| | • | | Shares acquired through a right of reinstatement. |
Front-end Load Discounts Available at Raymond James: Breakpoints, and/or Rights of Accumulation
| | • | | Breakpoints as described in the Fund’s Prospectus. |
| | • | | Rights of accumulation which entitle shareholders to breakpoint discounts will be automatically calculated based on the aggregated holding of fund family assets held by accounts within the purchaser’s household at Raymond James. Eligible fund family assets not held at Raymond James may be included in the rights of accumulation calculation only if the shareholder notifies his or her financial advisor about such assets. |
This page is intentionally left blank.
This page is intentionally left blank.

For more information
More information about Wells Fargo Funds is available free upon request. To obtain literature, please write, visit the Fund’s website, or call:
Wells Fargo Funds
P.O. Box 219967
Kansas City, MO 64121-9967
Website: wellsfargofunds.com
Individual investors: 1-800-222-8222
Retail investment professionals: 1-888-877-9275
Institutional investment professionals: 1-866-765-0778
This report and the financial statements contained herein are submitted for the general information of the shareholders of the Fund. If this report is used for promotional purposes, distribution of the report must be accompanied or preceded by a current prospectus. Before investing, please consider the investment objectives, risks, charges, and expenses of the investment. For a current prospectus and, if available, a summary prospectus, containing this information, call1-800-222-8222 or visit the Fund’s website atwellsfargofunds.com. Read the prospectus carefully before you invest or send money.
Wells Fargo Asset Management (WFAM) is the trade name for certain investment advisory/management firms owned by Wells Fargo & Company. These firms include but are not limited to Wells Capital Management Incorporated and Wells Fargo Funds Management, LLC. Certain products managed by WFAM entities are distributed by Wells Fargo Funds Distributor, LLC (a broker/dealer and Member FINRA).
This material is for general informational and educational purposes only and is NOT intended to provide investment advice or a recommendation of any kind—including a recommendation for any specific investment, strategy, or plan.
INVESTMENT PRODUCTS: NOT FDIC INSURED ◾ NO BANK GUARANTEE ◾ MAY LOSE VALUE
© 2019 Wells Fargo Funds Management, LLC. All rights reserved.
| | |
 | | 320450 02-19 SA255/SAR255 12-18 |
Semi-Annual Report
December 31, 2018

Wells Fargo Short-Term Municipal Bond Fund

Beginning on January 1, 2021, as permitted by new regulations adopted by the Securities and Exchange Commission, paper copies of the Wells Fargo Funds’ annual and semi-annual shareholder reports issued after this date will no longer be sent by mail, unless you specifically request paper copies of the reports. Instead, the reports will be made available on the Funds’ website, and you will be notified by mail each time a report is posted and provided with a website address to access the report.
If you already elected to receive shareholder reports electronically, you will not be affected by this change and you need not take any action. You may elect to receive shareholder reports and other communications from the Fund electronically at any time by contacting your financial intermediary (such as a broker-dealer or bank) or, if you are a direct investor, by calling 1-800-222-8222 or by enrolling at wellsfargo.com/advantagedelivery.
You may elect to receive all future reports in paper free of charge. If you invest through a financial intermediary, you can contact your financial intermediary to request that you continue to receive paper copies of your shareholder reports; if you invest directly with the Fund, you can call 1-800-222-8222. Your election to receive reports in paper will apply to all Wells Fargo Funds held in your account with your financial intermediary or, if you are a direct investor, to all Wells Fargo Funds that you hold.

Reduce clutter. Save trees.
Sign up for electronic delivery of prospectuses and shareholder reports atwellsfargo.com/advantagedelivery
Contents
The views expressed and any forward-looking statements are as of December 31, 2018, unless otherwise noted, and are those of the Fund managers and/or Wells Fargo Funds Management, LLC. Discussions of individual securities, or the markets generally, or any Wells Fargo Fund are not intended as individual recommendations. Future events or results may vary significantly from those expressed in any forward-looking statements. The views expressed are subject to change at any time in response to changing circumstances in the market. Wells Fargo Funds Management, LLC and the Fund disclaim any obligation to publicly update or revise any views expressed or forward-looking statements.
INVESTMENT PRODUCTS: NOT FDIC INSURED ◾ NO BANK GUARANTEE ◾ MAY LOSE VALUE
| | | | |
| 2 | | Wells Fargo Short-Term Municipal Bond Fund | | Letter to shareholders (unaudited) |

Andrew Owen
President
Wells Fargo Funds
Global trade tensions escalated during the third quarter of 2018.
Dear Shareholder:
We are pleased to offer you this semi-annual report for the Wells Fargo Short-Term Municipal Bond Fund for the six-month period that ended December 31, 2018. During the reporting period, the U.S. generated encouraging economic and business data that was offset by less positive and more inconsistent data from international markets. Investment returns were generally negative as geopolitical tensions and uncertainty tended to distract investors from more favorable underlying trends.
For the period, U.S. stocks, as measured by the S&P 500 Index,1 fell 6.85% and international stocks, as measured by the MSCI ACWI ex USA Index (Net),2 declined 10.84%. Based on the MSCI EM Index (Net),3 emerging market stocks lost 8.48%. For bond investors, the Bloomberg Barclays U.S. Aggregate Bond Index4 gained 1.65% while the Bloomberg Barclays Global Aggregate ex-USD Index5 fell 0.84%. The Bloomberg Barclays Municipal Bond Index6 gained 1.53% while the ICE BofAML U.S. High Yield Index7 declined 2.34%.
Global trade tensions prompted investor concerns.
Global trade tensions escalated during the third quarter of 2018. The U.S. imposed tariffs on a wide range of products manufactured overseas. Foreign governments retaliated with tariffs that punished U.S. commodity producers and product manufacturers. Investors wondered about next steps as divergence in global economic policies and growth prospects widened.
During the summer months, the U.S. economy strengthened. Revised second-quarter gross domestic product (GDP) growth data released in August showed the U.S. economy growing at a 4.2% rate. The unemployment rate in the U.S. was 3.7% by the end of September, according to the U.S. Department of Labor. Wages showed more consistent growth, and consumer confidence remained strong. Several U.S. equity market indices reached records during August, with the S&P 500 Index gaining 7.71% for the three-month period that ended September 30, 2018. In contrast, the MSCI ACWI ex USA Index (Net) gained 0.71% while the MSCI EM Index (Net) declined 1.09% during the same three-month period.
| 1 | The S&P 500 Index consists of 500 stocks chosen for market size, liquidity, and industry group representation. It is a market-value-weighted index with each stock’s weight in the index proportionate to its market value. You cannot invest directly in an index. |
| 2 | The Morgan Stanley Capital International (MSCI) All Country World Index (ACWI) ex USA Index (Net) is a free-float-adjusted market-capitalization-weighted index that is designed to measure the equity market performance of developed markets, excluding the United States and Canada. Source: MSCI. MSCI makes no express or implied warranties or representations and shall have no liability whatsoever with respect to any MSCI data contained herein. The MSCI data may not be further redistributed or used as a basis for other indices or any securities or financial products. This report is not approved, reviewed, or produced by MSCI. You cannot invest directly in an index. |
| 3 | The MSCI Emerging Markets (EM) Index (Net) is a free-float-adjusted market-capitalization-weighted index that is designed to measure large- and mid-cap equity market performance of emerging markets. The MSCI EM Index (Net) consists of the following 24 emerging market country indices: Brazil, Chile, China, Colombia, Czech Republic, Egypt, Greece, Hungary, India, Indonesia, Korea, Malaysia, Mexico, Pakistan, Peru, the Philippines, Poland, Qatar, Russia, South Africa, Taiwan, Thailand, Turkey, and the United Arab Emirates. You cannot invest directly in an index. |
| 4 | The Bloomberg Barclays U.S. Aggregate Bond Index is a broad-based benchmark that measures the investment-grade, U.S. dollar-denominated, fixed-rate taxable bond market, including Treasuries, government-related and corporate securities, mortgage-backed securities (agency fixed-rate and hybrid adjustable-rate mortgage pass-throughs), asset-backed securities, and commercial mortgage-backed securities. You cannot invest directly in an index. |
| 5 | The Bloomberg Barclays Global Aggregate ex-USD Index is an unmanaged index that provides a broad-based measure of the global investment-grade fixed-income markets excluding the U.S. dollar-denominated debt market. You cannot invest directly in an index. |
| 6 | The Bloomberg Barclays Municipal Bond Index is an unmanaged index composed of long-term tax-exempt bonds with a minimum credit rating of Baa. You cannot invest directly in an index. |
| 7 | The ICE BofAML U.S. High Yield Index is a market-capitalization-weighted index of domestic and Yankee high-yield bonds. The index tracks the performance of high-yield securities traded in the U.S. bond market. You cannot invest directly in an index. Copyright 2018. ICE Data Indices, LLC. All rights reserved. |
| | | | | | |
| Letter to shareholders (unaudited) | | Wells Fargo Short-Term Municipal Bond Fund | | | 3 | |
Economic signals overseas were mixed as the third quarter ended and the fourth quarter began. In particular, signs of slowing economic growth in China created uncertainty for investors. Amid rising trade tensions, the People’s Bank of China cut reserve requirement ratios and accelerated infrastructure spending and tax cuts for business enterprises and individuals. Nevertheless, a strengthening U.S. dollar and trade tensions remained headwinds for investors overseas.
Equity markets were volatile during the fourth quarter.
Negative stock market performance during October and December bracketed a mildly positive November, as measured by the S&P 500 Index and the MSCI ACWI ex USA Index (Net). As interest rates and bond yields gained during October, stock markets struggled. Readings on consumer sentiment and business spending were mixed. Markets rebounded in November. The U.S. and China agreed to halt further increases in tariffs and engage in additional negotiations. While November returns were positive, the loss for the full fourth quarter was substantial for equity investors globally, with the S&P down 13.52% and the MSCI ACWI ex USA Index (Net) down 11.46%. December’s S&P 500 Index performance was the lowest since 1931. Globally, fixed income investments fared better than stocks during the last two months of the year as conflicting signals unsettled investors’ outlooks.
Equity investors confronted a number of changing conditions. In November’smid-term elections, control of the U.S. House of Representatives shifted from Republicans to Democrats, presaging potential partisan disputes. Progress on Brexit negotiations stalled in the UK. In China, the value of the yuan declined to low levels last seen in 2008. Oil prices continued to fall. The Fed increased the federal funds rate by 25 bps to a target range of between 2.25% and 2.50% in December 2018. A late-December dispute over spending and immigration policy resulted in a partial U.S. government shutdown that continued through the end of the period.
Don’t let short-term uncertainty derail long-term investment goals.
Periods of investment uncertainty can present challenges, but experience has taught us that maintaining long-term investment goals can be an effective way to plan for the future. To help you create a sound strategy based on your personal goals and risk tolerance, Wells Fargo Funds offers more than 100 mutual funds spanning a wide range of asset classes and investment styles. Although diversification cannot guarantee an investment profit or prevent losses, we believe it can be an effective way to manage investment risk and potentially smooth out overall portfolio performance. We encourage investors to know their investments and to understand that appropriate levels of risk-taking may unlock opportunities.
Thank you for choosing to invest with Wells Fargo Funds. We appreciate your confidence in us and remain committed to helping you meet your financial needs.
Sincerely,

Andrew Owen
President
Wells Fargo Funds
Economic signals overseas were mixed as the third quarter ended and the fourth quarter began.
For further information about your Fund, contact your investment professional, visit our website atwellsfargofunds.com, or call us directly at1-800-222-8222.
| | | | |
| 4 | | Wells Fargo Short-Term Municipal Bond Fund | | Performance highlights (unaudited) |
Investment objective
The Fund seeks current income exempt from federal income tax consistent with capital preservation.
Manager
Wells Fargo Funds Management, LLC
Subadviser
Wells Capital Management Incorporated
Portfolio managers
Wendy Casetta
Lyle J. Fitterer, CFA®‡, CPA
Average annual total returns (%) as of December 31, 2018
| | | | | | | | | | | | | | | | | | | | | | | | | | | | | | | | | | |
| | | | | Including sales charge | | | Excluding sales charge | | | Expense ratios1 (%) | |
| | | Inception date | | 1 year | | | 5 year | | | 10 year | | | 1 year | | | 5 year | | | 10 year | | | Gross | | | Net2 | |
| | | | | | | | | |
| Class A (WSMAX) | | 7-18-2008 | | | -0.60 | | | | 0.59 | | | | 2.19 | | | | 1.43 | | | | 0.99 | | | | 2.40 | | | | 0.77 | | | | 0.63 | |
| | | | | | | | | |
| Class C (WSSCX) | | 1-31-2003 | | | -0.33 | | | | 0.24 | | | | 1.63 | | | | 0.67 | | | | 0.24 | | | | 1.63 | | | | 1.52 | | | | 1.38 | |
| | | | | | | | | |
| Class R63 | | 7-31-2018 | | | – | | | | – | | | | – | | | | 1.68 | | | | 1.22 | | | | 2.62 | | | | 0.39 | | | | 0.35 | |
| | | | | | | | | |
| Administrator Class (WSTMX)4 | | 7-30-2010 | | | – | | | | – | | | | – | | | | 1.46 | | | | 0.98 | | | | 2.41 | | | | 0.71 | | | | 0.60 | |
| | | | | | | | | |
| Institutional Class (WSBIX) | | 3-31-2008 | | | – | | | | – | | | | – | | | | 1.66 | | | | 1.21 | | | | 2.62 | | | | 0.44 | | | | 0.40 | |
| | | | | | | | | |
| Bloomberg Barclays 1-3 Year Composite Municipal Bond Index5 | | – | | | – | | | | – | | | | – | | | | 1.75 | | | | 0.99 | | | | 1.60 | | | | – | | | | – | |
Figures quoted represent past performance, which is no guarantee of future results, and do not reflect taxes that a shareholder may pay on fund distributions or the redemption of fund shares. Investment return and principal value of an investment will fluctuate so that an investor’s shares, when redeemed, may be worth more or less than their original cost. Performance shown without sales charges would be lower if sales charges were reflected. Current performance may be lower or higher than the performance data quoted, which assumes the reinvestment of dividends and capital gains. Current month-end performance is available on the Fund’s website, wellsfargofunds.com.
Index returns do not include transaction costs associated with buying and selling securities, any mutual fund fees or expenses, or any taxes. It is not possible to invest directly in an index.
For Class A shares, the maximum front-end sales charge is 2.00%. For Class C shares, the maximum contingent deferred sales charge is 1.00%. Performance including a contingent deferred sales charge assumes the sales charge for the corresponding time period. Class R6, Administrator Class, and Institutional Class shares are sold without a front-end sales charge or contingent deferred sales charge.
Bond values fluctuate in response to the financial condition of individual issuers, general market and economic conditions, and changes in interest rates. Changes in market conditions and government policies may lead to periods of heightened volatility in the bond market and reduced liquidity for certain bonds held by the Fund. In general, when interest rates rise, bond values fall and investors may lose principal value. Interest rate changes and their impact on the Fund and its share price can be sudden and unpredictable. The use of derivatives may reduce returns and/or increase volatility. Certain investment strategies tend to increase the total risk of an investment (relative to the broader market). Consult the Fund’s prospectus for additional information on these and other risks. A portion of the Fund’s income may be subject to federal, state, and/or local income taxes or the Alternative Minimum Tax (AMT). Any capital gains distributions may be taxable.
Please see footnotes on page 5.
| | | | | | |
| Performance highlights (unaudited) | | Wells Fargo Short-Term Municipal Bond Fund | | | 5 | |
|
| Effective maturity distribution as of December 31, 20186 |
|
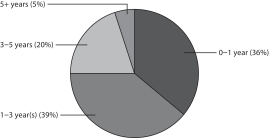 |
|
| Credit quality as of December 31, 20187 |
|
 |
| ‡ | CFA® and Chartered Financial Analyst® are trademarks owned by CFA Institute. |
| 1 | Reflects the expense ratios as stated in the most recent prospectuses. The expense ratios shown are subject to change and may differ from the annualized expense ratios shown in the financial highlights of this report. |
| 2 | The manager has contractually committed through October 31, 2019, to waive fees and/or reimburse expenses to the extent necessary to cap the Fund’s Total Annual Fund Operating Expenses After Fee Waivers at the amounts shown. After this time, the cap may be increased or the commitment to maintain the cap may be terminated only with the approval of the Board of Trustees. Brokerage commissions, stamp duty fees, interest, taxes, acquired fund fees and expenses (if any), and extraordinary expenses are excluded from the expense cap. Without this cap, the Fund’s returns would have been lower. The expense ratio paid by an investor is the net expense ratio (the total annual fund operating expenses after fee waivers) as stated in the prospectuses. |
| 3 | Historical performance shown for Class R6 shares prior to their inception reflects the performance of the Institutional Class shares, and includes the higher expenses applicable to Institutional Class shares. If these expenses had not been included, returns for Class R6 shares would be higher. |
| 4 | Historical performance shown for Administrator Class shares prior to their inception reflects the performance of Institutional Class shares, adjusted to reflect the higher expenses applicable to Administrator Class shares. |
| 5 | The Bloomberg Barclays 1-3 Year Composite Municipal Bond Index is a blended index weighted 50% in the Bloomberg Barclays 1-Year Municipal Bond Index and 50% in the Barclays 3-Year Municipal Bond Index. You cannot invest directly in an index. |
| 6 | Amounts are calculated based on the total long-term investments of the Fund. These amounts are subject to change and may have changed since the date specified. |
| 7 | The credit quality distribution of portfolio holdings reflected in the chart is based on ratings from Standard & Poor’s, Moody’s Investors Service, and/ or Fitch Ratings Ltd. Credit quality ratings apply to the underlying holdings of the Fund and not to the Fund itself. The percentages of the Fund’s portfolio with the ratings depicted in the chart are calculated based on the total market value of fixed income securities held by the Fund. If a security was rated by all three rating agencies, the middle rating was utilized. If rated by two of three rating agencies, the lower rating was utilized, and if rated by one of the rating agencies, that rating was utilized. Standard & Poor’s rates the creditworthiness of bonds, ranging from AAA (highest) to D (lowest). Ratings from A to CCC may be modified by the addition of a plus (+) or minus (-) sign to show relative standing within the rating categories. Standard & Poor’s rates the creditworthiness of short-term notes from SP-1 (highest) to SP-3 (lowest). Moody’s rates the creditworthiness of bonds, ranging from Aaa (highest) to C (lowest). Ratings Aa to B may be modified by the addition of a number 1 (highest) to 3 (lowest) to show relative standing within the ratings categories. Moody’s rates the creditworthiness of short-term U.S. tax-exempt municipal securities from MIG 1/VMIG 1 (highest) to SG (lowest). Fitch rates the creditworthiness of bonds, ranging from AAA (highest) to D (lowest). Credit quality distribution is subject to change and may have changed since the date specified. |
| | | | |
| 6 | | Wells Fargo Short-Term Municipal Bond Fund | | Fund expenses (unaudited) |
As a shareholder of the Fund, you incur two types of costs: (1) transaction costs, including sales charges (loads) on purchase payments and contingent deferred sales charges (if any) on redemptions and (2) ongoing costs, including management fees, distribution (12b-1) and/or shareholder servicing fees, and other Fund expenses. This example is intended to help you understand your ongoing costs (in dollars) of investing in the Fund and to compare these costs with the ongoing costs of investing in other mutual funds.
The example is based on an investment of $1,000 invested at the beginning of the six-month period and held for the entire period from July 1, 2018 to December 31, 2018.
Actual expenses
The “Actual” line of the table below provides information about actual account values and actual expenses. You may use the information in this line, together with the amount you invested, to estimate the expenses that you paid over the period. Simply divide your account value by $1,000 (for example, an $8,600 account value divided by $1,000 = 8.6), then multiply the result by the number in the “Actual” line under the heading entitled “Expenses paid during period” for your applicable class of shares to estimate the expenses you paid on your account during this period.
Hypothetical example for comparison purposes
The “Hypothetical” line of the table below provides information about hypothetical account values and hypothetical expenses based on the Fund’s actual expense ratio and an assumed rate of return of 5% per year before expenses, which is not the Fund’s actual return. The hypothetical account values and expenses may not be used to estimate the actual ending account balance or expenses you paid for the period. You may use this information to compare the ongoing costs of investing in the Fund and other funds. To do so, compare this 5% hypothetical example with the 5% hypothetical examples that appear in the shareholder reports of the other funds.
Please note that the expenses shown in the table are meant to highlight your ongoing costs only and do not reflect any transactional costs, such as sales charges (loads) and contingent deferred sales charges. Therefore, the “Hypothetical” line of the table is useful in comparing ongoing costs only and will not help you determine the relative total costs of owning different funds. In addition, if these transactional costs were included, your costs would have been higher.
| | | | | | | | | | | | | | | | |
| | | Beginning
account value
7-1-2018 | | | Ending
account value
12-31-2018 | | | Expenses
paid during
the period¹ | | | Annualized net
expense ratio | |
Class A | | | | | | | | | | | | | | | | |
| | | | |
Actual | | $ | 1,000.00 | | | $ | 1,007.89 | | | $ | 3.19 | | | | 0.63 | % |
| | | | |
Hypothetical (5% return before expenses) | | $ | 1,000.00 | | | $ | 1,022.03 | | | $ | 3.21 | | | | 0.63 | % |
Class C | | | | | | | | | | | | | | | | |
| | | | |
Actual | | $ | 1,000.00 | | | $ | 1,004.09 | | | $ | 6.97 | | | | 1.38 | % |
| | | | |
Hypothetical (5% return before expenses) | | $ | 1,000.00 | | | $ | 1,018.25 | | | $ | 7.02 | | | | 1.38 | % |
Class R6 | | | | | | | | | | | | | | | | |
| | | | |
Actual | | $ | 1,000.00 | | | $ | 1,009.27 | | | $ | 1.77 | | | | 0.35 | % |
| | | | |
Hypothetical (5% return before expenses) | | $ | 1,000.00 | | | $ | 1,023.44 | | | $ | 1.79 | | | | 0.35 | % |
Administrator Class | | | | | | | | | | | | | | | | |
| | | | |
Actual | | $ | 1,000.00 | | | $ | 1,008.04 | | | $ | 3.04 | | | | 0.60 | % |
| | | | |
Hypothetical (5% return before expenses) | | $ | 1,000.00 | | | $ | 1,022.18 | | | $ | 3.06 | | | | 0.60 | % |
Institutional Class | | | | | | | | | | | | | | | | |
| | | | |
Actual | | $ | 1,000.00 | | | $ | 1,009.05 | | | $ | 2.03 | | | | 0.40 | % |
| | | | |
Hypothetical (5% return before expenses) | | $ | 1,000.00 | | | $ | 1,023.19 | | | $ | 2.04 | | | | 0.40 | % |
| 1 | Expenses paid is equal to the annualized net expense ratio of each class multiplied by the average account value over the period, multiplied by the number of days in the most recent fiscal half-year divided by the number of days in the fiscal year (to reflect the one-half-year period). |
| | | | | | |
| Portfolio of investments—December 31, 2018 (unaudited) | | Wells Fargo Short-Term Municipal Bond Fund | | | 7 | |
| | | | | | | | | | | | | | | | |
| Security name | | Interest rate | | | Maturity date | | | Principal | | | Value | |
| | | | |
Municipal Obligations: 99.32% | | | | | | | | | | | | | | | | |
| | | | |
Alabama: 0.43% | | | | | | | | | | | | | | | | |
| | | | |
| GO Revenue: 0.13% | | | | | | | | | | | | | | | | |
| | | | |
Jefferson County AL Series C | | | 4.90 | % | | | 4-1-2021 | | | $ | 5,290,000 | | | $ | 5,404,105 | |
| | | | | | | | | | | | | | | | |
| | | | |
| Tax Revenue: 0.01% | | | | | | | | | | | | | | | | |
| | | | |
Board of Education of Shelby County AL Public School Series 2016 | | | 4.00 | | | | 2-1-2020 | | | | 410,000 | | | | 419,582 | |
| | | | | | | | | | | | | | | | |
| | | | |
| Utilities Revenue: 0.29% | | | | | | | | | | | | | | | | |
| | | | |
Alabama Black Belt Energy Gas District Series A | | | 4.00 | | | | 12-1-2048 | | | | 8,000,000 | | | | 8,351,440 | |
| | | | |
Alabama Black Belt Energy Gas District Series A (Royal Bank of Canada LIQ) | | | 4.00 | | | | 8-1-2047 | | | | 3,880,000 | | | | 4,036,597 | |
| | | | |
| | | | | | | | | | | | | | | 12,388,037 | |
| | | | | | | | | | | | | | | | |
| | | | |
| | | | | | | | | | | | | | | 18,211,724 | |
| | | | | | | | | | | | | | | | |
| | | | |
Alaska: 0.63% | | | | | | | | | | | | | | | | |
| | | | |
| Health Revenue: 0.53% | | | | | | | | | | | | | | | | |
| | | | |
Alaska IDA Loan Anticipation YKHC Project | | | 3.50 | | | | 12-1-2020 | | | | 22,000,000 | | | | 22,165,000 | |
| | | | | | | | | | | | | | | | |
| | | | |
| Utilities Revenue: 0.04% | | | | | | | | | | | | | | | | |
| | | | |
Alaska IDA Snettisham Hydroelectric Project | | | 5.00 | | | | 1-1-2021 | | | | 1,400,000 | | | | 1,458,506 | |
| | | | | | | | | | | | | | | | |
| | | | |
| Water & Sewer Revenue: 0.06% | | | | | | | | | | | | | | | | |
| | | | |
North Slope Borough Alaska Service Area Water & Wastewater Facilities | | | 5.25 | | | | 6-30-2034 | | | | 2,445,000 | | | | 2,635,294 | |
| | | | | | | | | | | | | | | | |
| | | | |
| | | | | | | | | | | | | | | 26,258,800 | |
| | | | | | | | | | | | | | | | |
| | | | |
Arizona: 2.46% | | | | | | | | | | | | | | | | |
| | | | |
| Education Revenue: 0.16% | | | | | | | | | | | | | | | | |
| | | | |
Arizona Board of Regents Certificate of Participation Series A | | | 5.00 | | | | 6-1-2021 | | | | 3,000,000 | | | | 3,215,910 | |
| | | | |
Cochise County AZ Community College District of Cochise County Series 2016A (Build America Mutual Assurance Company Insured) | | | 5.00 | | | | 7-1-2020 | | | | 405,000 | | | | 422,861 | |
| | | | |
Cochise County AZ Community College District of Cochise County Series 2016A (Build America Mutual Assurance Company Insured) | | | 5.00 | | | | 7-1-2021 | | | | 425,000 | | | | 453,624 | |
| | | | |
PIMA County AZ IDA Education Facility Odyssey Preparatory Academy Goodyear Project | | | 7.00 | | | | 6-1-2034 | | | | 312,000 | | | | 348,067 | |
| | | | |
PIMA County AZ IDA Education Facility Odyssey Preparatory Academy Goodyear Project | | | 7.13 | | | | 6-1-2049 | | | | 1,950,000 | | | | 2,181,153 | |
| | | | |
| | | | | | | | | | | | | | | 6,621,615 | |
| | | | | | | | | | | | | | | | |
| | | | |
| GO Revenue: 0.05% | | | | | | | | | | | | | | | | |
| | | | |
Maricopa County AZ Unified School District #89 Refunding Bond Series 2016 (Build America Mutual Assurance Company Insured) ## | | | 2.00 | | | | 7-1-2019 | | | | 2,265,000 | | | | 2,267,106 | |
| | | | | | | | | | | | | | | | |
| | | | |
| Health Revenue: 0.36% | | | | | | | | | | | | | | | | |
| | | | |
Maricopa County AZ IDA Series 2019C (SIFMA Municipal Swap +0.80%) ±%% | | | 2.43 | | | | 9-1-2048 | | | | 9,000,000 | | | | 9,000,000 | |
| | | | |
Tempe AZ IDA Mirabella Arizona State University Project Series B1 144A | | | 4.00 | | | | 10-1-2023 | | | | 6,000,000 | | | | 6,004,740 | |
| | | | |
| | | | | | | | | | | | | | | 15,004,740 | |
| | | | | | | | | | | | | | | | |
The accompanying notes are an integral part of these financial statements.
| | | | |
| 8 | | Wells Fargo Short-Term Municipal Bond Fund | | Portfolio of investments—December 31, 2018 (unaudited) |
| | | | | | | | | | | | | | | | |
| Security name | | Interest rate | | | Maturity date | | | Principal | | | Value | |
| | | | |
| Industrial Development Revenue: 1.17% | | | | | | | | | | | | | | | | |
| | | | |
Chandler AZ IDA Intel Corporation Project | | | 2.40 | % | | | 12-1-2035 | | | $ | 32,085,000 | | | $ | 32,336,546 | |
| | | | |
Coconino County AZ Pollution Control Corporation Series A | | | 1.80 | | | | 9-1-2032 | | | | 7,100,000 | | | | 7,045,188 | |
| | | | |
Phoenix AZ IDA Various Republic Services Incorporated Projects øø | | | 2.15 | | | | 12-1-2035 | | | | 9,500,000 | | | | 9,497,815 | |
| | | | |
| | | | | | | | | | | | | | | 48,879,549 | |
| | | | | | | | | | | | | | | | |
| | | | |
| Miscellaneous Revenue: 0.29% | | | | | | | | | | | | | | | | |
| | | | |
Navajo Nation AZ Refunding Bond Series A 144A | | | 2.90 | | | | 12-1-2020 | | | | 5,965,000 | | | | 5,977,049 | |
| | | | |
Navajo Nation AZ Tribal Utility Authority (Municipal Government Guaranty Insured) | | | 4.00 | | | | 1-1-2021 | | | | 6,295,000 | | | | 6,354,991 | |
| | | | |
| | | | | | | | | | | | | | | 12,332,040 | |
| | | | | | | | | | | | | | | | |
| | | | |
| Resource Recovery Revenue: 0.14% | | | | | | | | | | | | | | | | |
| | | | |
Yavapai County AZ IDA Waste Management Incorporated Project Series A2 | | | 1.85 | | | | 3-1-2028 | | | | 6,000,000 | | | | 5,994,060 | |
| | | | | | | | | | | | | | | | |
| | | | |
| Utilities Revenue: 0.29% | | | | | | | | | | | | | | | | |
| | | | |
Maricopa County AZ PCR Public Service Company of New Mexico Palo Verde Project Series B | | | 5.20 | | | | 6-1-2043 | | | | 2,500,000 | | | | 2,580,625 | |
| | | | |
Maricopa County AZ PCR Series A | | | 2.40 | | | | 6-1-2043 | | | | 9,800,000 | | | | 9,739,338 | |
| | | | |
| | | | | | | | | | | | | | | 12,319,963 | |
| | | | | | | | | | | | | | | | |
| | | | |
| | | | | | | | | | | | | | | 103,419,073 | |
| | | | | | | | | | | | | | | | |
| | | | |
Arkansas: 0.12% | | | | | | | | | | | | | | | | |
| | | | |
| Housing Revenue: 0.12% | | | | | | | | | | | | | | | | |
| | | | |
Arkansas Development Finance Authority Multifamily Housing Texarkana Rental Assistance Demonstration Convertible Bond Series A | | | 2.10 | | | | 6-1-2022 | | | | 5,100,000 | | | | 5,101,836 | |
| | | | | | | | | | | | | | | | |
| | | | |
California: 3.38% | | | | | | | | | | | | | | | | |
| | | | |
| Education Revenue: 0.63% | | | | | | | | | | | | | | | | |
| | | | |
California Infrastructure & Economic Development Bank Series A (SIFMA Municipal Swap +1.00%) ± | | | 2.71 | | | | 8-1-2037 | | | | 26,185,000 | | | | 26,345,776 | |
| | | | | | | | | | | | | | | | |
| | | | |
| GO Revenue: 1.18% | | | | | | | | | | | | | | | | |
| | | | |
California Refunding Bond Series A (SIFMA Municipal Swap +0.25%) ± | | | 1.96 | | | | 5-1-2033 | | | | 26,000,000 | | | | 25,935,780 | |
| | | | |
California Series B (SIFMA Municipal Swap +0.38%) ± | | | 2.09 | | | | 12-1-2027 | | | | 20,000,000 | | | | 19,995,600 | |
| | | | |
Oakland CA Unified School District Alameda County Election of 2012 | | | 5.00 | | | | 8-1-2019 | | | | 1,000,000 | | | | 1,019,700 | |
| | | | |
Palomar CA Pomerado Health CAB Election of 2004 Series A (National Insured) (z)## | | | 2.81 | | | | 8-1-2019 | | | | 2,215,000 | | | | 2,188,929 | |
| | | | |
San Ysidro CA School District (AGM Insured) (z) | | | 6.83 | | | | 8-1-2047 | | | | 3,610,000 | | | | 489,985 | |
| | | | |
| | | | | | | | | | | | | | | 49,629,994 | |
| | | | | | | | | | | | | | | | |
| | | | |
| Health Revenue: 0.15% | | | | | | | | | | | | | | | | |
| | | | |
California HFFA Providence St. Joseph Series B1 | | | 1.25 | | | | 10-1-2036 | | | | 5,755,000 | | | | 5,695,954 | |
| | | | |
Washington Township CA Health Care District Series B | | | 5.00 | | | | 7-1-2020 | | | | 600,000 | | | | 623,844 | |
| | | | |
| | | | | | | | | | | | | | | 6,319,798 | |
| | | | | | | | | | | | | | | | |
| | | | |
| Industrial Development Revenue: 0.09% | | | | | | | | | | | | | | | | |
| | | | |
California PCFA AMT Calplant I Project 144A | | | 7.00 | | | | 7-1-2022 | | | | 3,505,000 | | | | 3,611,552 | |
| | | | | | | | | | | | | | | | |
The accompanying notes are an integral part of these financial statements.
| | | | | | |
| Portfolio of investments—December 31, 2018 (unaudited) | | Wells Fargo Short-Term Municipal Bond Fund | | | 9 | |
| | | | | | | | | | | | | | | | |
| Security name | | Interest rate | | | Maturity date | | | Principal | | | Value | |
| | | | |
| Miscellaneous Revenue: 0.19% | | | | | | | | | | | | | | | | |
| | | | |
California Infrastructure & Economic Development J. Paul Getty Trust Series B2 (1 Month LIBOR +0.20%) ± | | | 1.84 | % | | | 10-1-2047 | | | $ | 8,000,000 | | | $ | 7,986,800 | |
| | | | | | | | | | | | | | | | |
| | | | |
| Tax Revenue: 0.05% | | | | | | | | | | | | | | | | |
| | | | |
Commerce CA RDA CAB Project #1 (z) | | | 4.86 | | | | 8-1-2021 | | | | 2,245,000 | | | | 2,002,473 | |
| | | | | | | | | | | | | | | | |
| | | | |
| Transportation Revenue: 0.25% | | | | | | | | | | | | | | | | |
| | | | |
Bay Area CA Toll Authority San Francisco Bay Area Series D | | | 1.88 | | | | 4-1-2034 | | | | 10,500,000 | | | | 10,507,980 | |
| | | | | | | | | | | | | | | | |
| | | | |
| Water & Sewer Revenue: 0.84% | | | | | | | | | | | | | | | | |
| | | | |
California Department of Water Resources Central Valley Project Series AT (SIFMA Municipal Swap +0.37%) ± | | | 2.08 | | | | 12-1-2035 | | | | 35,500,000 | | | | 35,460,240 | |
| | | | | | | | | | | | | | | | |
| | | | |
| | | | | | | | | | | | | | | 141,864,613 | |
| | | | | | | | | | | | | | | | |
| | | | |
Colorado: 1.32% | | | | | | | | | | | | | | | | |
| | | | |
| GO Revenue: 0.26% | | | | | | | | | | | | | | | | |
| | | | |
Dawson Ridge Metropolitan District # 1 CO (z) | | | 2.22 | | | | 10-1-2022 | | | | 8,445,000 | | | | 7,800,900 | |
| | | | |
Grand River CO Hospital District (AGM Insured) | | | 5.00 | | | | 12-1-2022 | | | | 1,450,000 | | | | 1,604,773 | |
| | | | |
Grand River CO Hospital District (AGM Insured) | | | 5.00 | | | | 12-1-2024 | | | | 1,140,000 | | | | 1,301,071 | |
| | | | |
| | | | | | | | | | | | | | | 10,706,744 | |
| | | | | | | | | | | | | | | | |
| | | | |
| Health Revenue: 0.89% | | | | | | | | | | | | | | | | |
| | | | |
Colorado HCFR Catholic Health Initiatives Series C2 (1 Month LIBOR +1.25%) ± | | | 2.85 | | | | 10-1-2039 | | | | 8,500,000 | | | | 8,526,010 | |
| | | | |
Colorado HCFR Catholic Health Initiatives Series C4 (1 Month LIBOR +1.25%) ± | | | 2.85 | | | | 10-1-2039 | | | | 3,495,000 | | | | 3,505,695 | |
| | | | |
University of Colorado Hospital Authority Series 2017C-1 | | | 5.00 | | | | 11-15-2038 | | | | 23,630,000 | | | | 25,336,795 | |
| | | | |
| | | | | | | | | | | | | | | 37,368,500 | |
| | | | | | | | | | | | | | | | |
| | | | |
| Housing Revenue: 0.14% | | | | | | | | | | | | | | | | |
| | | | |
Colorado HSG Finance Authority Multifamily Housing Bonds South Range Crossings Project Series 2017 | | | 2.15 | | | | 1-1-2038 | | | | 6,000,000 | | | | 5,998,800 | |
| | | | | | | | | | | | | | | | |
| | | | |
| Miscellaneous Revenue: 0.03% | | | | | | | | | | | | | | | | |
| | | | |
Colorado Bridge Enterprise Central 70 Project | | | 4.00 | | | | 12-31-2023 | | | | 1,285,000 | | | | 1,368,127 | |
| | | | | | | | | | | | | | | | |
| | | | |
| | | | | | | | | | | | | | | 55,442,171 | |
| | | | | | | | | | | | | | | | |
| | | | |
Connecticut: 2.05% | | | | | | | | | | | | | | | | |
| | | | |
| Education Revenue: 0.76% | | | | | | | | | | | | | | | | |
| | | | |
Connecticut HEFAR Yale University Issue Series A | | | 1.30 | | | | 7-1-2048 | | | | 5,105,000 | | | | 5,069,571 | |
| | | | |
Connecticut HEFAR Yale University Issue Series A | | | 2.05 | | | | 7-1-2035 | | | | 25,000,000 | | | | 25,073,500 | |
| | | | |
Connecticut HEFAR Yale University Issue Series A-1 øø | | | 1.00 | | | | 7-1-2042 | | | | 600,000 | | | | 597,528 | |
| | | | |
Connecticut Higher Education Supplemental Loan Authority Refunding Bonds Chelsea Loan Program Series A | | | 3.60 | | | | 11-15-2023 | | | | 1,265,000 | | | | 1,298,523 | |
| | | | |
| | | | | | | | | | | | | | | 32,039,122 | |
| | | | | | | | | | | | | | | | |
| | | | |
| GO Revenue: 0.43% | | | | | | | | | | | | | | | | |
| | | | |
Connecticut Refunding Bond Series B | | | 4.00 | | | | 5-15-2021 | | | | 11,190,000 | | | | 11,622,829 | |
| | | | |
Hartford CT Series A (AGM Insured) ## | | | 5.00 | | | | 7-1-2019 | | | | 700,000 | | | | 710,073 | |
| | | | |
New Haven CT Prerefunded Bond Series A (AGM Insured) ## | | | 3.00 | | | | 11-1-2019 | | | | 80,000 | | | | 80,745 | |
The accompanying notes are an integral part of these financial statements.
| | | | |
| 10 | | Wells Fargo Short-Term Municipal Bond Fund | | Portfolio of investments—December 31, 2018 (unaudited) |
| | | | | | | | | | | | | | | | |
| Security name | | Interest rate | | | Maturity date | | | Principal | | | Value | |
| | | | |
| GO Revenue(continued) | | | | | | | | | | | | | | | | |
| | | | |
New Haven CT Series A | | | 5.25 | % | | | 8-1-2021 | | | $ | 1,830,000 | | | $ | 1,944,942 | |
| | | | |
New Haven CT Unrefunded Balance Refunding Bond Series A (AGM Insured) ## | | | 3.00 | | | | 11-1-2019 | | | | 3,325,000 | | | | 3,350,204 | |
| | | | |
West Haven CT Series A | | | 3.00 | | | | 11-1-2019 | | | | 300,000 | | | | 299,631 | |
| | | | |
West Haven CT Series B ## | | | 3.00 | | | | 11-1-2019 | | | | 210,000 | | | | 209,742 | |
| | | | |
| | | | | | | | | | | | | | | 18,218,166 | |
| | | | | | | | | | | | | | | | |
| | | | |
| Health Revenue: 0.24% | | | | | | | | | | | | | | | | |
| | | | |
Connecticut HEFAR Hartford Healthcare Series G (1 Month LIBOR +0.95%) ± | | | 2.55 | | | | 7-1-2049 | | | | 10,000,000 | | | | 10,023,900 | |
| | | | | | | | | | | | | | | | |
| | | | |
| Miscellaneous Revenue: 0.62% | | | | | | | | | | | | | | | | |
| | | | |
Connecticut Refunding Bond (SIFMA Municipal Swap +1.10%) ##± | | | 2.81 | | | | 5-15-2019 | | | | 3,500,000 | | | | 3,508,540 | |
| | | | |
Connecticut Series A (SIFMA Municipal Swap +0.55%) ##± | | | 2.26 | | | | 3-1-2019 | | | | 3,800,000 | | | | 3,800,912 | |
| | | | |
Connecticut Series A (SIFMA Municipal Swap +0.65%) ± | | | 2.36 | | | | 3-1-2020 | | | | 8,385,000 | | | | 8,395,565 | |
| | | | |
Connecticut Series A (SIFMA Municipal Swap +1.10%) ##± | | | 2.81 | | | | 4-15-2019 | | | | 5,600,000 | | | | 5,611,088 | |
| | | | |
Mohegan Tribe of Indians of Connecticut U.S. Department of Agriculture BAN ## | | | 3.00 | | | | 6-14-2019 | | | | 4,466,000 | | | | 4,466,000 | |
| | | | |
| | | | | | | | | | | | | | | 25,782,105 | |
| | | | | | | | | | | | | | | | |
| | | | |
| | | | | | | | | | | | | | | 86,063,293 | |
| | | | | | | | | | | | | | | | |
| | | | |
District of Columbia: 0.59% | | | | | | | | | | | | | | | | |
| | | | |
| Airport Revenue: 0.09% | | | | | | | | | | | | | | | | |
| | | | |
Metropolitan Washington DC Airport Authority Series A | | | 5.00 | | | | 10-1-2024 | | | | 3,450,000 | | | | 3,769,263 | |
| | | | | | | | | | | | | | | | |
| | | | |
| Housing Revenue: 0.50% | | | | | | | | | | | | | | | | |
| | | | |
District of Columbia HFA Multifamily Housing Liberty Place Apartments Project | | | 2.13 | | | | 6-1-2021 | | | | 9,800,000 | | | | 9,799,902 | |
| | | | |
District of Columbia HFA Multifamily Housing Maplewood Courts Apartments Project | | | 1.80 | | | | 2-1-2020 | | | | 11,310,000 | | | | 11,292,470 | |
| | | | |
| | | | | | | | | | | | | | | 21,092,372 | |
| | | | | | | | | | | | | | | | |
| | | | |
| | | | | | | | | | | | | | | 24,861,635 | |
| | | | | | | | | | | | | | | | |
| | | | |
Florida: 1.44% | | | | | | | | | | | | | | | | |
| | | | |
| Education Revenue: 0.22% | | | | | | | | | | | | | | | | |
| | | | |
Florida Gulf Coast University Financing Corporation Housing Project Series A | | | 5.00 | | | | 8-1-2020 | | | | 2,055,000 | | | | 2,144,372 | |
| | | | |
University of North Florida Financing Corporation Capital Housing Project (AGM Insured) | | | 5.00 | | | | 11-1-2020 | | | | 3,125,000 | | | | 3,276,219 | |
| | | | |
University of North Florida Financing Corporation Capital Housing Project (AGM Insured) | | | 5.00 | | | | 11-1-2021 | | | | 3,440,000 | | | | 3,691,808 | |
| | | | |
| | | | | | | | | | | | | | | 9,112,399 | |
| | | | | | | | | | | | | | | | |
| | | | |
| Health Revenue: 0.42% | | | | | | | | | | | | | | | | |
| | | | |
North Broward FL Hospital District Series B | | | 5.00 | | | | 1-1-2022 | | | | 1,255,000 | | | | 1,348,359 | |
| | | | |
North Broward FL Hospital District Series B | | | 5.00 | | | | 1-1-2023 | | | | 1,700,000 | | | | 1,856,553 | |
| | | | |
North Broward FL Hospital District Series B | | | 5.00 | | | | 1-1-2024 | | | | 2,000,000 | | | | 2,214,560 | |
| | | | |
Palm Beach County FL HCFR ACTS Retirement Life Communities Series 2016 | | | 5.00 | | | | 11-15-2021 | | | | 3,515,000 | | | | 3,737,464 | |
| | | | |
Tampa FL BayCare Health System Prefunded Bond | | | 5.00 | | | | 11-15-2023 | | | | 4,140,000 | | | | 4,315,660 | |
| | | | |
Tampa FL BayCare Health System Unrefunded Bond | | | 5.00 | | | | 11-15-2023 | | | | 3,940,000 | | | | 4,101,737 | |
| | | | |
| | | | | | | | | | | | | | | 17,574,333 | |
| | | | | | | | | | | | | | | | |
The accompanying notes are an integral part of these financial statements.
| | | | | | |
| Portfolio of investments—December 31, 2018 (unaudited) | | Wells Fargo Short-Term Municipal Bond Fund | | | 11 | |
| | | | | | | | | | | | | | | | |
| Security name | | Interest rate | | | Maturity date | | | Principal | | | Value | |
| | | | |
| Housing Revenue: 0.12% | | | | | | | | | | | | | | | | |
| | | | |
Florida Housing Finance Corporation Logan Heights Apartments Series F %% | | | 1.90 | % | | | 2-1-2020 | | | $ | 5,280,000 | | | $ | 5,261,520 | |
| | | | | | | | | | | | | | | | |
| | | | |
| Miscellaneous Revenue: 0.39% | | | | | | | | | | | | | | | | |
| | | | |
Manatee County FL School Board Certificate of Participation Series A | | | 5.00 | | | | 7-1-2020 | | | | 1,225,000 | | | | 1,274,417 | |
| | | | |
Miami-Dade County FL School Board Certificate of Participation Series A | | | 5.00 | | | | 5-1-2031 | | | | 10,000,000 | | | | 11,276,700 | |
| | | | |
St. Johns County FL School Board Refunding Bond Certificate of Participation | | | 5.00 | | | | 7-1-2020 | | | | 2,010,000 | | | | 2,100,470 | |
| | | | |
St. Johns County FL School Board Refunding Bond Certificate of Participation | | | 5.00 | | | | 7-1-2021 | | | | 1,670,000 | | | | 1,791,309 | |
| | | | |
| | | | | | | | | | | | | | | 16,442,896 | |
| | | | | | | | | | | | | | | | |
| | | | |
| Resource Recovery Revenue: 0.05% | | | | | | | | | | | | | | | | |
| | | | |
Lee County FL Solid Waste System Refunding Bond | | | 5.00 | | | | 10-1-2023 | | | | 1,750,000 | | | | 1,910,913 | |
| | | | | | | | | | | | | | | | |
| | | | |
| Tax Revenue: 0.20% | | | | | | | | | | | | | | | | |
| | | | |
Florida Department of Environmental Protection Florida Forever Series A | | | 5.00 | | | | 7-1-2023 | | | | 7,720,000 | | | | 8,489,684 | |
| | | | | | | | | | | | | | | | |
| | | | |
| Transportation Revenue: 0.04% | | | | | | | | | | | | | | | | |
| | | | |
Florida Mid-Bay Bridge Authority Series C ## | | | 5.00 | | | | 10-1-2019 | | | | 675,000 | | | | 689,108 | |
| | | | |
Florida Mid-Bay Bridge Authority Series C | | | 5.00 | | | | 10-1-2020 | | | | 785,000 | | | | 821,565 | |
| | | | |
| | | | | | | | | | | | | | | 1,510,673 | |
| | | | | | | | | | | | | | | | |
| | | | |
| | | | | | | | | | | | | | | 60,302,418 | |
| | | | | | | | | | | | | | | | |
| | | | |
Georgia: 4.41% | | | | | | | | | | | | | | | | |
| | | | |
| Education Revenue: 0.17% | | | | | | | | | | | | | | | | |
| | | | |
Walesa GA Downtown Development Authority Reinhardt University Project ## | | | 2.00 | | | | 8-1-2019 | | | | 7,000,000 | | | | 6,988,730 | |
| | | | | | | | | | | | | | | | |
| | | | |
| Health Revenue: 0.86% | | | | | | | | | | | | | | | | |
| | | | |
Gainesville & Hall Counties GA Development Authority Senior Living Facilities Lanier Village Series B (AGC Insured, TD Bank NA SPA) ø | | | 1.75 | | | | 11-15-2033 | | | | 12,825,000 | | | | 12,825,000 | |
| | | | |
Gainesville & Hall Counties GA Hospital Authority Health System Project Series B (SIFMA Municipal Swap +0.95%) ± | | | 2.66 | | | | 8-15-2035 | | | | 23,000,000 | | | | 23,019,780 | |
| | | | |
| | | | | | | | | | | | | | | 35,844,780 | |
| | | | | | | | | | | | | | | | |
| | | | |
| Housing Revenue: 0.63% | | | | | | | | | | | | | | | | |
| | | | |
Atlanta GA Urban Residential Finance Authority Multifamily Housing City Lights II Family Apartments Project | | | 1.86 | | | | 12-1-2020 | | | | 11,500,000 | | | | 11,478,265 | |
| | | | |
Macon-Bibb County GA Housing Authority Hallmark Portfolio | | | 2.04 | | | | 4-1-2021 | | | | 15,000,000 | | | | 14,992,500 | |
| | | | |
| | | | | | | | | | | | | | | 26,470,765 | |
| | | | | | | | | | | | | | | | |
| | | | |
| Industrial Development Revenue: 0.38% | | | | | | | | | | | | | | | | |
| | | | |
Monroe County GA PCR Georgia Power Company Plant Scherer Project | | | 2.35 | | | | 10-1-2048 | | | | 16,000,000 | | | | 15,867,840 | |
| | | | | | | | | | | | | | | | |
| | | | |
| Miscellaneous Revenue: 0.32% | | | | | | | | | | | | | | | | |
| | | | |
Georgia Road & Tollway Authority Federal Highway Grant Anticipation Bond Series B | | | 5.00 | | | | 6-1-2020 | | | | 12,980,000 | | | | 13,554,105 | |
| | | | | | | | | | | | | | | | |
The accompanying notes are an integral part of these financial statements.
| | | | |
| 12 | | Wells Fargo Short-Term Municipal Bond Fund | | Portfolio of investments—December 31, 2018 (unaudited) |
| | | | | | | | | | | | | | | | |
| Security name | | Interest rate | | | Maturity date | | | Principal | | | Value | |
| | | | |
| Utilities Revenue: 2.05% | | | | | | | | | | | | | | | | |
| | | | |
Bartow County GA Development Authority Georgia Power Company Bowen Project | | | 2.05 | % | | | 9-1-2029 | | | $ | 4,100,000 | | | $ | 3,998,853 | |
| | | | |
Burke County GA Development Authority Georgia Power Company Plant Vogtle Project | | | 1.85 | | | | 12-1-2049 | | | | 17,300,000 | | | | 17,248,792 | |
| | | | |
Burke County GA Development Authority Oglethorpe Power Corporation Vogtle Project Series A | | | 2.40 | | | | 1-1-2040 | | | | 15,995,000 | | | | 15,918,864 | |
| | | | |
Burke County GA Development Authority Oglethorpe Power Corporation Vogtle Project Series F | | | 3.00 | | | | 11-1-2045 | | | | 22,050,000 | | | | 21,874,041 | |
| | | | |
Floyd County GA PCR Georgia Power Company Plant Hammond Project | | | 2.35 | | | | 7-1-2022 | | | | 11,250,000 | | | | 11,157,075 | |
| | | | |
Main Street Natural Gas Incorporated Georgia Gas Project Series B | | | 5.00 | | | | 3-15-2021 | | | | 2,600,000 | | | | 2,745,652 | |
| | | | |
Main Street Natural Gas Incorporated Georgia Gas Project Series C | | | 4.00 | | | | 8-1-2048 | | | | 6,120,000 | | | | 6,462,230 | |
| | | | |
Monroe County GA Development Authority PCR Oglethorpe Power Corporation Scherer Project Series A | | | 2.40 | | | | 1-1-2039 | | | | 6,755,000 | | | | 6,722,846 | |
| | | | |
| | | | | | | | | | | | | | | 86,128,353 | |
| | | | | | | | | | | | | | | | |
| | | | |
| | | | | | | | | | | | | | | 184,854,573 | |
| | | | | | | | | | | | | | | | |
| | | | |
Guam: 0.01% | | | | | | | | | | | | | | | | |
| | | | |
| Airport Revenue: 0.01% | | | | | | | | | | | | | | | | |
| | | | |
Guam International Airport Authority Series A | | | 5.00 | | | | 10-1-2019 | | | | 450,000 | | | | 457,223 | |
| | | | | | | | | | | | | | | | |
| | | | |
Hawaii: 0.47% | | | | | | | | | | | | | | | | |
| | | | |
| GO Revenue: 0.30% | | | | | | | | | | | | | | | | |
| | | | |
Honolulu HI Rail Transit Project Series H (SIFMA Municipal Swap +0.32%) ± | | | 2.03 | | | | 9-1-2027 | | | | 7,600,000 | | | | 7,597,036 | |
| | | | |
Honolulu HI Rail Transit Project Series H (SIFMA Municipal Swap +0.32%) ± | | | 2.03 | | | | 9-1-2028 | | | | 5,000,000 | | | | 4,998,050 | |
| | | | |
| | | | | | | | | | | | | | | 12,595,086 | |
| | | | | | | | | | | | | | | | |
| | | | |
| Housing Revenue: 0.17% | | | | | | | | | | | | | | | | |
| | | | |
Hawaii Housing Finance & Development Corporation Multifamily Housing Hale Kewalo Apartments Series A (GNMA Insured) | | | 1.90 | | | | 1-1-2021 | | | | 7,160,000 | | | | 7,125,775 | |
| | | | | | | | | | | | | | | | |
| | | | |
| | | | | | | | | | | | | | | 19,720,861 | |
| | | | | | | | | | | | | | | | |
| | | | |
Illinois: 10.81% | | | | | | | | | | | | | | | | |
| | | | |
| Airport Revenue: 0.89% | | | | | | | | | | | | | | | | |
| | | | |
Chicago IL Midway Airport Refunding Bond Second Lien Series A | | | 5.00 | | | | 1-1-2022 | | | | 6,100,000 | | | | 6,540,969 | |
| | | | |
Chicago IL Midway Airport Refunding Bond Second Lien Series A | | | 5.00 | | | | 1-1-2025 | | | | 5,000,000 | | | | 5,529,050 | |
| | | | |
Chicago IL O’Hare International Airport Customer Facility Series 2013 | | | 5.00 | | | | 1-1-2019 | | | | 1,000,000 | | | | 1,000,000 | |
| | | | |
Chicago IL O’Hare International Airport Customer Facility Series 2013 | | | 5.00 | | | | 1-1-2020 | | | | 890,000 | | | | 915,178 | |
| | | | |
Chicago IL O’Hare International Airport Refunding Bond General Senior Lien Series B | | | 5.00 | | | | 1-1-2023 | | | | 5,000,000 | | | | 5,380,950 | |
| | | | |
Chicago IL O’Hare International Airport Refunding Bond General Senior Lien Series B | | | 5.00 | | | | 1-1-2024 | | | | 1,550,000 | | | | 1,665,305 | |
| | | | |
Chicago IL O’Hare International Airport Refunding Bond Passenger Facility | | | 5.00 | | | | 1-1-2023 | | | | 13,720,000 | | | | 14,765,327 | |
| | | | |
Chicago IL O’Hare International Airport Refunding Bond Passenger Facility | | | 5.00 | | | | 1-1-2024 | | | | 1,335,000 | | | | 1,480,862 | |
| | | | |
| | | | | | | | | | | | | | | 37,277,641 | |
| | | | | | | | | | | | | | | | |
The accompanying notes are an integral part of these financial statements.
| | | | | | |
| Portfolio of investments—December 31, 2018 (unaudited) | | Wells Fargo Short-Term Municipal Bond Fund | | | 13 | |
| | | | | | | | | | | | | | | | |
| Security name | | Interest rate | | | Maturity date | | | Principal | | | Value | |
| | | | |
| Education Revenue: 0.25% | | | | | | | | | | | | | | | | |
| | | | |
University of Illinois Auxiliary Facilities CAB (z) | | | 2.53 | % | | | 4-1-2019 | | | $ | 7,110,000 | | | $ | 7,070,255 | |
| | | | |
University of Illinois Board of Trustees Certificate of Participation Series A | | | 4.00 | | | | 8-15-2019 | | | | 1,900,000 | | | | 1,923,484 | |
| | | | |
Western Illinois University Auxiliary Facilities System | | | 4.00 | | | | 4-1-2020 | | | | 1,480,000 | | | | 1,469,122 | |
| | | | |
| | | | | | | | | | | | | | | 10,462,861 | |
| | | | | | | | | | | | | | | | |
| | | | |
| GO Revenue: 3.51% | | | | | | | | | | | | | | | | |
| | | | |
Chicago IL Board Education Refunding Bond Series A (AGM Insured) | | | 5.00 | | | | 12-1-2022 | | | | 500,000 | | | | 539,125 | |
| | | | |
Chicago IL Board Education Refunding Bond Series A (AGM Insured) | | | 5.00 | | | | 12-1-2023 | | | | 2,000,000 | | | | 2,185,160 | |
| | | | |
Chicago IL Board of Education Series A (National Insured) | | | 5.00 | | | | 12-1-2019 | | | | 895,000 | | | | 911,674 | |
| | | | |
Chicago IL City Colleges of Chicago Capital Improvement Project CAB (National Insured) (z) | | | 0.00 | | | | 1-1-2019 | | | | 8,555,000 | | | | 8,555,000 | |
| | | | |
Chicago IL Emergency Telephone System Refunding Bond (National Insured) | | | 5.25 | | | | 1-1-2020 | | | | 3,765,000 | | | | 3,875,842 | |
| | | | |
Chicago IL Emergency Telephone System Refunding Bond (National Insured) | | | 5.50 | | | | 1-1-2019 | | | | 2,600,000 | | | | 2,600,000 | |
| | | | |
Chicago IL Park District Harbor Facility Series C | | | 5.00 | | | | 1-1-2022 | | | | 3,155,000 | | | | 3,306,251 | |
| | | | |
Chicago IL Park District Personal Property Replacement Tax | | | 5.00 | | | | 1-1-2019 | | | | 500,000 | | | | 500,000 | |
| | | | |
Chicago IL Park District Refunding Bonds Series B | | | 5.00 | | | | 1-1-2019 | | | | 3,555,000 | | | | 3,555,000 | |
| | | | |
Chicago IL Park District Refunding Bonds Series D | | | 4.00 | | | | 1-1-2019 | | | | 1,990,000 | | | | 1,990,000 | |
| | | | |
Chicago IL Park District Refunding Bonds Series D | | | 5.00 | | | | 1-1-2019 | | | | 1,060,000 | | | | 1,060,000 | |
| | | | |
Chicago IL Park District Refunding Bonds Series D | | | 5.00 | | | | 1-1-2020 | | | | 1,290,000 | | | | 1,321,218 | |
| | | | |
Chicago IL Park District Refunding Bonds Series D | | | 5.00 | | | | 1-1-2021 | | | | 1,000,000 | | | | 1,044,370 | |
| | | | |
Chicago IL Park District Series A | | | 4.50 | | | | 1-1-2023 | | | | 250,000 | | | | 256,955 | |
| | | | |
Chicago IL Refunding Bond Series B (Ambac Insured) | | | 5.13 | | | | 1-1-2022 | | | | 2,610,000 | | | | 2,665,776 | |
| | | | |
Chicago IL Series C | | | 5.00 | | | | 1-1-2021 | | | | 3,000,000 | | | | 3,098,820 | |
| | | | |
Chicago IL Series C | | | 5.00 | | | | 1-1-2022 | | | | 12,780,000 | | | | 13,357,528 | |
| | | | |
Chicago IL Series C | | | 5.00 | | | | 1-1-2023 | | | | 4,750,000 | | | | 5,009,825 | |
| | | | |
Cook County IL Refunding Bond Series 2016 A | | | 5.00 | | | | 11-15-2020 | | | | 5,430,000 | | | | 5,693,192 | |
| | | | |
Cook County IL Series 2009D | | | 5.00 | | | | 11-15-2020 | | | | 2,220,000 | | | | 2,273,213 | |
| | | | |
Cook County IL Series A | | | 5.00 | | | | 11-15-2019 | | | | 2,275,000 | | | | 2,331,306 | |
| | | | |
Cook County IL Series C | | | 5.00 | | | | 11-15-2020 | | | | 21,615,000 | | | | 22,133,112 | |
| | | | |
Illinois | | | 4.00 | | | | 2-1-2019 | | | | 6,300,000 | | | | 6,308,001 | |
| | | | |
Illinois | | | 4.00 | | | | 2-1-2020 | | | | 1,750,000 | | | | 1,770,055 | |
| | | | |
Illinois | | | 5.00 | | | | 2-1-2019 | | | | 1,600,000 | | | | 1,603,264 | |
| | | | |
Illinois | | | 5.00 | | | | 2-1-2020 | | | | 2,520,000 | | | | 2,575,415 | |
| | | | |
Illinois | | | 5.00 | | | | 11-1-2021 | | | | 5,000,000 | | | | 5,227,450 | |
| | | | |
Illinois | | | 5.00 | | | | 4-1-2022 | | | | 3,000,000 | | | | 3,144,240 | |
| | | | |
Illinois Refunding Bond | | | 5.00 | | | | 1-1-2019 | | | | 12,570,000 | | | | 12,570,000 | |
| | | | |
Illinois Refunding Bond | | | 5.00 | | | | 1-1-2020 | | | | 13,515,000 | | | | 13,795,166 | |
| | | | |
Illinois Series A | | | 5.00 | | | | 4-1-2019 | | | | 4,890,000 | | | | 4,920,416 | |
| | | | |
Kane County IL School District Series B | | | 2.00 | | | | 2-1-2021 | | | | 880,000 | | | | 877,501 | |
| | | | |
Kane County IL School District Series C (AGC Insured) | | | 5.00 | | | | 6-1-2019 | | | | 2,110,000 | | | | 2,115,275 | |
| | | | |
Kendall, Kane, & Will Counties IL Community Unit School District #308 CAB (AGM Insured) (z) | | | 1.87 | | | | 2-1-2020 | | | | 1,000,000 | | | | 976,590 | |
| | | | |
McHenry & Kane Counties IL Community Consolidated School District #158 CAB (National Insured) (z) | | | 2.70 | | | | 1-1-2021 | | | | 1,130,000 | | | | 1,084,958 | |
| | | | |
Waukegan IL Series B (AGM Insured) | | | 4.00 | | | | 12-30-2023 | | | | 500,000 | | | | 533,535 | |
| | | | |
Will County IL Community High School District #210 | | | 5.00 | | | | 1-1-2021 | | | | 1,165,000 | | | | 1,166,107 | |
| | | | |
Winnebago Boone County IL Community College District Rock Valley College Series A (AGM Insured) | | | 5.00 | | | | 1-1-2022 | | | | 500,000 | | | | 537,495 | |
| | | | |
| | | | | | | | | | | | | | | 147,468,835 | |
| | | | | | | | | | | | | | | | |
The accompanying notes are an integral part of these financial statements.
| | | | |
| 14 | | Wells Fargo Short-Term Municipal Bond Fund | | Portfolio of investments—December 31, 2018 (unaudited) |
| | | | | | | | | | | | | | | | |
| Security name | | Interest rate | | | Maturity date | | | Principal | | | Value | |
| | | | |
| Health Revenue: 1.93% | | | | | | | | | | | | | | | | |
| | | | |
Illinois Development Finance Authority St. Vincent De Paul Center Project Series A | | | 1.88 | % | | | 11-15-2039 | | | $ | 5,870,000 | | | $ | 5,864,893 | |
| | | | |
Illinois Finance Authority Ascension Health Alliance Senior Credit Group Series E-2 | | | 1.75 | | | | 11-15-2042 | | | | 2,000,000 | | | | 1,977,340 | |
| | | | |
Illinois Finance Authority Centigram Health System Project | | | 5.00 | | | | 9-1-2019 | | | | 2,265,000 | | | | 2,312,067 | |
| | | | |
Illinois Finance Authority Friendship Village of Schaumburg | | | 4.00 | | | | 2-15-2019 | | | | 1,180,000 | | | | 1,179,917 | |
| | | | |
Illinois Finance Authority Friendship Village of Schaumburg | | | 4.00 | | | | 2-15-2020 | | | | 1,230,000 | | | | 1,226,765 | |
| | | | |
Illinois Finance Authority Lifespace Communities Refunding Bond | | | 4.00 | | | | 5-15-2019 | | | | 1,090,000 | | | | 1,094,883 | |
| | | | |
Illinois Finance Authority OSF Healthcare System Prerefunded Bond Series A | | | 6.00 | | | | 5-15-2039 | | | | 14,630,000 | | | | 15,426,896 | |
| | | | |
Illinois Finance Authority Proven Health Series A | | | 5.75 | | | | 5-1-2019 | | | | 3,000,000 | | | | 3,039,330 | |
| | | | |
Illinois Finance Authority Swedish Covenant Hospital Series A | | | 6.00 | | | | 8-15-2038 | | | | 3,460,000 | | | | 3,615,527 | |
| | | | |
Illinois Finance Authority The Admiral at the Lake Project Series A | | | 7.75 | | | | 5-15-2030 | | | | 2,015,000 | | | | 2,170,639 | |
| | | | |
Illinois Finance Authority The Admiral at the Lake Project Series A | | | 8.00 | | | | 5-15-2040 | | | | 20,755,000 | | | | 22,413,117 | |
| | | | |
Illinois Finance Authority The Admiral at the Lake Project Series A | | | 8.00 | | | | 5-15-2046 | | | | 17,295,000 | | | | 18,676,698 | |
| | | | |
Southwestern IL Development Authority Health Facility Memorial Group Incorporated | | | 6.38 | | | | 11-1-2023 | | | | 1,950,000 | | | | 2,201,960 | |
| | | | |
| | | | | | | | | | | | | | | 81,200,032 | |
| | | | | | | | | | | | | | | | |
| | | | |
| Housing Revenue: 0.42% | | | | | | | | | | | | | | | | |
| | | | |
Chicago IL Multifamily Housing Mark Rwain Apartments Project | | | 2.20 | | | | 6-1-2021 | | | | 17,000,000 | | | | 16,999,830 | |
| | | | |
Illinois Housing Development Authority (GNMA Insured) | | | 5.00 | | | | 8-1-2028 | | | | 475,000 | | | | 486,196 | |
| | | | |
| | | | | | | | | | | | | | | 17,486,026 | |
| | | | | | | | | | | | | | | | |
| | | | |
| Miscellaneous Revenue: 0.84% | | | | | | | | | | | | | | | | |
| | | | |
Chicago IL Board of Education Lease Certificates Refunding Bond Series A (National Insured) | | | 6.00 | | | | 1-1-2020 | | | | 3,260,000 | | | | 3,299,576 | |
| | | | |
Chicago IL Board of Education Series 2018C | | | 5.00 | | | | 12-1-2019 | | | | 4,035,000 | | | | 4,104,321 | |
| | | | |
Illinois Refunding Bond (Build America Mutual Assurance Company Insured) | | | 5.00 | | | | 8-1-2020 | | | | 9,175,000 | | | | 9,523,191 | |
| | | | |
Illinois Refunding Bond | | | 5.00 | | | | 2-1-2022 | | | | 4,375,000 | | | | 4,576,513 | |
| | | | |
Illinois Refunding Bond | | | 5.00 | | | | 2-1-2023 | | | | 6,040,000 | | | | 6,371,958 | |
| | | | |
Illinois Refunding Bonds Series 2012 (AGM Insured) | | | 5.00 | | | | 8-1-2020 | | | | 5,000,000 | | | | 5,193,700 | |
| | | | |
Illinois Series 2014 | | | 5.00 | | | | 5-1-2021 | | | | 2,000,000 | | | | 2,078,680 | |
| | | | |
| | | | | | | | | | | | | | | 35,147,939 | |
| | | | | | | | | | | | | | | | |
| | | | |
| Tax Revenue: 2.61% | | | | | | | | | | | | | | | | |
| | | | |
Build Illinois Bonds Junior Obligation Series C | | | 5.00 | | | | 6-15-2022 | | | | 1,705,000 | | | | 1,813,063 | |
| | | | |
Chicago IL Motor Fuel Tax Refunding Bonds Series 2013 | | | 5.00 | | | | 1-1-2020 | | | | 1,120,000 | | | | 1,140,014 | |
| | | | |
Chicago IL Motor Fuel Tax Refunding Bonds Series 2013 | | | 5.00 | | | | 1-1-2021 | | | | 380,000 | | | | 392,517 | |
| | | | |
Chicago IL Motor Fuel Tax Refunding Bonds Series 2013 | | | 5.00 | | | | 1-1-2022 | | | | 955,000 | | | | 998,433 | |
| | | | |
Hillside IL Refunding Bond Series 2018 | | | 5.00 | | | | 1-1-2024 | | | | 1,475,000 | | | | 1,512,642 | |
| | | | |
Huntley IL Special Service Area No 6 Special Tax Refunding Bond
(Build America Mutual Assurance Company Insured) | | | 2.20 | | | | 3-1-2024 | | | | 2,190,000 | | | | 2,143,725 | |
| | | | |
Illinois Refunding Bond | | | 5.00 | | | | 1-1-2021 | | | | 1,760,000 | | | | 1,817,640 | |
| | | | |
Illinois Regional Transportation Authority Refunding Bond (AGM Insured) | | | 5.75 | | | | 6-1-2021 | | | | 3,000,000 | | | | 3,256,080 | |
| | | | |
Illinois Series A | | | 4.00 | | | | 1-1-2020 | | | | 12,265,000 | | | | 12,399,915 | |
| | | | |
Illinois Series A | | | 4.00 | | | | 1-1-2021 | | | | 2,715,000 | | | | 2,751,924 | |
| | | | |
Illinois Tender Option Bond Trust Receipts/Floater Certificates Series 2017-XG0108 (Barclays Bank plc LOC, Barclays Bank plc LIQ) ø144A | | | 1.89 | | | | 4-1-2046 | | | | 29,485,000 | | | | 29,485,000 | |
| | | | |
Illinois Tender Option Bond Trust Receipts/Floater Certificates Series 2018-XL0093 (Barclays Bank plc LIQ) ø144A | | | 1.88 | | | | 1-1-2048 | | | | 10,000,000 | | | | 10,000,000 | |
| | | | |
Metropolitan Pier & Exposition Authority CAB McCormick Place Project Series A (National Insured) (z) | | | 3.94 | | | | 12-15-2021 | | | | 920,000 | | | | 833,630 | |
The accompanying notes are an integral part of these financial statements.
| | | | | | |
| Portfolio of investments—December 31, 2018 (unaudited) | | Wells Fargo Short-Term Municipal Bond Fund | | | 15 | |
| | | | | | | | | | | | | | | | |
| Security name | | Interest rate | | | Maturity date | | | Principal | | | Value | |
| | | | |
| Tax Revenue(continued) | | | | | | | | | | | | | | | | |
| | | | |
Metropolitan Pier & Exposition Authority McCormick Place Project Series B | | | 5.00 | % | | | 12-15-2020 | | | $ | 1,700,000 | | | $ | 1,764,226 | |
| | | | |
Metropolitan Pier & Exposition Authority McCormick Place Project Callable Bond Series B | | | 5.00 | | | | 12-15-2022 | | | | 1,260,000 | | | | 1,263,755 | |
| | | | |
Metropolitan Pier & Exposition Authority McCormick Place Project Non-Callable Bond Series B | | | 5.00 | | | | 12-15-2022 | | | | 7,000,000 | | | | 7,418,600 | |
| | | | |
Regional Transportation Authority IL Series B-RMKT 1 | | | 1.92 | | | | 6-1-2025 | | | | 19,145,000 | | | | 19,145,000 | |
| | | | |
Sales Tax Securitization Corporation Series A | | | 5.00 | | | | 1-1-2024 | | | | 10,200,000 | | | | 11,199,192 | |
| | | | |
| | | | | | | | | | | | | | | 109,335,356 | |
| | | | | | | | | | | | | | | | |
| | | | |
| Tobacco Revenue: 0.31% | | | | | | | | | | | | | | | | |
| | | | |
Illinois Railsplitter Tobacco Settlement Authority | | | 5.00 | | | | 6-1-2022 | | | | 12,000,000 | | | | 12,983,040 | |
| | | | | | | | | | | | | | | | |
| | | | |
| Water & Sewer Revenue: 0.05% | | | | | | | | | | | | | | | | |
| | | | |
Chicago IL Second Lien | | | 5.00 | | | | 11-1-2020 | | | | 740,000 | | | | 776,356 | |
| | | | |
Chicago IL Second Lien (National Insured) | | | 5.50 | | | | 1-1-2019 | | | | 1,460,000 | | | | 1,460,000 | |
| | | | |
| | | | | | | | | | | | | | | 2,236,356 | |
| | | | | | | | | | | | | | | | |
| | | | |
| | | | | | | | | | | | | | | 453,598,086 | |
| | | | | | | | | | | | | | | | |
| | | | |
Indiana: 2.61% | | | | | | | | | | | | | | | | |
| | | | |
| Health Revenue: 1.06% | | | | | | | | | | | | | | | | |
| | | | |
Indiana Finance Authority Health System Franciscan Alliance Incorporated Series B | | | 5.00 | | | | 11-1-2022 | | | | 1,000,000 | | | | 1,105,320 | |
| | | | |
Indiana Finance Authority Health System Franciscan Alliance Incorporated Series B | | | 5.00 | | | | 11-1-2023 | | | | 1,270,000 | | | | 1,432,611 | |
| | | | |
Indiana Finance Authority Health System Franciscan Alliance Incorporated Series B | | | 5.00 | | | | 11-1-2024 | | | | 3,000,000 | | | | 3,441,090 | |
| | | | |
Indiana Finance Authority Health System Franciscan Alliance Incorporated Series C | | | 5.00 | | | | 11-1-2021 | | | | 1,000,000 | | | | 1,081,480 | |
| | | | |
Indiana Finance Authority Health System Franciscan Alliance Incorporated Series C | | | 5.00 | | | | 11-1-2023 | | | | 800,000 | | | | 902,432 | |
| | | | |
Indiana Finance Authority Health System Franciscan Alliance Incorporated Series C | | | 5.00 | | | | 11-1-2024 | | | | 1,000,000 | | | | 1,147,030 | |
| | | | |
Indiana Finance Authority Parkview Health Series A %% | | | 5.00 | | | | 5-1-2021 | | | | 1,020,000 | | | | 1,079,323 | |
| | | | |
Indiana Finance Authority Parkview Health Series A %% | | | 5.00 | | | | 5-1-2023 | | | | 1,010,000 | | | | 1,113,747 | |
| | | | |
Indiana Finance Authority Senior Living Series A | | | 5.00 | | | | 11-15-2022 | | | | 500,000 | | | | 534,350 | |
| | | | |
Indiana Finance Authority Senior Living Series A | | | 5.00 | | | | 11-15-2023 | | | | 500,000 | | | | 539,775 | |
| | | | |
Indiana Health & Educational Facility Financing Authority Series 2006B | | | 1.75 | | | | 11-15-2031 | | | | 11,915,000 | | | | 11,736,275 | |
| | | | |
Indiana HFFA Ascension Health Series A1 | | | 2.80 | | | | 11-1-2027 | | | | 9,095,000 | | | | 9,129,743 | |
| | | | |
Indiana HFFA Ascension Health Series A7 | | | 2.00 | | | | 10-1-2026 | | | | 8,100,000 | | | | 8,093,925 | |
| | | | |
Indiana HFFA Ascension Health Subordinate Credit Group Series 2015 A4 | | | 1.50 | | | | 10-1-2027 | | | | 2,055,000 | | | | 2,035,457 | |
| | | | |
Indiana HFFA Ascension Health Subordinate Credit Group Series A-8 | | | 1.25 | | | | 11-1-2027 | | | | 1,285,000 | | | | 1,268,603 | |
| | | | |
| | | | | | | | | | | | | | | 44,641,161 | |
| | | | | | | | | | | | | | | | |
| | | | |
| Housing Revenue: 0.27% | | | | | | | | | | | | | | | | |
| | | | |
Evansville IN Multifamily Housing Series A | | | 1.85 | | | | 6-1-2020 | | | | 7,400,000 | | | | 7,382,684 | |
| | | | |
Indianapolis IN Multifamily Housing Bethel Townhomes Project Series A | | | 2.30 | | | | 3-1-2021 | | | | 3,795,000 | | | | 3,801,452 | |
| | | | |
| | | | | | | | | | | | | | | 11,184,136 | |
| | | | | | | | | | | | | | | | |
| | | | |
| Miscellaneous Revenue: 0.05% | | | | | | | | | | | | | | | | |
| | | | |
Indiana Bond Bank Special Program Series A | | | 5.25 | | | | 10-15-2021 | | | | 2,000,000 | | | | 2,158,120 | |
| | | | | | | | | | | | | | | | |
The accompanying notes are an integral part of these financial statements.
| | | | |
| 16 | | Wells Fargo Short-Term Municipal Bond Fund | | Portfolio of investments—December 31, 2018 (unaudited) |
| | | | | | | | | | | | | | | | |
| Security name | | Interest rate | | | Maturity date | | | Principal | | | Value | |
| | | | |
| Resource Recovery Revenue: 1.07% | | | | | | | | | | | | | | | | |
| | | | |
Whiting IN BP Products North America Incorporated Project
(SIFMA Municipal Swap +0.75%) ± | | | 2.46 | % | | | 12-1-2044 | | | $ | 45,000,000 | | | $ | 45,055,350 | |
| | | | | | | | | | | | | | | | |
| | | | |
| Utilities Revenue: 0.16% | | | | | | | | | | | | | | | | |
| | | | |
Warrick County IN Environment Import Vectra Energy Delivery of Indiana Incorporated | | | 2.38 | | | | 9-1-2055 | | | | 6,550,000 | | | | 6,499,762 | |
| | | | | | | | | | | | | | | | |
| | | | |
| | | | | | | | | | | | | | | 109,538,529 | |
| | | | | | | | | | | | | | | | |
| | | | |
Iowa: 0.23% | | | | | | | | | | | | | | | | |
| | | | |
| Education Revenue: 0.05% | | | | | | | | | | | | | | | | |
| | | | |
Iowa Student Loan Liquidity Corporation Series 2011A-1 | | | 4.63 | | | | 12-1-2019 | | | | 2,265,000 | | | | 2,302,282 | |
| | | | | | | | | | | | | | | | |
| | | | |
| Housing Revenue: 0.18% | | | | | | | | | | | | | | | | |
| | | | |
Iowa Finance Authority SFMR Series D (1 Month LIBOR +0.35%) (GNMA/FNMA/FHLMC Insured) ± | | | 2.10 | | | | 7-1-2048 | | | | 7,500,000 | | | | 7,493,175 | |
| | | | | | | | | | | | | | | | |
| | | | |
| | | | | | | | | | | | | | | 9,795,457 | |
| | | | | | | | | | | | | | | | |
| | | | |
Kansas: 0.25% | | | | | | | | | | | | | | | | |
| | | | |
| Miscellaneous Revenue: 0.25% | | | | | | | | | | | | | | | | |
| | | | |
Kansas Development Finance Authority Series A | | | 5.00 | | | | 5-1-2019 | | | | 10,305,000 | | | | 10,413,306 | |
| | | | | | | | | | | | | | | | |
| | | | |
Kentucky: 2.32% | | | | | | | | | | | | | | | | |
| | | | |
| Education Revenue: 0.00% | | | | | | | | | | | | | | | | |
| | | | |
Kentucky Higher Education Student Loan Corporation Series A | | | 3.75 | | | | 6-1-2026 | | | | 80,000 | | | | 80,543 | |
| | | | | | | | | | | | | | | | |
| | | | |
| Health Revenue: 0.77% | | | | | | | | | | | | | | | | |
| | | | |
Ashland KY Ashland Hospital Corporation Medical Center Project Series B | | | 5.00 | | | | 2-1-2019 | | | | 1,500,000 | | | | 1,502,730 | |
| | | | |
Kentucky EDFA Catholic Health Initiative Series B1 (1 Month LIBOR +0.90%) ± | | | 2.50 | | | | 2-1-2046 | | | | 10,720,000 | | | | 10,723,109 | |
| | | | |
Kentucky EDFA Catholic Health Initiative Series B2 (1 Month LIBOR +0.90%) ± | | | 2.50 | | | | 2-1-2046 | | | | 11,220,000 | | | | 11,223,254 | |
| | | | |
Louisville & Jefferson Counties KY Catholic Health Initiatives Series A | | | 5.00 | | | | 12-1-2021 | | | | 8,060,000 | | | | 8,648,058 | |
| | | | |
| | | | | | | | | | | | | | | 32,097,151 | |
| | | | | | | | | | | | | | | | |
| | | | |
| Housing Revenue: 0.24% | | | | | | | | | | | | | | | | |
| | | | |
Kentucky Housing Corporation Jefferson Green Apartments Project | | | 2.20 | | | | 9-1-2022 | | | | 10,000,000 | | | | 9,995,700 | |
| | | | | | | | | | | | | | | | |
| | | | |
| Miscellaneous Revenue: 0.05% | | | | | | | | | | | | | | | | |
| | | | |
Hopkins County KY Public Properties Corporation Judicial Center Project | | | 3.63 | | | | 6-1-2025 | | | | 1,000,000 | | | | 1,022,630 | |
| | | | |
Pendleton County KY School District Finance Corporation | | | 2.00 | | | | 2-1-2021 | | | | 1,200,000 | | | | 1,179,408 | |
| | | | |
| | | | | | | | | | | | | | | 2,202,038 | |
| | | | | | | | | | | | | | | | |
| | | | |
| Utilities Revenue: 1.26% | | | | | | | | | | | | | | | | |
| | | | |
Kentucky Public Energy Authority Gas Supply Series B | | | 4.00 | | | | 1-1-2049 | | | | 24,085,000 | | | | 25,460,976 | |
| | | | |
Kentucky Public Energy Authority Gas Supply Series C | | | 4.00 | | | | 12-1-2049 | | | | 20,000,000 | | | | 20,975,200 | |
| | | | |
Louisville & Jefferson Counties KY Metro Government PCR Series A | | | 2.20 | | | | 2-1-2035 | | | | 1,000,000 | | | | 1,000,050 | |
| | | | |
Louisville & Jefferson Counties KY Metro Government PCR Series B | | | 2.55 | | | | 11-1-2027 | | | | 5,500,000 | | | | 5,522,275 | |
| | | | |
| | | | | | | | | | | | | | | 52,958,501 | |
| | | | | | | | | | | | | | | | |
| | | | |
| | | | | | | | | | | | | | | 97,333,933 | |
| | | | | | | | | | | | | | | | |
The accompanying notes are an integral part of these financial statements.
| | | | | | |
| Portfolio of investments—December 31, 2018 (unaudited) | | Wells Fargo Short-Term Municipal Bond Fund | | | 17 | |
| | | | | | | | | | | | | | | | |
| Security name | | Interest rate | | | Maturity date | | | Principal | | | Value | |
| | | | |
Louisiana: 1.08% | | | | | | | | | | | | | | | | |
| | | | |
| Housing Revenue: 0.07% | | | | | | | | | | | | | | | | |
| | | | |
Louisiana Housing Corporation Pine Trace Homes I Project | | | 2.40 | % | | | 5-1-2021 | | | $ | 3,000,000 | | | $ | 3,011,670 | |
| | | | | | | | | | | | | | | | |
| | | | |
| Industrial Development Revenue: 0.48% | | | | | | | | | | | | | | | | |
| | | | |
St. James Parish LA Nucor Steel LLC Project Gulf Opportunity Zone Series A-1 ø | | | 2.00 | | | | 11-1-2040 | | | | 20,000,000 | | | | 20,000,000 | |
| | | | | | | | | | | | | | | | |
| | | | |
| Tax Revenue: 0.08% | | | | | | | | | | | | | | | | |
| | | | |
Louisiana Local Government Environmental Facilities & CDA Series 2015 (Build America Mutual Assurance Company Insured) | | | 5.00 | | | | 12-1-2020 | | | | 1,135,000 | | | | 1,199,616 | |
| | | | |
Louisiana Regional Transit Authority CAB (National Insured) (z) | | | 5.06 | | | | 12-1-2021 | | | | 2,360,000 | | | | 2,070,168 | |
| | | | |
| | | | | | | | | | | | | | | 3,269,784 | |
| | | | | | | | | | | | | | | | |
| | | | |
| Utilities Revenue: 0.45% | | | | | | | | | | | | | | | | |
| | | | |
Desoto Parish LA PCR | | | 1.60 | | | | 1-1-2019 | | | | 15,000,000 | | | | 15,000,000 | |
| | | | |
Lafayette LA Refunding Bond | | | 5.00 | | | | 11-1-2023 | | | | 3,680,000 | | | | 4,083,328 | |
| | | | |
| | | | | | | | | | | | | | | 19,083,328 | |
| | | | | | | | | | | | | | | | |
| | | | |
| | | | | | | | | | | | | | | 45,364,782 | |
| | | | | | | | | | | | | | | | |
| | | | |
Maryland: 2.01% | | | | | | | | | | | | | | | | |
| | | | |
| GO Revenue: 0.62% | | | | | | | | | | | | | | | | |
| | | | |
Maryland State & Local Facilities Loan of 2015 Series A | | | 5.00 | | | | 3-1-2024 | | | | 23,060,000 | | | | 25,867,094 | |
| | | | | | | | | | | | | | | | |
| | | | |
| Health Revenue: 0.02% | | | | | | | | | | | | | | | | |
| | | | |
Rockville MD Mayor and Council Economic Development Ingleside King Farm Project Series A-1 | | | 5.00 | | | | 11-1-2020 | | | | 850,000 | | | | 880,286 | |
| | | | | | | | | | | | | | | | |
| | | | |
| Housing Revenue: 1.37% | | | | | | | | | | | | | | | | |
| | | | |
Maryland CDA Department of Housing & Community Multifamily Development Bethel Gardens Series F | | | 1.80 | | | | 2-1-2019 | | | | 8,500,000 | | | | 8,493,285 | |
| | | | |
Maryland CDA Department of Housing & Community Multifamily Development Lakeview Victoria Park Series H | | | 3.00 | | | | 11-1-2020 | | | | 9,000,000 | | | | 9,045,990 | |
| | | | |
Maryland CDA Department of Housing & Community Multifamily Development Orchard Park Series F | | | 2.52 | | | | 8-1-2020 | | | | 15,000,000 | | | | 14,962,950 | |
| | | | |
Maryland CDA Department of Housing & Community Multifamily Development Park Square Homes Series E | | | 2.53 | | | | 8-1-2020 | | | | 7,500,000 | | | | 7,481,475 | |
| | | | |
Maryland CDA Department of Housing & Community Multifamily Development The Ellerslie Series C | | | 2.00 | | | | 2-1-2019 | | | | 7,500,000 | | | | 7,497,450 | |
| | | | |
Maryland CDA Department of Housing & Community Multifamily Development Zions Towers Series A (FHA Insured) | | | 2.44 | | | | 3-1-2020 | | | | 10,000,000 | | | | 9,974,800 | |
| | | | |
| | | | | | | | | | | | | | | 57,455,950 | |
| | | | | | | | | | | | | | | | |
| | | | |
| | | | | | | | | | | | | | | 84,203,330 | |
| | | | | | | | | | | | | | | | |
| | | | |
Massachusetts: 5.03% | | | | | | | | | | | | | | | | |
| | | | |
| Education Revenue: 0.44% | | | | | | | | | | | | | | | | |
| | | | |
Massachusetts Educational Financing Authority AMT Issue K Series A | | | 5.00 | | | | 7-1-2022 | | | | 1,000,000 | | | | 1,083,500 | |
| | | | |
Massachusetts Educational Financing Authority AMT Issue J | | | 5.00 | | | | 7-1-2021 | | | | 1,280,000 | | | | 1,361,075 | |
| | | | |
Massachusetts Educational Financing Authority Series A | | | 3.50 | | | | 1-1-2019 | | | | 2,500,000 | | | | 2,500,000 | |
| | | | |
Massachusetts Educational Financing Authority Series A | | | 5.00 | | | | 1-1-2019 | | | | 4,000,000 | | | | 4,000,000 | |
The accompanying notes are an integral part of these financial statements.
| | | | |
| 18 | | Wells Fargo Short-Term Municipal Bond Fund | | Portfolio of investments—December 31, 2018 (unaudited) |
| | | | | | | | | | | | | | | | |
| Security name | | Interest rate | | | Maturity date | | | Principal | | | Value | |
| | | | |
| Education Revenue(continued) | | | | | | | | | | | | | | | | |
| | | | |
Massachusetts Educational Financing Authority Series A | | | 5.00 | % | | | 1-1-2020 | | | $ | 3,000,000 | | | $ | 3,080,370 | |
| | | | |
Massachusetts Educational Financing Authority Series A | | | 5.00 | | | | 1-1-2022 | | | | 4,115,000 | | | | 4,418,646 | |
| | | | |
Massachusetts Educational Financing Authority Series K | | | 5.00 | | | | 7-1-2019 | | | | 2,000,000 | | | | 2,027,680 | |
| | | | |
| | | | | | | | | | | | | | | 18,471,271 | |
| | | | | | | | | | | | | | | | |
| | | | |
| Health Revenue: 0.26% | | | | | | | | | | | | | | | | |
| | | | |
Massachusetts Development Finance Agency Partners Healthcare SystemSeries S-5 (SIFMA Municipal Swap +0.42%) ± | | | 2.13 | | | | 7-1-2044 | | | | 11,230,000 | | | | 11,224,722 | |
| | | | | | | | | | | | | | | | |
| | | | |
| Housing Revenue: 2.88% | | | | | | | | | | | | | | | | |
| | | | |
Massachusetts HFA Construction Loan Notes Series A | | | 1.85 | | | | 6-1-2020 | | | | 5,750,000 | | | | 5,734,820 | |
| | | | |
Massachusetts HFA Construction Loan Notes Series B | | | 2.00 | | | | 6-1-2019 | | | | 2,720,000 | | | | 2,720,109 | |
| | | | |
Massachusetts HFA Construction Loan Notes Series B | | | 2.05 | | | | 12-1-2021 | | | | 26,875,000 | | | | 26,874,731 | |
| | | | |
Massachusetts HFA Highland Glen Project Series A | | | 1.22 | | | | 8-1-2019 | | | | 10,000,000 | | | | 9,993,900 | |
| | | | |
Massachusetts HFA Multifamily Conduit Symphony Plaza Project Series A | | | 1.72 | | | | 2-1-2020 | | | | 61,000,000 | | | | 60,986,580 | |
| | | | |
Massachusetts HFA Multifamily Conduit Van Brodie Mill Series A (TD Bank NA LOC) | | | 2.00 | | | | 7-1-2020 | | | | 7,000,000 | | | | 6,981,590 | |
| | | | |
Massachusetts HFA Single Family Series 200 (1 Month LIBOR +0.38%) ± | | | 2.02 | | | | 12-1-2048 | | | | 7,500,000 | | | | 7,493,700 | |
| | | | |
| | | | | | | | | | | | | | | 120,785,430 | |
| | | | | | | | | | | | | | | | |
| | | | |
| Miscellaneous Revenue: 1.45% | | | | | | | | | | | | | | | | |
| | | | |
Massachusetts Consolidated Loan Series D | | | 1.05 | | | | 8-1-2043 | | | | 11,500,000 | | | | 11,324,970 | |
| | | | |
Massachusetts Consolidated Loan Subordinate Bond Series D-2 | | | 1.70 | | | | 8-1-2043 | | | | 24,550,000 | | | | 24,188,133 | |
| | | | |
Massachusetts RAN Series C | | | 4.00 | | | | 6-20-2019 | | | | 25,000,000 | | | | 25,260,000 | |
| | | | |
| | | | | | | | | | | | | | | 60,773,103 | |
| | | | | | | | | | | | | | | | |
| | | | |
| | | | | | | | | | | | | | | 211,254,526 | |
| | | | | | | | | | | | | | | | |
| | | | |
Michigan: 3.39% | | | | | | | | | | | | | | | | |
| | | | |
| Airport Revenue: 0.47% | | | | | | | | | | | | | | | | |
| | | | |
Wayne County MI Airport Authority Refunding Bond Series A | | | 5.00 | | | | 12-1-2019 | | | | 19,405,000 | | | | 19,918,844 | |
| | | | | | | | | | | | | | | | |
| | | | |
| Education Revenue: 0.50% | | | | | | | | | | | | | | | | |
| | | | |
RBC Municipal Products Incorporated Trust Series E-127 (Royal Bank of Canada LOC, Royal Bank of Canada LIQ) 144Aø | | | 1.74 | | | | 7-1-2020 | | | | 20,000,000 | | | | 20,000,000 | |
| | | | |
Western Michigan University Refunding Bond | | | 5.00 | | | | 11-15-2020 | | | | 1,000,000 | | | | 1,055,620 | |
| | | | |
| | | | | | | | | | | | | | | 21,055,620 | |
| | | | | | | | | | | | | | | | |
| | | | |
| GO Revenue: 0.93% | | | | | | | | | | | | | | | | |
| | | | |
Allendale MI Public School District Series A (Qualified School Board Loan Fund Insured) | | | 3.00 | | | | 11-1-2021 | | | | 895,000 | | | | 919,836 | |
| | | | |
Birmingham MI City School District | | | 5.00 | | | | 11-1-2019 | | | | 5,970,000 | | | | 6,128,623 | |
| | | | |
Caledonia MI Community Schools (Qualified School Board Loan Fund Insured) | | | 5.00 | | | | 5-1-2020 | | | | 500,000 | | | | 521,020 | |
| | | | |
Caledonia MI Community Schools (Qualified School Board Loan Fund Insured) | | | 5.00 | | | | 5-1-2021 | | | | 1,140,000 | | | | 1,218,181 | |
| | | | |
Chippewa Hills MI School District (Qualified School Board Loan Fund Insured) | | | 4.00 | | | | 5-1-2019 | | | | 1,595,000 | | | | 1,606,372 | |
| | | | |
Detroit MI Series 2018 | | | 5.00 | | | | 4-1-2021 | | | | 620,000 | | | | 642,866 | |
| | | | |
Flushing MI Community Schools School District (Qualified School Board Loan Fund Insured) | | | 4.00 | | | | 5-1-2021 | | | | 1,135,000 | | | | 1,186,620 | |
| | | | |
Forest Hills MI Public Schools | | | 5.00 | | | | 5-1-2019 | | | | 1,375,000 | | | | 1,389,630 | |
| | | | |
Fraser MI Public Schools District (Qualified School Board Loan Fund Insured) | | | 5.00 | | | | 5-1-2019 | | | | 1,050,000 | | | | 1,060,899 | |
The accompanying notes are an integral part of these financial statements.
| | | | | | |
| Portfolio of investments—December 31, 2018 (unaudited) | | Wells Fargo Short-Term Municipal Bond Fund | | | 19 | |
| | | | | | | | | | | | | | | | |
| Security name | | Interest rate | | | Maturity date | | | Principal | | | Value | |
| | | | |
| GO Revenue(continued) | | | | | | | | | | | | | | | | |
| | | | |
Gibraltar MI School District (Qualified School Board Loan Fund Insured) | | | 5.00 | % | | | 5-1-2019 | | | $ | 1,085,000 | | | $ | 1,096,620 | |
| | | | |
Gibraltar MI School District (Qualified School Board Loan Fund Insured) | | | 5.00 | | | | 5-1-2020 | | | | 1,100,000 | | | | 1,146,541 | |
| | | | |
Gibraltar MI School District (Qualified School Board Loan Fund Insured) | | | 5.00 | | | | 5-1-2021 | | | | 1,185,000 | | | | 1,264,596 | |
| | | | |
Grand Ledge MI Public School District (Qualified School Board Loan Fund Insured) | | | 5.00 | | | | 5-1-2020 | | | | 2,680,000 | | | | 2,790,523 | |
| | | | |
Haslett MI Public Schools (Qualified School Board Loan Fund Insured) | | | 4.00 | | | | 5-1-2019 | | | | 515,000 | | | | 518,672 | |
| | | | |
Haslett MI Public Schools (Qualified School Board Loan Fund Insured) | | | 4.00 | | | | 5-1-2020 | | | | 370,000 | | | | 380,330 | |
| | | | |
Haslett MI Public Schools (Qualified School Board Loan Fund Insured) | | | 5.00 | | | | 5-1-2021 | | | | 500,000 | | | | 535,235 | |
| | | | |
Hudsonville MI Public Schools (Qualified School Board Loan Fund Insured) | | | 5.00 | | | | 5-1-2019 | | | | 1,605,000 | | | | 1,621,756 | |
| | | | |
Lake Orion MI Community School District 2015 Refunding Bond (Qualified School Board Loan Fund Insured) | | | 5.00 | | | | 5-1-2019 | | | | 2,325,000 | | | | 2,349,273 | |
| | | | |
Lake Orion MI Community School District 2015 Refunding Bond (Qualified School Board Loan Fund Insured) | | | 5.00 | | | | 5-1-2020 | | | | 1,550,000 | | | | 1,613,922 | |
| | | | |
Lake Orion MI Community School District 2016 Refunding Bond (Qualified School Board Loan Fund Insured) | | | 5.00 | | | | 5-1-2019 | | | | 915,000 | | | | 924,553 | |
| | | | |
Lake Orion MI Community School District 2016 Refunding Bond (Qualified School Board Loan Fund Insured) | | | 5.00 | | | | 5-1-2020 | | | | 1,390,000 | | | | 1,447,324 | |
| | | | |
Lake Orion MI Community School District 2016 Refunding Bond (Qualified School Board Loan Fund Insured) | | | 5.00 | | | | 5-1-2021 | | | | 1,385,000 | | | | 1,477,698 | |
| | | | |
Rochester MI Community School District (Qualified School Board Loan Fund Insured) | | | 5.00 | | | | 5-1-2019 | | | | 900,000 | | | | 909,576 | |
| | | | |
South Lyon MI Community School District | | | 4.00 | | | | 5-1-2019 | | | | 1,860,000 | | | | 1,873,559 | |
| | | | |
South Lyon MI Community School District | | | 4.00 | | | | 5-1-2020 | | | | 1,425,000 | | | | 1,465,727 | |
| | | | |
Southgate MI Community School District (Build America Mutual Assurance Company Insured) | | | 5.00 | | | | 5-1-2019 | | | | 1,000,000 | | | | 1,010,710 | |
| | | | |
Southgate MI Community School District (Build America Mutual Assurance Company Insured) | | | 5.00 | | | | 5-1-2020 | | | | 500,000 | | | | 521,155 | |
| | | | |
Warren Woods MI Public Schools (Qualified School Board Loan Fund Insured) | | | 5.00 | | | | 5-1-2020 | | | | 1,445,000 | | | | 1,504,592 | |
| | | | |
| | | | | | | | | | | | | | | 39,126,409 | |
| | | | | | | | | | | | | | | | |
| | | | |
| Health Revenue: 0.20% | | | | | | | | | | | | | | | | |
| | | | |
Michigan Finance Authority Crittenden Hospital Medical Center Series A | | | 4.13 | | | | 6-1-2032 | | | | 4,290,000 | | | | 4,592,016 | |
| | | | |
Michigan Hospital Finance Authority Ascension Health Subordinate Credit Group Series 2005 A-4 | | | 1.63 | | | | 11-1-2027 | | | | 3,660,000 | | | | 3,643,384 | |
| | | | |
| | | | | | | | | | | | | | | 8,235,400 | |
| | | | | | | | | | | | | | | | |
| | | | |
| Housing Revenue: 0.13% | | | | | | | | | | | | | | | | |
| | | | |
Michigan Housing Development Authority Series A | | | 1.80 | | | | 4-1-2019 | | | | 5,405,000 | | | | 5,402,243 | |
| | | | | | | | | | | | | | | | |
| | | | |
| Miscellaneous Revenue: 0.41% | | | | | | | | | | | | | | | | |
| | | | |
Michigan Finance Authority School District | | | 5.00 | | | | 7-1-2021 | | | | 915,000 | | | | 915,000 | |
| | | | |
Michigan Finance Authority Senior Lien Distributable State Aid Charter County of Wayne Criminal Justice Center Project | | | 5.00 | | | | 11-1-2022 | | | | 1,150,000 | | | | 1,273,798 | |
| | | | |
Michigan Finance Authority Unemployment Obligation Assessment Series B | | | 5.00 | | | | 1-1-2020 | | | | 15,000,000 | | | | 15,240,450 | |
| | | | |
| | | | | | | | | | | | | | | 17,429,248 | |
| | | | | | | | | | | | | | | | |
| | | | |
| Tax Revenue: 0.03% | | | | | | | | | | | | | | | | |
| | | | |
Michigan Finance Authority Local Government Loan Program Series 2014H-1 | | | 5.00 | | | | 10-1-2022 | | | | 1,075,000 | | | | 1,149,659 | |
| | | | | | | | | | | | | | | | |
The accompanying notes are an integral part of these financial statements.
| | | | |
| 20 | | Wells Fargo Short-Term Municipal Bond Fund | | Portfolio of investments—December 31, 2018 (unaudited) |
| | | | | | | | | | | | | | | | |
| Security name | | Interest rate | | | Maturity date | | | Principal | | | Value | |
| | | | |
| Water & Sewer Revenue: 0.72% | | | | | | | | | | | | | | | | |
| | | | |
Detroit MI Sewage Disposal System Series A (AGM Insured) | | | 5.25 | % | | | 7-1-2019 | | | $ | 2,615,000 | | | $ | 2,655,036 | |
| | | | |
Michigan Finance Authority Refunding Bond Local Government Loan Program Detroit Water & Sewer Series D-3 (National Insured) | | | 5.00 | | | | 7-1-2019 | | | | 7,000,000 | | | | 7,105,560 | |
| | | | |
Michigan Finance Authority Refunding Bond Local Government Loan Program Detroit Water & Sewer Series D-6 (National Insured) | | | 5.00 | | | | 7-1-2019 | | | | 1,500,000 | | | | 1,522,620 | |
| | | | |
Michigan Finance Authority Refunding Bond Local Government Loan Program Detroit Water & Sewer Series D-6 (National Insured) | | | 5.00 | | | | 7-1-2020 | | | | 1,800,000 | | | | 1,877,490 | |
| | | | |
Michigan Finance Authority Refunding Bond Senior Lien Detroit Water & Sewer Series C-5 (National Insured) | | | 5.00 | | | | 7-1-2019 | | | | 7,000,000 | | | | 7,105,560 | |
| | | | |
Michigan Finance Authority Refunding Bond Second Lien Detroit Water & Sewer Series C-7 (National Insured) | | | 5.00 | | | | 7-1-2019 | | | | 2,500,000 | | | | 2,537,700 | |
| | | | |
Michigan Finance Authority Refunding Bond Second Lien Detroit Water & Sewer Series C-7 (National Insured) | | | 5.00 | | | | 7-1-2020 | | | | 3,835,000 | | | | 4,000,097 | |
| | | | |
Michigan Finance Authority Refunding Bond Second Lien Detroit Water & Sewer Series C-7 (National Insured) | | | 5.00 | | | | 7-1-2021 | | | | 3,095,000 | | | | 3,305,770 | |
| | | | |
| | | | | | | | | | | | | | | 30,109,833 | |
| | | | | | | | | | | | | | | | |
| | | | |
| | | | | | | | | | | | | | | 142,427,256 | |
| | | | | | | | | | | | | | | | |
| | | | |
Minnesota: 0.78% | | | | | | | | | | | | | | | | |
| | | | |
| GO Revenue: 0.04% | | | | | | | | | | | | | | | | |
| | | | |
Hastings MN Independent School District #200 Series A (South Dakota Credit Program Insured) (z) | | | 2.38 | | | | 2-1-2023 | | | | 815,000 | | | | 744,535 | |
| | | | |
Hastings MN Independent School District #200 Series A (South Dakota Credit Program Insured) (z) | | | 2.54 | | | | 2-1-2024 | | | | 1,015,000 | | | | 900,102 | |
| | | | |
| | | | | | | | | | | | | | | 1,644,637 | |
| | | | | | | | | | | | | | | | |
| | | | |
| Health Revenue: 0.18% | | | | | | | | | | | | | | | | |
| | | | |
Kanabec County MN Firstlight Health Kanabec Hospital | | | 2.75 | | | | 12-1-2019 | | | | 7,000,000 | | | | 6,999,300 | |
| | | | |
Minneapolis & St. Paul MN Housing & RDA Allina Health Systems Series B-1 (JPMorgan Chase & Company LOC) ø | | | 1.75 | | | | 11-15-2035 | | | | 600,000 | | | | 600,000 | |
| | | | |
| | | | | | | | | | | | | | | 7,599,300 | |
| | | | | | | | | | | | | | | | |
| | | | |
| Housing Revenue: 0.56% | | | | | | | | | | | | | | | | |
| | | | |
Dakota County Community Development Agency Senior Multifamily Housing West St. Paul Apartments Project Series A | | | 2.25 | | | | 1-1-2022 | | | | 6,285,000 | | | | 6,292,353 | |
| | | | |
Dakota County Community Development Agency Senior Multifamily Housing West St. Paul Apartments Project Series B | | | 3.80 | | | | 7-1-2022 | | | | 6,325,000 | | | | 6,329,554 | |
| | | | |
Minnesota HFA Series D (SIFMA Municipal Swap +0.43%) (GNMA/FNMA/FHLMC Insured) ± | | | 2.14 | | | | 1-1-2045 | | | | 11,000,000 | | | | 11,000,000 | |
| | | | |
| | | | | | | | | | | | | | | 23,621,907 | |
| | | | | | | | | | | | | | | | |
| | | | |
| | | | | | | | | | | | | | | 32,865,844 | |
| | | | | | | | | | | | | | | | |
| | | | |
Mississippi: 0.89% | | | | | | | | | | | | | | | | |
| | | | |
| Housing Revenue: 0.64% | | | | | | | | | | | | | | | | |
| | | | |
Mississippi Home Corporation Multifamily Housing Deville Manor Apartments Project | | | 1.76 | | | | 12-1-2020 | | | | 5,500,000 | | | | 5,496,425 | |
| | | | |
Mississippi Home Corporation Multifamily Vicksburg Housing Authority Rad Project (GNMA/FNMA/FHLMC Insured) | | | 1.91 | | | | 12-1-2020 | | | | 21,500,000 | | | | 21,459,365 | |
| | | | |
| | | | | | | | | | | | | | | 26,955,790 | |
| | | | | | | | | | | | | | | | |
The accompanying notes are an integral part of these financial statements.
| | | | | | |
| Portfolio of investments—December 31, 2018 (unaudited) | | Wells Fargo Short-Term Municipal Bond Fund | | | 21 | |
| | | | | | | | | | | | | | | | |
| Security name | | Interest rate | | | Maturity date | | | Principal | | | Value | |
| | | | |
| Resource Recovery Revenue: 0.09% | | | | | | | | | | | | | | | | |
| | | | |
Mississippi Business Finance Corporation Waste Management Incorporated Project | | | 1.85 | % | | | 3-1-2027 | | | $ | 3,500,000 | | | $ | 3,496,535 | |
| | | | | | | | | | | | | | | | |
| | | | |
| Utilities Revenue: 0.16% | | | | | | | | | | | | | | | | |
| | | | |
Mississippi Business Finance Corporation Mississippi Power Company Project Series 2010 | | | 2.75 | | | | 12-1-2040 | | | | 6,750,000 | | | | 6,755,603 | |
| | | | | | | | | | | | | | | | |
| | | | |
| | | | | | | | | | | | | | | 37,207,928 | |
| | | | | | | | | | | | | | | | |
| | | | |
Missouri: 1.15% | | | | | | | | | | | | | | | | |
| | | | |
| GO Revenue: 0.19% | | | | | | | | | | | | | | | | |
| | | | |
Kansas City MO Series A | | | 5.00 | | | | 2-1-2019 | | | | 1,000,000 | | | | 1,002,540 | |
| | | | |
Kansas City MO Series A | | | 5.00 | | | | 2-1-2020 | | | | 1,495,000 | | | | 1,546,308 | |
| | | | |
St. Louis MO Special Administrative Board The Transitional School Direct Deposit Program | | | 4.00 | | | | 4-1-2022 | | | | 5,030,000 | | | | 5,344,375 | |
| | | | |
| | | | | | | | | | | | | | | 7,893,223 | |
| | | | | | | | | | | | | | | | |
| | | | |
| Health Revenue: 0.08% | | | | | | | | | | | | | | | | |
| | | | |
Kirkwood MO IDA Retirement Community Series A | | | 8.25 | | | | 5-15-2045 | | | | 3,000,000 | | | | 3,249,720 | |
| | | | | | | | | | | | | | | | |
| | | | |
| Industrial Development Revenue: 0.55% | | | | | | | | | | | | | | | | |
| | | | |
Missouri Environmental Improvement and Energy Resources Authority Kansas City Power And Light Company Project | | | 2.75 | | | | 5-1-2038 | | | | 23,400,000 | | | | 23,222,628 | |
| | | | | | | | | | | | | | | | |
| | | | |
| Tax Revenue: 0.05% | | | | | | | | | | | | | | | | |
| | | | |
Arnold MO Real Property Arnold Triangle Redevelopment Project Series A | | | 3.75 | | | | 5-1-2023 | | | | 1,950,000 | | | | 1,947,602 | |
| | | | | | | | | | | | | | | | |
| | | | |
| Utilities Revenue: 0.28% | | | | | | | | | | | | | | | | |
| | | | |
Sikeston MO Electric System Refunding Bond | | | 5.00 | | | | 6-1-2019 | | | | 11,625,000 | | | | 11,764,384 | |
| | | | | | | | | | | | | | | | |
| | | | |
| | | | | | | | | | | | | | | 48,077,557 | |
| | | | | | | | | | | | | | | | |
| | | | |
Montana: 0.41% | | | | | | | | | | | | | | | | |
| | | | |
| Miscellaneous Revenue: 0.41% | | | | | | | | | | | | | | | | |
| | | | |
Montana Board of Investments Intercap Revolving Program | | | 1.65 | | | | 3-1-2032 | | | | 4,000,000 | | | | 3,997,360 | |
| | | | |
Montana Board of Investments Municipal Finance Consolidation | | | 1.65 | | | | 3-1-2035 | | | | 11,315,000 | | | | 11,307,532 | |
| | | | |
Montana Board of Investments Municipal Finance Consolidation | | | 1.65 | | | | 3-1-2038 | | | | 1,970,000 | | | | 1,968,700 | |
| | | | |
| | | | | | | | | | | | | | | 17,273,592 | |
| | | | | | | | | | | | | | | | |
| | | | |
Nebraska: 0.14% | | | | | | | | | | | | | | | | |
| | | | |
| Housing Revenue: 0.12% | | | | | | | | | | | | | | | | |
| | | | |
Douglas Country NE Housing Authority Sorensen Senior Residences Project Series A | | | 2.05 | | | | 3-1-2020 | | | | 5,000,000 | | | | 4,994,800 | |
| | | | | | | | | | | | | | | | |
| | | | |
| Utilities Revenue: 0.02% | | | | | | | | | | | | | | | | |
| | | | |
Nebraska Public Power Generation Agency Whelan Energy Center Unit 2 Series A | | | 5.00 | | | | 1-1-2020 | | | | 1,000,000 | | | | 1,029,090 | |
| | | | | | | | | | | | | | | | |
| | | | |
| | | | | | | | | | | | | | | 6,023,890 | |
| | | | | | | | | | | | | | | | |
The accompanying notes are an integral part of these financial statements.
| | | | |
| 22 | | Wells Fargo Short-Term Municipal Bond Fund | | Portfolio of investments—December 31, 2018 (unaudited) |
| | | | | | | | | | | | | | | | |
| Security name | | Interest rate | | | Maturity date | | | Principal | | | Value | |
| | | | |
Nevada: 0.65% | | | | | | | | | | | | | | | | |
| | | | |
| Airport Revenue: 0.05% | | | | | | | | | | | | | | | | |
| | | | |
Clark County NV Airport Jet Aviation Fuel Tax Series A | | | 5.00 | % | | | 7-1-2019 | | | $ | 1,000,000 | | | $ | 1,014,190 | |
| | | | |
Clark County NV Airport Jet Aviation Fuel Tax Series A | | | 5.00 | | | | 7-1-2020 | | | | 1,000,000 | | | | 1,041,090 | |
| | | | |
| | | | | | | | | | | | | | | 2,055,280 | |
| | | | | | | | | | | | | | | | |
| | | | |
| GO Revenue: 0.57% | | | | | | | | | | | | | | | | |
| | | | |
Clark County NV School District Series B | | | 5.00 | | | | 6-15-2019 | | | | 18,800,000 | | | | 19,070,720 | |
| | | | |
Clark County NV School District Series C | | | 5.00 | | | | 6-15-2022 | | | | 2,000,000 | | | | 2,181,560 | |
| | | | |
Clark County NV School District Series D | | | 5.00 | | | | 6-15-2021 | | | | 2,395,000 | | | | 2,556,447 | |
| | | | |
| | | | | | | | | | | | | | | 23,808,727 | |
| | | | | | | | | | | | | | | | |
| | | | |
| Industrial Development Revenue: 0.02% | | | | | | | | | | | | | | | | |
| | | | |
Clark County NV PCR | | | 1.88 | | | | 6-1-2031 | | | | 880,000 | | | | 869,466 | |
| | | | | | | | | | | | | | | | |
| | | | |
| Utilities Revenue: 0.01% | | | | | | | | | | | | | | | | |
| | | | |
Washoe County NV Sierra Pacific Power Series B | | | 3.00 | | | | 3-1-2036 | | | | 520,000 | | | | 530,499 | |
| | | | | | | | | | | | | | | | |
| | | | |
| | | | | | | | | | | | | | | 27,263,972 | |
| | | | | | | | | | | | | | | | |
| | | | |
New Hampshire: 0.12% | | | | | | | | | | | | | | | | |
| | | | |
| Health Revenue: 0.06% | | | | | | | | | | | | | | | | |
| | | | |
New Hampshire HEFA Catholic Medical Center | | | 4.00 | | | | 7-1-2019 | | | | 2,635,000 | | | | 2,656,502 | |
| | | | | | | | | | | | | | | | |
| | | | |
| Housing Revenue: 0.06% | | | | | | | | | | | | | | | | |
| | | | |
New Hampshire HFA Multifamily Housing Series 1 (FHA Insured) | | | 1.75 | | | | 1-1-2020 | | | | 2,455,000 | | | | 2,449,403 | |
| | | | | | | | | | | | | | | | |
| | | | |
| | | | | | | | | | | | | | | 5,105,905 | |
| | | | | | | | | | | | | | | | |
| | | | |
New Jersey: 6.72% | | | | | | | | | | | | | | | | |
| | | | |
| Education Revenue: 0.51% | | | | | | | | | | | | | | | | |
| | | | |
New Jersey EDA Student Loan Series 1 | | | 5.50 | | | | 12-1-2021 | | | | 1,000,000 | | | | 1,082,530 | |
| | | | |
New Jersey Higher Education Assistance Authority Series A1 | | | 5.00 | | | | 12-1-2020 | | | | 9,775,000 | | | | 10,235,500 | |
| | | | |
New Jersey Higher Education Series A | | | 5.25 | | | | 6-1-2021 | | | | 10,000,000 | | | | 10,124,700 | |
| | | | |
| | | | | | | | | | | | | | | 21,442,730 | |
| | | | | | | | | | | | | | | | |
| | | | |
| GO Revenue: 0.26% | | | | | | | | | | | | | | | | |
| | | | |
Andover NJ Regional School District Refunding School Bond Series 2014 (Build America Mutual Assurance Company Insured) | | | 3.00 | | | | 2-15-2020 | | | | 515,000 | | | | 521,736 | |
| | | | |
New Jersey TTFA Transit System Series A | | | 5.75 | | | | 6-15-2020 | | | | 4,425,000 | | | | 4,567,529 | |
| | | | |
Trenton City NJ Refunding Bond | | | 4.00 | | | | 7-15-2019 | | | | 1,905,000 | | | | 1,920,945 | |
| | | | |
Trenton City NJ Refunding Bond | | | 4.00 | | | | 7-15-2020 | | | | 1,685,000 | | | | 1,713,594 | |
| | | | |
Trenton City NJ Refunding Bond (Build America Mutual Assurance Company Insured) | | | 5.00 | | | | 12-1-2020 | | | | 1,675,000 | | | | 1,766,790 | |
| | | | |
Winslow Township NJ Board of Education Refunding Bond | | | 4.00 | | | | 8-1-2019 | | | | 525,000 | | | | 531,694 | |
| | | | |
| | | | | | | | | | | | | | | 11,022,288 | |
| | | | | | | | | | | | | | | | |
The accompanying notes are an integral part of these financial statements.
| | | | | | |
| Portfolio of investments—December 31, 2018 (unaudited) | | Wells Fargo Short-Term Municipal Bond Fund | | | 23 | |
| | | | | | | | | | | | | | | | |
| Security name | | Interest rate | | | Maturity date | | | Principal | | | Value | |
| | | | |
| Housing Revenue: 2.25% | | | | | | | | | | | | | | | | |
| | | | |
New Jersey Housing & Mortgage Finance Agency Multifamily Series A | | | 2.00 | % | | | 11-1-2021 | | | $ | 325,000 | | | $ | 323,931 | |
| | | | |
New Jersey Housing & Mortgage Finance Agency Multifamily Series B | | | 1.25 | | | | 5-1-2019 | | | | 6,000,000 | | | | 5,983,140 | |
| | | | |
New Jersey Housing & Mortgage Finance Agency Multifamily Series B | | | 1.65 | | | | 5-1-2020 | | | | 4,605,000 | | | | 4,585,751 | |
| | | | |
New Jersey Housing & Mortgage Finance Agency Multifamily Series B | | | 2.00 | | | | 5-1-2021 | | | | 14,335,000 | | | | 14,328,406 | |
| | | | |
New Jersey Housing & Mortgage Finance Agency Multifamily Series C | | | 2.41 | | | | 10-1-2021 | | | | 27,500,000 | | | | 27,625,950 | |
| | | | |
New Jersey Housing & Mortgage Finance Agency Single Family Housing Series B | | | 2.60 | | | | 10-1-2021 | | | | 6,060,000 | | | | 6,061,454 | |
| | | | |
New Jersey Housing & Mortgage Finance Agency Single Family Housing Series B | | | 2.70 | | | | 4-1-2022 | | | | 6,195,000 | | | | 6,202,496 | |
| | | | |
New Jersey Housing & Mortgage Finance Agency Single Family Housing Series B | | | 2.80 | | | | 10-1-2022 | | | | 5,780,000 | | | | 5,792,138 | |
| | | | |
New Jersey Housing & Mortgage Finance Agency Single Family Housing Series B | | | 2.90 | | | | 4-1-2023 | | | | 6,370,000 | | | | 6,402,806 | |
| | | | |
New Jersey Housing & Mortgage Finance Agency Single Family Housing Series B | | | 2.95 | | | | 10-1-2023 | | | | 5,970,000 | | | | 6,006,716 | |
| | | | |
New Jersey Housing & Mortgage Finance Agency Single Family Housing Series B | | | 3.10 | | | | 4-1-2024 | | | | 2,820,000 | | | | 2,855,419 | |
| | | | |
New Jersey Housing & Mortgage Finance Agency Single Family Housing Series B | | | 3.25 | | | | 4-1-2025 | | | | 3,210,000 | | | | 3,249,804 | |
| | | | |
New Jersey Housing & Mortgage Finance Agency Villa Victoria Apartments Project Series F | | | 2.43 | | | | 11-1-2021 | | | | 5,000,000 | | | | 5,020,400 | |
| | | | |
| | | | | | | | | | | | | | | 94,438,411 | |
| | | | | | | | | | | | | | | | |
| | | | |
| Miscellaneous Revenue: 1.88% | | | | | | | | | | | | | | | | |
| | | | |
New Jersey EDA School Facilities Construction Bond Series DDD | | | 5.00 | | | | 6-15-2023 | | | | 3,000,000 | | | | 3,269,040 | |
| | | | |
New Jersey EDA School Facilities Construction Bond Series DDD | | | 5.00 | | | | 6-15-2024 | | | | 2,605,000 | | | | 2,863,729 | |
| | | | |
New Jersey EDA School Facilities Construction Bonds Series DD-1 | | | 5.00 | | | | 12-15-2019 | | | | 1,000,000 | | | | 1,024,930 | |
| | | | |
New Jersey EDA School Facilities Construction Bonds Series K (National Insured) | | | 5.25 | | | | 12-15-2021 | | | | 1,040,000 | | | | 1,118,073 | |
| | | | |
New Jersey EDA School Facilities Construction Notes Series NN | | | 5.00 | | | | 3-1-2022 | | | | 405,000 | | | | 432,900 | |
| | | | |
New Jersey EDA School Facilities Construction Refunding Bond Series NN | | | 5.00 | | | | 3-1-2021 | | | | 5,020,000 | | | | 5,273,610 | |
| | | | |
New Jersey EDA Series BBB | | | 5.00 | | | | 6-15-2022 | | | | 6,000,000 | | | | 6,447,480 | |
| | | | |
New Jersey EDA Series BBB | | | 5.00 | | | | 6-15-2023 | | | | 4,000,000 | | | | 4,358,720 | |
| | | | |
New Jersey EDA Series XX | | | 5.00 | | | | 6-15-2022 | | | | 7,500,000 | | | | 8,059,350 | |
| | | | |
New Jersey EDA Transportation Project New Jersey Transit Corporation Project Series B | | | 5.00 | | | | 11-1-2021 | | | | 2,490,000 | | | | 2,653,917 | |
| | | | |
New Jersey EDA Transportation Project New Jersey Transit Corporation Project Series B | | | 5.00 | | | | 11-1-2022 | | | | 26,000,000 | | | | 28,110,680 | |
| | | | |
New Jersey HFFA Greystone Park Psychiatric Hospital Project Series B | | | 5.00 | | | | 9-15-2019 | | | | 2,135,000 | | | | 2,176,675 | |
| | | | |
New Jersey School Facilities Construction Prerefunded Bond Series EE | | | 5.00 | | | | 9-1-2020 | | | | 1,650,000 | | | | 1,731,824 | |
| | | | |
New Jersey TTFA Series A | | | 5.00 | | | | 12-15-2019 | | | | 3,000,000 | | | | 3,074,790 | |
| | | | |
New Jersey TTFA Series A | | | 5.00 | | | | 6-15-2020 | | | | 1,000,000 | | | | 1,037,550 | |
| | | | |
Newark NJ Housing Authority Newark Redevelopment Project Refunding Bond (National Insured) | | | 5.25 | | | | 1-1-2020 | | | | 2,170,000 | | | | 2,239,961 | |
| | | | |
Newark NJ Housing Authority Newark Redevelopment Project Refunding Bond (National Insured) | | | 5.25 | | | | 1-1-2021 | | | | 4,570,000 | | | | 4,846,988 | |
| | | | |
| | | | | | | | | | | | | | | 78,720,217 | |
| | | | | | | | | | | | | | | | |
| | | | |
| Tax Revenue: 0.05% | | | | | | | | | | | | | | | | |
| | | | |
New Jersey Casino Reinvestment Development Authority | | | 4.00 | | | | 11-1-2019 | | | | 1,425,000 | | | | 1,442,129 | |
| | | | |
New Jersey EDA School Facilities Construction Unrefunded Bond Series EE | | | 5.00 | | | | 9-1-2020 | | | | 610,000 | | | | 636,065 | |
| | | | |
| | | | | | | | | | | | | | | 2,078,194 | |
| | | | | | | | | | | | | | | | |
| | | | |
| Tobacco Revenue: 0.06% | | | | | | | | | | | | | | | | |
| | | | |
New Jersey EDA | | | 4.00 | | | | 6-15-2019 | | | | 2,500,000 | | | | 2,519,100 | |
| | | | | | | | | | | | | | | | |
The accompanying notes are an integral part of these financial statements.
| | | | |
| 24 | | Wells Fargo Short-Term Municipal Bond Fund | | Portfolio of investments—December 31, 2018 (unaudited) |
| | | | | | | | | | | | | | | | |
| Security name | | Interest rate | | | Maturity date | | | Principal | | | Value | |
| | | | |
| Transportation Revenue: 1.71% | | | | | | | | | | | | | | | | |
| | | | |
New Jersey TTFA Series A | | | 5.25 | % | | | 12-15-2020 | | | $ | 33,465,000 | | | $ | 35,290,516 | |
| | | | |
New Jersey TTFA Series A1 | | | 5.00 | | | | 6-15-2020 | | | | 7,000,000 | | | | 7,272,020 | |
| | | | |
New Jersey TTFA Series A1 | | | 5.00 | | | | 6-15-2021 | | | | 5,000,000 | | | | 5,294,000 | |
| | | | |
New Jersey TTFA Series AA | | | 5.00 | | | | 6-15-2019 | | | | 2,070,000 | | | | 2,095,689 | |
| | | | |
New Jersey Turnpike Authority Series C-6 (1 Month LIBOR +0.75%) ± | | | 2.39 | | | | 1-1-2030 | | | | 21,820,000 | | | | 21,940,883 | |
| | | | |
| | | | | | | | | | | | | | | 71,893,108 | |
| | | | | | | | | | | | | | | | |
| | | | |
| | | | | | | | | | | | | | | 282,114,048 | |
| | | | | | | | | | | | | | | | |
| | | | |
New Mexico: 0.78% | | | | | | | | | | | | | | | | |
| | | | |
| Utilities Revenue: 0.78% | | | | | | | | | | | | | | | | |
| | | | |
Farmington NM PCR Southern California Edison Company Four Corners Project Series A | | | 1.88 | | | | 4-1-2029 | | | | 4,950,000 | | | | 4,890,749 | |
| | | | |
Farmington NM PCR Southern California Edison Company Four Corners Project Series B | | | 1.88 | | | | 4-1-2029 | | | | 6,000,000 | | | | 5,928,180 | |
| | | | |
New Mexico Municipal Energy Acquisition Authority Gas Supply Subordinate Bond Series B (1 Month LIBOR +0.75%) (Royal Bank of Canada SPA) ± | | | 2.32 | | | | 11-1-2039 | | | | 21,725,000 | | | | 21,728,693 | |
| | | | |
| | | | | | | | | | | | | | | 32,547,622 | |
| | | | | | | | | | | | | | | | |
| | | | |
New York: 8.19% | | | | | | | | | | | | | | | | |
| | | | |
| GO Revenue: 1.11% | | | | | | | | | | | | | | | | |
| | | | |
Binghamton NY Various Purpose BAN Series B | | | 3.00 | | | | 4-19-2019 | | | | 21,000,000 | | | | 21,063,840 | |
| | | | |
Nassau County NY Prerefunded Bond Series C | | | 5.00 | | | | 10-1-2020 | | | | 3,020,000 | | | | 3,092,661 | |
| | | | |
Nassau County NY Series A | | | 5.00 | | | | 1-1-2020 | | | | 4,000,000 | | | | 4,121,560 | |
| | | | |
Nassau County NY Series F | | | 5.00 | | | | 10-1-2020 | | | | 1,780,000 | | | | 1,822,827 | |
| | | | |
Nassau County NY Unrefunded Bond Series C | | | 5.00 | | | | 10-1-2020 | | | | 45,000 | | | | 46,083 | |
| | | | |
Oyster Bay NY Public Improvement | | | 4.00 | | | | 2-15-2020 | | | | 1,000,000 | | | | 1,017,060 | |
| | | | |
Rockland County NY Public Improvement Series C (AGM Insured) | | | 3.00 | | | | 5-1-2020 | | | | 1,390,000 | | | | 1,411,211 | |
| | | | |
Rockland County NY Refunding Bond (Build America Mutual Assurance Company Insured) | | | 3.00 | | | | 2-15-2019 | | | | 1,830,000 | | | | 1,832,635 | |
| | | | |
Rockland County NY Refunding Bond (Build America Mutual Assurance Company Insured) | | | 3.00 | | | | 2-15-2020 | | | | 630,000 | | | | 638,171 | |
| | | | |
Suffolk County NY Refunding Bond Series A | | | 5.00 | | | | 4-1-2019 | | | | 1,385,000 | | | | 1,395,817 | |
| | | | |
Suffolk County NY TAN | | | 5.00 | | | | 7-24-2019 | | | | 10,000,000 | | | | 10,147,800 | |
| | | | |
| | | | | | | | | | | | | | | 46,589,665 | |
| | | | | | | | | | | | | | | | |
| | | | |
| Health Revenue: 0.14% | | | | | | | | | | | | | | | | |
| | | | |
New York NY Health & Hospital Corporation Health System Series A | | | 5.50 | | | | 2-15-2020 | | | | 5,755,000 | | | | 5,772,380 | |
| | | | | | | | | | | | | | | | |
| | | | |
| Housing Revenue: 0.66% | | | | | | | | | | | | | | | | |
| | | | |
New York HFA Affordable Housing Series L (GNMA/FNMA/FHLMC Insured) | | | 1.65 | | | | 5-1-2021 | | | | 6,400,000 | | | | 6,347,776 | |
| | | | |
New York HFA Affordable Housing Series M-1 (GNMA/FNMA/FHLMC Insured) | | | 1.80 | | | | 5-1-2020 | | | | 1,200,000 | | | | 1,197,324 | |
| | | | |
New York HFA Affordable Housing Series M-1 (GNMA/FNMA/FHLMC Insured) | | | 2.00 | | | | 5-1-2021 | | | | 5,000,000 | | | | 4,986,400 | |
| | | | |
New York NY Housing Development Corporation Sustainable Neighborhood Bonds Series I2B | | | 2.00 | | | | 5-1-2021 | | | | 12,000,000 | | | | 11,990,040 | |
| | | | |
Saratoga County NY Capital Resource Corporation Multifamily Housing Preservation LLC Project | | | 2.00 | | | | 7-1-2020 | | | | 3,250,000 | | | | 3,250,000 | |
| | | | |
| | | | | | | | | | | | | | | 27,771,540 | |
| | | | | | | | | | | | | | | | |
The accompanying notes are an integral part of these financial statements.
| | | | | | |
| Portfolio of investments—December 31, 2018 (unaudited) | | Wells Fargo Short-Term Municipal Bond Fund | | | 25 | |
| | | | | | | | | | | | | | | | |
| Security name | | Interest rate | | | Maturity date | | | Principal | | | Value | |
| | | | |
| Industrial Development Revenue: 0.99% | | | | | | | | | | | | | | | | |
| | | | |
New York Transportation Development Corporation American Airlines Incorporated John F. Kennedy International Airport Project Series 2016 | | | 5.00 | % | | | 8-1-2019 | | | $ | 8,000,000 | | | $ | 8,103,680 | |
| | | | |
New York Transportation Development Corporation Special Facilities Revenue Delta Air lines Incorporated LaGuardia Airport Terminals C&D Redevelopment | | | 5.00 | | | | 1-1-2024 | | | | 30,130,000 | | | | 33,243,936 | |
| | | | |
| | | | | | | | | | | | | | | 41,347,616 | |
| | | | | | | | | | | | | | | | |
| | | | |
| Miscellaneous Revenue: 0.14% | | | | | | | | | | | | | | | | |
| | | | |
Suffolk County NY Judicial Facilities Agency Leases H. Lee Dennison Building | | | 5.00 | | | | 11-1-2019 | | | | 2,775,000 | | | | 2,840,629 | |
| | | | |
Suffolk County NY Judicial Facilities Agency Leases H. Lee Dennison Building | | | 5.00 | | | | 11-1-2020 | | | | 2,915,000 | | | | 3,063,578 | |
| | | | |
| | | | | | | | | | | | | | | 5,904,207 | |
| | | | | | | | | | | | | | | | |
| | | | |
| Tax Revenue: 0.61% | | | | | | | | | | | | | | | | |
| | | | |
New York Metropolitan Transportation Authority Subordinate Bond Series A2A (SIFMA Municipal Swap +0.45%) ± | | | 2.16 | | | | 11-1-2026 | | | | 6,980,000 | | | | 6,937,073 | |
| | | | |
New York NY Transitional Finance Authority (SIFMA Municipal Swap +0.80%) ± | | | 2.51 | | | | 11-1-2022 | | | | 18,500,000 | | | | 18,659,285 | |
| | | | |
| | | | | | | | | | | | | | | 25,596,358 | |
| | | | | | | | | | | | | | | | |
| | | | |
| Transportation Revenue: 4.03% | | | | | | | | | | | | | | | | |
| | | | |
New York Metropolitan Transportation Authority Subordinate Bond Series A-3 (SIFMA Municipal Swap +0.50%) ± | | | 2.21 | | | | 11-15-2042 | | | | 39,500,000 | | | | 39,492,890 | |
| | | | |
New York Metropolitan Transportation Authority Subordinate Bond Series A2 (SIFMA Municipal Swap +0.58%) ± | | | 2.29 | | | | 11-15-2039 | | | | 2,000,000 | | | | 1,999,280 | |
| | | | |
New York Metropolitan Transportation Authority Subordinate Bond Series B4 | | | 5.00 | | | | 11-15-2030 | | | | 13,835,000 | | | | 14,188,346 | |
| | | | |
New York Metropolitan Transportation Authority Subordinate Bond Series C2 | | | 4.00 | | | | 11-15-2033 | | | | 8,330,000 | | | | 8,573,403 | |
| | | | |
New York Metropolitan Transportation Authority Subordinate Bond Series D-2 (SIFMA Municipal Swap +0.45%) ± | | | 2.16 | | | | 11-15-2044 | | | | 22,545,000 | | | | 22,374,785 | |
| | | | |
New York Metropolitan Transportation Authority Subordinate Bond Series D-2A-1 (1 Month LIBOR +0.57%) (AGM Insured) ± | | | 2.19 | | | | 11-1-2032 | | | | 7,500,000 | | | | 7,510,500 | |
| | | | |
New York Metropolitan Transportation Authority Subordinate Bond Series D-2A-2 (1 Month LIBOR +0.68%) (AGM Insured) ± | | | 2.30 | | | | 11-1-2032 | | | | 20,000,000 | | | | 20,090,600 | |
| | | | |
New York Metropolitan Transportation Authority Subordinate Bond Series D-2B (1 Month LIBOR +0.30%) (AGM Insured) ± | | | 1.92 | | | | 11-1-2032 | | | | 6,000,000 | | | | 5,977,740 | |
| | | | |
New York Metropolitan Transportation Authority Subordinate Bond Series D2 | | | 4.00 | | | | 11-15-2034 | | | | 14,665,000 | | | | 14,845,380 | |
| | | | |
Niagara Falls NY Board Community Toll (National Insured) | | | 6.25 | | | | 10-1-2020 | | | | 8,685,000 | | | | 9,329,948 | |
| | | | |
Triborough Bridge & Tunnel Authority New York Series B (United States Secured Overnight Financing Rate +0.43%) ± | | | 2.05 | | | | 1-1-2032 | | | | 24,590,000 | | | | 24,614,590 | |
| | | | |
| | | | | | | | | | | | | | | 168,997,462 | |
| | | | | | | | | | | | | | | | |
| | | | |
| Utilities Revenue: 0.49% | | | | | | | | | | | | | | | | |
| | | | |
Long Island NY Power Authority Electric System Series C (1 Month LIBOR +0.75%) ± | | | 2.39 | | | | 5-1-2033 | | | | 20,550,000 | | | | 20,540,753 | |
| | | | | | | | | | | | | | | | |
| | | | |
| Water & Sewer Revenue: 0.02% | | | | | | | | | | | | | | | | |
| | | | |
New York Environmental Facilities Corporation Municipal Water Series A | | | 5.00 | | | | 6-15-2019 | | | | 1,000,000 | | | | 1,015,080 | |
| | | | | | | | | | | | | | | | |
| | | | |
| | | | | | | | | | | | | | | 343,535,061 | |
| | | | | | | | | | | | | | | | |
| | | | |
North Carolina: 0.19% | | | | | | | | | | | | | | | | |
| | | | |
| Health Revenue: 0.18% | | | | | | | | | | | | | | | | |
| | | | |
Charlotte Mecklenburg NC Hospital Authority Atrium Health Series B | | | 5.00 | | | | 1-15-2048 | | | | 7,000,000 | | | | 7,604,100 | |
| | | | | | | | | | | | | | | | |
The accompanying notes are an integral part of these financial statements.
| | | | |
| 26 | | Wells Fargo Short-Term Municipal Bond Fund | | Portfolio of investments—December 31, 2018 (unaudited) |
| | | | | | | | | | | | | | | | |
| Security name | | Interest rate | | | Maturity date | | | Principal | | | Value | |
| | | | |
| Utilities Revenue: 0.01% | | | | | | | | | | | | | | | | |
| | | | |
North Carolina Eastern Municipal Power Agency Series C (AGC Insured) | | | 6.00 | % | | | 1-1-2019 | | | $ | 250,000 | | | $ | 250,000 | |
| | | | | | | | | | | | | | | | |
| | | | |
| | | | | | | | | | | | | | | 7,854,100 | |
| | | | | | | | | | | | | | | | |
| | | | |
Ohio: 2.10% | | | | | | | | | | | | | | | | |
| | | | |
| GO Revenue: 0.01% | | | | | | | | | | | | | | | | |
| | | | |
Springfield OH Refunding Bond (AGC Insured) | | | 4.00 | | | | 12-1-2020 | | | | 440,000 | | | | 443,159 | |
| | | | | | | | | | | | | | | | |
| | | | |
| Health Revenue: 0.08% | | | | | | | | | | | | | | | | |
| | | | |
Lake County OH Lake Hospital System Incorporated | | | 5.00 | | | | 8-15-2020 | | | | 905,000 | | | | 945,454 | |
| | | | |
Warren County OH HCFR Otterbein Homes Series A | | | 5.00 | | | | 7-1-2019 | | | | 2,215,000 | | | | 2,246,209 | |
| | | | |
| | | | | | | | | | | | | | | 3,191,663 | |
| | | | | | | | | | | | | | | | |
| | | | |
| Housing Revenue: 0.55% | | | | | | | | | | | | | | | | |
| | | | |
Cuyahoga OH Metropolitan Housing Authority Headquarters Project | | | 1.75 | | | | 3-1-2020 | | | | 5,575,000 | | | | 5,564,742 | |
| | | | |
Lucas OH Metropolitan Housing Authority Certificate of Participation | | | 2.25 | | | | 11-1-2020 | | | | 530,000 | | | | 526,831 | |
| | | | |
Lucas Plaza OH Housing Development Corporation Refunding Bond (FHA Insured) (z) | | | 2.56 | | | | 6-1-2024 | | | | 15,800,000 | | | | 13,856,758 | |
| | | | |
Ohio HFA Cambridge Village Apartments Project (HUD Insured) | | | 2.40 | | | | 4-1-2021 | | | | 3,200,000 | | | | 3,210,496 | |
| | | | |
| | | | | | | | | | | | | | | 23,158,827 | |
| | | | | | | | | | | | | | | | |
| | | | |
| Miscellaneous Revenue: 0.06% | | | | | | | | | | | | | | | | |
| | | | |
Ohio Portsmouth Bypass Project | | | 5.00 | | | | 12-31-2020 | | | | 1,320,000 | | | | 1,380,654 | |
| | | | |
Ohio Portsmouth Bypass Project | | | 5.00 | | | | 12-31-2021 | | | | 1,205,000 | | | | 1,283,494 | |
| | | | |
| | | | | | | | | | | | | | | 2,664,148 | |
| | | | | | | | | | | | | | | | |
| | | | |
| Resource Recovery Revenue: 0.24% | | | | | | | | | | | | | | | | |
| | | | |
Ohio Air Quality Development Authority Ohio Valley Electric Corporation Series E | | | 5.63 | | | | 10-1-2019 | | | | 10,000,000 | | | | 10,145,300 | |
| | | | | | | | | | | | | | | | |
| | | | |
| Utilities Revenue: 1.16% | | | | | | | | | | | | | | | | |
| | | | |
Lancaster OH Port Authority (1 Month LIBOR +0.72%) (Royal Bank of Canada SPA) ± | | | 2.29 | | | | 5-1-2038 | | | | 48,500,000 | | | | 48,504,850 | |
| | | | | | | | | | | | | | | | |
| | | | |
| | | | | | | | | | | | | | | 88,107,947 | |
| | | | | | | | | | | | | | | | |
| | | | |
Oklahoma: 0.75% | | | | | | | | | | | | | | | | |
| | | | |
| Airport Revenue: 0.13% | | | | | | | | | | | | | | | | |
| | | | |
Tulsa OK Airports Improvement Trust Series 2013A (Build America Mutual Assurance Company Insured) | | | 5.00 | | | | 6-1-2020 | | | | 695,000 | | | | 720,798 | |
| | | | |
Tulsa OK Airports Improvement Trust Series 2015A (Build America Mutual Assurance Company Insured) | | | 5.00 | | | | 6-1-2019 | | | | 3,025,000 | | | | 3,058,759 | |
| | | | |
Tulsa OK Airports Improvement Trust Series 2015A (Build America Mutual Assurance Company Insured) | | | 5.00 | | | | 6-1-2020 | | | | 1,710,000 | | | | 1,773,475 | |
| | | | |
| | | | | | | | | | | | | | | 5,553,032 | |
| | | | | | | | | | | | | | | | |
| | | | |
| GO Revenue: 0.35% | | | | | | | | | | | | | | | | |
| | | | |
Oklahoma County OK Independent School District #52 Series A | | | 2.50 | | | | 1-1-2021 | | | | 3,535,000 | | | | 3,570,067 | |
| | | | |
Oklahoma County OK Independent School District #52 Series A | | | 3.00 | | | | 1-1-2022 | | | | 3,535,000 | | | | 3,637,232 | |
| | | | |
Oklahoma County OK Independent School District #52 Series A | | | 3.00 | | | | 1-1-2023 | | | | 3,135,000 | | | | 3,245,007 | |
The accompanying notes are an integral part of these financial statements.
| | | | | | |
| Portfolio of investments—December 31, 2018 (unaudited) | | Wells Fargo Short-Term Municipal Bond Fund | | | 27 | |
| | | | | | | | | | | | | | | | |
| Security name | | Interest rate | | | Maturity date | | | Principal | | | Value | |
| | | | |
| GO Revenue(continued) | | | | | | | | | | | | | | | | |
| | | | |
Oklahoma County OK Independent School District #52 Series A | | | 3.50 | % | | | 1-1-2020 | | | $ | 2,840,000 | | | $ | 2,883,424 | |
| | | | |
Woodward County OK Independent School District #1 Board of Education | | | 2.30 | | | | 6-1-2020 | | | | 1,435,000 | | | | 1,435,574 | |
| | | | |
| | | | | | | | | | | | | | | 14,771,304 | |
| | | | | | | | | | | | | | | | |
| | | | |
| Health Revenue: 0.05% | | | | | | | | | | | | | | | | |
| | | | |
Oklahoma City OK Industrial & Cultural Facilities Series B (National Insured) (m)(n) | | | 3.17 | | | | 6-1-2019 | | | | 300,000 | | | | 291,000 | |
| | | | |
Oklahoma Development Finance Authority Oklahoma University Medicine Project Series B | | | 5.00 | | | | 8-15-2022 | | | | 500,000 | | | | 540,255 | |
| | | | |
Oklahoma Development Finance Authority Oklahoma University Medicine Project Series B | | | 5.00 | | | | 8-15-2023 | | | | 500,000 | | | | 548,220 | |
| | | | |
Oklahoma Development Finance Authority Oklahoma University Medicine Project Series B | | | 5.00 | | | | 8-15-2024 | | | | 600,000 | | | | 665,514 | |
| | | | |
| | | | | | | | | | | | | | | 2,044,989 | |
| | | | | | | | | | | | | | | | |
| | | | |
| Miscellaneous Revenue: 0.21% | | | | | | | | | | | | | | | | |
| | | | |
Blaine County OK Educational Facilities Authority Watonga Public Schools Project | | | 5.00 | | | | 12-1-2020 | | | | 750,000 | | | | 788,355 | |
| | | | |
Blaine County OK Educational Facilities Authority Watonga Public Schools Project | | | 5.00 | | | | 12-1-2021 | | | | 945,000 | | | | 1,015,043 | |
| | | | |
Cleveland County OK Educational Facilities Authority Norman Public Schools Project | | | 5.00 | | | | 7-1-2019 | | | | 2,000,000 | | | | 2,030,860 | |
| | | | |
Creek County OK Educational Facilities Authority Sapulpa Public School Project | | | 5.00 | | | | 9-1-2020 | | | | 2,550,000 | | | | 2,673,879 | |
| | | | |
Grady County OK School Finance Authority Tuttle Public School Project | | | 5.00 | | | | 9-1-2019 | | | | 1,000,000 | | | | 1,020,450 | |
| | | | |
Grady County OK School Finance Authority Tuttle Public School Project | | | 5.00 | | | | 9-1-2021 | | | | 1,065,000 | | | | 1,143,927 | |
| | | | |
| | | | | | | | | | | | | | | 8,672,514 | |
| | | | | | | | | | | | | | | | |
| | | | |
| Tax Revenue: 0.01% | | | | | | | | | | | | | | | | |
| | | | |
Cleveland County OK Justice Authority Detention Facility Project | | | 4.00 | | | | 3-1-2020 | | | | 500,000 | | | | 501,625 | |
| | | | | | | | | | | | | | | | |
| | | | |
| | | | | | | | | | | | | | | 31,543,464 | |
| | | | | | | | | | | | | | | | |
| | | | |
Other: 1.04% | | | | | | | | | | | | | | | | |
| | | | |
| Miscellaneous Revenue: 1.04% | | | | | | | | | | | | | | | | |
| | | | |
Branch Banking & Trust Municipal Investment Trust Various States Class C (SIFMA Municipal Swap +1.05%) (Rabobank LOC) 144A± | | | 2.76 | | | | 12-31-2019 | | | | 6,354,027 | | | | 6,354,154 | |
| | | | |
Branch Banking & Trust Municipal Investment Trust Various States Class D (SIFMA Municipal Swap +0.80%) (Rabobank LOC) 144A± | | | 2.51 | | | | 11-15-2019 | | | | 355,305 | | | | 355,312 | |
| | | | |
FHLMC Multiclass Mortgage Participation Certificates Series M012 Class A1A øø | | | 1.60 | | | | 8-15-2051 | | | | 1,000,000 | | | | 965,740 | |
| | | | |
FHLMC Multiclass Mortgage Participation Certificates Series M012 Class A1B1 øø | | | 2.25 | | | | 8-15-2051 | | | | 18,500,000 | | | | 18,329,060 | |
| | | | |
FHLMC Multifamily Variable Rate Certificates Series M042 Class A ø | | | 1.96 | | | | 9-15-2033 | | | | 10,930,000 | | | | 10,930,000 | |
| | | | |
Public Housing Capital Fund Trust I (HUD Insured) 144A | | | 4.50 | | | | 7-1-2022 | | | | 5,001,153 | | | | 5,001,003 | |
| | | | |
Public Housing Capital Fund Trust II (HUD Insured) 144A | | | 4.50 | | | | 7-1-2022 | | | | 1,516,873 | | | | 1,516,873 | |
| | | | |
| | | | | | | | | | | | | | | 43,452,142 | |
| | | | | | | | | | | | | | | | |
| | | | |
Pennsylvania: 5.17% | | | | | | | | | | | | | | | | |
| | | | |
| GO Revenue: 1.35% | | | | | | | | | | | | | | | | |
| | | | |
Butler PA Area School District (AGM Insured) | | | 5.00 | | | | 10-1-2023 | | | | 1,280,000 | | | | 1,433,229 | |
| | | | |
Butler PA Area School District (AGM Insured) | | | 5.00 | | | | 10-1-2024 | | | | 2,965,000 | | | | 3,376,275 | |
| | | | |
Butler PA Area School District (AGM Insured) | | | 5.00 | | | | 10-1-2025 | | | | 4,695,000 | | | | 5,419,157 | |
| | | | |
Coatesville PA Area School District (AGM Insured) | | | 5.00 | | | | 8-1-2023 | | | | 1,000,000 | | | | 1,098,850 | |
| | | | |
Lackawanna County PA Riverside School District Project (Build America Mutual Assurance Company Insured) | | | 4.00 | | | | 10-15-2019 | | | | 1,400,000 | | | | 1,420,090 | |
The accompanying notes are an integral part of these financial statements.
| | | | |
| 28 | | Wells Fargo Short-Term Municipal Bond Fund | | Portfolio of investments—December 31, 2018 (unaudited) |
| | | | | | | | | | | | | | | | |
| Security name | | Interest rate | | | Maturity date | | | Principal | | | Value | |
| | | | |
| GO Revenue(continued) | | | | | | | | | | | | | | | | |
| | | | |
Lackawanna County PA Riverside School District Project (Build America Mutual Assurance Company Insured) | | | 4.00 | % | | | 10-15-2020 | | | $ | 1,455,000 | | | $ | 1,497,675 | |
| | | | |
Manheim Township PA School District Series A (1 Month LIBOR +0.47%) ± | | | 2.07 | | | | 5-1-2025 | | | | 3,760,000 | | | | 3,776,657 | |
| | | | |
Penn Hills PA School District (Build America Mutual Assurance Company Insured) | | | 5.00 | | | | 11-15-2020 | | | | 825,000 | | | | 870,260 | |
| | | | |
Penn Hills PA School District (Build America Mutual Assurance Company Insured) | | | 5.00 | | | | 11-15-2021 | | | | 1,275,000 | | | | 1,374,361 | |
| | | | |
Philadelphia PA School District Series A | | | 5.00 | | | | 9-1-2022 | | | | 1,000,000 | | | | 1,092,040 | |
| | | | |
Philadelphia PA School District Series A | | | 5.00 | | | | 9-1-2024 | | | | 800,000 | | | | 898,648 | |
| | | | |
Philadelphia PA School District Series C | | | 5.00 | | | | 9-1-2020 | | | | 1,125,000 | | | | 1,176,255 | |
| | | | |
Philadelphia PA School District Series D | | | 5.00 | | | | 9-1-2020 | | | | 1,500,000 | | | | 1,568,340 | |
| | | | |
Philadelphia PA School District Series D | | | 5.00 | | | | 9-1-2021 | | | | 1,750,000 | | | | 1,875,930 | |
| | | | |
Philadelphia PA School District Series E (State Aid Withholding Insured) | | | 5.00 | | | | 9-1-2020 | | | | 2,225,000 | | | | 2,326,371 | |
| | | | |
Philadelphia PA School District Series E | | | 5.25 | | | | 9-1-2023 | | | | 7,000,000 | | | | 7,314,580 | |
| | | | |
Philadelphia PA School District Series F | | | 5.00 | | | | 9-1-2020 | | | | 2,750,000 | | | | 2,875,290 | |
| | | | |
Philadelphia PA School District Series F | | | 5.00 | | | | 9-1-2021 | | | | 3,580,000 | | | | 3,837,617 | |
| | | | |
Philadelphia PA Unrefunded Bond Series A (AGM Insured) | | | 5.00 | | | | 8-1-2019 | | | | 3,420,000 | | | | 3,428,140 | |
| | | | |
Scranton PA 144A | | | 5.00 | | | | 9-1-2020 | | | | 2,205,000 | | | | 2,282,021 | |
| | | | |
Scranton PA School District Series A | | | 5.00 | | | | 6-1-2021 | | | | 680,000 | | | | 715,278 | |
| | | | |
Scranton PA School District Series A | | | 5.00 | | | | 6-1-2022 | | | | 730,000 | | | | 779,187 | |
| | | | |
Scranton PA School District Series A | | | 5.00 | | | | 6-1-2023 | | | | 835,000 | | | | 903,136 | |
| | | | |
Scranton PA School District Series B | | | 5.00 | | | | 6-1-2021 | | | | 580,000 | | | | 610,090 | |
| | | | |
Scranton PA School District Series B (National Insured) | | | 5.00 | | | | 6-1-2022 | | | | 870,000 | | | | 930,082 | |
| | | | |
Scranton PA School District Series B (National Insured) | | | 5.00 | | | | 6-1-2023 | | | | 615,000 | | | | 666,506 | |
| | | | |
Scranton PA School District Series C | | | 5.00 | | | | 6-1-2020 | | | | 585,000 | | | | 604,896 | |
| | | | |
Scranton PA School District Series C | | | 5.00 | | | | 6-1-2021 | | | | 590,000 | | | | 620,609 | |
| | | | |
Warwick PA School District | | | 4.00 | | | | 2-15-2020 | | | | 1,000,000 | | | | 1,023,970 | |
| | | | |
West Mifflin PA School District (AGM Insured) | | | 5.00 | | | | 10-1-2019 | | | | 750,000 | | | | 767,535 | |
| | | | |
| | | | | | | | | | | | | | | 56,563,075 | |
| | | | | | | | | | | | | | | | |
| | | | |
| Health Revenue: 0.97% | | | | | | | | | | | | | | | | |
| | | | |
Allegheny County PA Hospital Development Authority University of Pittsburgh Medical Center Series A-1 (3 Month LIBOR +0.72%) ± | | | 2.42 | | | | 2-1-2021 | | | | 1,985,000 | | | | 1,991,908 | |
| | | | |
Berks County PA IDA Health System Tower Health Project | | | 5.00 | | | | 11-1-2023 | | | | 1,000,000 | | | | 1,118,310 | |
| | | | |
Berks County PA IDA Health System Tower Health Project | | | 5.00 | | | | 11-1-2024 | | | | 1,000,000 | | | | 1,134,180 | |
| | | | |
Franklin County PA IDA Menno-Haven Incorporated Project | | | 4.00 | | | | 12-1-2019 | | | | 500,000 | | | | 504,000 | |
| | | | |
Franklin County PA IDA Menno-Haven Incorporated Project | | | 5.00 | | | | 12-1-2021 | | | | 230,000 | | | | 239,462 | |
| | | | |
Montgomery County PA Higher Education & Health Authority Series 2018D ø | | | 2.01 | | | | 9-1-2050 | | | | 12,000,000 | | | | 12,000,000 | |
| | | | |
Montgomery County PA Higher Education & Health Authority Thomas Jefferson University Series C (SIFMA Municipal Swap +0.72%) ± | | | 2.43 | | | | 9-1-2051 | | | | 10,000,000 | | | | 9,996,400 | |
| | | | |
Montgomery County PA Higher Education & Health Authority Thomas Jefferson University Series A | | | 5.00 | | | | 9-1-2023 | | | | 1,050,000 | | | | 1,176,074 | |
| | | | |
Montgomery County PA IDA Albert Einstein Healthcare Network Issue Series A | | | 5.00 | | | | 1-15-2020 | | | | 1,315,000 | | | | 1,346,692 | |
| | | | |
Pennsylvania Tender Option Bond Trust Receipts/Floater Certificates Berks County IDA Health Series 2018-XM0594 (Barclays Bank plc LIQ) 144Aø | | | 1.83 | | | | 11-1-2050 | | | | 4,625,000 | | | | 4,625,000 | |
| | | | |
Philadelphia PA Hospitals & HEFAR Temple University Health System | | | 5.00 | | | | 7-1-2021 | | | | 1,250,000 | | | | 1,316,125 | |
| | | | |
Philadelphia PA Hospitals & HEFAR Temple University Health System | | | 5.00 | | | | 7-1-2022 | | | | 2,000,000 | | | | 2,140,000 | |
| | | | |
Quakertown PA Health Facilities Authority Series A | | | 3.13 | | | | 7-1-2021 | | | | 3,250,000 | | | | 3,190,688 | |
| | | | |
| | | | | | | | | | | | | | | 40,778,839 | |
| | | | | | | | | | | | | | | | |
The accompanying notes are an integral part of these financial statements.
| | | | | | |
| Portfolio of investments—December 31, 2018 (unaudited) | | Wells Fargo Short-Term Municipal Bond Fund | | | 29 | |
| | | | | | | | | | | | | | | | |
| Security name | | Interest rate | | | Maturity date | | | Principal | | | Value | |
| | | | |
| Housing Revenue: 0.58% | | | | | | | | | | | | | | | | |
| | | | |
Pennsylvania HFA Single Family Series 125A | | | 2.38 | % | | | 10-1-2025 | | | $ | 21,250,000 | | | $ | 20,994,575 | |
| | | | |
Pittsburgh PA Urban RDA Crawford Square Apartments Project | | | 2.25 | | | | 12-1-2020 | | | | 3,300,000 | | | | 3,302,046 | |
| | | | |
| | | | | | | | | | | | | | | 24,296,621 | |
| | | | | | | | | | | | | | | | |
| | | | |
| Industrial Development Revenue: 0.50% | | | | | | | | | | | | | | | | |
| | | | |
Montgomery County PA IDA Exelon Generation Company LLC | | | 2.50 | | | | 10-1-2030 | | | | 15,795,000 | | | | 15,748,563 | |
| | | | |
Montgomery County PA IDA Peco Energy Company Project Series A | | | 2.60 | | | | 3-1-2034 | | | | 2,125,000 | | | | 2,116,734 | |
| | | | |
Pennsylvania EDFA Bridges Finco LP | | | 5.00 | | | | 12-31-2020 | | | | 1,850,000 | | | | 1,932,806 | |
| | | | |
Pennsylvania EDFA Bridges Finco LP | | | 5.00 | | | | 12-31-2021 | | | | 1,095,000 | | | | 1,163,405 | |
| | | | |
| | | | | | | | | | | | | | | 20,961,508 | |
| | | | | | | | | | | | | | | | |
| | | | |
| Miscellaneous Revenue: 0.40% | | | | | | | | | | | | | | | | |
| | | | |
Bethlehem PA Area School District Authority Bethlehem Area School District Refunding Bond Project (1 Month LIBOR +0.49%) ± | | | 2.24 | | | | 1-1-2030 | | | | 4,980,000 | | | | 4,967,899 | |
| | | | |
Delaware County PA Authority Neumann University | | | 4.00 | | | | 10-1-2021 | | | | 2,005,000 | | | | 2,064,869 | |
| | | | |
Pennsylvania Certificate of Participation (AGM Insured) | | | 2.00 | | | | 11-1-2019 | | | | 1,100,000 | | | | 1,094,423 | |
| | | | |
Pennsylvania Certificate of Participation (AGM Insured) | | | 4.00 | | | | 11-1-2019 | | | | 1,005,000 | | | | 1,017,492 | |
| | | | |
Pennsylvania Public School Building Authority | | | 5.00 | | | | 4-1-2019 | | | | 1,220,000 | | | | 1,228,528 | |
| | | | |
Philadelphia PA RDA Transformation Initiative Series B | | | 5.00 | | | | 4-15-2019 | | | | 2,000,000 | | | | 2,015,980 | |
| | | | |
Philadelphia PA RDA Transformation Initiative Series B | | | 5.00 | | | | 4-15-2020 | | | | 1,870,000 | | | | 1,935,600 | |
| | | | |
Scranton PA RDA Series A (Municipal Government Guaranty Insured) | | | 5.00 | | | | 11-15-2021 | | | | 2,580,000 | | | | 2,637,173 | |
| | | | |
| | | | | | | | | | | | | | | 16,961,964 | |
| | | | | | | | | | | | | | | | |
| | | | |
| Resource Recovery Revenue: 0.22% | | | | | | | | | | | | | | | | |
| | | | |
Delaware County PA IDA Resource Recovery Facility Series A | | | 6.20 | | | | 7-1-2019 | | | | 145,000 | | | | 145,348 | |
| | | | |
Pennsylvania EDFA Solid Waste Disposal Series A | | | 1.70 | | | | 8-1-2037 | | | | 9,420,000 | | | | 9,284,917 | |
| | | | |
| | | | | | | | | | | | | | | 9,430,265 | |
| | | | | | | | | | | | | | | | |
| | | | |
| Transportation Revenue: 0.73% | | | | | | | | | | | | | | | | |
| | | | |
Pennsylvania Turnpike Commission Series B (SIFMA Municipal Swap +1.15%) ± | | | 2.86 | | | | 12-1-2019 | | | | 18,150,000 | | | | 18,203,724 | |
| | | | |
Pennsylvania Turnpike Commission Series B (SIFMA Municipal Swap +1.27%) ± | | | 2.98 | | | | 12-1-2020 | | | | 11,300,000 | | | | 11,425,430 | |
| | | | |
Reading PA Parking Authority CAB (National Insured) (z) | | | 3.61 | | | | 11-15-2019 | | | | 1,000,000 | | | | 976,440 | |
| | | | |
| | | | | | | | | | | | | | | 30,605,594 | |
| | | | | | | | | | | | | | | | |
| | | | |
| Utilities Revenue: 0.06% | | | | | | | | | | | | | | | | |
| | | | |
Philadelphia PA Gas Works Series 1998 General Ordinance (AGM Insured) | | | 5.00 | | | | 7-1-2019 | | | | 2,500,000 | | | | 2,536,950 | |
| | | | | | | | | | | | | | | | |
| | | | |
| Water & Sewer Revenue: 0.36% | | | | | | | | | | | | | | | | |
| | | | |
Pittsburgh PA Water & Sewer Authority Series C (1 Month LIBOR +0.64%) (AGM Insured) ± | | | 2.33 | | | | 9-1-2040 | | | | 15,000,000 | | | | 15,003,900 | |
| | | | | | | | | | | | | | | | |
| | | | |
| | | | | | | | | | | | | | | 217,138,716 | |
| | | | | | | | | | | | | | | | |
| | | | |
Rhode Island: 0.33% | | | | | | | | | | | | | | | | |
| | | | |
| Education Revenue: 0.01% | | | | | | | | | | | | | | | | |
| | | | |
Rhode Island Student Loan Authority AMT Series A | | | 5.00 | | | | 12-1-2019 | | | | 450,000 | | | | 460,391 | |
| | | | | | | | | | | | | | | | |
The accompanying notes are an integral part of these financial statements.
| | | | |
| 30 | | Wells Fargo Short-Term Municipal Bond Fund | | Portfolio of investments—December 31, 2018 (unaudited) |
| | | | | | | | | | | | | | | | |
| Security name | | Interest rate | | | Maturity date | | | Principal | | | Value | |
| | | | |
| Health Revenue: 0.08% | | | | | | | | | | | | | | | | |
| | | | |
Rhode Island Health & Educational Building Corporation Tockwotton Home Series 2011 | | | 8.38 | % | | | 1-1-2046 | | | $ | 3,000,000 | | | $ | 3,375,240 | |
| | | | | | | | | | | | | | | | |
| | | | |
| Miscellaneous Revenue: 0.24% | | | | | | | | | | | | | | | | |
| | | | |
Rhode Island & Providence Plantations Consol Capital Series A | | | 5.00 | | | | 8-1-2023 | | | | 8,045,000 | | | | 8,868,325 | |
| | | | |
Rhode Island Health & Educational Building Corporation Providence Public Schools Program Series A | | | 5.00 | | | | 5-15-2019 | | | | 1,100,000 | | | | 1,112,859 | |
| | | | |
| | | | | | | | | | | | | | | 9,981,184 | |
| | | | | | | | | | | | | | | | |
| | | | |
| | | | | | | | | | | | | | | 13,816,815 | |
| | | | | | | | | | | | | | | | |
| | | | |
South Carolina: 0.40% | | | | | | | | | | | | | | | | |
| | | | |
| Education Revenue: 0.08% | | | | | | | | | | | | | | | | |
| | | | |
South Carolina Jobs EDA East Point Academy Project Series A 144A | | | 2.25 | | | | 5-1-2019 | | | | 3,500,000 | | | | 3,490,795 | |
| | | | | | | | | | | | | | | | |
| | | | |
| Health Revenue: 0.19% | | | | | | | | | | | | | | | | |
| | | | |
South Carolina Jobs EDA Prisma Health Obligated Group Series C ø | | | 2.03 | | | | 5-1-2048 | | | | 8,000,000 | | | | 8,000,000 | |
| | | | | | | | | | | | | | | | |
| | | | |
| Utilities Revenue: 0.13% | | | | | | | | | | | | | | | | |
| | | | |
Piedmont SC Municipal Power Agency (National Insured) | | | 5.38 | | | | 1-1-2025 | | | | 4,760,000 | | | | 5,486,090 | |
| | | | | | | | | | | | | | | | |
| | | | |
| | | | | | | | | | | | | | | 16,976,885 | |
| | | | | | | | | | | | | | | | |
| | | | |
Tennessee: 1.60% | | | | | | | | | | | | | | | | |
| | | | |
| Airport Revenue: 0.07% | | | | | | | | | | | | | | | | |
| | | | |
Memphis-Shelby County TN Airport Authority Series A1 | | | 5.75 | | | | 7-1-2019 | | | | 1,500,000 | | | | 1,527,315 | |
| | | | |
Memphis-Shelby County TN Airport Authority Series B | | | 5.50 | | | | 7-1-2019 | | | | 1,505,000 | | | | 1,530,555 | |
| | | | |
| | | | | | | | | | | | | | | 3,057,870 | |
| | | | | | | | | | | | | | | | |
| | | | |
| Health Revenue: 0.04% | | | | | | | | | | | | | | | | |
| | | | |
Greeneville TN Health and Educational Ballad Health Series A | | | 5.00 | | | | 7-1-2023 | | | | 1,600,000 | | | | 1,774,800 | |
| | | | | | | | | | | | | | | | |
| | | | |
| Housing Revenue: 0.16% | | | | | | | | | | | | | | | | |
| | | | |
Kingsport TN Housing & RDA Collateralized Multifamily Housing Series B | | | 2.22 | | | | 1-1-2022 | | | | 6,700,000 | | | | 6,696,784 | |
| | | | | | | | | | | | | | | | |
| | | | |
| Utilities Revenue: 1.33% | | | | | | | | | | | | | | | | |
| | | | |
Tennessee Energy Acquisition Corporation Gas Project | | | 4.00 | | | | 11-1-2049 | | | | 7,500,000 | | | | 7,865,100 | |
| | | | |
Tennessee Energy Acquisition Corporation Series A | | | 4.00 | | | | 5-1-2048 | | | | 39,840,000 | | | | 41,394,955 | |
| | | | |
Tennessee Energy Acquisition Corporation Series A | | | 5.25 | | | | 9-1-2019 | | | | 6,225,000 | | | | 6,336,303 | |
| | | | |
| | | | | | | | | | | | | | | 55,596,358 | |
| | | | | | | | | | | | | | | | |
| | | | |
| | | | | | | | | | | | | | | 67,125,812 | |
| | | | | | | | | | | | | | | | |
| | | | |
Texas: 15.02% | | | | | | | | | | | | | | | | |
| | | | |
| Airport Revenue: 0.10% | | | | | | | | | | | | | | | | |
| | | | |
Dallas-Fort Worth TX International Airport Series B | | | 5.00 | | | | 11-1-2023 | | | | 500,000 | | | | 547,835 | |
| | | | |
Houston TX Airport System Refunding Bond Subordinate Lien Series A | | | 5.00 | | | | 7-1-2024 | | | | 3,620,000 | | | | 3,917,238 | |
| | | | |
| | | | | | | | | | | | | | | 4,465,073 | |
| | | | | | | | | | | | | | | | |
The accompanying notes are an integral part of these financial statements.
| | | | | | |
| Portfolio of investments—December 31, 2018 (unaudited) | | Wells Fargo Short-Term Municipal Bond Fund | | | 31 | |
| | | | | | | | | | | | | | | | |
| Security name | | Interest rate | | | Maturity date | | | Principal | | | Value | |
| | | | |
| Education Revenue: 0.54% | | | | | | | | | | | | | | | | |
| | | | |
Clifton TX Higher Education Finance Corporation Education International Leadership Series D | | | 5.00 | % | | | 8-15-2021 | | | $ | 665,000 | | | $ | 686,513 | |
| | | | |
Clifton TX Higher Education Finance Corporation Education International Leadership Series D | | | 5.00 | | | | 8-15-2022 | | | | 1,000,000 | | | | 1,038,100 | |
| | | | |
Clifton TX Higher Education Finance Corporation Education International Leadership Series D | | | 5.00 | | | | 8-15-2023 | | | | 1,510,000 | | | | 1,571,080 | |
| | | | |
Clifton TX Higher Education Finance Corporation Education International Leadership Series D | | | 5.00 | | | | 8-15-2024 | | | | 3,125,000 | | | | 3,248,781 | |
| | | | |
North Texas Higher Education Authority Incorporated Student Loan Series 2 Class A (3 Month LIBOR +1.00%) ± | | | 3.40 | | | | 4-1-2037 | | | | 4,995,000 | | | | 5,039,306 | |
| | | | |
Texas A&M University System Permanent University Series A | | | 5.00 | | | | 7-1-2021 | | | | 4,870,000 | | | | 5,239,828 | |
| | | | |
Texas PFA Southern University Financing System (Build America Mutual Assurance Company Insured) | | | 5.00 | | | | 11-1-2019 | | | | 2,375,000 | | | | 2,427,606 | |
| | | | |
University of Texas Financing System Refunding Bonds Series C | | | 5.00 | | | | 8-15-2022 | | | | 3,000,000 | | | | 3,321,300 | |
| | | | |
| | | | | | | | | | | | | | | 22,572,514 | |
| | | | | | | | | | | | | | | | |
| | | | |
| GO Revenue: 9.24% | | | | | | | | | | | | | | | | |
| | | | |
Brownsville TX Independent School District Maintenance Tax Notes | | | 4.00 | | | | 8-15-2019 | | | | 7,905,000 | | | | 8,014,484 | |
| | | | |
Clear Creek TX Independent School District Series B | | | 3.00 | | | | 2-15-2032 | | | | 4,945,000 | | | | 4,974,967 | |
| | | | |
Cypress-Fairbanks TX Independent School District Series B-1 | | | 3.00 | | | | 2-15-2036 | | | | 11,625,000 | | | | 11,695,796 | |
| | | | |
Cypress-Fairbanks TX Independent School District Series B-2 | | | 2.13 | | | | 2-15-2040 | | | | 17,000,000 | | | | 16,980,450 | |
| | | | |
Dallas TX Series A | | | 5.00 | | | | 2-15-2019 | | | | 5,000,000 | | | | 5,018,650 | |
| | | | |
Dallas TX Unrefunded Balance Refunding Bond | | | 5.00 | | | | 2-15-2021 | | | | 3,580,000 | | | | 3,804,502 | |
| | | | |
Denton TX Independent School District Unlimited Tax School Building Bond Series 2013 | | | 2.00 | | | | 8-1-2043 | | | | 7,000,000 | | | | 6,992,370 | |
| | | | |
Eagle Mountain & Saginaw TX Independent School District | | | 2.00 | | | | 8-1-2050 | | | | 12,150,000 | | | | 12,149,879 | |
| | | | |
El Paso County TX Hospital District Refunding Bonds | | | 5.00 | | | | 8-15-2019 | | | | 4,035,000 | | | | 4,102,990 | |
| | | | |
Fort Bend TX Independent School District Series C | | | 1.35 | | | | 8-1-2042 | | | | 5,630,000 | | | | 5,567,394 | |
| | | | |
Fort Bend TX independent School District Series D | | | 1.50 | | | | 8-1-2042 | | | | 10,770,000 | | | | 10,576,679 | |
| | | | |
Harris County TX Houston Independent School District Series B | | | 1.45 | | | | 6-1-2035 | | | | 11,580,000 | | | | 11,475,780 | |
| | | | |
Harris County TX Refunding Bonds Series A | | | 5.00 | | | | 10-1-2021 | | | | 10,000,000 | | | | 10,232,300 | |
| | | | |
Hays TX Consolidated Independent School District Building Bonds Series B | | | 2.70 | | | | 8-15-2042 | | | | 7,370,000 | | | | 7,471,632 | |
| | | | |
Houston TX Independent School District Limited Tax Schoolhouse Series B | | | 2.40 | | | | 6-1-2036 | | | | 5,000,000 | | | | 5,029,150 | |
| | | | |
Houston TX Independent School District Series A2 | | | 3.00 | | | | 6-1-2039 | | | | 1,700,000 | | | | 1,706,477 | |
| | | | |
Houston TX Public Improvement Series A | | | 5.00 | | | | 3-1-2019 | | | | 7,000,000 | | | | 7,036,540 | |
| | | | |
Houston TX Public Improvement Series A | | | 5.00 | | | | 3-1-2020 | | | | 4,000,000 | | | | 4,146,320 | |
| | | | |
Houston TX Public Improvement Series A | | | 5.00 | | | | 3-1-2021 | | | | 4,000,000 | | | | 4,263,000 | |
| | | | |
Houston TX Public Improvement Series A | | | 5.00 | | | | 3-1-2022 | | | | 5,000,000 | | | | 5,465,200 | |
| | | | |
Houston TX Public Improvement Series A | | | 5.00 | | | | 3-1-2023 | | | | 3,500,000 | | | | 3,912,685 | |
| | | | |
Hurst Euless Bedford TX Independent School District Prerefunded Bond | | | 5.00 | | | | 8-15-2022 | | | | 2,140,000 | | | | 2,245,074 | |
| | | | |
Hutto TX Independent School District Series 2015 | | | 3.00 | | | | 2-1-2055 | | | | 23,425,000 | | | | 23,761,149 | |
| | | | |
Lake Travis TX Independent School District Series B | | | 2.63 | | | | 2-15-2048 | | | | 10,000,000 | | | | 10,127,200 | |
| | | | |
Leander TX Independent School District Refunding CAB (z) | | | 2.46 | | | | 8-15-2023 | | | | 1,065,000 | | | | 961,354 | |
| | | | |
Mansfield TX Independent School District | | | 2.50 | | | | 8-1-2042 | | | | 8,250,000 | | | | 8,307,503 | |
| | | | |
McAllen TX Independent School District Series A | | | 5.00 | | | | 2-15-2024 | | | | 2,620,000 | | | | 2,945,640 | |
| | | | |
New Caney TX Independent School District Building Bonds | | | 3.00 | | | | 2-15-2050 | | | | 1,100,000 | | | | 1,122,803 | |
| | | | |
North East TX Independent School District | | | 2.00 | | | | 8-1-2044 | | | | 9,320,000 | | | | 9,319,907 | |
| | | | |
North East TX Independent School District | | | 2.38 | | | | 8-1-2047 | | | | 7,135,000 | | | | 7,158,117 | |
| | | | |
Northside TX Independent School Building Project District Series A | | | 2.00 | | | | 6-1-2039 | | | | 4,010,000 | | | | 4,011,083 | |
| | | | |
Northside TX Independent School District Building Bonds Series 2018 | | | 2.75 | | | | 8-1-2048 | | | | 16,225,000 | | | | 16,561,669 | |
The accompanying notes are an integral part of these financial statements.
| | | | |
| 32 | | Wells Fargo Short-Term Municipal Bond Fund | | Portfolio of investments—December 31, 2018 (unaudited) |
| | | | | | | | | | | | | | | | |
| Security name | | Interest rate | | | Maturity date | | | Principal | | | Value | |
| | | | |
| GO Revenue(continued) | | | | | | | | | | | | | | | | |
| | | | |
Northside TX Independent School District Building Project | | | 1.75 | % | | | 6-1-2032 | | | $ | 6,395,000 | | | $ | 6,290,506 | |
| | | | |
Northside TX Independent School District Building Project | | | 2.00 | | | | 8-1-2044 | | | | 21,330,000 | | | | 21,329,787 | |
| | | | |
Northside TX Independent School District Building Project | | | 2.00 | | | | 6-1-2046 | | | | 8,600,000 | | | | 8,553,732 | |
| | | | |
Pflugerville TX Independent School District Prerefunded Bond School Building Series 2017 | | | 2.00 | | | | 8-15-2039 | | | | 7,665,000 | | | | 7,675,731 | |
| | | | |
Pflugerville TX Independent School District Prerefunded Bond School Building Series A | | | 2.00 | | | | 8-15-2039 | | | | 4,830,000 | | | | 4,836,762 | |
| | | | |
Pflugerville TX Independent School District Unrefunded Bond | | | 2.00 | | | | 8-15-2039 | | | | 15,750,000 | | | | 15,749,843 | |
| | | | |
Spring Branch TX Independent School District | | | 3.00 | | | | 6-15-2041 | | | | 650,000 | | | | 653,153 | |
| | | | |
Texas Anticipation Notes Series 2018 | | | 4.00 | | | | 8-29-2019 | | | | 50,000,000 | | | | 50,715,500 | |
| | | | |
Texas Northside Independent School District | | | 1.45 | | | | 6-1-2047 | | | | 4,000,000 | | | | 3,966,760 | |
| | | | |
Texas Transportation Commission Mobility Fund Bonds Series B (SIFMA Municipal Swap +0.30%) ± | | | 2.01 | | | | 10-1-2041 | | | | 24,500,000 | | | | 24,434,585 | |
| | | | |
Tomball TX Independent School District Series B2 | | | 2.13 | | | | 2-15-2039 | | | | 6,500,000 | | | | 6,494,150 | |
| | | | |
| | | | | | | | | | | | | | | 387,839,253 | |
| | | | | | | | | | | | | | | | |
| | | | |
| Health Revenue: 0.09% | | | | | | | | | | | | | | | | |
| | | | |
Tarrant County TX ECFA Hendrick Medical Center Group | | | 5.00 | | | | 9-1-2019 | | | | 655,000 | | | | 668,303 | |
| | | | |
Tarrant County TX ECFA Hendrick Medical Center Group | | | 5.00 | | | | 9-1-2020 | | | | 920,000 | | | | 965,154 | |
| | | | |
Tarrant County TX ECFA Hendrick Medical Center Group | | | 5.00 | | | | 11-15-2020 | | | | 1,045,000 | | | | 1,075,524 | |
| | | | |
Travis County TX Health Facilities Development Corporation Longhorn Village Project Series A | | | 7.13 | | | | 1-1-2046 | | | | 845,000 | | | | 929,255 | |
| | | | |
| | | | | | | | | | | | | | | 3,638,236 | |
| | | | | | | | | | | | | | | | |
| | | | |
| Housing Revenue: 2.01% | | | | | | | | | | | | | | | | |
| | | | |
Alamito TX Public Facility Corporation Three Apartments Project | | | 2.50 | | | | 11-1-2021 | | | | 20,000,000 | | | | 20,144,200 | |
| | | | |
Austin TX Affordable PFC Incorporated Multifamily Housing Bridge Cameron Apartments | | | 1.86 | | | | 12-1-2021 | | | | 25,000,000 | | | | 24,946,000 | |
| | | | |
Bexar County TX Housing Finance Corporation Medio Springs Apartments Project | | | 2.00 | | | | 11-1-2020 | | | | 26,500,000 | | | | 26,440,905 | |
| | | | |
New Hope TX Cultural Education Facilities Finance Corporation Student Housing Project Series A | | | 3.25 | | | | 8-1-2019 | | | | 13,000,000 | | | | 12,976,340 | |
| | | | |
| | | | | | | | | | | | | | | 84,507,445 | |
| | | | | | | | | | | | | | | | |
| | | | |
| Resource Recovery Revenue: 0.38% | | | | | | | | | | | | | | | | |
| | | | |
Mission TX Economic Development Corporation Waste Management Project | | | 2.50 | | | | 8-1-2020 | | | | 11,000,000 | | | | 10,986,360 | |
| | | | |
Port Arthur TX Navigation District Jefferson County Environmental Facilities Motiva Enterprises LLC Project Series A ø | | | 2.05 | | | | 4-1-2040 | | | | 1,550,000 | | | | 1,550,000 | |
| | | | |
Port Arthur TX Navigation District Jefferson County Environmental Facilities Motiva Enterprises LLC Project Series B ø | | | 2.05 | | | | 4-1-2040 | | | | 3,280,000 | | | | 3,280,000 | |
| | | | |
| | | | | | | | | | | | | | | 15,816,360 | |
| | | | | | | | | | | | | | | | |
| | | | |
| Transportation Revenue: 0.70% | | | | | | | | | | | | | | | | |
| | | | |
Central Texas Regional Mobility Authority Series B | | | 5.00 | | | | 1-1-2045 | | | | 310,000 | | | | 321,761 | |
| | | | |
Central Texas Regional Mobility Authority Subordinate Lien Bond | | | 4.00 | | | | 1-1-2022 | | | | 6,000,000 | | | | 6,217,800 | |
| | | | |
Central Texas Regional Mobility Authority Subordinate Lien Bond | | | 5.00 | | | | 1-1-2019 | | | | 750,000 | | | | 750,000 | |
| | | | |
North Texas Tollway Authority Series A | | | 5.00 | | | | 1-1-2020 | | | | 1,050,000 | | | | 1,082,235 | |
| | | | |
North Texas Tollway Authority Series A | | | 5.00 | | | | 1-1-2021 | | | | 1,860,000 | | | | 1,965,202 | |
| | | | |
North Texas Tollway Authority Special Projects System Series A | | | 6.00 | | | | 9-1-2041 | | | | 3,500,000 | | | | 3,866,695 | |
| | | | |
North Texas Tollway Authority Special Projects System Series D | | | 5.00 | | | | 9-1-2024 | | | | 1,790,000 | | | | 1,931,338 | |
The accompanying notes are an integral part of these financial statements.
| | | | | | |
| Portfolio of investments—December 31, 2018 (unaudited) | | Wells Fargo Short-Term Municipal Bond Fund | | | 33 | |
| | | | | | | | | | | | | | | | |
| Security name | | Interest rate | | | Maturity date | | | Principal | | | Value | |
| | | | |
| Transportation Revenue(continued) | | | | | | | | | | | | | | | | |
| | | | |
North Texas Tollway Authority Special Projects System Series D | | | 5.00 | % | | | 9-1-2028 | | | $ | 4,335,000 | | | $ | 4,677,292 | |
| | | | |
North Texas Tollway Authority Special Projects System Series D | | | 5.25 | | | | 9-1-2025 | | | | 3,840,000 | | | | 4,168,013 | |
| | | | |
North Texas Tollway Authority Special Projects System Series D | | | 5.25 | | | | 9-1-2026 | | | | 3,980,000 | | | | 4,319,972 | |
| | | | |
| | | | | | | | | | | | | | | 29,300,308 | |
| | | | | | | | | | | | | | | | |
| | | | |
| Utilities Revenue: 1.79% | | | | | | | | | | | | | | | | |
| | | | |
San Antonio TX Electric & Gas Systems Junior Lien Refunding Bond | | | 2.75 | | | | 2-1-2048 | | | | 6,000,000 | | | | 6,084,600 | |
| | | | |
San Antonio TX Junior Lien Series C | | | 3.00 | | | | 12-1-2045 | | | | 13,840,000 | | | | 13,964,145 | |
| | | | |
San Antonio TX Junior Lien Series D | | | 3.00 | | | | 12-1-2045 | | | | 12,325,000 | | | | 12,527,007 | |
| | | | |
San Antonio TX Series A | | | 2.25 | | | | 2-1-2033 | | | | 24,550,000 | | | | 24,604,992 | |
| | | | |
Texas Municipal Gas Acquisition & Supply Corporation III | | | 5.00 | | | | 12-15-2019 | | | | 7,000,000 | | | | 7,186,550 | |
| | | | |
Texas Municipal Gas Acquisition & Supply Corporation Series A
(SIFMA Municipal Swap +0.55%) ± | | | 2.26 | | | | 9-15-2027 | | | | 11,135,000 | | | | 10,939,469 | |
| | | | |
| | | | | | | | | | | | | | | 75,306,763 | |
| | | | | | | | | | | | | | | | |
| | | | |
| Water & Sewer Revenue: 0.17% | | | | | | | | | | | | | | | | |
| | | | |
San Antonio TX Water System Junior Lien Series B | | | 2.00 | | | | 5-1-2044 | | | | 5,605,000 | | | | 5,547,717 | |
| | | | |
Walnut Creek TX Special Utility District (Build America Mutual Assurance Company Insured) | | | 4.00 | | | | 1-10-2019 | | | | 1,010,000 | | | | 1,010,434 | |
| | | | |
Walnut Creek TX Special Utility District (Build America Mutual Assurance Company Insured) | | | 4.00 | | | | 1-10-2020 | | | | 500,000 | | | | 510,805 | |
| | | | |
| | | | | | | | | | | | | | | 7,068,956 | |
| | | | | | | | | | | | | | | | |
| | | | |
| | | | | | | | | | | | | | | 630,514,908 | |
| | | | | | | | | | | | | | | | |
| | | | |
Utah: 0.18% | | | | | | | | | | | | | | | | |
| | | | |
| Airport Revenue: 0.18% | | | | | | | | | | | | | | | | |
| | | | |
Salt Lake City UT International Airport Series A | | | 5.00 | | | | 7-1-2023 | | | | 2,500,000 | | | | 2,779,875 | |
| | | | |
Salt Lake City UT International Airport Series A | | | 5.00 | | | | 7-1-2024 | | | | 2,000,000 | | | | 2,259,580 | |
| | | | |
Salt Lake City UT International Airport Series A | | | 5.00 | | | | 7-1-2025 | | | | 2,300,000 | | | | 2,632,327 | |
| | | | |
| | | | | | | | | | | | | | | 7,671,782 | |
| | | | | | | | | | | | | | | | |
| | | | |
Virginia: 1.92% | | | | | | | | | | | | | | | | |
| | | | |
| Health Revenue: 0.06% | | | | | | | | | | | | | | | | |
| | | | |
Lexington VA IDA Residential Care Facility Kendal at Lexington Refunding Bond | | | 3.00 | | | | 1-1-2019 | | | | 320,000 | | | | 320,000 | |
| | | | |
Lexington VA IDA Residential Care Facility Kendal at Lexington Refunding Bond | | | 3.00 | | | | 1-1-2020 | | | | 450,000 | | | | 451,625 | |
| | | | |
Lexington VA IDA Residential Care Facility Kendal at Lexington Refunding Bond | | | 4.00 | | | | 1-1-2021 | | | | 440,000 | | | | 450,344 | |
| | | | |
Lexington VA IDA Residential Care Facility Kendal at Lexington Refunding Bond | | | 4.00 | | | | 1-1-2022 | | | | 525,000 | | | | 540,839 | |
| | | | |
Washington County VA County IDA Mountain States Health Alliance Series C | | | 7.25 | | | | 7-1-2019 | | | | 690,000 | | | | 708,326 | |
| | | | |
| | | | | | | | | | | | | | | 2,471,134 | |
| | | | | | | | | | | | | | | | |
| | | | |
| Housing Revenue: 0.58% | | | | | | | | | | | | | | | | |
| | | | |
Fairfax County VA Redevelopment & Housing Authority Parkwood Project | | | 2.21 | | | | 2-1-2021 | | | | 15,000,000 | | | | 15,009,150 | |
| | | | |
Newport News VA Redevelopment & Housing Authority Multifamily Housing Series A | | | 1.82 | | | | 11-1-2020 | | | | 9,500,000 | | | | 9,482,045 | |
| | | | |
| | | | | | | | | | | | | | | 24,491,195 | |
| | | | | | | | | | | | | | | | |
The accompanying notes are an integral part of these financial statements.
| | | | |
| 34 | | Wells Fargo Short-Term Municipal Bond Fund | | Portfolio of investments—December 31, 2018 (unaudited) |
| | | | | | | | | | | | | | | | |
| Security name | | Interest rate | | | Maturity date | | | Principal | | | Value | |
| | | | |
| Miscellaneous Revenue: 0.07% | | | | | | | | | | | | | | | | |
| | | | |
Franklin County VA IDA BAN | | | 3.00 | % | | | 10-15-2023 | | | $ | 3,000,000 | | | $ | 3,039,060 | |
| | | | | | | | | | | | | | | | |
| | | | |
| Tax Revenue: 0.11% | | | | | | | | | | | | | | | | |
| | | | |
Greater Richmond VA Convention Center Authority | | | 5.00 | | | | 6-15-2019 | | | | 1,250,000 | | | | 1,267,600 | |
| | | | |
Greater Richmond VA Convention Center Authority | | | 5.00 | | | | 6-15-2020 | | | | 1,000,000 | | | | 1,044,120 | |
| | | | |
Marquis VA CDA CAB Series 2015 144A(z) | | | 2.81 | | | | 9-1-2045 | | | | 680,000 | | | | 477,020 | |
| | | | |
Marquis VA CDA CAB Series A | | | 5.10 | | | | 9-1-2036 | | | | 2,169,000 | | | | 1,461,017 | |
| | | | |
Marquis VA CDA CAB Series C (z) | | | 6.21 | | | | 9-1-2041 | | | | 3,493,000 | | | | 175,209 | |
| | | | |
| | | | | | | | | | | | | | | 4,424,966 | |
| | | | | | | | | | | | | | | | |
| | | | |
| Transportation Revenue: 0.04% | | | | | | | | | | | | | | | | |
| | | | |
Virginia Commonwealth Transportation Board Refunding Bonds Series A | | | 5.00 | | | | 5-15-2023 | | | | 1,500,000 | | | | 1,690,575 | |
| | | | | | | | | | | | | | | | |
| | | | |
| Utilities Revenue: 1.06% | | | | | | | | | | | | | | | | |
| | | | |
Halifax County VA IDA | | | 2.15 | | | | 12-1-2041 | | | | 44,450,000 | | | | 44,333,986 | |
| | | | | | | | | | | | | | | | |
| | | | |
| | | | | | | | | | | | | | | 80,450,916 | |
| | | | | | | | | | | | | | | | |
| | | | |
Washington: 3.24% | | | | | | | | | | | | | | | | |
| | | | |
| Airport Revenue: 0.27% | | | | | | | | | | | | | | | | |
| | | | |
Metropolitan Washington Airports Authority Refunding Bond Series 2014A | | | 3.00 | | | | 10-1-2022 | | | | 6,500,000 | | | | 6,624,670 | |
| | | | |
Port of Seattle WA Refunding Bond Series B | | | 5.00 | | | | 8-1-2023 | | | | 4,155,000 | | | | 4,527,662 | |
| | | | |
| | | | | | | | | | | | | | | 11,152,332 | |
| | | | | | | | | | | | | | | | |
| | | | |
| GO Revenue: 0.13% | | | | | | | | | | | | | | | | |
| | | | |
Washington Series A | | | 5.00 | | | | 8-1-2022 | | | | 4,800,000 | | | | 5,310,528 | |
| | | | | | | | | | | | | | | | |
| | | | |
| Health Revenue: 0.48% | | | | | | | | | | | | | | | | |
| | | | |
Washington HCFR Catholic Health Initiatives Series B
(SIFMA Municipal Swap +1.00%) ± | | | 2.71 | | | | 1-1-2035 | | | | 8,650,000 | | | | 8,675,345 | |
| | | | |
Washington Health Care Facilities Authority Catholic Health Initiatives Series A | | | 5.00 | | | | 2-1-2023 | | | | 1,025,000 | | | | 1,080,391 | |
| | | | |
Washington Health Care Facilities Authority Fred Hutchinson Cancer Research (1 Month LIBOR +1.10%) ± | | | 2.78 | | | | 1-1-2042 | | | | 9,500,000 | | | | 9,584,740 | |
| | | | |
Washington Health Care Facilities Authority Series 2015 | | | 5.00 | | | | 7-1-2020 | | | | 850,000 | | | | 881,365 | |
| | | | |
| | | | | | | | | | | | | | | 20,221,841 | |
| | | | | | | | | | | | | | | | |
| | | | |
| Housing Revenue: 0.58% | | | | | | | | | | | | | | | | |
| | | | |
Washington Housing Finance Commission Multifamily Housing Sanford Hildebrandt Towers Project | | | 2.25 | | | | 7-1-2021 | | | | 16,900,000 | | | | 16,913,182 | |
| | | | |
Washington Housing Finance Commission Multifamily Housing Series A | | | 1.80 | | | | 7-1-2020 | | | | 7,350,000 | | | | 7,320,086 | |
| | | | |
| | | | | | | | | | | | | | | 24,233,268 | |
| | | | | | | | | | | | | | | | |
| | | | |
| Tax Revenue: 0.52% | | | | | | | | | | | | | | | | |
| | | | |
Central Puget Sound WA Regional Transit Authority Sales Series 2015-S Class 2A (SIFMA Municipal Swap +0.30%) ± | | | 2.01 | | | | 11-1-2045 | | | | 7,000,000 | | | | 6,998,110 | |
| | | | |
Central Puget Sound WA Regional Transit Authority Sales Series S2B (SIFMA Municipal Swap +0.45%) ± | | | 2.16 | | | | 11-1-2045 | | | | 15,000,000 | | | | 15,004,500 | |
| | | | |
| | | | | | | | | | | | | | | 22,002,610 | |
| | | | | | | | | | | | | | | | |
The accompanying notes are an integral part of these financial statements.
| | | | | | |
| Portfolio of investments—December 31, 2018 (unaudited) | | Wells Fargo Short-Term Municipal Bond Fund | | | 35 | |
| | | | | | | | | | | | | | | | |
| Security name | | Interest rate | | | Maturity date | | | Principal | | | Value | |
| | | | |
| Utilities Revenue: 0.85% | | | | | | | | | | | | | | | | |
| | | | |
Seattle WA Municipal Light & Power Refunding Bond Series B-2 (SIFMA Municipal Swap +0.29%) ± | | | 2.00 | % | | | 5-1-2045 | | | $ | 12,635,000 | | | $ | 12,630,072 | |
| | | | |
Seattle WA Municipal Light & Power Refunding Bond Series C-1 (SIFMA Municipal Swap +0.49%) ± | | | 2.20 | | | | 11-1-2046 | | | | 23,190,000 | | | | 23,133,185 | |
| | | | |
| | | | | | | | | | | | | | | 35,763,257 | |
| | | | | | | | | | | | | | | | |
| | | | |
| Water & Sewer Revenue: 0.41% | | | | | | | | | | | | | | | | |
| | | | |
King County WA Junior Lien Series 2011 | | | 2.45 | | | | 1-1-2042 | | | | 17,000,000 | | | | 17,060,860 | |
| | | | | | | | | | | | | | | | |
| | | | |
| | | | | | | | | | | | | | | 135,744,696 | |
| | | | | | | | | | | | | | | | |
| | | | |
West Virginia: 0.26% | | | | | | | | | | | | | | | | |
| | | | |
| Resource Recovery Revenue: 0.06% | | | | | | | | | | | | | | | | |
| | | | |
West Virginia EDA PCR Appalachian Power Company Series D | | | 3.25 | | | | 5-1-2019 | | | | 2,745,000 | | | | 2,747,855 | |
| | | | | | | | | | | | | | | | |
| | | | |
| Utilities Revenue: 0.20% | | | | | | | | | | | | | | | | |
| | | | |
West Virginia Economic Development Refunding Bond Wheeling Power Company | | | 3.00 | | | | 6-1-2037 | | | | 8,300,000 | | | | 8,246,465 | |
| | | | | | | | | | | | | | | | |
| | | | |
| | | | | | | | | | | | | | | 10,994,320 | |
| | | | | | | | | | | | | | | | |
| | | | |
Wisconsin: 2.25% | | | | | | | | | | | | | | | | |
| | | | |
| Airport Revenue: 0.24% | | | | | | | | | | | | | | | | |
| | | | |
Wisconsin Airport Facilities PFA Senior Obligation Group Series B | | | 5.00 | | | | 7-1-2022 | | | | 9,745,000 | | | | 10,244,041 | |
| | | | | | | | | | | | | | | | |
| | | | |
| Education Revenue: 0.13% | | | | | | | | | | | | | | | | |
| | | | |
Wisconsin PFA Guilford College | | | 5.00 | | | | 1-1-2021 | | | | 650,000 | | | | 672,302 | |
| | | | |
Wisconsin PFA Guilford College | | | 5.00 | | | | 1-1-2022 | | | | 625,000 | | | | 654,875 | |
| | | | |
Wisconsin PFA Loan Anticipation Notes Lake Oconee Academy Foundation Incorporated Project | | | 2.30 | | | | 10-1-2019 | | | | 4,000,000 | | | | 3,980,320 | |
| | | | |
| | | | | | | | | | | | | | | 5,307,497 | |
| | | | | | | | | | | | | | | | |
| | | | |
| Health Revenue: 0.48% | | | | | | | | | | | | | | | | |
| | | | |
Wisconsin HEFA Advocate Aurora Health Credit Group Series C-4 (SIFMA Municipal Swap +0.65%) ± | | | 2.36 | | | | 8-15-2054 | | | | 4,200,000 | | | | 4,189,794 | |
| | | | |
Wisconsin HEFA Ascension Health Alliance Series B | | | 4.00 | | | | 11-15-2043 | | | | 13,000,000 | | | | 13,107,640 | |
| | | | |
Wisconsin HEFA Benevolent Corporation Cedar Community | | | 5.00 | | | | 6-1-2019 | | | | 635,000 | | | | 640,309 | |
| | | | |
Wisconsin HEFA Benevolent Corporation Cedar Community | | | 5.00 | | | | 6-1-2020 | | | | 880,000 | | | | 903,382 | |
| | | | |
Wisconsin HEFA Mercy Alliance Incorporated Project Series A | | | 5.00 | | | | 6-1-2019 | | | | 510,000 | | | | 515,860 | |
| | | | |
Wisconsin HEFA Vernon Memorial Healthcare Incorporated | | | 4.00 | | | | 3-1-2019 | | | | 445,000 | | | | 445,525 | |
| | | | |
Wisconsin HEFA Vernon Memorial Healthcare Incorporated | | | 5.00 | | | | 3-1-2020 | | | | 375,000 | | | | 382,230 | |
| | | | |
| | | | | | | | | | | | | | | 20,184,740 | |
| | | | | | | | | | | | | | | | |
| | | | |
| Miscellaneous Revenue: 0.90% | | | | | | | | | | | | | | | | |
| | | | |
Waukesha County WI Anticipation Notes Series C | | | 3.00 | | | | 5-1-2022 | | | | 3,035,000 | | | | 3,045,968 | |
| | | | |
Waukesha County WI Series B | | | 3.00 | | | | 5-1-2021 | | | | 16,725,000 | | | | 16,740,220 | |
| | | | |
Wisconsin State Refunding Bond Series A %% | | | 5.00 | | | | 5-1-2022 | | | | 8,040,000 | | | | 8,811,679 | |
| | | | |
Wisconsin State Refunding Bond Series A %% | | | 5.00 | | | | 5-1-2023 | | | | 8,015,000 | | | | 8,993,872 | |
| | | | |
| | | | | | | | | | | | | | | 37,591,739 | |
| | | | | | | | | | | | | | | | |
The accompanying notes are an integral part of these financial statements.
| | | | |
| 36 | | Wells Fargo Short-Term Municipal Bond Fund | | Portfolio of investments—December 31, 2018 (unaudited) |
| | | | | | | | | | | | | | | | |
| Security name | | Interest rate | | | Maturity date | | | Principal | | | Value | |
| | | | |
| Resource Recovery Revenue: 0.50% | | | | | | | | | | | | | | | | |
| | | | |
Wisconsin PFA Series A-2 | | | 2.15 | % | | | 10-1-2025 | | | $ | 21,000,000 | | | $ | 20,995,170 | |
| | | | | | | | | | | | | | | | |
| | | | |
| | | | | | | | | | | | | | | 94,323,187 | |
| | | | | | | | | | | | | | | | |
| | | | |
Total Municipal Obligations (Cost $4,171,234,650) | | | | | | | | | | | | | | | 4,168,218,534 | |
| | | | | | | | | | | | | | | | |
| | | | |
Other: 0.48% | | | | | | | | | | | | | | | | |
| | | | |
Nuveen California AMT-Free Quality Municipal Income Fund Preferred Shares Series A 144Aøø§ | | | 2.01 | | | | 10-1-2047 | | | | 20,400,000 | | | | 20,400,000 | |
| | | | | | | | | | | | | | | | |
| | | | |
Total Other (Cost $20,400,000) | | | | | | | | | | | | | | | 20,400,000 | |
| | | | | | | | | | | | | | | | |
| | | | |
| | | Yield | | | | | | Shares | | | | |
| Short-Term Investments: 0.07% | | | | | | | | | | | | | | | | |
| | | | |
| Investment Companies: 0.03% | | | | | | | | | | | | | | | | |
| | | | |
Wells Fargo Municipal Cash Management Money Market Fund Institutional Class (l)(u) | | | 1.65 | | | | | | | | 1,150,674 | | | | 1,151,135 | |
| | | | | | | | | | | | | | | | |
| | | | |
| | | | | | | | | Principal | | | | |
| U.S. Treasury Securities: 0.04% | | | | | | | | | | | | | | | | |
| | | | |
U.S. Treasury Bill (z)# | | | 2.32 | | | | 3-14-2019 | | | $ | 1,780,000 | | | | 1,771,475 | |
| | | | | | | | | | | | | | | | |
| | | | |
Total Short-Term Investments (Cost $2,922,797) | | | | | | | | | | | | | | | 2,922,610 | |
| | | | | | | | | | | | | | | | |
| | | | | | | | |
| Total investments in securities (Cost $4,194,557,447) | | | 99.87 | % | | | 4,191,541,144 | |
| | |
Other assets and liabilities, net | | | 0.13 | | | | 5,295,967 | |
| | | | | | | | |
| Total net assets | | | 100.00 | % | | $ | 4,196,837,111 | |
| | | | | | | | |
| ## | All or a portion of this security is segregated for when-issued securities. |
| ± | Variable rate investment. The rate shown is the rate in effect at period end. |
| %% | The security is issued on a when-issued basis. |
| 144A | The security may be resold in transactions exempt from registration, normally to qualified institutional buyers, pursuant to Rule 144A under the Securities Act of 1933. |
| øø | The interest rate is determined and reset by the issuer periodically depending upon the terms of the security. The rate shown is the rate in effect at period end. |
| (z) | Zero coupon security. The rate represents the purchase yield to maturity. |
| ø | Variable rate demand notes are subject to a demand feature which reduces the effective maturity. The maturity date shown represents the final maturity date of the security. The interest rate is determined and reset by the issuer daily, weekly, or monthly depending upon the terms of the security. The rate shown is the rate in effect at period end. |
| (m) | The security is an auction-rate security which has an interest rate that resets at predetermined short-term intervals through a Dutch auction. The rate shown is the rate in effect at period end. |
| (n) | The auction to set the interest rate on the security failed at period end due to insufficient investor interest. A failed auction does not itself cause a default. |
| § | The security is subject to a demand feature which reduces the effective maturity. |
| (l) | The issuer of the security is an affiliated person of the Fund as defined in the Investment Company Act of 1940. |
| (u) | The rate represents the 7-day annualized yield at period end. |
| # | All or a portion of this security is segregated as collateral for investments in derivative instruments. |
The accompanying notes are an integral part of these financial statements.
| | | | | | |
| Portfolio of investments—December 31, 2018 (unaudited) | | Wells Fargo Short-Term Municipal Bond Fund | | | 37 | |
Abbreviations:
| AGC | Assured Guaranty Corporation |
| AGM | Assured Guaranty Municipal |
| Ambac | Ambac Financial Group Incorporated |
| AMT | Alternative minimum tax |
| BAN | Bond anticipation notes |
| CAB | Capital appreciation bond |
| CDA | Community Development Authority |
| ECFA | Educational & Cultural Facilities Authority |
| EDA | Economic Development Authority |
| EDFA | Economic Development Finance Authority |
| FHA | Federal Housing Administration |
| FHLMC | Federal Home Loan Mortgage Corporation |
| FNMA | Federal National Mortgage Association |
| GNMA | Government National Mortgage Association |
| HCFR | Healthcare facilities revenue |
| HEFA | Health & Educational Facilities Authority |
| HEFAR | Higher Education Facilities Authority Revenue |
| HFA | Housing Finance Authority |
| HFFA | Health Facilities Financing Authority |
| HUD | Department of Housing and Urban Development |
| IDA | Industrial Development Authority |
| LIBOR | London Interbank Offered Rate |
| National | National Public Finance Guarantee Corporation |
| PCFA | Pollution Control Financing Authority |
| PCR | Pollution control revenue |
| PFA | Public Finance Authority |
| RAN | Revenue anticipation notes |
| RDA | Redevelopment Authority |
| SFMR | Single-family mortgage revenue |
| SIFMA | Securities Industry and Financial Markets Association |
| SPA | Standby purchase agreement |
| TAN | Tax anticipation notes |
| TTFA | Transportation Trust Fund Authority |
Investments in Affiliates
An affiliated investment is an investment in which the Fund owns at least 5% of the outstanding voting shares of the issuer or as a result of other relationships, such as the Fund and the issuer having the same investment manager. Transactions with issuers that were either affiliated persons of the Fund at the beginning of the period or the end of the period were as follows:
| | | | | | | | | | | | | | | | | | | | | | | | | | | | | | | | | | | | |
| | | Shares,
beginning of
period | | | Shares
purchased | | | Shares sold | | | Shares,
end of
period | | | Net
realized
gains
(losses) | | | Net
change in
unrealized
gains
(losses) | | | Income
from
affiliated
securities | | | Value,
end
of period | | | % of
net
assets | |
Short-Term Investments | | | | | | | | | | | | | | | | | | | | | | | | | | | | | | | | | | | | |
Investment Companies | | | | | | | | | | | | | | | | | | | | | | | | | | | | | | | | | | | | |
Wells Fargo Municipal Cash Management Money Market Fund Institutional Class | | | 11,091,809 | | | | 661,742,338 | | | | 671,683,473 | | | | 1,150,674 | | | $ | (40,369 | ) | | $ | 0 | | | $ | 147,612 | | | $ | 1,151,135 | | | | 0.03 | % |
The accompanying notes are an integral part of these financial statements.
| | | | |
| 38 | | Wells Fargo Short-Term Municipal Bond Fund | | Statement of assets and liabilities—December 31, 2018 (unaudited) |
| | | | |
| |
Assets | | | | |
Investments in unaffiliated securities, at value (cost $4,193,406,312) | | $ | 4,190,390,009 | |
Investments in affiliated securities, at value (cost $1,151,135) | | | 1,151,135 | |
Cash | | | 6,780,115 | |
Receivable for investments sold | | | 11,997,185 | |
Receivable for Fund shares sold | | | 12,499,673 | |
Receivable for interest | | | 31,861,908 | |
| | | | |
Total assets | | | 4,254,680,025 | |
| | | | |
| |
Liabilities | | | | |
Payable for investments purchased | | | 33,972,631 | |
Payable for Fund shares redeemed | | | 20,253,135 | |
Dividends payable | | | 1,223,382 | |
Management fee payable | | | 1,011,254 | |
Administration fees payable | | | 347,004 | |
Distribution fee payable | | | 28,201 | |
Trustees’ fees and expenses payable | | | 415 | |
Accrued expenses and other liabilities | | | 1,006,892 | |
| | | | |
Total liabilities | | | 57,842,914 | |
| | | | |
Total net assets | | $ | 4,196,837,111 | |
| | | | |
| |
NET ASSETS CONSIST OF | | | | |
Paid-in capital | | $ | 4,241,991,785 | |
Total distributable loss | | | (45,154,674 | ) |
| | | | |
Total net assets | | $ | 4,196,837,111 | |
| | | | |
| |
COMPUTATION OF NET ASSET VALUE AND OFFERING PRICE PER SHARE | | | | |
Net assets – Class A | | $ | 1,035,123,196 | |
Shares outstanding – Class A1 | | | 105,275,303 | |
Net asset value per share – Class A | | | $9.83 | |
Maximum offering price per share – Class A2 | | | $10.03 | |
Net assets – Class C | | $ | 43,131,249 | |
Shares outstanding – Class C1 | | | 4,386,262 | |
Net asset value per share – Class C | | | $9.83 | |
Net assets – Class R6 | | $ | 622,614,351 | |
Shares outstanding – Class R61 | | | 63,200,781 | |
Net asset value per share – Class R6 | | | $9.85 | |
Net assets – Administrator Class | | $ | 38,157,275 | |
Shares outstanding – Administrator Class1 | | | 3,878,307 | |
Net asset value per share – Administrator Class | | | $9.84 | |
Net assets – Institutional Class | | $ | 2,457,811,040 | |
Shares outstanding – Institutional Class1 | | | 249,507,436 | |
Net asset value per share – Institutional Class | | | $9.85 | |
| 1 | The Fund has an unlimited number of authorized shares. |
| 2 | Maximum offering price is computed as 100/98 of net asset value. On investments of $50,000 or more, the offering price is reduced. |
The accompanying notes are an integral part of these financial statements.
| | | | | | |
| Statement of operations—six months ended December 31, 2018 (unaudited) | | Wells Fargo Short-Term Municipal Bond Fund | | | 39 | |
| | | | |
| |
Investment income | | | | |
Interest | | $ | 49,587,814 | |
Income from affiliated securities | | | 147,612 | |
| | | | |
Total investment income | | | 49,735,426 | |
| | | | |
| |
Expenses | | | | |
Management fee | | | 7,533,650 | |
Administration fees | | | | |
Class A | | | 907,670 | |
Class C | | | 35,825 | |
Class R6 | | | 25,210 | 1 |
Administrator Class | | | 20,228 | |
Institutional Class | | | 1,268,258 | |
Shareholder servicing fees | | | | |
Class A | | | 1,418,235 | |
Class C | | | 55,976 | |
Administrator Class | | | 50,270 | |
Distribution fee | | | | |
Class C | | | 167,929 | |
Custody and accounting fees | | | 70,271 | |
Professional fees | | | 41,118 | |
Registration fees | | | 166,008 | |
Shareholder report expenses | | | 140,283 | |
Trustees’ fees and expenses | | | 10,526 | |
Other fees and expenses | | | 38,797 | |
| | | | |
Total expenses | | | 11,950,254 | |
Less: Fee waivers and/or expense reimbursements | | | (1,310,537 | ) |
| | | | |
Net expenses | | | 10,639,717 | |
| | | | |
Net investment income | | | 39,095,709 | |
| | | | |
| |
REALIZED AND UNREALIZED GAINS (LOSSES) ON INVESTMENTS | | | | |
| |
| Net realized gains (losses) on: | | | | |
Unaffiliated securities | | | (3,005,471 | ) |
Affiliated securities | | | (40,369 | ) |
Futures contracts | | | 2,761,205 | |
| | | | |
Net realized losses on investments | | | (284,635 | ) |
Net change in unrealized gains (losses) on investments | | | (641,443 | ) |
| | | | |
Net realized and unrealized gains (losses) on investments | | | (926,078 | ) |
| | | | |
Net increase in net assets resulting from operations | | $ | 38,169,631 | |
| | | | |
| 1 | For the period from July 31, 2018 (commencement of class operations) to December 31, 2018 |
The accompanying notes are an integral part of these financial statements.
| | | | |
| 40 | | Wells Fargo Short-Term Municipal Bond Fund | | Statement of changes in net assets |
| | | | | | | | | | | | | | | | |
| | | Six months ended
December 31, 2018
(unaudited) | | | Year ended
June 30, 20181 | |
| | | | |
Operations | | | | | | | | | | | | | | | | |
Net investment income | | | | | | $ | 39,095,709 | | | | | | | $ | 76,005,326 | |
Net realized losses on investments | | | | | | | (284,635 | ) | | | | | | | (37,212,436 | ) |
Net change in unrealized gains (losses) on investments | | | | | | | (641,443 | ) | | | | | | | 26,940,201 | |
| | | | |
Net increase in net assets resulting from operations | | | | | | | 38,169,631 | | | | | | | | 65,733,091 | |
| | | | |
| | | | |
Distributions to shareholders from net investment income and net realized gains | | | | | | | | | | | | | | | | |
Class A | | | | | | | (8,823,177 | ) | | | | | | | (18,913,250 | ) |
Class C | | | | | | | (180,724 | ) | | | | | | | (329,883 | ) |
Class R6 | | | | | | | (1,626,724 | )2 | | | | | | | N/A | |
Administrator Class | | | | | | | (320,665 | ) | | | | | | | (776,666 | ) |
Institutional Class | | | | | | | (28,153,969 | ) | | | | | | | (55,986,581 | ) |
| | | | |
Total distributions to shareholders | | | | | | | (39,105,259 | ) | | | | | | | (76,006,380 | ) |
| | | | |
| | | | |
Capital share transactions | | | Shares | | | | | | | | Shares | | | | | |
Proceeds from shares sold | | | | | | | | | | | | | | | | |
Class A | | | 7,122,513 | | | | 69,893,029 | | | | 18,297,636 | | | | 180,213,329 | |
Class C | | | 187,609 | | | | 1,840,919 | | | | 182,051 | | | | 1,795,631 | |
Class R6 | | | 66,914,399 | 2 | | | 656,135,308 | 2 | | | N/A | | | | N/A | |
Administrator Class | | | 813,792 | | | | 7,987,449 | | | | 1,971,304 | | | | 19,431,959 | |
Institutional Class | | | 59,188,640 | | | | 582,159,535 | | | | 141,398,279 | | | | 1,395,926,490 | |
| | | | |
| | | | |
| | | | | | | 1,318,016,240 | | | | | | | | 1,597,367,409 | |
| | | | |
Reinvestment of distributions | | | | | | | | | | | | | | | | |
Class A | | | 846,635 | | | | 8,309,706 | | | | 1,836,651 | | | | 18,081,160 | |
Class C | | | 16,655 | | | | 163,486 | | | | 30,273 | | | | 297,962 | |
Class R6 | | | 107,519 | 2 | | | 1,058,083 | 2 | | | N/A | | | | N/A | |
Administrator Class | | | 31,681 | | | | 311,152 | | | | 77,693 | | | | 765,617 | |
Institutional Class | | | 2,306,214 | | | | 22,676,071 | | | | 4,344,070 | | | | 42,840,075 | |
| | | | |
| | | | |
| | | | | | | 32,518,498 | | | | | | | | 61,984,814 | |
| | | | |
Payment for shares redeemed | | | | | | | | | | | | | | | | |
Class A | | | (25,687,858 | ) | | | (252,033,311 | ) | | | (61,621,053 | ) | | | (606,889,814 | ) |
Class C | | | (710,670 | ) | | | (6,976,891 | ) | | | (1,695,155 | ) | | | (16,694,825 | ) |
Class R6 | | | (3,821,137 | )2 | | | (37,580,455 | )2 | | | N/A | | | | N/A | |
Administrator Class | | | (1,459,024 | ) | | | (14,336,069 | ) | | | (4,519,762 | ) | | | (44,536,175 | ) |
Institutional Class | | | (159,359,925 | ) | | | (1,564,450,196 | ) | | | (145,674,086 | ) | | | (1,436,794,551 | ) |
| | | | |
| | | | |
| | | | | | | (1,875,376,922 | ) | | | | | | | (2,104,915,365 | ) |
| | | | |
Net decrease in net assets resulting from capital share transactions | | | | | | | (524,842,184 | ) | | | | | | | (445,563,142 | ) |
| | | | |
Total decrease in net assets | | | | | | | (525,777,812 | ) | | | | | | | (455,836,431 | ) |
| | | | |
| | | | |
Net assets | | | | | | | | | | | | | | | | |
Beginning of period | | | | | | | 4,722,614,923 | | | | | | | | 5,178,451,354 | |
| | | | |
End of period | | | | | | $ | 4,196,837,111 | | | | | | | $ | 4,722,614,923 | |
| | | | |
| 1 | Effective for all filings after November 4, 2018, the SEC prospectively eliminated the requirement to parenthetically disclose undistributed net investment income at the end of the period and permitted the aggregation of distributions, with the exception of tax basis returns of capital. Undistributed net investment income at June 30, 2018 was $287,138. The disaggregated distributions information for the year ended June 30, 2018 is included in Note 8,Distributions to Shareholders, in the notes to the financial statements. |
| 2 | For the period from July 31, 2018 (commencement of class operations) to December 31, 2018 |
The accompanying notes are an integral part of these financial statements.
| | | | | | |
| Financial highlights | | Wells Fargo Short-Term Municipal Bond Fund | | | 41 | |
(For a share outstanding throughout each period)
| | | | | | | | | | | | | | | | | | | | | | | | |
| | | Six months ended
December 31, 2018 (unaudited) | | | Year ended June 30 | |
| CLASS A | | 2018 | | | 2017 | | | 2016 | | | 2015 | | | 2014 | |
Net asset value, beginning of period | | | $9.83 | | | | $9.85 | | | | $9.96 | | | | $9.93 | | | | $10.00 | | | | $9.97 | |
Net investment income | | | 0.08 | | | | 0.13 | | | | 0.12 | | | | 0.11 | | | | 0.09 | | | | 0.11 | |
Net realized and unrealized gains (losses) on investments | | | (0.00 | )1 | | | (0.02 | ) | | | (0.11 | ) | | | 0.04 | | | | (0.06 | ) | | | 0.05 | |
| | | | | | | | | | | | | | | | | | | | | | | | |
Total from investment operations | | | 0.08 | | | | 0.11 | | | | 0.01 | | | | 0.15 | | | | 0.03 | | | | 0.16 | |
Distributions to shareholders from | | | | | | | | | | | | | | | | | | | | | | | | |
Net investment income | | | (0.08 | ) | | | (0.13 | ) | | | (0.12 | ) | | | (0.11 | ) | | | (0.09 | ) | | | (0.11 | ) |
Net realized gains | | | 0.00 | | | | 0.00 | | | | 0.00 | | | | (0.01 | ) | | | (0.01 | ) | | | (0.02 | ) |
| | | | | | | | | | | | | | | | | | | | | | | | |
Total distributions to shareholders | | | (0.08 | ) | | | (0.13 | ) | | | (0.12 | ) | | | (0.12 | ) | | | (0.10 | ) | | | (0.13 | ) |
Net asset value, end of period | | | $9.83 | | | | $9.83 | | | | $9.85 | | | | $9.96 | | | | $9.93 | | | | $10.00 | |
Total return2 | | | 0.79 | % | | | 1.15 | % | | | 0.14 | % | | | 1.49 | % | | | 0.27 | % | | | 1.55 | % |
Ratios to average net assets (annualized) | | | | | | | | | | | | | | | | | | | | | | | | |
Gross expenses | | | 0.76 | % | | | 0.77 | % | | | 0.76 | % | | | 0.75 | % | | | 0.75 | % | | | 0.76 | % |
Net expenses | | | 0.63 | % | | | 0.63 | % | | | 0.63 | % | | | 0.62 | % | | | 0.60 | % | | | 0.60 | % |
Net investment income | | | 1.55 | % | | | 1.34 | % | | | 1.23 | % | | | 1.11 | % | | | 0.89 | % | | | 1.08 | % |
Supplemental data | | | | | | | | | | | | | | | | | | | | | | | | |
Portfolio turnover rate | | | 21 | % | | | 31 | % | | | 23 | % | | | 16 | % | | | 24 | % | | | 28 | % |
Net assets, end of period (000s omitted) | | | $1,035,123 | | | | $1,209,079 | | | | $1,619,974 | | | | $3,362,147 | | | | $2,228,977 | | | | $2,031,798 | |
| 1 | Amount is more than $(0.005). |
| 2 | Total return calculations do not include any sales charges. Returns for periods of less than one year are not annualized. |
The accompanying notes are an integral part of these financial statements.
| | | | |
| 42 | | Wells Fargo Short-Term Municipal Bond Fund | | Financial highlights |
(For a share outstanding throughout each period)
| | | | | | | | | | | | | | | | | | | | | | | | |
| | | Six months ended
December 31, 2018 (unaudited) | | | Year ended June 30 | |
| CLASS C | | 2018 | | | 2017 | | | 2016 | | | 2015 | | | 2014 | |
Net asset value, beginning of period | | | $9.83 | | | | $9.85 | | | | $9.96 | | | | $9.93 | | | | $10.00 | | | | $9.97 | |
Net investment income | | | 0.04 | | | | 0.06 | | | | 0.05 | | | | 0.04 | | | | 0.01 | | | | 0.03 | |
Net realized and unrealized gains (losses) on investments | | | (0.00 | )1 | | | (0.02 | ) | | | (0.11 | ) | | | 0.04 | | | | (0.06 | ) | | | 0.05 | |
| | | | | | | | | | | | | | | | | | | | | | | | |
Total from investment operations | | | 0.04 | | | | 0.04 | | | | (0.06 | ) | | | 0.08 | | | | (0.05 | ) | | | 0.08 | |
Distributions to shareholders from | | | | | | | | | | | | | | | | | | | | | | | | |
Net investment income | | | (0.04 | ) | | | (0.06 | ) | | | (0.05 | ) | | | (0.04 | ) | | | (0.01 | ) | | | (0.03 | ) |
Net realized gains | | | 0.00 | | | | 0.00 | | | | 0.00 | | | | (0.01 | ) | | | (0.01 | ) | | | (0.02 | ) |
| | | | | | | | | | | | | | | | | | | | | | | | |
Total distributions to shareholders | | | (0.04 | ) | | | (0.06 | ) | | | (0.05 | ) | | | (0.05 | ) | | | (0.02 | ) | | | (0.05 | ) |
Net asset value, end of period | | | $9.83 | | | | $9.83 | | | | $9.85 | | | | $9.96 | | | | $9.93 | | | | $10.00 | |
Total return2 | | | 0.41 | % | | | 0.40 | % | | | (0.61 | )% | | | 0.73 | % | | | (0.48 | )% | | | 0.79 | % |
Ratios to average net assets (annualized) | | | | | | | | | | | | | | | | | | | | | | | | |
Gross expenses | | | 1.51 | % | | | 1.52 | % | | | 1.51 | % | | | 1.50 | % | | | 1.50 | % | | | 1.51 | % |
Net expenses | | | 1.38 | % | | | 1.38 | % | | | 1.38 | % | | | 1.37 | % | | | 1.35 | % | | | 1.35 | % |
Net investment income | | | 0.81 | % | | | 0.59 | % | | | 0.49 | % | | | 0.35 | % | | | 0.14 | % | | | 0.34 | % |
Supplemental data | | | | | | | | | | | | | | | | | | | | | | | | |
Portfolio turnover rate | | | 21 | % | | | 31 | % | | | 23 | % | | | 16 | % | | | 24 | % | | | 28 | % |
Net assets, end of period (000s omitted) | | | $43,131 | | | | $48,101 | | | | $62,796 | | | | $82,111 | | | | $103,146 | | | | $133,463 | |
| 1 | Amount is more than $(0.005). |
| 2 | Total return calculations do not include any sales charges. Returns for periods of less than one year are not annualized. |
The accompanying notes are an integral part of these financial statements.
| | | | | | |
| Financial highlights | | Wells Fargo Short-Term Municipal Bond Fund | | | 43 | |
(For a share outstanding throughout the period)
| | | | |
| CLASS R6 | | Period ended
December 31, 20181
(unaudited) | |
Net asset value, beginning of period | | | $9.86 | |
Net investment income | | | 0.08 | |
Net realized and unrealized gains (losses) on investments | | | (0.01 | ) |
| | | | |
Total from investment operations | | | 0.07 | |
Distributions to shareholders from | | | | |
Net investment income | | | (0.08 | ) |
Net realized gains | | | 0.00 | |
| | | | |
Total distributions to shareholders | | | (0.08 | ) |
Net asset value, end of period | | | $9.85 | |
Total return2 | | | 0.68 | % |
Ratios to average net assets (annualized) | | | | |
Gross expenses | | | 0.38 | % |
Net expenses | | | 0.35 | % |
Net investment income | | | 1.94 | % |
Supplemental data | | | | |
Portfolio turnover rate | | | 21 | % |
Net assets, end of period (000s omitted) | | | $622,614 | |
| 1 | For the period from July 31, 2018 (commencement of class operations) to December 31, 2018 |
| 2 | Returns for periods of less than one year are not annualized. |
The accompanying notes are an integral part of these financial statements.
| | | | |
| 44 | | Wells Fargo Short-Term Municipal Bond Fund | | Financial highlights |
(For a share outstanding throughout each period)
| | | | | | | | | | | | | | | | | | | | | | | | |
| | | Six months ended
December 31, 2018 (unaudited) | | | Year ended June 30 | |
| ADMINISTRATOR CLASS | | 2018 | | | 2017 | | | 2016 | | | 2015 | | | 2014 | |
Net asset value, beginning of period | | | $9.84 | | | | $9.86 | | | | $9.97 | | | | $9.95 | | | | $10.03 | | | | $9.99 | |
Net investment income | | | 0.08 | | | | 0.14 | | | | 0.13 | | | | 0.11 | 1 | | | 0.09 | | | | 0.11 | |
Net realized and unrealized gains (losses) on investments | | | (0.00 | )2 | | | (0.02 | ) | | | (0.11 | ) | | | 0.03 | | | | (0.07 | ) | | | 0.06 | |
| | | | | | | | | | | | | | | | | | | | | | | | |
Total from investment operations | | | 0.08 | | | | 0.12 | | | | 0.02 | | | | 0.14 | | | | 0.02 | | | | 0.17 | |
Distributions to shareholders from | | | | | | | | | | | | | | | | | | | | | | | | |
Net investment income | | | (0.08 | ) | | | (0.14 | ) | | | (0.13 | ) | | | (0.11 | ) | | | (0.09 | ) | | | (0.11 | ) |
Net realized gains | | | 0.00 | | | | 0.00 | | | | 0.00 | | | | (0.01 | ) | | | (0.01 | ) | | | (0.02 | ) |
| | | | | | | | | | | | | | | | | | | | | | | | |
Total distributions to shareholders | | | (0.08 | ) | | | (0.14 | ) | | | (0.13 | ) | | | (0.12 | ) | | | (0.10 | ) | | | (0.13 | ) |
Net asset value, end of period | | | $9.84 | | | | $9.84 | | | | $9.86 | | | | $9.97 | | | | $9.95 | | | | $10.03 | |
Total return3 | | | 0.80 | % | | | 1.18 | % | | | 0.17 | % | | | 1.42 | % | | | 0.17 | % | | | 1.65 | % |
Ratios to average net assets (annualized) | | | | | | | | | | | | | | | | | | | | | | | | |
Gross expenses | | | 0.70 | % | | | 0.71 | % | | | 0.70 | % | | | 0.66 | % | | | 0.68 | % | | | 0.70 | % |
Net expenses | | | 0.60 | % | | | 0.60 | % | | | 0.60 | % | | | 0.59 | % | | | 0.60 | % | | | 0.60 | % |
Net investment income | | | 1.58 | % | | | 1.36 | % | | | 1.27 | % | | | 1.08 | % | | | 0.89 | % | | | 1.08 | % |
Supplemental data | | | | | | | | | | | | | | | | | | | | | | | | |
Portfolio turnover rate | | | 21 | % | | | 31 | % | | | 23 | % | | | 16 | % | | | 24 | % | | | 28 | % |
Net assets, end of period (000s omitted) | | | $38,157 | | | | $44,186 | | | | $68,621 | | | | $95,121 | | | | $511,894 | | | | $565,737 | |
| 1 | Calculated based upon average shares outstanding |
| 2 | Amount is more than $(0.005). |
| 3 | Returns for periods of less than one year are not annualized. |
The accompanying notes are an integral part of these financial statements.
| | | | | | |
| Financial highlights | | Wells Fargo Short-Term Municipal Bond Fund | | | 45 | |
(For a share outstanding throughout each period)
| | | | | | | | | | | | | | | | | | | | | | | | |
| | | Six months ended
December 31, 2018 (unaudited) | | | Year ended June 30 | |
| INSTITUTIONAL CLASS | | 2018 | | | 2017 | | | 2016 | | | 2015 | | | 2014 | |
Net asset value, beginning of period | | | $9.85 | | | | $9.87 | | | | $9.98 | | | | $9.95 | | | | $10.02 | | | | $9.99 | |
Net investment income | | | 0.09 | | | | 0.16 | | | | 0.15 | | | | 0.13 | | | | 0.11 | | | | 0.13 | |
Net realized and unrealized gains (losses) on investments | | | (0.00 | )1 | | | (0.02 | ) | | | (0.11 | ) | | | 0.04 | | | | (0.06 | ) | | | 0.05 | |
| | | | | | | | | | | | | | | | | | | | | | | | |
Total from investment operations | | | 0.09 | | | | 0.14 | | | | 0.04 | | | | 0.17 | | | | 0.05 | | | | 0.18 | |
Distributions to shareholders from | | | | | | | | | | | | | | | | | | | | | | | | |
Net investment income | | | (0.09 | ) | | | (0.16 | ) | | | (0.15 | ) | | | (0.13 | ) | | | (0.11 | ) | | | (0.13 | ) |
Net realized gains | | | 0.00 | | | | 0.00 | | | | 0.00 | | | | (0.01 | ) | | | (0.01 | ) | | | (0.02 | ) |
| | | | | | | | | | | | | | | | | | | | | | | | |
Total distributions to shareholders | | | (0.09 | ) | | | (0.16 | ) | | | (0.15 | ) | | | (0.14 | ) | | | (0.12 | ) | | | (0.15 | ) |
Net asset value, end of period | | | $9.85 | | | | $9.85 | | | | $9.87 | | | | $9.98 | | | | $9.95 | | | | $10.02 | |
Total return2 | | | 0.90 | % | | | 1.39 | % | | | 0.37 | % | | | 1.71 | % | | | 0.47 | % | | | 1.75 | % |
Ratios to average net assets (annualized) | | | | | | | | | | | | | | | | | | | | | | | | |
Gross expenses | | | 0.43 | % | | | 0.44 | % | | | 0.43 | % | | | 0.42 | % | | | 0.42 | % | | | 0.43 | % |
Net expenses | | | 0.40 | % | | | 0.40 | % | | | 0.40 | % | | | 0.40 | % | | | 0.40 | % | | | 0.40 | % |
Net investment income | | | 1.78 | % | | | 1.58 | % | | | 1.48 | % | | | 1.33 | % | | | 1.09 | % | | | 1.29 | % |
Supplemental data | | | | | | | | | | | | | | | | | | | | | | | | |
Portfolio turnover rate | | | 21 | % | | | 31 | % | | | 23 | % | | | 16 | % | | | 24 | % | | | 28 | % |
Net assets, end of period (000s omitted) | | | $2,457,811 | | | | $3,421,249 | | | | $3,427,060 | | | | $2,261,092 | | | | $1,895,713 | | | | $1,382,576 | |
| 1 | Amount is more than $(0.005). |
| 2 | Returns for periods of less than one year are not annualized. |
The accompanying notes are an integral part of these financial statements.
| | | | |
| 46 | | Wells Fargo Short-Term Municipal Bond Fund | | Notes to financial statements (unaudited) |
1. ORGANIZATION
Wells Fargo Funds Trust (the “Trust”), a Delaware statutory trust organized on March 10, 1999, is an open-end management investment company registered under the Investment Company Act of 1940, as amended (the “1940 Act”). As an investment company, the Trust follows the accounting and reporting guidance in Financial Accounting Standards Board (“FASB”) Accounting Standards Codification Topic 946,Financial Services – Investment Companies. These financial statements report on the Wells Fargo Short-Term Municipal Bond Fund (the “Fund”) which is a diversified series of the Trust.
2. SIGNIFICANT ACCOUNTING POLICIES
The following significant accounting policies, which are consistently followed in the preparation of the financial statements of the Fund, are in conformity with U.S. generally accepted accounting principles which require management to make estimates and assumptions that affect the reported amounts of assets and liabilities, disclosure of contingent assets and liabilities at the date of the financial statements, and the reported amounts of revenues and expenses during the reporting period. Actual results could differ from those estimates.
Securities valuation
All investments are valued each business day as of the close of regular trading on the New York Stock Exchange (generally 4 p.m. Eastern Time), although the Fund may deviate from this calculation time under unusual or unexpected circumstances.
Debt securities are valued at the evaluated bid price provided by an independent pricing service (e.g. taking into account various factors, including yields, maturities, or credit ratings) or, if a reliable price is not available, the quoted bid price from an independent broker-dealer.
Futures contracts that are listed on a foreign or domestic exchange or market are valued at the official closing price or, if none, the last sales price.
Investments in registered open-end investment companies are valued at net asset value.
Investments which are not valued using any of the methods discussed above are valued at their fair value, as determined in good faith by the Board of Trustees of the Fund. The Board of Trustees has established a Valuation Committee comprised of the Trustees and has delegated to it the authority to take any actions regarding the valuation of portfolio securities that the Valuation Committee deems necessary or appropriate, including determining the fair value of portfolio securities, unless the determination has been delegated to the Wells Fargo Asset Management Pricing Committee at Wells Fargo Funds Management, LLC (“Funds Management”). The Board of Trustees retains the authority to make or ratify any valuation decisions or approve any changes to the Valuation Procedures as it deems appropriate. On a quarterly basis, the Board of Trustees receives reports on any valuation actions taken by the Valuation Committee or the Wells Fargo Asset Management Pricing Committee which may include items for ratification.
When-issued transactions
The Fund may purchase securities on a forward commitment or when-issued basis. The Fund records a when-issued transaction on the trade date and will segregate assets in an amount at least equal in value to the Fund’s commitment to purchase when-issued securities. Securities purchased on a when-issued basis are marked-to-market daily and the Fund begins earning interest on the settlement date. Losses may arise due to changes in the market value of the underlying securities or if the counterparty does not perform under the contract.
Futures contracts
The Fund is subject to interest rate risk in the normal course of pursuing its investment objectives. Futures contracts are agreements between the Fund and a counterparty to buy or sell a specific amount of a commodity, financial instrument or currency at specified price and on a specified date. The Fund may buy and sell futures contracts in order to gain exposure to, or protect against, changes in interest rates. The primary risks associated with the use of futures contracts are the imperfect correlation between changes in market values of securities held by the Fund and the prices of futures contracts, and the possibility of an illiquid market. Futures contracts are generally entered into on a regulated futures exchange and cleared through a clearinghouse associated with the exchange. With futures contracts, there is minimal counterparty risk to the Fund since futures contracts are exchange traded and the exchange’s clearinghouse, as counterparty to all exchange traded futures, guarantees the futures contracts against default.
Upon entering into a futures contracts, the Fund is required to deposit either cash or securities (initial margin) with the broker in an amount equal to a certain percentage of the contract value. Subsequent payments (variation margin) are paid to or from the broker each day equal to the daily changes in the contract value. Such payments are recorded as unrealized gains or losses and, if any, shown as variation margin receivable (payable) in the Statement of Assets and Liabilities. Should the Fund fail to make
| | | | | | |
| Notes to financial statements (unaudited) | | Wells Fargo Short-Term Municipal Bond Fund | | | 47 | |
requested variation margin payments, the broker can gain access to the initial margin to satisfy the Fund’s payment obligations. When the contracts are closed, a realized gain or loss is recorded in the Statement of Operations.
Security transactions and income recognition
Securities transactions are recorded on a trade date basis. Realized gains or losses are recorded on the basis of identified cost.
Interest income is accrued daily and bond discounts are accreted and premiums are amortized daily. To the extent debt obligations are placed on non-accrual status, any related interest income may be reduced by writing off interest receivables when the collection of all or a portion of interest has been determined to be doubtful based on consistently applied procedures and the fair value has decreased. If the issuer subsequently resumes interest payments or when the collectability of interest is reasonably assured, the debt obligation is removed from non-accrual status.
Distributions to shareholders
Distributions to shareholders from net investment income are declared daily and paid monthly. Distributions from net realized gains, if any, are recorded on the ex-dividend date and paid at least annually. Such distributions are determined in accordance with income tax regulations and may differ from U.S. generally accepted accounting principles. Dividend sources are estimated at the time of declaration. The tax character of distributions is determined as of the Fund’s fiscal year end. Therefore, a portion of the Fund’s distributions made prior to the Fund’s fiscal year end may be categorized as a tax return of capital at year end.
Federal and other taxes
The Fund intends to continue to qualify as a regulated investment company by distributing substantially all of its investment company taxable and tax-exempt income and any net realized capital gains (after reduction for capital loss carryforwards) sufficient to relieve it from all, or substantially all, federal income taxes. Accordingly, no provision for federal income taxes was required.
The Fund’s income and federal excise tax returns and all financial records supporting those returns for the prior three fiscal years are subject to examination by the federal and Delaware revenue authorities. Management has analyzed the Fund’s tax positions taken on federal, state, and foreign tax returns for all open tax years and does not believe that there are any uncertain tax positions that require recognition of a tax liability.
As of December 31, 2018, the aggregate cost of all investments for federal income tax purposes was $4,194,186,429 and the unrealized gains (losses) consisted of:
| | | | |
| |
Gross unrealized gains | | $ | 11,308,280 | |
| |
Gross unrealized losses | | | (13,953,565 | ) |
| |
Net unrealized losses | | $ | (2,645,285 | ) |
As of June 30, 2018, the Fund had capital loss carryforwards which consisted of $42,091,784 in long-term capital losses.
Class allocations
The separate classes of shares offered by the Fund differ principally in applicable sales charges, distribution, shareholder servicing, and administration fees. Class specific expenses are charged directly to that share class. Investment income, common expenses, and realized and unrealized gains (losses) on investments are allocated daily to each class of shares based on the relative proportion of net assets of each class.
3. FAIR VALUATION MEASUREMENTS
Fair value measurements of investments are determined within a framework that has established a fair value hierarchy based upon the various data inputs utilized in determining the value of the Fund’s investments. The three-level hierarchy gives the highest priority to unadjusted quoted prices in active markets for identical assets or liabilities (Level 1) and the lowest priority to unobservable inputs (Level 3). The Fund’s investments are classified within the fair value hierarchy based on the lowest level of input that is significant to the fair value measurement. The inputs are summarized into three broad levels as follows:
| ∎ | | Level 1 – quoted prices in active markets for identical securities |
| ∎ | | Level 2 – other significant observable inputs (including quoted prices for similar securities, interest rates, prepayment speeds, credit risk, etc.) |
| ∎ | | Level 3 – significant unobservable inputs (including the Fund’s own assumptions in determining the fair value of investments) |
| | | | |
| 48 | | Wells Fargo Short-Term Municipal Bond Fund | | Notes to financial statements (unaudited) |
The inputs or methodologies used for valuing investments in securities are not necessarily an indication of the risk associated with investing in those securities.
The following is a summary of the inputs used in valuing the Fund’s assets and liabilities as of December 31, 2018:
| | | | | | | | | | | | | | | | |
| | | | |
| | | Quoted prices
(Level 1) | | | Other significant
observable inputs
(Level 2) | | | Significant
unobservable inputs (Level 3) | | | Total | |
| | | | |
Assets | | | | | | | | | | | | | | | | |
Investments in: | | | | | | | | | | | | | | | | |
| | | | |
Municipal obligations | | $ | 0 | | | $ | 4,168,218,534 | | | $ | 0 | | | $ | 4,168,218,534 | |
| | | | |
Other | | | 0 | | | | 20,400,000 | | | | 0 | | | | 20,400,000 | |
| | | | |
Short-term investments | | | | | | | | | | | | | | | | |
| | | | |
Investment companies | | | 1,151,135 | | | | 0 | | | | 0 | | | | 1,151,135 | |
| | | | |
U.S. Treasury securities | | | 1,771,475 | | | | 0 | | | | 0 | | | | 1,771,475 | |
| | | | |
Total assets | | $ | 2,922,610 | | | $ | 4,188,618,534 | | | $ | 0 | | | $ | 4,191,541,144 | |
Additional sector, industry or geographic detail is included in the Portfolio of Investments.
At December 31, 2018, the Fund did not have any transfers into/out of Level 3.
4. TRANSACTIONS WITH AFFILIATES
Management fee
Funds Management, an indirect wholly owned subsidiary of Wells Fargo & Company (“Wells Fargo”), is the manager of the Fund and provides advisory and fund-level administrative services under an investment management agreement. Under the investment management agreement, Funds Management is responsible for, among other services, implementing the investment objectives and strategies of the Fund, supervising the subadviser and providing fund-level administrative services in connection with the Fund’s operations. As compensation for its services under the investment management agreement, Funds Management is entitled to receive an annual management fee starting at 0.35% and declining to 0.255% as the average daily net assets of the Fund increase. For the six months ended December 31, 2018, the management fee was equivalent to an annual rate of 0.33% of the Fund’s average daily net assets.
Funds Management has retained the services of a subadviser to provide daily portfolio management to the Fund. The fee for subadvisory services is borne by Funds Management. Wells Capital Management Incorporated, an affiliate of Funds Management and an indirect wholly owned subsidiary of Wells Fargo, is the subadviser to the Fund and is entitled to receive a fee from Funds Management at an annual rate starting at 0.15% and declining to 0.05% as the average daily net assets of the Fund increase.
Administration fee
Under a class-level administration agreement, Funds Management provides class-level administrative services to the Fund, which includes paying fees and expenses for services provided by the transfer agent, sub-transfer agents, omnibus account servicers and record-keepers. As compensation for its services under the class-level administration agreement, Funds Management receives an annual fee which is calculated based on the average daily net assets of each class as follows:
| | | | |
| | | Class-level
administration fee | |
| |
Class A, Class C | | | 0.16 | % |
| |
Class R6 | | | 0.03 | |
| |
Administrator Class | | | 0.10 | |
| |
Institutional Class | | | 0.08 | |
Funds Management has contractually waived and/or reimbursed management and administration fees to the extent necessary to maintain certain net operating expense ratios for the Fund. When each class of the Fund has exceeded its expense cap, Funds Management has waived fees and/or reimbursed expenses from fund level expenses on a
| | | | | | |
| Notes to financial statements (unaudited) | | Wells Fargo Short-Term Municipal Bond Fund | | | 49 | |
proportionate basis and then from class specific expenses; otherwise, waivers and/or reimbursements are applied against class specific expenses before fund level expenses. Funds Management has committed through October 31, 2019 to waive fees and/or reimburse expenses to the extent necessary to cap the Fund’s expenses at 0.63% for Class A shares, 1.38% for Class C shares, 0.35% for Class R6 shares, 0.60% for Administrator Class shares, and 0.40% for Institutional Class shares. After this time, the cap may be increased or the commitment to maintain the cap may be terminated only with the approval of the Board of Trustees.
Distribution fee
The Trust has adopted a distribution plan for Class C shares of the Fund pursuant to Rule 12b-1 under the 1940 Act. A distribution fee is charged to Class C shares and paid to Wells Fargo Funds Distributor, LLC (“Funds Distributor”), the principal underwriter, at an annual rate of 0.75% of the average daily net assets of Class C shares.
In addition, Funds Distributor is entitled to receive the front-end sales charge from the purchase of Class A shares and a contingent deferred sales charge on the redemption of certain Class A shares. Funds Distributor is also entitled to receive the contingent deferred sales charges from redemptions of Class C shares. For the six months ended December 31, 2018, Funds Distributor received $733 from the sale of Class A shares. No contingent deferred sales charges were incurred by Class A and Class C shares for the six months ended December 31, 2018.
Shareholder servicing fees
The Trust has entered into contracts with one or more shareholder servicing agents, whereby Class A, Class C, and Administrator Class of the Fund are charged a fee at an annual rate of 0.25% of the average daily net assets of each respective class.
A portion of these total shareholder servicing fees were paid to affiliates of Wells Fargo.
Interfund transactions
The Fund may purchase or sell portfolio investment securities to certain other Wells Fargo affiliates pursuant toRule 17a-7 under the 1940 Act and under procedures adopted by the Board of Trustees. The procedures have been designed to ensure that these interfund transactions, which do not incur broker commissions, are effected at current market prices. Pursuant to these procedures, the Fund had $234,075,000 and $350,875,000 in interfund purchases and sales, respectively, during the six months ended December 31, 2018.
5. INVESTMENT PORTFOLIO TRANSACTIONS
Purchases and sales of investments, excluding U.S. government obligations (if any) and short-term securities, for the six months ended December 31, 2018 were $898,903,320 and $1,035,895,441, respectively.
6. DERIVATIVE TRANSACTIONS
During the six months ended December 31, 2018, the Fund entered into futures contracts to take advantage of the differences between municipal and treasury yields and to help manage the duration of the portfolio. The Fund had an average notional amount of $308,309,362 in long futures contracts during the six months ended December 31, 2018.
The fair value, realized gains or losses and change in unrealized gains or losses, if any, on derivative instruments are reflected in the corresponding financial statement captions.
7. BANK BORROWINGS
The Trust (excluding the money market funds), Wells Fargo Master Trust and Wells Fargo Variable Trust are parties to a $280,000,000 revolving credit agreement whereby the Fund is permitted to use bank borrowings for temporary or emergency purposes, such as to fund shareholder redemption requests. Interest under the credit agreement is charged to the Fund based on a borrowing rate equal to the higher of the Federal Funds rate in effect on that day plus 1.25% or the overnight LIBOR rate in effect on that day plus 1.25%. In addition, an annual commitment fee equal to 0.25% of the unused balance is allocated to each participating fund.
For the six months ended December 31, 2018, there were no borrowings by the Fund under the agreement.
| | | | |
| 50 | | Wells Fargo Short-Term Municipal Bond Fund | | Notes to financial statements (unaudited) |
8. DISTRIBUTIONS TO SHAREHOLDERS
Effective for all filings after November 4, 2018, the Securities and Exchange Commission eliminated the requirement to separately state the components of distributions to shareholders under U.S. generally accounting principles. The amounts of distributions to shareholders for the year ended June 30, 2018 were as follows:
| | | | |
| | | Net investment
income | |
| |
Class A | | | $18,913,250 | |
| |
Class C | | | 329,883 | |
| |
Administrator Class | | | 776,666 | |
| |
Institutional Class | | | 55,986,581 | |
9. INDEMNIFICATION
Under the Trust’s organizational documents, the officers and Trustees have been granted certain indemnification rights against certain liabilities that may arise out of performance of their duties to the Trust. Additionally, in the normal course of business, the Trust may enter into contracts with service providers that contain a variety of indemnification clauses. The Trust’s maximum exposure under these arrangements is dependent on future claims that may be made against the Fund and, therefore, cannot be estimated.
10. NEW ACCOUNTING PRONOUNCEMENT
In August 2018, FASB issued Accounting Standards Update (“ASU”) No. 2018-13, Fair Value Measurement (Topic 820) Disclosure Framework—Changes to the Disclosure Requirements for Fair Value Measurement. ASU 2018-13 updates the disclosure requirements for fair value measurements by modifying or removing certain disclosures and adding certain new disclosures. The amendments are effective for fiscal years, and interim periods within those fiscal years, beginning after December 15, 2019. Early adoption is permitted. Management has adopted the removal and modification of disclosures early, as permitted, and will adopt the additional new disclosures at the effective date.
| | | | | | |
| Other information (unaudited) | | Wells Fargo Short-Term Municipal Bond Fund | | | 51 | |
PROXY VOTING INFORMATION
A description of the policies and procedures used to determine how to vote proxies relating to portfolio securities is available, upon request, by calling1-800-222-8222, visiting our website atwellsfargofunds.com, or visiting the SEC website at sec.gov. Information regarding how the Fund voted proxies relating to portfolio securities during the most recent 12-month period ended June 30 is available on the Fund’s website atwellsfargofunds.com or by visiting the SEC website at sec.gov.
PORTFOLIO HOLDINGS INFORMATION
The complete portfolio holdings for the Fund are publicly available monthly on the Fund’s website (wellsfargofunds.com), on a one-month delayed basis. In addition, top ten holdings information (excluding derivative positions) for the Fund is publicly available on the Fund’s website on a monthly, seven-day or more delayed basis. The Fund files its complete schedule of portfolio holdings with the SEC for the first and third quarters of each fiscal year on Form N-Q, which is available by visiting the SEC website at sec.gov. In addition, the Fund’s Form N-Q may be reviewed and copied at the SEC’s Public Reference Room in Washington, DC, and at regional offices in New York City, at 233 Broadway, and in Chicago, at 175 West Jackson Boulevard, Suite 900. Information about the Public Reference Room may be obtained by calling 1-800-SEC-0330.
| | | | |
| 52 | | Wells Fargo Short-Term Municipal Bond Fund | | Other information (unaudited) |
BOARD OF TRUSTEES AND OFFICERS
Each of the Trustees and Officers1 listed in the table below acts in identical capacities for each fund in the Wells Fargo family of funds, which consists of 152 mutual funds comprising the Wells Fargo Funds Trust, Wells Fargo Variable Trust, Wells Fargo Master Trust and four closed-end funds (collectively the “Fund Complex”). This table should be read in conjunction with the Prospectus and the Statement of Additional Information2. The mailing address of each Trustee and Officer is 525 Market Street, 12th Floor, San Francisco, CA 94105. Each Trustee and Officer serves an indefinite term, however, each Trustee serves such term until reaching the mandatory retirement age established by the Trustees.
Independent Trustees
| | | | | | |
Name and
year of birth | | Position held and
length of service* | | Principal occupations during past five years or longer | | Current other
public company or
investment company
directorships |
| | | |
William R. Ebsworth (Born 1957) | | Trustee, since 2015 | | Retired. From 1984 to 2013, equities analyst, portfolio manager, research director and chief investment officer at Fidelity Management and Research Company in Boston, Tokyo, and Hong Kong, and retired in 2013 as Chief Investment Officer of Fidelity Strategic Advisers, Inc. where he led a team of investment professionals managing client assets. Prior thereto, Board member of Hong Kong Securities Clearing Co., Hong Kong Options Clearing Corp., the Thailand International Fund, Ltd., Fidelity Investments Life Insurance Company, and Empire Fidelity Investments Life Insurance Company. Board member of the Vincent Memorial Hospital Endowment (non-profit organization), where he serves on the Investment Committee and as a Chair of the Audit Committee. Mr. Ebsworth is a CFA® charterholder. | | N/A |
| | | |
Jane A. Freeman (Born 1953) | | Trustee, since 2015; Chair Liaison, since 2018 | | Retired. From 2012 to 2014 and 1999 to 2008, Chief Financial Officer of Scientific Learning Corporation. From 2008 to 2012, Ms. Freeman provided consulting services related to strategic business projects. Prior to 1999, Portfolio Manager at Rockefeller & Co. and Scudder, Stevens & Clark. Board member of the Harding Loevner Funds from 1996 to 2014, serving as both Lead Independent Director and chair of the Audit Committee. Board member of the Russell Exchange Traded Funds Trust from 2011 to 2012 and the chair of the Audit Committee. Ms. Freeman is a Board Member of The Ruth Bancroft Garden (non-profit organization). She is also an inactive Chartered Financial Analyst. | | N/A |
| | | |
Isaiah Harris, Jr.3 (Born 1952) | | Trustee, since 2009; Audit Committee Chairman, since 2019 | | Retired. Chairman of the Board of CIGNA Corporation since 2009, and Director since 2005. From 2003 to 2011, Director of Deluxe Corporation. Prior thereto, President and CEO of BellSouth Advertising and Publishing Corp. from 2005 to 2007, President and CEO of BellSouth Enterprises from 2004 to 2005 and President of BellSouth Consumer Services from 2000 to 2003. Emeritus member of the Iowa State University Foundation Board of Governors. Emeritus Member of the Advisory Board of Iowa State University School of Business. Advisory Board Member, Palm Harbor Academy (private school). Advisory Board Member, Child Evangelism Fellowship (non-profit). Mr. Harris is a certified public accountant (inactive status). | | CIGNA Corporation |
| | | |
Judith M. Johnson3 (Born 1949) | | Trustee, since 2008; Audit Committee Chairman, from 2009 to 2018 | | Retired. Prior thereto, Chief Executive Officer and Chief Investment Officer of Minneapolis Employees Retirement Fund from 1996 to 2008. Ms. Johnson is an attorney, certified public accountant and a certified managerial accountant. | | N/A |
| | | |
David F. Larcker (Born 1950) | | Trustee, since 2009 | | James Irvin Miller Professor of Accounting at the Graduate School of Business, Stanford University, Director of the Corporate Governance Research Initiative and Senior Faculty of The Rock Center for Corporate Governance since 2006. From 2005 to 2008, Professor of Accounting at the Graduate School of Business, Stanford University. Prior thereto, Ernst & Young Professor of Accounting at The Wharton School, University of Pennsylvania from 1985 to 2005. | | N/A |
| | | | | | |
| Other information (unaudited) | | Wells Fargo Short-Term Municipal Bond Fund | | | 53 | |
| | | | | | |
Name and
year of birth | | Position held and
length of service* | | Principal occupations during past five years or longer | | Current other
public company or
investment company
directorships |
| | | |
Olivia S. Mitchell (Born 1953) | | Trustee, since 2006; Nominating and Governance Committee Chairman, since 2018 | | International Foundation of Employee Benefit Plans Professor, Wharton School of the University of Pennsylvania since 1993. Director of Wharton’s Pension Research Council and Boettner Center on Pensions & Retirement Research, and Research Associate at the National Bureau of Economic Research. Previously, Cornell University Professor from 1978 to 1993. | | N/A |
| | | |
Timothy J. Penny (Born 1951) | | Trustee, since 1996; Chairman, since 2018; Vice Chairman, from 2017 to 2018 | | President and Chief Executive Officer of Southern Minnesota Initiative Foundation, a non-profit organization, since 2007. Member of the Board of Trustees of NorthStar Education Finance, Inc., a non-profit organization, since 2007. | | N/A |
| | | |
James G. Polisson (Born 1959) | | Trustee, since 2018; Advisory Board Member, from 2017 to 2018 | | Retired. Chief Marketing Officer, Source (ETF) UK Services, Ltd, from 2015 to 2017. From 2012 to 2015, Principal of The Polisson Group, LLC, a management consulting, corporate advisory and principal investing company. Chief Executive Officer and Managing Director at Russell Investments, Global Exchange Traded Funds from 2010 to 2012. Managing Director of Barclays Global Investors from 1998 to 2010 and Global Chief Marketing Officer for iShares and Barclays Global Investors from 2000 to 2010. Trustee of the San Francisco Mechanics’ Institute, a non-profit organization, from 2013 to 2015. Board member of the Russell Exchange Traded Fund Trust from 2011 to 2012. Director of Barclays Global Investors Holdings Deutschland GmbH from 2006 to 2009. Mr. Polisson is an attorney and has a retired status with the Massachusetts and District of Columbia Bar Associations. | | N/A |
| | | |
Michael S. Scofield4 (Born 1943) | | Trustee, since 2010 | | Served on the Investment Company Institute’s Board of Governors and Executive Committee from 2008-2011 as well the Governing Council of the Independent Directors Council from 2006-2011 and the Independent Directors Council Executive Committee from 2008-2011. Trustee of the Evergreen Fund complex (and its predecessors) from 1984 to 2010. Chairman of the Evergreen Funds from 2000-2010. Former Trustee of the Mentor Funds. Retired Attorney, Law Offices of Michael S. Scofield. | | N/A |
| | | |
Pamela Wheelock (Born 1959) | | Trustee, since 2018; Advisory Board Member, from 2017 to 2018 | | Chief Operating Officer, Twin Cities Habitat for Humanity, since January, 2017. Vice President of University Services, University of Minnesota from 2012 to 2017. Prior thereto, on the Board of Directors, Governance Committee and Finance Committee for the Minnesota Philanthropy Partners (Saint Paul Foundation) from 2012 to 2018, Interim President and Chief Executive Officer of Blue Cross Blue Shield of Minnesota from 2010 to 2011, Chairman of the Board from 2009 to 2011 and Board Director from 2003 to 2015. Vice President, Leadership and Community Engagement, Bush Foundation, Saint Paul, Minnesota (a private foundation) from 2009 to 2011. Executive Vice President and Chief Financial Officer, Minnesota Sports and Entertainment from 2004 to 2009 and Senior Vice President from 2002 to 2004. Commissioner of Finance, State of Minnesota, from 1999 to 2002. Currently the Board Chair of the Minnesota Wild Foundation since 2010. | | N/A |
| * | Length of service dates reflect the Trustee’s commencement of service with the Trust’s predecessor entities, where applicable. |
| | | | |
| 54 | | Wells Fargo Short-Term Municipal Bond Fund | | Other information (unaudited) |
Officers
| | | | | | |
Name and
year of birth | | Position held and
length of service | | Principal occupations during past five years or longer | | |
| | | |
Andrew Owen (Born 1960) | | President, since 2017 | | Executive Vice President of Wells Fargo & Company and Head of Affiliated Managers, Wells Fargo Asset Management, since 2014. In addition, Mr. Owen is currently President, Chief Executive Officer and Director of Wells Fargo Funds Management, LLC since 2017. Prior thereto, Executive Vice President responsible for marketing, investments and product development for Wells Fargo Funds Management, LLC, from 2009 to 2014. | | |
| | | |
Nancy Wiser1 (Born 1967) | | Treasurer, since 2012 | | Executive Vice President of Wells Fargo Funds Management, LLC since 2011. Chief Operating Officer and Chief Compliance Officer at LightBox Capital Management LLC, from 2008 to 2011. | | |
| | | |
Alexander Kymn (Born 1973) | | Secretary, since 2018; Chief Legal Officer, since 2018 | | Senior Company Counsel of Wells Fargo Bank, N.A. since 2018 (previously Senior Counsel from 2007 to 2018). Vice President of Wells Fargo Funds Management, LLC from 2008 to 2014. | | |
| | | |
Michael H. Whitaker (Born 1967) | | Chief Compliance Officer, since 2016 | | Senior Vice President and Chief Compliance Officer since 2016. Senior Vice President and Chief Compliance Officer for Fidelity Investments from 2007 to 2016. | | |
| | | |
David Berardi (Born 1975) | | Assistant Treasurer, since 2009 | | Vice President of Wells Fargo Funds Management, LLC since 2009. Vice President of Evergreen Investment Management Company, LLC from 2008 to 2010. Manager of Fund Reporting and Control for Evergreen Investment Management Company, LLC from 2004 to 2010. | | |
| | | |
Jeremy DePalma1 (Born 1974) | | Assistant Treasurer, since 2009 | | Senior Vice President of Wells Fargo Funds Management, LLC since 2009. Senior Vice President of Evergreen Investment Management Company, LLC from 2008 to 2010 and head of the Fund Reporting and Control Team within Fund Administration from 2005 to 2010. | | |
| 1 | Nancy Wiser acts as Treasurer of 76 funds in the Fund Complex. Jeremy DePalma acts as Treasurer of 76 funds and Assistant Treasurer of 76 funds in the Fund Complex. |
| 2 | The Statement of Additional Information includes additional information about the Trustees and is available, without charge, upon request, by calling1-800-222-8222 or by visiting the website atwellsfargofunds.com. |
| 3 | Mr. Harris replaced Ms. Johnson as the Chairman of the Audit Committee effective January 1, 2019. |
| 4 | Mr. Scofield retired on December 31, 2018. |
| | | | | | |
| Appendix A (unaudited) | | Wells Fargo Short-Term Municipal Bond Fund | | | 55 | |
SALES CHARGE REDUCTIONS AND WAIVERS FOR CERTAIN INTERMEDIARIES
Raymond James & Associates, Inc., Raymond James Financial Services & Raymond James affiliates (“Raymond James”)
Effective on or about March 1, 2019, shareholders purchasing Fund shares through a Raymond James platform or account will be eligible only for the following load waivers (front-end sales charge waivers and contingent deferred, or back-end, sales charge waivers) and discounts, which may differ from those disclosed elsewhere in the Fund’s Prospectus or SAI.
Front-end Sales Load Waivers on Class A shares Available at Raymond James
| | • | | Shares purchased in an investment advisory program. |
| | • | | Shares purchased through reinvestment of capital gains distributions and dividend reinvestment when purchasing shares of the same fund (but not any other fund within the fund family). |
| | • | | Employees and registered representatives of Raymond James or its affiliates and their family members as designated by Raymond James. |
| | • | | Shares purchased from the proceeds of redemptions within the same fund family, provided (1) the repurchase occurs within 90 days following the redemption, (2) the redemption and purchase occur in the same account, and (3) redeemed shares were subject to a front-end or deferred sales load (known as Rights of Reinstatement). |
| | • | | A shareholder in the fund’s Class C shares will have their shares automatically exchanged at net asset value to Class A shares (or the appropriate share class) of the fund if the shares are no longer subject to a CDSC and the exchange is in line with the policies and procedures of Raymond James. |
CDSC Waivers on Class A and C Shares Available at Raymond James
| | • | | Death or disability of the shareholder. |
| | • | | Shares sold as part of a systematic withdrawal plan as described in the Fund’s Prospectus. |
| | • | | Return of excess contributions from an IRA Account. |
| | • | | Shares sold as part of a required minimum distribution for IRA and retirement accounts due to the shareholder reaching age 70½ as described in the Fund’s prospectus. |
| | • | | Shares sold to pay Raymond James fees but only if the transaction is initiated by Raymond James. |
| | • | | Shares acquired through a right of reinstatement. |
Front-end Load Discounts Available at Raymond James: Breakpoints, and/or Rights of Accumulation
| | • | | Breakpoints as described in the Fund’s Prospectus. |
| | • | | Rights of accumulation which entitle shareholders to breakpoint discounts will be automatically calculated based on the aggregated holding of fund family assets held by accounts within the purchaser’s household at Raymond James. Eligible fund family assets not held at Raymond James may be included in the rights of accumulation calculation only if the shareholder notifies his or her financial advisor about such assets. |
This page is intentionally left blank.

For more information
More information about Wells Fargo Funds is available free upon request. To obtain literature, please write, visit the Fund’s website, or call:
Wells Fargo Funds
P.O. Box 219967
Kansas City, MO 64121-9967
Website: wellsfargofunds.com
Individual investors: 1-800-222-8222
Retail investment professionals: 1-888-877-9275
Institutional investment professionals: 1-866-765-0778
This report and the financial statements contained herein are submitted for the general information of the shareholders of the Fund. If this report is used for promotional purposes, distribution of the report must be accompanied or preceded by a current prospectus. Before investing, please consider the investment objectives, risks, charges, and expenses of the investment. For a current prospectus and, if available, a summary prospectus, containing this information, call1-800-222-8222 or visit the Fund’s website atwellsfargofunds.com. Read the prospectus carefully before you invest or send money.
Wells Fargo Asset Management (WFAM) is the trade name for certain investment advisory/management firms owned by Wells Fargo & Company. These firms include but are not limited to Wells Capital Management Incorporated and Wells Fargo Funds Management, LLC. Certain products managed by WFAM entities are distributed by Wells Fargo Funds Distributor, LLC (a broker/dealer and Member FINRA).
This material is for general informational and educational purposes only and is NOT intended to provide investment advice or a recommendation of any kind—including a recommendation for any specific investment, strategy, or plan.
INVESTMENT PRODUCTS: NOT FDIC INSURED ◾ NO BANK GUARANTEE ◾ MAY LOSE VALUE
© 2019 Wells Fargo Funds Management, LLC. All rights reserved.
| | |
 | | 320451 02-19 SA256/SAR256 12-18 |
Semi-Annual Report
December 31, 2018

Wells Fargo Strategic Municipal Bond Fund

Beginning on January 1, 2021, as permitted by new regulations adopted by the Securities and Exchange Commission, paper copies of the Wells Fargo Funds’ annual and semi-annual shareholder reports issued after this date will no longer be sent by mail, unless you specifically request paper copies of the reports. Instead, the reports will be made available on the Funds’ website, and you will be notified by mail each time a report is posted and provided with a website address to access the report.
If you already elected to receive shareholder reports electronically, you will not be affected by this change and you need not take any action. You may elect to receive shareholder reports and other communications from the Fund electronically at any time by contacting your financial intermediary (such as a broker-dealer or bank) or, if you are a direct investor, by calling 1-800-222-8222 or by enrolling at wellsfargo.com/advantagedelivery.
You may elect to receive all future reports in paper free of charge. If you invest through a financial intermediary, you can contact your financial intermediary to request that you continue to receive paper copies of your shareholder reports; if you invest directly with the Fund, you can call 1-800-222-8222. Your election to receive reports in paper will apply to all Wells Fargo Funds held in your account with your financial intermediary or, if you are a direct investor, to all Wells Fargo Funds that you hold.

Reduce clutter. Save trees.
Sign up for electronic delivery of prospectuses and shareholder reports atwellsfargo.com/advantagedelivery
Contents
The views expressed and any forward-looking statements are as of December 31, 2018, unless otherwise noted, and are those of the Fund managers and/or Wells Fargo Funds Management, LLC. Discussions of individual securities, or the markets generally, or any Wells Fargo Fund are not intended as individual recommendations. Future events or results may vary significantly from those expressed in any forward-looking statements. The views expressed are subject to change at any time in response to changing circumstances in the market. Wells Fargo Funds Management, LLC and the Fund disclaim any obligation to publicly update or revise any views expressed or forward-looking statements.
INVESTMENT PRODUCTS: NOT FDIC INSURED ◾ NO BANK GUARANTEE ◾ MAY LOSE VALUE
| | | | |
| 2 | | Wells Fargo Strategic Municipal Bond Fund | | Letter to shareholders (unaudited) |

Andrew Owen
President
Wells Fargo Funds
Global trade tensions escalated during the third quarter of 2018.
Dear Shareholder:
We are pleased to offer you this semi-annual report for the Wells Fargo Strategic Municipal Bond Fund for the six-month period that ended December 31, 2018. During the reporting period, the U.S. generated encouraging economic and business data that was offset by less positive and more inconsistent data from international markets. Investment returns were generally negative as geopolitical tensions and uncertainty tended to distract investors from more favorable underlying trends.
For the period, U.S. stocks, as measured by the S&P 500 Index,1 fell 6.85% and international stocks, as measured by the MSCI ACWI ex USA Index (Net),2 declined 10.84%. Based on the MSCI EM Index (Net),3 emerging market stocks lost 8.48%. For bond investors, the Bloomberg Barclays U.S. Aggregate Bond Index4 gained 1.65% while the Bloomberg Barclays Global Aggregate ex-USD Index5 fell 0.84%. The Bloomberg Barclays Municipal Bond Index6 gained 1.53% while the ICE BofAML U.S. High Yield Index7 declined 2.34%.
Global trade tensions prompted investor concerns.
Global trade tensions escalated during the third quarter of 2018. The U.S. imposed tariffs on a wide range of products manufactured overseas. Foreign governments retaliated with tariffs that punished U.S. commodity producers and product manufacturers. Investors wondered about next steps as divergence in global economic policies and growth prospects widened.
During the summer months, the U.S. economy strengthened. Revised second-quarter gross domestic product (GDP) growth data released in August showed the U.S. economy growing at a 4.2% rate. The unemployment rate in the U.S. was 3.7% by the end of September, according to the U.S. Department of Labor. Wages showed more consistent growth, and consumer confidence remained strong. Several U.S. equity market indices reached records during August, with the S&P 500 Index gaining 7.71% for the three-month period that ended September 30, 2018. In contrast, the MSCI ACWI ex USA Index (Net) gained 0.71% while the MSCI EM Index (Net) declined 1.09% during the same three-month period.
| 1 | The S&P 500 Index consists of 500 stocks chosen for market size, liquidity, and industry group representation. It is a market-value-weighted index with each stock’s weight in the index proportionate to its market value. You cannot invest directly in an index. |
| 2 | The Morgan Stanley Capital International (MSCI) All Country World Index (ACWI) ex USA Index (Net) is a free-float-adjusted market-capitalization-weighted index that is designed to measure the equity market performance of developed markets, excluding the United States and Canada. Source: MSCI. MSCI makes no express or implied warranties or representations and shall have no liability whatsoever with respect to any MSCI data contained herein. The MSCI data may not be further redistributed or used as a basis for other indices or any securities or financial products. This report is not approved, reviewed, or produced by MSCI. You cannot invest directly in an index. |
| 3 | The MSCI Emerging Markets (EM) Index (Net) is a free-float-adjusted market-capitalization-weighted index that is designed to measure large- and mid-cap equity market performance of emerging markets. The MSCI EM Index (Net) consists of the following 24 emerging market country indices: Brazil, Chile, China, Colombia, Czech Republic, Egypt, Greece, Hungary, India, Indonesia, Korea, Malaysia, Mexico, Pakistan, Peru, the Philippines, Poland, Qatar, Russia, South Africa, Taiwan, Thailand, Turkey, and the United Arab Emirates. You cannot invest directly in an index. |
| 4 | The Bloomberg Barclays U.S. Aggregate Bond Index is a broad-based benchmark that measures the investment-grade, U.S. dollar-denominated, fixed-rate taxable bond market, including Treasuries, government-related and corporate securities, mortgage-backed securities (agency fixed-rate and hybrid adjustable-rate mortgage pass-throughs), asset-backed securities, and commercial mortgage-backed securities. You cannot invest directly in an index. |
| 5 | The Bloomberg Barclays Global Aggregate ex-USD Index is an unmanaged index that provides a broad-based measure of the global investment-grade fixed-income markets excluding the U.S. dollar-denominated debt market. You cannot invest directly in an index. |
| 6 | The Bloomberg Barclays Municipal Bond Index is an unmanaged index composed of long-term tax-exempt bonds with a minimum credit rating of Baa. You cannot invest directly in an index. |
| 7 | The ICE BofAML U.S. High Yield Index is a market-capitalization-weighted index of domestic and Yankee high-yield bonds. The index tracks the performance of high-yield securities traded in the U.S. bond market. You cannot invest directly in an index. Copyright 2018. ICE Data Indices, LLC. All rights reserved. |
| | | | | | |
| Letter to shareholders (unaudited) | | Wells Fargo Strategic Municipal Bond Fund | | | 3 | |
Economic signals overseas were mixed as the third quarter ended and the fourth quarter began. In particular, signs of slowing economic growth in China created uncertainty for investors. Amid rising trade tensions, the People’s Bank of China cut reserve requirement ratios and accelerated infrastructure spending and tax cuts for business enterprises and individuals. Nevertheless, a strengthening U.S. dollar and trade tensions remained headwinds for investors overseas.
Equity markets were volatile during the fourth quarter.
Negative stock market performance during October and December bracketed a mildly positive November, as measured by the S&P 500 Index and the MSCI ACWI ex USA Index (Net). As interest rates and bond yields gained during October, stock markets struggled. Readings on consumer sentiment and business spending were mixed. Markets rebounded in November. The U.S. and China agreed to halt further increases in tariffs and engage in additional negotiations. While November returns were positive, the loss for the full fourth quarter was substantial for equity investors globally, with the S&P down 13.52% and the MSCI ACWI ex USA Index (Net) down 11.46%. December’s S&P 500 Index performance was the lowest since 1931. Globally, fixed income investments fared better than stocks during the last two months of the year as conflicting signals unsettled investors’ outlooks.
Equity investors confronted a number of changing conditions. In November’smid-term elections, control of the U.S. House of Representatives shifted from Republicans to Democrats, presaging potential partisan disputes. Progress on Brexit negotiations stalled in the UK. In China, the value of the yuan declined to low levels last seen in 2008. Oil prices continued to fall. The Fed increased the federal funds rate by 25 bps to a target range of between 2.25% and 2.50% in December 2018. A late-December dispute over spending and immigration policy resulted in a partial U.S. government shutdown that continued through the end of the period.
Don’t let short-term uncertainty derail long-term investment goals.
Periods of investment uncertainty can present challenges, but experience has taught us that maintaining long-term investment goals can be an effective way to plan for the future. To help you create a sound strategy based on your personal goals and risk tolerance, Wells Fargo Funds offers more than 100 mutual funds spanning a wide range of asset classes and investment styles. Although diversification cannot guarantee an investment profit or prevent losses, we believe it can be an effective way to manage investment risk and potentially smooth out overall portfolio performance. We encourage investors to know their investments and to understand that appropriate levels of risk-taking may unlock opportunities.
Thank you for choosing to invest with Wells Fargo Funds. We appreciate your confidence in us and remain committed to helping you meet your financial needs.
Sincerely,

Andrew Owen
President
Wells Fargo Funds
Economic signals overseas were mixed as the third quarter ended and the fourth quarter began.
For further information about your Fund, contact your investment professional, visit our website atwellsfargofunds.com, or call us directly at1-800-222-8222.
| | | | |
| 4 | | Wells Fargo Strategic Municipal Bond Fund | | Performance highlights (unaudited) |
Investment objective
The Fund seeks current income exempt from regular federal income tax.
Manager
Wells Fargo Funds Management, LLC
Subadviser
Wells Capital Management Incorporated
Portfolio managers
Wendy Casetta
Lyle J. Fitterer, CFA®‡, CPA
Robert J. Miller
Average annual total returns (%) as of December 31, 2018
| | | | | | | | | | | | | | | | | | | | | | | | | | | | | | | | | | |
| | | | | Including sales charge | | | Excluding sales charge | | | Expense ratios1 (%) | |
| | | Inception date | | 1 year | | | 5 year | | | 10 year | | | 1 year | | | 5 year | | | 10 year | | | Gross | | | Net2 | |
| | | | | | | | | |
| Class A (VMPAX) | | 12-1-1994 | | | -2.03 | | | | 1.47 | | | | 2.65 | | | | 2.02 | | | | 2.31 | | | | 3.07 | | | | 0.82 | | | | 0.82 | |
| | | | | | | | | |
| Class C (DHICX) | | 8-18-1997 | | | 0.26 | | | | 1.54 | | | | 2.30 | | | | 1.26 | | | | 1.54 | | | | 2.30 | | | | 1.57 | | | | 1.57 | |
| | | | | | | | | |
| Class R63 | | 7-31-2018 | | | – | | | | – | | | | – | | | | 2.26 | | | | 2.44 | | | | 3.23 | | | | 0.44 | | | | 0.43 | |
| | | | | | | | | |
| Administrator Class (VMPYX) | | 10-6-1997 | | | – | | | | – | | | | – | | | | 2.15 | | | | 2.42 | | | | 3.22 | | | | 0.76 | | | | 0.68 | |
| | | | | | | | | |
| Institutional Class (STRIX)4 | | 11-30-2012 | | | – | | | | – | | | | – | | | | 2.48 | | | | 2.65 | | | | 3.36 | | | | 0.49 | | | | 0.48 | |
| | | | | | | | | |
| Bloomberg Barclays Short-Intermediate Municipal Bond Index5 | | – | | | – | | | | – | | | | – | | | | 1.69 | | | | 2.12 | | | | 2.99 | | | | – | | | | – | |
Figures quoted represent past performance, which is no guarantee of future results, and do not reflect taxes that a shareholder may pay on fund distributions or the redemption of fund shares. Investment return and principal value of an investment will fluctuate so that an investor’s shares, when redeemed, may be worth more or less than their original cost. Performance shown without sales charges would be lower if sales charges were reflected. Current performance may be lower or higher than the performance data quoted, which assumes the reinvestment of dividends and capital gains. Current month-end performance is available on the Fund’s website,wellsfargofunds.com.
Index returns do not include transaction costs associated with buying and selling securities, any mutual fund fees or expenses, or any taxes. It is not possible to invest directly in an index.
For Class A shares, the maximum front-end sales charge is 4.00%. For Class C shares, the maximum contingent deferred sales charge is 1.00%. Performance including a contingent deferred sales charge assumes the sales charge for the corresponding time period. Class R6, Administrator Class, and Institutional Class shares are sold without a front-end sales charge or contingent deferred sales charge.
Bond values fluctuate in response to the financial condition of individual issuers, general market and economic conditions, and changes in interest rates. Changes in market conditions and government policies may lead to periods of heightened volatility in the bond market and reduced liquidity for certain bonds held by the Fund. In general, when interest rates rise, bond values fall and investors may lose principal value. Interest rate changes and their impact on the Fund and its share price can be sudden and unpredictable. High-yield securities have a greater risk of default and tend to be more volatile than higher-rated debt securities. The use of derivatives may reduce returns and/or increase volatility. Certain investment strategies tend to increase the total risk of an investment (relative to the broader market). The Fund is exposed to municipal securities risk. Consult the Fund’s prospectus for additional information on these and other risks. A portion of the Fund’s income may be subject to federal, state, and/or local income taxes or the Alternative Minimum Tax (AMT). Any capital gains distributions may be taxable.
Please see footnotes on page 5.
| | | | | | |
| Performance highlights (unaudited) | | Wells Fargo Strategic Municipal Bond Fund | | | 5 | |
|
| Effective maturity distribution as of December 31, 20186 |
|
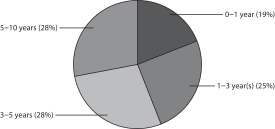 |
|
| Credit quality as of December 31, 20187 |
|
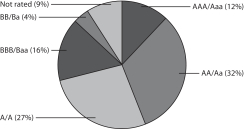 |
| ‡ | CFA® and Chartered Financial Analyst® are trademarks owned by CFA Institute. |
| 1 | Reflects the expense ratios as stated in the most recent prospectuses. The expense ratios shown are subject to change and may differ from the annualized expense ratios shown in the financial highlights of this report. |
| 2 | The manager has contractually committed through October 31, 2019, to waive fees and/or reimburse expenses to the extent necessary to cap the Fund’s Total Annual Fund Operating Expenses After Fee Waivers at the amounts shown. After this time, the cap may be increased or the commitment to maintain the cap may be terminated only with the approval of the Board of Trustees. Brokerage commissions, stamp duty fees, interest, taxes, acquired fund fees and expenses (if any), and extraordinary expenses are excluded from the expense cap. Without this cap, the Fund’s returns would have been lower. The expense ratio paid by an investor is the net expense ratio (the total annual fund operating expenses after fee waivers) as stated in the prospectuses. |
| 3 | Historical performance shown for Class R6 shares prior to their inception reflects the performance of the Institutional Class shares, and includes the higher expenses applicable to Institutional Class shares. If these expenses had not been included, returns for Class R6 shares would be higher. |
| 4 | Historical performance shown for the Institutional Class shares prior to their inception reflects the performance of the Administrator Class shares, and includes the higher expenses applicable to the Administrator Class shares. If these expenses had not been included, returns for Institutional Class shares would be higher. |
| 5 | The Bloomberg Barclays Short-Intermediate Municipal Bond Index is a rules-based, market-value-weighted index composed of publicly traded municipal bonds that cover the U.S. dollar–denominated short-term tax-exempt bond market, including state and local general obligation bonds, revenue bonds, insured bonds, and prefunded bonds. You cannot invest directly in an index. |
| 6 | Amounts are calculated based on the total long-term investments of the Fund. These amounts are subject to change and may have changed since the date specified. |
| 7 | The credit quality distribution of portfolio holdings reflected in the chart is based on ratings from Standard & Poor’s, Moody’s Investors Service, and/ or Fitch Ratings Ltd. Credit quality ratings apply to the underlying holdings of the Fund and not to the Fund itself. The percentages of the Fund’s portfolio with the ratings depicted in the chart are calculated based on the total market value of fixed income securities held by the Fund. If a security was rated by all three rating agencies, the middle rating was utilized. If rated by two of three rating agencies, the lower rating was utilized, and if rated by one of the rating agencies, that rating was utilized. Standard & Poor’s rates the creditworthiness of bonds, ranging from AAA (highest) to D (lowest). Ratings from A to CCC may be modified by the addition of a plus (+) or minus (-) sign to show relative standing within the rating categories. Standard & Poor’s rates the creditworthiness of short-term notes from SP-1 (highest) to SP-3 (lowest). Moody’s rates the creditworthiness of bonds, ranging from Aaa (highest) to C (lowest). Ratings Aa to B may be modified by the addition of a number 1 (highest) to 3 (lowest) to show relative standing within the ratings categories. Moody’s rates the creditworthiness of short-term U.S. tax-exempt municipal securities from MIG 1/VMIG 1 (highest) to SG (lowest). Fitch rates the creditworthiness of bonds, ranging from AAA (highest) to D (lowest). Credit quality distribution is subject to change and may have changed since the date specified. |
| | | | |
| 6 | | Wells Fargo Strategic Municipal Bond Fund | | Fund expenses (unaudited) |
As a shareholder of the Fund, you incur two types of costs: (1) transaction costs, including sales charges (loads) on purchase payments and contingent deferred sales charges (if any) on redemptions and (2) ongoing costs, including management fees, distribution (12b-1) and/or shareholder servicing fees, and other Fund expenses. This example is intended to help you understand your ongoing costs (in dollars) of investing in the Fund and to compare these costs with the ongoing costs of investing in other mutual funds.
The example is based on an investment of $1,000 invested at the beginning of the six-month period and held for the entire period from July 1, 2018 to December 31, 2018.
Actual expenses
The “Actual” line of the table below provides information about actual account values and actual expenses. You may use the information in this line, together with the amount you invested, to estimate the expenses that you paid over the period. Simply divide your account value by $1,000 (for example, an $8,600 account value divided by $1,000 = 8.6), then multiply the result by the number in the “Actual” line under the heading entitled “Expenses paid during period” for your applicable class of shares to estimate the expenses you paid on your account during this period.
Hypothetical example for comparison purposes
The “Hypothetical” line of the table below provides information about hypothetical account values and hypothetical expenses based on the Fund’s actual expense ratio and an assumed rate of return of 5% per year before expenses, which is not the Fund’s actual return. The hypothetical account values and expenses may not be used to estimate the actual ending account balance or expenses you paid for the period. You may use this information to compare the ongoing costs of investing in the Fund and other funds. To do so, compare this 5% hypothetical example with the 5% hypothetical examples that appear in the shareholder reports of the other funds.
Please note that the expenses shown in the table are meant to highlight your ongoing costs only and do not reflect any transactional costs, such as sales charges (loads) and contingent deferred sales charges. Therefore, the “Hypothetical” line of the table is useful in comparing ongoing costs only and will not help you determine the relative total costs of owning different funds. In addition, if these transactional costs were included, your costs would have been higher.
| | | | | | | | | | | | | | | | |
| | | Beginning
account value
7-1-2018 | | | Ending
account value
12-31-2018 | | | Expenses
paid during
the period¹ | | | Annualized net
expense ratio | |
Class A | | | | | | | | | | | | | | | | |
| | | | |
Actual | | $ | 1,000.00 | | | $ | 1,013.27 | | | $ | 4.06 | | | | 0.80 | % |
| | | | |
Hypothetical (5% return before expenses) | | $ | 1,000.00 | | | $ | 1,021.17 | | | $ | 4.08 | | | | 0.80 | % |
Class C | | | | | | | | | | | | | | | | |
| | | | |
Actual | | $ | 1,000.00 | | | $ | 1,009.44 | | | $ | 7.85 | | | | 1.55 | % |
| | | | |
Hypothetical (5% return before expenses) | | $ | 1,000.00 | | | $ | 1,017.39 | | | $ | 7.88 | | | | 1.55 | % |
Class R6 | | | | | | | | | | | | | | | | |
| | | | |
Actual | | $ | 1,000.00 | | | $ | 1,013.80 | | | $ | 2.13 | | | | 0.42 | % |
| | | | |
Hypothetical (5% return before expenses) | | $ | 1,000.00 | | | $ | 1,023.09 | | | $ | 2.14 | | | | 0.42 | % |
Administrator Class | | | | | | | | | | | | | | | | |
| | | | |
Actual | | $ | 1,000.00 | | | $ | 1,012.77 | | | $ | 3.45 | | | | 0.68 | % |
| | | | |
Hypothetical (5% return before expenses) | | $ | 1,000.00 | | | $ | 1,021.78 | | | $ | 3.47 | | | | 0.68 | % |
Institutional Class | | | | | | | | | | | | | | | | |
| | | | |
Actual | | $ | 1,000.00 | | | $ | 1,014.96 | | | $ | 2.39 | | | | 0.47 | % |
| | | | |
Hypothetical (5% return before expenses) | | $ | 1,000.00 | | | $ | 1,022.84 | | | $ | 2.40 | | | | 0.47 | % |
| 1 | Expenses paid is equal to the annualized net expense ratio of each class multiplied by the average account value over the period, multiplied by the number of days in the most recent fiscal half-year divided by the number of days in the fiscal year (to reflect the one-half-year period). |
| | | | | | |
| Portfolio of investments—December 31, 2018 (unaudited) | | Wells Fargo Strategic Municipal Bond Fund | | | 7 | |
| | | | | | | | | | | | | | | | |
| Security name | | Interest rate | | | Maturity date | | | Principal | | | Value | |
|
Municipal Obligations: 98.00% | |
| | | | |
Alabama: 1.45% | | | | | | | | | | | | | | | | |
| | | | |
| GO Revenue: 0.05% | | | | | | | | | | | | | | | | |
| | | | |
Jefferson County AL Series A | | | 4.90 | % | | | 4-1-2021 | | | $ | 1,060,000 | | | $ | 1,082,864 | |
| | | | | | | | | | | | | | | | |
| | | | |
| Health Revenue: 0.25% | | | | | | | | | | | | | | | | |
| | | | |
Birmingham AL Special Care Facilities Ascension Senior Credit Group Series C-1 | | | 1.85 | | | | 11-15-2046 | | | | 5,250,000 | | | | 5,143,058 | |
| | | | | | | | | | | | | | | | |
| | | | |
| Utilities Revenue: 1.15% | | | | | | | | | | | | | | | | |
| | | | |
Alabama Black Belt Energy Gas District Series A | | | 4.00 | | | | 12-1-2048 | | | | 2,000,000 | | | | 2,087,860 | |
| | | | |
Southeast Alabama Gas Supply District Project #2 Series A | | | 4.00 | | | | 6-1-2049 | | | | 16,505,000 | | | | 17,256,143 | |
| | | | |
SouthEast Alabama Gas Supply District Series A | | | 4.00 | | | | 4-1-2049 | | | | 4,410,000 | | | | 4,607,127 | |
| |
| | | | 23,951,130 | |
| | | | | | | | | | | | | | | | |
| |
| | | | 30,177,052 | |
| | | | | | | | | | | | | | | | |
| | | | |
Alaska: 0.68% | | | | | | | | | | | | | | | | |
| | | | |
| Health Revenue: 0.29% | | | | | | | | | | | | | | | | |
| | | | |
Alaska IDA Loan Anticipation YKHC Project | | | 3.50 | | | | 12-1-2020 | | | | 6,000,000 | | | | 6,045,000 | |
| | | | | | | | | | | | | | | | |
| | | | |
| Industrial Development Revenue: 0.20% | | | | | | | | | | | | | | | | |
| | | | |
Valdez AK Marine Terminal BP Pipelines Project Series B | | | 5.00 | | | | 1-1-2021 | | | | 4,000,000 | | | | 4,214,960 | |
| | | | | | | | | | | | | | | | |
| | | | |
| Utilities Revenue: 0.19% | | | | | | | | | | | | | | | | |
| | | | |
Alaska Industrial Development & Export Authority Power Refunding Bonds Snettisham Hydroelectric Project Series 2015 | | | 5.00 | | | | 1-1-2022 | | | | 1,735,000 | | | | 1,835,717 | |
| | | | |
Alaska Industrial Development & Export Authority Power Refunding Bonds Snettisham Hydroelectric Project Series 2015 | | | 5.00 | | | | 1-1-2023 | | | | 1,995,000 | | | | 2,140,256 | |
| |
| | | | 3,975,973 | |
| | | | | | | | | | | | | | | | |
| |
| | | | 14,235,933 | |
| | | | | | | | | | | | | | | | |
| | | | |
Arizona: 3.53% | | | | | | | | | | | | | | | | |
| | | | |
| Education Revenue: 0.71% | | | | | | | | | | | | | | | | |
| | | | |
Arizona IDA Agribusiness & Equine Center Incorporated Project Series 2017B 144A | | | 4.00 | | | | 3-1-2027 | | | | 1,225,000 | | | | 1,174,971 | |
| | | | |
Maricopa County AZ IDA Educational Horizon Community Learning Center Project | | | 2.63 | | | | 7-1-2021 | | | | 1,605,000 | | | | 1,567,234 | |
| | | | |
Phoenix AZ IDA BASIS Schools Incorporated Project Series A 144A | | | 3.00 | | | | 7-1-2020 | | | | 1,550,000 | | | | 1,535,476 | |
| | | | |
Phoenix AZ IDA Great Hearts Academies Project | | | 5.20 | | | | 7-1-2022 | | | | 450,000 | | | | 473,342 | |
| | | | |
Phoenix AZ IDA Legacy Traditional School Project Series 2015 144A | | | 3.00 | | | | 7-1-2020 | | | | 570,000 | | | | 564,819 | |
| | | | |
Pima County AZ IDA American Leadership Academy Project Series 2015 144A | | | 4.60 | | | | 6-15-2025 | | | | 1,255,000 | | | | 1,285,220 | |
| | | | |
Pima County AZ IDA Charter Schools Project Series 2013 | | | 4.50 | | | | 7-1-2020 | | | | 530,000 | | | | 543,722 | |
| | | | |
Pima County AZ IDA Charter Schools Project Series 2013 | | | 4.50 | | | | 7-1-2021 | | | | 1,300,000 | | | | 1,354,808 | |
| | | | |
Pima County AZ IDA Charter Schools Project Series 2013 | | | 4.50 | | | | 7-1-2022 | | | | 1,355,000 | | | | 1,427,072 | |
| | | | |
Pima County AZ IDA New Plan Learning Project Series A | | | 7.75 | | | | 7-1-2035 | | | | 985,000 | | | | 986,527 | |
| | | | |
Pima County AZ IDA New Plan Learning Project Series A | | | 8.13 | | | | 7-1-2041 | | | | 2,950,000 | | | | 2,952,272 | |
| | | | |
Pima County AZ IDA Noah Webster Schools Project Series A | | | 5.50 | | | | 12-15-2023 | | | | 955,000 | | | | 972,753 | |
| |
| | | | 14,838,216 | |
| | | | | | | | | | | | | | | | |
The accompanying notes are an integral part of these financial statements.
| | | | |
| 8 | | Wells Fargo Strategic Municipal Bond Fund | | Portfolio of investments—December 31, 2018 (unaudited) |
| | | | | | | | | | | | | | | | |
| Security name | | Interest rate | | | Maturity date | | | Principal | | | Value | |
| | | | |
| GO Revenue: 1.41% | | | | | | | | | | | | | | | | |
| | | | |
Phoenix AZ | | | 5.00 | % | | | 7-1-2027 | | | $ | 22,515,000 | | | $ | 26,729,133 | |
| | | | |
Verrado AZ Community Facilities District #1 Series A 144A | | | 4.25 | | | | 7-15-2019 | | | | 1,320,000 | | | | 1,326,428 | |
| | | | |
Verrado AZ Community Facilities District #1 Series A 144A | | | 5.00 | | | | 7-15-2020 | | | | 700,000 | | | | 712,600 | |
| | | | |
Verrado AZ Community Facilities District #1 Series A 144A | | | 5.00 | | | | 7-15-2021 | | | | 500,000 | | | | 512,290 | |
| |
| | | | 29,280,451 | |
| | | | | | | | | | | | | | | | |
| | | | |
| Health Revenue: 0.80% | | | | | | | | | | | | | | | | |
| | | | |
Arizona Health Facilities Authority Catholic West Series B (Barclays Bank LOC) ø | | | 1.70 | | | | 7-1-2035 | | | | 9,260,000 | | | | 9,260,000 | |
| | | | |
Maricopa County AZ IDA Senior Living Facilities Christian Care Retirement Apartments Incorporated Project | | | 5.00 | | | | 1-1-2022 | | | | 1,065,000 | | | | 1,155,802 | |
| | | | |
Maricopa County AZ IDA Senior Living Facilities Christian Care Retirement Apartments Incorporated Project | | | 5.00 | | | | 1-1-2023 | | | | 1,120,000 | | | | 1,239,291 | |
| | | | |
Maricopa County AZ IDA Senior Living Facilities Christian Care Surprise Incorporated Project 144A | | | 5.00 | | | | 1-1-2026 | | | | 3,205,000 | | | | 3,156,733 | |
| | | | |
Tempe AZ IDA Mirabella Arizona State University Project Series B1 144A | | | 4.00 | | | | 10-1-2023 | | | | 1,810,000 | | | | 1,811,430 | |
| |
| | | | 16,623,256 | |
| | | | | | | | | | | | | | | | |
| | | | |
| Miscellaneous Revenue: 0.61% | | | | | | | | | | | | | | | | |
| | | | |
Navajo Nation AZ Series A 144A | | | 4.00 | | | | 12-1-2022 | | | | 6,345,000 | | | | 6,528,942 | |
| | | | |
Navajo Nation AZ Series A 144A | | | 5.00 | | | | 12-1-2025 | | | | 4,110,000 | | | | 4,464,282 | |
| | | | |
Navajo Nation AZ Tribal Utility Authority (Municipal Government Guaranty Insured) | | | 4.00 | | | | 1-1-2021 | | | | 1,573,000 | | | | 1,587,991 | |
| |
| | | | 12,581,215 | |
| | | | | | | | | | | | | | | | |
| |
| | | | 73,323,138 | |
| | | | | | | | | | | | | | | | |
| | | | |
Arkansas: 0.23% | | | | | | | | | | | | | | | | |
| | | | |
| Health Revenue: 0.23% | | | | | | | | | | | | | | | | |
| | | | |
Boone County AR Hospital Construction Series 2006 (Bank of Oklahoma Financial NA LOC) ø | | | 3.00 | | | | 5-1-2037 | | | | 4,700,000 | | | | 4,700,000 | |
| | | | | | | | | | | | | | | | |
| | | | |
California: 1.51% | | | | | | | | | | | | | | | | |
| | | | |
| Education Revenue: 0.05% | | | | | | | | | | | | | | | | |
| | | | |
California Municipal Finance Authority Charter School Nova Academy Project Series 2016A 144A | | | 4.00 | | | | 6-15-2026 | | | | 890,000 | | | | 891,317 | |
| | | | |
California School Finance Authority Charter School Rocketship Education Obligated Group Series 2017A 144A | | | 4.50 | | | | 6-1-2027 | | | | 250,000 | | | | 256,973 | |
| |
| | | | 1,148,290 | |
| | | | | | | | | | | | | | | | |
| | | | |
| GO Revenue: 0.02% | | | | | | | | | | | | | | | | |
| | | | |
Delhi CA Unified School District CAB (Ambac Insured) (z) | | | 5.16 | | | | 8-1-2019 | | | | 475,000 | | | | 470,136 | |
| | | | | | | | | | | | | | | | |
| | | | |
| Health Revenue: 0.48% | | | | | | | | | | | | | | | | |
| | | | |
California Statewide CDA Health Facilities Catholic Series D (AGM Insured) (m) | | | 2.01 | | | | 7-1-2041 | | | | 8,700,000 | | | | 8,700,000 | |
| | | | |
Palomar CA Health Refunding Bond Series 2016 | | | 4.00 | | | | 11-1-2019 | | | | 1,250,000 | | | | 1,264,513 | |
| |
| | | | 9,964,513 | |
| | | | | | | | | | | | | | | | |
| | | | |
| Industrial Development Revenue: 0.17% | | | | | | | | | | | | | | | | |
| | | | |
California PCFA AMT Calplant I Project 144A | | | 7.50 | | | | 7-1-2032 | | | | 3,500,000 | | | | 3,605,910 | |
| | | | | | | | | | | | | | | | |
The accompanying notes are an integral part of these financial statements.
| | | | | | |
| Portfolio of investments—December 31, 2018 (unaudited) | | Wells Fargo Strategic Municipal Bond Fund | | | 9 | |
| | | | | | | | | | | | | | | | |
| Security name | | Interest rate | | | Maturity date | | | Principal | | | Value | |
| | | | |
| Miscellaneous Revenue: 0.22% | | | | | | | | | | | | | | | | |
| | | | |
Compton CA PFA Lease 144A | | | 4.00 | % | | | 9-1-2022 | | | $ | 4,440,000 | | | $ | 4,503,670 | |
| | | | | | | | | | | | | | | | |
|
| Transportation Revenue: 0.57% | |
| | | | |
California Bay Area Toll Authority Toll Bridge Series E-3 (SIFMA Municipal Swap +0.70%) ± | | | 2.41 | | | | 4-1-2047 | | | | 11,750,000 | | | | 11,758,813 | |
| | | | | | | | | | | | | | | | |
| |
| | | | 31,451,332 | |
| | | | | | | | | | | | | | | | |
| | | | |
Colorado: 1.78% | | | | | | | | | | | | | | | | |
| | | | |
| Education Revenue: 0.56% | | | | | | | | | | | | | | | | |
| | | | |
Colorado ECFA Eagle Ridge Academy Project 144A | | | 3.63 | | | | 11-1-2026 | | | | 2,260,000 | | | | 2,194,279 | |
| | | | |
Colorado ECFA Rocky Mountain Classical Academy Project | | | 6.38 | | | | 9-1-2023 | | | | 1,445,000 | | | | 1,600,338 | |
| | | | |
Colorado ECFA Vanguard School Project | | | 4.00 | | | | 6-15-2021 | | | | 250,000 | | | | 259,945 | |
| | | | |
Colorado ECFA Vanguard School Project | | | 4.00 | | | | 6-15-2022 | | | | 515,000 | | | | 541,250 | |
| | | | |
Colorado ECFA Windsor Charter Academy 144A | | | 3.88 | | | | 9-1-2026 | | | | 1,140,000 | | | | 1,094,240 | |
| | | | |
Colorado School of Mines Institutional Enterprise Refunding Bonds Series A (1 Month LIBOR +0.50%) ± | | | 2.07 | | | | 2-1-2023 | | | | 5,915,000 | | | | 5,896,486 | |
| |
| | | | 11,586,538 | |
| | | | | | | | | | | | | | | | |
| | | | |
| GO Revenue: 0.09% | | | | | | | | | | | | | | | | |
| | | | |
Centennial CO Southglenn Metropolitan District | | | 3.00 | | | | 12-1-2021 | | | | 668,000 | | | | 657,185 | |
| | | | |
Grand River CO Hospital District (AGM Insured) | | | 5.00 | | | | 12-1-2025 | | | | 1,000,000 | | | | 1,154,320 | |
| |
| | | | 1,811,505 | |
| | | | | | | | | | | | | | | | |
| | | | |
| Health Revenue: 0.96% | | | | | | | | | | | | | | | | |
| | | | |
Colorado Health Facilities Authority Catholic Health Initiatives Series 2009A | | | 5.50 | | | | 7-1-2034 | | | | 10,000,000 | | | | 10,170,800 | |
| | | | |
Colorado Health Facilities Authority Catholic Health Initiatives Series 2011A | | | 5.00 | | | | 2-1-2022 | | | | 3,415,000 | | | | 3,600,981 | |
| | | | |
Colorado Health Facilities Authority Catholic Health Initiatives Series 2011A | | | 5.25 | | | | 2-1-2031 | | | | 5,150,000 | | | | 5,410,281 | |
| | | | |
Colorado Health Facilities Authority Christian Living Neighborhoods Project | | | 4.00 | | | | 1-1-2019 | | | | 385,000 | | | | 385,000 | |
| | | | |
Colorado Health Facilities Authority Christian Living Neighborhoods Project | | | 4.00 | | | | 1-1-2020 | | | | 450,000 | | | | 454,554 | |
| |
| | | | 20,021,616 | |
| | | | | | | | | | | | | | | | |
| | | | |
| Tax Revenue: 0.17% | | | | | | | | | | | | | | | | |
| | | | |
Centerra CO Metropolitan District #1 Series 2017 144A | | | 5.00 | | | | 12-1-2021 | | | | 1,440,000 | | | | 1,514,736 | |
| | | | |
Centerra CO Metropolitan District #1 Series 2017 144A | | | 5.00 | | | | 12-1-2022 | | | | 1,940,000 | | | | 2,062,220 | |
| |
| | | | 3,576,956 | |
| | | | | | | | | | | | | | | | |
| |
| | | | 36,996,615 | |
| | | | | | | | | | | | | | | | |
| | | | |
Connecticut: 1.90% | | | | | | | | | | | | | | | | |
| | | | |
| Education Revenue: 0.34% | | | | | | | | | | | | | | | | |
| | | | |
Connecticut HEFAR Yale University Series A | | | 2.05 | | | | 7-1-2035 | | | | 7,000,000 | | | | 7,020,580 | |
| | | | | | | | | | | | | | | | |
| | | | |
| GO Revenue: 0.47% | | | | | | | | | | | | | | | | |
| | | | |
Connecticut Series D (SIFMA Municipal Swap +0.92%) ± | | | 2.63 | | | | 9-15-2019 | | | | 3,345,000 | | | | 3,356,975 | |
| | | | |
Hamden CT Refunding Bond | | | 5.00 | | | | 8-15-2019 | | | | 1,835,000 | | | | 1,870,819 | |
| | | | |
Hartford CT Series A | | | 5.00 | | | | 4-1-2025 | | | | 2,500,000 | | | | 2,723,800 | |
| | | | |
Hartford CT Series A | | | 5.00 | | | | 4-1-2027 | | | | 1,650,000 | | | | 1,780,515 | |
| |
| | | | 9,732,109 | |
| | | | | | | | | | | | | | | | |
The accompanying notes are an integral part of these financial statements.
| | | | |
| 10 | | Wells Fargo Strategic Municipal Bond Fund | | Portfolio of investments—December 31, 2018 (unaudited) |
| | | | | | | | | | | | | | | | |
| Security name | | Interest rate | | | Maturity date | | | Principal | | | Value | |
| | | | |
| Health Revenue: 0.03% | | | | | | | | | | | | | | | | |
| | | | |
Connecticut HEFA Bridgeport Hospital Series D | | | 5.00 | % | | | 7-1-2020 | | | $ | 500,000 | | | $ | 523,715 | |
| | | | | | | | | | | | | | | | |
|
| Miscellaneous Revenue: 0.13% | |
| | | | |
Connecticut Series A (SIFMA Municipal Swap +0.75%) ± | | | 2.46 | | | | 3-1-2021 | | | | 2,700,000 | | | | 2,704,590 | |
| | | | | | | | | | | | | | | | |
| | | | |
| Tax Revenue: 0.93% | | | | | | | | | | | | | | | | |
| | | | |
Connecticut State Special Tax Obligation Revenue Transportation Infrastructure Purpose | | | 5.00 | | | | 10-1-2030 | | | | 3,000,000 | | | | 3,451,560 | |
| | | | |
Connecticut State Special Tax Obligation Revenue Transportation Infrastructure Purpose | | | 5.00 | | | | 10-1-2031 | | | | 9,000,000 | | | | 10,281,780 | |
| | | | |
Connecticut State Special Tax Obligation Revenue Transportation Infrastructure Purpose | | | 5.00 | | | | 10-1-2032 | | | | 5,000,000 | | | | 5,698,650 | |
| |
| | | | 19,431,990 | |
| | | | | | | | | | | | | | | | |
| |
| | | | 39,412,984 | |
| | | | | | | | | | | | | | | | |
| | | | |
Delaware: 0.10% | | | | | | | | | | | | | | | | |
| | | | |
| Education Revenue: 0.10% | | | | | | | | | | | | | | | | |
| | | | |
Delaware EDA Odyssey Charter School Project Series A 144A | | | 6.25 | | | | 9-1-2025 | | | | 1,960,000 | | | | 2,046,162 | |
| | | | | | | | | | | | | | | | |
| | | | |
District of Columbia: 2.16% | | | | | | | | | | | | | | | | |
| | | | |
| Housing Revenue: 2.16% | | | | | | | | | | | | | | | | |
| | | | |
District of Columbia HFA Hilltop Apartments Project Series 2017 | | | 1.94 | | | | 1-1-2021 | | | | 5,850,000 | | | | 5,841,401 | |
| | | | |
District of Columbia HFA Wah Luck House Apartments Project Series 2017 | | | 1.72 | | | | 2-1-2020 | | | | 39,000,000 | | | | 38,991,420 | |
| |
| | | | 44,832,821 | |
| | | | | | | | | | | | | | | | |
| | | | |
Florida: 1.07% | | | | | | | | | | | | | | | | |
| | | | |
| Education Revenue: 0.11% | | | | | | | | | | | | | | | | |
| | | | |
Capital Trust Agency Educational Facilities Renaissance Charter School Projects Series 2017A 144A | | | 4.38 | | | | 6-15-2027 | | | | 1,355,000 | | | | 1,307,141 | |
| | | | |
Miami-Dade County FL IDA Youth Charter Schools Project Series 2015A 144A | | | 5.00 | | | | 9-15-2025 | | | | 900,000 | | | | 907,578 | |
| |
| | | | 2,214,719 | |
| | | | | | | | | | | | | | | | |
| | | | |
| Health Revenue: 0.30% | | | | | | | | | | | | | | | | |
| | | | |
Lakeland FL Hospital System Lakeland Regional Health System | | | 5.00 | | | | 11-15-2022 | | | | 4,495,000 | | | | 4,842,688 | |
| | | | |
Sarasota County FL Health Facilities Authority Village on the Isle Project | | | 4.00 | | | | 1-1-2020 | | | | 1,485,000 | | | | 1,497,994 | |
| |
| | | | 6,340,682 | |
| | | | | | | | | | | | | | | | |
| | | | |
| Housing Revenue: 0.26% | | | | | | | | | | | | | | | | |
| | | | |
University of West Florida Foundation Incorporated Dormitory Series A | | | 5.00 | | | | 6-1-2020 | | | | 1,210,000 | | | | 1,250,632 | |
| | | | |
University of West Florida Foundation Incorporated Dormitory Series A | | | 5.00 | | | | 6-1-2021 | | | | 1,265,000 | | | | 1,334,271 | |
| | | | |
University of West Florida Foundation Incorporated Dormitory Series A | | | 5.00 | | | | 6-1-2022 | | | | 1,325,000 | | | | 1,424,985 | |
| | | | |
University of West Florida Foundation Incorporated Dormitory Series A | | | 5.00 | | | | 6-1-2023 | | | | 1,190,000 | | | | 1,303,597 | |
| |
| | | | 5,313,485 | |
| | | | | | | | | | | | | | | | |
| | | | |
| Miscellaneous Revenue: 0.18% | | | | | | | | | | | | | | | | |
| | | | |
Florida Village Community Development District #10 Special Assignment | | | 5.13 | | | | 5-1-2024 | | | | 2,655,000 | | | | 2,818,442 | |
| | | | |
Wildwood FL Village Community Development District #12 Series 2016 | | | 2.88 | | | | 5-1-2021 | | | | 985,000 | | | | 987,896 | |
| |
| | | | 3,806,338 | |
| | | | | | | | | | | | | | | | |
The accompanying notes are an integral part of these financial statements.
| | | | | | |
| Portfolio of investments—December 31, 2018 (unaudited) | | Wells Fargo Strategic Municipal Bond Fund | | | 11 | |
| | | | | | | | | | | | | | | | |
| Security name | | Interest rate | | | Maturity date | | | Principal | | | Value | |
|
| Resource Recovery Revenue: 0.17% | |
| | | | |
Florida Development Finance Corporation Solid Waste AMT Pro USA Incorporated 144A | | | 5.00 | % | | | 8-1-2029 | | | $ | 3,500,000 | | | $ | 3,586,170 | |
| | | | | | | | | | | | | | | | |
| | | | |
| Transportation Revenue: 0.05% | | | | | | | | | | | | | | | | |
| | | | |
Miami-Dade County FL Expressway Authority Toll System (AGM Insured, Citibank NA LIQ) 144Aø | | | 1.91 | | | | 2-1-2020 | | | | 1,000,000 | | | | 1,000,000 | |
| | | | | | | | | | | | | | | | |
| |
| | | | 22,261,394 | |
| | | | | | | | | | | | | | | | |
| | | | |
Georgia: 3.87% | | | | | | | | | | | | | | | | |
| | | | |
| Education Revenue: 0.06% | | | | | | | | | | | | | | | | |
| | | | |
Georgia Private Colleges & Universities Authority | | | 5.00 | | | | 10-1-2019 | | | | 1,325,000 | | | | 1,350,321 | |
| | | | | | | | | | | | | | | | |
| | | | |
| Health Revenue: 1.01% | | | | | | | | | | | | | | | | |
| | | | |
Gainesville & Hall Counties GA Development Authority Senior Living Facilities Lanier Village Series B (AGC Insured, TD Bank NA SPA) ø | | | 1.75 | | | | 11-15-2033 | | | | 15,000,000 | | | | 15,000,000 | |
| | | | |
Gainesville & Hall Counties GA Hospital Authority Health System Project Series B (SIFMA Municipal Swap +0.95%) ± | | | 2.66 | | | | 8-15-2035 | | | | 6,000,000 | | | | 6,005,160 | |
| |
| | | | 21,005,160 | |
| | | | | | | | | | | | | | | | |
| | | | |
| Transportation Revenue: 0.09% | | | | | | | | | | | | | | | | |
| | | | |
Georgia Road & Tollway Authority I-75 S Express Lanes Project Series A 144A (z) | | | 6.34 | | | | 6-1-2024 | | | | 2,500,000 | | | | 1,818,975 | |
| | | | | | | | | | | | | | | | |
| | | | |
| Utilities Revenue: 2.71% | | | | | | | | | | | | | | | | |
| | | | |
Burke County GA Development Authority Georgia Power Company Plant Vogtle Project First Series 2012 | | | 1.85 | | | | 12-1-2049 | | | | 3,000,000 | | | | 2,991,120 | |
| | | | |
Burke County GA Development Authority Oglethorpe Power Corporation Vogtle Project Series F | | | 3.00 | | | | 11-1-2045 | | | | 14,955,000 | | | | 14,835,659 | |
| | | | |
Burke County GA PCR Oglethorpe Power Corporation Vogtle Project Series E | | | 3.25 | | | | 11-1-2045 | | | | 3,000,000 | | | | 2,988,450 | |
| | | | |
Floyd County GA PCR Georgia Power Company Plant Hammond Project | | | 2.35 | | | | 7-1-2022 | | | | 8,875,000 | | | | 8,801,693 | |
| | | | |
Main Street Natural Gas Incorporated Georgia Gas Project Series C | | | 4.00 | | | | 8-1-2048 | | | | 14,485,000 | | | | 15,295,001 | |
| | | | |
Main Street Natural Gas Incorporated Georgia Gas Project Subordinate Bond Series A (Royal Bank of Canada LIQ) | | | 4.00 | | | | 4-1-2048 | | | | 7,340,000 | | | | 7,732,029 | |
| | | | |
Monroe County GA Development Authority Pollution Control Gulf Power Company Plant Scherer Project | | | 1.40 | | | | 6-1-2049 | | | | 3,750,000 | | | | 3,725,775 | |
| |
| | | | 56,369,727 | |
| | | | | | | | | | | | | | | | |
| |
| | | | 80,544,183 | |
| | | | | | | | | | | | | | | | |
| | | | |
Guam: 0.05% | | | | | | | | | | | | | | | | |
| | | | |
| Water & Sewer Revenue: 0.05% | | | | | | | | | | | | | | | | |
| | | | |
Guam Government Waterworks Authority Water & Wastewater System Series 2014A | | | 5.00 | | | | 7-1-2020 | | | | 1,000,000 | | | | 1,034,360 | |
| | | | | | | | | | | | | | | | |
| | | | |
Hawaii: 0.47% | | | | | | | | | | | | | | | | |
| | | | |
| Health Revenue: 0.47% | | | | | | | | | | | | | | | | |
| | | | |
Hawaii Department of Budget & Finance Queens Health System Series B (SIFMA Municipal Swap +0.45%) ± | | | 2.16 | | | | 7-1-2039 | | | | 9,820,000 | | | | 9,820,000 | |
| | | | | | | | | | | | | | | | |
The accompanying notes are an integral part of these financial statements.
| | | | |
| 12 | | Wells Fargo Strategic Municipal Bond Fund | | Portfolio of investments—December 31, 2018 (unaudited) |
| | | | | | | | | | | | | | | | |
| Security name | | Interest rate | | | Maturity date | | | Principal | | | Value | |
|
Illinois: 17.21% | |
|
| Airport Revenue: 2.06% | |
| | | | |
Chicago IL Midway Airport Second Lien Refunding Bonds Series 2014A | | | 5.00 | % | | | 1-1-2026 | | | $ | 7,000,000 | | | $ | 7,709,730 | |
| | | | |
Chicago IL Midway Airport Second Lien Refunding Bonds Series 2014A | | | 5.00 | | | | 1-1-2030 | | | | 4,385,000 | | | | 4,767,767 | |
| | | | |
Chicago IL Midway Airport Second Lien Refunding Bonds Series A | | | 5.50 | | | | 1-1-2027 | | | | 3,925,000 | | | | 4,340,069 | |
| | | | |
Chicago IL O’Hare International Airport AMT Passenger Facility Charge Refunding Bonds Series B | | | 5.00 | | | | 1-1-2032 | | | | 5,125,000 | | | | 5,440,649 | |
| | | | |
Chicago IL O’Hare International Airport Senior Lien Bonds Series 2015 C | | | 5.00 | | | | 1-1-2022 | | | | 695,000 | | | | 746,076 | |
| | | | |
Chicago IL O’Hare International Airport Senior Lien Bonds Series 2015 D | | | 5.00 | | | | 1-1-2021 | | | | 500,000 | | | | 529,890 | |
| | | | |
Chicago IL O’Hare International Airport Senior Lien Refunding Bonds Series 2013A | | | 5.00 | | | | 1-1-2026 | | | | 2,690,000 | | | | 2,928,119 | |
| | | | |
Chicago IL O’Hare International Airport Senior Lien Refunding Bonds Series 2015A | | | 5.00 | | | | 1-1-2028 | | | | 10,000,000 | | | | 11,101,400 | |
| | | | |
Chicago IL O’Hare International Airport Senior Lien Refunding Bonds Series 2017D | | | 5.00 | | | | 1-1-2025 | | | | 1,700,000 | | | | 1,908,063 | |
| | | | |
Chicago IL O’Hare International Airport Customer Facility Charge | | | 5.25 | | | | 1-1-2023 | | | | 1,350,000 | | | | 1,498,433 | |
| | | | |
Chicago IL O’Hare International Airport Customer Facility Charge | | | 5.25 | | | | 1-1-2024 | | | | 1,665,000 | | | | 1,858,173 | |
| |
| | | | 42,828,369 | |
| | | | | | | | | | | | | | | | |
| | | | |
| GO Revenue: 5.80% | | | | | | | | | | | | | | | | |
| | | | |
Chicago IL Board of Education Unlimited Tax General Obligation Refunding Bonds Series 2018A (AGM Insured) | | | 5.00 | | | | 12-1-2024 | | | | 3,000,000 | | | | 3,319,290 | |
| | | | |
Chicago IL CAB City Colleges (National Insured) (z) | | | 4.46 | | | | 1-1-2027 | | | | 7,720,000 | | | | 5,669,105 | |
| | | | |
Chicago IL CAB City Colleges (National Insured) (z) | | | 5.45 | | | | 1-1-2024 | | | | 9,800,000 | | | | 8,269,142 | |
| | | | |
Chicago IL Park District General Obligation Limited Series A | | | 5.00 | | | | 1-1-2022 | | | | 400,000 | | | | 424,872 | |
| | | | |
Chicago IL Park District General Obligation Limited Series A | | | 5.00 | | | | 1-1-2023 | | | | 400,000 | | | | 430,684 | |
| | | | |
Chicago IL Park District General Obligation Limited Series A | | | 5.00 | | | | 1-1-2024 | | | | 550,000 | | | | 600,138 | |
| | | | |
Chicago IL Park District General Obligation Limited Series A | | | 5.00 | | | | 1-1-2025 | | | | 625,000 | | | | 689,869 | |
| | | | |
Chicago IL Park District General Obligation Limited Series C | | | 5.00 | | | | 1-1-2022 | | | | 1,000,000 | | | | 1,062,180 | |
| | | | |
Chicago IL Park District General Obligation Limited Series C | | | 5.00 | | | | 1-1-2023 | | | | 1,000,000 | | | | 1,076,710 | |
| | | | |
Chicago IL Park District General Obligation Limited Series C | | | 5.00 | | | | 1-1-2024 | | | | 410,000 | | | | 447,376 | |
| | | | |
Chicago IL Park District Harbor Facilities Series D | | | 5.00 | | | | 1-1-2022 | | | | 1,645,000 | | | | 1,747,286 | |
| | | | |
Chicago IL Park District Harbor Facilities Series D | | | 5.00 | | | | 1-1-2023 | | | | 1,175,000 | | | | 1,265,134 | |
| | | | |
Chicago IL Park District Limited Tax Series B | | | 5.00 | | | | 1-1-2022 | | | | 4,675,000 | | | | 4,965,692 | |
| | | | |
Chicago IL Park District Unlimited Tax Series E | | | 5.00 | | | | 11-15-2022 | | | | 1,235,000 | | | | 1,328,712 | |
| | | | |
Chicago IL Park District Unlimited Tax Series E | | | 5.00 | | | | 11-15-2023 | | | | 1,295,000 | | | | 1,411,421 | |
| | | | |
Chicago IL Series C | | | 5.00 | | | | 1-1-2021 | | | | 1,000,000 | | | | 1,032,940 | |
| | | | |
Chicago IL Series C | | | 5.00 | | | | 1-1-2022 | | | | 2,250,000 | | | | 2,351,678 | |
| | | | |
Chicago IL Series C | | | 5.00 | | | | 1-1-2023 | | | | 2,500,000 | | | | 2,636,750 | |
| | | | |
Chicago IL Series G (Ambac Insured) | | | 5.00 | | | | 12-1-2024 | | | | 910,000 | | | | 913,221 | |
| | | | |
Cook County IL Refunding Bonds Series 2010 G | | | 5.00 | | | | 11-15-2026 | | | | 1,000,000 | | | | 1,038,780 | |
| | | | |
Cook County IL School District #123 Oak Lawn CAB (National Insured) (z) | | | 3.25 | | | | 12-1-2021 | | | | 1,090,000 | | | | 1,013,362 | |
| | | | |
Cook County IL School District #153 Homewood Series A (AGM Insured) (z) | | | 2.75 | | | | 12-15-2023 | | | | 1,225,000 | | | | 1,069,045 | |
| | | | |
Cook County IL School District #227 Rich Township Refunding School Bonds Series 2015 | | | 3.00 | | | | 12-1-2024 | | | | 965,000 | | | | 968,271 | |
| | | | |
Cook County IL Series A | | | 5.00 | | | | 11-15-2021 | | | | 2,250,000 | | | | 2,411,708 | |
| | | | |
Cook County IL Series A | | | 5.25 | | | | 11-15-2022 | | | | 10,040,000 | | | | 10,555,253 | |
| | | | |
Cook County IL Series A | | | 5.25 | | | | 11-15-2022 | | | | 1,000,000 | | | | 1,090,960 | |
| | | | |
De Kalb & Kane Counties IL Community Unit School District #427 Sycamore Prerefunded Balance CAB (AGM Insured) (z) | | | 2.85 | | | | 1-1-2024 | | | | 455,000 | | | | 405,687 | |
| | | | |
De Kalb & Kane Counties IL Community Unit School District #427 Sycamore Unrefunded Balance CAB (AGM Insured) (z) | | | 2.85 | | | | 1-1-2024 | | | | 5,175,000 | | | | 4,462,040 | |
| | | | |
Decatur IL Macon County General Obligation Refunding Bonds Series 2013 | | | 5.00 | | | | 3-1-2024 | | | | 1,405,000 | | | | 1,523,835 | |
| | | | |
DuPage County IL Forest Preservation District Series 2015 | | | 5.00 | | | | 1-1-2023 | | | | 2,455,000 | | | | 2,720,459 | |
The accompanying notes are an integral part of these financial statements.
| | | | | | |
| Portfolio of investments—December 31, 2018 (unaudited) | | Wells Fargo Strategic Municipal Bond Fund | | | 13 | |
| | | | | | | | | | | | | | | | |
| Security name | | Interest rate | | | Maturity date | | | Principal | | | Value | |
| | | | |
| GO Revenue(continued) | | | | | | | | | | | | | | | | |
| | | | |
Illinois Series A | | | 5.00 | % | | | 4-1-2023 | | | $ | 3,500,000 | | | $ | 3,698,135 | |
| | | | |
Illinois State Series 2012 | | | 5.00 | | | | 3-1-2028 | | | | 6,000,000 | | | | 6,177,960 | |
| | | | |
Kane, Cook & DuPage Counties IL School District #46 Elgin Unrefunded Balance Series 2012B | | | 4.50 | | | | 1-1-2025 | | | | 4,295,000 | | | | 4,564,339 | |
| | | | |
Kane, Cook & DuPage Counties IL School District #46 Prerefunded CAB Series B (Ambac Insured) (z) | | | 2.46 | | | | 1-1-2021 | | | | 510,000 | | | | 489,671 | |
| | | | |
Kane, Cook & DuPage Counties IL School District #46 Unrefunded CAB Series B (Ambac Insured) (z) | | | 2.56 | | | | 1-1-2021 | | | | 595,000 | | | | 566,791 | |
| | | | |
Lake County IL Community Consolidated School District #3 Beach Park CAB (Ambac Insured) (z) | | | 3.80 | | | | 2-1-2019 | | | | 1,100,000 | | | | 1,096,942 | |
| | | | |
Lake County IL School District #38 Big Hollow CAB (Ambac Insured) (z) | | | 2.53 | | | | 2-1-2019 | | | | 1,175,000 | | | | 1,172,368 | |
| | | | |
McHenry & Kane Counties IL Community Consolidated School District #158 CAB (AGM/FGIC Insured) (z) | | | 0.00 | | | | 1-1-2019 | | | | 1,185,000 | | | | 1,185,000 | |
| | | | |
Rockford IL Waterworks System Series B (Build America Mutual Assurance Company Insured) | | | 5.00 | | | | 12-15-2020 | | | | 1,000,000 | | | | 1,051,380 | |
| | | | |
Rockford IL Waterworks System Series B (Build America Mutual Assurance Company Insured) | | | 5.00 | | | | 12-15-2021 | | | | 1,015,000 | | | | 1,084,923 | |
| | | | |
Rockford IL Waterworks System Series B (Build America Mutual Assurance Company Insured) | | | 5.00 | | | | 12-15-2022 | | | | 1,065,000 | | | | 1,159,934 | |
| | | | |
Romeoville IL Series B (AGC Insured) (z) | | | 4.77 | | | | 12-30-2023 | | | | 3,410,000 | | | | 2,634,941 | |
| | | | |
Romeoville IL Series B (AGC Insured) (z) | | | 4.88 | | | | 12-30-2024 | | | | 2,840,000 | | | | 2,073,399 | |
| | | | |
Will County IL Lincoln-Way Community High School District #210 | | | 4.00 | | | | 1-1-2022 | | | | 1,630,000 | | | | 1,630,179 | |
| | | | |
Will County IL Lincoln-Way Community High School District #210 Unrefunded CAB (AGM Insured) (z) | | | 4.31 | | | | 1-1-2021 | | | | 1,535,000 | | | | 1,450,191 | |
| | | | |
Will County IL Lincoln-Way Community High School District #210 Unrefunded CAB (AGM Insured) (z) | | | 4.67 | | | | 1-1-2025 | | | | 14,385,000 | | | | 11,738,879 | |
| | | | |
Will County IL Lincoln-Way Community High School District #210 Unrefunded CAB (AGM Insured) (z) | | | 4.81 | | | | 1-1-2026 | | | | 8,295,000 | | | | 6,471,842 | |
| | | | |
Will County IL School District #114 Manhattan CAB Series C (National Insured) (z) | | | 4.24 | | | | 12-1-2021 | | | | 1,055,000 | | | | 971,011 | |
| | | | |
Winnebago & Boone Counties IL School District #205 Series A (z) | | | 2.71 | | | | 2-1-2021 | | | | 1,305,000 | | | | 1,236,553 | |
| | | | |
Winnebago & Boone Counties IL School District #205 Series B (z) | | | 2.71 | | | | 2-1-2021 | | | | 3,400,000 | | | | 3,221,670 | |
| |
| | | | 120,577,708 | |
| | | | | | | | | | | | | | | | |
| | | | |
| Health Revenue: 0.28% | | | | | | | | | | | | | | | | |
| | | | |
Illinois Finance Authority Ascension Health Alliance Senior Credit Group Bonds Series A | | | 5.00 | | | | 11-15-2027 | | | | 1,000,000 | | | | 1,077,060 | |
| | | | |
Illinois Finance Authority Friendship Village of Schaumburg Series 2017 | | | 5.00 | | | | 2-15-2021 | | | | 2,555,000 | | | | 2,586,580 | |
| | | | |
Illinois Finance Authority Rosalind Franklin University of Medicine & Science Series A | | | 3.25 | | | | 2-15-2022 | | | | 500,000 | | | | 497,495 | |
| | | | |
Illinois State Finance Authority Revenue Bonds Series 2014 | | | 5.00 | | | | 8-1-2038 | | | | 1,520,000 | | | | 1,657,910 | |
| |
| | | | 5,819,045 | |
| | | | | | | | | | | | | | | | |
| | | | |
| Miscellaneous Revenue: 2.24% | | | | | | | | | | | | | | | | |
| | | | |
Chicago IL Transit Authority Capital Grant Receipts Refunding Bond Series 2011 (AGM Insured) | | | 5.25 | | | | 6-1-2024 | | | | 4,450,000 | | | | 4,738,805 | |
| | | | |
Cook County IL Community Unit School District Number 401 Elmwood Park Limited Tax Debt Certificates Series A | | | 2.38 | | | | 12-1-2028 | | | | 5,000,000 | | | | 5,021,900 | |
| | | | |
Cook County IL School District #63 East Maine 144A | | | 2.38 | | | | 12-1-2028 | | | | 12,570,000 | | | | 12,842,392 | |
| | | | |
Illinois Refunding Bonds Series 2012 (AGM Insured) | | | 5.00 | | | | 8-1-2020 | | | | 5,050,000 | | | | 5,245,637 | |
| | | | |
Illinois Refunding Bonds Series 2016 | | | 5.00 | | | | 2-1-2026 | | | | 7,000,000 | | | | 7,485,450 | |
The accompanying notes are an integral part of these financial statements.
| | | | |
| 14 | | Wells Fargo Strategic Municipal Bond Fund | | Portfolio of investments—December 31, 2018 (unaudited) |
| | | | | | | | | | | | | | | | |
| Security name | | Interest rate | | | Maturity date | | | Principal | | | Value | |
| | | | |
| Miscellaneous Revenue(continued) | | | | | | | | | | | | | | | | |
| | | | |
Illinois State Series 2012 | | | 5.00 | % | | | 8-1-2021 | | | $ | 5,620,000 | | | $ | 5,855,534 | |
| | | | |
Illinois State Series 2013 (AGM Insured) | | | 5.00 | | | | 7-1-2023 | | | | 4,875,000 | | | | 5,305,609 | |
| |
| | | | 46,495,327 | |
| | | | | | | | | | | | | | | | |
| | | | |
| Tax Revenue: 5.76% | | | | | | | | | | | | | | | | |
| | | | |
Chicago IL Motor Fuel Tax Refunding Bonds Series 2013 | | | 5.00 | | | | 1-1-2021 | | | | 1,450,000 | | | | 1,497,763 | |
| | | | |
Chicago IL Motor Fuel Tax Refunding Bonds Series 2013 | | | 5.00 | | | | 1-1-2022 | | | | 1,810,000 | | | | 1,892,319 | |
| | | | |
Chicago IL Motor Fuel Tax Refunding Bonds Series 2013 | | | 5.00 | | | | 1-1-2023 | | | | 2,400,000 | | | | 2,531,280 | |
| | | | |
Chicago IL Motor Fuel Tax Refunding Bonds Series 2013 | | | 5.00 | | | | 1-1-2024 | | | | 2,475,000 | | | | 2,620,505 | |
| | | | |
Chicago IL Motor Fuel Tax Refunding Bonds Series 2013 | | | 5.00 | | | | 1-1-2025 | | | | 1,000,000 | | | | 1,053,190 | |
| | | | |
Chicago lL Series A | | | 5.00 | | | | 1-1-2022 | | | | 3,000,000 | | | | 3,092,400 | |
| | | | |
Chicago IL Series A | | | 5.00 | | | | 1-1-2029 | | | | 5,000,000 | | | | 5,154,000 | |
| | | | |
Chicago IL Tax Increment Bond Pilson Redevelopment Project Series A | | | 5.00 | | | | 6-1-2022 | | | | 1,635,000 | | | | 1,753,407 | |
| | | | |
Chicago IL Transit Authority Sales Tax Receipts Series 2011 | | | 5.25 | | | | 12-1-2036 | | | | 17,415,000 | | | | 18,344,787 | |
| | | | |
Illinois Regional Transportation Authority Series A (AGM Insured) | | | 5.25 | | | | 6-1-2024 | | | | 9,995,000 | | | | 11,426,784 | |
| | | | |
Illinois Sales Tax First Series (National Insured) | | | 6.00 | | | | 6-15-2024 | | | | 515,000 | | | | 584,103 | |
| | | | |
Illinois Sales Tax First Series (National Insured) | | | 6.00 | | | | 6-15-2025 | | | | 8,165,000 | | | | 9,405,508 | |
| | | | |
Illinois Sports Facilities Authority Series 2014 | | | 5.00 | | | | 6-15-2022 | | | | 3,395,000 | | | | 3,538,880 | |
| | | | |
Illinois Sports Facilities Authority Series 2014 | | | 5.00 | | | | 6-15-2023 | | | | 3,220,000 | | | | 3,390,241 | |
| | | | |
Illinois Sports Facilities Authority Series 2014 | | | 5.00 | | | | 6-15-2024 | | | | 4,130,000 | | | | 4,367,640 | |
| | | | |
Illinois Sports Facilities Authority State Tax Supported CAB (Ambac Insured) (z) | | | 4.33 | | | | 6-15-2022 | | | | 3,795,000 | | | | 3,344,116 | |
| | | | |
Illinois Sports Facilities Authority State Tax Supported CAB (Ambac Insured) (z) | | | 4.18 | | | | 6-15-2026 | | | | 1,740,000 | | | | 1,297,309 | |
| | | | |
Metropolitan Pier & Exposition Authority CAB McCormick Place Project Series A (National Insured) (z) | | | 3.85 | | | | 12-15-2022 | | | | 1,390,000 | | | | 1,212,914 | |
| | | | |
Metropolitan Pier & Exposition Authority McCormick Place Project Series B | | | 5.00 | | | | 12-15-2022 | | | | 11,520,000 | | | | 11,554,330 | |
| | | | |
Metropolitan Pier & Exposition Authority McCormick Place Project Series B | | | 5.00 | | | | 12-15-2028 | | | | 14,090,000 | | | | 14,576,246 | |
| | | | |
Metropolitan Pier & Exposition Authority Prerefunded Bond (National Insured) (z) | | | 3.21 | | | | 12-15-2023 | | | | 20,000 | | | | 17,877 | |
| | | | |
Metropolitan Pier & Exposition Authority Prerefunded Bond (National Insured) | | | 5.70 | | | | 6-15-2025 | | | | 220,000 | | | | 249,216 | |
| | | | |
Metropolitan Pier & Exposition Authority Unrefunded Bond (National Insured) (z) | | | 3.21 | | | | 12-15-2023 | | | | 845,000 | | | | 708,195 | |
| | | | |
Metropolitan Pier & Exposition Authority Unrefunded Bond (National Insured) | | | 5.70 | | | | 6-15-2025 | | | | 780,000 | | | | 855,293 | |
| | | | |
Sales Tax Securitization Corporation Series 2017A | | | 5.00 | | | | 1-1-2026 | | | | 4,815,000 | | | | 5,395,930 | |
| | | | |
Sales Tax Securitization Corporation Series A | | | 5.00 | | | | 1-1-2028 | | | | 4,015,000 | | | | 4,565,898 | |
| | | | |
St. Charles, Kane & DuPage Counties IL Series 2016 | | | 3.00 | | | | 1-1-2019 | | | | 300,000 | | | | 300,000 | |
| | | | |
St. Charles, Kane & DuPage Counties IL Series 2016 | | | 4.00 | | | | 1-1-2020 | | | | 760,000 | | | | 763,906 | |
| | | | |
St. Charles, Kane & DuPage Counties IL Series 2016 | | | 4.00 | | | | 1-1-2021 | | | | 790,000 | | | | 796,636 | |
| | | | |
St. Charles, Kane & DuPage Counties IL Series 2016 | | | 4.00 | | | | 1-1-2022 | | | | 820,000 | | | | 819,541 | |
| | | | |
St. Charles, Kane & DuPage Counties IL Series 2016 | | | 4.00 | | | | 1-1-2023 | | | | 855,000 | | | | 850,631 | |
| | | | |
St. Charles, Kane & DuPage Counties IL Series 2016 | | | 4.00 | | | | 1-1-2024 | | | | 885,000 | | | | 872,787 | |
| | | | |
St. Charles, Kane & DuPage Counties IL Series 2016 | | | 4.00 | | | | 1-1-2025 | | | | 925,000 | | | | 898,092 | |
| |
| | | | 119,731,724 | |
| | | | | | | | | | | | | | | | |
| | | | |
| Tobacco Revenue: 0.95% | | | | | | | | | | | | | | | | |
| | | | |
Railsplitter Tobacco Settlement Authority | | | 5.00 | | | | 6-1-2023 | | | | 18,000,000 | | | | 19,836,360 | |
| | | | | | | | | | | | | | | | |
| | | | |
| Water & Sewer Revenue: 0.12% | | | | | | | | | | | | | | | | |
| | | | |
Chicago IL Waterworks Second Lien | | | 5.00 | | | | 11-1-2028 | | | | 2,325,000 | | | | 2,619,531 | |
| | | | | | | | | | | | | | | | |
| |
| | | | 357,908,064 | |
| | | | | | | | | | | | | | | | |
The accompanying notes are an integral part of these financial statements.
| | | | | | |
| Portfolio of investments—December 31, 2018 (unaudited) | | Wells Fargo Strategic Municipal Bond Fund | | | 15 | |
| | | | | | | | | | | | | | | | |
| Security name | | Interest rate | | | Maturity date | | | Principal | | | Value | |
| | | | |
Indiana: 1.29% | | | | | | | | | | | | | | | | |
| | | | |
| Health Revenue: 0.27% | | | | | | | | | | | | | | | | |
| | | | |
Indiana Finance Authority Parkview Health Project Prerefunded Bond | | | 5.50 | % | | | 5-1-2024 | | | $ | 4,345,000 | | | $ | 4,396,271 | |
| | | | |
Indiana Finance Authority Parkview Health Project Unrefunded Bond | | | 5.50 | | | | 5-1-2024 | | | | 910,000 | | | | 920,738 | |
| | | | |
Indiana HFFA Ancilla System Incorporated (National Insured) | | | 5.25 | | | | 7-1-2022 | | | | 325,000 | | | | 325,787 | |
| |
| | | | 5,642,796 | |
| | | | | | | | | | | | | | | | |
| | | | |
| Housing Revenue: 0.82% | | | | | | | | | | | | | | | | |
| | | | |
Indiana Housing and CDA Affordable Assisted Living Project Series 2017 | | | 1.80 | | | | 12-1-2019 | | | | 17,030,000 | | | | 17,008,883 | |
| | | | | | | | | | | | | | | | |
|
| Industrial Development Revenue: 0.14% | |
| | | | |
Whiting IN BP Products North America Incorporated Project | | | 1.85 | | | | 6-1-2044 | | | | 3,000,000 | | | | 2,994,450 | |
| | | | | | | | | | | | | | | | |
| | | | |
| Miscellaneous Revenue: 0.06% | | | | | | | | | | | | | | | | |
| | | | |
Michigan IN City School Building Corporation Series 2016A | | | 5.00 | | | | 1-15-2025 | | | | 1,000,000 | | | | 1,142,520 | |
| | | | | | | | | | | | | | | | |
| |
| | | | 26,788,649 | |
| | | | | | | | | | | | | | | | |
| | | | |
Iowa: 0.05% | | | | | | | | | | | | | | | | |
| | | | |
| Industrial Development Revenue: 0.05% | | | | | | | | | | | | | | | | |
| | | | |
Iowa Finance Authority Midwestern Disaster Area Project (Korea Development Bank LOC) ø | | | 2.07 | | | | 4-1-2022 | | | | 1,000,000 | | | | 1,000,000 | |
| | | | | | | | | | | | | | | | |
| | | | |
Kansas: 0.53% | | | | | | | | | | | | | | | | |
| | | | |
| Tax Revenue: 0.53% | | | | | | | | | | | | | | | | |
| | | | |
Wyandotte County & Kansas City KS Special Obligation Refunding & Improvement Bonds Plaza Redevelopment Project | | | 4.00 | | | | 12-1-2028 | | | | 810,000 | | | | 799,535 | |
| | | | |
Wyandotte County & Kansas City KS Special Obligation Vacation Village Project Area 4 Major Multi-Sport Athletic Complex Project CAB Series 2015 144A (z) | | | 6.86 | | | | 9-1-2034 | | | | 27,905,000 | | | | 10,220,485 | |
| |
| | | | 11,020,020 | |
| | | | | | | | | | | | | | | | |
| | | | |
Kentucky: 0.66% | | | | | | | | | | | | | | | | |
| | | | |
| Health Revenue: 0.15% | | | | | | | | | | | | | | | | |
| | | | |
Kentucky EDFA Healthcare Facilities Rosedale Green Project Series 2015 | | | 3.00 | | | | 11-15-2019 | | | | 350,000 | | | | 348,009 | |
| | | | |
Kentucky EDFA Healthcare Facilities Rosedale Green Project Series 2015 | | | 3.35 | | | | 11-15-2020 | | | | 335,000 | | | | 331,643 | |
| | | | |
Kentucky EDFA Healthcare Facilities Rosedale Green Project Series 2015 | | | 5.00 | | | | 11-15-2025 | | | | 1,500,000 | | | | 1,527,015 | |
| | | | |
Kentucky EDFA Norton Healthcare Incorporated Series B (National Insured) (z) | | | 4.66 | | | | 10-1-2022 | | | | 1,000,000 | | | | 894,820 | |
| |
| | | | 3,101,487 | |
| | | | | | | | | | | | | | | | |
| | | | |
| Utilities Revenue: 0.51% | | | | | | | | | | | | | | | | |
| | | | |
Kentucky Public Energy Authority Gas Supply Series B | | | 4.00 | | | | 1-1-2049 | | | | 10,000,000 | | | | 10,571,300 | |
| | | | | | | | | | | | | | | | |
| |
| | | | 13,672,787 | |
| | | | | | | | | | | | | | | | |
| | | | |
Louisiana: 2.08% | | | | | | | | | | | | | | | | |
| | | | |
| Airport Revenue: 0.23% | | | | | | | | | | | | | | | | |
| | | | |
New Orleans LA Aviation Board General North Terminal Project Series A | | | 5.00 | | | | 1-1-2032 | | | | 1,000,000 | | | | 1,104,940 | |
| | | | |
New Orleans LA Aviation Board Gulf Opportunity Zone Controlled Foreign Corporation Revenue Refunding Consolidated Rental Car Project (AGM Insured) | | | 5.00 | | | | 1-1-2031 | | | | 1,250,000 | | | | 1,434,125 | |
| | | | |
New Orleans LA Aviation Board Gulf Opportunity Zone Controlled Foreign Corporation Revenue Refunding Consolidated Rental Car Project (AGM Insured) | | | 5.00 | | | | 1-1-2032 | | | | 2,000,000 | | | | 2,282,800 | |
| |
| | | | 4,821,865 | |
| | | | | | | | | | | | | | | | |
The accompanying notes are an integral part of these financial statements.
| | | | |
| 16 | | Wells Fargo Strategic Municipal Bond Fund | | Portfolio of investments—December 31, 2018 (unaudited) |
| | | | | | | | | | | | | | | | |
| Security name | | Interest rate | | | Maturity date | | | Principal | | | Value | |
| | | | |
| Education Revenue: 0.30% | | | | | | | | | | | | | | | | |
| | | | |
Louisiana Public Facilities Authority Loyola University Project Series 2011 | | | 5.25 | % | | | 10-1-2025 | | | $ | 2,815,000 | | | $ | 2,982,830 | |
| | | | |
Louisiana Public Facilities Authority Loyola University Project Series 2017 (z) | | | 2.93 | | | | 10-1-2020 | | | | 1,000,000 | | | | 950,200 | |
| | | | |
Louisiana Public Facilities Authority Loyola University Project Series 2017 (z) | | | 3.20 | | | | 10-1-2021 | | | | 950,000 | | | | 873,563 | |
| | | | |
Louisiana Public Facilities Authority Loyola University Project Series 2017 (z) | | | 3.38 | | | | 10-1-2022 | | | | 1,500,000 | | | | 1,332,855 | |
| |
| | | | 6,139,448 | |
| | | | | | | | | | | | | | | | |
| | | | |
| Housing Revenue: 1.39% | | | | | | | | | | | | | | | | |
| | | | |
Louisiana Housing Corporation Harmony Gaeden Estates Project Series 2017 | | | 1.86 | | | | 12-1-2020 | | | | 13,500,000 | | | | 13,486,095 | |
| | | | |
Louisiana Housing Corporation The Meadows at Nicholson Project Series 2017 | | | 1.83 | | | | 5-1-2020 | | | | 15,500,000 | | | | 15,466,985 | |
| |
| | | | 28,953,080 | |
| | | | | | | | | | | | | | | | |
| | | | |
| Tax Revenue: 0.16% | | | | | | | | | | | | | | | | |
| | | | |
St. Bernard Parish LA Series 2012 | | | 4.00 | | | | 3-1-2019 | | | | 3,355,000 | | | | 3,366,139 | |
| | | | | | | | | | | | | | | | |
| |
| | | | 43,280,532 | |
| | | | | | | | | | | | | | | | |
| | | | |
Maryland: 5.13% | | | | | | | | | | | | | | | | |
| | | | |
| Education Revenue: 0.13% | | | | | | | | | | | | | | | | |
| | | | |
Prince George’s County MD Chesapeake Lighthouse Charter School Project Series 2015 144A | | | 5.25 | | | | 8-1-2022 | | | | 1,465,000 | | | | 1,465,410 | |
| | | | |
Prince George’s County MD Chesapeake Lighthouse Charter School Project Series 2016 | | | 5.00 | | | | 8-1-2026 | | | | 1,335,000 | | | | 1,290,024 | |
| |
| | | | 2,755,434 | |
| | | | | | | | | | | | | | | | |
| | | | |
| GO Revenue: 1.61% | | | | | | | | | | | | | | | | |
| | | | |
Maryland GO State and Local Facilities Loan of 2015 | | | 5.00 | | | | 8-1-2024 | | | | 8,905,000 | | | | 10,080,460 | |
| | | | |
Montgomery County MD Consolidated Public Improvement Series A | | | 4.00 | | | | 11-1-2030 | | | | 5,000,000 | | | | 5,356,550 | |
| | | | |
Prince George’s County MD Consolidated Public Improvement Bonds Series C | | | 4.00 | | | | 8-1-2027 | | | | 3,890,000 | | | | 4,182,723 | |
| | | | |
Prince George’s County MD Consolidated Public Improvement Bonds Series C | | | 4.00 | | | | 8-1-2028 | | | | 12,960,000 | | | | 13,882,752 | |
| |
| | | | 33,502,485 | |
| | | | | | | | | | | | | | | | |
| | | | |
| Health Revenue: 0.19% | | | | | | | | | | | | | | | | |
| | | | |
Rockville MD Mayor & Council Economic Development Ingleside King Farm Project #45 Series C-3 | | | 2.50 | | | | 11-1-2024 | | | | 4,000,000 | | | | 3,819,200 | |
| | | | | | | | | | | | | | | | |
| | | | |
| Housing Revenue: 0.43% | | | | | | | | | | | | | | | | |
| | | | |
Maryland CDA Department of Housing & Community Multifamily Development Zions Towers Series A (FHA Insured) | | | 2.44 | | | | 3-1-2020 | | | | 9,000,000 | | | | 8,977,320 | |
| | | | | | | | | | | | | | | | |
| | | | |
| Miscellaneous Revenue: 1.74% | | | | | | | | | | | | | | | | |
| | | | |
Maryland Local Facilities Loan of 2013 Series A | | | 4.00 | | | | 3-1-2026 | | | | 34,790,000 | | | | 36,231,350 | |
| | | | | | | | | | | | | | | | |
| | | | |
| Tax Revenue: 0.92% | | | | | | | | | | | | | | | | |
| | | | |
Maryland Consolidated Department of Transportation | | | 4.00 | | | | 2-1-2030 | | | | 8,500,000 | | | | 9,049,015 | |
| | | | |
Maryland State Department of Transportation | | | 4.00 | | | | 12-15-2027 | | | | 9,260,000 | | | | 10,042,100 | |
| |
| | | | 19,091,115 | |
| | | | | | | | | | | | | | | | |
| | | | |
| Water & Sewer Revenue: 0.11% | | | | | | | | | | | | | | | | |
| | | | |
Baltimore MD Series A (National Insured) | | | 5.65 | | | | 7-1-2020 | | | | 2,150,000 | | | | 2,230,797 | |
| | | | | | | | | | | | | | | | |
| |
| | | | 106,607,701 | |
| | | | | | | | | | | | | | | | |
The accompanying notes are an integral part of these financial statements.
| | | | | | |
| Portfolio of investments—December 31, 2018 (unaudited) | | Wells Fargo Strategic Municipal Bond Fund | | | 17 | |
| | | | | | | | | | | | | | | | |
| Security name | | Interest rate | | | Maturity date | | | Principal | | | Value | |
| | | | |
Massachusetts: 4.98% | | | | | | | | | | | | | | | | |
|
| Education Revenue: 1.41% | |
| | | | |
Massachusetts Development Finance Agency Sabis International Charter School Series 2015 | | | 5.00 | % | | | 4-15-2025 | | | $ | 1,000,000 | | | $ | 1,093,930 | |
| | | | |
Massachusetts Educational Financing Authority Series B | | | 5.00 | | | | 7-1-2023 | | | | 2,460,000 | | | | 2,708,903 | |
| | | | |
Massachusetts Development Finance Agency Havard University Series A | | | 5.00 | | | | 7-15-2033 | | | | 21,715,000 | | | | 25,568,110 | |
| |
| | | | 29,370,943 | |
| | | | | | | | | | | | | | | | |
| | | | |
| Health Revenue: 0.78% | | | | | | | | | | | | | | | | |
| | | | |
Massachusetts Development Finance Agency Linden Ponds Incorporated Facility 144A | | | 4.00 | | | | 11-15-2023 | | | | 1,335,000 | | | | 1,344,946 | |
| | | | |
Massachusetts Development Finance Agency Partners Healthcare System Issue Series S-3 (SIFMA Municipal Swap +0.50%) ± | | | 2.21 | | | | 7-1-2038 | | | | 14,870,000 | | | | 14,833,271 | |
| |
| | | | 16,178,217 | |
| | | | | | | | | | | | | | | | |
| | | | |
| Miscellaneous Revenue: 2.35% | | | | | | | | | | | | | | | | |
| | | | |
Massachusetts Series A (3 Month LIBOR +0.55%) ± | | | 2.25 | | | | 11-1-2025 | | | | 15,800,000 | | | | 15,608,504 | |
| | | | |
Massachusetts Water Pollution Abatement Trust Series 17 | | | 5.00 | | | | 2-1-2031 | | | | 10,000,000 | | | | 11,094,400 | |
| | | | |
Massachusetts Water Pollution Abatement Trust Series 17 | | | 5.00 | | | | 2-1-2032 | | | | 10,000,000 | | | | 11,053,300 | |
| | | | |
Massachusetts Water Pollution Abatement Trust Series 17 | | | 5.00 | | | | 2-1-2033 | | | | 10,000,000 | | | | 11,028,600 | |
| |
| | | | 48,784,804 | |
| | | | | | | | | | | | | | | | |
| | | | |
| Tax Revenue: 0.44% | | | | | | | | | | | | | | | | |
| | | | |
Massachusetts Bay Transportation Authority Assessment Bonds Series A | | | 4.00 | | | | 7-1-2037 | | | | 9,000,000 | | | | 9,248,220 | |
| | | | | | | | | | | | | | | | |
| |
| | | | 103,582,184 | |
| | | | | | | | | | | | | | | | |
| | | | |
Michigan: 2.53% | | | | | | | | | | | | | | | | |
| | | | |
| Airport Revenue: 0.05% | | | | | | | | | | | | | | | | |
| | | | |
Wayne County MI Airport Authority AMT Detroit Metropolitan Airport Series C | | | 5.00 | | | | 12-1-2022 | | | | 1,000,000 | | | | 1,058,860 | |
| | | | | | | | | | | | | | | | |
| | | | |
| Education Revenue: 0.07% | | | | | | | | | | | | | | | | |
| | | | |
Michigan Finance Authority Series 25-A | | | 5.00 | | | | 11-1-2019 | | | | 1,500,000 | | | | 1,531,845 | |
| | | | | | | | | | | | | | | | |
| | | | |
| GO Revenue: 0.50% | | | | | | | | | | | | | | | | |
| | | | |
Constantine MI Public Schools (Qualified School Board Loan Fund Insured) | | | 5.00 | | | | 5-1-2020 | | | | 350,000 | | | | 364,434 | |
| | | | |
Constantine MI Public Schools (Qualified School Board Loan Fund Insured) | | | 5.00 | | | | 5-1-2021 | | | | 1,200,000 | | | | 1,282,020 | |
| | | | |
Forest Hills MI Public Schools | | | 5.00 | | | | 5-1-2020 | | | | 1,600,000 | | | | 1,667,264 | |
| | | | |
Forest Hills MI Public Schools | | | 5.00 | | | | 5-1-2021 | | | | 1,600,000 | | | | 1,711,616 | |
| | | | |
Fraser MI Public Schools District (Qualified School Board Loan Fund Insured) | | | 5.00 | | | | 5-1-2021 | | | | 1,000,000 | | | | 1,069,760 | |
| | | | |
Fraser MI Public Schools District (Qualified School Board Loan Fund Insured) | | | 5.00 | | | | 5-1-2022 | | | | 610,000 | | | | 667,791 | |
| | | | |
Hudsonville MI Public Schools (Qualified School Board Loan Fund Insured) | | | 5.00 | | | | 5-1-2021 | | | | 1,465,000 | | | | 1,567,902 | |
| | | | |
Ingham County MI Williamston Community Schools Series A (Qualified School Board Loan Fund Insured) | | | 4.00 | | | | 5-1-2024 | | | | 1,025,000 | | | | 1,090,159 | |
| | | | |
Ingham County MI Williamston Community Schools Series A (Qualified School Board Loan Fund Insured) | | | 4.00 | | | | 5-1-2025 | | | | 1,000,000 | | | | 1,066,720 | |
| |
| | | | 10,487,666 | |
| | | | | | | | | | | | | | | | |
| | | | |
| Housing Revenue: 0.46% | | | | | | | | | | | | | | | | |
| | | | |
Michigan Housing Development Authority Series E (3 Month LIBOR +1.00%) ± | | | 2.68 | | | | 4-1-2042 | | | | 9,405,000 | | | | 9,493,877 | |
| | | | | | | | | | | | | | | | |
The accompanying notes are an integral part of these financial statements.
| | | | |
| 18 | | Wells Fargo Strategic Municipal Bond Fund | | Portfolio of investments—December 31, 2018 (unaudited) |
| | | | | | | | | | | | | | | | |
| Security name | | Interest rate | | | Maturity date | | | Principal | | | Value | |
| | | | |
| Miscellaneous Revenue: 0.34% | | | | | | | | | | | | | | | | |
| | | | |
Michigan Finance Authority Senior Lien Distributable State Aid | | | 5.00 | % | | | 11-1-2028 | | | $ | 865,000 | | | $ | 1,041,495 | |
| | | | |
Michigan Finance Authority Senior Lien Distributable State Aid | | | 5.00 | | | | 11-1-2029 | | | | 1,500,000 | | | | 1,784,595 | |
| | | | |
Michigan Municipal Bond Authority Local Government Loan Program Series A (Ambac Insured) | | | 4.00 | | | | 11-1-2019 | | | | 305,000 | | | | 305,235 | |
| | | | |
Michigan Municipal Bond Authority Local Government Loan Program Series C (Ambac Insured) | | | 4.13 | | | | 5-1-2020 | | | | 500,000 | | | | 500,270 | |
| | | | |
Michigan Municipal Bond Authority Local Government Loan Program Series C (Ambac Insured) | | | 5.00 | | | | 5-1-2023 | | | | 1,900,000 | | | | 1,901,311 | |
| | | | |
Michigan Public Educational Facilities Authority Chandler Park Academy | | | 6.35 | | | | 11-1-2028 | | | | 1,500,000 | | | | 1,501,905 | |
| |
| | | | 7,034,811 | |
| | | | | | | | | | | | | | | | |
| | | | |
| Tax Revenue: 0.28% | | | | | | | | | | | | | | | | |
| | | | |
Michigan Finance Authority Detroit Recovery Project Series 2014F | | | 3.40 | | | | 10-1-2020 | | | | 500,000 | | | | 505,485 | |
| | | | |
Michigan Finance Authority Detroit Recovery Project Series 2014F | | | 3.60 | | | | 10-1-2021 | | | | 500,000 | | | | 510,215 | |
| | | | |
Michigan Finance Authority Detroit Recovery Project Series 2014F | | | 3.80 | | | | 10-1-2022 | | | | 500,000 | | | | 516,200 | |
| | | | |
Michigan Finance Authority Detroit Recovery Project Series 2014F | | | 3.88 | | | | 10-1-2023 | | | | 2,500,000 | | | | 2,602,725 | |
| | | | |
Michigan Finance Authority Series H-1 | | | 5.00 | | | | 10-1-2021 | | | | 1,565,000 | | | | 1,636,787 | |
| |
| | | | 5,771,412 | |
| | | | | | | | | | | | | | | | |
| | | | |
| Water & Sewer Revenue: 0.83% | | | | | | | | | | | | | | | | |
| | | | |
Detroit MI Water & Sewage Department Series A | | | 5.00 | | | | 7-1-2022 | | | | 1,000,000 | | | | 1,085,950 | |
| | | | |
Michigan Financial Authority Local Government Loan Program Series C7 (National Insured) | | | 5.00 | | | | 7-1-2022 | | | | 2,000,000 | | | | 2,180,320 | |
| | | | |
Michigan Financial Authority Local Government Loan Program Series D1 (AGM Insured) | | | 5.00 | | | | 7-1-2022 | | | | 2,700,000 | | | | 2,962,494 | |
| | | | |
Michigan Financial Authority Local Government Loan Program Series D1 (AGM Insured) | | | 5.00 | | | | 7-1-2023 | | | | 2,000,000 | | | | 2,241,120 | |
| | | | |
Michigan Financial Authority Local Government Loan Program Series D6 (National Insured) | | | 5.00 | | | | 7-1-2022 | | | | 2,080,000 | | | | 2,267,533 | |
| | | | |
Michigan Financial Authority Local Government Loan Program Series D6 (National Insured) | | | 5.00 | | | | 7-1-2023 | | | | 3,670,000 | | | | 4,085,848 | |
| | | | |
Michigan Financial Authority Local Government Loan Program Series D6 (National Insured) | | | 5.00 | | | | 7-1-2024 | | | | 2,130,000 | | | | 2,405,281 | |
| |
| | | | 17,228,546 | |
| | | | | | | | | | | | | | | | |
| |
| | | | 52,607,017 | |
| | | | | | | | | | | | | | | | |
| | | | |
Minnesota: 0.43% | | | | | | | | | | | | | | | | |
| | | | |
| Education Revenue: 0.11% | | | | | | | | | | | | | | | | |
| | | | |
Cologne MN Charter School Lease Academy Project Series 2014A | | | 4.00 | | | | 7-1-2019 | | | | 170,000 | | | | 170,612 | |
| | | | |
Cologne MN Charter School Lease Academy Project Series 2014A | | | 4.00 | | | | 7-1-2023 | | | | 260,000 | | | | 263,523 | |
| | | | |
St. Paul MN Housing & RDA Charter School Hmong College Preparatory Academy Project Series A | | | 4.75 | | | | 9-1-2022 | | | | 500,000 | | | | 511,680 | |
| | | | |
St. Paul MN Housing & RDA Charter School Hmong College Preparatory Academy Project Series A | | | 5.00 | | | | 9-1-2026 | | | | 1,000,000 | | | | 1,053,900 | |
| | | | |
St. Paul MN Housing & RDA Great River School Project Series A 144A | | | 4.75 | | | | 7-1-2029 | | | | 250,000 | | | | 253,313 | |
| |
| | | | 2,253,028 | |
| | | | | | | | | | | | | | | | |
The accompanying notes are an integral part of these financial statements.
| | | | | | |
| Portfolio of investments—December 31, 2018 (unaudited) | | Wells Fargo Strategic Municipal Bond Fund | | | 19 | |
| | | | | | | | | | | | | | | | |
| Security name | | Interest rate | | | Maturity date | | | Principal | | | Value | |
| | | | |
| Health Revenue: 0.32% | | | | | | | | | | | | | | | | |
| | | | |
Kanabec County MN Firstlight Health Kanabec Hospital | | | 2.75 | % | | | 12-1-2019 | | | $ | 2,000,000 | | | $ | 1,999,800 | |
| | | | |
St. Paul MN Housing & RDA HealthEast Care System Project Series 2015A | | | 5.25 | | | | 11-15-2028 | | | | 1,505,000 | | | | 1,597,001 | |
| | | | |
St. Paul MN Housing & RDA HealthEast Care System Project Series 2015A | | | 5.25 | | | | 11-15-2035 | | | | 2,850,000 | | | | 3,024,221 | |
| |
| | | | 6,621,022 | |
| | | | | | | | | | | | | | | | |
| |
| | | | 8,874,050 | |
| | | | | | | | | | | | | | | | |
| | | | |
Mississippi: 0.72% | | | | | | | | | | | | | | | | |
| | | | |
| Health Revenue: 0.24% | | | | | | | | | | | | | | | | |
| | | | |
Mississippi HFFA Baptist Health System Series A (SIFMA Municipal Swap +1.30%) ± | | | 3.01 | | | | 8-15-2036 | | | | 5,000,000 | | | | 5,033,800 | |
| | | | | | | | | | | | | | | | |
| | | | |
| Industrial Development Revenue: 0.48% | | | | | | | | | | | | | | | | |
| | | | |
Mississippi Business Finance Commission Gulf Opportunity Zone Chevron USA Incorporated Project Series A ø | | | 1.67 | | | | 12-1-2030 | | | | 10,000,000 | | | | 10,000,000 | |
| | | | | | | | | | | | | | | | |
| |
| | | | 15,033,800 | |
| | | | | | | | | | | | | | | | |
| | | | |
Missouri: 0.87% | | | | | | | | | | | | | | | | |
| | | | |
| Health Revenue: 0.10% | | | | | | | | | | | | | | | | |
| | | | |
Lees Summit MO IDA Senior Living Facilities Revenue Series A | | | 5.00 | | | | 8-15-2019 | | | | 1,000,000 | | | | 1,011,240 | |
| | | | |
Lees Summit MO IDA Senior Living Facilities Revenue Series A | | | 5.00 | | | | 8-15-2020 | | | | 1,075,000 | | | | 1,102,133 | |
| |
| | | | 2,113,373 | |
| | | | | | | | | | | | | | | | |
| | | | |
| Miscellaneous Revenue: 0.41% | | | | | | | | | | | | | | | | |
| | | | |
Branson MO IDA Branson Shoppes Series A | | | 3.00 | | | | 11-1-2019 | | | | 800,000 | | | | 801,216 | |
| | | | |
Branson MO IDA Branson Shoppes Series A | | | 3.00 | | | | 11-1-2021 | | | | 350,000 | | | | 348,205 | |
| | | | |
Branson MO IDA Branson Shoppes Series A | | | 4.00 | | | | 11-1-2022 | | | | 350,000 | | | | 357,718 | |
| | | | |
Branson MO IDA Branson Shoppes Series A | | | 4.00 | | | | 11-1-2023 | | | | 750,000 | | | | 764,153 | |
| | | | |
Platte County MO Riverside-Quindaro Bend Levee District Project L-385 | | | 3.00 | | | | 3-1-2020 | | | | 900,000 | | | | 906,750 | |
| | | | |
Platte County MO Riverside-Quindaro Bend Levee District Project L-385 | | | 4.00 | | | | 3-1-2021 | | | | 930,000 | | | | 957,361 | |
| | | | |
Platte County MO Riverside-Quindaro Bend Levee District Project L-385 | | | 4.00 | | | | 3-1-2022 | | | | 970,000 | | | | 1,005,842 | |
| | | | |
Platte County MO Riverside-Quindaro Bend Levee District Project L-385 | | | 4.00 | | | | 3-1-2023 | | | | 1,010,000 | | | | 1,052,016 | |
| | | | |
Platte County MO Riverside-Quindaro Bend Levee District Project L-385 | | | 5.00 | | | | 3-1-2024 | | | | 1,000,000 | | | | 1,087,450 | |
| | | | |
Platte County MO Riverside-Quindaro Bend Levee District Project L-385 | | | 5.00 | | | | 3-1-2025 | | | | 1,105,000 | | | | 1,206,329 | |
| |
| | | | 8,487,040 | |
| | | | | | | | | | | | | | | | |
| | | | |
| Tax Revenue: 0.16% | | | | | | | | | | | | | | | | |
| | | | |
Arnold MO Real Property Arnold Triangle Redevelopment Project Series A | | | 3.75 | | | | 5-1-2023 | | | | 1,300,000 | | | | 1,298,401 | |
| | | | |
Lees Summit MO Summit Fair Project Series 2017 144A | | | 3.50 | | | | 11-1-2023 | | | | 620,000 | | | | 609,026 | |
| | | | |
Richmond Heights MO Francis Place Redevelopment Project | | | 5.63 | | | | 11-1-2025 | | | | 1,500,000 | | | | 1,499,985 | |
| |
| | | | 3,407,412 | |
| | | | | | | | | | | | | | | | |
| | | | |
| Water & Sewer Revenue: 0.20% | | | | | | | | | | | | | | | | |
| | | | |
Kansas City MO Sanitation Sewer System Revenue Series B | | | 5.00 | | | | 1-1-2020 | | | | 400,000 | | | | 412,720 | |
| | | | |
Kansas City MO Sanitation Sewer System Revenue Series B | | | 5.00 | | | | 1-1-2021 | | | | 575,000 | | | | 610,771 | |
| | | | |
Kansas City MO Sanitation Sewer System Revenue Series B | | | 5.00 | | | | 1-1-2023 | | | | 805,000 | | | | 898,581 | |
| | | | |
Kansas City MO Sanitation Sewer System Revenue Series B | | | 5.00 | | | | 1-1-2025 | | | | 810,000 | | | | 941,163 | |
The accompanying notes are an integral part of these financial statements.
| | | | |
| 20 | | Wells Fargo Strategic Municipal Bond Fund | | Portfolio of investments—December 31, 2018 (unaudited) |
| | | | | | | | | | | | | | | | |
| Security name | | Interest rate | | | Maturity date | | | Principal | | | Value | |
| | | | |
| Water & Sewer Revenue(continued) | | | | | | | | | | | | | | | | |
| | | | |
Kansas City MO Sanitation Sewer System Revenue Series B | | | 5.00 | % | | | 1-1-2027 | | | $ | 700,000 | | | $ | 837,298 | |
| | | | |
Kansas City MO Sanitation Sewer System Revenue Series B | | | 5.00 | | | | 1-1-2028 | | | | 275,000 | | | | 332,285 | |
| |
| | | | 4,032,818 | |
| | | | | | | | | | | | | | | | |
| |
| | | | 18,040,643 | |
| | | | | | | | | | | | | | | | |
| | | | |
Nebraska: 0.43% | | | | | | | | | | | | | | | | |
| | | | |
| Utilities Revenue: 0.43% | | | | | | | | | | | | | | | | |
| | | | |
Central Plains Energy Nebraska Gas Project #3 | | | 5.00 | | | | 9-1-2025 | | | | 3,290,000 | | | | 3,661,375 | |
| | | | |
Central Plains Energy Nebraska Gas Project #3 | | | 5.00 | | | | 9-1-2026 | | | | 3,750,000 | | | | 4,194,450 | |
| | | | |
Central Plains Energy Nebraska Gas Project #3 | | | 5.00 | | | | 9-1-2027 | | | | 1,000,000 | | | | 1,120,720 | |
| |
| | | | 8,976,545 | |
| | | | | | | | | | | | | | | | |
| | | | |
New Hampshire: 0.47% | | | | | | | | | | | | | | | | |
| | | | |
| Health Revenue: 0.47% | | | | | | | | | | | | | | | | |
| | | | |
New Hampshire Covenant Health Systems Series B | | | 5.00 | | | | 7-1-2028 | | | | 6,400,000 | | | | 6,446,080 | |
| | | | |
New Hampshire HEFA Hillside Village Issue Series 2017C 144A | | | 3.50 | | | | 7-1-2022 | | | | 3,350,000 | | | | 3,350,469 | |
| |
| | | | 9,796,549 | |
| | | | | | | | | | | | | | | | |
| | | | |
New Jersey: 4.15% | | | | | | | | | | | | | | | | |
| | | | |
| Airport Revenue: 0.26% | | | | | | | | | | | | | | | | |
| | | | |
South Jersey NJ Port Corporation Marine Terminal Series R | | | 4.00 | | | | 1-1-2022 | | | | 1,600,000 | | | | 1,649,200 | |
| | | | |
South Jersey NJ Port Corporation Marine Terminal Series S-2 | | | 5.00 | | | | 1-1-2023 | | | | 1,665,000 | | | | 1,794,021 | |
| | | | |
South Jersey NJ Port Corporation Marine Terminal Series S-2 | | | 5.00 | | | | 1-1-2024 | | | | 1,750,000 | | | | 1,910,370 | |
| |
| | | | 5,353,591 | |
| | | | | | | | | | | | | | | | |
| | | | |
| Education Revenue: 0.19% | | | | | | | | | | | | | | | | |
| | | | |
New Jersey Higher Education Student Assistance Authority Series 2017-1B | | | 5.00 | | | | 12-1-2020 | | | | 2,250,000 | | | | 2,355,998 | |
| | | | |
New Jersey Higher Education Student Assistance Authority Series 2017-1B | | | 5.00 | | | | 12-1-2021 | | | | 1,390,000 | | | | 1,485,340 | |
| |
| | | | 3,841,338 | |
| | | | | | | | | | | | | | | | |
| | | | |
| GO Revenue: 0.02% | | | | | | | | | | | | | | | | |
| | | | |
Paterson NJ General Improvement (AGM Insured) | | | 5.00 | | | | 6-15-2020 | | | | 400,000 | | | | 404,224 | |
| | | | | | | | | | | | | | | | |
| | | | |
| Housing Revenue: 0.48% | | | | | | | | | | | | | | | | |
| | | | |
New Jersey Housing & Mortgage Finance Agency Multifamily Series C | | | 2.41 | | | | 10-1-2021 | | | | 10,000,000 | | | | 10,045,800 | |
| | | | | | | | | | | | | | | | |
| | | | |
| Industrial Development Revenue: 0.14% | | | | | | | | | | | | | | | | |
| | | | |
New Jersey EDA Elite Pharmaceuticals Project Series A | | | 6.50 | | | | 9-1-2030 | | | | 375,000 | | | | 337,354 | |
| | | | |
New Jersey EDA The Goethals Bridge Replacement Project | | | 5.00 | | | | 7-1-2020 | | | | 500,000 | | | | 518,970 | |
| | | | |
New Jersey EDA The Goethals Bridge Replacement Project | | | 5.00 | | | | 1-1-2021 | | | | 585,000 | | | | 613,045 | |
| | | | |
New Jersey EDA The Goethals Bridge Replacement Project | | | 5.00 | | | | 7-1-2021 | | | | 900,000 | | | | 952,515 | |
| | | | |
New Jersey EDA The Goethals Bridge Replacement Project | | | 5.00 | | | | 1-1-2023 | | | | 400,000 | | | | 433,352 | |
| |
| | | | 2,855,236 | |
| | | | | | | | | | | | | | | | |
| | | | |
| Miscellaneous Revenue: 1.57% | | | | | | | | | | | | | | | | |
| | | | |
New Jersey EDA Motor Vehicle Surcharge Revenue Refunding Bond Series A | | | 3.13 | | | | 7-1-2029 | | | | 6,000,000 | | | | 6,000,420 | |
| | | | |
New Jersey EDA Motor Vehicle Surcharge Revenue Series A | | | 3.38 | | | | 7-1-2030 | | | | 9,705,000 | | | | 9,618,237 | |
The accompanying notes are an integral part of these financial statements.
| | | | | | |
| Portfolio of investments—December 31, 2018 (unaudited) | | Wells Fargo Strategic Municipal Bond Fund | | | 21 | |
| | | | | | | | | | | | | | | | |
| Security name | | Interest rate | | | Maturity date | | | Principal | | | Value | |
| | | | |
| Miscellaneous Revenue(continued) | | | | | | | | | | | | | | | | |
| | | | |
New Jersey EDA School Facilities Construction Project Prerefunded Bond Series EE | | | 5.50 | % | | | 9-1-2021 | | | $ | 2,025,000 | | | $ | 2,176,794 | |
| | | | |
New Jersey EDA School Facilities Construction Project Series EE | | | 5.25 | | | | 9-1-2025 | | | | 1,800,000 | | | | 1,890,630 | |
| | | | |
New Jersey EDA School Facilities Construction Project Series K (Ambac Insured) | | | 5.25 | | | | 12-15-2020 | | | | 3,000,000 | | | | 3,163,650 | |
| | | | |
New Jersey EDA School Facilities Construction Project Series NN (AGM Insured) | | | 5.00 | | | | 3-1-2024 | | | | 1,645,000 | | | | 1,794,942 | |
| | | | |
New Jersey TTFA Series A | | | 5.00 | | | | 6-15-2022 | | | | 4,815,000 | | | | 5,086,325 | |
| | | | |
Newark NJ Housing Authority (National Insured) | | | 5.25 | | | | 1-1-2019 | | | | 2,995,000 | | | | 2,995,000 | |
| |
| | | | 32,725,998 | |
| | | | | | | | | | | | | | | | |
| | | | |
| Tax Revenue: 0.04% | | | | | | | | | | | | | | | | |
| | | | |
New Jersey EDA School Facilities Construction Project Unrefunded Bond Series EE | | | 5.50 | | | | 9-1-2021 | | | | 750,000 | | | | 795,878 | |
| | | | | | | | | | | | | | | | |
| | | | |
| Transportation Revenue: 1.45% | | | | | | | | | | | | | | | | |
| | | | |
New Jersey TTFA CAB Series A (z) | | | 4.44 | | | | 12-15-2026 | | | | 12,000,000 | | | | 8,868,600 | |
| | | | |
New Jersey TTFA Series A | | | 5.25 | | | | 12-15-2020 | | | | 1,900,000 | | | | 2,003,645 | |
| | | | |
New Jersey TTFA Series A | | | 5.25 | | | | 6-15-2022 | | | | 2,785,000 | | | | 2,958,366 | |
| | | | |
New Jersey TTFA Series AA | | | 5.00 | | | | 6-15-2023 | | | | 4,665,000 | | | | 5,083,357 | |
| | | | |
New Jersey TTFA Series AA | | | 5.00 | | | | 6-15-2023 | | | | 1,350,000 | | | | 1,451,156 | |
| | | | |
New Jersey TTFA Series B | | | 5.00 | | | | 6-15-2020 | | | | 2,150,000 | | | | 2,230,733 | |
| | | | |
New Jersey TTFA Series D | | | 5.00 | | | | 12-15-2023 | | | | 6,960,000 | | | | 7,632,684 | |
| |
| | | | 30,228,541 | |
| | | | | | | | | | | | | | | | |
| |
| | | | 86,250,606 | |
| | | | | | | | | | | | | | | | |
| | | | |
New Mexico: 0.82% | | | | | | | | | | | | | | | | |
| | | | |
| Utilities Revenue: 0.82% | | | | | | | | | | | | | | | | |
| | | | |
New Mexico Municipal Energy Acquisition Authority Gas Supply Subordinate Bond Series B (1 Month LIBOR +0.75%) (Royal Bank of Canada SPA) ± | | | 2.32 | | | | 11-1-2039 | | | | 17,100,000 | | | | 17,102,907 | |
| | | | | | | | | | | | | | | | |
| | | | |
New York: 6.55% | | | | | | | | | | | | | | | | |
| | | | |
| Airport Revenue: 1.73% | | | | | | | | | | | | | | | | |
| | | | |
Port Authority of New York & New Jersey Consolidated Bonds One Hundred Eighty-Fifth Series | | | 5.00 | | | | 9-1-2028 | | | | 5,000,000 | | | | 5,622,150 | |
| | | | |
Port Authority of New York & New Jersey Consolidated Bonds One Hundred Seventy-Second Series | | | 5.00 | | | | 10-1-2027 | | | | 5,000,000 | | | | 5,404,900 | |
| | | | |
Port Authority of New York & New Jersey Consolidated Bonds Two Hundred Seventh Series | | | 5.00 | | | | 9-15-2027 | | | | 21,270,000 | | | | 25,021,815 | |
| |
| | | | 36,048,865 | |
| | | | | | | | | | | | | | | | |
| | | | |
| Education Revenue: 0.38% | | | | | | | | | | | | | | | | |
| | | | |
Albany NY IDA Foundation State University Project Series A ø | | | 1.93 | | | | 7-1-2032 | | | | 2,675,000 | | | | 2,675,000 | |
| | | | |
Build New York City Resource Corporation Bronx Charter School for International Cultures & Arts Series A | | | 3.88 | | | | 4-15-2023 | | | | 1,000,000 | | | | 1,006,830 | |
| | | | |
Hempstead Town NY Local Development Corporation Academy Charter School Project Series A | | | 5.45 | | | | 2-1-2027 | | | | 2,880,000 | | | | 2,735,424 | |
| | | | |
Hempstead Town NY Local Development Corporation Academy Charter School Project Series A | | | 6.47 | | | | 2-1-2033 | | | | 1,435,000 | | | | 1,407,678 | |
| |
| | | | 7,824,932 | |
| | | | | | | | | | | | | | | | |
The accompanying notes are an integral part of these financial statements.
| | | | |
| 22 | | Wells Fargo Strategic Municipal Bond Fund | | Portfolio of investments—December 31, 2018 (unaudited) |
| | | | | | | | | | | | | | | | |
| Security name | | Interest rate | | | Maturity date | | | Principal | | | Value | |
| | | | |
| Health Revenue: 0.35% | | | | | | | | | | | | | | | | |
| | | | |
Monroe County NY Industrial Development Corporation Unity Hospital Rochester Project (FHA Insured) | | | 4.20 | % | | | 8-15-2025 | | | $ | 7,195,000 | | | $ | 7,205,864 | |
| | | | | | | | | | | | | | | | |
| | | | |
| Housing Revenue: 0.56% | | | | | | | | | | | | | | | | |
| | | | |
New York HFA Affordable Housing Project Series M (GNMA/FNMA/FHLMC Insured) | | | 2.00 | | | | 5-1-2021 | | | | 11,625,000 | | | | 11,593,380 | |
| | | | | | | | | | | | | | | | |
| | | | |
| Industrial Development Revenue: 0.59% | | | | | | | | | | | | | | | | |
| | | | |
New York Transportation Development Corporation Special Facilities Bonds Series 2018 | | | 5.00 | | | | 1-1-2025 | | | | 11,030,000 | | | | 12,308,929 | |
| | | | | | | | | | | | | | | | |
| | | | |
| Tax Revenue: 0.36% | | | | | | | | | | | | | | | | |
| | | | |
New York Metropolitan Transportation Authority Dedicated Tax Fund (SIFMA Municipal Swap +0.95%) ± | | | 2.66 | | | | 11-1-2019 | | | | 7,500,000 | | | | 7,522,650 | |
| | | | | | | | | | | | | | | | |
| | | | |
| Tobacco Revenue: 0.06% | | | | | | | | | | | | | | | | |
| | | | |
Suffolk County NY Tobacco Asset Securitization Corporation | | | 5.00 | | | | 6-1-2019 | | | | 575,000 | | | | 581,015 | |
| | | | |
Suffolk County NY Tobacco Asset Securitization Corporation | | | 5.00 | | | | 6-1-2020 | | | | 625,000 | | | | 645,194 | |
| |
| | | | 1,226,209 | |
| | | | | | | | | | | | | | | | |
| | | | |
| Transportation Revenue: 1.56% | | | | | | | | | | | | | | | | |
| | | | |
New York Metropolitan Transportation Authority Subordinated Bond Series D (1 Month LIBOR +0.65%) ø | | | 2.22 | | | | 11-1-2035 | | | | 18,000,000 | | | | 18,000,000 | |
| | | | |
New York Triborough Bridge & Tunnel Authority Series B (United States Secured Overnight Financing Rate +0.50%) ± | | | 2.12 | | | | 11-15-2038 | | | | 14,500,000 | | | | 14,526,680 | |
| |
| | | | 32,526,680 | |
| | | | | | | | | | | | | | | | |
| | | | |
| Utilities Revenue: 0.96% | | | | | | | | | | | | | | | | |
| | | | |
Long Island NY Power Authority Electric System Series C (1 Month LIBOR +0.75%) ± | | | 2.39 | | | | 5-1-2033 | | | | 15,000,000 | | | | 14,993,250 | |
| | | | |
New York NY IDA Brooklyn Navy Yard Cogeneration Partners LP | | | 5.65 | | | | 10-1-2028 | | | | 5,000,000 | | | | 5,048,050 | |
| |
| | | | 20,041,300 | |
| | | | | | | | | | | | | | | | |
| |
| | | | 136,298,809 | |
| | | | | | | | | | | | | | | | |
| | | | |
Ohio: 0.61% | | | | | | | | | | | | | | | | |
| | | | |
| Education Revenue: 0.10% | | | | | | | | | | | | | | | | |
| | | | |
Portage County OH Port Authority Northeast Ohio Medical University Project | | | 5.00 | | | | 12-1-2026 | | | | 1,980,000 | | | | 2,088,999 | |
| | | | | | | | | | | | | | | | |
| | | | |
| Health Revenue: 0.27% | | | | | | | | | | | | | | | | |
| | | | |
Akron OH Bath and Copley Joint Township Hospital District | | | 5.00 | | | | 1-1-2031 | | | | 2,000,000 | | | | 2,164,440 | |
| | | | |
Allen County OH Hospital Facilities Revenue Bonds Series B | | | 5.00 | | | | 8-1-2047 | | | | 2,500,000 | | | | 2,735,075 | |
| | | | |
Hamilton County OH Healthcare Series 2017 | | | 3.00 | | | | 1-1-2022 | | | | 690,000 | | | | 682,783 | |
| |
| | | | 5,582,298 | |
| | | | | | | | | | | | | | | | |
| | | | |
| Resource Recovery Revenue: 0.24% | | | | | | | | | | | | | | | | |
| | | | |
Ohio Air Quality Development Authority Ohio Valley Electric Corporation Series E | | | 5.63 | | | | 10-1-2019 | | | | 4,850,000 | | | | 4,920,471 | |
| | | | | | | | | | | | | | | | |
| |
| | | | 12,591,768 | |
| | | | | | | | | | | | | | | | |
The accompanying notes are an integral part of these financial statements.
| | | | | | |
| Portfolio of investments—December 31, 2018 (unaudited) | | Wells Fargo Strategic Municipal Bond Fund | | | 23 | |
| | | | | | | | | | | | | | | | |
| Security name | | Interest rate | | | Maturity date | | | Principal | | | Value | |
| | | | |
Oklahoma: 0.21% | | | | | | | | | | | | | | | | |
| | | | |
| Tax Revenue: 0.21% | | | | | | | | | | | | | | | | |
| | | | |
Tulsa OK Public Facilities Authority Capital Improvements | | | 4.00 | % | | | 10-1-2027 | | | $ | 4,050,000 | | | $ | 4,433,373 | |
| | | | | | | | | | | | | | | | |
| | | | |
Other: 0.05% | | | | | | | | | | | | | | | | |
| | | | |
| Miscellaneous Revenue: 0.05% | | | | | | | | | | | | | | | | |
| | | | |
Public Housing Capital Fund Trust II (HUD Insured) 144A | | | 4.50 | | | | 7-1-2022 | | | | 1,103,180 | | | | 1,103,180 | |
| | | | | | | | | | | | | | | | |
| | | | |
Pennsylvania: 5.15% | | | | | | | | | | | | | | | | |
| | | | |
| Education Revenue: 0.70% | | | | | | | | | | | | | | | | |
| | | | |
Chester County PA IDA Avon Grove Charter School Project Series 2017A | | | 4.00 | | | | 12-15-2027 | | | | 2,110,000 | | | | 2,094,281 | |
| | | | |
Chester County PA IDA Collegium Charter School Project Series A | | | 3.70 | | | | 10-15-2022 | | | | 1,150,000 | | | | 1,134,958 | |
| | | | |
Montgomery County PA HEFAR Arcadia University | | | 5.00 | | | | 4-1-2022 | | | | 1,575,000 | | | | 1,687,754 | |
| | | | |
Montgomery County PA HEFAR Arcadia University | | | 5.00 | | | | 4-1-2023 | | | | 1,605,000 | | | | 1,745,309 | |
| | | | |
Philadelphia PA IDA Charter School Project A | | | 4.50 | | | | 8-1-2026 | | | | 3,365,000 | | | | 3,397,169 | |
| | | | |
Philadelphia PA IDA Charter School Project Series 2016B | | | 4.88 | | | | 8-1-2026 | | | | 2,190,000 | | | | 2,207,170 | |
| | | | |
Philadelphia PA IDA Tacony Academy Christian School Project Series A-1 | | | 6.25 | | | | 6-15-2023 | | | | 630,000 | | | | 670,339 | |
| | | | |
Philadelphia PA IDA University of the Arts Series 2017 144A | | | 5.00 | | | | 3-15-2019 | | | | 325,000 | | | | 325,770 | |
| | | | |
Philadelphia PA IDA University of the Arts Series 2017 144A | | | 5.00 | | | | 3-15-2021 | | | | 1,205,000 | | | | 1,230,064 | |
| |
| | | | 14,492,814 | |
| | | | | | | | | | | | | | | | |
| | | | |
| GO Revenue: 1.61% | | | | | | | | | | | | | | | | |
| | | | |
Allegheny County PA Penn Hills Schools District Series 2015 (Build America Mutual Assurance Company Insured) | | | 5.00 | | | | 11-15-2022 | | | | 340,000 | | | | 373,238 | |
| | | | |
Allegheny County PA Penn Hills Schools District Series 2015 (Build America Mutual Assurance Company Insured) | | | 5.00 | | | | 11-15-2023 | | | | 1,025,000 | | | | 1,141,707 | |
| | | | |
Bristol Township PA School District | | | 5.25 | | | | 6-1-2031 | | | | 6,990,000 | | | | 7,717,170 | |
| | | | |
Philadelphia PA School District Series B | | | 3.13 | | | | 9-1-2020 | | | | 200,000 | | | | 203,030 | |
| | | | |
Philadelphia PA School District Series D | | | 5.00 | | | | 9-1-2021 | | | | 2,000,000 | | | | 2,143,920 | |
| | | | |
Philadelphia PA School District Series D | | | 5.00 | | | | 9-1-2022 | | | | 3,565,000 | | | | 3,893,123 | |
| | | | |
Philadelphia PA School District Series E | | | 5.25 | | | | 9-1-2022 | | | | 1,525,000 | | | | 1,594,799 | |
| | | | |
Philadelphia PA School District Series E | | | 5.25 | | | | 9-1-2023 | | | | 5,770,000 | | | | 6,029,304 | |
| | | | |
Philadelphia PA School District Series F | | | 5.00 | | | | 9-1-2022 | | | | 5,000,000 | | | | 5,460,200 | |
| | | | |
Scranton PA School District Series A | | | 5.00 | | | | 6-1-2024 | | | | 750,000 | | | | 821,250 | |
| | | | |
Scranton PA School District Series A | | | 5.00 | | | | 6-1-2025 | | | | 1,000,000 | | | | 1,103,560 | |
| | | | |
Scranton PA School District Series B (National Insured) | | | 5.00 | | | | 6-1-2024 | | | | 665,000 | | | | 728,175 | |
| | | | |
Scranton PA School District Series B (National Insured) | | | 5.00 | | | | 6-1-2025 | | | | 710,000 | | | | 785,693 | |
| | | | |
Scranton PA Series 2017 144A | | | 5.00 | | | | 9-1-2023 | | | | 1,355,000 | | | | 1,456,733 | |
| |
| | | | 33,451,902 | |
| | | | | | | | | | | | | | | | |
| | | | |
| Health Revenue: 0.75% | | | | | | | | | | | | | | | | |
| | | | |
Berks County PA Municipal Authority Reading Hospital & Medical Center Project Series B (SIFMA Municipal Swap +1.50%) ± | | | 3.21 | | | | 11-1-2039 | | | | 8,850,000 | | | | 8,984,874 | |
| | | | |
Fulton County PA IDA Medical Center Project | | | 2.40 | | | | 7-1-2020 | | | | 1,600,000 | | | | 1,583,456 | |
| | | | |
Montgomery County PA Higher Education and Thomas Jefferson University (SIFMA Municipal Swap +0.72%) ± | | | 2.43 | | | | 9-1-2051 | | | | 3,500,000 | | | | 3,498,740 | |
| | | | |
Quakertown PA Health Facilities Authority Series A | | | 3.13 | | | | 7-1-2021 | | | | 1,500,000 | | | | 1,472,625 | |
| |
| | | | 15,539,695 | |
| | | | | | | | | | | | | | | | |
The accompanying notes are an integral part of these financial statements.
| | | | |
| 24 | | Wells Fargo Strategic Municipal Bond Fund | | Portfolio of investments—December 31, 2018 (unaudited) |
| | | | | | | | | | | | | | | | |
| Security name | | Interest rate | | | Maturity date | | | Principal | | | Value | |
| | | | |
| Industrial Development Revenue: 0.90% | | | | | | | | | | | | | | | | |
| | | | |
Montgomery County PA IDA Peco Energy Company Project Series A | | | 2.60 | % | | | 3-1-2034 | | | $ | 8,500,000 | | | $ | 8,466,935 | |
| | | | |
Montgomery County PA IDA Peco Energy Company Project Series B | | | 2.55 | | | | 6-1-2029 | | | | 10,340,000 | | | | 10,305,775 | |
| |
| | | | 18,772,710 | |
| | | | | | | | | | | | | | | | |
| | | | |
| Miscellaneous Revenue: 0.22% | | | | | | | | | | | | | | | | |
| | | | |
Pennsylvania Public School Building Authority | | | 5.00 | | | | 4-1-2019 | | | | 4,650,000 | | | | 4,682,504 | |
| | | | | | | | | | | | | | | | |
| | | | |
| Transportation Revenue: 0.49% | | | | | | | | | | | | | | | | |
| | | | |
Pennsylvania Turnpike Commission Series B (SIFMA Municipal Swap +1.27%) ± | | | 2.98 | | | | 12-1-2020 | | | | 10,000,000 | | | | 10,111,000 | |
| | | | | | | | | | | | | | | | |
| | | | |
| Water & Sewer Revenue: 0.48% | | | | | | | | | | | | | | | | |
| | | | |
Pittsburgh PA Water & Sewer Authority Series C (1 Month LIBOR +0.64%) (AGM Insured) ± | | | 2.33 | | | | 9-1-2040 | | | | 10,000,000 | | | | 10,002,600 | |
| | | | | | | | | | | | | | | | |
| |
| | | | 107,053,225 | |
| | | | | | | | | | | | | | | | |
| | | | |
Rhode Island: 0.10% | | | | | | | | | | | | | | | | |
| | | | |
| Housing Revenue: 0.00% | | | | | | | | | | | | | | | | |
| | | | |
Rhode Island Housing & Mortgage Finance | | | 6.50 | | | | 4-1-2027 | | | | 15,000 | | | | 15,071 | |
| | | | | | | | | | | | | | | | |
| | | | |
| Miscellaneous Revenue: 0.10% | | | | | | | | | | | | | | | | |
| | | | |
Providence RI RDA Series A | | | 5.00 | | | | 4-1-2022 | | | | 1,940,000 | | | | 2,083,269 | |
| | | | | | | | | | | | | | | | |
| |
| | | | 2,098,340 | |
| | | | | | | | | | | | | | | | |
| | | | |
South Carolina: 0.67% | | | | | | | | | | | | | | | | |
| | | | |
| Education Revenue: 0.15% | | | | | | | | | | | | | | | | |
| | | | |
South Carolina Jobs EDA East Point Academy Project Series A 144A | | | 2.25 | | | | 5-1-2019 | | | | 2,500,000 | | | | 2,493,425 | |
| | | | |
South Carolina Jobs EDA York Preparatory Academy Project Series A | | | 5.75 | | | | 11-1-2023 | | | | 710,000 | | | | 728,687 | |
| |
| | | | 3,222,112 | |
| | | | | | | | | | | | | | | | |
| | | | |
| Miscellaneous Revenue: 0.26% | | | | | | | | | | | | | | | | |
| | | | |
Lee County SC School Facilities Incorporated (AGM Insured) | | | 2.00 | | | | 6-1-2020 | | | | 185,000 | | | | 184,691 | |
| | | | |
Lee County SC School Facilities Incorporated (AGM Insured) | | | 4.00 | | | | 12-1-2019 | | | | 560,000 | | | | 569,542 | |
| | | | |
Lee County SC School Facilities Incorporated (AGM Insured) | | | 4.00 | | | | 12-1-2020 | | | | 375,000 | | | | 387,986 | |
| | | | |
South Carolina Transportation Infrastructure Refunding Bonds Series A | | | 5.00 | | | | 10-1-2032 | | | | 4,025,000 | | | | 4,293,468 | |
| |
| | | | 5,435,687 | |
| | | | | | | | | | | | | | | | |
| | | | |
| Resource Recovery Revenue: 0.16% | | | | | | | | | | | | | | | | |
| | | | |
South Carolina Jobs EDA Solid Waste Disposal RePower South Berkeley LLC 144A | | | 5.25 | | | | 2-1-2027 | | | | 3,310,000 | | | | 3,239,596 | |
| | | | | | | | | | | | | | | | |
| | | | |
| Utilities Revenue: 0.10% | | | | | | | | | | | | | | | | |
| | | | |
Patriots Energy Group Financing Agency South Carolina Series A | | | 4.00 | | | | 10-1-2048 | | | | 1,895,000 | | | | 2,001,897 | |
| | | | | | | | | | | | | | | | |
| |
| | | | 13,899,292 | |
| | | | | | | | | | | | | | | | |
|
South Dakota: 0.05% | |
|
| Health Revenue: 0.05% | |
| | | | |
South Dakota HEFA | | | 4.50 | | | | 9-1-2019 | | | | 990,000 | | | | 1,007,800 | |
| | | | | | | | | | | | | | | | |
The accompanying notes are an integral part of these financial statements.
| | | | | | |
| Portfolio of investments—December 31, 2018 (unaudited) | | Wells Fargo Strategic Municipal Bond Fund | | | 25 | |
| | | | | | | | | | | | | | | | |
| Security name | | Interest rate | | | Maturity date | | | Principal | | | Value | |
| | | | |
Tennessee: 0.71% | | | | | | | | | | | | | | | | |
| | | | |
| Utilities Revenue: 0.71% | | | | | | | | | | | | | | | | |
| | | | |
Tennessee Energy Acquisition Corporation Gas Project | | | 4.00 | % | | | 11-1-2049 | | | $ | 2,000,000 | | | $ | 2,097,360 | |
| | | | |
Tennessee Energy Acquisition Corporation Series A | | | 4.00 | | | | 5-1-2048 | | | | 11,140,000 | | | | 11,574,794 | |
| | | | |
Tennessee Energy Acquisition Corporation Series B | | | 5.63 | | | | 9-1-2026 | | | | 925,000 | | | | 1,063,417 | |
| |
| | | | 14,735,571 | |
| | | | | | | | | | | | | | | | |
| | | | |
Texas: 13.81% | | | | | | | | | | | | | | | | |
| | | | |
| Airport Revenue: 1.99% | | | | | | | | | | | | | | | | |
| | | | |
Dallas Fort Worth TX International Airport AMT Series E | | | 5.00 | | | | 11-1-2032 | | | | 1,970,000 | | | | 2,045,195 | |
| | | | |
Dallas Fort Worth TX International Airport Improvement Bonds AMT Series H | | | 5.00 | | | | 11-1-2032 | | | | 9,175,000 | | | | 9,673,661 | |
| | | | |
Dallas Fort Worth TX International Airport Improvement Bonds AMT Series H | | | 5.00 | | | | 11-1-2037 | | | | 22,000,000 | | | | 23,043,240 | |
| | | | |
Dallas Fort Worth TX International Airport Refunding Bonds AMT Series A | | | 5.00 | | | | 11-1-2032 | | | | 3,375,000 | | | | 3,657,184 | |
| | | | |
Houston TX Airport System Subordinate Refunding Bonds AMT Series A | | | 5.00 | | | | 7-1-2031 | | | | 2,750,000 | | | | 2,948,165 | |
| |
| | | | 41,367,445 | |
| | | | | | | | | | | | | | | | |
| | | | |
| Education Revenue: 2.05% | | | | | | | | | | | | | | | | |
| | | | |
Arlington TX Higher Education Finance Corporate Education Series A | | | 4.00 | | | | 6-15-2026 | | | | 695,000 | | | | 684,860 | |
| | | | |
Austin TX Community College District Series A | | | 4.00 | | | | 2-1-2023 | | | | 320,000 | | | | 342,342 | |
| | | | |
Clifton TX Higher Education Finance Corporation International Leadership Series 2015A | | | 4.63 | | | | 8-15-2025 | | | | 8,905,000 | | | | 8,882,025 | |
| | | | |
Clifton TX Higher Education Finance Corporation Uplift Education Series 2018D | | | 5.00 | | | | 8-15-2025 | | | | 6,565,000 | | | | 6,800,093 | |
| | | | |
Clifton TX Higher Education Finance Corporation Uplift Education Series A | | | 4.00 | | | | 12-1-2025 | | | | 3,245,000 | | | | 3,313,437 | |
| | | | |
New Hope TX Cultural Education Facilities Finance Corporation Jubilee Academic Center 144A | | | 3.38 | | | | 8-15-2021 | | | | 1,580,000 | | | | 1,560,282 | |
| | | | |
Newark TX Higher Educational Finance Corporation Charter Schools Incorporated Series 2015 A 144A | | | 4.63 | | | | 8-15-2025 | | | | 1,485,000 | | | | 1,532,327 | |
| | | | |
North Texas Higher Education Authority Incorporated Student Loan Series 2 Class A (3 Month LIBOR +1.00%) ± | | | 3.40 | | | | 4-1-2037 | | | | 1,455,000 | | | | 1,467,906 | |
| | | | |
Texas PFA Southern University Financing System (Build America Mutual Assurance Company Insured) | | | 5.00 | | | | 11-1-2020 | | | | 1,715,000 | | | | 1,797,046 | |
| | | | |
Texas PFA Southern University Financing System (Build America Mutual Assurance Company Insured) | | | 5.00 | | | | 11-1-2021 | | | | 1,275,000 | | | | 1,367,234 | |
| | | | |
University of Texas Board of Regents Series 2017C | | | 5.00 | | | | 8-15-2025 | | | | 4,750,000 | | | | 5,577,450 | |
| | | | |
University of Texas Board of Regents Series 2017C | | | 5.00 | | | | 8-15-2026 | | | | 7,780,000 | | | | 9,275,705 | |
| |
| | | | 42,600,707 | |
| | | | | | | | | | | | | | | | |
| | | | |
| GO Revenue: 6.89% | | | | | | | | | | | | | | | | |
| | | | |
Brownsville TX Independent School District Series 2017 | | | 4.00 | | | | 8-15-2021 | | | | 9,555,000 | | | | 10,044,694 | |
| | | | |
Dallas TX GO Refunding & Improvement Bond Series 2017 | | | 5.00 | | | | 2-15-2023 | | | | 7,105,000 | | | | 7,913,336 | |
| | | | |
Denton TX Independent School District Refunding Bonds Series B | | | 5.00 | | | | 8-15-2032 | | | | 5,000,000 | | | | 5,485,850 | |
| | | | |
Houston TX Public Improvement Refunding Bonds Series A | | | 4.00 | | | | 3-1-2031 | | | | 10,110,000 | | | | 10,639,259 | |
| | | | |
Houston TX Public Improvement Refunding Bonds Series A | | | 5.00 | | | | 3-1-2020 | | | | 11,000,000 | | | | 11,402,380 | |
| | | | |
Houston TX Public Improvement Refunding Bonds Series A | | | 5.00 | | | | 3-1-2024 | | | | 3,400,000 | | | | 3,876,238 | |
| | | | |
Katy TX Independent School District Series 2016A | | | 5.00 | | | | 2-15-2023 | | | | 1,415,000 | | | | 1,578,362 | |
| | | | |
Leander TX Independent School District CAB Bonds Series 2014C (z) | | | 4.18 | | | | 8-15-2035 | | | | 2,975,000 | | | | 1,500,828 | |
| | | | |
Northside TX Independent School District Building Bonds Series 2018 | | | 2.75 | | | | 8-1-2048 | | | | 11,275,000 | | | | 11,508,956 | |
| | | | |
Pearland TX Permanent Improvement Series 2015 | | | 5.00 | | | | 3-1-2021 | | | | 1,000,000 | | | | 1,063,550 | |
| | | | |
Texas Anticipation Notes Series 2018 | | | 4.00 | | | | 8-29-2019 | | | | 16,810,000 | | | | 17,050,551 | |
The accompanying notes are an integral part of these financial statements.
| | | | |
| 26 | | Wells Fargo Strategic Municipal Bond Fund | | Portfolio of investments—December 31, 2018 (unaudited) |
| | | | | | | | | | | | | | | | |
| Security name | | Interest rate | | | Maturity date | | | Principal | | | Value | |
| | | | |
| GO Revenue(continued) | | | | | | | | | | | | | | | | |
| | | | |
Texas Transportation Commission Mobility Fund Refunding Bonds Series A | | | 5.00 | % | | | 10-1-2030 | | | $ | 40,760,000 | | | $ | 46,273,175 | |
| | | | |
Texas Transportation Commission Mobility Fund Series B (SIFMA Municipal Swap +0.30%) ± | | | 2.01 | | | | 10-1-2041 | | | | 15,000,000 | | | | 14,959,950 | |
| |
| | | | 143,297,129 | |
| | | | | | | | | | | | | | | | |
| | | | |
| Health Revenue: 0.60% | | | | | | | | | | | | | | | | |
| | | | |
Mesquite TX Health Facilities Development Corporation Christian Care Centers Incorporated Project Series 2016 | | | 1.95 | | | | 2-15-2019 | | | | 500,000 | | | | 499,145 | |
| | | | |
Mesquite TX Health Facilities Development Corporation Christian Care Centers Incorporated Project Series 2016 | | | 5.00 | | | | 2-15-2020 | | | | 810,000 | | | | 822,361 | |
| | | | |
Mesquite TX Health Facilities Development Corporation Christian Care Centers Incorporated Project Series 2016 | | | 5.00 | | | | 2-15-2021 | | | | 560,000 | | | | 573,866 | |
| | | | |
New Hope TX Cultural Education Facilities Finance Corporation Hospital Series 2017A | | | 5.00 | | | | 8-15-2024 | | | | 1,000,000 | | | | 1,144,880 | |
| | | | |
New Hope TX Cultural Education Facilities Finance Corporation Hospital Series 2017A | | | 5.00 | | | | 8-15-2026 | | | | 2,000,000 | | | | 2,352,340 | |
| | | | |
New Hope TX Cultural Education Facilities Finance Corporation Presbyterian Village North Project | | | 5.00 | | | | 10-1-2019 | | | | 405,000 | | | | 410,123 | |
| | | | |
New Hope TX Cultural Education Facilities Finance Corporation Presbyterian Village North Project | | | 5.00 | | | | 10-1-2020 | | | | 680,000 | | | | 698,360 | |
| | | | |
New Hope TX Cultural Education Facilities Finance Corporation Presbyterian Village North Project | | | 5.00 | | | | 10-1-2023 | | | | 1,570,000 | | | | 1,644,057 | |
| | | | |
Tarrant County TX Cultural Education Facilities Finance Corporation Buckner Senior Living-Ventana Project | | | 3.88 | | | | 11-15-2022 | | | | 4,315,000 | | | | 4,263,738 | |
| |
| | | | 12,408,870 | |
| | | | | | | | | | | | | | | | |
| | | | |
| Housing Revenue: 0.43% | | | | | | | | | | | | | | | | |
| | | | |
New Hope TX Cultural Education Facilities Finance Corporation Student Housing Project Series A | | | 3.25 | | | | 8-1-2019 | | | | 5,000,000 | | | | 4,990,900 | |
| | | | |
New Hope TX Cultural Education Facilities Finance Corporation Student Housing Tarleton State University Project | | | 5.38 | | | | 4-1-2028 | | | | 1,845,000 | | | | 1,963,006 | |
| | | | |
Texas New Hope ECFA Collegiate Housing Tarleton State University Series A | | | 4.00 | | | | 4-1-2020 | | | | 185,000 | | | | 187,486 | |
| | | | |
Texas New Hope ECFA Collegiate Housing Tarleton State University Series A | | | 4.00 | | | | 4-1-2021 | | | | 310,000 | | | | 316,600 | |
| | | | |
Texas New Hope ECFA Collegiate Housing Tarleton State University Series A | | | 4.00 | | | | 4-1-2022 | | | | 870,000 | | | | 892,872 | |
| | | | |
Texas New Hope ECFA Collegiate Housing Tarleton State University Series A | | | 5.00 | | | | 4-1-2025 | | | | 480,000 | | | | 520,046 | |
| |
| | | | 8,870,910 | |
| | | | | | | | | | | | | | | | |
| | | | |
| Industrial Development Revenue: 0.08% | | | | | | | | | | | | | | | | |
| | | | |
Austin Convention Enterprises Incorporated Series 2017B | | | 5.00 | | | | 1-1-2019 | | | | 600,000 | | | | 600,000 | |
| | | | |
Austin Convention Enterprises Incorporated Series 2017B | | | 5.00 | | | | 1-1-2020 | | | | 500,000 | | | | 514,345 | |
| | | | |
Austin Convention Enterprises Incorporated Series 2017B | | | 5.00 | | | | 1-1-2021 | | | | 500,000 | | | | 526,670 | |
| |
| | | | 1,641,015 | |
| | | | | | | | | | | | | | | | |
| | | | |
| Miscellaneous Revenue: 0.11% | | | | | | | | | | | | | | | | |
| | | | |
Wood Glen TX Housing Finance Corporation Mortgage Copperwood Project Series A (National/FHA Insured) | | | 7.65 | | | | 7-1-2022 | | | | 2,125,000 | | | | 2,369,014 | |
| | | | | | | | | | | | | | | | |
| | | | |
| Resource Recovery Revenue: 0.20% | | | | | | | | | | | | | | | | |
| | | | |
Port Arthur TX Navigation District Jefferson County Environmental Facilities Motiva Enterprises LLC Project Series B ø | | | 2.05 | | | | 4-1-2040 | | | | 4,100,000 | | | | 4,100,000 | |
| | | | | | | | | | | | | | | | |
The accompanying notes are an integral part of these financial statements.
| | | | | | |
| Portfolio of investments—December 31, 2018 (unaudited) | | Wells Fargo Strategic Municipal Bond Fund | | | 27 | |
| | | | | | | | | | | | | | | | |
| Security name | | Interest rate | | | Maturity date | | | Principal | | | Value | |
|
| Transportation Revenue: 0.32% | |
| | | | |
Central Texas Regional Mobility Authority Senior Lien Series A | | | 5.00 | % | | | 1-1-2021 | | | $ | 1,000,000 | | | $ | 1,050,340 | |
| | | | |
Central Texas Regional Mobility Authority Senior Lien Series A | | | 5.00 | | | | 1-1-2023 | | | | 500,000 | | | | 546,440 | |
| | | | |
North Texas Tollway Authority System Refunding Bonds Series C (SIFMA Municipal Swap +0.67%) ± | | | 2.38 | | | | 1-1-2038 | | | | 3,850,000 | | | | 3,849,615 | |
| | | | |
Texas Private Activity Bond Surface Transportation Corporation | | | 7.00 | | | | 6-30-2040 | | | | 1,250,000 | | | | 1,327,500 | |
| |
| | | | 6,773,895 | |
| | | | | | | | | | | | | | | | |
| | | | |
| Utilities Revenue: 0.29% | | | | | | | | | | | | | | | | |
| | | | |
San Antonio TX Electric & Gas Systems Junior Lien Refunding Bond | | | 2.75 | | | | 2-1-2048 | | | | 6,000,000 | | | | 6,084,600 | |
| | | | | | | | | | | | | | | | |
| | | | |
| Water & Sewer Revenue: 0.85% | | | | | | | | | | | | | | | | |
| | | | |
Dallas TX Waterworks Refunding Bonds Series A | | | 5.00 | | | | 10-1-2029 | | | | 15,000,000 | | | | 17,601,900 | |
| | | | | | | | | | | | | | | | |
| |
| | | | 287,115,485 | |
| | | | | | | | | | | | | | | | |
| | | | |
Utah: 0.65% | | | | | | | | | | | | | | | | |
| | | | |
| Airport Revenue: 0.20% | | | | | | | | | | | | | | | | |
| | | | |
Salt Lake City UT Airport Revenue Bonds AMT Series 2018A | | | 5.00 | | | | 7-1-2029 | | | | 1,000,000 | | | | 1,168,680 | |
| | | | |
Salt Lake City UT Airport Revenue Bonds AMT Series 2018A | | | 5.00 | | | | 7-1-2031 | | | | 2,500,000 | | | | 2,883,650 | |
| |
| | | | 4,052,330 | |
| | | | | | | | | | | | | | | | |
| | | | |
| Education Revenue: 0.07% | | | | | | | | | | | | | | | | |
| | | | |
Utah Charter School Finance Authority Ronald Wilson Reagan Academy Project Series A 144A | | | 3.50 | | | | 2-15-2026 | | | | 1,565,000 | | | | 1,490,459 | |
| | | | | | | | | | | | | | | | |
| | | | |
| Health Revenue: 0.35% | | | | | | | | | | | | | | | | |
| | | | |
Utah County UT IHC Health Services Series D (U.S. Bank NA SPA) ø | | | 1.70 | | | | 5-15-2049 | | | | 7,275,000 | | | | 7,275,000 | |
| | | | | | | | | | | | | | | | |
| | | | |
| Miscellaneous Revenue: 0.03% | | | | | | | | | | | | | | | | |
| | | | |
Utah Infrastructure Agency Telecommunications Series 2017 | | | 2.00 | | | | 10-15-2019 | | | | 625,000 | | | | 622,050 | |
| | | | | | | | | | | | | | | | |
| |
| | | | 13,439,839 | |
| | | | | | | | | | | | | | | | |
| | | | |
Vermont: 0.55% | | | | | | | | | | | | | | | | |
| | | | |
| Education Revenue: 0.55% | | | | | | | | | | | | | | | | |
| | | | |
Vermont Student Assistance Corporation Series A | | | 5.00 | | | | 6-15-2021 | | | | 1,800,000 | | | | 1,902,744 | |
| | | | |
Vermont Student Assistance Corporation Series A | | | 5.00 | | | | 6-15-2022 | | | | 550,000 | | | | 589,336 | |
| | | | |
Vermont Student Assistance Corporation Series A | | | 5.00 | | | | 6-15-2023 | | | | 1,200,000 | | | | 1,312,872 | |
| | | | |
Vermont Student Assistance Corporation Series B Class B (1 Month LIBOR +1.00%) ± | | | 3.35 | | | | 6-2-2042 | | | | 7,757,516 | | | | 7,719,737 | |
| |
| | | | 11,524,689 | |
| | | | | | | | | | | | | | | | |
| | | | |
Virginia: 0.99% | | | | | | | | | | | | | | | | |
| | | | |
| Health Revenue: 0.07% | | | | | | | | | | | | | | | | |
| | | | |
Prince William County VA IDA Westminster at Lake Ridge Series 2016 | | | 2.00 | | | | 1-1-2019 | | | | 600,000 | | | | 600,000 | |
| | | | |
Prince William County VA IDA Westminster at Lake Ridge Series 2016 | | | 2.25 | | | | 1-1-2020 | | | | 910,000 | | | | 904,504 | |
| |
| | | | 1,504,504 | |
| | | | | | | | | | | | | | | | |
| | | | |
| Utilities Revenue: 0.92% | | | | | | | | | | | | | | | | |
| | | | |
Louisa VA Electric and Power IDA Series 2008B | | | 2.15 | | | | 11-1-2035 | | | | 19,050,000 | | | | 19,000,280 | |
| | | | | | | | | | | | | | | | |
| |
| | | | 20,504,784 | |
| | | | | | | | | | | | | | | | |
The accompanying notes are an integral part of these financial statements.
| | | | |
| 28 | | Wells Fargo Strategic Municipal Bond Fund | | Portfolio of investments—December 31, 2018 (unaudited) |
| | | | | | | | | | | | | | | | |
| Security name | | Interest rate | | | Maturity date | | | Principal | | | Value | |
|
Washington: 1.23% | |
|
| Airport Revenue: 0.06% | |
| | | | |
Port of Seattle WA Intermediate Lien Revenue Bonds AMT Series 2018A | | | 5.00 | % | | | 5-1-2036 | | | $ | 1,210,000 | | | $ | 1,357,729 | |
| | | | | | | | | | | | | | | | |
| | | | |
| Health Revenue: 0.83% | | | | | | | | | | | | | | | | |
| | | | |
Washington HCFR Catholic Health Initiatives Series B (SIFMA Municipal Swap +1.40%) ± | | | 3.11 | | | | 1-1-2035 | | | | 11,000,000 | | | | 11,186,120 | |
| | | | |
Washington Health Care Facilities Authority Fred Hutchinson Cancer Research (1 Month LIBOR +1.10%) ± | | | 2.78 | | | | 1-1-2042 | | | | 6,050,000 | | | | 6,103,966 | |
| |
| | | | 17,290,086 | |
| | | | | | | | | | | | | | | | |
| | | | |
| Housing Revenue: 0.22% | | | | | | | | | | | | | | | | |
| | | | |
Seattle WA Housing Authority Newholly Phase I Series B | | | 1.25 | | | | 4-1-2019 | | | | 4,505,000 | | | | 4,493,242 | |
| | | | | | | | | | | | | | | | |
| | | | |
| Resource Recovery Revenue: 0.12% | | | | | | | | | | | | | | | | |
| | | | |
Washington State EDFA Waste Management 144A | | | 2.13 | | | | 6-1-2020 | | | | 2,500,000 | | | | 2,483,975 | |
| | | | | | | | | | | | | | | | |
| |
| | | | 25,625,032 | |
| | | | | | | | | | | | | | | | |
| | | | |
West Virginia: 0.32% | | | | | | | | | | | | | | | | |
| | | | |
| Tax Revenue: 0.06% | | | | | | | | | | | | | | | | |
| | | | |
Monongalia County WV Commission Special District University Town Center Series A 144A | | | 4.50 | | | | 6-1-2027 | | | | 1,250,000 | | | | 1,231,038 | |
| | | | | | | | | | | | | | | | |
| | | | |
| Utilities Revenue: 0.26% | | | | | | | | | | | | | | | | |
| | | | |
West Virginia Economic Development Authority Solid Waste Disposal Facilities Wheeling Power Company Mitchell Project Refunding Bond Series A øø | | | 3.00 | | | | 6-1-2037 | | | | 5,450,000 | | | | 5,414,848 | |
| | | | | | | | | | | | | | | | |
| |
| | | | 6,645,886 | |
| | | | | | | | | | | | | | | | |
| | | | |
Wisconsin: 5.20% | | | | | | | | | | | | | | | | |
| | | | |
| Airport Revenue: 0.11% | | | | | | | | | | | | | | | | |
| | | | |
Wisconsin PFA Airport Series C | | | 5.00 | | | | 7-1-2022 | | | | 2,090,000 | | | | 2,220,521 | |
| | | | | | | | | | | | | | | | |
| | | | |
| Education Revenue: 0.33% | | | | | | | | | | | | | | | | |
| | | | |
Corvian County WI Community School Revenue 144A | | | 4.25 | | | | 6-15-2029 | | | | 1,085,000 | | | | 1,086,020 | |
| | | | |
Milwaukee WI RDA Milwaukee School of Engineering Project (AGM Insured) | | | 4.10 | | | | 4-1-2032 | | | | 1,000,000 | | | | 1,030,600 | |
| | | | |
Milwaukee WI RDA Science Education Consortium Incorporated Project Series A | | | 4.75 | | | | 8-1-2023 | | | | 1,015,000 | | | | 1,050,200 | |
| | | | |
Pine Lake WI PFA Preparatory Series 2015 144A | | | 4.35 | | | | 3-1-2025 | | | | 2,420,000 | | | | 2,452,525 | |
| | | | |
Wisconsin PFA Roseman University of Health Sciences Project Series 2012 | | | 5.00 | | | | 4-1-2022 | | | | 1,195,000 | | | | 1,245,214 | |
| |
| | | | 6,864,559 | |
| | | | | | | | | | | | | | | | |
| | | | |
| GO Revenue: 1.55% | | | | | | | | | | | | | | | | |
| | | | |
Eau Claire WI Area School District Refunding Bonds | | | 5.00 | | | | 4-1-2022 | | | | 1,245,000 | | | | 1,358,034 | |
| | | | |
Eau Claire WI Area School District Refunding Bonds | | | 5.00 | | | | 4-1-2023 | | | | 1,860,000 | | | | 2,075,481 | |
| | | | |
Eau Claire WI Area School District Refunding Bonds | | | 5.00 | | | | 4-1-2024 | | | | 1,000,000 | | | | 1,137,410 | |
| | | | |
Wisconsin State Series A | | | 4.00 | | | | 5-1-2030 | | | | 12,720,000 | | | | 13,329,415 | |
| | | | |
Wisconsin State Series B | | | 5.00 | | | | 5-1-2031 | | | | 12,230,000 | | | | 14,238,533 | |
| |
| | | | 32,138,873 | |
| | | | | | | | | | | | | | | | |
|
| Health Revenue: 1.06% | |
| | | | |
Public Finance Authority Senior Living Marylhurst Project Series 2017B 144A | | | 3.00 | | | | 11-15-2022 | | | | 2,200,000 | | | | 2,200,154 | |
| | | | |
Wisconsin HEFA Bellin Memorial Hospital Series 2015 | | | 3.00 | | | | 12-1-2020 | | | | 745,000 | | | | 757,345 | |
The accompanying notes are an integral part of these financial statements.
| | | | | | |
| Portfolio of investments—December 31, 2018 (unaudited) | | Wells Fargo Strategic Municipal Bond Fund | | | 29 | |
| | | | | | | | | | | | | | | | |
| Security name | | Interest rate | | | Maturity date | | | Principal | | | Value | |
| | | | |
| Health Revenue(continued) | | | | | | | | | | | | | | | | |
| | | | |
Wisconsin HEFA Bellin Memorial Hospital Series 2015 | | | 5.00 | % | | | 12-1-2022 | | | $ | 755,000 | | | $ | 832,304 | |
| | | | |
Wisconsin HEFA Health Care Series 2010A | | | 5.00 | | | | 6-1-2030 | | | | 14,330,000 | | | | 14,947,480 | |
| | | | |
Wisconsin PFA Bancroft Neurohealth Project Series A 144A | | | 4.00 | | | | 6-1-2019 | | | | 1,270,000 | | | | 1,276,033 | |
| | | | |
Wisconsin PFA Bancroft Neurohealth Project Series A 144A | | | 4.00 | | | | 6-1-2020 | | | | 635,000 | | | | 642,639 | |
| | | | |
Wisconsin PFA Bancroft Neurohealth Project Series A 144A | | | 4.00 | | | | 6-1-2021 | | | | 1,370,000 | | | | 1,389,481 | |
| |
| | | | 22,045,436 | |
| | | | | | | | | | | | | | | | |
| | | | |
| Housing Revenue: 0.08% | | | | | | | | | | | | | | | | |
| | | | |
Wisconsin Housing & EDA President House Project (Associated Trust Company NA LOC) ø | | | 1.81 | | | | 8-1-2046 | | | | 1,585,000 | | | | 1,585,000 | |
| | | | | | | | | | | | | | | | |
| | | | |
| Miscellaneous Revenue: 0.26% | | | | | | | | | | | | | | | | |
| | | | |
Monona WI Anticipation Notes Series D | | | 3.63 | | | | 9-1-2022 | | | | 1,925,000 | | | | 1,960,882 | |
| | | | |
Wisconsin State Series 2 | | | 5.00 | | | | 11-1-2029 | | | | 3,000,000 | | | | 3,514,590 | |
| |
| | | | 5,475,472 | |
| | | | | | | | | | | | | | | | |
| | | | |
| Tax Revenue: 1.24% | | | | | | | | | | | | | | | | |
| | | | |
Wisconsin State General Fund Annual Appropriations Series A %% | | | 5.00 | | | | 5-1-2028 | | | | 11,775,000 | | | | 13,996,118 | |
| | | | |
Wisconsin State General Fund Annual Appropriations Series A %% | | | 5.00 | | | | 5-1-2029 | | | | 10,000,000 | | | | 11,845,300 | |
| |
| | | | 25,841,418 | |
| | | | | | | | | | | | | | | | |
| | | | |
| Water & Sewer Revenue: 0.57% | | | | | | | | | | | | | | | | |
| | | | |
Wisconsin Clean Water Refunding Bonds Series 2012 | | | 5.00 | | | | 6-1-2023 | | | | 310,000 | | | | 349,072 | |
| | | | |
Wisconsin Clean Water Refunding Bonds Series 2013 | | | 5.00 | | | | 6-1-2024 | | | | 2,285,000 | | | | 2,578,166 | |
| | | | |
Wisconsin Clean Water Refunding Bonds Series 2015 | | | 5.00 | | | | 6-1-2023 | | | | 3,355,000 | | | | 3,777,864 | |
| | | | |
Wisconsin Clean Water Refunding Bonds Series 2015 | | | 5.00 | | | | 6-1-2025 | | | | 3,045,000 | | | | 3,501,111 | |
| | | | |
Wisconsin Clean Water Refunding Bonds Series 2015 | | | 5.00 | | | | 6-1-2026 | | | | 1,525,000 | | | | 1,753,430 | |
| |
| | | | 11,959,643 | |
| | | | | | | | | | | | | | | | |
| |
| | | | 108,130,922 | |
| | | | | | | | | | | | | | | | |
| |
Total Municipal Obligations (Cost $2,023,556,203) | | | | 2,037,586,023 | |
| | | | | | | | | | | | | | | | |
| | | | |
Other: 0.48% | | | | | | | | | | | | | | | | |
| | | | |
Nuveen California AMT-Free Quality Municipal Income Fund Preferred Shares Series A 144A§øø | | | 2.01 | | | | 10-1-2047 | | | | 10,000,000 | | | | 10,000,000 | |
| | | | | | | | | | | | | | | | |
| |
Total Other (Cost $10,000,000) | | | | 10,000,000 | |
| | | | | | | | | | | | | | | | |
| | | | |
| | | Yield | | | | | | Shares | | | | |
| Short-Term Investments: 1.37% | | | | | | | | | | | | | | | | |
| | | | |
| Investment Companies: 1.31% | | | | | | | | | | | | | | | | |
| | | | |
Wells Fargo Municipal Cash Management Money Market Fund Institutional Class (l)(u) ## | | | 1.65 | | | | | | | | 27,266,449 | | | | 27,277,355 | |
| | | | | | | | | | | | | | | | |
| | | | |
| | | | | | | | | Principal | | | | |
| U.S. Treasury Securities: 0.06% | | | | | | | | | | | | | | | | |
| | | | |
U.S. Treasury Bill (z) | | | 2.32 | | | | 3-14-2019 | | | $ | 1,215,000 | | | | 1,209,181 | |
| | | | | | | | | | | | | | | | |
| |
Total Short-Term Investments (Cost $28,486,664) | | | | 28,486,536 | |
| | | | | | | | | | | | | | | | |
| | | | | | | | |
| Total investments in securities (Cost $2,062,042,867) | | | 99.85 | % | | | 2,076,072,559 | |
| | |
Other assets and liabilities, net | | | 0.15 | | | | 3,215,985 | |
| | | | | | | | |
| Total net assets | | | 100.00 | % | | $ | 2,079,288,544 | |
| | | | | | | | |
The accompanying notes are an integral part of these financial statements.
| | | | |
| 30 | | Wells Fargo Strategic Municipal Bond Fund | | Portfolio of investments—December 31, 2018 (unaudited) |
| 144A | The security may be resold in transactions exempt from registration, normally to qualified institutional buyers, pursuant to Rule 144A under the Securities Act of 1933. |
| ø | Variable rate demand notes are subject to a demand feature which reduces the effective maturity. The maturity date shown represents the final maturity date of the security. The interest rate is determined and reset by the issuer daily, weekly, or monthly depending upon the terms of the security. The rate shown is the rate in effect at period end. |
| (z) | Zero coupon security. The rate represents the purchase yield to maturity. |
| (m) | The security is an auction-rate security which has an interest rate that resets at predetermined short-term intervals through a Dutch auction. The rate shown is the rate in effect at period end. |
| ± | Variable rate investment. The rate shown is the rate in effect at period end. |
| %% | The security is issued on a when-issued basis. |
| ## | All or a portion of this security is segregated for when-issued securities. |
| § | The security is subject to a demand feature which reduces the effective maturity. |
| øø | The interest rate is determined and reset by the issuer periodically depending upon the terms of the security. The rate shown is the rate in effect at period end. |
| (l) | The issuer of the security is an affiliated person of the Fund as defined in the Investment Company Act of 1940. |
| (u) | The rate represents the 7-day annualized yield at period end. |
Abbreviations:
| AGC | Assured Guaranty Corporation |
| AGM | Assured Guaranty Municipal |
| Ambac | Ambac Financial Group Incorporated |
| AMT | Alternative minimum tax |
| CAB | Capital appreciation bond |
| CDA | Community Development Authority |
| ECFA | Educational & Cultural Facilities Authority |
| EDA | Economic Development Authority |
| EDFA | Economic Development Finance Authority |
| FGIC | Financial Guaranty Insurance Corporation |
| FHA | Federal Housing Administration |
| FHLMC | Federal Home Loan Mortgage Corporation |
| FNMA | Federal National Mortgage Association |
| GNMA | Government National Mortgage Association |
| HCFR | Healthcare facilities revenue |
| HEFA | Health & Educational Facilities Authority |
| HEFAR | Higher Education Facilities Authority Revenue |
| HFA | Housing Finance Authority |
| HFFA | Health Facilities Financing Authority |
| HUD | Department of Housing and Urban Development |
| IDA | Industrial Development Authority |
| LIBOR | London Interbank Offered Rate |
| National | National Public Finance Guarantee Corporation |
| PCFA | Pollution Control Financing Authority |
| PCR | Pollution control revenue |
| PFA | Public Finance Authority |
| RDA | Redevelopment Authority |
| SPA | Standby purchase agreement |
| TTFA | Transportation Trust Fund Authority |
The accompanying notes are an integral part of these financial statements.
| | | | | | |
| Portfolio of investments—December 31, 2018 (unaudited) | | Wells Fargo Strategic Municipal Bond Fund | | | 31 | |
Investments in Affiliates
An affiliated investment is an investment in which the Fund owns at least 5% of the outstanding voting shares of the issuer or as a result of other relationships, such as the Fund and the issuer having the same investment manager. Transactions with issuers that were either affiliated persons of the Fund at the beginning of the period or the end of the period were as follows:
| | | | | | | | | | | | | | | | | | | | | | | | | | | | | | | | | | | | |
| | | Shares,
beginning of
period | | | Shares
purchased | | | Shares
sold | | | Shares,
end of
period | | | Net
realized
gains
(losses) | | | Net
change in
unrealized
gains
(losses) | | | Income
from
affiliated
securities | | | Value,
end
of period | | | % of
net
assets | |
Short-Term Investments | | | | | | | | | | | | | | | | | | | | | | | | | | | | | | | | | | | | |
Investment Companies | | | | | | | | | | | | | | | | | | | | | | | | | | | | | | | | | | | | |
Wells Fargo Municipal Cash Management Money Market Fund Institutional Class | | | 10,804,761 | | | | 299,033,769 | | | | 282,572,081 | | | | 27,266,449 | | | $ | (11,589 | ) | | $ | 0 | | | $ | 99,196 | | | $ | 27,277,355 | | | | 1.31 | % |
The accompanying notes are an integral part of these financial statements.
| | | | |
| 32 | | Wells Fargo Strategic Municipal Bond Fund | | Statement of assets and liabilities—December 31, 2018 (unaudited) |
| | | | |
| | | | |
| |
Assets | | | | |
Investments in unaffiliated securities, at value (cost $2,034,765,512) | | $ | 2,048,795,204 | |
Investments in affiliated securities, at value (cost $27,277,355) | | | 27,277,355 | |
Receivable for investments sold | | | 3,853,388 | |
Receivable for Fund shares sold | | | 17,337,965 | |
Receivable for interest | | | 19,885,095 | |
| | | | |
Total assets | | | 2,117,149,007 | |
| | | | |
| |
Liabilities | | | | |
Payable for investments purchased | | | 28,046,071 | |
Payable for Fund shares redeemed | | | 5,402,303 | |
Due to custodian bank | | | 2,454,739 | |
Dividends payable | | | 662,010 | |
Management fee payable | | | 643,926 | |
Administration fees payable | | | 184,242 | |
Distribution fee payable | | | 71,573 | |
Trustees’ fees and expenses payable | | | 602 | |
Accrued expenses and other liabilities | | | 394,997 | |
| | | | |
Total liabilities | | | 37,860,463 | |
| | | | |
Total net assets | | $ | 2,079,288,544 | |
| | | | |
| |
NET ASSETS CONSIST OF | | | | |
Paid-in capital | | $ | 2,067,156,816 | |
Total distributable earnings | | | 12,131,728 | |
| | | | |
Total net assets | | $ | 2,079,288,544 | |
| | | | |
| |
COMPUTATION OF NET ASSET VALUE AND OFFERING PRICE PER SHARE | | | | |
Net assets – Class A | | $ | 467,218,037 | |
Shares outstanding – Class A1 | | | 52,154,493 | |
Net asset value per share – Class A | | | $8.96 | |
Maximum offering price per share – Class A2 | | | $9.33 | |
Net assets – Class C | | $ | 108,529,220 | |
Shares outstanding – Class C1 | | | 12,072,960 | |
Net asset value per share – Class C | | | $8.99 | |
Net assets – Class R6 | | $ | 10,580,169 | |
Shares outstanding – Class R61 | | | 1,180,670 | |
Net asset value per share – Class R6 | | | $8.96 | |
Net assets – Administrator Class | | $ | 159,758,888 | |
Shares outstanding – Administrator Class1 | | | 17,843,316 | |
Net asset value per share – Administrator Class | | | $8.95 | |
Net assets – Institutional Class | | $ | 1,333,202,230 | |
Shares outstanding – Institutional Class1 | | | 148,860,412 | |
Net asset value per share – Institutional Class | | | $8.96 | |
| 1 | The Fund has an unlimited number of authorized shares. |
| 2 | Maximum offering price is computed as 100/96 of net asset value. On investments of $50,000 or more, the offering price is reduced. |
The accompanying notes are an integral part of these financial statements.
| | | | | | |
| Statement of operations—six months ended December 31, 2018 (unaudited) | | Wells Fargo Strategic Municipal Bond Fund | | | 33 | |
| | | | |
| | | | |
| |
Investment income | | | | |
Interest | | $ | 27,927,467 | |
Income from affiliated securities | | | 99,196 | |
| | | | |
Total investment income | | | 28,026,663 | |
| | | | |
| |
Expenses | | | | |
Management fee | | | 3,745,296 | |
Administration fees | | | | |
Class A | | | 385,935 | |
Class C | | | 89,862 | |
Class R6 | | | 727 | 1 |
Administrator Class | | | 87,195 | |
Institutional Class | | | 503,265 | |
Shareholder servicing fees | | | | |
Class A | | | 603,023 | |
Class C | | | 140,410 | |
Administrator Class | | | 217,512 | |
Distribution fee | | | | |
Class C | | | 421,229 | |
Custody and accounting fees | | | 48,743 | |
Professional fees | | | 31,155 | |
Registration fees | | | 92,246 | |
Shareholder report expenses | | | 51,463 | |
Trustees’ fees and expenses | | | 12,046 | |
Other fees and expenses | | | 20,094 | |
| | | | |
Total expenses | | | 6,450,201 | |
Less: Fee waivers and/or expense reimbursements | | | (57,880 | ) |
| | | | |
Net expenses | | | 6,392,321 | |
| | | | |
Net investment income | | | 21,634,342 | |
| | | | |
| |
REALIZED AND UNREALIZED GAINS (LOSSES) ON INVESTMENTS | | | | |
| |
| Net realized gains (losses) on: | | | | |
Unaffiliated securities | | | 235,096 | |
Affiliated securities | | | (11,589 | ) |
Futures contracts | | | 2,023,773 | |
| | | | |
Net realized gains on investments | | | 2,247,280 | |
Net change in unrealized gains (losses) on investments | | | 3,713,124 | |
| | | | |
Net realized and unrealized gains (losses) on investments | | | 5,960,404 | |
| | | | |
Net increase in net assets resulting from operations | | $ | 27,594,746 | |
| | | | |
| 1 | For the period from July, 31, 2018 (commencement of class operations) to December 31, 2018 |
The accompanying notes are an integral part of these financial statements.
| | | | |
| 34 | | Wells Fargo Strategic Municipal Bond Fund | | Statement of changes in net assets |
| | | | | | | | | | | | | | | | |
| | | Six months ended
December 31, 2018
(unaudited) | | | Year ended
June 30, 20181 | |
| | | | |
Operations | | | | | | | | | | | | | | | | |
Net investment income | | | | | | $ | 21,634,342 | | | | | | | $ | 36,723,411 | |
Net realized gains (losses) on investments | | | | | | | 2,247,280 | | | | | | | | (1,654,315 | ) |
Net change in unrealized gains (losses) on investments | | | | | | | 3,713,124 | | | | | | | | 4,181,203 | |
| | | | |
Net increase in net assets resulting from operations | | | | | | | 27,594,746 | | | | | | | | 39,250,299 | |
| | | | |
| | | | |
Distributions to shareholders from net investment income and net realized gains | | | | | | | | | | | | | | | | |
Class A | | | | | | | (4,707,661 | ) | | | | | | | (10,041,868 | ) |
Class C | | | | | | | (674,601 | ) | | | | | | | (1,478,818 | ) |
Class R6 | | | | | | | (58,256 | )2 | | | | | | | N/A | |
Administrator Class | | | | | | | (1,801,595 | ) | | | | | | | (4,161,841 | ) |
Institutional Class | | | | | | | (14,392,229 | ) | | | | | | | (25,473,493 | ) |
| | | | |
Total distributions to shareholders | | | | | | | (21,634,342 | ) | | | | | | | (41,156,020 | ) |
| | | | |
| | | | |
Capital share transactions | | | Shares | | | | | | | | Shares | | | | | |
Proceeds from shares sold | | | | | | | | | | | | | | | | |
Class A | | | 7,338,452 | | | | 65,487,134 | | | | 14,183,216 | | | | 126,858,667 | |
Class C | | | 754,208 | | | | 6,750,085 | | | | 1,262,039 | | | | 11,336,254 | |
Class R6 | | | 1,364,831 | 2 | | | 12,183,299 | 2 | | | N/A | | | | N/A | |
Administrator Class | | | 3,967,719 | | | | 35,405,038 | | | | 8,016,839 | | | | 71,728,421 | |
Institutional Class | | | 43,497,069 | | | | 387,766,007 | | | | 65,554,521 | | | | 586,336,407 | |
| | | | |
| | | | |
| | | | | | | 507,591,563 | | | | | | | | 796,259,749 | |
| | | | |
Reinvestment of distributions | | | | | | | | | | | | | | | | |
Class A | | | 481,792 | | | | 4,295,490 | | | | 1,025,264 | | | | 9,170,102 | |
Class C | | | 65,880 | | | | 589,337 | | | | 145,058 | | | | 1,302,030 | |
Administrator Class | | | 196,075 | | | | 1,746,581 | | | | 455,559 | | | | 4,072,557 | |
Institutional Class | | | 1,306,425 | | | | 11,645,865 | | | | 2,335,413 | | | | 20,883,398 | |
| | | | |
| | | | |
| | | | | | | 18,277,273 | | | | | | | | 35,428,087 | |
| | | | |
Payment for shares redeemed | | | | | | | | | | | | | | | | |
Class A | | | (10,652,828 | ) | | | (94,994,979 | ) | | | (21,867,476 | ) | | | (195,482,366 | ) |
Class C | | | (1,635,800 | ) | | | (14,634,221 | ) | | | (3,900,702 | ) | | | (35,016,106 | ) |
Class R6 | | | (184,161 | )2 | | | (1,635,000 | )2 | | | N/A | | | | N/A | |
Administrator Class | | | (7,797,523 | ) | | | (69,446,896 | ) | | | (8,841,309 | ) | | | (78,960,801 | ) |
Institutional Class | | | (33,037,731 | ) | | | (294,368,145 | ) | | | (46,407,316 | ) | | | (414,849,938 | ) |
| | | | |
| | | | |
| | | | | | | (475,079,241 | ) | | | | | | | (724,309,211 | ) |
| | | | |
Net increase in net assets resulting from capital share transactions | | | | | | | 50,789,595 | | | | | | | | 107,378,625 | |
| | | | |
Total increase in net assets | | | | | | | 56,749,999 | | | | | | | | 105,472,904 | |
| | | | |
| | | | |
Net assets | | | | | | | | | | | | | | | | |
Beginning of period | | | | | | | 2,022,538,545 | | | | | | | | 1,917,065,641 | |
| | | | |
End of period | | | | | | $ | 2,079,288,544 | | | | | | | $ | 2,022,538,545 | |
| | | | |
| 1 | Effective for all filings after November 4, 2018, the SEC prospectively eliminated the requirement to parenthetically disclose undistributed net investment income at the end of the period and permitted the aggregation of distributions, with the exception of tax basis returns of capital. Overdistributed net investment income at June 30, 2018 was $260,353. The disaggregated distributions information for the year ended June 30, 2018 is included in Note 8,Distributions to Shareholders, in the notes to the financial statements. |
| 2 | For the period from July, 31, 2018 (commencement of class operations) to December 31, 2018 |
The accompanying notes are an integral part of these financial statements.
| | | | | | |
| Financial highlights | | Wells Fargo Strategic Municipal Bond Fund | | | 35 | |
(For a share outstanding throughout each period)
| | | | | | | | | | | | | | | | | | | | | | | | |
| | | Six months ended
December 31, 2018 (unaudited) | | | Year ended June 30 | |
| CLASS A | | 2018 | | | 2017 | | | 2016 | | | 2015 | | | 2014 | |
Net asset value, beginning of period | | | $8.93 | | | | $8.94 | | | | $9.06 | | | | $8.90 | | | | $9.03 | | | | $8.87 | |
Net investment income | | | 0.09 | | | | 0.15 | | | | 0.13 | | | | 0.14 | | | | 0.10 | | | | 0.17 | |
Net realized and unrealized gains (losses) on investments | | | 0.03 | | | | 0.01 | | | | (0.07 | ) | | | 0.18 | | | | (0.05 | ) | | | 0.21 | |
| | | | | | | | | | | | | | | | | | | | | | | | |
Total from investment operations | | | 0.12 | | | | 0.16 | | | | 0.06 | | | | 0.32 | | | | 0.05 | | | | 0.38 | |
Distributions to shareholders from | | | | | | | | | | | | | | | | | | | | | | | | |
Net investment income | | | (0.09 | ) | | | (0.15 | ) | | | (0.13 | ) | | | (0.14 | ) | | | (0.10 | ) | | | (0.17 | ) |
Net realized gains | | | 0.00 | | | | (0.02 | ) | | | (0.05 | ) | | | (0.02 | ) | | | (0.08 | ) | | | (0.05 | ) |
| | | | | | | | | | | | | | | | | | | | | | | | |
Total distributions to shareholders | | | (0.09 | ) | | | (0.17 | ) | | | (0.18 | ) | | | (0.16 | ) | | | (0.18 | ) | | | (0.22 | ) |
Net asset value, end of period | | | $8.96 | | | | $8.93 | | | | $8.94 | | | | $9.06 | | | | $8.90 | | | | $9.03 | |
Total return1 | | | 1.33 | % | | | 1.82 | % | | | 0.65 | % | | | 3.67 | % | | | 0.56 | % | | | 4.41 | % |
Ratios to average net assets (annualized) | | | | | | | | | | | | | | | | | | | | | | | | |
Gross expenses | | | 0.80 | % | | | 0.82 | % | | | 0.81 | % | | | 0.81 | % | | | 0.81 | % | | | 0.83 | % |
Net expenses | | | 0.80 | % | | | 0.82 | % | | | 0.81 | % | | | 0.81 | % | | | 0.81 | % | | | 0.82 | % |
Net investment income | | | 1.95 | % | | | 1.69 | % | | | 1.45 | % | | | 1.53 | % | | | 1.16 | % | | | 1.91 | % |
Supplemental data | | | | | | | | | | | | | | | | | | | | | | | | |
Portfolio turnover rate | | | 12 | % | | | 33 | % | | | 31 | % | | | 53 | % | | | 39 | % | | | 51 | % |
Net assets, end of period (000s omitted) | | | $467,218 | | | | $491,128 | | | | $550,965 | | | | $726,135 | | | | $635,610 | | | | $656,256 | |
| 1 | Total return calculations do not include any sales charges. Returns for periods of less than one year are not annualized. |
The accompanying notes are an integral part of these financial statements.
| | | | |
| 36 | | Wells Fargo Strategic Municipal Bond Fund | | Financial highlights |
(For a share outstanding throughout each period)
| | | | | | | | | | | | | | | | | | | | | | | | |
| | | Six months ended
December 31, 2018 (unaudited) | | | Year ended June 30 | |
| CLASS C | | 2018 | | | 2017 | | | 2016 | | | 2015 | | | 2014 | |
Net asset value, beginning of period | | | $8.96 | | | | $8.97 | | | | $9.09 | | | | $8.94 | | | | $9.06 | | | | $8.90 | |
Net investment income | | | 0.05 | | | | 0.08 | 1 | | | 0.07 | | | | 0.07 | | | | 0.04 | | | | 0.10 | |
Net realized and unrealized gains (losses) on investments | | | 0.03 | | | | 0.01 | | | | (0.07 | ) | | | 0.17 | | | | (0.04 | ) | | | 0.21 | |
| | | | | | | | | | | | | | | | | | | | | | | | |
Total from investment operations | | | 0.08 | | | | 0.09 | | | | (0.00 | ) | | | 0.24 | | | | 0.00 | | | | 0.31 | |
Distributions to shareholders from | | | | | | | | | | | | | | | | | | | | | | | | |
Net investment income | | | (0.05 | ) | | | (0.08 | ) | | | (0.07 | ) | | | (0.07 | ) | | | (0.04 | ) | | | (0.10 | ) |
Net realized gains | | | 0.00 | | | | (0.02 | ) | | | (0.05 | ) | | | (0.02 | ) | | | (0.08 | ) | | | (0.05 | ) |
| | | | | | | | | | | | | | | | | | | | | | | | |
Total distributions to shareholders | | | (0.05 | ) | | | (0.10 | ) | | | (0.12 | ) | | | (0.09 | ) | | | (0.12 | ) | | | (0.15 | ) |
Net asset value, end of period | | | $8.99 | | | | $8.96 | | | | $8.97 | | | | $9.09 | | | | $8.94 | | | | $9.06 | |
Total return2 | | | 0.94 | % | | | 1.06 | % | | | (0.10 | )% | | | 2.78 | % | | | (0.08 | )% | | | 3.63 | % |
Ratios to average net assets (annualized) | | | | | | | | | | | | | | | | | | | | | | | | |
Gross expenses | | | 1.55 | % | | | 1.57 | % | | | 1.56 | % | | | 1.56 | % | | | 1.56 | % | | | 1.58 | % |
Net expenses | | | 1.55 | % | | | 1.57 | % | | | 1.56 | % | | | 1.56 | % | | | 1.56 | % | | | 1.57 | % |
Net investment income | | | 1.20 | % | | | 0.94 | % | | | 0.72 | % | | | 0.78 | % | | | 0.40 | % | | | 1.16 | % |
Supplemental data | | | | | | | | | | | | | | | | | | | | | | | | |
Portfolio turnover rate | | | 12 | % | | | 33 | % | | | 31 | % | | | 53 | % | | | 39 | % | | | 51 | % |
Net assets, end of period (000s omitted) | | | $108,529 | | | | $115,518 | | | | $137,955 | | | | $156,560 | | | | $152,882 | | | | $146,329 | |
| 1 | Calculated based upon average shares outstanding |
| 2 | Total return calculations do not include any sales charges. Returns for periods of less than one year are not annualized. |
The accompanying notes are an integral part of these financial statements.
| | | | | | |
| Financial highlights | | Wells Fargo Strategic Municipal Bond Fund | | | 37 | |
(For a share outstanding throughout the period)
| | | | |
| CLASS R6 | | Period ended
December 31, 2018 (unaudited)1 | |
Net asset value, beginning of period | | | $8.94 | |
Net investment income | | | 0.09 | |
Net realized and unrealized gains on investments | | | 0.02 | |
| | | | |
Total from investment operations | | | 0.11 | |
Distributions to shareholders from | | | | |
Net investment income | | | (0.09 | ) |
Net asset value, end of period | | | $8.96 | |
Total return2 | | | 1.22 | % |
Ratios to average net assets (annualized) | | | | |
Gross expenses | | | 0.42 | % |
Net expenses | | | 0.42 | % |
Net investment income | | | 2.40 | % |
Supplemental data | | | | |
Portfolio turnover rate | | | 12 | % |
Net assets, end of period (000s omitted) | | | $10,580 | |
| 1 | For the period from July, 31, 2018 (commencement of class operations) to December 31, 2018 |
| 2 | Returns for periods of less than one year are not annualized. |
The accompanying notes are an integral part of these financial statements.
| | | | |
| 38 | | Wells Fargo Strategic Municipal Bond Fund | | Financial highlights |
(For a share outstanding throughout each period)
| | | | | | | | | | | | | | | | | | | | | | | | |
| | | Six months ended
December 31, 2018 (unaudited) | | | Year ended June 30 | |
| ADMINISTRATOR CLASS | | 2018 | | | 2017 | | | 2016 | | | 2015 | | | 2014 | |
Net asset value, beginning of period | | | $8.93 | | | | $8.93 | | | | $9.06 | | | | $8.90 | | | | $9.02 | | | | $8.87 | |
Net investment income | | | 0.09 | | | | 0.16 | | | | 0.14 | | | | 0.15 | | | | 0.12 | | | | 0.18 | |
Net realized and unrealized gains (losses) on investments | | | 0.02 | | | | 0.02 | | | | (0.08 | ) | | | 0.18 | | | | (0.04 | ) | | | 0.20 | |
| | | | | | | | | | | | | | | | | | | | | | | | |
Total from investment operations | | | 0.11 | | | | 0.18 | | | | 0.06 | | | | 0.33 | | | | 0.08 | | | | 0.38 | |
Distributions to shareholders from | | | | | | | | | | | | | | | | | | | | | | | | |
Net investment income | | | (0.09 | ) | | | (0.16 | ) | | | (0.14 | ) | | | (0.15 | ) | | | (0.12 | ) | | | (0.18 | ) |
Net realized gains | | | 0.00 | | | | (0.02 | ) | | | (0.05 | ) | | | (0.02 | ) | | | (0.08 | ) | | | (0.05 | ) |
| | | | | | | | | | | | | | | | | | | | | | | | |
Total distributions to shareholders | | | (0.09 | ) | | | (0.18 | ) | | | (0.19 | ) | | | (0.17 | ) | | | (0.20 | ) | | | (0.23 | ) |
Net asset value, end of period | | | $8.95 | | | | $8.93 | | | | $8.93 | | | | $9.06 | | | | $8.90 | | | | $9.02 | |
Total return1 | | | 1.28 | % | | | 2.07 | % | | | 0.67 | % | | | 3.80 | % | | | 0.80 | % | | | 4.44 | % |
Ratios to average net assets (annualized) | | | | | | | | | | | | | | | | | | | | | | | | |
Gross expenses | | | 0.74 | % | | | 0.76 | % | | | 0.75 | % | | | 0.74 | % | | | 0.75 | % | | | 0.77 | % |
Net expenses | | | 0.68 | % | | | 0.68 | % | | | 0.68 | % | | | 0.68 | % | | | 0.68 | % | | | 0.68 | % |
Net investment income | | | 2.07 | % | | | 1.80 | % | | | 1.51 | % | | | 1.66 | % | | | 1.28 | % | | | 2.05 | % |
Supplemental data | | | | | | | | | | | | | | | | | | | | | | | | |
Portfolio turnover rate | | | 12 | % | | | 33 | % | | | 31 | % | | | 53 | % | | | 39 | % | | | 51 | % |
Net assets, end of period (000s omitted) | | | $159,759 | | | | $191,723 | | | | $195,138 | | | | $408,846 | | | | $529,945 | | | | $516,069 | |
| 1 | Returns for periods of less than one year are not annualized. |
The accompanying notes are an integral part of these financial statements.
| | | | | | |
| Financial highlights | | Wells Fargo Strategic Municipal Bond Fund | | | 39 | |
(For a share outstanding throughout each period)
| | | | | | | | | | | | | | | | | | | | | | | | |
| | | Six months ended
December 31, 2018 (unaudited) | | | Year ended June 30 | |
| INSTITUTIONAL CLASS | | 2018 | | | 2017 | | | 2016 | | | 2015 | | | 2014 | |
Net asset value, beginning of period | | | $8.93 | | | | $8.94 | | | | $9.06 | | | | $8.90 | | | | $9.03 | | | | $8.87 | |
Net investment income | | | 0.10 | | | | 0.18 | | | | 0.16 | | | | 0.17 | | | | 0.13 | | | | 0.20 | |
Net realized and unrealized gains (losses) on investments | | | 0.03 | | | | 0.01 | | | | (0.07 | ) | | | 0.18 | | | | (0.05 | ) | | | 0.21 | |
| | | | | | | | | | | | | | | | | | | | | | | | |
Total from investment operations | | | 0.13 | | | | 0.19 | | | | 0.09 | | | | 0.35 | | | | 0.08 | | | | 0.41 | |
Distributions to shareholders from | | | | | | | | | | | | | | | | | | | | | | | | |
Net investment income | | | (0.10 | ) | | | (0.18 | ) | | | (0.16 | ) | | | (0.17 | ) | | | (0.13 | ) | | | (0.20 | ) |
Net realized gains | | | 0.00 | | | | (0.02 | ) | | | (0.05 | ) | | | (0.02 | ) | | | (0.08 | ) | | | (0.05 | ) |
| | | | | | | | | | | | | | | | | | | | | | | | |
Total distributions to shareholders | | | (0.10 | ) | | | (0.20 | ) | | | (0.21 | ) | | | (0.19 | ) | | | (0.21 | ) | | | (0.25 | ) |
Net asset value, end of period | | | $8.96 | | | | $8.93 | | | | $8.94 | | | | $9.06 | | | | $8.90 | | | | $9.03 | |
Total return1 | | | 1.50 | % | | | 2.16 | % | | | 0.99 | % | | | 4.02 | % | | | 0.89 | % | | | 4.77 | % |
Ratios to average net assets (annualized) | | | | | | | | | | | | | | | | | | | | | | | | |
Gross expenses | | | 0.47 | % | | | 0.49 | % | | | 0.48 | % | | | 0.48 | % | | | 0.48 | % | | | 0.50 | % |
Net expenses | | | 0.47 | % | | | 0.48 | % | | | 0.48 | % | | | 0.48 | % | | | 0.48 | % | | | 0.48 | % |
Net investment income | | | 2.29 | % | | | 2.05 | % | | | 1.85 | % | | | 1.85 | % | | | 1.49 | % | | | 2.27 | % |
Supplemental data | | | | | | | | | | | | | | | | | | | | | | | | |
Portfolio turnover rate | | | 12 | % | | | 33 | % | | | 31 | % | | | 53 | % | | | 39 | % | | | 51 | % |
Net assets, end of period (000s omitted) | | | $1,333,202 | | | | $1,224,170 | | | | $1,033,007 | | | | $608,995 | | | | $319,313 | | | | $29,528 | |
| 1 | Returns for periods of less than one year are not annualized. |
The accompanying notes are an integral part of these financial statements.
| | | | |
| 40 | | Wells Fargo Strategic Municipal Bond Fund | | Notes to financial statements (unaudited) |
1. ORGANIZATION
Wells Fargo Funds Trust (the “Trust”), a Delaware statutory trust organized on March 10, 1999, is an open-end management investment company registered under the Investment Company Act of 1940, as amended (the “1940 Act”). As an investment company, the Trust follows the accounting and reporting guidance in Financial Accounting Standards Board (“FASB”) Accounting Standards Codification Topic 946, Financial Services – Investment Companies. These financial statements report on the Wells Fargo Strategic Municipal Bond Fund (the “Fund”) which is a diversified series of the Trust.
2. SIGNIFICANT ACCOUNTING POLICIES
The following significant accounting policies, which are consistently followed in the preparation of the financial statements of the Fund, are in conformity with U.S. generally accepted accounting principles which require management to make estimates and assumptions that affect the reported amounts of assets and liabilities, disclosure of contingent assets and liabilities at the date of the financial statements, and the reported amounts of revenues and expenses during the reporting period. Actual results could differ from those estimates.
Securities valuation
All investments are valued each business day as of the close of regular trading on the New York Stock Exchange (generally 4 p.m. Eastern Time), although the Fund may deviate from this calculation time under unusual or unexpected circumstances.
Debt securities are valued at the evaluated bid price provided by an independent pricing service (e.g. taking into account various factors, including yields, maturities, or credit ratings) or, if a reliable price is not available, the quoted bid price from an independent broker-dealer.
Futures contracts that are listed on a foreign or domestic exchange or market are valued at the official closing price or, if none, the last sales price.
Swap contracts are valued at the evaluated price provided by an independent pricing service or, if a reliable price is not available, the quoted bid price from an independent broker-dealer.
Investments in registered open-end investment companies are valued at net asset value.
Investments which are not valued using any of the methods discussed above are valued at their fair value, as determined in good faith by the Board of Trustees of the Fund. The Board of Trustees has established a Valuation Committee comprised of the Trustees and has delegated to it the authority to take any actions regarding the valuation of portfolio securities that the Valuation Committee deems necessary or appropriate, including determining the fair value of portfolio securities, unless the determination has been delegated to the Wells Fargo Asset Management Pricing Committee at Wells Fargo Funds Management, LLC (“Funds Management”). The Board of Trustees retains the authority to make or ratify any valuation decisions or approve any changes to the Valuation Procedures as it deems appropriate. On a quarterly basis, the Board of Trustees receives reports on any valuation actions taken by the Valuation Committee or the Wells Fargo Asset Management Pricing Committee which may include items for ratification.
When-issued transactions
The Fund may purchase securities on a forward commitment or when-issued basis. The Fund records a when-issued transaction on the trade date and will segregate assets in an amount at least equal in value to the Fund’s commitment to purchase when-issued securities. Securities purchased on a when-issued basis are marked-to-market daily and the Fund begins earning interest on the settlement date. Losses may arise due to changes in the market value of the underlying securities or if the counterparty does not perform under the contract.
Futures contracts
The Fund is subject to interest rate risk in the normal course of pursuing its investment objectives. Futures contracts are agreements between the Fund and a counterparty to buy or sell a specific amount of a commodity, financial instrument or currency at specified price and on a specified date. The Fund may buy and sell futures contracts in order to gain exposure to, or protect against, changes in interest rates. The primary risks associated with the use of futures contracts are the imperfect correlation between changes in market values of securities held by the Fund and the prices of futures contracts, and the possibility of an illiquid market. Futures contracts are generally entered into on a regulated futures exchange and cleared through a clearinghouse associated with the exchange. With futures contracts, there is minimal counterparty risk to the Fund since futures contracts are exchange traded and the exchange’s clearinghouse, as counterparty to all exchange traded futures, guarantees the futures contracts against default.
| | | | | | |
| Notes to financial statements (unaudited) | | Wells Fargo Strategic Municipal Bond Fund | | | 41 | |
Upon entering into a futures contracts, the Fund is required to deposit either cash or securities (initial margin) with the broker in an amount equal to a certain percentage of the contract value. Subsequent payments (variation margin) are paid to or from the broker each day equal to the daily changes in the contract value. Such payments are recorded as unrealized gains or losses and, if any, shown as variation margin receivable (payable) in the Statement of Assets and Liabilities. Should the Fund fail to make requested variation margin payments, the broker can gain access to the initial margin to satisfy the Fund’s payment obligations. When the contracts are closed, a realized gain or loss is recorded in the Statement of Operations.
Swap contracts
Swap contracts are agreements between the Fund and a counterparty to exchange a series of cash flows over a specified period. Swap agreements are privately negotiated contracts between the Fund and a counterparty in the OTC market and may be entered into as a bilateral contract (“OTC swaps”) or centrally cleared (“centrally cleared swaps”) with a central clearinghouse.
For OTC swaps, any upfront premiums paid and any upfront fees received are shown as swap premiums paid and swap premiums received, respectively, in the Statement of Assets and Liabilities and amortized over the term of the contract. The daily fluctuations in market value are recorded as unrealized gains or losses on OTC swaps in the Statement of Assets and Liabilities. Payments received or paid are recorded in the Statement of Operations as realized gains or losses, respectively. When an OTC swap is terminated, a realized gain or loss is recorded in the Statement of Operations equal to the difference between the proceeds from (or cost of) the closing transaction and the Fund’s basis in the contract, if any. Generally, the basis of the contract is the premium received or paid.
In a centrally cleared swap, immediately following execution of the swap contract, the swap contract is novated to a central counterparty (the “CCP”) and the Fund’s counterparty on the swap agreement becomes the CCP. Upon entering into a centrally cleared swap, the Fund is required to deposit an initial margin with the broker in the form of cash or securities. Securities deposited as initial margin are designated in the Portfolio of Investments and cash deposited is shown as cash segregated for centrally cleared swaps in the Statement of Assets and Liabilities. Pursuant to the contract, the Fund agrees to receive from or pay to the broker an amount of cash equal to the daily fluctuation in market value of the contract (“variation margin”). The variation margin is recorded as an unrealized gain (or loss) and shown as variation margin receivable (or payable) on centrally cleared swaps in the Statement of Assets and Liabilities. Payments received from (paid to) the counterparty, including at termination, are recorded as realized gains (losses) in the Statement of Operations.
Credit default swaps
The Fund is subject to credit risk in the normal course of pursuing its investment objectives. The Fund may enter into credit default swaps for hedging or speculative purposes to provide or receive a measure of protection against default on a referenced entity, obligation or index or a basket of single-name issuers or traded indexes. An index credit default swap references all the names in the index, and if a credit event is triggered, the credit event is settled based on that name’s weight in the index. Credit default swaps are agreements in which the protection buyer pays fixed periodic payments to the protection seller in consideration for a promise from the protection seller to make a specific payment should a negative credit event take place with respect to the referenced entity (e.g., bankruptcy, failure to pay, obligation acceleration, repudiation, moratorium or restructuring).
The Fund may enter into credit default swaps as either the seller of protection or the buyer of protection. If the Fund is the buyer of protection and a credit event occurs, the Fund will either receive from the seller an amount equal to the notional amount of the swap and deliver the referenced security or underlying securities comprising the index, or receive a net settlement of cash equal to the notional amount of the swap less the recovery value of the security or underlying securities comprising the index. If the Fund is the seller of protection and a credit event occurs, the Fund will either pay the buyer an amount equal to the notional amount of the swap and take delivery of the referenced security or underlying securities comprising the index or pay a net settlement of cash equal to the notional amount of the swap less the recovery value of the security or underlying securities comprising the index.
As the seller of protection, the Fund is subject to investment exposure on the notional amount of the swap and has assumed the risk of default of the underlying security or index. As the buyer of protection, the Fund could be exposed to risks if the seller of the protection defaults on its obligation to perform, or if there are unfavorable changes in the fluctuation of interest rates.
Security transactions and income recognition
Securities transactions are recorded on a trade date basis. Realized gains or losses are recorded on the basis of identified cost.
| | | | |
| 42 | | Wells Fargo Strategic Municipal Bond Fund | | Notes to financial statements (unaudited) |
Interest income is accrued daily and bond discounts are accreted and premiums are amortized daily. To the extent debt obligations are placed on non-accrual status, any related interest income may be reduced by writing off interest receivables when the collection of all or a portion of interest has been determined to be doubtful based on consistently applied procedures and the fair value has decreased. If the issuer subsequently resumes interest payments or when the collectability of interest is reasonably assured, the debt obligation is removed from non-accrual status.
Distributions to shareholders
Distributions to shareholders from net investment income are declared daily and paid monthly. Distributions from net realized gains, if any, are recorded on the ex-dividend date and paid at least annually. Such distributions are determined in accordance with income tax regulations and may differ from U.S. generally accepted accounting principles. Dividend sources are estimated at the time of declaration. The tax character of distributions is determined as of the Fund’s fiscal year end. Therefore, a portion of the Fund’s distributions made prior to the Fund’s fiscal year end may be categorized as a tax return of capital at year end.
Federal and other taxes
The Fund intends to continue to qualify as a regulated investment company by distributing substantially all of its investment company taxable and tax-exempt income and any net realized capital gains (after reduction for capital loss carryforwards) sufficient to relieve it from all, or substantially all, federal income taxes. Accordingly, no provision for federal income taxes was required.
The Fund’s income and federal excise tax returns and all financial records supporting those returns for the prior three fiscal years are subject to examination by the federal and Delaware revenue authorities. Management has analyzed the Fund’s tax positions taken on federal, state, and foreign tax returns for all open tax years and does not believe that there are any uncertain tax positions that require recognition of a tax liability.
As of December 31, 2018, the aggregate cost of all investments for federal income tax purposes was $2,062,042,867 and the unrealized gains (losses) consisted of:
| | | | |
| |
Gross unrealized gains | | $ | 18,388,572 | |
| |
Gross unrealized losses | | | (4,358,880 | ) |
| |
Net unrealized gains | | $ | 14,029,692 | |
As of June 30, 2018, the Fund had current year deferred post-October capital losses consisting of $3,884,893 in net long-term losses which were recognized on the first day of the current fiscal year.
Class allocations
The separate classes of shares offered by the Fund differ principally in applicable sales charges, distribution, shareholder servicing, and administration fees. Class specific expenses are charged directly to that share class. Investment income, common expenses, and realized and unrealized gains (losses) on investments are allocated daily to each class of shares based on the relative proportion of net assets of each class.
3. FAIR VALUATION MEASUREMENTS
Fair value measurements of investments are determined within a framework that has established a fair value hierarchy based upon the various data inputs utilized in determining the value of the Fund’s investments. The three-level hierarchy gives the highest priority to unadjusted quoted prices in active markets for identical assets or liabilities (Level 1) and the lowest priority to unobservable inputs (Level 3). The Fund’s investments are classified within the fair value hierarchy based on the lowest level of input that is significant to the fair value measurement. The inputs are summarized into three broad levels as follows:
| ∎ | | Level 1 – quoted prices in active markets for identical securities |
| ∎ | | Level 2 – other significant observable inputs (including quoted prices for similar securities, interest rates, prepayment speeds, credit risk, etc.) |
| ∎ | | Level 3 – significant unobservable inputs (including the Fund’s own assumptions in determining the fair value of investments) |
The inputs or methodologies used for valuing investments in securities are not necessarily an indication of the risk associated with investing in those securities.
| | | | | | |
| Notes to financial statements (unaudited) | | Wells Fargo Strategic Municipal Bond Fund | | | 43 | |
The following is a summary of the inputs used in valuing the Fund’s assets and liabilities as of December 31, 2018:
| | | | | | | | | | | | | | | | |
| | | | |
| | | Quoted prices
(Level 1) | | | Other significant
observable inputs
(Level 2) | | | Significant
unobservable inputs (Level 3) | | | Total | |
| | | | |
Assets | | | | | | | | | | | | | | | | |
Investments in: | | | | | | | | | | | | | | | | |
| | | | |
Municipal obligations | | $ | 0 | | | $ | 2,037,586,023 | | | $ | 0 | | | $ | 2,037,586,023 | |
| | | | |
Other | | | 0 | | | | 10,000,000 | | | | 0 | | | | 10,000,000 | |
| | | | |
Short-term investments | | | | | | | | | | | | | | | | |
| | | | |
Investment companies | | | 27,277,355 | | | | 0 | | | | 0 | | | | 27,277,355 | |
| | | | |
U.S. Treasury securities | | | 1,209,181 | | | | 0 | | | | 0 | | | | 1,209,181 | |
| | | | |
Total assets | | $ | 28,486,536 | | | $ | 2,047,586,023 | | | $ | 0 | | | $ | 2,076,072,559 | |
Additional sector, industry or geographic detail is included in the Portfolio of Investments.
At December 31, 2018, the Fund did not have any transfers into/out of Level 3.
4. TRANSACTIONS WITH AFFILIATES
Management fee
Funds Management, an indirect wholly owned subsidiary of Wells Fargo & Company (“Wells Fargo”), is the manager of the Fund and provides advisory and fund-level administrative services under an investment management agreement. Under the investment management agreement, Funds Management is responsible for, among other services, implementing the investment objectives and strategies of the Fund, supervising the subadviser and providing fund-level administrative services in connection with the Fund’s operations. As compensation for its services under the investment management agreement, Funds Management is entitled to receive an annual management fee starting at 0.40% and declining to 0.28% as the average daily net assets of the Fund increase. For the six months ended December 31, 2018, the management fee was equivalent to an annual rate of 0.37% of the Fund’s average daily net assets.
Funds Management has retained the services of a subadviser to provide daily portfolio management to the Fund. The fee for subadvisory services is borne by Funds Management. Wells Capital Management Incorporated, an affiliate of Funds Management and an indirect wholly owned subsidiary of Wells Fargo, is the subadviser to the Fund and is entitled to receive a fee from Funds Management at an annual rate starting at 0.20% and declining to 0.10% as the average daily net assets of the Fund increase.
Administration fees
Under a class-level administration agreement, Funds Management provides class-level administrative services to the Fund, which includes paying fees and expenses for services provided by the transfer agent, sub-transfer agents, omnibus account servicers and record-keepers. As compensation for its services under the class-level administration agreement, Funds Management receives an annual fee which is calculated based on the average daily net assets of each class as follows:
| | | | |
| | | Class-level
administration fee | |
| |
Class A, Class C | | | 0.16 | % |
| |
Class R6 | | | 0.03 | |
| |
Administrator Class | | | 0.10 | |
| |
Institutional Class | | | 0.08 | |
Funds Management has contractually waived and/or reimbursed management and administration fees to the extent necessary to maintain certain net operating expense ratios for the Fund. When each class of the Fund has exceeded its expense cap, Funds Management has waived fees and/or reimbursed expenses from fund level expenses on a proportionate basis and then from class specific expenses; otherwise, waivers and/or reimbursements are applied against class specific expenses before fund level expenses. Funds Management has committed through October 31, 2019 to waive fees and/or reimburse expenses to the extent necessary to cap the Fund’s expenses at 0.82% for Class A shares, 1.57% for Class C shares, 0.43% for Class R6 shares, 0.68% for Administrator Class shares, and 0.48% for Institutional Class shares. After this time, the cap may be increased or the commitment to maintain the cap may be terminated only with the approval of the Board of Trustees.
| | | | |
| 44 | | Wells Fargo Strategic Municipal Bond Fund | | Notes to financial statements (unaudited) |
Distribution fee
The Trust has adopted a distribution plan for Class C shares of the Fund pursuant to Rule 12b-1 under the 1940 Act. A distribution fee is charged to Class C shares and paid to Wells Fargo Funds Distributor, LLC (“Funds Distributor”), the principal underwriter, at an annual rate of 0.75% of the average daily net assets of Class C shares.
In addition, Funds Distributor is entitled to receive the front-end sales charge from the purchase of Class A shares and a contingent deferred sales charge on the redemption of certain Class A shares. Funds Distributor is also entitled to receive the contingent deferred sales charges from redemptions of Class C shares. For the six months ended December 31, 2018, Funds Distributor received $4,832 from the sale of Class A shares. No contingent deferred sales charges were incurred by Class A and Class C shares for the six months ended December 31, 2018.
Shareholder servicing fees
The Trust has entered into contracts with one or more shareholder servicing agents, whereby Class A, Class C and Administrator Class of the Fund are charged a fee at an annual rate of 0.25% of the average daily net assets of each respective class.
A portion of these total shareholder servicing fees were paid to affiliates of Wells Fargo.
Interfund transactions
The Fund may purchase or sell portfolio investment securities to certain other Wells Fargo affiliates pursuant toRule 17a-7 under the 1940 Act and under procedures adopted by the Board of Trustees. The procedures have been designed to ensure that these interfund transactions, which do not incur broker commissions, are effected at current market prices. Pursuant to these procedures, the Fund had $284,839,458 and $286,300,000 in interfund purchases and sales, respectively, during the six months ended December 31, 2018.
5. INVESTMENT PORTFOLIO TRANSACTIONS
Purchases and sales of investments, excluding U.S. government obligations (if any) and short-term securities, for the six months ended December 31, 2018 were $643,489,473 and $221,803,283, respectively.
6. DERIVATIVE TRANSACTIONS
During the six months ended December 31, 2018, the Fund entered into futures contracts for to take advantage of the differences between municipal and treasury yields and to help manage the duration of the portfolio. The Fund had an average notional amount of $161,058,882 in long futures contracts during the six months ended December 31, 2018.
The fair value, realized gains or losses and change in unrealized gains or losses, if any, on derivative instruments are reflected in the corresponding financial statement captions.
7. BANK BORROWINGS
The Trust (excluding the money market funds), Wells Fargo Master Trust and Wells Fargo Variable Trust are parties to a $280,000,000 revolving credit agreement whereby the Fund is permitted to use bank borrowings for temporary or emergency purposes, such as to fund shareholder redemption requests. Interest under the credit agreement is charged to the Fund based on a borrowing rate equal to the higher of the Federal Funds rate in effect on that day plus 1.25% or the overnight LIBOR rate in effect on that day plus 1.25%. In addition, an annual commitment fee equal to 0.25% of the unused balance is allocated to each participating fund.
For the six months ended December 31, 2018, there were no borrowings by the Fund under the agreement.
8. DISTRIBUTIONS TO SHAREHOLDERS
Effective for all filings after November 4, 2018, the Securities and Exchange Commission eliminated the requirement to separately state the components of distributions to shareholders under U.S. generally accepted accounting principles. The amounts of distributions to shareholders for the year ended June 30, 2018 were as follows:
| | | | | | | | |
| | | Net investment
income | | | Net realized
gains | |
| | |
Class A | | | $ 8,770,008 | | | | $1,271,860 | |
| | |
Class C | | | 1,173,934 | | | | 304,884 | |
| | |
Administrator Class | | | 3,668,568 | | | | 493,273 | |
| | |
Institutional Class | | | 22,770,948 | | | | 2,702,545 | |
| | | | | | |
| Notes to financial statements (unaudited) | | Wells Fargo Strategic Municipal Bond Fund | | | 45 | |
9. INDEMNIFICATION
Under the Trust’s organizational documents, the officers and Trustees have been granted certain indemnification rights against certain liabilities that may arise out of performance of their duties to the Trust. Additionally, in the normal course of business, the Trust may enter into contracts with service providers that contain a variety of indemnification clauses. The Trust’s maximum exposure under these arrangements is dependent on future claims that may be made against the Fund and, therefore, cannot be estimated.
10. NEW ACCOUNTING PRONOUNCEMENT
In August 2018, FASB issued Accounting Standards Update (“ASU”) No. 2018-13, Fair Value Measurement (Topic 820)Disclosure Framework—Changes to the Disclosure Requirements for Fair Value Measurement. ASU 2018-13 updates the disclosure requirements for fair value measurements by modifying or removing certain disclosures and adding certain new disclosures. The amendments are effective for fiscal years, and interim periods within those fiscal years, beginning after December 15, 2019. Early adoption is permitted. Management has adopted the removal and modification of disclosures early, as permitted, and will adopt the additional new disclosures at the effective date.
| | | | |
| 46 | | Wells Fargo Strategic Municipal Bond Fund | | Other information (unaudited) |
PROXY VOTING INFORMATION
A description of the policies and procedures used to determine how to vote proxies relating to portfolio securities is available, upon request, by calling1-800-222-8222, visiting our website atwellsfargofunds.com, or visiting the SEC website at sec.gov. Information regarding how the Fund voted proxies relating to portfolio securities during the most recent 12-month period ended June 30 is available on the Fund’s website atwellsfargofunds.comor by visiting the SEC website at sec.gov.
PORTFOLIO HOLDINGS INFORMATION
The complete portfolio holdings for the Fund are publicly available monthly on the Fund’s website (wellsfargofunds.com), on a one-month delayed basis. In addition, top ten holdings information (excluding derivative positions) for the Fund is publicly available on the Fund’s website on a monthly, seven-day or more delayed basis. The Fund files its complete schedule of portfolio holdings with the SEC for the first and third quarters of each fiscal year on Form N-Q, which is available by visiting the SEC website at sec.gov. In addition, the Fund’s Form N-Q may be reviewed and copied at the SEC’s Public Reference Room in Washington, DC, and at regional offices in New York City, at 233 Broadway, and in Chicago, at 175 West Jackson Boulevard, Suite 900. Information about the Public Reference Room may be obtained by calling 1-800-SEC-0330.
| | | | | | |
| Other information (unaudited) | | Wells Fargo Strategic Municipal Bond Fund | | | 47 | |
BOARD OF TRUSTEES AND OFFICERS
Each of the Trustees and Officers1 listed in the table below acts in identical capacities for each fund in the Wells Fargo family of funds, which consists of 152 mutual funds comprising the Wells Fargo Funds Trust, Wells Fargo Variable Trust, Wells Fargo Master Trust and four closed-end funds (collectively the “Fund Complex”). This table should be read in conjunction with the Prospectus and the Statement of Additional Information2. The mailing address of each Trustee and Officer is 525 Market Street, 12th Floor, San Francisco, CA 94105. Each Trustee and Officer serves an indefinite term, however, each Trustee serves such term until reaching the mandatory retirement age established by the Trustees.
Independent Trustees
| | | | | | |
Name and
year of birth | | Position held and
length of service* | | Principal occupations during past five years or longer | | Current other
public company or
investment company
directorships |
| | | |
William R. Ebsworth (Born 1957) | | Trustee, since 2015 | | Retired. From 1984 to 2013, equities analyst, portfolio manager, research director and chief investment officer at Fidelity Management and Research Company in Boston, Tokyo, and Hong Kong, and retired in 2013 as Chief Investment Officer of Fidelity Strategic Advisers, Inc. where he led a team of investment professionals managing client assets. Prior thereto, Board member of Hong Kong Securities Clearing Co., Hong Kong Options Clearing Corp., the Thailand International Fund, Ltd., Fidelity Investments Life Insurance Company, and Empire Fidelity Investments Life Insurance Company. Board member of the Vincent Memorial Hospital Endowment (non-profit organization), where he serves on the Investment Committee and as a Chair of the Audit Committee. Mr. Ebsworth is a CFA® charterholder. | | N/A |
| | | |
Jane A. Freeman (Born 1953) | | Trustee, since 2015; Chair Liaison, since 2018 | | Retired. From 2012 to 2014 and 1999 to 2008, Chief Financial Officer of Scientific Learning Corporation. From 2008 to 2012, Ms. Freeman provided consulting services related to strategic business projects. Prior to 1999, Portfolio Manager at Rockefeller & Co. and Scudder, Stevens & Clark. Board member of the Harding Loevner Funds from 1996 to 2014, serving as both Lead Independent Director and chair of the Audit Committee. Board member of the Russell Exchange Traded Funds Trust from 2011 to 2012 and the chair of the Audit Committee. Ms. Freeman is a Board Member of The Ruth Bancroft Garden (non-profit organization). She is also an inactive Chartered Financial Analyst. | | N/A |
| | | |
Isaiah Harris, Jr.3 (Born 1952) | | Trustee, since 2009; Audit Committee Chairman, since 2019 | | Retired. Chairman of the Board of CIGNA Corporation since 2009, and Director since 2005. From 2003 to 2011, Director of Deluxe Corporation. Prior thereto, President and CEO of BellSouth Advertising and Publishing Corp. from 2005 to 2007, President and CEO of BellSouth Enterprises from 2004 to 2005 and President of BellSouth Consumer Services from 2000 to 2003. Emeritus member of the Iowa State University Foundation Board of Governors. Emeritus Member of the Advisory Board of Iowa State University School of Business. Advisory Board Member, Palm Harbor Academy (private school). Advisory Board Member, Child Evangelism Fellowship (non-profit). Mr. Harris is a certified public accountant (inactive status). | | CIGNA Corporation |
| | | |
Judith M. Johnson3 (Born 1949) | | Trustee, since 2008; Audit Committee Chairman, from 2009 to 2018 | | Retired. Prior thereto, Chief Executive Officer and Chief Investment Officer of Minneapolis Employees Retirement Fund from 1996 to 2008. Ms. Johnson is an attorney, certified public accountant and a certified managerial accountant. | | N/A |
| | | |
David F. Larcker (Born 1950) | | Trustee, since 2009 | | James Irvin Miller Professor of Accounting at the Graduate School of Business, Stanford University, Director of the Corporate Governance Research Initiative and Senior Faculty of The Rock Center for Corporate Governance since 2006. From 2005 to 2008, Professor of Accounting at the Graduate School of Business, Stanford University. Prior thereto, Ernst & Young Professor of Accounting at The Wharton School, University of Pennsylvania from 1985 to 2005. | | N/A |
| | | | |
| 48 | | Wells Fargo Strategic Municipal Bond Fund | | Other information (unaudited) |
| | | | | | |
Name and
year of birth | | Position held and
length of service* | | Principal occupations during past five years or longer | | Current other
public company or
investment company
directorships |
| | | |
Olivia S. Mitchell (Born 1953) | | Trustee, since 2006; Nominating and Governance Committee Chairman, since 2018 | | International Foundation of Employee Benefit Plans Professor, Wharton School of the University of Pennsylvania since 1993. Director of Wharton’s Pension Research Council and Boettner Center on Pensions & Retirement Research, and Research Associate at the National Bureau of Economic Research. Previously, Cornell University Professor from 1978 to 1993. | | N/A |
| | | |
Timothy J. Penny (Born 1951) | | Trustee, since 1996; Chairman, since 2018; Vice Chairman, from 2017 to 2018 | | President and Chief Executive Officer of Southern Minnesota Initiative Foundation, a non-profit organization, since 2007. Member of the Board of Trustees of NorthStar Education Finance, Inc., a non-profit organization, since 2007. | | N/A |
| | | |
James G. Polisson (Born 1959) | | Trustee, since 2018; Advisory Board Member, from 2017 to 2018 | | Retired. Chief Marketing Officer, Source (ETF) UK Services, Ltd, from 2015 to 2017. From 2012 to 2015, Principal of The Polisson Group, LLC, a management consulting, corporate advisory and principal investing company. Chief Executive Officer and Managing Director at Russell Investments, Global Exchange Traded Funds from 2010 to 2012. Managing Director of Barclays Global Investors from 1998 to 2010 and Global Chief Marketing Officer for iShares and Barclays Global Investors from 2000 to 2010. Trustee of the San Francisco Mechanics’ Institute, a non-profit organization, from 2013 to 2015. Board member of the Russell Exchange Traded Fund Trust from 2011 to 2012. Director of Barclays Global Investors Holdings Deutschland GmbH from 2006 to 2009. Mr. Polisson is an attorney and has a retired status with the Massachusetts and District of Columbia Bar Associations. | | N/A |
| | | |
Michael S. Scofield4 (Born 1943) | | Trustee, since 2010 | | Served on the Investment Company Institute’s Board of Governors and Executive Committee from 2008-2011 as well the Governing Council of the Independent Directors Council from 2006-2011 and the Independent Directors Council Executive Committee from 2008-2011. Trustee of the Evergreen Fund complex (and its predecessors) from 1984 to 2010. Chairman of the Evergreen Funds from 2000-2010. Former Trustee of the Mentor Funds. Retired Attorney, Law Offices of Michael S. Scofield. | | N/A |
| | | |
Pamela Wheelock (Born 1959) | | Trustee, since 2018; Advisory Board Member, from 2017 to 2018 | | Chief Operating Officer, Twin Cities Habitat for Humanity, since January, 2017. Vice President of University Services, University of Minnesota from 2012 to 2017. Prior thereto, on the Board of Directors, Governance Committee and Finance Committee for the Minnesota Philanthropy Partners (Saint Paul Foundation) from 2012 to 2018, Interim President and Chief Executive Officer of Blue Cross Blue Shield of Minnesota from 2010 to 2011, Chairman of the Board from 2009 to 2011 and Board Director from 2003 to 2015. Vice President, Leadership and Community Engagement, Bush Foundation, Saint Paul, Minnesota (a private foundation) from 2009 to 2011. Executive Vice President and Chief Financial Officer, Minnesota Sports and Entertainment from 2004 to 2009 and Senior Vice President from 2002 to 2004. Commissioner of Finance, State of Minnesota, from 1999 to 2002. Currently the Board Chair of the Minnesota Wild Foundation since 2010. | | N/A |
| * | Length of service dates reflect the Trustee’s commencement of service with the Trust’s predecessor entities, where applicable. |
| | | | | | |
| Other information (unaudited) | | Wells Fargo Strategic Municipal Bond Fund | | | 49 | |
Officers
| | | | | | |
Name and
year of birth | | Position held and
length of service | | Principal occupations during past five years or longer | | |
| | | |
Andrew Owen (Born 1960) | | President, since 2017 | | Executive Vice President of Wells Fargo & Company and Head of Affiliated Managers, Wells Fargo Asset Management, since 2014. In addition, Mr. Owen is currently President, Chief Executive Officer and Director of Wells Fargo Funds Management, LLC since 2017. Prior thereto, Executive Vice President responsible for marketing, investments and product development for Wells Fargo Funds Management, LLC, from 2009 to 2014. | | |
| | | |
Nancy Wiser1 (Born 1967) | | Treasurer, since 2012 | | Executive Vice President of Wells Fargo Funds Management, LLC since 2011. Chief Operating Officer and Chief Compliance Officer at LightBox Capital Management LLC, from 2008 to 2011. | | |
| | | |
Alexander Kymn (Born 1973) | | Secretary, since 2018; Chief Legal Officer, since 2018 | | Senior Company Counsel of Wells Fargo Bank, N.A. since 2018 (previously Senior Counsel from 2007 to 2018). Vice President of Wells Fargo Funds Management, LLC from 2008 to 2014. | | |
| | | |
Michael H. Whitaker (Born 1967) | | Chief Compliance Officer, since 2016 | | Senior Vice President and Chief Compliance Officer since 2016. Senior Vice President and Chief Compliance Officer for Fidelity Investments from 2007 to 2016. | | |
| | | |
David Berardi (Born 1975) | | Assistant Treasurer, since 2009 | | Vice President of Wells Fargo Funds Management, LLC since 2009. Vice President of Evergreen Investment Management Company, LLC from 2008 to 2010. Manager of Fund Reporting and Control for Evergreen Investment Management Company, LLC from 2004 to 2010. | | |
| | | |
Jeremy DePalma1 (Born 1974) | | Assistant Treasurer, since 2009 | | Senior Vice President of Wells Fargo Funds Management, LLC since 2009. Senior Vice President of Evergreen Investment Management Company, LLC from 2008 to 2010 and head of the Fund Reporting and Control Team within Fund Administration from 2005 to 2010. | | |
| 1 | Nancy Wiser acts as Treasurer of 76 funds in the Fund Complex. Jeremy DePalma acts as Treasurer of 76 funds and Assistant Treasurer of 76 funds in the Fund Complex. |
| 2 | The Statement of Additional Information includes additional information about the Trustees and is available, without charge, upon request, by calling1-800-222-8222 or by visiting the website atwellsfargofunds.com. |
| 3 | Mr. Harris replaced Ms. Johnson as the Chairman of the Audit Committee effective January 1, 2019. |
| 4 | Mr. Scofield retired on December 31, 2018. |
| | | | |
| 50 | | Wells Fargo Strategic Municipal Bond Fund | | Appendix A (unaudited) |
SALES CHARGE REDUCTIONS AND WAIVERS FOR CERTAIN INTERMEDIARIES
Raymond James & Associates, Inc., Raymond James Financial Services & Raymond James affiliates (“Raymond James”)
Effective on or about March 1, 2019, shareholders purchasing Fund shares through a Raymond James platform or account will be eligible only for the following load waivers (front-end sales charge waivers and contingent deferred, or back-end, sales charge waivers) and discounts, which may differ from those disclosed elsewhere in the Fund’s Prospectus or SAI.
Front-end Sales Load Waivers on Class A shares Available at Raymond James
| | • | | Shares purchased in an investment advisory program. |
| | • | | Shares purchased through reinvestment of capital gains distributions and dividend reinvestment when purchasing shares of the same fund (but not any other fund within the fund family). |
| | • | | Employees and registered representatives of Raymond James or its affiliates and their family members as designated by Raymond James. |
| | • | | Shares purchased from the proceeds of redemptions within the same fund family, provided (1) the repurchase occurs within 90 days following the redemption, (2) the redemption and purchase occur in the same account, and (3) redeemed shares were subject to a front-end or deferred sales load (known as Rights of Reinstatement). |
| | • | | A shareholder in the fund’s Class C shares will have their shares automatically exchanged at net asset value to Class A shares (or the appropriate share class) of the fund if the shares are no longer subject to a CDSC and the exchange is in line with the policies and procedures of Raymond James. |
CDSC Waivers on Class A and C Shares Available at Raymond James
| | • | | Death or disability of the shareholder. |
| | • | | Shares sold as part of a systematic withdrawal plan as described in the Fund’s Prospectus. |
| | • | | Return of excess contributions from an IRA Account. |
| | • | | Shares sold as part of a required minimum distribution for IRA and retirement accounts due to the shareholder reaching age 70½ as described in the Fund’s prospectus. |
| | • | | Shares sold to pay Raymond James fees but only if the transaction is initiated by Raymond James. |
| | • | | Shares acquired through a right of reinstatement. |
Front-end Load Discounts Available at Raymond James: Breakpoints, and/or Rights of Accumulation
| | • | | Breakpoints as described in the Fund’s Prospectus. |
| | • | | Rights of accumulation which entitle shareholders to breakpoint discounts will be automatically calculated based on the aggregated holding of fund family assets held by accounts within the purchaser’s household at Raymond James. Eligible fund family assets not held at Raymond James may be included in the rights of accumulation calculation only if the shareholder notifies his or her financial advisor about such assets. |
This page is intentionally left blank.
This page is intentionally left blank.

For more information
More information about Wells Fargo Funds is available free upon request. To obtain literature, please write, visit the Fund’s website, or call:
Wells Fargo Funds
P.O. Box 219967
Kansas City, MO 64121-9967
Website: wellsfargofunds.com
Individual investors: 1-800-222-8222
Retail investment professionals: 1-888-877-9275
Institutional investment professionals:1-866-765-0778
This report and the financial statements contained herein are submitted for the general information of the shareholders of the Fund. If this report is used for promotional purposes, distribution of the report must be accompanied or preceded by a current prospectus. Before investing, please consider the investment objectives, risks, charges, and expenses of the investment. For a current prospectus and, if available, a summary prospectus, containing this information, call1-800-222-8222 or visit the Fund’s website atwellsfargofunds.com. Read the prospectus carefully before you invest or send money.
Wells Fargo Asset Management (WFAM) is the trade name for certain investment advisory/management firms owned by Wells Fargo & Company. These firms include but are not limited to Wells Capital Management Incorporated and Wells Fargo Funds Management, LLC. Certain products managed by WFAM entities are distributed by Wells Fargo Funds Distributor, LLC (a broker/dealer and Member FINRA).
This material is for general informational and educational purposes only and is NOT intended to provide investment advice or a recommendation of any kind—including a recommendation for any specific investment, strategy, or plan.
INVESTMENT PRODUCTS: NOT FDIC INSURED ◾ NO BANK GUARANTEE ◾ MAY LOSE VALUE
© 2019 Wells Fargo Funds Management, LLC. All rights reserved.
| | |
 | | 320452 02-19 SA257/SAR257 12-18 |
Semi-Annual Report
December 31, 2018

Wells Fargo
Ultra Short-Term Municipal Income Fund

Beginning on January 1, 2021, as permitted by new regulations adopted by the Securities and Exchange Commission, paper copies of the Wells Fargo Funds’ annual and semi-annual shareholder reports issued after this date will no longer be sent by mail, unless you specifically request paper copies of the reports. Instead, the reports will be made available on the Funds’ website, and you will be notified by mail each time a report is posted and provided with a website address to access the report.
If you already elected to receive shareholder reports electronically, you will not be affected by this change and you need not take any action. You may elect to receive shareholder reports and other communications from the Fund electronically at any time by contacting your financial intermediary (such as a broker-dealer or bank) or, if you are a direct investor, by calling 1-800-222-8222 or by enrolling at wellsfargo.com/advantagedelivery.
You may elect to receive all future reports in paper free of charge. If you invest through a financial intermediary, you can contact your financial intermediary to request that you continue to receive paper copies of your shareholder reports; if you invest directly with the Fund, you can call 1-800-222-8222. Your election to receive reports in paper will apply to all Wells Fargo Funds held in your account with your financial intermediary or, if you are a direct investor, to all Wells Fargo Funds that you hold.

Reduce clutter. Save trees.
Sign up for electronic delivery of prospectuses and shareholder reports atwellsfargo.com/advantagedelivery
Contents
The views expressed and any forward-looking statements are as of December 31, 2018, unless otherwise noted, and are those of the Fund managers and/or Wells Fargo Funds Management, LLC. Discussions of individual securities, or the markets generally, or any Wells Fargo Fund are not intended as individual recommendations. Future events or results may vary significantly from those expressed in any forward-looking statements. The views expressed are subject to change at any time in response to changing circumstances in the market. Wells Fargo Funds Management, LLC and the Fund disclaim any obligation to publicly update or revise any views expressed or forward-looking statements.
INVESTMENT PRODUCTS: NOT FDIC INSURED ◾ NO BANK GUARANTEE ◾ MAY LOSE VALUE
| | | | |
| 2 | | Wells Fargo Ultra Short-Term Municipal Income Fund | | Letter to shareholders (unaudited) |

Andrew Owen
President
Wells Fargo Funds
Global trade tensions escalated during the third quarter of 2018.
Dear Shareholder:
We are pleased to offer you this semi-annual report for the Wells Fargo Ultra Short-Term Municipal Income Fund for the six-month period that ended December 31, 2018. During the reporting period, the U.S. generated encouraging economic and business data that was offset by less positive and more inconsistent data from international markets. Investment returns were generally negative as geopolitical tensions and uncertainty tended to distract investors from more favorable underlying trends.
For the period, U.S. stocks, as measured by the S&P 500 Index,1 fell 6.85% and international stocks, as measured by the MSCI ACWI ex USA Index (Net),2 declined 10.84%. Based on the MSCI EM Index (Net),3 emerging market stocks lost 8.48%. For bond investors, the Bloomberg Barclays U.S. Aggregate Bond Index4 gained 1.65% while the Bloomberg Barclays Global Aggregate ex-USD Index5 fell 0.84%. The Bloomberg Barclays Municipal Bond Index6 gained 1.53% while the ICE BofAML U.S. High Yield Index7 declined 2.34%.
Global trade tensions prompted investor concerns.
Global trade tensions escalated during the third quarter of 2018. The U.S. imposed tariffs on a wide range of products manufactured overseas. Foreign governments retaliated with tariffs that punished U.S. commodity producers and product manufacturers. Investors wondered about next steps as divergence in global economic policies and growth prospects widened.
During the summer months, the U.S. economy strengthened. Revised second-quarter gross domestic product (GDP) growth data released in August showed the U.S. economy growing at a 4.2% rate. The unemployment rate in the U.S. was 3.7% by the end of September, according to the U.S. Department of Labor. Wages showed more consistent growth, and consumer confidence remained strong. Several U.S. equity market indices reached records during August, with the S&P 500 Index gaining 7.71% for the three-month period that ended September 30, 2018. In contrast, the MSCI ACWI ex USA Index (Net) gained 0.71% while the MSCI EM Index (Net) declined 1.09% during the same three-month period.
| 1 | The S&P 500 Index consists of 500 stocks chosen for market size, liquidity, and industry group representation. It is a market-value-weighted index with each stock’s weight in the index proportionate to its market value. You cannot invest directly in an index. |
| 2 | The Morgan Stanley Capital International (MSCI) All Country World Index (ACWI) ex USA Index (Net) is a free-float-adjusted market-capitalization-weighted index that is designed to measure the equity market performance of developed markets, excluding the United States and Canada. Source: MSCI. MSCI makes no express or implied warranties or representations and shall have no liability whatsoever with respect to any MSCI data contained herein. The MSCI data may not be further redistributed or used as a basis for other indices or any securities or financial products. This report is not approved, reviewed, or produced by MSCI. You cannot invest directly in an index. |
| 3 | The MSCI Emerging Markets (EM) Index (Net) is a free-float-adjusted market-capitalization-weighted index that is designed to measure large- and mid-cap equity market performance of emerging markets. The MSCI EM Index (Net) consists of the following 24 emerging market country indices: Brazil, Chile, China, Colombia, Czech Republic, Egypt, Greece, Hungary, India, Indonesia, Korea, Malaysia, Mexico, Pakistan, Peru, the Philippines, Poland, Qatar, Russia, South Africa, Taiwan, Thailand, Turkey, and the United Arab Emirates. You cannot invest directly in an index. |
| 4 | The Bloomberg Barclays U.S. Aggregate Bond Index is a broad-based benchmark that measures the investment-grade, U.S. dollar-denominated, fixed-rate taxable bond market, including Treasuries, government-related and corporate securities, mortgage-backed securities (agency fixed-rate and hybrid adjustable-rate mortgage pass-throughs), asset-backed securities, and commercial mortgage-backed securities. You cannot invest directly in an index. |
| 5 | The Bloomberg Barclays Global Aggregate ex-USD Index is an unmanaged index that provides a broad-based measure of the global investment-grade fixed-income markets excluding the U.S. dollar-denominated debt market. You cannot invest directly in an index. |
| 6 | The Bloomberg Barclays Municipal Bond Index is an unmanaged index composed of long-term tax-exempt bonds with a minimum credit rating of Baa. You cannot invest directly in an index. |
| 7 | The ICE BofAML U.S. High Yield Index is a market-capitalization-weighted index of domestic and Yankee high-yield bonds. The index tracks the performance of high-yield securities traded in the U.S. bond market. You cannot invest directly in an index. Copyright 2018. ICE Data Indices, LLC. All rights reserved. |
| | | | | | |
| Letter to shareholders (unaudited) | | Wells Fargo Ultra Short-Term Municipal Income Fund | | | 3 | |
Economic signals overseas were mixed as the third quarter ended and the fourth quarter began. In particular, signs of slowing economic growth in China created uncertainty for investors. Amid rising trade tensions, the People’s Bank of China cut reserve requirement ratios and accelerated infrastructure spending and tax cuts for business enterprises and individuals. Nevertheless, a strengthening U.S. dollar and trade tensions remained headwinds for investors overseas.
Equity markets were volatile during the fourth quarter.
Negative stock market performance during October and December bracketed a mildly positive November, as measured by the S&P 500 Index and the MSCI ACWI ex USA Index (Net). As interest rates and bond yields gained during October, stock markets struggled. Readings on consumer sentiment and business spending were mixed. Markets rebounded in November. The U.S. and China agreed to halt further increases in tariffs and engage in additional negotiations. While November returns were positive, the loss for the full fourth quarter was substantial for equity investors globally, with the S&P down 13.52% and the MSCI ACWI ex USA Index (Net) down 11.46%. December’s S&P 500 Index performance was the lowest since 1931. Globally, fixed income investments fared better than stocks during the last two months of the year as conflicting signals unsettled investors’ outlooks.
Equity investors confronted a number of changing conditions. In November’s mid-term elections, control of the U.S. House of Representatives shifted from Republicans to Democrats, presaging potential partisan disputes. Progress on Brexit negotiations stalled in the UK. In China, the value of the yuan declined to low levels last seen in 2008. Oil prices continued to fall. The Fed increased the federal funds rate by 25 bps to a target range of between 2.25% and 2.50% in December 2018. A late-December dispute over spending and immigration policy resulted in a partial U.S. government shutdown that continued through the end of the period.
Don’t let short-term uncertainty derail long-term investment goals.
Periods of investment uncertainty can present challenges, but experience has taught us that maintaining long-term investment goals can be an effective way to plan for the future. To help you create a sound strategy based on your personal goals and risk tolerance, Wells Fargo Funds offers more than 100 mutual funds spanning a wide range of asset classes and investment styles. Although diversification cannot guarantee an investment profit or prevent losses, we believe it can be an effective way to manage investment risk and potentially smooth out overall portfolio performance. We encourage investors to know their investments and to understand that appropriate levels of risk-taking may unlock opportunities.
Thank you for choosing to invest with Wells Fargo Funds. We appreciate your confidence in us and remain committed to helping you meet your financial needs.
Sincerely,

Andrew Owen
President
Wells Fargo Funds
Economic signals overseas were mixed as the third quarter ended and the fourth quarter began.
For further information about your Fund, contact your investment professional, visit our website atwellsfargofunds.com, or call us directly at1-800-222-8222.
| | | | |
| 4 | | Wells Fargo Ultra Short-Term Municipal Income Fund | | Performance highlights (unaudited) |
Investment objective
The Fund seeks current income exempt from federal income tax, consistent with capital preservation.
Manager
Wells Fargo Funds Management, LLC
Subadviser
Wells Capital Management Incorporated
Portfolio managers
Wendy Casetta
Lyle J. Fitterer, CFA®‡, CPA
Bruce R. Johns
Average annual total returns (%) as of December 31, 2018
| | | | | | | | | | | | | | | | | | | | | | | | | | | | | | | | | | |
| | | | | Including sales charge | | | Excluding sales charge | | | Expense ratios1 (%) | |
| | | Inception date | | 1 year | | | 5 year | | | 10 year | | | 1 year | | | 5 year | | | 10 year | | | Gross | | | Net2 | |
| | | | | | | | | |
| Class A (SMAVX) | | 10-2-2000 | | | -0.88 | | | | 0.03 | | | | 0.93 | | | | 1.14 | | | | 0.43 | | | | 1.14 | | | | 0.77 | | | | 0.67 | |
| | | | | | | | | |
| Class C (WFUSX) | | 3-31-2008 | | | -0.61 | | | | -0.31 | | | | 0.37 | | | | 0.39 | | | | -0.31 | | | | 0.37 | | | | 1.52 | | | | 1.42 | |
| | | | | | | | | |
| Class R63 | | 7-31-2018 | | | – | | | | – | | | | – | | | | 1.46 | | | | 0.74 | | | | 1.44 | | | | 0.39 | | | | 0.32 | |
| | | | | | | | | |
| Administrator Class (WUSMX)4 | | 7-30-2010 | | | – | | | | – | | | | – | | | | 1.21 | | | | 0.50 | | | | 1.21 | | | | 0.71 | | | | 0.60 | |
| | | | | | | | | |
| Institutional Class (SMAIX) | | 7-31-2000 | | | – | | | | – | | | | – | | | | 1.44 | | | | 0.73 | | | | 1.44 | | | | 0.44 | | | | 0.37 | |
| | | | | | | | | |
| Ultra Short-Term Municipal Blended Index5 | | – | | | – | | | | – | | | | – | | | | 1.55 | | | | 0.64 | | | | 0.73 | | | | – | | | | – | |
| | | | | | | | | |
| Bloomberg Barclays 1-Year Municipal Bond Index6 | | – | | | – | | | | – | | | | – | | | | 1.74 | | | | 0.83 | | | | 1.20 | | | | – | | | | – | |
| | | | | | | | | |
| iMoneyNet Tax-Free National Institutional Money Market Funds Average7 | | – | | | – | | | | – | | | | – | | | | 1.36 | | | | 0.44 | | | | 0.26 | | | | – | | | | – | |
Figures quoted represent past performance, which is no guarantee of future results, and do not reflect taxes that a shareholder may pay on fund distributions or the redemption of fund shares. Investment return and principal value of an investment will fluctuate so that an investor’s shares, when redeemed, may be worth more or less than their original cost. Performance shown without sales charges would be lower if sales charges were reflected. Current performance may be lower or higher than the performance data quoted, which assumes the reinvestment of dividends and capital gains. Current month-end performance is available on the Fund’s website, wellsfargofunds.com.
Index returns do not include transaction costs associated with buying and selling securities, any mutual fund fees or expenses, or any taxes. It is not possible to invest directly in an index.
For Class A shares, the maximum front-end sales charge is 2.00%. For Class C shares, the maximum contingent deferred sales charge is 1.00%. Performance including a contingent deferred sales charge assumes the sales charge for the corresponding time period. Class R6, Administrator Class, and Institutional Class shares are sold without a front-end sales charge or contingent deferred sales charge.
Bond values fluctuate in response to the financial condition of individual issuers, general market and economic conditions, and changes in interest rates. Changes in market conditions and government policies may lead to periods of heightened volatility in the bond market and reduced liquidity for certain bonds held by the Fund. In general, when interest rates rise, bond values fall and investors may lose principal value. Interest rate changes and their impact on the Fund and its share price can be sudden and unpredictable. The use of derivatives may reduce returns and/or increase volatility. Certain investment strategies tend to increase the total risk of an investment (relative to the broader market). The Fund is exposed to high-yield securities risk and municipal securities risk. Consult the Fund’s prospectus for additional information on these and other risks. A portion of the Fund’s income may be subject to federal, state, and/or local income taxes or the Alternative Minimum Tax (AMT). Any capital gains distributions may be taxable.
Please see footnotes on page 5.
| | | | | | |
| Performance highlights (unaudited) | | Wells Fargo Ultra Short-Term Municipal Income Fund | | | 5 | |
|
| Effective maturity distribution as of December 31, 20188 |
|
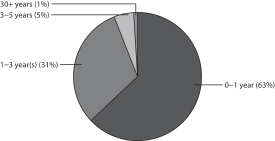 |
|
| Credit quality as of December 31, 20189 |
|
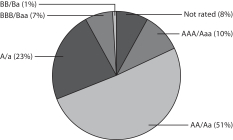 |
| ‡ | CFA® and Chartered Financial Analyst® are trademarks owned by CFA Institute. |
| 1 | Reflects the expense ratios as stated in the most recent prospectuses. The expense ratios shown are subject to change and may differ from the annualized expense ratios shown in the financial highlights of this report. |
| 2 | The manager has contractually committed through October 31, 2019, to waive fees and/or reimburse expenses to the extent necessary to cap the Fund’s Total Annual Fund Operating Expenses After Fee Waivers at the amounts shown. After this time, the cap may be increased or the commitment to maintain the cap may be terminated only with the approval of the Board of Trustees. Brokerage commissions, stamp duty fees, interest, taxes, acquired fund fees and expenses (if any), and extraordinary expenses are excluded from the expense cap. Without this cap, the Fund’s returns would have been lower. The expense ratio paid by an investor is the net expense ratio or (the total annual fund operating expenses after fee waivers) as stated in the prospectuses. |
| 3 | Historical performance shown for Class R6 shares prior to their inception reflects the performance of the Institutional Class shares, and includes the higher expenses applicable to Institutional Class shares. If these expenses had not been included, returns for Class R6 shares would be higher. |
| 4 | Historical performance shown for Administrator Class shares prior to their inception reflects the performance of Institutional Class shares, adjusted to reflect the higher expenses applicable to Administrator Class shares. |
| 5 | Source: Wells Fargo Funds Management LLC. The Ultra Short-Term Municipal Blended Index is weighted 50% in the Bloomberg Barclays1-Year Municipal Bond Index and 50% in the iMoneyNet Tax-Free National Institutional Money Market Funds Average. You cannot invest directly in an index. |
| 6 | The Bloomberg Barclays 1-Year Municipal Bond Index is the one-year component of the Bloomberg Barclays Municipal Bond Index, which is an unmanaged index composed of long-term tax-exempt bonds with a minimum credit rating of Baa. You cannot invest directly in an index. |
| 7 | iMoneyNet Tax-Free National Institutional Money Market Funds Average is the return of an unmanaged group of money market funds. You cannot invest directly in this average. |
| 8 | Amounts are calculated based on the total long-term investments of the Fund. These amounts are subject to change and may have changed since the date specified. |
| 9 | The credit quality distribution of portfolio holdings reflected in the chart is based on ratings from Standard & Poor’s, Moody’s Investors Service, and/ or Fitch Ratings Ltd. Credit quality ratings apply to the underlying holdings of the Fund and not to the Fund itself. The percentages of the Fund’s portfolio with the ratings depicted in the chart are calculated based on the total market value of fixed income securities held by the Fund. If a security was rated by all three rating agencies, the middle rating was utilized. If rated by two of three rating agencies, the lower rating was utilized, and if rated by one of the rating agencies, that rating was utilized. Standard & Poor’s rates the creditworthiness of bonds, ranging from AAA (highest) to D (lowest). Ratings from A to CCC may be modified by the addition of a plus (+) or minus (-) sign to show relative standing within the rating categories. Standard & Poor’s rates the creditworthiness of short-term notes from SP-1 (highest) to SP-3 (lowest). Moody’s rates the creditworthiness of bonds, ranging from Aaa (highest) to C (lowest). Ratings Aa to B may be modified by the addition of a number 1 (highest) to 3 (lowest) to show relative standing within the ratings categories. Moody’s rates the creditworthiness of short-term U.S. tax-exempt municipal securities from MIG 1/VMIG 1 (highest) to SG (lowest). Fitch rates the creditworthiness of bonds, ranging from AAA (highest) to D (lowest). Credit quality distribution is subject to change and may have changed since the date specified. |
| | | | |
| 6 | | Wells Fargo Ultra Short-Term Municipal Income Fund | | Fund expenses (unaudited) |
As a shareholder of the Fund, you incur two types of costs: (1) transaction costs, including sales charges (loads) on purchase payments and contingent deferred sales charges (if any) on redemptions and (2) ongoing costs, including management fees, distribution (12b-1) and/or shareholder servicing fees, and other Fund expenses. This example is intended to help you understand your ongoing costs (in dollars) of investing in the Fund and to compare these costs with the ongoing costs of investing in other mutual funds.
The example is based on an investment of $1,000 invested at the beginning of the six-month period and held for the entire period from July 1, 2018 to December 31, 2018.
Actual expenses
The “Actual” line of the table below provides information about actual account values and actual expenses. You may use the information in this line, together with the amount you invested, to estimate the expenses that you paid over the period. Simply divide your account value by $1,000 (for example, an $8,600 account value divided by $1,000 = 8.6), then multiply the result by the number in the “Actual” line under the heading entitled “Expenses paid during period” for your applicable class of shares to estimate the expenses you paid on your account during this period.
Hypothetical example for comparison purposes
The “Hypothetical” line of the table below provides information about hypothetical account values and hypothetical expenses based on the Fund’s actual expense ratio and an assumed rate of return of 5% per year before expenses, which is not the Fund’s actual return. The hypothetical account values and expenses may not be used to estimate the actual ending account balance or expenses you paid for the period. You may use this information to compare the ongoing costs of investing in the Fund and other funds. To do so, compare this 5% hypothetical example with the 5% hypothetical examples that appear in the shareholder reports of the other funds.
Please note that the expenses shown in the table are meant to highlight your ongoing costs only and do not reflect any transactional costs, such as sales charges (loads) and contingent deferred sales charges. Therefore, the “Hypothetical” line of the table is useful in comparing ongoing costs only and will not help you determine the relative total costs of owning different funds. In addition, if these transactional costs were included, your costs would have been higher.
| | | | | | | | | | | | | | | | |
| | | Beginning
account value
7-1-2018 | | | Ending
account value
12-31-2018 | | | Expenses
paid during
the period¹ | | | Annualized net
expense ratio | |
Class A | | | | | | | | | | | | | | | | |
| | | | |
Actual | | $ | 1,000.00 | | | $ | 1,006.14 | | | $ | 3.39 | | | | 0.67 | % |
| | | | |
Hypothetical (5% return before expenses) | | $ | 1,000.00 | | | $ | 1,021.83 | | | $ | 3.41 | | | | 0.67 | % |
Class C | | | | | | | | | | | | | | | | |
| | | | |
Actual | | $ | 1,000.00 | | | $ | 1,001.30 | | | $ | 7.16 | | | | 1.42 | % |
| | | | |
Hypothetical (5% return before expenses) | | $ | 1,000.00 | | | $ | 1,018.05 | | | $ | 7.22 | | | | 1.42 | % |
Class R6 | | | | | | | | | | | | | | | | |
| | | | |
Actual | | $ | 1,000.00 | | | $ | 1,007.88 | | | $ | 1.62 | | | | 0.32 | % |
| | | | |
Hypothetical (5% return before expenses) | | $ | 1,000.00 | | | $ | 1,023.59 | | | $ | 1.63 | | | | 0.32 | % |
Administrator Class | | | | | | | | | | | | | | | | |
| | | | |
Actual | | $ | 1,000.00 | | | $ | 1,006.49 | | | $ | 3.03 | | | | 0.60 | % |
| | | | |
Hypothetical (5% return before expenses) | | $ | 1,000.00 | | | $ | 1,022.18 | | | $ | 3.06 | | | | 0.60 | % |
Institutional Class | | | | | | | | | | | | | | | | |
| | | | |
Actual | | $ | 1,000.00 | | | $ | 1,007.66 | | | $ | 1.87 | | | | 0.37 | % |
| | | | |
Hypothetical (5% return before expenses) | | $ | 1,000.00 | | | $ | 1,023.34 | | | $ | 1.89 | | | | 0.37 | % |
| 1 | Expenses paid is equal to the annualized net expense ratio of each class multiplied by the average account value over the period, multiplied by the number of days in the most recent fiscal half-year divided by the number of days in the fiscal year (to reflect the one-half-year period). |
| | | | | | |
| Portfolio of investments—December 31, 2018 (unaudited) | | Wells Fargo Ultra Short-Term Municipal Income Fund | | | 7 | |
| | | | | | | | | | | | | | | | |
| Security name | | Interest rate | | | Maturity date | | | Principal | | | Value | |
| | | | |
Municipal Obligations: 98.51% | | | | | | | | | | | | | | | | |
| | | | |
Alabama: 2.62% | | | | | | | | | | | | | | | | |
| | | | |
| GO Revenue: 0.09% | | | | | | | | | | | | | | | | |
| | | | |
Jefferson County AL Series A | | | 4.90 | % | | | 4-1-2021 | | | $ | 2,595,000 | | | $ | 2,650,974 | |
| | | | | | | | | | | | | | | | |
| | | | |
| Health Revenue: 0.64% | | | | | | | | | | | | | | | | |
| | | | |
Alabama Health Care Authority for Baptist Health Series B (AGC Insured) (m) | | | 2.15 | | | | 11-15-2037 | | | | 5,225,000 | | | | 5,225,000 | |
| | | | |
Alabama Health Care Authority for Baptist Health Series B ø | | | 2.44 | | | | 11-1-2042 | | | | 13,295,000 | | | | 13,295,000 | |
| |
| | | | 18,520,000 | |
| | | | | | | | | | | | | | | | |
| | | | |
| Utilities Revenue: 1.89% | | | | | | | | | | | | | | | | |
| | | | |
Alabama Black Belt Energy Gas District Series A (Royal Bank of Canada LIQ) | | | 4.00 | | | | 7-1-2046 | | | | 18,635,000 | | | | 19,214,176 | |
| | | | |
Alabama Black Belt Energy Gas District Series A (Royal Bank of Canada LIQ) | | | 4.00 | | | | 8-1-2047 | | | | 4,280,000 | | | | 4,452,741 | |
| | | | |
Chatom AL Industrial Development Board Alabama Electric Series A (National Rural Utilities Cooperative Finance SPA) ø | | | 1.65 | | | | 8-1-2037 | | | | 6,820,000 | | | | 6,818,295 | |
| | | | |
Tender Option Bond Trust Receipts/Floater Certificates Series 2016-XM0184 (Morgan Stanley Bank LIQ) 144Aø | | | 2.11 | | | | 9-1-2046 | | | | 24,555,000 | | | | 24,555,000 | |
| |
| | | | 55,040,212 | |
| | | | | | | | | | | | | | | | |
| |
| | | | 76,211,186 | |
| | | | | | | | | | | | | | | | |
| | | | |
Alaska: 0.07% | | | | | | | | | | | | | | | | |
| | | | |
| Health Revenue: 0.07% | | | | | | | | | | | | | | | | |
| | | | |
Alaska IDA Loan Anticipation YKHC Project | | | 3.50 | | | | 12-1-2020 | | | | 2,000,000 | | | | 2,015,000 | |
| | | | | | | | | | | | | | | | |
| | | | |
Arizona: 2.12% | | | | | | | | | | | | | | | | |
| | | | |
| Education Revenue: 0.09% | | | | | | | | | | | | | | | | |
| | | | |
Phoenix AZ IDA BASIS Schools Incorporated Project Series A 144A | | | 3.00 | | | | 7-1-2020 | | | | 1,535,000 | | | | 1,520,617 | |
| | | | |
Pima County AZ IDA Charter Schools Refunding Bond Project Series Q | | | 4.00 | | | | 7-1-2019 | | | | 945,000 | | | | 951,643 | |
| |
| | | | 2,472,260 | |
| | | | | | | | | | | | | | | | |
| | | | |
| GO Revenue: 0.10% | | | | | | | | | | | | | | | | |
| | | | |
Maricopa County AZ Gilbert Unified School District #41 (Build America Mutual Assurance Company Insured) | | | 3.00 | | | | 7-1-2019 | | | | 3,005,000 | | | | 3,022,970 | |
| | | | | | | | | | | | | | | | |
| | | | |
| Health Revenue: 1.48% | | | | | | | | | | | | | | | | |
| | | | |
Maricopa County AZ IDA Series A | | | 5.00 | | | | 1-1-2048 | | | | 3,910,000 | | | | 4,309,055 | |
| | | | |
Scottsdale AZ IDA Healthcare Series F (AGM Insured) (m) | | | 1.48 | | | | 9-1-2045 | | | | 38,575,000 | | | | 38,575,000 | |
| |
| | | | 42,884,055 | |
| | | | | | | | | | | | | | | | |
| | | | |
| Industrial Development Revenue: 0.45% | | | | | | | | | | | | | | | | |
| | | | |
Chandler AZ IDA Intel Corporation Project | | | 2.70 | | | | 12-1-2037 | | | | 3,200,000 | | | | 3,209,632 | |
| | | | |
Phoenix AZ IDA Various Republic Services Incorporated Projects | | | 2.15 | | | | 12-1-2035 | | | | 10,000,000 | | | | 9,997,700 | |
| |
| | | | 13,207,332 | |
| | | | | | | | | | | | | | | | |
| |
| | | | 61,586,617 | |
| | | | | | | | | | | | | | | | |
The accompanying notes are an integral part of these financial statements.
| | | | |
| 8 | | Wells Fargo Ultra Short-Term Municipal Income Fund | | Portfolio of investments—December 31, 2018 (unaudited) |
| | | | | | | | | | | | | | | | |
| Security name | | Interest rate | | | Maturity date | | | Principal | | | Value | |
| | | | |
Arkansas: 0.26% | | | | | | | | | | | | | | | | |
| | | | |
| Housing Revenue: 0.26% | | | | | | | | | | | | | | | | |
| | | | |
Arkansas Development Finance Authority Pine Bluff Conversion Project | | | 1.69 | % | | | 11-1-2021 | | | $ | 7,430,000 | | | $ | 7,413,505 | |
| | | | | | | | | | | | | | | | |
| | | | |
California: 8.79% | | | | | | | | | | | | | | | | |
| | | | |
| Airport Revenue: 1.72% | | | | | | | | | | | | | | | | |
| | | | |
California Tender Option Bond Trust Receipts/Floater Certificates Series 2018-XF0712 (Bank of America NA LOC, Bank of America NA LIQ) 144Aø | | | 1.83 | | | | 5-1-2043 | | | | 25,000,000 | | | | 25,000,000 | |
| | | | |
California Tender Option Bond Trust Receipts/Floater Certificates San Francisco & County Airport Commission (Morgan Stanley Bank LIQ) 144Aø | | | 2.01 | | | | 5-1-2048 | | | | 10,000,000 | | | | 10,000,000 | |
| | | | |
California Tender Option Bond Trust Receipts/Floater Certificates Series 2018-XG0175 (Morgan Stanley Bank LIQ) 144Aø | | | 1.91 | | | | 5-1-2042 | | | | 15,000,000 | | | | 15,000,000 | |
| |
| | | | 50,000,000 | |
| | | | | | | | | | | | | | | | |
| | | | |
| GO Revenue: 1.55% | | | | | | | | | | | | | | | | |
| | | | |
California Refunding Bond Series A (SIFMA Municipal Swap +0.25%) ± | | | 1.96 | | | | 5-1-2033 | | | | 21,505,000 | | | | 21,451,883 | |
| | | | |
California Series B (SIFMA Municipal Swap +0.38%) ± | | | 2.09 | | | | 12-1-2027 | | | | 6,730,000 | | | | 6,728,519 | |
| | | | |
California Series D (SIFMA Municipal Swap +0.29%) ± | | | 2.00 | | | | 12-1-2028 | | | | 16,910,000 | | | | 16,902,898 | |
| |
| | | | 45,083,300 | |
| | | | | | | | | | | | | | | | |
| | | | |
| Health Revenue: 3.43% | | | | | | | | | | | | | | | | |
| | | | |
California Statewide CDA Health Facilities Catholic Series D (AGM Insured) (m) | | | 2.01 | | | | 7-1-2041 | | | | 20,050,000 | | | | 20,050,000 | |
| | | | |
California Statewide CDA Health Facilities Catholic Series E (AGM Insured) (m) | | | 2.10 | | | | 7-1-2040 | | | | 22,200,000 | | | | 22,200,000 | |
| | | | |
California Statewide CDA Health Facilities Catholic Series F (AGM Insured) (m) | | | 2.04 | | | | 7-1-2040 | | | | 18,825,000 | | | | 18,825,000 | |
| | | | |
California Tender Option Bond Trust Receipts/Floater Certificates Series 2017-013 (Barclays Bank plc LOC, Barclays Bank plc LIQ) 144Aø | | | 1.83 | | | | 8-15-2051 | | | | 8,710,000 | | | | 8,710,000 | |
| | | | |
California Tender Option Bond Trust Receipts/Floater Certificates Series 2018-XG0175 (Bank of America NA LIQ) 144Aø | | | 1.84 | | | | 3-1-2039 | | | | 5,300,000 | | | | 5,300,000 | |
| | | | |
Palomar CA Pomerado Health Care District Certificate of Participation Series A (AGM Insured) (m) | | | 2.59 | | | | 11-1-2036 | | | | 11,025,000 | | | | 11,025,000 | |
| | | | |
Palomar CA Pomerado Health Care District Certificate of Participation Series B (AGM Insured) (m) | | | 2.59 | | | | 11-1-2036 | | | | 11,075,000 | | | | 11,075,000 | |
| | | | |
Palomar CA Pomerado Health Care District Certificate of Participation Series C (AGM Insured) (m) | | | 2.58 | | | | 11-1-2036 | | | | 2,500,000 | | | | 2,500,000 | |
| |
| | | | 99,685,000 | |
| | | | | | | | | | | | | | | | |
| | | | |
| Housing Revenue: 0.31% | | | | | | | | | | | | | | | | |
| | | | |
California Development Authority for Westgate Pasadena Apartments LP Project Series B ø | | | 2.14 | | | | 4-1-2042 | | | | 9,000,000 | | | | 9,000,000 | |
| | | | | | | | | | | | | | | | |
| | | | |
| Miscellaneous Revenue: 1.06% | | | | | | | | | | | | | | | | |
| | | | |
California Infrastructure & Economic Development Bank The J. Paul Getty Trust Series A-2 (3 Month LIBOR +0.37%) ± | | | 2.29 | | | | 4-1-2038 | | | | 25,640,000 | | | | 25,684,870 | |
| | | | |
California Infrastructure & Economic Development Bank The J. Paul Getty Trust Series B2 (1 Month LIBOR +0.20%) ± | | | 1.84 | | | | 10-1-2047 | | | | 5,000,000 | | | | 4,991,750 | |
| |
| | | | 30,676,620 | |
| | | | | | | | | | | | | | | | |
| | | | |
| Transportation Revenue: 0.39% | | | | | | | | | | | | | | | | |
| | | | |
California Tender Option Bond Trust Receipts/Floater Certificates Series 2017-BAML01 (Bank of America NA LIQ) 144Aø | | | 1.76 | | | | 4-1-2047 | | | | 11,445,000 | | | | 11,445,000 | |
| | | | | | | | | | | | | | | | |
The accompanying notes are an integral part of these financial statements.
| | | | | | |
| Portfolio of investments—December 31, 2018 (unaudited) | | Wells Fargo Ultra Short-Term Municipal Income Fund | | | 9 | |
| | | | | | | | | | | | | | | | |
| Security name | | Interest rate | | | Maturity date | | | Principal | | | Value | |
| | | | |
| Water & Sewer Revenue: 0.33% | | | | | | | | | | | | | | | | |
| | | | |
Tender Option Bond Trust Receipts for Semitropic CA Improvement District Water Storage Series A (JPMorgan Chase & Company LIQ) 144Aø | | | 1.86 | % | | | 12-1-2019 | | | $ | 9,595,000 | | | $ | 9,595,000 | |
| | | | | | | | | | | | | | | | |
| |
| | | | 255,484,920 | |
| | | | | | | | | | | | | | | | |
| | | | |
Colorado: 1.05% | | | | | | | | | | | | | | | | |
| | | | |
| Airport Revenue: 0.44% | | | | | | | | | | | | | | | | |
| | | | |
Denver CO City & County Airport Subordinate Bond Series F-2 (AGC Insured) (m) | | | 2.10 | | | | 11-15-2025 | | | | 2,700,000 | | | | 2,700,000 | |
| | | | |
Tender Option Bond Trust (Morgan Stanley Bank LIQ) 144Aø | | | 2.01 | | | | 12-1-2036 | | | | 10,000,000 | | | | 10,000,000 | |
| |
| | | | 12,700,000 | |
| | | | | | | | | | | | | | | | |
| | | | |
| Education Revenue: 0.10% | | | | | | | | | | | | | | | | |
| | | | |
Colorado RBC Municipal Products Incorporated Trust Series 2018-E123 (Royal Bank of Canada LOC, Royal Bank of Canada LIQ) 144Aø | | | 1.74 | | | | 4-1-2020 | | | | 3,000,000 | | | | 3,000,000 | |
| | | | | | | | | | | | | | | | |
| | | | |
| Health Revenue: 0.37% | | | | | | | | | | | | | | | | |
| | | | |
Colorado Health Facilities Authority Catholic Health Initiatives Series B-3 | | | 1.88 | | | | 7-1-2039 | | | | 360,000 | | | | 358,610 | |
| | | | |
Denver CO Health & Hospital Authority Refunding Bond Series A 144A | | | 5.00 | | | | 12-1-2019 | | | | 1,355,000 | | | | 1,388,889 | |
| | | | |
Denver CO Health & Hospital Authority Refunding Bond Series A 144A | | | 5.00 | | | | 12-1-2020 | | | | 1,175,000 | | | | 1,235,089 | |
| | | | |
University of Colorado Hospital Authority Series C-1 | | | 4.00 | | | | 11-15-2047 | | | | 7,775,000 | | | | 7,868,766 | |
| |
| | | | 10,851,354 | |
| | | | | | | | | | | | | | | | |
| | | | |
| Housing Revenue: 0.04% | | | | | | | | | | | | | | | | |
| | | | |
Colorado HFA Park Terrace Project (HUD Insured) | | | 1.85 | | | | 4-1-2020 | | | | 1,250,000 | | | | 1,246,500 | |
| | | | | | | | | | | | | | | | |
| | | | |
| Tax Revenue: 0.02% | | | | | | | | | | | | | | | | |
| | | | |
Pueblo CO Urban Renewal Authority Regional Tourism Act Project | | | 2.75 | | | | 6-1-2020 | | | | 545,000 | | | | 543,872 | |
| | | | | | | | | | | | | | | | |
| | | | |
| Transportation Revenue: 0.08% | | | | | | | | | | | | | | | | |
| | | | |
Colorado E-470 Public Highway Authority Series A (1 Month LIBOR +0.90%) ± | | | 2.58 | | | | 9-1-2039 | | | | 2,150,000 | | | | 2,151,269 | |
| | | | | | | | | | | | | | | | |
| |
| | | | 30,492,995 | |
| | | | | | | | | | | | | | | | |
| | | | |
Connecticut: 1.31% | | | | | | | | | | | | | | | | |
| | | | |
| Education Revenue: 0.83% | | | | | | | | | | | | | | | | |
| | | | |
Connecticut HEFAR Yale University Issue Series A | | | 1.00 | | | | 7-1-2042 | | | | 11,730,000 | | | | 11,681,672 | |
| | | | |
Connecticut HEFAR Yale University Issue Series A | | | 1.30 | | | | 7-1-2048 | | | | 9,395,000 | | | | 9,329,799 | |
| | | | |
Connecticut HEFAR Yale University Issue Series U-1 | | | 1.00 | | | | 7-1-2033 | | | | 1,100,000 | | | | 1,099,175 | |
| | | | |
Connecticut Higher Education Supplemental Loan Authority Chesla Loan Program Series B | | | 4.00 | | | | 11-15-2019 | | | | 935,000 | | | | 946,762 | |
| | | | |
Connecticut Higher Education Supplemental Loan Authority Chesla Loan Program Series B | | | 5.00 | | | | 11-15-2021 | | | | 545,000 | | | | 579,340 | |
| | | | |
Connecticut Higher Education Supplemental Loan Authority Chesla Loan Program Series B | | | 5.00 | | | | 11-15-2023 | | | | 440,000 | | | | 480,181 | |
| |
| | | | 24,116,929 | |
| | | | | | | | | | | | | | | | |
| | | | |
| GO Revenue: 0.26% | | | | | | | | | | | | | | | | |
| | | | |
New Haven CT Series A | | | 5.25 | | | | 8-1-2019 | | | | 575,000 | | | | 584,838 | |
| | | | |
New Haven CT TANS | | | 3.00 | | | | 4-3-2019 | | | | 7,000,000 | | | | 7,015,540 | |
| |
| | | | 7,600,378 | |
| | | | | | | | | | | | | | | | |
The accompanying notes are an integral part of these financial statements.
| | | | |
| 10 | | Wells Fargo Ultra Short-Term Municipal Income Fund | | Portfolio of investments—December 31, 2018 (unaudited) |
| | | | | | | | | | | | | | | | |
| Security name | | Interest rate | | | Maturity date | | | Principal | | | Value | |
| | | | |
| Housing Revenue: 0.22% | | | | | | | | | | | | | | | | |
| | | | |
Connecticut HFA Housing Mortgage Finance Program Series A | | | 2.40 | % | | | 11-15-2020 | | | $ | 980,000 | | | $ | 984,273 | |
| | | | |
Connecticut HFA Housing Mortgage Finance Program Series F | | | 1.55 | | | | 5-15-2020 | | | | 800,000 | | | | 791,544 | |
| | | | |
Connecticut HFA Subordinate Bond Series E-3 (GNMA/FNMA/FHLMC Insured) | | | 1.50 | | | | 11-15-2047 | | | | 4,580,000 | | | | 4,518,353 | |
| |
| | | | 6,294,170 | |
| | | | | | | | | | | | | | | | |
| |
| | | | 38,011,477 | |
| | | | | | | | | | | | | | | | |
| | | | |
Florida: 2.50% | | | | | | | | | | | | | | | | |
| | | | |
| Airport Revenue: 0.23% | | | | | | | | | | | | | | | | |
| | | | |
Florida Tender Option Bond Trust Receipts/Certificates Series 2017-XF0577 (Royal Bank of Canada LIQ) 144Aø | | | 1.91 | | | | 10-1-2025 | | | | 6,665,000 | | | | 6,665,000 | |
| | | | | | | | | | | | | | | | |
| | | | |
| Education Revenue: 0.09% | | | | | | | | | | | | | | | | |
| | | | |
University of North Florida Financing Corporation Housing Project (AGM Insured) | | | 5.00 | | | | 11-1-2019 | | | | 2,510,000 | | | | 2,568,307 | |
| | | | | | | | | | | | | | | | |
| | | | |
| GO Revenue: 0.28% | | | | | | | | | | | | | | | | |
| | | | |
Saint Lucie County FL School Board | | | 3.00 | | | | 6-28-2019 | | | | 8,000,000 | | | | 8,044,560 | |
| | | | | | | | | | | | | | | | |
| | | | |
| Health Revenue: 0.45% | | | | | | | | | | | | | | | | |
| | | | |
Escambia County FL HFA ACTS Retirement-Life Communities Incorporated Series B (AGC Insured, TD Bank NA SPA) ø | | | 1.75 | | | | 11-15-2029 | | | | 1,475,000 | | | | 1,475,000 | |
| | | | |
Highlands County FL HFA Adventist Health System Series I5 ø | | | 1.71 | | | | 11-15-2035 | | | | 2,350,000 | | | | 2,350,000 | |
| | | | |
Hillsborough County FL IDA University Community Hospital Series B | | | 8.00 | | | | 8-15-2032 | | | | 3,830,000 | | | | 4,011,504 | |
| | | | |
Miami FL HFFA Miami Jewish Health Systems Incorporate Project | | | 5.00 | | | | 7-1-2020 | | | | 390,000 | | | | 403,981 | |
| | | | |
Miami-Dade County FL Health Facilities Authority Miami Children’s Hospital Project Series A | | | 5.25 | | | | 8-1-2021 | | | | 425,000 | | | | 446,611 | |
| | | | |
North Broward FL Hospital District Series B | | | 5.00 | | | | 1-1-2020 | | | | 780,000 | | | | 800,584 | |
| | | | |
North Broward FL Hospital District Series B | | | 5.00 | | | | 1-1-2021 | | | | 925,000 | | | | 972,305 | |
| | | | |
Palm Beach County FL Health Facilities Authority Lifespace Communities Series C | | | 4.00 | | | | 5-15-2019 | | | | 610,000 | | | | 612,397 | |
| | | | |
Palm Beach County FL Health Facilities Authority Retirement Life Communities Project | | | 4.00 | | | | 11-15-2019 | | | | 2,090,000 | | | | 2,116,292 | |
| |
| | | | 13,188,674 | |
| | | | | | | | | | | | | | | | |
| | | | |
| Housing Revenue: 0.69% | | | | | | | | | | | | | | | | |
| | | | |
Florida Housing Finance Corporation Series 1 (GNMA/FNMA/FHLMC Insured) | | | 1.95 | | | | 1-1-2021 | | | | 1,620,000 | | | | 1,619,676 | |
| | | | |
Florida Housing Finance Corporation Series 1 (GNMA/FNMA/FHLMC Insured) | | | 2.00 | | | | 7-1-2021 | | | | 1,415,000 | | | | 1,416,033 | |
| | | | |
Florida Housing Finance Corporation Series 1 (GNMA/FNMA/FHLMC Insured) | | | 2.05 | | | | 1-1-2022 | | | | 1,055,000 | | | | 1,056,530 | |
| | | | |
Jacksonville FL HFA Desert-Silver LLC Project | | | 2.25 | | | | 12-1-2021 | | | | 7,250,000 | | | | 7,247,245 | |
| | | | |
Miami-Dade County FL HFA St. John Plaza Apartments | | | 1.78 | | | | 8-1-2019 | | | | 7,625,000 | | | | 7,619,815 | |
| | | | |
Pinellas County FL HFA | | | 1.85 | | | | 1-1-2022 | | | | 1,120,000 | | | | 1,116,931 | |
| |
| | | | 20,076,230 | |
| | | | | | | | | | | | | | | | |
| | | | |
| Miscellaneous Revenue: 0.34% | | | | | | | | | | | | | | | | |
| | | | |
Pasco County FL School Board Certificate of Participation Series B (Ambac Insured) (m) | | | 2.10 | | | | 8-1-2030 | | | | 9,825,000 | | | | 9,825,000 | |
| | | | | | | | | | | | | | | | |
| | | | |
| Resource Recovery Revenue: 0.02% | | | | | | | | | | | | | | | | |
| | | | |
Lee County FL Solid Waste System | | | 5.00 | | | | 10-1-2020 | | | | 470,000 | | | | 489,590 | |
| | | | | | | | | | | | | | | | |
The accompanying notes are an integral part of these financial statements.
| | | | | | |
| Portfolio of investments—December 31, 2018 (unaudited) | | Wells Fargo Ultra Short-Term Municipal Income Fund | | | 11 | |
| | | | | | | | | | | | | | | | |
| Security name | | Interest rate | | | Maturity date | | | Principal | | | Value | |
| | | | |
| Transportation Revenue: 0.40% | | | | | | | | | | | | | | | | |
| | | | |
Miami-Dade County FL Expressway Authority Toll System (Dexia Credit Local LOC, Dexia Credit Local LIQ) 144A | | | 2.04 | % | | | 7-1-2026 | | | $ | 11,775,000 | | | $ | 11,775,000 | |
| | | | | | | | | | | | | | | | |
| |
| | | | 72,632,361 | |
| | | | | | | | | | | | | | | | |
| | | | |
Georgia: 3.71% | | | | | | | | | | | | | | | | |
| | | | |
| Housing Revenue: 2.50% | | | | | | | | | | | | | | | | |
| | | | |
Atlanta GA Urban Residential Finance Authority Bethel Towers I LP Apartments Project | | | 2.07 | | | | 7-1-2021 | | | | 3,500,000 | | | | 3,498,075 | |
| | | | |
Augusta GA Housing Authority Richmond Villas Apartments Project | | | 1.20 | | | | 9-1-2019 | | | | 5,470,000 | | | | 5,460,974 | |
| | | | |
Clayton County GA Housing Authority Renaissance at Garden Walk Apartments Project | | | 2.30 | | | | 6-1-2022 | | | | 13,000,000 | | | | 13,018,070 | |
| | | | |
DeKalb County GA Housing Authority Sterling at Candler Village Project | | | 1.75 | | | | 1-1-2021 | | | | 5,630,000 | | | | 5,629,606 | |
| | | | |
Douglas County GA Housing Authority Douglas Village Apartments Project | | | 2.25 | | | | 12-1-2021 | | | | 9,500,000 | | | | 9,508,740 | |
| | | | |
East Point GA Housing Authority HSG-Hillcrest Senior Apartments Project (FHA Insured) | | | 2.25 | | | | 6-1-2022 | | | | 15,000,000 | | | | 14,999,850 | |
| | | | |
Fulton County GA Housing Authority Residences Maggie Capitol Series A | | | 2.00 | | | | 3-1-2021 | | | | 8,735,000 | | | | 8,730,895 | |
| | | | |
Macon-Bibb County GA Housing Authority Hallmark Portfolio | | | 2.04 | | | | 4-1-2021 | | | | 11,765,000 | | | | 11,759,118 | |
| |
| | | | 72,605,328 | |
| | | | | | | | | | | | | | | | |
| | | | |
| Industrial Development Revenue: 0.25% | | | | | | | | | | | | | | | | |
| | | | |
Monroe County GA PCR Georgia Power Company Plant Scherer Project | | | 2.35 | | | | 10-1-2048 | | | | 7,430,000 | | | | 7,368,628 | |
| | | | | | | | | | | | | | | | |
| | | | |
| Utilities Revenue: 0.96% | | | | | | | | | | | | | | | | |
| | | | |
Burke County GA Development Authority Georgia Power Company Plant Vogtle Project Fifth Series 1995 | | | 2.05 | | | | 10-1-2032 | | | | 1,350,000 | | | | 1,316,696 | |
| | | | |
Burke County GA Development Authority Georgia Power Company Plant Vogtle Project First Series 1996 | | | 2.35 | | | | 10-1-2032 | | | | 5,315,000 | | | | 5,299,958 | |
| | | | |
Burke County GA Development Authority Georgia Power Company Plant Vogtle Project First Series 2008 | | | 1.65 | | | | 11-1-2048 | | | | 1,755,000 | | | | 1,696,013 | |
| | | | |
Burke County GA Development Authority Georgia Power Company Plant Vogtle Project First Series 2012 | | | 1.85 | | | | 12-1-2049 | | | | 12,120,000 | | | | 12,084,125 | |
| | | | |
Maine Street National Gas Incorporated GA Series A | | | 5.00 | | | | 3-15-2019 | | | | 5,000,000 | | | | 5,029,200 | |
| | | | |
Monroe County GA Development Authority Power Company Plant Scherer Project | | | 2.05 | | | | 7-1-2049 | | | | 2,545,000 | | | | 2,482,215 | |
| |
| | | | 27,908,207 | |
| | | | | | | | | | | | | | | | |
| |
| | | | 107,882,163 | |
| | | | | | | | | | | | | | | | |
| | | | |
Hawaii: 0.69% | | | | | | | | | | | | | | | | |
| | | | |
| GO Revenue: 0.62% | | | | | | | | | | | | | | | | |
| | | | |
Honolulu HI Rail Transit Project Series H (SIFMA Municipal Swap +0.31%) ± | | | 2.02 | | | | 9-1-2024 | | | | 7,820,000 | | | | 7,816,872 | |
| | | | |
Honolulu HI Rail Transit Project Series H (SIFMA Municipal Swap +0.32%) ± | | | 2.03 | | | | 9-1-2025 | | | | 7,035,000 | | | | 7,032,256 | |
| | | | |
Honolulu HI Rail Transit Project Series H (SIFMA Municipal Swap +0.32%) ± | | | 2.03 | | | | 9-1-2026 | | | | 3,125,000 | | | | 3,123,781 | |
| |
| | | | 17,972,909 | |
| | | | | | | | | | | | | | | | |
| | | | |
| Health Revenue: 0.07% | | | | | | | | | | | | | | | | |
| | | | |
Hawaii Department of Budget & Finance Queens Health System Series B (SIFMA Municipal Swap +0.45%) ± | | | 2.16 | | | | 7-1-2039 | | | | 2,180,000 | | | | 2,180,000 | |
| | | | | | | | | | | | | | | | |
| |
| | | | 20,152,909 | |
| | | | | | | | | | | | | | | | |
The accompanying notes are an integral part of these financial statements.
| | | | |
| 12 | | Wells Fargo Ultra Short-Term Municipal Income Fund | | Portfolio of investments—December 31, 2018 (unaudited) |
| | | | | | | | | | | | | | | | |
| Security name | | Interest rate | | | Maturity date | | | Principal | | | Value | |
| | | | |
Idaho: 0.23% | | | | | | | | | | | | | | | | |
| | | | |
| Housing Revenue: 0.23% | | | | | | | | | | | | | | | | |
| | | | |
Idaho Housing & Finance Association Series A (FNMA LOC) ø | | | 1.89 | % | | | 1-1-2038 | | | $ | 6,745,000 | | | $ | 6,745,000 | |
| | | | | | | | | | | | | | | | |
| | | | |
Illinois: 7.65% | | | | | | | | | | | | | | | | |
| | | | |
| Education Revenue: 0.52% | | | | | | | | | | | | | | | | |
| | | | |
Illinois Tender Option Bond Trust Receipts/Floater Certificates Series 2018-XF1077 (Deutsche Bank LOC, Deutsche Bank LIQ) 144Aø | | | 2.08 | | | | 4-1-2058 | | | | 15,000,000 | | | | 15,000,000 | |
| | | | | | | | | | | | | | | | |
| | | | |
| GO Revenue: 1.99% | | | | | | | | | | | | | | | | |
| | | | |
Chicago IL Neighborhoods Alive 21 Program Series B | | | 5.00 | | | | 1-1-2019 | | | | 1,505,000 | | | | 1,505,000 | |
| | | | |
Chicago Il Park District Series F | | | 5.50 | | | | 1-1-2023 | | | | 1,000,000 | | | | 1,000,000 | |
| | | | |
Chicago IL Refunding Bond Emergency System (AGM/FGIC Insured) | | | 5.50 | | | | 1-1-2019 | | | | 2,345,000 | | | | 2,345,000 | |
| | | | |
Chicago IL Refunding Bond Project Series A | | | 4.00 | | | | 1-1-2019 | | | | 980,000 | | | | 980,000 | |
| | | | |
Chicago IL Refunding Bond Project Series B | | | 5.00 | | | | 1-1-2019 | | | | 2,505,000 | | | | 2,505,000 | |
| | | | |
Chicago IL Refunding Bond Project Series B | | | 5.00 | | | | 1-1-2020 | | | | 2,575,000 | | | | 2,621,015 | |
| | | | |
Chicago IL Series A | | | 4.00 | | | | 1-1-2019 | | | | 1,045,000 | | | | 1,045,000 | |
| | | | |
Chicago IL Series A | | | 5.00 | | | | 12-1-2019 | | | | 780,000 | | | | 793,120 | |
| | | | |
Chicago IL Series C | | | 5.00 | | | | 1-1-2020 | | | | 1,005,000 | | | | 1,022,567 | |
| | | | |
Chicago IL Series C | | | 5.00 | | | | 1-1-2021 | | | | 1,565,000 | | | | 1,615,941 | |
| | | | |
Grundy, Kendall & Will Counties IL Community School District #201 (AGC Insured) | | | 5.75 | | | | 10-15-2019 | | | | 420,000 | | | | 421,340 | |
| | | | |
Illinois | | | 5.00 | | | | 1-1-2020 | | | | 6,315,000 | | | | 6,445,910 | |
| | | | |
Illinois | | | 5.00 | | | | 2-1-2020 | | | | 2,375,000 | | | | 2,427,226 | |
| | | | |
Illinois | | | 5.00 | | | | 2-1-2021 | | | | 3,115,000 | | | | 3,225,489 | |
| | | | |
Illinois | | | 5.00 | | | | 11-1-2021 | | | | 5,380,000 | | | | 5,624,736 | |
| | | | |
Illinois | | | 5.00 | | | | 1-1-2022 | | | | 5,915,000 | | | | 6,180,584 | |
| | | | |
JPMorgan Chase Putters/Drivers Trust Series 5021 (JPMorgan Chase & Company LOC, JPMorgan Chase & Company LIQ) 144Aø | | | 1.78 | | | | 3-29-2019 | | | | 8,000,000 | | | | 8,000,000 | |
| | | | |
Lake County IL Water Sewerage System Grainger Incorporated Project (Northern Trust Company LIQ) ø | | | 1.89 | | | | 4-1-2021 | | | | 1,500,000 | | | | 1,500,000 | |
| | | | |
Waukegan IL Series 2018B (AGM Insured) | | | 3.00 | | | | 12-30-2020 | | | | 2,340,000 | | | | 2,379,031 | |
| | | | |
Waukegan IL Series 2018B (AGM Insured) | | | 4.00 | | | | 12-30-2021 | | | | 800,000 | | | | 840,048 | |
| | | | |
Will County IL High School District 210 Lincoln-Way (AGM Insured) | | | 5.00 | | | | 1-1-2019 | | | | 3,080,000 | | | | 3,080,000 | |
| | | | |
Winnebago, Boone & Ogle Counties IL Rockford Park District Series 2018B | | | 2.31 | | | | 12-15-2019 | | | | 2,280,000 | | | | 2,280,616 | |
| |
| | | | 57,837,623 | |
| | | | | | | | | | | | | | | | |
| | | | |
| | | | | | | | | | | | | | | | |
| | | | |
| Health Revenue: 1.27% | | | | | | | | | | | | | | | | |
| | | | |
Illinois Finance Authority Presbyterian Homes Obligated Group Series A | | | 4.00 | | | | 5-1-2019 | | | | 390,000 | | | | 392,188 | |
| | | | |
Illinois Finance Authority Presbyterian Homes Obligated Group Series A | | | 4.00 | | | | 11-1-2019 | | | | 390,000 | | | | 395,522 | |
| | | | |
Illinois Finance Authority Presbyterian Homes Obligated Group Series B (1 Month LIBOR +1.35%) ± | | | 2.99 | | | | 5-1-2036 | | | | 3,910,000 | | | | 3,922,512 | |
| | | | |
Illinois State Finance Authority Northwestern Memorial Hospital Series A-1 (JPMorgan Chase & Company SPA) ø | | | 1.75 | | | | 8-15-2042 | | | | 32,100,000 | | | | 32,100,000 | |
| |
| | | | 36,810,222 | |
| | | | | | | | | | | | | | | | |
| | | | |
| Housing Revenue: 0.36% | | | | | | | | | | | | | | | | |
| | | | |
Chicago IL Multifamily Housing Mark Twain Apartments Project | | | 2.20 | | | | 6-1-2021 | | | | 10,325,000 | | | | 10,324,897 | |
| | | | | | | | | | | | | | | | |
The accompanying notes are an integral part of these financial statements.
| | | | | | |
| Portfolio of investments—December 31, 2018 (unaudited) | | Wells Fargo Ultra Short-Term Municipal Income Fund | | | 13 | |
| | | | | | | | | | | | | | | | |
| Security name | | Interest rate | | | Maturity date | | | Principal | | | Value | |
| | | | |
| Miscellaneous Revenue: 0.72% | | | | | | | | | | | | | | | | |
| | | | |
Illinois | | | 5.00 | % | | | 8-1-2019 | | | $ | 7,925,000 | | | $ | 8,040,071 | |
| | | | |
Illinois Refunding Bond | | | 5.00 | | | | 8-1-2022 | | | | 2,290,000 | | | | 2,409,240 | |
| | | | |
Illinois Series 2014 | | | 5.00 | | | | 5-1-2019 | | | | 1,955,000 | | | | 1,971,266 | |
| | | | |
Illinois Series D | | | 5.00 | | | | 11-1-2021 | | | | 7,820,000 | | | | 8,175,732 | |
| | | | |
Minooka IL Special Assessment Refunding & Improvement Bond (AGM Insured) | | | 3.50 | | | | 12-1-2019 | | | | 433,000 | | | | 436,871 | |
| |
| | | | 21,033,180 | |
| | | | | | | | | | | | | | | | |
| | | | |
| Tax Revenue: 2.72% | | | | | | | | | | | | | | | | |
| | | | |
Chicago IL Refunding Bond | | | 5.00 | | | | 1-1-2019 | | | | 625,000 | | | | 625,000 | |
| | | | |
Illinois | | | 5.00 | | | | 6-15-2019 | | | | 2,385,000 | | | | 2,413,954 | |
| | | | |
Illinois Series A | | | 5.00 | | | | 6-1-2021 | | | | 1,455,000 | | | | 1,514,233 | |
| | | | |
Illinois Tender Option Bond Trust Receipts/Floater Certificates Series 2018-XM0683 (Bank of America NA LIQ) 144Aø | | | 1.88 | | | | 1-1-2048 | | | | 2,000,000 | | | | 2,000,000 | |
| | | | |
Illinois Tender Option Bond Trust Receipts/Floater Certificates Series 2017-XG0108 (Barclays Bank plc LOC, Barclays Bank plc LIQ) 144Aø | | | 1.89 | | | | 4-1-2046 | | | | 18,725,000 | | | | 18,725,000 | |
| | | | |
Illinois Tender Option Bond Trust Receipts/Floater Certificates Series 2018-XM0713 (Morgan Stanley Bank LIQ) 144Aø | | | 1.83 | | | | 1-1-2043 | | | | 17,000,000 | | | | 17,000,000 | |
| | | | |
Illinois Tender Option Bond Trust Receipts/Floater Certificates Series 2018-XF0603 (Royal Bank of Canada LIQ) 144Aø | | | 1.86 | | | | 1-1-2026 | | | | 2,265,000 | | | | 2,265,000 | |
| | | | |
Metropolitan Pier & Exposition Authority McCormick Place Project Series B | | | 5.00 | | | | 12-15-2022 | | | | 5,925,000 | | | | 6,279,315 | |
| | | | |
Regional Transportation Authority IL Series B-RMKT 1 | | | 1.92 | | | | 6-1-2025 | | | | 28,380,000 | | | | 28,380,000 | |
| |
| | | | 79,202,502 | |
| | | | | | | | | | | | | | | | |
| | | | |
| Water & Sewer Revenue: 0.07% | | | | | | | | | | | | | | | | |
| | | | |
Chicago IL Refunding Bond | | | 5.00 | | | | 11-1-2019 | | | | 1,955,000 | | | | 2,000,747 | |
| | | | | | | | | | | | | | | | |
| |
| | | | 222,209,171 | |
| | | | | | | | | | | | | | | | |
| | | | |
Indiana: 1.74% | | | | | | | | | | | | | | | | |
| | | | |
| Education Revenue: 0.03% | | | | | | | | | | | | | | | | |
| | | | |
Trustees of Purdue University Series AA | | | 5.00 | | | | 7-1-2027 | | | | 895,000 | | | | 984,554 | |
| | | | | | | | | | | | | | | | |
| | | | |
| GO Revenue: 0.15% | | | | | | | | | | | | | | | | |
| | | | |
Hammond IN Local Public Improvement Bond Bank Series A %% | | | 3.00 | | | | 6-30-2019 | | | | 4,460,000 | | | | 4,468,206 | |
| | | | | | | | | | | | | | | | |
| | | | |
| Health Revenue: 1.03% | | | | | | | | | | | | | | | | |
| | | | |
Indiana Finance Authority Parkview Health Project Prerefunded Bond | | | 5.50 | | | | 5-1-2024 | | | | 4,495,000 | | | | 4,548,041 | |
| | | | |
Indiana Finance Authority Parkview Health System Obligated Group Series A %% | | | 4.00 | | | | 5-1-2019 | | | | 1,910,000 | | | | 1,918,920 | |
| | | | |
Indiana HFFA Ascension Health Subordinate Bond Credit Group Series A-3 | | | 1.35 | | | | 11-1-2027 | | | | 655,000 | | | | 645,457 | |
| | | | |
Indiana HFFA Ascension Health Subordinate Bond Credit Group Series A-5 | | | 1.35 | | | | 11-1-2027 | | | | 6,590,000 | | | | 6,493,984 | |
| | | | |
Indiana HFFA Ascension Health Subordinate Bond Credit Group Series A-8 | | | 1.25 | | | | 11-1-2027 | | | | 945,000 | | | | 932,942 | |
| | | | |
Indiana HFFA Ascension Health Subordinate Bond Credit Group Series E-7 | | | 1.75 | | | | 11-15-2033 | | | | 11,870,000 | | | | 11,870,000 | |
| | | | |
Indiana HFFA Unrefunded-Ascension Health Subordinate Bond Credit Series A-9 | | | 1.38 | | | | 10-1-2027 | | | | 3,530,000 | | | | 3,490,711 | |
| |
| | | | 29,900,055 | |
| | | | | | | | | | | | | | | | |
| | | | |
| Housing Revenue: 0.16% | | | | | | | | | | | | | | | | |
| | | | |
Anderson IN EDA Cottages of Anderson Apartments Project | | | 1.70 | | | | 7-1-2019 | | | | 1,290,000 | | | | 1,290,000 | |
| | | | |
Indiana Housing Authority Cass Plaza Apartments Project | | | 1.85 | | | | 3-1-2020 | | | | 3,400,000 | | | | 3,394,424 | |
| |
| | | | 4,684,424 | |
| | | | | | | | | | | | | | | | |
The accompanying notes are an integral part of these financial statements.
| | | | |
| 14 | | Wells Fargo Ultra Short-Term Municipal Income Fund | | Portfolio of investments—December 31, 2018 (unaudited) |
| | | | | | | | | | | | | | | | |
| Security name | | Interest rate | | | Maturity date | | | Principal | | | Value | |
| | | | |
| Industrial Development Revenue: 0.11% | | | | | | | | | | | | | | | | |
| | | | |
Jasper County IN Poll Control (National Insured) | | | 5.85 | % | | | 4-1-2019 | | | $ | 3,000,000 | | | $ | 3,026,520 | |
| | | | | | | | | | | | | | | | |
| | | | |
| Resource Recovery Revenue: 0.14% | | | | | | | | | | | | | | | | |
| | | | |
Whiting IN BP Products North America Incorporated Project (SIFMA Municipal Swap +0.75%) ± | | | 2.46 | | | | 12-1-2044 | | | | 3,910,000 | | | | 3,914,809 | |
| | | | | | | | | | | | | | | | |
| | | | |
| Utilities Revenue: 0.12% | | | | | | | | | | | | | | | | |
| | | | |
Tender Option Bond Trust Receipts/Floater Certificates Series 2015-XF0115 (JPMorgan Chase & Company LIQ) 144Aø | | | 1.98 | | | | 10-15-2019 | | | | 3,500,000 | | | | 3,500,000 | |
| | | | | | | | | | | | | | | | |
| |
| | | | 50,478,568 | |
| | | | | | | | | | | | | | | | |
| | | | |
Iowa: 1.60% | | | | | | | | | | | | | | | | |
| | | | |
| Health Revenue: 0.70% | | | | | | | | | | | | | | | | |
| | | | |
Iowa Finance Authority UnityPoint Health Project Series B-1 (Union Bank NA LOC) ø | | | 1.70 | | | | 2-15-2039 | | | | 16,150,000 | | | | 16,150,000 | |
| | | | |
Iowa Finance Authority Health Care Genesis Health System Obligated Group | | | 5.00 | | | | 7-1-2019 | | | | 4,075,000 | | | | 4,133,517 | |
| |
| | | | 20,283,517 | |
| | | | | | | | | | | | | | | | |
| | | | |
| Industrial Development Revenue: 0.90% | | | | | | | | | | | | | | | | |
| | | | |
Iowa Finance Authority Midwestern Disaster Area Project (Korea Development Bank LOC) ø | | | 2.07 | | | | 4-1-2022 | | | | 26,300,000 | | | | 26,300,000 | |
| | | | | | | | | | | | | | | | |
| |
| | | | 46,583,517 | |
| | | | | | | | | | | | | | | | |
| | | | |
Kansas: 0.42% | | | | | | | | | | | | | | | | |
| | | | |
| Health Revenue: 0.05% | | | | | | | | | | | | | | | | |
| | | | |
Wichita KS HCFR Series I | | | 3.75 | | | | 5-15-2023 | | | | 1,500,000 | | | | 1,500,240 | |
| | | | | | | | | | | | | | | | |
| | | | |
| Tax Revenue: 0.16% | | | | | | | | | | | | | | | | |
| | | | |
Kansas Department of Transportation Highway Libor Index Series B-5 (1 Month LIBOR +0.40%) ± | | | 1.97 | | | | 9-1-2019 | | | | 4,690,000 | | | | 4,695,300 | |
| | | | | | | | | | | | | | | | |
| | | | |
| Utilities Revenue: 0.21% | | | | | | | | | | | | | | | | |
| | | | |
Burlington KS Environmental Impact Series A ø | | | 2.00 | | | | 9-1-2035 | | | | 3,000,000 | | | | 3,000,000 | |
| | | | |
Burlington KS Environmental Impact Series B ø | | | 2.00 | | | | 9-1-2035 | | | | 3,000,000 | | | | 3,000,000 | |
| |
| | | | 6,000,000 | |
| | | | | | | | | | | | | | | | |
| |
| | | | 12,195,540 | |
| | | | | | | | | | | | | | | | |
| | | | |
Kentucky: 1.05% | | | | | | | | | | | | | | | | |
| | | | |
| Health Revenue: 0.25% | | | | | | | | | | | | | | | | |
| | | | |
Kentucky EDFA Catholic Health Initiative Series B1 (1 Month LIBOR +0.90%) ± | | | 2.50 | | | | 2-1-2046 | | | | 5,470,000 | | | | 5,471,586 | |
| | | | |
Kentucky EDFA Owensboro Health Incorporated Series A | | | 5.00 | | | | 6-1-2020 | | | | 890,000 | | | | 917,759 | |
| | | | |
Kentucky EDFA Owensboro Health Incorporated Series A | | | 5.00 | | | | 6-1-2021 | | | | 825,000 | | | | 866,819 | |
| |
| | | | 7,256,164 | |
| | | | | | | | | | | | | | | | |
| | | | |
| Housing Revenue: 0.12% | | | | | | | | | | | | | | | | |
| | | | |
Kentucky Housing Corporation Parkway Manor Project | | | 1.45 | | | | 3-1-2020 | | | | 3,655,000 | | | | 3,652,186 | |
| | | | | | | | | | | | | | | | |
The accompanying notes are an integral part of these financial statements.
| | | | | | |
| Portfolio of investments—December 31, 2018 (unaudited) | | Wells Fargo Ultra Short-Term Municipal Income Fund | | | 15 | |
| | | | | | | | | | | | | | | | |
| Security name | | Interest rate | | | Maturity date | | | Principal | | | Value | |
| | | | |
| Tax Revenue: 0.19% | | | | | | | | | | | | | | | | |
| | | | |
Kentucky Tender Option Bond Trust Receipts/Floater Certificates Series 2018-XG0161 (AGM Insured, Bank of America NA LIQ) 144Aø | | | 1.87 | % | | | 12-1-2041 | | | $ | 5,460,000 | | | $ | 5,460,000 | |
| | | | | | | | | | | | | | | | |
| | | | |
| Utilities Revenue: 0.49% | | | | | | | | | | | | | | | | |
| | | | |
Louisville & Jefferson Counties KY Environmental Facilities Series A | | | 1.25 | | | | 6-1-2033 | | | | 7,125,000 | | | | 7,097,854 | |
| | | | |
Louisville & Jefferson Counties KY Metro Government PCR Series A | | | 2.20 | | | | 2-1-2035 | | | | 1,000,000 | | | | 1,000,050 | |
| | | | |
Louisville & Jefferson Counties KY Metro Government PCR Series B | | | 2.55 | | | | 11-1-2027 | | | | 6,000,000 | | | | 6,024,300 | |
| |
| | | | 14,122,204 | |
| | | | | | | | | | | | | | | | |
| |
| | | | 30,490,554 | |
| | | | | | | | | | | | | | | | |
| | | | |
Louisiana: 0.78% | | | | | | | | | | | | | | | | |
| | | | |
| Airport Revenue: 0.19% | | | | | | | | | | | | | | | | |
| | | | |
Louisiana Offshore Terminal Authority Deepwater Loop LLC Project Series B-1A | | | 2.00 | | | | 10-1-2040 | | | | 2,935,000 | | | | 2,901,453 | |
| | | | |
New Orleans LA Aviation Board Series D-1 | | | 5.00 | | | | 1-1-2019 | | | | 470,000 | | | | 470,000 | |
| | | | |
New Orleans LA Aviation Board Series D-1 | | | 5.00 | | | | 1-1-2020 | | | | 780,000 | | | | 803,860 | |
| | | | |
New Orleans LA Aviation Board Series D-2 | | | 5.00 | | | | 1-1-2019 | | | | 780,000 | | | | 780,000 | |
| | | | |
New Orleans LA Aviation Board Series D-2 | | | 5.00 | | | | 1-1-2021 | | | | 590,000 | | | | 621,471 | |
| |
| | | | 5,576,784 | |
| | | | | | | | | | | | | | | | |
| | | | |
| Health Revenue: 0.35% | | | | | | | | | | | | | | | | |
| | | | |
Louisiana Tender Option Bond Trust Receipts/Floater Certificates Series 2018-BAML7002 (Bank of America NA LOC, Bank of America NA LIQ) 144Aø | | | 1.76 | | | | 9-1-2057 | | | | 10,000,000 | | | | 10,000,000 | |
| | | | | | | | | | | | | | | | |
| | | | |
| Housing Revenue: 0.10% | | | | | | | | | | | | | | | | |
| | | | |
Louisiana Housing Corporation Pine Trace Homes I Project | | | 2.40 | | | | 5-1-2021 | | | | 3,000,000 | | | | 3,011,670 | |
| | | | | | | | | | | | | | | | |
| | | | |
| Industrial Development Revenue: 0.02% | | | | | | | | | | | | | | | | |
| | | | |
St. James Parish LA Nucor Steel LLC Project Gulf Opportunity Zone Series A-1 ø | | | 2.00 | | | | 11-1-2040 | | | | 550,000 | | | | 550,000 | |
| | | | | | | | | | | | | | | | |
| | | | |
| Miscellaneous Revenue: 0.12% | | | | | | | | | | | | | | | | |
| | | | |
Louisiana PFFA Department of Public Safety Project | | | 4.00 | | | | 8-1-2019 | | | | 3,375,000 | | | | 3,415,095 | |
| | | | | | | | | | | | | | | | |
| |
| | | | 22,553,549 | |
| | | | | | | | | | | | | | | | |
| | | | |
Maine: 0.41% | | | | | | | | | | | | | | | | |
| | | | |
| Resource Recovery Revenue: 0.41% | | | | | | | | | | | | | | | | |
| | | | |
Old Town ME Georgia-Pacific Corporation Project 144Aø | | | 1.93 | | | | 12-1-2024 | | | | 11,930,000 | | | | 11,930,000 | |
| | | | | | | | | | | | | | | | |
| | | | |
Maryland: 2.13% | | | | | | | | | | | | | | | | |
| | | | |
| Housing Revenue: 1.97% | | | | | | | | | | | | | | | | |
| | | | |
Maryland CDA Belnor Senior Residences Series D | | | 1.83 | | | | 6-1-2019 | | | | 5,240,000 | | | | 5,218,935 | |
| | | | |
Maryland CDA Department of Housing & Community Multifamily Development Orchard Park Series F | | | 2.52 | | | | 8-1-2020 | | | | 6,000,000 | | | | 5,985,180 | |
| | | | |
Maryland CDA Department of Housing & Community Multifamily Development The Ellerslie Series C | | | 2.00 | | | | 2-1-2019 | | | | 4,690,000 | | | | 4,688,405 | |
| | | | |
Maryland CDA Department of Housing & Community Multifamily Development Zions Towers Series A (FHA Insured) | | | 2.44 | | | | 3-1-2020 | | | | 6,000,000 | | | | 5,984,880 | |
| | | | |
Maryland Community Development Administration Heritage Crossing II Series G | | | 2.93 | | | | 11-1-2020 | | | | 7,600,000 | | | | 7,632,148 | |
The accompanying notes are an integral part of these financial statements.
| | | | |
| 16 | | Wells Fargo Ultra Short-Term Municipal Income Fund | | Portfolio of investments—December 31, 2018 (unaudited) |
| | | | | | | | | | | | | | | | |
| Security name | | Interest rate | | | Maturity date | | | Principal | | | Value | |
| | | | |
| Housing Revenue(continued) | | | | | | | | | | | | | | | | |
| | | | |
Maryland Community Development Administration Village at Lakeview Series 2018C 144A | | | 2.76 | % | | | 5-1-2020 | | | $ | 17,700,000 | | | $ | 17,720,355 | |
| | | | |
Maryland Community Development Administration Willow Manor at Fairland Series I | | | 2.93 | | | | 11-1-2020 | | | | 10,000,000 | | | | 10,042,300 | |
| |
| | | | 57,272,203 | |
| | | | | | | | | | | | | | | | |
| | | | |
| Water & Sewer Revenue: 0.16% | | | | | | | | | | | | | | | | |
| | | | |
Baltimore MD Series A (National Insured) | | | 5.65 | | | | 7-1-2020 | | | | 4,560,000 | | | | 4,731,365 | |
| | | | | | | | | | | | | | | | |
| |
| | | | 62,003,568 | |
| | | | | | | | | | | | | | | | |
| | | | |
Massachusetts: 1.75% | | | | | | | | | | | | | | | | |
| | | | |
| Health Revenue: 0.20% | | | | | | | | | | | | | | | | |
| | | | |
Massachusetts HEFA Partners Healthcare Series G-2 (AGM Insured) (m) | | | 2.10 | | | | 7-1-2042 | | | | 5,910,000 | | | | 5,910,000 | |
| | | | | | | | | | | | | | | | |
| | | | |
| Housing Revenue: 0.56% | | | | | | | | | | | | | | | | |
| | | | |
Massachusetts HFA Conduit-Oaks Woods Project | | | 2.40 | | | | 6-1-2021 | | | | 4,660,000 | | | | 4,674,120 | |
| | | | |
Massachusetts HFA Highland Glen Project Series A | | | 1.22 | | | | 8-1-2019 | | | | 10,280,000 | | | | 10,273,729 | |
| | | | |
Massachusetts HFA Series 187 (FNMA Insured) | | | 1.50 | | | | 12-1-2047 | | | | 1,210,000 | | | | 1,200,078 | |
| |
| | | | 16,147,927 | |
| | | | | | | | | | | | | | | | |
| | | | |
| Miscellaneous Revenue: 0.99% | | | | | | | | | | | | | | | | |
| | | | |
Commonwealth of Massachusetts Series A (SIFMA Municipal Swap +0.47%) ± | | | 2.18 | | | | 2-1-2019 | | | | 3,185,000 | | | | 3,185,191 | |
| | | | |
Massachusetts Series B | | | 4.00 | | | | 5-23-2019 | | | | 25,360,000 | | | | 25,582,154 | |
| |
| | | | 28,767,345 | |
| | | | | | | | | | | | | | | | |
| |
| | | | 50,825,272 | |
| | | | | | | | | | | | | | | | |
| | | | |
Michigan: 1.93% | | | | | | | | | | | | | | | | |
| | | | |
| Education Revenue: 1.30% | | | | | | | | | | | | | | | | |
| | | | |
RBC Municipal Products Incorporated Trust Series E-127 (Royal Bank of Canada LOC, Royal Bank of Canada LIQ) 144Aø | | | 1.74 | | | | 7-1-2020 | | | | 17,000,000 | | | | 17,000,000 | |
| | | | |
University of Michigan SIFMA Series E (SIFMA Municipal Swap +0.27%) ± | | | 1.96 | | | | 4-1-2033 | | | | 20,940,000 | | | | 20,892,257 | |
| |
| | | | 37,892,257 | |
| | | | | | | | | | | | | | | | |
| | | | |
| GO Revenue: 0.07% | | | | | | | | | | | | | | | | |
| | | | |
Charlotte MI Public School District (Qualified School Board Loan Fund Insured) | | | 5.00 | | | | 5-1-2019 | | | | 1,185,000 | | | | 1,197,300 | |
| | | | |
Rockford MI Public School District (Qualified School Board Loan Fund Insured) | | | 5.00 | | | | 5-1-2019 | | | | 780,000 | | | | 788,096 | |
| |
| | | | 1,985,396 | |
| | | | | | | | | | | | | | | | |
| | | | |
| Health Revenue: 0.16% | | | | | | | | | | | | | | | | |
| | | | |
Michigan Hospital Finance Authority Ascension Health Group Project Series A-2 | | | 1.50 | | | | 11-1-2027 | | | | 1,210,000 | | | | 1,198,493 | |
| | | | |
Michigan Hospital Finance Authority Ascension Health Group Project Series E-1 | | | 1.10 | | | | 11-15-2046 | | | | 3,325,000 | | | | 3,304,119 | |
| |
| | | | 4,502,612 | |
| | | | | | | | | | | | | | | | |
The accompanying notes are an integral part of these financial statements.
| | | | | | |
| Portfolio of investments—December 31, 2018 (unaudited) | | Wells Fargo Ultra Short-Term Municipal Income Fund | | | 17 | |
| | | | | | | | | | | | | | | | |
| Security name | | Interest rate | | | Maturity date | | | Principal | | | Value | |
| | | | |
| Housing Revenue: 0.40% | | | | | | | | | | | | | | | | |
| | | | |
Michigan Housing Development Authority Newman Court Apartments Project (FHA Insured) | | | 1.46 | % | | | 11-1-2019 | | | $ | 7,740,000 | | | $ | 7,719,257 | |
| | | | |
Michigan Housing Development Authority Series A | | | 2.30 | | | | 10-1-2021 | | | | 4,000,000 | | | | 4,004,040 | |
| |
| | | | 11,723,297 | |
| | | | | | | | | | | | | | | | |
| |
| | | | 56,103,562 | |
| | | | | | | | | | | | | | | | |
| | | | |
Minnesota: 1.08% | | | | | | | | | | | | | | | | |
| | | | |
| Health Revenue: 0.26% | | | | | | | | | | | | | | | | |
| | | | |
Apple Valley MN Senior Living LLC Project Series B | | | 3.00 | | | | 1-1-2019 | | | | 505,000 | | | | 505,000 | |
| | | | |
Apple Valley MN Senior Living LLC Project Series B | | | 3.00 | | | | 1-1-2020 | | | | 525,000 | | | | 525,819 | |
| | | | |
Apple Valley MN Senior Living LLC Project Series B | | | 4.00 | | | | 1-1-2021 | | | | 545,000 | | | | 555,153 | |
| | | | |
Apple Valley MN Senior Living LLC Project Series B | | | 4.00 | | | | 1-1-2022 | | | | 565,000 | | | | 577,645 | |
| | | | |
Kanabec County MN Firstlight Health Kanabec Hospital | | | 2.75 | | | | 12-1-2019 | | | | 3,125,000 | | | | 3,124,688 | |
| | | | |
Minneapolis & St. Paul MN Housing & RDA Allina Health Systems Series B-2 (JPMorgan Chase & Company LOC) ø | | | 1.75 | | | | 11-15-2035 | | | | 500,000 | | | | 500,000 | |
| | | | |
Minnesota HCFR Maple Grove Hospital Corporation | | | 4.00 | | | | 5-1-2020 | | | | 390,000 | | | | 399,282 | |
| | | | |
Minnesota HCFR Maple Grove Hospital Corporation | | | 4.00 | | | | 5-1-2021 | | | | 390,000 | | | | 405,655 | |
| | | | |
Minnesota HCFR Maple Grove Hospital Corporation | | | 4.00 | | | | 5-1-2022 | | | | 390,000 | | | | 411,115 | |
| | | | |
Minnesota HCFR Maple Grove Hospital Corporation | | | 5.00 | | | | 5-1-2023 | | | | 390,000 | | | | 431,773 | |
| |
| | | | 7,436,130 | |
| | | | | | | | | | | | | | | | |
| | | | |
| Housing Revenue: 0.12% | | | | | | | | | | | | | | | | |
| | | | |
Minneapolis & St. Paul MN Housing & RDA Union Flats Apartments Project Series B | | | 2.75 | | | | 2-1-2022 | | | | 3,520,000 | | | | 3,469,066 | |
| | | | | | | | | | | | | | | | |
| | | | |
| Miscellaneous Revenue: 0.70% | | | | | | | | | | | | | | | | |
| | | | |
Minneapolis & St. Paul MN Housing & RDA Children’s Hospital Clinics Series A (AGM Insured, U.S. Bank NA SPA) | | | 1.65 | | | | 8-15-2037 | | | | 12,275,000 | | | | 12,275,000 | |
| | | | |
Minneapolis & St. Paul MN Housing & RDA Children’s Hospital Clinics Series A (AGM Insured, U.S. Bank NA SPA) ø | | | 1.65 | | | | 8-15-2037 | | | | 8,100,000 | | | | 8,100,000 | |
| |
| | | | 20,375,000 | |
| | | | | | | | | | | | | | | | |
| |
| | | | 31,280,196 | |
| | | | | | | | | | | | | | | | |
| | | | |
Mississippi: 0.38% | | | | | | | | | | | | | | | | |
| | | | |
| Housing Revenue: 0.38% | | | | | | | | | | | | | | | | |
| | | | |
Mississippi Home Corporation Jackson Housing Authority Project (HUD Insured) | | | 2.21 | | | | 2-1-2022 | | | | 11,000,000 | | | | 11,011,770 | |
| | | | | | | | | | | | | | | | |
| | | | |
Missouri: 0.65% | | | | | | | | | | | | | | | | |
| | | | |
| Airport Revenue: 0.29% | | | | | | | | | | | | | | | | |
| | | | |
St. Louis MO Series 004 (Dexia Credit Local LOC, AGM Insured, Dexia Credit Local LIQ) 144Aø | | | 1.94 | | | | 7-1-2026 | | | | 8,550,000 | | | | 8,550,000 | |
| | | | | | | | | | | | | | | | |
| | | | |
| Health Revenue: 0.02% | | | | | | | | | | | | | | | | |
| | | | |
Cape Girardeau County MO IDA South Eastern Health Series A | | | 5.00 | | | | 3-1-2019 | | | | 480,000 | | | | 481,963 | |
| | | | | | | | | | | | | | | | |
| | | | |
| Housing Revenue: 0.26% | | | | | | | | | | | | | | | | |
| | | | |
Kansas City MO IDA Gothan Apartments Project | | | 1.81 | | | | 2-1-2021 | | | | 7,500,000 | | | | 7,493,550 | |
| | | | | | | | | | | | | | | | |
The accompanying notes are an integral part of these financial statements.
| | | | |
| 18 | | Wells Fargo Ultra Short-Term Municipal Income Fund | | Portfolio of investments—December 31, 2018 (unaudited) |
| | | | | | | | | | | | | | | | |
| Security name | | Interest rate | | | Maturity date | | | Principal | | | Value | |
| | | | |
| Miscellaneous Revenue: 0.08% | | | | | | | | | | | | | | | | |
| | | | |
Bridgeton MO IDA Mestek Machinery Incorporated (Santander Bank NA LOC) ø | | | 2.35 | % | | | 7-1-2030 | | | $ | 2,425,000 | | | $ | 2,425,000 | |
| | | | | | | | | | | | | | | | |
| |
| | | | 18,950,513 | |
| | | | | | | | | | | | | | | | |
| | | | |
Montana: 0.31% | | | | | | | | | | | | | | | | |
| | | | |
| Miscellaneous Revenue: 0.31% | | | | | | | | | | | | | | | | |
| | | | |
Montana Board of Investments Intercap Revolving Program | | | 1.65 | | | | 3-1-2032 | | | | 8,905,000 | | | | 8,899,123 | |
| | | | | | | | | | | | | | | | |
| | | | |
Nebraska: 0.32% | | | | | | | | | | | | | | | | |
| | | | |
| Housing Revenue: 0.28% | | | | | | | | | | | | | | | | |
| | | | |
Douglas Country NE Housing Authority Sorensen Senior Residences Project Series A | | | 2.05 | | | | 3-1-2020 | | | | 4,000,000 | | | | 3,995,840 | |
| | | | |
Nebraska Investment Finance Authority Series D (GNMA/FNMA/FHLMC Insured) | | | 3.30 | | | | 9-1-2020 | | | | 1,345,000 | | | | 1,367,435 | |
| | | | |
Nebraska Investment Finance Authority Series D (GNMA/FNMA/FHLMC Insured) | | | 3.65 | | | | 3-1-2021 | | | | 1,265,000 | | | | 1,299,699 | |
| | | | |
Nebraska Investment Finance Authority Series D (GNMA/FNMA/FHLMC Insured) | | | 3.65 | | | | 9-1-2021 | | | | 1,390,000 | | | | 1,435,953 | |
| |
| | | | 8,098,927 | |
| | | | | | | | | | | | | | | | |
| | | | |
| Utilities Revenue: 0.04% | | | | | | | | | | | | | | | | |
| | | | |
Nebraska Central Plains Energy Project Refunding Bond (Royal Bank of Canada SPA) | | | 5.00 | | | | 8-1-2039 | | | | 1,130,000 | | | | 1,157,742 | |
| | | | | | | | | | | | | | | | |
| |
| | | | 9,256,669 | |
| | | | | | | | | | | | | | | | |
| | | | |
Nevada: 0.34% | | | | | | | | | | | | | | | | |
| | | | |
| GO Revenue: 0.32% | | | | | | | | | | | | | | | | |
| | | | |
Clark County Refunding Bond Series C | | | 5.00 | | | | 6-15-2020 | | | | 3,325,000 | | | | 3,471,699 | |
| | | | |
Clark County Refunding Bond Series D | | | 5.00 | | | | 6-15-2020 | | | | 810,000 | | | | 845,737 | |
| | | | |
Tender Option Bond Trust Receipts/Certificates Nevada Water District (JPMorgan Chase & Company LIQ) 144Aø | | | 1.89 | | | | 6-1-2020 | | | | 5,000,000 | | | | 5,000,000 | |
| |
| | | | 9,317,436 | |
| | | | | | | | | | | | | | | | |
| | | | |
| Utilities Revenue: 0.02% | | | | | | | | | | | | | | | | |
| | | | |
Washoe County NV Sierra Pacific Power Company Project Series A | | | 1.50 | | | | 8-1-2031 | | | | 665,000 | | | | 662,739 | |
| | | | | | | | | | | | | | | | |
| |
| | | | 9,980,175 | |
| | | | | | | | | | | | | | | | |
| | | | |
New Jersey: 4.81% | | | | | | | | | | | | | | | | |
| | | | |
| Education Revenue: 0.07% | | | | | | | | | | | | | | | | |
| | | | |
New Jersey Higher Education Assistance Authority Series B | | | 5.00 | | | | 12-1-2021 | | | | 2,000,000 | | | | 2,137,180 | |
| | | | | | | | | | | | | | | | |
| | | | |
| GO Revenue: 0.81% | | | | | | | | | | | | | | | | |
| | | | |
Lyndhurst Township NJ BAN | | | 2.75 | | | | 9-12-2019 | | | | 9,000,000 | | | | 9,048,690 | |
| | | | |
New Providence NJ BAN | | | 3.00 | | | | 10-30-2019 | | | | 5,400,000 | | | | 5,441,796 | |
| | | | |
Sea Isle City NJ | | | 3.50 | | | | 9-12-2019 | | | | 9,015,000 | | | | 9,111,370 | |
| |
| | | | 23,601,856 | |
| | | | | | | | | | | | | | | | |
| | | | |
| Health Revenue: 0.77% | | | | | | | | | | | | | | | | |
| | | | |
New Jersey HFFA St. Joseph’s Healthcare System Group | | | 4.00 | | | | 7-1-2019 | | | | 935,000 | | | | 941,891 | |
| | | | |
New Jersey HFFA St. Joseph’s Healthcare System Group | | | 4.00 | | | | 7-1-2020 | | | | 1,540,000 | | | | 1,572,309 | |
| | | | |
New Jersey HFFA St. Joseph’s Healthcare System Group | | | 5.00 | | | | 7-1-2021 | | | | 780,000 | | | | 824,733 | |
| | | | |
Tender Option Bond Trust Receipts/Floater Certificates Series 2016-XG0047 (AGC Insured, Deutsche Bank LIQ) 144Aø | | | 1.81 | | | | 7-1-2038 | | | | 18,906,373 | | | | 18,906,373 | |
| |
| | | | 22,245,306 | |
| | | | | | | | | | | | | | | | |
The accompanying notes are an integral part of these financial statements.
| | | | | | |
| Portfolio of investments—December 31, 2018 (unaudited) | | Wells Fargo Ultra Short-Term Municipal Income Fund | | | 19 | |
| | | | | | | | | | | | | | | | |
| Security name | | Interest rate | | | Maturity date | | | Principal | | | Value | |
| | | | |
| Housing Revenue: 0.77% | | | | | | | | | | | | | | | | |
| | | | |
New Jersey Housing & Mortgage Finance Agency Camden Townhouses Project Series F | | | 1.35 | % | | | 2-1-2020 | | | $ | 2,265,000 | | | $ | 2,263,935 | |
| | | | |
New Jersey Housing & Mortgage Finance Agency Series A | | | 1.50 | | | | 11-1-2019 | | | | 470,000 | | | | 468,228 | |
| | | | |
New Jersey Housing & Mortgage Finance Agency Series A | | | 1.75 | | | | 11-1-2020 | | | | 6,455,000 | | | | 6,426,146 | |
| | | | |
New Jersey Housing & Mortgage Finance Agency Series E | | | 2.05 | | | | 5-1-2019 | | | | 370,000 | | | | 369,907 | |
| | | | |
New Jersey Housing & Mortgage Finance Agency Series E | | | 2.15 | | | | 11-1-2019 | | | | 520,000 | | | | 519,740 | |
| | | | |
New Jersey Housing & Mortgage Finance Agency Series E | | | 2.20 | | | | 5-1-2020 | | | | 1,200,000 | | | | 1,199,364 | |
| | | | |
New Jersey Housing & Mortgage Finance Agency Series E | | | 2.30 | | | | 11-1-2020 | | | | 1,040,000 | | | | 1,039,615 | |
| | | | |
New Jersey Housing & Mortgage Finance Agency Villa Victoria Apartments Project Series F | | | 2.43 | | | | 11-1-2021 | | | | 10,000,000 | | | | 10,040,800 | |
| |
| | | | 22,327,735 | |
| | | | | | | | | | | | | | | | |
| | | | |
| Miscellaneous Revenue: 1.56% | | | | | | | | | | | | | | | | |
| | | | |
New Jersey Building Authority Unrefunded Bond Series A | | | 5.00 | | | | 6-15-2019 | | | | 515,000 | | | | 521,391 | |
| | | | |
New Jersey EDA School Facilities Construction Notes Series BBB | | | 5.00 | | | | 6-15-2021 | | | | 3,910,000 | | | | 4,132,244 | |
| | | | |
New Jersey EDA School Facilities Construction Notes Series DDD | | | 5.00 | | | | 6-15-2022 | | | | 780,000 | | | | 838,172 | |
| | | | |
New Jersey EDA School Facilities Construction Notes Series PP | | | 5.00 | | | | 6-15-2019 | | | | 9,940,000 | | | | 10,063,355 | |
| | | | |
New Jersey EDA School Facilities Construction Notes Series XX | | | 5.00 | | | | 6-15-2019 | | | | 11,730,000 | | | | 11,875,569 | |
| | | | |
New Jersey EDA Transportation Project Series B | | | 5.00 | | | | 11-1-2019 | | | | 3,910,000 | | | | 3,996,607 | |
| | | | |
New Jersey EDA Transportation Project Series B | | | 5.00 | | | | 11-1-2020 | | | | 7,820,000 | | | | 8,185,507 | |
| | | | |
New Jersey EDA Unrefunded Bond Series NN | | | 5.00 | | | | 3-1-2020 | | | | 895,000 | | | | 922,190 | |
| | | | |
New Jersey TTFA Series A | | | 5.00 | | | | 12-15-2019 | | | | 3,445,000 | | | | 3,530,884 | |
| | | | |
New Jersey TTFA Series AA | | | 5.00 | | | | 6-15-2020 | | | | 1,250,000 | | | | 1,296,937 | |
| |
| | | | 45,362,856 | |
| | | | | | | | | | | | | | | | |
| | | | |
| Transportation Revenue: 0.83% | | | | | | | | | | | | | | | | |
| | | | |
New Jersey TTFA Series A-1 | | | 5.00 | | | | 6-15-2019 | | | | 3,720,000 | | | | 3,767,653 | |
| | | | |
New Jersey Turnpike Authority Series C-5 (1 Month LIBOR +0.46%) ± | | | 2.10 | | | | 1-1-2028 | | | | 20,330,000 | | | | 20,330,000 | |
| |
| | | | 24,097,653 | |
| | | | | | | | | | | | | | | | |
| |
| | | | 139,772,586 | |
| | | | | | | | | | | | | | | | |
| | | | |
New Mexico: 0.73% | | | | | | | | | | | | | | | | |
| | | | |
| Housing Revenue: 0.04% | | | | | | | | | | | | | | | | |
| | | | |
New Mexico Mortgage Finance Authority South Shiprock Homes Project | | | 1.35 | | | | 6-1-2020 | | | | 1,095,000 | | | | 1,091,551 | |
| | | | | | | | | | | | | | | | |
| | | | |
| Utilities Revenue: 0.69% | | | | | | | | | | | | | | | | |
| | | | |
Farmington NM Public Service Company of New Mexico San Juan Project Series A | | | 5.20 | | | | 6-1-2040 | | | | 780,000 | | | | 805,155 | |
| | | | |
New Mexico Municipal Energy Acquisition Authority Gas Supply Subordinate Bond Series B (1 Month LIBOR +0.75%) (Royal Bank of Canada SPA) ± | | | 2.32 | | | | 11-1-2039 | | | | 19,430,000 | | | | 19,433,303 | |
| |
| | | | 20,238,458 | |
| | | | | | | | | | | | | | | | |
| |
| | | | 21,330,009 | |
| | | | | | | | | | | | | | | | |
| | | | |
New York: 11.66% | | | | | | | | | | | | | | | | |
| | | | |
| GO Revenue: 5.63% | | | | | | | | | | | | | | | | |
| | | | |
Binghamton NY Various Purpose BAN Series B | | | 3.00 | | | | 4-19-2019 | | | | 12,825,156 | | | | 12,864,144 | |
| | | | |
Hempstead NY Union Free School District | | | 2.75 | | | | 6-27-2019 | | | | 4,150,000 | | | | 4,158,964 | |
| | | | |
New York NY Adjusted Fiscal 2008 Subordinate Bond Series A-3 (AGM Insured) (m) | | | 2.04 | | | | 8-1-2026 | | | | 2,925,000 | | | | 2,925,000 | |
| | | | |
New York NY Adjusted Fiscal 2008 Subordinate Bond Series A-4 (AGM Insured) (m) | | | 2.00 | | | | 8-1-2026 | | | | 15,075,000 | | | | 15,075,000 | |
The accompanying notes are an integral part of these financial statements.
| | | | |
| 20 | | Wells Fargo Ultra Short-Term Municipal Income Fund | | Portfolio of investments—December 31, 2018 (unaudited) |
| | | | | | | | | | | | | | | | |
| Security name | | Interest rate | | | Maturity date | | | Principal | | | Value | |
| | | | |
| GO Revenue(continued) | | | | | | | | | | | | | | | | |
| | | | |
New York NY Adjusted Fiscal 2008 Subordinate Bond Series C-4 (AGC Insured) (m) | | | 2.04 | % | | | 10-1-2027 | | | $ | 50,650,000 | | | $ | 50,650,000 | |
| | | | |
New York NY Fiscal Series 2013F-3 (Bank of America NA SPA) ø | | | 1.68 | | | | 3-1-2042 | | | | 3,000,000 | | | | 3,000,000 | |
| | | | |
New York NY Series I (State Street Bank & Trust Company SPA) ø | | | 1.73 | | | | 4-1-2036 | | | | 4,100,000 | | | | 4,100,000 | |
| | | | |
New York NY Series J Subordinate Bond Series J-2 (AGM Insured) (m) | | | 1.95 | | | | 6-1-2036 | | | | 12,875,000 | | | | 12,875,000 | |
| | | | |
New York NY Series J Subordinate Bond Series J-3 (AGM Insured) (m) | | | 2.04 | | | | 6-1-2036 | | | | 26,500,000 | | | | 26,500,000 | |
| | | | |
New York NY Subordinate Bond Series C-4 (AGM Insured) (m) | | | 2.04 | | | | 1-1-2032 | | | | 800,000 | | | | 800,000 | |
| | | | |
Oyster Bay NY | | | 2.00 | | | | 2-15-2019 | | | | 4,260,000 | | | | 4,257,146 | |
| | | | |
Rome NY Series C | | | 2.75 | | | | 5-31-2019 | | | | 5,269,600 | | | | 5,284,197 | |
| | | | |
Suffolk County NY Public Improvement Serial Bonds Series B (Build America Mutual Assurance Company Insured) | | | 2.00 | | | | 10-15-2019 | | | | 685,000 | | | | 685,897 | |
| | | | |
Suffolk County NY RAN Series 2018 | | | 2.00 | | | | 3-21-2019 | | | | 7,250,000 | | | | 7,249,855 | |
| | | | |
Suffolk County NY TRAN | | | 5.00 | | | | 7-24-2019 | | | | 8,500,000 | | | | 8,625,630 | |
| | | | |
Yonkers NY Series A | | | 3.50 | | | | 5-15-2019 | | | | 4,500,000 | | | | 4,519,935 | |
| |
| | | | 163,570,768 | |
| | | | | | | | | | | | | | | | |
| | | | |
| Health Revenue: 0.07% | | | | | | | | | | | | | | | | |
| | | | |
New York Dormitory Authority Orange Regional Medical Center 144A | | | 4.00 | | | | 12-1-2019 | | | | 1,200,000 | | | | 1,216,740 | |
| | | | |
New York Dormitory Authority Orange Regional Medical Center 144A | | | 4.00 | | | | 12-1-2020 | | | | 800,000 | | | | 822,544 | |
| |
| | | | 2,039,284 | |
| | | | | | | | | | | | | | | | |
| | | | |
| Housing Revenue: 1.37% | | | | | | | | | | | | | | | | |
| | | | |
East Rochester NY Housing Authority Home Good Shepherd Project Series A (Royal Bank of Scotland LOC) ø | | | 1.86 | | | | 12-1-2036 | | | | 2,480,000 | | | | 2,480,000 | |
| | | | |
Ilion NY Housing Authority John Guy Prindle Apartments Project | | | 2.00 | | | | 7-1-2020 | | | | 2,545,000 | | | | 2,545,000 | |
| | | | |
New York City NY Housing Development Corporation Bond Series A | | | 1.15 | | | | 11-1-2019 | | | | 5,000,000 | | | | 4,950,250 | |
| | | | |
New York Mortgage Agency Homeowner Revenue Series 183 | | | 2.30 | | | | 10-1-2019 | | | | 2,535,000 | | | | 2,537,560 | |
| | | | |
New York Mortgage Agency Homeowner Revenue Series 183 | | | 3.50 | | | | 4-1-2022 | | | | 1,200,000 | | | | 1,236,000 | |
| | | | |
New York NY Housing Development Corporation Series G | | | 1.50 | | | | 11-1-2048 | | | | 3,655,000 | | | | 3,654,306 | |
| | | | |
New York NY Housing Development Corporation Series G-2 | | | 2.00 | | | | 11-1-2057 | | | | 7,970,000 | | | | 7,926,324 | |
| | | | |
New York NY Housing Development Corporation Series I-2-B | | | 1.85 | | | | 5-1-2021 | | | | 12,550,000 | | | | 12,537,450 | |
| | | | |
New York ST Mortgage Agency Homeowner AMT Series 170 | | | 2.70 | | | | 4-1-2019 | | | | 1,820,000 | | | | 1,820,000 | |
| |
| | | | 39,686,890 | |
| | | | | | | | | | | | | | | | |
| | | | |
| Industrial Development Revenue: 0.78% | | | | | | | | | | | | | | | | |
| | | | |
New York Energy R&D Authority PCR Keyspan Generation Series A (Ambac Insured) (m) | | | 2.64 | | | | 10-1-2028 | | | | 900,000 | | | | 900,000 | |
| | | | |
New York Transportation Development Corporation Series 2018 | | | 5.00 | | | | 1-1-2022 | | | | 2,000,000 | | | | 2,140,400 | |
| | | | |
New York Transportation Development Corporation Series 2018 | | | 5.00 | | | | 1-1-2023 | | | | 18,000,000 | | | | 19,550,520 | |
| |
| | | | 22,590,920 | |
| | | | | | | | | | | | | | | | |
| | | | |
| Miscellaneous Revenue: 0.69% | | | | | | | | | | | | | | | | |
| | | | |
BB&T Municipal Trust Class A (SIFMA Municipal Swap +0.40%) (Rabobank LOC) 144A± | | | 2.11 | | | | 5-31-2019 | | | | 3,649,354 | | | | 3,649,354 | |
| | | | |
BB&T Municipal Trust Class B (SIFMA Municipal Swap +0.55%) (Rabobank LOC) 144A± | | | 2.26 | | | | 11-30-2019 | | | | 4,000,000 | | | | 4,000,000 | |
| | | | |
Greater Southern Tier NY Board of Cooperative Educational Services District | | | 3.25 | | | | 6-28-2019 | | | | 12,500,000 | | | | 12,559,125 | |
| |
| | | | 20,208,479 | |
| | | | | | | | | | | | | | | | |
| | | | |
| Tax Revenue: 0.45% | | | | | | | | | | | | | | | | |
| | | | |
New York NY Transitional Finance Authority (SIFMA Municipal Swap +0.80%) ± | | | 2.51 | | | | 11-1-2022 | | | | 13,100,000 | | | | 13,212,791 | |
| | | | | | | | | | | | | | | | |
The accompanying notes are an integral part of these financial statements.
| | | | | | |
| Portfolio of investments—December 31, 2018 (unaudited) | | Wells Fargo Ultra Short-Term Municipal Income Fund | | | 21 | |
| | | | | | | | | | | | | | | | |
| Security name | | Interest rate | | | Maturity date | | | Principal | | | Value | |
| | | | |
| Transportation Revenue: 2.09% | | | | | | | | | | | | | | | | |
| | | | |
New York Metropolitan Transportation Authority Series B (1 Month LIBOR +0.55%) ± | | | 2.12 | % | | | 11-1-2041 | | | $ | 6,255,000 | | | $ | 6,221,849 | |
| | | | |
New York Metropolitan Transportation Authority Subordinate Bond Series A-3 (SIFMA Municipal Swap +0.50%) ± | | | 2.21 | | | | 11-15-2042 | | | | 7,820,000 | | | | 7,818,592 | |
| | | | |
New York Metropolitan Transportation Authority Subordinate Bond Series D-2 (SIFMA Municipal Swap +0.45%) ± | | | 2.16 | | | | 11-15-2044 | | | | 18,460,000 | | | | 18,320,627 | |
| | | | |
New York Metropolitan Transportation Authority Subordinate Bond Series G-1F (1 Month LIBOR +0.65%) ± | | | 2.22 | | | | 11-1-2026 | | | | 28,270,000 | | | | 28,270,000 | |
| |
| | | | 60,631,068 | |
| | | | | | | | | | | | | | | | |
| | | | |
| Water & Sewer Revenue: 0.58% | | | | | | | | | | | | | | | | |
| | | | |
RBC Municipal Products Incorporated Trust Series 2018 (Royal Bank of Canada LOC, Royal Bank of Canada LIQ) 144A | | | 1.74 | | | | 11-15-2022 | | | | 17,000,000 | | | | 17,000,000 | |
| | | | | | | | | | | | | | | | |
| |
| | | | 338,940,200 | |
| | | | | | | | | | | | | | | | |
| | | | |
North Carolina: 3.35% | | | | | | | | | | | | | | | | |
| | | | |
| Health Revenue: 1.21% | | | | | | | | | | | | | | | | |
| | | | |
Charlotte Mecklenburg NC Hospital Authority Carolinas Healthcare Systems Series H (JPMorgan Chase & Company SPA) ø | | | 1.70 | | | | 1-15-2048 | | | | 18,800,000 | | | | 18,800,000 | |
| | | | |
North Carolina Medical Care Commission FirstHealth of the Carolinas Series A (Branch Banking & Trust SPA) ø | | | 1.73 | | | | 10-1-2028 | | | | 16,240,000 | | | | 16,240,000 | |
| |
| | | | 35,040,000 | |
| | | | | | | | | | | | | | | | |
| | | | |
| Housing Revenue: 1.19% | | | | | | | | | | | | | | | | |
| | | | |
Charlotte NC Housing Authority West Tyvola Seniors LLC | | | 2.23 | | | | 12-1-2021 | | | | 6,000,000 | | | | 6,001,080 | |
| | | | |
Durham NC Housing Authority Morreene Road Apartments Project | | | 1.85 | | | | 1-1-2021 | | | | 3,125,000 | | | | 3,118,875 | |
| | | | |
Gastonia NC Housing Authority Cameron Courts & Weldon Heights Apartments | | | 1.78 | | | | 11-1-2020 | | | | 8,215,000 | | | | 8,194,134 | |
| | | | |
Gastonia NC Housing Authority Linwood Terrace Apartments | | | 1.78 | | | | 11-1-2020 | | | | 3,910,000 | | | | 3,900,069 | |
| | | | |
Gastonia NC Housing Authority Mountain View Apartments | | | 1.78 | | | | 11-1-2020 | | | | 3,715,000 | | | | 3,705,564 | |
| | | | |
Raleigh NC Housing Authority Sir Walter Apartments Project Series A | | | 2.15 | | | | 7-1-2021 | | | | 9,600,000 | | | | 9,600,000 | |
| |
| | | | 34,519,722 | |
| | | | | | | | | | | | | | | | |
| | | | |
| Resource Recovery Revenue: 0.31% | | | | | | | | | | | | | | | | |
| | | | |
North Carolina Capital Finance Republic Services Incorporated Project Series 2013 | | | 1.40 | | | | 6-1-2038 | | | | 9,000,000 | | | | 8,998,200 | |
| | | | | | | | | | | | | | | | |
| | | | |
| Tax Revenue: 0.64% | | | | | | | | | | | | | | | | |
| | | | |
Montgomery County NC BAN | | | 3.00 | | | | 9-1-2020 | | | | 18,500,000 | | | | 18,706,645 | |
| | | | | | | | | | | | | | | | |
| |
| | | | 97,264,567 | |
| | | | | | | | | | | | | | | | |
| | | | |
North Dakota: 0.10% | | | | | | | | | | | | | | | | |
| | | | |
| Housing Revenue: 0.10% | | | | | | | | | | | | | | | | |
| | | | |
North Dakota HFA Community Homes (HUD Insured) | | | 2.13 | | | | 8-1-2020 | | | | 3,000,000 | | | | 3,000,450 | |
| | | | | | | | | | | | | | | | |
| | | | |
Ohio: 1.94% | | | | | | | | | | | | | | | | |
| | | | |
| GO Revenue: 0.68% | | | | | | | | | | | | | | | | |
| | | | |
East Clinton OH Local School District BAN | | | 2.80 | | | | 12-3-2019 | | | | 2,000,000 | | | | 2,009,940 | |
| | | | |
Fairborn OH | | | 2.75 | | | | 9-6-2019 | | | | 2,795,000 | | | | 2,809,562 | |
| | | | |
Firelands OH Local School District BAN | | | 3.00 | | | | 8-22-2019 | | | | 2,460,000 | | | | 2,474,096 | |
The accompanying notes are an integral part of these financial statements.
| | | | |
| 22 | | Wells Fargo Ultra Short-Term Municipal Income Fund | | Portfolio of investments—December 31, 2018 (unaudited) |
| | | | | | | | | | | | | | | | |
| Security name | | Interest rate | | | Maturity date | | | Principal | | | Value | |
| | | | |
| GO Revenue(continued) | | | | | | | | | | | | | | | | |
| | | | |
Mahoning County OH | | | 3.00 | % | | | 9-19-2019 | | | $ | 5,245,000 | | | $ | 5,286,750 | |
| | | | |
Newark OH BAN Church Street Area Improvement Series 2018 | | | 3.00 | | | | 4-17-2019 | | | | 1,125,000 | | | | 1,127,599 | |
| | | | |
Newark OH BAN | | | 3.50 | | | | 4-25-2019 | | | | 5,000,000 | | | | 5,020,200 | |
| | | | |
Newark OH BAN Street Sidewalk & Parking Lot Improvement | | | 3.00 | | | | 8-13-2019 | | | | 1,120,000 | | | | 1,125,006 | |
| |
| | | | 19,853,153 | |
| | | | | | | | | | | | | | | | |
| | | | |
| Health Revenue: 0.51% | | | | | | | | | | | | | | | | |
| | | | |
Allen County OH Mercy Health Hospital Series A | | | 5.00 | | | | 8-1-2021 | | | | 2,795,000 | | | | 2,981,343 | |
| | | | |
Ohio Tender Option Bond Trust Receipts/Floater Certificates Series 2018-BAML5002 (Bank of America NA LOC, National Insured, Bank of America NA LIQ) 144Aø | | | 1.76 | | | | 4-1-2026 | | | | 11,925,000 | | | | 11,925,000 | |
| |
| | | | 14,906,343 | |
| | | | | | | | | | | | | | | | |
| | | | |
| Housing Revenue: 0.07% | | | | | | | | | | | | | | | | |
| | | | |
Franklin County OH Sawyer & Trevitt Project | | | 1.30 | | | | 6-1-2020 | | | | 2,125,000 | | | | 2,119,263 | |
| | | | | | | | | | | | | | | | |
| | | | |
| Miscellaneous Revenue: 0.09% | | | | | | | | | | | | | | | | |
| | | | |
Orange Village OH Recreational Trail Special Assessment | | | 3.00 | | | | 8-29-2019 | | | | 2,500,000 | | | | 2,514,600 | |
| | | | | | | | | | | | | | | | |
| | | | |
| Tax Revenue: 0.22% | | | | | | | | | | | | | | | | |
| | | | |
Lakewood OH Income Tax Revenue | | | 2.50 | | | | 3-28-2019 | | | | 6,500,000 | | | | 6,508,775 | |
| | | | | | | | | | | | | | | | |
| | | | |
| Utilities Revenue: 0.26% | | | | | | | | | | | | | | | | |
| | | | |
Lancaster OH Port Authority (1 Month LIBOR +0.72%) (Royal Bank of Canada SPA) ± | | | 2.29 | | | | 5-1-2038 | | | | 7,520,000 | | | | 7,520,752 | |
| | | | | | | | | | | | | | | | |
| | | | |
| Water & Sewer Revenue: 0.11% | | | | | | | | | | | | | | | | |
| | | | |
Ohio Water Development Authority Series B (SIFMA Municipal Swap +0.22%) ± | | | 1.93 | | | | 12-1-2020 | | | | 3,090,000 | | | | 3,074,581 | |
| | | | | | | | | | | | | | | | |
| |
| | | | 56,497,467 | |
| | | | | | | | | | | | | | | | |
| | | | |
Oklahoma: 0.31% | | | | | | | | | | | | | | | | |
| | | | |
| GO Revenue: 0.14% | | | | | | | | | | | | | | | | |
| | | | |
Oklahoma County OK Independent School District | | | 1.75 | | | | 7-1-2019 | | | | 870,000 | | | | 866,964 | |
| | | | |
Oklahoma County OK Independent School District | | | 1.75 | | | | 7-1-2020 | | | | 950,000 | | | | 938,334 | |
| | | | |
Oklahoma Independent School District #52 Series A | | | 2.50 | | | | 1-1-2020 | | | | 2,375,000 | | | | 2,388,039 | |
| |
| | | | 4,193,337 | |
| | | | | | | | | | | | | | | | |
| | | | |
| Miscellaneous Revenue: 0.13% | | | | | | | | | | | | | | | | |
| | | | |
Oklahoma Metro Technology Centers School District No. 22 | | | 1.90 | | | | 6-28-2019 | | | | 3,725,000 | | | | 3,721,201 | |
| | | | | | | | | | | | | | | | |
| | | | |
| Tax Revenue: 0.04% | | | | | | | | | | | | | | | | |
| | | | |
Cleveland County OK Detention Facilities Project | | | 3.00 | | | | 3-1-2019 | | | | 1,175,000 | | | | 1,177,174 | |
| | | | | | | | | | | | | | | | |
| |
| | | | 9,091,712 | |
| | | | | | | | | | | | | | | | |
| | | | |
Oregon: 0.69% | | | | | | | | | | | | | | | | |
| | | | |
| Industrial Development Revenue: 0.69% | | | | | | | | | | | | | | | | |
| | | | |
Oregon Business Development Commission Intel Corporation Project Series 232 | | | 2.40 | | | | 12-1-2040 | | | | 20,000,000 | | | | 20,086,800 | |
| | | | | | | | | | | | | | | | |
The accompanying notes are an integral part of these financial statements.
| | | | | | |
| Portfolio of investments—December 31, 2018 (unaudited) | | Wells Fargo Ultra Short-Term Municipal Income Fund | | | 23 | |
| | | | | | | | | | | | | | | | |
| Security name | | Interest rate | | | Maturity date | | | Principal | | | Value | |
| | | | |
Other: 0.08% | | | | | | | | | | | | | | | | |
| | | | |
| Miscellaneous Revenue: 0.08% | | | | | | | | | | | | | | | | |
| | | | |
Branch Banking & Trust Municipal Investment Trust Various States Class C (SIFMA Municipal Swap +1.05%) (Rabobank LOC) 144A± | | | 2.76 | % | | | 12-31-2019 | | | $ | 2,409,765 | | | $ | 2,409,813 | |
| | | | | | | | | | | | | | | | |
| | | | |
Pennsylvania: 5.31% | | | | | | | | | | | | | | | | |
| | | | |
| Education Revenue: 1.41% | | | | | | | | | | | | | | | | |
| | | | |
Chester County PA HEFA Immaculata University Project | | | 4.00 | | | | 11-1-2019 | | | | 510,000 | | | | 511,586 | |
| | | | |
Chester County PA HEFA Immaculata University Project | | | 5.00 | | | | 11-1-2020 | | | | 550,000 | | | | 562,105 | |
| | | | |
Chester County PA HEFA Immaculata University Project | | | 5.00 | | | | 11-1-2021 | | | | 580,000 | | | | 597,522 | |
| | | | |
Cumberland County PA Authority Association of Independent Colleges & Universities of Pennsylvania Financing Program Series T-1 ø | | | 2.00 | | | | 5-1-2044 | | | | 1,200,000 | | | | 1,187,580 | |
| | | | |
Lycoming County PA Authority Association of Independent Colleges & Universities of Pennsylvania Financing Program | | | 1.85 | | | | 11-1-2035 | | | | 1,565,000 | | | | 1,565,000 | |
| | | | |
Pennsylvania HEFA Association of Independent Colleges & Universities of Pennsylvania Financing Program Series T-3 ø | | | 2.25 | | | | 5-1-2033 | | | | 3,745,000 | | | | 3,756,684 | |
| | | | |
Pennsylvania HEFA Independent Colleges Series I4 | | | 2.72 | | | | 11-1-2031 | | | | 3,000,000 | | | | 3,000,660 | |
| | | | |
Pennsylvania HEFA Thomas Jefferson University Series B ø | | | 2.01 | | | | 9-1-2045 | | | | 9,440,000 | | | | 9,440,000 | |
| | | | |
Pennsylvania HEFA Wilkes University Project Series A | | | 4.00 | | | | 3-1-2020 | | | | 575,000 | | | | 583,539 | |
| | | | |
Pennsylvania HEFA Wilkes University Project Series A | | | 5.00 | | | | 3-1-2021 | | | | 390,000 | | | | 407,605 | |
| | | | |
Philadelphia PA IDA Thomas Jefferson University Series B ø | | | 2.01 | | | | 9-1-2050 | | | | 19,210,000 | | | | 19,210,000 | |
| |
| | | | 40,822,281 | |
| | | | | | | | | | | | | | | | |
| | | | |
| GO Revenue: 0.76% | | | | | | | | | | | | | | | | |
| | | | |
Allentown PA School District TRAN Series 2018 | | | 2.20 | | | | 1-2-2019 | | | | 3,250,000 | | | | 3,250,000 | |
| | | | |
Pennsylvania | | | 5.00 | | | | 1-15-2020 | | | | 12,845,000 | | | | 13,251,801 | |
| | | | |
Philadelphia PA School District Series D | | | 5.00 | | | | 9-1-2019 | | | | 980,000 | | | | 998,208 | |
| | | | |
Philadelphia PA School District Series F | | | 5.00 | | | | 9-1-2019 | | | | 780,000 | | | | 794,492 | |
| | | | |
Scranton PA 144A | | | 5.00 | | | | 9-1-2019 | | | | 1,640,000 | | | | 1,663,518 | |
| | | | |
Scranton PA School District Series A | | | 5.00 | | | | 6-1-2019 | | | | 390,000 | | | | 393,997 | |
| | | | |
Scranton PA School District Series A | | | 5.00 | | | | 6-1-2020 | | | | 500,000 | | | | 517,005 | |
| | | | |
Scranton PA School District Series B | | | 5.00 | | | | 6-1-2020 | | | | 420,000 | | | | 434,284 | |
| | | | |
Warwick PA School District | | | 4.00 | | | | 2-15-2019 | | | | 805,000 | | | | 807,093 | |
| |
| | | | 22,110,398 | |
| | | | | | | | | | | | | | | | |
| | | | |
| Health Revenue: 0.55% | | | | | | | | | | | | | | | | |
| | | | |
Montgomery County PA Higher Education & Health Authority Presbytery Homes Incorporated Project | | | 2.00 | | | | 12-1-2019 | | | | 575,000 | | | | 571,906 | |
| | | | |
Montgomery County PA Higher Education & Health Authority Presbytery Homes Incorporated Project | | | 2.00 | | | | 12-1-2020 | | | | 505,000 | | | | 497,526 | |
| | | | |
Montgomery County PA Higher Education & Health Authority Presbytery Homes Incorporated Project | | | 3.00 | | | | 12-1-2021 | | | | 560,000 | | | | 559,989 | |
| | | | |
Montgomery County PA Higher Education & Health Authority Series 2018A | | | 5.00 | | | | 9-1-2022 | | | | 1,250,000 | | | | 1,371,513 | |
| | | | |
Montgomery County PA Higher Education & Health Authority Series 2018D ø | | | 2.01 | | | | 9-1-2050 | | | | 9,000,000 | | | | 9,000,000 | |
| | | | |
Philadelphia PA Hospital & Higher Education Facilities Authority | | | 5.00 | | | | 7-1-2019 | | | | 780,000 | | | | 789,017 | |
| | | | |
Philadelphia PA Hospital & Higher Education Facilities Authority | | | 5.00 | | | | 7-1-2020 | | | | 780,000 | | | | 805,756 | |
| | | | |
Quakertown PA Health Facilities Authority Series A | | | 3.13 | | | | 7-1-2021 | | | | 2,545,000 | | | | 2,498,554 | |
| |
| | | | 16,094,261 | |
| | | | | | | | | | | | | | | | |
The accompanying notes are an integral part of these financial statements.
| | | | |
| 24 | | Wells Fargo Ultra Short-Term Municipal Income Fund | | Portfolio of investments—December 31, 2018 (unaudited) |
| | | | | | | | | | | | | | | | |
| Security name | | Interest rate | | | Maturity date | | | Principal | | | Value | |
| | | | |
| Housing Revenue: 0.55% | | | | | | | | | | | | | | | | |
| | | | |
Indiana County PA IDA Residential Revival Indiana Student Housing Project at University of Pennsylvania Series A | | | 1.55 | % | | | 4-1-2019 | | | $ | 7,820,000 | | | $ | 7,809,990 | |
| | | | |
Pennsylvania HFA Series 114A | | | 2.90 | | | | 10-1-2021 | | | | 3,000,000 | | | | 3,031,560 | |
| | | | |
Pennsylvania Housing Finance Agency Sharpsburg Towers Series B | | | 2.40 | | | | 12-1-2021 | | | | 2,500,000 | | | | 2,507,875 | |
| | | | |
Pittsburgh PA Housing Authority East Liberty Phase II Apartments | | | 1.40 | | | | 10-1-2021 | | | | 2,735,000 | | | | 2,719,110 | |
| |
| | | | 16,068,535 | |
| | | | | | | | | | | | | | | | |
| | | | |
| Industrial Development Revenue: 0.26% | | | | | | | | | | | | | | | | |
| | | | |
Beaver County PA IDA Pollution Control FirstEnergy Generation Project Series B | | | 4.25 | | | | 10-1-2047 | | | | 3,910,000 | | | | 3,792,700 | |
| | | | |
Montgomery County PA IDA Peco Energy Company Project Series A | | | 2.60 | | | | 3-1-2034 | | | | 3,910,000 | | | | 3,894,790 | |
| |
| | | | 7,687,490 | |
| | | | | | | | | | | | | | | | |
| | | | |
| Miscellaneous Revenue: 0.52% | | | | | | | | | | | | | | | | |
| | | | |
Bethlehem PA School District Revenue (1 Month LIBOR +0.48%) ± | | | 2.23 | | | | 7-1-2031 | | | | 9,995,000 | | | | 9,968,113 | |
| | | | |
Pennsylvania Public School Building Authority Series A (AGM Insured, Citibank NA LIQ) 144Aø | | | 1.86 | | | | 12-1-2023 | | | | 5,000,000 | | | | 5,000,000 | |
| |
| | | | 14,968,113 | |
| | | | | | | | | | | | | | | | |
| | | | |
| Resource Recovery Revenue: 0.69% | | | | | | | | | | | | | | | | |
| | | | |
Pennsylvania EDFA Solid Waste Disposal Republic Services Incorporated Project | | | 2.05 | | | | 6-1-2044 | | | | 20,000,000 | | | | 20,000,000 | |
| | | | | | | | | | | | | | | | |
| | | | |
| Water & Sewer Revenue: 0.57% | | | | | | | | | | | | | | | | |
| | | | |
North Pennsylvania Water Authority (1 Month LIBOR +0.41%) ± | | | 1.98 | | | | 11-1-2019 | | | | 780,000 | | | | 779,594 | |
| | | | |
North Pennsylvania Water Authority (1 Month LIBOR +0.50%) ± | | | 2.07 | | | | 11-1-2024 | | | | 3,910,000 | | | | 3,910,469 | |
| | | | |
Pittsburgh PA Water & Sewer Authority Series C (1 Month LIBOR +0.64%) (AGM Insured) ± | | | 2.33 | | | | 9-1-2040 | | | | 11,730,000 | | | | 11,733,050 | |
| |
| | | | 16,423,113 | |
| | | | | | | | | | | | | | | | |
| |
| | | | 154,174,191 | |
| | | | | | | | | | | | | | | | |
| | | | |
Rhode Island: 0.10% | | | | | | | | | | | | | | | | |
| | | | |
| Education Revenue: 0.02% | | | | | | | | | | | | | | | | |
| | | | |
Rhode Island Student Loan Authority AMT Program Senior Series A | | | 5.00 | | | | 12-1-2019 | | | | 590,000 | | | | 603,623 | |
| | | | | | | | | | | | | | | | |
| | | | |
| Housing Revenue: 0.08% | | | | | | | | | | | | | | | | |
| | | | |
Rhode Island Housing & Mortgage Finance Corporation Series 4-A | | | 1.85 | | | | 4-1-2056 | | | | 2,155,000 | | | | 2,154,634 | |
| | | | | | | | | | | | | | | | |
| |
| | | | 2,758,257 | |
| | | | | | | | | | | | | | | | |
| | | | |
South Carolina: 0.71% | | | | | | | | | | | | | | | | |
| | | | |
| Health Revenue: 0.45% | | | | | | | | | | | | | | | | |
| | | | |
South Carolina Jobs Economics Development Authority Residential Facilities Revenue Refunding Bond Episcopal Home Still Hopes Series A | | | 5.00 | | | | 4-1-2019 | | | | 225,000 | | | | 226,094 | |
| | | | |
South Carolina Jobs Economics Development Authority Residential Facilities Revenue Refunding Bond Episcopal Home Still Hopes Series A | | | 5.00 | | | | 4-1-2021 | | | | 425,000 | | | | 441,422 | |
| | | | |
South Carolina Jobs Economics Development Authority Residential Facilities Revenue Refunding Bond Episcopal Home Still Hopes Series A | | | 5.00 | | | | 4-1-2022 | | | | 455,000 | | | | 478,451 | |
| | | | |
South Carolina Jobs EDA Prisma Health Obligated Group Series C ø | | | 2.03 | | | | 5-1-2048 | | | | 12,000,000 | | | | 12,000,000 | |
| |
| | | | 13,145,967 | |
| | | | | | | | | | | | | | | | |
The accompanying notes are an integral part of these financial statements.
| | | | | | |
| Portfolio of investments—December 31, 2018 (unaudited) | | Wells Fargo Ultra Short-Term Municipal Income Fund | | | 25 | |
| | | | | | | | | | | | | | | | |
| Security name | | Interest rate | | | Maturity date | | | Principal | | | Value | |
| | | | |
| Housing Revenue: 0.26% | | | | | | | | | | | | | | | | |
| | | | |
South Carolina Housing Finance & Development Authority Lorick Place Apartments Project | | | 2.43 | % | | | 11-1-2021 | | | $ | 7,500,000 | | | $ | 7,530,600 | |
| | | | | | | | | | | | | | | | |
| |
| | | | 20,676,567 | |
| | | | | | | | | | | | | | | | |
| | | | |
Tennessee: 0.54% | | | | | | | | | | | | | | | | |
| | | | |
| Health Revenue: 0.05% | | | | | | | | | | | | | | | | |
| | | | |
Greeneville TN HEFA Board Series 2018A | | | 5.00 | | | | 7-1-2022 | | | | 1,280,000 | | | | 1,393,600 | |
| | | | | | | | | | | | | | | | |
| | | | |
| Housing Revenue: 0.49% | | | | | | | | | | | | | | | | |
| | | | |
Memphis TN Health Educational & Housing Facility Board Keystone Landing & Pendleton Place Apartments | | | 2.03 | | | | 8-1-2021 | | | | 8,000,000 | | | | 7,986,400 | |
| | | | |
Murfreesboro TN Housing Authority Westbrook Towers II LP Project | | | 2.13 | | | | 9-1-2021 | | | | 5,000,000 | | | | 4,988,200 | |
| | | | |
Nashville & Davidson County TN HEFA Twelfth & Wedgewood Apartments Project (HUD Insured) | | | 1.80 | | | | 12-1-2020 | | | | 1,175,000 | | | | 1,173,308 | |
| |
| | | | 14,147,908 | |
| | | | | | | | | | | | | | | | |
| |
| | | | 15,541,508 | |
| | | | | | | | | | | | | | | | |
| | | | |
Texas: 14.97% | | | | | | | | | | | | | | | | |
| | | | |
| Airport Revenue: 0.08% | | | | | | | | | | | | | | | | |
| | | | |
Houston TX Airport System Revenue Series A | | | 5.00 | | | | 7-1-2019 | | | | 1,000,000 | | | | 1,014,830 | |
| | | | |
Houston TX Airport System Revenue Series B | | | 5.00 | | | | 7-1-2019 | | | | 1,250,000 | | | | 1,269,162 | |
| |
| | | | 2,283,992 | |
| | | | | | | | | | | | | | | | |
| | | | |
| Education Revenue: 0.51% | | | | | | | | | | | | | | | | |
| | | | |
Alamo TX Community College District | | | 3.00 | | | | 11-1-2046 | | | | 3,200,000 | | | | 3,222,144 | |
| | | | |
University of Texas Board of Regents Series C | | | 5.00 | | | | 8-15-2020 | | | | 3,910,000 | | | | 4,110,348 | |
| | | | |
University of Texas Board of Regents Series C | | | 5.00 | | | | 8-15-2021 | | | | 6,980,000 | | | | 7,535,259 | |
| |
| | | | 14,867,751 | |
| | | | | | | | | | | | | | | | |
| | | | |
| GO Revenue: 7.87% | | | | | | | | | | | | | | | | |
| | | | |
Burleson TX Independent School District | | | 2.50 | | | | 2-1-2047 | | | | 7,885,000 | | | | 7,938,776 | |
| | | | |
Cypress-Fairbanks TX Independent School District Series A-1 | | | 2.13 | | | | 2-15-2027 | | | | 5,000,000 | | | | 4,985,400 | |
| | | | |
Cypress-Fairbanks TX Independent School District Series A-2 | | | 2.50 | | | | 2-15-2036 | | | | 13,295,000 | | | | 13,335,417 | |
| | | | |
Cypress-Fairbanks TX Independent School District Series A-3 | | | 3.00 | | | | 2-15-2043 | | | | 2,470,000 | | | | 2,506,433 | |
| | | | |
Cypress-Fairbanks TX Independent School District Series B-2 | | | 2.13 | | | | 2-15-2040 | | | | 7,015,000 | | | | 7,006,933 | |
| | | | |
Dallas TX Refunding Bond | | | 5.00 | | | | 2-15-2019 | | | | 4,800,000 | | | | 4,817,904 | |
| | | | |
Denton TX Independent School District Unlimited Tax School Building Bond Series 2013 | | | 2.00 | | | | 8-1-2043 | | | | 1,980,000 | | | | 1,977,842 | |
| | | | |
Fort Bend TX Independent School District Series A | | | 1.75 | | | | 8-1-2040 | | | | 12,000,000 | | | | 11,982,840 | |
| | | | |
Fort Bend TX Independent School District Series B | | | 1.35 | | | | 8-1-2040 | | | | 1,520,000 | | | | 1,514,346 | |
| | | | |
Galveston TX Dickinson Independent High School District | | | 1.35 | | | | 8-1-2037 | | | | 3,585,000 | | | | 3,571,664 | |
| | | | |
Goose Creek TX Independent School District Series B | | | 1.18 | | | | 2-15-2035 | | | | 7,820,000 | | | | 7,780,822 | |
| | | | |
Grapevine-Colleyville TX Independent School District Series B | | | 2.00 | | | | 8-1-2036 | | | | 6,645,000 | | | | 6,662,476 | |
| | | | |
Harlandale TX Independent School District | | | 3.00 | | | | 8-15-2045 | | | | 8,775,000 | | | | 8,877,404 | |
| | | | |
Harris County TX Cypress-Fairbanks Independent High School Series 2014B-2 | | | 1.40 | | | | 2-15-2040 | | | | 4,070,000 | | | | 4,026,695 | |
| | | | |
Harris County TX Cypress-Fairbanks Independent High School Series 2014B-3 | | | 1.40 | | | | 2-15-2044 | | | | 8,405,000 | | | | 8,315,571 | |
| | | | |
Houston TX Independent School District | | | 1.45 | | | | 6-1-2029 | | | | 16,305,000 | | | | 16,158,255 | |
| | | | |
Houston TX Independent School District Series 2014A-1B | | | 2.20 | | | | 6-1-2039 | | | | 9,000,000 | | | | 9,012,330 | |
The accompanying notes are an integral part of these financial statements.
| | | | |
| 26 | | Wells Fargo Ultra Short-Term Municipal Income Fund | | Portfolio of investments—December 31, 2018 (unaudited) |
| | | | | | | | | | | | | | | | |
| Security name | | Interest rate | | | Maturity date | | | Principal | | | Value | |
| | | | |
| GO Revenue(continued) | | | | | | | | | | | | | | | | |
| | | | |
Houston TX Independent School District Series A2 | | | 3.00 | % | | | 6-1-2039 | | | $ | 6,000,000 | | | $ | 6,022,860 | |
| | | | |
North East TX Independent School District Series B | | | 1.42 | | | | 8-1-2040 | | | | 1,090,000 | | | | 1,069,072 | |
| | | | |
Northside TX Independent School Building Project District Series A | | | 2.00 | | | | 6-1-2039 | | | | 20,615,000 | | | | 20,620,566 | |
| | | | |
Northside TX Independent School District Building Project | | | 2.00 | | | | 8-1-2044 | | | | 2,820,000 | | | | 2,819,972 | |
| | | | |
Northside TX Independent School District Building Project | | | 2.00 | | | | 6-1-2046 | | | | 2,135,000 | | | | 2,123,514 | |
| | | | |
Northside TX Independent School District Building Project | | | 2.13 | | | | 8-1-2040 | | | | 1,425,000 | | | | 1,425,442 | |
| | | | |
Sherman TX Independent School District Series B | | | 3.00 | | | | 8-1-2048 | | | | 14,000,000 | | | | 14,200,900 | |
| | | | |
Spring Branch TX Independent School District | | | 3.00 | | | | 6-15-2041 | | | | 14,095,000 | | | | 14,163,361 | |
| | | | |
Texas Anticipation Notes Series 2018 | | | 4.00 | | | | 8-29-2019 | | | | 40,000,000 | | | | 40,572,400 | |
| | | | |
Texas Northside Independent School District | | | 1.45 | | | | 6-1-2047 | | | | 3,825,000 | | | | 3,793,214 | |
| | | | |
Williamson County TX | | | 1.85 | | | | 8-15-2034 | | | | 1,340,000 | | | | 1,337,695 | |
| |
| | | | 228,620,104 | |
| | | | | | | | | | | | | | | | |
| | | | |
| Health Revenue: 1.07% | | | | | | | | | | | | | | | | |
| | | | |
Coastal Bend TX Health Facilities Development Corporation (AGM Insured) (m) | | | 2.00 | | | | 7-1-2031 | | | | 13,600,000 | | | | 13,600,000 | |
| | | | |
Harris County TX Health Facilities Development Corporation Series A3 (AGM Insured) (m) | | | 2.00 | | | | 7-1-2031 | | | | 16,375,000 | | | | 16,375,000 | |
| | | | |
Tarrant County TX Cultural Education Facilities Finance Corporation Edgemere Project Refunding Bond Series A | | | 4.00 | | | | 11-15-2019 | | | | 400,000 | | | | 402,940 | |
| | | | |
Tarrant County TX Cultural Education Facilities Finance Corporation Edgemere Project Series B | | | 4.00 | | | | 11-15-2019 | | | | 705,000 | | | | 710,182 | |
| |
| | | | 31,088,122 | |
| | | | | | | | | | | | | | | | |
| | | | |
| Housing Revenue: 2.15% | | | | | | | | | | | | | | | | |
| | | | |
Alamito TX Public Facilities Corporation Multifamily Housing Series 2018 | | | 2.25 | | | | 6-1-2021 | | | | 16,300,000 | | | | 16,317,930 | |
| | | | |
Alamito TX Public Facilities Corporation Cramer Three Apartments Project | | | 2.50 | | | | 11-1-2021 | | | | 2,000,000 | | | | 2,014,420 | |
| | | | |
Capital Area Housing Finance Corporation TX Hills Leander Apartments | | | 2.05 | | | | 8-1-2021 | | | | 7,000,000 | | | | 6,993,490 | |
| | | | |
Del Rio TX Housing Facility Corporation | | | 1.35 | | | | 6-1-2021 | | | | 1,955,000 | | | | 1,950,992 | |
| | | | |
New Hope TX Cultural Education Facilities Finance Corporation Student Housing Project Series A | | | 3.25 | | | | 8-1-2019 | | | | 12,295,000 | | | | 12,272,623 | |
| | | | |
Southeast Texas Housing Finance Corporation Bayshore Towers Apartments (HUD Insured) | | | 2.20 | | | | 1-1-2022 | | | | 8,025,000 | | | | 8,029,654 | |
| | | | |
Texas Affordable Housing Corporation Palladium Glenn Heights Apartments | | | 1.90 | | | | 12-1-2020 | | | | 935,000 | | | | 933,654 | |
| | | | |
Texas Department of Housing & Community Affairs Multifamily Housing | | | 1.80 | | | | 12-1-2020 | | | | 1,955,000 | | | | 1,949,018 | |
| | | | |
Texas Department of Housing & Community Affairs Multifamily Housing | | | 2.20 | | | | 5-1-2021 | | | | 8,500,000 | | | | 8,503,230 | |
| | | | |
Texas Department of Housing & Community Affairs Multifamily Housing Series 2018 (FHA Insured) | | | 2.23 | | | | 5-1-2021 | | | | 3,500,000 | | | | 3,496,780 | |
| |
| | | | 62,461,791 | |
| | | | | | | | | | | | | | | | |
| | | | |
| Industrial Development Revenue: 0.35% | | | | | | | | | | | | | | | | |
| | | | |
Matagorda County TX Navigation District Central Power & Light Company Project | | | 1.75 | | | | 5-1-2030 | | | | 5,280,000 | | | | 5,207,453 | |
| | | | |
Port of Port Arthur TX Navigation District Emerald Renewable Diesel LLC Project 144A | | | 2.40 | | | | 6-1-2049 | | | | 5,000,000 | | | | 5,000,000 | |
| |
| | | | 10,207,453 | |
| | | | | | | | | | | | | | | | |
| | | | |
| Resource Recovery Revenue: 1.24% | | | | | | | | | | | | | | | | |
| | | | |
Harris County TX Industrial Development Corporation Solid Waste Disposal Series 2006 | | | 5.00 | | | | 2-1-2023 | | | | 13,500,000 | | | | 13,884,750 | |
| | | | |
Port Arthur TX Navigation District Jefferson County Environmental Facilities Motiva Enterprises LLC Project Series A ø | | | 2.05 | | | | 4-1-2040 | | | | 2,555,000 | | | | 2,555,000 | |
The accompanying notes are an integral part of these financial statements.
| | | | | | |
| Portfolio of investments—December 31, 2018 (unaudited) | | Wells Fargo Ultra Short-Term Municipal Income Fund | | | 27 | |
| | | | | | | | | | | | | | | | |
| Security name | | Interest rate | | | Maturity date | | | Principal | | | Value | |
| | | | |
| Resource Recovery Revenue(continued) | | | | | | | | | | | | | | | | |
| | | | |
Port Arthur TX Navigation District Jefferson County Environmental Facilities Motiva Enterprises LLC Project Series C ø | | | 2.05 | % | | | 4-1-2040 | | | $ | 2,500,000 | | | $ | 2,500,000 | |
| | | | |
Port Arthur TX Navigation District Jefferson County Environmental Facilities Motiva Enterprises LLC Project Subordinate Bond Series D ø | | | 2.10 | | | | 11-1-2040 | | | | 7,000,000 | | | | 7,000,000 | |
| | | | |
Port Arthur TX Navigation District Jefferson County Environmental Facilities Motiva Enterprises LLC Project Subordinate Bond Series E ø | | | 2.03 | | | | 11-1-2040 | | | | 10,000,000 | | | | 10,000,000 | |
| |
| | | | 35,939,750 | |
| | | | | | | | | | | | | | | | |
| | | | |
| Transportation Revenue: 0.64% | | | | | | | | | | | | | | | | |
| | | | |
Texas Tender Option Bond Trust Receipts/Floater Certificates Series 2015-XM0085 (Barclays Bank plc LIQ) 144Aø | | | 1.91 | | | | 7-1-2021 | | | | 17,500,000 | | | | 17,500,000 | |
| | | | |
Texas Tollway Authority Series C | | | 1.95 | | | | 1-1-2038 | | | | 1,200,000 | | | | 1,200,000 | |
| |
| | | | 18,700,000 | |
| | | | | | | | | | | | | | | | |
| | | | |
| Utilities Revenue: 0.92% | | | | | | | | | | | | | | | | |
| | | | |
San Antonio TX Electric & Gas Systems Refunding Bond Series B | | | 2.00 | | | | 2-1-2033 | | | | 11,265,000 | | | | 11,170,261 | |
| | | | |
San Antonio TX Series A | | | 2.25 | | | | 2-1-2033 | | | | 15,640,000 | | | | 15,675,034 | |
| |
| | | | 26,845,295 | |
| | | | | | | | | | | | | | | | |
| | | | |
| Water & Sewer Revenue: 0.14% | | | | | | | | | | | | | | | | |
| | | | |
Houston TX Combined Utility System Revenue Series C (1 Month LIBOR +0.36%) ± | | | 2.11 | | | | 5-15-2034 | | | | 4,000,000 | | | | 3,976,120 | |
| | | | | | | | | | | | | | | | |
| |
| | | | 434,990,378 | |
| | | | | | | | | | | | | | | | |
| | | | |
Virginia: 2.66% | | | | | | | | | | | | | | | | |
| | | | |
| Housing Revenue: 1.31% | | | | | | | | | | | | | | | | |
| | | | |
Colonial Heights VA EDA Colonial Ridge Apartments Series A | | | 1.80 | | | | 1-1-2020 | | | | 7,820,000 | | | | 7,809,678 | |
| | | | |
Fairfax County VA Redevelopment & Housing Authority Murraygate Village Apartment Project | | | 2.26 | | | | 2-1-2021 | | | | 12,500,000 | | | | 12,507,625 | |
| | | | |
Fairfax County VA Redevelopment & Housing Authority Parkwood Project | | | 2.21 | | | | 2-1-2021 | | | | 5,500,000 | | | | 5,503,355 | |
| | | | |
Newport News VA Redevelopment & Housing Authority Soundview Townhouses | | | 2.05 | | | | 8-1-2021 | | | | 2,690,000 | | | | 2,688,332 | |
| | | | |
Prince William County VA IDA Glen Arbor Apartments Project Series A | | | 1.35 | | | | 7-1-2019 | | | | 8,215,000 | | | | 8,215,000 | |
| | | | |
Prince William County VA IDA Glen Arbor Apartments Project Series B | | | 1.30 | | | | 7-1-2019 | | | | 1,250,000 | | | | 1,250,000 | |
| |
| | | | 37,973,990 | |
| | | | | | | | | | | | | | | | |
| | | | |
| Utilities Revenue: 0.94% | | | | | | | | | | | | | | | | |
| | | | |
Chesapeake VA EDA Electric & Power Company Series 2008A | | | 1.75 | | | | 2-1-2032 | | | | 23,460,000 | | | | 23,421,760 | |
| | | | |
Halifax County VA IDA | | | 2.15 | | | | 12-1-2041 | | | | 2,000,000 | | | | 1,994,780 | |
| | | | |
Wise County IDA Waste & Sewage Disposal Revenue | | | 1.88 | | | | 11-1-2040 | | | | 2,000,000 | | | | 1,987,980 | |
| |
| | | | 27,404,520 | |
| | | | | | | | | | | | | | | | |
| | | | |
| Water & Sewer Revenue: 0.41% | | | | | | | | | | | | | | | | |
| | | | |
Virginia Tender Option Bond Trust Receipts/Floater Certificates Series 2018-XS0003 144Aø | | | 2.09 | | | | 11-1-2024 | | | | 11,985,000 | | | | 11,985,000 | |
| | | | | | | | | | | | | | | | |
| |
| | | | 77,363,510 | |
| | | | | | | | | | | | | | | | |
The accompanying notes are an integral part of these financial statements.
| | | | |
| 28 | | Wells Fargo Ultra Short-Term Municipal Income Fund | | Portfolio of investments—December 31, 2018 (unaudited) |
| | | | | | | | | | | | | | | | |
| Security name | | Interest rate | | | Maturity date | | | Principal | | | Value | |
| | | | |
Washington: 2.07% | | | | | | | | | | | | | | | | |
| | | | |
| Health Revenue: 0.68% | | | | | | | | | | | | | | | | |
| | | | |
Grays Harbor County WA Public Hospital District #1 | | | 3.00 | % | | | 8-1-2019 | | | $ | 5,965,000 | | | $ | 5,953,368 | |
| | | | |
Washington HCFR Central Washington Health Service Association | | | 7.00 | | | | 7-1-2039 | | | | 2,345,000 | | | | 2,403,695 | |
| | | | |
Washington HCFR Series XF2035 (Morgan Stanley Bank LIQ) 144Aø | | | 2.11 | | | | 10-1-2036 | | | | 11,280,000 | | | | 11,280,000 | |
| |
| | | | 19,637,063 | |
| | | | | | | | | | | | | | | | |
| | | | |
| Housing Revenue: 0.21% | | | | | | | | | | | | | | | | |
| | | | |
Washington Housing Finance Commission SAG Portfolio Project | | | 2.55 | | | | 7-1-2022 | | | | 6,250,000 | | | | 6,260,500 | |
| | | | | | | | | | | | | | | | |
| | | | |
| Tax Revenue: 0.76% | | | | | | | | | | | | | | | | |
| | | | |
Central Puget Sound WA Regional Transit Authority Series 2015-S Class 2A (SIFMA Municipal Swap +0.30%) ± | | | 2.01 | | | | 11-1-2045 | | | | 22,150,000 | | | | 22,144,019 | |
| | | | | | | | | | | | | | | | |
| | | | |
| Utilities Revenue: 0.42% | | | | | | | | | | | | | | | | |
| | | | |
Seattle WA Municipal Light & Power Refunding Bond Series B2 (SIFMA Municipal Swap +0.29%) ± | | | 2.00 | | | | 5-1-2045 | | | | 10,000,000 | | | | 9,996,100 | |
| | | | |
Seattle WA Municipal Light & Power Series C1 (SIFMA Municipal Swap +0.25%) ± | | | 1.96 | | | | 11-1-2021 | | | | 1,055,000 | | | | 1,053,185 | |
| | | | |
Seattle WA Municipal Light & Power Series C2 (SIFMA Municipal Swap +0.25%) ± | | | 1.96 | | | | 11-1-2021 | | | | 1,055,000 | | | | 1,053,185 | |
| |
| | | | 12,102,470 | |
| | | | | | | | | | | | | | | | |
| |
| | | | 60,144,052 | |
| | | | | | | | | | | | | | | | |
| | | | |
West Virginia: 0.20% | | | | | | | | | | | | | | | | |
| | | | |
| Utilities Revenue: 0.20% | | | | | | | | | | | | | | | | |
| | | | |
West Virginia EDA Solid Waste Disposal Facilities Appalachian Power Company Series A | | | 1.70 | | | | 1-1-2041 | | | | 3,520,000 | | | | 3,449,142 | |
| | | | |
West Virginia EDA Solid Waste Disposal Facilities Appalachian Power Company Series A | | | 1.90 | | | | 3-1-2040 | | | | 2,485,000 | | | | 2,482,590 | |
| |
| | | | 5,931,732 | |
| | | | | | | | | | | | | | | | |
| | | | |
Wisconsin: 2.34% | | | | | | | | | | | | | | | | |
| | | | |
| Education Revenue: 0.07% | | | | | | | | | | | | | | | | |
| | | | |
Wisconsin PFA Gardner Webb University 144A | | | 5.00 | | | | 7-1-2021 | | | | 1,360,000 | | | | 1,398,162 | |
| | | | |
Wisconsin PFA Guilford College | | | 5.00 | | | | 1-1-2020 | | | | 490,000 | | | | 499,045 | |
| |
| | | | 1,897,207 | |
| | | | | | | | | | | | | | | | |
| | | | |
| GO Revenue: 0.10% | | | | | | | | | | | | | | | | |
| | | | |
Dane County WI AMT Promissory Notes Apartment Project Series D | | | 2.50 | | | | 6-1-2022 | | | | 445,000 | | | | 446,135 | |
| | | | |
Dane County WI AMT Promissory Notes Apartment Project Series D | | | 2.63 | | | | 6-1-2023 | | | | 980,000 | | | | 983,067 | |
| | | | |
Dane County WI AMT Promissory Notes Apartment Project Series D | | | 3.50 | | | | 6-1-2020 | | | | 600,000 | | | | 613,380 | |
| | | | |
Dane County WI AMT Promissory Notes Apartment Project Series D | | | 3.50 | | | | 6-1-2021 | | | | 735,000 | | | | 758,711 | |
| |
| | | | 2,801,293 | |
| | | | | | | | | | | | | | | | |
| | | | |
| Health Revenue: 0.84% | | | | | | | | | | | | | | | | |
| | | | |
Wisconsin HEFA Advocate Aurora Health Credit Group Series C3 (SIFMA Municipal Swap +0.55%) ± | | | 2.26 | | | | 8-15-2054 | | | | 20,065,000 | | | | 19,989,154 | |
| | | | |
Wisconsin HEFA Ascension Senior Credit Group Series B-5 | | | 1.38 | | | | 11-15-2038 | | | | 1,220,000 | | | | 1,211,131 | |
| | | | |
Wisconsin HEFA Tomah Memorial Hospital Series A | | | 2.65 | | | | 11-1-2020 | | | | 3,125,000 | | | | 3,119,969 | |
| |
| | | | 24,320,254 | |
| | | | | | | | | | | | | | | | |
The accompanying notes are an integral part of these financial statements.
| | | | | | |
| Portfolio of investments—December 31, 2018 (unaudited) | | Wells Fargo Ultra Short-Term Municipal Income Fund | | | 29 | |
| | | | | | | | | | | | | | | | |
| Security name | | Interest rate | | | Maturity date | | | Principal | | | Value | |
| | | | |
| Housing Revenue: 0.20% | | | | | | | | | | | | | | | | |
| | | | |
Wisconsin Housing & Economic Development Authority Series A | | | 1.95 | % | | | 11-1-2047 | | | $ | 4,865,000 | | | $ | 4,852,886 | |
| | | | |
Wisconsin Housing & Economic Development Authority Series A | | | 2.80 | | | | 3-1-2022 | | | | 1,070,000 | | | | 1,079,352 | |
| |
| | | | 5,932,238 | |
| | | | | | | | | | | | | | | | |
| | | | |
| Miscellaneous Revenue: 0.10% | | | | | | | | | | | | | | | | |
| | | | |
Shawano County WI BAN | | | 3.00 | | | | 9-1-2019 | | | | 3,000,000 | | | | 3,011,040 | |
| | | | | | | | | | | | | | | | |
| | | | |
| Resource Recovery Revenue: 0.96% | | | | | | | | | | | | | | | | |
| | | | |
Wisconsin PFA Series A-2 | | | 2.15 | | | | 10-1-2025 | | | | 28,000,000 | | | | 27,993,560 | |
| | | | | | | | | | | | | | | | |
| | | | |
| Tax Revenue: 0.07% | | | | | | | | | | | | | | | | |
| | | | |
Oconto Falls WI Public School District | | | 3.00 | | | | 10-1-2019 | | | | 2,150,000 | | | | 2,163,911 | |
| | | | | | | | | | | | | | | | |
| |
| | | | 68,119,503 | |
| | | | | | | | | | | | | | | | |
| | | | |
Wyoming: 0.05% | | | | | | | | | | | | | | | | |
| | | | |
| Utilities Revenue: 0.05% | | | | | | | | | | | | | | | | |
| | | | |
Converse County WY Pollution Control PacifiCorp Projects ø | | | 1.85 | | | | 12-1-2020 | | | | 1,485,000 | | | | 1,485,000 | |
| | | | | | | | | | | | | | | | |
| |
Total Municipal Obligations (Cost $2,865,240,887) | | | | 2,862,958,182 | |
| | | | | | | | | | | | | | | | |
| | | | |
Other: 1.37% | | | | | | | | | | | | | | | | |
| | | | |
Nuveen California AMT-Free Quality Municipal Income Fund Preferred Shares Series A 144Aøø§ | | | 2.01 | | | | 10-1-2047 | | | | 15,600,000 | | | | 15,600,000 | |
| | | | |
Nuveen New York Quality Municipal Income Fund Institutional MuniFund Term Preferred Shares 144Aøø§ | | | 2.01 | | | | 5-1-2047 | | | | 24,200,000 | | | | 24,200,000 | |
| | | | |
Total Other (Cost $39,800,000) | | | | | | | | | | | | | | | 39,800,000 | |
| | | | | | | | | | | | | | | | |
| | | | |
| | | Yield | | | | | | Shares | | | | |
| Short-Term Investments: 0.69% | | | | | | | | | | | | | | | | |
| | | | |
| Investment Companies: 0.69% | | | | | | | | | | | | | | | | |
| | | | |
Wells Fargo Municipal Cash Management Money Market Fund Institutional Class (l)(u) ## | | | 1.65 | | | | | | | | 19,890,349 | | | | 19,898,305 | |
| | | | | | | | | | | | | | | | |
| | | | |
Total Short-Term Investments (Cost $19,898,305) | | | | | | | | | | | | | | | 19,898,305 | |
| | | | | | | | | | | | | | | | |
| | | | | | | | |
| Total investments in securities (Cost $2,924,939,192) | | | 100.57 | % | | | 2,922,656,487 | |
| | |
Other assets and liabilities, net | | | (0.57 | ) | | | (16,512,141 | ) |
| | | | | | | | |
| Total net assets | | | 100.00 | % | | $ | 2,906,144,346 | |
| | | | | | | | |
| (m) | The security is an auction-rate security which has an interest rate that resets at predetermined short-term intervals through a Dutch auction. The rate shown is the rate in effect at period end. |
| ø | Variable rate demand notes are subject to a demand feature which reduces the effective maturity. The maturity date shown represents the final maturity date of the security. The interest rate is determined and reset by the issuer daily, weekly, or monthly depending upon the terms of the security. The rate shown is the rate in effect at period end. |
| 144A | The security may be resold in transactions exempt from registration, normally to qualified institutional buyers, pursuant to Rule 144A under the Securities Act of 1933. |
| ± | Variable rate investment. The rate shown is the rate in effect at period end. |
| %% | The security is issued on a when-issued basis. |
| øø | The interest rate is determined and reset by the issuer periodically depending upon the terms of the security. The rate shown is the rate in effect at period end. |
| § | The security is subject to a demand feature which reduces the effective maturity. |
| (l) | The issuer of the security is an affiliated person of the Fund as defined in the Investment Company Act of 1940. |
| (u) | The rate represents the 7-day annualized yield at period end. |
| ## | All or a portion of this security is segregated for when-issued securities. |
The accompanying notes are an integral part of these financial statements.
| | | | |
| 30 | | Wells Fargo Ultra Short-Term Municipal Income Fund | | Portfolio of investments—December 31, 2018 (unaudited) |
Abbreviations:
| AGC | Assured Guaranty Corporation |
| AGM | Assured Guaranty Municipal |
| Ambac | Ambac Financial Group Incorporated |
| AMT | Alternative minimum tax |
| BAN | Bond anticipation notes |
| CDA | Community Development Authority |
| DRIVER | Derivative inverse tax-exempt receipts |
| EDA | Economic Development Authority |
| EDFA | Economic Development Finance Authority |
| FGIC | Financial Guaranty Insurance Corporation |
| FHA | Federal Housing Administration |
| FHLMC | Federal Home Loan Mortgage Corporation |
| FNMA | Federal National Mortgage Association |
| GNMA | Government National Mortgage Association |
| HCFR | Healthcare facilities revenue |
| HEFA | Health & Educational Facilities Authority |
| HEFAR | Higher Education Facilities Authority Revenue |
| HFA | Housing Finance Authority |
| HFFA | Health Facilities Financing Authority |
| HUD | Department of Housing and Urban Development |
| IDA | Industrial Development Authority |
| LIBOR | London Interbank Offered Rate |
| National | National Public Finance Guarantee Corporation |
| PCR | Pollution control revenue |
| PFA | Public Finance Authority |
| PFFA | Public Facilities Financing Authority |
| PUTTER | Puttable tax-exempt receipts |
| RAN | Revenue anticipation notes |
| R&D | Research & development |
| RDA | Redevelopment Authority |
| SIFMA | Securities Industry and Financial Markets Association |
| SPA | Standby purchase agreement |
| TRAN | Tax revenue anticipation notes |
| TTFA | Transportation Trust Fund Authority |
Investments in Affiliates
An affiliated investment is an investment in which the Fund owns at least 5% of the outstanding voting shares of the issuer or as a result of other relationships, such as the Fund and the issuer having the same investment manager. Transactions with issuers that were either affiliates of the Fund at the beginning of the period or the end of the period were as follows:
| | | | | | | | | | | | | | | | | | | | | | | | | | | | | | | | | | | | |
| | | Shares,
beginning of
period | | | Shares
purchased | | | Shares
sold | | | Shares,
end of
period | | | Net
realized
gains
(losses) | | | Net
change in
unrealized
gains
(losses) | | | Income
from
affiliated
securities | | | Value,
end
of period | | | % of
net
assets | |
Short-Term Investments | | | | | | | | | | | | | | | | | | | | | | | | | | | | | | | | | | | | |
Investment Companies | | | | | | | | | | | | | | | | | | | | | | | | | | | | | | | | | | | | |
Wells Fargo Municipal Cash Management Money Market Fund Institutional Class | | | 48,291,197 | | | | 612,993,052 | | | | 641,393,900 | | | | 19,890,349 | | | $ | (44,463 | ) | | $ | 0 | | | $ | 180,381 | | | $ | 19,898,305 | | | | 0.69 | % |
The accompanying notes are an integral part of these financial statements.
| | | | | | |
| Statement of assets and liabilities—December 31, 2018 (unaudited) | | Wells Fargo Ultra Short-Term Municipal Income Fund | | | 31 | |
| | | | |
| | | | |
| |
Assets | | | | |
Investments in unaffiliated securities, at value (cost $2,905,040,887) | | $ | 2,902,758,182 | |
Investments in affiliated securities, at value (cost $19,898,305) | | | 19,898,305 | |
Receivable for Fund shares sold | | | 12,601,192 | |
Receivable for interest | | | 14,831,561 | |
Receivable for investments sold | | | 2,746,734 | |
| | | | |
Total assets | | | 2,952,835,974 | |
| | | | |
| |
Liabilities | | | | |
Payable for investments purchased | | | 20,994,611 | |
Due to custodian bank | | | 12,549,488 | |
Payable for Fund shares redeemed | | | 10,082,659 | |
Dividends payable | | | 1,438,478 | |
Management fee payable | | | 634,543 | |
Administration fees payable | | | 199,057 | |
Distribution fee payable | | | 11,773 | |
Trustees’ fees and expenses payable | | | 1,389 | |
Accrued expenses and other liabilities | | | 779,630 | |
| | | | |
Total liabilities | | | 46,691,628 | |
| | | | |
Total net assets | | $ | 2,906,144,346 | |
| | | | |
| |
NET ASSETS CONSIST OF | | | | |
Paid-in capital | | $ | 2,935,481,052 | |
Total distributable loss | | | (29,336,706 | ) |
| | | | |
Total net assets | | $ | 2,906,144,346 | |
| | | | |
| |
COMPUTATION OF NET ASSET VALUE AND OFFERING PRICE PER SHARE | | | | |
Net assets – Class A | | $ | 548,288,659 | |
Shares outstanding – Class A1 | | | 57,311,878 | |
Net asset value per share – Class A | | | $9.57 | |
Maximum offering price per share – Class A2 | | | $9.77 | |
Net assets – Class C | | $ | 18,781,662 | |
Shares outstanding – Class C1 | | | 1,999,639 | |
Net asset value per share – Class C | | | $9.39 | |
Net assets – Class R6 | | $ | 958,817,308 | |
Shares outstanding – Class R61 | | | 100,231,556 | |
Net asset value per share – Class R6 | | | $9.57 | |
Net assets – Administrator Class | | $ | 38,010,191 | |
Shares outstanding – Administrator Class1 | | | 3,972,651 | |
Net asset value per share – Administrator Class | | | $9.57 | |
Net assets – Institutional Class | | $ | 1,342,246,526 | |
Shares outstanding – Institutional Class1 | | | 140,261,977 | |
Net asset value per share – Institutional Class | | | $9.57 | |
| 1 | The Fund has an unlimited number of authorized shares. |
| 2 | Maximum offering price is computed as 100/98 of net asset value. On investments of $50,000 or more, the offering price is reduced. |
The accompanying notes are an integral part of these financial statements.
| | | | |
| 32 | | Wells Fargo Ultra Short-Term Municipal Income Fund | | Statement of operations—six months ended December 31, 2018 (unaudited) |
| | | | |
| | | | |
| |
Investment income | | | | |
Interest | | $ | 26,315,326 | |
Income from affiliated securities | | | 180,381 | |
| | | | |
Total investment income | | | 26,495,707 | |
| | | | |
| |
Expenses | | | | |
Management fee | | | 4,701,478 | |
Administration fees | | | | |
Class A | | | 514,229 | |
Class C | | | 13,456 | |
Class R6 | | | 32,852 | 1 |
Administrator Class | | | 21,713 | |
Institutional Class | | | 757,446 | |
Shareholder servicing fees | | | | |
Class A | | | 803,484 | |
Class C | | | 21,025 | |
Administrator Class | | | 53,939 | |
Distribution fee | | | | |
Class C | | | 63,075 | |
Custody and accounting fees | | | 98,088 | |
Professional fees | | | 29,492 | |
Registration fees | | | 66,410 | |
Shareholder report expenses | | | 88,423 | |
Trustees’ fees and expenses | | | 11,293 | |
Other fees and expenses | | | 50,511 | |
| | | | |
Total expenses | | | 7,326,914 | |
Less: Fee waivers and/or expense reimbursements | | | (1,070,270 | ) |
| | | | |
Net expenses | | | 6,256,644 | |
| | | | |
Net investment income | | | 20,239,063 | |
| | | | |
| |
REALIZED AND UNREALIZED GAINS (LOSSES) ON INVESTMENTS | | | | |
| |
| Net realized losses on: | | | | |
Unaffiliated securities | | | (419,435 | ) |
Affiliated securities | | | (44,463 | ) |
| | | | |
Net realized losses on investments | | | (463,898 | ) |
Net change in unrealized gains (losses) on investments | | | (705,599 | ) |
| | | | |
Net realized and unrealized gains (losses) on investments | | | (1,169,497 | ) |
| | | | |
Net increase in net assets resulting from operations | | $ | 19,069,566 | |
| | | | |
| 1 | For the period from July 31, 2018 (commencement of class operations) to December 31, 2018 |
The accompanying notes are an integral part of these financial statements.
| | | | | | |
| Statement of changes in net assets | | Wells Fargo Ultra Short-Term Municipal Income Fund | | | 33 | |
| | | | | | | | | | | | | | | | |
| | | Six months ended
December 31, 2018
(unaudited) | | | Year ended
June 30, 2018¹ | |
| | | | |
Operations | | | | | | | | | | | | | | | | |
Net investment income | | | | | | $ | 20,239,063 | | | | | | | $ | 45,974,475 | |
Net realized losses on investments | | | | | | | (463,898 | ) | | | | | | | (18,767,051 | ) |
Net change in unrealized gains (losses) on investments | | | | | | | (705,599 | ) | | | | | | | 15,359,294 | |
| | | | |
Net increase in net assets resulting from operations | | | | | | | 19,069,566 | | | | | | | | 42,566,718 | |
| | | | |
| | | | |
Distributions to shareholders from net investment income and net realized gains | | | | | | | | | | | | | | | | |
Class A | | | | | | | (3,877,107 | ) | | | | | | | (7,085,882 | ) |
Class C | | | | | | | (39,629 | ) | | | | | | | (29,395 | ) |
Class R6 | | | | | | | (1,881,789 | )2 | | | | | | | N/A | |
Administrator Class | | | | | | | (275,625 | ) | | | | | | | (10,119,588 | ) |
Institutional Class | | | | | | | (14,187,468 | ) | | | | | | | (28,738,290 | ) |
| | | | |
Total distributions to shareholders | | | | | | | (20,261,618 | ) | | | | | | | (45,973,155 | ) |
| | | | |
| | | | |
Capital share transactions | | | Shares | | | | | | | | Shares | | | | | |
Proceeds from shares sold | | | | | | | | | | | | | | | | |
Class A | | | 3,468,622 | | | | 33,164,195 | | | | 20,676,172 | | | | 197,898,705 | |
Class C | | | 387,374 | | | | 3,635,092 | | | | 46,196 | | | | 434,035 | |
Class R6 | | | 114,182,842 | 2 | | | 1,090,851,294 | 2 | | | N/A | | | | N/A | |
Administrator Class | | | 474,380 | | | | 4,538,092 | | | | 180,310,370 | | | | 1,725,053,645 | |
Institutional Class | | | 89,306,379 | | | | 854,223,311 | | | | 236,575,489 | | | | 2,265,282,906 | |
| | | | |
| | | | |
| | | | | | | 1,986,411,984 | | | | | | | | 4,188,669,291 | |
| | | | |
Reinvestment of distributions | | | | | | | | | | | | | | | | |
Class A | | | 386,812 | | | | 3,699,154 | | | | 714,776 | | | | 6,840,532 | |
Class C | | | 3,536 | | | | 33,203 | | | | 2,611 | | | | 24,514 | |
Class R6 | | | 2,374 | 2 | | | 22,715 | 2 | | | N/A | | | | N/A | |
Administrator Class | | | 27,885 | | | | 266,724 | | | | 1,054,198 | | | | 10,092,519 | |
Institutional Class | | | 909,655 | | | | 8,700,545 | | | | 1,693,421 | | | | 16,209,226 | |
| | | | |
| | | | |
| | | | | | | 12,722,341 | | | | | | | | 33,166,791 | |
| | | | |
Payment for shares redeemed | | | | | | | | | | | | | | | | |
Class A | | | (19,956,041 | ) | | | (190,768,621 | ) | | | (49,417,914 | ) | | | (473,112,170 | ) |
Class C | | | (216,969 | ) | | | (2,036,606 | ) | | | (738,395 | ) | | | (6,941,123 | ) |
Class R6 | | | (13,953,660 | )2 | | | (133,397,144 | )2 | | | N/A | | | | N/A | |
Administrator Class | | | (2,145,289 | ) | | | (20,523,021 | ) | | | (379,152,798 | ) | | | (3,626,561,750 | ) |
Institutional Class | | | (173,662,606 | ) | | | (1,659,739,340 | ) | | | (297,934,058 | ) | | | (2,852,291,197 | ) |
| | | | |
| | | | |
| | | | | | | (2,006,464,732 | ) | | | | | | | (6,958,906,240 | ) |
| | | | |
Net decrease in net assets resulting from capital share transactions | | | | | | | (7,330,407 | ) | | | | | | | (2,737,070,158 | ) |
| | | | |
Total decrease in net assets | | | | | | | (8,522,459 | ) | | | | | | | (2,740,476,595 | ) |
| | | | |
| | | | |
Net assets | | | | | | | | | | | | | | | | |
Beginning of period | | | | | | | 2,914,666,805 | | | | | | | | 5,655,143,400 | |
| | | | |
End of period | | | | | | $ | 2,906,144,346 | | | | | | | $ | 2,914,666,805 | |
| | | | |
| 1 | Effective for all filings after November 4, 2018, the SEC prospectively eliminated the requirement to parenthetically disclose undistributed net investment income at the end of the period and permitted the aggregation of distributions, with the exception of tax basis returns of capital. Overdistributed net investment income at June 30, 2018 was $484,384. The disaggregated distributions information for the year ended June 30, 2018 is included in Note 7,Distributions to Shareholders,in the notes to the financial statements. |
| 2 | For the period from July 31, 2018 (commencement of class operations) to December 31, 2018 |
The accompanying notes are an integral part of these financial statements.
| | | | |
| 34 | | Wells Fargo Ultra Short-Term Municipal Income Fund | | Financial highlights |
(For a share outstanding throughout each period)
| | | | | | | | | | | | | | | | | | | | | | | | |
| | | Six months ended
December 31, 2018 (unaudited) | | | Year ended June 30 | |
| CLASS A | | 2018 | | | 2017 | | | 2016 | | | 20151 | | | 20141 | |
Net asset value, beginning of period | | | $9.57 | | | | $9.57 | | | | $9.63 | | | | $9.61 | | | | $9.64 | | | | $9.64 | |
Net investment income | | | 0.06 | | | | 0.08 | | | | 0.06 | | | | 0.04 | | | | 0.02 | | | | 0.04 | |
Net realized and unrealized gains (losses) on investments | | | 0.00 | 2 | | | 0.00 | 2 | | | (0.06 | ) | | | 0.02 | | | | (0.03 | ) | | | 0.00 | 2 |
| | | | | | | | | | | | | | | | | | | | | | | | |
Total from investment operations | | | 0.06 | | | | 0.08 | | | | 0.00 | | | | 0.06 | | | | (0.01 | ) | | | 0.04 | |
Distributions to shareholders from | | | | | | | | | | | | | | | | | | | | | | | | |
Net investment income | | | (0.06 | ) | | | (0.08 | ) | | | (0.06 | ) | | | (0.04 | ) | | | (0.02 | ) | | | (0.04 | ) |
Net realized gains | | | 0.00 | | | | 0.00 | | | | (0.00 | )2 | | | (0.00 | )2 | | | (0.00 | )2 | | | (0.00 | )2 |
| | | | | | | | | | | | | | | | | | | | | | | | |
Total distributions to shareholders | | | (0.06 | ) | | | (0.08 | ) | | | (0.06 | ) | | | (0.04 | ) | | | (0.02 | ) | | | (0.04 | ) |
Net asset value, end of period | | | $9.57 | | | | $9.57 | | | | $9.57 | | | | $9.63 | | | | $9.61 | | | | $9.64 | |
Total return3 | | | 0.61 | % | | | 0.88 | % | | | (0.04 | )% | | | 0.61 | % | | | (0.07 | )% | | | 0.35 | % |
Ratios to average net assets (annualized) | | | | | | | | | | | | | | | | | | | | | | | | |
Gross expenses | | | 0.77 | % | | | 0.77 | % | | | 0.75 | % | | | 0.75 | % | | | 0.75 | % | | | 0.75 | % |
Net expenses | | | 0.67 | % | | | 0.67 | % | | | 0.67 | % | | | 0.67 | % | | | 0.67 | % | | | 0.67 | % |
Net investment income | | | 1.20 | % | | | 0.86 | % | | | 0.57 | % | | | 0.38 | % | | | 0.23 | % | | | 0.34 | % |
Supplemental data | | | | | | | | | | | | | | | | | | | | | | | | |
Portfolio turnover rate | | | 28 | % | | | 50 | % | | | 56 | % | | | 41 | % | | | 44 | % | | | 51 | % |
Net assets, end of period (000s omitted) | | | $548,289 | | | | $702,570 | | | | $971,189 | | | | $1,209,818 | | | | $961,485 | | | | $1,582,112 | |
| 1 | A one-for-two share split took place after the close of business on June 12, 2015 for all classes of the Fund. The per share information has been adjusted to give effect to this transaction. |
| 2 | Amount is less than $0.005. |
| 3 | Total return calculations do not include any sales charges. Returns for periods of less than one year are not annualized. |
The accompanying notes are an integral part of these financial statements.
| | | | | | |
| Financial highlights | | Wells Fargo Ultra Short-Term Municipal Income Fund | | | 35 | |
(For a share outstanding throughout each period)
| | | | | | | | | | | | | | | | | | | | | | | | |
| | | Six months ended
December 31, 2018 (unaudited) | | | Year ended June 30 | |
| CLASS C | | 2018 | | | 2017 | | | 2016 | | | 20151 | | | 20141 | |
Net asset value, beginning of period | | | $9.40 | | | | $9.40 | | | | $9.47 | | | | $9.49 | | | | $9.58 | | | | $9.62 | |
Net investment income (loss) | | | 0.02 | 2 | | | 0.01 | 2 | | | (0.02 | )2 | | | (0.04 | )2 | | | (0.11 | ) | | | (0.04 | )2 |
Net realized and unrealized gains (losses) on investments | | | (0.01 | ) | | | 0.00 | 3 | | | (0.05 | ) | | | 0.02 | | | | 0.02 | | | | 0.00 | 3 |
| | | | | | | | | | | | | | | | | | | | | | | | |
Total from investment operations | | | 0.01 | | | | 0.01 | | | | (0.07 | ) | | | (0.02 | ) | | | (0.09 | ) | | | (0.04 | ) |
Distributions to shareholders from | | | | | | | | | | | | | | | | | | | | | | | | |
Net investment income | | | (0.02 | ) | | | (0.01 | ) | | | (0.00 | )3 | | | 0.00 | | | | 0.00 | | | | 0.00 | |
Net realized gains | | | 0.00 | | | | 0.00 | | | | (0.00 | )3 | | | (0.00 | )3 | | | (0.00 | )3 | | | (0.00 | )3 |
| | | | | | | | | | | | | | | | | | | | | | | | |
Total distributions to shareholders | | | (0.02 | ) | | | (0.01 | ) | | | (0.00 | )3 | | | (0.00 | )3 | | | (0.00 | )3 | | | (0.00 | )3 |
Net asset value, end of period | | | $9.39 | | | | $9.40 | | | | $9.40 | | | | $9.47 | | | | $9.49 | | | | $9.58 | |
Total return4 | | | 0.13 | % | | | 0.16 | % | | | (0.73 | )% | | | (0.19 | )% | | | (0.93 | )% | | | (0.40 | )% |
Ratios to average net assets (annualized) | | | | | | | | | | | | | | | | | | | | | | | | |
Gross expenses | | | 1.52 | % | | | 1.52 | % | | | 1.50 | % | | | 1.50 | % | | | 1.50 | % | | | 1.50 | % |
Net expenses | | | 1.42 | % | | | 1.42 | % | | | 1.42 | % | | | 1.42 | % | | | 1.42 | % | | | 1.42 | % |
Net investment income (loss) | | | 0.47 | % | | | 0.11 | % | | | (0.18 | )% | | | (0.37 | )% | | | (0.52 | )% | | | (0.41 | )% |
Supplemental data | | | | | | | | | | | | | | | | | | | | | | | | |
Portfolio turnover rate | | | 28 | % | | | 50 | % | | | 56 | % | | | 41 | % | | | 44 | % | | | 51 | % |
Net assets, end of period (000s omitted) | | | $18,782 | | | | $17,154 | | | | $23,650 | | | | $31,837 | | | | $42,289 | | | | $59,352 | |
| 1 | A one-for-two share split took place after the close of business on June 12, 2015 for all classes of the Fund. The per share information has been adjusted to give effect to this transaction. |
| 2 | Calculated based upon average shares outstanding |
| 3 | Amount is less than $0.005. |
| 4 | Total return calculations do not include any sales charges. Returns for periods of less than one year are not annualized. |
The accompanying notes are an integral part of these financial statements.
| | | | |
| 36 | | Wells Fargo Ultra Short-Term Municipal Income Fund | | Financial highlights |
(For a share outstanding throughout the period)
| | | | |
| CLASS R6 | | Period ended
December 31, 2018¹
(unaudited) | |
Net asset value, beginning of period | | | $9.58 | |
Net investment income | | | 0.07 | 2 |
Net realized and unrealized gains (losses) on investments | | | (0.01 | ) |
| | | | |
Total from investment operations | | | 0.06 | |
Distributions to shareholders from | | | | |
Net investment income | | | (0.07 | ) |
Net asset value, end of period | | | $9.57 | |
Total return3 | | | 0.57 | % |
Ratios to average net assets (annualized) | | | | |
Gross expenses | | | 0.39 | % |
Net expenses | | | 0.32 | % |
Net investment income | | | 1.71 | % |
Supplemental data | | | | |
Portfolio turnover rate | | | 28 | % |
Net assets, end of period (000s omitted) | | | $958,817 | |
| 1 | For the period from July 31, 2018 (commencement of class operations) to December 31, 2018 |
| 2 | Calculated based upon average shares outstanding |
| 3 | Returns for periods of less than one year are not annualized. |
The accompanying notes are an integral part of these financial statements.
| | | | | | |
| Financial highlights | | Wells Fargo Ultra Short-Term Municipal Income Fund | | | 37 | |
(For a share outstanding throughout each period)
| | | | | | | | | | | | | | | | | | | | | | | | |
| | | Six months ended
December 31, 2018 (unaudited) | | | Year ended June 30 | |
| ADMINISTRATOR CLASS | | 2018 | | | 2017 | | | 2016 | | | 20151 | | | 20141 | |
Net asset value, beginning of period | | | $9.57 | | | | $9.57 | | | | $9.63 | | | | $9.61 | | | | $9.64 | | | | $9.64 | |
Net investment income | | | 0.06 | 2 | | | 0.08 | 2 | | | 0.06 | | | | 0.04 | | | | 0.03 | | | | 0.04 | |
Net realized and unrealized gains (losses) on investments | | | 0.00 | 3 | | | 0.01 | | | | (0.06 | ) | | | 0.02 | | | | (0.03 | ) | | | 0.00 | 3 |
| | | | | | | | | | | | | | | | | | | | | | | | |
Total from investment operations | | | 0.06 | | | | 0.09 | | | | 0.00 | | | | 0.06 | | | | 0.00 | | | | 0.04 | |
Distributions to shareholders from | | | | | | | | | | | | | | | | | | | | | | | | |
Net investment income | | | (0.06 | ) | | | (0.09 | ) | | | (0.06 | ) | | | (0.04 | ) | | | (0.03 | ) | | | (0.04 | ) |
Net realized gains | | | 0.00 | | | | 0.00 | | | | (0.00 | )3 | | | (0.00 | )3 | | | (0.00 | )3 | | | (0.00 | )3 |
| | | | | | | | | | | | | | | | | | | | | | | | |
Total distributions to shareholders | | | (0.06 | ) | | | (0.09 | ) | | | (0.06 | ) | | | (0.04 | ) | | | (0.03 | ) | | | (0.04 | ) |
Net asset value, end of period | | | $9.57 | | | | $9.57 | | | | $9.57 | | | | $9.63 | | | | $9.61 | | | | $9.64 | |
Total return4 | | | 0.65 | % | | | 0.95 | % | | | 0.03 | % | | | 0.68 | % | | | 0.00 | % | | | 0.42 | % |
Ratios to average net assets (annualized) | | | | | | | | | | | | | | | | | | | | | | | | |
Gross expenses | | | 0.71 | % | | | 0.70 | % | | | 0.70 | % | | | 0.68 | % | | | 0.69 | % | | | 0.69 | % |
Net expenses | | | 0.60 | % | | | 0.60 | % | | | 0.60 | % | | | 0.60 | % | | | 0.60 | % | | | 0.60 | % |
Net investment income | | | 1.27 | % | | | 0.82 | % | | | 0.69 | % | | | 0.45 | % | | | 0.30 | % | | | 0.41 | % |
Supplemental data | | | | | | | | | | | | | | | | | | | | | | | | |
Portfolio turnover rate | | | 28 | % | | | 50 | % | | | 56 | % | | | 41 | % | | | 44 | % | | | 51 | % |
Net assets, end of period (000s omitted) | | | $38,010 | | | | $53,746 | | | | $1,946,987 | | | | $226,125 | | | | $328,134 | | | | $407,791 | |
| 1 | A one-for-two share split took place after the close of business on June 12, 2015 for all classes of the Fund. The per share information has been adjusted to give effect to this transaction. |
| 2 | Calculated based upon average shares outstanding |
| 3 | Amount is less than $0.005. |
| 4 | Returns for periods of less than one year are not annualized. |
The accompanying notes are an integral part of these financial statements.
| | | | |
| 38 | | Wells Fargo Ultra Short-Term Municipal Income Fund | | Financial highlights |
(For a share outstanding throughout each period)
| | | | | | | | | | | | | | | | | | | | | | | | |
| | | Six months ended
December 31, 2018 (unaudited) | | | Year ended June 30 | |
| INSTITUTIONAL CLASS | | 2018 | | | 2017 | | | 2016 | | | 20151 | | | 20141 | |
Net asset value, beginning of period | | | $9.57 | | | | $9.58 | | | | $9.63 | | | | $9.61 | | | | $9.64 | | | | $9.64 | |
Net investment income | | | 0.07 | | | | 0.11 | | | | 0.08 | 2 | | | 0.07 | | | | 0.05 | | | | 0.06 | |
Net realized and unrealized gains (losses) on investments | | | 0.00 | 3 | | | (0.01 | ) | | | (0.05 | ) | | | 0.02 | | | | (0.03 | ) | | | 0.00 | 3 |
| | | | | | | | | | | | | | | | | | | | | | | | |
Total from investment operations | | | 0.07 | | | | 0.10 | | | | 0.03 | | | | 0.09 | | | | 0.02 | | | | 0.06 | |
Distributions to shareholders from | | | | | | | | | | | | | | | | | | | | | | | | |
Net investment income | | | (0.07 | ) | | | (0.11 | ) | | | (0.08 | ) | | | (0.07 | ) | | | (0.05 | ) | | | (0.06 | ) |
Net realized gains | | | 0.00 | | | | 0.00 | | | | (0.00 | )3 | | | (0.00 | )3 | | | (0.00 | )3 | | | (0.00 | )3 |
| | | | | | | | | | | | | | | | | | | | | | | | |
Total distributions to shareholders | | | (0.07 | ) | | | (0.11 | ) | | | (0.08 | ) | | | (0.07 | ) | | | (0.05 | ) | | | (0.06 | ) |
Net asset value, end of period | | | $9.57 | | | | $9.57 | | | | $9.58 | | | | $9.63 | | | | $9.61 | | | | $9.64 | |
Total return4 | | | 0.77 | % | | | 1.07 | % | | | 0.36 | % | | | 0.91 | % | | | 0.23 | % | | | 0.65 | % |
Ratios to average net assets (annualized) | | | | | | | | | | | | | | | | | | | | | | | | |
Gross expenses | | | 0.44 | % | | | 0.44 | % | | | 0.42 | % | | | 0.42 | % | | | 0.42 | % | | | 0.42 | % |
Net expenses | | | 0.37 | % | | | 0.37 | % | | | 0.37 | % | | | 0.37 | % | | | 0.37 | % | | | 0.37 | % |
Net investment income | | | 1.49 | % | | | 1.16 | % | | | 0.86 | % | | | 0.68 | % | | | 0.54 | % | | | 0.64 | % |
Supplemental data | | | | | | | | | | | | | | | | | | | | | | | | |
Portfolio turnover rate | | | 28 | % | | | 50 | % | | | 56 | % | | | 41 | % | | | 44 | % | | | 51 | % |
Net assets, end of period (000s omitted) | | | $1,342,247 | | | | $2,141,197 | | | | $2,713,317 | | | | $4,061,647 | | | | $3,930,234 | | | | $3,403,244 | |
| 1 | A one-for-two share split took place after the close of business on June 12, 2015 for all classes of the Fund. The per share information has been adjusted to give effect to this transaction. |
| 2 | Calculated based upon average shares outstanding |
| 3 | Amount is less than $0.005. |
| 4 | Returns for periods of less than one year are not annualized. |
The accompanying notes are an integral part of these financial statements.
| | | | | | |
| Notes to financial statements (unaudited) | | Wells Fargo Ultra Short-Term Municipal Income Fund | | | 39 | |
1. ORGANIZATION
Wells Fargo Funds Trust (the “Trust”), a Delaware statutory trust organized on March 10, 1999, is an open-end management investment company registered under the Investment Company Act of 1940, as amended (the “1940 Act”). As an investment company, the Trust follows the accounting and reporting guidance in Financial Accounting Standards Board (“FASB”) Accounting Standards Codification Topic 946, Financial Services – Investment Companies. These financial statements report on the Wells Fargo Ultra Short-Term Municipal Income Fund (the “Fund”) which is a diversified series of the Trust.
2. SIGNIFICANT ACCOUNTING POLICIES
The following significant accounting policies, which are consistently followed in the preparation of the financial statements of the Fund, are in conformity with U.S. generally accepted accounting principles which require management to make estimates and assumptions that affect the reported amounts of assets and liabilities, disclosure of contingent assets and liabilities at the date of the financial statements, and the reported amounts of revenues and expenses during the reporting period. Actual results could differ from those estimates.
Securities valuation
All investments are valued each business day as of the close of regular trading on the New York Stock Exchange (generally 4 p.m. Eastern Time), although the Fund may deviate from this calculation time under unusual or unexpected circumstances.
Debt securities are valued at the evaluated bid price provided by an independent pricing service (e.g. taking into account various factors, including yields, maturities, or credit ratings) or, if a reliable price is not available, the quoted bid price from an independent broker-dealer.
Investments in registered open-end investment companies are valued at net asset value.
Investments which are not valued using any of the methods discussed above are valued at their fair value, as determined in good faith by the Board of Trustees of the Fund. The Board of Trustees has established a Valuation Committee comprised of the Trustees and has delegated to it the authority to take any actions regarding the valuation of portfolio securities that the Valuation Committee deems necessary or appropriate, including determining the fair value of portfolio securities, unless the determination has been delegated to the Wells Fargo Asset Management Pricing Committee at Wells Fargo Funds Management, LLC (“Funds Management”).The Board of Trustees retains the authority to make or ratify any valuation decisions or approve any changes to the Valuation Procedures as it deems appropriate. On a quarterly basis, the Board of Trustees receives reports on any valuation actions taken by the Valuation Committee or the Wells Fargo Asset Management Pricing Committee which may include items for ratification.
When-issued transactions
The Fund may purchase securities on a forward commitment or when-issued basis. The Fund records a when-issued transaction on the trade date and will segregate assets in an amount at least equal in value to the Fund’s commitment to purchase when-issued securities. Securities purchased on a when-issued basis are marked-to-market daily and the Fund begins earning interest on the settlement date. Losses may arise due to changes in the market value of the underlying securities or if the counterparty does not perform under the contract.
Security transactions and income recognition
Securities transactions are recorded on a trade date basis. Realized gains or losses are recorded on the basis of identified cost.
Interest income is accrued daily and bond discounts are accreted and premiums are amortized daily. To the extent debt obligations are placed on non-accrual status, any related interest income may be reduced by writing off interest receivables when the collection of all or a portion of interest has been determined to be doubtful based on consistently applied procedures and the fair value has decreased. If the issuer subsequently resumes interest payments or when the collectability of interest is reasonably assured, the debt obligation is removed from non-accrual status.
Distributions to shareholders
Distributions to shareholders from net investment income are declared daily and paid monthly. Distributions from net realized gains, if any, are recorded on the ex-dividend date and paid at least annually. Such distributions are determined in accordance with income tax regulations and may differ from U.S. generally accepted accounting principles. Dividend sources are estimated at the time of declaration. The tax character of distributions is determined as of the Fund’s fiscal year end. Therefore, a portion of the Fund’s distributions made prior to the Fund’s fiscal year end may be categorized as a tax return of capital at year end.
| | | | |
| 40 | | Wells Fargo Ultra Short-Term Municipal Income Fund | | Notes to financial statements (unaudited) |
Federal and other taxes
The Fund intends to continue to qualify as a regulated investment company by distributing substantially all of its investment company taxable and tax-exempt income and any net realized capital gains (after reduction for capital loss carryforwards) sufficient to relieve it from all, or substantially all, federal income taxes. Accordingly, no provision for federal income taxes was required.
The Fund’s income and federal excise tax returns and all financial records supporting those returns for the prior three fiscal years are subject to examination by the federal and Delaware revenue authorities. Management has analyzed the Fund’s tax positions taken on federal, state, and foreign tax returns for all open tax years and does not believe that there are any uncertain tax positions that require recognition of a tax liability.
As of December 31, 2018, the aggregate cost of all investments for federal income tax purposes was $2,924,892,070 and the unrealized gains (losses) consisted of:
| | | | |
| |
Gross unrealized gains | | $ | 1,966,369 | |
| |
Gross unrealized losses | | | (4,201,952 | ) |
| |
Net unrealized losses | | $ | (2,235,583 | ) |
As of June 30, 2018, the Fund had capital loss carryforwards which consisted of $2,986,678 in short-term capital losses and $5,235,390 in long-term capital losses.
As of June 30, 2018, the Fund had current year deferred post-October capital losses consisting of $161,994 in short-term losses and $17,648,790 in long-term losses which were recognized on the first day of the current fiscal year.
Class allocations
The separate classes of shares offered by the Fund differ principally in applicable sales charges, distribution, shareholder servicing, and administration fees. Class specific expenses are charged directly to that share class. Investment income, common expenses, and realized and unrealized gains (losses) on investments are allocated daily to each class of shares based on the relative proportion of net assets of each class.
3. FAIR VALUATION MEASUREMENTS
Fair value measurements of investments are determined within a framework that has established a fair value hierarchy based upon the various data inputs utilized in determining the value of the Fund’s investments. The three-level hierarchy gives the highest priority to unadjusted quoted prices in active markets for identical assets or liabilities (Level 1) and the lowest priority to unobservable inputs (Level 3). The Fund’s investments are classified within the fair value hierarchy based on the lowest level of input that is significant to the fair value measurement. The inputs are summarized into three broad levels as follows:
| ∎ | | Level 1 – quoted prices in active markets for identical securities |
| ∎ | | Level 2 – other significant observable inputs (including quoted prices for similar securities, interest rates, prepayment speeds, credit risk, etc.) |
| ∎ | | Level 3 – significant unobservable inputs (including the Fund’s own assumptions in determining the fair value of investments) |
The inputs or methodologies used for valuing investments in securities are not necessarily an indication of the risk associated with investing in those securities.
The following is a summary of the inputs used in valuing the Fund’s assets and liabilities as of December 31, 2018:
| | | | | | | | | | | | | | | | |
| | | | |
| | | Quoted prices (Level 1) | | | Other significant
observable inputs (Level 2) | | | Significant
unobservable inputs (Level 3) | | | Total | |
| | | | |
Assets | | | | | | | | | | | | | | | | |
Investments in: | | | | | | | | | | | | | | | | |
| | | | |
Municipal obligations | | $ | 0 | | | $ | 2,862,958,182 | | | $ | 0 | | | $ | 2,862,958,182 | |
| | | | |
Other | | | 0 | | | | 39,800,000 | | | | 0 | | | | 39,800,000 | |
| | | | |
Short-term investments | | | | | | | | | | | | | | | | |
| | | | |
Investment companies | | | 19,898,305 | | | | 0 | | | | 0 | | | | 19,898,305 | |
| | | | |
Total assets | | $ | 19,898,305 | | | $ | 2,902,758,182 | | | $ | 0 | | | $ | 2,922,656,487 | |
| | | | | | |
| Notes to financial statements (unaudited) | | Wells Fargo Ultra Short-Term Municipal Income Fund | | | 41 | |
Additional sector, industry or geographic detail is included in the Portfolio of Investments.
At December 31, 2018, the Fund did not have any transfers into/out of Level 3.
4. TRANSACTIONS WITH AFFILIATES
Management fee
Funds Management, an indirect wholly owned subsidiary of Wells Fargo & Company (“Wells Fargo”), is the manager of the Fund and provides advisory and fund-level administrative services under an investment management agreement. Under the investment management agreement, Funds Management is responsible for, among other services, implementing the investment objectives and strategies of the Fund, supervising the subadviser and providing fund-level administrative services in connection with the Fund’s operations. As compensation for its services under the investment management agreement, Funds Management is entitled to receive an annual management fee starting at 0.35% and declining to 0.255% as the average daily net assets of the Fund increase. For the six months ended December 31, 2018, the management fee was equivalent to an annual rate of 0.33% of the Fund’s average daily net assets.
Funds Management has retained the services of a subadviser to provide daily portfolio management to the Fund. The fee for subadvisory services is borne by Funds Management. Wells Capital Management Incorporated, an affiliate of Funds Management and an indirect wholly owned subsidiary of Wells Fargo, is the subadviser to the Fund and is entitled to receive a fee from Funds Management at an annual rate starting at 0.15% and declining to 0.05% as the average daily net assets of the Fund increase.
Administration fees
Under a class-level administration agreement, Funds Management provides class-level administrative services to the Fund, which includes paying fees and expenses for services provided by the transfer agent, sub-transfer agents, omnibus account servicers and record-keepers. As compensation for its services under the class-level administration agreement, Funds Management receives an annual fee which is calculated based on the average daily net assets of each class as follows:
| | | | |
| | | Class-level
administration fee | |
| |
Class A, Class C | | | 0.16 | % |
| |
Class R6 | | | 0.03 | |
| |
Administrator Class | | | 0.10 | |
| |
Institutional Class | | | 0.08 | |
Funds Management has contractually waived and/or reimbursed management and administration fees to the extent necessary to maintain certain net operating expense ratios for the Fund. When each class of the Fund has exceeded its expense cap, Funds Management has waived fees and/or reimbursed expenses from fund level expenses on a proportionate basis and then from class specific expenses; otherwise, waivers and/or reimbursements are applied against class specific expenses before fund level expenses. Funds Management has committed through October 31, 2019 to waive fees and/or reimburse expenses to the extent necessary to cap the Fund’s expenses at 0.67% for Class A shares, 1.42% for Class C shares, 0.32% for Class R6 shares, 0.60% for Administrator Class shares, and 0.37% for Institutional Class shares. After this time, the cap may be increased or the commitment to maintain the cap may be terminated only with the approval of the Board of Trustees.
Distribution fee
The Trust has adopted a distribution plan for Class C shares of the Fund pursuant to Rule 12b-1 under the 1940 Act. A distribution fee is charged to Class C shares and paid to Wells Fargo Funds Distributor, LLC (“Funds Distributor”), the principal underwriter, at an annual rate of 0.75% of the average daily net assets of Class C shares.
In addition, Funds Distributor is entitled to receive the front-end sales charge from the purchase of Class A shares and a contingent deferred sales charge on the redemption of certain Class A shares. Funds Distributor is also entitled to receive the contingent deferred sales charges from redemptions of Class C shares. For the six months ended December 31, 2018, Funds Distributor received $777 from the sale of Class A shares. No contingent deferred sales charges were incurred by Class A and Class C shares for the six months ended December 31, 2018.
Shareholder servicing fees
The Trust has entered into contracts with one or more shareholder servicing agents, whereby Class A, Class C, and Administrator Class of the Fund are charged a fee at an annual rate of 0.25% of the average daily net assets of each respective class.
| | | | |
| 42 | | Wells Fargo Ultra Short-Term Municipal Income Fund | | Notes to financial statements (unaudited) |
A portion of these total shareholder servicing fees were paid to affiliates of Wells Fargo.
Interfund transactions
The Fund may purchase or sell portfolio investment securities to certain other Wells Fargo affiliates pursuant toRule 17a-7 under the 1940 Act and under procedures adopted by the Board of Trustees. The procedures have been designed to ensure that these interfund transactions, which do not incur broker commissions, are effected at current market prices. Pursuant to these procedures, the Fund had $419,060,000 and $546,320,000 in interfund purchases and sales, respectively, during the six months ended December 31, 2018.
5. INVESTMENT PORTFOLIO TRANSACTIONS
Purchases and sales of investments, excluding U.S. government obligations (if any) and short-term securities, for the six months ended December 31, 2018 were $892,901,859 and $648,889,836, respectively.
6. BANK BORROWINGS
The Trust (excluding the money market funds), Wells Fargo Master Trust and Wells Fargo Variable Trust are parties to a $280,000,000 revolving credit agreement whereby the Fund is permitted to use bank borrowings for temporary or emergency purposes, such as to fund shareholder redemption requests. Interest under the credit agreement is charged to the Fund based on a borrowing rate equal to the higher of the Federal Funds rate in effect on that day plus 1.25% or the overnight LIBOR rate in effect on that day plus 1.25%. In addition, an annual commitment fee equal to 0.25% of the unused balance is allocated to each participating fund.
For the six months ended December 31, 2018, there were no borrowings by the Fund under the agreement.
7. DISTRIBUTIONS TO SHAREHOLDERS
Effective for all filings after November 4, 2018, the Securities and Exchange Commission eliminated the requirement to separately state the components of distributions to shareholders under U.S. generally accepted accounting principles. The amounts of distributions to shareholders for the year ended June 30, 2018 were as follows:
| | | | |
| | | Net investment
income | |
| |
Class A | | | $7,085,882 | |
| |
Class C | | | 29,395 | |
| |
Administrator Class | | | 10,119,588 | |
| |
Institutional Class | | | 28,738,290 | |
8. INDEMNIFICATION
Under the Trust’s organizational documents, the officers and Trustees have been granted certain indemnification rights against certain liabilities that may arise out of performance of their duties to the Trust. Additionally, in the normal course of business, the Trust may enter into contracts with service providers that contain a variety of indemnification clauses. The Trust’s maximum exposure under these arrangements is dependent on future claims that may be made against the Fund and, therefore, cannot be estimated.
9. REDEMPTIONS IN-KIND
After the close of business on February 2, 2018, the Fund redeemed assets through an in-kind redemption. In the redemption transaction, the Fund issued securities with a value of $579,567,077 and cash in the amount of $20,646,313. The Fund recognized losses in the amount of $907,398 which are reflected on the Statement of Changes in Net Assets. The redemption in-kind by a shareholder of Administrator Class represented 13% of the Fund and are reflected on the Statement of Changes in Net Assets.
After the close of business on February 9, 2018, the Fund redeemed assets through an in-kind redemption. In the redemption transaction, the Fund issued securities with a value of $404,757,400 and cash in the amount of $13,121,572. The Fund recognized losses in the amount of $645,597 which are reflected on the Statement of Changes in Net Assets. The redemption in-kind by a shareholder of Administrator Class represented 10% of the Fund and are reflected on the Statement of Changes in Net Assets.
| | | | | | |
| Notes to financial statements (unaudited) | | Wells Fargo Ultra Short-Term Municipal Income Fund | | | 43 | |
10. NEW ACCOUNTING PRONOUNCEMENT
In August 2018, FASB issued Accounting Standards Update (“ASU”) No. 2018-13, Fair Value Measurement (Topic 820)Disclosure Framework—Changes to the Disclosure Requirements for Fair Value Measurement. ASU 2018-13 updates the disclosure requirements for fair value measurements by modifying or removing certain disclosures and adding certain new disclosures. The amendments are effective for fiscal years, and interim periods within those fiscal years, beginning after December 15, 2019. Early adoption is permitted. Management has adopted the removal and modification of disclosures early, as permitted, and will adopt the additional new disclosures at the effective date.
| | | | |
| 44 | | Wells Fargo Ultra Short-Term Municipal Income Fund | | Other information (unaudited) |
PROXY VOTING INFORMATION
A description of the policies and procedures used to determine how to vote proxies relating to portfolio securities is available, upon request, by calling1-800-222-8222, visiting our website atwellsfargofunds.com, or visiting the SEC website at sec.gov. Information regarding how the Fund voted proxies relating to portfolio securities during the most recent 12-month period ended June 30 is available on the Fund’s website atwellsfargofunds.comor by visiting the SEC website at sec.gov.
PORTFOLIO HOLDINGS INFORMATION
The complete portfolio holdings for the Fund are publicly available monthly on the Fund’s website (wellsfargofunds.com), on a one-month delayed basis. In addition, top ten holdings information (excluding derivative positions) for the Fund is publicly available on the Fund’s website on a monthly, seven-day or more delayed basis. The Fund files its complete schedule of portfolio holdings with the SEC for the first and third quarters of each fiscal year on Form N-Q, which is available by visiting the SEC website at sec.gov. In addition, the Fund’s Form N-Q may be reviewed and copied at the SEC’s Public Reference Room in Washington, DC, and at regional offices in New York City, at 233 Broadway, and in Chicago, at 175 West Jackson Boulevard, Suite 900. Information about the Public Reference Room may be obtained by calling 1-800-SEC-0330.
| | | | | | |
| Other information (unaudited) | | Wells Fargo Ultra Short-Term Municipal Income Fund | | | 45 | |
BOARD OF TRUSTEES AND OFFICERS
Each of the Trustees and Officers1 listed in the table below acts in identical capacities for each fund in the Wells Fargo family of funds, which consists of 152 mutual funds comprising the Wells Fargo Funds Trust, Wells Fargo Variable Trust, Wells Fargo Master Trust and four closed-end funds (collectively the “Fund Complex”). This table should be read in conjunction with the Prospectus and the Statement of Additional Information2. The mailing address of each Trustee and Officer is 525 Market Street, 12th Floor, San Francisco, CA 94105. Each Trustee and Officer serves an indefinite term, however, each Trustee serves such term until reaching the mandatory retirement age established by the Trustees.
Independent Trustees
| | | | | | |
Name and
year of birth | | Position held and
length of service* | | Principal occupations during past five years or longer | | Current other
public company or
investment company
directorships |
| | | |
William R. Ebsworth
(Born 1957) | | Trustee, since 2015 | | Retired. From 1984 to 2013, equities analyst, portfolio manager, research director and chief investment officer at Fidelity Management and Research Company in Boston, Tokyo, and Hong Kong, and retired in 2013 as Chief Investment Officer of Fidelity Strategic Advisers, Inc. where he led a team of investment professionals managing client assets. Prior thereto, Board member of Hong Kong Securities Clearing Co., Hong Kong Options Clearing Corp., the Thailand International Fund, Ltd., Fidelity Investments Life Insurance Company, and Empire Fidelity Investments Life Insurance Company. Board member of the Vincent Memorial Hospital Endowment (non-profit organization), where he serves on the Investment Committee and as a Chair of the Audit Committee. Mr. Ebsworth is a CFA® charterholder. | | N/A |
| | | |
Jane A. Freeman
(Born 1953) | | Trustee, since 2015; Chair Liaison, since 2018 | | Retired. From 2012 to 2014 and 1999 to 2008, Chief Financial Officer of Scientific Learning Corporation. From 2008 to 2012, Ms. Freeman provided consulting services related to strategic business projects. Prior to 1999, Portfolio Manager at Rockefeller & Co. and Scudder, Stevens & Clark. Board member of the Harding Loevner Funds from 1996 to 2014, serving as both Lead Independent Director and chair of the Audit Committee. Board member of the Russell Exchange Traded Funds Trust from 2011 to 2012 and the chair of the Audit Committee. Ms. Freeman is a Board Member of The Ruth Bancroft Garden (non-profit organization). She is also an inactive Chartered Financial Analyst. | | N/A |
| | | |
Isaiah Harris, Jr.3
(Born 1952) | | Trustee, since 2009; Audit Committee Chairman, since 2019 | | Retired. Chairman of the Board of CIGNA Corporation since 2009, and Director since 2005. From 2003 to 2011, Director of Deluxe Corporation. Prior thereto, President and CEO of BellSouth Advertising and Publishing Corp. from 2005 to 2007, President and CEO of BellSouth Enterprises from 2004 to 2005 and President of BellSouth Consumer Services from 2000 to 2003. Emeritus member of the Iowa State University Foundation Board of Governors. Emeritus Member of the Advisory Board of Iowa State University School of Business. Advisory Board Member, Palm Harbor Academy (private school). Advisory Board Member, Child Evangelism Fellowship (non-profit). Mr. Harris is a certified public accountant (inactive status). | | CIGNA Corporation |
| | | |
Judith M. Johnson3
(Born 1949) | | Trustee, since 2008; Audit Committee Chairman, from 2009 to 2018 | | Retired. Prior thereto, Chief Executive Officer and Chief Investment Officer of Minneapolis Employees Retirement Fund from 1996 to 2008. Ms. Johnson is an attorney, certified public accountant and a certified managerial accountant. | | N/A |
| | | |
David F. Larcker
(Born 1950) | | Trustee, since 2009 | | James Irvin Miller Professor of Accounting at the Graduate School of Business, Stanford University, Director of the Corporate Governance Research Initiative and Senior Faculty of The Rock Center for Corporate Governance since 2006. From 2005 to 2008, Professor of Accounting at the Graduate School of Business, Stanford University. Prior thereto, Ernst & Young Professor of Accounting at The Wharton School, University of Pennsylvania from 1985 to 2005. | | N/A |
| | | | |
| 46 | | Wells Fargo Ultra Short-Term Municipal Income Fund | | Other information (unaudited) |
| | | | | | |
Name and
year of birth | | Position held and
length of service* | | Principal occupations during past five years or longer | | Current other
public company or
investment company
directorships |
| | | |
Olivia S. Mitchell
(Born 1953) | | Trustee, since 2006; Nominating and Governance Committee Chairman, since 2018 | | International Foundation of Employee Benefit Plans Professor, Wharton School of the University of Pennsylvania since 1993. Director of Wharton’s Pension Research Council and Boettner Center on Pensions & Retirement Research, and Research Associate at the National Bureau of Economic Research. Previously, Cornell University Professor from 1978 to 1993. | | N/A |
| | | |
Timothy J. Penny
(Born 1951) | | Trustee, since 1996; Chairman, since 2018; Vice Chairman, from 2017 to 2018 | | President and Chief Executive Officer of Southern Minnesota Initiative Foundation, a non-profit organization, since 2007. Member of the Board of Trustees of NorthStar Education Finance, Inc., a non-profit organization, since 2007. | | N/A |
| | | |
James G. Polisson
(Born 1959) | | Trustee, since 2018; Advisory Board Member, from 2017 to 2018 | | Retired. Chief Marketing Officer, Source (ETF) UK Services, Ltd, from 2015 to 2017. From 2012 to 2015, Principal of The Polisson Group, LLC, a management consulting, corporate advisory and principal investing company. Chief Executive Officer and Managing Director at Russell Investments, Global Exchange Traded Funds from 2010 to 2012. Managing Director of Barclays Global Investors from 1998 to 2010 and Global Chief Marketing Officer for iShares and Barclays Global Investors from 2000 to 2010. Trustee of the San Francisco Mechanics’ Institute, a non-profit organization, from 2013 to 2015. Board member of the Russell Exchange Traded Fund Trust from 2011 to 2012. Director of Barclays Global Investors Holdings Deutschland GmbH from 2006 to 2009. Mr. Polisson is an attorney and has a retired status with the Massachusetts and District of Columbia Bar Associations. | | N/A |
| | | |
Michael S. Scofield4
(Born 1943) | | Trustee, since 2010 | | Served on the Investment Company Institute’s Board of Governors and Executive Committee from 2008-2011 as well the Governing Council of the Independent Directors Council from 2006-2011 and the Independent Directors Council Executive Committee from 2008-2011. Trustee of the Evergreen Fund complex (and its predecessors) from 1984 to 2010. Chairman of the Evergreen Funds from 2000-2010. Former Trustee of the Mentor Funds. Retired Attorney, Law Offices of Michael S. Scofield. | | N/A |
| | | |
Pamela Wheelock
(Born 1959) | | Trustee, since 2018; Advisory Board Member, from 2017 to 2018 | | Chief Operating Officer, Twin Cities Habitat for Humanity, since January, 2017. Vice President of University Services, University of Minnesota from 2012 to 2017. Prior thereto, on the Board of Directors, Governance Committee and Finance Committee for the Minnesota Philanthropy Partners (Saint Paul Foundation) from 2012 to 2018, Interim President and Chief Executive Officer of Blue Cross Blue Shield of Minnesota from 2010 to 2011, Chairman of the Board from 2009 to 2011 and Board Director from 2003 to 2015. Vice President, Leadership and Community Engagement, Bush Foundation, Saint Paul, Minnesota (a private foundation) from 2009 to 2011. Executive Vice President and Chief Financial Officer, Minnesota Sports and Entertainment from 2004 to 2009 and Senior Vice President from 2002 to 2004. Commissioner of Finance, State of Minnesota, from 1999 to 2002. Currently the Board Chair of the Minnesota Wild Foundation since 2010. | | N/A |
| * | Length of service dates reflect the Trustee’s commencement of service with the Trust’s predecessor entities, where applicable. |
| | | | | | |
| Other information (unaudited) | | Wells Fargo Ultra Short-Term Municipal Income Fund | | | 47 | |
Officers
| | | | | | |
Name and
year of birth | | Position held and length of service | | Principal occupations during past five years or longer | | |
| | | |
Andrew Owen
(Born 1960) | | President, since 2017 | | Executive Vice President of Wells Fargo & Company and Head of Affiliated Managers, Wells Fargo Asset Management, since 2014. In addition, Mr. Owen is currently President, Chief Executive Officer and Director of Wells Fargo Funds Management, LLC since 2017. Prior thereto, Executive Vice President responsible for marketing, investments and product development for Wells Fargo Funds Management, LLC, from 2009 to 2014. | | |
| | | |
Nancy Wiser1
(Born 1967) | | Treasurer, since 2012 | | Executive Vice President of Wells Fargo Funds Management, LLC since 2011. Chief Operating Officer and Chief Compliance Officer at LightBox Capital Management LLC, from 2008 to 2011. | | |
| | | |
Alexander Kymn
(Born 1973) | | Secretary, since 2018; Chief Legal Officer, since 2018 | | Senior Company Counsel of Wells Fargo Bank, N.A. since 2018 (previously Senior Counsel from 2007 to 2018). Vice President of Wells Fargo Funds Management, LLC from 2008 to 2014. | | |
| | | |
Michael H. Whitaker
(Born 1967) | | Chief Compliance Officer, since 2016 | | Senior Vice President and Chief Compliance Officer since 2016. Senior Vice President and Chief Compliance Officer for Fidelity Investments from 2007 to 2016. | | |
| | | |
David Berardi
(Born 1975) | | Assistant Treasurer, since 2009 | | Vice President of Wells Fargo Funds Management, LLC since 2009. Vice President of Evergreen Investment Management Company, LLC from 2008 to 2010. Manager of Fund Reporting and Control for Evergreen Investment Management Company, LLC from 2004 to 2010. | | |
| | | |
Jeremy DePalma1
(Born 1974) | | Assistant Treasurer, since 2009 | | Senior Vice President of Wells Fargo Funds Management, LLC since 2009. Senior Vice President of Evergreen Investment Management Company, LLC from 2008 to 2010 and head of the Fund Reporting and Control Team within Fund Administration from 2005 to 2010. | | |
| 1 | Nancy Wiser acts as Treasurer of 76 funds in the Fund Complex. Jeremy DePalma acts as Treasurer of 76 funds and Assistant Treasurer of 76 funds in the Fund Complex. |
| 2 | The Statement of Additional Information includes additional information about the Trustees and is available, without charge, upon request, by calling1-800-222-8222 or by visiting the website atwellsfargofunds.com. |
| 3 | Mr. Harris replaced Ms. Johnson as the Chairman of the Audit Committee effective January 1, 2019. |
| 4 | Mr. Scofield retired on December 31, 2018. |
| | | | |
| 48 | | Wells Fargo Ultra Short-Term Municipal Income Fund | | Appendix A (unaudited) |
SALES CHARGE REDUCTIONS AND WAIVERS FOR CERTAIN INTERMEDIARIES
Raymond James & Associates, Inc., Raymond James Financial Services & Raymond James affiliates (“Raymond James”)
Effective on or about March 1, 2019, shareholders purchasing Fund shares through a Raymond James platform or account will be eligible only for the following load waivers (front-end sales charge waivers and contingent deferred, or back-end, sales charge waivers) and discounts, which may differ from those disclosed elsewhere in the Fund’s Prospectus or SAI.
Front-end Sales Load Waivers on Class A shares Available at Raymond James
| | • | | Shares purchased in an investment advisory program. |
| | • | | Shares purchased through reinvestment of capital gains distributions and dividend reinvestment when purchasing shares of the same fund (but not any other fund within the fund family). |
| | • | | Employees and registered representatives of Raymond James or its affiliates and their family members as designated by Raymond James. |
| | • | | Shares purchased from the proceeds of redemptions within the same fund family, provided (1) the repurchase occurs within 90 days following the redemption, (2) the redemption and purchase occur in the same account, and (3) redeemed shares were subject to a front-end or deferred sales load (known as Rights of Reinstatement). |
| | • | | A shareholder in the fund’s Class C shares will have their shares automatically exchanged at net asset value to Class A shares (or the appropriate share class) of the fund if the shares are no longer subject to a CDSC and the exchange is in line with the policies and procedures of Raymond James. |
CDSC Waivers on Class A and C Shares Available at Raymond James
| | • | | Death or disability of the shareholder. |
| | • | | Shares sold as part of a systematic withdrawal plan as described in the Fund’s Prospectus. |
| | • | | Return of excess contributions from an IRA Account. |
| | • | | Shares sold as part of a required minimum distribution for IRA and retirement accounts due to the shareholder reaching age 70½ as described in the Fund’s prospectus. |
| | • | | Shares sold to pay Raymond James fees but only if the transaction is initiated by Raymond James. |
| | • | | Shares acquired through a right of reinstatement. |
Front-end Load Discounts Available at Raymond James: Breakpoints, and/or Rights of Accumulation
| | • | | Breakpoints as described in the Fund’s Prospectus. |
| | • | | Rights of accumulation which entitle shareholders to breakpoint discounts will be automatically calculated based on the aggregated holding of fund family assets held by accounts within the purchaser’s household at Raymond James. Eligible fund family assets not held at Raymond James may be included in the rights of accumulation calculation only if the shareholder notifies his or her financial advisor about such assets. |

For more information
More information about Wells Fargo Funds is available free upon request. To obtain literature, please write, visit the Fund’s website, or call:
Wells Fargo Funds
P.O. Box 219967
Kansas City, MO 64121-9967
Website: wellsfargofunds.com
Individual investors: 1-800-222-8222
Retail investment professionals: 1-888-877-9275
Institutional investment professionals:1-866-765-0778
This report and the financial statements contained herein are submitted for the general information of the shareholders of the Fund. If this report is used for promotional purposes, distribution of the report must be accompanied or preceded by a current prospectus. Before investing, please consider the investment objectives, risks, charges, and expenses of the investment. For a current prospectus and, if available, a summary prospectus, containing this information, call1-800-222-8222 or visit the Fund’s website atwellsfargofunds.com. Read the prospectus carefully before you invest or send money.
Wells Fargo Asset Management (WFAM) is the trade name for certain investment advisory/management firms owned by Wells Fargo & Company. These firms include but are not limited to Wells Capital Management Incorporated and Wells Fargo Funds Management, LLC. Certain products managed by WFAM entities are distributed by Wells Fargo Funds Distributor, LLC (a broker/dealer and Member FINRA).
This material is for general informational and educational purposes only and is NOT intended to provide investment advice or a recommendation of any kind—including a recommendation for any specific investment, strategy, or plan.
INVESTMENT PRODUCTS: NOT FDIC INSURED ◾ NO BANK GUARANTEE ◾ MAY LOSE VALUE
© 2019 Wells Fargo Funds Management, LLC. All rights reserved.
| | |
 | | 320453 02-19 SA258/SAR258 12-18 |
Semi-Annual Report
December 31, 2018

Wells Fargo Wisconsin Tax-Free Fund

Beginning on January 1, 2021, as permitted by new regulations adopted by the Securities and Exchange Commission, paper copies of the Wells Fargo Funds’ annual and semi-annual shareholder reports issued after this date will no longer be sent by mail, unless you specifically request paper copies of the reports. Instead, the reports will be made available on the Funds’ website, and you will be notified by mail each time a report is posted and provided with a website address to access the report.
If you already elected to receive shareholder reports electronically, you will not be affected by this change and you need not take any action. You may elect to receive shareholder reports and other communications from the Fund electronically at any time by contacting your financial intermediary (such as a broker-dealer or bank) or, if you are a direct investor, by calling 1-800-222-8222 or by enrolling at wellsfargo.com/advantagedelivery.
You may elect to receive all future reports in paper free of charge. If you invest through a financial intermediary, you can contact your financial intermediary to request that you continue to receive paper copies of your shareholder reports; if you invest directly with the Fund, you can call 1-800-222-8222. Your election to receive reports in paper will apply to all Wells Fargo Funds held in your account with your financial intermediary or, if you are a direct investor, to all Wells Fargo Funds that you hold.

Reduce clutter. Save trees.
Sign up for electronic delivery of prospectuses and shareholder reports atwellsfargo.com/advantagedelivery
Contents
The views expressed and any forward-looking statements are as of December 31, 2018, unless otherwise noted, and are those of the Fund managers and/or Wells Fargo Funds Management, LLC. Discussions of individual securities, or the markets generally, or any Wells Fargo Fund are not intended as individual recommendations. Future events or results may vary significantly from those expressed in any forward-looking statements. The views expressed are subject to change at any time in response to changing circumstances in the market. Wells Fargo Funds Management, LLC and the Fund disclaim any obligation to publicly update or revise any views expressed or forward-looking statements.
INVESTMENT PRODUCTS: NOT FDIC INSURED ◾ NO BANK GUARANTEE ◾ MAY LOSE VALUE
| | | | |
| 2 | | Wells Fargo Wisconsin Tax-Free Fund | | Letter to shareholders (unaudited) |

Andrew Owen
President
Wells Fargo Funds
Global trade tensions escalated during the third quarter of 2018.
Dear Shareholder:
We are pleased to offer you this semi-annual report for the Wells Fargo Wisconsin Tax-Free Fund for the six-month period that ended December 31, 2018. During the reporting period, the U.S. generated encouraging economic and business data that was offset by less positive and more inconsistent data from international markets. Investment returns were generally negative as geopolitical tensions and uncertainty tended to distract investors from more favorable underlying trends.
For the period, U.S. stocks, as measured by the S&P 500 Index,1 fell 6.85% and international stocks, as measured by the MSCI ACWI ex USA Index (Net),2 declined 10.84%. Based on the MSCI EM Index (Net),3 emerging market stocks lost 8.48%. For bond investors, the Bloomberg Barclays U.S. Aggregate Bond Index4 gained 1.65% while the Bloomberg Barclays Global Aggregate ex-USD Index5 fell 0.84%. The Bloomberg Barclays Municipal Bond Index6 gained 1.53% while the ICE BofAML U.S. High Yield Index7 declined 2.34%.
Global trade tensions prompted investor concerns.
Global trade tensions escalated during the third quarter of 2018. The U.S. imposed tariffs on a wide range of products manufactured overseas. Foreign governments retaliated with tariffs that punished U.S. commodity producers and product manufacturers. Investors wondered about next steps as divergence in global economic policies and growth prospects widened.
During the summer months, the U.S. economy strengthened. Revised second-quarter gross domestic product (GDP) growth data released in August showed the U.S. economy growing at a 4.2% rate. The unemployment rate in the U.S. was 3.7% by the end of September, according to the U.S. Department of Labor. Wages showed more consistent growth, and consumer confidence remained strong. Several U.S. equity market indices reached records during August, with the S&P 500 Index gaining 7.71% for the three-month period that ended September 30, 2018. In contrast, the MSCI ACWI ex USA Index (Net) gained 0.71% while the MSCI EM Index (Net) declined 1.09% during the same three-month period.
| 1 | The S&P 500 Index consists of 500 stocks chosen for market size, liquidity, and industry group representation. It is a market-value-weighted index with each stock’s weight in the index proportionate to its market value. You cannot invest directly in an index. |
| 2 | The Morgan Stanley Capital International (MSCI) All Country World Index (ACWI) ex USA Index (Net) is a free-float-adjusted market-capitalization-weighted index that is designed to measure the equity market performance of developed markets, excluding the United States and Canada. Source: MSCI. MSCI makes no express or implied warranties or representations and shall have no liability whatsoever with respect to any MSCI data contained herein. The MSCI data may not be further redistributed or used as a basis for other indices or any securities or financial products. This report is not approved, reviewed, or produced by MSCI. You cannot invest directly in an index. |
| 3 | The MSCI Emerging Markets (EM) Index (Net) is a free-float-adjusted market-capitalization-weighted index that is designed to measure large- and mid-cap equity market performance of emerging markets. The MSCI EM Index (Net) consists of the following 24 emerging market country indices: Brazil, Chile, China, Colombia, Czech Republic, Egypt, Greece, Hungary, India, Indonesia, Korea, Malaysia, Mexico, Pakistan, Peru, the Philippines, Poland, Qatar, Russia, South Africa, Taiwan, Thailand, Turkey, and the United Arab Emirates. You cannot invest directly in an index. |
| 4 | The Bloomberg Barclays U.S. Aggregate Bond Index is a broad-based benchmark that measures the investment-grade, U.S. dollar-denominated, fixed-rate taxable bond market, including Treasuries, government-related and corporate securities, mortgage-backed securities (agency fixed-rate and hybrid adjustable-rate mortgage pass-throughs), asset-backed securities, and commercial mortgage-backed securities. You cannot invest directly in an index. |
| 5 | The Bloomberg Barclays Global Aggregate ex-USD Index is an unmanaged index that provides a broad-based measure of the global investment-grade fixed-income markets excluding the U.S. dollar-denominated debt market. You cannot invest directly in an index. |
| 6 | The Bloomberg Barclays Municipal Bond Index is an unmanaged index composed of long-term tax-exempt bonds with a minimum credit rating of Baa. You cannot invest directly in an index. |
| 7 | The ICE BofAML U.S. High Yield Index is a market-capitalization-weighted index of domestic and Yankee high-yield bonds. The index tracks the performance of high-yield securities traded in the U.S. bond market. You cannot invest directly in an index. Copyright 2018. ICE Data Indices, LLC. All rights reserved. |
| | | | | | |
| Letter to shareholders (unaudited) | | Wells Fargo Wisconsin Tax-Free Fund | | | 3 | |
Economic signals overseas were mixed as the third quarter ended and the fourth quarter began. In particular, signs of slowing economic growth in China created uncertainty for investors. Amid rising trade tensions, the People’s Bank of China cut reserve requirement ratios and accelerated infrastructure spending and tax cuts for business enterprises and individuals. Nevertheless, a strengthening U.S. dollar and trade tensions remained headwinds for investors overseas.
Equity markets were volatile during the fourth quarter.
Negative stock market performance during October and December bracketed a mildly positive November, as measured by the S&P 500 Index and the MSCI ACWI ex USA Index (Net). As interest rates and bond yields gained during October, stock markets struggled. Readings on consumer sentiment and business spending were mixed. Markets rebounded in November. The U.S. and China agreed to halt further increases in tariffs and engage in additional negotiations. While November returns were positive, the loss for the full fourth quarter was substantial for equity investors globally, with the S&P down 13.52% and the MSCI ACWI ex USA Index (Net) down 11.46%. December’s S&P 500 Index performance was the lowest since 1931. Globally, fixed income investments fared better than stocks during the last two months of the year as conflicting signals unsettled investors’ outlooks.
Equity investors confronted a number of changing conditions. In November’s mid-term elections, control of the U.S. House of Representatives shifted from Republicans to Democrats, presaging potential partisan disputes. Progress on Brexit negotiations stalled in the UK. In China, the value of the yuan declined to low levels last seen in 2008. Oil prices continued to fall. The Fed increased the federal funds rate by 25 bps to a target range of between 2.25% and 2.50% in December 2018. A late-December dispute over spending and immigration policy resulted in a partial U.S. government shutdown that continued through the end of the period.
Don’t let short-term uncertainty derail long-term investment goals.
Periods of investment uncertainty can present challenges, but experience has taught us that maintaining long-term investment goals can be an effective way to plan for the future. To help you create a sound strategy based on your personal goals and risk tolerance, Wells Fargo Funds offers more than 100 mutual funds spanning a wide range of asset classes and investment styles. Although diversification cannot guarantee an investment profit or prevent losses, we believe it can be an effective way to manage investment risk and potentially smooth out overall portfolio performance. We encourage investors to know their investments and to understand that appropriate levels of risk-taking may unlock opportunities.
Thank you for choosing to invest with Wells Fargo Funds. We appreciate your confidence in us and remain committed to helping you meet your financial needs.
Sincerely,

Andrew Owen
President
Wells Fargo Funds
Economic signals overseas were mixed as the third quarter ended and the fourth quarter began.
For further information about your Fund, contact your investment professional, visit our website atwellsfargofunds.com, or call us directly at1-800-222-8222.
| | | | |
| 4 | | Wells Fargo Wisconsin Tax-Free Fund | | Performance highlights (unaudited) |
Investment objective
The Fund seeks current income exempt from federal income tax and Wisconsin individual income tax.
Manager
Wells Fargo Funds Management, LLC
Subadviser
Wells Capital Management Incorporated
Portfolio managers
Lyle J. Fitterer, CFA®‡, CPA
Bruce R. Johns
Thomas Stoeckmann
Average annual total returns (%) as of December 31, 2018
| | | | | | | | | | | | | | | | | | | | | | | | | | | | | | | | | | |
| | | | | Including sales charge | | | Excluding sales charge | | | Expense ratios1 (%) | |
| | | Inception date | | 1 year | | | 5 year | | | 10 year | | | 1 year | | | 5 year | | | 10 year | | | Gross | | | Net2 | |
| | | | | | | | | |
| Class A (WWTFX) | | 3-31-2008 | | | -3.06 | | | | 2.06 | | | | 3.43 | | | | 1.49 | | | | 3.00 | | | | 3.91 | | | | 0.88 | | | | 0.70 | |
| | | | | | | | | |
| Class C (WWTCX) | | 12-26-2002 | | | -0.27 | | | | 2.23 | | | | 3.12 | | | | 0.73 | | | | 2.23 | | | | 3.12 | | | | 1.63 | | | | 1.45 | |
| | | | | | | | | |
| Institutional Class (WWTIX)3 | | 10-31-2016 | | | – | | | | – | | | | – | | | | 1.67 | | | | 3.08 | | | | 3.95 | | | | 0.55 | | | | 0.52 | |
| | | | | | | | | |
| Bloomberg Barclays Municipal Bond Index4 | | – | | | – | | | | – | | | | – | | | | 1.28 | | | | 3.82 | | | | 4.85 | | | | – | | | | – | |
| | | | | | | | | |
| Bloomberg Barclays Wisconsin Municipal Bond Index5 | | – | | | – | | | | – | | | | – | | | | 1.32 | | | | 3.45 | | | | 4.73 | | | | – | | | | – | |
Figures quoted represent past performance, which is no guarantee of future results, and do not reflect taxes that a shareholder may pay on fund distributions or the redemption of fund shares. Investment return and principal value of an investment will fluctuate so that an investor’s shares, when redeemed, may be worth more or less than their original cost. Performance shown without sales charges would be lower if sales charges were reflected. Current performance may be lower or higher than the performance data quoted, which assumes the reinvestment of dividends and capital gains. Current month-end performance is available on the Fund’s website, wellsfargofunds.com.
Index returns do not include transaction costs associated with buying and selling securities, any mutual fund fees or expenses, or any taxes. It is not possible to invest directly in an index.
For Class A shares, the maximum front-end sales charge is 4.50%. For Class C shares, the maximum contingent deferred sales charge is 1.00%. Performance including a contingent deferred sales charge assumes the sales charge for the corresponding time period. Institutional Class shares are sold without a front-end sales charge or contingent deferred sales charge.
Bond values fluctuate in response to the financial condition of individual issuers, general market and economic conditions, and changes in interest rates. Changes in market conditions and government policies may lead to periods of heightened volatility in the bond market and reduced liquidity for certain bonds held by the Fund. In general, when interest rates rise, bond values fall and investors may lose principal value. Interest rate changes and their impact on the Fund and its share price can be sudden and unpredictable. The use of derivatives may reduce returns and/or increase volatility. Certain investment strategies tend to increase the total risk of an investment (relative to the broader market). The Fund is exposed to Wisconsin and Puerto Rico municipal securities risk and high-yield securities, and non-diversification risk. Consult the Fund’s prospectus for additional information on these and other risks. A portion of the Fund’s income may be subject to federal, state, and/or local income taxes or the Alternative Minimum Tax (AMT). Any capital gains distributions may be taxable.
Please see footnotes on page 5.
| | | | | | |
| Performance highlights (unaudited) | | Wells Fargo Wisconsin Tax-Free Fund | | | 5 | |
|
| Effective maturity distribution as of December 31, 20186 |
|
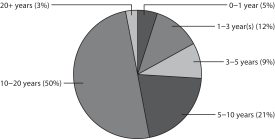 |
|
| Credit quality as of December 31, 20187 |
|
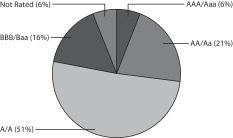 |
| ‡ | CFA® and Chartered Financial Analyst® are trademarks owned by CFA Institute. |
| 1 | Reflects the expense ratios as stated in the most recent prospectuses. The expense ratios shown are subject to change and may differ from the annualized expense ratios shown in the financial highlights of this report. |
| 2 | The manager has contractually committed through October 31, 2019, to waive fees and/or reimburse expenses to the extent necessary to cap the Fund’s Total Annual Fund Operating Expenses After Fee Waivers at the amounts shown. After this time, the cap may be increased or the commitment to maintain the cap may be terminated only with the approval of the Board of Trustees. Brokerage commissions, stamp duty fees, interest, taxes, acquired fund fees and expenses (if any), and extraordinary expenses are excluded from the expense cap. Without this cap, the Fund’s returns would have been lower. The expense ratio paid by an investor is the net expense ratio (the total annual fund operating expenses after fee waivers) as stated in the prospectuses. |
| 3 | Historical performance shown for the Institutional Class shares prior to their inception reflects the performance of the Class A shares, and is not adjusted to reflect Institutional Class expenses. If these expenses had been included, returns for Institutional Class would be higher. |
| 4 | The Bloomberg Barclays Municipal Bond Index is an unmanaged index composed of long-term tax-exempt bonds with a minimum credit rating of Baa. You cannot invest directly in an index. |
| 5 | The Bloomberg Barclays Wisconsin Municipal Bond Index is the Wisconsin component of the Bloomberg Barclays Municipal Bond Index. You cannot invest directly in an index. |
| 6 | Amounts are calculated based on the total long-term investments of the Fund. These amounts are subject to change and may have changed since the date specified. |
| 7 | The credit quality distribution of portfolio holdings reflected in the chart is based on ratings from Standard & Poor’s, Moody’s Investors Service, and/ or Fitch Ratings Ltd. Credit quality ratings apply to the underlying holdings of the Fund and not to the Fund itself. The percentages of the Fund’s portfolio with the ratings depicted in the chart are calculated based on the total market value of fixed income securities held by the Fund. If a security was rated by all three rating agencies, the middle rating was utilized. If rated by two of three rating agencies, the lower rating was utilized, and if rated by one of the rating agencies, that rating was utilized. Standard & Poor’s rates the creditworthiness of bonds, ranging from AAA (highest) to D (lowest). Ratings from A to CCC may be modified by the addition of a plus (+) or minus (-) sign to show relative standing within the rating categories. Standard & Poor’s rates the creditworthiness of short-term notes from SP-1 (highest) to SP-3 (lowest). Moody’s rates the creditworthiness of bonds, ranging from Aaa (highest) to C (lowest). Ratings Aa to B may be modified by the addition of a number 1 (highest) to 3 (lowest) to show relative standing within the ratings categories. Moody’s rates the creditworthiness of short-term U.S. tax-exempt municipal securities from MIG 1/VMIG 1 (highest) to SG (lowest). Fitch rates the creditworthiness of bonds, ranging from AAA (highest) to D (lowest). Credit quality distribution is subject to change and may have changed since the date specified. |
| | | | |
| 6 | | Wells Fargo Wisconsin Tax-Free Fund | | Fund expenses (unaudited) |
As a shareholder of the Fund, you incur two types of costs: (1) transaction costs, including sales charges (loads) on purchase payments and contingent deferred sales charges (if any) on redemptions and (2) ongoing costs, including management fees, distribution (12b-1) and/or shareholder servicing fees, and other Fund expenses. This example is intended to help you understand your ongoing costs (in dollars) of investing in the Fund and to compare these costs with the ongoing costs of investing in other mutual funds.
The example is based on an investment of $1,000 invested at the beginning of the six-month period and held for the entire period from July 1, 2018 to December 31, 2018.
Actual expenses
The “Actual” line of the table below provides information about actual account values and actual expenses. You may use the information in this line, together with the amount you invested, to estimate the expenses that you paid over the period. Simply divide your account value by $1,000 (for example, an $8,600 account value divided by $1,000 = 8.6), then multiply the result by the number in the “Actual” line under the heading entitled “Expenses paid during period” for your applicable class of shares to estimate the expenses you paid on your account during this period.
Hypothetical example for comparison purposes
The “Hypothetical” line of the table below provides information about hypothetical account values and hypothetical expenses based on the Fund’s actual expense ratio and an assumed rate of return of 5% per year before expenses, which is not the Fund’s actual return. The hypothetical account values and expenses may not be used to estimate the actual ending account balance or expenses you paid for the period. You may use this information to compare the ongoing costs of investing in the Fund and other funds. To do so, compare this 5% hypothetical example with the 5% hypothetical examples that appear in the shareholder reports of the other funds.
Please note that the expenses shown in the table are meant to highlight your ongoing costs only and do not reflect any transactional costs, such as sales charges (loads) and contingent deferred sales charges. Therefore, the “Hypothetical” line of the table is useful in comparing ongoing costs only and will not help you determine the relative total costs of owning different funds. In addition, if these transactional costs were included, your costs would have been higher.
| | | | | | | | | | | | | | | | |
| | | Beginning
account value
7-1-2018 | | | Ending
account value
12-31-2018 | | | Expenses
paid during
the period¹ | | | Annualized net
expense ratio | |
Class A | | | | | | | | | | | | | | | | |
| | | | |
Actual | | $ | 1,000.00 | | | $ | 1,014.52 | | | $ | 3.55 | | | | 0.70 | % |
| | | | |
Hypothetical (5% return before expenses) | | $ | 1,000.00 | | | $ | 1,021.68 | | | $ | 3.57 | | | | 0.70 | % |
Class C | | | | | | | | | | | | | | | | |
| | | | |
Actual | | $ | 1,000.00 | | | $ | 1,010.70 | | | $ | 7.35 | | | | 1.45 | % |
| | | | |
Hypothetical (5% return before expenses) | | $ | 1,000.00 | | | $ | 1,017.90 | | | $ | 7.38 | | | | 1.45 | % |
Institutional Class | | | | | | | | | | | | | | | | |
| | | | |
Actual | | $ | 1,000.00 | | | $ | 1,015.44 | | | $ | 2.64 | | | | 0.52 | % |
| | | | |
Hypothetical (5% return before expenses) | | $ | 1,000.00 | | | $ | 1,022.58 | | | $ | 2.65 | | | | 0.52 | % |
| 1 | Expenses paid is equal to the annualized net expense ratio of each class multiplied by the average account value over the period, multiplied by the number of days in the most recent fiscal half-year divided by the number of days in the fiscal year (to reflect the one-half-year period). |
| | | | | | |
| Portfolio of investments—December 31, 2018 (unaudited) | | Wells Fargo Wisconsin Tax-Free Fund | | | 7 | |
| | | | | | | | | | | | | | | | |
| Security name | | Interest rate | | | Maturity date | | | Principal | | | Value | |
| | | | |
Municipal Obligations: 98.20% | | | | | | | | | | | | | | | | |
| | | | |
Guam: 4.57% | | | | | | | | | | | | | | | | |
| | | | |
| Airport Revenue: 2.55% | | | | | | | | | | | | | | | | |
| | | | |
Guam International Airport Authority Series C (AGM Insured) | | | 6.13 | % | | | 10-1-2043 | | | $ | 1,500,000 | | | $ | 1,715,753 | |
| | | | |
Guam Port Authority AMT Series A | | | 5.00 | | | | 7-1-2048 | | | | 1,000,000 | | | | 1,087,410 | |
| | | | |
Guam Port Authority AMT Series B | | | 5.00 | | | | 7-1-2034 | | | | 445,000 | | | | 482,794 | |
| |
| | | | 3,285,957 | |
| | | | | | | | | | | | | | | | |
| | | | |
| Miscellaneous Revenue: 1.61% | | | | | | | | | | | | | | | | |
| | | | |
Guam Government Limited Obligation Bonds Section 30 Series A | | | 5.38 | | | | 12-1-2024 | | | | 1,000,000 | | | | 1,032,520 | |
| | | | |
Guam Government Limited Obligation Bonds Section 30 Series A | | | 5.50 | | | | 12-1-2019 | | | | 1,000,000 | | | | 1,033,640 | |
| |
| | | | 2,066,160 | |
| | | | | | | | | | | | | | | | |
| | | | |
| Utilities Revenue: 0.41% | | | | | | | | | | | | | | | | |
| | | | |
Guam Power Authority Series A (AGM Insured) | | | 5.00 | | | | 10-1-2020 | | | | 500,000 | | | | 524,515 | |
| | | | | | | | | | | | | | | | |
| |
| | | | 5,876,632 | |
| | | | | | | | | | | | | | | | |
| | | | |
Illinois: 4.28% | | | | | | | | | | | | | | | | |
| | | | |
| GO Revenue: 3.22% | | | | | | | | | | | | | | | | |
| | | | |
Chicago IL CAB City Colleges (National Insured) (z) | | | 4.46 | | | | 1-1-2027 | | | | 1,000,000 | | | | 734,340 | |
| | | | |
Chicago IL Park District Special Recreation Activity Series E | | | 5.00 | | | | 11-15-2027 | | | | 1,000,000 | | | | 1,118,370 | |
| | | | |
Chicago IL Series A | | | 5.00 | | | | 1-1-2027 | | | | 1,700,000 | | | | 1,770,805 | |
| | | | |
Illinois Refunding Bond Series 2018A | | | 5.00 | | | | 10-1-2021 | | | | 500,000 | | | | 522,105 | |
| |
| | | | 4,145,620 | |
| | | | | | | | | | | | | | | | |
| | | | |
| Miscellaneous Revenue: 0.21% | | | | | | | | | | | | | | | | |
| | | | |
Illinois | | | 5.50 | | | | 7-1-2026 | | | | 250,000 | | | | 269,013 | |
| | | | | | | | | | | | | | | | |
| | | | |
| Tax Revenue: 0.78% | | | | | | | | | | | | | | | | |
| | | | |
Metropolitan Pier & Exposition Authority McCormick Place Expansion Project Series B | | | 5.00 | | | | 12-15-2028 | | | | 970,000 | | | | 1,003,475 | |
| | | | | | | | | | | | | | | | |
| | | | |
| Water & Sewer Revenue: 0.07% | | | | | | | | | | | | | | | | |
| | | | |
Chicago IL Waterworks Unrefunded Bond (AGM Insured) | | | 5.00 | | | | 11-1-2020 | | | | 95,000 | | | | 95,254 | |
| | | | | | | | | | | | | | | | |
| |
| | | | 5,513,362 | |
| | | | | | | | | | | | | | | | |
| | | | |
Michigan: 0.09% | | | | | | | | | | | | | | | | |
| | | | |
| Miscellaneous Revenue: 0.09% | | | | | | | | | | | | | | | | |
| | | | |
Michigan Municipal Bond Authority Local Government Loan Program Series A (Ambac Insured) | | | 4.00 | | | | 11-1-2021 | | | | 110,000 | | | | 109,998 | |
| | | | | | | | | | | | | | | | |
| | | | |
New Jersey: 1.76% | | | | | | | | | | | | | | | | |
| | | | |
| Miscellaneous Revenue: 0.87% | | | | | | | | | | | | | | | | |
| | | | |
New Jersey EDA Series EE | | | 5.00 | | | | 9-1-2023 | | | | 1,070,000 | | | | 1,121,521 | |
| | | | | | | | | | | | | | | | |
| | | | |
| Transportation Revenue: 0.89% | | | | | | | | | | | | | | | | |
| | | | |
New Jersey TTFA CAB Series A (z) | | | 5.85 | | | | 12-15-2031 | | | | 2,000,000 | | | | 1,144,080 | |
| | | | | | | | | | | | | | | | |
| |
| | | | 2,265,601 | |
| | | | | | | | | | | | | | | | |
The accompanying notes are an integral part of these financial statements.
| | | | |
| 8 | | Wells Fargo Wisconsin Tax-Free Fund | | Portfolio of investments—December 31, 2018 (unaudited) |
| | | | | | | | | | | | | | | | |
| Security name | | Interest rate | | | Maturity date | | | Principal | | | Value | |
| | | | |
New York: 0.70% | | | | | | | | | | | | | | | | |
| | | | |
| Education Revenue: 0.70% | | | | | | | | | | | | | | | | |
| | | | |
Hempstead NY Local Development Corporation The Academy Charter School Project Series A | | | 6.24 | % | | | 2-1-2047 | | | $ | 1,000,000 | | | $ | 905,960 | |
| | | | | | | | | | | | | | | | |
| | | | |
Puerto Rico: 1.04% | | | | | | | | | | | | | | | | |
| | | | |
| Transportation Revenue: 1.04% | | | | | | | | | | | | | | | | |
| | | | |
Puerto Rico Highway & Transportation Authority Refunding Bond Series L (AGC Insured) | | | 5.25 | | | | 7-1-2019 | | | | 1,000,000 | | | | 1,011,900 | |
| | | | |
Puerto Rico Highway & Transportation Authority Refunding Bond Series L (BHAC/FGIC Insured) | | | 5.25 | | | | 7-1-2021 | | | | 300,000 | | | | 321,714 | |
| |
| | | | 1,333,614 | |
| | | | | | | | | | | | | | | | |
| | | | |
Texas: 1.59% | | | | | | | | | | | | | | | | |
| | | | |
| GO Revenue: 1.59% | | | | | | | | | | | | | | | | |
| | | | |
Denton Texas Independent School District School Building | | | 4.00 | | | | 8-15-2048 | | | | 2,000,000 | | | | 2,044,860 | |
| | | | | | | | | | | | | | | | |
| | | | |
Virgin Islands: 3.88% | | | | | | | | | | | | | | | | |
| | | | |
| Miscellaneous Revenue: 2.29% | | | | | | | | | | | | | | | | |
| | | | |
Virgin Islands PFA 144A | | | 5.00 | | | | 9-1-2020 | | | | 750,000 | | | | 774,473 | |
| | | | |
Virgin Islands PFA Gross Receipts Taxes Loan Notes (National Insured) | | | 4.00 | | | | 10-1-2020 | | | | 450,000 | | | | 452,709 | |
| | | | |
Virgin Islands PFA Gross Receipts Taxes Loan Notes (AGM Insured) | | | 4.00 | | | | 10-1-2022 | | | | 1,690,000 | | | | 1,719,051 | |
| |
| | | | 2,946,233 | |
| | | | | | | | | | | | | | | | |
| | | | |
| Tax Revenue: 1.59% | | | | | | | | | | | | | | | | |
| | | | |
Virgin Islands PFA Matching Fund Loan Notes Senior Lien Series B (AGM Insured) | | | 5.00 | | | | 10-1-2025 | | | | 2,000,000 | | | | 2,044,060 | |
| | | | | | | | | | | | | | | | |
| |
| | | | 4,990,293 | |
| | | | | | | | | | | | | | | | |
| | | | |
Wisconsin: 80.29% | | | | | | | | | | | | | | | | |
| | | | |
| Education Revenue: 11.61% | | | | | | | | | | | | | | | | |
| | | | |
Green Bay WI Housing Authority University Village Housing Incorporated | | | 4.38 | | | | 4-1-2022 | | | | 200,000 | | | | 202,328 | |
| | | | |
Green Bay WI Housing Authority University Village Housing Incorporated | | | 5.00 | | | | 4-1-2030 | | | | 1,410,000 | | | | 1,438,792 | |
| | | | |
Madison WI CDA Wisconsin Alumni Research Foundation | | | 5.00 | | | | 10-1-2023 | | | | 150,000 | | | | 153,473 | |
| | | | |
Madison WI CDA Wisconsin Alumni Research Foundation | | | 5.00 | | | | 10-1-2025 | | | | 475,000 | | | | 485,996 | |
| | | | |
Madison WI CDA Wisconsin Alumni Research Foundation | | | 5.00 | | | | 10-1-2039 | | | | 5,000,000 | | | | 5,106,400 | |
| | | | |
Milwaukee WI RDA Milwaukee School of Engineering Project (AGM Insured) | | | 2.75 | | | | 4-1-2021 | | | | 1,080,000 | | | | 1,094,580 | |
| | | | |
Milwaukee WI RDA Milwaukee School of Engineering Project (AGM Insured) | | | 4.10 | | | | 4-1-2032 | | | | 1,500,000 | | | | 1,545,900 | |
| | | | |
Milwaukee WI RDA Science Education Consortium Incorporated Project Series A | | | 6.25 | | | | 8-1-2043 | | | | 2,100,000 | | | | 2,256,702 | |
| | | | |
Platteville WI RDA University of Wisconsin Platteville Real Estate Foundation Incorporated | | | 5.00 | | | | 7-1-2022 | | | | 1,065,000 | | | | 1,104,671 | |
| | | | |
Platteville WI RDA University of Wisconsin Platteville Real Estate Foundation Incorporated | | | 5.00 | | | | 7-1-2032 | | | | 1,500,000 | | | | 1,545,015 | |
| |
| | | | 14,933,857 | |
| | | | | | | | | | | | | | | | |
| | | | |
| GO Revenue: 1.90% | | | | | | | | | | | | | | | | |
| | | | |
Milwaukee WI Series B6 | | | 2.00 | | | | 4-1-2021 | | | | 175,000 | | | | 175,382 | |
| | | | |
Milwaukee WI Series B6 | | | 3.00 | | | | 4-1-2024 | | | | 570,000 | | | | 595,052 | |
| | | | |
Milwaukee WI Series B6 | | | 5.00 | | | | 4-1-2022 | | | | 350,000 | | | | 383,509 | |
| | | | |
Milwaukee WI Series B6 | | | 5.00 | | | | 4-1-2023 | | | | 580,000 | | | | 650,453 | |
| | | | |
Milwaukee WI Series B6 | | | 5.00 | | | | 4-1-2025 | | | | 550,000 | | | | 641,119 | |
| |
| | | | 2,445,515 | |
| | | | | | | | | | | | | | | | |
The accompanying notes are an integral part of these financial statements.
| | | | | | |
| Portfolio of investments—December 31, 2018 (unaudited) | | Wells Fargo Wisconsin Tax-Free Fund | | | 9 | |
| | | | | | | | | | | | | | | | |
| Security name | | Interest rate | | | Maturity date | | | Principal | | | Value | |
| | | | |
| Health Revenue: 13.98% | | | | | | | | | | | | | | | | |
| | | | |
University Wisconsin Hospital and Clinics Authority Revenue Various Refunding Bond Series B (JPMorgan Chase & Company SPA) ø | | | 1.72 | % | | | 4-1-2048 | | | $ | 1,000,000 | | | $ | 1,000,000 | |
| | | | |
University Wisconsin Hospital and Clinics Authority Revenue Various Refunding Bond Series C (BMO Harris Bank NA SPA) ø | | | 1.70 | | | | 4-1-2048 | | | | 2,000,000 | | | | 2,000,000 | |
| | | | |
Wisconsin HEFA Bellin Memorial Hospital Obligated Group | | | 4.00 | | | | 12-1-2035 | | | | 1,000,000 | | | | 1,034,410 | |
| | | | |
Wisconsin HEFA Bellin Memorial Hospital Obligated Group | | | 5.00 | | | | 12-1-2025 | | | | 1,500,000 | | | | 1,687,035 | |
| | | | |
Wisconsin HEFA Bellin Memorial Hospital Obligated Group | | | 5.00 | | | | 12-1-2026 | | | | 1,740,000 | | | | 1,955,099 | |
| | | | |
Wisconsin HEFA Bellin Memorial Hospital Obligated Group (Ambac Insured) | | | 5.50 | | | | 2-15-2019 | | | | 15,000 | | | | 15,062 | |
| | | | |
Wisconsin HEFA Marshfield Clinic Health System Obligated Group Series C | | | 5.00 | | | | 2-15-2020 | | | | 850,000 | | | | 877,617 | |
| | | | |
Wisconsin HEFA Marshfield Clinic Health System Obligated Group Series C | | | 5.00 | | | | 2-15-2027 | | | | 400,000 | | | | 462,228 | |
| | | | |
Wisconsin HEFA Marshfield Clinic Health System Obligated Group Series C | | | 5.00 | | | | 2-15-2028 | | | | 650,000 | | | | 747,559 | |
| | | | |
Wisconsin HEFA Marshfield Clinic Health System Obligated Group Series C | | | 5.00 | | | | 2-15-2029 | | | | 500,000 | | | | 570,005 | |
| | | | |
Wisconsin HEFA Monroe Clinic Incorporated | | | 3.00 | | | | 2-15-2035 | | | | 520,000 | | | | 540,914 | |
| | | | |
Wisconsin HEFA Monroe Clinic Incorporated | | | 4.00 | | | | 2-15-2031 | | | | 900,000 | | | | 992,808 | |
| | | | |
Wisconsin HEFA Monroe Clinic Incorporated | | | 4.00 | | | | 2-15-2033 | | | | 550,000 | | | | 606,716 | |
| | | | |
Wisconsin HEFA Monroe Clinic Incorporated | | | 5.00 | | | | 2-15-2028 | | | | 880,000 | | | | 1,024,452 | |
| | | | |
Wisconsin HEFA Monroe Clinic Incorporated | | | 5.00 | | | | 2-15-2029 | | | | 575,000 | | | | 669,386 | |
| | | | |
Wisconsin HEFA Monroe Clinic Incorporated | | | 5.00 | | | | 2-15-2030 | | | | 300,000 | | | | 349,245 | |
| | | | |
Wisconsin HEFA Rogers Memorial Hospital Incorporated Series B | | | 5.00 | | | | 7-1-2044 | | | | 3,250,000 | | | | 3,458,325 | |
| |
| | | | 17,990,861 | |
| | | | | | | | | | | | | | | | |
| | | | |
| Housing Revenue: 11.81% | | | | | | | | | | | | | | | | |
| | | | |
Wisconsin Housing & EDA AMT Series A | | | 4.63 | | | | 11-1-2037 | | | | 25,000 | | | | 25,014 | |
| | | | |
Wisconsin Housing & EDA Madison Pool Project Series A | | | 4.55 | | | | 7-1-2037 | | | | 165,000 | | | | 171,843 | |
| | | | |
Wisconsin Housing & EDA Madison Pool Project Series A | | | 4.70 | | | | 7-1-2047 | | | | 2,300,000 | | | | 2,379,787 | |
| | | | |
Wisconsin Housing & EDA Madison Pool Project Series A | | | 4.85 | | | | 7-1-2052 | | | | 3,000,000 | | | | 3,088,380 | |
| | | | |
Wisconsin Housing & EDA Series A | | | 1.55 | | | | 12-1-2019 | | | | 55,000 | | | | 54,847 | |
| | | | |
Wisconsin Housing & EDA Series A | | | 1.95 | | | | 12-1-2020 | | | | 55,000 | | | | 55,020 | |
| | | | |
Wisconsin Housing & EDA Series A | | | 3.00 | | | | 5-1-2022 | | | | 100,000 | | | | 102,293 | |
| | | | |
Wisconsin Housing & EDA Series A | | | 3.00 | | | | 11-1-2022 | | | | 125,000 | | | | 128,140 | |
| | | | |
Wisconsin Housing & EDA Series A | | | 3.40 | | | | 11-1-2032 | | | | 2,450,000 | | | | 2,453,259 | |
| | | | |
Wisconsin Housing & EDA Series A | | | 3.95 | | | | 11-1-2038 | | | | 2,000,000 | | | | 2,008,800 | |
| | | | |
Wisconsin Housing & EDA Series A | | | 4.05 | | | | 12-1-2049 | | | | 800,000 | | | | 802,808 | |
| | | | |
Wisconsin Housing & EDA Series A | | | 5.75 | | | | 11-1-2043 | | | | 2,835,000 | | | | 2,906,867 | |
| | | | |
Wisconsin Housing & EDA Series C | | | 3.88 | | | | 11-1-2035 | | | | 1,000,000 | | | | 1,016,530 | |
| |
| | | | 15,193,588 | |
| | | | | | | | | | | | | | | | |
| | | | |
| Miscellaneous Revenue: 22.14% | | | | | | | | | | | | | | | | |
| | | | |
Brookfield WI Community Development & RDA Series A | | | 1.35 | | | | 6-1-2019 | | | | 750,000 | | | | 747,045 | |
| | | | |
Cudahy WI CDA Series A | | | 1.75 | | | | 6-1-2019 | | | | 300,000 | | | | 299,553 | |
| | | | |
Cudahy WI CDA Series A | | | 1.95 | | | | 6-1-2019 | | | | 145,000 | | | | 145,004 | |
| | | | |
Cudahy WI CDA Series C | | | 1.05 | | | | 6-1-2019 | | | | 125,000 | | | | 124,305 | |
| | | | |
Glendale WI CDA Bayshore Public Parking | | | 1.50 | | | | 10-1-2019 | | | | 375,000 | | | | 373,020 | |
| | | | |
Kaukauna WI RDA | | | 3.75 | | | | 6-1-2032 | | | | 850,000 | | | | 864,535 | |
| | | | |
Kaukauna WI RDA | | | 4.00 | | | | 6-1-2019 | | | | 50,000 | | | | 50,431 | |
| | | | |
Kaukauna WI RDA | | | 4.00 | | | | 6-1-2020 | | | | 100,000 | | | | 102,852 | |
| | | | |
Kaukauna WI RDA | | | 4.00 | | | | 6-1-2021 | | | | 310,000 | | | | 322,657 | |
| | | | |
Kaukauna WI RDA | | | 4.00 | | | | 6-1-2022 | | | | 235,000 | | | | 247,714 | |
| | | | |
Kaukauna WI RDA | | | 4.00 | | | | 6-1-2023 | | | | 200,000 | | | | 213,314 | |
The accompanying notes are an integral part of these financial statements.
| | | | |
| 10 | | Wells Fargo Wisconsin Tax-Free Fund | | Portfolio of investments—December 31, 2018 (unaudited) |
| | | | | | | | | | | | | | | | |
| Security name | | Interest rate | | | Maturity date | | | Principal | | | Value | |
| | | | |
| Miscellaneous Revenue(continued) | | | | | | | | | | | | | | | | |
| | | | |
Kaukauna WI RDA | | | 4.00 | % | | | 6-1-2025 | | | $ | 425,000 | | | $ | 459,136 | |
| | | | |
Kaukauna WI RDA | | | 4.00 | | | | 6-1-2028 | | | | 425,000 | | | | 451,397 | |
| | | | |
Kaukauna WI RDA | | | 4.00 | | | | 6-1-2035 | | | | 900,000 | | | | 931,905 | |
| | | | |
Milwaukee WI RDA Lease Public Schools Series | | | 5.00 | | | | 11-15-2033 | | | | 750,000 | | | | 848,775 | |
| | | | |
Milwaukee WI RDA Lease Public Schools Series A | | | 5.00 | | | | 11-15-2026 | | | | 220,000 | | | | 259,222 | |
| | | | |
Milwaukee WI RDA Milwaukee Public Schools | | | 5.00 | | | | 11-15-2034 | | | | 675,000 | | | | 760,887 | |
| | | | |
Milwaukee WI RDA Milwaukee Public Schools | | | 5.00 | | | | 11-15-2035 | | | | 1,000,000 | | | | 1,125,010 | |
| | | | |
Milwaukee WI RDA Milwaukee Public Schools | | | 5.00 | | | | 11-15-2036 | | | | 500,000 | | | | 560,660 | |
| | | | |
Milwaukee WI RDA Milwaukee Public Schools Series A | | | 5.00 | | | | 11-15-2027 | | | | 1,020,000 | | | | 1,186,025 | |
| | | | |
Milwaukee WI RDA Milwaukee Public Schools Series A | | | 5.00 | | | | 11-15-2028 | | | | 1,000,000 | | | | 1,156,630 | |
| | | | |
Milwaukee WI RDA Milwaukee Public Schools Series A | | | 5.00 | | | | 11-15-2031 | | | | 750,000 | | | | 853,260 | |
| | | | |
Milwaukee WI RDA Public Schools Series A | | | 5.00 | | | | 8-1-2019 | | | | 915,000 | | | | 931,424 | |
| | | | |
Milwaukee WI RDA Public Schools Series A | | | 5.00 | | | | 8-1-2020 | | | | 1,100,000 | | | | 1,152,569 | |
| | | | |
Milwaukee WI RDA Public Schools Series A | | | 5.00 | | | | 8-1-2021 | | | | 3,330,000 | | | | 3,573,623 | |
| | | | |
Milwaukee WI RDA Summer Festival Project | | | 4.60 | | | | 8-1-2024 | | | | 870,000 | | | | 880,649 | |
| | | | |
Milwaukee WI RDA Summer Festival Project | | | 4.70 | | | | 8-1-2025 | | | | 110,000 | | | | 111,397 | |
| | | | |
Milwaukee WI RDA Summer Festival Project | | | 5.00 | | | | 8-1-2030 | | | | 5,000,000 | | | | 5,072,300 | |
| | | | |
Prairie du Chien WI RDA Series B | | | 1.65 | | | | 9-1-2020 | | | | 200,000 | | | | 198,034 | |
| | | | |
Warrens WI CDA Economic Improvements | | | 5.10 | | | | 11-1-2020 | | | | 70,000 | | | | 65,712 | |
| | | | |
Weston WI CDA Series A | | | 1.40 | | | | 10-1-2019 | | | | 625,000 | | | | 619,769 | |
| | | | |
Weston WI CDA Series A | | | 1.50 | | | | 10-1-2020 | | | | 500,000 | | | | 491,180 | |
| | | | |
Weston WI CDA Series A | | | 1.60 | | | | 10-1-2021 | | | | 340,000 | | | | 331,371 | |
| | | | |
Weston WI CDA Series A | | | 1.75 | | | | 10-1-2022 | | | | 200,000 | | | | 193,876 | |
| | | | |
Weston WI CDA Series A | | | 1.90 | | | | 10-1-2023 | | | | 100,000 | | | | 97,179 | |
| | | | |
Weston WI CDA Series A | | | 2.00 | | | | 10-1-2024 | | | | 625,000 | | | | 606,088 | |
| | | | |
Weston WI CDA Series A | | | 2.15 | | | | 10-1-2025 | | | | 615,000 | | | | 598,026 | |
| | | | |
Weston WI CDA Series A | | | 2.25 | | | | 10-1-2026 | | | | 940,000 | | | | 928,109 | |
| | | | |
Weston WI CDA Series A | | | 2.40 | | | | 10-1-2027 | | | | 570,000 | | | | 561,125 | |
| |
| | | | 28,495,768 | |
| | | | | | | | | | | | | | | | |
| | | | |
| Tax Revenue: 18.85% | | | | | | | | | | | | | | | | |
| | | | |
Mount Pleasant WI Tax Increment Series 2018A | | | 4.00 | | | | 4-1-2035 | | | | 1,295,000 | | | | 1,333,319 | |
| | | | |
Mount Pleasant WI Tax Increment Series 2018A | | | 5.00 | | | | 4-1-2034 | | | | 1,000,000 | | | | 1,127,650 | |
| | | | |
Southeast Wisconsin Professional Baseball Park District Series A (National Insured) | | | 5.50 | | | | 12-15-2019 | | | | 100,000 | | | | 103,507 | |
| | | | |
Southeast Wisconsin Professional Baseball Park District Series A (National Insured) | | | 5.50 | | | | 12-15-2021 | | | | 2,000,000 | | | | 2,206,200 | |
| | | | |
Southeast Wisconsin Professional Baseball Park District Series A (National Insured) | | | 5.50 | | | | 12-15-2023 | | | | 1,600,000 | | | | 1,845,520 | |
| | | | |
Southeast Wisconsin Professional Baseball Park District Series A (National Insured) | | | 5.50 | | | | 12-15-2026 | | | | 2,435,000 | | | | 2,892,342 | |
| | | | |
Warrens WI CDA Interim Workout Extension | | | 3.70 | | | | 11-1-2029 | | | | 155,045 | | | | 94,221 | |
| | | | |
Wisconsin Center District CAB (AGM Insured) (z) | | | 4.83 | | | | 12-15-2030 | | | | 295,000 | | | | 203,057 | |
| | | | |
Wisconsin Center District CAB Senior Dedicated Milwaukee Arena Project Series A (Build America Mutual Assurance Company Insured) (z) | | | 4.04 | | | | 12-15-2033 | | | | 2,985,000 | | | | 1,735,628 | |
| | | | |
Wisconsin Center District CAB Series A (National Insured) (z) | | | 2.59 | | | | 12-15-2019 | | | | 275,000 | | | | 269,343 | |
| | | | |
Wisconsin Center District CAB Series A (National Insured) (z) | | | 3.09 | | | | 12-15-2027 | | | | 100,000 | | | | 76,876 | |
| | | | |
Wisconsin Center District Junior Dedicated Bond (AGM Insured) | | | 5.25 | | | | 12-15-2019 | | | | 500,000 | | | | 515,355 | |
| | | | |
Wisconsin Center District Junior Dedicated Bond (AGM Insured) | | | 5.25 | | | | 12-15-2023 | | | | 2,150,000 | | | | 2,362,850 | |
| | | | |
Wisconsin Center District Junior Dedicated Bond (AGM Insured) | | | 5.25 | | | | 12-15-2027 | | | | 1,005,000 | | | | 1,159,760 | |
| | | | |
Wisconsin Center District Junior Dedicated Bond Series A | | | 5.00 | | | | 12-15-2022 | | | | 730,000 | | | | 800,825 | |
| | | | |
Wisconsin Center District Junior Dedicated Bond Series A | | | 5.00 | | | | 12-15-2030 | | | | 2,100,000 | | | | 2,284,716 | |
| | | | |
Wisconsin Center District Milwaukee Arena Project | | | 4.00 | | | | 12-15-2032 | | | | 1,100,000 | | | | 1,172,941 | |
The accompanying notes are an integral part of these financial statements.
| | | | | | |
| Portfolio of investments—December 31, 2018 (unaudited) | | Wells Fargo Wisconsin Tax-Free Fund | | | 11 | |
| | | | | | | | | | | | | | | | |
| Security name | | Interest rate | | | Maturity date | | | Principal | | | Value | |
| | | | |
| Tax Revenue(continued) | | | | | | | | | | | | | | | | |
| | | | |
Wisconsin Center District Milwaukee Arena Project | | | 4.00 | % | | | 12-15-2033 | | | $ | 920,000 | | | $ | 976,580 | |
| | | | |
Wisconsin Center District Milwaukee Arena Project | | | 4.00 | | | | 12-15-2034 | | | | 2,000,000 | | | | 2,109,360 | |
| | | | |
Wisconsin Oneida Tribe of Indians 144A | | | 5.50 | | | | 2-1-2021 | | | | 965,000 | | | | 986,384 | |
| | | | |
| | | | | | | | | | | | | | | 24,256,434 | |
| | | | | | | | | | | | | | | | |
| | | | |
| | | | | | | | | | | | | | | 103,316,023 | |
| | | | | | | | | | | | | | | | |
| | | | |
Total Municipal Obligations (Cost $124,343,082) | | | | | | | | | | | | | | | 126,356,343 | |
| | | | | | | | | | | | | | | | |
| | | | |
| | | Yield | | | | | | | | | | |
| Short-Term Investments: 0.04% | | | | | | | | | | | | | | | | |
| | | | |
| U.S. Treasury Securities: 0.04% | | | | | | | | | | | | | | | | |
| | | | |
U.S. Treasury Bill (z)# | | | 2.32 | | | | 3-14-2019 | | | | 50,000 | | | | 49,761 | |
| | | | | | | | | | | | | | | | |
| | | | |
Total Short-Term Investments (Cost $49,766) | | | | | | | | | | | | | | | 49,761 | |
| | | | | | | | | | | | | | | | |
| | | | | | | | |
| Total investments in securities (Cost $124,392,848) | | | 98.24 | % | | | 126,406,104 | |
| | |
Other assets and liabilities, net | | | 1.76 | | | | 2,269,359 | |
| | | | | | | | |
| Total net assets | | | 100.00 | % | | $ | 128,675,463 | |
| | | | | | | | |
| (z) | Zero coupon security. The rate represents the purchase yield to maturity. |
| 144A | The security may be resold in transactions exempt from registration, normally to qualified institutional buyers, pursuant to Rule 144A under the Securities Act of 1933. |
| ø | Variable rate demand notes are subject to a demand feature which reduces the effective maturity. The maturity date shown represents the final maturity date of the security. The interest rate is determined and reset by the issuer daily, weekly, or monthly depending upon the terms of the security. The rate shown is the rate in effect at period end. |
| # | All or a portion of this security is segregated as collateral for investments in derivative instruments. |
Abbreviations:
| AGC | Assured Guaranty Corporation |
| AGM | Assured Guaranty Municipal |
| Ambac | Ambac Financial Group Incorporated |
| AMT | Alternative minimum tax |
| BHAC | Berkshire Hathaway Assurance Corporation |
| CAB | Capital appreciation bond |
| CDA | Community Development Authority |
| EDA | Economic Development Authority |
| FGIC | Financial Guaranty Insurance Corporation |
| HEFA | Health & Educational Facilities Authority |
| National | National Public Finance Guarantee Corporation |
| PFA | Public Finance Authority |
| RDA | Redevelopment Authority |
| TTFA | Transportation Trust Fund Authority |
The accompanying notes are an integral part of these financial statements.
| | | | |
| 12 | | Wells Fargo Wisconsin Tax-Free Fund | | Statement of assets and liabilities—December 31, 2018 (unaudited) |
| | | | |
| | | | |
| |
Assets | | | | |
Investments in unaffiliated securities, at value (cost $124,392,848) | | $ | 126,406,104 | |
Cash | | | 453,348 | |
Receivable for investments sold | | | 445,000 | |
Receivable for Fund shares sold | | | 103,289 | |
Receivable for interest | | | 1,368,781 | |
Prepaid expenses and other assets | | | 88,305 | |
| | | | |
Total assets | | | 128,864,827 | |
| | | | |
| |
Liabilities | | | | |
Payable for Fund shares redeemed | | | 91,610 | |
Dividends payable | | | 39,463 | |
Management fee payable | | | 24,629 | |
Administration fees payable | | | 15,187 | |
Distribution fee payable | | | 4,998 | |
Trustees’ fees and expenses payable | | | 919 | |
Shareholder servicing fees payable | | | 12,558 | |
| | | | |
Total liabilities | | | 189,364 | |
| | | | |
Total net assets | | $ | 128,675,463 | |
| | | | |
| |
NET ASSETS CONSIST OF | | | | |
Paid-in capital | | $ | 126,753,779 | |
Total distributable earnings | | | 1,921,684 | |
| | | | |
Total net assets | | $ | 128,675,463 | |
| | | | |
| |
COMPUTATION OF NET ASSET VALUE AND OFFERING PRICE PER SHARE | | | | |
Net assets – Class A | | $ | 80,930,912 | |
Shares outstanding – Class A1 | | | 7,527,457 | |
Net asset value per share – Class A | | | $10.75 | |
Maximum offering price per share – Class A2 | | | $11.26 | |
Net assets – Class C | | $ | 7,553,785 | |
Shares outstanding – Class C1 | | | 702,600 | |
Net asset value per share – Class C | | | $10.75 | |
Net assets – Institutional Class | | $ | 40,190,766 | |
Shares outstanding – Institutional Class1 | | | 3,737,899 | |
Net asset value per share – Institutional Class | | | $10.75 | |
| 1 | The Fund has an unlimited number of authorized shares. |
| 2 | Maximum offering price is computed as 100/95.50 of net asset value. On investments of $50,000 or more, the offering price is reduced. |
The accompanying notes are an integral part of these financial statements.
| | | | | | |
| Statement of operations—six months ended December 31, 2018 (unaudited) | | Wells Fargo Wisconsin Tax-Free Fund | | | 13 | |
| | | | |
| | | | |
| |
Investment income | | | | |
Interest | | $ | 2,230,678 | |
| | | | |
| |
Expenses | | | | |
Management fee | | | 264,193 | |
Administration fees | | | | |
Class A | | | 68,496 | |
Class C | | | 6,448 | |
Institutional Class | | | 15,367 | |
Shareholder servicing fees | | | | |
Class A | | | 107,025 | |
Class C | | | 10,074 | |
Distribution fee | | | | |
Class C | | | 30,223 | |
Custody and accounting fees | | | 2,059 | |
Professional fees | | | 26,181 | |
Registration fees | | | 29,504 | |
Trustees’ fees and expenses | | | 10,608 | |
Other fees and expenses | | | 6,092 | |
| | | | |
Total expenses | | | 576,270 | |
Less: Fee waivers and/or expense reimbursements | | | (118,284 | ) |
| | | | |
Net expenses | | | 457,986 | |
| | | | |
Net investment income | | | 1,772,692 | |
| | | | |
| |
REALIZED AND UNREALIZED GAINS (LOSSES) ON INVESTMENTS | | | | |
| |
Net realized gains (losses) on: | | | | |
Unaffiliated securities | | | (56,586 | ) |
Futures contracts | | | 129,518 | |
| | | | |
Net realized gains on investments | | | 72,932 | |
Net change in unrealized gains (losses) on investments | | | (5,194 | ) |
| | | | |
Net realized and unrealized gains (losses) on investments | | | 67,738 | |
| | | | |
Net increase in net assets resulting from operations | | $ | 1,840,430 | |
| | | | |
The accompanying notes are an integral part of these financial statements.
| | | | |
| 14 | | Wells Fargo Wisconsin Tax-Free Fund | | Statement of changes in net assets |
| | | | | | | | | | | | | | | | |
| | | Six months ended
December 31, 2018
(unaudited) | | | Year ended
June 30, 20181 | |
| | | |
Operations | | | | | | | | | | | | |
Net investment income | | | | | | $ | 1,772,692 | | | | | | | $ | 3,599,283 | |
Net realized gains on investments | | | | | | | 72,932 | | | | | | | | 438,289 | |
Net change in unrealized gains (losses) on investments | | | | | | | (5,194 | ) | | | | | | | (1,547,565 | ) |
| | | | |
Net increase in net assets resulting from operations | | | | | | | 1,840,430 | | | | | | | | 2,490,007 | |
| | | | |
| | | |
Distributions to shareholders from net investment income and net realized gains | | | | | | | | | | | | |
Class A | | | | | | | (1,144,887 | ) | | | | | | | (2,888,504 | ) |
Class C | | | | | | | (77,729 | ) | | | | | | | (159,161 | ) |
Institutional Class | | | | | | | (549,649 | ) | | | | | | | (551,618 | ) |
| | | | |
Total distributions to shareholders | | | | | | | (1,772,265 | ) | | | | | | | (3,599,283 | ) |
| | | | |
| | | | |
Capital share transactions | | | Shares | | | | | | | | Shares | | | | | |
Proceeds from shares sold | | | | | | | | | | | | | | | | |
Class A | | | 473,262 | | | | 5,066,032 | | | | 1,129,437 | | | | 12,227,348 | |
Class C | | | 54,763 | | | | 585,050 | | | | 97,473 | | | | 1,053,625 | |
Institutional Class | | | 974,223 | | | | 10,365,775 | | | | 2,428,890 | | | | 26,124,983 | |
| | | | |
| | | | |
| | | | | | | 16,016,857 | | | | | | | | 39,405,956 | |
| | | | |
Reinvestment of distributions | | | | | | | | | | | | | | | | |
Class A | | | 88,349 | | | | 943,947 | | | | 237,522 | | | | 2,567,343 | |
Class C | | | 7,228 | | | | 77,215 | | | | 14,637 | | | | 158,123 | |
Institutional Class | | | 50,854 | | | | 543,348 | | | | 51,060 | | | | 550,646 | |
| | | | |
| | | | |
| | | | | | | 1,564,510 | | | | | | | | 3,276,112 | |
| | | | |
Payment for shares redeemed | | | | | | | | | | | | | | | | |
Class A | | | (1,208,392 | ) | | | (12,852,095 | ) | | | (5,332,606 | ) | | | (57,620,587 | ) |
Class C | | | (114,052 | ) | | | (1,215,338 | ) | | | (229,697 | ) | | | (2,483,639 | ) |
Institutional Class | | | (655,688 | ) | | | (6,983,505 | ) | | | (364,389 | ) | | | (3,932,185 | ) |
| | | | |
| | | | |
| | | | | | | (21,050,938 | ) | | | | | | | (64,036,411 | ) |
| | | | |
Net decrease in net assets resulting from capital share transactions | | | | | | | (3,469,571 | ) | | | | | | | (21,354,343 | ) |
| | | | |
Total decrease in net assets | | | | | | | (3,401,406 | ) | | | | | | | (22,463,619 | ) |
| | | | |
| | |
Net assets | | | | | | | | |
Beginning of period | | | | | | | 132,076,869 | | | | | | | | 154,540,488 | |
| | | | |
End of period | | | | | | $ | 128,675,463 | | | | | | | $ | 132,076,869 | |
| | | | |
| 1 | Effective for all filings after November 4, 2018, the SEC prospectively eliminated the requirement to parenthetically disclose undistributed net investment income at the end of the period and permitted the aggregation of distributions, with the exception of tax basis returns of capital. Overdistributed net investment income at June 30, 2018 was $10,724. The disaggregated distributions information for the year ended June 30, 2018 is included in Note 8,Distributions to Shareholders, in the notes to the financial statements. |
The accompanying notes are an integral part of these financial statements.
| | | | | | |
| Financial highlights | | Wells Fargo Wisconsin Tax-Free Fund | | | 15 | |
(For a share outstanding throughout each period)
| | | | | | | | | | | | | | | | | | | | | | | | |
| | | Six months ended
December 31, 2018
(unaudited) | | | Year ended June 30 | |
| CLASS A | | 2018 | | | 2017 | | | 2016 | | | 2015 | | | 2014 | |
Net asset value, beginning of period | | | $10.74 | | | | $10.83 | | | | $11.16 | | | | $10.83 | | | | $10.96 | | | | $10.86 | |
Net investment income | | | 0.14 | | | | 0.28 | | | | 0.26 | | | | 0.25 | | | | 0.24 | | | | 0.33 | |
Net realized and unrealized gains (losses) on investments | | | 0.01 | | | | (0.09 | ) | | | (0.32 | ) | | | 0.33 | | | | (0.02 | ) | | | 0.18 | |
| | | | | | | | | | | | | | | | | | | | | | | | |
Total from investment operations | | | 0.15 | | | | 0.19 | | | | (0.06 | ) | | | 0.58 | | | | 0.22 | | | | 0.51 | |
Distributions to shareholders from | | | | | | | | | | | | | | | | | | | | | | | | |
Net investment income | | | (0.14 | ) | | | (0.28 | ) | | | (0.26 | ) | | | (0.25 | ) | | | (0.24 | ) | | | (0.33 | ) |
Net realized gains | | | 0.00 | | | | 0.00 | | | | (0.01 | ) | | | (0.00 | )1 | | | (0.11 | ) | | | (0.08 | ) |
| | | | | | | | | | | | | | | | | | | | | | | | |
Total distributions to shareholders | | | (0.14 | ) | | | (0.28 | ) | | | (0.27 | ) | | | (0.25 | ) | | | (0.35 | ) | | | (0.41 | ) |
Net asset value, end of period | | | $10.75 | | | | $10.74 | | | | $10.83 | | | | $11.16 | | | | $10.83 | | | | $10.96 | |
Total return2 | | | 1.45 | % | | | 1.76 | % | | | (0.48 | )% | | | 5.44 | % | | | 2.07 | % | | | 4.80 | % |
Ratios to average net assets (annualized) | | | | | | | | | | | | | | | | | | | | | | | | |
Gross expenses | | | 0.92 | % | | | 0.88 | % | | | 0.93 | % | | | 0.94 | % | | | 0.90 | % | | | 0.92 | % |
Net expenses | | | 0.70 | % | | | 0.70 | % | | | 0.70 | % | | | 0.70 | % | | | 0.70 | % | | | 0.70 | % |
Net investment income | | | 2.67 | % | | | 2.57 | % | | | 2.41 | % | | | 2.26 | % | | | 2.22 | % | | | 3.02 | % |
Supplemental data | | | | | | | | | | | | | | | | | | | | | | | | |
Portfolio turnover rate | | | 4 | % | | | 11 | % | | | 27 | % | | | 16 | % | | | 28 | % | | | 25 | % |
Net assets, end of period (000s omitted) | | | $80,931 | | | | $87,790 | | | | $131,518 | | | | $160,480 | | | | $23,824 | | | | $19,825 | |
| 1 | Amount is less than $0.005. |
| 2 | Total return calculations do not include any sales charges. Returns for periods of less than one year are not annualized. |
The accompanying notes are an integral part of these financial statements.
| | | | |
| 16 | | Wells Fargo Wisconsin Tax-Free Fund | | Financial highlights |
(For a share outstanding throughout each period)
| | | | | | | | | | | | | | | | | | | | | | | | |
| | | Six months ended
December 31, 2018 (unaudited) | | | Year ended June 30 | |
| CLASS C | | 2018 | | | 2017 | | | 2016 | | | 2015 | | | 2014 | |
Net asset value, beginning of period | | | $10.74 | | | | $10.83 | | | | $11.16 | | | | $10.83 | | | | $10.96 | | | | $10.86 | |
Net investment income | | | 0.10 | | | | 0.20 | | | | 0.18 | | | | 0.17 | | | | 0.16 | | | | 0.25 | |
Net realized and unrealized gains (losses) on investments | | | 0.01 | | | | (0.09 | ) | | | (0.32 | ) | | | 0.33 | | | | (0.02 | ) | | | 0.18 | |
| | | | | | | | | | | | | | | | | | | | | | | | |
Total from investment operations | | | 0.11 | | | | 0.11 | | | | (0.14 | ) | | | 0.50 | | | | 0.14 | | | | 0.43 | |
Distributions to shareholders from | | | | | | | | | | | | | | | | | | | | | | | | |
Net investment income | | | (0.10 | ) | | | (0.20 | ) | | | (0.18 | ) | | | (0.17 | ) | | | (0.16 | ) | | | (0.25 | ) |
Net realized gains | | | 0.00 | | | | 0.00 | | | | (0.01 | ) | | | (0.00 | )1 | | | (0.11 | ) | | | (0.08 | ) |
| | | | | | | | | | | | | | | | | | | | | | | | |
Total distributions to shareholders | | | (0.10 | ) | | | (0.20 | ) | | | (0.19 | ) | | | (0.17 | ) | | | (0.27 | ) | | | (0.33 | ) |
Net asset value, end of period | | | $10.75 | | | | $10.74 | | | | $10.83 | | | | $11.16 | | | | $10.83 | | | | $10.96 | |
Total return2 | | | 1.07 | % | | | 1.01 | % | | | (1.22 | )% | | | 4.66 | % | | | 1.31 | % | | | 4.02 | % |
Ratios to average net assets (annualized) | | | | | | | | | | | | | | | | | | | | | | | | |
Gross expenses | | | 1.67 | % | | | 1.63 | % | | | 1.68 | % | | | 1.68 | % | | | 1.65 | % | | | 1.67 | % |
Net expenses | | | 1.45 | % | | | 1.45 | % | | | 1.45 | % | | | 1.45 | % | | | 1.45 | % | | | 1.45 | % |
Net investment income | | | 1.93 | % | | | 1.83 | % | | | 1.67 | % | | | 1.52 | % | | | 1.47 | % | | | 2.28 | % |
Supplemental data | | | | | | | | | | | | | | | | | | | | | | | | |
Portfolio turnover rate | | | 4 | % | | | 11 | % | | | 27 | % | | | 16 | % | | | 28 | % | | | 25 | % |
Net assets, end of period (000s omitted) | | | $7,554 | | | | $8,105 | | | | $9,449 | | | | $10,949 | | | | $10,923 | | | | $10,431 | |
| 1 | Amount is less than $0.005. |
| 2 | Total return calculations do not include any sales charges. Returns for periods of less than one year are not annualized. |
The accompanying notes are an integral part of these financial statements.
| | | | | | |
| Financial highlights | | Wells Fargo Wisconsin Tax-Free Fund | | | 17 | |
(For a share outstanding throughout each period)
| | | | | | | | | | | | |
| | | Six months ended
December 31, 2018 (unaudited) | | | Year ended June 30 | |
| INSTITUTIONAL CLASS | | 2018 | | | 20171 | |
Net asset value, beginning of period | | | $10.74 | | | | $10.83 | | | | $10.99 | |
Net investment income | | | 0.15 | | | | 0.30 | | | | 0.20 | |
Net realized and unrealized gains (losses) on investments | | | 0.01 | | | | (0.09 | ) | | | (0.15 | ) |
| | | | | | | | | | | | |
Total from investment operations | | | 0.16 | | | | 0.21 | | | | 0.05 | |
Distributions to shareholders from | | | | | | | | | | | | |
Net investment income | | | (0.15 | ) | | | (0.30 | ) | | | (0.20 | ) |
Net realized gains | | | 0.00 | | | | 0.00 | | | | (0.01 | ) |
| | | | | | | | | | | | |
Total distributions to shareholders | | | (0.15 | ) | | | (0.30 | ) | | | (0.21 | ) |
Net asset value, end of period | | | $10.75 | | | | $10.74 | | | | $10.83 | |
Total return2 | | | 1.54 | % | | | 1.95 | % | | | 0.44 | % |
Ratios to average net assets (annualized) | | | | | | | | | | | | |
Gross expenses | | | 0.59 | % | | | 0.55 | % | | | 0.54 | % |
Net expenses | | | 0.52 | % | | | 0.52 | % | | | 0.52 | % |
Net investment income | | | 2.86 | % | | | 2.79 | % | | | 2.74 | % |
Supplemental data | | | | | | | | | | | | |
Portfolio turnover rate | | | 4 | % | | | 11 | % | | | 27 | % |
Net assets, end of period (000s omitted) | | | $40,191 | | | | $36,181 | | | | $13,573 | |
| 1 | For the period from October 31, 2016 (commencement of class operations) to June 30, 2017 |
| 2 | Returns for periods of less than one year are not annualized. |
The accompanying notes are an integral part of these financial statements.
| | | | |
| 18 | | Wells Fargo Wisconsin Tax-Free Fund | | Notes to financial statements (unaudited) |
1. ORGANIZATION
Wells Fargo Funds Trust (the “Trust”), a Delaware statutory trust organized on March 10, 1999, is an open-end management investment company registered under the Investment Company Act of 1940, as amended (the “1940 Act”). As an investment company, the Trust follows the accounting and reporting guidance in Financial Accounting Standards Board (“FASB”) Accounting Standards Codification Topic 946, Financial Services – Investment Companies. These financial statements report on the Wells Fargo Wisconsin Tax-Free Fund (the “Fund”) which is a non-diversified series of the Trust.
2. SIGNIFICANT ACCOUNTING POLICIES
The following significant accounting policies, which are consistently followed in the preparation of the financial statements of the Fund, are in conformity with U.S. generally accepted accounting principles which require management to make estimates and assumptions that affect the reported amounts of assets and liabilities, disclosure of contingent assets and liabilities at the date of the financial statements, and the reported amounts of revenues and expenses during the reporting period. Actual results could differ from those estimates.
Securities valuation
All investments are valued each business day as of the close of regular trading on the New York Stock Exchange (generally 4 p.m. Eastern Time), although the Fund may deviate from this calculation time under unusual or unexpected circumstances.
Debt securities are valued at the evaluated bid price provided by an independent pricing service (e.g. taking into account various factors, including yields, maturities, or credit ratings) or, if a reliable price is not available, the quoted bid price from an independent broker-dealer.
Futures contracts that are listed on a foreign or domestic exchange or market are valued at the official closing price or, if none, the last sales price.
Investments which are not valued using any of the methods discussed above are valued at their fair value, as determined in good faith by the Board of Trustees of the Fund. The Board of Trustees has established a Valuation Committee comprised of the Trustees and has delegated to it the authority to take any actions regarding the valuation of portfolio securities that the Valuation Committee deems necessary or appropriate, including determining the fair value of portfolio securities, unless the determination has been delegated to the Wells Fargo Asset Management Pricing Committee at Wells Fargo Funds Management, LLC (“Funds Management”). The Board of Trustees retains the authority to make or ratify any valuation decisions or approve any changes to the Valuation Procedures as it deems appropriate. On a quarterly basis, the Board of Trustees receives reports on any valuation actions taken by the Valuation Committee or the Wells Fargo Asset Management Pricing Committee which may include items for ratification.
When-issued transactions
The Fund may purchase securities on a forward commitment or when-issued basis. The Fund records a when-issued transaction on the trade date and will segregate assets in an amount at least equal in value to the Fund’s commitment to purchase when-issued securities. Securities purchased on a when-issued basis are marked-to-market daily and the Fund begins earning interest on the settlement date. Losses may arise due to changes in the market value of the underlying securities or if the counterparty does not perform under the contract.
Futures contracts
The Fund is subject to interest rate risk in the normal course of pursuing its investment objectives. Futures contracts are agreements between the Fund and a counterparty to buy or sell a specific amount of a commodity, financial instrument or currency at specified price and on a specified date. The Fund may buy and sell futures contracts in order to gain exposure to, or protect against, changes in interest rates. The primary risks associated with the use of futures contracts are the imperfect correlation between changes in market values of securities held by the Fund and the prices of futures contracts, and the possibility of an illiquid market. Futures contracts are generally entered into on a regulated futures exchange and cleared through a clearinghouse associated with the exchange. With futures contracts, there is minimal counterparty risk to the Fund since futures contracts are exchange traded and the exchange’s clearinghouse, as counterparty to all exchange traded futures, guarantees the futures contracts against default.
Upon entering into a futures contracts, the Fund is required to deposit either cash or securities (initial margin) with the broker in an amount equal to a certain percentage of the contract value. Subsequent payments (variation margin) are paid to or from the broker each day equal to the daily changes in the contract value. Such payments are recorded as unrealized gains or losses and, if any, shown as variation margin receivable (payable) in the Statement of Assets and Liabilities. Should the Fund fail to make requested variation margin payments, the broker can gain access to the initial margin to satisfy the Fund’s payment obligations. When the contracts are closed, a realized gain or loss is recorded in the Statement of Operations.
| | | | | | |
| Notes to financial statements (unaudited) | | Wells Fargo Wisconsin Tax-Free Fund | | | 19 | |
Security transactions and income recognition
Securities transactions are recorded on a trade date basis. Realized gains or losses are recorded on the basis of identified cost.
Interest income is accrued daily and bond discounts are accreted and premiums are amortized daily. To the extent debt obligations are placed on non-accrual status, any related interest income may be reduced by writing off interest receivables when the collection of all or a portion of interest has been determined to be doubtful based on consistently applied procedures and the fair value has decreased. If the issuer subsequently resumes interest payments or when the collectability of interest is reasonably assured, the debt obligation is removed from non-accrual status.
Distributions to shareholders
Distributions to shareholders from net investment income are declared daily and paid monthly. Distributions from net realized gains, if any, are recorded on the ex-dividend date and paid at least annually. Such distributions are determined in accordance with income tax regulations and may differ from U.S. generally accepted accounting principles. Dividend sources are estimated at the time of declaration. The tax character of distributions is determined as of the Fund’s fiscal year end. Therefore, a portion of the Fund’s distributions made prior to the Fund’s fiscal year end may be categorized as a tax return of capital at year end.
Federal and other taxes
The Fund intends to continue to qualify as a regulated investment company by distributing substantially all of its investment company taxable and tax-exempt income and any net realized capital gains (after reduction for capital loss carryforwards) sufficient to relieve it from all, or substantially all, federal income taxes. Accordingly, no provision for federal income taxes was required.
The Fund’s income and federal excise tax returns and all financial records supporting those returns for the prior three fiscal years are subject to examination by the federal and Delaware revenue authorities. Management has analyzed the Fund’s tax positions taken on federal, state, and foreign tax returns for all open tax years and does not believe that there are any uncertain tax positions that require recognition of a tax liability.
As of December 31, 2018, the aggregate cost of all investments for federal income tax purposes was $124,392,363 and the unrealized gains (losses) consisted of:
| | | | |
| |
Gross unrealized gains | | $ | 2,534,844 | |
| |
Gross unrealized losses | | | (521,103 | ) |
| |
Net unrealized gains | | $ | 2,013,741 | |
As of June 30, 2018, the Fund had capital loss carryforwards which consisted of $97,612 in short-term capital losses.
As of June 30, 2018, the Fund had current year deferred post-October capital losses consisting of $52,909 in short-term losses and $4,165 in long-term losses which were recognized on the first day of the current fiscal year.
Class allocations
The separate classes of shares offered by the Fund differ principally in applicable sales charges, distribution, shareholder servicing, and administration fees. Class specific expenses are charged directly to that share class. Investment income, common expenses, and realized and unrealized gains (losses) on investments are allocated daily to each class of shares based on the relative proportion of net assets of each class.
3. FAIR VALUATION MEASUREMENTS
Fair value measurements of investments are determined within a framework that has established a fair value hierarchy based upon the various data inputs utilized in determining the value of the Fund’s investments. The three-level hierarchy gives the highest priority to unadjusted quoted prices in active markets for identical assets or liabilities (Level 1) and the lowest priority to unobservable inputs (Level 3). The Fund’s investments are classified within the fair value hierarchy based on the lowest level of input that is significant to the fair value measurement. The inputs are summarized into three broad levels as follows:
| ∎ | | Level 1 – quoted prices in active markets for identical securities |
| ∎ | | Level 2 – other significant observable inputs (including quoted prices for similar securities, interest rates, prepayment speeds, credit risk, etc.) |
| ∎ | | Level 3 – significant unobservable inputs (including the Fund’s own assumptions in determining the fair value of investments) |
| | | | |
| 20 | | Wells Fargo Wisconsin Tax-Free Fund | | Notes to financial statements (unaudited) |
The inputs or methodologies used for valuing investments in securities are not necessarily an indication of the risk associated with investing in those securities.
The following is a summary of the inputs used in valuing the Fund’s assets and liabilities as of December 31, 2018:
| | | | | | | | | | | | | | | | |
| | | | |
| | | Quoted prices
(Level 1) | | | Other significant
observable inputs
(Level 2) | | | Significant
unobservable inputs (Level 3) | | | Total | |
| | | | |
Assets | | | | | | | | | | | | | | | | |
Investments in: | | | | | | | | | | | | | | | | |
| | | | |
Municipal obligations | | $ | 0 | | | $ | 126,356,343 | | | $ | 0 | | | $ | 126,356,343 | |
| | | | |
Short-term investments | | | | | | | | | | | | | | | | |
| | | | |
U.S. Treasury securities | | | 49,761 | | | | 0 | | | | 0 | | | | 49,761 | |
| | | | |
Total assets | | $ | 49,761 | | | $ | 126,356,343 | | | $ | 0 | | | $ | 126,406,104 | |
Additional sector, industry or geographic detail is included in the Portfolio of Investments.
At December 31, 2018, the Fund did not have any transfers into/out of Level 3.
4. TRANSACTIONS WITH AFFILIATES
Management fee
Funds Management, an indirect wholly owned subsidiary of Wells Fargo & Company (“Wells Fargo”), is the manager of the Fund and provides advisory and fund-level administrative services under an investment management agreement. Under the investment management agreement, Funds Management is responsible for, among other services, implementing the investment objectives and strategies of the Fund, supervising the subadviser and providing fund-level administrative services in connection with the Fund’s operations. As compensation for its services under the investment management agreement, Funds Management is entitled to receive an annual management fee starting at 0.40% and declining to 0.28% as the average daily net assets of the Fund increase. For the six months ended December 31, 2018, the management fee was equivalent to an annual rate of 0.40% of the Fund’s average daily net assets.
Funds Management has retained the services of a subadviser to provide daily portfolio management to the Fund. The fee for subadvisory services is borne by Funds Management. Wells Capital Management Incorporated, an affiliate of Funds Management and an indirect wholly owned subsidiary of Wells Fargo, is the subadviser to the Fund and is entitled to receive a fee from Funds Management at an annual rate starting at 0.20% and declining to 0.10% as the average daily net assets of the Fund increase.
Administration fees
Under a class-level administration agreement, Funds Management provides class-level administrative services to the Fund, which includes paying fees and expenses for services provided by the transfer agent, sub-transfer agents, omnibus account servicers and record-keepers. As compensation for its services under the class-level administration agreement, Funds Management receives an annual fee which is calculated based on the average daily net assets of each class as follows:
| | | | |
| | | Class-level
administration fee | |
| |
Class A, Class C | | | 0.16 | % |
| |
Institutional Class | | | 0.08 | |
Funds Management has contractually waived and/or reimbursed management and administration fees to the extent necessary to maintain certain net operating expense ratios for the Fund. When each class of the Fund has exceeded its expense cap, Funds Management has waived fees and/or reimbursed expenses from fund level expenses on a proportionate basis and then from class specific expenses; otherwise, waivers and/or reimbursements are applied against class specific expenses before fund level expenses. Funds Management has committed through October 31, 2019 to waive fees and/or reimburse expenses to the extent necessary to cap the Fund’s expenses at 0.70% for Class A shares, 1.45% for Class C shares, and 0.52% for Institutional Class shares. After this time, the cap may be increased or the commitment to maintain the cap may be terminated only with the approval of the Board of Trustees.
| | | | | | |
| Notes to financial statements (unaudited) | | Wells Fargo Wisconsin Tax-Free Fund | | | 21 | |
Distribution fee
The Trust has adopted a distribution plan for Class C shares of the Fund pursuant to Rule 12b-1 under the 1940 Act. A distribution fee is charged to Class C shares and paid to Wells Fargo Funds Distributor, LLC (“Funds Distributor”), the principal underwriter, at an annual rate of 0.75% of the average daily net assets of Class C shares.
In addition, Funds Distributor is entitled to receive the front-end sales charge from the purchase of Class A shares and a contingent deferred sales charge on the redemption of certain Class A shares. Funds Distributor is also entitled to receive the contingent deferred sales charges from redemptions of Class C shares. For the six months ended December 31, 2018, Funds Distributor received $4,336 from the sale of Class A shares. No contingent deferred sales charges were incurred by Class A and Class C shares for the six months ended December 31, 2018.
Shareholder servicing fees
The Trust has entered into contracts with one or more shareholder servicing agents, whereby Class A and Class C of the Fund are charged a fee at an annual rate of 0.25% of the average daily net assets of each respective class.
A portion of these total shareholder servicing fees were paid to affiliates of Wells Fargo.
Interfund transactions
The Fund may purchase or sell portfolio investment securities to certain other Wells Fargo affiliates pursuant to Rule 17a-7 under the 1940 Act and under procedures adopted by the Board of Trustees. The procedures have been designed to ensure that these interfund transactions, which do not incur broker commissions, are effected at current market prices. Pursuant to these procedures, the Fund had $3,600,000 and $9,685,000 in interfund purchases and sales, respectively, during the six months ended December 31, 2018.
5. INVESTMENT PORTFOLIO TRANSACTIONS
Purchases and sales of investments, excluding U.S. government obligations (if any) and short-term securities, for the six months ended December 31, 2018 were $5,574,527 and $15,031,204, respectively.
6. DERIVATIVE TRANSACTIONS
During the six months ended December 31, 2018, the Fund entered into futures contracts to gain market exposure. The Fund had an average notional amount of $3,076,750 in long futures contracts during the six months ended December 31, 2018.
The fair value, realized gains or losses and change in unrealized gains or losses, if any, on derivative instruments are reflected in the corresponding financial statement captions.
7. BANK BORROWINGS
The Trust (excluding the money market funds), Wells Fargo Master Trust and Wells Fargo Variable Trust are parties to a $280,000,000 revolving credit agreement whereby the Fund is permitted to use bank borrowings for temporary or emergency purposes, such as to fund shareholder redemption requests. Interest under the credit agreement is charged to the Fund based on a borrowing rate equal to the higher of the Federal Funds rate in effect on that day plus 1.25% or the overnight LIBOR rate in effect on that day plus 1.25%. In addition, an annual commitment fee equal to 0.25% of the unused balance is allocated to each participating fund.
For the six months ended December 31, 2018, there were no borrowings by the Fund under the agreement.
8. DISTRIBUTIONS TO SHAREHOLDERS
Effective for all filings after November 4, 2018, the Securities and Exchange Commission eliminated the requirement to separately state the components of distributions to shareholders under U.S. generally accepted accounting principles. The amounts of distributions to shareholders for the year ended June 30, 2018 were as follows:
| | | | |
| | | Net investment
income | |
| |
Class A | | $ | 2,888,504 | |
| |
Class C | | | 159,161 | |
| |
Institutional Class | | | 551,618 | |
| | | | |
| 22 | | Wells Fargo Wisconsin Tax-Free Fund | | Notes to financial statements (unaudited) |
9. CONCENTRATION RISK
The Fund invests a substantial portion of its assets in issuers of municipal debt securities located in a single state or territories of the U.S. Therefore, it may be more affected by economic and political developments in that state or region than would be a comparable general tax-exempt fund.
10. INDEMNIFICATION
Under the Trust’s organizational documents, the officers and Trustees have been granted certain indemnification rights against certain liabilities that may arise out of performance of their duties to the Trust. Additionally, in the normal course of business, the Trust may enter into contracts with service providers that contain a variety of indemnification clauses. The Trust’s maximum exposure under these arrangements is dependent on future claims that may be made against the Fund and, therefore, cannot be estimated.
11. NEW ACCOUNTING PRONOUNCEMENT
In August 2018, FASB issued Accounting Standards Update (“ASU”) No. 2018-13, Fair Value Measurement (Topic 820)Disclosure Framework—Changes to the Disclosure Requirements for Fair Value Measurement. ASU 2018-13 updates the disclosure requirements for fair value measurements by modifying or removing certain disclosures and adding certain new disclosures. The amendments are effective for fiscal years, and interim periods within those fiscal years, beginning after December 15, 2019. Early adoption is permitted. Management has adopted the removal and modification of disclosures early, as permitted, and will adopt the additional new disclosures at the effective date.
| | | | | | |
| Other information (unaudited) | | Wells Fargo Wisconsin Tax-Free Fund | | | 23 | |
PROXY VOTING INFORMATION
A description of the policies and procedures used to determine how to vote proxies relating to portfolio securities is available, upon request, by calling1-800-222-8222, visiting our website at wellsfargofunds.com, or visiting the SEC website at sec.gov. Information regarding how the Fund voted proxies relating to portfolio securities during the most recent 12-month period ended June 30 is available on the Fund’s website atwellsfargofunds.comor by visiting the SEC website at sec.gov.
PORTFOLIO HOLDINGS INFORMATION
The complete portfolio holdings for the Fund are publicly available monthly on the Fund’s website (wellsfargofunds.com), on a one-month delayed basis. In addition, top ten holdings information (excluding derivative positions) for the Fund is publicly available on the Fund’s website on a monthly, seven-day or more delayed basis. The Fund files its complete schedule of portfolio holdings with the SEC for the first and third quarters of each fiscal year on Form N-Q, which is available by visiting the SEC website at sec.gov. In addition, the Fund’s Form N-Q may be reviewed and copied at the SEC’s Public Reference Room in Washington, DC, and at regional offices in New York City, at 233 Broadway, and in Chicago, at 175 West Jackson Boulevard, Suite 900. Information about the Public Reference Room may be obtained by calling 1-800-SEC-0330.
| | | | |
| 24 | | Wells Fargo Wisconsin Tax-Free Fund | | Other information (unaudited) |
BOARD OF TRUSTEES AND OFFICERS
Each of the Trustees and Officers1 listed in the table below acts in identical capacities for each fund in the Wells Fargo family of funds, which consists of 152 mutual funds comprising the Wells Fargo Funds Trust, Wells Fargo Variable Trust, Wells Fargo Master Trust and four closed-end funds (collectively the “Fund Complex”). This table should be read in conjunction with the Prospectus and the Statement of Additional Information2. The mailing address of each Trustee and Officer is 525 Market Street, 12th Floor, San Francisco, CA 94105. Each Trustee and Officer serves an indefinite term, however, each Trustee serves such term until reaching the mandatory retirement age established by the Trustees.
Independent Trustees
| | | | | | |
Name and year of birth | | Position held and length of service* | | Principal occupations during past five years or longer | | Current other
public company or
investment company
directorships |
| | | |
William R. Ebsworth (Born 1957) | | Trustee, since 2015 | | Retired. From 1984 to 2013, equities analyst, portfolio manager, research director and chief investment officer at Fidelity Management and Research Company in Boston, Tokyo, and Hong Kong, and retired in 2013 as Chief Investment Officer of Fidelity Strategic Advisers, Inc. where he led a team of investment professionals managing client assets. Prior thereto, Board member of Hong Kong Securities Clearing Co., Hong Kong Options Clearing Corp., the Thailand International Fund, Ltd., Fidelity Investments Life Insurance Company, and Empire Fidelity Investments Life Insurance Company. Board member of the Vincent Memorial Hospital Endowment (non-profit organization), where he serves on the Investment Committee and as a Chair of the Audit Committee. Mr. Ebsworth is a CFA® charterholder. | | N/A |
| | | |
Jane A. Freeman (Born 1953) | | Trustee, since 2015; Chair Liaison, since 2018 | | Retired. From 2012 to 2014 and 1999 to 2008, Chief Financial Officer of Scientific Learning Corporation. From 2008 to 2012, Ms. Freeman provided consulting services related to strategic business projects. Prior to 1999, Portfolio Manager at Rockefeller & Co. and Scudder, Stevens & Clark. Board member of the Harding Loevner Funds from 1996 to 2014, serving as both Lead Independent Director and chair of the Audit Committee. Board member of the Russell Exchange Traded Funds Trust from 2011 to 2012 and the chair of the Audit Committee. Ms. Freeman is a Board Member of The Ruth Bancroft Garden (non-profit organization). She is also an inactive Chartered Financial Analyst. | | N/A |
| | | |
Isaiah Harris, Jr.3 (Born 1952) | | Trustee, since 2009; Audit Committee Chairman, since 2019 | | Retired. Chairman of the Board of CIGNA Corporation since 2009, and Director since 2005. From 2003 to 2011, Director of Deluxe Corporation. Prior thereto, President and CEO of BellSouth Advertising and Publishing Corp. from 2005 to 2007, President and CEO of BellSouth Enterprises from 2004 to 2005 and President of BellSouth Consumer Services from 2000 to 2003. Emeritus member of the Iowa State University Foundation Board of Governors. Emeritus Member of the Advisory Board of Iowa State University School of Business. Advisory Board Member, Palm Harbor Academy (private school). Advisory Board Member, Child Evangelism Fellowship (non-profit). Mr. Harris is a certified public accountant (inactive status). | | CIGNA Corporation |
| | | |
Judith M. Johnson3 (Born 1949) | | Trustee, since 2008; Audit Committee Chairman, from 2009 to 2018 | | Retired. Prior thereto, Chief Executive Officer and Chief Investment Officer of Minneapolis Employees Retirement Fund from 1996 to 2008. Ms. Johnson is an attorney, certified public accountant and a certified managerial accountant. | | N/A |
| | | |
David F. Larcker (Born 1950) | | Trustee, since 2009 | | James Irvin Miller Professor of Accounting at the Graduate School of Business, Stanford University, Director of the Corporate Governance Research Initiative and Senior Faculty of The Rock Center for Corporate Governance since 2006. From 2005 to 2008, Professor of Accounting at the Graduate School of Business, Stanford University. Prior thereto, Ernst & Young Professor of Accounting at The Wharton School, University of Pennsylvania from 1985 to 2005. | | N/A |
| | | | | | |
| Other information (unaudited) | | Wells Fargo Wisconsin Tax-Free Fund | | | 25 | |
| | | | | | |
Name and year of birth | | Position held and length of service* | | Principal occupations during past five years or longer | | Current other
public company or
investment company
directorships |
| | | |
Olivia S. Mitchell (Born 1953) | | Trustee, since 2006; Nominating and Governance Committee Chairman, since 2018 | | International Foundation of Employee Benefit Plans Professor, Wharton School of the University of Pennsylvania since 1993. Director of Wharton’s Pension Research Council and Boettner Center on Pensions & Retirement Research, and Research Associate at the National Bureau of Economic Research. Previously, Cornell University Professor from 1978 to 1993. | | N/A |
| | | |
Timothy J. Penny (Born 1951) | | Trustee, since 1996; Chairman, since 2018; Vice Chairman, from 2017 to 2018 | | President and Chief Executive Officer of Southern Minnesota Initiative Foundation, a non-profit organization, since 2007. Member of the Board of Trustees of NorthStar Education Finance, Inc., a non-profit organization, since 2007. | | N/A |
| | | |
James G. Polisson (Born 1959) | | Trustee, since 2018; Advisory Board Member, from 2017 to 2018 | | Retired. Chief Marketing Officer, Source (ETF) UK Services, Ltd, from 2015 to 2017. From 2012 to 2015, Principal of The Polisson Group, LLC, a management consulting, corporate advisory and principal investing company. Chief Executive Officer and Managing Director at Russell Investments, Global Exchange Traded Funds from 2010 to 2012. Managing Director of Barclays Global Investors from 1998 to 2010 and Global Chief Marketing Officer for iShares and Barclays Global Investors from 2000 to 2010. Trustee of the San Francisco Mechanics’ Institute, a non-profit organization, from 2013 to 2015. Board member of the Russell Exchange Traded Fund Trust from 2011 to 2012. Director of Barclays Global Investors Holdings Deutschland GmbH from 2006 to 2009. Mr. Polisson is an attorney and has a retired status with the Massachusetts and District of Columbia Bar Associations. | | N/A |
| | | |
Michael S. Scofield4 (Born 1943) | | Trustee, since 2010 | | Served on the Investment Company Institute’s Board of Governors and Executive Committee from 2008-2011 as well the Governing Council of the Independent Directors Council from 2006-2011 and the Independent Directors Council Executive Committee from 2008-2011. Trustee of the Evergreen Fund complex (and its predecessors) from 1984 to 2010. Chairman of the Evergreen Funds from 2000-2010. Former Trustee of the Mentor Funds. Retired Attorney, Law Offices of Michael S. Scofield. | | N/A |
| | | |
Pamela Wheelock (Born 1959) | | Trustee, since 2018; Advisory Board Member, from 2017 to 2018 | | Chief Operating Officer, Twin Cities Habitat for Humanity, since January, 2017. Vice President of University Services, University of Minnesota from 2012 to 2017. Prior thereto, on the Board of Directors, Governance Committee and Finance Committee for the Minnesota Philanthropy Partners (Saint Paul Foundation) from 2012 to 2018, Interim President and Chief Executive Officer of Blue Cross Blue Shield of Minnesota from 2010 to 2011, Chairman of the Board from 2009 to 2011 and Board Director from 2003 to 2015. Vice President, Leadership and Community Engagement, Bush Foundation, Saint Paul, Minnesota (a private foundation) from 2009 to 2011. Executive Vice President and Chief Financial Officer, Minnesota Sports and Entertainment from 2004 to 2009 and Senior Vice President from 2002 to 2004. Commissioner of Finance, State of Minnesota, from 1999 to 2002. Currently the Board Chair of the Minnesota Wild Foundation since 2010. | | N/A |
| * | Length of service dates reflect the Trustee’s commencement of service with the Trust’s predecessor entities, where applicable. |
| | | | |
| 26 | | Wells Fargo Wisconsin Tax-Free Fund | | Other information (unaudited) |
Officers
| | | | | | |
Name and year of birth | | Position held and
length of service | | Principal occupations during past five years or longer | | |
| | | |
Andrew Owen (Born 1960) | | President, since 2017 | | Executive Vice President of Wells Fargo & Company and Head of Affiliated Managers, Wells Fargo Asset Management, since 2014. In addition, Mr. Owen is currently President, Chief Executive Officer and Director of Wells Fargo Funds Management, LLC since 2017. Prior thereto, Executive Vice President responsible for marketing, investments and product development for Wells Fargo Funds Management, LLC, from 2009 to 2014. | | |
| | | |
Nancy Wiser1 (Born 1967) | | Treasurer, since 2012 | | Executive Vice President of Wells Fargo Funds Management, LLC since 2011. Chief Operating Officer and Chief Compliance Officer at LightBox Capital Management LLC, from 2008 to 2011. | | |
| | | |
Alexander Kymn (Born 1973) | | Secretary, since 2018; Chief Legal Officer, since 2018 | | Senior Company Counsel of Wells Fargo Bank, N.A. since 2018 (previously Senior Counsel from 2007 to 2018). Vice President of Wells Fargo Funds Management, LLC from 2008 to 2014. | | |
| | | |
Michael H. Whitaker (Born 1967) | | Chief Compliance Officer, since 2016 | | Senior Vice President and Chief Compliance Officer since 2016. Senior Vice President and Chief Compliance Officer for Fidelity Investments from 2007 to 2016. | | |
| | | |
David Berardi (Born 1975) | | Assistant Treasurer, since 2009 | | Vice President of Wells Fargo Funds Management, LLC since 2009. Vice President of Evergreen Investment Management Company, LLC from 2008 to 2010. Manager of Fund Reporting and Control for Evergreen Investment Management Company, LLC from 2004 to 2010. | | |
| | | |
Jeremy DePalma1 (Born 1974) | | Assistant Treasurer, since 2009 | | Senior Vice President of Wells Fargo Funds Management, LLC since 2009. Senior Vice President of Evergreen Investment Management Company, LLC from 2008 to 2010 and head of the Fund Reporting and Control Team within Fund Administration from 2005 to 2010. | | |
| 1 | Nancy Wiser acts as Treasurer of 76 funds in the Fund Complex. Jeremy DePalma acts as Treasurer of 76 funds and Assistant Treasurer of 76 funds in the Fund Complex. |
| 2 | The Statement of Additional Information includes additional information about the Trustees and is available, without charge, upon request, by calling 1-800-222-8222 or by visiting the website atwellsfargofunds.com. |
| 3 | Mr. Harris replaced Ms. Johnson as the Chairman of the Audit Committee effective January 1, 2019. |
| 4 | Mr. Scofield retired on December 31, 2018. |
| | | | | | |
| Appendix A (unaudited) | | Wells Fargo Wisconsin Tax-Free Fund | | | 27 | |
SALES CHARGE REDUCTIONS AND WAIVERS FOR CERTAIN INTERMEDIARIES
Raymond James & Associates, Inc., Raymond James Financial Services & Raymond James affiliates (“Raymond James”)
Effective on or about March 1, 2019, shareholders purchasing Fund shares through a Raymond James platform or account will be eligible only for the following load waivers (front-end sales charge waivers and contingent deferred, or back-end, sales charge waivers) and discounts, which may differ from those disclosed elsewhere in the Fund’s Prospectus or SAI.
Front-end Sales Load Waivers on Class A shares Available at Raymond James
| | • | | Shares purchased in an investment advisory program. |
| | • | | Shares purchased through reinvestment of capital gains distributions and dividend reinvestment when purchasing shares of the same fund (but not any other fund within the fund family). |
| | • | | Employees and registered representatives of Raymond James or its affiliates and their family members as designated by Raymond James. |
| | • | | Shares purchased from the proceeds of redemptions within the same fund family, provided (1) the repurchase occurs within 90 days following the redemption, (2) the redemption and purchase occur in the same account, and (3) redeemed shares were subject to a front-end or deferred sales load (known as Rights of Reinstatement). |
| | • | | A shareholder in the fund’s Class C shares will have their shares automatically exchanged at net asset value to Class A shares (or the appropriate share class) of the fund if the shares are no longer subject to a CDSC and the exchange is in line with the policies and procedures of Raymond James. |
CDSC Waivers on Class A and C Shares Available at Raymond James
| | • | | Death or disability of the shareholder. |
| | • | | Shares sold as part of a systematic withdrawal plan as described in the Fund’s Prospectus. |
| | • | | Return of excess contributions from an IRA Account. |
| | • | | Shares sold as part of a required minimum distribution for IRA and retirement accounts due to the shareholder reaching age 70½ as described in the Fund’s prospectus. |
| | • | | Shares sold to pay Raymond James fees but only if the transaction is initiated by Raymond James. |
| | • | | Shares acquired through a right of reinstatement. |
Front-end Load Discounts Available at Raymond James: Breakpoints, and/or Rights of Accumulation
| | • | | Breakpoints as described in the Fund’s Prospectus. |
| | • | | Rights of accumulation which entitle shareholders to breakpoint discounts will be automatically calculated based on the aggregated holding of fund family assets held by accounts within the purchaser’s household at Raymond James. Eligible fund family assets not held at Raymond James may be included in the rights of accumulation calculation only if the shareholder notifies his or her financial advisor about such assets. |
This page is intentionally left blank.

For more information
More information about Wells Fargo Funds is available free upon request. To obtain literature, please write, visit the Fund’s website, or call:
Wells Fargo Funds
P.O. Box 219967
Kansas City, MO 64121-9967
Website: wellsfargofunds.com
Individual investors: 1-800-222-8222
Retail investment professionals: 1-888-877-9275
Institutional investment professionals:
1-866-765-0778
This report and the financial statements contained herein are submitted for the general information of the shareholders of the Fund. If this report is used for promotional purposes, distribution of the report must be accompanied or preceded by a current prospectus. Before investing, please consider the investment objectives, risks, charges, and expenses of the investment. For a current prospectus and, if available, a summary prospectus, containing this information, call1-800-222-8222 or visit the Fund’s website atwellsfargofunds.com. Read the prospectus carefully before you invest or send money.
Wells Fargo Asset Management (WFAM) is the trade name for certain investment advisory/management firms owned by Wells Fargo & Company. These firms include but are not limited to Wells Capital Management Incorporated and Wells Fargo Funds Management, LLC. Certain products managed by WFAM entities are distributed by Wells Fargo Funds Distributor, LLC (a broker/dealer and Member FINRA).
This material is for general informational and educational purposes only and is NOT intended to provide investment advice or a recommendation of any kind—including a recommendation for any specific investment, strategy, or plan.
INVESTMENT PRODUCTS: NOT FDIC INSURED ◾ NO BANK GUARANTEE ◾ MAY LOSE VALUE
© 2019 Wells Fargo Funds Management, LLC. All rights reserved.
| | |
 | | 320454 02-19 SA259/SAR259 12-18 |
ITEM 2. CODE OF ETHICS
Not applicable.
ITEM 3. AUDIT COMMITTEE FINANCIAL EXPERT
Not applicable.
ITEM 4. PRINCIPAL ACCOUNTANT FEES AND SERVICES
Not applicable.
ITEM 5. AUDIT COMMITTEE OF LISTED REGISTRANTS
Not applicable.
ITEM 6. INVESTMENTS
A Portfolio of Investments for each series of Wells Fargo Funds Trust is included as part of the report to shareholders filed under Item 1 of this Form.
ITEM 7. DISCLOSURE OF PROXY VOTING POLICIES AND PROCEDURES FORCLOSED-END MANAGEMENT INVESTMENT COMPANIES
Not applicable.
ITEM 8. PORTFOLIO MANAGERS OFCLOSED-END MANAGEMENT INVESTMENT COMPANIES
Not applicable.
ITEM 9. PURCHASES OF EQUITY SECURITIES BYCLOSED-END MANAGEMENT INVESTMENT COMPANY AND AFFILIATED PURCHASERS
Not applicable.
ITEM 10. SUBMISSION OF MATTERS TO A VOTE OF SECURITY HOLDERS
There have been no material changes to the procedures by which shareholders may recommend nominees to the registrant’s Board of Trustees that have been implemented since the registrant’s last provided disclosure in response to the requirements of this Item.
ITEM 11. CONTROLS AND PROCEDURES
(a) The President and Treasurer have concluded that the Wells Fargo Funds Trust (the “Trust”) disclosure controls and procedures (as defined inRule 30a-3(c) under the Investment Company Act of 1940) provide reasonable assurances that material information relating to the Trust is made known to them by the appropriate persons, based on their evaluation of these controls and procedures as of a date within 90 days of the filing of this report.
(b) There were no significant changes in the Trust’s internal controls over financial reporting (as defined inRule 30a-3(d) under the Investment Company Act of 1940) that occurred during the second fiscal quarter of the period covered by this report that materially affected, or is reasonably likely to materially affect, the registrant’s internal control over financial reporting.
ITEM 12. DISCLOSURES OF SECURITIES LENDING ACTIVITIES FORCLOSED-END MANAGEMENT INVESTMENT COMPANIES
Not applicable.
ITEM 13. EXHIBITS
(a)(1) Not applicable.
(a)(2) Certification pursuant to Rule30a-2(a) under the Investment Company Act of 1940 (17 CFR270.30a-2(a)) is filed and attached hereto as Exhibit 99.CERT.
(a)(3) Not applicable.
(b) Certification pursuant to Rule30a-2(b) under the Investment Company Act of 1940 (17 CFR270.30a-2(b)) is filed and attached hereto as Exhibit 99.906CERT.
SIGNATURES
Pursuant to the requirements of the Securities Exchange Act of 1934 and the Investment Company Act of 1940, the registrant has duly caused this report to be signed on its behalf by the undersigned, thereunto duly authorized.
| | |
| Wells Fargo Funds Trust |
| |
| By: | | |
| |
| | /s/ Andrew Owen |
| |
| | Andrew Owen |
| | President |
| |
| Date: | | February 22, 2019 |
Pursuant to the requirements of the Securities Exchange Act of 1934 and the Investment Company Act of 1940, this report has been signed below by the following persons on behalf of the registrant and in the capacities and on the date indicated.
| | |
| Wells Fargo Funds Trust |
| |
| By: | | |
| |
| | /s/ Andrew Owen |
| |
| | Andrew Owen |
| | President |
| |
| Date: | | February 22, 2019 |
| |
| By: | | |
| |
| | /s/ Nancy Wiser |
| |
| | Nancy Wiser |
| | Treasurer |
| |
| Date: | | February 22, 2019 |