
UNITED STATES
SECURITIES AND EXCHANGE COMMISSION
Washington, D.C. 20549
FORM N-CSRS
CERTIFIED SHAREHOLDER REPORT OF REGISTERED
MANAGEMENT INVESTMENT COMPANIES
Investment Company Act file number: 811-09253
Wells Fargo Funds Trust
(Exact name of registrant as specified in charter)
525 Market St., San Francisco, CA 94105
(Address of principal executive offices) (Zip code)
Alexander Kymn
Wells Fargo Funds Management, LLC
525 Market St., San Francisco, CA 94105
(Name and address of agent for service)
Registrant’s telephone number, including area code: 800-222-8222
Date of fiscal year end: March 31
Registrant is making a filing for 9 of its series:
Wells Fargo Intrinsic Small Cap Value Fund, Wells Fargo Small Cap Core Fund, Wells Fargo Disciplined Small Cap Fund, Wells Fargo Small Cap Value Fund, Wells Fargo Special Small Cap Value Fund, Wells Fargo Traditional Small Cap Growth Fund, Wells Fargo Precious Metals Fund, Wells Fargo Specialized Technology Fund, and Wells Fargo Utility and Telecommunications Fund.
Date of reporting period: September 30, 2018
ITEM 1. REPORT TO STOCKHOLDERS
Semi-Annual Report
September 30, 2018

Wells Fargo Intrinsic Small Cap Value Fund


Reduce clutter. Save trees.
Sign up for electronic delivery of prospectuses and shareholder reports at wellsfargo.com/advantagedelivery
Contents
The views expressed and any forward-looking statements are as of September 30, 2018, unless otherwise noted, and are those of the Fund managers and/or Wells Fargo Funds Management, LLC. Discussions of individual securities, or the markets generally, or any Wells Fargo Fund are not intended as individual recommendations. Future events or results may vary significantly from those expressed in any forward-looking statements. The views expressed are subject to change at any time in response to changing circumstances in the market. Wells Fargo Funds Management, LLC and the Fund disclaim any obligation to publicly update or revise any views expressed or forward-looking statements.
NOT FDIC INSURED ◾ NO BANK GUARANTEE ◾ MAY LOSE VALUE
| | | | |
| 2 | | Wells Fargo Intrinsic Small Cap Value Fund | | Letter to shareholders (unaudited) |

Andrew Owen
President
Wells Fargo Funds
The second and third quarters of 2018 were characterized by growing economic and investment activity in the U.S.
Dear Shareholder:
We are pleased to offer you this semi-annual report for the Wells Fargo Intrinsic Small Cap Value Fund for the six-month period that ended September 30, 2018. The second and third quarters of 2018 were characterized by growing economic and investment activity in the U.S. In contrast, economies overseas were restrained as geopolitical tensions and rising interest rates diverted investor interest in those markets.
For the period, U.S. stocks, as measured by the S&P 500 Index,1 gained 11.41% and international stocks, as measured by the MSCI ACWI ex USA Index (Net),2 lost 1.93%. Based on the MSCI EM Index (Net),3 emerging market stocks lost 8.97%. For bond investors, the Bloomberg Barclays U.S. Aggregate Bond Index4 lost 0.14% while the Bloomberg Barclays Global Aggregate ex-USD Index5 fell 6.42%. The Bloomberg Barclays Municipal Bond Index6 added 0.72%, and the ICE BofAML U.S. High Yield Index7 was up 3.46%.
Global trade tensions escalated during the second quarter.
During the second quarter of 2018, the U.S. government imposed tariffs, and foreign governments in North America, Europe, and Asia retaliated. The actions marked the initialization of trade tensions that would escalate during the next six months. The increasing tensions chilled investment activity as observers awaited signals of next steps.
Meanwhile, inflation continued an upward trend. The CPI-U8 added 0.1% in June after an increase of 0.2% in both April and May. On a year-over-year basis, the all-items index rose 2.9% for the 12 months that ended June 30, 2018. The index for all items less food and energy rose 2.3% for the same 12-month period.
| 1 | The S&P 500 Index consists of 500 stocks chosen for market size, liquidity, and industry group representation. It is a market-value-weighted index with each stock’s weight in the index proportionate to its market value. You cannot invest directly in an index. |
| 2 | The Morgan Stanley Capital International (MSCI) All Country World Index (ACWI) ex USA Index (Net) is a free-float-adjusted market-capitalization-weighted index that is designed to measure the equity market performance of developed markets, excluding the United States and Canada. Source: MSCI. MSCI makes no express or implied warranties or representations and shall have no liability whatsoever with respect to any MSCI data contained herein. The MSCI data may not be further redistributed or used as a basis for other indices or any securities or financial products. This report is not approved, reviewed, or produced by MSCI. You cannot invest directly in an index. |
| 3 | The MSCI Emerging Markets (EM) Index (Net) is a free-float-adjusted market-capitalization-weighted index that is designed to measure large- and mid-cap equity market performance of emerging markets. The MSCI EM Index (Net) consists of the following 24 emerging market country indices: Brazil, Chile, China, Colombia, Czech Republic, Egypt, Greece, Hungary, India, Indonesia, Korea, Malaysia, Mexico, Pakistan, Peru, the Philippines, Poland, Qatar, Russia, South Africa, Taiwan, Thailand, Turkey, and the United Arab Emirates. You cannot invest directly in an index. |
| 4 | The Bloomberg Barclays U.S. Aggregate Bond Index is a broad-based benchmark that measures the investment-grade, U.S. dollar-denominated, fixed-rate taxable bond market, including Treasuries, government-related and corporate securities, mortgage-backed securities (agency fixed-rate and hybrid adjustable-rate mortgage pass-throughs), asset-backed securities, and commercial mortgage-backed securities. You cannot invest directly in an index. |
| 5 | The Bloomberg Barclays Global Aggregate ex-USD Index is an unmanaged index that provides a broad-based measure of the global investment-grade fixed-income markets excluding the U.S. dollar-denominated debt market. You cannot invest directly in an index. |
| 6 | The Bloomberg Barclays Municipal Bond Index is an unmanaged index composed of long-term tax-exempt bonds with a minimum credit rating of Baa. You cannot invest directly in an index. |
| 7 | The ICE BofAML U.S. High Yield Index is a market-capitalization-weighted index of domestic and Yankee high-yield bonds. The index tracks the performance of high-yield securities traded in the U.S. bond market. You cannot invest directly in an index. Copyright 2018. ICE Data Indices, LLC. All rights reserved. |
| 8 | The Consumer Price Index for All Urban Consumers (CPI-U) measures the changes in the price of a basket of goods and services purchased by urban consumers. The urban consumer population is deemed by many as a better representative measure of the general public because close to 90% of the country’s population lives in highly populated areas. You cannot invest directly in an index. |
| | | | | | |
| Letter to shareholders (unaudited) | | Wells Fargo Intrinsic Small Cap Value Fund | | | 3 | |
U.S. stocks gained while international stocks and bonds declined during the summer of 2018.
The U.S. economy strengthened during the summer months. Revised second-quarter gross domestic product data released in August showed the U.S. economy growing at a 4.2% rate. After ticking up slightly in June, the unemployment rate in the U.S. was 3.9% in July and August, according to the U.S. Department of Labor. Wages showed more consistent growth, and consumer confidence remained strong.
Several U.S. equity market indices reached records during August, with the S&P 500 Index gaining 7.76% for the three-month period that ended August 31, 2018. International stock values continued to suffer under the effects of a strong U.S. dollar and continuing trade tensions. The MSCI ACWI ex USA Index (Net) and the MSCI EM Index (Net) were down 4.70% and 1.64%, during the same three-month period.
The U.S. Federal Reserve (Fed) increased the federal funds rate in June, and expectations grew that two more rate increases were in the offing in 2018. Long-term interest rates in the U.S. remained at higher levels relative to the prior 10 years. Rates on 10-year and 30-year Treasury bonds—2.74% and 2.97%, respectively, on March 31, 2018—were 3.05% and 3.19%, respectively, on September 30, off their peak levels on May 17, 2018, of 3.11% and 3.25%, respectively. Some investors became more aware of and concerned about the potential for an inverted yield curve—sometimes a recession signal—as short-term rates increased more quickly than long-term rates. The Fed decided to forgo an interest rate increase at its August meeting.
Internationally, members of Prime Minister Theresa May’s U.K./Brexit negotiating team resigned amid unproductive negotiations. In early August, the Bank of England’s Monetary Policy Committee increased its key interest rate to 0.75%. Central banks in Europe and Japan maintained low interest rates and accommodative monetary policies. Amid rising trade uncertainty, the People’s Bank of China cut reserve requirement ratios and accelerated infrastructure spending and tax cuts for business enterprises and individuals. Nevertheless, a strengthening U.S. dollar and the trade tensions remained headwinds for investors overseas.
Don’t let short-term uncertainty derail long-term investment goals.
Periods of investment uncertainty can present challenges, but experience has taught us that maintaining long-term investment goals can be an effective way to plan for the future. To help you create a sound strategy based on your personal goals and risk tolerance, Wells Fargo Funds offers more than 100 mutual funds spanning a wide range of asset classes and investment styles. Although diversification cannot guarantee an investment profit or prevent losses, we believe it can be an effective way to manage investment risk and potentially smooth out overall portfolio performance. We encourage investors to know their investments and to understand that appropriate levels of risk-taking may unlock opportunities.
The U.S. economy strengthened during the summer months.
| | | | |
| 4 | | Wells Fargo Intrinsic Small Cap Value Fund | | Letter to shareholders (unaudited) |
Thank you for choosing to invest with Wells Fargo Funds. We appreciate your confidence in us and remain committed to helping you meet your financial needs.
Sincerely,

Andrew Owen
President
Wells Fargo Funds
Notice to shareholders
At a meeting held on August 14-15, 2018, the Board of Trustees of the Fund approved the following policy which will be effective on or about February 5, 2019:
Class C shares will convert automatically into Class A shares ten years after the initial date of purchase or, if you acquired your Class C shares through an exchange or conversion from another share class, ten years after the date you acquired your Class C shares. When Class C shares that you acquired through a purchase or exchange convert, any other Class C shares that you purchased with reinvested dividends and distributions also will convert into Class A shares on a pro rata basis. A shorter holding period may also apply depending on your intermediary. Please see “Appendix A—Sales Charge Reductions and Waivers for Certain Intermediaries” in the Fund’s prospectus or at the end of this report.
For further information about your Fund, contact your investment professional, visit our website at wellsfargofunds.com, or call us directly at 1-800-222-8222.
This page is intentionally left blank.
| | | | |
| 6 | | Wells Fargo Intrinsic Small Cap Value Fund | | Performance highlights (unaudited) |
Investment objective
The Fund seeks long-term capital appreciation.
Manager
Wells Fargo Funds Management, LLC
Subadviser
Wells Capital Management Incorporated
Portfolio managers
Ann Miletti
Christopher G. Miller, CFA®
Average annual total returns (%) as of September 30, 2018
| | | | | | | | | | | | | | | | | | | | | | | | | | | | | | | | | | |
| | | | | Including sales charge | | | Excluding sales charge | | | Expense ratios1 (%) | |
| | | Inception date | | 1 year | | | 5 year | | | 10 year | | | 1 year | | | 5 year | | | 10 year | | | Gross | | | Net2 | |
| Class A (WFSMX) | | 3-31-2008 | | | 2.97 | | | | 7.84 | | | | 8.42 | | | | 9.24 | | | | 9.12 | | | | 9.06 | | | | 1.55 | | | | 1.36 | |
| Class C (WSCDX) | | 3-31-2008 | | | 7.43 | | | | 8.30 | | | | 8.26 | | | | 8.43 | | | | 8.30 | | | | 8.26 | | | | 2.30 | | | | 2.11 | |
| Administrator Class (WFSDX) | | 4-8-2005 | | | – | | | | – | | | | – | | | | 9.43 | | | | 9.31 | | | | 9.29 | | | | 1.47 | | | | 1.21 | |
| Institutional Class (WFSSX) | | 4-8-2005 | | | – | | | | – | | | | – | | | | 9.65 | | | | 9.52 | | | | 9.52 | | | | 1.22 | | | | 1.01 | |
| Russell 2000® Value Index3 | | – | | | – | | | | – | | | | – | | | | 9.33 | | | | 9.91 | | | | 9.52 | | | | – | | | | – | |
Figures quoted represent past performance, which is no guarantee of future results, and do not reflect taxes that a shareholder may pay on fund distributions or the redemption of fund shares. Investment return and principal value of an investment will fluctuate so that an investor’s shares, when redeemed, may be worth more or less than their original cost. Performance shown without sales charges would be lower if sales charges were reflected. Current performance may be lower or higher than the performance data quoted, which assumes the reinvestment of dividends and capital gains. Current month-end performance is available on the Fund’s website, wellsfargofunds.com.
Index returns do not include transaction costs associated with buying and selling securities, any mutual fund fees or expenses, or any taxes. It is not possible to invest directly in an index.
For Class A shares, the maximum front-end sales charge is 5.75%. For Class C shares, the maximum contingent deferred sales charge is 1.00%. Performance including a contingent deferred sales charge assumes the sales charge for the corresponding time period. Administrator Class and Institutional Class shares are sold without a front-end sales charge or contingent deferred sales charge.
Stock values fluctuate in response to the activities of individual companies and general market and economic conditions. Smaller-company stocks tend to be more volatile and less liquid than those of larger companies. Certain investment strategies tend to increase the total risk of an investment (relative to the broader market). Consult the Fund’s prospectus for additional information on these and other risks.
Please see footnotes on page 7.
| | | | | | |
| Performance highlights (unaudited) | | Wells Fargo Intrinsic Small Cap Value Fund | | | 7 | |
| | | | |
| Ten largest holdings (%) as of September 30, 20184 | |
WPX Energy Incorporated | | | 2.58 | |
Webster Financial Corporation | | | 2.30 | |
Sterling Bancorp | | | 2.12 | |
Bio-Rad Laboratories Incorporated Class A | | | 2.10 | |
AngioDynamics Incorporated | | | 2.06 | |
National General Holdings Corporation | | | 2.03 | |
Steris plc | | | 2.02 | |
Zions Bancorporation | | | 1.95 | |
Integer Holdings Corporation | | | 1.90 | |
Steelcase Incorporated Class A | | | 1.82 | |
|
| Sector distribution as of September 30, 20185 |
|

|
| 1 | Reflects the expense ratios as stated in the most recent prospectuses, which include the impact of 0.01% in acquired fund fees and expenses. The expense ratios shown are subject to change and may differ from the annualized expense ratios shown in the financial highlights of this report, which do not include acquired fund fees and expenses. |
| 2 | The manager has contractually committed through July 31, 2019 to waive fees and/or reimburse expenses to the extent necessary to cap the Fund’s Total Annual Fund Operating Expenses After Fee Waivers at 1.35% for Class A, 2.10% for Class C, 1.20% for Administrator Class, and 1.00% for Institutional Class. After this time, the cap may be increased or the commitment to maintain the cap may be terminated only with the approval of the Board of Trustees. Brokerage commissions, stamp duty fees, interest, taxes, acquired fund fees and expenses (if any), and extraordinary expenses are excluded from the expense cap. Without this cap, the Fund’s returns would have been lower. The expense ratio paid by an investor is the net expense ratio (the total annual fund operating expenses after fee waivers) as stated in the prospectuses. |
| 3 | The Russell 2000® Value Index measures the performance of those Russell 2000 companies with lower price/book ratios and lower forecasted growth values. You cannot invest directly in an index. |
| 4 | The ten largest holdings, excluding cash, cash equivalents and any money market funds, are calculated based on the value of the investments divided by total net assets of the Fund. Holdings are subject to change and may have changed since the date specified. |
| 5 | Amounts are calculated based on the total long-term investments of the Fund. These amounts are subject to change and may have changed since the date specified. |
| | | | |
| 8 | | Wells Fargo Intrinsic Small Cap Value Fund | | Fund expenses (unaudited) |
As a shareholder of the Fund, you incur two types of costs: (1) transaction costs, including sales charges (loads) on purchase payments and contingent deferred sales charges (if any) on redemptions and (2) ongoing costs, including management fees, distribution (12b-1) and/or shareholder servicing fees, and other Fund expenses. This example is intended to help you understand your ongoing costs (in dollars) of investing in the Fund and to compare these costs with the ongoing costs of investing in other mutual funds.
The example is based on an investment of $1,000 invested at the beginning of the six-month period and held for the entire period from April 1, 2018 to September 30, 2018.
Actual expenses
The “Actual” line of the table below provides information about actual account values and actual expenses. You may use the information in this line, together with the amount you invested, to estimate the expenses that you paid over the period. Simply divide your account value by $1,000 (for example, an $8,600 account value divided by $1,000 = 8.6), then multiply the result by the number in the “Actual” line under the heading entitled “Expenses paid during period” for your applicable class of shares to estimate the expenses you paid on your account during this period.
Hypothetical example for comparison purposes
The “Hypothetical” line of the table below provides information about hypothetical account values and hypothetical expenses based on the Fund’s actual expense ratio and an assumed rate of return of 5% per year before expenses, which is not the Fund’s actual return. The hypothetical account values and expenses may not be used to estimate the actual ending account balance or expenses you paid for the period. You may use this information to compare the ongoing costs of investing in the Fund and other funds. To do so, compare this 5% hypothetical example with the 5% hypothetical examples that appear in the shareholder reports of the other funds.
Please note that the expenses shown in the table are meant to highlight your ongoing costs only and do not reflect any transactional costs, such as sales charges (loads) and contingent deferred sales charges. Therefore, the “Hypothetical” line of the table is useful in comparing ongoing costs only and will not help you determine the relative total costs of owning different funds. In addition, if these transactional costs were included, your costs would have been higher.
| | | | | | | | | | | | | | | | |
| | | Beginning
account value
4-1-2018 | | | Ending
account value
9-30-2018 | | | Expenses
paid during
the period¹ | | | Annualized net
expense ratio | |
Class A | | | | | | | | | | | | | | | | |
Actual | | $ | 1,000.00 | | | $ | 1,048.32 | | | $ | 6.93 | | | | 1.35 | % |
Hypothetical (5% return before expenses) | | $ | 1,000.00 | | | $ | 1,018.30 | | | $ | 6.83 | | | | 1.35 | % |
Class C | | | | | | | | | | | | | | | | |
Actual | | $ | 1,000.00 | | | $ | 1,044.37 | | | $ | 10.76 | | | | 2.10 | % |
Hypothetical (5% return before expenses) | | $ | 1,000.00 | | | $ | 1,014.54 | | | $ | 10.61 | | | | 2.10 | % |
Administrator Class | | | | | | | | | | | | | | | | |
Actual | | $ | 1,000.00 | | | $ | 1,049.28 | | | $ | 6.16 | | | | 1.20 | % |
Hypothetical (5% return before expenses) | | $ | 1,000.00 | | | $ | 1,019.05 | | | $ | 6.07 | | | | 1.20 | % |
Institutional Class | | | | | | | | | | | | | | | | |
Actual | | $ | 1,000.00 | | | $ | 1,050.23 | | | $ | 5.14 | | | | 1.00 | % |
Hypothetical (5% return before expenses) | | $ | 1,000.00 | | | $ | 1,020.05 | | | $ | 5.06 | | | | 1.00 | % |
| 1 | Expenses paid is equal to the annualized net expense ratio of each class multiplied by the average account value over the period, multiplied by the number of days in the most recent fiscal half-year divided by the number of days in the fiscal year (to reflect the one-half-year period). |
| | | | | | |
| Portfolio of investments—September 30, 2018 (unaudited) | | Wells Fargo Intrinsic Small Cap Value Fund | | | 9 | |
| | | | | | | | | | | | | | | | |
| Security name | | | | | | | | Shares | | | Value | |
| | | | |
Common Stocks: 97.28% | | | | | | | | | | | | | | | | |
| | | | |
Communication Services: 1.35% | | | | | | | | | | | | | | | | |
| | | | |
| Entertainment: 0.96% | | | | | | | | | | | | | | | | |
Lions Gate Entertainment Class B | | | | | | | | | | | 32,875 | | | $ | 765,985 | |
| | | | | | | | | | | | | | | | |
| | | | |
| Media: 0.39% | | | | | | | | | | | | | | | | |
MDC Partners Incorporated Class A † | | | | | | | | | | | 74,210 | | | | 307,972 | |
| | | | | | | | | | | | | | | | |
| | | | |
Consumer Discretionary: 7.98% | | | | | | | | | | | | | | | | |
| | | | |
| Auto Components: 3.72% | | | | | | | | | | | | | | | | |
Dana Incorporated | | | | | | | | | | | 60,978 | | | | 1,138,459 | |
Gentherm Incorporated † | | | | | | | | | | | 18,308 | | | | 832,099 | |
Tenneco Incorporated | | | | | | | | | | | 23,256 | | | | 980,008 | |
| |
| | | | 2,950,566 | |
| | | | | | | | | | | | | | | | |
| | | | |
| Diversified Consumer Services: 0.93% | | | | | | | | | | | | | | | | |
Houghton Mifflin Harcourt Company † | | | | | | | | | | | 105,225 | | | | 736,575 | |
| | | | | | | | | | | | | | | | |
| | | | |
| Hotels, Restaurants & Leisure: 1.14% | | | | | | | | | | | | | | | | |
Playa Hotels & Resorts NV † | | | | | | | | | | | 46,611 | | | | 448,864 | |
Red Robin Gourmet Burgers Incorporated † | | | | | | | | | | | 11,314 | | | | 454,257 | |
| |
| | | | 903,121 | |
| | | | | | | | | | | | | | | | |
| | | | |
| Internet & Direct Marketing Retail: 1.00% | | | | | | | | | | | | | | | | |
Groupon Incorporated † | | | | | | | | | | | 209,071 | | | | 788,198 | |
| | | | | | | | | | | | | | | | |
| | | | |
| Textiles, Apparel & Luxury Goods: 1.19% | | | | | | | | | | | | | | | | |
Carter’s Incorporated | | | | | | | | | | | 9,592 | | | | 945,771 | |
| | | | | | | | | | | | | | | | |
| | | | |
Consumer Staples: 0.68% | | | | | | | | | | | | | | | | |
| | | | |
| Food Products: 0.68% | | | | | | | | | | | | | | | | |
TreeHouse Foods Incorporated † | | | | | | | | | | | 11,223 | | | | 537,021 | |
| | | | | | | | | | | | | | | | |
| | | | |
Energy: 7.62% | | | | | | | | | | | | | | | | |
| | | | |
| Oil, Gas & Consumable Fuels: 7.62% | | | | | | | | | | | | | | | | |
Cimarex Energy Company | | | | | | | | | | | 13,331 | | | | 1,238,983 | |
Concho Resources Incorporated † | | | | | | | | | | | 3,783 | | | | 577,853 | |
GasLog Limited | | | | | | | | | | | 38,909 | | | | 768,453 | |
Matador Resources Company † | | | | | | | | | | | 42,622 | | | | 1,408,657 | |
WPX Energy Incorporated † | | | | | | | | | | | 101,680 | | | | 2,045,802 | |
| |
| | | | 6,039,748 | |
| | | | | | | | | | | | | | | | |
| | | | |
Financials: 25.24% | | | | | | | | | | | | | | | | |
| | | | |
| Banks: 17.07% | | | | | | | | | | | | | | | | |
Ameris Bancorp | | | | | | | | | | | 25,936 | | | | 1,185,275 | |
First Midwest Bancorp Incorporated | | | | | | | | | | | 26,068 | | | | 693,148 | |
LegacyTexas Financial Group | | | | | | | | | | | 31,925 | | | | 1,360,005 | |
PacWest Bancorp | | | | | | | | | | | 23,873 | | | | 1,137,548 | |
Pinnacle Financial Partners Incorporated | | | | | | | | | | | 19,966 | | | | 1,200,955 | |
The accompanying notes are an integral part of these financial statements.
| | | | |
| 10 | | Wells Fargo Intrinsic Small Cap Value Fund | | Portfolio of investments—September 30, 2018 (unaudited) |
| | | | | | | | | | | | | | | | |
| Security name | | | | | | | | Shares | | | Value | |
|
| Banks (continued) | |
Renasant Corporation | | | | | | | | | | | 24,418 | | | $ | 1,006,266 | |
Sterling Bancorp | | | | | | | | | | | 76,355 | | | | 1,679,810 | |
United Community Bank | | | | | | | | | | | 40,533 | | | | 1,130,465 | |
Webster Financial Corporation | | | | | | | | | | | 30,944 | | | | 1,824,458 | |
Wintrust Financial Corporation | | | | | | | | | | | 9,069 | | | | 770,321 | |
Zions Bancorporation | | | | | | | | | | | 30,741 | | | | 1,541,661 | |
| |
| | | | 13,529,912 | |
| | | | | | | | | | | | | | | | |
| | | | |
| Capital Markets: 1.58% | | | | | | | | | | | | | | | | |
Stifel Financial Corporation | | | | | | | | | | | 24,413 | | | | 1,251,410 | |
| | | | | | | | | | | | | | | | |
| | | | |
| Insurance: 4.82% | | | | | | | | | | | | | | | | |
CNO Financial Group Incorporated | | | | | | | | | | | 65,032 | | | | 1,379,979 | |
First American Financial Corporation | | | | | | | | | | | 16,167 | | | | 834,056 | |
National General Holdings Corporation | | | | | | | | | | | 59,944 | | | | 1,608,897 | |
| |
| | | | 3,822,932 | |
| | | | | | | | | | | | | | | | |
| | | | |
| Thrifts & Mortgage Finance: 1.77% | | | | | | | | | | | | | | | | |
Essent Group Limited † | | | | | | | | | | | 31,596 | | | | 1,398,123 | |
| | | | | | | | | | | | | | | | |
| | | | |
Health Care: 11.08% | | | | | | | | | | | | | | | | |
| | | | |
| Health Care Equipment & Supplies: 7.39% | | | | | | | | | | | | | | | | |
AngioDynamics Incorporated † | | | | | | | | | | | 75,173 | | | | 1,634,261 | |
Haemonetics Corporation † | | | | | | | | | | | 9,751 | | | | 1,117,270 | |
Integer Holdings Corporation † | | | | | | | | | | | 18,129 | | | | 1,503,801 | |
Steris plc | | | | | | | | | | | 13,973 | | | | 1,598,511 | |
| |
| | | | 5,853,843 | |
| | | | | | | | | | | | | | | | |
| | | | |
| Life Sciences Tools & Services: 3.69% | | | | | | | | | | | | | | | | |
Bio-Rad Laboratories Incorporated Class A † | | | | | | | | | | | 5,313 | | | | 1,662,916 | |
Bruker Corporation | | | | | | | | | | | 37,850 | | | | 1,266,083 | |
| |
| | | | 2,928,999 | |
| | | | | | | | | | | | | | | | |
| | | | |
Industrials: 21.02% | | | | | | | | | | | | | | | | |
| | | | |
| Aerospace & Defense: 1.19% | | | | | | | | | | | | | | | | |
Aerojet Rocketdyne Holdings † | | | | | | | | | | | 27,794 | | | | 944,718 | |
| | | | | | | | | | | | | | | | |
| | | | |
| Airlines: 1.41% | | | | | | | | | | | | | | | | |
Spirit Airlines Incorporated †« | | | | | | | | | | | 23,857 | | | | 1,120,563 | |
| | | | | | | | | | | | | | | | |
| | | | |
| Building Products: 1.35% | | | | | | | | | | | | | | | | |
Masonite International Corporation † | | | | | | | | | | | 16,765 | | | | 1,074,637 | |
| | | | | | | | | | | | | | | | |
| | | | |
| Commercial Services & Supplies: 4.96% | | | | | | | | | | | | | | | | |
Interface Incorporated | | | | | | | | | | | 54,864 | | | | 1,281,074 | |
KAR Auction Services Incorporated | | | | | | | | | | | 20,184 | | | | 1,204,783 | |
Steelcase Incorporated Class A | | | | | | | | | | | 77,991 | | | | 1,442,834 | |
| |
| | | | 3,928,691 | |
| | | | | | | | | | | | | | | | |
The accompanying notes are an integral part of these financial statements.
| | | | | | |
| Portfolio of investments—September 30, 2018 (unaudited) | | Wells Fargo Intrinsic Small Cap Value Fund | | | 11 | |
| | | | | | | | | | | | | | | | |
| Security name | | | | | | | | Shares | | | Value | |
| | | | |
| Machinery: 5.80% | | | | | | | | | | | | | | | | |
Altra Holdings Incorporated « | | | | | | | | | | | 28,012 | | | $ | 1,156,896 | |
ITT Incorporated | | | | | | | | | | | 17,137 | | | | 1,049,813 | |
Rexnord Corporation † | | | | | | | | | | | 40,907 | | | | 1,259,936 | |
SPX Corporation † | | | | | | | | | | | 33,919 | | | | 1,129,842 | |
| |
| | | | 4,596,487 | |
| | | | | | | | | | | | | | | | |
| | | | |
| Road & Rail: 2.43% | | | | | | | | | | | | | | | | |
Avis Budget Group Incorporated † | | | | | | | | | | | 16,998 | | | | 546,316 | |
Genesee & Wyoming Incorporated Class A † | | | | | | | | | | | 15,146 | | | | 1,378,135 | |
| | | | |
| | | | | | | | | | | | | | | 1,924,451 | |
| | | | | | | | | | | | | | | | |
| | | | |
| Trading Companies & Distributors: 3.88% | | | | | | | | | | | | | | | | |
Air Lease Corporation | | | | | | | | | | | 22,757 | | | | 1,044,091 | |
GATX Corporation « | | | | | | | | | | | 9,159 | | | | 793,078 | |
MRC Global Incorporated † | | | | | | | | | | | 65,953 | | | | 1,237,938 | |
| | | | |
| | | | | | | | | | | | | | | 3,075,107 | |
| | | | | | | | | | | | | | | | |
| | | | |
Information Technology: 10.03% | | | | | | | | | | | | | | | | |
| | | | |
| Communications Equipment: 1.23% | | | | | | | | | | | | | | | | |
Infinera Corporation † | | | | | | | | | | | 133,368 | | | | 973,586 | |
| | | | | | | | | | | | | | | | |
| | | | |
| Electronic Equipment, Instruments & Components: 6.03% | | | | | | | | | | | | | | | | |
Anixter International Incorporated † | | | | | | | | | | | 17,263 | | | | 1,213,589 | |
Avnet Incorporated | | | | | | | | | | | 29,597 | | | | 1,325,058 | |
Synnex Corporation | | | | | | | | | | | 9,789 | | | | 829,128 | |
Zebra Technologies Corporation Class A † | | | | | | | | | | | 7,981 | | | | 1,411,280 | |
| | | | |
| | | | | | | | | | | | | | | 4,779,055 | |
| | | | | | | | | | | | | | | | |
| | | | |
| IT Services: 2.48% | | | | | | | | | | | | | | | | |
Conduent Incorporated † | | | | | | | | | | | 59,623 | | | | 1,342,710 | |
WEX Incorporated † | | | | | | | | | | | 3,086 | | | | 619,545 | |
| | | | |
| | | | | | | | | | | | | | | 1,962,255 | |
| | | | | | | | | | | | | | | | |
| | | | |
| Software: 0.29% | | | | | | | | | | | | | | | | |
Apptio Incorporated Class A † | | | | | | | | | | | 6,276 | | | | 231,961 | |
| | | | | | | | | | | | | | | | |
| | | | |
Materials: 2.72% | | | | | | | | | | | | | | | | |
| | | | |
| Metals & Mining: 2.72% | | | | | | | | | | | | | | | | |
Reliance Steel & Aluminum Company | | | | | | | | | | | 14,004 | | | | 1,194,401 | |
Royal Gold Incorporated | | | | | | | | | | | 12,460 | | | | 960,168 | |
| | | | |
| | | | | | | | | | | | | | | 2,154,569 | |
| | | | | | | | | | | | | | | | |
| | | | |
Real Estate: 9.56% | | | | | | | | | | | | | | | | |
| | | | |
| Equity REITs: 9.56% | | | | | | | | | | | | | | | | |
Cousins Properties Incorporated | | | | | | | | | | | 102,756 | | | | 913,501 | |
Four Corners Property Trust Incorporated | | | | | | | | | | | 47,010 | | | | 1,207,687 | |
Hudson Pacific Properties Incorporated | | | | | | | | | | | 39,313 | | | | 1,286,321 | |
Outfront Media Incorporated | | | | | | | | | | | 36,170 | | | | 721,592 | |
The accompanying notes are an integral part of these financial statements.
| | | | |
| 12 | | Wells Fargo Intrinsic Small Cap Value Fund | | Portfolio of investments—September 30, 2018 (unaudited) |
| | | | | | | | | | | | | | | | |
| Security name | | | | | | | | Shares | | | Value | |
| | | | |
| Equity REITs (continued) | | | | | | | | | | | | | | | | |
Physicians Realty Trust | | | | | | | | | | | 76,640 | | | $ | 1,292,150 | |
Retail Opportunity Investment Corporation | | | | | | | | | | | 67,205 | | | | 1,254,717 | |
Taubman Centers Incorporated | | | | | | | | | | | 15,039 | | | | 899,783 | |
| | | | |
| | | | | | | | | | | | | | | 7,575,751 | |
| | | | | | | | | | | | | | | | |
| | | | |
Total Common Stocks (Cost $61,469,212) | | | | | | | | | | | | | | | 77,102,007 | |
| | | | | | | | | | | | | | | | |
| | | | |
| | | Yield | | | | | | | | | | |
| Short-Term Investments: 5.29% | | | | | | | | | | | | | | | | |
| | | | |
| Investment Companies: 5.29% | | | | | | | | | | | | | | | | |
Securities Lending Cash Investment LLC (l)(r)(u) | | | 2.17 | % | | | | | | | 2,091,609 | | | | 2,091,818 | |
Wells Fargo Government Money Market Fund Select Class (l)(u) | | | 1.99 | | | | | | | | 2,103,322 | | | | 2,103,322 | |
| | | | |
Total Short-Term Investments (Cost $4,195,071) | | | | | | | | | | | | | | | 4,195,140 | |
| | | | | | | | | | | | | | | | |
| | | | | | | | |
| Total investments in securities (Cost $65,664,283) | | | 102.57 | % | | | 81,297,147 | |
Other assets and liabilities, net | | | (2.57 | ) | | | (2,036,954 | ) |
| | | | | | | | |
| Total net assets | | | 100.00 | % | | $ | 79,260,193 | |
| | | | | | | | |
| † | Non-income-earning security |
| « | All or a portion of this security is on loan. |
| (l) | The issuer of the security is an affiliated person of the Fund as defined in the Investment Company Act of 1940. |
| (r) | The investment is a non-registered investment company purchased with cash collateral received from securities on loan. |
| (u) | The rate represents the 7-day annualized yield at period end. |
Abbreviations:
| REIT | Real estate investment trust |
Investments in Affiliates
An affiliated investment is an investment in which the Fund owns at least 5% of the outstanding voting shares of the issuer or as a result of other relationships, such as the Fund and the issuer having the same investment manager. Transactions with issuers that were either affiliated persons of the Portfolio at the beginning of the period or the end of the period were as follows:
| | | | | | | | | | | | | | | | | | | | | | | | | | | | | | | | | | | | |
| | | Shares,
beginning of
period | | | Shares
purchased | | | Shares
sold | | | Shares,
end of
period | | | Net
realized
gains
(losses) | | | Net
change in
unrealized
gains
(losses) | | | Income
from
affiliated
securities | | | Value,
end
of period | | | % of
net
assets | |
Short-Term Investments | | | | | | | | | | | | | | | | | | | | | | | | | | | | | | | | | | | | |
Investment Companies | | | | | | | | | | | | | | | | | | | | | | | | | | | | | | | | | | | | |
Securities Lending Cash Investment LLC | | | 4,579,892 | | | | 13,774,183 | | | | 16,262,466 | | | | 2,091,609 | | | $ | (32 | ) | | $ | 0 | | | $ | 9,659 | | | $ | 2,091,818 | | | | | |
Wells Fargo Government Money Market Fund Select Class | | | 893,311 | | | | 9,723,081 | | | | 8,513,070 | | | | 2,103,322 | | | | 0 | | | | 0 | | | | 16,843 | | | | 2,103,322 | | | | | |
| | | | | | | | | | | | | | | | | | | | | | | | | | | | | | | | | | | | |
| | | | | | | | | | | | | | | | | | $ | (32 | ) | | $ | 0 | | | $ | 26,502 | | | $ | 4,195,140 | | | | 5.29 | % |
| | | | | | | | | | | | | | | | | | | | | | | | | | | | | | | | | | | | |
The accompanying notes are an integral part of these financial statements.
| | | | | | |
| Statement of assets and liabilities—September 30, 2018 (unaudited) | | Wells Fargo Intrinsic Small Cap Value Fund | | | 13 | |
| | | | |
| | | | |
| |
Assets | | | | |
Investments in unaffiliated securities (including $1,944,156 of securities loaned), at value (cost $61,469,212) | | $ | 77,102,007 | |
Investments in affiliated securities, at value (cost $4,195,071) | | | 4,195,140 | |
Receivable for investments sold | | | 1,346,229 | |
Receivable for Fund shares sold | | | 4,266 | |
Receivable for dividends | | | 64,739 | |
Receivable for securities lending income | | | 3,545 | |
Prepaid expenses and other assets | | | 41,347 | |
| | | | |
Total assets | | | 82,757,273 | |
| | | | |
| |
Liabilities | | | | |
Payable upon receipt of securities loaned | | | 2,091,325 | |
Payable for investments purchased | | | 1,219,003 | |
Payable for Fund shares redeemed | | | 90,295 | |
Management fee payable | | | 43,919 | |
Administration fees payable | | | 11,967 | |
Trustees’ fees and expenses payable | | | 928 | |
Distribution fee payable | | | 481 | |
Accrued expenses and other liabilities | | | 39,162 | |
| | | | |
Total liabilities | | | 3,497,080 | |
| | | | |
Total net assets | | $ | 79,260,193 | |
| | | | |
| |
NET ASSETS CONSIST OF | | | | |
Paid-in capital | | $ | 61,336,984 | |
Total distributable earnings | | | 17,923,209 | |
| | | | |
Total net assets | | $ | 79,260,193 | |
| | | | |
| |
COMPUTATION OF NET ASSET VALUE AND OFFERING PRICE PER SHARE | | | | |
Net assets – Class A | | $ | 50,220,068 | |
Shares outstanding – Class A1 | | | 1,522,592 | |
Net asset value per share – Class A | | | $32.98 | |
Maximum offering price per share – Class A2 | | | $34.99 | |
Net assets – Class C | | $ | 706,676 | |
Shares outstanding – Class C1 | | | 23,091 | |
Net asset value per share – Class C | | | $30.60 | |
Net assets – Administrator Class | | $ | 1,265,406 | |
Shares outstanding – Administrator Class1 | | | 37,620 | |
Net asset value per share – Administrator Class | | | $33.64 | |
Net assets – Institutional Class | | $ | 27,068,043 | |
Shares outstanding – Institutional Class1 | | | 794,172 | |
Net asset value per share – Institutional Class | | | $34.08 | |
| 1 | The Fund has an unlimited number of authorized shares. |
| 2 | Maximum offering price is computed as 100/94.25 of net asset value. On investments of $50,000 or more, the offering price is reduced. |
The accompanying notes are an integral part of these financial statements.
| | | | |
| 14 | | Wells Fargo Intrinsic Small Cap Value Fund | | Statement of operations—six months ended September 30, 2018 (unaudited) |
| | | | |
| | | | |
| |
Investment income | | | | |
Dividends (net of foreign withholding taxes of $872) | | $ | 520,746 | |
Income from affiliated securities | | | 26,502 | |
| | | | |
Total investment income | | | 547,248 | |
| | | | |
| |
Expenses | | | | |
Management fee | | | 344,804 | |
Administration fees | | | | |
Class A | | | 53,917 | |
Class C | | | 872 | |
Administrator Class | | | 813 | |
Institutional Class | | | 18,005 | |
Shareholder servicing fees | | | | |
Class A | | | 64,187 | |
Class C | | | 1,038 | |
Administrator Class | | | 1,563 | |
Distribution fee | | | | |
Class C | | | 3,115 | |
Custody and accounting fees | | | 2,326 | |
Professional fees | | | 19,417 | |
Registration fees | | | 30,105 | |
Shareholder report expenses | | | 17,855 | |
Trustees’ fees and expenses | | | 11,535 | |
Other fees and expenses | | | 5,901 | |
| | | | |
Total expenses | | | 575,453 | |
Less: Fee waivers and/or expense reimbursements | | | (74,120 | ) |
| | | | |
Net expenses | | | 501,333 | |
| | | | |
Net investment income | | | 45,915 | |
| | | | |
| |
REALIZED AND UNREALIZED GAINS (LOSSES) ON INVESTMENTS | | | | |
| |
Net realized gains (losses) on: | | | | |
Unaffiliated securities | | | 2,754,542 | |
Affiliated securities | | | (32 | ) |
| | | | |
Net realized gains on investments | | | 2,754,510 | |
Net change in unrealized gains (losses) on investments | | | 1,144,054 | |
| | | | |
Net realized and unrealized gains (losses) on investments | | | 3,898,564 | |
| | | | |
Net increase in net assets resulting from operations | | $ | 3,944,479 | |
| | | | |
The accompanying notes are an integral part of these financial statements.
| | | | | | |
| Statement of changes in net assets | | Wells Fargo Intrinsic Small Cap Value Fund | | | 15 | |
| | | | | | | | | | | | | | | | |
| | | Six months ended
September 30, 2018
(unaudited) | | | Year ended
March 31, 2018 | |
| | | | |
Operations | | | | | | | | | | | | | | | | |
Net investment income (loss) | | | | | | $ | 45,915 | | | | | | | $ | (122,689 | ) |
Net realized gains on investments | | | | | | | 2,754,510 | | | | | | | | 8,079,158 | |
Net change in unrealized gains (losses) on investments | | | | | | | 1,144,054 | | | | | | | | (1,592,607 | ) |
| | | | |
Net increase in net assets resulting from operations | | | | | | | 3,944,479 | | | | | | | | 6,363,862 | |
| | | | |
| | | | |
Capital share transactions | | | Shares | | | | | | | | Shares | | | | | |
Proceeds from shares sold | | | | | | | | | | | | | | | | |
Class A | | | 12,471 | | | | 411,348 | | | | 56,287 | | | | 1,697,291 | |
Class C | | | 965 | | | | 29,611 | | | | 3,291 | | | | 88,944 | |
Administrator Class | | | 2,290 | | | | 77,297 | | | | 9,745 | | | | 302,977 | |
Institutional Class | | | 26,346 | | | | 894,764 | | | | 134,112 | | | | 4,360,186 | |
| | | | |
| | | | | | | 1,413,020 | | | | | | | | 6,449,398 | |
| | | | |
Payment for shares redeemed | | | | | | | | | | | | | | | | |
Class A | | | (110,690 | ) | | | (3,641,219 | ) | | | (261,867 | ) | | | (7,767,468 | ) |
Class C | | | (6,535 | ) | | | (199,866 | ) | | | (11,065 | ) | | | (298,907 | ) |
Administrator Class | | | (6,673 | ) | | | (215,749 | ) | | | (115,713 | ) | | | (3,702,140 | ) |
Institutional Class | | | (95,910 | ) | | | (3,251,409 | ) | | | (1,288,079 | ) | | | (37,985,828 | ) |
| | | | |
| | | | | | | (7,308,243 | ) | | | | | | | (49,754,343 | ) |
| | | | |
Net decrease in net assets resulting from capital share transactions | | | | | | | (5,895,223 | ) | | | | | | | (43,304,945 | ) |
| | | | |
Total decrease in net assets | | | | | | | (1,950,744 | ) | | | | | | | (36,941,083 | ) |
| | | | |
| | | | |
Net assets | | | | | | | | | | | | | | | | |
Beginning of period | | | | | | | 81,210,937 | | | | | | | | 118,152,020 | |
| | | | |
End of period | | | | | | $ | 79,260,193 | | | | | | | $ | 81,210,937 | |
| | | | |
The accompanying notes are an integral part of these financial statements.
| | | | |
| 16 | | Wells Fargo Intrinsic Small Cap Value Fund | | Financial highlights |
(For a share outstanding throughout each period)
| | | | | | | | | | | | | | | | | | | | | | | | | | | | |
| | | Six months ended
September 30, 2018 (unaudited) | | | Year ended March 31 | | | Year ended October 31, 2013 | |
| CLASS A | | 2018 | | | 2017 | | | 2016 | | | 2015 | | | 20141 | |
Net asset value, beginning of period | | | $31.46 | | | | $28.92 | | | | $23.49 | | | | $25.50 | | | | $23.53 | | | | $22.16 | | | | $15.96 | |
Net investment income (loss) | | | 0.00 | 2 | | | (0.08 | )3 | | | (0.15 | )3 | | | 0.22 | 3 | | | 0.04 | | | | 0.02 | | | | 0.03 | |
Net realized and unrealized gains (losses) on investments | | | 1.52 | | | | 2.62 | | | | 5.71 | | | | (2.09 | ) | | | 1.93 | | | | 1.35 | | | | 6.17 | |
| | | | | | | | | | | | | | | | | | | | | | | | | | | | |
Total from investment operations | | | 1.52 | | | | 2.54 | | | | 5.56 | | | | (1.87 | ) | | | 1.97 | | | | 1.37 | | | | 6.20 | |
Distributions to shareholders from | | | | | | | | | | | | | | | | | | | | | | | | | | | | |
Net investment income | | | 0.00 | | | | 0.00 | | | | (0.13 | ) | | | (0.14 | ) | | | 0.00 | | | | 0.00 | | | | 0.00 | |
Net asset value, end of period | | | $32.98 | | | | $31.46 | | | | $28.92 | | | | $23.49 | | | | $25.50 | | | | $23.53 | | | | $22.16 | |
Total return4 | | | 4.83 | % | | | 8.78 | % | | | 23.68 | % | | | (7.36 | )% | | | 8.37 | % | | | 6.33 | % | | | 38.66 | % |
Ratios to average net assets (annualized) | | | | | | | | | | | | | | | | | | | | | | | | | | | | |
Gross expenses | | | 1.52 | % | | | 1.54 | % | | | 1.48 | % | | | 1.47 | % | | | 1.46 | % | | | 1.57 | % | | | 1.56 | % |
Net expenses | | | 1.35 | % | | | 1.35 | % | | | 1.35 | % | | | 1.35 | % | | | 1.40 | % | | | 1.44 | % | | | 1.45 | % |
Net investment income (loss) | | | 0.00 | % | | | (0.26 | )% | | | (0.57 | )% | | | 0.95 | % | | | 0.15 | % | | | 0.19 | % | | | 0.11 | % |
Supplemental data | | | | | | | | | | | | | | | | | | | | | | | | | | | | |
Portfolio turnover rate | | | 15 | % | | | 27 | % | | | 142 | % | | | 66 | % | | | 60 | % | | | 22 | % | | | 75 | % |
Net assets, end of period (000s omitted) | | | $50,220 | | | | $50,993 | | | | $52,817 | | | | $49,898 | | | | $817 | | | | $908 | | | | $967 | |
| 1 | For the five months ended March 31, 2014. The Fund changed its fiscal year end from October 31 to March 31, effective March 31, 2014. |
| 2 | Amount is less than $0.005. |
| 3 | Calculated based upon average shares outstanding |
| 4 | Total return calculations do not include any sales charges. Returns for periods of less than one year are not annualized. |
The accompanying notes are an integral part of these financial statements.
| | | | | | |
| Financial highlights | | Wells Fargo Intrinsic Small Cap Value Fund | | | 17 | |
(For a share outstanding throughout each period)
| | | | | | | | | | | | | | | | | | | | | | | | | | | | |
| | | Six months ended
September 30, 2018 (unaudited) | | | Year ended March 31 | | | Year ended October 31, 2013 | |
| CLASS C | | 2018 | | | 2017 | | | 2016 | | | 2015 | | | 20141 | |
Net asset value, beginning of period | | | $29.30 | | | | $27.14 | | | | $22.11 | | | | $24.04 | | | | $22.35 | | | | $21.12 | | | | $15.32 | |
Net investment loss | | | (0.12 | )2 | | | (0.28 | )2 | | | (0.39 | )2 | | | (0.00 | )2,3 | | | (0.14 | )2 | | | (0.05 | ) | | | (0.13 | )2 |
Net realized and unrealized gains (losses) on investments | | | 1.42 | | | | 2.44 | | | | 5.42 | | | | (1.93 | ) | | | 1.83 | | | | 1.28 | | | | 5.93 | |
| | | | | | | | | | | | | | | | | | | | | | | | | | | | |
Total from investment operations | | | 1.30 | | | | 2.16 | | | | 5.03 | | | | (1.93 | ) | | | 1.69 | | | | 1.23 | | | | 5.80 | |
Net asset value, end of period | | | $30.60 | | | | $29.30 | | | | $27.14 | | | | $22.11 | | | | $24.04 | | | | $22.35 | | | | $21.12 | |
Total return4 | | | 4.44 | % | | | 7.96 | % | | | 22.75 | % | | | (8.03 | )% | | | 7.56 | % | | | 6.02 | % | | | 37.60 | % |
Ratios to average net assets (annualized) | | | | | | | | | | | | | | | | | | | | | | | | |
Gross expenses | | | 2.27 | % | | | 2.29 | % | | | 2.22 | % | | | 2.22 | % | | | 2.21 | % | | | 2.33 | % | | | 2.30 | % |
Net expenses | | | 2.10 | % | | | 2.10 | % | | | 2.10 | % | | | 2.12 | % | | | 2.15 | % | | | 2.19 | % | | | 2.20 | % |
Net investment loss | | | (0.76 | )% | | | (1.02 | )% | | | (1.52 | )% | | | (0.00 | )% | | | (0.62 | )% | | | (0.54 | )% | | | (0.66 | )% |
Supplemental data | | | | | | | | | | | | | | | | | | | | | | | | |
Portfolio turnover rate | | | 15 | % | | | 27 | % | | | 142 | % | | | 66 | % | | | 60 | % | | | 22 | % | | | 75 | % |
Net assets, end of period (000s omitted) | | | $707 | | | | $840 | | | | $989 | | | | $285 | | | | $304 | | | | $429 | | | | $418 | |
| 1 | For the five months ended March 31, 2014. The Fund changed its fiscal year end from October 31 to March 31, effective March 31, 2014. |
| 2 | Calculated based upon average shares outstanding |
| 3 | Amount is more than $(0.005). |
| 4 | Total return calculations do not include any sales charges. Returns for periods of less than one year are not annualized. |
The accompanying notes are an integral part of these financial statements.
| | | | |
| 18 | | Wells Fargo Intrinsic Small Cap Value Fund | | Financial highlights |
(For a share outstanding throughout each period)
| | | | | | | | | | | | | | | | | | | | | | | | | | | | |
| | | Six months ended
September 30, 2018 (unaudited) | | | Year ended March 31 | | | Year ended October 31, 2013 | |
| ADMINISTRATOR CLASS | | 2018 | | | 2017 | | | 2016 | | | 2015 | | | 20141 | |
Net asset value, beginning of period | | | $32.06 | | | | $29.43 | | | | $23.89 | | | | $25.95 | | | | $23.90 | | | | $22.49 | | | | $16.16 | |
Net investment income (loss) | | | 0.03 | 2 | | | (0.03 | )2 | | | (0.10 | )2 | | | 0.22 | 2 | | | 0.07 | 2 | | | 0.04 | 2 | | | 0.09 | |
Net realized and unrealized gains (losses) on investments | | | 1.55 | | | | 2.66 | | | | 5.80 | | | | (2.08 | ) | | | 1.98 | | | | 1.37 | | | | 6.24 | |
| | | | | | | | | | | | | | | | | | | | | | | | | | | | |
Total from investment operations | | | 1.58 | | | | 2.63 | | | | 5.70 | | | | (1.86 | ) | | | 2.05 | | | | 1.41 | | | | 6.33 | |
Distributions to shareholders from | | | | | | | | | | | | | | | | | | | | | | | | | | | | |
Net investment income | | | 0.00 | | | | 0.00 | | | | (0.16 | ) | | | (0.20 | ) | | | 0.00 | | | | (0.00 | )3 | | | 0.00 | |
Net asset value, end of period | | | $33.64 | | | | $32.06 | | | | $29.43 | | | | $23.89 | | | | $25.95 | | | | $23.90 | | | | $22.49 | |
Total return4 | | | 4.93 | % | | | 8.94 | % | | | 23.86 | % | | | (7.17 | )% | | | 8.58 | % | | | 6.43 | % | | | 38.99 | % |
Ratios to average net assets (annualized) | | | | | | | | | | | | | | | | | | | | | | | | | | | | |
Gross expenses | | | 1.44 | % | | | 1.46 | % | | | 1.40 | % | | | 1.37 | % | | | 1.30 | % | | | 1.42 | % | | | 1.40 | % |
Net expenses | | | 1.20 | % | | | 1.20 | % | | | 1.20 | % | | | 1.20 | % | | | 1.20 | % | | | 1.20 | % | | | 1.20 | % |
Net investment income (loss) | | | 0.16 | % | | | (0.10 | )% | | | (0.38 | )% | | | 0.91 | % | | | 0.27 | % | | | 0.45 | % | | | 0.52 | % |
Supplemental data | | | | | | | | | | | | | | | | | | | | | | | | | | | | |
Portfolio turnover rate | | | 15 | % | | | 27 | % | | | 142 | % | | | 66 | % | | | 60 | % | | | 22 | % | | | 75 | % |
Net assets, end of period (000s omitted) | | | $1,265 | | | | $1,347 | | | | $4,355 | | | | $4,893 | | | | $5,110 | | | | $10,498 | | | | $11,182 | |
| 1 | For the five months ended March 31, 2014. The Fund changed its fiscal year end from October 31 to March 31, effective March 31, 2014. |
| 2 | Calculated based upon average shares outstanding |
| 3 | Amount is less than $0.005. |
| 4 | Returns for periods of less than one year are not annualized. |
The accompanying notes are an integral part of these financial statements.
| | | | | | |
| Financial highlights | | Wells Fargo Intrinsic Small Cap Value Fund | | | 19 | |
(For a share outstanding throughout each period)
| | | | | | | | | | | | | | | | | | | | | | | | | | | | |
| | | Six months ended
September 30, 2018 (unaudited) | | | Year ended March 31 | | | Year ended October 31, 2013 | |
| INSTITUTIONAL CLASS | | 2018 | | | 2017 | | | 2016 | | | 2015 | | | 20141 | |
Net asset value, beginning of period | | | $32.45 | | | | $29.73 | | | | $24.13 | | | | $26.22 | | | | $24.19 | | | | $22.78 | | | | $16.32 | |
Net investment income (loss) | | | 0.06 | 2 | | | 0.03 | 2 | | | (0.07 | )2 | | | 0.33 | | | | 0.14 | 2 | | | 0.06 | 2 | | | 0.12 | 2 |
Net realized and unrealized gains (losses) on investments | | | 1.57 | | | | 2.69 | | | | 5.89 | | | | (2.17 | ) | | | 1.99 | | | | 1.39 | | | | 6.34 | |
| | | | | | | | | | | | | | | | | | | | | | | | | | | | |
Total from investment operations | | | 1.63 | | | | 2.72 | | | | 5.82 | | | | (1.84 | ) | | | 2.13 | | | | 1.45 | | | | 6.46 | |
Distributions to shareholders from | | | | | | | | | | | | | | | | | | | | | | | | | | | | |
Net investment income | | | 0.00 | | | | 0.00 | | | | (0.22 | ) | | | (0.25 | ) | | | (0.10 | ) | | | (0.04 | ) | | | 0.00 | |
Net asset value, end of period | | | $34.08 | | | | $32.45 | | | | $29.73 | | | | $24.13 | | | | $26.22 | | | | $24.19 | | | | $22.78 | |
Total return3 | | | 5.02 | % | | | 9.15 | % | | | 24.14 | % | | | (7.02 | )% | | | 8.83 | % | | | 6.50 | % | | | 39.40 | % |
Ratios to average net assets (annualized) | | | | | | | | | | | | | | | | | | | | | | | | | | | | |
Gross expenses | | | 1.19 | % | | | 1.21 | % | | | 1.15 | % | | | 1.12 | % | | | 1.03 | % | | | 1.15 | % | | | 1.10 | % |
Net expenses | | | 1.00 | % | | | 1.00 | % | | | 1.00 | % | | | 1.00 | % | | | 1.00 | % | | | 1.00 | % | | | 1.00 | % |
Net investment income (loss) | | | 0.35 | % | | | 0.08 | % | | | (0.26 | )% | | | 1.10 | % | | | 0.57 | % | | | 0.64 | % | | | 0.58 | % |
Supplemental data | | | | | | | | | | | | | | | | | | | | | | | | | | | | |
Portfolio turnover rate | | | 15 | % | | | 27 | % | | | 142 | % | | | 66 | % | | | 60 | % | | | 22 | % | | | 75 | % |
Net assets, end of period (000s omitted) | | | $27,068 | | | | $28,032 | | | | $59,991 | | | | $71,072 | | | | $84,563 | | | | $79,312 | | | | $71,934 | |
| 1 | For the five months ended March 31, 2014. The Fund changed its fiscal year end from October 31 to March 31, effective March 31, 2014. |
| 2 | Calculated based upon average shares outstanding |
| 3 | Returns for periods of less than one year are not annualized. |
The accompanying notes are an integral part of these financial statements.
| | | | |
| 20 | | Wells Fargo Intrinsic Small Cap Value Fund | | Notes to financial statements (unaudited) |
1. ORGANIZATION
Wells Fargo Funds Trust (the “Trust”), a Delaware statutory trust organized on March 10, 1999, is an open-end management investment company registered under the Investment Company Act of 1940, as amended (the “1940 Act”). As an investment company, the Trust follows the accounting and reporting guidance in Financial Accounting Standards Board (“FASB”) Accounting Standards Codification Topic 946, Financial Services – Investment Companies. These financial statements report on the Wells Fargo Intrinsic Small Cap Value Fund (the “Fund”) which is a diversified series of the Trust.
2. SIGNIFICANT ACCOUNTING POLICIES
The following significant accounting policies, which are consistently followed in the preparation of the financial statements of the Fund, are in conformity with U.S. generally accepted accounting principles which require management to make estimates and assumptions that affect the reported amounts of assets and liabilities, disclosure of contingent assets and liabilities at the date of the financial statements, and the reported amounts of revenues and expenses during the reporting period. Actual results could differ from those estimates.
Securities valuation
All investments are valued each business day as of the close of regular trading on the New York Stock Exchange (generally 4 p.m. Eastern Time), although the Fund may deviate from this calculation time under unusual or unexpected circumstances.
Equity securities that are listed on a foreign or domestic exchange or market are valued at the official closing price or, if none, the last sales price. If no sale occurs on the principal exchange or market that day, a fair value price will be determined in accordance with the Fund’s Valuation Procedures.
Investments in registered open-end investment companies are valued at net asset value. Interests in non-registered investment companies that are redeemable at net asset value are fair valued normally at net asset value.
Investments which are not valued using any of the methods discussed above are valued at their fair value, as determined in good faith by the Board of Trustees of the Fund. The Board of Trustees has established a Valuation Committee comprised of the Trustees and has delegated to it the authority to take any actions regarding the valuation of portfolio securities that the Valuation Committee deems necessary or appropriate, including determining the fair value of portfolio securities, unless the determination has been delegated to the Wells Fargo Asset Management Pricing Committee at Wells Fargo Funds Management, LLC (“Funds Management”). The Board of Trustees retains the authority to make or ratify any valuation decisions or approve any changes to the Valuation Procedures as it deems appropriate. On a quarterly basis, the Board of Trustees receives reports on any valuation actions taken by the Valuation Committee or the Wells Fargo Asset Management Pricing Committee which may include items for ratification.
Securities lending
The Fund may lend its securities from time to time in order to earn additional income in the form of fees or interest on securities received as collateral or the investment of any cash received as collateral. The Fund continues to receive interest or dividends on the securities loaned. The Fund receives collateral in the form of cash or securities with a value at least equal to the value of the securities on loan. The value of the loaned securities is determined at the close of each business day and any additional required collateral is delivered to the Fund on the next business day. In a securities lending transaction, the net asset value of the Fund will be affected by an increase or decrease in the value of the securities loaned and by an increase or decrease in the value of the instrument in which collateral is invested. The amount of securities lending activity undertaken by the Fund fluctuates from time to time. In the event of default or bankruptcy by the borrower, the Fund may be prevented from recovering the loaned securities or gaining access to the collateral or may experience delays or costs in doing so. In addition, the investment of any cash collateral received may lose all or part of its value. The Fund has the right under the lending agreement to recover the securities from the borrower on demand.
The Fund lends its securities through an unaffiliated securities lending agent. Cash collateral received in connection with its securities lending transactions is invested in Securities Lending Cash Investments, LLC (the “Securities Lending Fund”). The Securities Lending Fund is exempt from registration under Section 3(c)(7) of the 1940 Act and is managed by Funds Management and is subadvised by Wells Capital Management Incorporated (“WellsCap”), an affiliate of Funds Management and an indirect wholly owned subsidiary of Wells Fargo & Company (“Wells Fargo”). Funds Management receives an advisory fee starting at 0.05% and declining to 0.01% as the average daily net assets of the Securities Lending Fund increase. All of the fees received by Funds Management are paid to WellsCap for its services as subadviser. The Securities Lending Fund seeks to provide a positive return compared to the daily Fed Funds Open Rate by investing in high-quality, U.S. dollar-denominated short-term money market instruments. Securities Lending Fund investments are
| | | | | | |
| Notes to financial statements (unaudited) | | Wells Fargo Intrinsic Small Cap Value Fund | | | 21 | |
valued at the evaluated bid price provided by an independent pricing service. Income earned from investment in the Securities Lending Fund, if any, is included in income from affiliated securities on the Statement of Operations.
Security transactions and income recognition
Securities transactions are recorded on a trade date basis. Realized gains or losses are recorded on the basis of identified cost.
Dividend income is recognized on the ex-dividend date. Dividend income is recorded net of foreign taxes withheld where recovery of such taxes is not assured.
Distributions to shareholders
Distributions to shareholders from net investment income and any net realized gains are recorded on the ex-dividend date and paid at least annually. Such distributions are determined in accordance with income tax regulations and may differ from U.S. generally accepted accounting principles. Dividend sources are estimated at the time of declaration. The tax character of distributions is determined as of the Fund’s fiscal year end. Therefore, a portion of the Fund’s distributions made prior to the Fund’s fiscal year end may be categorized as a tax return of capital at year end.
Federal and other taxes
The Fund intends to continue to qualify as a regulated investment company by distributing substantially all of its investment company taxable income and any net realized capital gains (after reduction for capital loss carryforwards) sufficient to relieve it from all, or substantially all, federal income taxes. Accordingly, no provision for federal income taxes was required.
The Fund’s income and federal excise tax returns and all financial records supporting those returns for the prior three fiscal years are subject to examination by the federal and Delaware revenue authorities. Management has analyzed the Fund’s tax positions taken on federal, state, and foreign tax returns for all open tax years and does not believe that there are any uncertain tax positions that require recognition of a tax liability.
As of September 30, 2018, the aggregate cost of all investments for federal income tax purposes was $65,797,430 and the unrealized gains (losses) consisted of:
| | | | |
Gross unrealized gains | | $ | 18,243,287 | |
Gross unrealized losses | | | (2,743,570 | ) |
Net unrealized gains | | $ | 15,499,717 | |
Class allocations
The separate classes of shares offered by the Fund differ principally in applicable sales charges, distribution, shareholder servicing, and administration fees. Class specific expenses are charged directly to that share class. Investment income, common expenses, and realized and unrealized gains (losses) on investments are allocated daily to each class of shares based on the relative proportion of net assets of each class.
3. FAIR VALUATION MEASUREMENTS
Fair value measurements of investments are determined within a framework that has established a fair value hierarchy based upon the various data inputs utilized in determining the value of the Fund’s investments. The three-level hierarchy gives the highest priority to unadjusted quoted prices in active markets for identical assets or liabilities (Level 1) and the lowest priority to unobservable inputs (Level 3). The Fund’s investments are classified within the fair value hierarchy based on the lowest level of input that is significant to the fair value measurement. The inputs are summarized into three broad levels as follows:
| ∎ | | Level 1 – quoted prices in active markets for identical securities |
| ∎ | | Level 2 – other significant observable inputs (including quoted prices for similar securities, interest rates, prepayment speeds, credit risk, etc.) |
| ∎ | | Level 3 – significant unobservable inputs (including the Fund’s own assumptions in determining the fair value of investments) |
The inputs or methodologies used for valuing investments in securities are not necessarily an indication of the risk associated with investing in those securities.
| | | | |
| 22 | | Wells Fargo Intrinsic Small Cap Value Fund | | Notes to financial statements (unaudited) |
The following is a summary of the inputs used in valuing the Fund’s assets and liabilities as of September 30, 2018:
| | | | | | | | | | | | | | | | |
| | | Quoted prices
(Level 1) | | | Other significant
observable inputs
(Level 2) | | | Significant
unobservable inputs (Level 3) | | | Total | |
Assets | | | | | | | | | | | | | | | | |
Investments in: | | | | | | | | | | | | | | | | |
| | | | |
Common stocks | | | | | | | | | | | | | | | | |
Communication services | | $ | 1,073,957 | | | $ | 0 | | | $ | 0 | | | $ | 1,073,957 | |
Consumer discretionary | | | 6,324,231 | | | | 0 | | | | 0 | | | | 6,324,231 | |
Consumer staples | | | 537,021 | | | | 0 | | | | 0 | | | | 537,021 | |
Energy | | | 6,039,748 | | | | 0 | | | | 0 | | | | 6,039,748 | |
Financials | | | 20,002,377 | | | | 0 | | | | 0 | | | | 20,002,377 | |
Health care | | | 8,782,842 | | | | 0 | | | | 0 | | | | 8,782,842 | |
Industrials | | | 16,664,654 | | | | 0 | | | | 0 | | | | 16,664,654 | |
Information technology | | | 7,946,857 | | | | 0 | | | | 0 | | | | 7,946,857 | |
Materials | | | 2,154,569 | | | | 0 | | | | 0 | | | | 2,154,569 | |
Real estate | | | 7,575,751 | | | | 0 | | | | 0 | | | | 7,575,751 | |
| | | | |
Short-term investments | | | | | | | | | | | | | | | | |
Investment companies | | | 2,103,322 | | | | 2,091,818 | | | | 0 | | | | 4,195,140 | |
Total assets | | $ | 79,205,329 | | | $ | 2,091,818 | | | $ | 0 | | | $ | 81,297,147 | |
Additional sector, industry or geographic detail is included in the Portfolio of Investments.
At September 30, 2018, the Fund did not have any transfers into/out of Level 3.
4. TRANSACTIONS WITH AFFILIATES
Management fee
Funds Management, an indirect wholly owned subsidiary of Wells Fargo, is the manager of the Fund and provides advisory and fund-level administrative services under an investment management agreement. Under the investment management agreement, Funds Management is responsible for, among other services, implementing the investment objectives and strategies of the Fund, supervising the subadviser, providing fund-level administrative services in connection with the Fund’s operations. As compensation for its services under the investment management agreement, Funds Management is entitled to receive an annual management fee starting at 0.85% and declining to 0.71% as the average daily net assets of the Fund increase. For the six months ended September 30, 2018, the management fee was equivalent to an annual rate of 0.85% of the Fund’s average daily net assets.
Funds Management has retained the services of a subadviser to provide daily portfolio management to the Fund. The fee for subadvisory services is borne by Funds Management. WellsCap is the subadviser to the Fund and is entitled to receive a fee from Funds Management at an annual rate starting at 0.55% and declining to 0.40% as the average daily net assets of the Fund increase.
Administration fees
Under a class-level administration agreement, Funds Management provides class-level administrative services to the Fund, which includes paying fees and expenses for services provided by the transfer agent, sub-transfer agents, omnibus account servicers and record-keepers. As compensation for its services under the class-level administration agreement, Funds Management receives an annual fee which is calculated based on the average daily net assets of each class as follows:
| | | | |
| | | Class-level
administration fee | |
Class A, Class C | | | 0.21 | % |
Administrator Class, Institutional Class | | | 0.13 | |
Funds Management has contractually waived and/or reimbursed management and administration fees to the extent necessary to maintain certain net operating expense ratios for the Fund. When each class of the Fund has exceeded its expense cap, Funds Management has waived fees and/or reimbursed expenses from fund level expenses on a proportionate basis and then from class specific expenses; otherwise, waivers and/or reimbursements are applied against class specific
| | | | | | |
| Notes to financial statements (unaudited) | | Wells Fargo Intrinsic Small Cap Value Fund | | | 23 | |
expenses before fund level expenses. Funds Management has committed through July 31, 2019 to waive fees and/or reimburse expenses to the extent necessary to cap the Fund’s expenses at 1.35% for Class A shares, 2.10% for Class C shares, and 1.20% for Administrator Class shares, and 1.00% for Institutional Class shares. After this time, the cap may be increased or the commitment to maintain the cap may be terminated only with the approval of the Board of Trustees.
Distribution fee
The Trust has adopted a distribution plan for Class C shares of the Fund pursuant to Rule 12b-1 under the 1940 Act. A distribution fee is charged to Class C shares and paid to Wells Fargo Funds Distributor, LLC (“Funds Distributor”), the principal underwriter, at an annual rate of 0.75% of the average daily net assets of Class C shares.
In addition, Funds Distributor is entitled to receive the front-end sales charge from the purchase of Class A shares and a contingent deferred sales charge on the redemption of certain Class A shares. Funds Distributor is also entitled to receive the contingent deferred sales charges from redemptions of Class C shares. Funds Distributor did not receive any front-end or contingent deferred sales charges from Class A or Class C shares for the six months ended September 30, 2018.
Shareholder servicing fees
The Trust has entered into contracts with one or more shareholder servicing agents, whereby Class A, Class C, and Administrator Class of the Fund are charged a fee at an annual rate of 0.25% of the average daily net assets of each respective class.
A portion of these total shareholder servicing fees were paid to affiliates of Wells Fargo.
Interfund transactions
The Fund may purchase or sell portfolio investment securities to certain other Wells Fargo affiliates pursuant to Rule 17a-7 under the 1940 Act and under procedures adopted by the Board of Trustees. The procedures have been designed to ensure that these interfund transactions, which do not incur broker commissions, are effected at current market prices.
5. INVESTMENT PORTFOLIO TRANSACTIONS
Purchases and sales of investments, excluding U.S. government obligations (if any) and short-term securities, for the six months ended September 30, 2018 were $12,099,516 and $18,942,574, respectively.
6. BANK BORROWINGS
The Trust (excluding the money market funds), Wells Fargo Master Trust and Wells Fargo Variable Trust are parties to a $280,000,000 revolving credit agreement whereby the Fund is permitted to use bank borrowings for temporary or emergency purposes, such as to fund shareholder redemption requests. Interest under the credit agreement is charged to the Fund based on a borrowing rate equal to the higher of the Federal Funds rate in effect on that day plus 1.25% or the overnight LIBOR rate in effect on that day plus 1.25%. In addition, an annual commitment fee equal to 0.25% of the unused balance is allocated to each participating fund.
For the six months ended September 30, 2018, there were no borrowings by the Fund under the agreement.
7. CONCENTRATION RISK
Concentration risks result from exposure to a limited number of sectors. A fund that invests a substantial portion of its assets in any sector may be more affected by changes in that sector than would be a fund whose investments are not heavily weighted in any sector.
8. INDEMNIFICATION
Under the Trust’s organizational documents, the officers and Trustees have been granted certain indemnification rights against certain liabilities that may arise out of performance of their duties to the Trust. Additionally, in the normal course of business, the Trust may enter into contracts with service providers that contain a variety of indemnification clauses. The Trust’s maximum exposure under these arrangements is dependent on future claims that may be made against the Fund and, therefore, cannot be estimated.
9. NEW ACCOUNTING PRONOUNCEMENT
In August 2018, FASB issued Accounting Standards Update (“ASU”) No. 2018-13, Fair Value Measurement (Topic 820) Disclosure Framework—Changes to the Disclosure Requirements for Fair Value Measurement. ASU 2018-13 updates the disclosure requirements for fair value measurements by modifying or removing certain disclosures and adding certain new disclosures. The amendments are effective for fiscal years, and interim periods within those fiscal years, beginning after December 15, 2019. Early adoption is permitted. Management has early adopted the removal and modification disclosures, as permitted, and will adopt the additional new disclosures at the effective date.
| | | | |
| 24 | | Wells Fargo Intrinsic Small Cap Value Fund | | Other information (unaudited) |
PROXY VOTING INFORMATION
A description of the policies and procedures that the Fund uses to determine how to vote proxies relating to portfolio securities is available, upon request, by calling 1-800-222-8222, visiting our website at wellsfargofunds.com, or visiting the SEC website at sec.gov. Information regarding how the Fund voted proxies relating to portfolio securities during the most recent 12-month period ended June 30 is available on the Fund’s website at wellsfargofunds.com or by visiting the SEC website at sec.gov.
PORTFOLIO HOLDINGS INFORMATION
The complete portfolio holdings for the Fund are publicly available monthly on the Fund’s website (wellsfargofunds.com), on a one-month delayed basis. In addition, top ten holdings information (excluding derivative positions) for the Fund is publicly available on the Fund’s website on a monthly, seven-day or more delayed basis. The Fund files its complete schedule of portfolio holdings with the SEC for the first and third quarters of each fiscal year on Form N-Q, which is available by visiting the SEC website at sec.gov. In addition, the Fund’s Form N-Q may be reviewed and copied at the SEC’s Public Reference Room in Washington, DC, and at regional offices in New York City, at 233 Broadway, and in Chicago, at 175 West Jackson Boulevard, Suite 900. Information about the Public Reference Room may be obtained by calling 1-800-SEC-0330.
| | | | | | |
| Other information (unaudited) | | Wells Fargo Intrinsic Small Cap Value Fund | | | 25 | |
BOARD OF TRUSTEES AND OFFICERS
Each of the Trustees and Officers1 listed in the table below acts in identical capacities for each fund in the Wells Fargo family of funds, which consists of 153 mutual funds comprising the Wells Fargo Funds Trust, Wells Fargo Variable Trust, Wells Fargo Master Trust and four closed-end funds (collectively the “Fund Complex”). This table should be read in conjunction with the Prospectus and the Statement of Additional Information2. The mailing address of each Trustee and Officer is 525 Market Street, 12th Floor, San Francisco, CA 94105. Each Trustee and Officer serves an indefinite term, however, each Trustee serves such term until reaching the mandatory retirement age established by the Trustees.
Independent Trustees
| | | | | | |
Name and
year of birth | | Position held and
length of service* | | Principal occupations during past five years or longer | | Current other
public company or
investment company
directorships |
| William R. Ebsworth (Born 1957) | | Trustee, since 2015 | | Retired. From 1984 to 2013, equities analyst, portfolio manager, research director and chief investment officer at Fidelity Management and Research Company in Boston, Tokyo, and Hong Kong, and retired in 2013 as Chief Investment Officer of Fidelity Strategic Advisers, Inc. where he led a team of investment professionals managing client assets. Prior thereto, Board member of Hong Kong Securities Clearing Co., Hong Kong Options Clearing Corp., the Thailand International Fund, Ltd., Fidelity Investments Life Insurance Company, and Empire Fidelity Investments Life Insurance Company. Board member of the Vincent Memorial Hospital Endowment (non-profit organization), where he serves on the Investment Committee and as a Chair of the Audit Committee. Mr. Ebsworth is a CFA® charterholder. | | N/A |
Jane A. Freeman (Born 1953) | | Trustee, since 2015; Chair Liaison, since 2018 | | Retired. From 2012 to 2014 and 1999 to 2008, Chief Financial Officer of Scientific Learning Corporation. From 2008 to 2012, Ms. Freeman provided consulting services related to strategic business projects. Prior to 1999, Portfolio Manager at Rockefeller & Co. and Scudder, Stevens & Clark. Board member of the Harding Loevner Funds from 1996 to 2014, serving as both Lead Independent Director and chair of the Audit Committee. Board member of the Russell Exchange Traded Funds Trust from 2011 to 2012 and the chair of the Audit Committee. Ms. Freeman is a Board Member of The Ruth Bancroft Garden (non-profit organization). She is also an inactive Chartered Financial Analyst. | | N/A |
Isaiah Harris, Jr. (Born 1952) | | Trustee, since 2009 | | Retired. Chairman of the Board of CIGNA Corporation since 2009, and Director since 2005. From 2003 to 2011, Director of Deluxe Corporation. Prior thereto, President and CEO of BellSouth Advertising and Publishing Corp. from 2005 to 2007, President and CEO of BellSouth Enterprises from 2004 to 2005 and President of BellSouth Consumer Services from 2000 to 2003. Emeritus member of the Iowa State University Foundation Board of Governors. Emeritus Member of the Advisory Board of Iowa State University School of Business. Advisory Board Member, Palm Harbor Academy (private school). Advisory Board Member, Child Evangelism Fellowship (non-profit). Mr. Harris is a certified public accountant (inactive status). | | CIGNA Corporation |
Judith M. Johnson (Born 1949) | | Trustee, since 2008; Audit Committee Chairman, since 2009 | | Retired. Prior thereto, Chief Executive Officer and Chief Investment Officer of Minneapolis Employees Retirement Fund from 1996 to 2008. Ms. Johnson is an attorney, certified public accountant and a certified managerial accountant. | | N/A |
David F. Larcker (Born 1950) | | Trustee, since 2009 | | James Irvin Miller Professor of Accounting at the Graduate School of Business, Stanford University, Director of the Corporate Governance Research Initiative and Senior Faculty of The Rock Center for Corporate Governance since 2006. From 2005 to 2008, Professor of Accounting at the Graduate School of Business, Stanford University. Prior thereto, Ernst & Young Professor of Accounting at The Wharton School, University of Pennsylvania from 1985 to 2005. | | N/A |
| | | | |
| 26 | | Wells Fargo Intrinsic Small Cap Value Fund | | Other information (unaudited) |
| | | | | | |
Name and
year of birth | | Position held and
length of service* | | Principal occupations during past five years or longer | | Current other
public company or
investment company
directorships |
Olivia S. Mitchell (Born 1953) | | Trustee, since 2006; Governance Committee Chairman, since 2018 | | International Foundation of Employee Benefit Plans Professor, Wharton School of the University of Pennsylvania since 1993. Director of Wharton’s Pension Research Council and Boettner Center on Pensions & Retirement Research, and Research Associate at the National Bureau of Economic Research. Previously, Cornell University Professor from 1978 to 1993. | | N/A |
Timothy J. Penny (Born 1951) | | Trustee, since 1996; Chairman, since 2018; Vice Chairman, from 2017 to 2018 | | President and Chief Executive Officer of Southern Minnesota Initiative Foundation, a non-profit organization, since 2007. Member of the Board of Trustees of NorthStar Education Finance, Inc., a non-profit organization, since 2007. | | N/A |
James G. Polisson (Born 1959) | | Trustee, since 2018; Advisory Board Member, from 2017 to 2018 | | Retired. Chief Marketing Officer, Source (ETF) UK Services, Ltd, from 2015 to 2017. From 2012 to 2015, Principal of The Polisson Group, LLC, a management consulting, corporate advisory and principal investing company. Chief Executive Officer and Managing Director at Russell Investments, Global Exchange Traded Funds from 2010 to 2012. Managing Director of Barclays Global Investors from 1998 to 2010 and Global Chief Marketing Officer for iShares and Barclays Global Investors from 2000 to 2010. Trustee of the San Francisco Mechanics’ Institute, a non-profit organization, from 2013 to 2015. Board member of the Russell Exchange Traded Fund Trust from 2011 to 2012. Director of Barclays Global Investors Holdings Deutschland GmbH from 2006 to 2009. Mr. Polisson is an attorney and has a retired status with the Massachusetts and District of Columbia Bar Associations. | | N/A |
Michael S. Scofield (Born 1943) | | Trustee, since 2010 | | Served on the Investment Company Institute’s Board of Governors and Executive Committee from 2008-2011 as well the Governing Council of the Independent Directors Council from 2006-2011 and the Independent Directors Council Executive Committee from 2008-2011. Trustee of the Evergreen Fund complex (and its predecessors) from 1984 to 2010. Chairman of the Evergreen Funds from 2000-2010. Former Trustee of the Mentor Funds. Retired Attorney, Law Offices of Michael S. Scofield. | | N/A |
Pamela Wheelock (Born 1959) | | Trustee, since 2018; Advisory Board Member, from 2017 to 2018 | | Chief Operating Officer, Twin Cities Habitat for Humanity, since January, 2017. Vice President of University Services, University of Minnesota from 2012 to 2017. Prior thereto, on the Board of Directors, Governance Committee and Finance Committee for the Minnesota Philanthropy Partners (Saint Paul Foundation) from 2012 to 2018, Interim President and Chief Executive Officer of Blue Cross Blue Shield of Minnesota from 2010 to 2011, Chairman of the Board from 2009 to 2011 and Board Director from 2003 to 2015. Vice President, Leadership and Community Engagement, Bush Foundation, Saint Paul, Minnesota (a private foundation) from 2009 to 2011. Executive Vice President and Chief Financial Officer, Minnesota Sports and Entertainment from 2004 to 2009 and Senior Vice President from 2002 to 2004. Commissioner of Finance, State of Minnesota, from 1999 to 2002. Currently the Board Chair of the Minnesota Wild Foundation since 2010. | | N/A |
| * | Length of service dates reflect the Trustee’s commencement of service with the Trust’s predecessor entities, where applicable. |
| | | | | | |
| Other information (unaudited) | | Wells Fargo Intrinsic Small Cap Value Fund | | | 27 | |
Officers
| | | | | | |
Name and
year of birth | | Position held and
length of service | | Principal occupations during past five years or longer | | |
Andrew Owen
(Born 1960) | | President, since 2017 | | Executive Vice President of Wells Fargo & Company and Head of Affiliated Managers, Wells Fargo Asset Management, since 2014. In addition, Mr. Owen is currently President, Chief Executive Officer and Director of Wells Fargo Funds Management, LLC since 2017. Prior thereto, Executive Vice President responsible for marketing, investments and product development for Wells Fargo Funds Management, LLC, from 2009 to 2014. | | |
Nancy Wiser1
(Born 1967) | | Treasurer, since 2012 | | Executive Vice President of Wells Fargo Funds Management, LLC since 2011. Chief Operating Officer and Chief Compliance Officer at LightBox Capital Management LLC, from 2008 to 2011. | | |
Alexander Kymn3
(Born 1973) | | Secretary, since 2018; Chief Legal Officer, since 2018 | | Senior Company Counsel of Wells Fargo Bank, N.A. since 2018 (previously Senior Counsel from 2007 to 2018). Vice President of Wells Fargo Funds Management, LLC from 2008 to 2014. | | |
Michael H. Whitaker
(Born 1967) | | Chief Compliance Officer, since 2016 | | Senior Vice President and Chief Compliance Officer since 2016. Senior Vice President and Chief Compliance Officer for Fidelity Investments from 2007 to 2016. | | |
David Berardi
(Born 1975) | | Assistant Treasurer, since 2009 | | Vice President of Wells Fargo Funds Management, LLC since 2009. Vice President of Evergreen Investment Management Company, LLC from 2008 to 2010. Manager of Fund Reporting and Control for Evergreen Investment Management Company, LLC from 2004 to 2010. | | |
Jeremy DePalma1
(Born 1974) | | Assistant Treasurer, since 2009 | | Senior Vice President of Wells Fargo Funds Management, LLC since 2009. Senior Vice President of Evergreen Investment Management Company, LLC from 2008 to 2010 and head of the Fund Reporting and Control Team within Fund Administration from 2005 to 2010. | | |
| 1 | Nancy Wiser acts as Treasurer of 76 funds in the Fund Complex. Jeremy DePalma acts as Treasurer of 77 funds and Assistant Treasurer of 76 funds in the Fund Complex. |
| 2 | The Statement of Additional Information includes additional information about the Trustees and is available, without charge, upon request, by calling 1-800-222-8222 or by visiting the website at wellsfargofunds.com. |
| 3 | Alexander Kymn became the Secretary and Chief Legal Officer effective April 17, 2018. |
| | | | |
| 28 | | Wells Fargo Intrinsic Small Cap Value Fund | | Other information (unaudited) |
BOARD CONSIDERATION OF INVESTMENT MANAGEMENT AND SUB-ADVISORY AGREEMENTS:
Wells Fargo Intrinsic Small Cap Value Fund
Under the Investment Company Act of 1940 (the “1940 Act”), the Board of Trustees (the “Board”) of Wells Fargo Funds Trust (the “Trust”) must determine annually whether to approve the continuation of the Trust’s investment management and sub-advisory agreements. In this regard, at an in-person meeting held on May 22-23, 2018 (the “Meeting”), the Board, all the members of which have no direct or indirect interest in the investment management and sub-advisory agreements and are not “interested persons” of the Trust, as defined in the 1940 Act (the “Independent Trustees”), reviewed and approved for Wells Fargo Intrinsic Small Cap Value Fund (the “Fund”): (i) an investment management agreement (the “Management Agreement”) with Wells Fargo Funds Management, LLC (“Funds Management”); and (ii) an investment sub-advisory agreement (the “Sub-Advisory Agreement”) with Wells Capital Management Incorporated (the “Sub-Adviser”), an affiliate of Funds Management. The Management Agreement and the Sub-Advisory Agreement are collectively referred to as the “Advisory Agreements.”
At the Meeting, the Board considered the factors and reached the conclusions described below relating to the selection of Funds Management and the Sub-Adviser and the approval of the Advisory Agreements. Prior to the Meeting, including at an in-person meeting in April 2018, the Trustees conferred extensively among themselves and with representatives of Funds Management about these matters. Also, the Board has adopted a team-based approach, with each team consisting of a sub-set of Trustees, to assist the full Board in the discharge of its duties in reviewing investment performance and other matters throughout the year. The Independent Trustees were assisted in their evaluation of the Advisory Agreements by independent legal counsel, from whom they received separate legal advice and with whom they met separately.
In providing information to the Board, Funds Management and the Sub-Adviser were guided by a detailed set of requests for information submitted to them by independent legal counsel on behalf of the Independent Trustees at the start of the Board’s annual contract renewal process earlier in 2018. In considering and approving the Advisory Agreements, the Trustees considered the information they believed relevant, including but not limited to the information discussed below. The Board considered not only the specific information presented in connection with the Meeting, but also the knowledge gained over time through interaction with Funds Management and the Sub-Adviser about various topics. In this regard, the Board reviewed reports of Funds Management at each of its quarterly meetings, which included, among other things, portfolio reviews and investment performance reports. In addition, the Board and the teams mentioned above confer with portfolio managers at various times throughout the year. The Board did not identify any particular information or consideration that was all-important or controlling, and each individual Trustee may have attributed different weights to various factors.
After its deliberations, the Board unanimously approved the continuation of the Advisory Agreements for a one-year term and determined that the compensation payable to Funds Management and the Sub-Adviser under each of the Advisory Agreements was reasonable. The Board considered the approval of the Advisory Agreements for the Fund as part of its consideration of agreements for funds across the complex, but its approvals were made on a fund-by-fund basis. The following summarizes a number of important, but not necessarily all, factors considered by the Board in support of its approvals.
Nature, extent and quality of services
The Board received and considered various information regarding the nature, extent and quality of services provided to the Fund by Funds Management and the Sub-Adviser under the Advisory Agreements. This information included a description of the investment advisory services and Fund-level administrative services covered by the Management Agreement, as well as, among other things, a summary of the background and experience of senior management of Wells Fargo Asset Management (“WFAM”), of which Funds Management and the Sub-Adviser are a part, a summary of investments made in the business of WFAM, a summary of certain organizational and personnel changes involving Funds Management and the Sub-Adviser, and a description of Funds Management’s and the Sub-Adviser’s business continuity planning programs and of their approaches to data privacy and cybersecurity. The Board also considered the qualifications, background, tenure and responsibilities of each of the portfolio managers primarily responsible for the day-to-day portfolio management of the Fund.
The Board evaluated the ability of Funds Management and the Sub-Adviser to attract and retain qualified investment professionals, including research, advisory and supervisory personnel. The Board further considered the compliance programs and compliance records of Funds Management and the Sub-Adviser. In addition, the Board took into account the full range of services provided to the Fund by Funds Management and its affiliates.
| | | | | | |
| Other information (unaudited) | | Wells Fargo Intrinsic Small Cap Value Fund | | | 29 | |
Fund investment performance and expenses
The Board considered the investment performance results for the Fund over various time periods ended December 31, 2017. The Board considered these results in comparison to the investment performance of funds in a universe that was determined by Broadridge Inc. (“Broadridge”) to be similar to the Fund (the “Universe”), and in comparison to the Fund’s benchmark index and to other comparative data. Broadridge is an independent provider of investment company data. The Board received a description of the methodology used by Broadridge to select the mutual funds in the performance Universe. The Board noted that the investment performance of the Fund (Administrator Class) was higher than or in range of the average investment performance of the Universe for the three- and five-year periods under review, but lower than the average investment performance of the Universe for the one- and ten-year periods under review. The Board also noted that the investment performance of the Fund was higher than its benchmark index, the Russell 2000 Value Index, for the one- and five-year periods under review, but lower than its benchmark index for the three- and ten-year periods under review.
The Board received information concerning, and discussed factors contributing to, the underperformance of the Fund relative to the Universe and benchmark for the periods identified above. The Board took note of the explanations for the relative underperformance during these periods, including with respect to investment decisions and market factors that affected the Fund’s investment performance.
The Board also received and considered information regarding the Fund’s net operating expense ratios and their various components, including actual management fees, custodian and other non-management fees, and Rule 12b-1 and non-Rule 12b-1 shareholder service fees. The Board considered these ratios in comparison to the median ratios of funds in class-specific expense groups that were determined by Broadridge to be similar to the Fund (the “Groups”). The Board received a description of the methodology used by Broadridge to select the mutual funds in the expense Groups and an explanation of how funds comprising expense groups and their expense ratios may vary from year-to-year. Based on the Broadridge reports, the Board noted that the net operating expense ratios of the Fund were lower than, equal to, or in range of the median net operating expense ratios of the expense Groups for each share class.
The Board took into account the Fund’s investment performance and expense information provided to it among the factors considered in deciding to re-approve the Advisory Agreements.
Investment management and sub-advisory fee rates
The Board reviewed and considered the contractual fee rates payable by the Fund to Funds Management under the Management Agreement, as well as the contractual fee rates payable by the Fund to Funds Management for class-level administrative services under a Class-Level Administration Agreement, which include, among other things, class-level transfer agency and sub-transfer agency costs (collectively, the “Management Rates”). The Board also reviewed and considered the contractual investment sub-advisory fee rates that are payable by Funds Management to the Sub-Adviser for investment sub-advisory services.
Among other information reviewed by the Board was a comparison of the Fund’s Management Rates with the average contractual investment management fee rates of funds in the expense Groups at a common asset level as well as transfer agency costs of the funds in the expense Groups. The Board noted that the Management Rates of the Fund were lower than or in range of the sum of these average rates for the Fund’s expense Groups for all Classes.
The Board also received and considered information about the portion of the total management fee that was retained by Funds Management after payment of the fee to the Sub-Adviser for sub-advisory services. In assessing the reasonableness of this amount, the Board received and evaluated information about the nature and extent of responsibilities retained and risks assumed by Funds Management and not delegated to or assumed by the Sub-Adviser, and about Funds Management’s on-going oversight services. Given the affiliation between Funds Management and the Sub-Adviser, the Board ascribed limited relevance to the allocation of fees between them.
The Board also received and considered information about the nature and extent of services offered and fee rates charged by Funds Management and the Sub-Adviser to other types of clients with investment strategies similar to those of the Fund. In this regard, the Board received information about the significantly greater scope of services, and compliance, reporting and other legal burdens and risks of managing mutual funds compared with those associated with managing assets of non-mutual fund clients such as institutional separate accounts.
Based on its consideration of the factors and information it deemed relevant, including those described here, the Board determined that the compensation payable to Funds Management under the Management Agreement and to the Sub-Adviser under the Sub-Advisory Agreement was reasonable.
| | | | |
| 30 | | Wells Fargo Intrinsic Small Cap Value Fund | | Other information (unaudited) |
Profitability
The Board received and considered information concerning the profitability of Funds Management, as well as the profitability of both WFAM and Wells Fargo & Co. (“Wells Fargo”) as a whole, from providing services to the Fund and the fund family as a whole. The Board noted that the Sub-Adviser’s profitability information with respect to providing services to the Fund was subsumed in the WFAM and Wells Fargo profitability analysis.
Funds Management reported on the methodologies and estimates used in calculating profitability, including a description of the methodology used to allocate certain expenses and recent enhancements made to the methodology. Among other things, the Board noted that the levels of profitability reported on a fund-by-fund basis varied widely, depending on factors such as the size and type of fund. Based on its review, the Board did not deem the profits reported by Funds Management, WFAM or Wells Fargo from services provided to the Fund to be at a level that would prevent it from approving the continuation of the Advisory Agreements.
Economies of scale
The Board considered the extent to which Funds Management may experience economies of scale in the provision of management services, and the extent to which scale benefits, if any, would be shared with shareholders. In particular, the Board noted the existence of breakpoints in the Fund’s management fee structure, which operate generally to reduce the Fund’s expense ratios as the Fund grows in size. It considered that, for a small fund or a fund that shrinks in size, breakpoints conversely can result in higher fee levels. The Board also considered that in addition to management fee breakpoints, competitive management fee rates set at the outset without regard to breakpoints and fee waiver and expense reimbursement arrangements, as well as investments in the business intended to enhance services available to Fund shareholders, are means of sharing potential economies of scale with shareholders of the Fund.
The Board concluded that the Fund’s fee and expense arrangements, including contractual breakpoints, constituted a reasonable approach to sharing potential economies of scale with the Fund and its shareholders.
Other benefits to Funds Management and the Sub-Adviser
The Board received and considered information regarding potential “fall-out” or ancillary benefits received by Funds Management and its affiliates, including the Sub-Adviser, as a result of their relationships with the Fund. Ancillary benefits could include, among others, benefits directly attributable to other relationships with the Fund and benefits potentially derived from an increase in Funds Management’s and the Sub-Adviser’s business as a result of their relationships with the Fund. The Board noted that various affiliates of Funds Management may receive distribution-related fees, shareholder servicing payments and sub-transfer agency fees in respect of shares sold or held through them and services provided.
The Board also reviewed information about soft dollar credits earned and utilized by the Sub-Adviser, fees earned by Funds Management and the Sub-Adviser from managing a private investment vehicle for the fund family’s securities lending collateral and commissions earned by an affiliated broker from portfolio transactions.
Based on its consideration of the factors and information it deemed relevant, including those described here, the Board did not find that any ancillary benefits received by Funds Management and its affiliates, including the Sub-Adviser, were unreasonable.
Conclusion
At the Meeting, after considering the above-described factors and based on its deliberations and its evaluation of the information described above, the Board unanimously approved the continuation of the Advisory Agreements for a one-year term and determined that the compensation payable to Funds Management and the Sub-Adviser under each of the Advisory Agreements was reasonable.
| | | | | | |
| Appendix A (unaudited) | | Wells Fargo Intrinsic Small Cap Value Fund | | | 31 | |
SALES CHARGE REDUCTIONS AND WAIVERS FOR CERTAIN INTERMEDIARIES
Ameriprise
Effective June 1, 2018, shareholders purchasing Fund shares through an Ameriprise Financial platform or account will be eligible only for the following Class A load waivers (front-end sales charge waivers), which may differ from those disclosed elsewhere in the Fund’s prospectus or Statement of Additional Information.
Front-end Sales Load Waivers on Class A Shares Available at Ameriprise Financial
| | • | | Employer-sponsored retirement plans (e.g., 401(k) plans, 457 plans, employer-sponsored 403(b) plans, profit sharing and money purchase pension plans and defined benefit plans). For purposes of this provision, employer-sponsored retirement plans do not include SEP IRAs, Simple IRAs or SAR-SEPs. |
| | • | | Shares purchased through an Ameriprise Financial investment advisory program (if an Advisory or similar share class for such investment advisory program is not available) |
| | • | | Shares purchased by third party investment advisors on behalf of their advisory clients through Ameriprise Financial’s platform (if an Advisory or similar share class for such investment advisory program is not available) |
| | • | | Shares purchased through reinvestment of distributions and dividend reinvestment when purchasing shares of the same Fund (but not any other fund within the same fund family) |
| | • | | Shares exchanged from Class C shares of the same fund in the month of or following the 10-year anniversary of the purchase date. To the extent that the Fund’s prospectus elsewhere provides for a waiver with respect to such shares following a shorter holding period, that waiver will apply to exchanges following such shorter period. To the extent that the Fund’s prospectus elsewhere provides for a waiver with respect to exchanges of Class C shares for load-waived shares, that waiver will also apply to such exchanges. |
| | • | | Employees and registered representatives of Ameriprise Financial or its affiliates and their immediate family members |
| | • | | Shares purchased by or through qualified accounts (including IRAs, Coverdell Education Savings Accounts, 401(k)s, 403(b) TSCAs subject to ERISA and defined benefit plans) that are held by a covered family member, defined as an Ameriprise financial advisor and/or the advisor’s spouse, advisor’s lineal ascendant (mother, father, grandmother, grandfather, great grandmother, great grandfather), advisor’s lineal descendant (son, step-son, daughter, step-daughter, grandson, granddaughter, great grandson, great granddaughter) or any spouse of a covered family member who is a lineal descendant |
| | • | | Shares purchased from the proceeds of redemptions within the same fund family, provided (1) the repurchase occurs within 90 days following the redemption, (2) the redemption and purchase occur in the same account, and (3) redeemed shares were subject to a front-end or deferred sales load (i.e. Rights of Reinstatement). Subject to the Fund’s policy regarding frequent purchases and redemptions of Fund shares, you may not be able to repurchase shares for the first 30 days after your redemption. |
Automatic Exchange of Class C Shares Available at Ameriprise Financial
| | • | | Class C shares will automatically exchange to Class A shares in the month of the 10-year anniversary of the purchase date. |
Merrill Lynch
Effective April 10, 2017, shareholders purchasing Fund shares through a Merrill Lynch platform or account will be eligible only for the following load waivers (front-end sales charge waivers and contingent deferred, or back-end, sales charge waivers) and discounts, which may differ from those disclosed elsewhere in the Fund’s prospectus or Statement of Additional Information.
Front-end Sales Load Waivers on Class A Shares available at Merrill Lynch
| | • | | Employer-sponsored retirement, deferred compensation and employee benefit plans (including health savings accounts) and trusts used to fund those plans, provided that the shares are not held in a commission-based brokerage account and shares are held for the benefit of the plan |
| | • | | Shares purchased by or through a 529 Plan |
| | • | | Shares purchased through a Merrill Lynch affiliated investment advisory program |
| | | | |
| 32 | | Wells Fargo Intrinsic Small Cap Value Fund | | Appendix A (unaudited) |
| | • | | Shares purchased by third party investment advisors on behalf of their advisory clients through Merrill Lynch’s platform |
| | • | | Shares of funds purchased through the Merrill Edge Self-Directed platform (if applicable) |
| | • | | Shares purchased through reinvestment of capital gains distributions and dividend reinvestment when purchasing shares of the same fund (but not any other fund within the fund family) |
| | • | | Shares exchanged from Class C (i.e. level-load) shares of the same fund in the month of or following the 10-year anniversary of the purchase date |
| | • | | Employees and registered representatives of Merrill Lynch or its affiliates and their family members, as defined by Merrill Lynch, which may differ from the definition of family member in the Fund’s prospectus. |
| | • | | Directors or Trustees of the Fund, and employees of the Fund’s investment adviser or any of its affiliates, as described in the Fund’s prospectus |
| | • | | Shares purchased from the proceeds of redemptions within the same fund family, provided (1) the repurchase occurs within 90 days following the redemption, (2) the redemption and purchase occur in the same account, and (3) redeemed shares were subject to a front-end or deferred sales load (known as Rights of Reinstatement). Subject to the Fund’s policy regarding frequent purchases and redemptions of Fund shares, you may not be able to repurchase shares for the first 30 days after your redemption. |
CDSC Waivers on A, B and C Shares available at Merrill Lynch
| | • | | Death or disability of the shareholder |
| | • | | Shares sold as part of a systematic withdrawal plan as described in the Fund’s prospectus |
| | • | | Return of excess contributions from an IRA Account |
| | • | | Shares sold as part of a required minimum distribution for IRA and retirement accounts due to the shareholder reaching age 70½ |
| | • | | Shares sold to pay Merrill Lynch fees but only if the transaction is initiated by Merrill Lynch |
| | • | | Shares acquired through a right of reinstatement |
| | • | | Shares held in retirement brokerage accounts, that are exchanged for a lower cost share class due to transfer to certain fee based accounts or platforms (applicable to A and C shares only) |
Front-end load Discounts Available at Merrill Lynch: Breakpoints, Rights of Accumulation & Letters of Intent
| | • | | Breakpoints as described in the Fund’s prospectus |
| | • | | Rights of Accumulation (ROA) which entitle shareholders to breakpoint discounts will be automatically calculated based on the aggregated holding of fund family assets held by accounts within the purchaser’s household at Merrill Lynch. Eligible fund family assets not held at Merrill Lynch may be included in the ROA calculation only if the shareholder notifies his or her financial advisor about such assets. |
| | • | | Letters of Intent (LOI) which allow for breakpoint discounts based on anticipated purchases within a fund family, through Merrill Lynch, over a 13-month period of time (if applicable) |
Morgan Stanley
Effective on or about July 1, 2018, shareholders purchasing Fund shares through a Morgan Stanley Wealth Management transactional brokerage account will be eligible only for the following Class A load waivers (front-end sales charge waivers), which may differ from and be more limited than those disclosed in the Fund’s prospectus or Statement of Additional Information.
Front-end Sales Load Waivers on Class A Shares Available at Morgan Stanley
| | • | | Employer-sponsored retirement plans (e.g., 401(k) plans, 457 plans, employer-sponsored 403(b) plans, profit sharing and money purchase pension plans and defined benefit plans). For purposes of this provision, employer-sponsored retirement plans do not include SEP IRAs, Simple IRAs, SAR-SEPs or Keogh plans. |
| | • | | Morgan Stanley employee and employee-related accounts according to Morgan Stanley’s account linking rules |
| | • | | Shares purchased through reinvestment of dividends and capital gains distributions when purchasing shares of the same fund |
| | • | | Shares purchased through a Morgan Stanley self-directed brokerage account |
| | | | | | |
| Appendix A (unaudited) | | Wells Fargo Intrinsic Small Cap Value Fund | | | 33 | |
| | • | | Class C (i.e., level-load) shares that are no longer subject to a contingent deferred sales charge and are exchanged to Class A shares of the same fund pursuant to Morgan Stanley Wealth Management’s share class exchange program. |
| | • | | Shares purchased from the proceeds of redemptions within the same fund family, provided (i) the repurchase occurs within 90 days following the redemption, (ii) the redemption and purchase occur in the same account, and (iii) redeemed shares were subject to a front-end or deferred sales charge. This waiver is subject to the Fund’s policy regarding frequent purchases and redemption of Fund shares, as discussed under “Account Information—Frequent Purchases and Redemptions of Fund Shares” in the Fund’s prospectus. |
Raymond James & Associates, Inc., Raymond James Financial Services & Raymond James affiliates (“Raymond James”)
Effective on or about March 1, 2019, shareholders purchasing Fund shares through a Raymond James platform or account will be eligible only for the following load waivers (front-end sales charge waivers and contingent deferred, or back-end, sales charge waivers) and discounts, which may differ from those disclosed elsewhere in the Fund’s Prospectus or SAI.
Front-end Sales Load Waivers on Class A shares Available at Raymond James
| | • | | Shares purchased in an investment advisory program. |
| | • | | Shares purchased through reinvestment of capital gains distributions and dividend reinvestment when purchasing shares of the same fund (but not any other fund within the fund family). |
| | • | | Employees and registered representatives of Raymond James or its affiliates and their family members as designated by Raymond James. |
| | • | | Shares purchased from the proceeds of redemptions within the same fund family, provided (1) the repurchase occurs within 90 days following the redemption, (2) the redemption and purchase occur in the same account, and (3) redeemed shares were subject to a front-end or deferred sales load (known as Rights of Reinstatement). |
| | • | | A shareholder in the fund’s Class C shares will have their shares automatically exchanged at net asset value to Class A shares (or the appropriate share class) of the fund if the shares are no longer subject to a CDSC and the exchange is in line with the policies and procedures of Raymond James. |
CDSC Waivers on Class A and C Shares Available at Raymond James
| | • | | Death or disability of the shareholder. |
| | • | | Shares sold as part of a systematic withdrawal plan as described in the Fund’s Prospectus. |
| | • | | Return of excess contributions from an IRA Account. |
| | • | | Shares sold as part of a required minimum distribution for IRA and retirement accounts due to the shareholder reaching age 70½ as described in the Fund’s prospectus. |
| | • | | Shares sold to pay Raymond James fees but only if the transaction is initiated by Raymond James. |
| | • | | Shares acquired through a right of reinstatement. |
Front-end Load Discounts Available at Raymond James: Breakpoints, and/or Rights of Accumulation
| | • | | Breakpoints as described in the Fund’s Prospectus. |
| | • | | Rights of accumulation which entitle shareholders to breakpoint discounts will be automatically calculated based on the aggregated holding of fund family assets held by accounts within the purchaser’s household at Raymond James. Eligible fund family assets not held at Raymond James may be included in the rights of accumulation calculation only if the shareholder notifies his or her financial advisor about such assets. |
This page is intentionally left blank.
This page is intentionally left blank.
This page is intentionally left blank.

For more information
More information about Wells Fargo Funds is available free upon request. To obtain literature, please write, visit the Fund’s website, or call:
Wells Fargo Funds
P.O. Box 219967
Kansas City, MO 64121-9967
Website: wellsfargofunds.com
Individual investors: 1-800-222-8222
Retail investment professionals: 1-888-877-9275
Institutional investment professionals: 1-866-765-0778
This report and the financial statements contained herein are submitted for the general information of the shareholders of the Fund. If this report is used for promotional purposes, distribution of the report must be accompanied or preceded by a current prospectus. Before investing, please consider the investment objectives, risks, charges, and expenses of the investment. For a current prospectus and, if available, a summary prospectus, containing this information, call 1-800-222-8222 or visit the Fund’s website at wellsfargofunds.com. Read the prospectus carefully before you invest or send money.
Wells Fargo Asset Management (WFAM) is the trade name for certain investment advisory/management firms owned by Wells Fargo & Company. These firms include but are not limited to Wells Capital Management Incorporated and Wells Fargo Funds Management, LLC. Certain products managed by WFAM entities are distributed by Wells Fargo Funds Distributor, LLC (a broker/dealer and Member FINRA).
This material is for general informational and educational purposes only and is NOT intended to provide investment advice or a recommendation of any kind—including a recommendation for any specific investment, strategy, or plan.
NOT FDIC INSURED ◾ NO BANK GUARANTEE ◾ MAY LOSE VALUE
© 2018 Wells Fargo Funds Management, LLC. All rights reserved.
| | |
 | | 317296 11-18 SA242/SAR242 09-18 |
Semi-Annual Report
September 30, 2018

Wells Fargo Small Cap Core Fund


Reduce clutter. Save trees.
Sign up for electronic delivery of prospectuses and shareholder reports at wellsfargo.com/advantagedelivery
Contents
The views expressed and any forward-looking statements are as of September 30, 2018, unless otherwise noted, and are those of the Fund managers and/or Wells Fargo Funds Management, LLC. Discussions of individual securities, or the markets generally, or any Wells Fargo Fund are not intended as individual recommendations. Future events or results may vary significantly from those expressed in any forward-looking statements. The views expressed are subject to change at any time in response to changing circumstances in the market. Wells Fargo Funds Management, LLC and the Fund disclaim any obligation to publicly update or revise any views expressed or forward-looking statements.
NOT FDIC INSURED ◾ NO BANK GUARANTEE ◾ MAY LOSE VALUE
| | | | |
| 2 | | Wells Fargo Small Cap Core Fund | | Letter to shareholders (unaudited) |

Andrew Owen
President
Wells Fargo Funds
The second and third quarters of 2018 were characterized by growing economic and investment activity in the U.S.
Dear Shareholder:
We are pleased to offer you this semi-annual report for the Wells Fargo Small Cap Core Fund for the six-month period that ended September 30, 2018. The second and third quarters of 2018 were characterized by growing economic and investment activity in the U.S. In contrast, economies overseas were restrained as geopolitical tensions and rising interest rates diverted investor interest in those markets.
For the period, U.S. stocks, as measured by the S&P 500 Index,1 gained 11.41% and international stocks, as measured by the MSCI ACWI ex USA Index (Net),2 lost 1.93%. Based on the MSCI EM Index (Net),3 emerging market stocks lost 8.97%. For bond investors, the Bloomberg Barclays U.S. Aggregate Bond Index4 lost 0.14% while the Bloomberg Barclays Global Aggregate ex-USD Index5 fell 6.42%. The Bloomberg Barclays Municipal Bond Index6 added 0.72%, and the ICE BofAML U.S. High Yield Index7 was up 3.46%.
Global trade tensions escalated during the second quarter.
During the second quarter of 2018, the U.S. government imposed tariffs, and foreign governments in North America, Europe, and Asia retaliated. The actions marked the initialization of trade tensions that would escalate during the next six months. The increasing tensions chilled investment activity as observers awaited signals of next steps.
Meanwhile, inflation continued an upward trend. The CPI-U8 added 0.1% in June after an increase of 0.2% in both April and May. On a year-over-year basis, the all-items index rose 2.9% for the 12 months that ended June 30, 2018. The index for all items less food and energy rose 2.3% for the same 12-month period.
| 1 | The S&P 500 Index consists of 500 stocks chosen for market size, liquidity, and industry group representation. It is a market-value-weighted index with each stock’s weight in the index proportionate to its market value. You cannot invest directly in an index. |
| 2 | The Morgan Stanley Capital International (MSCI) All Country World Index (ACWI) ex USA Index (Net) is a free-float-adjusted market-capitalization-weighted index that is designed to measure the equity market performance of developed markets, excluding the United States and Canada. Source: MSCI. MSCI makes no express or implied warranties or representations and shall have no liability whatsoever with respect to any MSCI data contained herein. The MSCI data may not be further redistributed or used as a basis for other indices or any securities or financial products. This report is not approved, reviewed, or produced by MSCI. You cannot invest directly in an index. |
| 3 | The MSCI Emerging Markets (EM) Index (Net) is a free-float-adjusted market-capitalization-weighted index that is designed to measure large- and mid-cap equity market performance of emerging markets. The MSCI EM Index (Net) consists of the following 24 emerging market country indices: Brazil, Chile, China, Colombia, Czech Republic, Egypt, Greece, Hungary, India, Indonesia, Korea, Malaysia, Mexico, Pakistan, Peru, the Philippines, Poland, Qatar, Russia, South Africa, Taiwan, Thailand, Turkey, and the United Arab Emirates. You cannot invest directly in an index. |
| 4 | The Bloomberg Barclays U.S. Aggregate Bond Index is a broad-based benchmark that measures the investment-grade, U.S. dollar-denominated, fixed-rate taxable bond market, including Treasuries, government-related and corporate securities, mortgage-backed securities (agency fixed-rate and hybrid adjustable-rate mortgage pass-throughs), asset-backed securities, and commercial mortgage-backed securities. You cannot invest directly in an index. |
| 5 | The Bloomberg Barclays Global Aggregate ex-USD Index is an unmanaged index that provides a broad-based measure of the global investment-grade fixed-income markets excluding the U.S. dollar-denominated debt market. You cannot invest directly in an index. |
| 6 | The Bloomberg Barclays Municipal Bond Index is an unmanaged index composed of long-term tax-exempt bonds with a minimum credit rating of Baa. You cannot invest directly in an index. |
| 7 | The ICE BofAML U.S. High Yield Index is a market-capitalization-weighted index of domestic and Yankee high-yield bonds. The index tracks the performance of high-yield securities traded in the U.S. bond market. You cannot invest directly in an index. Copyright 2018. ICE Data Indices, LLC. All rights reserved. |
| 8 | The Consumer Price Index for All Urban Consumers (CPI-U) measures the changes in the price of a basket of goods and services purchased by urban consumers. The urban consumer population is deemed by many as a better representative measure of the general public because close to 90% of the country’s population lives in highly populated areas. You cannot invest directly in an index. |
| | | | | | |
| Letter to shareholders (unaudited) | | Wells Fargo Small Cap Core Fund | | | 3 | |
U.S. stocks gained while international stocks and bonds declined during the summer of 2018.
The U.S. economy strengthened during the summer months. Revised second-quarter gross domestic product data released in August showed the U.S. economy growing at a 4.2% rate. After ticking up slightly in June, the unemployment rate in the U.S. was 3.9% in July and August, according to the U.S. Department of Labor. Wages showed more consistent growth, and consumer confidence remained strong.
Several U.S. equity market indices reached records during August, with the S&P 500 Index gaining 7.76% for the three-month period that ended August 31, 2018. International stock values continued to suffer under the effects of a strong U.S. dollar and continuing trade tensions. The MSCI ACWI ex USA Index (Net) and the MSCI EM Index (Net) were down 4.70% and 1.64%, during the same three-month period.
The U.S. Federal Reserve (Fed) increased the federal funds rate in June, and expectations grew that two more rate increases were in the offing in 2018. Long-term interest rates in the U.S. remained at higher levels relative to the prior 10 years. Rates on 10-year and 30-year Treasury bonds—2.74% and 2.97%, respectively, on March 31, 2018—were 3.05% and 3.19%, respectively, on September 30, off their peak levels on May 17, 2018, of 3.11% and 3.25%, respectively. Some investors became more aware of and concerned about the potential for an inverted yield curve—sometimes a recession signal—as short-term rates increased more quickly than long-term rates. The Fed decided to forgo an interest rate increase at its August meeting.
Internationally, members of Prime Minister Theresa May’s U.K./Brexit negotiating team resigned amid unproductive negotiations. In early August, the Bank of England’s Monetary Policy Committee increased its key interest rate to 0.75%. Central banks in Europe and Japan maintained low interest rates and accommodative monetary policies. Amid rising trade uncertainty, the People’s Bank of China cut reserve requirement ratios and accelerated infrastructure spending and tax cuts for business enterprises and individuals. Nevertheless, a strengthening U.S. dollar and the trade tensions remained headwinds for investors overseas.
Don’t let short-term uncertainty derail long-term investment goals.
Periods of investment uncertainty can present challenges, but experience has taught us that maintaining long-term investment goals can be an effective way to plan for the future. To help you create a sound strategy based on your personal goals and risk tolerance, Wells Fargo Funds offers more than 100 mutual funds spanning a wide range of asset classes and investment styles. Although diversification cannot guarantee an investment profit or prevent losses, we believe it can be an effective way to manage investment risk and potentially smooth out overall portfolio performance. We encourage investors to know their investments and to understand that appropriate levels of risk-taking may unlock opportunities.
The U.S. economy strengthened during the summer months.
| | | | |
| 4 | | Wells Fargo Small Cap Core Fund | | Letter to shareholders (unaudited) |
Thank you for choosing to invest with Wells Fargo Funds. We appreciate your confidence in us and remain committed to helping you meet your financial needs.
Sincerely,

Andrew Owen
President
Wells Fargo Funds
Notice to shareholders
At a meeting held on August 14-15, 2018, the Board of Trustees of the Fund approved the following policy which will be effective on or about February 5, 2019:
Class C shares will convert automatically into Class A shares ten years after the initial date of purchase or, if you acquired your Class C shares through an exchange or conversion from another share class, ten years after the date you acquired your Class C shares. When Class C shares that you acquired through a purchase or exchange convert, any other Class C shares that you purchased with reinvested dividends and distributions also will convert into Class A shares on a pro rata basis. A shorter holding period may also apply depending on your intermediary. Please see “Appendix A—Sales Charge Reductions and Waivers for Certain Intermediaries” in the Fund’s prospectus or at the end of this report.
For further information about your Fund, contact your investment professional, visit our website at wellsfargofunds.com, or call us directly at 1-800-222-8222.
This page is intentionally left blank.
| | | | |
| 6 | | Wells Fargo Small Cap Core Fund | | Performance highlights (unaudited) |
The Fund is currently closed to most new investors.1
Investment objective
The Fund seeks long-term capital appreciation.
Manager
Wells Fargo Funds Management, LLC
Subadviser
Wells Capital Management, Incorporated
Portfolio managers
John R. Campbell, CFA®
Justin P. Carr, CFA®
Greg W. Golden, CFA®
Average annual total returns (%) as of September 30, 20182
| | | | | | | | | | | | | | | | | | | | | | | | | | | | | | | | | | |
| | | | | Including sales charge | | | Excluding sales charge | | | Expense ratios3 (%) | |
| | | Inception date | | 1 year | | | 5 year | | | 10 year | | | 1 year | | | 5 year | | | 10 year | | | Gross | | | Net4 | |
| Class A (WOSCX) | | 5-20-2016 | | | (7.15 | ) | | | 6.31 | | | | 7.19 | | | | (1.50 | ) | | | 7.58 | | | | 7.82 | | | | 1.64 | | | | 1.35 | |
| Class C (WCSCX) | | 5-20-2016 | | | (3.20 | ) | | | 6.78 | | | | 7.02 | | | | (2.22 | ) | | | 6.78 | | | | 7.02 | | | | 2.39 | | | | 2.10 | |
| Class R6 (WRSCX) | | 5-20-2016 | | | – | | | | – | | | | – | | | | (0.98 | ) | | | 8.02 | | | | 8.23 | | | | 1.21 | | | | 0.90 | |
| Administrator Class (WNSCX) | | 5-20-2016 | | | – | | | | – | | | | – | | | | (1.36 | ) | | | 7.69 | | | | 7.93 | | | | 1.56 | | | | 1.25 | |
| Institutional Class (WYSCX) | | 9-13-2005 | | | – | | | | – | | | | – | | | | (1.07 | ) | | | 7.98 | | | | 8.21 | | | | 1.31 | | | | 1.00 | |
| Russell 2000® Index5 | | – | | | – | | | | – | | | | – | | | | 15.24 | | | | 11.07 | | | | 11.11 | | | | – | | | | – | |
Figures quoted represent past performance, which is no guarantee of future results, and do not reflect taxes that a shareholder may pay on fund distributions or the redemption of fund shares. Investment return and principal value of an investment will fluctuate so that an investor’s shares, when redeemed, may be worth more or less than their original cost. Performance shown without sales charges would be lower if sales charges were reflected. Current performance may be lower or higher than the performance data quoted, which assumes the reinvestment of dividends and capital gains. Current month-end performance is available on the Fund’s website, wellsfargofunds.com.
Index returns do not include transaction costs associated with buying and selling securities, any mutual fund fees or expenses, or any taxes. It is not possible to invest directly in an index.
For Class A shares, the maximum front-end sales charge is 5.75%. For Class C shares, the maximum contingent deferred sales charge is 1.00%. Performance including a contingent deferred sales charge assumes the sales charge for the corresponding time period. Class R6, Administrator Class, and Institutional Class shares are sold without a front-end sales charge or contingent deferred sales charge.
Stock values fluctuate in response to the activities of individual companies and general market and economic conditions. Certain investment strategies tend to increase the total risk of an investment (relative to the broader market). The Fund is exposed to foreign investment risk and smaller-company securities risk. Consult the Fund’s prospectus for additional information on these and other risks.
Please see footnotes on page 7.
| | | | | | |
| Performance highlights (unaudited) | | Wells Fargo Small Cap Core Fund | | | 7 | |
| | | | |
| Ten largest holdings (%) as of September 30, 20186 | |
AppFolio Incorporated Class A | | | 2.75 | |
Universal Insurance Holdings Company | | | 2.49 | |
Evercore Partners Incorporated Class A | | | 2.16 | |
Helix Energy Solutions Group Incorporated | | | 2.16 | |
ManTech International Corporation Class A | | | 2.15 | |
Supernus Pharmaceuticals Incorporated | | | 2.11 | |
Novocure Limited | | | 2.07 | |
The Greenbrier Companies Incorporated | | | 2.00 | |
Encompass Health Corporation | | | 2.00 | |
Ruth’s Chris Steak House Incorporated | | | 1.97 | |
|
| Sector distribution as of September 30, 20187 |
|

|
| 1 | Please see the Fund’s current Statement of Additional Information for further details. |
| 2 | Historical performance shown for the Class A, Class C, and Administrator Class shares prior to their inception reflects the performance of the Institutional Class shares, and are adjusted to reflect the higher expenses applicable to Class A, Class C, and Administrator shares, respectively. Historical performance shown for the Class R6 shares prior to their inception reflects the performance of the Institutional Class shares, and has not been adjusted to reflect the expenses of the Class R6 shares. If these expenses had been included, returns for Class R6 shares would be higher. Historical performance shown for all classes of the Fund prior to May 20, 2016 is based on the performance of the Fund’s predecessor, Golden Small Cap Core Fund. |
| 3 | Reflects the expense ratios as stated in the most recent prospectuses. The expense ratios shown are subject to change and may differ from the annualized expense ratios shown in the financial highlights of this report. |
| 4 | The manager has contractually committed through July 31, 2019, to waive fees and/or reimburse expenses to the extent necessary to cap the Fund’s Total Annual Fund Operating Expenses After Fee Waivers at the amounts shown. After this time, the cap may be increased or the commitment to maintain the cap may be terminated only with the approval of the Board of Trustees. Brokerage commissions, stamp duty fees, interest, taxes, acquired fund fees and expenses (if any), and extraordinary expenses are excluded from the expense cap. Without this cap, the Fund’s returns would have been lower. The expense ratio paid by an investor is the net expense ratio (the total annual fund operating expenses after fee waivers) as stated in the prospectuses. |
| 5 | The Russell 2000® Index measures the performance of the 2,000 smallest companies in the Russell 3000® Index, which represents approximately 8% of the total market capitalization of the Russell 3000® Index. You cannot invest directly in an index. |
| 6 | The ten largest holdings, excluding cash, cash equivalents and any money market funds, are calculated based on the value of the investments divided by total net assets of the Fund. Holdings are subject to change and may have changed since the date specified. |
| 7 | Amounts are calculated based on the total long-term investments of the Fund. These amounts are subject to change and may have changed since the date specified. |
| | | | |
| 8 | | Wells Fargo Small Cap Core Fund | | Fund expenses (unaudited) |
As a shareholder of the Fund, you incur two types of costs: (1) transaction costs, including sales charges (loads) on purchase payments and contingent deferred sales charges (if any) on redemptions and (2) ongoing costs, including management fees, distribution (12b-1) and/or shareholder servicing fees, and other Fund expenses. This example is intended to help you understand your ongoing costs (in dollars) of investing in the Fund and to compare these costs with the ongoing costs of investing in other mutual funds.
The example is based on an investment of $1,000 invested at the beginning of the six-month period and held for the entire period from April 1, 2018 to September 30, 2018.
Actual expenses
The “Actual” line of the table below provides information about actual account values and actual expenses. You may use the information in this line, together with the amount you invested, to estimate the expenses that you paid over the period. Simply divide your account value by $1,000 (for example, an $8,600 account value divided by $1,000 = 8.6), then multiply the result by the number in the “Actual” line under the heading entitled “Expenses paid during period” for your applicable class of shares to estimate the expenses you paid on your account during this period.
Hypothetical example for comparison purposes
The “Hypothetical” line of the table below provides information about hypothetical account values and hypothetical expenses based on the Fund’s actual expense ratio and an assumed rate of return of 5% per year before expenses, which is not the Fund’s actual return. The hypothetical account values and expenses may not be used to estimate the actual ending account balance or expenses you paid for the period. You may use this information to compare the ongoing costs of investing in the Fund and other funds. To do so, compare this 5% hypothetical example with the 5% hypothetical examples that appear in the shareholder reports of the other funds.
Please note that the expenses shown in the table are meant to highlight your ongoing costs only and do not reflect any transactional costs, such as sales charges (loads) and contingent deferred sales charges. Therefore, the “Hypothetical” line of the table is useful in comparing ongoing costs only and will not help you determine the relative total costs of owning different funds. In addition, if these transactional costs were included, your costs would have been higher.
| | | | | | | | | | | | | | | | |
| | | Beginning
account value
4-1-2018 | | | Ending
account value
9-30-2018 | | | Expenses
paid during
the period¹ | | | Annualized net
expense ratio | |
Class A | | | | | | | | | | | | | | | | |
Actual | | $ | 1,000.00 | | | $ | 948.10 | | | $ | 6.59 | | | | 1.35 | % |
Hypothetical (5% return before expenses) | | $ | 1,000.00 | | | $ | 1,018.30 | | | $ | 6.83 | | | | 1.35 | % |
Class C | | | | | | | | | | | | | | | | |
Actual | | $ | 1,000.00 | | | $ | 944.30 | | | $ | 10.24 | | | | 2.10 | % |
Hypothetical (5% return before expenses) | | $ | 1,000.00 | | | $ | 1,014.54 | | | $ | 10.61 | | | | 2.10 | % |
Class R6 | | | | | | | | | | | | | | | | |
Actual | | $ | 1,000.00 | | | $ | 950.00 | | | $ | 4.40 | | | | 0.90 | % |
Hypothetical (5% return before expenses) | | $ | 1,000.00 | | | $ | 1,020.56 | | | $ | 4.56 | | | | 0.90 | % |
Administrator Class | | | | | | | | | | | | | | | | |
Actual | | $ | 1,000.00 | | | $ | 948.50 | | | $ | 6.11 | | | | 1.25 | % |
Hypothetical (5% return before expenses) | | $ | 1,000.00 | | | $ | 1,018.80 | | | $ | 6.33 | | | | 1.25 | % |
Institutional Class | | | | | | | | | | | | | | | | |
Actual | | $ | 1,000.00 | | | $ | 950.00 | | | $ | 4.89 | | | | 1.00 | % |
Hypothetical (5% return before expenses) | | $ | 1,000.00 | | | $ | 1,020.05 | | | $ | 5.06 | | | | 1.00 | % |
| 1 | Expenses paid is equal to the annualized net expense ratio of each class multiplied by the average account value over the period, multiplied by the number of days in the most recent fiscal half-year divided by the number of days in the fiscal year (to reflect the one-half-year period). |
| | | | | | |
| Portfolio of investments—September 30, 2018 (unaudited) | | Wells Fargo Small Cap Core Fund | | | 9 | |
| | | | | | | | | | | | | | | | |
| Security name | | | | | | | | Shares | | | Value | |
| | | | |
Common Stocks: 99.28% | | | | | | | | | | | | | | | | |
| | | | |
Consumer Discretionary: 13.23% | | | | | | | | | | | | | | | | |
| | | | |
| Auto Components: 2.63% | | | | | | | | | | | | | | | | |
Tenneco Incorporated | | | | | | | | | | | 17,865 | | | $ | 752,831 | |
Tower International Incorporated | | | | | | | | | | | 26,321 | | | | 796,210 | |
| | | | |
| | | | | | | | | | | | | | | 1,549,041 | |
| | | | | | | | | | | | | | | | |
| | | | |
| Automobiles: 1.11% | | | | | | | | | | | | | | | | |
Winnebago Industries Incorporated | | | | | | | | | | | 19,655 | | | | 651,563 | |
| | | | | | | | | | | | | | | | |
| | | | |
| Hotels, Restaurants & Leisure: 1.97% | | | | | | | | | | | | | | | | |
Ruth’s Chris Steak House Incorporated | | | | | | | | | | | 36,710 | | | | 1,158,201 | |
| | | | | | | | | | | | | | | | |
| | | | |
| Household Durables: 1.62% | | | | | | | | | | | | | | | | |
KB Home Incorporated | | | | | | | | | | | 39,751 | | | | 950,446 | |
| | | | | | | | | | | | | | | | |
| | | | |
| Multiline Retail: 1.38% | | | | | | | | | | | | | | | | |
Big Lots Stores Incorporated « | | | | | | | | | | | 19,499 | | | | 814,863 | |
| | | | | | | | | | | | | | | | |
| | | | |
| Specialty Retail: 3.53% | | | | | | | | | | | | | | | | |
Children’s Place Retail Stores Incorporated | | | | | | | | | | | 7,957 | | | | 1,016,905 | |
Zumiez Incorporated † | | | | | | | | | | | 40,236 | | | | 1,060,219 | |
| | | | |
| | | | | | | | | | | | | | | 2,077,124 | |
| | | | | | | | | | | | | | | | |
| | | | |
| Textiles, Apparel & Luxury Goods: 0.99% | | | | | | | | | | | | | | | | |
Skechers U.S.A. Incorporated Class A † | | | | | | | | | | | 20,788 | | | | 580,609 | |
| | | | | | | | | | | | | | | | |
| | | | |
Energy: 6.63% | | | | | | | | | | | | | | | | |
| | | | |
| Energy Equipment & Services: 5.24% | | | | | | | | | | | | | | | | |
Archrock Incorporated | | | | | | | | | | | 83,876 | | | | 1,023,287 | |
C&J Energy Services Incorporated † | | | | | | | | | | | 37,914 | | | | 788,611 | |
Helix Energy Solutions Group Incorporated † | | | | | | | | | | | 128,383 | | | | 1,268,424 | |
| | | | |
| | | | | | | | | | | | | | | 3,080,322 | |
| | | | | | | | | | | | | | | | |
| | | | |
| Oil, Gas & Consumable Fuels: 1.39% | | | | | | | | | | | | | | | | |
Delek US Holdings Incorporated | | | | | | | | | | | 19,318 | | | | 819,663 | |
| | | | | | | | | | | | | | | | |
| | | | |
Financials: 14.95% | | | | | | | | | | | | | | | | |
| | | | |
| Banks: 3.37% | | | | | | | | | | | | | | | | |
First Merchants Corporation | | | | | | | | | | | 25,038 | | | | 1,126,460 | |
Umpqua Holdings Corporation | | | | | | | | | | | 41,154 | | | | 856,003 | |
| | | | |
| | | | | | | | | | | | | | | 1,982,463 | |
| | | | | | | | | | | | | | | | |
| | | | |
| Capital Markets: 4.03% | | | | | | | | | | | | | | | | |
Evercore Partners Incorporated Class A | | | | | | | | | | | 12,627 | | | | 1,269,645 | |
Houlihan Lokey Incorporated | | | | | | | | | | | 24,463 | | | | 1,099,123 | |
| | | | |
| | | | | | | | | | | | | | | 2,368,768 | |
| | | | | | | | | | | | | | | | |
| | | | |
| Consumer Finance: 1.50% | | | | | | | | | | | | | | | | |
Enova International Incorporated † | | | | | | | | | | | 30,527 | | | | 879,178 | |
| | | | | | | | | | | | | | | | |
The accompanying notes are an integral part of these financial statements.
| | | | |
| 10 | | Wells Fargo Small Cap Core Fund | | Portfolio of investments—September 30, 2018 (unaudited) |
| | | | | | | | | | | | | | | | |
| Security name | | | | | | | | Shares | | | Value | |
| | | | |
| Insurance: 4.32% | | | | | | | | | | | | | | | | |
National General Holdings Corporation | | | | | | | | | | | 40,223 | | | $ | 1,079,585 | |
Universal Insurance Holdings Company | | | | | | | | | | | 30,122 | | | | 1,462,423 | |
| | | | |
| | | | | | | | | | | | | | | 2,542,008 | |
| | | | | | | | | | | | | | | | |
| | | | |
| Thrifts & Mortgage Finance: 1.73% | | | | | | | | | | | | | | | | |
MGIC Investment Corporation † | | | | | | | | | | | 76,432 | | | | 1,017,310 | |
| | | | | | | | | | | | | | | | |
| | | | |
Health Care: 16.95% | | | | | | | | | | | | | | | | |
| | | | |
| Biotechnology: 1.59% | | | | | | | | | | | | | | | | |
Exelixis Incorporated † | | | | | | | | | | | 52,785 | | | | 935,350 | |
| | | | | | | | | | | | | | | | |
| | | | |
| Health Care Equipment & Supplies: 6.73% | | | | | | | | | | | | | | | | |
ICU Medical Incorporated † | | | | | | | | | | | 3,347 | | | | 946,364 | |
Novocure Limited † | | | | | | | | | | | 23,195 | | | | 1,215,418 | |
OraSure Technologies Incorporated † | | | | | | | | | | | 54,089 | | | | 835,675 | |
Orthofix Medical Incorporated † | | | | | | | | | | | 16,584 | | | | 958,721 | |
| | | | |
| | | | | | | | | | | | | | | 3,956,178 | |
| | | | | | | | | | | | | | | | |
| | | | |
| Health Care Providers & Services: 4.77% | | | | | | | | | | | | | | | | |
Encompass Health Corporation | | | | | | | | | | | 15,080 | | | | 1,175,486 | |
Magellan Health Services Incorporated † | | | | | | | | | | | 11,952 | | | | 861,142 | |
Tivity Health Incorporated † | | | | | | | | | | | 23,886 | | | | 767,935 | |
| | | | |
| | | | | | | | | | | | | | | 2,804,563 | |
| | | | | | | | | | | | | | | | |
| | | | |
| Pharmaceuticals: 3.86% | | | | | | | | | | | | | | | | |
Catalent Incorporated † | | | | | | | | | | | 22,682 | | | | 1,033,165 | |
Supernus Pharmaceuticals Incorporated † | | | | | | | | | | | 24,629 | | | | 1,240,070 | |
| | | | |
| | | | | | | | | | | | | | | 2,273,235 | |
| | | | | | | | | | | | | | | | |
| | | | |
Industrials: 19.61% | | | | | | | | | | | | | | | | |
| | | | |
| Airlines: 1.60% | | | | | | | | | | | | | | | | |
SkyWest Incorporated | | | | | | | | | | | 15,996 | | | | 942,164 | |
| | | | | | | | | | | | | | | | |
| | | | |
| Commercial Services & Supplies: 4.80% | | | | | | | | | | | | | | | | |
ACCO Brands Corporation | | | | | | | | | | | 72,977 | | | | 824,640 | |
SP Plus Corporation † | | | | | | | | | | | 25,260 | | | | 921,990 | |
UniFirst Corporation | | | | | | | | | | | 6,194 | | | | 1,075,588 | |
| | | | |
| | | | | | | | | | | | | | | 2,822,218 | |
| | | | | | | | | | | | | | | | |
| | | | |
| Construction & Engineering: 3.15% | | | | | | | | | | | | | | | | |
EMCOR Group Incorporated | | | | | | | | | | | 13,352 | | | | 1,002,869 | |
MasTec Incorporated † | | | | | | | | | | | 19,045 | | | | 850,359 | |
| | | | |
| | | | | | | | | | | | | | | 1,853,228 | |
| | | | | | | | | | | | | | | | |
| | | | |
| Machinery: 3.42% | | | | | | | | | | | | | | | | |
EnPro Industries Incorporated | | | | | | | | | | | 11,366 | | | | 828,922 | |
The Greenbrier Companies Incorporated | | | | | | | | | | | 19,612 | | | | 1,178,681 | |
| | | | |
| | | | | | | | | | | | | | | 2,007,603 | |
| | | | | | | | | | | | | | | | |
The accompanying notes are an integral part of these financial statements.
| | | | | | |
| Portfolio of investments—September 30, 2018 (unaudited) | | Wells Fargo Small Cap Core Fund | | | 11 | |
| | | | | | | | | | | | | | | | |
| Security name | | | | | | | | Shares | | | Value | |
| | | | |
| Professional Services: 1.77% | | | | | | | | | | | | | | | | |
Insperity Incorporated | | | | | | | | | | | 8,815 | | | $ | 1,039,729 | |
| | | | | | | | | | | | | | | | |
| | | | |
| Road & Rail: 1.60% | | | | | | | | | | | | | | | | |
Covenant Transport Incorporated Class A † | | | | | | | | | | | 32,437 | | | | 942,619 | |
| | | | | | | | | | | | | | | | |
| | | | |
| Trading Companies & Distributors: 3.27% | | | | | | | | | | | | | | | | |
Applied Industrial Technologies Incorporated | | | | | | | | | | | 14,745 | | | | 1,153,796 | |
Rush Enterprises Incorporated | | | | | | | | | | | 19,538 | | | | 768,039 | |
| | | | |
| | | | | | | | | | | | | | | 1,921,835 | |
| | | | | | | | | | | | | | | | |
| | | | |
Information Technology: 15.43% | | | | | | | | | | | | | | | | |
| | | | |
| Electronic Equipment, Instruments & Components: 2.63% | | | | | | | | | | | | | | | | |
Kemet Corporation † | | | | | | | | | | | 46,493 | | | | 862,445 | |
Synnex Corporation | | | | | | | | | | | 8,045 | | | | 681,412 | |
| | | | |
| | | | | | | | | | | | | | | 1,543,857 | |
| | | | | | | | | | | | | | | | |
| | | | |
| IT Services: 4.08% | | | | | | | | | | | | | | | | |
Hackett Group Incorporated | | | | | | | | | | | 56,517 | | | | 1,138,818 | |
ManTech International Corporation Class A | | | | | | | | | | | 19,959 | | | | 1,263,405 | |
| | | | |
| | | | | | | | | | | | | | | 2,402,223 | |
| | | | | | | | | | | | | | | | |
| | | | |
| Semiconductors & Semiconductor Equipment: 4.26% | | | | | | | | | | | | | | | | |
Advanced Energy Industries Incorporated † | | | | | | | | | | | 13,840 | | | | 714,836 | |
Brooks Automation Incorporated | | | | | | | | | | | 31,366 | | | | 1,098,751 | |
MKS Instruments Incorporated | | | | | | | | | | | 8,633 | | | | 691,935 | |
| | | | |
| | | | | | | | | | | | | | | 2,505,522 | |
| | | | | | | | | | | | | | | | |
| | | | |
| Software: 4.46% | | | | | | | | | | | | | | | | |
AppFolio Incorporated Class A † | | | | | | | | | | | 20,636 | | | | 1,617,862 | |
Qualys Incorporated † | | | | | | | | | | | 11,278 | | | | 1,004,870 | |
| | | | |
| | | | | | | | | | | | | | | 2,622,732 | |
| | | | | | | | | | | | | | | | |
| | | | |
Materials: 6.93% | | | | | | | | | | | | | | | | |
| | | | |
| Chemicals: 1.94% | | | | | | | | | | | | | �� | | | |
Trinseo SA | | | | | | | | | | | 14,610 | | | | 1,143,963 | |
| | | | | | | | | | | | | | | | |
| | | | |
| Metals & Mining: 3.48% | | | | | | | | | | | | | | | | |
Materion Corporation | | | | | | | | | | | 18,526 | | | | 1,120,823 | |
Suncoke Energy Incorporated † | | | | | | | | | | | 79,562 | | | | 924,510 | |
| | | | |
| | | | | | | | | | | | | | | 2,045,333 | |
| | | | | | | | | | | | | | | | |
| | | | |
| Paper & Forest Products: 1.51% | | | | | | | | | | | | | | | | |
Louisiana-Pacific Corporation | | | | | | | | | | | 33,436 | | | | 885,720 | |
| | | | | | | | | | | | | | | | |
| | | | |
Real Estate: 2.97% | | | | | | | | | | | | | | | | |
| | | | |
| Equity REITs: 2.97% | | | | | | | | | | | | | | | | |
Ashford Hospitality Trust Incorporated | | | | | | | | | | | 107,520 | | | | 687,053 | |
The Geo Group Incorporated | | | | | | | | | | | 42,197 | | | | 1,061,677 | |
| | | | |
| | | | | | | | | | | | | | | 1,748,730 | |
| | | | | | | | | | | | | | | | |
The accompanying notes are an integral part of these financial statements.
| | | | |
| 12 | | Wells Fargo Small Cap Core Fund | | Portfolio of investments—September 30, 2018 (unaudited) |
| | | | | | | | | | | | | | | | |
| Security name | | | | | | | | Shares | | | Value | |
| | | | |
Utilities: 2.58% | | | | | | | | | | | | | | | | |
| | | | |
| Electric Utilities: 0.67% | | | | | | | | | | | | | | | | |
Spark Energy Incorporated Class A | | | | | | | | | | | 47,537 | | | $ | 392,180 | |
| | | | | | | | | | | | | | | | |
| | | | |
| Independent Power & Renewable Electricity Producers: 1.91% | | | | | | | | | | | | | | | | |
Clearway Energy Incorporated | | | | | | | | | | | 59,058 | | | | 1,124,464 | |
| | | | | | | | | | | | | | | | |
| | | | |
Total Common Stocks (Cost $50,135,496) | | | | | | | | | | | | | | | 58,385,005 | |
| | | | | | | | | | | | | | | | |
| | | | |
| | | Yield | | | | | | | | | | |
| Short-Term Investments: 2.08% | | | | | | | | | | | | | | | | |
| | | | |
| Investment Companies: 2.08% | | | | | | | | | | | | | | | | |
Securities Lending Cash Investment LLC (l)(r)(u) | | | 2.17 | % | | | | | | | 798,432 | | | | 798,512 | |
Wells Fargo Government Money Market Fund Select Class (l)(u) | | | 1.99 | | | | | | | | 425,352 | | | | 425,352 | |
| | | | |
Total Short-Term Investments (Cost $1,223,864) | | | | | | | | | | | | | | | 1,223,864 | |
| | | | | | | | | | | | | | | | |
| | | | | | | | |
| Total investments in securities (Cost $51,359,360) | | | 101.36 | % | | | 59,608,869 | |
Other assets and liabilities, net | | | (1.36 | ) | | | (799,653 | ) |
| | | | | | | | |
| Total net assets | | | 100.00 | % | | $ | 58,809,216 | |
| | | | | | | | |
| « | All or a portion of this security is on loan. |
| † | Non-income-earning security |
| (l) | The issuer of the security is an affiliated person of the Fund as defined in the Investment Company Act of 1940. |
| (r) | The investment is a non-registered investment company purchased with cash collateral received from securities on loan. |
| (u) | The rate represents the 7-day annualized yield at period end. |
Abbreviations:
| REIT | Real estate investment trust |
Investments in Affiliates
An affiliated investment is an investment in which the Fund owns at least 5% of the outstanding voting shares of the issuer or as a result of other relationships, such as the Fund and the issuer having the same investment manager. Transactions with issuers that were either affiliated persons of the Fund at the beginning of the period or the end of the period were as follows:
| | | | | | | | | | | | | | | | | | | | | | | | | | | | | | | | | | | | |
| | | Shares,
beginning of
period | | | Shares
purchased | | | Shares
sold | | | Shares,
end of
period | | | Net
realized
gains
(losses) | | | Net
change in
unrealized
gains
(losses) | | | Income
from
affiliated
securities | | | Value,
end
of period | | | % of
net
assets | |
Short-Term Investments | | | | | | | | | | | | | | | | | | | | | | | | | | | | | | | | | | | | |
Investment Companies | | | | | | | | | | | | | | | | | | | | | | | | | | | | | | | | | | | | |
Securities Lending Cash Investment LLC | | | 4,708,943 | | | | 17,387,791 | | | | 21,298,302 | | | | 798,432 | | | $ | 0 | | | $ | 0 | | | $ | 24,858 | | | $ | 798,512 | | | | | |
Wells Fargo Government Money Market Fund Select Class | | | 0 | | | | 7,220,284 | | | | 6,794,932 | | | | 425,352 | | | | 0 | | | | 0 | | | | 3,204 | | | | 425,352 | | | | | |
| | | | | | | | | | | | | | | | | | | | | | | | | | | | | | | | | | | | |
| | | | | | | | | | | | | | | | | | $ | 0 | | | $ | 0 | | | $ | 28,062 | | | $ | 1,223,864 | | | | 2.08 | % |
| | | | | | | | | | | | | | | | | | | | | | | | | | | | | | | | | | | | |
The accompanying notes are an integral part of these financial statements.
| | | | | | |
| Statement of assets and liabilities—September 30, 2018 (unaudited) | | Wells Fargo Small Cap Core Fund | | | 13 | |
| | | | |
| | | | |
| |
Assets | | | | |
Investments in unaffiliated securities, (including $782,838, of securities loaned), at value (cost $50,135,496) | | $ | 58,385,005 | |
Investments in affiliated securities, at value (cost $1,223,864) | | | 1,223,864 | |
Receivable for dividends | | | 29,377 | |
Receivable for securities lending income | | | 293 | |
Prepaid expenses and other assets | | | 59,517 | |
| | | | |
Total assets | | | 59,698,056 | |
| | | | |
| |
Liabilities | | | | |
Payable upon receipt of securities loaned | | | 798,507 | |
Management fee payable | | | 26,033 | |
Payable for Fund shares redeemed | | | 17,900 | |
Administration fees payable | | | 3,320 | |
Trustees’ fees and expenses payable | | | 827 | |
Distribution fee payable | | | 317 | |
Accrued expenses and other liabilities | | | 41,936 | |
| | | | |
Total liabilities | | | 888,840 | |
| | | | |
Total net assets | | $ | 58,809,216 | |
| | | | |
| |
NET ASSETS CONSIST OF | | | | |
Paid-in capital | | $ | 46,829,722 | |
Total distributable earnings | | | 11,979,494 | |
| | | | |
Total net assets | | $ | 58,809,216 | |
| | | | |
| |
COMPUTATION OF NET ASSET VALUE AND OFFERING PRICE PER SHARE | | | | |
Net assets – Class A | | $ | 1,217,779 | |
Shares outstanding – Class A1 | | | 57,897 | |
Net asset value per share – Class A | | | $21.03 | |
Maximum offering price per share – Class A2 | | | $22.31 | |
Net assets – Class C | | $ | 534,069 | |
Shares outstanding – Class C1 | | | 25,822 | |
Net asset value per share – Class C | | | $20.68 | |
Net assets – Class R6 | | $ | 38,487,209 | |
Shares outstanding – Class R61 | | | 1,810,685 | |
Net asset value per share – Class R6 | | | $21.26 | |
Net assets – Administrator Class | | $ | 129,472 | |
Shares outstanding – Administrator Class1 | | | 6,142 | |
Net asset value per share – Administrator Class | | | $21.08 | |
Net assets – Institutional Class | | $ | 18,440,687 | |
Shares outstanding – Institutional Class1 | | | 869,147 | |
Net asset value per share – Institutional Class | | | $21.22 | |
| 1 | The Fund has an unlimited number of authorized shares. |
| 2 | Maximum offering price is computed as 100/94.25 of net asset value. On investments of $50,000 or more, the offering price is reduced. |
The accompanying notes are an integral part of these financial statements.
| | | | |
| 14 | | Wells Fargo Small Cap Core Fund | | Statement of operations—six months ended September 30, 2018 (unaudited) |
| | | | |
| | | | |
| |
Investment income | | | | |
Dividends | | $ | 444,459 | |
Income from affiliated securities | | | 28,062 | |
| | | | |
Total investment income | | | 472,521 | |
| | | | |
| |
Expenses | | | | |
Management fee | | | 279,754 | |
Administration fees | | | | |
Class A | | | 1,082 | |
Class C | | | 497 | |
Class R6 | | | 6,538 | |
Administrator Class | | | 88 | |
Institutional Class | | | 13,390 | |
Shareholder servicing fees | | | | |
Class A | | | 1,288 | |
Class C | | | 592 | |
Administrator Class | | | 170 | |
Distribution fee | | | | |
Class C | | | 1,776 | |
Custody and accounting fees | | | 19,569 | |
Professional fees | | | 26,127 | |
Registration fees | | | 36,498 | |
Shareholder report expenses | | | 20,025 | |
Trustees’ fees and expenses | | | 11,417 | |
Other fees and expenses | | | 7,188 | |
| | | | |
Total expenses | | | 425,999 | |
Less: Fee waivers and/or expense reimbursements | | | (114,091 | ) |
| | | | |
Net expenses | | | 311,908 | |
| | | | |
Net investment income | | | 160,613 | |
| | | | |
| |
REALIZED AND UNREALIZED GAINS (LOSSES) ON INVESTMENTS | | | | |
Net realized gains on investments | | | 3,979,260 | |
Net change in unrealized gains (losses) on investments | | | (1,346,952 | ) |
| | | | |
Net realized and unrealized gains (losses) on investments | | | 2,632,308 | |
| | | | |
Net increase in net assets resulting from operations | | $ | 2,792,921 | |
| | | | |
The accompanying notes are an integral part of these financial statements.
| | | | | | |
| Statement of changes in net assets | | Wells Fargo Small Cap Core Fund | | | 15 | |
| | | | | | | | | | | | | | | | |
| | | Six months ended
September 30, 2018
(unaudited) | | | Year ended
March 31, 20181 | |
| | | | |
Operations | | | | | | | | | | | | | | | | |
Net investment income | | | | | | $ | 160,613 | | | | | | | $ | 105,535 | |
Net realized gains on investments | | | | | | | 3,979,260 | | | | | | | | 8,151,237 | |
Net change in unrealized gains (losses) on investments | | | | | | | (1,346,952 | ) | | | | | | | (10,668,825 | ) |
| | | | |
Net increase (decrease) in net assets resulting from operations | | | | | | | 2,792,921 | | | | | | | | (2,412,053 | ) |
| | | | |
| | | | |
Capital share transactions | | | Shares | | | | | | | | Shares | | | | | |
Proceeds from shares sold | | | | | | | | | | | | | | | | |
Class A | | | 28,601 | | | | 614,809 | | | | 37,520 | | | | 783,618 | |
Class C | | | 4,425 | | | | 93,260 | | | | 16,509 | | | | 337,254 | |
Class R6 | | | 57,005 | | | | 1,216,078 | | | | 2,403,202 | | | | 49,394,331 | |
Administrator Class | | | 134 | | | | 2,634 | | | | 526 | | | | 10,842 | |
Institutional Class | | | 16,878 | | | | 358,777 | | | | 439,875 | | | | 9,607,302 | |
| | | | |
| | | | | | | 2,285,558 | | | | | | | | 60,133,347 | |
| | | | |
Payment for shares redeemed | | | | | | | | | | | | | | | | |
Class A | | | (10,438 | ) | | | (224,502 | ) | | | (18,944 | ) | | | (398,834 | ) |
Class C | | | (1,029 | ) | | | (21,471 | ) | | | (1,955 | ) | | | (40,335 | ) |
Class R6 | | | (442,290 | ) | | | (9,542,637 | ) | | | (213,263 | ) | | | (4,357,007 | ) |
Administrator Class | | | (660 | ) | | | (14,195 | ) | | | 0 | | | | 0 | |
Institutional Class | | | (185,805 | ) | | | (3,989,057 | ) | | | (3,401,750 | ) | | | (70,332,621 | ) |
| | | | |
| | | | | | | (13,791,862 | ) | | | | | | | (75,128,797 | ) |
| | | | |
Net decrease in net assets resulting from capital share transactions | | | | | | | (11,506,304 | ) | | | | | | | (14,995,450 | ) |
| | | | |
Total decrease in net assets | | | | | | | (8,713,383 | ) | | | | | | | (17,407,503 | ) |
| | | | |
| | | | |
Net assets | | | | | | | | | | | | | | | | |
Beginning of period | | | | | | | 67,522,599 | | | | | | | | 84,930,102 | |
| | | | |
End of period | | | | | | $ | 58,809,216 | | | | | | | $ | 67,522,599 | |
| | | | |
| 1 | Effective for all filings after November 4, 2018, the SEC prospectively eliminated the requirements to parenthetically disclose undistributed net investment income at the end of the period. Undistributed net investment income at March 31, 2018 was $105,535. |
The accompanying notes are an integral part of these financial statements.
| | | | |
| 16 | | Wells Fargo Small Cap Core Fund | | Financial highlights |
(For a share outstanding throughout each period)
| | | | | | | | | | | | | | | | |
| | | Six months ended
September 30, 2018
(unaudited) | | | Year ended March 31 | | | Year ended
June 30, 20162 | |
| CLASS A | | 2018 | | | 20171 | |
Net asset value, beginning of period | | | $20.29 | | | | $20.95 | | | | $16.89 | | | | $16.62 | |
Net investment income (loss) | | | 0.01 | 3 | | | (0.05 | )3 | | | (0.05 | )3 | | | 0.01 | 3 |
Net realized and unrealized gains (losses) on investments | | | 0.73 | | | | (0.61 | ) | | | 4.15 | | | | 0.26 | |
| | | | | | | | | | | | | | | | |
Total from investment operations | | | 0.74 | | | | (0.66 | ) | | | 4.10 | | | | 0.27 | |
Distributions to shareholders from | | | | | | | | | | | | | | | | |
Net investment income | | | 0.00 | | | | 0.00 | | | | (0.04 | ) | | | 0.00 | |
Net asset value, end of period | | | $21.03 | | | | $20.29 | | | | $20.95 | | | | $16.89 | |
Total return4 | | | 3.70 | % | | | (3.15 | )% | | | 24.30 | % | | | 1.62 | % |
Ratios to average net assets (annualized) | | | | | | | | | | | | | | | | |
Gross expenses | | | 1.67 | % | | | 1.66 | % | | | 1.50 | % | | | 1.46 | % |
Net expenses | | | 1.35 | % | | | 1.35 | % | | | 1.35 | % | | | 1.35 | % |
Net investment income (loss) | | | 0.08 | % | | | (0.25 | )% | | | (0.32 | )% | | | 0.65 | % |
Supplemental data | | | | | | | | | | | | | | | | |
Portfolio turnover rate | | | 25 | % | | | 53 | % | | | 25 | % | | | 61 | % |
Net assets, end of period (000s omitted) | | | $1,218 | | | | $806 | | | | $443 | | | | $132 | |
| 1 | For the nine months ended March 31, 2017. The Fund changed its fiscal year end from June 30 to March 31, effective March 31, 2017. |
| 2 | For the period May 20, 2016 (commencement of class operations) to June 30, 2016 |
| 3 | Calculated based upon average shares outstanding |
| 4 | Total return calculations do not include any sales charges. Returns for periods of less than one year are not annualized. |
The accompanying notes are an integral part of these financial statements.
| | | | | | |
| Financial highlights | | Wells Fargo Small Cap Core Fund | | | 17 | |
(For a share outstanding throughout each period)
| | | | | | | | | | | | | | | | |
| | | Six months ended
September 30, 2018 (unaudited) | | | Year ended March 31 | | | Year ended June 30, 20162 | |
| CLASS C | | 2018 | | | 20171 | |
Net asset value, beginning of period | | | $20.02 | | | | $20.84 | | | | $16.87 | | | | $16.62 | |
Net investment loss | | | (0.07 | )3 | | | (0.08 | ) | | | (0.12 | ) | | | (0.00 | )3,4 |
Net realized and unrealized gains (losses) on investments | | | 0.73 | | | | (0.74 | ) | | | 4.12 | | | | 0.25 | |
| | | | | | | | | | | | | | | | |
Total from investment operations | | | 0.66 | | | | (0.82 | ) | | | 4.00 | | | | 0.25 | |
Distributions to shareholders from | | | | | | | | | | | | | | | | |
Net investment income | | | 0.00 | | | | 0.00 | | | | (0.03 | ) | | | 0.00 | |
Net asset value, end of period | | | $20.68 | | | | $20.02 | | | | $20.84 | | | | $16.87 | |
Total return5 | | | 3.30 | % | | | (3.93 | )% | | | 23.70 | % | | | 1.50 | % |
Ratios to average net assets (annualized) | | | | | | | | | | | | | | | | |
Gross expenses | | | 2.43 | % | | | 2.41 | % | | | 2.24 | % | | | 2.21 | % |
Net expenses | | | 2.10 | % | | | 2.10 | % | | | 2.10 | % | | | 2.10 | % |
Net investment loss | | | (0.65 | )% | | | (0.98 | )% | | | (1.10 | )% | | | (0.27 | )% |
Supplemental data | | | | | | | | | | | | | | | | |
Portfolio turnover rate | | | 25 | % | | | 53 | % | | | 25 | % | | | 61 | % |
Net assets, end of period (000s omitted) | | | $534 | | | | $449 | | | | $164 | | | | $102 | |
| 1 | For the nine months ended March 31, 2017. The Fund changed its fiscal year end from June 30 to March 31, effective March 31, 2017. |
| 2 | For the period May 20, 2016 (commencement of class operations) to June 30, 2016 |
| 3 | Calculated based upon average shares outstanding |
| 4 | Amount is more than $(0.005). |
| 5 | Total return calculations do not include any sales charges. Returns for periods of less than one year are not annualized. |
The accompanying notes are an integral part of these financial statements.
| | | | |
| 18 | | Wells Fargo Small Cap Core Fund | | Financial highlights |
(For a share outstanding throughout each period)
| | | | | | | | | | | | | | | | |
| | | Six months ended
September 30, 2018 (unaudited) | | | Year ended March 31 | | | Year ended June 30, 20162 | |
| CLASS R6 | | 2018 | | | 20171 | |
Net asset value, beginning of period | | | $20.46 | | | | $21.03 | | | | $16.90 | | | | $16.62 | |
Net investment income (loss) | | | 0.06 | | | | (0.01 | ) | | | 0.01 | | | | 0.02 | 3 |
Net realized and unrealized gains (losses) on investments | | | 0.74 | | | | (0.56 | ) | | | 4.17 | | | | 0.26 | |
| | | | | | | | | | | | | | | | |
Total from investment operations | | | 0.80 | | | | (0.57 | ) | | | 4.18 | | | | 0.28 | |
Distributions to shareholders from | | | | | | | | | | | | | | | | |
Net investment income | | | 0.00 | | | | 0.00 | | | | (0.05 | ) | | | 0.00 | |
Net asset value, end of period | | | $21.26 | | | | $20.46 | | | | $21.03 | | | | $16.90 | |
Total return4 | | | 3.96 | % | | | (2.71 | )% | | | 24.73 | % | | | 1.68 | % |
Ratios to average net assets (annualized) | | | | | | | | | | | | | | | | |
Gross expenses | | | 1.25 | % | | | 2.15 | % | | | 1.06 | % | | | 1.03 | % |
Net expenses | | | 0.90 | % | | | 0.90 | % | | | 0.90 | % | | | 0.90 | % |
Net investment income (loss) | | | 0.53 | % | | | (1.41 | )% | | | 0.09 | % | | | 0.93 | % |
Supplemental data | | | | | | | | | | | | | | | | |
Portfolio turnover rate | | | 25 | % | | | 53 | % | | | 25 | % | | | 61 | % |
Net assets, end of period (000s omitted) | | | $38,487 | | | | $44,924 | | | | $127 | | | | $102 | |
| 1 | For the nine months ended March 31, 2017. The Fund changed its fiscal year end from June 30 to March 31, effective March 31, 2017. |
| 2 | For the period May 20, 2016 (commencement of class operations) to June 30, 2016 |
| 3 | Calculated based upon average shares outstanding |
| 4 | Returns for periods of less than one year are not annualized. |
The accompanying notes are an integral part of these financial statements.
| | | | | | |
| Financial highlights | | Wells Fargo Small Cap Core Fund | | | 19 | |
(For a share outstanding throughout each period)
| | | | | | | | | | | | | | | | |
| | | Six months ended
September 30, 2018 (unaudited) | | | Year ended March 31 | | | Year ended June 30, 20162 | |
| ADMINISTRATOR CLASS | | 2018 | | | 20171 | |
Net asset value, beginning of period | | | $20.33 | | | | $20.98 | | | | $16.89 | | | | $16.62 | |
Net investment income (loss) | | | 0.02 | | | | (0.02 | ) | | | (0.04 | ) | | | 0.01 | 3 |
Net realized and unrealized gains (losses) on investments | | | 0.73 | | | | (0.63 | ) | | | 4.17 | | | | 0.26 | |
| | | | | | | | | | | | | | | | |
Total from investment operations | | | 0.75 | | | | (0.65 | ) | | | 4.13 | | | | 0.27 | |
Distributions to shareholders from | | | | | | | | | | | | | | | | |
Net investment income | | | 0.00 | | | | 0.00 | | | | (0.04 | ) | | | 0.00 | |
Net asset value, end of period | | | $21.08 | | | | $20.33 | | | | $20.98 | | | | $16.89 | |
Total return4 | | | 3.74 | % | | | (3.10 | )% | | | 24.47 | % | | | 1.62 | % |
Ratios to average net assets (annualized) | | | | | | | | | | | | | | | | |
Gross expenses | | | 1.60 | % | | | 1.57 | % | | | 1.41 | % | | | 1.37 | % |
Net expenses | | | 1.25 | % | | | 1.25 | % | | | 1.25 | % | | | 1.25 | % |
Net investment income (loss) | | | 0.20 | % | | | (0.13 | )% | | | (0.26 | )% | | | 0.58 | % |
Supplemental data | | | | | | | | | | | | | | | | |
Portfolio turnover rate | | | 25 | % | | | 53 | % | | | 25 | % | | | 61 | % |
Net assets, end of period (000s omitted) | | | $129 | | | | $136 | | | | $129 | | | | $102 | |
| 1 | For the nine months ended March 31, 2017. The Fund changed its fiscal year end from June 30 to March 31, effective March 31, 2017. |
| 2 | For the period May 20, 2016 (commencement of class operations) to June 30, 2016 |
| 3 | Calculated based upon average shares outstanding |
| 4 | Returns for periods of less than one year are not annualized. |
The accompanying notes are an integral part of these financial statements.
| | | | |
| 20 | | Wells Fargo Small Cap Core Fund | | Financial highlights |
(For a share outstanding throughout each period)
| | | | | | | | | | | | | | | | | | | | | | | | | | | | |
| | | Six months ended
September 30, 2018 (unaudited) | | | Year ended March 31 | | | Year ended June 30 | |
| INSTITUTIONAL CLASS | | 2018 | | | 20171 | | | 20162 | | | 20152 | | | 20142 | | | 20132 | |
Net asset value, beginning of period | | | $20.43 | | | | $21.02 | | | | $16.90 | | | | $18.71 | | | | $16.76 | | | | $13.57 | | | | $10.64 | |
Net investment income (loss) | | | 0.05 | | | | 0.06 | 3 | | | (0.01 | )3 | | | 0.04 | 3 | | | 0.06 | 3 | | | 0.05 | 3 | | | 0.16 | 3 |
Net realized and unrealized gains (losses) on investments | | | 0.74 | | | | (0.65 | ) | | | 4.18 | | | | (1.83 | ) | | | 1.92 | | | | 3.36 | | | | 2.77 | |
| | | | | | | | | | | | | | | | | | | | | | | | | | | | |
Total from investment operations | | | 0.79 | | | | (0.59 | ) | | | 4.17 | | | | (1.79 | ) | | | 1.98 | | | | 3.41 | | | | 2.93 | |
Distributions to shareholders from | | | | | | | | | | | | | | | | | | | | | | | | | | | | |
Net investment income | | | 0.00 | | | | 0.00 | | | | (0.05 | ) | | | (0.02 | ) | | | (0.03 | ) | | | (0.22 | ) | | | 0.00 | |
Net asset value, end of period | | | $21.22 | | | | $20.43 | | | | $21.02 | | | | $16.90 | | | | $18.71 | | | | $16.76 | | | | $13.57 | |
Total return4 | | | 3.87 | % | | | (2.81 | )% | | | 24.67 | % | | | (9.57 | )% | | | 11.80 | % | | | 25.21 | % | | | 27.54 | % |
Ratios to average net assets (annualized) | | | | | | | | | | | | | | | | | | | | | | | | | | | | |
Gross expenses | | | 1.35 | % | | | 1.24 | % | | | 1.16 | % | | | 1.11 | % | | | 1.10 | % | | | 1.10 | % | | | 1.10 | % |
Net expenses | | | 1.00 | % | | | 1.00 | % | | | 1.00 | % | | | 1.09 | % | | | 1.10 | % | | | 1.10 | % | | | 1.10 | % |
Net investment income (loss) | | | 0.44 | % | | | 0.26 | % | | | (0.05 | )% | | | 0.25 | % | | | 0.37 | % | | | 0.30 | % | | | 1.32 | % |
Supplemental data | | | | | | | | | | | | | | | | | | | | | | | | | | | | |
Portfolio turnover rate | | | 25 | % | | | 53 | % | | | 25 | % | | | 61 | % | | | 57 | % | | | 68 | % | | | 52 | % |
Net assets, end of period (000s omitted) | | | $18,441 | | | | $21,208 | | | | $84,067 | | | | $111,902 | | | | $84,417 | | | | $22,170 | | | | $20,093 | |
| 1 | For the nine months ended March 31, 2017. The Fund changed its fiscal year end from June 30 to March 31, effective March 31, 2017. |
| 2 | After the close of business on May 20, 2016, the Fund acquired the net assets of Golden Small Cap Core Fund, which became the accounting and performance survivor in the transaction. The information for the periods prior to May 20, 2016 is that of Golden Small Cap Core Fund. |
| 3 | Calculated based upon average shares outstanding |
| 4 | Returns for periods of less than one year are not annualized. |
The accompanying notes are an integral part of these financial statements.
| | | | | | |
| Notes to financial statements (unaudited) | | Wells Fargo Small Cap Core Fund | | | 21 | |
1. ORGANIZATION
Wells Fargo Funds Trust (the “Trust”), a Delaware statutory trust organized on March 10, 1999, is an open-end management investment company registered under the Investment Company Act of 1940, as amended (the “1940 Act”). As an investment company, the Trust follows the accounting and reporting guidance in Financial Accounting Standards Board (“FASB”) Accounting Standards Codification Topic 946, Financial Services – Investment Companies. These financial statements report on the Wells Fargo Small Cap Core Fund (the “Fund”) which is a diversified series of the Trust.
2. SIGNIFICANT ACCOUNTING POLICIES
The following significant accounting policies, which are consistently followed in the preparation of the financial statements of the Fund, are in conformity with U.S. generally accepted accounting principles which require management to make estimates and assumptions that affect the reported amounts of assets and liabilities, disclosure of contingent assets and liabilities at the date of the financial statements, and the reported amounts of revenues and expenses during the reporting period. Actual results could differ from those estimates.
Securities valuation
All investments are valued each business day as of the close of regular trading on the New York Stock Exchange (generally 4 p.m. Eastern Time), although the Fund may deviate from this calculation time under unusual or unexpected circumstances.
Equity securities that are listed on a foreign or domestic exchange or market are valued at the official closing price or, if none, the last sales price. If no sale occurs on the principal exchange or market that day, a fair value price will be determined in accordance with the Fund’s Valuation Procedures.
Investments in registered open-end investment companies are valued at net asset value. Interests in non-registered investment companies that are redeemable at net asset value are fair valued normally at net asset value.
Investments which are not valued using any of the methods discussed above are valued at their fair value, as determined in good faith by the Board of Trustees of the Fund. The Board of Trustees has established a Valuation Committee comprised of the Trustees and has delegated to it the authority to take any actions regarding the valuation of portfolio securities that the Valuation Committee deems necessary or appropriate, including determining the fair value of portfolio securities, unless the determination has been delegated to the Wells Fargo Asset Management Pricing Committee of Wells Fargo Funds Management, LLC (“Funds Management”). The Board of Trustees retains the authority to make or ratify any valuation decisions or approve any changes to the Valuation Procedures as it deems appropriate. On a quarterly basis, the Board of Trustees receives reports on any valuation actions taken by the Valuation Committee or the Wells Fargo Asset Management Pricing Committee which may include items for ratification.
Securities lending
The Fund may lend its securities from time to time in order to earn additional income in the form of fees or interest on securities received as collateral or the investment of any cash received as collateral. The Fund continues to receive interest or dividends on the securities loaned. The Fund receives collateral in the form of cash or securities with a value at least equal to the value of the securities on loan. The value of the loaned securities is determined at the close of each business day and any additional required collateral is delivered to the Fund on the next business day. In a securities lending transaction, the net asset value of the Fund will be affected by an increase or decrease in the value of the securities loaned and by an increase or decrease in the value of the instrument in which collateral is invested. The amount of securities lending activity undertaken by the Fund fluctuates from time to time. In the event of default or bankruptcy by the borrower, the Fund may be prevented from recovering the loaned securities or gaining access to the collateral or may experience delays or costs in doing so. In addition, the investment of any cash collateral received may lose all or part of its value. The Fund has the right under the lending agreement to recover the securities from the borrower on demand.
The Fund lends its securities through an unaffiliated securities lending agent. Cash collateral received in connection with its securities lending transactions is invested in Securities Lending Cash Investments, LLC (the “Securities Lending Fund”). The Securities Lending Fund is exempt from registration under Section 3(c)(7) of the 1940 Act and is managed by Funds Management and is subadvised by Wells Capital Management Incorporated (“WellsCap”), an affiliate of Funds Management and an indirect wholly owned subsidiary of Wells Fargo & Company (“Wells Fargo”). Funds Management receives an advisory fee starting at 0.05% and declining to 0.01% as the average daily net assets of the Securities Lending Fund increase. All of the fees received by Funds Management are paid to WellsCap for its services as subadviser. The Securities Lending Fund seeks to provide a positive return compared to the daily Fed Funds Open Rate by investing in
| | | | |
| 22 | | Wells Fargo Small Cap Core Fund | | Notes to financial statements (unaudited) |
high-quality, U.S. dollar-denominated short-term money market instruments. Securities Lending Fund investments are valued at the evaluated bid price provided by an independent pricing service. Income earned from investment in the Securities Lending Fund, if any, is included in income from affiliated securities on the Statement of Operations.
Security transactions and income recognition
Securities transactions are recorded on a trade date basis. Realized gains or losses are recorded on the basis of identified cost.
Dividend income is recognized on the ex-dividend date.
Distributions to shareholders
Distributions to shareholders from net investment income and any net realized gains are recorded on the ex-dividend date and paid at least annually. Such distributions are determined in accordance with income tax regulations and may differ from U.S. generally accepted accounting principles. Dividend sources are estimated at the time of declaration. The tax character of distributions is determined as of the Fund’s fiscal year end. Therefore, a portion of the Fund’s distributions made prior to the Fund’s fiscal year end may be categorized as a tax return of capital at year end.
Federal and other taxes
The Fund intends to continue to qualify as a regulated investment company by distributing substantially all of its investment company taxable income and any net realized capital gains (after reduction for capital loss carryforwards) sufficient to relieve it from all, or substantially all, federal income taxes. Accordingly, no provision for federal income taxes was required.
The Fund’s income and federal excise tax returns and all financial records supporting those returns for the prior three fiscal years are subject to examination by the federal and Delaware revenue authorities. Management has analyzed the Fund’s tax positions taken on federal, state, and foreign tax returns for all open tax years and does not believe that there are any uncertain tax positions that require recognition of a tax liability.
As of September 30, 2018, the aggregate cost of all investments for federal income tax purposes was $51,591,647 and the unrealized gains (losses) consisted of:
| | | | |
Gross unrealized gains | | $ | 12,258,107 | |
Gross unrealized losses | | | (4,240,885 | ) |
Net unrealized gains | | $ | 8,017,222 | |
Class allocations
The separate classes of shares offered by the Fund differ principally in applicable sales charges, distribution, shareholder servicing, and administration fees. Class specific expenses are charged directly to that share class. Investment income, common expenses, and realized and unrealized gains (losses) on investments are allocated daily to each class of shares based on the relative proportion of net assets of each class.
3. FAIR VALUATION MEASUREMENTS
Fair value measurements of investments are determined within a framework that has established a fair value hierarchy based upon the various data inputs utilized in determining the value of the Fund’s investments. The three-level hierarchy gives the highest priority to unadjusted quoted prices in active markets for identical assets or liabilities (Level 1) and the lowest priority to unobservable inputs (Level 3). The Fund’s investments are classified within the fair value hierarchy based on the lowest level of input that is significant to the fair value measurement. The inputs are summarized into three broad levels as follows:
| ∎ | | Level 1 – quoted prices in active markets for identical securities |
| ∎ | | Level 2 – other significant observable inputs (including quoted prices for similar securities, interest rates, prepayment speeds, credit risk, etc.) |
| ∎ | | Level 3 – significant unobservable inputs (including the Fund’s own assumptions in determining the fair value of investments) |
The inputs or methodologies used for valuing investments in securities are not necessarily an indication of the risk associated with investing in those securities.
| | | | | | |
| Notes to financial statements (unaudited) | | Wells Fargo Small Cap Core Fund | | | 23 | |
The following is a summary of the inputs used in valuing the Fund’s assets and liabilities as of September 30, 2018:
| | | | | | | | | | | | | | | | |
| | | Quoted prices
(Level 1) | | | Other significant
observable inputs
(Level 2) | | | Significant
unobservable inputs (Level 3) | | | Total | |
Assets | | | | | | | | | | | | | | | | |
Investments in: | | | | | | | | | | | | | | | | |
| | | | |
Common stocks | | | | | | | | | | | | | | | | |
Consumer discretionary | | $ | 7,781,847 | | | $ | 0 | | | $ | 0 | | | $ | 7,781,847 | |
Energy | | | 3,899,985 | | | | 0 | | | | 0 | | | | 3,899,985 | |
Financials | | | 8,789,727 | | | | 0 | | | | 0 | | | | 8,789,727 | |
Health care | | | 9,969,326 | | | | 0 | | | | 0 | | | | 9,969,326 | |
Industrials | | | 11,529,396 | | | | 0 | | | | 0 | | | | 11,529,396 | |
Information technology | | | 9,074,334 | | | | 0 | | | | 0 | | | | 9,074,334 | |
Materials | | | 4,075,016 | | | | 0 | | | | 0 | | | | 4,075,016 | |
Real estate | | | 1,748,730 | | | | 0 | | | | 0 | | | | 1,748,730 | |
Utilities | | | 1,516,644 | | | | 0 | | | | 0 | | | | 1,516,644 | |
| | | | |
Short-term investments | | | | | | | | | | | | | | | | |
Investment companies | | | 425,352 | | | | 798,512 | | | | 0 | | | | 1,223,864 | |
Total assets | | $ | 58,810,357 | | | $ | 798,512 | | | $ | 0 | | | $ | 59,608,869 | |
Additional sector, industry or geographic detail is included in the Portfolio of Investments.
At September 30, 2018, the Fund did not have any transfers into/out of Level 3.
4. TRANSACTIONS WITH AFFILIATES
Management fee
Funds Management, an indirect wholly owned subsidiary of Wells Fargo, is the manager of the Fund and provides advisory and fund-level administrative services under an investment management agreement. Under the investment management agreement, Funds Management is responsible for, among other services, implementing the investment objectives and strategies of the Fund, supervising the subadviser and providing fund-level administrative services in connection with the Fund’s operations. As compensation for its services under the investment management agreement, Funds Management is entitled to receive an annual management fee starting at 0.85% and declining to 0.71% as the average daily net assets of the Fund increase. For the six months ended September 30, 2018, the management fee was equivalent to an annual rate of 0.85% of the Fund’s average daily net assets.
Funds Management has retained the services of a subadviser to provide daily portfolio management to the Fund. The fee for subadvisory services is borne by Funds Management. WellsCap is the subadviser to the Fund and is entitled to receive a fee from Funds Management at an annual rate starting at 0.55% and declining to 0.45% as the average daily net assets of the Fund increase.
Administration fees
Under a class-level administration agreement, Funds Management provides class-level administrative services to the Fund, which includes paying fees and expenses for services provided by the transfer agent, sub-transfer agents, omnibus account servicers and record-keepers. As compensation for its services under the class-level administration agreement, Funds Management receives an annual fee which is calculated based on the average daily net assets of each class as follows:
| | | | |
| | | Class-level
administration fee | |
Class A, Class C | | | 0.21 | % |
Class R6 | | | 0.03 | |
Administrator Class, Institutional Class | | | 0.13 | |
Funds Management has contractually waived and/or reimbursed management and administration fees to the extent necessary to maintain certain net operating expense ratios for the Fund. When each class of the Fund has exceeded its
| | | | |
| 24 | | Wells Fargo Small Cap Core Fund | | Notes to financial statements (unaudited) |
expense cap, Funds Management has waived fees and/or reimbursed expenses from fund level expenses on a proportionate basis and then from class specific expenses; otherwise, waivers and/or reimbursements are applied against class specific expenses before fund level expenses. Funds Management has committed through July 31, 2019 to waive fees and/or reimburse expenses to the extent necessary to cap the Fund’s expenses at 1.35% for Class A shares, 2.10% for Class C shares, 0.90% for Class R6, 1.25% for Administrator Class shares and 1.00% for Institutional Class shares. After this time, the cap may be increased or the commitment to maintain the cap may be terminated only with the approval of the Board of Trustees.
Distribution fee
The Trust has adopted a distribution plan for Class C shares of the Fund pursuant to Rule 12b-1 under the 1940 Act. A distribution fee is charged to Class C shares and paid to Wells Fargo Funds Distributor, LLC, the principal underwriter, at an annual rate of 0.75% of the average daily net assets of Class C shares.
In addition, Funds Distributor is entitled to receive the front-end sales charge from the purchase of Class A shares and a contingent deferred sales charge on the redemption of certain Class A shares. Funds Distributor is also entitled to receive the contingent deferred sales charges from redemptions of Class C shares. For the six months ended September 30, 2018, Funds Distributor received $493 from the sale of Class A shares. No contingent deferred sales charges were incurred by Class A and Class C shares for the six months ended September 30, 2018.
Shareholder servicing fees
The Trust has entered into contracts with one or more shareholder servicing agents, whereby Class A, Class C, and Administrator Class of the Fund are charged a fee at an annual rate of 0.25% of the average daily net assets of each respective class.
A portion of these total shareholder servicing fees were paid to affiliates of Wells Fargo.
Interfund transactions
The Fund may purchase or sell portfolio investment securities to certain other Wells Fargo affiliates pursuant to Rule 17a-7 under the 1940 Act and under procedures adopted by the Board of Trustees. The procedures have been designed to ensure that these interfund transactions, which do not incur broker commissions, are effected at current market prices.
5. INVESTMENT PORTFOLIO TRANSACTIONS
Purchases and sales of investments, excluding U.S. government obligations (if any) and short-term securities, for the six months ended September 30, 2018 were $16,058,437 and $27,565,417, respectively.
6. BANK BORROWINGS
The Trust (excluding the money market funds), Wells Fargo Master Trust and Wells Fargo Variable Trust are parties to a $280,000,000 revolving credit agreement whereby the Fund is permitted to use bank borrowings for temporary or emergency purposes, such as to fund shareholder redemption requests. Interest under the credit agreement is charged to the Fund based on a borrowing rate equal to the higher of the Federal Funds rate in effect on that day plus 1.25% or the overnight LIBOR rate in effect on that day plus 1.25%. In addition, an annual commitment fee equal to 0.25% of the unused balance is allocated to each participating fund.
For the six months ended September 30, 2018, there were no borrowings by the Fund under the agreement.
7. INDEMNIFICATION
Under the Trust’s organizational documents, the officers and Trustees have been granted certain indemnification rights against certain liabilities that may arise out of performance of their duties to the Trust. Additionally, in the normal course of business, the Trust may enter into contracts with service providers that contain a variety of indemnification clauses. The Trust’s maximum exposure under these arrangements is dependent on future claims that may be made against the Fund and, therefore, cannot be estimated.
8. NEW ACCOUNTING PRONOUNCEMENT
In August 2018, FASB issued Accounting Standards Update (“ASU”) No. 2018-13, Fair Value Measurement (Topic 820) Disclosure Framework—Changes to the Disclosure Requirements for Fair Value Measurement. ASU 2018-13 updates the disclosure requirements for fair value measurements by modifying or removing certain disclosures and adding certain new disclosures. The amendments are effective for fiscal years, and interim periods within those fiscal years, beginning after December 15, 2019. Early adoption is permitted. Management is currently evaluating the potential impact of this new guidance to the financial statements.
| | | | | | |
| Notes to financial statements (unaudited) | | Wells Fargo Small Cap Core Fund | | | 25 | |
9. SUBSEQUENT DISTRIBUTION
On November 5, 2018, the Fund declared distributions from long-term capital gains to shareholders of record on November 2, 2018. The per share amounts payable on November 6, 2018 were as follows:
| | | | |
| | | Long-term
capital gains | |
Class A | | | $8.84489 | |
Class C | | | 8.84489 | |
Class R6 | | | 8.84489 | |
Institutional Class | | | 8.84489 | |
Administrator Class | | | 8.84489 | |
These distributions are not reflected in the accompanying financial statements.
10. SUBSEQUENT EVENT
At a meeting held on October 25, 2018, the Board of Trustees approved the closure and liquidation of the Fund. The Fund was closed to new investors and additional investments from existing shareholders effective at the close of business on October 26, 2018.
The liquidation of the Fund is expected to occur after close of business on or about December 14, 2018. Shareholders of the Fund on the date of liquidation will receive a distribution of their account proceeds in complete redemption of their shares.
| | | | |
| 26 | | Wells Fargo Small Cap Core Fund | | Other information (unaudited) |
PROXY VOTING INFORMATION
A description of the policies and procedures that the Fund uses to determine how to vote proxies relating to portfolio securities is available, upon request, by calling 1-800-222-8222, visiting our website at wellsfargofunds.com, or visiting the SEC website at sec.gov. Information regarding how the Fund voted proxies relating to portfolio securities during the most recent 12-month period ended June 30 is available on the Fund’s website at wellsfargofunds.com or by visiting the SEC website at sec.gov.
PORTFOLIO HOLDINGS INFORMATION
The complete portfolio holdings for the Fund are publicly available monthly on the Fund’s website (wellsfargofunds.com), on a one-month delayed basis. In addition, top ten holdings information (excluding derivative positions) for the Fund is publicly available on the Fund’s website on a monthly, seven-day or more delayed basis. The Fund files its complete schedule of portfolio holdings with the SEC for the first and third quarters of each fiscal year on Form N-Q, which is available by visiting the SEC website at sec.gov. In addition, the Fund’s Form N-Q may be reviewed and copied at the SEC’s Public Reference Room in Washington, DC, and at regional offices in New York City, at 233 Broadway, and in Chicago, at 175 West Jackson Boulevard, Suite 900. Information about the Public Reference Room may be obtained by calling 1-800-SEC-0330.
| | | | | | |
| Other information (unaudited) | | Wells Fargo Small Cap Core Fund | | | 27 | |
BOARD OF TRUSTEES AND OFFICERS
Each of the Trustees and Officers1 listed in the table below acts in identical capacities for each fund in the Wells Fargo family of funds, which consists of 153 mutual funds comprising the Wells Fargo Funds Trust, Wells Fargo Variable Trust, Wells Fargo Master Trust and four closed-end funds (collectively the “Fund Complex”). This table should be read in conjunction with the Prospectus and the Statement of Additional Information2. The mailing address of each Trustee and Officer is 525 Market Street, 12th Floor, San Francisco, CA 94105. Each Trustee and Officer serves an indefinite term, however, each Trustee serves such term until reaching the mandatory retirement age established by the Trustees.
Independent Trustees
| | | | | | |
Name and year of birth | | Position held and length of service* | | Principal occupations during past five years or longer | | Current other public company or
investment company
directorships |
William R. Ebsworth (Born 1957) | | Trustee, since 2015 | | Retired. From 1984 to 2013, equities analyst, portfolio manager, research director and chief investment officer at Fidelity Management and Research Company in Boston, Tokyo, and Hong Kong, and retired in 2013 as Chief Investment Officer of Fidelity Strategic Advisers, Inc. where he led a team of investment professionals managing client assets. Prior thereto, Board member of Hong Kong Securities Clearing Co., Hong Kong Options Clearing Corp., the Thailand International Fund, Ltd., Fidelity Investments Life Insurance Company, and Empire Fidelity Investments Life Insurance Company. Board member of the Vincent Memorial Hospital Endowment (non-profit organization), where he serves on the Investment Committee and as a Chair of the Audit Committee. Mr. Ebsworth is a CFA® charterholder. | | N/A |
Jane A. Freeman (Born 1953) | | Trustee, since 2015; Chair Liaison, since 2018 | | Retired. From 2012 to 2014 and 1999 to 2008, Chief Financial Officer of Scientific Learning Corporation. From 2008 to 2012, Ms. Freeman provided consulting services related to strategic business projects. Prior to 1999, Portfolio Manager at Rockefeller & Co. and Scudder, Stevens & Clark. Board member of the Harding Loevner Funds from 1996 to 2014, serving as both Lead Independent Director and chair of the Audit Committee. Board member of the Russell Exchange Traded Funds Trust from 2011 to 2012 and the chair of the Audit Committee. Ms. Freeman is a Board Member of The Ruth Bancroft Garden (non-profit organization). She is also an inactive Chartered Financial Analyst. | | N/A |
Isaiah Harris, Jr. (Born 1952) | | Trustee, since 2009 | | Retired. Chairman of the Board of CIGNA Corporation since 2009, and Director since 2005. From 2003 to 2011, Director of Deluxe Corporation. Prior thereto, President and CEO of BellSouth Advertising and Publishing Corp. from 2005 to 2007, President and CEO of BellSouth Enterprises from 2004 to 2005 and President of BellSouth Consumer Services from 2000 to 2003. Emeritus member of the Iowa State University Foundation Board of Governors. Emeritus Member of the Advisory Board of Iowa State University School of Business. Advisory Board Member, Palm Harbor Academy (private school). Advisory Board Member, Child Evangelism Fellowship (non-profit). Mr. Harris is a certified public accountant (inactive status). | | CIGNA Corporation |
Judith M. Johnson (Born 1949) | | Trustee, since 2008; Audit Committee Chairman, since 2009 | | Retired. Prior thereto, Chief Executive Officer and Chief Investment Officer of Minneapolis Employees Retirement Fund from 1996 to 2008. Ms. Johnson is an attorney, certified public accountant and a certified managerial accountant. | | N/A |
David F. Larcker (Born 1950) | | Trustee, since 2009 | | James Irvin Miller Professor of Accounting at the Graduate School of Business, Stanford University, Director of the Corporate Governance Research Initiative and Senior Faculty of The Rock Center for Corporate Governance since 2006. From 2005 to 2008, Professor of Accounting at the Graduate School of Business, Stanford University. Prior thereto, Ernst & Young Professor of Accounting at The Wharton School, University of Pennsylvania from 1985 to 2005. | | N/A |
| | | | |
| 28 | | Wells Fargo Small Cap Core Fund | | Other information (unaudited) |
| | | | | | |
Name and year of birth | | Position held and length of service* | | Principal occupations during past five years or longer | | Current other public company or
investment company
directorships |
Olivia S. Mitchell (Born 1953) | | Trustee, since 2006; Governance Committee Chairman, since 2018 | | International Foundation of Employee Benefit Plans Professor, Wharton School of the University of Pennsylvania since 1993. Director of Wharton’s Pension Research Council and Boettner Center on Pensions & Retirement Research, and Research Associate at the National Bureau of Economic Research. Previously, Cornell University Professor from 1978 to 1993. | | N/A |
Timothy J. Penny (Born 1951) | | Trustee, since 1996; Chairman, since 2018; Vice Chairman, from 2017 to 2018 | | President and Chief Executive Officer of Southern Minnesota Initiative Foundation, a non-profit organization, since 2007. Member of the Board of Trustees of NorthStar Education Finance, Inc., a non-profit organization, since 2007. | | N/A |
James G. Polisson (Born 1959) | | Trustee, since 2018; Advisory Board Member, from 2017 to 2018 | | Retired. Chief Marketing Officer, Source (ETF) UK Services, Ltd, from 2015 to 2017. From 2012 to 2015, Principal of The Polisson Group, LLC, a management consulting, corporate advisory and principal investing company. Chief Executive Officer and Managing Director at Russell Investments, Global Exchange Traded Funds from 2010 to 2012. Managing Director of Barclays Global Investors from 1998 to 2010 and Global Chief Marketing Officer for iShares and Barclays Global Investors from 2000 to 2010. Trustee of the San Francisco Mechanics’ Institute, a non-profit organization, from 2013 to 2015. Board member of the Russell Exchange Traded Fund Trust from 2011 to 2012. Director of Barclays Global Investors Holdings Deutschland GmbH from 2006 to 2009. Mr. Polisson is an attorney and has a retired status with the Massachusetts and District of Columbia Bar Associations. | | N/A |
Michael S. Scofield (Born 1943) | | Trustee, since 2010 | | Served on the Investment Company Institute’s Board of Governors and Executive Committee from 2008-2011 as well the Governing Council of the Independent Directors Council from 2006-2011 and the Independent Directors Council Executive Committee from 2008-2011. Trustee of the Evergreen Fund complex (and its predecessors) from 1984 to 2010. Chairman of the Evergreen Funds from 2000-2010. Former Trustee of the Mentor Funds. Retired Attorney, Law Offices of Michael S. Scofield. | | N/A |
Pamela Wheelock (Born 1959) | | Trustee, since 2018; Advisory Board Member, from 2017 to 2018 | | Chief Operating Officer, Twin Cities Habitat for Humanity, since January, 2017. Vice President of University Services, University of Minnesota from 2012 to 2017. Prior thereto, on the Board of Directors, Governance Committee and Finance Committee for the Minnesota Philanthropy Partners (Saint Paul Foundation) from 2012 to 2018, Interim President and Chief Executive Officer of Blue Cross Blue Shield of Minnesota from 2010 to 2011, Chairman of the Board from 2009 to 2011 and Board Director from 2003 to 2015. Vice President, Leadership and Community Engagement, Bush Foundation, Saint Paul, Minnesota (a private foundation) from 2009 to 2011. Executive Vice President and Chief Financial Officer, Minnesota Sports and Entertainment from 2004 to 2009 and Senior Vice President from 2002 to 2004. Commissioner of Finance, State of Minnesota, from 1999 to 2002. Currently the Board Chair of the Minnesota Wild Foundation since 2010. | | N/A |
| * | Length of service dates reflect the Trustee’s commencement of service with the Trust’s predecessor entities, where applicable. |
| | | | | | |
| Other information (unaudited) | | Wells Fargo Small Cap Core Fund | | | 29 | |
Officers
| | | | | | |
Name and year of birth | | Position held and
length of service | | Principal occupations during past five years or longer | | |
Andrew Owen (Born 1960) | | President, since 2017 | | Executive Vice President of Wells Fargo & Company and Head of Affiliated Managers, Wells Fargo Asset Management, since 2014. In addition, Mr. Owen is currently President, Chief Executive Officer and Director of Wells Fargo Funds Management, LLC since 2017. Prior thereto, Executive Vice President responsible for marketing, investments and product development for Wells Fargo Funds Management, LLC, from 2009 to 2014. | | |
Nancy Wiser1 (Born 1967) | | Treasurer, since 2012 | | Executive Vice President of Wells Fargo Funds Management, LLC since 2011. Chief Operating Officer and Chief Compliance Officer at LightBox Capital Management LLC, from 2008 to 2011. | | |
Alexander Kymn3 (Born 1973) | | Secretary, since 2018; Chief Legal Officer, since 2018 | | Senior Company Counsel of Wells Fargo Bank, N.A. since 2018 (previously Senior Counsel from 2007 to 2018). Vice President of Wells Fargo Funds Management, LLC from 2008 to 2014. | | |
Michael H. Whitaker (Born 1967) | | Chief Compliance Officer, since 2016 | | Senior Vice President and Chief Compliance Officer since 2016. Senior Vice President and Chief Compliance Officer for Fidelity Investments from 2007 to 2016. | | |
David Berardi (Born 1975) | | Assistant Treasurer, since 2009 | | Vice President of Wells Fargo Funds Management, LLC since 2009. Vice President of Evergreen Investment Management Company, LLC from 2008 to 2010. Manager of Fund Reporting and Control for Evergreen Investment Management Company, LLC from 2004 to 2010. | | |
Jeremy DePalma1 (Born 1974) | | Assistant Treasurer, since 2009 | | Senior Vice President of Wells Fargo Funds Management, LLC since 2009. Senior Vice President of Evergreen Investment Management Company, LLC from 2008 to 2010 and head of the Fund Reporting and Control Team within Fund Administration from 2005 to 2010. | | |
| 1 | Nancy Wiser acts as Treasurer of 76 funds in the Fund Complex. Jeremy DePalma acts as Treasurer of 77 funds and Assistant Treasurer of 76 funds in the Fund Complex. |
| 2 | The Statement of Additional Information includes additional information about the Trustees and is available, without charge, upon request, by calling 1-800-222-8222 or by visiting the website at wellsfargofunds.com. |
| 3 | Alexander Kymn became the Secretary and Chief Legal Officer effective April 17, 2018. |
| | | | |
| 30 | | Wells Fargo Small Cap Core Fund | | Other information (unaudited) |
BOARD CONSIDERATION OF INVESTMENT MANAGEMENT AND SUB-ADVISORY AGREEMENTS:
Wells Fargo Small Cap Core Fund
Under the Investment Company Act of 1940 (the “1940 Act”), the Board of Trustees (the “Board”) of Wells Fargo Funds Trust (the “Trust”) must determine annually whether to approve the continuation of the Trust’s investment management and sub-advisory agreements. In this regard, at an in-person meeting held on May 22-23, 2018 (the “Meeting”), the Board, all the members of which have no direct or indirect interest in the investment management and sub-advisory agreements and are not “interested persons” of the Trust, as defined in the 1940 Act (the “Independent Trustees”), reviewed and approved for Wells Fargo Small Cap Core Fund (the “Fund”): (i) an investment management agreement (the “Management Agreement”) with Wells Fargo Funds Management, LLC (“Funds Management”); and (ii) an investment sub-advisory agreement (the “Sub-Advisory Agreement”) with Wells Capital Management Incorporated (the “Sub-Adviser”), an affiliate of Funds Management. The Management Agreement and the Sub-Advisory Agreement are collectively referred to as the “Advisory Agreements.”
At the Meeting, the Board considered the factors and reached the conclusions described below relating to the selection of Funds Management and the Sub-Adviser and the approval of the Advisory Agreements. Prior to the Meeting, including at an in-person meeting in April 2018, the Trustees conferred extensively among themselves and with representatives of Funds Management about these matters. Also, the Board has adopted a team-based approach, with each team consisting of a sub-set of Trustees, to assist the full Board in the discharge of its duties in reviewing investment performance and other matters throughout the year. The Independent Trustees were assisted in their evaluation of the Advisory Agreements by independent legal counsel, from whom they received separate legal advice and with whom they met separately.
In providing information to the Board, Funds Management and the Sub-Adviser were guided by a detailed set of requests for information submitted to them by independent legal counsel on behalf of the Independent Trustees at the start of the Board’s annual contract renewal process earlier in 2018. In considering and approving the Advisory Agreements, the Trustees considered the information they believed relevant, including but not limited to the information discussed below. The Board considered not only the specific information presented in connection with the Meeting, but also the knowledge gained over time through interaction with Funds Management and the Sub-Adviser about various topics. In this regard, the Board reviewed reports of Funds Management at each of its quarterly meetings, which included, among other things, portfolio reviews and investment performance reports. In addition, the Board and the teams mentioned above confer with portfolio managers at various times throughout the year. The Board did not identify any particular information or consideration that was all-important or controlling, and each individual Trustee may have attributed different weights to various factors.
After its deliberations, the Board unanimously approved the continuation of the Advisory Agreements for a one-year term and determined that the compensation payable to Funds Management and the Sub-Adviser under each of the Advisory Agreements was reasonable. The Board considered the approval of the Advisory Agreements for the Fund as part of its consideration of agreements for funds across the complex, but its approvals were made on a fund-by-fund basis. The following summarizes a number of important, but not necessarily all, factors considered by the Board in support of its approvals.
Nature, extent and quality of services
The Board received and considered various information regarding the nature, extent and quality of services provided to the Fund by Funds Management and the Sub-Adviser under the Advisory Agreements. This information included a description of the investment advisory services and Fund-level administrative services covered by the Management Agreement, as well as, among other things, a summary of the background and experience of senior management of Wells Fargo Asset Management (“WFAM”), of which Funds Management and the Sub-Adviser are a part, a summary of investments made in the business of WFAM, a summary of certain organizational and personnel changes involving Funds Management and the Sub-Adviser, and a description of Funds Management’s and the Sub-Adviser’s business continuity planning programs and of their approaches to data privacy and cybersecurity. The Board also considered the qualifications, background, tenure and responsibilities of each of the portfolio managers primarily responsible for the day-to-day portfolio management of the Fund.
The Board evaluated the ability of Funds Management and the Sub-Adviser to attract and retain qualified investment professionals, including research, advisory and supervisory personnel. The Board further considered the compliance programs and compliance records of Funds Management and the Sub-Adviser. In addition, the Board took into account the full range of services provided to the Fund by Funds Management and its affiliates.
| | | | | | |
| Other information (unaudited) | | Wells Fargo Small Cap Core Fund | | | 31 | |
Fund investment performance and expenses
The Board considered the investment performance results for the Fund over various time periods ended December 31, 2017. The Board considered these results in comparison to the investment performance of funds in a universe that was determined by Broadridge Inc. (“Broadridge”) to be similar to the Fund (the “Universe”), and in comparison to the Fund’s benchmark index and to other comparative data. Broadridge is an independent provider of investment company data. The Board received a description of the methodology used by Broadridge to select the mutual funds in the performance Universe. The Board noted that the investment performance of the Fund (Institutional Class) was higher than the average investment performance of the Universe for the five-year period under review, but lower than the average investment performance of the Universe for the one-, three-, and ten-year periods under review. The Board also noted that the investment performance of the Fund was lower than its benchmark index, the Russell 2000 Index, for all periods under review.
The Board received information concerning, and discussed factors contributing to, the underperformance of the Fund relative to the Universe and benchmark for the periods identified above. The Board took note of the explanations for the relative underperformance during these periods, including with respect to investment decisions and market factors that affected the Fund’s investment performance.
The Board also received and considered information regarding the Fund’s net operating expense ratios and their various components, including actual management fees, custodian and other non-management fees, and Rule 12b-1 and non-Rule 12b-1 shareholder service fees. The Board considered these ratios in comparison to the median ratios of funds in class-specific expense groups that were determined by Broadridge to be similar to the Fund (the “Groups”). The Board received a description of the methodology used by Broadridge to select the mutual funds in the expense Groups and an explanation of how funds comprising expense groups and their expense ratios may vary from year-to-year. Based on the Broadridge reports, the Board noted that the net operating expense ratios of the Fund were lower than or in the range of the median net operating expense ratios of the expense Groups for all share classes.
The Board took into account the Fund’s investment performance and expense information provided to it among the factors considered in deciding to re-approve the Advisory Agreements.
Investment management and sub-advisory fee rates
The Board reviewed and considered the contractual fee rates payable by the Fund to Funds Management under the Management Agreement, as well as the contractual fee rates payable by the Fund to Funds Management for class-level administrative services under a Class-Level Administration Agreement, which include, among other things, class-level transfer agency and sub-transfer agency costs (collectively, the “Management Rates”). The Board also reviewed and considered the contractual investment sub-advisory fee rates that are payable by Funds Management to the Sub-Adviser for investment sub-advisory services.
Among other information reviewed by the Board was a comparison of the Fund’s Management Rates with the average contractual investment management fee rates of funds in the expense Groups at a common asset level as well as transfer agency costs of the funds in the expense Groups. The Board noted that the Management Rates of the Fund were lower than or in the range of the sum of these average rates for the Fund’s expense Groups for all Classes. The Board noted that the net operating expense ratios of the Fund were lower than or in the range of the median net operating expense ratios of the expense Groups for all share classes.
The Board also received and considered information about the portion of the total management fee that was retained by Funds Management after payment of the fee to the Sub-Adviser for sub-advisory services. In assessing the reasonableness of this amount, the Board received and evaluated information about the nature and extent of responsibilities retained and risks assumed by Funds Management and not delegated to or assumed by the Sub-Adviser, and about Funds Management’s on-going oversight services. Given the affiliation between Funds Management and the Sub-Adviser, the Board ascribed limited relevance to the allocation of fees between them.
The Board also received and considered information about the nature and extent of services offered and fee rates charged by Funds Management and the Sub-Adviser to other types of clients with investment strategies similar to those of the Fund. In this regard, the Board received information about the significantly greater scope of services, and compliance, reporting and other legal burdens and risks of managing mutual funds compared with those associated with managing assets of non-mutual fund clients such as institutional separate accounts.
Based on its consideration of the factors and information it deemed relevant, including those described here, the Board determined that the compensation payable to Funds Management under the Management Agreement and to the Sub-Adviser under the Sub-Advisory Agreement was reasonable.
| | | | |
| 32 | | Wells Fargo Small Cap Core Fund | | Other information (unaudited) |
Profitability
The Board received and considered information concerning the profitability of Funds Management, as well as the profitability of both WFAM and Wells Fargo & Co. (“Wells Fargo”) as a whole, from providing services to the Fund and the fund family as a whole. The Board noted that the Sub-Adviser’s profitability information with respect to providing services to the Fund was subsumed in the WFAM and Wells Fargo profitability analysis.
Funds Management reported on the methodologies and estimates used in calculating profitability, including a description of the methodology used to allocate certain expenses and recent enhancements made to the methodology. Among other things, the Board noted that the levels of profitability reported on a fund-by-fund basis varied widely, depending on factors such as the size and type of fund. Based on its review, the Board did not deem the profits reported by Funds Management, WFAM or Wells Fargo from services provided to the Fund to be at a level that would prevent it from approving the continuation of the Advisory Agreements.
Economies of scale
The Board considered the extent to which Funds Management may experience economies of scale in the provision of management services, and the extent to which scale benefits, if any, would be shared with shareholders. In particular, the Board noted the existence of breakpoints in the Fund’s management fee structure, which operate generally to reduce the Fund’s expense ratios as the Fund grows in size. It considered that, for a small fund or a fund that shrinks in size, breakpoints conversely can result in higher fee levels. The Board also considered that in addition to management fee breakpoints, competitive management fee rates set at the outset without regard to breakpoints and fee waiver and expense reimbursement arrangements, as well as investments in the business intended to enhance services available to Fund shareholders, are means of sharing potential economies of scale with shareholders of the Fund.
The Board concluded that the Fund’s fee and expense arrangements, including contractual breakpoints, constituted a reasonable approach to sharing potential economies of scale with the Fund and its shareholders.
Other benefits to Funds Management and the Sub-Adviser
The Board received and considered information regarding potential “fall-out” or ancillary benefits received by Funds Management and its affiliates, including the Sub-Adviser, as a result of their relationships with the Fund. Ancillary benefits could include, among others, benefits directly attributable to other relationships with the Fund and benefits potentially derived from an increase in Funds Management’s and the Sub-Adviser’s business as a result of their relationships with the Fund. The Board noted that various affiliates of Funds Management may receive distribution-related fees, shareholder servicing payments and sub-transfer agency fees in respect of shares sold or held through them and services provided.
The Board also reviewed information about soft dollar credits earned and utilized by the Sub-Adviser, fees earned by Funds Management and the Sub-Adviser from managing a private investment vehicle for the fund family’s securities lending collateral and commissions earned by an affiliated broker from portfolio transactions.
Based on its consideration of the factors and information it deemed relevant, including those described here, the Board did not find that any ancillary benefits received by Funds Management and its affiliates, including the Sub-Adviser, were unreasonable.
Conclusion
At the Meeting, after considering the above-described factors and based on its deliberations and its evaluation of the information described above, the Board unanimously approved the continuation of the Advisory Agreements for a one-year term and determined that the compensation payable to Funds Management and the Sub-Adviser under each of the Advisory Agreements was reasonable.
| | | | | | |
| Appendix A (unaudited) | | Wells Fargo Small Cap Core Fund | | | 33 | |
SALES CHARGE REDUCTIONS AND WAIVERS FOR CERTAIN INTERMEDIARIES
Ameriprise
Effective June 1, 2018, shareholders purchasing Fund shares through an Ameriprise Financial platform or account will be eligible only for the following Class A load waivers (front-end sales charge waivers), which may differ from those disclosed elsewhere in the Fund’s prospectus or Statement of Additional Information.
Front-end Sales Load Waivers on Class A Shares Available at Ameriprise Financial
| | • | | Employer-sponsored retirement plans (e.g., 401(k) plans, 457 plans, employer-sponsored 403(b) plans, profit sharing and money purchase pension plans and defined benefit plans). For purposes of this provision, employer-sponsored retirement plans do not include SEP IRAs, Simple IRAs or SAR-SEPs. |
| | • | | Shares purchased through an Ameriprise Financial investment advisory program (if an Advisory or similar share class for such investment advisory program is not available) |
| | • | | Shares purchased by third party investment advisors on behalf of their advisory clients through Ameriprise Financial’s platform (if an Advisory or similar share class for such investment advisory program is not available) |
| | • | | Shares purchased through reinvestment of distributions and dividend reinvestment when purchasing shares of the same Fund (but not any other fund within the same fund family) |
| | • | | Shares exchanged from Class C shares of the same fund in the month of or following the 10-year anniversary of the purchase date. To the extent that the Fund’s prospectus elsewhere provides for a waiver with respect to such shares following a shorter holding period, that waiver will apply to exchanges following such shorter period. To the extent that the Fund’s prospectus elsewhere provides for a waiver with respect to exchanges of Class C shares for load-waived shares, that waiver will also apply to such exchanges. |
| | • | | Employees and registered representatives of Ameriprise Financial or its affiliates and their immediate family members |
| | • | | Shares purchased by or through qualified accounts (including IRAs, Coverdell Education Savings Accounts, 401(k)s, 403(b) TSCAs subject to ERISA and defined benefit plans) that are held by a covered family member, defined as an Ameriprise financial advisor and/or the advisor’s spouse, advisor’s lineal ascendant (mother, father, grandmother, grandfather, great grandmother, great grandfather), advisor’s lineal descendant (son, step-son, daughter, step-daughter, grandson, granddaughter, great grandson, great granddaughter) or any spouse of a covered family member who is a lineal descendant |
| | • | | Shares purchased from the proceeds of redemptions within the same fund family, provided (1) the repurchase occurs within 90 days following the redemption, (2) the redemption and purchase occur in the same account, and (3) redeemed shares were subject to a front-end or deferred sales load (i.e. Rights of Reinstatement). Subject to the Fund’s policy regarding frequent purchases and redemptions of Fund shares, you may not be able to repurchase shares for the first 30 days after your redemption. |
Automatic Exchange of Class C Shares Available at Ameriprise Financial
| | • | | Class C shares will automatically exchange to Class A shares in the month of the 10-year anniversary of the purchase date. |
Merrill Lynch
Effective April 10, 2017, shareholders purchasing Fund shares through a Merrill Lynch platform or account will be eligible only for the following load waivers (front-end sales charge waivers and contingent deferred, or back-end, sales charge waivers) and discounts, which may differ from those disclosed elsewhere in the Fund’s prospectus or Statement of Additional Information.
Front-end Sales Load Waivers on Class A Shares available at Merrill Lynch
| | • | | Employer-sponsored retirement, deferred compensation and employee benefit plans (including health savings accounts) and trusts used to fund those plans, provided that the shares are not held in a commission-based brokerage account and shares are held for the benefit of the plan |
| | • | | Shares purchased by or through a 529 Plan |
| | • | | Shares purchased through a Merrill Lynch affiliated investment advisory program |
| | | | |
| 34 | | Wells Fargo Small Cap Core Fund | | Appendix A (unaudited) |
| | • | | Shares purchased by third party investment advisors on behalf of their advisory clients through Merrill Lynch’s platform |
| | • | | Shares of funds purchased through the Merrill Edge Self-Directed platform (if applicable) |
| | • | | Shares purchased through reinvestment of capital gains distributions and dividend reinvestment when purchasing shares of the same fund (but not any other fund within the fund family) |
| | • | | Shares exchanged from Class C (i.e. level-load) shares of the same fund in the month of or following the 10-year anniversary of the purchase date |
| | • | | Employees and registered representatives of Merrill Lynch or its affiliates and their family members, as defined by Merrill Lynch, which may differ from the definition of family member in the Fund’s prospectus. |
| | • | | Directors or Trustees of the Fund, and employees of the Fund’s investment adviser or any of its affiliates, as described in the Fund’s prospectus |
| | • | | Shares purchased from the proceeds of redemptions within the same fund family, provided (1) the repurchase occurs within 90 days following the redemption, (2) the redemption and purchase occur in the same account, and (3) redeemed shares were subject to a front-end or deferred sales load (known as Rights of Reinstatement). Subject to the Fund’s policy regarding frequent purchases and redemptions of Fund shares, you may not be able to repurchase shares for the first 30 days after your redemption. |
CDSC Waivers on A, B and C Shares available at Merrill Lynch
| | • | | Death or disability of the shareholder |
| | • | | Shares sold as part of a systematic withdrawal plan as described in the Fund’s prospectus |
| | • | | Return of excess contributions from an IRA Account |
| | • | | Shares sold as part of a required minimum distribution for IRA and retirement accounts due to the shareholder reaching age 70½ |
| | • | | Shares sold to pay Merrill Lynch fees but only if the transaction is initiated by Merrill Lynch |
| | • | | Shares acquired through a right of reinstatement |
| | • | | Shares held in retirement brokerage accounts, that are exchanged for a lower cost share class due to transfer to certain fee based accounts or platforms (applicable to A and C shares only) |
Front-end load Discounts Available at Merrill Lynch: Breakpoints, Rights of Accumulation & Letters of Intent
| | • | | Breakpoints as described in the Fund’s prospectus |
| | • | | Rights of Accumulation (ROA) which entitle shareholders to breakpoint discounts will be automatically calculated based on the aggregated holding of fund family assets held by accounts within the purchaser’s household at Merrill Lynch. Eligible fund family assets not held at Merrill Lynch may be included in the ROA calculation only if the shareholder notifies his or her financial advisor about such assets. |
| | • | | Letters of Intent (LOI) which allow for breakpoint discounts based on anticipated purchases within a fund family, through Merrill Lynch, over a 13-month period of time (if applicable) |
Morgan Stanley
Effective on or about July 1, 2018, shareholders purchasing Fund shares through a Morgan Stanley Wealth Management transactional brokerage account will be eligible only for the following Class A load waivers (front-end sales charge waivers), which may differ from and be more limited than those disclosed in the Fund’s prospectus or Statement of Additional Information.
Front-end Sales Load Waivers on Class A Shares Available at Morgan Stanley
| | • | | Employer-sponsored retirement plans (e.g., 401(k) plans, 457 plans, employer-sponsored 403(b) plans, profit sharing and money purchase pension plans and defined benefit plans). For purposes of this provision, employer-sponsored retirement plans do not include SEP IRAs, Simple IRAs, SAR-SEPs or Keogh plans. |
| | • | | Morgan Stanley employee and employee-related accounts according to Morgan Stanley’s account linking rules |
| | • | | Shares purchased through reinvestment of dividends and capital gains distributions when purchasing shares of the same fund |
| | • | | Shares purchased through a Morgan Stanley self-directed brokerage account |
| | | | | | |
| Appendix A (unaudited) | | Wells Fargo Small Cap Core Fund | | | 35 | |
| | • | | Class C (i.e., level-load) shares that are no longer subject to a contingent deferred sales charge and are exchanged to Class A shares of the same fund pursuant to Morgan Stanley Wealth Management’s share class exchange program. |
| | • | | Shares purchased from the proceeds of redemptions within the same fund family, provided (i) the repurchase occurs within 90 days following the redemption, (ii) the redemption and purchase occur in the same account, and (iii) redeemed shares were subject to a front-end or deferred sales charge. This waiver is subject to the Fund’s policy regarding frequent purchases and redemption of Fund shares, as discussed under “Account Information—Frequent Purchases and Redemptions of Fund Shares” in the Fund’s prospectus. |
Raymond James & Associates, Inc., Raymond James Financial Services & Raymond James affiliates (“Raymond James”)
Effective on or about March 1, 2019, shareholders purchasing Fund shares through a Raymond James platform or account will be eligible only for the following load waivers (front-end sales charge waivers and contingent deferred, or back-end, sales charge waivers) and discounts, which may differ from those disclosed elsewhere in the Fund’s Prospectus or SAI.
Front-end Sales Load Waivers on Class A shares Available at Raymond James
| | • | | Shares purchased in an investment advisory program. |
| | • | | Shares purchased through reinvestment of capital gains distributions and dividend reinvestment when purchasing shares of the same fund (but not any other fund within the fund family). |
| | • | | Employees and registered representatives of Raymond James or its affiliates and their family members as designated by Raymond James. |
| | • | | Shares purchased from the proceeds of redemptions within the same fund family, provided (1) the repurchase occurs within 90 days following the redemption, (2) the redemption and purchase occur in the same account, and (3) redeemed shares were subject to a front-end or deferred sales load (known as Rights of Reinstatement). |
| | • | | A shareholder in the fund’s Class C shares will have their shares automatically exchanged at net asset value to Class A shares (or the appropriate share class) of the fund if the shares are no longer subject to a CDSC and the exchange is in line with the policies and procedures of Raymond James. |
CDSC Waivers on Class A and C Shares Available at Raymond James
| | • | | Death or disability of the shareholder. |
| | • | | Shares sold as part of a systematic withdrawal plan as described in the Fund’s Prospectus. |
| | • | | Return of excess contributions from an IRA Account. |
| | • | | Shares sold as part of a required minimum distribution for IRA and retirement accounts due to the shareholder reaching age 70½ as described in the Fund’s prospectus. |
| | • | | Shares sold to pay Raymond James fees but only if the transaction is initiated by Raymond James. |
| | • | | Shares acquired through a right of reinstatement. |
Front-end Load Discounts Available at Raymond James: Breakpoints, and/or Rights of Accumulation
| | • | | Breakpoints as described in the Fund’s Prospectus. |
| | • | | Rights of accumulation which entitle shareholders to breakpoint discounts will be automatically calculated based on the aggregated holding of fund family assets held by accounts within the purchaser’s household at Raymond James. Eligible fund family assets not held at Raymond James may be included in the rights of accumulation calculation only if the shareholder notifies his or her financial advisor about such assets. |
This page is intentionally left blank.

For more information
More information about Wells Fargo Funds is available free upon request. To obtain literature, please write, visit the Fund’s website, or call:
Wells Fargo Funds
P.O. Box 219967
Kansas City, MO 64121-9967
Website: wellsfargofunds.com
Individual investors: 1-800-222-8222
Retail investment professionals: 1-888-877-9275
Institutional investment professionals:
1-866-765-0778
This report and the financial statements contained herein are submitted for the general information of the shareholders of the Fund. If this report is used for promotional purposes, distribution of the report must be accompanied or preceded by a current prospectus. Before investing, please consider the investment objectives, risks, charges, and expenses of the investment. For a current prospectus and, if available, a summary prospectus, containing this information, call 1-800-222-8222 or visit the Fund’s website at wellsfargofunds.com. Read the prospectus carefully before you invest or send money.
Wells Fargo Asset Management (WFAM) is the trade name for certain investment advisory/management firms owned by Wells Fargo & Company. These firms include but are not limited to Wells Capital Management Incorporated and Wells Fargo Funds Management, LLC. Certain products managed by WFAM entities are distributed by Wells Fargo Funds Distributor, LLC (a broker/dealer and Member FINRA).
This material is for general informational and educational purposes only and is NOT intended to provide investment advice or a recommendation of any kind—including a recommendation for any specific investment, strategy, or plan.
NOT FDIC INSURED ◾ NO BANK GUARANTEE ◾ MAY LOSE VALUE
© 2018 Wells Fargo Funds Management, LLC. All rights reserved.
| | |
 | | 317297 11-18 SA269/SAR269 09-18 |
Semi-Annual Report
September 30, 2018

Wells Fargo Disciplined Small Cap Fund
(formerly, Wells Fargo Small Cap Opportunities Fund)


Reduce clutter. Save trees.
Sign up for electronic delivery of prospectuses and shareholder reports at wellsfargo.com/advantagedelivery
Contents
The views expressed and any forward-looking statements are as of September 30, 2018, unless otherwise noted, and are those of the Fund managers and/or Wells Fargo Funds Management, LLC. Discussions of individual securities, or the markets generally, or any Wells Fargo Fund are not intended as individual recommendations. Future events or results may vary significantly from those expressed in any forward-looking statements. The views expressed are subject to change at any time in response to changing circumstances in the market. Wells Fargo Funds Management, LLC and the Fund disclaim any obligation to publicly update or revise any views expressed or forward-looking statements.
NOT FDIC INSURED ◾ NO BANK GUARANTEE ◾ MAY LOSE VALUE
| | | | |
| 2 | | Wells Fargo Disciplined Small Cap Fund | | Letter to shareholders (unaudited) |

Andrew Owen
President
Wells Fargo Funds
The second and third quarters of 2018 were characterized by growing economic and investment activity in the U.S.
Dear Shareholder:
We are pleased to offer you this semi-annual report for the Wells Fargo Disciplined Small Cap Fund for the six-month period that ended September 30, 2018. Effective June 27, 2018, the Fund changed its name from Wells Fargo Small Cap Opportunities Fund to Wells Fargo Disciplined Small Cap Fund. The second and third quarters of 2018 were characterized by growing economic and investment activity in the U.S. In contrast, economies overseas were restrained as geopolitical tensions and rising interest rates diverted investor interest in those markets.
For the period, U.S. stocks, as measured by the S&P 500 Index,1 gained 11.41% and international stocks, as measured by the MSCI ACWI ex USA Index (Net),2 lost 1.93%. Based on the MSCI EM Index (Net),3 emerging market stocks lost 8.97%. For bond investors, the Bloomberg Barclays U.S. Aggregate Bond Index4 lost 0.14% while the Bloomberg Barclays Global Aggregate ex-USD Index5 fell 6.42%. The Bloomberg Barclays Municipal Bond Index6 added 0.72%, and the ICE BofAML U.S. High Yield Index7 was up 3.46%.
Global trade tensions escalated during the second quarter.
During the second quarter of 2018, the U.S. government imposed tariffs, and foreign governments in North America, Europe, and Asia retaliated. The actions marked the initialization of trade tensions that would escalate during the next six months. The increasing tensions chilled investment activity as observers awaited signals of next steps.
Meanwhile, inflation continued an upward trend. The CPI-U8 added 0.1% in June after an increase of 0.2% in both April and May. On a year-over-year basis, the all-items index rose 2.9% for the 12 months that ended June 30, 2018. The index for all items less food and energy rose 2.3% for the same 12-month period.
| 1 | The S&P 500 Index consists of 500 stocks chosen for market size, liquidity, and industry group representation. It is a market-value-weighted index with each stock’s weight in the index proportionate to its market value. You cannot invest directly in an index. |
| 2 | The Morgan Stanley Capital International (MSCI) All Country World Index (ACWI) ex USA Index (Net) is a free-float-adjusted market-capitalization-weighted index that is designed to measure the equity market performance of developed markets, excluding the United States and Canada. Source: MSCI. MSCI makes no express or implied warranties or representations and shall have no liability whatsoever with respect to any MSCI data contained herein. The MSCI data may not be further redistributed or used as a basis for other indices or any securities or financial products. This report is not approved, reviewed, or produced by MSCI. You cannot invest directly in an index. |
| 3 | The MSCI Emerging Markets (EM) Index (Net) is a free-float-adjusted market-capitalization-weighted index that is designed to measure large- and mid-cap equity market performance of emerging markets. The MSCI EM Index (Net) consists of the following 24 emerging market country indices: Brazil, Chile, China, Colombia, Czech Republic, Egypt, Greece, Hungary, India, Indonesia, Korea, Malaysia, Mexico, Pakistan, Peru, the Philippines, Poland, Qatar, Russia, South Africa, Taiwan, Thailand, Turkey, and the United Arab Emirates. You cannot invest directly in an index. |
| 4 | The Bloomberg Barclays U.S. Aggregate Bond Index is a broad-based benchmark that measures the investment-grade, U.S. dollar-denominated, fixed-rate taxable bond market, including Treasuries, government-related and corporate securities, mortgage-backed securities (agency fixed-rate and hybrid adjustable-rate mortgage pass-throughs), asset-backed securities, and commercial mortgage-backed securities. You cannot invest directly in an index. |
| 5 | The Bloomberg Barclays Global Aggregate ex-USD Index is an unmanaged index that provides a broad-based measure of the global investment-grade fixed-income markets excluding the U.S. dollar-denominated debt market. You cannot invest directly in an index. |
| 6 | The Bloomberg Barclays Municipal Bond Index is an unmanaged index composed of long-term tax-exempt bonds with a minimum credit rating of Baa. You cannot invest directly in an index. |
| 7 | The ICE BofAML U.S. High Yield Index is a market-capitalization-weighted index of domestic and Yankee high-yield bonds. The index tracks the performance of high-yield securities traded in the U.S. bond market. You cannot invest directly in an index. Copyright 2018. ICE Data Indices, LLC. All rights reserved. |
| 8 | The Consumer Price Index for All Urban Consumers (CPI-U) measures the changes in the price of a basket of goods and services purchased by urban consumers. The urban consumer population is deemed by many as a better representative measure of the general public because close to 90% of the country’s population lives in highly populated areas. You cannot invest directly in an index. |
| | | | | | |
| Letter to shareholders (unaudited) | | Wells Fargo Disciplined Small Cap Fund | | | 3 | |
U.S. stocks gained while international stocks and bonds declined during the summer of 2018.
The U.S. economy strengthened during the summer months. Revised second-quarter gross domestic product data released in August showed the U.S. economy growing at a 4.2% rate. After ticking up slightly in June, the unemployment rate in the U.S. was 3.9% in July and August, according to the U.S. Department of Labor. Wages showed more consistent growth, and consumer confidence remained strong.
Several U.S. equity market indices reached records during August, with the S&P 500 Index gaining 7.76% for the three-month period that ended August 31, 2018. International stock values continued to suffer under the effects of a strong U.S. dollar and continuing trade tensions. The MSCI ACWI ex USA Index (Net) and the MSCI EM Index (Net) were down 4.70% and 1.64%, during the same three-month period.
The U.S. Federal Reserve (Fed) increased the federal funds rate in June, and expectations grew that two more rate increases were in the offing in 2018. Long-term interest rates in the U.S. remained at higher levels relative to the prior 10 years. Rates on 10-year and 30-year Treasury bonds—2.74% and 2.97%, respectively, on March 31, 2018—were 3.05% and 3.19%, respectively, on September 30, off their peak levels on May 17, 2018, of 3.11% and 3.25%, respectively. Some investors became more aware of and concerned about the potential for an inverted yield curve—sometimes a recession signal—as short-term rates increased more quickly than long-term rates. The Fed decided to forgo an interest rate increase at its August meeting.
Internationally, members of Prime Minister Theresa May’s U.K./Brexit negotiating team resigned amid unproductive negotiations. In early August, the Bank of England’s Monetary Policy Committee increased its key interest rate to 0.75%. Central banks in Europe and Japan maintained low interest rates and accommodative monetary policies. Amid rising trade uncertainty, the People’s Bank of China cut reserve requirement ratios and accelerated infrastructure spending and tax cuts for business enterprises and individuals. Nevertheless, a strengthening U.S. dollar and the trade tensions remained headwinds for investors overseas.
Don’t let short-term uncertainty derail long-term investment goals.
Periods of investment uncertainty can present challenges, but experience has taught us that maintaining long-term investment goals can be an effective way to plan for the future. To help you create a sound strategy based on your personal goals and risk tolerance, Wells Fargo Funds offers more than 100 mutual funds spanning a wide range of asset classes and investment styles. Although diversification cannot guarantee an investment profit or prevent losses, we believe it can be an effective way to manage investment risk and potentially smooth out overall portfolio performance. We encourage investors to know their investments and to understand that appropriate levels of risk-taking may unlock opportunities.
The U.S. economy strengthened during the summer months.
| | | | |
| 4 | | Wells Fargo Disciplined Small Cap Fund | | Letter to shareholders (unaudited) |
Thank you for choosing to invest with Wells Fargo Funds. We appreciate your confidence in us and remain committed to helping you meet your financial needs.
Sincerely,

Andrew Owen
President
Wells Fargo Funds
Notice to shareholders
At a meeting held on August 14-15, 2018, the Board of Trustees of the Fund approved the following policy which will be effective on or about February 5, 2019:
Class C shares will convert automatically into Class A shares ten years after the initial date of purchase or, if you acquired your Class C shares through an exchange or conversion from another share class, ten years after the date you acquired your Class C shares. When Class C shares that you acquired through a purchase or exchange convert, any other Class C shares that you purchased with reinvested dividends and distributions also will convert into Class A shares on a pro rata basis. A shorter holding period may also apply depending on your intermediary. Please see “Appendix A—Sales Charge Reductions and Waivers for Certain Intermediaries” in the Fund’s prospectus or at the end of this report.
For further information about your Fund, contact your investment professional, visit our website at wellsfargofunds.com, or call us directly at 1-800-222-8222.
This page is intentionally left blank.
| | | | |
| 6 | | Wells Fargo Disciplined Small Cap Fund | | Performance highlights (unaudited) |
Investment objective
The Fund seeks long-term capital appreciation.
Manager
Wells Fargo Funds Management, LLC
Subadviser
Wells Capital Management Incorporated‡
Portfolio managers‡‡
Justin P. Carr, CFA®
Greg G. Golden, CFA®
Robert M. Wicentowski, CFA®
Average annual total returns (%) as of September 30, 20181
| | | | | | | | | | | | | | | | | | | | | | | | | | | | | | | | | | |
| | | | | Including sales charge | | | Excluding sales charge | | | Expense ratios2 (%) | |
| | | Inception date | | 1 year | | | 5 year | | | 10 year | | | 1 year | | | 5 year | | | 10 year | | | Gross | | | Net3 | |
| Class A (WDSAX) | | 7-31-2018 | | | 1.94 | | | | 9.00 | | | | 9.89 | | | | 8.15 | | | | 10.30 | | | | 10.54 | | | | 1.10 | | | | 0.99 | |
| Class R6 (WSCJX) | | 10-31-2016 | | | – | | | | – | | | | – | | | | 8.57 | | | | 10.57 | | | | 10.68 | | | | 0.67 | | | | 0.56 | |
| Administrator Class (NVSOX) | | 8-1-1993 | | | – | | | | – | | | | – | | | | 8.20 | | | | 10.31 | | | | 10.55 | | | | 1.02 | | | | 0.91 | |
| Institutional Class (WSCOX) | | 10-31-2014 | | | – | | | | – | | | | – | | | | 8.48 | | | | 10.53 | | | | 10.66 | | | | 0.77 | | | | 0.66 | |
| Russell 2000® Index4 | | – | | | – | | | | – | | | | – | | | | 15.24 | | | | 11.07 | | | | 11.11 | | | | – | | | | – | |
Figures quoted represent past performance, which is no guarantee of future results, and do not reflect taxes that a shareholder may pay on fund distributions or the redemption of fund shares. Investment return and principal value of an investment will fluctuate so that an investor’s shares, when redeemed, may be worth more or less than their original cost. Performance shown without sales charges would be lower if sales charges were reflected. Current performance may be lower or higher than the performance data quoted, which assumes the reinvestment of dividends and capital gains. Current month-end performance is available on the Fund’s website, wellsfargofunds.com.
Index returns do not include transaction costs associated with buying and selling securities, any mutual fund fees or expenses, or any taxes. It is not possible to invest directly in an index.
For Class A shares, the maximum front-end sales charge is 5.75%. Performance including a contingent deferred sales charge assumes the sales charge for the corresponding time period. Class R6, Administrator Class, and Institutional Class shares are sold without a front-end sales charge or contingent deferred sales charge.
Stock values fluctuate in response to the activities of individual companies and general market and economic conditions. Smaller-company stocks tend to be more volatile and less liquid than those of larger companies. Certain investment strategies tend to increase the total risk of an investment (relative to the broader market). The Fund is exposed to foreign investment risk. Consult the Fund’s prospectus for additional information on these and other risks.
Please see footnotes on page 7.
| | | | | | |
| Performance highlights (unaudited) | | Wells Fargo Disciplined Small Cap Fund | | | 7 | |
| | | | |
| Ten largest holdings (%) as of September 30, 20185 | |
Helen of Troy Limited | | | 0.89 | |
Insperity Incorporated | | | 0.87 | |
iShares Russell 2000 Index ETF | | | 0.84 | |
EnerSys | | | 0.80 | |
Portland General Electric Company | | | 0.80 | |
Ryman Hospitality Properties Incorporated | | | 0.78 | |
Trinseo SA | | | 0.77 | |
Performance Food Group Company | | | 0.76 | |
Steven Madden Limited | | | 0.76 | |
LHC Group Incorporated | | | 0.75 | |
|
| Sector distribution as of September 30, 20186 |
|
 |
| ‡ | Wells Capital Management Incorporated became the subadviser of the Fund on June 27, 2018. |
| ‡‡ | Mr. Carr, Mr. Golden, and Mr. Wicentowski became portfolio managers of the Fund on June 27, 2018. |
| 1 | Class A shares prior to their inception reflects the performance of the Administrator Class shares, and is adjusted to reflect the higher expenses and sales charges of the Class A shares. Historical performance shown for Class R6 shares prior to their inception reflects the performance of the Institutional Class shares, and is not adjusted to reflect the expenses of Class R6 shares. If these expenses had been included, returns for Class R6 shares would be higher. Historical performance shown for the Institutional Class shares prior to their inception reflects the performance of the Administrator Class shares, and is not adjusted to reflect the expenses of the Institutional Class shares. If these expenses had been included, returns for the Institutional Class shares would be higher. |
| 2 | Reflects the expense ratios as stated in the most recent prospectuses, which include the impact of 0.06% in acquired fund fees and expenses. The expense ratios shown are subject to change and may differ from the annualized expense ratios shown in the financial highlights of this report, which do not include acquired fund fees and expenses. |
| 3 | The manager has contractually committed through July 31, 2019 (July 31, 2020 for Class A shares), to waive fees and/or reimburse expenses to the extent necessary to cap the Fund’s Total Annual Fund Operating Expenses After Fee Waivers at 0.93% for Class A, 0.50% for Class R6, 0.85% for Administrator Class, and 0.60% for Institutional Class. After this time, the cap may be increased or the commitment to maintain the cap may be terminated only with the approval of the Board of Trustees. Brokerage commissions, stamp duty fees, interest, taxes, acquired fund fees and expenses (if any), and extraordinary expenses are excluded from the expense cap. Without this cap, the Fund’s returns would have been lower. The expense ratio paid by an investor is the net expense ratio (the total annual fund operating expenses after fee waivers) as stated in the prospectuses. |
| 4 | The Russell 2000® Index measures the performance of the 2,000 smallest companies in the Russell 3000® Index, which represents approximately 8% of the total market capitalization of the Russell 3000® Index. You cannot invest directly in an index. |
| 5 | The ten largest holdings, excluding cash, cash equivalents and any money market funds, are calculated based on the value of the investments divided by total net assets of the Fund. Holdings are subject to change and may have changed since the date specified. |
| 6 | Amounts are calculated based on the total long-term investments of the Fund. These amounts are subject to change and may have changed since the date specified. |
| | | | |
| 8 | | Wells Fargo Disciplined Small Cap Fund | | Fund expenses (unaudited) |
As a shareholder of the Fund, you incur two types of costs: (1) transaction costs, including sales charges (loads) on purchase payments and contingent deferred sales charges (if any) on redemptions and (2) ongoing costs, including management fees, shareholder servicing fees, and other Fund expenses. This example is intended to help you understand your ongoing costs (in dollars) of investing in the Fund and to compare these costs with the ongoing costs of investing in other mutual funds.
The example is based on an investment of $1,000 invested at the beginning of the six-month period and held for the entire period from April 1, 2018 to September 30, 2018.
Actual expenses
The “Actual” line of the table below provides information about actual account values and actual expenses. You may use the information in this line, together with the amount you invested, to estimate the expenses that you paid over the period. Simply divide your account value by $1,000 (for example, an $8,600 account value divided by $1,000 = 8.6), then multiply the result by the number in the “Actual” line under the heading entitled “Expenses paid during period” for your applicable class of shares to estimate the expenses you paid on your account during this period.
Hypothetical example for comparison purposes
The “Hypothetical” line of the table below provides information about hypothetical account values and hypothetical expenses based on the Fund’s actual expense ratio and an assumed rate of return of 5% per year before expenses, which is not the Fund’s actual return. The hypothetical account values and expenses may not be used to estimate the actual ending account balance or expenses you paid for the period. You may use this information to compare the ongoing costs of investing in the Fund and other funds. To do so, compare this 5% hypothetical example with the 5% hypothetical examples that appear in the shareholder reports of the other funds.
Please note that the expenses shown in the table are meant to highlight your ongoing costs only and do not reflect any transactional costs, such as sales charges (loads) and contingent deferred sales charges. Therefore, the “Hypothetical” line of the table is useful in comparing ongoing costs only and will not help you determine the relative total costs of owning different funds. In addition, if these transactional costs were included, your costs would have been higher.
| | | | | | | | | | | | | | | | |
| | | Beginning
account value
4-1-2018 | | | Ending
account value
9-30-2018 | | | Expenses
paid during
the period¹ | | | Annualized net
expense ratio | |
Class A | | | | | | | | | | | | | | | | |
Actual | | $ | 1,000.00 | | | $ | 1,059.02 | | | $ | 4.75 | | | | 0.92 | % |
Hypothetical (5% return before expenses) | | $ | 1,000.00 | | | $ | 1,020.46 | | | $ | 4.66 | | | | 0.92 | % |
Class R6 | | | | | | | | | | | | | | | | |
Actual | | $ | 1,000.00 | | | $ | 1,060.95 | | | $ | 3.56 | | | | 0.69 | % |
Hypothetical (5% return before expenses) | | $ | 1,000.00 | | | $ | 1,021.61 | | | $ | 3.50 | | | | 0.69 | % |
Administrator Class | | | | | | | | | | | | | | | | |
Actual | | $ | 1,000.00 | | | $ | 1,059.48 | | | $ | 5.27 | | | | 1.02 | % |
Hypothetical (5% return before expenses) | | $ | 1,000.00 | | | $ | 1,019.95 | | | $ | 5.16 | | | | 1.02 | % |
Institutional Class | | | | | | | | | | | | | | | | |
Actual | | $ | 1,000.00 | | | $ | 1,060.59 | | | $ | 3.93 | | | | 0.76 | % |
Hypothetical (5% return before expenses) | | $ | 1,000.00 | | | $ | 1,021.26 | | | $ | 3.85 | | | | 0.76 | % |
| 1 | Expenses paid is equal to the annualized net expense ratio of each class multiplied by the average account value over the period, multiplied by the number of days in the most recent fiscal half-year divided by the number of days in the fiscal year (to reflect the one-half-year period). |
| | | | | | |
| Portfolio of investments—September 30, 2018 (unaudited) | | Wells Fargo Disciplined Small Cap Fund | | | 9 | |
| | | | | | | | | | | | | | | | |
| Security name | | | | | | | | Shares | | | Value | |
| | | | |
Common Stocks: 101.67% | | | | | | | | | | | | | | | | |
| | | | |
Communication Services: 1.75% | | | | | | | | | | | | | | | | |
| | | | |
| Diversified Telecommunication Services: 0.62% | | | | | | | | | | | | | | | | |
Vonage Holdings Corporation † | | | | | | | | | | | 70,671 | | | $ | 1,000,701 | |
| | | | | | | | | | | | | | | | |
| | | | |
| Interactive Media & Services: 1.03% | | | | | | | | | | | | | | | | |
Quinstreet Incorporated † | | | | | | | | | | | 69,011 | | | | 936,479 | |
Yelp Incorporated † | | | | | | | | | | | 14,665 | | | | 721,518 | |
| | | | |
| | | | | | | | | | | | | | | 1,657,997 | |
| | | | | | | | | | | | | | | | |
| | | | |
| Wireless Telecommunication Services: 0.10% | | | | | | | | | | | | | | | | |
Boingo Wireless Incorporated † | | | | | | | | | | | 4,707 | | | | 164,274 | |
| | | | | | | | | | | | | | | | |
| | | | |
Consumer Discretionary: 13.15% | | | | | | | | | | | | | | | | |
| | | | |
| Auto Components: 1.61% | | | | | | | | | | | | | | | | |
Cooper-Standard Holdings Incorporated † | | | | | | | | | | | 5,659 | | | | 678,967 | |
Dana Incorporated | | | | | | | | | | | 26,904 | | | | 502,298 | |
Tenneco Incorporated | | | | | | | | | | | 17,930 | | | | 755,570 | |
Tower International Incorporated | | | | | | | | | | | 21,689 | | | | 656,092 | |
| | | | |
| | | | | | | | | | | | | | | 2,592,927 | |
| | | | | | | | | | | | | | | | |
| | | | |
| Diversified Consumer Services: 1.66% | | | | | | | | | | | | | | | | |
Grand Canyon Education Incorporated † | | | | | | | | | | | 8,470 | | | | 955,416 | |
Strategic Education Incorporated | | | | | | | | | | | 6,717 | | | | 920,431 | |
Weight Watchers International Incorporated † | | | | | | | | | | | 11,256 | | | | 810,319 | |
| | | | |
| | | | | | | | | | | | | | | 2,686,166 | |
| | | | | | | | | | | | | | | | |
| | | | |
| Hotels, Restaurants & Leisure: 2.65% | | | | | | | | | | | | | | | | |
Brinker International Incorporated « | | | | | | | | | | | 21,936 | | | | 1,025,069 | |
Dave & Buster’s Entertainment Incorporated | | | | | | | | | | | 12,441 | | | | 823,843 | |
Marriott Vacations Worldwide Corporation | | | | | | | | | | | 7,280 | | | | 813,540 | |
Planet Fitness Incorporated Class A † | | | | | | | | | | | 16,020 | | | | 865,561 | |
Ruth’s Chris Steak House Incorporated | | | | | | | | | | | 23,563 | | | | 743,413 | |
| | | | |
| | | | | | | | | | | | | | | 4,271,426 | |
| | | | | | | | | | | | | | | | |
| | | | |
| Household Durables: 1.63% | | | | | | | | | | | | | | | | |
Century Communities Incorporated † | | | | | | | | | | | 13,989 | | | | 367,211 | |
Helen of Troy Limited † | | | | | | | | | | | 10,978 | | | | 1,437,020 | |
KB Home Incorporated | | | | | | | | | | | 17,383 | | | | 415,628 | |
La-Z-Boy Incorporated | | | | | | | | | | | 13,177 | | | | 416,393 | |
| | | | |
| | | | | | | | | | | | | | | 2,636,252 | |
| | | | | | | | | | | | | | | | |
| | | | |
| Internet & Direct Marketing Retail: 1.10% | | | | | | | | | | | | | | | | |
Etsy Incorporated † | | | | | | | | | | | 7,865 | | | | 404,104 | |
Nutrisystem Incorporated | | | | | | | | | | | 16,319 | | | | 604,619 | |
Stamps.com Incorporated † | | | | | | | | | | | 3,396 | | | | 768,175 | |
| | | | |
| | | | | | | | | | | | | | | 1,776,898 | |
| | | | | | | | | | | | | | | | |
The accompanying notes are an integral part of these financial statements.
| | | | |
| 10 | | Wells Fargo Disciplined Small Cap Fund | | Portfolio of investments—September 30, 2018 (unaudited) |
| | | | | | | | | | | | | | | | |
| Security name | | | | | | | | Shares | | | Value | |
| | | | |
| Specialty Retail: 3.07% | | | | | | | | | | | | | | | | |
American Eagle Outfitters Incorporated | | | | | | | | | | | 27,474 | | | $ | 682,179 | |
Caleres Incorporated | | | | | | | | | | | 17,795 | | | | 638,129 | |
Children’s Place Retail Stores Incorporated | | | | | | | | | | | 7,502 | | | | 958,756 | |
DSW Incorporated Class A | | | | | | | | | | | 32,689 | | | | 1,107,503 | |
Five Below Incorporated † | | | | | | | | | | | 1,859 | | | | 241,782 | |
Tailored Brands Incorporated | | | | | | | | | | | 21,734 | | | | 547,479 | |
Zumiez Incorporated † | | | | | | | | | | | 29,638 | | | | 780,961 | |
| | | | |
| | | | | | | | | | | | | | | 4,956,789 | |
| | | | | | | | | | | | | | | | |
| | | | |
| Textiles, Apparel & Luxury Goods: 1.43% | | | | | | | | | | | | | | | | |
Movado Group Incorporated | | | | | | | | | | | 15,796 | | | | 661,852 | |
Skechers U.S.A. Incorporated Class A † | | | | | | | | | | | 14,759 | | | | 412,219 | |
Steven Madden Limited | | | | | | | | | | | 23,174 | | | | 1,225,905 | |
| | | | |
| | | | | | | | | | | | | | | 2,299,976 | |
| | | | | | | | | | | | | | | | |
| | | | |
Consumer Staples: 2.80% | | | | | | | | | | | | | | | | |
| | | | |
| Food & Staples Retailing: 1.08% | | | | | | | | | | | | | | | | |
Performance Food Group Company † | | | | | | | | | | | 37,001 | | | | 1,232,133 | |
United Natural Foods Incorporated † | | | | | | | | | | | 17,229 | | | | 516,009 | |
| | | | |
| | | | | | | | | | | | | | | 1,748,142 | |
| | | | | | | | | | | | | | | | |
| | | | |
| Food Products: 0.17% | | | | | | | | | | | | | | | | |
Fresh Del Monte Produce Incorporated | | | | | | | | | | | 7,965 | | | | 269,934 | |
| | | | | | | | | | | | | | | | |
| | | | |
| Personal Products: 1.02% | | | | | | | | | | | | | | | | |
Medifast Incorporated | | | | | | | | | | | 4,425 | | | | 980,359 | |
USANA Health Sciences Incorporated † | | | | | | | | | | | 5,505 | | | | 663,628 | |
| | | | |
| | | | | | | | | | | | | | | 1,643,987 | |
| | | | | | | | | | | | | | | | |
| | | | |
| Tobacco: 0.53% | | | | | | | | | | | | | | | | |
Turning Point Brands Incorporated | | | | | | | | | | | 20,714 | | | | 858,802 | |
| | | | | | | | | | | | | | | | |
| | | | |
Energy: 5.79% | | | | | | | | | | | | | | | | |
| | | | |
| Energy Equipment & Services: 1.60% | | | | | | | | | | | | | | | | |
Archrock Incorporated | | | | | | | | | | | 62,275 | | | | 759,755 | |
Helix Energy Solutions Group Incorporated † | | | | | | | | | | | 85,384 | | | | 843,594 | |
Pioneer Energy Services Corporation † | | | | | | | | | | | 59,759 | | | | 176,289 | |
ProPetro Holding Corporation † | | | | | | | | | | | 17,013 | | | | 280,544 | |
Tetra Technologies Incorporated † | | | | | | | | | | | 115,024 | | | | 518,758 | |
| | | | |
| | | | | | | | | | | | | | | 2,578,940 | |
| | | | | | | | | | | | | | | | |
| | | | |
| Oil, Gas & Consumable Fuels: 4.19% | | | | | | | | | | | | | | | | |
Abraxas Petroleum Corporation † | | | | | | | | | | | 334,045 | | | | 778,325 | |
Callon Petroleum Company † | | | | | | | | | | | 58,249 | | | | 698,406 | |
Delek US Holdings Incorporated | | | | | | | | | | | 24,901 | | | | 1,056,549 | |
Denbury Resources Incorporated † | | | | | | | | | | | 78,759 | | | | 488,306 | |
HighPoint Resources Corporation † | | | | | | | | | | | 100,851 | | | | 492,153 | |
Matador Resources Company † | | | | | | | | | | | 20,798 | | | | 687,374 | |
The accompanying notes are an integral part of these financial statements.
| | | | | | |
| Portfolio of investments—September 30, 2018 (unaudited) | | Wells Fargo Disciplined Small Cap Fund | | | 11 | |
| | | | | | | | | | | | | | | | |
| Security name | | | | | | | | Shares | | | Value | |
| | | | |
| Oil, Gas & Consumable Fuels (continued) | | | | | | | | | | | | | | | | |
Northern Oil & Gas Incorporated † | | | | | | | | | | | 122,162 | | | $ | 488,648 | |
Oasis Petroleum Incorporated † | | | | | | | | | | | 63,656 | | | | 902,642 | |
Penn Virginia Corporation † | | | | | | | | | | | 5,155 | | | | 415,184 | |
SRC Energy Incorporated † | | | | | | | | | | | 85,698 | | | | 761,855 | |
| | | | |
| | | | | | | | | | | | | | | 6,769,442 | |
| | | | | | | | | | | | | | | | |
| | | | |
Financials: 17.78% | | | | | | | | | | | | | | | | |
| | | | |
| Banks: 9.13% | | | | | | | | | | | | | | | | |
Bank of N.T. Butterfield & Son Limited | | | | | | | | | | | 18,965 | | | | 983,525 | |
Brookline Bancorp Incorporated | | | | | | | | | | | 14,734 | | | | 246,058 | |
Central Pacific Financial Company | | | | | | | | | | | 10,042 | | | | 265,410 | |
CNB Financial Corporation | | | | | | | | | | | 13,287 | | | | 383,463 | |
Enterprise Financial Service | | | | | | | | | | | 14,923 | | | | 791,665 | |
FB Financial Corporation | | | | | | | | | | | 14,779 | | | | 579,041 | |
First Bancorp Corporation | | | | | | | | | | | 20,396 | | | | 826,242 | |
First Financial Bancorp | | | | | | | | | | | 19,547 | | | | 580,546 | |
First Interstate BancSystem Class A | | | | | | | | | | | 19,813 | | | | 887,622 | |
First Merchants Corporation | | | | | | | | | | | 17,187 | | | | 773,243 | |
Great Western Bancorp Incorporated | | | | | | | | | | | 14,579 | | | | 615,088 | |
Hancock Holding Company | | | | | | | | | | | 21,184 | | | | 1,007,299 | |
Heartland Financial USA Incorporated | | | | | | | | | | | 11,380 | | | | 660,609 | |
Heritage Commerce Corporation | | | | | | | | | | | 20,937 | | | | 312,380 | |
IBERIABANK Corporation | | | | | | | | | | | 1,807 | | | | 146,999 | |
Independent Bank Corporation | | | | | | | | | | | 25,216 | | | | 596,358 | |
Mercantile Bank Corporation | | | | | | | | | | | 15,570 | | | | 519,571 | |
NBT Bancorp Incorporated | | | | | | | | | | | 14,820 | | | | 568,792 | |
Peoples Bancorp Incorporated | | | | | | | | | | | 16,377 | | | | 573,686 | |
Preferred Bank (Los Angeles) | | | | | | | | | | | 12,788 | | | | 748,098 | |
Shore Bancshares Incorporated | | | | | | | | | | | 6,939 | | | | 123,653 | |
Simmons First National Corporation Class A | | | | | | | | | | | 3,463 | | | | 101,985 | |
Sterling Bancorp | | | | | | | | | | | 23,444 | | | | 515,768 | |
TriCo Bancshares | | | | | | | | | | | 7,790 | | | | 300,850 | |
Umpqua Holdings Corporation | | | | | | | | | | | 30,789 | | | | 640,411 | |
Valley National Bancorp | | | | | | | | | | | 88,022 | | | | 990,248 | |
| | | | |
| | | | | | | | | | | | | | | 14,738,610 | |
| | | | | | | | | | | | | | | | |
| | | | |
| Capital Markets: 3.04% | | | | | | | | | | | | | | | | |
BGC Partners Incorporated Class A | | | | | | | | | | | 78,695 | | | | 930,175 | |
Blucora Incorporated † | | | | | | | | | | | 26,795 | | | | 1,078,499 | |
BrightSphere Investment Group Incorporated | | | | | | | | | | | 42,085 | | | | 521,854 | |
Evercore Partners Incorporated Class A | | | | | | | | | | | 10,193 | | | | 1,024,906 | |
Houlihan Lokey Incorporated | | | | | | | | | | | 12,225 | | | | 549,269 | |
Stifel Financial Corporation | | | | | | | | | | | 15,724 | | | | 806,012 | |
| | | | |
| | | | | | | | | | | | | | | 4,910,715 | |
| | | | | | | | | | | | | | | | |
| | | | |
| Consumer Finance: 0.72% | | | | | | | | | | | | | | | | |
Elevate Credit Incorporated †« | | | | | | | | | | | 41,316 | | | | 333,007 | |
Enova International Incorporated † | | | | | | | | | | | 28,586 | | | | 823,277 | |
| | | | |
| | | | | | | | | | | | | | | 1,156,284 | |
| | | | | | | | | | | | | | | | |
The accompanying notes are an integral part of these financial statements.
| | | | |
| 12 | | Wells Fargo Disciplined Small Cap Fund | | Portfolio of investments—September 30, 2018 (unaudited) |
| | | | | | | | | | | | | | | | |
| Security name | | | | | | | | Shares | | | Value | |
| | | | |
| Insurance: 2.66% | | | | | | | | | | | | | | | | |
CNO Financial Group Incorporated | | | | | | | | | | | 12,116 | | | $ | 257,102 | |
Health Insurance Innovations Incorporated Class A † | | | | | | | | | | | 8,627 | | | | 531,855 | |
Kemper Corporation | | | | | | | | | | | 14,516 | | | | 1,167,812 | |
National General Holdings Corporation | | | | | | | | | | | 21,534 | | | | 577,973 | |
Selective Insurance Group Incorporated | | | | | | | | | | | 10,295 | | | | 653,733 | |
Universal Insurance Holdings Company | | | | | | | | | | | 22,859 | | | | 1,109,804 | |
| | | | |
| | | | | | | | | | | | | | | 4,298,279 | |
| | | | | | | | | | | | | | | | |
| | | | |
| Thrifts & Mortgage Finance: 2.23% | | | | | | | | | | | | | | | | |
Essent Group Limited † | | | | | | | | | | | 25,998 | | | | 1,150,412 | |
First Defiance Financial Corporation | | | | | | | | | | | 25,808 | | | | 777,079 | |
MGIC Investment Corporation † | | | | | | | | | | | 81,642 | | | | 1,086,655 | |
Radian Group Incorporated | | | | | | | | | | | 28,416 | | | | 587,359 | |
| | | | |
| | | | | | | | | | | | | | | 3,601,505 | |
| | | | | | | | | | | | | | | | |
| | | | |
Health Care: 17.56% | | | | | | | | | | | | | | | | |
| | | | |
| Biotechnology: 5.93% | | | | | | | | | | | | | | | | |
Amicus Therapeutics Incorporated † | | | | | | | | | | | 31,242 | | | | 377,716 | |
Arena Pharmaceuticals Incorporated † | | | | | | | | | | | 7,926 | | | | 364,755 | |
Array BioPharma Incorporated † | | | | | | | | | | | 39,897 | | | | 606,434 | |
Concert Pharmaceuticals Incorporated † | | | | | | | | | | | 31,393 | | | | 465,872 | |
Cytomx Therapeutics Incorporated † | | | | | | | | | | | 23,168 | | | | 428,608 | |
Emergent BioSolutions Incorporated † | | | | | | | | | | | 9,229 | | | | 607,545 | |
Exelixis Incorporated † | | | | | | | | | | | 20,882 | | | | 370,029 | |
Fibrogen Incorporated † | | | | | | | | | | | 13,107 | | | | 796,250 | |
Halozyme Therapeutics Incorporated † | | | | | | | | | | | 23,907 | | | | 434,390 | |
Heron Therapeutics Incorporated † | | | | | | | | | | | 13,656 | | | | 432,212 | |
Immunogen Incorporated † | | | | | | | | | | | 54,010 | | | | 511,475 | |
Immunomedics Incorporated †« | | | | | | | | | | | 22,997 | | | | 479,028 | |
Intercept Pharmaceuticals Incorporated † | | | | | | | | | | | 1,933 | | | | 244,254 | |
Ligand Pharmaceuticals Incorporated † | | | | | | | | | | | 3,585 | | | | 984,047 | |
Regenxbio Incorporated † | | | | | | | | | | | 7,978 | | | | 602,339 | |
Sangamo Biosciences Incorporated †« | | | | | | | | | | | 22,534 | | | | 381,951 | |
Spectrum Pharmaceuticals Incorporated † | | | | | | | | | | | 27,004 | | | | 453,667 | |
Vanda Pharmaceuticals Incorporated † | | | | | | | | | | | 21,046 | | | | 483,006 | |
Vericel Corporation † | | | | | | | | | | | 38,377 | | | | 543,035 | |
| | | | |
| | | | | | | | | | | | | | | 9,566,613 | |
| | | | | | | | | | | | | | | | |
| | | | |
| Health Care Equipment & Supplies: 3.51% | | | | | | | | | | | | | | | | |
Globus Medical Incorporated Class A † | | | | | | | | | | | 12,961 | | | | 735,666 | |
Haemonetics Corporation † | | | | | | | | | | | 4,714 | | | | 540,130 | |
ICU Medical Incorporated † | | | | | | | | | | | 2,434 | | | | 688,214 | |
Inogen Incorporated † | | | | | | | | | | | 3,694 | | | | 901,779 | |
Merit Medical Systems Incorporated † | | | | | | | | | | | 14,200 | | | | 872,590 | |
Novocure Limited † | | | | | | | | | | | 20,255 | | | | 1,061,362 | |
Orthofix Medical Incorporated † | | | | | | | | | | | 14,910 | | | | 861,947 | |
| | | | |
| | | | | | | | | | | | | | | 5,661,688 | |
| | | | | | | | | | | | | | | | |
The accompanying notes are an integral part of these financial statements.
| | | | | | |
| Portfolio of investments—September 30, 2018 (unaudited) | | Wells Fargo Disciplined Small Cap Fund | | | 13 | |
| | | | | | | | | | | | | | | | |
| Security name | | | | | | | | Shares | | | Value | |
| | | | |
| Health Care Providers & Services: 4.19% | | | | | | | | | | | | | | | | |
Amedisys Incorporated † | | | | | | | | | | | 4,753 | | | $ | 593,935 | |
Biotelemetry Incorporated † | | | | | | | | | | | 12,293 | | | | 792,284 | |
Centene Corporation † | | | | | | | | | | | 5,418 | | | | 784,418 | |
Encompass Health Corporation | | | | | | | | | | | 11,190 | | | | 872,261 | |
Ensign Group Incorporated | | | | | | | | | | | 16,515 | | | | 626,249 | |
LHC Group Incorporated † | | | | | | | | | | | 11,827 | | | | 1,218,063 | |
Magellan Health Services Incorporated † | | | | | | | | | | | 4,888 | | | | 352,180 | |
R1 RCM Incorporated † | | | | | | | | | | | 76,022 | | | | 772,384 | |
Select Medical Holdings Corporation † | | | | | | | | | | | 18,229 | | | | 335,414 | |
Tivity Health Incorporated † | | | | | | | | | | | 12,772 | | | | 410,620 | |
| | | | |
| | | | | | | | | | | | | | | 6,757,808 | |
| | | | | | | | | | | | | | | | |
| | | | |
| Health Care Technology: 0.25% | | | | | | | | | | | | | | | | |
Omnicell Incorporated † | | | | | | | | | | | 5,711 | | | | 410,621 | |
| | | | | | | | | | | | | | | | |
| | | | |
| Life Sciences Tools & Services: 1.17% | | | | | | | | | | | | | | | | |
Medpace Holdings Incorporated † | | | | | | | | | | | 15,965 | | | | 956,463 | |
PRA Health Sciences Incorporated † | | | | | | | | | | | 8,457 | | | | 931,877 | |
| | | | |
| | | | | | | | | | | | | | | 1,888,340 | |
| | | | | | | | | | | | | | | | |
| | | | |
| Pharmaceuticals: 2.51% | | | | | | | | | | | | | | | | |
ANI Pharmaceuticals Incorporated † | | | | | | | | | | | 7,174 | | | | 405,618 | |
Catalent Incorporated † | | | | | | | | | | | 15,849 | | | | 721,922 | |
Corcept Therapeutics Incorporated †« | | | | | | | | | | | 21,171 | | | | 296,817 | |
Horizon Pharma plc † | | | | | | | | | | | 57,381 | | | | 1,123,520 | |
Intersect ENT Incorporated † | | | | | | | | | | | 15,229 | | | | 437,834 | |
Supernus Pharmaceuticals Incorporated † | | | | | | | | | | | 21,251 | | | | 1,069,988 | |
| | | | |
| | | | | | | | | | | | | | | 4,055,699 | |
| | | | | | | | | | | | | | | | |
| | | | |
Industrials: 15.32% | | | | | | | | | | | | | | | | |
| | | | |
| Air Freight & Logistics: 0.15% | | | | | | | | | | | | | | | | |
XPO Logistics Incorporated † | | | | | | | | | | | 2,106 | | | | 240,442 | |
| | | | | | | | | | | | | | | | |
| | | | |
| Airlines: 0.39% | | | | | | | | | | | | | | | | |
SkyWest Incorporated | | | | | | | | | | | 10,621 | | | | 625,577 | |
| | | | | | | | | | | | | | | | |
| | | | |
| Building Products: 0.89% | | | | | | | | | | | | | | | | |
Builders FirstSource Incorporated † | | | | | | | | | | | 26,972 | | | | 395,949 | |
NCI Building Systems Incorporated † | | | | | | | | | | | 29,689 | | | | 449,788 | |
Patrick Industries Incorporated † | | | | | | | | | | | 10,036 | | | | 594,131 | |
| | | | |
| | | | | | | | | | | | | | | 1,439,868 | |
| | | | | | | | | | | | | | | | |
| | | | |
| Commercial Services & Supplies: 2.41% | | | | | | | | | | | | | | | | |
ACCO Brands Corporation | | | | | | | | | | | 71,083 | | | | 803,238 | |
Deluxe Corporation | | | | | | | | | | | 5,437 | | | | 309,583 | |
Knoll Incorporated | | | | | | | | | | | 25,049 | | | | 587,399 | |
McGrath RentCorp | | | | | | | | | | | 13,344 | | | | 726,848 | |
Tetra Tech Incorporated | | | | | | | | | | | 17,293 | | | | 1,181,112 | |
UniFirst Corporation | | | | | | | | | | | 1,640 | | | | 284,786 | |
| | | | |
| | | | | | | | | | | | | | | 3,892,966 | |
| | | | | | | | | | | | | | | | |
The accompanying notes are an integral part of these financial statements.
| | | | |
| 14 | | Wells Fargo Disciplined Small Cap Fund | | Portfolio of investments—September 30, 2018 (unaudited) |
| | | | | | | | | | | | | | | | |
| Security name | | | | | | | | Shares | | | Value | |
| | | | |
| Construction & Engineering: 2.37% | | | | | | | | | | | | | | | | |
Ameresco Incorporated Class A † | | | | | | | | | | | 29,081 | | | $ | 396,956 | |
EMCOR Group Incorporated | | | | | | | | | | | 14,499 | | | | 1,089,020 | |
MasTec Incorporated † | | | | | | | | | | | 21,792 | | | | 973,013 | |
Primoris Services Corporation | | | | | | | | | | | 26,033 | | | | 646,139 | |
Sterling Construction Company Incorporated † | | | | | | | | | | | 36,889 | | | | 528,250 | |
Tutor Perini Corporation † | | | | | | | | | | | 10,502 | | | | 197,438 | |
| | | | |
| | | | | | | | | | | | | | | 3,830,816 | |
| | | | | | | | | | | | | | | | |
| | | | |
| Electrical Equipment: 1.39% | | | | | | | | | | | | | | | | |
Atkore International Incorporated † | | | | | | | | | | | 35,393 | | | | 938,976 | |
EnerSys | | | | | | | | | | | 14,894 | | | | 1,297,714 | |
| | | | |
| | | | | | | | | | | | | | | 2,236,690 | |
| | | | | | | | | | | | | | | | |
| | | | |
| Electronic Equipment, Instruments & Components: 0.29% | | | | | | | | | | | | | | | | |
ScanSource Incorporated † | | | | | | | | | | | 11,460 | | | | 457,254 | |
| | | | | | | | | | | | | | | | |
| | | | |
| Machinery: 3.29% | | | | | | | | | | | | | | | | |
Barnes Group Incorporated | | | | | | | | | | | 16,576 | | | | 1,177,393 | |
Global Brass & Copper Holdings Incorporated | | | | | | | | | | | 29,335 | | | | 1,082,462 | |
Kadant Incorporated | | | | | | | | | | | 5,901 | | | | 636,423 | |
Kennametal Incorporated | | | | | | | | | | | 16,584 | | | | 722,399 | |
Lydall Incorporated † | | | | | | | | | | | 3,537 | | | | 152,445 | |
Meritor Incorporated † | | | | | | | | | | | 43,751 | | | | 847,019 | |
Park Ohio Holdings Corporation | | | | | | | | | | | 18,110 | | | | 694,519 | |
| | | | |
| | | | | | | | | | | | | | | 5,312,660 | |
| | | | | | | | | | | | | | | | |
| | | | |
| Professional Services: 2.01% | | | | | | | | | | | | | | | | |
CBIZ Incorporated † | | | | | | | | | | | 14,328 | | | | 339,574 | |
Insperity Incorporated | | | | | | | | | | | 11,872 | | | | 1,400,302 | |
Korn/Ferry International | | | | | | | | | | | 20,705 | | | | 1,019,509 | |
TriNet Group Incorporated † | | | | | | | | | | | 8,677 | | | | 488,689 | |
| | | | |
| | | | | | | | | | | | | | | 3,248,074 | |
| | | | | | | | | | | | | | | | |
| | | | |
| Road & Rail: 0.93% | | | | | | | | | | | | | | | | |
Covenant Transport Incorporated Class A † | | | | | | | | | | | 29,248 | | | | 849,947 | |
USA Truck Incorporated † | | | | | | | | | | | 24,342 | | | | 492,439 | |
YRC Worldwide Incorporated † | | | | | | | | | | | 17,161 | | | | 154,106 | |
| | | | |
| | | | | | | | | | | | | | | 1,496,492 | |
| | | | | | | | | | | | | | | | |
| | | | |
| Trading Companies & Distributors: 1.20% | | | | | | | | | | | | | | | | |
Applied Industrial Technologies Incorporated | | | | | | | | | | | 10,605 | | | | 829,841 | |
Rush Enterprises Incorporated | | | | | | | | | | | 9,720 | | | | 382,093 | |
Triton International Limited | | | | | | | | | | | 21,936 | | | | 729,811 | |
| | | | |
| | | | | | | | | | | | | | | 1,941,745 | |
| | | | | | | | | | | | | | | | |
| | | | |
Information Technology: 13.94% | | | | | | | | | | | | | | | | |
| | | | |
| Communications Equipment: 0.62% | | | | | | | | | | | | | | | | |
Ciena Corporation † | | | | | | | | | | | 31,776 | | | | 992,682 | |
| | | | | | | | | | | | | | | | |
The accompanying notes are an integral part of these financial statements.
| | | | | | |
| Portfolio of investments—September 30, 2018 (unaudited) | | Wells Fargo Disciplined Small Cap Fund | | | 15 | |
| | | | | | | | | | | | | | | | |
| Security name | | | | | | | | Shares | | | Value | |
| | | | |
| Electronic Equipment, Instruments & Components: 3.32% | | | | | | | | | | | | | | | | |
Control4 Corporation † | | | | | | | | | | | 11,123 | | | $ | 381,853 | |
Electro Scientific Industries Incorporated † | | | | | | | | | | | 31,001 | | | | 540,967 | |
Fabrinet † | | | | | | | | | | | 10,100 | | | | 467,226 | |
Insight Enterprises Incorporated † | | | | | | | | | | | 19,213 | | | | 1,039,231 | |
Kemet Corporation † | | | | | | | | | | | 25,644 | | | | 475,696 | |
Plexus Corporation † | | | | | | | | | | | 5,032 | | | | 294,422 | |
Synnex Corporation | | | | | | | | | | | 6,601 | | | | 559,105 | |
TTM Technologies Incorporated † | | | | | | | | | | | 50,072 | | | | 796,646 | |
Vishay Precision Group † | | | | | | | | | | | 21,374 | | | | 799,388 | |
| | | | |
| | | | | | | | | | | | | | | 5,354,534 | |
| | | | | | | | | | | | | | | | |
| | | | |
| IT Services: 4.15% | | | | | | | | | | | | | | | | |
CACI International Incorporated Class A † | | | | | | | | | | | 3,209 | | | | 590,937 | |
CSG Systems International Incorporated | | | | | | | | | | | 12,331 | | | | 494,966 | |
EPAM Systems Incorporated † | | | | | | | | | | | 6,498 | | | | 894,775 | |
EVERTEC Incorporated | | | | | | | | | | | 25,367 | | | | 611,345 | |
Exlservice Holdings Incorporated † | | | | | | | | | | | 12,309 | | | | 814,856 | |
Hackett Group Incorporated | | | | | | | | | | | 25,367 | | | | 511,145 | |
ManTech International Corporation Class A | | | | | | | | | | | 5,708 | | | | 361,316 | |
Perficient Incorporated † | | | | | | | | | | | 20,657 | | | | 550,509 | |
Sykes Enterprises Incorporated † | | | | | | | | | | | 2,866 | | | | 87,384 | |
Travelport Worldwide Limited | | | | | | | | | | | 35,644 | | | | 601,314 | |
Unisys Corporation †« | | | | | | | | | | | 26,634 | | | | 543,334 | |
Virtusa Corporation † | | | | | | | | | | | 11,904 | | | | 639,364 | |
| | | | |
| | | | | | | | | | | | | | | 6,701,245 | |
| | | | | | | | | | | | | | | | |
| | | | |
| Semiconductors & Semiconductor Equipment: 2.67% | | | | | | | | | | | | | | | | |
Diodes Incorporated † | | | | | | | | | | | 17,188 | | | | 572,189 | |
Entegris Incorporated | | | | | | | | | | | 37,242 | | | | 1,078,156 | |
Ichor Holdings Limited †« | | | | | | | | | | | 19,008 | | | | 388,143 | |
MKS Instruments Incorporated | | | | | | | | | | | 5,855 | | | | 469,278 | |
Rudolph Technologies Incorporated † | | | | | | | | | | | 13,791 | | | | 337,190 | |
Smart Global Holdings Incorporated † | | | | | | | | | | | 20,759 | | | | 596,614 | |
Ultra Clean Holdings Incorporated † | | | | | | | | | | | 27,059 | | | | 339,590 | |
Xcerra Corporation † | | | | | | | | | | | 37,397 | | | | 533,655 | |
| | | | |
| | | | | | | | | | | | | | | 4,314,815 | |
| | | | | | | | | | | | | | | | |
| | | | |
| Software: 2.85% | | | | | | | | | | | | | | | | |
Amber Road Incorporated † | | | | | | | | | | | 24,648 | | | | 237,114 | |
American Software Incorporated Class A | | | | | | | | | | | 36,969 | | | | 448,434 | |
J2 Global Incorporated | | | | | | | | | | | 13,962 | | | | 1,156,752 | |
New Relic Incorporated † | | | | | | | | | | | 4,985 | | | | 469,737 | |
Qualys Incorporated † | | | | | | | | | | | 10,550 | | | | 940,005 | |
Upland Software Incorporated † | | | | | | | | | | | 8,782 | | | | 283,746 | |
Verint Systems Incorporated † | | | | | | | | | | | 21,364 | | | | 1,070,336 | |
| | | | |
| | | | | | | | | | | | | | | 4,606,124 | |
| | | | | | | | | | | | | | | | |
| | | | |
| Technology Hardware, Storage & Peripherals: 0.33% | | | | | | | | | | | | | | | | |
Immersion Corporation † | | | | | | | | | | | 50,087 | | | | 529,420 | |
| | | | | | | | | | | | | | | | |
The accompanying notes are an integral part of these financial statements.
| | | | |
| 16 | | Wells Fargo Disciplined Small Cap Fund | | Portfolio of investments—September 30, 2018 (unaudited) |
| | | | | | | | | | | | | | | | |
| Security name | | | | | | | | Shares | | | Value | |
| | | | |
Materials: 4.84% | | | | | | | | | | | | | | | | |
| | | | |
| Chemicals: 2.32% | | | | | | | | | | | | | | | | |
Ferro Corporation † | | | | | | | | | | | 16,660 | | | $ | 386,845 | |
Innospec Incorporated | | | | | | | | | | | 3,904 | | | | 299,632 | |
Kooper Holdings Incorporated † | | | | | | | | | | | 10,438 | | | | 325,144 | |
Kraton Performance Polymers Incorporated † | | | | | | | | | | | 10,055 | | | | 474,093 | |
PolyOne Corporation | | | | | | | | | | | 23,348 | | | | 1,020,775 | |
Trinseo SA | | | | | | | | | | | 15,798 | | | | 1,236,983 | |
| | | | |
| | | | | | | | | | | | | | | 3,743,472 | |
| | | | | | | | | | | | | | | | |
| | | | |
| Containers & Packaging: 0.80% | | | | | | | | | | | | | | | | |
Berry Global Group Incorporated † | | | | | | | | | | | 11,563 | | | | 559,534 | |
Greif Incorporated Class A | | | | | | | | | | | 13,705 | | | | 735,410 | |
| | | | |
| | | | | | | | | | | | | | | 1,294,944 | |
| | | | | | | | | | | | | | | | |
| | | | |
| Metals & Mining: 0.30% | | | | | | | | | | | | | | | | |
Commercial Metals Company | | | | | | | | | | | 23,676 | | | | 485,832 | |
| | | | | | | | | | | | | | | | |
| | | | |
| Paper & Forest Products: 1.42% | | | | | | | | | | | | | | | | |
Boise Cascade Company | | | | | | | | | | | 10,457 | | | | 384,818 | |
Louisiana-Pacific Corporation | | | | | | | | | | | 25,284 | | | | 669,773 | |
Schweitzer-Mauduit International Incorporated | | | | | | | | | | | 10,454 | | | | 400,493 | |
Verso Corporation Class A † | | | | | | | | | | | 24,893 | | | | 838,147 | |
| | | | |
| | | | | | | | | | | | | | | 2,293,231 | |
| | | | | | | | | | | | | | | | |
| | | | |
Real Estate: 6.13% | | | | | | | | | | | | | | | | |
| | | | |
| Equity REITs: 6.13% | | | | | | | | | | | | | | | | |
Ashford Hospitality Trust Incorporated | | | | | | | | | | | 99,283 | | | | 634,418 | |
CoreSite Realty Corporation | | | | | | | | | | | 6,717 | | | | 746,527 | |
CyrusOne Incorporated | | | | | | | | | | | 15,613 | | | | 989,864 | |
Digital Realty Trust Incorporated | | | | | | | | | | | 8,701 | | | | 978,688 | |
Hudson Pacific Properties Incorporated | | | | | | | | | | | 11,648 | | | | 381,123 | |
Nexpoint Residential | | | | | | | | | | | 29,782 | | | | 988,762 | |
Preferred Apartment Communities Incorporated Series A | | | | | | | | | | | 54,706 | | | | 961,731 | |
Ryman Hospitality Properties Incorporated | | | | | | | | | | | 14,676 | | | | 1,264,631 | |
Sabra Health Care REIT Incorporated | | | | | | | | | | | 28,184 | | | | 651,614 | |
STAG Industrial Incorporated | | | | | | | | | | | 24,528 | | | | 674,520 | |
The Geo Group Incorporated | | | | | | | | | | | 30,525 | | | | 768,009 | |
Xenia Hotels & Resorts Incorporated | | | | | | | | | | | 36,149 | | | | 856,731 | |
| | | | |
| | | | | | | | | | | | | | | 9,896,618 | |
| | | | | | | | | | | | | | | | |
| | | | |
Utilities: 2.61% | | | | | | | | | | | | | | | | |
| | | | |
| Electric Utilities: 1.98% | | | | | | | | | | | | | | | | |
IDACORP Incorporated | | | | | | | | | | | 7,807 | | | | 774,689 | |
Otter Tail Corporation | | | | | | | | | | | 15,975 | | | | 765,203 | |
Portland General Electric Company | | | | | | | | | | | 28,223 | | | | 1,287,251 | |
Spark Energy Incorporated Class A | | | | | | | | | | | 46,007 | | | | 379,558 | |
| | | | |
| | | | | | | | | | | | | | | 3,206,701 | |
| | | | | | | | | | | | | | | | |
The accompanying notes are an integral part of these financial statements.
| | | | | | |
| Portfolio of investments—September 30, 2018 (unaudited) | | Wells Fargo Disciplined Small Cap Fund | | | 17 | |
| | | | | | | | | | | | | | | | |
| Security name | | | | | | | | Shares | | | Value | |
| | | | |
| Independent Power & Renewable Electricity Producers: 0.63% | | | | | | | | | | | | | | | | |
Clearway Energy Incorporated | | | | | | | | | | | 53,281 | | | $ | 1,014,470 | |
| | | | | | | | | | | | | | | | |
| | | | |
Total Common Stocks (Cost $159,659,010) | | | | | | | | | | | | | | | 164,115,487 | |
| | | | | | | | | | | | | | | | |
| | | | |
Exchange-Traded Funds: 0.84% | | | | | | | | | | | | | | | | |
iShares Russell 2000 Index ETF | | | | | | | | | | | 8,053 | | | | 1,357,333 | |
| | | | | | | | | | | | | | | | |
| | | | |
Total Exchange-Traded Funds (Cost $1,327,566) | | | | | | | | | | | | | | | 1,357,333 | |
| | | | | | | | | | | | | | | | |
| | | | |
| | | Yield | | | | | | | | | | |
| Short-Term Investments: 2.88% | | | | | | | | | | | | | | | | |
| | | | |
| Investment Companies: 2.88% | | | | | | | | | | | | | | | | |
Securities Lending Cash Investment LLC (l)(r)(u) | | | 2.17 | % | | | | | | | 4,031,036 | | | | 4,031,440 | |
Wells Fargo Government Money Market Fund Select Class (l)(u) | | | 1.99 | | | | | | | | 612,896 | | | | 612,896 | |
| | | | |
Total Short-Term Investments (Cost $4,644,336) | | | | | | | | | | | | | | | 4,644,336 | |
| | | | | | | | | | | | | | | | |
| | | | | | | | |
| Total investments in securities (Cost $165,630,912) | | | 105.39 | % | | | 170,117,156 | |
Other assets and liabilities, net | | | (5.39 | ) | | | (8,696,955 | ) |
| | | | | | | | |
| Total net assets | | | 100.00 | % | | $ | 161,420,201 | |
| | | | | | | | |
| † | Non-income-earning security |
| « | All or a portion of this security is on loan. |
| (l) | The issuer of the security is an affiliated person of the Fund as defined in the Investment Company Act of 1940. |
| (r) | The investment is a non-registered investment company purchased with cash collateral received from securities on loan. |
| (u) | The rate represents the 7-day annualized yield at period end. |
Abbreviations:
| REIT | Real estate investment trust |
Investments in Affiliates
An affiliated investment is an investment in which the Fund owns at least 5% of the outstanding voting shares of the issuer or as a result of other relationships, such as the Fund and the issuer having the same investment manager. Transactions with issuers that were either affiliated persons of the Fund at the beginning of the period or the end of the period were as follows:
| | | | | | | | | | | | | | | | | | | | | | | | | | | | | | | | | | | | |
| | | Shares,
beginning of
period | | | Shares
purchased | | | Shares
sold | | | Shares,
end of
period | | | Net
realized
gains
(losses) | | | Net
change in
unrealized
gains
(losses) | | | Income
from
affiliated
securities | | | Value,
end
of period | | | % of
net
assets | |
Short-Term Investments | | | | | | | | | | | | | | | | | | | | | | | | | | | | | | | | | | | | |
Investment Companies | | | | | | | | | | | | | | | | | | | | | | | | | | | | | | | | | | | | |
Securities Lending Cash Investment LLC | | | 13,754,682 | | | | 42,419,809 | | | | 52,143,455 | | | | 4,031,036 | | | $ | (79 | ) | | $ | 0 | | | $ | 33,397 | | | $ | 4,031,440 | | | | | |
Wells Fargo Government Money Market Fund Select Class | | | 14,793,357 | | | | 30,574,783 | | | | 44,755,244 | | | | 612,896 | | | | 0 | | | | 0 | | | | 54,889 | | | | 612,896 | | | | | |
| | | | | | | | | | | | | | | | | | | | | | | | | | | | | | | | | | | | |
| | | | | | | | | | | | | | | | | | $ | (79 | ) | | $ | 0 | | | $ | 88,286 | | | $ | 4,644,336 | | | | 2.88 | % |
| | | | | | | | | | | | | | | | | | | | | | | | | | | | | | | | | | | | |
The accompanying notes are an integral part of these financial statements.
| | | | |
| 18 | | Wells Fargo Disciplined Small Cap Fund | | Statement of assets and liabilities—September 30, 2018 (unaudited) |
| | | | |
| | | | |
| |
Assets | | | | |
Investments in unaffiliated securities (including $3,092,715 of securities loaned), at value (cost $160,986,576) | | $ | 165,472,820 | |
Investments in affiliated securities, at value (cost $4,644,336) | | | 4,644,336 | |
Receivable for investments sold | | | 11,784,100 | |
Receivable for Fund shares sold | | | 80,249 | |
Receivable for dividends | | | 144,949 | |
Receivable for securities lending income | | | 2,293 | |
Prepaid expenses and other assets | | | 44,581 | |
| | | | |
Total assets | | | 182,173,328 | |
| | | | |
| |
Liabilities | | | | |
Payable for investments purchased | | | 11,728,865 | |
Payable for Fund shares redeemed | | | 4,876,326 | |
Payable upon receipt of securities loaned | | | 4,030,149 | |
Management fee payable | | | 50,919 | |
Administration fees payable | | | 17,432 | |
Trustees’ fees and expenses payable | | | 1,673 | |
Accrued expenses and other liabilities | | | 47,763 | |
| | | | |
Total liabilities | | | 20,753,127 | |
| | | | |
Total net assets | | $ | 161,420,201 | |
| | | | |
| |
NET ASSETS CONSIST OF | | | | |
Paid-in capital | | $ | 81,050,699 | |
Total distributable earnings | | | 80,369,502 | |
| | | | |
Total net assets | | $ | 161,420,201 | |
| | | | |
| |
COMPUTATION OF NET ASSET VALUE AND OFFERING PRICE PER SHARE1 | | | | |
Net assets – Class A | | $ | 26,060 | |
Shares outstanding – Class A1 | | | 1,092 | |
Net asset value per share – Class A | | | $23.86 | |
Maximum offering price per share – Class A2 | | | $25.32 | |
Net assets – Class R6 | | $ | 9,720,020 | |
Shares outstanding – Class R61 | | | 404,633 | |
Net asset value per share – Class R6 | | | $24.02 | |
Net assets – Administrator Class | | $ | 82,633,528 | |
Shares outstanding – Administrator Class1 | | | 3,461,957 | |
Net asset value per share – Administrator Class | | | $23.87 | |
Net assets – Institutional Class | | $ | 69,040,593 | |
Shares outstanding – Institutional Class1 | | | 2,878,537 | |
Net asset value per share – Institutional Class | | | $23.98 | |
| 1 | The Fund has an unlimited number of authorized shares. |
| 2 | Maximum offering price is computed as 100/94.25 of net asset value. On investments of $50,000 or more, the offering price is reduced. |
The accompanying notes are an integral part of these financial statements.
| | | | | | |
| Statement of operations—six months ended September 30, 2018 (unaudited) | | Wells Fargo Disciplined Small Cap Fund | | | 19 | |
| | | | |
| | | | |
| |
Investment income | | | | |
Dividends (net of foreign withholding taxes of $1,600) | | $ | 989,457 | |
Income from affiliated securities | | | 88,286 | |
| | | | |
Total investment income | | | 1,077,743 | |
| | | | |
| |
Expenses | | | | |
Management fee | | | 602,222 | |
Administration fees | | | | |
Class A | | | 9 | 1 |
Class R6 | | | 2,937 | |
Administrator Class | | | 58,859 | |
Institutional Class | | | 45,484 | |
Shareholder servicing fees | | | | |
Class A | | | 11 | 1 |
Administrator Class | | | 112,740 | |
Custody and accounting fees | | | 9,508 | |
Professional fees | | | 23,930 | |
Registration fees | | | 40,255 | |
Shareholder report expenses | | | 20,974 | |
Trustees’ fees and expenses | | | 11,822 | |
Other fees and expenses | | | 6,886 | |
| | | | |
Total expenses | | | 935,637 | |
Less: Fee waivers and/or expense reimbursements | | | (140,039 | ) |
| | | | |
Net expenses | | | 795,598 | |
| | | | |
Net investment income | | | 282,145 | |
| | | | |
| |
REALIZED AND UNREALIZED GAINS (LOSSES) ON INVESTMENTS | | | | |
| |
Net realized gains (losses) on: | | | | |
Unaffiliated securities | | | 42,164,176 | |
Affiliated securities | | | (79 | ) |
| | | | |
Net realized gains on investments | | | 42,164,097 | |
Net change in unrealized gains (losses) on investments | | | (31,599,934 | ) |
| | | | |
Net realized and unrealized gains (losses) on investments | | | 10,564,163 | |
| | | | |
Net increase in net assets resulting from operations | | $ | 10,846,308 | |
| | | | |
| 1 | For the period from July 31, 2018 (commencement of operations) to September 30, 2018 |
The accompanying notes are an integral part of these financial statements.
| | | | |
| 20 | | Wells Fargo Disciplined Small Cap Fund | | Statement of changes in net assets |
| | | | | | | | | | | | | | | | |
| | | Six months ended
September 30, 2018
(unaudited) | | | Year ended
March 31, 20181 | |
| | | | |
Operations | | | | | | | | | | | | | | | | |
Net investment income | | | | | | $ | 282,145 | | | | | | | $ | 502,956 | |
Net realized gains on investments | | | | | | | 42,164,097 | | | | | | | | 54,267,385 | |
Net change in unrealized gains (losses) on investments | | | | | | | (31,599,934 | ) | | | | | | | (28,401,505 | ) |
| | | | |
Net increase in net assets resulting from operations | | | | | | | 10,846,308 | | | | | | | | 26,368,836 | |
| | | | |
| | | | |
Distributions to shareholders | | | | | | | | | | | | | | | | |
Class R6 | | | | | | | 0 | | | | | | | | (265,386 | ) |
Administrator Class | | | | | | | 0 | | | | | | | | (27,391,629 | ) |
Institutional Class | | | | | | | 0 | | | | | | | | (10,224,030 | ) |
| | | | |
Total distributions to shareholders | | | | | | | 0 | | | | | | | | (37,881,045 | ) |
| | | | |
| | | | |
Capital share transactions | | | Shares | | | | | | | | Shares | | | | | |
Proceeds from shares sold | | | | | | | | | | | | | | | | |
Class A | | | 1,092 | 2 | | | 25,900 | 2 | | | N/A | | | | N/A | |
Class R6 | | | 163,876 | | | | 3,793,304 | | | | 1,016,892 | | | | 23,696,710 | |
Administrator Class | | | 151,341 | | | | 3,583,399 | | | | 1,003,396 | | | | 24,583,627 | |
Institutional Class | | | 261,250 | | | | 6,210,650 | | | | 1,609,570 | | | | 39,079,106 | |
| | | | |
| | | | | | | 13,613,253 | | | | | | | | 87,359,443 | |
| | | | |
Reinvestment of distributions | | | | | | | | | | | | | | | | |
Class R6 | | | 0 | | | | 0 | | | | 11,427 | | | | 261,336 | |
Administrator Class | | | 0 | | | | 0 | | | | 1,202,741 | | | | 27,387,299 | |
Institutional Class | | | 0 | | | | 0 | | | | 386,831 | | | | 8,839,448 | |
| | | | |
| | | | | | | 0 | | | | | | | | 36,488,083 | |
| | | | |
Payment for shares redeemed | | | | | | | | | | | | | | | | |
Class R6 | | | (814,089 | ) | | | (19,341,873 | ) | | | (41,737 | ) | | | (978,591 | ) |
Administrator Class | | | (751,794 | ) | | | (17,783,045 | ) | | | (7,857,302 | ) | | | (184,787,406 | ) |
Institutional Class | | | (381,829 | ) | | | (9,088,816 | ) | | | (1,280,303 | ) | | | (30,434,668 | ) |
| | | | |
| | | | | | | (46,213,734 | ) | | | | | | | (216,200,665 | ) |
| | | | |
Net decrease in net assets resulting from capital share transactions | | | | | | | (32,600,481 | ) | | | | | | | (92,353,139 | ) |
| | | | |
Total decrease in net assets | | | | | | | (21,754,173 | ) | | | | | | | (103,865,348 | ) |
| | | | |
| | | | |
Net assets | | | | | | | | | | | | | | | | |
Beginning of period | | | | | | | 183,174,374 | | | | | | | | 287,039,722 | |
| | | | |
End of period | | | | | | $ | 161,420,201 | | | | | | | $ | 183,174,374 | |
| | | | |
| 1 | Effective for all filings after November 4, 2018, the SEC prospectively eliminated the requirements to parenthetically disclose undistributed net investment income at the end of the period and to disaggregate distributions to shareholders between distributions from net investment income and distributions from realized gains. Undistributed net investment income at March 31, 2018 was $168,078. The disaggregated distributions information for the year ended March 31, 2018 is included in Note 7, Distributions to Shareholders, in the notes to the financial statements. |
| 2 | For the period from July 31, 2018 (commencement of class operations) to September 30, 2018 |
The accompanying notes are an integral part of these financial statements.
| | | | | | |
| Financial highlights | | Wells Fargo Disciplined Small Cap Fund | | | 21 | |
(For a share outstanding throughout the period)
| | | | |
| CLASS A | | Period ended
September 30, 20181 | |
Net asset value, beginning of period | | | $23.70 | |
Net investment income | | | 0.03 | |
Net realized and unrealized gains (losses) on investments | | | 0.13 | |
| | | | |
Total from investment operations | | | 0.16 | |
Net asset value, end of period | | | $23.86 | |
Total return2 | | | 0.68 | % |
Ratios to average net assets (annualized) | | | | |
Gross expenses | | | 1.08 | % |
Net expenses | | | 0.92 | % |
Net investment income | | | 0.68 | % |
Supplemental data | | | | |
Portfolio turnover rate | | | 122 | % |
Net assets, end of period (000s omitted) | | | $26 | |
| 1 | For the period from July 31, 2018 (commencement of class operations) to September 30, 2018 |
| 2 | Total return calculations do not include any sales charges. Returns for periods of less than one year are not annualized. |
The accompanying notes are an integral part of these financial statements.
| | | | |
| 22 | | Wells Fargo Disciplined Small Cap Fund | | Financial highlights |
(For a share outstanding throughout each period)
| | | | | | | | | | | | |
| | | Six months ended
September 30, 2018 (unaudited) | | | Year ended March 31 | |
| CLASS R6 | | 2018 | | | 20171 | |
Net asset value, beginning of period | | | $22.63 | | | | $23.82 | | | | $22.43 | |
Net investment income | | | 0.11 | | | | 0.07 | | | | 0.14 | |
Net realized and unrealized gains (losses) on investments | | | 1.28 | | | | 2.08 | | | | 3.32 | |
| | | | | | | | | | | | |
Total from investment operations | | | 1.39 | | | | 2.15 | | | | 3.46 | |
Distributions to shareholders from | | | | | | | | | | | | |
Net investment income | | | 0.00 | | | | (0.06 | ) | | | (0.14 | ) |
Net realized gains | | | 0.00 | | | | (3.28 | ) | | | (1.93 | ) |
| | | | | | | | | | | | |
Total distributions to shareholders | | | 0.00 | | | | (3.34 | ) | | | (2.07 | ) |
Net asset value, end of period | | | $24.02 | | | | $22.63 | | | | $23.82 | |
Total return2 | | | 6.10 | % | | | 8.95 | % | | | 15.63 | % |
Ratios to average net assets (annualized) | | | | | | | | | | | | |
Gross expenses | | | 0.85 | % | | | 1.06 | % | | | 0.92 | % |
Net expenses | | | 0.69 | % | | | 0.85 | % | | | 0.85 | % |
Net investment income | | | 0.46 | % | | | 0.14 | % | | | 0.67 | % |
Supplemental data | | | | | | | | | | | | |
Portfolio turnover rate | | | 122 | % | | | 48 | % | | | 73 | % |
Net assets, end of period (000s omitted) | | | $9,720 | | | | $23,871 | | | | $1,626 | |
| 1 | For the period from October 31, 2016 (commencement of class operations) to March 31, 2017 |
| 2 | Returns for periods of less than one year are not annualized. |
The accompanying notes are an integral part of these financial statements.
| | | | | | |
| Financial highlights | | Wells Fargo Disciplined Small Cap Fund | | | 23 | |
(For a share outstanding throughout each period)
| | | | | | | | | | | | | | | | | | | | | | | | | | | | |
| | | Six months ended
September 30, 2018 (unaudited) | | | Year ended March 31 | | | Year ended October 31, 2013 | |
| ADMINISTRATOR CLASS | | 2018 | | | 2017 | | | 2016 | | | 2015 | | | 20141 | |
Net asset value, beginning of period | | | $22.53 | | | | $23.79 | | | | $21.15 | | | | $25.19 | | | | $37.93 | | | | $42.43 | | | | $34.45 | |
Net investment income | | | 0.03 | | | | 0.06 | | | | 0.08 | 2 | | | 0.06 | | | | 0.02 | | | | 0.02 | | | | 0.11 | |
Net realized and unrealized gains (losses) on investments | | | 1.31 | | | | 2.00 | | | | 4.56 | | | | (1.24 | ) | | | 3.13 | | | | 2.33 | | | | 10.48 | |
| | | | | | | | | | | | | | | | | | | | | | | | | | | | |
Total from investment operations | | | 1.34 | | | | 2.06 | | | | 4.64 | | | | (1.18 | ) | | | 3.15 | | | | 2.35 | | | | 10.59 | |
Distributions to shareholders from | | | | | | | | | | | | | | | | | | | | | | | | | | | | |
Net investment income | | | 0.00 | | | | (0.04 | ) | | | (0.07 | ) | | | (0.02 | ) | | | 0.00 | | | | (0.02 | ) | | | (0.08 | ) |
Net realized gains | | | 0.00 | | | | (3.28 | ) | | | (1.93 | ) | | | (2.84 | ) | | | (15.89 | ) | | | (6.83 | ) | | | (2.53 | ) |
| | | | | | | | | | | | | | | | | | | | | | | | | | | | |
Total distributions to shareholders | | | 0.00 | | | | (3.32 | ) | | | (2.00 | ) | | | (2.86 | ) | | | (15.89 | ) | | | (6.85 | ) | | | (2.61 | ) |
Net asset value, end of period | | | $23.87 | | | | $22.53 | | | | $23.79 | | | | $21.15 | | | | $25.19 | | | | $37.93 | | | | $42.43 | |
Total return3 | | | 5.95 | % | | | 8.52 | % | | | 22.13 | % | | | (4.39 | )% | | | 11.75 | % | | | 6.26 | % | | | 33.19 | % |
Ratios to average net assets (annualized) | | | | | | | | | | | | | | | | | | | | | | | | | | | | |
Gross expenses | | | 1.17 | % | | | 1.30 | % | | | 1.28 | % | | | 1.29 | % | | | 1.24 | % | | | 1.24 | % | | | 1.22 | % |
Net expenses | | | 1.02 | % | | | 1.20 | % | | | 1.20 | % | | | 1.20 | % | | | 1.20 | % | | | 1.20 | % | | | 1.20 | % |
Net investment income | | | 0.18 | % | | | 0.12 | % | | | 0.36 | % | | | 0.25 | % | | | 0.06 | % | | | 0.11 | % | | | 0.31 | % |
Supplemental data | | | | | | | | | | | | | | | | | | | | | | | | | | | | |
Portfolio turnover rate | | | 122 | % | | | 48 | % | | | 73 | % | | | 59 | % | | | 60 | % | | | 26 | % | | | 76 | % |
Net assets, end of period (000s omitted) | | | $82,634 | | | | $91,506 | | | | $231,039 | | | | $264,560 | | | | $306,628 | | | | $471,330 | | | | $705,671 | |
| 1 | For the five months ended March 31, 2014. The Fund changed its fiscal year end from October 31 to March 31, effective March 31, 2014. |
| 2 | Calculated based upon average shares outstanding |
| 3 | Returns for periods of less than one year are not annualized. |
The accompanying notes are an integral part of these financial statements.
| | | | |
| 24 | | Wells Fargo Disciplined Small Cap Fund | | Financial highlights |
(For a share outstanding throughout each period)
| | | | | | | | | | | | | | | | | | | | |
| | | Six months ended
September 30, 2018 (unaudited) | | | Year ended March 31 | |
| INSTITUTIONAL CLASS | | 2018 | | | 2017 | | | 2016 | | | 20151 | |
Net asset value, beginning of period | | | $22.61 | | | | $23.82 | | | | $21.18 | | | | $25.22 | | | | $39.04 | |
Net investment income | | | 0.05 | | | | 0.09 | | | | 0.09 | | | | 0.16 | 2 | | | 0.06 | |
Net realized and unrealized gains (losses) on investments | | | 1.32 | | | | 2.03 | | | | 4.61 | | | | (1.28 | ) | | | 2.01 | |
| | | | | | | | | | | | | | | | | | | | |
Total from investment operations | | | 1.37 | | | | 2.12 | | | | 4.70 | | | | (1.12 | ) | | | 2.07 | |
Distributions to shareholders from | | | | | | | | | | | | | | | | | | | | |
Net investment income | | | 0.00 | | | | (0.05 | ) | | | (0.13 | ) | | | (0.08 | ) | | | 0.00 | |
Net realized gains | | | 0.00 | | | | (3.28 | ) | | | (1.93 | ) | | | (2.84 | ) | | | (15.89 | ) |
| | | | | | | | | | | | | | | | | | | | |
Total distributions to shareholders | | | 0.00 | | | | (3.33 | ) | | | (2.06 | ) | | | (2.92 | ) | | | (15.89 | ) |
Net asset value, end of period | | | $23.98 | | | | $22.61 | | | | $23.82 | | | | $21.18 | | | | $25.22 | |
Total return3 | | | 6.06 | % | | | 8.81 | % | | | 22.43 | % | | | (4.12 | )% | | | 8.68 | % |
Ratios to average net assets (annualized) | | | | | | | | | | | | | | | | | | | | |
Gross expenses | | | 0.92 | % | | | 1.07 | % | | | 1.03 | % | | | 1.05 | % | | | 0.92 | % |
Net expenses | | | 0.76 | % | | | 0.95 | % | | | 0.95 | % | | | 0.95 | % | | | 0.92 | % |
Net investment income | | | 0.44 | % | | | 0.37 | % | | | 0.56 | % | | | 0.71 | % | | | 0.59 | % |
Supplemental data | | | | | | | | | | | | | | | | | | | | |
Portfolio turnover rate | | | 122 | % | | | 48 | % | | | 73 | % | | | 59 | % | | | 60 | % |
Net assets, end of period (000s omitted) | | | $69,041 | | | | $67,798 | | | | $54,375 | | | | $263 | | | | $11 | |
| 1 | For the period from October 31, 2014 (commencement of class operations) to March 31, 2015 |
| 2 | Calculated based upon average shares outstanding |
| 3 | Returns for periods of less than one year are not annualized. |
The accompanying notes are an integral part of these financial statements.
| | | | | | |
| Notes to financial statements (unaudited) | | Wells Fargo Disciplined Small Cap Fund | | | 25 | |
1. ORGANIZATION
Wells Fargo Funds Trust (the “Trust”), a Delaware statutory trust organized on March 10, 1999, is an open-end management investment company registered under the Investment Company Act of 1940, as amended (the “1940 Act”). As an investment company, the Trust follows the accounting and reporting guidance in Financial Accounting Standards Board (“FASB”) Accounting Standards Codification Topic 946, Financial Services – Investment Companies. These financial statements report on the Wells Fargo Disciplined Small Cap Fund (the “Fund”), (formerly, Wells Fargo Small Cap Opportunities Fund) which is a diversified series of the Trust.
2. SIGNIFICANT ACCOUNTING POLICIES
The following significant accounting policies, which are consistently followed in the preparation of the financial statements of the Fund, are in conformity with U.S. generally accepted accounting principles which require management to make estimates and assumptions that affect the reported amounts of assets and liabilities, disclosure of contingent assets and liabilities at the date of the financial statements, and the reported amounts of revenues and expenses during the reporting period. Actual results could differ from those estimates.
Securities valuation
All investments are valued each business day as of the close of regular trading on the New York Stock Exchange (generally 4 p.m. Eastern Time), although the Fund may deviate from this calculation time under unusual or unexpected circumstances.
Equity securities that are listed on a foreign or domestic exchange or market are valued at the official closing price or, if none, the last sales price. If no sale occurs on the principal exchange or market that day, a fair value price will be determined in accordance with the Fund’s Valuation Procedures.
Investments in registered open-end investment companies are valued at net asset value. Interests in non-registered investment companies that are redeemable at net asset value are fair valued normally at net asset value.
Investments which are not valued using any of the methods discussed above are valued at their fair value, as determined in good faith by the Board of Trustees of the Fund. The Board of Trustees has established a Valuation Committee comprised of the Trustees and has delegated to it the authority to take any actions regarding the valuation of portfolio securities that the Valuation Committee deems necessary or appropriate, including determining the fair value of portfolio securities, unless the determination has been delegated to the Wells Fargo Asset Management Pricing Committee at Wells Fargo Funds Management, LLC (“Funds Management”). The Board of Trustees retains the authority to make or ratify any valuation decisions or approve any changes to the Valuation Procedures as it deems appropriate. On a quarterly basis, the Board of Trustees receives reports on any valuation actions taken by the Valuation Committee or the Wells Fargo Asset Management Pricing Committee which may include items for ratification.
Foreign currency translation
The accounting records of the Fund are maintained in U.S. dollars. The values of other assets and liabilities denominated in foreign currencies are translated into U.S. dollars at rates provided by an independent foreign currency pricing source at a time each business day specified by the Wells Fargo Asset Management Pricing Committee. Purchases and sales of securities, and income and expenses are converted at the rate of exchange on the respective dates of such transactions. Net realized foreign exchange gains or losses arise from sales of foreign currencies, currency gains or losses realized between the trade and settlement dates on securities transactions, and the difference between the amounts of dividends, interest and foreign withholding taxes recorded and the U.S. dollar equivalent of the amounts actually paid or received. Net unrealized foreign exchange gains and losses arise from changes in the fair value of assets and liabilities other than investments in securities resulting from changes in exchange rates. The changes in net assets arising from changes in exchange rates of securities and the changes in net assets resulting from changes in market prices of securities are not separately presented. Such changes are included in net realized and unrealized gains or losses from investments.
Securities lending
The Fund may lend its securities from time to time in order to earn additional income in the form of fees or interest on securities received as collateral or the investment of any cash received as collateral. The Fund continues to receive interest or dividends on the securities loaned. The Fund receives collateral in the form of cash or securities with a value at least equal to the value of the securities on loan. The value of the loaned securities is determined at the close of each business day and any additional required collateral is delivered to the Fund on the next business day. In a securities lending transaction, the net asset value of the Fund will be affected by an increase or decrease in the value of the securities loaned
| | | | |
| 26 | | Wells Fargo Disciplined Small Cap Fund | | Notes to financial statements (unaudited) |
and by an increase or decrease in the value of the instrument in which collateral is invested. The amount of securities lending activity undertaken by the Fund fluctuates from time to time. In the event of default or bankruptcy by the borrower, the Fund may be prevented from recovering the loaned securities or gaining access to the collateral or may experience delays or costs in doing so. In addition, the investment of any cash collateral received may lose all or part of its value. The Fund has the right under the lending agreement to recover the securities from the borrower on demand.
The Fund lends its securities through an unaffiliated securities lending agent. Cash collateral received in connection with its securities lending transactions is invested in Securities Lending Cash Investments, LLC (the “Securities Lending Fund”). The Securities Lending Fund is exempt from registration under Section 3(c)(7) of the 1940 Act and is managed by Funds Management and is subadvised by Wells Capital Management Incorporated (“WellsCap”), an affiliate of Funds Management and an indirect wholly owned subsidiary of Wells Fargo & Company (“Wells Fargo”). Funds Management receives an advisory fee starting at 0.05% and declining to 0.01% as the average daily net assets of the Securities Lending Fund increase. All of the fees received by Funds Management are paid to WellsCap for its services as subadviser. The Securities Lending Fund seeks to provide a positive return compared to the daily Fed Funds Open Rate by investing in high-quality, U.S. dollar-denominated short-term money market instruments. Securities Lending Fund investments are valued at the evaluated bid price provided by an independent pricing service. Income earned from investment in the Securities Lending Fund, if any, is included in income from affiliated securities on the Statement of Operations.
Security transactions and income recognition
Securities transactions are recorded on a trade date basis. Realized gains or losses are recorded on the basis of identified cost.
Dividend income is recognized on the ex-dividend date. Dividend income is recorded net of foreign taxes withheld where recovery of such taxes is not assured.
Income dividends and capital gain distributions from investment companies are recorded on the ex-dividend date. Capital gain distributions from investment companies are treated as realized gains.
Distributions to shareholders
Distributions to shareholders from net investment income and any net realized gains are recorded on the ex-dividend date and paid at least annually. Such distributions are determined in accordance with income tax regulations and may differ from U.S. generally accepted accounting principles. Dividend sources are estimated at the time of declaration. The tax character of distributions is determined as of the Fund’s fiscal year end. Therefore, a portion of the Fund’s distributions made prior to the Fund’s fiscal year end may be categorized as a tax return of capital at year end.
Federal and other taxes
The Fund intends to continue to qualify as a regulated investment company by distributing substantially all of its investment company taxable income and any net realized capital gains (after reduction for capital loss carryforwards) sufficient to relieve it from all, or substantially all, federal income taxes. Accordingly, no provision for federal income taxes was required.
The Fund’s income and federal excise tax returns and all financial records supporting those returns for the prior three fiscal years are subject to examination by the federal and Delaware revenue authorities. Management has analyzed the Fund’s tax positions taken on federal, state, and foreign tax returns for all open tax years and does not believe that there are any uncertain tax positions that require recognition of a tax liability.
As of September 30, 2018, the aggregate cost of all investments for federal income tax purposes was $166,285,457 and the unrealized gains (losses) consisted of:
| | | | |
Gross unrealized gains | | $ | 11,363,433 | |
Gross unrealized losses | | | (7,531,734 | ) |
Net unrealized gains | | $ | 3,831,699 | |
Class allocations
The separate classes of shares offered by the Fund differ principally in applicable sales charges, shareholder servicing, and administration fees. Class specific expenses are charged directly to that share class. Investment income, common expenses, and realized and unrealized gains (losses) on investments are allocated daily to each class of shares based on the relative proportion of net assets of each class.
| | | | | | |
| Notes to financial statements (unaudited) | | Wells Fargo Disciplined Small Cap Fund | | | 27 | |
3. FAIR VALUATION MEASUREMENTS
Fair value measurements of investments are determined within a framework that has established a fair value hierarchy based upon the various data inputs utilized in determining the value of the Fund’s investments. The three-level hierarchy gives the highest priority to unadjusted quoted prices in active markets for identical assets or liabilities (Level 1) and the lowest priority to unobservable inputs (Level 3). The Fund’s investments are classified within the fair value hierarchy based on the lowest level of input that is significant to the fair value measurement. The inputs are summarized into three broad levels as follows:
| ∎ | | Level 1 – quoted prices in active markets for identical securities |
| ∎ | | Level 2 – other significant observable inputs (including quoted prices for similar securities, interest rates, prepayment speeds, credit risk, etc.) |
| ∎ | | Level 3 – significant unobservable inputs (including the Fund’s own assumptions in determining the fair value of investments) |
The inputs or methodologies used for valuing investments in securities are not necessarily an indication of the risk associated with investing in those securities.
The following is a summary of the inputs used in valuing the Fund’s assets and liabilities as of September 30, 2018:
| | | | | | | | | | | | | | | | |
| | | Quoted prices (Level 1) | | | Other significant
observable inputs
(Level 2) | | | Significant
unobservable inputs (Level 3) | | | Total | |
Assets | | | | | | | | | | | | | | | | |
Investments in: | | | | | | | | | | | | | | | | |
| | | | |
Common stocks | | | | | | | | | | | | | | | | |
Communication services | | $ | 2,822,972 | | | $ | 0 | | | $ | 0 | | | $ | 2,822,972 | |
Consumer discretionary | | | 21,220,434 | | | | 0 | | | | 0 | | | | 21,220,434 | |
Consumer staples | | | 4,520,865 | | | | 0 | | | | 0 | | | | 4,520,865 | |
Energy | | | 9,348,382 | | | | 0 | | | | 0 | | | | 9,348,382 | |
Financials | | | 28,705,393 | | | | 0 | | | | 0 | | | | 28,705,393 | |
Health care | | | 28,340,769 | | | | 0 | | | | 0 | | | | 28,340,769 | |
Industrials | | | 24,722,584 | | | | 0 | | | | 0 | | | | 24,722,584 | |
Information technology | | | 22,498,820 | | | | 0 | | | | 0 | | | | 22,498,820 | |
Materials | | | 7,817,479 | | | | 0 | | | | 0 | | | | 7,817,479 | |
Real estate | | | 9,896,618 | | | | 0 | | | | 0 | | | | 9,896,618 | |
Utilities | | | 4,221,171 | | | | 0 | | | | 0 | | | | 4,221,171 | |
| | | | |
Exchange-traded funds | | | 1,357,333 | | | | 0 | | | | 0 | | | | 1,357,333 | |
| | | | |
Short-term investments | | | | | | | | | | | | | | | | |
Investment companies | | | 612,896 | | | | 4,031,440 | | | | 0 | | | | 4,644,336 | |
Total assets | | $ | 166,085,716 | | | $ | 4,031,440 | | | $ | 0 | | | $ | 170,117,156 | |
At September 30, 2018, the Fund did not have any transfers into/out of Level 3.
Additional sector, industry or geographic detail is included in the Portfolio of Investments.
4. TRANSACTIONS WITH AFFILIATES AND OTHER EXPENSES
Management fee
Funds Management, an indirect wholly owned subsidiary of Wells Fargo, is the manager of the Fund and provides advisory and fund-level administrative services under an investment management agreement. Under the investment management agreement, Funds Management is responsible for, among other services, implementing the investment objectives and strategies of the Fund, supervising the subadviser and providing fund-level administrative services in connection with the Fund’s operations. As compensation for its services under the investment management agreement, Funds Management is entitled to receive an annual management fee starting at 0.50% and declining to 0.43% as the average daily net assets of the Fund increase. Prior to June 27, 2018, Funds Management received a fee at an annual rate which started at 0.85% and declined to 0.71% as the average daily net assets of the Fund increased. For the six months ended September 30, 2018, the management fee was equivalent to an annual rate of 0.67% of the Fund’s average daily net assets.
| | | | |
| 28 | | Wells Fargo Disciplined Small Cap Fund | | Notes to financial statements (unaudited) |
Funds Management has retained the services of a subadviser to provide daily portfolio management to the Fund. The fee for subadvisory services is borne by Funds Management. WellsCap is the subadviser to the Fund and is entitled to receive a fee from Funds Management at an annual rate starting at 0.35% and declining to 0.25% as the average daily net assets of the Fund increase. Prior to June 27, 2018, Schroder Investment Management North America Inc., which is not an affiliate of Funds Management, was the subadviser to the Fund and was entitled to receive a fee from Funds Management at an annual rate which started at 0.50% and declined to 0.45% as the average daily net assets of the Fund increased.
Administration fees
Under a class-level administration agreement, Funds Management provides class-level administrative services to the Fund, which includes paying fees and expenses for services provided by the transfer agent, sub-transfer agents, omnibus account servicers and record-keepers. As compensation for its services under the class-level administration agreement, Funds Management receives an annual fee which is calculated based on the average daily net assets of each class as follows:
| | | | |
| | | Class-level
administration fee | |
Class A | | | 0.21 | % |
Class R6 | | | 0.03 | |
Administrator Class, Institutional Class | | | 0.13 | |
Funds Management has contractually waived and/or reimbursed management and administration fees to the extent necessary to maintain certain net operating expense ratios for the Fund. When each class of the Fund has exceeded its expense cap, Funds Management has waived fees and/or reimbursed expenses from fund level expenses on a proportionate basis and then from class specific expenses; otherwise, waivers and/or reimbursements are applied against class specific expenses before fund level expenses. Funds Management has committed to waive fees and/or reimburse expenses to the extent necessary to cap expenses as follows:
| | | | | | | | |
| | | Expense ratio cap | | | Expiration date | |
Class A | | | 0.93 | % | | | July 31, 2020 | |
Class R6 | | | 0.50 | % | | | July 31, 2019 | |
Administrator Class | | | 0.85 | % | | | July 31, 2019 | |
Institutional Class | | | 0.60 | % | | | July 31, 2019 | |
After the expiration date, the cap may be increased or the commitment to maintain the cap may be terminated only with the approval of the Board of Trustees. Prior to June 27, 2018, the Fund’s expenses were capped at 0.85% for Class R6 shares, 1.20% for Administrator Class shares, and 0.95% for Institutional Class shares.
Sales charges
Wells Fargo Funds Distributor, LLC (“Funds Distributor”), the principal underwriter, is entitled to receive the front-end sales charge from the purchase of Class A shares and a contingent deferred sales charge on the redemption of certain Class A shares. Funds Distributor did not receive any front-end or contingent deferred sales charges from Class A shares for the six months ended September 30, 2018.
Shareholder servicing fees
The Trust has entered into contracts with one or more shareholder servicing agents, whereby Class A and Administrator Class of the Fund are charged a fee at an annual rate of 0.25% of its average daily net assets.
A portion of these total shareholder servicing fees were paid to affiliates of Wells Fargo.
Interfund transactions
The Fund may purchase or sell portfolio investment securities to certain other Wells Fargo affiliates pursuant to Rule 17a-7 under the 1940 Act and under procedures adopted by the Board of Trustees. The procedures have been designed to ensure that these interfund transactions, which do not incur broker commissions, are effected at current market prices.
5. INVESTMENT PORTFOLIO TRANSACTIONS
Purchases and sales of investments, excluding U.S. government obligations (if any) and short-term securities, for the six months ended September 30, 2018 were $209,032,213 and $221,934,408, respectively.
| | | | | | |
| Notes to financial statements (unaudited) | | Wells Fargo Disciplined Small Cap Fund | | | 29 | |
6. BANK BORROWINGS
The Trust (excluding the money market funds), Wells Fargo Master Trust and Wells Fargo Variable Trust are parties to a $280,000,000 revolving credit agreement whereby the Fund is permitted to use bank borrowings for temporary or emergency purposes, such as to fund shareholder redemption requests. Interest under the credit agreement is charged to the Fund based on a borrowing rate equal to the higher of the Federal Funds rate in effect on that day plus 1.25% or the overnight LIBOR rate in effect on that day plus 1.25%. In addition, an annual commitment fee equal to 0.25% of the unused balance is allocated to each participating fund.
For the six months ended September 30, 2018, there were no borrowings by the Fund under the agreement.
7. DISTRIBUTIONS TO SHAREHOLDERS
Beginning October 2018, the Securities and Exchange Commission eliminated the requirement to separately state the components of distributions to shareholders. The amounts of distributions to shareholders for the year ended March 31, 2018 were as follows:
| | | | | | | | |
| | | Net investment
income | | | Net realized
gains | |
Class R6 | | $ | 5,027 | | | $ | 260,359 | |
Administrator Class | | | 339,109 | | | | 27,052,520 | |
Institutional Class | | | 183,973 | | | | 10,040,057 | |
8. INDEMNIFICATION
Under the Trust’s organizational documents, the officers and Trustees have been granted certain indemnification rights against certain liabilities that may arise out of performance of their duties to the Trust. Additionally, in the normal course of business, the Trust may enter into contracts with service providers that contain a variety of indemnification clauses. The Trust’s maximum exposure under these arrangements is dependent on future claims that may be made against the Fund and, therefore, cannot be estimated.
9. NEW ACCOUNTING PRONOUNCEMENT
In August 2018, FASB issued Accounting Standards Update (“ASU”) No. 2018-13, Fair Value Measurement (Topic 820) Disclosure Framework—Changes to the Disclosure Requirements for Fair Value Measurement. ASU 2018-13 updates the disclosure requirements for fair value measurements by modifying or removing certain disclosures and adding certain new disclosures. The amendments are effective for fiscal years, and interim periods within those fiscal years, beginning after December 15, 2019. Early adoption is permitted. Management has early adopted the removal and modification disclosures, as permitted, and will adopt the additional new disclosures at the effective date.
| | | | |
| 30 | | Wells Fargo Disciplined Small Cap Fund | | Other information (unaudited) |
PROXY VOTING INFORMATION
A description of the policies and procedures that the Fund uses to determine how to vote proxies relating to portfolio securities is available, upon request, by calling 1-800-222-8222, visiting our website at wellsfargofunds.com, or visiting the SEC website at sec.gov. Information regarding how the Fund voted proxies relating to portfolio securities during the most recent 12-month period ended June 30 is available on the Fund’s website at wellsfargofunds.com or by visiting the SEC website at sec.gov.
SPECIAL MEETING OF SHAREHOLDERS
On June 22, 2018, a Special Meeting of Shareholders for the Fund was held to consider the following proposal. The results of the proposal are indicated below.
Proposal – To consider and act upon a new investment sub-advisory agreement with Wells Capital Management Incorporated:
| | | | |
| Shares voted “For” | | | 2,874,861 | |
| Shares voted “Against” | | | 546,337 | |
| Shares voted “Abstain” | | | 681,371 | |
PORTFOLIO HOLDINGS INFORMATION
The complete portfolio holdings for the Fund are publicly available monthly on the Fund’s website (wellsfargofunds.com), on a one-month delayed basis. In addition, top ten holdings information (excluding derivative positions) for the Fund is publicly available on the Fund’s website on a monthly, seven-day or more delayed basis. The Fund files its complete schedule of portfolio holdings with the SEC for the first and third quarters of each fiscal year on Form N-Q, which is available by visiting the SEC website at sec.gov. In addition, the Fund’s Form N-Q may be reviewed and copied at the SEC’s Public Reference Room in Washington, DC, and at regional offices in New York City, at 233 Broadway, and in Chicago, at 175 West Jackson Boulevard, Suite 900. Information about the Public Reference Room may be obtained by calling 1-800-SEC-0330.
| | | | | | |
| Other information (unaudited) | | Wells Fargo Disciplined Small Cap Fund | | | 31 | |
BOARD OF TRUSTEES AND OFFICERS
Each of the Trustees and Officers1 listed in the table below acts in identical capacities for each fund in the Wells Fargo family of funds, which consists of 153 mutual funds comprising the Wells Fargo Funds Trust, Wells Fargo Variable Trust, Wells Fargo Master Trust and four closed-end funds (collectively the “Fund Complex”). This table should be read in conjunction with the Prospectus and the Statement of Additional Information2. The mailing address of each Trustee and Officer is 525 Market Street, 12th Floor, San Francisco, CA 94105. Each Trustee and Officer serves an indefinite term, however, each Trustee serves such term until reaching the mandatory retirement age established by the Trustees.
Independent Trustees
| | | | | | |
Name and year of birth | | Position held and length of service* | | Principal occupations during past five years or longer | | Current other public company or
investment company
directorships |
William R. Ebsworth (Born 1957) | | Trustee, since 2015 | | Retired. From 1984 to 2013, equities analyst, portfolio manager, research director and chief investment officer at Fidelity Management and Research Company in Boston, Tokyo, and Hong Kong, and retired in 2013 as Chief Investment Officer of Fidelity Strategic Advisers, Inc. where he led a team of investment professionals managing client assets. Prior thereto, Board member of Hong Kong Securities Clearing Co., Hong Kong Options Clearing Corp., the Thailand International Fund, Ltd., Fidelity Investments Life Insurance Company, and Empire Fidelity Investments Life Insurance Company. Board member of the Vincent Memorial Hospital Endowment (non-profit organization), where he serves on the Investment Committee and as a Chair of the Audit Committee. Mr. Ebsworth is a CFA® charterholder. | | N/A |
Jane A. Freeman (Born 1953) | | Trustee, since 2015; Chair Liaison, since 2018 | | Retired. From 2012 to 2014 and 1999 to 2008, Chief Financial Officer of Scientific Learning Corporation. From 2008 to 2012, Ms. Freeman provided consulting services related to strategic business projects. Prior to 1999, Portfolio Manager at Rockefeller & Co. and Scudder, Stevens & Clark. Board member of the Harding Loevner Funds from 1996 to 2014, serving as both Lead Independent Director and chair of the Audit Committee. Board member of the Russell Exchange Traded Funds Trust from 2011 to 2012 and the chair of the Audit Committee. Ms. Freeman is a Board Member of The Ruth Bancroft Garden (non-profit organization). She is also an inactive Chartered Financial Analyst. | | N/A |
Isaiah Harris, Jr. (Born 1952) | | Trustee, since 2009 | | Retired. Chairman of the Board of CIGNA Corporation since 2009, and Director since 2005. From 2003 to 2011, Director of Deluxe Corporation. Prior thereto, President and CEO of BellSouth Advertising and Publishing Corp. from 2005 to 2007, President and CEO of BellSouth Enterprises from 2004 to 2005 and President of BellSouth Consumer Services from 2000 to 2003. Emeritus member of the Iowa State University Foundation Board of Governors. Emeritus Member of the Advisory Board of Iowa State University School of Business. Advisory Board Member, Palm Harbor Academy (private school). Advisory Board Member, Child Evangelism Fellowship (non-profit). Mr. Harris is a certified public accountant (inactive status). | | CIGNA Corporation |
Judith M. Johnson (Born 1949) | | Trustee, since 2008; Audit Committee Chairman, since 2009 | | Retired. Prior thereto, Chief Executive Officer and Chief Investment Officer of Minneapolis Employees Retirement Fund from 1996 to 2008. Ms. Johnson is an attorney, certified public accountant and a certified managerial accountant. | | N/A |
David F. Larcker (Born 1950) | | Trustee, since 2009 | | James Irvin Miller Professor of Accounting at the Graduate School of Business, Stanford University, Director of the Corporate Governance Research Initiative and Senior Faculty of The Rock Center for Corporate Governance since 2006. From 2005 to 2008, Professor of Accounting at the Graduate School of Business, Stanford University. Prior thereto, Ernst & Young Professor of Accounting at The Wharton School, University of Pennsylvania from 1985 to 2005. | | N/A |
| | | | |
| 32 | | Wells Fargo Disciplined Small Cap Fund | | Other information (unaudited) |
| | | | | | |
Name and year of birth | | Position held and length of service* | | Principal occupations during past five years or longer | | Current other public company or
investment company
directorships |
Olivia S. Mitchell (Born 1953) | | Trustee, since 2006; Governance Committee Chairman, since 2018 | | International Foundation of Employee Benefit Plans Professor, Wharton School of the University of Pennsylvania since 1993. Director of Wharton’s Pension Research Council and Boettner Center on Pensions & Retirement Research, and Research Associate at the National Bureau of Economic Research. Previously, Cornell University Professor from 1978 to 1993. | | N/A |
Timothy J. Penny (Born 1951) | | Trustee, since 1996; Chairman, since 2018; Vice Chairman, from 2017 to 2018 | | President and Chief Executive Officer of Southern Minnesota Initiative Foundation, a non-profit organization, since 2007. Member of the Board of Trustees of NorthStar Education Finance, Inc., a non-profit organization, since 2007. | | N/A |
James G. Polisson (Born 1959) | | Trustee, since 2018; Advisory Board Member, from 2017 to 2018 | | Retired. Chief Marketing Officer, Source (ETF) UK Services, Ltd, from 2015 to 2017. From 2012 to 2015, Principal of The Polisson Group, LLC, a management consulting, corporate advisory and principal investing company. Chief Executive Officer and Managing Director at Russell Investments, Global Exchange Traded Funds from 2010 to 2012. Managing Director of Barclays Global Investors from 1998 to 2010 and Global Chief Marketing Officer for iShares and Barclays Global Investors from 2000 to 2010. Trustee of the San Francisco Mechanics’ Institute, a non-profit organization, from 2013 to 2015. Board member of the Russell Exchange Traded Fund Trust from 2011 to 2012. Director of Barclays Global Investors Holdings Deutschland GmbH from 2006 to 2009. Mr. Polisson is an attorney and has a retired status with the Massachusetts and District of Columbia Bar Associations. | | N/A |
Michael S. Scofield (Born 1943) | | Trustee, since 2010 | | Served on the Investment Company Institute’s Board of Governors and Executive Committee from 2008-2011 as well the Governing Council of the Independent Directors Council from 2006-2011 and the Independent Directors Council Executive Committee from 2008-2011. Trustee of the Evergreen Fund complex (and its predecessors) from 1984 to 2010. Chairman of the Evergreen Funds from 2000-2010. Former Trustee of the Mentor Funds. Retired Attorney, Law Offices of Michael S. Scofield. | | N/A |
Pamela Wheelock (Born 1959) | | Trustee, since 2018; Advisory Board Member, from 2017 to 2018 | | Chief Operating Officer, Twin Cities Habitat for Humanity, since January, 2017. Vice President of University Services, University of Minnesota from 2012 to 2017. Prior thereto, on the Board of Directors, Governance Committee and Finance Committee for the Minnesota Philanthropy Partners (Saint Paul Foundation) from 2012 to 2018, Interim President and Chief Executive Officer of Blue Cross Blue Shield of Minnesota from 2010 to 2011, Chairman of the Board from 2009 to 2011 and Board Director from 2003 to 2015. Vice President, Leadership and Community Engagement, Bush Foundation, Saint Paul, Minnesota (a private foundation) from 2009 to 2011. Executive Vice President and Chief Financial Officer, Minnesota Sports and Entertainment from 2004 to 2009 and Senior Vice President from 2002 to 2004. Commissioner of Finance, State of Minnesota, from 1999 to 2002. Currently the Board Chair of the Minnesota Wild Foundation since 2010. | | N/A |
| * | Length of service dates reflect the Trustee’s commencement of service with the Trust’s predecessor entities, where applicable. |
| | | | | | |
| Other information (unaudited) | | Wells Fargo Disciplined Small Cap Fund | | | 33 | |
Officers
| | | | | | |
Name and year of birth | | Position held and
length of service | | Principal occupations during past five years or longer | | |
Andrew Owen (Born 1960) | | President, since 2017 | | Executive Vice President of Wells Fargo & Company and Head of Affiliated Managers, Wells Fargo Asset Management, since 2014. In addition, Mr. Owen is currently President, Chief Executive Officer and Director of Wells Fargo Funds Management, LLC since 2017. Prior thereto, Executive Vice President responsible for marketing, investments and product development for Wells Fargo Funds Management, LLC, from 2009 to 2014. | | |
Nancy Wiser1 (Born 1967) | | Treasurer, since 2012 | | Executive Vice President of Wells Fargo Funds Management, LLC since 2011. Chief Operating Officer and Chief Compliance Officer at LightBox Capital Management LLC, from 2008 to 2011. | | |
Alexander Kymn3
(Born 1973) | | Secretary, since 2018; Chief Legal Officer, since 2018 | | Senior Company Counsel of Wells Fargo Bank, N.A. since 2018 (previously Senior Counsel from 2007 to 2018). Vice President of Wells Fargo Funds Management, LLC from 2008 to 2014. | | |
Michael H. Whitaker
(Born 1967) | | Chief Compliance Officer, since 2016 | | Senior Vice President and Chief Compliance Officer since 2016. Senior Vice President and Chief Compliance Officer for Fidelity Investments from 2007 to 2016. | | |
David Berardi
(Born 1975) | | Assistant Treasurer, since 2009 | | Vice President of Wells Fargo Funds Management, LLC since 2009. Vice President of Evergreen Investment Management Company, LLC from 2008 to 2010. Manager of Fund Reporting and Control for Evergreen Investment Management Company, LLC from 2004 to 2010. | | |
Jeremy DePalma1
(Born 1974) | | Assistant Treasurer, since 2009 | | Senior Vice President of Wells Fargo Funds Management, LLC since 2009. Senior Vice President of Evergreen Investment Management Company, LLC from 2008 to 2010 and head of the Fund Reporting and Control Team within Fund Administration from 2005 to 2010. | | |
| 1 | Nancy Wiser acts as Treasurer of 76 funds in the Fund Complex. Jeremy DePalma acts as Treasurer of 77 funds and Assistant Treasurer of 76 funds in the Fund Complex. |
| 2 | The Statement of Additional Information includes additional information about the Trustees and is available, without charge, upon request, by calling 1-800-222-8222 or by visiting the website at wellsfargofunds.com. |
| 3 | Alexander Kymn became the Secretary and Chief Legal Officer effective April 17, 2018. |
| | | | |
| 34 | | Wells Fargo Disciplined Small Cap Fund | | Other information (unaudited) |
BOARD CONSIDERATION OF INVESTMENT MANAGEMENT AND SUB-ADVISORY AGREEMENTS:
Wells Fargo Disciplined Small Cap Fund
Under the Investment Company Act of 1940 (the “1940 Act”), the Board of Trustees (the “Board”) of Wells Fargo Funds Trust (the “Trust”) must determine annually whether to approve the continuation of the Trust’s investment management and sub-advisory agreements. In this regard, at an in-person meeting held on May 22-23, 2018 (the “Meeting”), the Board, all the members of which have no direct or indirect interest in the investment management and sub-advisory agreements and are not “interested persons” of the Trust, as defined in the 1940 Act (the “Independent Trustees”), reviewed and approved for Wells Fargo Disciplined Small Cap Fund (the “Fund”): (i) an investment management agreement (the “Management Agreement”) with Wells Fargo Funds Management, LLC (“Funds Management”); and (ii) an investment sub-advisory agreement (the “Sub-Advisory Agreement”) with Schroder Investment Management North America Inc. (the “Sub-Adviser”). The Management Agreement and the Sub-Advisory Agreement are collectively referred to as the “Advisory Agreements.”
At the Meeting, the Board considered the factors and reached the conclusions described below relating to the selection of Funds Management and the Sub-Adviser and the approval of the Advisory Agreements. Prior to the Meeting, including at an in-person meeting in April 2018, the Trustees conferred extensively among themselves and with representatives of Funds Management about these matters. Also, the Board has adopted a team-based approach, with each team consisting of a sub-set of Trustees, to assist the full Board in the discharge of its duties in reviewing investment performance and other matters throughout the year. The Independent Trustees were assisted in their evaluation of the Advisory Agreements by independent legal counsel, from whom they received separate legal advice and with whom they met separately.
In providing information to the Board, Funds Management and the Sub-Adviser were guided by a detailed set of requests for information submitted to them by independent legal counsel on behalf of the Independent Trustees at the start of the Board’s annual contract renewal process earlier in 2018. In considering and approving the Advisory Agreements, the Trustees considered the information they believed relevant, including but not limited to the information discussed below. The Board considered not only the specific information presented in connection with the Meeting, but also the knowledge gained over time through interaction with Funds Management and the Sub-Adviser about various topics. In this regard, the Board reviewed reports of Funds Management at each of its quarterly meetings, which included, among other things, portfolio reviews and investment performance reports. In addition, the Board and the teams mentioned above confer with portfolio managers at various times throughout the year. The Board did not identify any particular information or consideration that was all-important or controlling, and each individual Trustee may have attributed different weights to various factors.
After its deliberations, the Board unanimously approved the continuation of the Advisory Agreements for a one-year term and determined that the compensation payable to Funds Management and the Sub-Adviser under each of the Advisory Agreements was reasonable. The Board considered the approval of the Advisory Agreements for the Fund as part of its consideration of agreements for funds across the complex, but its approvals were made on a fund-by-fund basis. The following summarizes a number of important, but not necessarily all, factors considered by the Board in support of its approvals.
Nature, extent and quality of services
The Board received and considered various information regarding the nature, extent and quality of services provided to the Fund by Funds Management and the Sub-Adviser under the Advisory Agreements. This information included a description of the investment advisory services and Fund-level administrative services covered by the Management Agreement, as well as, among other things, a summary of the background and experience of senior management of Wells Fargo Asset Management (“WFAM”), of which Funds Management is a part, a summary of investments made in the business of WFAM, a summary of certain organizational and personnel changes involving Funds Management, and a description of Funds Management’s and the Sub-Adviser’s business continuity planning programs and of their approaches to data privacy and cybersecurity. The Board also considered the qualifications, background, tenure and responsibilities of each of the portfolio managers primarily responsible for the day-to-day portfolio management of the Fund.
The Board evaluated the ability of Funds Management and the Sub-Adviser to attract and retain qualified investment professionals, including research, advisory and supervisory personnel. The Board further considered the compliance programs and compliance records of Funds Management and the Sub-Adviser. In addition, the Board took into account the full range of services provided to the Fund by Funds Management and its affiliates.
| | | | | | |
| Other information (unaudited) | | Wells Fargo Disciplined Small Cap Fund | | | 35 | |
Fund investment performance and expenses
The Board considered the investment performance results for the Fund over various time periods ended December 31, 2017. The Board considered these results in comparison to the investment performance of funds in a universe that was determined by Broadridge Inc. (“Broadridge”) to be similar to the Fund (the “Universe”), and in comparison to the Fund’s benchmark index and to other comparative data. Broadridge is an independent provider of investment company data. The Board received a description of the methodology used by Broadridge to select the mutual funds in the performance Universe. The Board noted that the investment performance of the Fund (Administrator Class) was higher than the average performance of the Universe for all periods under review. The Board also noted that the investment performance of the Fund was higher than its benchmark index, the Russell 2000 Index, for all periods under review.
The Board also received and considered information regarding the Fund’s net operating expense ratios and their various components, including actual management fees, custodian and other non-management fees, and Rule 12b-1 and non-Rule 12b-1 shareholder service fees. The Board considered these ratios in comparison to the median ratios of funds in class-specific expense groups that were determined by Broadridge to be similar to the Fund (the “Groups”). The Board received a description of the methodology used by Broadridge to select the mutual funds in the expense Groups and an explanation of how funds comprising expense groups and their expense ratios may vary from year-to-year. Based on the Broadridge reports, the Board noted that the net operating expense ratios of the Fund were lower than the median net operating expense ratios of the expense Groups for each share class.
The Board took into account the Fund’s investment performance and expense information provided to it among the factors considered in deciding to re-approve the Advisory Agreements.
Investment management and sub-advisory fee rates
The Board reviewed and considered the contractual fee rates payable by the Fund to Funds Management under the Management Agreement, as well as the contractual fee rates payable by the Fund to Funds Management for class-level administrative services under a Class-Level Administration Agreement, which include, among other things, class-level transfer agency and sub-transfer agency costs (collectively, the “Management Rates”). The Board also reviewed and considered the contractual investment sub-advisory fee rates that are payable by Funds Management to the Sub-Adviser for investment sub-advisory services.
Among other information reviewed by the Board was a comparison of the Fund’s Management Rates with the average contractual investment management fee rates of funds in the expense Groups at a common asset level as well as transfer agency costs of the other funds in the expense Groups. The Board noted that the Management Rates of the Fund were lower than or in range of the sum of these average rates for the Fund’s expense Groups for all share classes.
The Board also received and considered information about the portion of the total management fee that was retained by Funds Management after payment of the fee to the Sub-Adviser for sub-advisory services. The Board considered this amount in comparison to the median amount retained by advisers to funds in a sub-advised expense universe that was determined by Broadridge to be similar to the Fund. In assessing the reasonableness of this amount, the Board received and evaluated information about the nature and extent of responsibilities retained and risks assumed by Funds Management and not delegated to or assumed by the Sub-Adviser, and about Funds Management’s on-going oversight services. The Board also considered that the sub-advisory fees paid to the Sub-Adviser had been negotiated by Funds Management on an arm’s length basis.
The Board also received and considered information about the nature and extent of services offered and fee rates charged by Funds Management and the Sub-Adviser to other types of clients with investment strategies similar to those of the Fund. In this regard, the Board received information about the significantly greater scope of services, and compliance, reporting and other legal burdens and risks of managing mutual funds compared with those associated with managing assets of non-mutual fund clients such as collective funds or institutional separate accounts.
Based on its consideration of the factors and information it deemed relevant, including those described here, the Board determined that the compensation payable to Funds Management under the Management Agreement and to the Sub-Adviser under the Sub-Advisory Agreement was reasonable.
Profitability
The Board received and considered information concerning the profitability of Funds Management, as well as the profitability of both WFAM and Wells Fargo & Co. (“Wells Fargo”) as a whole, from providing services to the Fund and the fund family as a whole. Funds Management reported on the methodologies and estimates used in calculating profitability, including a description of the methodology used to allocate certain expenses and recent enhancements
| | | | |
| 36 | | Wells Fargo Disciplined Small Cap Fund | | Other information (unaudited) |
made to the methodology. Among other things, the Board noted that the levels of profitability reported on a fund-by-fund basis varied widely, depending on factors such as the size and type of fund. The Board did not consider profitability with respect to the Sub-Adviser, as the sub-advisory fees paid to the Sub-Adviser had been negotiated by Funds Management on an arm’s-length basis.
Based on its review, the Board did not deem the profits reported by Funds Management, WFAM or Wells Fargo from services provided to the Fund to be at a level that would prevent it from approving the continuation of the Advisory Agreements.
Economies of scale
The Board considered the extent to which Funds Management may experience economies of scale in the provision of management services, and the extent to which scale benefits, if any, would be shared with shareholders. In particular, the Board noted the existence of breakpoints in the Fund’s management fee structure, which operate generally to reduce the Fund’s expense ratios as the Fund grows in size. It considered that, for a small fund or a fund that shrinks in size, breakpoints conversely can result in higher fee levels. The Board also considered that in addition to management fee breakpoints, competitive management fee rates set at the outset without regard to breakpoints and fee waiver and expense reimbursement arrangements, as well as investments in the business intended to enhance services available to Fund shareholders, are means of sharing potential economies of scale with shareholders of the Fund.
The Board concluded that the Fund’s fee and expense arrangements, including contractual breakpoints, constituted a reasonable approach to sharing potential economies of scale with the Fund and its shareholders.
Other benefits to Funds Management and the Sub-Adviser
The Board received and considered information regarding potential “fall-out” or ancillary benefits received by Funds Management, the Sub-Adviser, and their affiliates as a result of their relationships with the Fund. Ancillary benefits could include, among others, benefits directly attributable to other relationships with the Fund and benefits potentially derived from an increase in Funds Management’s and the Sub-Adviser’s business as a result of their relationships with the Fund. The Board noted that various affiliates of Funds Management may receive distribution-related fees, shareholder servicing payments and sub-transfer agency fees in respect of shares sold or held through them and services provided.
The Board also reviewed information about soft dollar credits earned and utilized by the Sub-Adviser, fees earned by Funds Management and its affiliate from managing a private investment vehicle for the fund family’s securities lending collateral and commissions earned by an affiliated broker from portfolio transactions.
Based on its consideration of the factors and information it deemed relevant, including those described here, the Board did not find that any ancillary benefits received by Funds Management, the Sub-Adviser, and their affiliates were unreasonable.
Conclusion
At the Meeting, after considering the above-described factors and based on its deliberations and its evaluation of the information described above, the Board unanimously approved the continuation of the Advisory Agreements for a one-year term and determined that the compensation payable to Funds Management and the Sub-Adviser under each of the Advisory Agreements was reasonable.
| | | | | | |
| Appendix A (unaudited) | | Wells Fargo Disciplined Small Cap Fund | | | 37 | |
SALES CHARGE REDUCTIONS AND WAIVERS FOR CERTAIN INTERMEDIARIES
Ameriprise
Effective June 1, 2018, shareholders purchasing Fund shares through an Ameriprise Financial platform or account will be eligible only for the following Class A load waivers (front-end sales charge waivers), which may differ from those disclosed elsewhere in the Fund’s prospectus or Statement of Additional Information.
Front-end Sales Load Waivers on Class A Shares Available at Ameriprise Financial
| | • | | Employer-sponsored retirement plans (e.g., 401(k) plans, 457 plans, employer-sponsored 403(b) plans, profit sharing and money purchase pension plans and defined benefit plans). For purposes of this provision, employer-sponsored retirement plans do not include SEP IRAs, Simple IRAs or SAR-SEPs. |
| | • | | Shares purchased through an Ameriprise Financial investment advisory program (if an Advisory or similar share class for such investment advisory program is not available) |
| | • | | Shares purchased by third party investment advisors on behalf of their advisory clients through Ameriprise Financial’s platform (if an Advisory or similar share class for such investment advisory program is not available) |
| | • | | Shares purchased through reinvestment of distributions and dividend reinvestment when purchasing shares of the same Fund (but not any other fund within the same fund family) |
| | • | | Shares exchanged from Class C shares of the same fund in the month of or following the 10-year anniversary of the purchase date. To the extent that the Fund’s prospectus elsewhere provides for a waiver with respect to such shares following a shorter holding period, that waiver will apply to exchanges following such shorter period. To the extent that the Fund’s prospectus elsewhere provides for a waiver with respect to exchanges of Class C shares for load-waived shares, that waiver will also apply to such exchanges. |
| | • | | Employees and registered representatives of Ameriprise Financial or its affiliates and their immediate family members |
| | • | | Shares purchased by or through qualified accounts (including IRAs, Coverdell Education Savings Accounts, 401(k)s, 403(b) TSCAs subject to ERISA and defined benefit plans) that are held by a covered family member, defined as an Ameriprise financial advisor and/or the advisor’s spouse, advisor’s lineal ascendant (mother, father, grandmother, grandfather, great grandmother, great grandfather), advisor’s lineal descendant (son, step-son, daughter, step-daughter, grandson, granddaughter, great grandson, great granddaughter) or any spouse of a covered family member who is a lineal descendant |
| | • | | Shares purchased from the proceeds of redemptions within the same fund family, provided (1) the repurchase occurs within 90 days following the redemption, (2) the redemption and purchase occur in the same account, and (3) redeemed shares were subject to a front-end or deferred sales load (i.e. Rights of Reinstatement). Subject to the Fund’s policy regarding frequent purchases and redemptions of Fund shares, you may not be able to repurchase shares for the first 30 days after your redemption. |
Automatic Exchange of Class C Shares Available at Ameriprise Financial
| | • | | Class C shares will automatically exchange to Class A shares in the month of the 10-year anniversary of the purchase date. |
Merrill Lynch
Effective April 10, 2017, shareholders purchasing Fund shares through a Merrill Lynch platform or account will be eligible only for the following load waivers (front-end sales charge waivers and contingent deferred, or back-end, sales charge waivers) and discounts, which may differ from those disclosed elsewhere in the Fund’s prospectus or Statement of Additional Information.
Front-end Sales Load Waivers on Class A Shares available at Merrill Lynch
| | • | | Employer-sponsored retirement, deferred compensation and employee benefit plans (including health savings accounts) and trusts used to fund those plans, provided that the shares are not held in a commission-based brokerage account and shares are held for the benefit of the plan |
| | • | | Shares purchased by or through a 529 Plan |
| | • | | Shares purchased through a Merrill Lynch affiliated investment advisory program |
| | | | |
| 38 | | Wells Fargo Disciplined Small Cap Fund | | Appendix A (unaudited) |
| | • | | Shares purchased by third party investment advisors on behalf of their advisory clients through Merrill Lynch’s platform |
| | • | | Shares of funds purchased through the Merrill Edge Self-Directed platform (if applicable) |
| | • | | Shares purchased through reinvestment of capital gains distributions and dividend reinvestment when purchasing shares of the same fund (but not any other fund within the fund family) |
| | • | | Shares exchanged from Class C (i.e. level-load) shares of the same fund in the month of or following the 10-year anniversary of the purchase date |
| | • | | Employees and registered representatives of Merrill Lynch or its affiliates and their family members, as defined by Merrill Lynch, which may differ from the definition of family member in the Fund’s prospectus. |
| | • | | Directors or Trustees of the Fund, and employees of the Fund’s investment adviser or any of its affiliates, as described in the Fund’s prospectus |
| | • | | Shares purchased from the proceeds of redemptions within the same fund family, provided (1) the repurchase occurs within 90 days following the redemption, (2) the redemption and purchase occur in the same account, and (3) redeemed shares were subject to a front-end or deferred sales load (known as Rights of Reinstatement). Subject to the Fund’s policy regarding frequent purchases and redemptions of Fund shares, you may not be able to repurchase shares for the first 30 days after your redemption. |
CDSC Waivers on A, B and C Shares available at Merrill Lynch
| | • | | Death or disability of the shareholder |
| | • | | Shares sold as part of a systematic withdrawal plan as described in the Fund’s prospectus |
| | • | | Return of excess contributions from an IRA Account |
| | • | | Shares sold as part of a required minimum distribution for IRA and retirement accounts due to the shareholder reaching age 70½ |
| | • | | Shares sold to pay Merrill Lynch fees but only if the transaction is initiated by Merrill Lynch |
| | • | | Shares acquired through a right of reinstatement |
| | • | | Shares held in retirement brokerage accounts, that are exchanged for a lower cost share class due to transfer to certain fee based accounts or platforms (applicable to A and C shares only) |
Front-end load Discounts Available at Merrill Lynch: Breakpoints, Rights of Accumulation & Letters of Intent
| | • | | Breakpoints as described in the Fund’s prospectus |
| | • | | Rights of Accumulation (ROA) which entitle shareholders to breakpoint discounts will be automatically calculated based on the aggregated holding of fund family assets held by accounts within the purchaser’s household at Merrill Lynch. Eligible fund family assets not held at Merrill Lynch may be included in the ROA calculation only if the shareholder notifies his or her financial advisor about such assets. |
| | • | | Letters of Intent (LOI) which allow for breakpoint discounts based on anticipated purchases within a fund family, through Merrill Lynch, over a 13-month period of time (if applicable) |
Morgan Stanley
Effective on or about July 1, 2018, shareholders purchasing Fund shares through a Morgan Stanley Wealth Management transactional brokerage account will be eligible only for the following Class A load waivers (front-end sales charge waivers), which may differ from and be more limited than those disclosed in the Fund’s prospectus or Statement of Additional Information.
Front-end Sales Load Waivers on Class A Shares Available at Morgan Stanley
| | • | | Employer-sponsored retirement plans (e.g., 401(k) plans, 457 plans, employer-sponsored 403(b) plans, profit sharing and money purchase pension plans and defined benefit plans). For purposes of this provision, employer-sponsored retirement plans do not include SEP IRAs, Simple IRAs, SAR-SEPs or Keogh plans. |
| | • | | Morgan Stanley employee and employee-related accounts according to Morgan Stanley’s account linking rules |
| | • | | Shares purchased through reinvestment of dividends and capital gains distributions when purchasing shares of the same fund |
| | • | | Shares purchased through a Morgan Stanley self-directed brokerage account |
| | | | | | |
| Appendix A (unaudited) | | Wells Fargo Disciplined Small Cap Fund | | | 39 | |
| | • | | Class C (i.e., level-load) shares that are no longer subject to a contingent deferred sales charge and are exchanged to Class A shares of the same fund pursuant to Morgan Stanley Wealth Management’s share class exchange program. |
| | • | | Shares purchased from the proceeds of redemptions within the same fund family, provided (i) the repurchase occurs within 90 days following the redemption, (ii) the redemption and purchase occur in the same account, and (iii) redeemed shares were subject to a front-end or deferred sales charge. This waiver is subject to the Fund’s policy regarding frequent purchases and redemption of Fund shares, as discussed under “Account Information—Frequent Purchases and Redemptions of Fund Shares” in the Fund’s prospectus. |
Raymond James & Associates, Inc., Raymond James Financial Services & Raymond James affiliates (“Raymond James”)
Effective on or about March 1, 2019, shareholders purchasing Fund shares through a Raymond James platform or account will be eligible only for the following load waivers (front-end sales charge waivers and contingent deferred, or back-end, sales charge waivers) and discounts, which may differ from those disclosed elsewhere in the Fund’s Prospectus or SAI.
Front-end Sales Load Waivers on Class A shares Available at Raymond James
| | • | | Shares purchased in an investment advisory program. |
| | • | | Shares purchased through reinvestment of capital gains distributions and dividend reinvestment when purchasing shares of the same fund (but not any other fund within the fund family). |
| | • | | Employees and registered representatives of Raymond James or its affiliates and their family members as designated by Raymond James. |
| | • | | Shares purchased from the proceeds of redemptions within the same fund family, provided (1) the repurchase occurs within 90 days following the redemption, (2) the redemption and purchase occur in the same account, and (3) redeemed shares were subject to a front-end or deferred sales load (known as Rights of Reinstatement). |
| | • | | A shareholder in the fund’s Class C shares will have their shares automatically exchanged at net asset value to Class A shares (or the appropriate share class) of the fund if the shares are no longer subject to a CDSC and the exchange is in line with the policies and procedures of Raymond James. |
CDSC Waivers on Class A and C Shares Available at Raymond James
| | • | | Death or disability of the shareholder. |
| | • | | Shares sold as part of a systematic withdrawal plan as described in the Fund’s Prospectus. |
| | • | | Return of excess contributions from an IRA Account. |
| | • | | Shares sold as part of a required minimum distribution for IRA and retirement accounts due to the shareholder reaching age 70½ as described in the Fund’s prospectus. |
| | • | | Shares sold to pay Raymond James fees but only if the transaction is initiated by Raymond James. |
| | • | | Shares acquired through a right of reinstatement. |
Front-end Load Discounts Available at Raymond James: Breakpoints, and/or Rights of Accumulation
| | • | | Breakpoints as described in the Fund’s Prospectus. |
| | • | | Rights of accumulation which entitle shareholders to breakpoint discounts will be automatically calculated based on the aggregated holding of fund family assets held by accounts within the purchaser’s household at Raymond James. Eligible fund family assets not held at Raymond James may be included in the rights of accumulation calculation only if the shareholder notifies his or her financial advisor about such assets. |
This page is intentionally left blank.

For more information
More information about Wells Fargo Funds is available free upon request. To obtain literature, please write, visit the Fund’s website, or call:
Wells Fargo Funds
P.O. Box 219967
Kansas City, MO 64121-9967
Website: wellsfargofunds.com
Individual investors: 1-800-222-8222
Retail investment professionals: 1-888-877-9275
Institutional investment professionals: 1-866-765-0778
This report and the financial statements contained herein are submitted for the general information of the shareholders of the Fund. If this report is used for promotional purposes, distribution of the report must be accompanied or preceded by a current prospectus. Before investing, please consider the investment objectives, risks, charges, and expenses of the investment. For a current prospectus and, if available, a summary prospectus, containing this information, call 1-800-222-8222 or visit the Fund’s website at wellsfargofunds.com. Read the prospectus carefully before you invest or send money.
Wells Fargo Asset Management (WFAM) is the trade name for certain investment advisory/management firms owned by Wells Fargo & Company. These firms include but are not limited to Wells Capital Management Incorporated and Wells Fargo Funds Management, LLC. Certain products managed by WFAM entities are distributed by Wells Fargo Funds Distributor, LLC (a broker/dealer and Member FINRA).
This material is for general informational and educational purposes only and is NOT intended to provide investment advice or a recommendation of any kind—including a recommendation for any specific investment, strategy, or plan.
NOT FDIC INSURED ◾ NO BANK GUARANTEE ◾ MAY LOSE VALUE
© 2018 Wells Fargo Funds Management, LLC. All rights reserved.
| | |
 | | 317298 11-18 SA243/SAR243 09-18 |
Semi-Annual Report
September 30, 2018

Wells Fargo Small Cap Value Fund


Reduce clutter. Save trees.
Sign up for electronic delivery of prospectuses and shareholder reports at wellsfargo.com/advantagedelivery
Contents
The views expressed and any forward-looking statements are as of September 30, 2018, unless otherwise noted, and are those of the Fund managers and/or Wells Fargo Funds Management, LLC. Discussions of individual securities, or the markets generally, or any Wells Fargo Fund are not intended as individual recommendations. Future events or results may vary significantly from those expressed in any forward-looking statements. The views expressed are subject to change at any time in response to changing circumstances in the market. Wells Fargo Funds Management, LLC and the Fund disclaim any obligation to publicly update or revise any views expressed or forward-looking statements.
NOT FDIC INSURED ◾ NO BANK GUARANTEE ◾ MAY LOSE VALUE
| | | | |
| 2 | | Wells Fargo Small Cap Value Fund | | Letter to shareholders (unaudited) |

Andrew Owen
President
Wells Fargo Funds
The second and third quarters of 2018 were characterized by growing economic and investment activity in the U.S.
Dear Shareholder:
We are pleased to offer you this semi-annual report for the Wells Fargo Small Cap Value Fund for the six-month period that ended September 30, 2018. The second and third quarters of 2018 were characterized by growing economic and investment activity in the U.S. In contrast, economies overseas were restrained as geopolitical tensions and rising interest rates diverted investor interest in those markets.
For the period, U.S. stocks, as measured by the S&P 500 Index,1 gained 11.41% and international stocks, as measured by the MSCI ACWI ex USA Index (Net),2 lost 1.93%. Based on the MSCI EM Index (Net),3 emerging market stocks lost 8.97%. For bond investors, the Bloomberg Barclays U.S. Aggregate Bond Index4 lost 0.14% while the Bloomberg Barclays Global Aggregate ex-USD Index5 fell 6.42%. The Bloomberg Barclays Municipal Bond Index6 added 0.72%, and the ICE BofAML U.S. High Yield Index7 was up 3.46%.
Global trade tensions escalated during the second quarter.
During the second quarter of 2018, the U.S. government imposed tariffs, and foreign governments in North America, Europe, and Asia retaliated. The actions marked the initialization of trade tensions that would escalate during the next six months. The increasing tensions chilled investment activity as observers awaited signals of next steps.
Meanwhile, inflation continued an upward trend. The CPI-U8 added 0.1% in June after an increase of 0.2% in both April and May. On a year-over-year basis, the all-items index rose 2.9% for the 12 months that ended June 30, 2018. The index for all items less food and energy rose 2.3% for the same 12-month period.
| 1 | The S&P 500 Index consists of 500 stocks chosen for market size, liquidity, and industry group representation. It is a market-value-weighted index with each stock’s weight in the index proportionate to its market value. You cannot invest directly in an index. |
| 2 | The Morgan Stanley Capital International (MSCI) All Country World Index (ACWI) ex USA Index (Net) is a free-float-adjusted market-capitalization-weighted index that is designed to measure the equity market performance of developed markets, excluding the United States and Canada. Source: MSCI. MSCI makes no express or implied warranties or representations and shall have no liability whatsoever with respect to any MSCI data contained herein. The MSCI data may not be further redistributed or used as a basis for other indices or any securities or financial products. This report is not approved, reviewed, or produced by MSCI. You cannot invest directly in an index. |
| 3 | The MSCI Emerging Markets (EM) Index (Net) is a free-float-adjusted market-capitalization-weighted index that is designed to measure large- and mid-cap equity market performance of emerging markets. The MSCI EM Index (Net) consists of the following 24 emerging market country indices: Brazil, Chile, China, Colombia, Czech Republic, Egypt, Greece, Hungary, India, Indonesia, Korea, Malaysia, Mexico, Pakistan, Peru, the Philippines, Poland, Qatar, Russia, South Africa, Taiwan, Thailand, Turkey, and the United Arab Emirates. You cannot invest directly in an index. |
| 4 | The Bloomberg Barclays U.S. Aggregate Bond Index is a broad-based benchmark that measures the investment-grade, U.S. dollar-denominated, fixed-rate taxable bond market, including Treasuries, government-related and corporate securities, mortgage-backed securities (agency fixed-rate and hybrid adjustable-rate mortgage pass-throughs), asset-backed securities, and commercial mortgage-backed securities. You cannot invest directly in an index. |
| 5 | The Bloomberg Barclays Global Aggregate ex-USD Index is an unmanaged index that provides a broad-based measure of the global investment-grade fixed-income markets excluding the U.S. dollar-denominated debt market. You cannot invest directly in an index. |
| 6 | The Bloomberg Barclays Municipal Bond Index is an unmanaged index composed of long-term tax-exempt bonds with a minimum credit rating of Baa. You cannot invest directly in an index. |
| 7 | The ICE BofAML U.S. High Yield Index is a market-capitalization-weighted index of domestic and Yankee high-yield bonds. The index tracks the performance of high-yield securities traded in the U.S. bond market. You cannot invest directly in an index. Copyright 2018. ICE Data Indices, LLC. All rights reserved. |
| 8 | The Consumer Price Index for All Urban Consumers (CPI-U) measures the changes in the price of a basket of goods and services purchased by urban consumers. The urban consumer population is deemed by many as a better representative measure of the general public because close to 90% of the country’s population lives in highly populated areas. You cannot invest directly in an index. |
| | | | | | |
| Letter to shareholders (unaudited) | | Wells Fargo Small Cap Value Fund | | | 3 | |
U.S. stocks gained while international stocks and bonds declined during the summer of 2018.
The U.S. economy strengthened during the summer months. Revised second-quarter gross domestic product data released in August showed the U.S. economy growing at a 4.2% rate. After ticking up slightly in June, the unemployment rate in the U.S. was 3.9% in July and August, according to the U.S. Department of Labor. Wages showed more consistent growth, and consumer confidence remained strong.
Several U.S. equity market indices reached records during August, with the S&P 500 Index gaining 7.76% for the three-month period that ended August 31, 2018. International stock values continued to suffer under the effects of a strong U.S. dollar and continuing trade tensions. The MSCI ACWI ex USA Index (Net) and the MSCI EM Index (Net) were down 4.70% and 1.64%, during the same three-month period.
The U.S. Federal Reserve (Fed) increased the federal funds rate in June, and expectations grew that two more rate increases were in the offing in 2018. Long-term interest rates in the U.S. remained at higher levels relative to the prior 10 years. Rates on 10-year and 30-year Treasury bonds—2.74% and 2.97%, respectively, on March 31, 2018—were 3.05% and 3.19%, respectively, on September 30, off their peak levels on May 17, 2018, of 3.11% and 3.25%, respectively. Some investors became more aware of and concerned about the potential for an inverted yield curve—sometimes a recession signal—as short-term rates increased more quickly than long-term rates. The Fed decided to forgo an interest rate increase at its August meeting.
Internationally, members of Prime Minister Theresa May’s U.K./Brexit negotiating team resigned amid unproductive negotiations. In early August, the Bank of England’s Monetary Policy Committee increased its key interest rate to 0.75%. Central banks in Europe and Japan maintained low interest rates and accommodative monetary policies. Amid rising trade uncertainty, the People’s Bank of China cut reserve requirement ratios and accelerated infrastructure spending and tax cuts for business enterprises and individuals. Nevertheless, a strengthening U.S. dollar and the trade tensions remained headwinds for investors overseas.
Don’t let short-term uncertainty derail long-term investment goals.
Periods of investment uncertainty can present challenges, but experience has taught us that maintaining long-term investment goals can be an effective way to plan for the future. To help you create a sound strategy based on your personal goals and risk tolerance, Wells Fargo Funds offers more than 100 mutual funds spanning a wide range of asset classes and investment styles. Although diversification cannot guarantee an investment profit or prevent losses, we believe it can be an effective way to manage investment risk and potentially smooth out overall portfolio performance. We encourage investors to know their investments and to understand that appropriate levels of risk-taking may unlock opportunities.
The U.S. economy strengthened during the summer months.
| | | | |
| 4 | | Wells Fargo Small Cap Value Fund | | Letter to shareholders (unaudited) |
Thank you for choosing to invest with Wells Fargo Funds. We appreciate your confidence in us and remain committed to helping you meet your financial needs.
Sincerely,

Andrew Owen
President
Wells Fargo Funds
Notice to shareholders
At a meeting held on August 14-15, 2018, the Board of Trustees of the Fund approved the following policy which will be effective on or about February 5, 2019:
Class C shares will convert automatically into Class A shares ten years after the initial date of purchase or, if you acquired your Class C shares through an exchange or conversion from another share class, ten years after the date you acquired your Class C shares. When Class C shares that you acquired through a purchase or exchange convert, any other Class C shares that you purchased with reinvested dividends and distributions also will convert into Class A shares on a pro rata basis. A shorter holding period may also apply depending on your intermediary. Please see “Appendix A—Sales Charge Reductions and Waivers for Certain Intermediaries” in the Fund’s prospectus or at the end of this report.
For further information about your Fund, contact your investment professional, visit our website at wellsfargofunds.com, or call us directly at 1-800-222-8222.
This page is intentionally left blank.
| | | | |
| 6 | | Wells Fargo Small Cap Value Fund | | Performance highlights (unaudited) |
Investment objective
The Fund seeks long-term capital appreciation.
Manager
Wells Fargo Funds Management, LLC
Subadviser
Wells Capital Management Incorporated
Portfolio managers
Erik C. Astheimer
Michael Schneider, CFA®
Average annual total returns (%) as of September 30, 20181
| | | | | | | | | | | | | | | | | | | | | | | | | | | | | | | | | | |
| | | | | Including sales charge | | | Excluding sales charge | | | Expense ratios2 (%) | |
| | | Inception date | | 1 year | | | 5 year | | | 10 year | | | 1 year | | | 5 year | | | 10 year | | | Gross | | | Net3 | |
| Class A (SMVAX) | | 11-30-2000 | | | (2.04 | ) | | | 6.18 | | | | 8.06 | | | | 3.95 | | | | 7.45 | | | | 8.70 | | | | 1.34 | | | | 1.29 | |
| Class C (SMVCX) | | 11-30-2000 | | | 2.24 | | | | 6.66 | | | | 7.90 | | | | 3.24 | | | | 6.66 | | | | 7.90 | | | | 2.09 | | | | 2.04 | |
| Class R6 (SMVRX) | | 6-28-2013 | | | – | | | | – | | | | – | | | | 4.36 | | | | 7.94 | | | | 9.19 | | | | 0.91 | | | | 0.84 | |
| Administrator Class (SMVDX) | | 7-30-2010 | | | – | | | | – | | | | – | | | | 4.18 | | | | 7.67 | | | | 8.95 | | | | 1.26 | | | | 1.09 | |
| Institutional Class (WFSVX) | | 7-31-2007 | | | – | | | | – | | | | – | | | | 4.36 | | | | 7.88 | | | | 9.16 | | | | 1.01 | | | | 0.89 | |
| Russell 2000® Value Index4 | | – | | | – | | | | – | | | | – | | | | 9.33 | | | | 9.91 | | | | 9.52 | | | | – | | | | – | |
Figures quoted represent past performance, which is no guarantee of future results, and do not reflect taxes that a shareholder may pay on fund distributions or the redemption of fund shares. Investment return and principal value of an investment will fluctuate so that an investor’s shares, when redeemed, may be worth more or less than their original cost. Performance shown without sales charges would be lower if sales charges were reflected. Current performance may be lower or higher than the performance data quoted, which assumes the reinvestment of dividends and capital gains. Current month-end performance is available on the Fund’s website, wellsfargofunds.com.
Index returns do not include transaction costs associated with buying and selling securities, any mutual fund fees or expenses, or any taxes. It is not possible to invest directly in an index.
For Class A shares, the maximum front-end sales charge is 5.75%. For Class C shares, the maximum contingent deferred sales charge is 1.00%. Performance including a contingent deferred sales charge assumes the sales charge for the corresponding time period. Class R6, Administrator Class, and Institutional Class shares are sold without a front-end sales charge or contingent deferred sales charge.
Stock values fluctuate in response to the activities of individual companies and general market and economic conditions. Smaller-company stocks tend to be more volatile and less liquid than those of larger companies. The use of derivatives may reduce returns and/or increase volatility. Certain investment strategies tend to increase the total risk of an investment (relative to the broader market). The Fund is exposed to foreign investment risk. Consult the Fund’s prospectus for additional information on these and other risks.
Please see footnotes on page 7.
| | | | | | |
| Performance highlights (unaudited) | | Wells Fargo Small Cap Value Fund | | | 7 | |
| | | | |
| Ten largest holdings (%) as of September 30, 20185 | |
Randgold Resources Limited ADR | | | 4.00 | |
National General Holdings Corporation | | | 3.52 | |
IBERIABANK Corporation | | | 3.21 | |
The Bancorp Incorporated | | | 3.18 | |
Navigator Holdings Limited | | | 2.98 | |
OSI Systems Incorporated | | | 2.76 | |
Sterling Bancorp | | | 2.52 | |
BankUnited Incorporated | | | 2.38 | |
Cray Incorporated | | | 2.34 | |
Freightcar America Incorporated | | | 2.24 | |
|
| Sector distribution as of September 30, 20186 |
|

|
| 1 | Historical performance shown for Class R6 shares prior to their inception reflects the performance of Institutional Class shares and includes the higher expenses applicable to Institutional Class shares. If these expenses had not been included, returns for Class R6 shares would be higher. Historical performance shown for Administrator Class shares prior to their inception reflects the performance of Institutional Class shares and has been adjusted to reflect the higher expenses applicable to Administrator Class shares. |
| 2 | Reflects the expense ratios as stated in the most recent prospectuses, which include the impact of 0.01% in acquired fund fees and expenses. The expense ratios shown are subject to change and may differ from the annualized expense ratios shown in the financial highlights of this report, which do not include acquired fund fees and expenses. |
| 3 | The manager has contractually committed through July 31, 2019, to waive fees and/or reimburse expenses to the extent necessary to cap the Fund’s Total Annual Fund Operating Expenses After Fee Waivers at 1.28% for Class A, 2.03% for Class C, 0.83% for Class R6, 1.08% for Administrator Class, and 0.88% for Institutional Class. After this time, the cap may be increased or the commitment to maintain the cap may be terminated only with the approval of the Board of Trustees. Brokerage commissions, stamp duty fees, interest, taxes, acquired fund fees and expenses (if any), and extraordinary expenses are excluded from the expense cap. Without this cap, the Fund’s returns would have been lower. The expense ratio paid by an investor is the net expense ratio (the total annual fund operating expenses after fee waivers) as stated in the prospectuses. |
| 4 | The Russell 2000® Value Index measures the performance of those Russell 2000 companies with lower price/book ratios and lower forecasted growth values. You cannot invest directly in an index. |
| 5 | The ten largest holdings, excluding cash, cash equivalents and any money market funds, are calculated based on the value of the investments divided by total net assets of the Fund. Holdings are subject to change and may have changed since the date specified. |
| 6 | Amounts are calculated based on the total long-term investments of the Fund. These amounts are subject to change and may have changed since the date specified. |
| | | | |
| 8 | | Wells Fargo Small Cap Value Fund | | Fund expenses (unaudited) |
As a shareholder of the Fund, you incur two types of costs: (1) transaction costs, including sales charges (loads) on purchase payments and contingent deferred sales charges (if any) on redemptions and (2) ongoing costs, including management fees, distribution (12b-1) and/or shareholder servicing fees, and other Fund expenses. This example is intended to help you understand your ongoing costs (in dollars) of investing in the Fund and to compare these costs with the ongoing costs of investing in other mutual funds.
The example is based on an investment of $1,000 invested at the beginning of the six-month period and held for the entire period from April 1, 2018 to September 30, 2018.
Actual expenses
The “Actual” line of the table below provides information about actual account values and actual expenses. You may use the information in this line, together with the amount you invested, to estimate the expenses that you paid over the period. Simply divide your account value by $1,000 (for example, an $8,600 account value divided by $1,000 = 8.6), then multiply the result by the number in the “Actual” line under the heading entitled “Expenses paid during period” for your applicable class of shares to estimate the expenses you paid on your account during this period.
Hypothetical example for comparison purposes
The “Hypothetical” line of the table below provides information about hypothetical account values and hypothetical expenses based on the Fund’s actual expense ratio and an assumed rate of return of 5% per year before expenses, which is not the Fund’s actual return. The hypothetical account values and expenses may not be used to estimate the actual ending account balance or expenses you paid for the period. You may use this information to compare the ongoing costs of investing in the Fund and other funds. To do so, compare this 5% hypothetical example with the 5% hypothetical examples that appear in the shareholder reports of the other funds.
Please note that the expenses shown in the table are meant to highlight your ongoing costs only and do not reflect any transactional costs, such as sales charges (loads) and contingent deferred sales charges. Therefore, the “Hypothetical” line of the table is useful in comparing ongoing costs only and will not help you determine the relative total costs of owning different funds. In addition, if these transactional costs were included, your costs would have been higher.
| | | | | | | | | | | | | | | | |
| | | Beginning
account value
4-1-2018 | | | Ending
account value
9-30-2018 | | | Expenses
paid during
the period1 | | | Annualized net
expense ratio | |
Class A | | | | | | | | | | | | | | | | |
Actual | | $ | 1,000.00 | | | $ | 1,028.67 | | | $ | 6.51 | | | | 1.28 | % |
Hypothetical (5% return before expenses) | | $ | 1,000.00 | | | $ | 1,018.65 | | | $ | 6.48 | | | | 1.28 | % |
Class C | | | | | | | | | | | | | | | | |
Actual | | $ | 1,000.00 | | | $ | 1,025.95 | | | $ | 10.31 | | | | 2.03 | % |
Hypothetical (5% return before expenses) | | $ | 1,000.00 | | | $ | 1,014.89 | | | $ | 10.25 | | | | 2.03 | % |
Class R6 | | | | | | | | | | | | | | | | |
Actual | | $ | 1,000.00 | | | $ | 1,031.32 | | | $ | 4.23 | | | | 0.83 | % |
Hypothetical (5% return before expenses) | | $ | 1,000.00 | | | $ | 1,020.91 | | | $ | 4.20 | | | | 0.83 | % |
Administrator Class | | | | | | | | | | | | | | | | |
Actual | | $ | 1,000.00 | | | $ | 1,029.99 | | | $ | 5.50 | | | | 1.08 | % |
Hypothetical (5% return before expenses) | | $ | 1,000.00 | | | $ | 1,019.65 | | | $ | 5.47 | | | | 1.08 | % |
Institutional Class | | | | | | | | | | | | | | | | |
Actual | | $ | 1,000.00 | | | $ | 1,030.83 | | | $ | 4.48 | | | | 0.88 | % |
Hypothetical (5% return before expenses) | | $ | 1,000.00 | | | $ | 1,020.66 | | | $ | 4.46 | | | | 0.88 | % |
| 1 | Expenses paid is equal to the annualized net expense ratio of each class multiplied by the average account value over the period, multiplied by the number of days in the most recent fiscal half-year divided by the number of days in the fiscal year (to reflect the one-half-year period). |
| | | | | | |
| Portfolio of investments—September 30, 2018 (unaudited) | | Wells Fargo Small Cap Value Fund | | | 9 | |
| | | | | | | | | | | | | | | | |
| Security name | | | | | | | | Shares | | | Value | |
|
Common Stocks: 98.77% | |
| | | | |
Communication Services: 1.07% | | | | | | | | | | | | | | | | |
| | | | |
| Diversified Telecommunication Services: 1.07% | | | | | | | | | | | | | | | | |
Iradium Communications Incorporated † | | | | | | | | | | | 247,700 | | | $ | 5,573,250 | |
| | | | | | | | | | | | | | | | |
| | | | |
Consumer Discretionary: 7.50% | | | | | | | | | | | | | | | | |
| | | | |
| Hotels, Restaurants & Leisure: 2.81% | | | | | | | | | | | | | | | | |
Bloomin’ Brands Incorporated | | | | | | | | | | | 68,000 | | | | 1,345,720 | |
Century Casinos Incorporated † | | | | | | | | | | | 1,402,400 | | | | 10,461,904 | |
Scientific Games Corporation Class A † | | | | | | | | | | | 99,000 | | | | 2,514,600 | |
The Wendy’s Company | | | | | | | | | | | 20,600 | | | | 353,084 | |
| |
| | | | 14,675,308 | |
| | | | | | | | | | | | | | | | |
| | | | |
| Household Durables: 4.23% | | | | | | | | | | | | | | | | |
Cavco Industries Incorporated † | | | | | | | | | | | 28,255 | | | | 7,148,515 | |
Nobility Homes Incorporated | | | | | | | | | | | 89,800 | | | | 2,195,610 | |
Skyline Champion Corporation | | | | | | | | | | | 100,300 | | | | 2,865,571 | |
Taylor Morrison Home Corporation Class A † | | | | | | | | | | | 181,000 | | | | 3,265,240 | |
The New Home Company Incorporated † | | | | | | | | | | | 819,300 | | | | 6,603,558 | |
| |
| | | | 22,078,494 | |
| | | | | | | | | | | | | | | | |
| | | | |
| Leisure Products: 0.42% | | | | | | | | | | | | | | | | |
Vista Outdoor Incorporated † | | | | | | | | | | | 123,400 | | | | 2,207,626 | |
| | | | | | | | | | | | | | | | |
| | | | |
| Textiles, Apparel & Luxury Goods: 0.04% | | | | | | | | | | | | | | | | |
G-III Apparel Group Limited † | | | | | | | | | | | 4,000 | | | | 192,760 | |
| | | | | | | | | | | | | | | | |
| | | | |
Consumer Staples: 0.38% | | | | | | | | | | | | | | | | |
| | | | |
| Food Products: 0.38% | | | | | | | | | | | | | | | | |
Amira Nature Foods Limited † | | | | | | | | | | | 1,187,100 | | | | 2,006,199 | |
| | | | | | | | | | | | | | | | |
| | | | |
Energy: 8.94% | | | | | | | | | | | | | | | | |
| | | | |
| Energy Equipment & Services: 3.37% | | | | | | | | | | | | | | | | |
CARBO Ceramics Incorporated † | | | | | | | | | | | 655,600 | | | | 4,753,100 | |
Newpark Resources Incorporated † | | | | | | | | | | | 544,200 | | | | 5,632,470 | |
Parker Drilling Company † | | | | | | | | | | | 51,266 | | | | 152,773 | |
Smart Sand Incorporated † | | | | | | | | | | | 466,300 | | | | 1,916,493 | |
Tidewater Incorporated † | | | | | | | | | | | 164,700 | | | | 5,136,993 | |
| |
| | | | 17,591,829 | |
| | | | | | | | | | | | | | | | |
| | | | |
| Oil, Gas & Consumable Fuels: 5.57% | | | | | | | | | | | | | | | | |
Navigator Holdings Limited † | | | | | | | | | | | 1,284,402 | | | | 15,541,264 | |
Oasis Petroleum Incorporated † | | | | | | | | | | | 367,200 | | | | 5,206,896 | |
Paramount Resources Limited Class A † | | | | | | | | | | | 266,500 | | | | 3,087,056 | |
Range Resources Corporation | | | | | | | | | | | 306,100 | | | | 5,200,639 | |
| |
| | | | 29,035,855 | |
| | | | | | | | | | | | | | | | |
The accompanying notes are an integral part of these financial statements.
| | | | |
| 10 | | Wells Fargo Small Cap Value Fund | | Portfolio of investments—September 30, 2018 (unaudited) |
| | | | | | | | | | | | | | | | |
| Security name | | | | | | | | Shares | | | Value | |
| | | | |
Financials: 32.20% | | | | | | | | | | | | | | | | |
| | | | |
| Banks: 23.38% | | | | | | | | | | | | | | | | |
Ameris Bancorp | | | | | | | | | | | 135,300 | | | $ | 6,183,210 | |
BankUnited Incorporated | | | | | | | | | | | 351,100 | | | | 12,428,940 | |
CenterState Banks Incorporated | | | | | | | | | | | 404,000 | | | | 11,332,200 | |
First Horizon National Corporation | | | | | | | | | | | 586,300 | | | | 10,119,538 | |
Hanmi Financial Corporation | | | | | | | | | | | 194,900 | | | | 4,853,010 | |
Hilltop Holdings Incorporated | | | | | | | | | | | 217,500 | | | | 4,386,975 | |
Hope Bancorp Incorporated | | | | | | | | | | | 708,700 | | | | 11,459,679 | |
IBERIABANK Corporation | | | | | | | | | | | 206,000 | | | | 16,758,100 | |
LegacyTexas Financial Group | | | | | | | | | | | 215,500 | | | | 9,180,300 | |
OFG Bancorp | | | | | | | | | | | 184,400 | | | | 2,978,060 | |
Sterling Bancorp | | | | | | | | | | | 597,100 | | | | 13,136,200 | |
The Bancorp Incorporated † | | | | | | | | | | | 1,732,000 | | | | 16,609,880 | |
Valley National Bancorp | | | | | | | | | | | 229,600 | | | | 2,583,000 | |
| |
| | | | 122,009,092 | |
| | | | | | | | | | | | | | | | |
| | | | |
| Consumer Finance: 0.66% | | | | | | | | | | | | | | | | |
Enova International Incorporated † | | | | | | | | | | | 119,700 | | | | 3,447,360 | |
| | | | | | | | | | | | | | | | |
| | | | |
| Insurance: 5.12% | | | | | | | | | | | | | | | | |
First Acceptance Corporation † | | | | | | | | | | | 83,100 | | | | 95,731 | |
James River Group Holdings Limited | | | | | | | | | | | 193,700 | | | | 8,255,494 | |
National General Holdings Corporation | | | | | | | | | | | 683,900 | | | | 18,355,876 | |
| |
| | | | 26,707,101 | |
| | | | | | | | | | | | | | | | |
| | | | |
| Mortgage REITs: 0.25% | | | | | | | | | | | | | | | | |
Redwood Trust Incorporated | | | | | | | | | | | 80,500 | | | | 1,307,320 | |
| | | | | | | | | | | | | | | | |
| | | | |
| Thrifts & Mortgage Finance: 2.79% | | | | | | | | | | | | | | | | |
Axos Financial Incorporated † | | | | | | | | | | | 49,000 | | | | 1,685,110 | |
Essent Group Limited † | | | | | | | | | | | 178,500 | | | | 7,898,625 | |
NMI Holdings Incorporated Class A † | | | | | | | | | | | 219,400 | | | | 4,969,410 | |
| |
| | | | 14,553,145 | |
| | | | | | | | | | | | | | | | |
| | | | |
Health Care: 6.11% | | | | | | | | | | | | | | | | |
| | | | |
| Health Care Equipment & Supplies: 1.34% | | | | | | | | | | | | | | | | |
Hologic Incorporated † | | | | | | | | | | | 42,800 | | | | 1,753,944 | |
Lantheus Holdings Incorporated † | | | | | | | | | | | 341,700 | | | | 5,108,415 | |
OraSure Technologies Incorporated † | | | | | | | | | | | 6,800 | | | | 105,060 | |
| |
| | | | 6,967,419 | |
| | | | | | | | | | | | | | | | |
| | | | |
| Health Care Providers & Services: 2.06% | | | | | | | | | | | | | | | | |
Cross Country Healthcare Incorporated † | | | | | | | | | | | 426,500 | | | | 3,723,345 | |
Tivity Health Incorporated † | | | | | | | | | | | 218,900 | | | | 7,037,635 | |
| |
| | | | 10,760,980 | |
| | | | | | | | | | | | | | | | |
The accompanying notes are an integral part of these financial statements.
| | | | | | |
| Portfolio of investments—September 30, 2018 (unaudited) | | Wells Fargo Small Cap Value Fund | | | 11 | |
| | | | | | | | | | | | | | | | |
| Security name | | | | | | | | Shares | | | Value | |
| | | | |
| Health Care Technology: 1.62% | | | | | | | | | | | | | | | | |
Allscripts Healthcare Solutions Incorporated † | | | | | | | | | | | 582,300 | | | $ | 8,297,775 | |
Omnicell Incorporated † | | | | | | | | | | | 2,200 | | | | 158,180 | |
| |
| | | | 8,455,955 | |
| | | | | | | | | | | | | | | | |
| | | | |
| Pharmaceuticals: 1.09% | | | | | | | | | | | | | | | | |
Mallinckrodt plc † | | | | | | | | | | | 52,300 | | | | 1,532,913 | |
Prestige Brands Holdings Incorporated † | | | | | | | | | | | 110,300 | | | | 4,179,267 | |
| |
| | | | 5,712,180 | |
| | | | | | | | | | | | | | | | |
| | | | |
Industrials: 20.38% | | | | | | | | | | | | | | | | |
| | | | |
| Air Freight & Logistics: 1.04% | | | | | | | | | | | | | | | | |
Atlas Air Worldwide Holdings Incorporated † | | | | | | | | | | | 84,900 | | | | 5,412,375 | |
| | | | | | | | | | | | | | | | |
|
| Airlines: 0.40% | |
Azul SA ADR † | | | | | | | | | | | 117,950 | | | | 2,098,331 | |
| | | | | | | | | | | | | | | | |
| | | | |
| Building Products: 3.66% | | | | | | | | | | | | | | | | |
Armstrong Flooring Incorporated † | | | | | | | | | | | 287,100 | | | | 5,196,510 | |
Builders FirstSource Incorporated † | | | | | | | | | | | 714,800 | | | | 10,493,264 | |
CSW Industrials Incorporated † | | | | | | | | | | | 62,900 | | | | 3,377,730 | |
| |
| | | | 19,067,504 | |
| | | | | | | | | | | | | | | | |
| | | | |
| Commercial Services & Supplies: 4.60% | | | | | | | | | | | | | | | | |
ABM Industries Incorporated | | | | | | | | | | | 188,100 | | | | 6,066,225 | |
ACCO Brands Corporation | | | | | | | | | | | 982,600 | | | | 11,103,380 | |
Healthcare Services Group Incorporated | | | | | | | | | | | 162,900 | | | | 6,616,998 | |
Hudson Technologies Incorporated † | | | | | | | | | | | 180,500 | | | | 231,040 | |
| |
| | | | 24,017,643 | |
| | | | | | | | | | | | | | | | |
| | | | |
| Construction & Engineering: 1.78% | | | | | | | | | | | | | | | | |
Bird Construction Incorporated (a) | | | | | | | | | | | 240,500 | | | | 1,468,972 | |
IES Holdings Incorporated † | | | | | | | | | | | 119,700 | | | | 2,334,150 | |
Tutor Perini Corporation † | | | | | | | | | | | 290,700 | | | | 5,465,160 | |
| |
| | | | 9,268,282 | |
| | | | | | | | | | | | | | | | |
| | | | |
| Machinery: 5.76% | | | | | | | | | | | | | | | | |
Actuant Corporation Class A | | | | | | | | | | | 219,700 | | | | 6,129,630 | |
Freightcar America Incorporated (l) | | | | | | | | | | | 726,905 | | | | 11,681,363 | |
Milacron Holdings Corporation † | | | | | | | | | | | 297,400 | | | | 6,022,350 | |
Mueller Water Products Incorporated Class A | | | | | | | | | | | 538,800 | | | | 6,201,588 | |
| |
| | | | 30,034,931 | |
| | | | | | | | | | | | | | | | |
| | | | |
| Marine: 0.90% | | | | | | | | | | | | | | | | |
Seaspan Corporation | | | | | | | | | | | 564,900 | | | | 4,705,617 | |
| | | | | | | | | | | | | | | | |
| | | | |
| Professional Services: 1.24% | | | | | | | | | | | | | | | | |
Hill International Incorporated † | | | | | | | | | | | 1,581,200 | | | | 6,482,920 | |
| | | | | | | | | | | | | | | | |
The accompanying notes are an integral part of these financial statements.
| | | | |
| 12 | | Wells Fargo Small Cap Value Fund | | Portfolio of investments—September 30, 2018 (unaudited) |
| | | | | | | | | | | | | | | | |
| Security name | | | | | | | | Shares | | | Value | |
| | | | |
| Trading Companies & Distributors: 1.00% | | | | | | | | | | | | | | | | |
Applied Industrial Technologies Incorporated | | | | | | | | | | | 45,500 | | | $ | 3,560,375 | |
BMC Stock Holdings Incorporated † | | | | | | | | | | | 63,900 | | | | 1,191,735 | |
Textainer Group Holdings Limited † | | | | | | | | | | | 38,000 | | | | 486,400 | |
| |
| | | | 5,238,510 | |
| | | | | | | | | | | | | | | | |
| | | | |
Information Technology: 9.05% | | | | | | | | | | | | | | | | |
| | | | |
| Communications Equipment: 2.41% | | | | | | | | | | | | | | | | |
Finisar Corporation † | | | | | | | | | | | 354,800 | | | | 6,758,940 | |
Harmonic Incorporated † | | | | | | | | | | | 1,058,000 | | | | 5,819,000 | |
| |
| | | | 12,577,940 | |
| | | | | | | | | | | | | | | | |
| | | | |
| Electronic Equipment, Instruments & Components: 3.15% | | | | | | | | | | | | | | | | |
Coherent Incorporated † | | | | | | | | | | | 11,700 | | | | 2,014,623 | |
OSI Systems Incorporated † | | | | | | | | | | | 188,700 | | | | 14,399,697 | |
| |
| | | | 16,414,320 | |
| | | | | | | | | | | | | | | | |
| | | | |
| IT Services: 0.47% | | | | | | | | | | | | | | | | |
Travelport Worldwide Limited | | | | | | | | | | | 146,000 | | | | 2,463,020 | |
| | | | | | | | | | | | | | | | |
|
| Technology Hardware, Storage & Peripherals: 3.02% | |
Cray Incorporated † | | | | | | | | | | | 568,100 | | | | 12,214,150 | |
Quantum Corporation † | | | | | | | | | | | 1,488,300 | | | | 3,571,920 | |
| |
| | | | 15,786,070 | |
| | | | | | | | | | | | | | | | |
| | | | |
Materials: 11.31% | | | | | | | | | | | | | | | | |
| | | | |
| Containers & Packaging: 0.77% | | | | | | | | | | | | | | | | |
Intertape Polymer Group Incorporated | | | | | | | | | | | 269,200 | | | | 4,013,772 | |
| | | | | | | | | | | | | | | | |
| | | | |
| Metals & Mining: 10.54% | | | | | | | | | | | | | | | | |
Agnico Eagle Mines Limited-U.S. Exchange Traded Shares | | | | | | | | | | | 5,000 | | | | 171,000 | |
Argonaut Gold Incorporated † | | | | | | | | | | | 734,600 | | | | 830,098 | |
Carpenter Technology Corporation | | | | | | | | | | | 91,400 | | | | 5,388,030 | |
Eldorado Gold Corporation † | | | | | | | | | | | 1,242,600 | | | | 1,097,340 | |
Haynes International Incorporated | | | | | | | | | | | 194,000 | | | | 6,887,000 | |
NovaGold Resources Incorporated † | | | | | | | | | | | 646,000 | | | | 2,396,660 | |
Olympic Steel Incorporated | | | | | | | | | | | 27,700 | | | | 578,099 | |
Randgold Resources Limited ADR | | | | | | | | | | | 295,700 | | | | 20,861,635 | |
Royal Gold Incorporated | | | | | | | | | | | 34,300 | | | | 2,643,158 | |
Ryerson Holding Corporation † | | | | | | | | | | | 41,900 | | | | 473,470 | |
Sandstorm Gold Limited † | | | | | | | | | | | 2,869,800 | | | | 10,704,354 | |
Schnitzer Steel Industries Incorporated Class A | | | | | | | | | | | 31,000 | | | | 838,550 | |
SSR Mining Incorporated † | | | | | | | | | | | 188,700 | | | | 1,643,577 | |
TimkenSteel Corporation † | | | | | | | | | | | 31,100 | | | | 462,457 | |
| |
| | | | 54,975,428 | |
| | | | | | | | | | | | | | | | |
| | | | |
Real Estate: 1.83% | | | | | | | | | | | | | | | | |
| | | | |
| Equity REITs: 1.83% | | | | | | | | | | | | | | | | |
UMH Properties Incorporated | | | | | | | | | | | 611,700 | | | | 9,566,988 | |
| | | | | | | | | | | | | | | | |
| |
Total Common Stocks (Cost $424,763,061) | | | | 515,405,524 | |
| | | | | | | | | | | | | | | | |
The accompanying notes are an integral part of these financial statements.
| | | | | | |
| Portfolio of investments—September 30, 2018 (unaudited) | | Wells Fargo Small Cap Value Fund | | | 13 | |
| | | | | | | | | | | | | | | | |
| Security name | | | | | | | | Shares | | | Value | |
| | | | |
Exchange-Traded Funds: 1.28% | | | | | | | | | | | | | | | | |
SPDR S&P Regional Banking ETF | | | | | | | | | | | 22,400 | | | $ | 1,331,008 | |
VanEck Vectors Gold Miners ETF | | | | | | | | | | | 181,451 | | | | 3,360,473 | |
VanEck Vectors Junior Gold Miners ETF | | | | | | | | | | | 72,683 | | | | 1,988,607 | |
| |
Total Exchange-Traded Funds (Cost $7,826,675) | | | | 6,680,088 | |
| | | | | | | | | | | | | | | | |
| | | | |
| | | Yield | | | | | | | | | | |
| Short-Term Investments: 0.20% | | | | | | | | | | | | | | | | |
| | | | |
| Investment Companies: 0.20% | | | | | | | | | | | | | | | | |
Wells Fargo Government Money Market Fund Select Class (l)(u) | | | 1.99 | % | | | | | | | 1,036,143 | | | | 1,036,143 | |
| | | | | | | | | | | | | | | | |
| |
Total Short-Term Investments (Cost $1,036,143) | | | | 1,036,143 | |
| | | | | | | | | | | | | | | | |
| | | | | | | | |
| Total investments in securities (Cost $433,625,879) | | | 100.25 | % | | | 523,121,755 | |
Other assets and liabilities, net | | | (0.25 | ) | | | (1,318,764 | ) |
| | | | | | | | |
| Total net assets | | | 100.00 | % | | $ | 521,802,991 | |
| | | | | | | | |
| † | Non-income-earning security |
| (a) | The security is fair valued in accordance with procedures approved by the Board of Trustees. |
| (l) | The issuer of the security is an affiliated person of the Fund as defined in the Investment Company Act of 1940. |
| (u) | The rate represents the 7-day annualized yield at period end. |
Abbreviations:
| ADR | American depositary receipt |
| REIT | Real estate investment trust |
Investments in Affiliates
An affiliated investment is an investment in which the Fund owns at least 5% of the outstanding voting shares of the issuer or as a result of other relationships, such as the Fund and the issuer having the same investment manager. Transactions with issuers that were either affiliated persons of the Fund at the beginning of the period or the end of the period were as follows:
| | | | | | | | | | | | | | | | | | | | | | | | | | | | | | | | | | | | |
| | | Shares,
beginning of
period | | | Shares
purchased | | | Shares
sold | | | Shares,
end of
period | | | Net
realized
gains
(losses) | | | Net
change in
unrealized
gains
(losses) | | | Income
from
affiliated
securities | | | Value, end
of period | | | % of
net
assets | |
Common Stocks | | | | | | | | | | | | | | | | | | | | | | | | | | | | | | | | | | | | |
Financials | | | | | | | | | | | | | | | | | | | | | | | | | | | | | | | | | | | | |
Capital Markets | | | | | | | | | | | | | | | | | | | | | | | | | | | | | | | | | | | | |
Medley Management Incorporated Class A * | | | 323,400 | | | | 0 | | | | 323,400 | | | | 0 | | | $ | (3,574,301 | ) | | $ | 3,438,521 | | | $ | 121,160 | | | $ | 0 | | | | | |
Industrials | | | | | | | | | | | | | | | | | | | | | | | | | | | | | | | | | | | | |
Machinery | | | | | | | | | | | | | | | | | | | | | | | | | | | | | | | | | | | | |
Freightcar America Incorporated | | | 697,800 | | | | 29,105 | | | | 0 | | | | 726,905 | | | | 0 | | | | 1,860,599 | | | | 0 | | | | 11,681,363 | | | | | |
| | | | | | | | | |
| | | | | | | | | | | | | | | | | | | | | | | | | | | | | | | 11,681,363 | | | | 2.24 | % |
| | | | | | | | | | | | | | | | | | | | | | | | | | | | | | | | | | | | |
| | | | | | | | | |
Short-Term Investments | | | | | | | | | | | | | | | | | | | | | | | | | | | | | | | | | | | | |
Investment Companies | | | | | | | | | | | | | | | | | | | | | | | | | | | | | | | | | | | | |
Wells Fargo Government Money Market Fund Select Class | | | 1,673,791 | | | | 60,254,026 | | | | 60,891,674 | | | | 1,036,143 | | | | 0 | | | | 0 | | | | 34,917 | | | | 1,036,143 | | | | 0.20 | |
| | | | | | | | | | | | | | | | | | | | | | | | | | | | | | | | | | | | |
| | | | | | | | | | | | | | | | | | $ | (3,574,301 | ) | | $ | 5,299,120 | | | $ | 156,077 | | | $ | 12,717,506 | | | | 2.44 | % |
| | | | | | | | | | | | | | | | | | | | | | | | | | | | | | | | | | | | |
| | * | No longer an affiliate of the Fund at the end of the period. |
The accompanying notes are an integral part of these financial statements.
| | | | |
| 14 | | Wells Fargo Small Cap Value Fund | | Statement of assets and liabilities—September 30, 2018 (unaudited) |
| | | | |
| | | | |
| |
Assets | | | | |
Investments in unaffiliated securities, at value (cost $421,561,642) | | $ | 510,404,249 | |
Investments in affiliated securities, at value (cost $12,064,237) | | | 12,717,506 | |
Cash | | | 1,021,243 | |
Receivable for investments sold | | | 171,611 | |
Receivable for Fund shares sold | | | 155,875 | |
Receivable for dividends | | | 247,814 | |
Prepaid expenses and other assets | | | 67,181 | |
| | | | |
Total assets | | | 524,785,479 | |
| | | | |
| |
Liabilities | | | | |
Payable for investments purchased | | | 1,860,841 | |
Payable for Fund shares redeemed | | | 508,321 | |
Management fee payable | | | 330,966 | |
Administration fees payable | | | 83,123 | |
Distribution fee payable | | | 13,881 | |
Trustees’ fees and expenses payable | | | 2,340 | |
Accrued expenses and other liabilities | | | 183,016 | |
| | | | |
Total liabilities | | | 2,982,488 | |
| | | | |
Total net assets | | $ | 521,802,991 | |
| | | | |
| |
NET ASSETS CONSIST OF | | | | |
Paid-in capital | | $ | 333,612,753 | |
Total distributable earnings | | | 188,190,238 | |
| | | | |
Total net assets | | $ | 521,802,991 | |
| | | | |
| |
COMPUTATION OF NET ASSET VALUE AND OFFERING PRICE PER SHARE | | | | |
Net assets – Class A | | $ | 418,932,107 | |
Shares outstanding – Class A1 | | | 23,825,581 | |
Net asset value per share – Class A | | | $17.58 | |
Maximum offering price per share – Class A2 | | | $18.65 | |
Net assets – Class C | | $ | 21,972,130 | |
Shares outstanding – Class C1 | | | 1,853,297 | |
Net asset value per share – Class C | | | $11.86 | |
Net assets – Class R6 | | $ | 42,023,489 | |
Shares outstanding – Class R61 | | | 2,199,717 | |
Net asset value per share – Class R6 | | | $19.10 | |
Net assets – Administrator Class | | $ | 9,334,657 | |
Shares outstanding – Administrator Class1 | | | 494,204 | |
Net asset value per share – Administrator Class | | | $18.89 | |
Net assets – Institutional Class | | $ | 29,540,608 | |
Shares outstanding – Institutional Class1 | | | 1,549,457 | |
Net asset value per share – Institutional Class | | | $19.07 | |
| 1 | The Fund has an unlimited number of authorized shares. |
| 2 | Maximum offering price is computed as 100/94.25 of net asset value. On investments of $50,000 or more, the offering price is reduced. |
The accompanying notes are an integral part of these financial statements.
| | | | | | |
| Statement of operations—six months ended September 30, 2018 (unaudited) | | Wells Fargo Small Cap Value Fund | | | 15 | |
| | | | |
| | | | |
| |
Investment income | | | | |
Dividends (net of foreign withholding taxes of $15,114) | | $ | 2,519,851 | |
Income from affiliated securities | | | 156,077 | |
| | | | |
Total investment income | | | 2,675,928 | |
| | | | |
| |
Expenses | | | | |
Management fee | | | 2,343,017 | |
Administration fees | | | | |
Class A | | | 464,839 | |
Class C | | | 25,319 | |
Class R6 | | | 6,553 | |
Administrator Class | | | 6,468 | |
Institutional Class | | | 21,087 | |
Shareholder servicing fees | | | | |
Class A | | | 553,379 | |
Class C | | | 30,142 | |
Administrator Class | | | 12,439 | |
Distribution fee | | | | |
Class C | | | 90,427 | |
Custody and accounting fees | | | 22,522 | |
Professional fees | | | 27,911 | |
Registration fees | | | 24,293 | |
Shareholder report expenses | | | 49,973 | |
Trustees’ fees and expenses | | | 12,023 | |
Other fees and expenses | | | 13,822 | |
| | | | |
Total expenses | | | 3,704,214 | |
Less: Fee waivers and/or expense reimbursements | | | (248,387 | ) |
| | | | |
Net expenses | | | 3,455,827 | |
| | | | |
Net investment loss | | | (779,899 | ) |
| | | | |
| |
REALIZED AND UNREALIZED GAINS (LOSSES) ON INVESTMENTS | | | | |
| |
Net realized gains (losses) on: | | | | |
Unaffiliated securities | | | 32,966,532 | |
Affiliated securities | | | (3,574,301 | ) |
| | | | |
Net realized gains on investments | | | 29,392,231 | |
| | | | |
| |
Net change in unrealized gains (losses) on: | | | | |
Unaffiliated securities | | | (17,109,203 | ) |
Affiliated securities | | | 5,299,120 | |
| | | | |
Net change in unrealized gains (losses) on investments | | | (11,810,083 | ) |
| | | | |
Net realized and unrealized gains (losses) on investments | | | 17,582,148 | |
| | | | |
Net increase in net assets resulting from operations | | $ | 16,802,249 | |
| | | | |
The accompanying notes are an integral part of these financial statements.
| | | | |
| 16 | | Wells Fargo Small Cap Value Fund | | Statement of changes in net assets |
| | | | | | | | | | | | | | | | |
| | | Six months ended
September 30, 2018
(unaudited) | | | Year ended
March 31, 20181 | |
| | | | |
Operations | | | | | | | | | | | | | | | | |
Net investment loss | | | | | | $ | (779,899 | ) | | | | | | $ | (2,802,360 | ) |
Net realized gains on investments | | | | | | | 29,392,231 | | | | | | | | 316,315,049 | |
Net change in unrealized gains (losses) on investments | | | | | | | (11,810,083 | ) | | | | | | | (259,345,164 | ) |
| | | | |
Net increase in net assets resulting from operations | | | | | | | 16,802,249 | | | | | | | | 54,167,525 | |
| | | | |
| | | | |
Distributions to shareholders | | | | | | | | | | | | | | | | |
Class A | | | | | | | 0 | | | | | | | | (139,185,621 | ) |
Class C | | | | | | | 0 | | | | | | | | (11,577,587 | ) |
Class R6 | | | | | | | 0 | | | | | | | | (18,852,432 | ) |
Administrator Class | | | | | | | 0 | | | | | | | | (3,280,317 | ) |
Institutional Class | | | | | | | 0 | | | | | | | | (59,214,889 | ) |
| | | | |
Total distributions to shareholders | | | | | | | 0 | | | | | | | | (232,110,846 | ) |
| | | | |
| | | | |
Capital share transactions | | | Shares | | | | | | | | Shares | | | | | |
Proceeds from shares sold | | | | | | | | | | | | | | | | |
Class A | | | 392,638 | | | | 7,077,978 | | | | 1,049,139 | | | | 20,283,556 | |
Class C | | | 24,853 | | | | 297,876 | | | | 82,745 | | | | 1,093,645 | |
Class R6 | | | 67,688 | | | | 1,329,668 | | | | 362,552 | | | | 7,674,684 | |
Administrator Class | | | 28,570 | | | | 552,183 | | | | 79,721 | | | | 1,605,699 | |
Institutional Class | | | 209,676 | | | | 4,143,355 | | | | 453,494 | | | | 9,352,699 | |
| | | | |
| | | | | | | 13,401,060 | | | | | | | | 40,010,283 | |
| | | | |
Reinvestment of distributions | | | | | | | | | | | | | | | | |
Class A | | | 0 | | | | 0 | | | | 7,549,312 | | | | 135,464,919 | |
Class C | | | 0 | | | | 0 | | | | 870,426 | | | | 10,955,100 | |
Class R6 | | | 0 | | | | 0 | | | | 964,823 | | | | 18,847,152 | |
Administrator Class | | | 0 | | | | 0 | | | | 144,268 | | | | 2,762,509 | |
Institutional Class | | | 0 | | | | 0 | | | | 2,910,455 | | | | 57,830,989 | |
| | | | |
| | | | | | | 0 | | | | | | | | 225,860,669 | |
| | | | |
Payment for shares redeemed | | | | | | | | | | | | | | | | |
Class A | | | (2,183,540 | ) | | | (39,099,404 | ) | | | (5,792,964 | ) | | | (110,590,516 | ) |
Class C | | | (343,038 | ) | | | (4,189,927 | ) | | | (909,855 | ) | | | (12,886,548 | ) |
Class R6 | | | (225,650 | ) | | | (4,404,270 | ) | | | (2,930,324 | ) | | | (61,212,656 | ) |
Administrator Class | | | (76,226 | ) | | | (1,468,739 | ) | | | (251,974 | ) | | | (5,114,206 | ) |
Institutional Class | | | (428,689 | ) | | | (8,358,460 | ) | | | (19,803,060 | ) | | | (399,900,378 | ) |
| | | | |
| | | | | | | (57,520,800 | ) | | | | | | | (589,704,304 | ) |
| | | | |
Net decrease in net assets resulting from capital share transactions | | | | | | | (44,119,740 | ) | | | | | | | (323,833,352 | ) |
| | | | |
Total decrease in net assets | | | | | | | (27,317,491 | ) | | | | | | | (501,776,673 | ) |
| | | | |
| | | | |
Net assets | | | | | | | | | | | | | | | | |
Beginning of period | | | | | | | 549,120,482 | | | | | | | | 1,050,897,155 | |
| | | | |
End of period | | | | | | $ | 521,802,991 | | | | | | | $ | 549,120,482 | |
| | | | |
| 1 | Effective for all filings after November 4, 2018, the SEC prospectively eliminated the requirements to parenthetically disclose undistributed net investment income at the end of the period and to disaggregate distributions to shareholders between distributions from net investment income and distributions from realized gains. Accumulated net investment loss at March 31, 2018 was $666,360. The disaggregated distributions information for the year ended March 31, 2018 is included in Note 7, Distributions to Shareholders, in the notes to the financial statements. |
The accompanying notes are an integral part of these financial statements.
| | | | | | |
| Financial highlights | | Wells Fargo Small Cap Value Fund | | | 17 | |
(For a share outstanding throughout each period)
| | | | | | | | | | | | | | | | | | | | | | | | | | | | |
| | | Six months ended
September 30, 2018
(unaudited) | | | Year ended March 31 | | | Year ended
October 31, 2013 | |
| CLASS A | | 2018 | | | 2017 | | | 2016 | | | 2015 | | | 20141 | |
Net asset value, beginning of period | | | $17.09 | | | | $21.68 | | | | $18.84 | | | | $27.51 | | | | $35.74 | | | | $36.33 | | | | $32.87 | |
Net investment income (loss) | | | (0.03 | )2 | | | (0.09 | )2 | | | (0.11 | ) | | | (0.06 | )2 | | | 0.01 | 2 | | | 0.18 | | | | 0.23 | |
Net realized and unrealized gains (losses) on investments | | | 0.52 | | | | 1.62 | | | | 5.45 | | | | (1.19 | ) | | | (2.55 | ) | | | 2.71 | | | | 4.68 | |
| | | | | | | | | | | | | | | | | | | | | | | | | | | | |
Total from investment operations | | | 0.49 | | | | 1.53 | | | | 5.34 | | | | (1.25 | ) | | | (2.54 | ) | | | 2.89 | | | | 4.91 | |
Distributions to shareholders from | | | | | | | | | | | | | | | | | | | | | | | | | | | | |
Net investment income | | | 0.00 | | | | 0.00 | | | | 0.00 | | | | 0.00 | | | | (0.13 | ) | | | (0.11 | ) | | | (0.24 | ) |
Net realized gains | | | 0.00 | | | | (6.12 | ) | | | (2.50 | ) | | | (7.42 | ) | | | (5.56 | ) | | | (3.37 | ) | | | (1.21 | ) |
| | | | | | | | | | | | | | | | | | | | | | | | | | | | |
Total distributions to shareholders | | | 0.00 | | | | (6.12 | ) | | | (2.50 | ) | | | (7.42 | ) | | | (5.69 | ) | | | (3.48 | ) | | | (1.45 | ) |
Net asset value, end of period | | | $17.58 | | | | $17.09 | | | | $21.68 | | | | $18.84 | | | | $27.51 | | | | $35.74 | | | | $36.33 | |
Total return3 | | | 2.87 | % | | | 7.97 | % | | | 29.92 | % | | | (2.90 | )% | | | (7.29 | )% | | | 8.87 | % | | | 15.67 | % |
Ratios to average net assets (annualized) | | | | | | | | | | | | | | | | | | | | | | | | | | | | |
Gross expenses | | | 1.36 | % | | | 1.33 | % | | | 1.32 | % | | | 1.36 | % | | | 1.35 | % | | | 1.33 | % | | | 1.33 | % |
Net expenses | | | 1.28 | % | | | 1.28 | % | | | 1.28 | % | | | 1.28 | % | | | 1.29 | % | | | 1.30 | % | | | 1.30 | % |
Net investment income (loss) | | | (0.31 | )% | | | (0.47 | )% | | | (0.48 | )% | | | (0.27 | )% | | | 0.02 | % | | | 1.26 | % | | | 0.72 | % |
Supplemental data | | | | | | | | | | | | | | | | | | | | | | | | | | | | |
Portfolio turnover rate | | | 19 | % | | | 36 | % | | | 31 | % | | | 16 | % | | | 9 | % | | | 7 | % | | | 18 | % |
Net assets, end of period (000s omitted) | | | $418,932 | | | | $437,704 | | | | $494,607 | | | | $441,679 | | | | $289,669 | | | | $443,671 | | | | $482,677 | |
| 1 | For the five months ended March 31, 2014. The Fund changed its fiscal year end from October 31 to March 31, effective March 31, 2014. |
| 2 | Calculated based upon average shares outstanding |
| 3 | Total return calculations do not include any sales charges. Returns for periods of less than one year are not annualized. |
The accompanying notes are an integral part of these financial statements.
| | | | |
| 18 | | Wells Fargo Small Cap Value Fund | | Financial highlights |
(For a share outstanding throughout each period)
| | | | | | | | | | | | | | | | | | | | | | | | | | | | |
| | | Six months ended
September 30, 2018 (unaudited) | | | Year ended March 31 | | | Year ended
October 31, 2013 | |
| CLASS C | | 2018 | | | 2017 | | | 2016 | | | 2015 | | | 20141 | |
Net asset value, beginning of period | | | $11.56 | | | | $16.67 | | | | $15.09 | | | | $23.80 | | | | $31.89 | | | | $32.77 | | | | $29.82 | |
Net investment income (loss) | | | (0.06 | )2 | | | (0.17 | )2 | | | (0.20 | )2 | | | (0.24 | )2 | | | (0.20 | )2 | | | 0.07 | 2 | | | (0.02 | )2 |
Net realized and unrealized gains (losses) on investments | | | 0.36 | | | | 1.18 | | | | 4.28 | | | | (1.05 | ) | | | (2.27 | ) | | | 2.42 | | | | 4.23 | |
| | | | | | | | | | | | | | | | | | | | | | | | | | | | |
Total from investment operations | | | 0.30 | | | | 1.01 | | | | 4.08 | | | | (1.29 | ) | | | (2.47 | ) | | | 2.49 | | | | 4.21 | |
Distributions to shareholders from | | | | | | | | | | | | | | | | | | | | | | | | | | | | |
Net investment income | | | 0.00 | | | | 0.00 | | | | 0.00 | | | | 0.00 | | | | (0.06 | ) | | | 0.00 | | | | (0.05 | ) |
Net realized gains | | | 0.00 | | | | (6.12 | ) | | | (2.50 | ) | | | (7.42 | ) | | | (5.56 | ) | | | (3.37 | ) | | | (1.21 | ) |
| | | | | | | | | | | | | | | | | | | | | | | | | | | | |
Total distributions to shareholders | | | 0.00 | | | | (6.12 | ) | | | (2.50 | ) | | | (7.42 | ) | | | (5.62 | ) | | | (3.37 | ) | | | (1.26 | ) |
Net asset value, end of period | | | $11.86 | | | | $11.56 | | | | $16.67 | | | | $15.09 | | | | $23.80 | | | | $31.89 | | | | $32.77 | |
Total return3 | | | 2.60 | % | | | 7.08 | % | | | 28.93 | % | | | (3.58 | )% | | | (8.00 | )% | | | 8.53 | % | | | 14.80 | % |
Ratios to average net assets (annualized) | | | | | | | | | | | | | | | | | | | | | | | | | | | | |
Gross expenses | | | 2.11 | % | | | 2.08 | % | | | 2.07 | % | | | 2.11 | % | | | 2.10 | % | | | 2.08 | % | | | 2.08 | % |
Net expenses | | | 2.03 | % | | | 2.03 | % | | | 2.03 | % | | | 2.03 | % | | | 2.04 | % | | | 2.05 | % | | | 2.05 | % |
Net investment income (loss) | | | (1.06 | )% | | | (1.23 | )% | | | (1.23 | )% | | | (1.18 | )% | | | (0.70 | )% | | | 0.52 | % | | | (0.06 | )% |
Supplemental data | | | | | | | | | | | | | | | | | | | | | | | | | | | | |
Portfolio turnover rate | | | 19 | % | | | 36 | % | | | 31 | % | | | 16 | % | | | 9 | % | | | 7 | % | | | 18 | % |
Net assets, end of period (000s omitted) | | | $21,972 | | | | $25,111 | | | | $35,470 | | | | $33,601 | | | | $80,969 | | | | $105,309 | | | | $105,491 | |
| 1 | For the five months ended March 31, 2014. The Fund changed its fiscal year end from October 31 to March 31, effective March 31, 2014. |
| 2 | Calculated based upon average shares outstanding |
| 3 | Total return calculations do not include any sales charges. Returns for periods of less than one year are not annualized. |
The accompanying notes are an integral part of these financial statements.
| | | | | | |
| Financial highlights | | Wells Fargo Small Cap Value Fund | | | 19 | |
(For a share outstanding throughout each period)
| | | | | | | | | | | | | | | | | | | | | | | | | | | | |
| | | Six months ended
September 30, 2018
(unaudited) | | | Year ended March 31 | | | Year ended October 31, 20132 | |
| CLASS R6 | | 2018 | | | 2017 | | | 2016 | | | 2015 | | | 20141 | |
Net asset value, beginning of period | | | $18.52 | | | | $22.93 | | | | $19.72 | | | | $28.29 | | | | $36.52 | | | | $37.13 | | | | $33.69 | |
Net investment income (loss) | | | 0.04 | | | | (0.00 | )3,4 | | | (0.01 | )3 | | | 0.03 | 3 | | | 0.23 | 3 | | | 0.35 | | | | 0.07 | 3 |
Net realized and unrealized gains (losses) on investments | | | 0.54 | | | | 1.71 | | | | 5.72 | | | | (1.18 | ) | | | (2.69 | ) | | | 2.67 | | | | 3.37 | |
| | | | | | | | | | | | | | | | | | | | | | | | | | | | |
Total from investment operations | | | 0.58 | | | | 1.71 | | | | 5.71 | | | | (1.15 | ) | | | (2.46 | ) | | | 3.02 | | | | 3.44 | |
Distributions to shareholders from | | | | | | | | | | | | | | | | | | | | | | | | | | | | |
Net investment income | | | 0.00 | | | | 0.00 | | | | 0.00 | | | | 0.00 | | | | (0.21 | ) | | | (0.26 | ) | | | 0.00 | |
Net realized gains | | | 0.00 | | | | (6.12 | ) | | | (2.50 | ) | | | (7.42 | ) | | | (5.56 | ) | | | (3.37 | ) | | | 0.00 | |
| | | | | | | | | | | | | | | | | | | | | | | | | | | | |
Total distributions to shareholders | | | 0.00 | | | | (6.12 | ) | | | (2.50 | ) | | | (7.42 | ) | | | (5.77 | ) | | | (3.63 | ) | | | 0.00 | |
Net asset value, end of period | | | $19.10 | | | | $18.52 | | | | $22.93 | | | | $19.72 | | | | $28.29 | | | | $36.52 | | | | $37.13 | |
Total return5 | | | 3.13 | % | | | 8.38 | % | | | 30.50 | % | | | (2.43 | )% | | | (6.90 | )% | | | 9.07 | % | | | 10.21 | % |
Ratios to average net assets (annualized) | | | | | | | | | | | | | | | | | | | | | | | | | | | | |
Gross expenses | | | 0.93 | % | | | 0.90 | % | | | 0.89 | % | | | 0.92 | % | | | 0.87 | % | | | 0.85 | % | | | 0.85 | % |
Net expenses | | | 0.83 | % | | | 0.83 | % | | | 0.83 | % | | | 0.83 | % | | | 0.83 | % | | | 0.85 | % | | | 0.85 | % |
Net investment income (loss) | | | 0.14 | % | | | (0.01 | )% | | | (0.03 | )% | | | 0.12 | % | | | 0.72 | % | | | 2.82 | % | | | 0.60 | % |
Supplemental data | | | | | | | | | | | | | | | | | | | | | | | | | | | | |
Portfolio turnover rate | | | 19 | % | | | 36 | % | | | 31 | % | | | 16 | % | | | 9 | % | | | 7 | % | | | 18 | % |
Net assets, end of period (000s omitted) | | | $42,023 | | | | $43,671 | | | | $90,809 | | | | $92,929 | | | | $52,613 | | | | $398 | | | | $28 | |
| 1 | For the five months ended March 31, 2014. The Fund changed its fiscal year end from October 31 to March 31, effective March 31, 2014. |
| 2 | For the period from June 28, 2013 (commencement of class operations) to October 31, 2013 |
| 3 | Calculated based upon average shares outstanding |
| 4 | Amount is more than $(0.005). |
| 5 | Returns for periods of less than one year are not annualized. |
The accompanying notes are an integral part of these financial statements.
| | | | |
| 20 | | Wells Fargo Small Cap Value Fund | | Financial highlights |
(For a share outstanding throughout each period)
| | | | | | | | | | | | | | | | | | | | | | | | | | | | |
| | | Six months ended
September 30, 2018
(unaudited) | | | Year ended March 31 | | | Year ended October 31, 2013 | |
| ADMINISTRATOR CLASS | | 2018 | | | 2017 | | | 2016 | | | 2015 | | | 20141 | |
Net asset value, beginning of period | | | $18.34 | | | | $22.80 | | | | $19.66 | | | | $28.30 | | | | $36.40 | | | | $36.98 | | | | $33.45 | |
Net investment income (loss) | | | (0.01 | )2 | | | (0.06 | )2 | | | (0.07 | )2 | | | (0.06 | )2 | | | 0.01 | 2 | | | 0.21 | | | | 0.31 | |
Net realized and unrealized gains (losses) on investments | | | 0.56 | | | | 1.72 | | | | 5.71 | | | | (1.16 | ) | | | (2.55 | ) | | | 2.77 | | | | 4.75 | |
| | | | | | | | | | | | | | | | | | | | | | | | | | | | |
Total from investment operations | | | 0.55 | | | | 1.66 | | | | 5.64 | | | | (1.22 | ) | | | (2.54 | ) | | | 2.98 | | | | 5.06 | |
Distributions to shareholders from | | | | | | | | | | | | | | | | | | | | | | | | | | | | |
Net investment income | | | 0.00 | | | | 0.00 | | | | 0.00 | | | | 0.00 | | | | 0.00 | | | | (0.19 | ) | | | (0.32 | ) |
Net realized gains | | | 0.00 | | | | (6.12 | ) | | | (2.50 | ) | | | (7.42 | ) | | | (5.56 | ) | | | (3.37 | ) | | | (1.21 | ) |
| | | | | | | | | | | | | | | | | | | | | | | | | | | | |
Total distributions to shareholders | | | 0.00 | | | | (6.12 | ) | | | (2.50 | ) | | | (7.42 | ) | | | (5.56 | ) | | | (3.56 | ) | | | (1.53 | ) |
Net asset value, end of period | | | $18.89 | | | | $18.34 | | | | $22.80 | | | | $19.66 | | | | $28.30 | | | | $36.40 | | | | $36.98 | |
Total return3 | | | 3.00 | % | | | 8.18 | % | | | 30.22 | % | | | (2.70 | )% | | | (7.16 | )% | | | 8.97 | % | | | 15.92 | % |
Ratios to average net assets (annualized) | | | | | | | | | | | | | | | | | | | | | | | | | | | | |
Gross expenses | | | 1.28 | % | | | 1.24 | % | | | 1.24 | % | | | 1.25 | % | | | 1.19 | % | | | 1.17 | % | | | 1.17 | % |
Net expenses | | | 1.08 | % | | | 1.08 | % | | | 1.08 | % | | | 1.08 | % | | | 1.09 | % | | | 1.10 | % | | | 1.10 | % |
Net investment income (loss) | | | (0.11 | )% | | | (0.28 | )% | | | (0.31 | )% | | | (0.24 | )% | | | 0.03 | % | | | 1.48 | % | | | 0.87 | % |
Supplemental data | | | | | | | | | | | | | | | | | | | | | | | | | | | | |
Portfolio turnover rate | | | 19 | % | | | 36 | % | | | 31 | % | | | 16 | % | | | 9 | % | | | 7 | % | | | 18 | % |
Net assets, end of period (000s omitted) | | | $9,335 | | | | $9,936 | | | | $12,994 | | | | $24,927 | | | | $74,820 | | | | $711,869 | | | | $666,812 | |
| 1 | For the five months ended March 31, 2014. The Fund changed its fiscal year end from October 31 to March 31, effective March 31, 2014. |
| 2 | Calculated based upon average shares outstanding |
| 3 | Returns for periods of less than one year are not annualized. |
The accompanying notes are an integral part of these financial statements.
| | | | | | |
| Financial highlights | | Wells Fargo Small Cap Value Fund | | | 21 | |
(For a share outstanding throughout each period)
| | | | | | | | | | | | | | | | | | | | | | | | | | | | |
| | | Six months ended
September 30, 2018 (unaudited) | | | Year ended March 31 | | | Year ended
October 31, 2013 | |
| INSTITUTIONAL CLASS | | 2018 | | | 2017 | | | 2016 | | | 2015 | | | 20141 | |
Net asset value, beginning of period | | | $18.49 | | | | $22.90 | | | | $19.71 | | | | $28.29 | | | | $36.53 | | | | $37.12 | | | | $33.56 | |
Net investment income (loss) | | | 0.01 | 2 | | | (0.02 | )2 | | | (0.01 | )2 | | | (0.01 | )2 | | | 0.17 | 2 | | | 0.26 | | | | 0.38 | 2 |
Net realized and unrealized gains (losses) on investments | | | 0.57 | | | | 1.73 | | | | 5.70 | | | | (1.15 | ) | | | (2.65 | ) | | | 2.76 | | | | 4.76 | |
| | | | | | | | | | | | | | | | | | | | | | | | | | | | |
Total from investment operations | | | 0.58 | | | | 1.71 | | | | 5.69 | | | | (1.16 | ) | | | (2.48 | ) | | | 3.02 | | | | 5.14 | |
Distributions to shareholders from | | | | | | | | | | | | | | | | | | | | | | | | | | | | |
Net investment income | | | 0.00 | | | | 0.00 | | | | 0.00 | | | | 0.00 | | | | (0.20 | ) | | | (0.24 | ) | | | (0.37 | ) |
Net realized gains | | | 0.00 | | | | (6.12 | ) | | | (2.50 | ) | | | (7.42 | ) | | | (5.56 | ) | | | (3.37 | ) | | | (1.21 | ) |
| | | | | | | | | | | | | | | | | | | | | | | | | | | | |
Total distributions to shareholders | | | 0.00 | | | | (6.12 | ) | | | (2.50 | ) | | | (7.42 | ) | | | (5.76 | ) | | | (3.61 | ) | | | (1.58 | ) |
Net asset value, end of period | | | $19.07 | | | | $18.49 | | | | $22.90 | | | | $19.71 | | | | $28.29 | | | | $36.53 | | | | $37.12 | |
Total return3 | | | 3.14 | % | | | 8.39 | % | | | 30.41 | % | | | (2.46 | )% | | | (6.95 | )% | | | 9.05 | % | | | 16.15 | % |
Ratios to average net assets (annualized) | | | | | | | | | | | | | | | | | | | | | | | | | | | | |
Gross expenses | | | 1.03 | % | | | 0.99 | % | | | 0.99 | % | | | 0.99 | % | | | 0.92 | % | | | 0.90 | % | | | 0.90 | % |
Net expenses | | | 0.88 | % | | | 0.88 | % | | | 0.88 | % | | | 0.88 | % | | | 0.89 | % | | | 0.90 | % | | | 0.90 | % |
Net investment income (loss) | | | 0.09 | % | | | (0.11 | )% | | | (0.06 | )% | | | (0.03 | )% | | | 0.52 | % | | | 1.66 | % | | | 1.08 | % |
Supplemental data | | | | | | | | | | | | | | | | | | | | | | | | | | | | |
Portfolio turnover rate | | | 19 | % | | | 36 | % | | | 31 | % | | | 16 | % | | | 9 | % | | | 7 | % | | | 18 | % |
Net assets, end of period (000s omitted) | | | $29,541 | | | | $32,699 | | | | $417,018 | | | | $283,728 | | | | $1,017,115 | | | | $984,881 | | | | $1,081,869 | |
| 1 | For the five months ended March 31, 2014. The Fund changed its fiscal year end from October 31 to March 31, effective March 31, 2014. |
| 2 | Calculated based upon average shares outstanding |
| 3 | Returns for periods of less than one year are not annualized. |
The accompanying notes are an integral part of these financial statements.
| | | | |
| 22 | | Wells Fargo Small Cap Value Fund | | Notes to financial statements (unaudited) |
1. ORGANIZATION
Wells Fargo Funds Trust (the “Trust”), a Delaware statutory trust organized on March 10, 1999, is an open-end management investment company registered under the Investment Company Act of 1940, as amended (the “1940 Act”). As an investment company, the Trust follows the accounting and reporting guidance in Financial Accounting Standards Board (“FASB”) Accounting Standards Codification Topic 946, Financial Services – Investment Companies. These financial statements report on the Wells Fargo Small Cap Value Fund (the “Fund”) which is a diversified series of the Trust.
2. SIGNIFICANT ACCOUNTING POLICIES
The following significant accounting policies, which are consistently followed in the preparation of the financial statements of the Fund, are in conformity with U.S. generally accepted accounting principles which require management to make estimates and assumptions that affect the reported amounts of assets and liabilities, disclosure of contingent assets and liabilities at the date of the financial statements, and the reported amounts of revenues and expenses during the reporting period. Actual results could differ from those estimates.
Securities valuation
All investments are valued each business day as of the close of regular trading on the New York Stock Exchange (generally 4 p.m. Eastern Time), although the Fund may deviate from this calculation time under unusual or unexpected circumstances.
Equity securities that are listed on a foreign or domestic exchange or market are valued at the official closing price or, if none, the last sales price. If no sale occurs on the principal exchange or market that day, a fair value price will be determined in accordance with the Fund’s Valuation Procedures.
The values of securities denominated in foreign currencies are translated into U.S. dollars at rates provided by an independent foreign currency pricing source at a time each business day specified by the Wells Fargo Asset Management Pricing Committee at Wells Fargo Funds Management, LLC (“Funds Management”)
Many securities markets and exchanges outside the U.S. close prior to the close of the New York Stock Exchange and therefore may not fully reflect trading or events that occur after the close of the principal exchange in which the foreign securities are traded, but before the close of the New York Stock Exchange. If such trading or events are expected to materially affect the value of such securities, then fair value pricing procedures approved by the Board of Trustees of the Fund are applied. These procedures take into account multiple factors including movements in U.S. securities markets after foreign exchanges close. Foreign securities that are fair valued under these procedures are categorized as Level 2 and the application of these procedures may result in transfers between Level 1 and Level 2. Depending on market activity, such fair valuations may be frequent. Such fair value pricing may result in net asset values that are higher or lower than net asset values based on the last reported sales price or latest quoted bid price. On September 30, 2018, such fair value pricing was not used in pricing foreign securities.
Investments in registered open-end investment companies are valued at net asset value.
Investments which are not valued using any of the methods discussed above are valued at their fair value, as determined in good faith by the Board of Trustees. The Board of Trustees has established a Valuation Committee comprised of the Trustees and has delegated to it the authority to take any actions regarding the valuation of portfolio securities that the Valuation Committee deems necessary or appropriate, including determining the fair value of portfolio securities, unless the determination has been delegated to the Wells Fargo Asset Management Pricing Committee. The Board of Trustees retains the authority to make or ratify any valuation decisions or approve any changes to the Valuation Procedures as it deems appropriate. On a quarterly basis, the Board of Trustees receives reports on any valuation actions taken by the Valuation Committee or the Wells Fargo Asset Management Pricing Committee which may include items for ratification.
Foreign currency translation
The accounting records of the Fund are maintained in U.S. dollars. The values of other assets and liabilities denominated in foreign currencies are translated into U.S. dollars at rates provided by an independent foreign currency pricing source at a time each business day specified by the Wells Fargo Asset Management Pricing Committee. Purchases and sales of securities, and income and expenses are converted at the rate of exchange on the respective dates of such transactions. Net realized foreign exchange gains or losses arise from sales of foreign currencies, currency gains or losses realized between the trade and settlement dates on securities transactions, and the difference between the amounts of dividends, interest and foreign withholding taxes recorded and the U.S. dollar equivalent of the amounts actually paid or received. Net unrealized foreign exchange gains and losses arise from changes in the fair value of assets and liabilities
| | | | | | |
| Notes to financial statements (unaudited) | | Wells Fargo Small Cap Value Fund | | | 23 | |
other than investments in securities resulting from changes in exchange rates. The changes in net assets arising from changes in exchange rates of securities and the changes in net assets resulting from changes in market prices of securities are not separately presented. Such changes are included in net realized and unrealized gains or losses from investments.
Security transactions and income recognition
Securities transactions are recorded on a trade date basis. Realized gains or losses are recorded on the basis of identified cost.
Dividend income is recognized on the ex-dividend date, except for certain dividends from foreign securities, which are recorded as soon as the custodian verifies the ex-dividend date. Dividend income from foreign securities is recorded net of foreign taxes withheld where recovery of such taxes is not assured.
Income dividends and capital gain distributions from investment companies are recorded on the ex-dividend date. Capital gain distributions from investment companies are treated as realized gains.
Distributions to shareholders
Distributions to shareholders from net investment income and any net realized gains are recorded on the ex-dividend date and paid at least annually. Such distributions are determined in accordance with income tax regulations and may differ from U.S. generally accepted accounting principles. Dividend sources are estimated at the time of declaration. The tax character of distributions is determined as of the Fund’s fiscal year end. Therefore, a portion of the Fund’s distributions made prior to the Fund’s fiscal year end may be categorized as a tax return of capital at year end.
Federal and other taxes
The Fund intends to continue to qualify as a regulated investment company by distributing substantially all of its investment company taxable income and any net realized capital gains (after reduction for capital loss carryforwards) sufficient to relieve it from all, or substantially all, federal income taxes. Accordingly, no provision for federal income taxes was required.
The Fund’s income and federal excise tax returns and all financial records supporting those returns for the prior three fiscal years are subject to examination by the federal and Delaware revenue authorities. Management has analyzed the Fund’s tax positions taken on federal, state, and foreign tax returns for all open tax years and does not believe that there are any uncertain tax positions that require recognition of a tax liability.
As of September 30, 2018, the aggregate cost of all investments for federal income tax purposes was $433,426,804 and the unrealized gains (losses) consisted of:
| | | | |
Gross unrealized gains | | $ | 133,316,146 | |
Gross unrealized losses | | | (43,621,195 | ) |
Net unrealized gains | | $ | 89,694,951 | |
Class allocations
The separate classes of shares offered by the Fund differ principally in applicable sales charges, distribution, shareholder servicing, and administration fees. Class specific expenses are charged directly to that share class. Investment income, common expenses, and realized and unrealized gains (losses) on investments are allocated daily to each class of shares based on the relative proportion of net assets of each class.
3. FAIR VALUATION MEASUREMENTS
Fair value measurements of investments are determined within a framework that has established a fair value hierarchy based upon the various data inputs utilized in determining the value of the Fund’s investments. The three-level hierarchy gives the highest priority to unadjusted quoted prices in active markets for identical assets or liabilities (Level 1) and the lowest priority to unobservable inputs (Level 3). The Fund’s investments are classified within the fair value hierarchy based on the lowest level of input that is significant to the fair value measurement. The inputs are summarized into three broad levels as follows:
| ∎ | | Level 1 – quoted prices in active markets for identical securities |
| ∎ | | Level 2 – other significant observable inputs (including quoted prices for similar securities, interest rates, prepayment speeds, credit risk, etc.) |
| ∎ | | Level 3 – significant unobservable inputs (including the Fund’s own assumptions in determining the fair value of investments) |
The inputs or methodologies used for valuing investments in securities are not necessarily an indication of the risk associated with investing in those securities.
| | | | |
| 24 | | Wells Fargo Small Cap Value Fund | | Notes to financial statements (unaudited) |
The following is a summary of the inputs used in valuing the Fund’s assets and liabilities as of September 30, 2018:
| | | | | | | | | | | | | | | | |
| | | Quoted prices
(Level 1) | | | Other significant
observable inputs
(Level 2) | | | Significant
unobservable inputs (Level 3) | | | Total | |
Assets | | | | | | | | | | | | | | | | |
Investments in: | | | | | | | | | | | | | | | | |
| | | | |
Common stocks | | | | | | | | | | | | | | | | |
Communication services | | $ | 5,573,250 | | | $ | 0 | | | $ | 0 | | | $ | 5,573,250 | |
Consumer discretionary | | | 36,958,578 | | | | 2,195,610 | | | | 0 | | | | 39,154,188 | |
Consumer staples | | | 2,006,199 | | | | 0 | | | | 0 | | | | 2,006,199 | |
Energy | | | 46,627,684 | | | | 0 | | | | 0 | | | | 46,627,684 | |
Financials | | | 168,024,018 | | | | 0 | | | | 0 | | | | 168,024,018 | |
Health care | | | 31,896,534 | | | | 0 | | | | 0 | | | | 31,896,534 | |
Industrials | | | 104,857,141 | | | | 1,468,972 | | | | 0 | | | | 106,326,113 | |
Information technology | | | 47,241,350 | | | | 0 | | | | 0 | | | | 47,241,350 | |
Materials | | | 54,975,428 | | | | 4,013,772 | | | | 0 | | | | 58,989,200 | |
Real estate | | | 9,566,988 | | | | 0 | | | | 0 | | | | 9,566,988 | |
| | | | |
Exchange-traded funds | | | 6,680,088 | | | | 0 | | | | 0 | | | | 6,680,088 | |
| | | | |
Short-term investments | | | | | | | | | | | | | | | | |
Investment companies | | | 1,036,143 | | | | 0 | | | | 0 | | | | 1,036,143 | |
Total assets | | $ | 515,443,401 | | | $ | 7,678,354 | | | $ | 0 | | | $ | 523,121,755 | |
Additional sector, industry or geographic detail is included in the Portfolio of Investments.
At September 30, 2018, the Fund did not have any transfers into/out of Level 3.
4. TRANSACTIONS WITH AFFILIATES
Management fee
Funds Management, an indirect wholly owned subsidiary of Wells Fargo, is the manager of the Fund and provides advisory and fund-level administrative services under an investment management agreement. Under the investment management agreement, Funds Management is responsible for, among other services, implementing the investment objectives and strategies of the Fund, supervising the subadviser and providing fund-level administrative services in connection with the Fund’s operations. As compensation for its services under the investment management agreement, Funds Management is entitled to receive an annual management fee starting at 0.85% and declining to 0.71% as the average daily net assets of the Fund increase. For the six months ended September 30, 2018, the management fee was equivalent to an annual rate of 0.85% of the Fund’s average daily net assets.
Funds Management has retained the services of a subadviser to provide daily portfolio management to the Fund. The fee for subadvisory services is borne by Funds Management. Wells Capital Management Incorporated, an affiliate of Funds Management and an indirect wholly owned subsidiary of Wells Fargo, is the subadviser to the Fund and is entitled to receive a fee from Funds Management at an annual rate starting at 0.55% and declining to 0.40% as the average daily net assets of the Fund increase.
Administration fees
Under a class-level administration agreement, Funds Management provides class-level administrative services to the Fund, which includes paying fees and expenses for services provided by the transfer agent, sub-transfer agents, omnibus account servicers and record-keepers. As compensation for its services under the class-level administration agreement, Funds Management receives an annual fee which is calculated based on the average daily net assets of each class as follows:
| | | | |
| | | Class-level
administration fee | |
Class A, Class C | | | 0.21 | % |
Class R6 | | | 0.03 | |
Administrator Class, Institutional Class | | | 0.13 | |
| | | | | | |
| Notes to financial statements (unaudited) | | Wells Fargo Small Cap Value Fund | | | 25 | |
Funds Management has contractually waived and/or reimbursed management and administration fees to the extent necessary to maintain certain net operating expense ratios for the Fund. When each class of the Fund has exceeded its expense cap, Funds Management has waived fees and/or reimbursed expenses from fund level expenses on a proportionate basis and then from class specific expenses; otherwise, waivers and/or reimbursements are applied against class specific expenses before fund level expenses. Funds Management has committed through July 31, 2019 to waive fees and/or reimburse expenses to the extent necessary to cap the Fund’s expenses at 1.28% for Class A shares, 2.03% for Class C shares, 0.83% for Class R6 shares, 1.08% for Administrator Class shares, and 0.88% for Institutional Class shares. After this time, the cap may be increased or the commitment to maintain the cap may be terminated only with the approval of the Board of Trustees.
Distribution fee
The Trust has adopted a distribution plan for Class C shares of the Fund pursuant to Rule 12b-1 under the 1940 Act. A distribution fee is charged to Class C shares and paid to Wells Fargo Funds Distributor, LLC (“Funds Distributor”), the principal underwriter, at an annual rate of 0.75% of the average daily net assets of Class C shares.
In addition, Funds Distributor is entitled to receive the front-end sales charge from the purchase of Class A shares and a contingent deferred sales charge on the redemption of certain Class A shares. Funds Distributor is also entitled to receive the contingent deferred sales charges from redemptions of Class C shares. For the six months ended September 30, 2018, Funds Distributor received $14,760 from the sale of Class A shares. No contingent deferred sales charges were incurred by Class A and Class C shares for the six months ended September 30, 2018.
Shareholder servicing fees
The Trust has entered into contracts with one or more shareholder servicing agents, whereby Class A, Class C, and Administrator Class of the Fund are charged a fee at an annual rate of 0.25% of the average daily net assets of each respective class.
A portion of these total shareholder servicing fees were paid to affiliates of Wells Fargo.
Interfund transactions
The Fund may purchase or sell portfolio investment securities to certain other Wells Fargo affiliates pursuant to Rule 17a-7 under the 1940 Act and under procedures adopted by the Board of Trustees. The procedures have been designed to ensure that these interfund transactions, which do not incur broker commissions, are effected at current market prices.
5. INVESTMENT PORTFOLIO TRANSACTIONS
Purchases and sales of investments, excluding U.S. government obligations (if any) and short-term securities, for the six months ended September 30, 2018 were $101,314,103 and $142,906,702, respectively.
6. BANK BORROWINGS
The Trust (excluding the money market funds), Wells Fargo Master Trust and Wells Fargo Variable Trust are parties to a $280,000,000 revolving credit agreement whereby the Fund is permitted to use bank borrowings for temporary or emergency purposes, such as to fund shareholder redemption requests. Interest under the credit agreement is charged to the Fund based on a borrowing rate equal to the higher of the Federal Funds rate in effect on that day plus 1.25% or the overnight LIBOR rate in effect on that day plus 1.25%. In addition, an annual commitment fee equal to 0.25% of the unused balance is allocated to each participating fund.
For the six months ended September 30, 2018, there were no borrowings by the Fund under the agreement.
7. DISTRIBUTIONS TO SHAREHOLDERS
Beginning October 2018, the Securities and Exchange Commission eliminated the requirement to separately state the components of distributions to shareholders. The amounts of distributions to shareholders for the year ended March 31, 2018 were as follows:
| | | | |
| | | Net realized
gains | |
Class A | | | $139,185,621 | |
Class C | | | 11,577,587 | |
Class R6 | | | 18,852,432 | |
Administrator Class | | | 3,280,317 | |
Institutional Class | | | 59,214,889 | |
| | | | |
| 26 | | Wells Fargo Small Cap Value Fund | | Notes to financial statements (unaudited) |
8. CONCENTRATION RISK
Concentration risks result from exposure to a limited number of sectors. A fund that invests a substantial portion of its assets in any sector may be more affected by changes in that sector than would be a fund whose investments are not heavily weighted in any sector.
9. INDEMNIFICATION
Under the Trust’s organizational documents, the officers and Trustees have been granted certain indemnification rights against certain liabilities that may arise out of performance of their duties to the Trust. Additionally, in the normal course of business, the Trust may enter into contracts with service providers that contain a variety of indemnification clauses. The Trust’s maximum exposure under these arrangements is dependent on future claims that may be made against the Fund and, therefore, cannot be estimated.
10. REDEMPTION IN-KIND
After the close of business on July 7, 2017, the Fund redeemed assets through an in-kind redemption. In the redemption transaction, the Fund issued securities with a value of $317,068,893 and cash in the amount of $17,087,078. The redemption in-kind by a shareholder of the Institutional Class represented 34% of the Fund and is reflected on the Statement of Changes in Net Assets.
11. NEW ACCOUNTING PRONOUNCEMENT
In August 2018, FASB issued Accounting Standards Update (“ASU”) No. 2018-13, Fair Value Measurement (Topic 820) Disclosure Framework—Changes to the Disclosure Requirements for Fair Value Measurement. ASU 2018-13 updates the disclosure requirements for fair value measurements by modifying or removing certain disclosures and adding certain new disclosures. The amendments are effective for fiscal years, and interim periods within those fiscal years, beginning after December 15, 2019. Early adoption is permitted. Management has early adopted the removal and modification disclosures, as permitted, and will adopt the additional new disclosures at the effective date.
| | | | | | |
| Other information (unaudited) | | Wells Fargo Small Cap Value Fund | | | 27 | |
PROXY VOTING INFORMATION
A description of the policies and procedures that the Fund uses to determine how to vote proxies relating to portfolio securities is available, upon request, by calling 1-800-222-8222, visiting our website at wellsfargofunds.com, or visiting the SEC website at sec.gov. Information regarding how the Fund voted proxies relating to portfolio securities during the most recent 12-month period ended June 30 is available on the Fund’s website at wellsfargofunds.com or by visiting the SEC website at sec.gov.
PORTFOLIO HOLDINGS INFORMATION
The complete portfolio holdings for the Fund are publicly available monthly on the Fund’s website (wellsfargofunds.com), on a one-month delayed basis. In addition, top ten holdings information (excluding derivative positions) for the Fund is publicly available on the Fund’s website on a monthly, seven-day or more delayed basis. The Fund files its complete schedule of portfolio holdings with the SEC for the first and third quarters of each fiscal year on Form N-Q, which is available by visiting the SEC website at sec.gov. In addition, the Fund’s Form N-Q may be reviewed and copied at the SEC’s Public Reference Room in Washington, DC, and at regional offices in New York City, at 233 Broadway, and in Chicago, at 175 West Jackson Boulevard, Suite 900. Information about the Public Reference Room may be obtained by calling 1-800-SEC-0330.
| | | | |
| 28 | | Wells Fargo Small Cap Value Fund | | Other information (unaudited) |
BOARD OF TRUSTEES AND OFFICERS
Each of the Trustees and Officers1 listed in the table below acts in identical capacities for each fund in the Wells Fargo family of funds, which consists of 153 mutual funds comprising the Wells Fargo Funds Trust, Wells Fargo Variable Trust, Wells Fargo Master Trust and four closed-end funds (collectively the “Fund Complex”). This table should be read in conjunction with the Prospectus and the Statement of Additional Information2. The mailing address of each Trustee and Officer is 525 Market Street, 12th Floor, San Francisco, CA 94105. Each Trustee and Officer serves an indefinite term, however, each Trustee serves such term until reaching the mandatory retirement age established by the Trustees.
Independent Trustees
| | | | | | |
Name and year of birth | | Position held and length of service* | | Principal occupations during past five years or longer | | Current other
public company or
investment company
directorships |
William R. Ebsworth (Born 1957) | | Trustee, since 2015 | | Retired. From 1984 to 2013, equities analyst, portfolio manager, research director and chief investment officer at Fidelity Management and Research Company in Boston, Tokyo, and Hong Kong, and retired in 2013 as Chief Investment Officer of Fidelity Strategic Advisers, Inc. where he led a team of investment professionals managing client assets. Prior thereto, Board member of Hong Kong Securities Clearing Co., Hong Kong Options Clearing Corp., the Thailand International Fund, Ltd., Fidelity Investments Life Insurance Company, and Empire Fidelity Investments Life Insurance Company. Board member of the Vincent Memorial Hospital Endowment (non-profit organization), where he serves on the Investment Committee and as a Chair of the Audit Committee. Mr. Ebsworth is a CFA® charterholder. | | N/A |
Jane A. Freeman (Born 1953) | | Trustee, since 2015; Chair Liaison, since 2018 | | Retired. From 2012 to 2014 and 1999 to 2008, Chief Financial Officer of Scientific Learning Corporation. From 2008 to 2012, Ms. Freeman provided consulting services related to strategic business projects. Prior to 1999, Portfolio Manager at Rockefeller & Co. and Scudder, Stevens & Clark. Board member of the Harding Loevner Funds from 1996 to 2014, serving as both Lead Independent Director and chair of the Audit Committee. Board member of the Russell Exchange Traded Funds Trust from 2011 to 2012 and the chair of the Audit Committee. Ms. Freeman is a Board Member of The Ruth Bancroft Garden (non-profit organization). She is also an inactive Chartered Financial Analyst. | | N/A |
Isaiah Harris, Jr. (Born 1952) | | Trustee, since 2009 | | Retired. Chairman of the Board of CIGNA Corporation since 2009, and Director since 2005. From 2003 to 2011, Director of Deluxe Corporation. Prior thereto, President and CEO of BellSouth Advertising and Publishing Corp. from 2005 to 2007, President and CEO of BellSouth Enterprises from 2004 to 2005 and President of BellSouth Consumer Services from 2000 to 2003. Emeritus member of the Iowa State University Foundation Board of Governors. Emeritus Member of the Advisory Board of Iowa State University School of Business. Advisory Board Member, Palm Harbor Academy (private school). Advisory Board Member, Child Evangelism Fellowship (non-profit). Mr. Harris is a certified public accountant (inactive status). | | CIGNA Corporation |
Judith M. Johnson (Born 1949) | | Trustee, since 2008; Audit Committee Chairman, since 2009 | | Retired. Prior thereto, Chief Executive Officer and Chief Investment Officer of Minneapolis Employees Retirement Fund from 1996 to 2008. Ms. Johnson is an attorney, certified public accountant and a certified managerial accountant. | | N/A |
David F. Larcker (Born 1950) | | Trustee, since 2009 | | James Irvin Miller Professor of Accounting at the Graduate School of Business, Stanford University, Director of the Corporate Governance Research Initiative and Senior Faculty of The Rock Center for Corporate Governance since 2006. From 2005 to 2008, Professor of Accounting at the Graduate School of Business, Stanford University. Prior thereto, Ernst & Young Professor of Accounting at The Wharton School, University of Pennsylvania from 1985 to 2005. | | N/A |
| | | | | | |
| Other information (unaudited) | | Wells Fargo Small Cap Value Fund | | | 29 | |
| | | | | | |
Name and year of birth | | Position held and length of service* | | Principal occupations during past five years or longer | | Current other
public company or
investment company
directorships |
Olivia S. Mitchell (Born 1953) | | Trustee, since 2006; Governance Committee Chairman, since 2018 | | International Foundation of Employee Benefit Plans Professor, Wharton School of the University of Pennsylvania since 1993. Director of Wharton’s Pension Research Council and Boettner Center on Pensions & Retirement Research, and Research Associate at the National Bureau of Economic Research. Previously, Cornell University Professor from 1978 to 1993. | | N/A |
Timothy J. Penny (Born 1951) | | Trustee, since 1996; Chairman, since 2018; Vice Chairman, from 2017 to 2018 | | President and Chief Executive Officer of Southern Minnesota Initiative Foundation, a non-profit organization, since 2007. Member of the Board of Trustees of NorthStar Education Finance, Inc., a non-profit organization, since 2007. | | N/A |
James G. Polisson (Born 1959) | | Trustee, since 2018; Advisory Board Member, from 2017 to 2018 | | Retired. Chief Marketing Officer, Source (ETF) UK Services, Ltd, from 2015 to 2017. From 2012 to 2015, Principal of The Polisson Group, LLC, a management consulting, corporate advisory and principal investing company. Chief Executive Officer and Managing Director at Russell Investments, Global Exchange Traded Funds from 2010 to 2012. Managing Director of Barclays Global Investors from 1998 to 2010 and Global Chief Marketing Officer for iShares and Barclays Global Investors from 2000 to 2010. Trustee of the San Francisco Mechanics’ Institute, a non-profit organization, from 2013 to 2015. Board member of the Russell Exchange Traded Fund Trust from 2011 to 2012. Director of Barclays Global Investors Holdings Deutschland GmbH from 2006 to 2009. Mr. Polisson is an attorney and has a retired status with the Massachusetts and District of Columbia Bar Associations. | | N/A |
Michael S. Scofield (Born 1943) | | Trustee, since 2010 | | Served on the Investment Company Institute’s Board of Governors and Executive Committee from 2008-2011 as well the Governing Council of the Independent Directors Council from 2006-2011 and the Independent Directors Council Executive Committee from 2008-2011. Trustee of the Evergreen Fund complex (and its predecessors) from 1984 to 2010. Chairman of the Evergreen Funds from 2000-2010. Former Trustee of the Mentor Funds. Retired Attorney, Law Offices of Michael S. Scofield. | | N/A |
Pamela Wheelock (Born 1959) | | Trustee, since 2018; Advisory Board Member, from 2017 to 2018 | | Chief Operating Officer, Twin Cities Habitat for Humanity, since January, 2017. Vice President of University Services, University of Minnesota from 2012 to 2017. Prior thereto, on the Board of Directors, Governance Committee and Finance Committee for the Minnesota Philanthropy Partners (Saint Paul Foundation) from 2012 to 2018, Interim President and Chief Executive Officer of Blue Cross Blue Shield of Minnesota from 2010 to 2011, Chairman of the Board from 2009 to 2011 and Board Director from 2003 to 2015. Vice President, Leadership and Community Engagement, Bush Foundation, Saint Paul, Minnesota (a private foundation) from 2009 to 2011. Executive Vice President and Chief Financial Officer, Minnesota Sports and Entertainment from 2004 to 2009 and Senior Vice President from 2002 to 2004. Commissioner of Finance, State of Minnesota, from 1999 to 2002. Currently the Board Chair of the Minnesota Wild Foundation since 2010. | | N/A |
| * | Length of service dates reflect the Trustee’s commencement of service with the Trust’s predecessor entities, where applicable. |
| | | | |
| 30 | | Wells Fargo Small Cap Value Fund | | Other information (unaudited) |
Officers
| | | | | | |
Name and year of birth | | Position held and length of service | | Principal occupations during past five years or longer | | |
Andrew Owen (Born 1960) | | President, since 2017 | | Executive Vice President of Wells Fargo & Company and Head of Affiliated Managers, Wells Fargo Asset Management, since 2014. In addition, Mr. Owen is currently President, Chief Executive Officer and Director of Wells Fargo Funds Management, LLC since 2017. Prior thereto, Executive Vice President responsible for marketing, investments and product development for Wells Fargo Funds Management, LLC, from 2009 to 2014. | | |
Nancy Wiser1 (Born 1967) | | Treasurer, since 2012 | | Executive Vice President of Wells Fargo Funds Management, LLC since 2011. Chief Operating Officer and Chief Compliance Officer at LightBox Capital Management LLC, from 2008 to 2011. | | |
Alexander Kymn3 (Born 1973) | | Secretary, since 2018; Chief Legal Officer, since 2018 | | Senior Company Counsel of Wells Fargo Bank, N.A. since 2018 (previously Senior Counsel from 2007 to 2018). Vice President of Wells Fargo Funds Management, LLC from 2008 to 2014. | | |
Michael H. Whitaker (Born 1967) | | Chief Compliance Officer, since 2016 | | Senior Vice President and Chief Compliance Officer since 2016. Senior Vice President and Chief Compliance Officer for Fidelity Investments from 2007 to 2016. | | |
David Berardi (Born 1975) | | Assistant Treasurer, since 2009 | | Vice President of Wells Fargo Funds Management, LLC since 2009. Vice President of Evergreen Investment Management Company, LLC from 2008 to 2010. Manager of Fund Reporting and Control for Evergreen Investment Management Company, LLC from 2004 to 2010. | | |
| Jeremy DePalma1 (Born 1974) | | Assistant Treasurer, since 2009 | | Senior Vice President of Wells Fargo Funds Management, LLC since 2009. Senior Vice President of Evergreen Investment Management Company, LLC from 2008 to 2010 and head of the Fund Reporting and Control Team within Fund Administration from 2005 to 2010. | | |
| 1 | Nancy Wiser acts as Treasurer of 76 funds in the Fund Complex. Jeremy DePalma acts as Treasurer of 77 funds and Assistant Treasurer of 76 funds in the Fund Complex. |
| 2 | The Statement of Additional Information includes additional information about the Trustees and is available, without charge, upon request, by calling 1-800-222-8222 or by visiting the website at wellsfargofunds.com. |
| 3 | Alexander Kymn became the Secretary and Chief Legal Officer effective April 17, 2018. |
| | | | | | |
| Other information (unaudited) | | Wells Fargo Small Cap Value Fund | | | 31 | |
BOARD CONSIDERATION OF INVESTMENT MANAGEMENT AND SUB-ADVISORY AGREEMENTS:
Wells Fargo Small Cap Value Fund
Under the Investment Company Act of 1940 (the “1940 Act”), the Board of Trustees (the “Board”) of Wells Fargo Funds Trust (the “Trust”) must determine annually whether to approve the continuation of the Trust’s investment management and sub-advisory agreements. In this regard, at an in-person meeting held on May 22-23, 2018 (the “Meeting”), the Board, all the members of which have no direct or indirect interest in the investment management and sub-advisory agreements and are not “interested persons” of the Trust, as defined in the 1940 Act (the “Independent Trustees”), reviewed and approved for Wells Fargo Small Cap Value Fund (the “Fund”): (i) an investment management agreement (the “Management Agreement”) with Wells Fargo Funds Management, LLC (“Funds Management”); and (ii) an investment sub-advisory agreement (the “Sub-Advisory Agreement”) with Wells Capital Management Incorporated (the “Sub-Adviser”), an affiliate of Funds Management. The Management Agreement and the Sub-Advisory Agreement are collectively referred to as the “Advisory Agreements.”
At the Meeting, the Board considered the factors and reached the conclusions described below relating to the selection of Funds Management and the Sub-Adviser and the approval of the Advisory Agreements. Prior to the Meeting, including at an in-person meeting in April 2018, the Trustees conferred extensively among themselves and with representatives of Funds Management about these matters. Also, the Board has adopted a team-based approach, with each team consisting of a sub-set of Trustees, to assist the full Board in the discharge of its duties in reviewing investment performance and other matters throughout the year. The Independent Trustees were assisted in their evaluation of the Advisory Agreements by independent legal counsel, from whom they received separate legal advice and with whom they met separately.
In providing information to the Board, Funds Management and the Sub-Adviser were guided by a detailed set of requests for information submitted to them by independent legal counsel on behalf of the Independent Trustees at the start of the Board’s annual contract renewal process earlier in 2018. In considering and approving the Advisory Agreements, the Trustees considered the information they believed relevant, including but not limited to the information discussed below. The Board considered not only the specific information presented in connection with the Meeting, but also the knowledge gained over time through interaction with Funds Management and the Sub-Adviser about various topics. In this regard, the Board reviewed reports of Funds Management at each of its quarterly meetings, which included, among other things, portfolio reviews and investment performance reports. In addition, the Board and the teams mentioned above confer with portfolio managers at various times throughout the year. The Board did not identify any particular information or consideration that was all-important or controlling, and each individual Trustee may have attributed different weights to various factors.
After its deliberations, the Board unanimously approved the continuation of the Advisory Agreements for a one-year term and determined that the compensation payable to Funds Management and the Sub-Adviser under each of the Advisory Agreements was reasonable. The Board considered the approval of the Advisory Agreements for the Fund as part of its consideration of agreements for funds across the complex, but its approvals were made on a fund-by-fund basis. The following summarizes a number of important, but not necessarily all, factors considered by the Board in support of its approvals.
Nature, extent and quality of services
The Board received and considered various information regarding the nature, extent and quality of services provided to the Fund by Funds Management and the Sub-Adviser under the Advisory Agreements. This information included a description of the investment advisory services and Fund-level administrative services covered by the Management Agreement, as well as, among other things, a summary of the background and experience of senior management of Wells Fargo Asset Management (“WFAM”), of which Funds Management and the Sub-Adviser are a part, a summary of investments made in the business of WFAM, a summary of certain organizational and personnel changes involving Funds Management and the Sub-Adviser, and a description of Funds Management’s and the Sub-Adviser’s business continuity planning programs and of their approaches to data privacy and cybersecurity. The Board also considered the qualifications, background, tenure and responsibilities of each of the portfolio managers primarily responsible for the day-to-day portfolio management of the Fund.
The Board evaluated the ability of Funds Management and the Sub-Adviser to attract and retain qualified investment professionals, including research, advisory and supervisory personnel. The Board further considered the compliance programs and compliance records of Funds Management and the Sub-Adviser. In addition, the Board took into account the full range of services provided to the Fund by Funds Management and its affiliates.
| | | | |
| 32 | | Wells Fargo Small Cap Value Fund | | Other information (unaudited) |
Fund investment performance and expenses
The Board considered the investment performance results for the Fund over various time periods ended December 31, 2017. The Board considered these results in comparison to the investment performance of funds in a universe that was determined by Broadridge Inc. (“Broadridge”) to be similar to the Fund (the “Universe”), and in comparison to the Fund’s benchmark index and to other comparative data. Broadridge is an independent provider of investment company data. The Board received a description of the methodology used by Broadridge to select the mutual funds in the performance Universe. The Board noted that the investment performance of the Fund (Class A) was higher than the average investment performance of the Universe for the one- and three-year periods under review, but lower than the average investment performance of the Universe for the five- and ten-year periods under review. The Board also noted that the investment performance of the Fund was higher than its benchmark index, the Russell 2000 Value Index, for the one- and three-year periods under review, but lower than its benchmark index for the five- and ten-year periods under review. The Board took note of the recent performance of the Fund relative to both the Universe and benchmark.
The Board also received and considered information regarding the Fund’s net operating expense ratios and their various components, including actual management fees, custodian and other non-management fees, and Rule 12b-1 and non-Rule 12b-1 shareholder service fees. The Board considered these ratios in comparison to the median ratios of funds in class-specific expense groups that were determined by Broadridge to be similar to the Fund (the “Groups”). The Board received a description of the methodology used by Broadridge to select the mutual funds in the expense Groups and an explanation of how funds comprising expense groups and their expense ratios may vary from year-to-year. Based on the Broadridge reports, the Board noted that the net operating expense ratios of the Fund were lower than or equal to the median net operating expense ratios of the expense Groups for all share classes.
The Board took into account the Fund’s investment performance and expense information provided to it among the factors considered in deciding to re-approve the Advisory Agreements.
Investment management and sub-advisory fee rates
The Board reviewed and considered the contractual fee rates payable by the Fund to Funds Management under the Management Agreement, as well as the contractual fee rates payable by the Fund to Funds Management for class-level administrative services under a Class-Level Administration Agreement, which include, among other things, class-level transfer agency and sub-transfer agency costs (collectively, the “Management Rates”). The Board also reviewed and considered the contractual investment sub-advisory fee rates that are payable by Funds Management to the Sub-Adviser for investment sub-advisory services.
Among other information reviewed by the Board was a comparison of the Fund’s Management Rates with the average contractual investment management fee rates of funds in the expense Groups at a common asset level as well as transfer agency costs of the funds in the expense Groups. The Board noted that the Management Rates of the Fund were in range of the sum of these average rates for the Fund’s expense Groups for all Classes.
The Board also received and considered information about the portion of the total management fee that was retained by Funds Management after payment of the fee to the Sub-Adviser for sub-advisory services. In assessing the reasonableness of this amount, the Board received and evaluated information about the nature and extent of responsibilities retained and risks assumed by Funds Management and not delegated to or assumed by the Sub-Adviser, and about Funds Management’s on-going oversight services. Given the affiliation between Funds Management and the Sub-Adviser, the Board ascribed limited relevance to the allocation of fees between them.
The Board also received and considered information about the nature and extent of services offered and fee rates charged by Funds Management and the Sub-Adviser to other types of clients with investment strategies similar to those of the Fund. In this regard, the Board received information about the significantly greater scope of services, and compliance, reporting and other legal burdens and risks of managing mutual funds compared with those associated with managing assets of non-mutual fund clients such as institutional separate accounts.
Based on its consideration of the factors and information it deemed relevant, including those described here, the Board determined that the compensation payable to Funds Management under the Management Agreement and to the Sub-Adviser under the Sub-Advisory Agreement was reasonable.
Profitability
The Board received and considered information concerning the profitability of Funds Management, as well as the profitability of both WFAM and Wells Fargo & Co. (“Wells Fargo”) as a whole, from providing services to the Fund and the fund family as a whole. The Board noted that the Sub-Adviser’s profitability information with respect to providing services to the Fund was subsumed in the WFAM and Wells Fargo profitability analysis.
| | | | | | |
| Other information (unaudited) | | Wells Fargo Small Cap Value Fund | | | 33 | |
Funds Management reported on the methodologies and estimates used in calculating profitability, including a description of the methodology used to allocate certain expenses and recent enhancements made to the methodology. Among other things, the Board noted that the levels of profitability reported on a fund-by-fund basis varied widely, depending on factors such as the size and type of fund. Based on its review, the Board did not deem the profits reported by Funds Management, WFAM or Wells Fargo from services provided to the Fund to be at a level that would prevent it from approving the continuation of the Advisory Agreements.
Economies of scale
The Board considered the extent to which Funds Management may experience economies of scale in the provision of management services, and the extent to which scale benefits, if any, would be shared with shareholders. In particular, the Board noted the existence of breakpoints in the Fund’s management fee structure, which operate generally to reduce the Fund’s expense ratios as the Fund grows in size. It considered that, for a small fund or a fund that shrinks in size, breakpoints conversely can result in higher fee levels. The Board also considered that in addition to management fee breakpoints, competitive management fee rates set at the outset without regard to breakpoints and fee waiver and expense reimbursement arrangements, as well as investments in the business intended to enhance services available to Fund shareholders, are means of sharing potential economies of scale with shareholders of the Fund.
The Board concluded that the Fund’s fee and expense arrangements, including contractual breakpoints, constituted a reasonable approach to sharing potential economies of scale with the Fund and its shareholders.
Other benefits to Funds Management and the Sub-Adviser
The Board received and considered information regarding potential “fall-out” or ancillary benefits received by Funds Management and its affiliates, including the Sub-Adviser, as a result of their relationships with the Fund. Ancillary benefits could include, among others, benefits directly attributable to other relationships with the Fund and benefits potentially derived from an increase in Funds Management’s and the Sub-Adviser’s business as a result of their relationships with the Fund. The Board noted that various affiliates of Funds Management may receive distribution-related fees, shareholder servicing payments and sub-transfer agency fees in respect of shares sold or held through them and services provided.
The Board also reviewed information about soft dollar credits earned and utilized by the Sub-Adviser, fees earned by Funds Management and the Sub-Adviser from managing a private investment vehicle for the fund family’s securities lending collateral and commissions earned by an affiliated broker from portfolio transactions.
Based on its consideration of the factors and information it deemed relevant, including those described here, the Board did not find that any ancillary benefits received by Funds Management and its affiliates, including the Sub-Adviser, were unreasonable.
Conclusion
At the Meeting, after considering the above-described factors and based on its deliberations and its evaluation of the information described above, the Board unanimously approved the continuation of the Advisory Agreements for a one-year term and determined that the compensation payable to Funds Management and the Sub-Adviser under each of the Advisory Agreements was reasonable.
| | | | |
| 34 | | Wells Fargo Small Cap Value Fund | | Appendix A (unaudited) |
SALES CHARGE REDUCTIONS AND WAIVERS FOR CERTAIN INTERMEDIARIES
Ameriprise
Effective June 1, 2018, shareholders purchasing Fund shares through an Ameriprise Financial platform or account will be eligible only for the following Class A load waivers (front-end sales charge waivers), which may differ from those disclosed elsewhere in the Fund’s prospectus or Statement of Additional Information.
Front-end Sales Load Waivers on Class A Shares Available at Ameriprise Financial
| | • | | Employer-sponsored retirement plans (e.g., 401(k) plans, 457 plans, employer-sponsored 403(b) plans, profit sharing and money purchase pension plans and defined benefit plans). For purposes of this provision, employer-sponsored retirement plans do not include SEP IRAs, Simple IRAs or SAR-SEPs. |
| | • | | Shares purchased through an Ameriprise Financial investment advisory program (if an Advisory or similar share class for such investment advisory program is not available) |
| | • | | Shares purchased by third party investment advisors on behalf of their advisory clients through Ameriprise Financial’s platform (if an Advisory or similar share class for such investment advisory program is not available) |
| | • | | Shares purchased through reinvestment of distributions and dividend reinvestment when purchasing shares of the same Fund (but not any other fund within the same fund family) |
| | • | | Shares exchanged from Class C shares of the same fund in the month of or following the 10-year anniversary of the purchase date. To the extent that the Fund’s prospectus elsewhere provides for a waiver with respect to such shares following a shorter holding period, that waiver will apply to exchanges following such shorter period. To the extent that the Fund’s prospectus elsewhere provides for a waiver with respect to exchanges of Class C shares for load-waived shares, that waiver will also apply to such exchanges. |
| | • | | Employees and registered representatives of Ameriprise Financial or its affiliates and their immediate family members |
| | • | | Shares purchased by or through qualified accounts (including IRAs, Coverdell Education Savings Accounts, 401(k)s, 403(b) TSCAs subject to ERISA and defined benefit plans) that are held by a covered family member, defined as an Ameriprise financial advisor and/or the advisor’s spouse, advisor’s lineal ascendant (mother, father, grandmother, grandfather, great grandmother, great grandfather), advisor’s lineal descendant (son, step-son, daughter, step-daughter, grandson, granddaughter, great grandson, great granddaughter) or any spouse of a covered family member who is a lineal descendant |
| | • | | Shares purchased from the proceeds of redemptions within the same fund family, provided (1) the repurchase occurs within 90 days following the redemption, (2) the redemption and purchase occur in the same account, and (3) redeemed shares were subject to a front-end or deferred sales load (i.e. Rights of Reinstatement). Subject to the Fund’s policy regarding frequent purchases and redemptions of Fund shares, you may not be able to repurchase shares for the first 30 days after your redemption. |
Automatic Exchange of Class C Shares Available at Ameriprise Financial
| | • | | Class C shares will automatically exchange to Class A shares in the month of the 10-year anniversary of the purchase date. |
Merrill Lynch
Effective April 10, 2017, shareholders purchasing Fund shares through a Merrill Lynch platform or account will be eligible only for the following load waivers (front-end sales charge waivers and contingent deferred, or back-end, sales charge waivers) and discounts, which may differ from those disclosed elsewhere in the Fund’s prospectus or Statement of Additional Information.
Front-end Sales Load Waivers on Class A Shares available at Merrill Lynch
| | • | | Employer-sponsored retirement, deferred compensation and employee benefit plans (including health savings accounts) and trusts used to fund those plans, provided that the shares are not held in a commission-based brokerage account and shares are held for the benefit of the plan |
| | • | | Shares purchased by or through a 529 Plan |
| | • | | Shares purchased through a Merrill Lynch affiliated investment advisory program |
| | | | | | |
| Appendix A (unaudited) | | Wells Fargo Small Cap Value Fund | | | 35 | |
| | • | | Shares purchased by third party investment advisors on behalf of their advisory clients through Merrill Lynch’s platform |
| | • | | Shares of funds purchased through the Merrill Edge Self-Directed platform (if applicable) |
| | • | | Shares purchased through reinvestment of capital gains distributions and dividend reinvestment when purchasing shares of the same fund (but not any other fund within the fund family) |
| | • | | Shares exchanged from Class C (i.e. level-load) shares of the same fund in the month of or following the 10-year anniversary of the purchase date |
| | • | | Employees and registered representatives of Merrill Lynch or its affiliates and their family members, as defined by Merrill Lynch, which may differ from the definition of family member in the Fund’s prospectus. |
| | • | | Directors or Trustees of the Fund, and employees of the Fund’s investment adviser or any of its affiliates, as described in the Fund’s prospectus |
| | • | | Shares purchased from the proceeds of redemptions within the same fund family, provided (1) the repurchase occurs within 90 days following the redemption, (2) the redemption and purchase occur in the same account, and (3) redeemed shares were subject to a front-end or deferred sales load (known as Rights of Reinstatement). Subject to the Fund’s policy regarding frequent purchases and redemptions of Fund shares, you may not be able to repurchase shares for the first 30 days after your redemption. |
CDSC Waivers on A, B and C Shares available at Merrill Lynch
| | • | | Death or disability of the shareholder |
| | • | | Shares sold as part of a systematic withdrawal plan as described in the Fund’s prospectus |
| | • | | Return of excess contributions from an IRA Account |
| | • | | Shares sold as part of a required minimum distribution for IRA and retirement accounts due to the shareholder reaching age 70½ |
| | • | | Shares sold to pay Merrill Lynch fees but only if the transaction is initiated by Merrill Lynch |
| | • | | Shares acquired through a right of reinstatement |
| | • | | Shares held in retirement brokerage accounts, that are exchanged for a lower cost share class due to transfer to certain fee based accounts or platforms (applicable to A and C shares only) |
Front-end load Discounts Available at Merrill Lynch: Breakpoints, Rights of Accumulation & Letters of Intent
| | • | | Breakpoints as described in the Fund’s prospectus |
| | • | | Rights of Accumulation (ROA) which entitle shareholders to breakpoint discounts will be automatically calculated based on the aggregated holding of fund family assets held by accounts within the purchaser’s household at Merrill Lynch. Eligible fund family assets not held at Merrill Lynch may be included in the ROA calculation only if the shareholder notifies his or her financial advisor about such assets. |
| | • | | Letters of Intent (LOI) which allow for breakpoint discounts based on anticipated purchases within a fund family, through Merrill Lynch, over a 13-month period of time (if applicable) |
Morgan Stanley
Effective on or about July 1, 2018, shareholders purchasing Fund shares through a Morgan Stanley Wealth Management transactional brokerage account will be eligible only for the following Class A load waivers (front-end sales charge waivers), which may differ from and be more limited than those disclosed in the Fund’s prospectus or Statement of Additional Information.
Front-end Sales Load Waivers on Class A Shares Available at Morgan Stanley
| | • | | Employer-sponsored retirement plans (e.g., 401(k) plans, 457 plans, employer-sponsored 403(b) plans, profit sharing and money purchase pension plans and defined benefit plans). For purposes of this provision, employer-sponsored retirement plans do not include SEP IRAs, Simple IRAs, SAR-SEPs or Keogh plans. |
| | • | | Morgan Stanley employee and employee-related accounts according to Morgan Stanley’s account linking rules |
| | • | | Shares purchased through reinvestment of dividends and capital gains distributions when purchasing shares of the same fund |
| | • | | Shares purchased through a Morgan Stanley self-directed brokerage account |
| | | | |
| 36 | | Wells Fargo Small Cap Value Fund | | Appendix A (unaudited) |
| | • | | Class C (i.e., level-load) shares that are no longer subject to a contingent deferred sales charge and are exchanged to Class A shares of the same fund pursuant to Morgan Stanley Wealth Management’s share class exchange program. |
| | • | | Shares purchased from the proceeds of redemptions within the same fund family, provided (i) the repurchase occurs within 90 days following the redemption, (ii) the redemption and purchase occur in the same account, and (iii) redeemed shares were subject to a front-end or deferred sales charge. This waiver is subject to the Fund’s policy regarding frequent purchases and redemption of Fund shares, as discussed under “Account Information—Frequent Purchases and Redemptions of Fund Shares” in the Fund’s prospectus. |
Raymond James & Associates, Inc., Raymond James Financial Services & Raymond James affiliates (“Raymond James”)
Effective on or about March 1, 2019, shareholders purchasing Fund shares through a Raymond James platform or account will be eligible only for the following load waivers (front-end sales charge waivers and contingent deferred, or back-end, sales charge waivers) and discounts, which may differ from those disclosed elsewhere in the Fund’s Prospectus or SAI.
Front-end Sales Load Waivers on Class A shares Available at Raymond James
| | • | | Shares purchased in an investment advisory program. |
| | • | | Shares purchased through reinvestment of capital gains distributions and dividend reinvestment when purchasing shares of the same fund (but not any other fund within the fund family). |
| | • | | Employees and registered representatives of Raymond James or its affiliates and their family members as designated by Raymond James. |
| | • | | Shares purchased from the proceeds of redemptions within the same fund family, provided (1) the repurchase occurs within 90 days following the redemption, (2) the redemption and purchase occur in the same account, and (3) redeemed shares were subject to a front-end or deferred sales load (known as Rights of Reinstatement). |
| | • | | A shareholder in the fund’s Class C shares will have their shares automatically exchanged at net asset value to Class A shares (or the appropriate share class) of the fund if the shares are no longer subject to a CDSC and the exchange is in line with the policies and procedures of Raymond James. |
CDSC Waivers on Class A and C Shares Available at Raymond James
| | • | | Death or disability of the shareholder. |
| | • | | Shares sold as part of a systematic withdrawal plan as described in the Fund’s Prospectus. |
| | • | | Return of excess contributions from an IRA Account. |
| | • | | Shares sold as part of a required minimum distribution for IRA and retirement accounts due to the shareholder reaching age 70½ as described in the Fund’s prospectus. |
| | • | | Shares sold to pay Raymond James fees but only if the transaction is initiated by Raymond James. |
| | • | | Shares acquired through a right of reinstatement. |
Front-end Load Discounts Available at Raymond James: Breakpoints, and/or Rights of Accumulation
| | • | | Breakpoints as described in the Fund’s Prospectus. |
| | • | | Rights of accumulation which entitle shareholders to breakpoint discounts will be automatically calculated based on the aggregated holding of fund family assets held by accounts within the purchaser’s household at Raymond James. Eligible fund family assets not held at Raymond James may be included in the rights of accumulation calculation only if the shareholder notifies his or her financial advisor about such assets. |

For more information
More information about Wells Fargo Funds is available free upon request. To obtain literature, please write, visit the Fund’s website, or call:
Wells Fargo Funds
P.O. Box 219967
Kansas City, MO 64121-9967
Website: wellsfargofunds.com
Individual investors: 1-800-222-8222
Retail investment professionals: 1-888-877-9275
Institutional investment professionals: 1-866-765-0778
This report and the financial statements contained herein are submitted for the general information of the shareholders of the Fund. If this report is used for promotional purposes, distribution of the report must be accompanied or preceded by a current prospectus. Before investing, please consider the investment objectives, risks, charges, and expenses of the investment. For a current prospectus and, if available, a summary prospectus, containing this information, call 1-800-222-8222 or visit the Fund’s website at wellsfargofunds.com. Read the prospectus carefully before you invest or send money.
Wells Fargo Asset Management (WFAM) is the trade name for certain investment advisory/management firms owned by Wells Fargo & Company. These firms include but are not limited to Wells Capital Management Incorporated and Wells Fargo Funds Management, LLC. Certain products managed by WFAM entities are distributed by Wells Fargo Funds Distributor, LLC (a broker/dealer and Member FINRA).
This material is for general informational and educational purposes only and is NOT intended to provide investment advice or a recommendation of any kind—including a recommendation for any specific investment, strategy, or plan.
NOT FDIC INSURED ◾ NO BANK GUARANTEE ◾ MAY LOSE VALUE
© 2018 Wells Fargo Funds Management, LLC. All rights reserved.
| | |
 | | 317299 11-18 SA244/SAR244 09-18 |
Semi-Annual Report
September 30, 2018

Wells Fargo Special Small Cap Value Fund


Reduce clutter. Save trees.
Sign up for electronic delivery of prospectuses and shareholder reports at wellsfargo.com/advantagedelivery
Contents
The views expressed and any forward-looking statements are as of September 30, 2018, unless otherwise noted, and are those of the Fund managers and/or Wells Fargo Funds Management, LLC. Discussions of individual securities, or the markets generally, or any Wells Fargo Fund are not intended as individual recommendations. Future events or results may vary significantly from those expressed in any forward-looking statements. The views expressed are subject to change at any time in response to changing circumstances in the market. Wells Fargo Funds Management, LLC and the Fund disclaim any obligation to publicly update or revise any views expressed or forward-looking statements.
NOT FDIC INSURED ◾ NO BANK GUARANTEE ◾ MAY LOSE VALUE
| | | | |
| 2 | | Wells Fargo Special Small Cap Value Fund | | Letter to shareholders (unaudited) |

Andrew Owen
President
Wells Fargo Funds
The second and third quarters of 2018 were characterized by growing economic and investment activity in the U.S.
Dear Shareholder:
We are pleased to offer you this semi-annual report for the Wells Fargo Special Small Cap Value Fund for the six-month period that ended September 30, 2018. The second and third quarters of 2018 were characterized by growing economic and investment activity in the U.S. In contrast, economies overseas were restrained as geopolitical tensions and rising interest rates diverted investor interest in those markets.
For the period, U.S. stocks, as measured by the S&P 500 Index,1 gained 11.41% and international stocks, as measured by the MSCI ACWI ex USA Index (Net),2 lost 1.93%. Based on the MSCI EM Index (Net),3 emerging market stocks lost 8.97%. For bond investors, the Bloomberg Barclays U.S. Aggregate Bond Index4 lost 0.14% while the Bloomberg Barclays Global Aggregate ex-USD Index5 fell 6.42%. The Bloomberg Barclays Municipal Bond Index6 added 0.72%, and the ICE BofAML U.S. High Yield Index7 was up 3.46%.
Global trade tensions escalated during the second quarter.
During the second quarter of 2018, the U.S. government imposed tariffs, and foreign governments in North America, Europe, and Asia retaliated. The actions marked the initialization of trade tensions that would escalate during the next six months. The increasing tensions chilled investment activity as observers awaited signals of next steps.
Meanwhile, inflation continued an upward trend. The CPI-U8 added 0.1% in June after an increase of 0.2% in both April and May. On a year-over-year basis, the all-items index rose 2.9% for the 12 months that ended June 30, 2018. The index for all items less food and energy rose 2.3% for the same 12-month period.
| 1 | The S&P 500 Index consists of 500 stocks chosen for market size, liquidity, and industry group representation. It is a market-value-weighted index with each stock’s weight in the index proportionate to its market value. You cannot invest directly in an index. |
| 2 | The Morgan Stanley Capital International (MSCI) All Country World Index (ACWI) ex USA Index (Net) is a free-float-adjusted market-capitalization-weighted index that is designed to measure the equity market performance of developed markets, excluding the United States and Canada. Source: MSCI. MSCI makes no express or implied warranties or representations and shall have no liability whatsoever with respect to any MSCI data contained herein. The MSCI data may not be further redistributed or used as a basis for other indices or any securities or financial products. This report is not approved, reviewed, or produced by MSCI. You cannot invest directly in an index. |
| 3 | The MSCI Emerging Markets (EM) Index (Net) is a free-float-adjusted market-capitalization-weighted index that is designed to measure large- and mid-cap equity market performance of emerging markets. The MSCI EM Index (Net) consists of the following 24 emerging market country indices: Brazil, Chile, China, Colombia, Czech Republic, Egypt, Greece, Hungary, India, Indonesia, Korea, Malaysia, Mexico, Pakistan, Peru, the Philippines, Poland, Qatar, Russia, South Africa, Taiwan, Thailand, Turkey, and the United Arab Emirates. You cannot invest directly in an index. |
| 4 | The Bloomberg Barclays U.S. Aggregate Bond Index is a broad-based benchmark that measures the investment-grade, U.S. dollar-denominated, fixed-rate taxable bond market, including Treasuries, government-related and corporate securities, mortgage-backed securities (agency fixed-rate and hybrid adjustable-rate mortgage pass-throughs), asset-backed securities, and commercial mortgage-backed securities. You cannot invest directly in an index. |
| 5 | The Bloomberg Barclays Global Aggregate ex-USD Index is an unmanaged index that provides a broad-based measure of the global investment-grade fixed-income markets excluding the U.S. dollar-denominated debt market. You cannot invest directly in an index. |
| 6 | The Bloomberg Barclays Municipal Bond Index is an unmanaged index composed of long-term tax-exempt bonds with a minimum credit rating of Baa. You cannot invest directly in an index. |
| 7 | The ICE BofAML U.S. High Yield Index is a market-capitalization-weighted index of domestic and Yankee high-yield bonds. The index tracks the performance of high-yield securities traded in the U.S. bond market. You cannot invest directly in an index. Copyright 2018. ICE Data Indices, LLC. All rights reserved. |
| 8 | The Consumer Price Index for All Urban Consumers (CPI-U) measures the changes in the price of a basket of goods and services purchased by urban consumers. The urban consumer population is deemed by many as a better representative measure of the general public because close to 90% of the country’s population lives in highly populated areas. You cannot invest directly in an index. |
| | | | | | |
| Letter to shareholders (unaudited) | | Wells Fargo Special Small Cap Value Fund | | | 3 | |
U.S. stocks gained while international stocks and bonds declined during the summer of 2018.
The U.S. economy strengthened during the summer months. Revised second-quarter gross domestic product data released in August showed the U.S. economy growing at a 4.2% rate. After ticking up slightly in June, the unemployment rate in the U.S. was 3.9% in July and August, according to the U.S. Department of Labor. Wages showed more consistent growth, and consumer confidence remained strong.
Several U.S. equity market indices reached records during August, with the S&P 500 Index gaining 7.76% for the three-month period that ended August 31, 2018. International stock values continued to suffer under the effects of a strong U.S. dollar and continuing trade tensions. The MSCI ACWI ex USA Index (Net) and the MSCI EM Index (Net) were down 4.70% and 1.64%, during the same three-month period.
The U.S. Federal Reserve (Fed) increased the federal funds rate in June, and expectations grew that two more rate increases were in the offing in 2018. Long-term interest rates in the U.S. remained at higher levels relative to the prior 10 years. Rates on 10-year and 30-year Treasury bonds—2.74% and 2.97%, respectively, on March 31, 2018—were 3.05% and 3.19%, respectively, on September 30, off their peak levels on May 17, 2018, of 3.11% and 3.25%, respectively. Some investors became more aware of and concerned about the potential for an inverted yield curve—sometimes a recession signal—as short-term rates increased more quickly than long-term rates. The Fed decided to forgo an interest rate increase at its August meeting.
Internationally, members of Prime Minister Theresa May’s U.K./Brexit negotiating team resigned amid unproductive negotiations. In early August, the Bank of England’s Monetary Policy Committee increased its key interest rate to 0.75%. Central banks in Europe and Japan maintained low interest rates and accommodative monetary policies. Amid rising trade uncertainty, the People’s Bank of China cut reserve requirement ratios and accelerated infrastructure spending and tax cuts for business enterprises and individuals. Nevertheless, a strengthening U.S. dollar and the trade tensions remained headwinds for investors overseas.
Don’t let short-term uncertainty derail long-term investment goals.
Periods of investment uncertainty can present challenges, but experience has taught us that maintaining long-term investment goals can be an effective way to plan for the future. To help you create a sound strategy based on your personal goals and risk tolerance, Wells Fargo Funds offers more than 100 mutual funds spanning a wide range of asset classes and investment styles. Although diversification cannot guarantee an investment profit or prevent losses, we believe it can be an effective way to manage investment risk and potentially smooth out overall portfolio performance. We encourage investors to know their investments and to understand that appropriate levels of risk-taking may unlock opportunities.
The U.S. economy strengthened during the summer months.
| | | | |
| 4 | | Wells Fargo Special Small Cap Value Fund | | Letter to shareholders (unaudited) |
Thank you for choosing to invest with Wells Fargo Funds. We appreciate your confidence in us and remain committed to helping you meet your financial needs.
Sincerely,

Andrew Owen
President
Wells Fargo Funds
Notice to shareholders
At a meeting held on August 14-15, 2018, the Board of Trustees of the Fund approved the following policy which will be effective on or about February 5, 2019:
Class C shares will convert automatically into Class A shares ten years after the initial date of purchase or, if you acquired your Class C shares through an exchange or conversion from another share class, ten years after the date you acquired your Class C shares. When Class C shares that you acquired through a purchase or exchange convert, any other Class C shares that you purchased with reinvested dividends and distributions also will convert into Class A shares on a pro rata basis. A shorter holding period may also apply depending on your intermediary. Please see “Appendix A—Sales Charge Reductions and Waivers for Certain Intermediaries” in the Fund’s prospectus or at the end of this report.
For further information about your Fund, contact your investment professional, visit our website at wellsfargofunds.com, or call us directly at 1-800-222-8222.
This page is intentionally left blank.
| | | | |
| 6 | | Wells Fargo Special Small Cap Value Fund | | Performance highlights (unaudited) |
The Fund is currently closed to most new investors.1
Investment objective
The Fund seeks long-term capital appreciation.
Manager
Wells Fargo Funds Management, LLC
Subadviser
Wells Capital Management Incorporated
Portfolio managers
Robert Rifkin, CFA®
James M. Tringas, CFA®
Bryant VanCronkhite, CFA®, CPA
Average annual total returns (%) as of September 30, 20182
| | | | | | | | | | | | | | | | | | | | | | | | | | | | | | | | | | |
| | | | | Including sales charge | | | Excluding sales charge | | | Expense ratios3 (%) | |
| | | Inception date | | 1 year | | | 5 year | | | 10 year | | | 1 year | | | 5 year | | | 10 year | | | Gross | | | Net4 | |
| Class A (ESPAX) | | 5-7-1993 | | | 5.04 | | | | 10.31 | | | | 10.20 | | | | 11.45 | | | | 11.63 | | | | 10.85 | | | | 1.31 | | | | 1.31 | |
| Class C (ESPCX) | | 12-12-2000 | | | 9.62 | | | | 10.79 | | | | 10.03 | | | | 10.62 | | | | 10.79 | | | | 10.03 | | | | 2.06 | | | | 2.06 | |
| Class R (ESPHX) | | 9-30-2015 | | | – | | | | – | | | | – | | | | 11.14 | | | | 11.36 | | | | 10.56 | | | | 1.56 | | | | 1.56 | |
| Class R6 (ESPRX) | | 10-31-2014 | | | – | | | | – | | | | – | | | | 11.94 | | | | 12.10 | | | | 11.28 | | | | 0.88 | | | | 0.88 | |
| Administrator Class (ESPIX) | | 7-23-1996 | | | – | | | | – | | | | – | | | | 11.56 | | | | 11.81 | | | | 11.09 | | | | 1.23 | | | | 1.20 | |
| Institutional Class (ESPNX) | | 7-30-2010 | | | – | | | | – | | | | – | | | | 11.84 | | | | 12.06 | | | | 11.26 | | | | 0.98 | | | | 0.94 | |
| Russell 2000® Value Index5 | | – | | | – | | | | – | | | | – | | | | 9.33 | | | | 9.91 | | | | 9.52 | | | | – | | | | – | |
Figures quoted represent past performance, which is no guarantee of future results, and do not reflect taxes that a shareholder may pay on fund distributions or the redemption of fund shares. Investment return and principal value of an investment will fluctuate so that an investor’s shares, when redeemed, may be worth more or less than their original cost. Performance shown without sales charges would be lower if sales charges were reflected. Current performance may be lower or higher than the performance data quoted, which assumes the reinvestment of dividends and capital gains. Current month-end performance is available on the Fund’s website, wellsfargofunds.com.
Index returns do not include transaction costs associated with buying and selling securities, any mutual fund fees or expenses, or any taxes. It is not possible to invest directly in an index.
For Class A shares, the maximum front-end sales charge is 5.75%. For Class C shares, the maximum contingent deferred sales charge is 1.00%. Performance including a contingent deferred sales charge assumes the sales charge for the corresponding time period. Class R, Class R6, Administrator Class, and Institutional Class shares are sold without a front-end sales charge or contingent deferred sales charge.
Stock values fluctuate in response to the activities of individual companies and general market and economic conditions. Smaller-company stocks tend to be more volatile and less liquid than those of larger companies. Consult the Fund’s prospectus for additional information on these and other risks.
Please see footnotes on page 7.
| | | | | | |
| Performance highlights (unaudited) | | Wells Fargo Special Small Cap Value Fund | | | 7 | |
| | |
| Ten largest holdings (%) as of September 30, 20186 |
First Citizens BancShares Corporation Class A | | 2.48% |
Neenah Paper Incorporated | | 2.27% |
Dine Brands Global Incorporated | | 2.21% |
Innospec Incorporated | | 2.05% |
UMB Financial Corporation | | 2.03% |
Mueller Industries Incorporated | | 2.01% |
KMG Chemicals Incorporated | | 1.88% |
Eagle Materials Incorporated | | 1.78% |
Simpson Manufacturing Company Incorporated | | 1.73% |
Hawaiian Electric Industries Incorporated | | 1.68% |
|
| Sector distribution as of September 30, 20187 |
|
 |
| 1 | Please see the Fund’s current Statement of Additional Information for further details. |
| 2 | Historical performance shown for Class R shares prior to their inception reflects the performance of the Institutional Class shares adjusted to reflect the higher expenses applicable to Class R shares. Historical performance for Class R6 shares prior to their inception reflects the performance of the Institutional Class shares, and includes the higher expenses applicable to Institutional Class shares. If these expenses had not been included, returns for Class R6 shares would be higher. Historical performance shown for Institutional Class shares prior to their inception reflects the performance of Administrator Class shares, and includes the higher expenses applicable to Administrator Class shares. If these expenses had not been included, returns for Institutional Class shares would be higher. Historical performance shown for all classes of the Fund prior to July 19, 2010, is based on the performance of the Fund’s predecessor, Evergreen Special Values Fund. |
| 3 | Reflects the expense ratios as stated in the most recent prospectuses. The expense ratios shown are subject to change and may differ from the annualized expense ratios shown in the financial highlights of this report. |
| 4 | The manager has contractually committed through July 31, 2019, to waive fees and/or reimburse expenses to the extent necessary to cap the Fund’s Total Annual Fund Operating Expenses After Fee Waivers at 1.34% for Class A, 2.09% for Class C, 1.59% for Class R, 0.89% for Class R6, 1.20% for Administrator Class, and 0.94% for Institutional Class. After this time, the cap may be increased or the commitment to maintain the cap may be terminated only with the approval of the Board of Trustees. Brokerage commissions, stamp duty fees, interest, taxes, acquired fund fees and expenses (if any), and extraordinary expenses are excluded from the expense cap. Without this cap, the Fund’s returns would have been lower. The expense ratio paid by an investor is the net expense ratio (the total annual fund operating expenses after fee waivers) as stated in the prospectuses. |
| 5 | The Russell 2000® Value Index measures the performance of those Russell 2000 companies with lower price/book ratios and lower forecasted growth values. You cannot invest directly in an index. |
| 6 | The ten largest holdings, excluding cash, cash equivalents and any money market funds, are calculated based on the value of the investments divided by total net assets of the Fund. Holdings are subject to change and may have changed since the date specified. |
| 7 | Amounts are calculated based on the total long-term investments of the Fund. These amounts are subject to change and may have changed since the date specified. |
| | | | |
| 8 | | Wells Fargo Special Small Cap Value Fund | | Fund expenses (unaudited) |
As a shareholder of the Fund, you incur two types of costs: (1) transaction costs, including sales charges (loads) on purchase payments and contingent deferred sales charges (if any) on redemptions and (2) ongoing costs, including management fees, distribution (12b-1) and/or shareholder servicing fees, and other Fund expenses. This example is intended to help you understand your ongoing costs (in dollars) of investing in the Fund and to compare these costs with the ongoing costs of investing in other mutual funds.
The example is based on an investment of $1,000 invested at the beginning of the six-month period and held for the entire period from April 1, 2018 to September 30, 2018.
Actual expenses
The “Actual” line of the table below provides information about actual account values and actual expenses. You may use the information in this line, together with the amount you invested, to estimate the expenses that you paid over the period. Simply divide your account value by $1,000 (for example, an $8,600 account value divided by $1,000 = 8.6), then multiply the result by the number in the “Actual” line under the heading entitled “Expenses paid during period” for your applicable class of shares to estimate the expenses you paid on your account during this period.
Hypothetical example for comparison purposes
The “Hypothetical” line of the table below provides information about hypothetical account values and hypothetical expenses based on the Fund’s actual expense ratio and an assumed rate of return of 5% per year before expenses, which is not the Fund’s actual return. The hypothetical account values and expenses may not be used to estimate the actual ending account balance or expenses you paid for the period. You may use this information to compare the ongoing costs of investing in the Fund and other funds. To do so, compare this 5% hypothetical example with the 5% hypothetical examples that appear in the shareholder reports of the other funds.
Please note that the expenses shown in the table are meant to highlight your ongoing costs only and do not reflect any transactional costs, such as sales charges (loads) and contingent deferred sales charges. Therefore, the “Hypothetical” line of the table is useful in comparing ongoing costs only and will not help you determine the relative total costs of owning different funds. In addition, if these transactional costs were included, your costs would have been higher.
| | | | | | | | | | | | | | | | |
| | | Beginning account value 4-1-2018 | | | Ending account value 9-30-2018 | | | Expenses paid during the period¹ | | | Annualized net expense ratio | |
Class A | | | | | | | | | | | | | | | | |
Actual | | $ | 1,000.00 | | | $ | 1,072.63 | | | $ | 6.70 | | | | 1.29 | % |
Hypothetical (5% return before expenses) | | $ | 1,000.00 | | | $ | 1,018.60 | | | $ | 6.53 | | | | 1.29 | % |
Class C | | | | | | | | | | | | | | | | |
Actual | | $ | 1,000.00 | | | $ | 1,068.57 | | | $ | 10.58 | | | | 2.04 | % |
Hypothetical (5% return before expenses) | | $ | 1,000.00 | | | $ | 1,014.84 | | | $ | 10.30 | | | | 2.04 | % |
Class R | | | | | | | | | | | | | | | | |
Actual | | $ | 1,000.00 | | | $ | 1,071.27 | | | $ | 8.00 | | | | 1.54 | % |
Hypothetical (5% return before expenses) | | $ | 1,000.00 | | | $ | 1,017.35 | | | $ | 7.79 | | | | 1.54 | % |
Class R6 | | | | | | | | | | | | | | | | |
Actual | | $ | 1,000.00 | | | $ | 1,075.18 | | | $ | 4.47 | | | | 0.86 | % |
Hypothetical (5% return before expenses) | | $ | 1,000.00 | | | $ | 1,020.76 | | | $ | 4.36 | | | | 0.86 | % |
Administrator Class | | | | | | | | | | | | | | | | |
Actual | | $ | 1,000.00 | | | $ | 1,073.25 | | | $ | 6.24 | | | | 1.20 | % |
Hypothetical (5% return before expenses) | | $ | 1,000.00 | | | $ | 1,019.05 | | | $ | 6.07 | | | | 1.20 | % |
Institutional Class | | | | | | | | | | | | | | | | |
Actual | | $ | 1,000.00 | | | $ | 1,074.57 | | | $ | 4.89 | | | | 0.94 | % |
Hypothetical (5% return before expenses) | | $ | 1,000.00 | | | $ | 1,020.36 | | | $ | 4.76 | | | | 0.94 | % |
| 1 | Expenses paid is equal to the annualized net expense ratio of each class multiplied by the average account value over the period, multiplied by the number of days in the most recent fiscal half-year divided by the number of days in the fiscal year (to reflect the one-half-year period). |
| | | | | | |
| Portfolio of investments—September 30, 2018 (unaudited) | | Wells Fargo Special Small Cap Value Fund | | | 9 | |
| | | | | | | | | | | | | | | | |
| Security name | | | | | | | | Shares | | | Value | |
| | | |
Common Stocks: 94.49% | | | | | | | | | | | | | |
| | | | |
Communication Services: 1.54% | | | | | | | | | | | | | | | | |
| | | |
| Diversified Telecommunication Services: 0.27% | | | | | | | | | | | | | |
Consolidated Communications Holdings Incorporated « | | | | | | | | | | | 558,524 | | | $ | 7,283,153 | |
| | | | | | | | | | | | | | | | |
| | | |
| Media: 1.27% | | | | | | | | | | | | | |
A.H. Belo Corporation Class A (l) | | | | | | | | | | | 1,496,789 | | | | 6,885,229 | |
Gannett Company Incorporated | | | | | | | | | | | 1,224,721 | | | | 12,259,457 | |
New Media Investment Group Incorporated | | | | | | | | | | | 1,002,539 | | | | 15,729,837 | |
| | | |
| | | | | | | | | | | | 34,874,523 | |
| | | | | | | | | | | | | | | | |
| | | |
Consumer Discretionary: 8.46% | | | | | | | | | | | | | |
| | | | |
| Auto Components: 0.31% | | | | | | | | | | | | | | | | |
Delphi Technologies plc | | | | | | | | | | | 275,800 | | | | 8,649,088 | |
| | | | | | | | | | | | | | | | |
| | | |
| Diversified Consumer Services: 0.12% | | | | | | | | | | | | | |
Liberty Tax Incorporated « | | | | | | | | | | | 273,546 | | | | 3,186,811 | |
| | | | | | | | | | | | | | | | |
| | | |
| Hotels, Restaurants & Leisure: 4.85% | | | | | | | | | | | | | |
Denny’s Corporation † | | | | | | | | | | | 2,787,690 | | | | 41,034,797 | |
Dine Brands Global Incorporated | | | | | | | | | | | 744,700 | | | | 60,551,557 | |
The Wendy’s Company | | | | | | | | | | | 1,829,300 | | | | 31,354,202 | |
| | | |
| | | | | | | | | | | | 132,940,556 | |
| | | | | | | | | | | | | | | | |
| | | |
| Household Durables: 1.70% | | | | | | | | | | | | | |
Dixie Group Incorporated † | | | | | | | | | | | 713,035 | | | | 1,140,856 | |
Helen of Troy Limited † | | | | | | | | | | | 289,800 | | | | 37,934,820 | |
Skyline Champion Corporation | | | | | | | | | | | 264,986 | | | | 7,570,650 | |
| | | |
| | | | | | | | | | | | 46,646,326 | |
| | | | | | | | | | | | | | | | |
| | | |
| Specialty Retail: 0.45% | | | | | | | | | | | | | |
Christopher & Banks Corporation Ǡ | | | | | | | | | | | 1,086,348 | | | | 825,733 | |
The Buckle Incorporated « | | | | | | | | | | | 496,820 | | | | 11,451,701 | |
| | | |
| | | | | | | | | | | | 12,277,434 | |
| | | | | | | | | | | | | | | | |
| | | |
| Textiles, Apparel & Luxury Goods: 1.03% | | | | | | | | | | | | | |
Delta Apparel Incorporated (l)† | | | | | | | | | | | 469,892 | | | | 8,359,379 | |
Steven Madden Limited | | | | | | | | | | | 374,300 | | | | 19,800,470 | |
| | | |
| | | | | | | | | | | | 28,159,849 | |
| | | | | | | | | | | | | | | | |
| | | |
Consumer Staples: 7.21% | | | | | | | | | | | | | |
| | | |
| Beverages: 0.90% | | | | | | | | | | | | | |
Cott Corporation | | | | | | | | | | | 1,523,800 | | | | 24,609,370 | |
| | | | | | | | | | | | | | | | |
| | | |
| Food Products: 3.42% | | | | | | | | | | | | | |
Hostess Brands Incorporated † | | | | | | | | | | | 1,307,023 | | | | 14,468,745 | |
J & J Snack Foods Corporation | | | | | | | | | | | 110,800 | | | | 16,718,612 | |
Nomad Foods Limited † | | | | | | | | | | | 2,140,124 | | | | 43,358,912 | |
The accompanying notes are an integral part of these financial statements.
| | | | |
| 10 | | Wells Fargo Special Small Cap Value Fund | | Portfolio of investments—September 30, 2018 (unaudited) |
| | | | | | | | | | | | | | | | |
| Security name | | | | | | | | Shares | | | Value | |
| | | |
| Food Products (continued) | | | | | | | | | | | | | |
TreeHouse Foods Incorporated † | | | | | | | | | | | 399,685 | | | $ | 19,124,927 | |
| | | |
| | | | | | | | | | | | 93,671,196 | |
| | | | | | | | | | | | | | | | |
| | | |
| Household Products: 2.89% | | | | | | | | | | | | | |
Central Garden & Pet Company (l)Ǡ | | | | | | | | | | | 709,780 | | | | 25,580,471 | |
Central Garden & Pet Company Class A † | | | | | | | | | | | 526,833 | | | | 17,459,246 | |
Spectrum Brands Holdings Incorporated | | | | | | | | | | | 486,501 | | | | 36,351,355 | |
| | | | |
| | | | | | | | | | | | | | | 79,391,072 | |
| | | | | | | | | | | | | | | | |
| | | |
Energy: 4.88% | | | | | | | | | | | | | |
| | | |
| Energy Equipment & Services: 2.50% | | | | | | | | | | | | | |
C&J Energy Services Incorporated † | | | | | | | | | | | 527,400 | | | | 10,969,920 | |
Forum Energy Technologies Incorporated † | | | | | | | | | | | 521,500 | | | | 5,397,525 | |
Oil States International Incorporated † | | | | | | | | | | | 547,900 | | | | 18,190,280 | |
Patterson-UTI Energy Incorporated | | | | | | | | | | | 1,363,310 | | | | 23,326,234 | |
Tetra Technologies Incorporated † | | | | | | | | | | | 2,384,700 | | | | 10,754,997 | |
| | | | |
| | | | | | | | | | | | | | | 68,638,956 | |
| | | | | | | | | | | | | | | | |
| | | |
| Oil, Gas & Consumable Fuels: 2.38% | | | | | | | | | | | | | |
Berry Petroleum Corporation | | | | | | | | | | | 423,242 | | | | 7,457,524 | |
Callon Petroleum Company † | | | | | | | | | | | 476,800 | | | | 5,716,832 | |
Penn Virginia Corporation † | | | | | | | | | | | 164,400 | | | | 13,240,776 | |
QEP Resources Incorporated † | | | | | | | | | | | 2,290,400 | | | | 25,927,328 | |
WPX Energy Incorporated † | | | | | | | | | | | 636,637 | | | | 12,809,136 | |
| | | | |
| | | | | | | | | | | | | | | 65,151,596 | |
| | | | | | | | | | | | | | | | |
| | | |
Financials: 18.68% | | | | | | | | | | | | | |
| | | |
| Banks: 11.56% | | | | | | | | | | | | | |
Associated Banc Corporation | | | | | | | | | | | 1,385,600 | | | | 36,025,600 | |
First Citizens BancShares Corporation Class A | | | | | | | | | | | 150,050 | | | | 67,864,616 | |
First Hawaiian Incorporated | | | | | | | | | | | 666,800 | | | | 18,110,288 | |
Fulton Financial Corporation | | | | | | | | | | | 548,849 | | | | 9,138,336 | |
Hancock Holding Company | | | | | | | | | | | 699,245 | | | | 33,249,100 | |
IBERIABANK Corporation | | | | | | | | | | | 357,100 | | | | 29,050,085 | |
Renasant Corporation | | | | | | | | | | | 956,945 | | | | 39,435,703 | |
South State Corporation | | | | | | | | | | | 346,400 | | | | 28,404,800 | |
UMB Financial Corporation | | | | | | | | | | | 783,586 | | | | 55,556,247 | |
| | | | |
| | | | | | | | | | | | | | | 316,834,775 | |
| | | | | | | | | | | | | | | | |
| | | |
| Capital Markets: 3.06% | | | | | | | | | | | | | |
Apollo Investment Corporation | | | | | | | | | | | 2,699,500 | | | | 14,685,280 | |
Artisan Partners Asset Management Incorporated Class A | | | | | | | | | | | 960,601 | | | | 31,123,472 | |
New Mountain Finance Corporation | | | | | | | | | | | 1,147,590 | | | | 15,492,465 | |
Westwood Holdings Group Incorporated | | | | | | | | | | | 436,883 | | | | 22,604,326 | |
| | | | |
| | | | | | | | | | | | | | | 83,905,543 | |
| | | | | | | | | | | | | | | | |
| | | |
| Diversified Financial Services: 0.04% | | | | | | | | | | | | | |
Schulman Incorporated Class A (a) | | | | | | | | | | | 593,658 | | | | 1,133,887 | |
| | | | | | | | | | | | | | | | |
The accompanying notes are an integral part of these financial statements.
| | | | | | |
| Portfolio of investments—September 30, 2018 (unaudited) | | Wells Fargo Special Small Cap Value Fund | | | 11 | |
| | | | | | | | | | | | | | | | |
| Security name | | | | | | | | Shares | | | Value | |
| | | |
| Insurance: 3.13% | | | | | | | | | | | | | |
Aspen Insurance Holdings Limited | | | | | | | | | | | 592,000 | | | $ | 24,745,600 | |
ProAssurance Corporation | | | | | | | | | | | 664,600 | | | | 31,202,970 | |
Stewart Information Services Corporation | | | | | | | | | | | 664,707 | | | | 29,918,462 | |
| | | | |
| | | | | | | | | | | | | | | 85,867,032 | |
| | | | | | | | | | | | | | | | |
| | | |
| Mortgage REITs: 0.69% | | | | | | | | | | | | | |
Apollo Commercial Real Estate Finance Incorporated | | | | | | | | | | | 1,000,137 | | | | 18,872,585 | |
| | | | | | | | | | | | | | | | |
| | | | |
| Thrifts & Mortgage Finance: 0.20% | | | | | | | | | | | | | | | | |
Flagstar Bancorp Incorporated † | | | | | | | | | | | 168,232 | | | | 5,294,261 | |
| | | | | | | | | | | | | | | | |
| | | | |
Health Care: 2.02% | | | | | | | | | | | | | | | | |
| | | | |
| Health Care Equipment & Supplies: 0.16% | | | | | | | | | | | | | | | | |
Varex Imaging Corporation † | | | | | | | | | | | 156,300 | | | | 4,479,558 | |
| | | | | | | | | | | | | | | | |
| | | | |
| Health Care Providers & Services: 0.44% | | | | | | | | | | | | | | | | |
Hanger Incorporated † | | | | | | | | | | | 574,700 | | | | 11,971,001 | |
| | | | | | | | | | | | | | | | |
| | | | |
| Life Sciences Tools & Services: 0.16% | | | | | | | | | | | | | | | | |
Cambrex Corporation † | | | | | | | | | | | 64,600 | | | | 4,418,640 | |
| | | | | | | | | | | | | | | | |
| | | | |
| Pharmaceuticals: 1.26% | | | | | | | | | | | | | | | | |
Innoviva Incorporated † | | | | | | | | | | | 680,202 | | | | 10,366,278 | |
Prestige Brands Holdings Incorporated † | | | | | | | | | | | 637,100 | | | | 24,139,719 | |
| | | | |
| | | | | | | | | | | | | | | 34,505,997 | |
| | | | | | | | | | | | | | | | |
| | | | |
Industrials: 21.57% | | | | | | | | | | | | | | | | |
| | | | |
| Building Products: 4.17% | | | | | | | | | | | | | | | | |
CSW Industrials Incorporated † | | | | | | | | | | | 709,244 | | | | 38,086,403 | |
Griffon Corporation | | | | | | | | | | | 541,955 | | | | 8,752,573 | |
Quanex Building Products Corporation | | | | | | | | | | | 1,095,600 | | | | 19,939,920 | |
Simpson Manufacturing Company Incorporated | | | | | | | | | | | 655,895 | | | | 47,526,152 | |
| | | | |
| | | | | | | | | | | | | | | 114,305,048 | |
| | | | | | | | | | | | | | | | |
| | | | |
| Commercial Services & Supplies: 5.13% | | | | | | | | | | | | | | | | |
ABM Industries Incorporated | | | | | | | | | | | 39,500 | | | | 1,273,875 | |
ACCO Brands Corporation | | | | | | | | | | | 1,665,061 | | | | 18,815,189 | |
Brady Corporation Class A | | | | | | | | | | | 700,509 | | | | 30,647,269 | |
Deluxe Corporation | | | | | | | | | | | 584,831 | | | | 33,300,277 | |
Ennis Incorporated (l) | | | | | | | | | | | 1,386,182 | | | | 28,347,422 | |
LSC Communications Incorporated | | | | | | | | | | | 312,862 | | | | 3,460,254 | |
Viad Corporation | | | | | | | | | | | 419,850 | | | | 24,876,113 | |
| | | | |
| | | | | | | | | | | | | | | 140,720,399 | |
| | | | | | | | | | | | | | | | |
| | | | |
| Electrical Equipment: 2.56% | | | | | | | | | | | | | | | | |
Atkore International Incorporated † | | | | | | | | | | | 1,304,921 | | | | 34,619,554 | |
EnerSys | | | | | | | | | | | 406,835 | | | | 35,447,534 | |
| | | | |
| | | | | | | | | | | | | | | 70,067,088 | |
| | | | | | | | | | | | | | | | |
The accompanying notes are an integral part of these financial statements.
| | | | |
| 12 | | Wells Fargo Special Small Cap Value Fund | | Portfolio of investments—September 30, 2018 (unaudited) |
| | | | | | | | | | | | | | | | |
| Security name | | | | | | | | Shares | | | Value | |
| | | | |
| Machinery: 8.87% | | | | | | | | | | | | | | | | |
Douglas Dynamics Incorporated | | | | | | | | | | | 706,670 | | | $ | 31,022,813 | |
Franklin Electric Company Incorporated | | | | | | | | | | | 969,336 | | | | 45,801,126 | |
Global Brass & Copper Holdings Incorporated | | | | | | | | | | | 870,719 | | | | 32,129,531 | |
Hillenbrand Incorporated | | | | | | | | | | | 605,544 | | | | 31,669,951 | |
Kadant Incorporated | | | | | | | | | | | 299,259 | | | | 32,275,083 | |
Mueller Industries Incorporated | | | | | | | | | | | 1,899,080 | | | | 55,035,338 | |
NN Incorporated | | | | | | | | | | | 972,410 | | | | 15,169,596 | |
| | | | |
| | | | | | | | | | | | | | | 243,103,438 | |
| | | | | | | | | | | | | | | | |
| | | | |
| Professional Services: 0.49% | | | | | | | | | | | | | | | | |
Korn/Ferry International | | | | | | | | | | | 274,232 | | | | 13,503,184 | |
| | | | | | | | | | | | | | | | |
| | | | |
| Trading Companies & Distributors: 0.35% | | | | | | | | | | | | | | | | |
Aircastle Limited | | | | | | | | | | | 440,300 | | | | 9,646,973 | |
| | | | | | | | | | | | | | | | |
| | | | |
Information Technology: 9.91% | | | | | | | | | | | | | | | | |
| | | | |
| Communications Equipment: 0.91% | | | | | | | | | | | | | | | | |
NETGEAR Incorporated † | | | | | | | | | | | 395,502 | | | | 24,857,301 | |
| | | | | | | | | | | | | | | | |
| | | | |
| Electronic Equipment, Instruments & Components: 5.22% | | | | | | | | | | | | | | | | |
AVX Corporation | | | | | | | | | | | 971,360 | | | | 17,533,048 | |
Badger Meter Incorporated | | | | | | | | | | | 314,977 | | | | 16,678,032 | |
Belden Incorporated | | | | | | | | | | | 596,968 | | | | 42,629,485 | |
Coherent Incorporated † | | | | | | | | | | | 92,900 | | | | 15,996,451 | |
Novanta Incorporated † | | | | | | | | | | | 341,545 | | | | 23,361,678 | |
Orbotech Limited † | | | | | | | | | | | 450,630 | | | | 26,785,447 | |
| | | | |
| | | | | | | | | | | | | | | 142,984,141 | |
| | | | | | | | | | | | | | | | |
| | | | |
| IT Services: 1.93% | | | | | | | | | | | | | | | | |
Conduent Incorporated † | | | | | | | | | | | 891,000 | | | | 20,065,320 | |
Maximus Incorporated | | | | | | | | | | | 162,900 | | | | 10,598,274 | |
Sykes Enterprises Incorporated † | | | | | | | | | | | 733,500 | | | | 22,364,415 | |
| | | | |
| | | | | | | | | | | | | | | 53,028,009 | |
| | | | | | | | | | | | | | | | |
| | | | |
| Semiconductors & Semiconductor Equipment: 0.99% | | | | | | | | | | | | | | | | |
Brooks Automation Incorporated | | | | | | | | | | | 143,400 | | | | 5,023,302 | |
Cabot Microelectronics Corporation | | | | | | | | | | | 143,100 | | | | 14,763,627 | |
DSP Group Incorporated † | | | | | | | | | | | 605,448 | | | | 7,204,831 | |
| | | | |
| | | | | | | | | | | | | | | 26,991,760 | |
| | | | | | | | | | | | | | | | |
| | | | |
| Software: 0.32% | | | | | | | | | | | | | | | | |
Cision Limited † | | | | | | | | | | | 527,701 | | | | 8,865,377 | |
| | | | | | | | | | | | | | | | |
| | | | |
| Technology Hardware, Storage & Peripherals: 0.54% | | | | | | | | | | | | | | | | |
Glassbridge Enterprises Incorporated (l)Ǡ | | | | | | | | | | | 305,421 | | | | 174,090 | |
NCR Corporation † | | | | | | | | | | | 519,100 | | | | 14,747,631 | |
| | | | |
| | | | | | | | | | | | | | | 14,921,721 | |
| | | | | | | | | | | | | | | | |
The accompanying notes are an integral part of these financial statements.
| | | | | | |
| Portfolio of investments—September 30, 2018 (unaudited) | | Wells Fargo Special Small Cap Value Fund | | | 13 | |
| | | | | | | | | | | | | | | | |
| Security name | | | | | | | | Shares | | | Value | |
| | | | |
Materials: 14.79% | | | | | | | | | | | | | | | | |
| | | | |
| Chemicals: 7.36% | | | | | | | | | | | | | | | | |
GCP Applied Technologies Incorporated † | | | | | | | | | | | 227,900 | | | $ | 6,050,745 | |
Innophos Holdings Incorporated | | | | | | | | | | | 160,418 | | | | 7,122,559 | |
Innospec Incorporated | | | | | | | | | | | 730,641 | | | | 56,076,697 | |
KMG Chemicals Incorporated | | | | | | | | | | | 680,456 | | | | 51,415,255 | |
PolyOne Corporation | | | | | | | | | | | 369,200 | | | | 16,141,424 | |
PQ Group Holdings Incorporated † | | | | | | | | | | | 596,373 | | | | 10,418,636 | |
Quaker Chemical Corporation | | | | | | | | | | | 94,890 | | | | 19,187,707 | |
Sensient Technologies Corporation | | | | | | | | | | | 460,468 | | | | 35,230,407 | |
| | | | |
| | | | | | | | | | | | | | | 201,643,430 | |
| | | | | | | | | | | | | | | | |
| | | | |
| Construction Materials: 1.78% | | | | | | | | | | | | | | | | |
Eagle Materials Incorporated | | | | | | | | | | | 571,700 | | | | 48,731,708 | |
| | | | | | | | | | | | | | | | |
| | | | |
| Containers & Packaging: 1.48% | | | | | | | | | | | | | | | | |
Silgan Holdings Incorporated | | | | | | | | | | | 1,459,442 | | | | 40,572,488 | |
| | | | | | | | | | | | | | | | |
| | | | |
| Metals & Mining: 0.89% | | | | | | | | | | | | | | | | |
Compass Minerals International Incorporated | | | | | | | | | | | 362,600 | | | | 24,366,720 | |
| | | | | | | | | | | | | | | | |
| | | | |
| Paper & Forest Products: 3.28% | | | | | | | | | | | | | | | | |
Neenah Paper Incorporated | | | | | | | | | | | 720,121 | | | | 62,146,442 | |
Schweitzer-Mauduit International Incorporated | | | | | | | | | | | 727,887 | | | | 27,885,351 | |
| | | | |
| | | | | | | | | | | | | | | 90,031,793 | |
| | | | | | | | | | | | | | | | |
| | | | |
Real Estate: 2.61% | | | | | | | | | | | | | | | | |
| | | | |
| Equity REITs: 2.61% | | | | | | | | | | | | | | | | |
Acadia Realty Trust | | | | | | | | | | | 593,000 | | | | 16,621,790 | |
LaSalle Hotel Properties | | | | | | | | | | | 851,300 | | | | 29,446,467 | |
Washington REIT | | | | | | | | | | | 828,657 | | | | 25,398,337 | |
| | | | |
| | | | | | | | | | | | | | | 71,466,594 | |
| | | | | | | | | | | | | | | | |
| | | | |
Utilities: 2.82% | | | | | | | | | | | | | | | | |
| | | | |
| Electric Utilities: 2.82% | | | | | | | | | | | | | | | | |
Hawaiian Electric Industries Incorporated | | | | | | | | | | | 1,293,454 | | | | 46,034,028 | |
IDACORP Incorporated | | | | | | | | | | | 315,700 | | | | 31,326,911 | |
| | | | |
| | | | | | | | | | | | | | | 77,360,939 | |
| | | | | | | | | | | | | | | | |
| | | | |
Total Common Stocks (Cost $2,218,618,736) | | | | | | | | | | | | | | | 2,589,931,320 | |
| | | | | | | | | | | | | | | | |
| | | | |
| | | Dividend yield | | | | | | | | | | |
| Preferred Stocks: 0.41% | | | | | | | | | | | | | | | | |
| | | | |
Industrials: 0.41% | | | | | | | | | | | | | | | | |
| | | | |
| Industrial Conglomerates: 0.41% | | | | | | | | | | | | | | | | |
Steel Partners Holdings LP « | | | 6.00 | % | | | | | | | 483,767 | | | | 11,078,264 | |
| | | | | | | | | | | | | | | | |
| | | | |
Total Preferred Stocks (Cost $12,001,048) | | | | | | | | | | | | | | | 11,078,264 | |
| | | | | | | | | | | | | | | | |
The accompanying notes are an integral part of these financial statements.
| | | | |
| 14 | | Wells Fargo Special Small Cap Value Fund | | Portfolio of investments—September 30, 2018 (unaudited) |
| | | | | | | | | | | | | | | | |
| Security name | | Yield | | | | | | Shares | | | Value | |
| | | | |
Short-Term Investments: 5.41% | | | | | | | | | | | | | | | | |
| | | | |
| Investment Companies: 5.41% | | | | | | | | | | | | | | | | |
Securities Lending Cash Investment LLC (l)(r)(u) | | | 2.17 | % | | | | | | | 29,360,632 | | | $ | 29,363,568 | |
Wells Fargo Government Money Market Fund Select Class (l)(u) | | | 1.99 | | | | | | | | 118,901,581 | | | | 118,901,581 | |
| | | | |
Total Short-Term Investments (Cost $148,265,149) | | | | | | | | | | | | | | | 148,265,149 | |
| | | | | | | | | | | | | | | | |
| | | | | | | | |
| | |
| Total investments in securities (Cost $2,378,884,933) | | | 100.31 | % | | | 2,749,274,733 | |
Other assets and liabilities, net | | | (0.31 | ) | | | (8,396,769 | ) |
| | | | | | | | |
| Total net assets | | | 100.00 | % | | $ | 2,740,877,964 | |
| | | | | | | | |
| « | All or a portion of this security is on loan. |
| † | Non-income-earning security |
| (a) | The security is fair valued in accordance with procedures approved by the Board of Trustees. |
| (l) | The issuer of the security is an affiliated person of the Fund as defined in the Investment Company Act of 1940. |
| (r) | The investment is a non-registered investment company purchased with cash collateral received from securities on loan. |
| (u) | The rate represents the 7-day annualized yield at period end. |
Abbreviations:
| REIT | Real estate investment trust |
The accompanying notes are an integral part of these financial statements.
| | | | | | |
| Portfolio of investments—September 30, 2018 (unaudited) | | Wells Fargo Special Small Cap Value Fund | | | 15 | |
Investments in Affiliates
An affiliated investment is an investment in which the Fund owns at least 5% of the outstanding voting shares of the issuer or as a result of other relationships, such as the Fund and the issuer having the same investment manager. Transactions with issuers that were either affiliated persons of the Fund at the beginning of the period or the end of the period were as follows:
| | | | | | | | | | | | | | | | | | | | | | | | | | | | | | | | | | | | |
| | | Shares,
beginning of
period | | | Shares
purchased | | | Shares
sold | | | Shares, end of period | | | Net
realized
gains
(losses) | | | Net
change in
unrealized
gains
(losses) | | | Income
from
affiliated
securities | | | Value,
end
of period | | | % of
net
assets | |
Common Stocks | | | | | | | | | | | | | | | | | | | | | | | | | | | | | | | | | | | | |
Communication Services | | | | | | | | | | | | | | | | | | | | | | | | | | | | | | | | | | | | |
Media | | | | | | | | | | | | | | | | | | | | | | | | | | | | | | | | | | | | |
A.H. Belo Corporation Class A | | | 1,423,589 | | | | 73,200 | | | | 0 | | | | 1,496,789 | | | $ | 0 | | | $ | (781,613 | ) | | $ | 230,558 | | | $ | 6,885,229 | | | | | |
Consumer Discretionary | | | | | | | | | | | | | | | | | | | | | | | | | | | | | | | | | | | | |
Textiles, Apparel & Luxury Goods | | | | | | | | | | | | | | | | | | | | | | | | | | | | | | | | | | | | |
Delta Apparel Incorporated | | | 459,492 | | | | 10,400 | | | | 0 | | | | 469,892 | | | | 0 | | | | (114,006 | ) | | | 0 | | | | 8,359,379 | | | | | |
Consumer Staples | | | | | | | | | | | | | | | | | | | | | | | | | | | | | | | | | | | | |
Household Products | | | | | | | | | | | | | | | | | | | | | | | | | | | | | | | | | | | | |
Central Garden & Pet Company | | | 553,580 | | | | 156,200 | | | | 0 | | | | 709,780 | | | | 0 | | | | 10,546,547 | | | | 0 | | | | 25,580,471 | | | | | |
Industrials | | | | | | | | | | | | | | | | | | | | | | | | | | | | | | | | | | | | |
Commercial Services & Supplies | | | | | | | | | | | | | | | | | | | | | | | | | | | | | | | | | | | | |
Ennis Incorporated | | | 1,320,620 | | | | 65,562 | | | | 0 | | | | 1,386,182 | | | | 0 | | | | 1,027,947 | | | | 566,326 | | | | 28,347,422 | | | | | |
Information Technology | | | | | | | | | | | | | | | | | | | | | | | | | | | | | | | | | | | | |
Technology Hardware, Storage & Peripherals | | | | | | | | | | | | | | | | | | | | | | | | | | | | | | | | | | | | |
Glassbridge Enterprises Incorporated | | | 305,221 | | | | 200 | | | | 0 | | | | 305,421 | | | | 0 | | | | (189,312 | ) | | | 0 | | | | 174,090 | | | | | |
| | | | | | | | | |
| | | | | | | | | | | | | | | | | | | | | | | | | | | | | | | 69,346,591 | | | | 2.53 | % |
| | | | | | | | | | | | | | | | | | | | | | | | | | | | | | | | | | | | |
| | | | | | | | | |
Short-Term Investments | | | | | | | | | | | | | | | | | | | | | | | | | | | | | | | | | | | | |
Investment Companies | | | | | | | | | | | | | | | | | | | | | | | | | | | | | | | | | | | | |
Securities Lending Cash Investment LLC | | | 81,074,217 | | | | 138,744,790 | | | | 190,458,375 | | | | 29,360,632 | | | | 242 | | | | 0 | | | | 206,504 | | | | 29,363,568 | | | | | |
Wells Fargo Government Money Market Fund Select Class | | | 139,485,748 | | | | 409,376,787 | | | | 429,960,954 | | | | 118,901,581 | | | | 0 | | | | 0 | | | | 1,353,040 | | | | 118,901,581 | | | | | |
| | | | | | | | | |
| | | | | | | | | | | | | | | | | | | | | | | | | | | | | | | 148,265,149 | | | | 5.41 | |
| | | | | | | | | | | | | | | | | | | | | | | | | | | | | | | | | | | | |
| | | | | | | | | | | | | | | | | | $ | 242 | | | $ | 10,489,563 | | | $ | 2,356,428 | | | $ | 217,611,740 | | | | 7.94 | % |
| | | | | | | | | | | | | | | | | | | | | | | | | | | | | | | | | | | | |
The accompanying notes are an integral part of these financial statements.
| | | | |
| 16 | | Wells Fargo Special Small Cap Value Fund | | Statement of assets and liabilities—September 30, 2018 (unaudited) |
| | | | |
| | | | |
| |
Assets | | | | |
Investments in unaffiliated securities (including $28,562,536 of securities loaned), at value (cost $2,147,384,500) | | $ | 2,531,662,993 | |
Investments in affiliated securities, at value (cost $231,500,433) | | | 217,611,740 | |
Receivable for investments sold | | | 6,695,678 | |
Receivable for Fund shares sold | | | 22,611,065 | |
Receivable for dividends | | | 3,345,239 | |
Receivable for securities lending income | | | 21,988 | |
Prepaid expenses and other assets | | | 116,907 | |
| | | | |
Total assets | | | 2,782,065,610 | |
| | | | |
| |
Liabilities | | | | |
Payable upon receipt of securities loaned | | | 29,358,522 | |
Payable for investments purchased | | | 7,866,295 | |
Management fee payable | | | 1,828,529 | |
Payable for Fund shares redeemed | | | 1,501,147 | |
Administration fees payable | | | 307,423 | |
Distribution fees payable | | | 34,641 | |
Trustees’ fees and expenses payable | | | 2,484 | |
Accrued expenses and other liabilities | | | 288,605 | |
| | | | |
Total liabilities | | | 41,187,646 | |
| | | | |
Total net assets | | $ | 2,740,877,964 | |
| | | | |
| |
NET ASSETS CONSIST OF | | | | |
Paid-in capital | | $ | 2,208,028,328 | |
Total distributable earnings | | | 532,849,636 | |
| | | | |
Total net assets | | $ | 2,740,877,964 | |
| | | | |
| |
COMPUTATION OF NET ASSET VALUE AND OFFERING PRICE PER SHARE | | | | |
Net assets – Class A | | $ | 582,911,880 | |
Shares outstanding – Class A1 | | | 15,790,088 | |
Net asset value per share – Class A | | | $36.92 | |
Maximum offering price per share – Class A2 | | | $39.17 | |
Net assets – Class C | | $ | 53,068,119 | |
Shares outstanding – Class C1 | | | 1,591,313 | |
Net asset value per share – Class C | | | $33.35 | |
Net assets – Class R | | $ | 5,888,000 | |
Shares outstanding – Class R1 | | | 157,289 | |
Net asset value per share – Class R | | | $37.43 | |
Net assets – Class R6 | | $ | 417,768,346 | |
Shares outstanding – Class R61 | | | 11,023,885 | |
Net asset value per share – Class R6 | | | $37.90 | |
Net assets – Administrator Class | | $ | 189,709,851 | |
Shares outstanding – Administrator Class1 | | | 5,018,860 | |
Net asset value per share – Administrator Class | | | $37.80 | |
Net assets – Institutional Class | | $ | 1,491,531,768 | |
Shares outstanding – Institutional Class1 | | | 39,356,899 | |
Net asset value per share – Institutional Class | | | $37.90 | |
| 1 | The Fund has an unlimited number of authorized shares. |
| 2 | Maximum offering price is computed as 100/94.25 of net asset value. On investments of $50,000 or more, the offering price is reduced. |
The accompanying notes are an integral part of these financial statements.
| | | | | | |
| Statement of operations—six months ended September 30, 2018 (unaudited) | | Wells Fargo Special Small Cap Value Fund | | | 17 | |
| | | | |
| | | | |
| |
Investment income | | | | |
Dividends (net of foreign withholding taxes of $24,610) | | $ | 20,762,282 | |
Income from affiliated securities | | | 2,356,428 | |
Interest | | | 499 | |
| | | | |
Total investment income | | | 23,119,209 | |
| | | | |
| |
Expenses | | | | |
Management fee | | | 10,305,231 | |
Administration fees | | | | |
Class A | | | 600,199 | |
Class C | | | 56,755 | |
Class R | | | 5,647 | |
Class R6 | | | 52,715 | |
Administrator Class | | | 141,258 | |
Institutional Class | | | 875,562 | |
Shareholder servicing fees | | | | |
Class A | | | 714,522 | |
Class C | | | 67,566 | |
Class R | | | 6,722 | |
Administrator Class | | | 270,298 | |
Distribution fees | | | | |
Class C | | | 202,698 | |
Class R | | | 6,722 | |
Custody and accounting fees | | | 38,543 | |
Professional fees | | | 26,882 | |
Registration fees | | | 118,393 | |
Shareholder report expenses | | | 111,304 | |
Trustees’ fees and expenses | | | 11,113 | |
Other fees and expenses | | | 20,804 | |
| | | | |
Total expenses | | | 13,632,934 | |
Less: Fee waivers and/or expense reimbursements | | | (191,481 | ) |
| | | | |
Net expenses | | | 13,441,453 | |
| | | | |
Net investment income | | | 9,677,756 | |
| | | | |
| |
REALIZED AND UNREALIZED GAINS (LOSSES) ON INVESTMENTS | | | | |
| |
Net realized gains on: | | | | |
Unaffiliated securities | | | 68,200,569 | |
Affiliated securities | | | 242 | |
| | | | |
Net realized gains on investments | | | 68,200,811 | |
| | | | |
| |
Net change in unrealized gains (losses) on: | | | | |
Unaffiliated securities | | | 86,285,455 | |
Affiliated securities | | | 10,489,563 | |
| | | | |
Net change in unrealized gains (losses) on investments | | | 96,775,018 | |
| | | | |
Net realized and unrealized gains (losses) on investments | | | 164,975,829 | |
| | | | |
Net increase in net assets resulting from operations | | $ | 174,653,585 | |
| | | | |
The accompanying notes are an integral part of these financial statements.
| | | | |
| 18 | | Wells Fargo Special Small Cap Value Fund | | Statement of changes in net assets |
| | | | | | | | | | | | | | | | |
| | | Six months ended
September 30, 2018
(unaudited) | | | Year ended
March 31, 20181 | |
| | | | |
Operations | | | | | | | | | | | | | | | | |
Net investment income | | | | | | $ | 9,677,756 | | | | | | | $ | 18,358,131 | |
Net realized gains on investments | | | | | | | 68,200,811 | | | | | | | | 148,275,813 | |
Net change in unrealized gains (losses) on investments | | | | | | | 96,775,018 | | | | | | | | 21,367,502 | |
| | | | |
Net increase in net assets resulting from operations | | | | | | | 174,653,585 | | | | | | | | 188,001,446 | |
| | | | |
| | | | |
Distributions to shareholders | | | | | | | | | | | | | | | | |
Class A | | | | | | | 0 | | | | | | | | (28,923,817 | ) |
Class C | | | | | | | 0 | | | | | | | | (2,701,391 | ) |
Class R | | | | | | | 0 | �� | | | | | | | (151,245 | ) |
Class R6 | | | | | | | 0 | | | | | | | | (13,961,093 | ) |
Administrator Class | | | | | | | 0 | | | | | | | | (11,096,481 | ) |
Institutional Class | | | | | | | 0 | | | | | | | | (59,336,216 | ) |
| | | | |
Total distributions to shareholders | | | | | | | 0 | | | | | | | | (116,170,243 | ) |
| | | | |
| | | | |
Capital share transactions | | | Shares | | | | | | | | Shares | | | | | |
Proceeds from shares sold | | | | | | | | | | | | | | | | |
Class A | | | 1,783,799 | | | | 64,544,897 | | | | 2,772,875 | | | | 94,731,826 | |
Class C | | | 121,382 | | | | 3,998,459 | | | | 191,743 | | | | 5,942,942 | |
Class R | | | 44,893 | | | | 1,641,525 | | | | 122,899 | | | | 4,239,675 | |
Class R6 | | | 4,538,357 | | | | 168,198,202 | | | | 4,147,795 | | | | 146,057,838 | |
Administrator Class | | | 900,653 | | | | 33,364,581 | | | | 2,707,738 | | | | 94,110,194 | |
Institutional Class | | | 13,109,991 | | | | 490,938,019 | | | | 15,040,023 | | | | 526,877,607 | |
| | | | |
| | | | | | | 762,685,683 | | | | | | | | 871,960,082 | |
| | | | |
Reinvestment of distributions | | | | | | | | | | | | | | | | |
Class A | | | 0 | | | | 0 | | | | 772,732 | | | | 26,881,022 | |
Class C | | | 0 | | | | 0 | | | | 82,534 | | | | 2,591,651 | |
Class R | | | 0 | | | | 0 | | | | 4,226 | | | | 149,401 | |
Class R6 | | | 0 | | | | 0 | | | | 360,421 | | | | 12,863,108 | |
Administrator Class | | | 0 | | | | 0 | | | | 304,887 | | | | 10,860,280 | |
Institutional Class | | | 0 | | | | 0 | | | | 1,252,402 | | | | 44,708,634 | |
| | | | |
| | | | | | | 0 | | | | | | | | 98,054,096 | |
| | | | |
Payment for shares redeemed | | | | | | | | | | | | | | | | |
Class A | | | (1,669,654 | ) | | | (60,731,335 | ) | | | (5,222,764 | ) | | | (178,462,050 | ) |
Class B | | | N/A | | | | N/A | | | | (11,387 | )2 | | | (339,787 | )2 |
Class C | | | (233,112 | ) | | | (7,702,390 | ) | | | (568,844 | ) | | | (17,485,661 | ) |
Class R | | | (20,147 | ) | | | (737,514 | ) | | | (17,869 | ) | | | (617,184 | ) |
Class R6 | | | (741,870 | ) | | | (27,755,776 | ) | | | (2,479,153 | ) | | | (87,096,747 | ) |
Administrator Class | | | (2,411,493 | ) | | | (90,197,739 | ) | | | (2,360,366 | ) | | | (81,310,178 | ) |
Institutional Class | | | (7,678,954 | ) | | | (287,906,705 | ) | | | (9,522,751 | ) | | | (332,025,710 | ) |
| | | | |
| | | | | | | (475,031,459 | ) | | | | | | | (697,337,317 | ) |
| | | | |
Net increase in net assets resulting from capital share transactions | | | | | | | 287,654,224 | | | | | | | | 272,676,861 | |
| | | | |
Total increase in net assets | | | | | | | 462,307,809 | | | | | | | | 344,508,064 | |
| | | | |
| | | | |
Net assets | | | | | | | | | | | | | | | | |
Beginning of period | | | | | | | 2,278,570,155 | | | | | | | | 1,934,062,091 | |
| | | | |
End of period | | | | | | $ | 2,740,877,964 | | | | | | | $ | 2,278,570,155 | |
| | | | |
| 1 | Effective for all filings after November 4, 2018, the SEC prospectively eliminated the requirements to parenthetically disclose undistributed net investment income at the end of the period and to disaggregate distributions to shareholders between distributions from net investment income and distributions from realized gains. Undistributed net investment income at March 31, 2018 was $3,571,012. The disaggregated distributions information for the year ended March 31, 2018 is included in Note 7, Distributions to Shareholders, in the notes to the financial statements. |
| 2 | For the period from April 1, 2017 to May 5, 2017. Effective at the close of business on May 5, 2017, Class B shares were converted to Class A shares and are no longer offered by the Fund. |
The accompanying notes are an integral part of these financial statements.
| | | | | | |
| Financial highlights | | Wells Fargo Special Small Cap Value Fund | | | 19 | |
(For a share outstanding throughout each period)
| | | | | | | | | | | | | | | | | | | | | | | | | | | | |
| | | Six months ended
September 30, 2018 (unaudited) | | | Year ended March 31 | | | Year ended
October 31, 2013 | |
| CLASS A | | 2018 | | | 2017 | | | 2016 | | | 2015 | | | 20141 | |
Net asset value, beginning of period | | | $34.42 | | | | $33.15 | | | | $27.40 | | | | $29.27 | | | | $32.59 | | | | $31.35 | | | | $22.97 | |
Net investment income | | | 0.09 | | | | 0.24 | | | | 0.35 | 2 | | | 0.20 | | | | 0.26 | | | | 0.10 | | | | 0.01 | 2 |
Net realized and unrealized gains (losses) on investments | | | 2.41 | | | | 2.89 | | | | 6.15 | | | | (1.46 | ) | | | 1.81 | | | | 3.14 | | | | 8.37 | |
| | | | | | | | | | | | | | | | | | | | | | | | | | | | |
Total from investment operations | | | 2.50 | | | | 3.13 | | | | 6.50 | | | | (1.26 | ) | | | 2.07 | | | | 3.24 | | | | 8.38 | |
Distributions to shareholders from | | | | | | | | | | | | | | | | | | | | | | | | | | | | |
Net investment income | | | 0.00 | | | | (0.32 | ) | | | (0.18 | ) | | | (0.19 | ) | | | (0.21 | ) | | | (0.03 | ) | | | 0.00 | |
Net realized gains | | | 0.00 | | | | (1.54 | ) | | | (0.57 | ) | | | (0.42 | ) | | | (5.18 | ) | | | (1.97 | ) | | | 0.00 | |
| | | | | | | | | | | | | | | | | | | | | | | | | | | | |
Total distributions to shareholders | | | 0.00 | | | | (1.86 | ) | | | (0.75 | ) | | | (0.61 | ) | | | (5.39 | ) | | | (2.00 | ) | | | 0.00 | |
Net asset value, end of period | | | $36.92 | | | | $34.42 | | | | $33.15 | | | | $27.40 | | | | $29.27 | | | | $32.59 | | | | $31.35 | |
Total return3 | | | 7.26 | % | | | 9.42 | % | | | 23.69 | % | | | (4.21 | )% | | | 7.56 | % | | | 10.74 | % | | | 36.48 | % |
Ratios to average net assets (annualized) | | | | | | | | | | | | | | | | | | | | | | | | | | | | |
Gross expenses | | | 1.29 | % | | | 1.31 | % | | | 1.32 | % | | | 1.36 | % | | | 1.39 | % | | | 1.41 | % | | | 1.40 | % |
Net expenses | | | 1.29 | % | | | 1.31 | % | | | 1.32 | % | | | 1.34 | % | | | 1.34 | % | | | 1.34 | % | | | 1.34 | % |
Net investment income | | | 0.51 | % | | | 0.66 | % | | | 1.14 | % | | | 0.73 | % | | | 0.90 | % | | | 0.75 | % | | | 0.04 | % |
Supplemental data | | | | | | | | | | | | | | | | | | | | | | | | | | | | |
Portfolio turnover rate | | | 13 | % | | | 41 | % | | | 51 | % | | | 46 | % | | | 79 | % | | | 37 | % | | | 65 | % |
Net assets, end of period (000s omitted) | | | $582,912 | | | | $539,499 | | | | $575,269 | | | | $417,161 | | | | $448,980 | | | | $429,089 | | | | $409,557 | |
| 1 | For the five months ended March 31, 2014. The Fund changed its fiscal year end from October 31 to March 31, effective March 31, 2014. |
| 2 | Calculated based upon average shares outstanding |
| 3 | Total return calculations do not include any sales charges. Returns for periods of less than one year are not annualized. |
The accompanying notes are an integral part of these financial statements.
| | | | |
| 20 | | Wells Fargo Special Small Cap Value Fund | | Financial highlights |
(For a share outstanding throughout each period)
| | | | | | | | | | | | | | | | | | | | | | | | | | | | |
| | | Six months ended
September 30, 2018 (unaudited) | | | Year ended March 31 | | | Year ended
October 31, 2013 | |
| CLASS C | | 2018 | | | 2017 | | | 2016 | | | 2015 | | | 20141 | |
Net asset value, beginning of period | | | $31.21 | | | | $30.19 | | | | $25.05 | | | | $26.81 | | | | $30.31 | | | | $29.34 | | | | $21.66 | |
Net investment income (loss) | | | (0.04 | )2 | | | (0.03 | )2 | | | 0.12 | 2 | | | (0.03 | ) | | | 0.04 | 2 | | | 0.00 | 2,3 | | | (0.18 | )2 |
Net realized and unrealized gains (losses) on investments | | | 2.18 | | | | 2.64 | | | | 5.59 | | | | (1.31 | ) | | | 1.65 | | | | 2.94 | | | | 7.86 | |
| | | | | | | | | | | | | | | | | | | | | | | | | | | | |
Total from investment operations | | | 2.14 | | | | 2.61 | | | | 5.71 | | | | (1.34 | ) | | | 1.69 | | | | 2.94 | | | | 7.68 | |
Distributions to shareholders from | | | | | | | | | | | | | | | | | | | | | | | | | | | | |
Net investment income | | | 0.00 | | | | (0.05 | ) | | | 0.00 | | | | 0.00 | | | | (0.01 | ) | | | 0.00 | | | | 0.00 | |
Net realized gains | | | 0.00 | | | | (1.54 | ) | | | (0.57 | ) | | | (0.42 | ) | | | (5.18 | ) | | | (1.97 | ) | | | 0.00 | |
| | | | | | | | | | | | | | | | | | | | | | | | | | | | |
Total distributions to shareholders | | | 0.00 | | | | (1.59 | ) | | | (0.57 | ) | | | (0.42 | ) | | | (5.19 | ) | | | (1.97 | ) | | | 0.00 | |
Net asset value, end of period | | | $33.35 | | | | $31.21 | | | | $30.19 | | | | $25.05 | | | | $26.81 | | | | $30.31 | | | | $29.34 | |
Total return4 | | | 6.86 | % | | | 8.60 | % | | | 22.75 | % | | | (4.93 | )% | | | 6.75 | % | | | 10.42 | % | | | 35.46 | % |
Ratios to average net assets (annualized) | | | | | | | | | | | | | | | | | | | | | | | | | | | | |
Gross expenses | | | 2.04 | % | | | 2.06 | % | | | 2.07 | % | | | 2.11 | % | | | 2.14 | % | | | 2.16 | % | | | 2.15 | % |
Net expenses | | | 2.04 | % | | | 2.06 | % | | | 2.07 | % | | | 2.09 | % | | | 2.09 | % | | | 2.09 | % | | | 2.09 | % |
Net investment income (loss) | | | (0.25 | )% | | | (0.10 | )% | | | 0.42 | % | | | (0.02 | )% | | | 0.15 | % | | | 0.00 | % | | | (0.71 | )% |
Supplemental data | | | | | | | | | | | | | | | | | | | | | | | | | | | | |
Portfolio turnover rate | | | 13 | % | | | 41 | % | | | 51 | % | | | 46 | % | | | 79 | % | | | 37 | % | | | 65 | % |
Net assets, end of period (000s omitted) | | | $53,068 | | | | $53,145 | | | | $60,309 | | | | $40,512 | | | | $44,327 | | | | $42,816 | | | | $39,620 | |
| 1 | For the five months ended March 31, 2014. The Fund changed its fiscal year end from October 31 to March 31, effective March 31, 2014. |
| 2 | Calculated based upon average shares outstanding |
| 3 | Amount is less than $0.005. |
| 4 | Total return calculations do not include any sales charges. Returns for periods of less than one year are not annualized. |
The accompanying notes are an integral part of these financial statements.
| | | | | | |
| Financial highlights | | Wells Fargo Special Small Cap Value Fund | | | 21 | |
(For a share outstanding throughout each period)
| | | | | | | | | | | | | | | | |
| | | Six months ended
September 30, 2018 (unaudited) | | | Year ended March 31 | |
| CLASS R | | 2018 | | | 2017 | | | 20161 | |
Net asset value, beginning of period | | | $34.94 | | | | $33.73 | | | | $27.97 | | | | $26.72 | |
Net investment income | | | 0.07 | | | | 0.17 | | | | 0.63 | 2 | | | 0.08 | 2 |
Net realized and unrealized gains (losses) on investments | | | 2.42 | | | | 2.92 | | | | 5.94 | | | | 1.87 | |
| | | | | | | | | | | | | | | | |
Total from investment operations | | | 2.49 | | | | 3.09 | | | | 6.57 | | | | 1.95 | |
Distributions to shareholders from | | | | | | | | | | | | | | | | |
Net investment income | | | 0.00 | | | | (0.34 | ) | | | (0.24 | ) | | | (0.28 | ) |
Net realized gains | | | 0.00 | | | | (1.54 | ) | | | (0.57 | ) | | | (0.42 | ) |
| | | | | | | | | | | | | | | | |
Total distributions to shareholders | | | 0.00 | | | | (1.88 | ) | | | (0.81 | ) | | | (0.70 | ) |
Net asset value, end of period | | | $37.43 | | | | $34.94 | | | | $33.73 | | | | $27.97 | |
Total return3 | | | 7.13 | % | | | 9.13 | % | | | 23.47 | % | | | 7.40 | % |
Ratios to average net assets (annualized) | | | | | | | | | | | | | | | | |
Gross expenses | | | 1.55 | % | | | 1.57 | % | | | 1.56 | % | | | 1.59 | % |
Net expenses | | | 1.54 | % | | | 1.56 | % | | | 1.56 | % | | | 1.58 | % |
Net investment income | | | 0.28 | % | | | 0.43 | % | | | 1.86 | % | | | 0.56 | % |
Supplemental data | | | | | | | | | | | | | | | | |
Portfolio turnover rate | | | 13 | % | | | 41 | % | | | 51 | % | | | 46 | % |
Net assets, end of period (000s omitted) | | | $5,888 | | | | $4,631 | | | | $785 | | | | $27 | |
| 1 | For the period from September 30, 2015 (commencement of class operations) to March 31, 2016 |
| 2 | Calculated based upon average shares outstanding |
| 3 | Returns for periods of less than one year are not annualized. |
The accompanying notes are an integral part of these financial statements.
| | | | |
| 22 | | Wells Fargo Special Small Cap Value Fund | | Financial highlights |
(For a share outstanding throughout each period)
| | | | | | | | | | | | | | | | | | | | |
| | | Six months ended
September 30, 2018 (unaudited) | | | Year ended March 31 | |
| CLASS R6 | | 2018 | | | 2017 | | | 2016 | | | 20151 | |
Net asset value, beginning of period | | | $35.25 | | | | $33.93 | | | | $28.01 | | | | $29.91 | | | | $33.38 | |
Net investment income | | | 0.18 | | | | 0.38 | 2 | | | 0.61 | 2 | | | 0.39 | | | | 0.26 | 2 |
Net realized and unrealized gains (losses) on investments | | | 2.47 | | | | 2.97 | | | | 6.18 | | | | (1.54 | ) | | | 1.80 | |
| | | | | | | | | | | | | | | | | | | | |
Total from investment operations | | | 2.65 | | | | 3.35 | | | | 6.79 | | | | (1.15 | ) | | | 2.06 | |
Distributions to shareholders from | | | | | | | | | | | | | | | | | | | | |
Net investment income | | | 0.00 | | | | (0.49 | ) | | | (0.30 | ) | | | (0.33 | ) | | | (0.35 | ) |
Net realized gains | | | 0.00 | | | | (1.54 | ) | | | (0.57 | ) | | | (0.42 | ) | | | (5.18 | ) |
| | | | | | | | | | | | | | | | | | | | |
Total distributions to shareholders | | | 0.00 | | | | (2.03 | ) | | | (0.87 | ) | | | (0.75 | ) | | | (5.53 | ) |
Net asset value, end of period | | | $37.90 | | | | $35.25 | | | | $33.93 | | | | $28.01 | | | | $29.91 | |
Total return3 | | | 7.52 | % | | | 9.85 | % | | | 24.22 | % | | | (3.74 | )% | | | 7.42 | % |
Ratios to average net assets (annualized) | | | | | | | | | | | | | | | | | | | | |
Gross expenses | | | 0.86 | % | | | 0.88 | % | | | 0.89 | % | | | 0.93 | % | | | 0.89 | % |
Net expenses | | | 0.86 | % | | | 0.88 | % | | | 0.89 | % | | | 0.89 | % | | | 0.89 | % |
Net investment income | | | 0.98 | % | | | 1.10 | % | | | 1.87 | % | | | 1.56 | % | | | 2.19 | % |
Supplemental data | | | | | | | | | | | | | | | | | | | | |
Portfolio turnover rate | | | 13 | % | | | 41 | % | | | 51 | % | | | 46 | % | | | 79 | % |
Net assets, end of period (000s omitted) | | | $417,768 | | | | $254,801 | | | | $176,362 | | | | $36,344 | | | | $27 | |
| 1 | For the period from October 31, 2014 (commencement of class operations) to March 31, 2015 |
| 2 | Calculated based upon average shares outstanding |
| 3 | Returns for periods of less than one year are not annualized. |
The accompanying notes are an integral part of these financial statements.
| | | | | | |
| Financial highlights | | Wells Fargo Special Small Cap Value Fund | | | 23 | |
(For a share outstanding throughout each period)
| | | | | | | | | | | | | | | | | | | | | | | | | | | | |
| | | Six months ended September 30, 2018 (unaudited) | | | Year ended March 31 | | | Year ended
October 31, 2013 | |
| ADMINISTRATOR CLASS | | 2018 | | | 2017 | | | 2016 | | | 2015 | | | 20141 | |
Net asset value, beginning of period | | | $35.22 | | | | $33.90 | | | | $28.02 | | | | $29.94 | | | | $33.21 | | | | $31.85 | | | | $23.28 | |
Net investment income | | | 0.11 | 2 | | | 0.27 | 2 | | | 0.44 | 2 | | | 0.26 | 2 | | | 0.35 | 2 | | | 0.14 | 2 | | | 0.08 | 2 |
Net realized and unrealized gains (losses) on investments | | | 2.47 | | | | 2.97 | | | | 6.24 | | | | (1.49 | ) | | | 1.83 | | | | 3.21 | | | | 8.49 | |
| | | | | | | | | | | | | | | | | | | | | | | | | | | | |
Total from investment operations | | | 2.58 | | | | 3.24 | | | | 6.68 | | | | (1.23 | ) | | | 2.18 | | | | 3.35 | | | | 8.57 | |
Distributions to shareholders from | | | | | | | | | | | | | | | | | | | | | | | | | | | | |
Net investment income | | | 0.00 | | | | (0.38 | ) | | | (0.23 | ) | | | (0.27 | ) | | | (0.27 | ) | | | (0.02 | ) | | | (0.00 | )3 |
Net realized gains | | | 0.00 | | | | (1.54 | ) | | | (0.57 | ) | | | (0.42 | ) | | | (5.18 | ) | | | (1.97 | ) | | | 0.00 | |
| | | | | | | | | | | | | | | | | | | | | | | | | | | | |
Total distributions to shareholders | | | 0.00 | | | | (1.92 | ) | | | (0.80 | ) | | | (0.69 | ) | | | (5.45 | ) | | | (1.99 | ) | | | (0.00 | )3 |
Net asset value, end of period | | | $37.80 | | | | $35.22 | | | | $33.90 | | | | $28.02 | | | | $29.94 | | | | $33.21 | | | | $31.85 | |
Total return4 | | | 7.33 | % | | | 9.52 | % | | | 23.82 | % | | | (4.01 | )% | | | 7.78 | % | | | 10.91 | % | | | 36.82 | % |
Ratios to average net assets (annualized) | | | | | | | | | | | | | | | | | | | | | | | | | | | | |
Gross expenses | | | 1.21 | % | | | 1.23 | % | | | 1.24 | % | | | 1.26 | % | | | 1.23 | % | | | 1.24 | % | | | 1.23 | % |
Net expenses | | | 1.20 | % | | | 1.20 | % | | | 1.20 | % | | | 1.17 | % | | | 1.09 | % | | | 1.09 | % | | | 1.09 | % |
Net investment income | | | 0.59 | % | | | 0.76 | % | | | 1.36 | % | | | 0.95 | % | | | 1.10 | % | | | 1.04 | % | | | 0.30 | % |
Supplemental data | | | | | | | | | | | | | | | | | | | | | | | | | | | | |
Portfolio turnover rate | | | 13 | % | | | 41 | % | | | 51 | % | | | 46 | % | | | 79 | % | | | 37 | % | | | 65 | % |
Net assets, end of period (000s omitted) | | | $189,710 | | | | $229,992 | | | | $199,262 | | | | $95,030 | | | | $70,100 | | | | $78,563 | | | | $96,940 | |
| 1 | For the five months ended March 31, 2014. The Fund changed its fiscal year end from October 31 to March 31, effective March 31, 2014. |
| 2 | Calculated based upon average shares outstanding |
| 3 | Amount is less than $0.005. |
| 4 | Returns for periods of less than one year are not annualized. |
The accompanying notes are an integral part of these financial statements.
| | | | |
| 24 | | Wells Fargo Special Small Cap Value Fund | | Financial highlights |
(For a share outstanding throughout each period)
| | | | | | | | | | | | | | | | | | | | | | | | | | | | |
| | | Six months ended
September 30, 2018 (unaudited) | | | Year ended March 31 | | | Year ended
October 31, 2013 | |
| INSTITUTIONAL CLASS | | 2018 | | | 2017 | | | 2016 | | | 2015 | | | 20141 | |
Net asset value, beginning of period | | | $35.27 | | | | $33.94 | | | | $28.03 | | | | $29.93 | | | | $33.21 | | | | $31.94 | | | | $23.36 | |
Net investment income | | | 0.15 | | | | 0.33 | | | | 0.60 | 2 | | | 0.30 | | | | 0.43 | 2 | | | 0.15 | | | | 0.10 | |
Net realized and unrealized gains (losses) on investments | | | 2.48 | | | | 3.01 | | | | 6.17 | | | | (1.46 | ) | | | 1.80 | | | | 3.22 | | | | 8.53 | |
| | | | | | | | | | | | | | | | | | | | | | | | | | | | |
Total from investment operations | | | 2.63 | | | | 3.34 | | | | 6.77 | | | | (1.16 | ) | | | 2.23 | | | | 3.37 | | | | 8.63 | |
Distributions to shareholders from | | | | | | | | | | | | | | | | | | | | | | | | | | | | |
Net investment income | | | 0.00 | | | | (0.47 | ) | | | (0.29 | ) | | | (0.32 | ) | | | (0.33 | ) | | | (0.13 | ) | | | (0.05 | ) |
Net realized gains | | | 0.00 | | | | (1.54 | ) | | | (0.57 | ) | | | (0.42 | ) | | | (5.18 | ) | | | (1.97 | ) | | | 0.00 | |
| | | | | | | | | | | | | | | | | | | | | | | | | | | | |
Total distributions to shareholders | | | 0.00 | | | | (2.01 | ) | | | (0.86 | ) | | | (0.74 | ) | | | (5.51 | ) | | | (2.10 | ) | | | (0.05 | ) |
Net asset value, end of period | | | $37.90 | | | | $35.27 | | | | $33.94 | | | | $28.03 | | | | $29.93 | | | | $33.21 | | | | $31.94 | |
Total return3 | | | 7.46 | % | | | 9.82 | % | | | 24.13 | % | | | (3.79 | )% | | | 7.96 | % | | | 10.97 | % | | | 37.02 | % |
Ratios to average net assets (annualized) | | | | | | | | | | | | | | | | | | | | | | | | | |
Gross expenses | | | 0.97 | % | | | 0.98 | % | | | 0.99 | % | | | 1.01 | % | | | 0.96 | % | | | 0.98 | % | | | 0.97 | % |
Net expenses | | | 0.94 | % | | | 0.94 | % | | | 0.94 | % | | | 0.94 | % | | | 0.94 | % | | | 0.94 | % | | | 0.94 | % |
Net investment income | | | 0.88 | % | | | 1.02 | % | | | 1.86 | % | | | 1.17 | % | | | 1.36 | % | | | 1.15 | % | | | 0.42 | % |
Supplemental data | | | | | | | | | | | | | | | | | | | | | | | | | | | | |
Portfolio turnover rate | | | 13 | % | | | 41 | % | | | 51 | % | | | 46 | % | | | 79 | % | | | 37 | % | | | 65 | % |
Net assets, end of period (000s omitted) | | | $1,491,532 | | | | $1,196,501 | | | | $921,732 | | | | $256,190 | | | | $189,965 | | | | $146,162 | | | | $138,638 | |
| 1 | For the five months ended March 31, 2014. The Fund changed its fiscal year end from October 31 to March 31, effective March 31, 2014. |
| 2 | Calculated based upon average shares outstanding |
| 3 | Returns for periods of less than one year are not annualized. |
The accompanying notes are an integral part of these financial statements.
| | | | | | |
| Notes to financial statements (unaudited) | | Wells Fargo Special Small Cap Value Fund | | | 25 | |
1. ORGANIZATION
Wells Fargo Funds Trust (the “Trust”), a Delaware statutory trust organized on March 10, 1999, is an open-end management investment company registered under the Investment Company Act of 1940, as amended (the “1940 Act”). As an investment company, the Trust follows the accounting and reporting guidance in Financial Accounting Standards Board (“FASB”) Accounting Standards Codification Topic 946, Financial Services – Investment Companies. These financial statements report on the Wells Fargo Special Small Cap Value Fund (the “Fund”) which is a diversified series of the Trust.
Effective at the close of business on May 5, 2017, Class B shares were converted to Class A shares and are no longer offered by the Fund. Information for Class B shares reflected in the financial statements represents activity through May 5, 2017.
2. SIGNIFICANT ACCOUNTING POLICIES
The following significant accounting policies, which are consistently followed in the preparation of the financial statements of the Fund, are in conformity with U.S. generally accepted accounting principles which require management to make estimates and assumptions that affect the reported amounts of assets and liabilities, disclosure of contingent assets and liabilities at the date of the financial statements, and the reported amounts of revenues and expenses during the reporting period. Actual results could differ from those estimates.
Securities valuation
All investments are valued each business day as of the close of regular trading on the New York Stock Exchange (generally 4 p.m. Eastern Time), although the Fund may deviate from this calculation time under unusual or unexpected circumstances.
Equity securities and futures contracts that are listed on a foreign or domestic exchange or market are valued at the official closing price or, if none, the last sales price. If no sale occurs on the principal exchange or market that day, a fair value price will be determined in accordance with the Fund’s Valuation Procedures.
Investments in registered open-end investment companies are valued at net asset value. Interests in non-registered investment companies that are redeemable at net asset value are fair valued normally at net asset value.
Investments which are not valued using any of the methods discussed above are valued at their fair value, as determined in good faith by the Board of Trustees of the Fund. The Board of Trustees has established a Valuation Committee comprised of the Trustees and has delegated to it the authority to take any actions regarding the valuation of portfolio securities that the Valuation Committee deems necessary or appropriate, including determining the fair value of portfolio securities, unless the determination has been delegated to the Wells Fargo Asset Management Pricing Committee at Wells Fargo Funds Management, LLC (“Funds Management”). The Board of Trustees retains the authority to make or ratify any valuation decisions or approve any changes to the Valuation Procedures as it deems appropriate. On a quarterly basis, the Board of Trustees receives reports on any valuation actions taken by the Valuation Committee or the Wells Fargo Asset Management Pricing Committee which may include items for ratification.
Securities lending
The Fund may lend its securities from time to time in order to earn additional income in the form of fees or interest on securities received as collateral or the investment of any cash received as collateral. The Fund continues to receive interest or dividends on the securities loaned. The Fund receives collateral in the form of cash or securities with a value at least equal to the value of the securities on loan. The value of the loaned securities is determined at the close of each business day and any additional required collateral is delivered to the Fund on the next business day. In a securities lending transaction, the net asset value of the Fund will be affected by an increase or decrease in the value of the securities loaned and by an increase or decrease in the value of the instrument in which collateral is invested. The amount of securities lending activity undertaken by the Fund fluctuates from time to time. In the event of default or bankruptcy by the borrower, the Fund may be prevented from recovering the loaned securities or gaining access to the collateral or may experience delays or costs in doing so. In addition, the investment of any cash collateral received may lose all or part of its value. The Fund has the right under the lending agreement to recover the securities from the borrower on demand.
The Fund lends its securities through an unaffiliated securities lending agent. Cash collateral received in connection with its securities lending transactions is invested in Securities Lending Cash Investments, LLC (the “Securities Lending Fund”). The Securities Lending Fund is exempt from registration under Section 3(c)(7) of the 1940 Act and is managed by Funds Management and is subadvised by Wells Capital Management Incorporated (“WellsCap”), an affiliate of Funds Management and an indirect wholly owned subsidiary of Wells Fargo & Company (“Wells Fargo”). Funds Management
| | | | |
| 26 | | Wells Fargo Special Small Cap Value Fund | | Notes to financial statements (unaudited) |
receives an advisory fee starting at 0.05% and declining to 0.01% as the average daily net assets of the Securities Lending Fund increase. All of the fees received by Funds Management are paid to WellsCap for its services as subadviser. The Securities Lending Fund seeks to provide a positive return compared to the daily Fed Funds Open Rate by investing in high-quality, U.S. dollar-denominated short-term money market instruments. Securities Lending Fund investments are valued at the evaluated bid price provided by an independent pricing service. Income earned from investment in the Securities Lending Fund, if any, is included in income from affiliated securities on the Statement of Operations.
Futures contracts
The Fund is subject to equity price risk in the normal course of pursuing its investment objectives. Futures contracts are agreements between the Fund and a counterparty to buy or sell a specific amount of a commodity, financial instrument or currency at specified price and on a specified date. The Fund may buy and sell futures contracts in order to gain exposure to, or protect against, changes in security values. The primary risks associated with the use of futures contracts are the imperfect correlation between changes in market values of securities held by the Fund and the prices of futures contracts, and the possibility of an illiquid market. Futures contracts are generally entered into on a regulated futures exchange and cleared through a clearinghouse associated with the exchange. With futures contracts, there is minimal counterparty risk to the Fund since futures contracts are exchange traded and the exchange’s clearinghouse, as counterparty to all exchange traded futures, guarantees the futures contracts against default.
Upon entering into a futures contracts, the Fund is required to deposit either cash or securities (initial margin) with the broker in an amount equal to a certain percentage of the contract value. Subsequent payments (variation margin) are paid to or from the broker each day equal to the daily changes in the contract value. Such payments are recorded as unrealized gains or losses and, if any, shown as variation margin receivable (payable) in the Statement of Assets and Liabilities. Should the Fund fail to make requested variation margin payments, the broker can gain access to the initial margin to satisfy the Fund’s payment obligations. When the contracts are closed, a realized gain or loss is recorded in the Statement of Operations.
Security transactions and income recognition
Securities transactions are recorded on a trade date basis. Realized gains or losses are recorded on the basis of identified cost.
Dividend income is recognized on the ex-dividend date. Dividend income is recorded net of foreign taxes withheld where recovery of such taxes is not assured.
Interest income is accrued daily and bond discounts are accreted and premiums are amortized daily.To the extent debt obligations are placed on non-accrual status, any related interest income may be reduced by writing off interest receivables when the collection of all or a portion of interest has been determined to be doubtful based on consistently applied procedures and the fair value has decreased. If the issuer subsequently resumes interest payments or when the collectability of interest is reasonably assured, the debt obligation is removed from non-accrual status.
Distributions to shareholders
Distributions to shareholders from net investment income and any net realized gains are recorded on the ex-dividend date and paid at least annually. Such distributions are determined in accordance with income tax regulations and may differ from U.S. generally accepted accounting principles. Dividend sources are estimated at the time of declaration. The tax character of distributions is determined as of the Fund’s fiscal year end. Therefore, a portion of the Fund’s distributions made prior to the Fund’s fiscal year end may be categorized as a tax return of capital at year end.
Federal and other taxes
The Fund intends to continue to qualify as a regulated investment company by distributing substantially all of its investment company taxable income and any net realized capital gains (after reduction for capital loss carryforwards) sufficient to relieve it from all, or substantially all, federal income taxes. Accordingly, no provision for federal income taxes was required.
The Fund’s income and federal excise tax returns and all financial records supporting those returns for the prior three fiscal years are subject to examination by the federal and Delaware revenue authorities. Management has analyzed the Fund’s tax positions taken on federal, state, and foreign tax returns for all open tax years and does not believe that there are any uncertain tax positions that require recognition of a tax liability.
| | | | | | |
| Notes to financial statements (unaudited) | | Wells Fargo Special Small Cap Value Fund | | | 27 | |
As of September 30, 2018, the aggregate cost of all investments for federal income tax purposes was $2,378,661,684 and the unrealized gains (losses) consisted of:
| | | | |
Gross unrealized gains | | $ | 479,066,236 | |
Gross unrealized losses | | | (108,453,187 | ) |
Net unrealized gains | | $ | 370,613,049 | |
Class allocations
The separate classes of shares offered by the Fund differ principally in applicable sales charges, distribution, shareholder servicing, and administration fees. Class specific expenses are charged directly to that share class. Investment income, common expenses, and realized and unrealized gains (losses) on investments are allocated daily to each class of shares based on the relative proportion of net assets of each class.
3. FAIR VALUATION MEASUREMENTS
Fair value measurements of investments are determined within a framework that has established a fair value hierarchy based upon the various data inputs utilized in determining the value of the Fund’s investments. The three-level hierarchy gives the highest priority to unadjusted quoted prices in active markets for identical assets or liabilities (Level 1) and the lowest priority to unobservable inputs (Level 3). The Fund’s investments are classified within the fair value hierarchy based on the lowest level of input that is significant to the fair value measurement. The inputs are summarized into three broad levels as follows:
| ∎ | | Level 1 – quoted prices in active markets for identical securities |
| ∎ | | Level 2 – other significant observable inputs (including quoted prices for similar securities, interest rates, prepayment speeds, credit risk, etc.) |
| ∎ | | Level 3 – significant unobservable inputs (including the Fund’s own assumptions in determining the fair value of investments) |
The inputs or methodologies used for valuing investments in securities are not necessarily an indication of the risk associated with investing in those securities.
The following is a summary of the inputs used in valuing the Fund’s assets and liabilities as of September 30, 2018:
| | | | | | | | | | | | | | | | |
| | | Quoted prices
(Level 1) | | | Other significant
observable inputs
(Level 2) | | | Significant
unobservable inputs (Level 3) | | | Total | |
Assets | | | | | | | | | | | | | | | | |
Investments in: | | | | | | | | | | | | | | | | |
| | | | |
Common stocks | | | | | | | | | | | | | | | | |
Communication services | | $ | 42,157,676 | | | $ | 0 | | | $ | 0 | | | $ | 42,157,676 | |
Consumer discretionary | | | 231,860,064 | | | | 0 | | | | 0 | | | | 231,860,064 | |
Consumer staples | | | 197,671,638 | | | | 0 | | | | 0 | | | | 197,671,638 | |
Energy | | | 133,790,552 | | | | 0 | | | | 0 | | | | 133,790,552 | |
Financials | | | 510,774,196 | | | | 1,133,887 | | | | 0 | | | | 511,908,083 | |
Health care | | | 55,375,196 | | | | 0 | | | | 0 | | | | 55,375,196 | |
Industrials | | | 591,346,130 | | | | 0 | | | | 0 | | | | 591,346,130 | |
Information technology | | | 271,474,219 | | | | 174,090 | | | | 0 | | | | 271,648,309 | |
Materials | | | 405,346,139 | | | | 0 | | | | 0 | | | | 405,346,139 | |
Real estate | | | 71,466,594 | | | | 0 | | | | 0 | | | | 71,466,594 | |
Utilities | | | 77,360,939 | | | | 0 | | | | 0 | | | | 77,360,939 | |
| | | | |
Preferred stocks | | | | | | | | | | | | | | | | |
Financials | | | 11,078,264 | | | | 0 | | | | 0 | | | | 11,078,264 | |
| | | | |
Short-term investments | | | | | | | | | | | | | | | | |
Investment companies | | | 118,901,581 | | | | 29,363,568 | | | | 0 | | | | 148,265,149 | |
Total assets | | $ | 2,718,603,188 | | | $ | 30,671,545 | | | $ | 0 | | | $ | 2,749,274,733 | |
| | | | |
| 28 | | Wells Fargo Special Small Cap Value Fund | | Notes to financial statements (unaudited) |
Additional sector, industry or geographic detail is included in the Portfolio of Investments.
At September 30, 2018, the Fund did not have any transfers into/out of Level 3.
4. TRANSACTIONS WITH AFFILIATES
Management fee
Funds Management, an indirect wholly owned subsidiary of Wells Fargo, is the manager of the Fund and provides advisory and fund-level administrative services under an investment management agreement. Under the investment management agreement, Funds Management is responsible for, among other services, implementing the investment objectives and strategies of the Fund, supervising the subadviser and providing fund-level administrative services in connection with the Fund’s operations. As compensation for its services under the investment management agreement, Funds Management is entitled to receive an annual management fee starting at 0.85% and declining to 0.71% as the average daily net assets of the Fund increase. For the six months ended September 30, 2018, the management fee was equivalent to an annual rate of 0.81% of the Fund’s average daily net assets.
Funds Management has retained the services of a subadviser to provide daily portfolio management to the Fund. The fee for subadvisory services is borne by Funds Management. WellsCap is the subadviser to the Fund and is entitled to receive a fee from Funds Management at an annual rate starting at 0.55% and declining to 0.40% as the average daily net assets of the Fund increase.
Administration fees
Under a class-level administration agreement, Funds Management provides class-level administrative services to the Fund, which includes paying fees and expenses for services provided by the transfer agent, sub-transfer agents, omnibus account servicers and record-keepers. As compensation for its services under the class-level administration agreement, Funds Management receives an annual fee which is calculated based on the average daily net assets of each class as follows:
| | | | |
| | | Class-level
administration fee | |
Class A, Class C, Class R | | | 0.21 | % |
Class R6 | | | 0.03 | |
Administrator Class, Institutional Class | | | 0.13 | |
Funds Management has contractually waived and/or reimbursed management and administration fees to the extent necessary to maintain certain net operating expense ratios for the Fund. When each class of the Fund has exceeded its expense cap, Funds Management has waived fees and/or reimbursed expenses from fund level expenses on a proportionate basis and then from class specific expenses; otherwise, waivers and/or reimbursements are applied against class specific expenses before fund level expenses. Funds Management has committed through July 31, 2019 to waive fees and/or reimburse expenses to the extent necessary to cap the Fund’s expenses at 1.34% for Class A shares, 2.09% for Class C shares, 1.59% for Class R shares, 0.89% for Class R6 shares, 1.20% for Administrator Class shares, and 0.94% for Institutional Class shares. After this time, the cap may be increased or the commitment to maintain the cap may be terminated only with the approval of the Board of Trustees.
Distribution fees
The Trust has adopted a distribution plan for Class C and Class R shares of the Fund pursuant to Rule 12b-1 under the 1940 Act. Distribution fees are charged to Class C and Class R shares and paid to Wells Fargo Funds Distributor, LLC (“Funds Distributor”), the principal underwriter, at an annual rate of 0.75% of the average daily net assets of Class C shares and 0.25% of the average daily net assets of Class R shares.
In addition, Funds Distributor is entitled to receive the front-end sales charge from the purchase of Class A shares and a contingent deferred sales charge on the redemption of certain Class A shares. Funds Distributor is also entitled to receive the contingent deferred sales charges from redemptions of Class C shares. For the six months ended September 30, 2018, Funds Distributor received $14,760 from the sale of Class A shares. No contingent deferred sales charges were incurred by Class A and Class C shares for the six months ended September 30, 2018.
Shareholder servicing fees
The Trust has entered into contracts with one or more shareholder servicing agents, whereby Class A, Class C, Class R, and Administrator Class of the Fund are charged a fee at an annual rate of 0.25% of the average daily net assets of each respective class.
| | | | | | |
| Notes to financial statements (unaudited) | | Wells Fargo Special Small Cap Value Fund | | | 29 | |
A portion of these total shareholder servicing fees were paid to affiliates of Wells Fargo.
Interfund transactions
The Fund may purchase or sell portfolio investment securities to certain other Wells Fargo affiliates pursuant to Rule 17a-7 under the 1940 Act and under procedures adopted by the Board of Trustees. The procedures have been designed to ensure that these interfund transactions, which do not incur broker commissions, are effected at current market prices. Pursuant to these procedures, the Fund had $21,695,501 and $27,546,894 in interfund purchases and sales, respectively, during the six months ended September 30, 2018.
5. INVESTMENT PORTFOLIO TRANSACTIONS
Purchases and sales of investments, excluding U.S. government obligations (if any) and short-term securities, for the six months ended September 30, 2018 were $671,041,796, and $303,143,223, respectively.
6. BANK BORROWINGS
The Trust (excluding the money market funds), Wells Fargo Master Trust and Wells Fargo Variable Trust are parties to a $280,000,000 revolving credit agreement whereby the Fund is permitted to use bank borrowings for temporary or emergency purposes, such as to fund shareholder redemption requests. Interest under the credit agreement is charged to the Fund based on a borrowing rate equal to the higher of the Federal Funds rate in effect on that day plus 1.25% or the overnight LIBOR rate in effect on that day plus 1.25%. In addition, an annual commitment fee equal to 0.25% of the unused balance is allocated to each participating fund.
For the six months ended September 30, 2018, there were no borrowings by the Fund under the agreement.
7. DISTRIBUTIONS TO SHAREHOLDERS
Beginning October 2018, the Securities and Exchange Commission eliminated the requirement to separately state the components of distributions to shareholders. The amounts of distributions to shareholders for the year ended March 31, 2018 were as follows:
| | | | | | | | |
| | | Net investment
income | | | Net realized
gains | |
Class A | | | $5,156,558 | | | | $23,767,259 | |
Class C | | | 80,902 | | | | 2,620,489 | |
Class R | | | 28,233 | | | | 123,012 | |
Class R6 | | | 3,491,795 | | | | 10,469,298 | |
Administrator Class | | | 2,253,608 | | | | 8,842,873 | |
Institutional Class | | | 14,206,922 | | | | 45,129,294 | |
8. INDEMNIFICATION
Under the Trust’s organizational documents, the officers and Trustees have been granted certain indemnification rights against certain liabilities that may arise out of performance of their duties to the Trust. Additionally, in the normal course of business, the Trust may enter into contracts with service providers that contain a variety of indemnification clauses. The Trust’s maximum exposure under these arrangements is dependent on future claims that may be made against the Fund and, therefore, cannot be estimated.
9. NEW ACCOUNTING PRONOUNCEMENT
In August 2018, FASB issued Accounting Standards Update (“ASU”) No. 2018-13, Fair Value Measurement (Topic 820) Disclosure Framework – Changes to the Disclosure Requirements for Fair Value Measurement. ASU 2018-13 updates the disclosure requirements for fair value measurements by modifying or removing certain disclosures and adding certain new disclosures. The amendments are effective for fiscal years, and interim periods within those fiscal years, beginning after December 15, 2019. Early adoption is permitted. Management has early adopted the removal and modification disclosures, as permitted, and will adopt the additional new disclosures at the effective date.
| | | | |
| 30 | | Wells Fargo Special Small Cap Value Fund | | Other information (unaudited) |
PROXY VOTING INFORMATION
A description of the policies and procedures that the Fund uses to determine how to vote proxies relating to portfolio securities is available, upon request, by calling 1-800-222-8222, visiting our website at wellsfargofunds.com, or visiting the SEC website at sec.gov. Information regarding how the Fund voted proxies relating to portfolio securities during the most recent 12-month period ended June 30 is available on the Fund’s website at wellsfargofunds.com or by visiting the SEC website at sec.gov.
PORTFOLIO HOLDINGS INFORMATION
The complete portfolio holdings for the Fund are publicly available monthly on the Fund’s website (wellsfargofunds.com), on a one-month delayed basis. In addition, top ten holdings information (excluding derivative positions) for the Fund is publicly available on the Fund’s website on a monthly, seven-day or more delayed basis. The Fund files its complete schedule of portfolio holdings with the SEC for the first and third quarters of each fiscal year on Form N-Q, which is available by visiting the SEC website at sec.gov. In addition, the Fund’s Form N-Q may be reviewed and copied at the SEC’s Public Reference Room in Washington, DC, and at regional offices in New York City, at 233 Broadway, and in Chicago, at 175 West Jackson Boulevard, Suite 900. Information about the Public Reference Room may be obtained by calling 1-800-SEC-0330.
| | | | | | |
| Other information (unaudited) | | Wells Fargo Special Small Cap Value Fund | | | 31 | |
BOARD OF TRUSTEES AND OFFICERS
Each of the Trustees and Officers1 listed in the table below acts in identical capacities for each fund in the Wells Fargo family of funds, which consists of 153 mutual funds comprising the Wells Fargo Funds Trust, Wells Fargo Variable Trust, Wells Fargo Master Trust and four closed-end funds (collectively the “Fund Complex”). This table should be read in conjunction with the Prospectus and the Statement of Additional Information2. The mailing address of each Trustee and Officer is 525 Market Street, 12th Floor, San Francisco, CA 94105. Each Trustee and Officer serves an indefinite term, however, each Trustee serves such term until reaching the mandatory retirement age established by the Trustees.
Independent Trustees
| | | | | | |
Name and year of birth | | Position held and
length of service* | | Principal occupations during past five years or longer | | Current other
public company or
investment company
directorships |
| William R. Ebsworth (Born 1957) | | Trustee, since 2015 | | Retired. From 1984 to 2013, equities analyst, portfolio manager, research director and chief investment officer at Fidelity Management and Research Company in Boston, Tokyo, and Hong Kong, and retired in 2013 as Chief Investment Officer of Fidelity Strategic Advisers, Inc. where he led a team of investment professionals managing client assets. Prior thereto, Board member of Hong Kong Securities Clearing Co., Hong Kong Options Clearing Corp., the Thailand International Fund, Ltd., Fidelity Investments Life Insurance Company, and Empire Fidelity Investments Life Insurance Company. Board member of the Vincent Memorial Hospital Endowment (non-profit organization), where he serves on the Investment Committee and as a Chair of the Audit Committee. Mr. Ebsworth is a CFA® charterholder. | | N/A |
| Jane A. Freeman (Born 1953) | | Trustee, since 2015;
Chair Liaison, since 2018 | | Retired. From 2012 to 2014 and 1999 to 2008, Chief Financial Officer of Scientific Learning Corporation. From 2008 to 2012, Ms. Freeman provided consulting services related to strategic business projects. Prior to 1999, Portfolio Manager at Rockefeller & Co. and Scudder, Stevens & Clark. Board member of the Harding Loevner Funds from 1996 to 2014, serving as both Lead Independent Director and chair of the Audit Committee. Board member of the Russell Exchange Traded Funds Trust from 2011 to 2012 and the chair of the Audit Committee. Ms. Freeman is a Board Member of The Ruth Bancroft Garden (non-profit organization). She is also an inactive Chartered Financial Analyst. | | N/A |
Isaiah Harris, Jr. (Born 1952) | | Trustee, since 2009 | | Retired. Chairman of the Board of CIGNA Corporation since 2009, and Director since 2005. From 2003 to 2011, Director of Deluxe Corporation. Prior thereto, President and CEO of BellSouth Advertising and Publishing Corp. from 2005 to 2007, President and CEO of BellSouth Enterprises from 2004 to 2005 and President of BellSouth Consumer Services from 2000 to 2003. Emeritus member of the Iowa State University Foundation Board of Governors. Emeritus Member of the Advisory Board of Iowa State University School of Business. Advisory Board Member, Palm Harbor Academy (private school). Advisory Board Member, Child Evangelism Fellowship (non-profit). Mr. Harris is a certified public accountant (inactive status). | | CIGNA Corporation |
| Judith M. Johnson (Born 1949) | | Trustee, since 2008;
Audit Committee Chairman, since 2009 | | Retired. Prior thereto, Chief Executive Officer and Chief Investment Officer of Minneapolis Employees Retirement Fund from 1996 to 2008. Ms. Johnson is an attorney, certified public accountant and a certified managerial accountant. | | N/A |
| | | | |
| 32 | | Wells Fargo Special Small Cap Value Fund | | Other information (unaudited) |
| | | | | | |
Name and year of birth | | Position held and
length of service* | | Principal occupations during past five years or longer | | Current other
public company or
investment company
directorships |
| David F. Larcker (Born 1950) | | Trustee, since 2009 | | James Irvin Miller Professor of Accounting at the Graduate School of Business, Stanford University, Director of the Corporate Governance Research Initiative and Senior Faculty of The Rock Center for Corporate Governance since 2006. From 2005 to 2008, Professor of Accounting at the Graduate School of Business, Stanford University. Prior thereto, Ernst & Young Professor of Accounting at The Wharton School, University of Pennsylvania from 1985 to 2005. | | N/A |
| Olivia S. Mitchell (Born 1953) | | Trustee, since 2006; Governance Committee Chairman, since 2018 | | International Foundation of Employee Benefit Plans Professor, Wharton School of the University of Pennsylvania since 1993. Director of Wharton’s Pension Research Council and Boettner Center on Pensions & Retirement Research, and Research Associate at the National Bureau of Economic Research. Previously, Cornell University Professor from 1978 to 1993. | | N/A |
| Timothy J. Penny (Born 1951) | | Trustee, since 1996; Chairman, since 2018; Vice Chairman, from 2017 to 2018 | | President and Chief Executive Officer of Southern Minnesota Initiative Foundation, a non-profit organization, since 2007. Member of the Board of Trustees of NorthStar Education Finance, Inc., a non-profit organization, since 2007. | | N/A |
| James G. Polisson (Born 1959) | | Trustee, since 2018; Advisory Board Member, from 2017 to 2018 | | Retired. Chief Marketing Officer, Source (ETF) UK Services, Ltd, from 2015 to 2017. From 2012 to 2015, Principal of The Polisson Group, LLC, a management consulting, corporate advisory and principal investing company. Chief Executive Officer and Managing Director at Russell Investments, Global Exchange Traded Funds from 2010 to 2012. Managing Director of Barclays Global Investors from 1998 to 2010 and Global Chief Marketing Officer for iShares and Barclays Global Investors from 2000 to 2010. Trustee of the San Francisco Mechanics’ Institute, a non-profit organization, from 2013 to 2015. Board member of the Russell Exchange Traded Fund Trust from 2011 to 2012. Director of Barclays Global Investors Holdings Deutschland GmbH from 2006 to 2009. Mr. Polisson is an attorney and has a retired status with the Massachusetts and District of Columbia Bar Associations. | | N/A |
| Michael S. Scofield (Born 1943) | | Trustee, since 2010 | | Served on the Investment Company Institute’s Board of Governors and Executive Committee from 2008-2011 as well the Governing Council of the Independent Directors Council from 2006-2011 and the Independent Directors Council Executive Committee from 2008-2011. Trustee of the Evergreen Fund complex (and its predecessors) from 1984 to 2010. Chairman of the Evergreen Funds from 2000-2010. Former Trustee of the Mentor Funds. Retired Attorney, Law Offices of Michael S. Scofield. | | N/A |
| Pamela Wheelock (Born 1959) | | Trustee, since 2018; Advisory Board Member, from 2017 to 2018 | | Chief Operating Officer, Twin Cities Habitat for Humanity, since January, 2017. Vice President of University Services, University of Minnesota from 2012 to 2017. Prior thereto, on the Board of Directors, Governance Committee and Finance Committee for the Minnesota Philanthropy Partners (Saint Paul Foundation) from 2012 to 2018, Interim President and Chief Executive Officer of Blue Cross Blue Shield of Minnesota from 2010 to 2011, Chairman of the Board from 2009 to 2011 and Board Director from 2003 to 2015. Vice President, Leadership and Community Engagement, Bush Foundation, Saint Paul, Minnesota (a private foundation) from 2009 to 2011. Executive Vice President and Chief Financial Officer, Minnesota Sports and Entertainment from 2004 to 2009 and Senior Vice President from 2002 to 2004. Commissioner of Finance, State of Minnesota, from 1999 to 2002. Currently the Board Chair of the Minnesota Wild Foundation since 2010. | | N/A |
| * | Length of service dates reflect the Trustee’s commencement of service with the Trust’s predecessor entities, where applicable. |
| | | | | | |
| Other information (unaudited) | | Wells Fargo Special Small Cap Value Fund | | | 33 | |
Officers
| | | | | | |
Name and year of birth | | Position held and length of service | | Principal occupations during past five years or longer | | |
Andrew Owen
(Born 1960) | | President, since 2017 | | Executive Vice President of Wells Fargo & Company and Head of Affiliated Managers, Wells Fargo Asset Management, since 2014. In addition, Mr. Owen is currently President, Chief Executive Officer and Director of Wells Fargo Funds Management, LLC since 2017. Prior thereto, Executive Vice President responsible for marketing, investments and product development for Wells Fargo Funds Management, LLC, from 2009 to 2014. | | |
Nancy Wiser1
(Born 1967) | | Treasurer, since 2012 | | Executive Vice President of Wells Fargo Funds Management, LLC since 2011. Chief Operating Officer and Chief Compliance Officer at LightBox Capital Management LLC, from 2008 to 2011. | | |
Alexander Kymn3
(Born 1973) | | Secretary, since 2018; Chief Legal Officer,
since 2018 | | Senior Company Counsel of Wells Fargo Bank, N.A. since 2018 (previously Senior Counsel from 2007 to 2018). Vice President of Wells Fargo Funds Management, LLC from 2008 to 2014. | | |
Michael H. Whitaker
(Born 1967) | | Chief Compliance Officer, since 2016 | | Senior Vice President and Chief Compliance Officer since 2016. Senior Vice President and Chief Compliance Officer for Fidelity Investments from 2007 to 2016. | | |
David Berardi
(Born 1975) | | Assistant Treasurer,
since 2009 | | Vice President of Wells Fargo Funds Management, LLC since 2009. Vice President of Evergreen Investment Management Company, LLC from 2008 to 2010. Manager of Fund Reporting and Control for Evergreen Investment Management Company, LLC from 2004 to 2010. | | |
Jeremy DePalma1
(Born 1974) | | Assistant Treasurer,
since 2009 | | Senior Vice President of Wells Fargo Funds Management, LLC since 2009. Senior Vice President of Evergreen Investment Management Company, LLC from 2008 to 2010 and head of the Fund Reporting and Control Team within Fund Administration from 2005 to 2010. | | |
| 1 | Nancy Wiser acts as Treasurer of 76 funds in the Fund Complex. Jeremy DePalma acts as Treasurer of 77 funds and Assistant Treasurer of 76 funds in the Fund Complex. |
| 2 | The Statement of Additional Information includes additional information about the Trustees and is available, without charge, upon request, by calling 1-800-222-8222 or by visiting the website at wellsfargofunds.com. |
| 3 | Alexander Kymn became the Secretary and Chief Legal Officer effective April 17, 2018. |
| | | | |
| 34 | | Wells Fargo Special Small Cap Value Fund | | Other information (unaudited) |
BOARD CONSIDERATION OF INVESTMENT MANAGEMENT AND SUB-ADVISORY AGREEMENTS:
Wells Fargo Special Small Cap Value Fund
Under the Investment Company Act of 1940 (the “1940 Act”), the Board of Trustees (the “Board”) of Wells Fargo Funds Trust (the “Trust”) must determine annually whether to approve the continuation of the Trust’s investment management and sub-advisory agreements. In this regard, at an in-person meeting held on May 22-23, 2018 (the “Meeting”), the Board, all the members of which have no direct or indirect interest in the investment management and sub-advisory agreements and are not “interested persons” of the Trust, as defined in the 1940 Act (the “Independent Trustees”), reviewed and approved for Wells Fargo Special Small Cap Value Fund (the “Fund”): (i) an investment management agreement (the “Management Agreement”) with Wells Fargo Funds Management, LLC (“Funds Management”); and (ii) an investment sub-advisory agreement (the “Sub-Advisory Agreement”) with Wells Capital Management Incorporated (the “Sub-Adviser”), an affiliate of Funds Management. The Management Agreement and the Sub-Advisory Agreement are collectively referred to as the “Advisory Agreements.”
At the Meeting, the Board considered the factors and reached the conclusions described below relating to the selection of Funds Management and the Sub-Adviser and the approval of the Advisory Agreements. Prior to the Meeting, including at an in-person meeting in April 2018, the Trustees conferred extensively among themselves and with representatives of Funds Management about these matters. Also, the Board has adopted a team-based approach, with each team consisting of a sub-set of Trustees, to assist the full Board in the discharge of its duties in reviewing investment performance and other matters throughout the year. The Independent Trustees were assisted in their evaluation of the Advisory Agreements by independent legal counsel, from whom they received separate legal advice and with whom they met separately.
In providing information to the Board, Funds Management and the Sub-Adviser were guided by a detailed set of requests for information submitted to them by independent legal counsel on behalf of the Independent Trustees at the start of the Board’s annual contract renewal process earlier in 2018. In considering and approving the Advisory Agreements, the Trustees considered the information they believed relevant, including but not limited to the information discussed below. The Board considered not only the specific information presented in connection with the Meeting, but also the knowledge gained over time through interaction with Funds Management and the Sub-Adviser about various topics. In this regard, the Board reviewed reports of Funds Management at each of its quarterly meetings, which included, among other things, portfolio reviews and investment performance reports. In addition, the Board and the teams mentioned above confer with portfolio managers at various times throughout the year. The Board did not identify any particular information or consideration that was all-important or controlling, and each individual Trustee may have attributed different weights to various factors.
After its deliberations, the Board unanimously approved the continuation of the Advisory Agreements for a one-year term and determined that the compensation payable to Funds Management and the Sub-Adviser under each of the Advisory Agreements was reasonable. The Board considered the approval of the Advisory Agreements for the Fund as part of its consideration of agreements for funds across the complex, but its approvals were made on a fund-by-fund basis. The following summarizes a number of important, but not necessarily all, factors considered by the Board in support of its approvals.
Nature, extent and quality of services
The Board received and considered various information regarding the nature, extent and quality of services provided to the Fund by Funds Management and the Sub-Adviser under the Advisory Agreements. This information included a description of the investment advisory services and Fund-level administrative services covered by the Management Agreement, as well as, among other things, a summary of the background and experience of senior management of Wells Fargo Asset Management (“WFAM”), of which Funds Management and the Sub-Adviser are a part, a summary of investments made in the business of WFAM, a summary of certain organizational and personnel changes involving Funds Management and the Sub-Adviser, and a description of Funds Management’s and the Sub-Adviser’s business continuity planning programs and of their approaches to data privacy and cybersecurity. The Board also considered the qualifications, background, tenure and responsibilities of each of the portfolio managers primarily responsible for the day-to-day portfolio management of the Fund.
The Board evaluated the ability of Funds Management and the Sub-Adviser to attract and retain qualified investment professionals, including research, advisory and supervisory personnel. The Board further considered the compliance programs and compliance records of Funds Management and the Sub-Adviser. In addition, the Board took into account the full range of services provided to the Fund by Funds Management and its affiliates.
| | | | | | |
| Other information (unaudited) | | Wells Fargo Special Small Cap Value Fund | | | 35 | |
Fund investment performance and expenses
The Board considered the investment performance results for the Fund over various time periods ended December 31, 2017. The Board considered these results in comparison to the investment performance of funds in a universe that was determined by Broadridge Inc. (“Broadridge”) to be similar to the Fund (the “Universe”), and in comparison to the Fund’s benchmark index and to other comparative data. Broadridge is an independent provider of investment company data. The Board received a description of the methodology used by Broadridge to select the mutual funds in the performance Universe. The Board noted that the investment performance of the Fund (Administrator Class) was higher than the average investment performance of the Universe for all periods under review. The Board also noted that the investment performance of the Fund was higher than its benchmark index, the Russell 2000 Value Index, for all periods under review.
The Board received information concerning, and discussed factors contributing to, the underperformance of the Fund relative to the Universe and benchmark for the periods identified above. The Board took note of the explanations for the relative underperformance during these periods, including with respect to investment decisions and market factors that affected the Fund’s investment performance. The Board also took note of the Fund’s outperformance relative to the Universe and benchmark over the more recent time periods under review.
The Board also received and considered information regarding the Fund’s net operating expense ratios and their various components, including actual management fees, custodian and other non-management fees, and Rule 12b-1 and non-Rule 12b-1 shareholder service fees. The Board considered these ratios in comparison to the median ratios of funds in class-specific expense groups that were determined by Broadridge to be similar to the Fund (the “Groups”). The Board received a description of the methodology used by Broadridge to select the mutual funds in the expense Groups and an explanation of how funds comprising expense groups and their expense ratios may vary from year-to-year. Based on the Broadridge reports, the Board noted that the net operating expense ratios of the Fund were lower than or in range of the median net operating expense ratios of the expense Groups for each share class except Class R.
The Board took into account the Fund’s investment performance and expense information provided to it among the factors considered in deciding to re-approve the Advisory Agreements.
Investment management and sub-advisory fee rates
The Board reviewed and considered the contractual fee rates payable by the Fund to Funds Management under the Management Agreement, as well as the contractual fee rates payable by the Fund to Funds Management for class-level administrative services under a Class-Level Administration Agreement, which include, among other things, class-level transfer agency and sub-transfer agency costs (collectively, the “Management Rates”). The Board also reviewed and considered the contractual investment sub-advisory fee rates that are payable by Funds Management to the Sub-Adviser for investment sub-advisory services.
Among other information reviewed by the Board was a comparison of the Fund’s Management Rates with the average contractual investment management fee rates of funds in the expense Groups at a common asset level as well as transfer agency costs of the funds in the expense Groups. The Board noted that the Management Rates of the Fund were lower than or in range of the sum of these average rates for the Fund’s expense Groups for all Classes.
The Board also received and considered information about the portion of the total management fee that was retained by Funds Management after payment of the fee to the Sub-Adviser for sub-advisory services. In assessing the reasonableness of this amount, the Board received and evaluated information about the nature and extent of responsibilities retained and risks assumed by Funds Management and not delegated to or assumed by the Sub-Adviser, and about Funds Management’s on-going oversight services. Given the affiliation between Funds Management and the Sub-Adviser, the Board ascribed limited relevance to the allocation of fees between them.
The Board also received and considered information about the nature and extent of services offered and fee rates charged by Funds Management and the Sub-Adviser to other types of clients with investment strategies similar to those of the Fund. In this regard, the Board received information about the significantly greater scope of services, and compliance, reporting and other legal burdens and risks of managing mutual funds compared with those associated with managing assets of non-mutual fund clients such as institutional separate accounts.
Based on its consideration of the factors and information it deemed relevant, including those described here, the Board determined that the compensation payable to Funds Management under the Management Agreement and to the Sub-Adviser under the Sub-Advisory Agreement was reasonable.
| | | | |
| 36 | | Wells Fargo Special Small Cap Value Fund | | Other information (unaudited) |
Profitability
The Board received and considered information concerning the profitability of Funds Management, as well as the profitability of both WFAM and Wells Fargo & Co. (“Wells Fargo”) as a whole, from providing services to the Fund and the fund family as a whole. The Board noted that the Sub-Adviser’s profitability information with respect to providing services to the Fund was subsumed in the WFAM and Wells Fargo profitability analysis.
Funds Management reported on the methodologies and estimates used in calculating profitability, including a description of the methodology used to allocate certain expenses and recent enhancements made to the methodology. Among other things, the Board noted that the levels of profitability reported on a fund-by-fund basis varied widely, depending on factors such as the size and type of fund. Based on its review, the Board did not deem the profits reported by Funds Management, WFAM or Wells Fargo from services provided to the Fund to be at a level that would prevent it from approving the continuation of the Advisory Agreements.
Economies of scale
The Board considered the extent to which Funds Management may experience economies of scale in the provision of management services, and the extent to which scale benefits, if any, would be shared with shareholders. In particular, the Board noted the existence of breakpoints in the Fund’s management fee structure, which operate generally to reduce the Fund’s expense ratios as the Fund grows in size. It considered that, for a small fund or a fund that shrinks in size, breakpoints conversely can result in higher fee levels. The Board also considered that in addition to management fee breakpoints, competitive management fee rates set at the outset without regard to breakpoints and fee waiver and expense reimbursement arrangements, as well as investments in the business intended to enhance services available to Fund shareholders, are means of sharing potential economies of scale with shareholders of the Fund.
The Board concluded that the Fund’s fee and expense arrangements, including contractual breakpoints, constituted a reasonable approach to sharing potential economies of scale with the Fund and its shareholders.
Other benefits to Funds Management and the Sub-Adviser
The Board received and considered information regarding potential “fall-out” or ancillary benefits received by Funds Management and its affiliates, including the Sub-Adviser, as a result of their relationships with the Fund. Ancillary benefits could include, among others, benefits directly attributable to other relationships with the Fund and benefits potentially derived from an increase in Funds Management’s and the Sub-Adviser’s business as a result of their relationships with the Fund. The Board noted that various affiliates of Funds Management may receive distribution-related fees, shareholder servicing payments and sub-transfer agency fees in respect of shares sold or held through them and services provided.
The Board also reviewed information about soft dollar credits earned and utilized by the Sub-Adviser, fees earned by Funds Management and the Sub-Adviser from managing a private investment vehicle for the fund family’s securities lending collateral and commissions earned by an affiliated broker from portfolio transactions.
Based on its consideration of the factors and information it deemed relevant, including those described here, the Board did not find that any ancillary benefits received by Funds Management and its affiliates, including the Sub-Adviser, were unreasonable.
Conclusion
At the Meeting, after considering the above-described factors and based on its deliberations and its evaluation of the information described above, the Board unanimously approved the continuation of the Advisory Agreements for a one-year term and determined that the compensation payable to Funds Management and the Sub-Adviser under each of the Advisory Agreements was reasonable.
| | | | | | |
| Appendix A (unaudited) | | Wells Fargo Special Small Cap Value Fund | | | 37 | |
SALES CHARGE REDUCTIONS AND WAIVERS FOR CERTAIN INTERMEDIARIES
Ameriprise
Effective June 1, 2018, shareholders purchasing Fund shares through an Ameriprise Financial platform or account will be eligible only for the following Class A load waivers (front-end sales charge waivers), which may differ from those disclosed elsewhere in the Fund’s prospectus or Statement of Additional Information.
Front-end Sales Load Waivers on Class A Shares Available at Ameriprise Financial
| | • | | Employer-sponsored retirement plans (e.g., 401(k) plans, 457 plans, employer-sponsored 403(b) plans, profit sharing and money purchase pension plans and defined benefit plans). For purposes of this provision, employer-sponsored retirement plans do not include SEP IRAs, Simple IRAs or SAR-SEPs. |
| | • | | Shares purchased through an Ameriprise Financial investment advisory program (if an Advisory or similar share class for such investment advisory program is not available) |
| | • | | Shares purchased by third party investment advisors on behalf of their advisory clients through Ameriprise Financial’s platform (if an Advisory or similar share class for such investment advisory program is not available) |
| | • | | Shares purchased through reinvestment of distributions and dividend reinvestment when purchasing shares of the same Fund (but not any other fund within the same fund family) |
| | • | | Shares exchanged from Class C shares of the same fund in the month of or following the 10-year anniversary of the purchase date. To the extent that the Fund’s prospectus elsewhere provides for a waiver with respect to such shares following a shorter holding period, that waiver will apply to exchanges following such shorter period. To the extent that the Fund’s prospectus elsewhere provides for a waiver with respect to exchanges of Class C shares for load-waived shares, that waiver will also apply to such exchanges. |
| | • | | Employees and registered representatives of Ameriprise Financial or its affiliates and their immediate family members |
| | • | | Shares purchased by or through qualified accounts (including IRAs, Coverdell Education Savings Accounts, 401(k)s, 403(b) TSCAs subject to ERISA and defined benefit plans) that are held by a covered family member, defined as an Ameriprise financial advisor and/or the advisor’s spouse, advisor’s lineal ascendant (mother, father, grandmother, grandfather, great grandmother, great grandfather), advisor’s lineal descendant (son, step-son, daughter, step-daughter, grandson, granddaughter, great grandson, great granddaughter) or any spouse of a covered family member who is a lineal descendant |
| | • | | Shares purchased from the proceeds of redemptions within the same fund family, provided (1) the repurchase occurs within 90 days following the redemption, (2) the redemption and purchase occur in the same account, and (3) redeemed shares were subject to a front-end or deferred sales load (i.e. Rights of Reinstatement). Subject to the Fund’s policy regarding frequent purchases and redemptions of Fund shares, you may not be able to repurchase shares for the first 30 days after your redemption. |
Automatic Exchange of Class C Shares Available at Ameriprise Financial
| | • | | Class C shares will automatically exchange to Class A shares in the month of the 10-year anniversary of the purchase date. |
Merrill Lynch
Effective April 10, 2017, shareholders purchasing Fund shares through a Merrill Lynch platform or account will be eligible only for the following load waivers (front-end sales charge waivers and contingent deferred, or back-end, sales charge waivers) and discounts, which may differ from those disclosed elsewhere in the Fund’s prospectus or Statement of Additional Information.
Front-end Sales Load Waivers on Class A Shares available at Merrill Lynch
| | • | | Employer-sponsored retirement, deferred compensation and employee benefit plans (including health savings accounts) and trusts used to fund those plans, provided that the shares are not held in a commission-based brokerage account and shares are held for the benefit of the plan |
| | • | | Shares purchased by or through a 529 Plan |
| | • | | Shares purchased through a Merrill Lynch affiliated investment advisory program |
| | | | |
| 38 | | Wells Fargo Special Small Cap Value Fund | | Appendix A (unaudited) |
| | • | | Shares purchased by third party investment advisors on behalf of their advisory clients through Merrill Lynch’s platform |
| | • | | Shares of funds purchased through the Merrill Edge Self-Directed platform (if applicable) |
| | • | | Shares purchased through reinvestment of capital gains distributions and dividend reinvestment when purchasing shares of the same fund (but not any other fund within the fund family) |
| | • | | Shares exchanged from Class C (i.e. level-load) shares of the same fund in the month of or following the 10-year anniversary of the purchase date |
| | • | | Employees and registered representatives of Merrill Lynch or its affiliates and their family members, as defined by Merrill Lynch, which may differ from the definition of family member in the Fund’s prospectus. |
| | • | | Directors or Trustees of the Fund, and employees of the Fund’s investment adviser or any of its affiliates, as described in the Fund’s prospectus |
| | • | | Shares purchased from the proceeds of redemptions within the same fund family, provided (1) the repurchase occurs within 90 days following the redemption, (2) the redemption and purchase occur in the same account, and (3) redeemed shares were subject to a front-end or deferred sales load (known as Rights of Reinstatement). Subject to the Fund’s policy regarding frequent purchases and redemptions of Fund shares, you may not be able to repurchase shares for the first 30 days after your redemption. |
CDSC Waivers on A, B and C Shares available at Merrill Lynch
| | • | | Death or disability of the shareholder |
| | • | | Shares sold as part of a systematic withdrawal plan as described in the Fund’s prospectus |
| | • | | Return of excess contributions from an IRA Account |
| | • | | Shares sold as part of a required minimum distribution for IRA and retirement accounts due to the shareholder reaching age 701⁄2 |
| | • | | Shares sold to pay Merrill Lynch fees but only if the transaction is initiated by Merrill Lynch |
| | • | | Shares acquired through a right of reinstatement |
| | • | | Shares held in retirement brokerage accounts, that are exchanged for a lower cost share class due to transfer to certain fee based accounts or platforms (applicable to A and C shares only) |
Front-end load Discounts Available at Merrill Lynch: Breakpoints, Rights of Accumulation & Letters of Intent
| | • | | Breakpoints as described in the Fund’s prospectus |
| | • | | Rights of Accumulation (ROA) which entitle shareholders to breakpoint discounts will be automatically calculated based on the aggregated holding of fund family assets held by accounts within the purchaser’s household at Merrill Lynch. Eligible fund family assets not held at Merrill Lynch may be included in the ROA calculation only if the shareholder notifies his or her financial advisor about such assets. |
| | • | | Letters of Intent (LOI) which allow for breakpoint discounts based on anticipated purchases within a fund family, through Merrill Lynch, over a 13-month period of time (if applicable) |
Morgan Stanley
Effective on or about July 1, 2018, shareholders purchasing Fund shares through a Morgan Stanley Wealth Management transactional brokerage account will be eligible only for the following Class A load waivers (front-end sales charge waivers), which may differ from and be more limited than those disclosed in the Fund’s prospectus or Statement of Additional Information.
Front-end Sales Load Waivers on Class A Shares Available at Morgan Stanley
| | • | | Employer-sponsored retirement plans (e.g., 401(k) plans, 457 plans, employer-sponsored 403(b) plans, profit sharing and money purchase pension plans and defined benefit plans). For purposes of this provision, employer-sponsored retirement plans do not include SEP IRAs, Simple IRAs, SAR-SEPs or Keogh plans. |
| | • | | Morgan Stanley employee and employee-related accounts according to Morgan Stanley’s account linking rules |
| | • | | Shares purchased through reinvestment of dividends and capital gains distributions when purchasing shares of the same fund |
| | • | | Shares purchased through a Morgan Stanley self-directed brokerage account |
| | | | | | |
| Appendix A (unaudited) | | Wells Fargo Special Small Cap Value Fund | | | 39 | |
| | • | | Class C (i.e., level-load) shares that are no longer subject to a contingent deferred sales charge and are exchanged to Class A shares of the same fund pursuant to Morgan Stanley Wealth Management’s share class exchange program. |
| | • | | Shares purchased from the proceeds of redemptions within the same fund family, provided (i) the repurchase occurs within 90 days following the redemption, (ii) the redemption and purchase occur in the same account, and (iii) redeemed shares were subject to a front-end or deferred sales charge. This waiver is subject to the Fund’s policy regarding frequent purchases and redemption of Fund shares, as discussed under “Account Information—Frequent Purchases and Redemptions of Fund Shares” in the Fund’s prospectus. |
Raymond James & Associates, Inc., Raymond James Financial Services & Raymond James affiliates (“Raymond James”)
Effective on or about March 1, 2019, shareholders purchasing Fund shares through a Raymond James platform or account will be eligible only for the following load waivers (front-end sales charge waivers and contingent deferred, or back-end, sales charge waivers) and discounts, which may differ from those disclosed elsewhere in the Fund’s Prospectus or SAI.
Front-end Sales Load Waivers on Class A shares Available at Raymond James
| | • | | Shares purchased in an investment advisory program. |
| | • | | Shares purchased through reinvestment of capital gains distributions and dividend reinvestment when purchasing shares of the same fund (but not any other fund within the fund family). |
| | • | | Employees and registered representatives of Raymond James or its affiliates and their family members as designated by Raymond James. |
| | • | | Shares purchased from the proceeds of redemptions within the same fund family, provided (1) the repurchase occurs within 90 days following the redemption, (2) the redemption and purchase occur in the same account, and (3) redeemed shares were subject to a front-end or deferred sales load (known as Rights of Reinstatement). |
| | • | | A shareholder in the fund’s Class C shares will have their shares automatically exchanged at net asset value to Class A shares (or the appropriate share class) of the fund if the shares are no longer subject to a CDSC and the exchange is in line with the policies and procedures of Raymond James. |
CDSC Waivers on Class A and C Shares Available at Raymond James
| | • | | Death or disability of the shareholder. |
| | • | | Shares sold as part of a systematic withdrawal plan as described in the Fund’s Prospectus. |
| | • | | Return of excess contributions from an IRA Account. |
| | • | | Shares sold as part of a required minimum distribution for IRA and retirement accounts due to the shareholder reaching age 70½ as described in the Fund’s prospectus. |
| | • | | Shares sold to pay Raymond James fees but only if the transaction is initiated by Raymond James. |
| | • | | Shares acquired through a right of reinstatement. |
Front-end Load Discounts Available at Raymond James: Breakpoints, and/or Rights of Accumulation
| | • | | Breakpoints as described in the Fund’s Prospectus. |
| | • | | Rights of accumulation which entitle shareholders to breakpoint discounts will be automatically calculated based on the aggregated holding of fund family assets held by accounts within the purchaser’s household at Raymond James. Eligible fund family assets not held at Raymond James may be included in the rights of accumulation calculation only if the shareholder notifies his or her financial advisor about such assets. |
This page is intentionally left blank.

For more information
More information about Wells Fargo Funds is available free upon request. To obtain literature, please write, visit the Fund’s website, or call:
Wells Fargo Funds
P.O. Box 219967
Kansas City, MO 64121-9967
Website: wellsfargofunds.com
Individual investors: 1-800-222-8222
Retail investment professionals: 1-888-877-9275
Institutional investment professionals: 1-866-765-0778
This report and the financial statements contained herein are submitted for the general information of the shareholders of the Fund. If this report is used for promotional purposes, distribution of the report must be accompanied or preceded by a current prospectus. Before investing, please consider the investment objectives, risks, charges, and expenses of the investment. For a current prospectus and, if available, a summary prospectus, containing this information, call 1-800-222-8222 or visit the Fund’s website at wellsfargofunds.com. Read the prospectus carefully before you invest or send money.
Wells Fargo Asset Management (WFAM) is the trade name for certain investment advisory/management firms owned by Wells Fargo & Company. These firms include but are not limited to Wells Capital Management Incorporated and Wells Fargo Funds Management, LLC. Certain products managed by WFAM entities are distributed by Wells Fargo Funds Distributor, LLC (a broker/dealer and Member FINRA).
This material is for general informational and educational purposes only and is NOT intended to provide investment advice or a recommendation of any kind—including a recommendation for any specific investment, strategy, or plan.
NOT FDIC INSURED ◾ NO BANK GUARANTEE ◾ MAY LOSE VALUE
© 2018 Wells Fargo Funds Management, LLC. All rights reserved.
| | |
 | | 317300 11-18 SA246/SAR246 09-18 |
Semi-Annual Report
September 30, 2018

Wells Fargo Traditional Small Cap Growth Fund


Reduce clutter. Save trees.
Sign up for electronic delivery of prospectuses and shareholder reports at wellsfargo.com/advantagedelivery
Contents
The views expressed and any forward-looking statements are as of September 30, 2018, unless otherwise noted, and are those of the Fund managers and/or Wells Fargo Funds Management, LLC. Discussions of individual securities, or the markets generally, or any Wells Fargo Fund are not intended as individual recommendations. Future events or results may vary significantly from those expressed in any forward-looking statements. The views expressed are subject to change at any time in response to changing circumstances in the market. Wells Fargo Funds Management, LLC and the Fund disclaim any obligation to publicly update or revise any views expressed or forward-looking statements.
NOT FDIC INSURED ◾ NO BANK GUARANTEE ◾ MAY LOSE VALUE
| | | | |
| 2 | | Wells Fargo Traditional Small Cap Growth Fund | | Letter to shareholders (unaudited) |

Andrew Owen
President
Wells Fargo Funds
The second and third quarters of 2018 were characterized by growing economic and investment activity in the U.S.
Dear Shareholder:
We are pleased to offer you this semi-annual report for the Wells Fargo Traditional Small Cap Growth Fund for the six-month period that ended September 30, 2018. The second and third quarters of 2018 were characterized by growing economic and investment activity in the U.S. In contrast, economies overseas were restrained as geopolitical tensions and rising interest rates diverted investor interest in those markets.
For the period, U.S. stocks, as measured by the S&P 500 Index,1 gained 11.41% and international stocks, as measured by the MSCI ACWI ex USA Index (Net),2 lost 1.93%. Based on the MSCI EM Index (Net),3 emerging market stocks lost 8.97%. For bond investors, the Bloomberg Barclays U.S. Aggregate Bond Index4 lost 0.14% while the Bloomberg Barclays Global Aggregate ex-USD Index5 fell 6.42%. The Bloomberg Barclays Municipal Bond Index6 added 0.72%, and the ICE BofAML U.S. High Yield Index7 was up 3.46%.
Global trade tensions escalated during the second quarter.
During the second quarter of 2018, the U.S. government imposed tariffs, and foreign governments in North America, Europe, and Asia retaliated. The actions marked the initialization of trade tensions that would escalate during the next six months. The increasing tensions chilled investment activity as observers awaited signals of next steps.
Meanwhile, inflation continued an upward trend. The CPI-U8 added 0.1% in June after an increase of 0.2% in both April and May. On a year-over-year basis, the all-items index rose 2.9% for the 12 months that ended June 30, 2018. The index for all items less food and energy rose 2.3% for the same 12-month period.
| 1 | The S&P 500 Index consists of 500 stocks chosen for market size, liquidity, and industry group representation. It is a market-value-weighted index with each stock’s weight in the index proportionate to its market value. You cannot invest directly in an index. |
| 2 | The Morgan Stanley Capital International (MSCI) All Country World Index (ACWI) ex USA Index (Net) is a free-float-adjusted market-capitalization-weighted index that is designed to measure the equity market performance of developed markets, excluding the United States and Canada. Source: MSCI. MSCI makes no express or implied warranties or representations and shall have no liability whatsoever with respect to any MSCI data contained herein. The MSCI data may not be further redistributed or used as a basis for other indices or any securities or financial products. This report is not approved, reviewed, or produced by MSCI. You cannot invest directly in an index. |
| 3 | The MSCI Emerging Markets (EM) Index (Net) is a free-float-adjusted market-capitalization-weighted index that is designed to measure large- and mid-cap equity market performance of emerging markets. The MSCI EM Index (Net) consists of the following 24 emerging market country indices: Brazil, Chile, China, Colombia, Czech Republic, Egypt, Greece, Hungary, India, Indonesia, Korea, Malaysia, Mexico, Pakistan, Peru, the Philippines, Poland, Qatar, Russia, South Africa, Taiwan, Thailand, Turkey, and the United Arab Emirates. You cannot invest directly in an index. |
| 4 | The Bloomberg Barclays U.S. Aggregate Bond Index is a broad-based benchmark that measures the investment-grade, U.S. dollar-denominated, fixed-rate taxable bond market, including Treasuries, government-related and corporate securities, mortgage-backed securities (agency fixed-rate and hybrid adjustable-rate mortgage pass-throughs), asset-backed securities, and commercial mortgage-backed securities. You cannot invest directly in an index. |
| 5 | The Bloomberg Barclays Global Aggregate ex-USD Index is an unmanaged index that provides a broad-based measure of the global investment-grade fixed-income markets excluding the U.S. dollar-denominated debt market. You cannot invest directly in an index. |
| 6 | The Bloomberg Barclays Municipal Bond Index is an unmanaged index composed of long-term tax-exempt bonds with a minimum credit rating of Baa. You cannot invest directly in an index. |
| 7 | The ICE BofAML U.S. High Yield Index is a market-capitalization-weighted index of domestic and Yankee high-yield bonds. The index tracks the performance of high-yield securities traded in the U.S. bond market. You cannot invest directly in an index. Copyright 2018. ICE Data Indices, LLC. All rights reserved. |
| 8 | The Consumer Price Index for All Urban Consumers (CPI-U) measures the changes in the price of a basket of goods and services purchased by urban consumers. The urban consumer population is deemed by many as a better representative measure of the general public because close to 90% of the country’s population lives in highly populated areas. You cannot invest directly in an index. |
| | | | | | |
| Letter to shareholders (unaudited) | | Wells Fargo Traditional Small Cap Growth Fund | | | 3 | |
U.S. stocks gained while international stocks and bonds declined during the summer of 2018.
The U.S. economy strengthened during the summer months. Revised second-quarter gross domestic product data released in August showed the U.S. economy growing at a 4.2% rate. After ticking up slightly in June, the unemployment rate in the U.S. was 3.9% in July and August, according to the U.S. Department of Labor. Wages showed more consistent growth, and consumer confidence remained strong.
Several U.S. equity market indices reached records during August, with the S&P 500 Index gaining 7.76% for the three-month period that ended August 31, 2018. International stock values continued to suffer under the effects of a strong U.S. dollar and continuing trade tensions. The MSCI ACWI ex USA Index (Net) and the MSCI EM Index (Net) were down 4.70% and 1.64%, during the same three-month period.
The U.S. Federal Reserve (Fed) increased the federal funds rate in June, and expectations grew that two more rate increases were in the offing in 2018. Long-term interest rates in the U.S. remained at higher levels relative to the prior 10 years. Rates on 10-year and 30-year Treasury bonds—2.74% and 2.97%, respectively, on March 31, 2018—were 3.05% and 3.19%, respectively, on September 30, off their peak levels on May 17, 2018, of 3.11% and 3.25%, respectively. Some investors became more aware of and concerned about the potential for an inverted yield curve—sometimes a recession signal—as short-term rates increased more quickly than long-term rates. The Fed decided to forgo an interest rate increase at its August meeting.
Internationally, members of Prime Minister Theresa May’s U.K./Brexit negotiating team resigned amid unproductive negotiations. In early August, the Bank of England’s Monetary Policy Committee increased its key interest rate to 0.75%. Central banks in Europe and Japan maintained low interest rates and accommodative monetary policies. Amid rising trade uncertainty, the People’s Bank of China cut reserve requirement ratios and accelerated infrastructure spending and tax cuts for business enterprises and individuals. Nevertheless, a strengthening U.S. dollar and the trade tensions remained headwinds for investors overseas.
Don’t let short-term uncertainty derail long-term investment goals.
Periods of investment uncertainty can present challenges, but experience has taught us that maintaining long-term investment goals can be an effective way to plan for the future. To help you create a sound strategy based on your personal goals and risk tolerance, Wells Fargo Funds offers more than 100 mutual funds spanning a wide range of asset classes and investment styles. Although diversification cannot guarantee an investment profit or prevent losses, we believe it can be an effective way to manage investment risk and potentially smooth out overall portfolio performance. We encourage investors to know their investments and to understand that appropriate levels of risk-taking may unlock opportunities.
The U.S. economy strengthened during the summer months.
| | | | |
| 4 | | Wells Fargo Traditional Small Cap Growth Fund | | Letter to shareholders (unaudited) |
Thank you for choosing to invest with Wells Fargo Funds. We appreciate your confidence in us and remain committed to helping you meet your financial needs.
Sincerely,

Andrew Owen
President
Wells Fargo Funds
Notice to shareholders
At a meeting held on August 14-15, 2018, the Board of Trustees of the Fund approved the following policy which will be effective on or about February 5, 2019:
Class C shares will convert automatically into Class A shares ten years after the initial date of purchase or, if you acquired your Class C shares through an exchange or conversion from another share class, ten years after the date you acquired your Class C shares. When Class C shares that you acquired through a purchase or exchange convert, any other Class C shares that you purchased with reinvested dividends and distributions also will convert into Class A shares on a pro rata basis. A shorter holding period may also apply depending on your intermediary. Please see “Appendix A—Sales Charge Reductions and Waivers for Certain Intermediaries” in the Fund’s prospectus or at the end of this report.
For further information about your Fund, contact your investment professional, visit our website at wellsfargofunds.com, or call us directly at 1-800-222-8222.
This page is intentionally left blank.
| | | | |
| 6 | | Wells Fargo Traditional Small Cap Growth Fund | | Performance highlights (unaudited) |
Investment objective
The Fund seeks long-term capital appreciation.
Manager
Wells Fargo Funds Management, LLC
Subadviser
Wells Capital Management Incorporated
Portfolio managers
Michael T. Smith, CFA®
Christopher J. Warner, CFA®
Average annual total returns (%) as of September 30, 20181
| | | | | | | | | | | | | | | | | | |
| | | | | Including sales charge | | Excluding sales charge | | Expense ratios2 (%) |
| | | Inception date | | 1 year | | 5 year | | 10 year | | 1 year | | 5 year | | 10 year | | Gross | | Net3 |
| Class A (EGWAX) | | 6-5-1995 | | 17.38 | | 8.74 | | 11.34 | | 24.56 | | 10.04 | | 11.99 | | 1.54 | | 1.25 |
| Class C (EGWCX) | | 7-30-2010 | | 22.63 | | 9.22 | | 11.16 | | 23.63 | | 9.22 | | 11.16 | | 2.29 | | 2.00 |
| Administrator Class (EGWDX) | | 7-30-2010 | | – | | – | | – | | 24.77 | | 10.23 | | 12.15 | | 1.46 | | 1.17 |
| Institutional Class (EGRYX) | | 11-19-1997 | | – | | – | | – | | 25.01 | | 10.42 | | 12.36 | | 1.21 | | 0.92 |
| Russell 2000® Growth Index4 | | – | | – | | – | | – | | 21.06 | | 12.14 | | 12.65 | | – | | – |
Figures quoted represent past performance, which is no guarantee of future results, and do not reflect taxes that a shareholder may pay on fund distributions or the redemption of fund shares. Investment return and principal value of an investment will fluctuate so that an investor’s shares, when redeemed, may be worth more or less than their original cost. Performance shown without sales charges would be lower if sales charges were reflected. Current performance may be lower or higher than the performance data quoted, which assumes the reinvestment of dividends and capital gains. Current month-end performance is available on the Fund’s website, wellsfargofunds.com.
Index returns do not include transaction costs associated with buying and selling securities, any mutual fund fees or expenses, or any taxes. It is not possible to invest directly in an index.
For Class A shares, the maximum front-end sales charge is 5.75%. For Class C shares, the maximum contingent deferred sales charge is 1.00%. Performance including a contingent deferred sales charge assumes the sales charge for the corresponding time period. Administrator Class and Institutional Class shares are sold without a front-end sales charge or contingent deferred sales charge.
Stock values fluctuate in response to the activities of individual companies and general market and economic conditions. Smaller-company stocks tend to be more volatile and less liquid than those of larger companies. Consult the Fund’s prospectus for additional information on these and other risks.
Please see footnotes on page 7.
| | | | | | |
| Performance highlights (unaudited) | | Wells Fargo Traditional Small Cap Growth Fund | | | 7 | |
| | | | |
| Ten largest holdings (%) as of September 30, 20185 | |
Envestnet Incorporated | | | 2.27 | |
Viper Energy Partners LP | | | 2.25 | |
Haemonetics Corporation | | | 2.13 | |
Globant SA | | | 2.02 | |
Adtalem Global Education Incorporated | | | 1.92 | |
WNS Holdings Limited ADR | | | 1.87 | |
Univar Incorporated | | | 1.82 | |
Insulet Corporation | | | 1.82 | |
Eldorado Resorts Incorporated | | | 1.80 | |
Ingevity Corporation | | | 1.80 | |
|
| Sector distribution as of September 30, 20186 |
|

|
| 1 | Historical performance shown for Class C shares prior to their inception reflects the performance of Class A shares and has been adjusted to reflect the higher expenses applicable to Class C shares. Historical performance shown for Administrator Class shares prior to their inception reflects the performance of Institutional Class shares and has been adjusted to reflect the higher expenses applicable to Administrator Class shares. Historical performance shown for all classes of the Fund prior to July 19, 2010, is based on the performance of the Fund’s predecessor, Evergreen Growth Fund. |
| 2 | Reflects the expense ratios as stated in the most recent prospectuses, which include the impact of 0.02% in acquired fund fees and expenses. The expense ratios shown are subject to change and may differ from the annualized expense ratios shown in the financial highlights of this report, which do not include acquired fund fees and expenses. |
| 3 | The manager has contractually committed through July 31, 2019, to waive fees and/or reimburse expenses to the extent necessary to cap the Fund’s Total Annual Fund Operating Expenses After Fee Waivers at 1.23% for Class A, 1.98% for Class C, 1.15% for Administrator Class, and 0.90% for Institutional Class. After this time, the cap may be increased or the commitment to maintain the cap may be terminated only with the approval of the Board of Trustees. Brokerage commissions, stamp duty fees, interest, taxes, acquired fund fees and expenses (if any), and extraordinary expenses are excluded from the expense cap. Without this cap, the Fund’s returns would have been lower. The expense ratio paid by an investor is the net expense ratio (the total annual fund operating expenses after fee waivers) as stated in the prospectuses. |
| 4 | The Russell 2000® Growth Index measures the performance of those Russell 2000 companies with higher price/book ratios and higher forecasted growth values. You cannot invest directly in an index. |
| 5 | The ten largest holdings, excluding cash, cash equivalents and any money market funds, are calculated based on the value of the investments divided by total net assets of the Fund. Holdings are subject to change and may have changed since the date specified. |
| 6 | Amounts are calculated based on the total long-term investments of the Fund. These amounts are subject to change and may have changed since the date specified. |
| | | | |
| 8 | | Wells Fargo Traditional Small Cap Growth Fund | | Fund expenses (unaudited) |
As a shareholder of the Fund, you incur two types of costs: (1) transaction costs, including sales charges (loads) on purchase payments and contingent deferred sales charges (if any) on redemptions and (2) ongoing costs, including management fees, distribution (12b-1) and/or shareholder servicing fees, and other Fund expenses. This example is intended to help you understand your ongoing costs (in dollars) of investing in the Fund and to compare these costs with the ongoing costs of investing in other mutual funds.
The example is based on an investment of $1,000 invested at the beginning of the six-month period and held for the entire period from April 1, 2018 to September 30, 2018.
Actual expenses
The “Actual” line of the table below provides information about actual account values and actual expenses. You may use the information in this line, together with the amount you invested, to estimate the expenses that you paid over the period. Simply divide your account value by $1,000 (for example, an $8,600 account value divided by $1,000 = 8.6), then multiply the result by the number in the “Actual” line under the heading entitled “Expenses paid during period” for your applicable class of shares to estimate the expenses you paid on your account during this period.
Hypothetical example for comparison purposes
The “Hypothetical” line of the table below provides information about hypothetical account values and hypothetical expenses based on the Fund’s actual expense ratio and an assumed rate of return of 5% per year before expenses, which is not the Fund’s actual return. The hypothetical account values and expenses may not be used to estimate the actual ending account balance or expenses you paid for the period. You may use this information to compare the ongoing costs of investing in the Fund and other funds. To do so, compare this 5% hypothetical example with the 5% hypothetical examples that appear in the shareholder reports of the other funds.
Please note that the expenses shown in the table are meant to highlight your ongoing costs only and do not reflect any transactional costs, such as sales charges (loads) and contingent deferred sales charges. Therefore, the “Hypothetical” line of the table is useful in comparing ongoing costs only and will not help you determine the relative total costs of owning different funds. In addition, if these transactional costs were included, your costs would have been higher.
| | | | | | | | | | | | | | | | |
| | | Beginning
account value
4-1-2018 | | | Ending
account value
9-30-2018 | | | Expenses
paid during
the period¹ | | | Annualized net
expense ratio | |
Class A | | | | | | | | | | | | | | | | |
Actual | | $ | 1,000.00 | | | $ | 1,195.82 | | | $ | 6.77 | | | | 1.23 | % |
Hypothetical (5% return before expenses) | | $ | 1,000.00 | | | $ | 1,018.90 | | | $ | 6.23 | | | | 1.23 | % |
Class C | | | | | | | | | | | | | | | | |
Actual | | $ | 1,000.00 | | | $ | 1,191.54 | | | $ | 10.88 | | | | 1.98 | % |
Hypothetical (5% return before expenses) | | $ | 1,000.00 | | | $ | 1,015.14 | | | $ | 10.00 | | | | 1.98 | % |
Administrator Class | | | | | | | | | | | | | | | | |
Actual | | $ | 1,000.00 | | | $ | 1,196.62 | | | $ | 6.33 | | | | 1.15 | % |
Hypothetical (5% return before expenses) | | $ | 1,000.00 | | | $ | 1,019.30 | | | $ | 5.82 | | | | 1.15 | % |
Institutional Class | | | | | | | | | | | | | | | | |
Actual | | $ | 1,000.00 | | | $ | 1,197.95 | | | $ | 4.96 | | | | 0.90 | % |
Hypothetical (5% return before expenses) | | $ | 1,000.00 | | | $ | 1,020.56 | | | $ | 4.56 | | | | 0.90 | % |
| 1 | Expenses paid is equal to the annualized net expense ratio of each class multiplied by the average account value over the period, multiplied by the number of days in the most recent fiscal half-year divided by the number of days in the fiscal year (to reflect the one-half-year period). |
| | | | | | |
| Portfolio of investments—September 30, 2018 (unaudited) | | Wells Fargo Traditional Small Cap Growth Fund | | | 9 | |
| | | | | | | | | | | | | | | | |
| Security name | | | | | | | | Shares | | | Value | |
| | | | |
Common Stocks: 96.85% | | | | | | | | | | | | | | | | |
| | | | |
Communication Services: 1.14% | | | | | | | | | | | | | | | | |
| | | | |
| Entertainment: 1.14% | | | | | | | | | | | | | | | | |
CD Projekt SA † | | | | | | | | | | | 24,054 | | | $ | 1,226,035 | |
| | | | | | | | | | | | | | | | |
| | | | |
Consumer Discretionary: 17.41% | | | | | | | | | | | | | | | | |
| | | | |
| Auto Components: 1.37% | | | | | | | | | | | | | | | | |
Stoneridge Incorporated † | | | | | | | | | | | 49,400 | | | | 1,468,168 | |
| | | | | | | | | | | | | | | | |
| | | | |
| Diversified Consumer Services: 5.10% | | | | | | | | | | | | | | | | |
Adtalem Global Education Incorporated † | | | | | | | | | | | 42,781 | | | | 2,062,044 | |
Bright Horizons Family Solutions Incorporated † | | | | | | | | | | | 14,983 | | | | 1,765,597 | |
Chegg Incorporated † | | | | | | | | | | | 37,633 | | | | 1,069,906 | |
Landcadia Holdings Incorporated † | | | | | | | | | | | 53,700 | | | | 582,108 | |
| | | | |
| | | | | | | | | | | | | | | 5,479,655 | |
| | | | | | | | | | | | | | | | |
| | | | |
| Hotels, Restaurants & Leisure: 6.08% | | | | | | | | | | | | | | | | |
Dave & Buster’s Entertainment Incorporated | | | | | | | | | | | 24,819 | | | | 1,643,514 | |
Eldorado Resorts Incorporated †« | | | | | | | | | | | 39,809 | | | | 1,934,717 | |
Hilton Grand Vacations Incorporated † | | | | | | | | | | | 41,162 | | | | 1,362,462 | |
Six Flags Entertainment Corporation « | | | | | | | | | | | 22,747 | | | | 1,588,196 | |
| | | | |
| | | | | | | | | | | | | | | 6,528,889 | |
| | | | | | | | | | | | | | | | |
| | | | |
| Household Durables: 1.17% | | | | | | | | | | | | | | | | |
Skyline Champion Corporation | | | | | | | | | | | 44,110 | | | | 1,260,223 | |
| | | | | | | | | | | | | | | | |
| | | | |
| Internet & Direct Marketing Retail: 2.52% | | | | | | | | | | | | | | | | |
Etsy Incorporated † | | | | | | | | | | | 27,048 | | | | 1,389,726 | |
Zooplus AG †« | | | | | | | | | | | 7,539 | | | | 1,310,348 | |
| | | | |
| | | | | | | | | | | | | | | 2,700,074 | |
| | | | | | | | | | | | | | | | |
| | | | |
| Leisure Products: 1.17% | | | | | | | | | | | | | | | | |
Games Workshop Group plc | | | | | | | | | | | 25,537 | | | | 1,259,835 | |
| | | | | | | | | | | | | | | | |
| | | | |
Consumer Staples: 4.03% | | | | | | | | | | | | | | | | |
| | | | |
| Beverages: 4.03% | | | | | | | | | | | | | | | | |
Boston Beer Company Incorporated Class A † | | | | | | | | | | | 4,994 | | | | 1,435,775 | |
Craft Brew Alliance Incorporated † | | | | | | | | | | | 75,490 | | | | 1,234,262 | |
National Beverage Corporation †« | | | | | | | | | | | 14,163 | | | | 1,651,689 | |
| | | | |
| | | | | | | | | | | | | | | 4,321,726 | |
| | | | | | | | | | | | | | | | |
| | | | |
Energy: 2.25% | | | | | | | | | | | | | | | | |
| | | | |
| Oil, Gas & Consumable Fuels: 2.25% | | | | | | | | | | | | | | | | |
Viper Energy Partners LP | | | | | | | | | | | 57,493 | | | | 2,420,455 | |
| | | | | | | | | | | | | | | | |
| | | | |
Financials: 2.05% | | | | | | | | | | | | | | | | |
| | | | |
| Consumer Finance: 1.30% | | | | | | | | | | | | | | | | |
SLM Corporation † | | | | | | | | | | | 125,251 | | | | 1,396,549 | |
| | | | | | | | | | | | | | | | |
The accompanying notes are an integral part of these financial statements.
| | | | |
| 10 | | Wells Fargo Traditional Small Cap Growth Fund | | Portfolio of investments—September 30, 2018 (unaudited) |
| | | | | | | | | | | | | | | | |
| Security name | | | | | | | | Shares | | | Value | |
| | | | |
| Diversified Financial Services: 0.75% | | | | | | | | | | | | | | | | |
Texas Pacific Land Trust | | | | | | | | | | | 930 | | | $ | 802,181 | |
| | | | | | | | | | | | | | | | |
| | | | |
Health Care: 24.42% | | | | | | | | | | | | | | | | |
| | | | |
| Biotechnology: 8.26% | | | | | | | | | | | | | | | | |
AnaptysBio Incorporated † | | | | | | | | | | | 7,451 | | | | 743,386 | |
Array BioPharma Incorporated † | | | | | | | | | | | 57,095 | | | | 867,844 | |
Avrobio Incorporated † | | | | | | | | | | | 8,826 | | | | 457,805 | |
CareDx Incorporated † | | | | | | | | | | | 31,097 | | | | 897,148 | |
Coherus Biosciences Incorporated † | | | | | | | | | | | 41,723 | | | | 688,430 | |
CRISPR Therapeutics AG † | | | | | | | | | | | 5,214 | | | | 231,241 | |
Deciphera Pharmaceuticals Incorporated † | | | | | | | | | | | 7,598 | | | | 294,195 | |
Editas Medicine Incorporated †« | | | | | | | | | | | 11,291 | | | | 359,280 | |
Flexion Therapeutics Incorporated †« | | | | | | | | | | | 47,704 | | | | 892,542 | |
Gritstone Oncology Incorporated † | | | | | | | | | | | 40,000 | | | | 600,000 | |
Halozyme Therapeutics Incorporated † | | | | | | | | | | | 36,600 | | | | 665,022 | |
Iovance Biotherapeutics Incorporated † | | | | | | | | | | | 35,028 | | | | 394,065 | |
KalVista Pharmaceuticals Incorporated † | | | | | | | | | | | 26,680 | | | | 589,895 | |
Mirati Therapeutics Incorporated † | | | | | | | | | | | 6,344 | | | | 298,802 | |
Tyme Technologies Incorporated † | | | | | | | | | | | 97,709 | | | | 271,631 | |
Vericel Corporation † | | | | | | | | | | | 43,598 | | | | 616,912 | |
| | | | |
| | | | | | | | | | | | | | | 8,868,198 | |
| | | | | | | | | | | | | | | | |
| | | | |
| Health Care Equipment & Supplies: 10.61% | | | | | | | | | | | | | | | | |
Avanos Medical Incorporated † | | | | | | | | | | | 18,831 | | | | 1,289,924 | |
BioLife Solutions Incorporated † | | | | | | | | | | | 74,400 | | | | 1,302,000 | |
Haemonetics Corporation † | | | | | | | | | | | 19,985 | | | | 2,289,881 | |
ICU Medical Incorporated † | | | | | | | | | | | 5,233 | | | | 1,479,631 | |
Insulet Corporation † | | | | | | | | | | | 18,484 | | | | 1,958,380 | |
iRhythm Technologies Incorporated † | | | | | | | | | | | 10,739 | | | | 1,016,554 | |
Orthopediatrics Corporation †« | | | | | | | | | | | 29,730 | | | | 1,089,307 | |
Sientra Incorporated † | | | | | | | | | | | 40,504 | | | | 967,236 | |
| | | | |
| | | | | | | | | | | | | | | 11,392,913 | |
| | | | | | | | | | | | | | | | |
| | | | |
| Health Care Providers & Services: 2.24% | | | | | | | | | | | | | | | | |
Amedisys Incorporated † | | | | | | | | | | | 10,215 | | | | 1,276,466 | |
RadNet Incorporated † | | | | | | | | | | | 75,029 | | | | 1,129,186 | |
| | | | |
| | | | | | | | | | | | | | | 2,405,652 | |
| | | | | | | | | | | | | | | | |
| | | | |
| Health Care Technology: 0.62% | | | | | | | | | | | | | | | | |
Inspire Medical Systems Incorporated † | | | | | | | | | | | 15,841 | | | | 666,589 | |
| | | | | | | | | | | | | | | | |
| | | | |
| Pharmaceuticals: 2.69% | | | | | | | | | | | | | | | | |
Assembly Biosciences Incorporated † | | | | | | | | | | | 9,228 | | | | 342,728 | |
Endocyte Incorporated † | | | | | | | | | | | 35,659 | | | | 633,304 | |
GW Pharmaceuticals plc ADR † | | | | | | | | | | | 3,600 | | | | 621,864 | |
MyoKardia Incorporated † | | | | | | | | | | | 10,565 | | | | 688,838 | |
Wave Life Sciences Limited † | | | | | | | | | | | 12,128 | | | | 606,400 | |
| | | | |
| | | | | | | | | | | | | | | 2,893,134 | |
| | | | | | | | | | | | | | | | |
The accompanying notes are an integral part of these financial statements.
| | | | | | |
| Portfolio of investments—September 30, 2018 (unaudited) | | Wells Fargo Traditional Small Cap Growth Fund | | | 11 | |
| | | | | | | | | | | | | | | | |
| Security name | | | | | | | | Shares | | | Value | |
| | | | |
Industrials: 18.18% | | | | | | | | | | | | | | | | |
| | | | |
| Aerospace & Defense: 2.84% | | | | | | | | | | | | | | | | |
Aerojet Rocketdyne Holdings † | | | | | | | | | | | 43,265 | | | $ | 1,470,577 | |
Mercury Computer Systems Incorporated † | | | | | | | | | | | 28,462 | | | | 1,574,518 | |
| | | | |
| | | | | | | | | | | | | | | 3,045,095 | |
| | | | | | | | | | | | | | | | |
| | | | |
| Airlines: 1.11% | | | | | | | | | | | | | | | | |
Spirit Airlines Incorporated † | | | | | | | | | | | 25,296 | | | | 1,188,153 | |
| | | | | | | | | | | | | | | | |
| | | | |
| Commercial Services & Supplies: 5.70% | | | | | | | | | | | | | | | | |
Casella Waste Systems Incorporated Class A † | | | | | | | | | | | 60,793 | | | | 1,888,231 | |
Mobile Mini Incorporated | | | | | | | | | | | 31,900 | | | | 1,398,815 | |
MSA Safety Incorporated | | | | | | | | | | | 15,788 | | | | 1,680,475 | |
The Brink’s Company | | | | | | | | | | | 16,572 | | | | 1,155,897 | |
| | | | |
| | | | | | | | | | | | | | | 6,123,418 | |
| | | | | | | | | | | | | | | | |
| | | | |
| Construction & Engineering: 1.77% | | | | | | | | | | | | | | | | |
WillScot Corporation †« | | | | | | | | | | | 110,975 | | | | 1,903,221 | |
| | | | | | | | | | | | | | | | |
| | | | |
| Machinery: 1.61% | | | | | | | | | | | | | | | | |
Energy Recovery Incorporated †« | | | | | | | | | | | 61,022 | | | | 546,147 | |
Evoqua Water Technologies Company † | | | | | | | | | | | 66,589 | | | | 1,183,952 | |
| | | | |
| | | | | | | | | | | | | | | 1,730,099 | |
| | | | | | | | | | | | | | | | |
| | | | |
| Road & Rail: 1.77% | | | | | | | | | | | | | | | | |
Saia Incorporated † | | | | | | | | | | | 24,874 | | | | 1,901,617 | |
| | | | | | | | | | | | | | | | |
| | | | |
| Trading Companies & Distributors: 3.38% | | | | | | | | | | | | | | | | |
SiteOne Landscape Supply Incorporated † | | | | | | | | | | | 22,166 | | | | 1,669,986 | |
Univar Incorporated † | | | | | | | | | | | 63,879 | | | | 1,958,530 | |
| | | | |
| | | | | | | | | | | | | | | 3,628,516 | |
| | | | | | | | | | | | | | | | |
| | | | |
Information Technology: 25.57% | | | | | | | | | | | | | | | | |
| | | | |
| Electronic Equipment, Instruments & Components: 2.38% | | | | | | | | | | | | | | | | |
Littelfuse Incorporated | | | | | | | | | | | 7,060 | | | | 1,397,103 | |
Novanta Incorporated † | | | | | | | | | | | 17,040 | | | | 1,165,536 | |
| | | | |
| | | | | | | | | | | | | | | 2,562,639 | |
| | | | | | | | | | | | | | | | |
| | | | |
| IT Services: 8.18% | | | | | | | | | | | | | | | | |
EPAM Systems Incorporated † | | | | | | | | | | | 12,455 | | | | 1,715,054 | |
Euronet Worldwide Incorporated † | | | | | | | | | | | 13,811 | | | | 1,384,138 | |
GreenSky Incorporated Class A † | | | | | | | | | | | 34,126 | | | | 614,268 | |
Keywords Studios plc | | | | | | | | | | | 53,976 | | | | 1,371,871 | |
WEX Incorporated † | | | | | | | | | | | 8,424 | | | | 1,691,202 | |
WNS Holdings Limited ADR † | | | | | | | | | | | 39,523 | | | | 2,005,792 | |
| | | | |
| | | | | | | | | | | | | | | 8,782,325 | |
| | | | | | | | | | | | | | | | |
| | | | |
| Semiconductors & Semiconductor Equipment: 0.76% | | | | | | | | | | | | | | | | |
Universal Display Corporation « | | | | | | | | | | | 6,929 | | | | 816,929 | |
| | | | | | | | | | | | | | | | |
The accompanying notes are an integral part of these financial statements.
| | | | |
| 12 | | Wells Fargo Traditional Small Cap Growth Fund | | Portfolio of investments—September 30, 2018 (unaudited) |
| | | | | | | | | | | | | | | | |
| Security name | | | | | | | | Shares | | | Value | |
| | | | |
| Software: 12.72% | | | | | | | | | | | | | | | | |
2U Incorporated † | | | | | | | | | | | 13,675 | | | $ | 1,028,223 | |
Bottomline Technologies (de) Incorporated † | | | | | | | | | | | 22,772 | | | | 1,655,752 | |
Envestnet Incorporated † | | | | | | | | | | | 39,965 | | | | 2,435,867 | |
Globant SA † | | | | | | | | | | | 36,772 | | | | 2,169,180 | |
LivePerson Incorporated † | | | | | | | | | | | 41,221 | | | | 1,069,685 | |
MINDBODY Incorporated Class A † | | | | | | | | | | | 43,094 | | | | 1,751,771 | |
Model N Incorporated † | | | | | | | | | | | 61,067 | | | | 967,912 | |
Proofpoint Incorporated † | | | | | | | | | | | 8,455 | | | | 899,020 | |
SendGrid Incorporated † | | | | | | | | | | | 45,691 | | | | 1,680,972 | |
| | | | |
| | | | | | | | | | | | | | | 13,658,382 | |
| | | | | | | | | | | | | | | | |
| | | | |
| Technology Hardware, Storage & Peripherals: 1.53% | | | | | | | | | | | | | | | | |
NCR Corporation † | | | | | | | | | | | 47,273 | | | | 1,343,026 | |
USA Technologies Incorporated † | | | | | | | | | | | 41,451 | | | | 298,447 | |
| | | | |
| | | | | | | | | | | | | | | 1,641,473 | |
| | | | | | | | | | | | | | | | |
| | | | |
Materials: 1.80% | | | | | | | | | | | | | | | | |
| | | | |
| Chemicals: 1.80% | | | | | | | | | | | | | | | | |
Ingevity Corporation † | | | | | | | | | | | 18,980 | | | | 1,933,682 | |
| | | | | | | | | | | | | | | | |
| | | | |
Total Common Stocks (Cost $85,905,706) | | | | | | | | | | | | | | | 104,005,825 | |
| | | | | | | | | | | | | | | | |
| | | | |
| | | Yield | | | | | | | | | | |
| Short-Term Investments: 10.12% | | | | | | | | | | | | | | | | |
| | | | |
| Investment Companies: 10.12% | | | | | | | | | | | | | | | | |
Securities Lending Cash Investment LLC (l)(r)(u) | | | 2.17 | % | | | | | | | 8,492,773 | | | | 8,493,622 | |
Wells Fargo Government Money Market Fund Select Class (l)(u) | | | 1.99 | | | | | | | | 2,367,984 | | | | 2,367,984 | |
| | | | |
Total Short-Term Investments (Cost $10,861,606) | | | | | | | | | | | | | | | 10,861,606 | |
| | | | | | | | | | | | | | | | |
| | | | | | | | |
| Total investments in securities (Cost $96,767,312) | | | 106.97 | % | | | 114,867,431 | |
Other assets and liabilities, net | | | (6.97 | ) | | | (7,482,955 | ) |
| | | | | | | | |
| Total net assets | | | 100.00 | % | | $ | 107,384,476 | |
| | | | | | | | |
| † | Non-income-earning security |
| « | All or a portion of this security is on loan. |
| (l) | The issuer of the security is an affiliated person of the Fund as defined in the Investment Company Act of 1940. |
| (r) | The investment is a non-registered investment company purchased with cash collateral received from securities on loan. |
| (u) | The rate represents the 7-day annualized yield at period end. |
Abbreviations:
| ADR | American depositary receipt |
The accompanying notes are an integral part of these financial statements.
| | | | | | |
| Portfolio of investments—September 30, 2018 (unaudited) | | Wells Fargo Traditional Small Cap Growth Fund | | | 13 | |
Investments in Affiliates
An affiliated investment is an investment in which the Fund owns at least 5% of the outstanding voting shares of the issuer or as a result of other relationships, such as the Fund and the issuer having the same investment manager. Transactions with issuers that were either affiliated persons of the Fund at the beginning of the period or the end of the period were as follows:
| | | | | | | | | | | | | | | | | | | | | | | | | | | | | | | | | | | | |
| | | Shares,
beginning of
period | | | Shares
purchased | | | Shares
sold | | | Shares,
end of
period | | | Net
realized
gains
(losses) | | | Net
change in
unrealized
gains
(losses) | | | Income
from
affiliated
securities | | | Value,
end
of period | | | % of
net
assets | |
Short-Term Investments | | | | | | | | | | | | | | | | | | | | | | | | | | | | | | | | | | | | |
Investment Companies | | | | | | | | | | | | | | | | | | | | | | | | | | | | | | | | | | | | |
Securities Lending Cash Investment LLC | | | 10,521,186 | | | | 43,024,484 | | | | 45,052,897 | | | | 8,492,773 | | | $ | 689 | | | $ | 0 | | | $ | 57,780 | | | $ | 8,493,622 | | | | | |
Wells Fargo Government Money Market Fund Select Class | | | 870,700 | | | | 25,989,964 | | | | 24,492,680 | | | | 2,367,984 | | | | 0 | | | | 0 | | | | 25,179 | | | | 2,367,984 | | | | | |
| | | | | | | | | | | | | | | | | | | | | | | | | | | | | | | | | | | | |
| | | | | | | | | | | | | | | | | | $ | 689 | | | $ | 0 | | | $ | 82,959 | | | $ | 10,861,606 | | | | 10.12 | % |
| | | | | | | | | | | | | | | | | | | | | | | | | | | | | | | | | | | | |
The accompanying notes are an integral part of these financial statements.
| | | | |
| 14 | | Wells Fargo Traditional Small Cap Growth Fund | | Statement of assets and liabilities—September 30, 2018 (unaudited) |
| | | | |
| | | | |
| |
Assets | | | | |
Investments in unaffiliated securities (including $8,216,597 of securities loaned), at value (cost $85,905,706) | | $ | 104,005,825 | |
Investments in affiliated securities, at value (cost $10,861,606) | | | 10,861,606 | |
Foreign currency, at value (cost $334) | | | 334 | |
Receivable for investments sold | | | 1,660,675 | |
Receivable for Fund shares sold | | | 1,554 | |
Receivable for dividends | | | 23,440 | |
Receivable for securities lending income | | | 11,720 | |
Prepaid expenses and other assets | | | 51,915 | |
| | | | |
Total assets | | | 116,617,069 | |
| | | | |
| |
Liabilities | | | | |
Payable upon receipt of securities loaned | | | 8,491,945 | |
Payable for investments purchased | | | 600,000 | |
Management fee payable | | | 53,063 | |
Payable for Fund shares redeemed | | | 19,656 | |
Administration fees payable | | | 18,107 | |
Trustees’ fees and expenses payable | | | 1,985 | |
Distribution fee payable | | | 229 | |
Accrued expenses and other liabilities | | | 47,608 | |
| | | | |
Total liabilities | | | 9,232,593 | |
| | | | |
Total net assets | | $ | 107,384,476 | |
| | | | |
| |
NET ASSETS CONSIST OF | | | | |
Paid-in capital | | $ | 63,922,774 | |
Total distributable earnings | | | 43,461,702 | |
| | | | |
Total net assets | | $ | 107,384,476 | |
| | | | |
| |
COMPUTATION OF NET ASSET VALUE AND OFFERING PRICE PER SHARE | | | | |
Net assets – Class A | | $ | 96,000,009 | |
Shares outstanding – Class A1 | | | 5,240,377 | |
Net asset value per share – Class A | | | $18.32 | |
Maximum offering price per share – Class A2 | | | $19.44 | |
Net assets – Class C | | $ | 383,467 | |
Shares outstanding – Class C1 | | | 23,084 | |
Net asset value per share – Class C | | | $16.61 | |
Net assets – Administrator Class | | $ | 146,483 | |
Shares outstanding – Administrator Class1 | | | 7,142 | |
Net asset value per share – Administrator Class | | | $20.51 | |
Net assets – Institutional Class | | $ | 10,854,517 | |
Shares outstanding – Institutional Class1 | | | 516,907 | |
Net asset value per share – Institutional Class | | | $21.00 | |
| 1 | The Fund has an unlimited number of authorized shares. |
| 2 | Maximum offering price is computed as 100/94.25 of net asset value. On investments of $50,000 or more, the offering price is reduced. |
The accompanying notes are an integral part of these financial statements.
| | | | | | |
| Statement of operations—six months ended September 30, 2018 (unaudited) | | Wells Fargo Traditional Small Cap Growth Fund | | | 15 | |
| | | | |
| | | | |
| |
Investment income | | | | |
Dividends | | $ | 159,448 | |
Securities lending income from affiliates, net | | | 57,780 | |
Income from affiliated securities | | | 25,179 | |
| | | | |
Total investment income | | | 242,407 | |
| | | | |
| |
Expenses | | | | |
Management fee | | | 436,004 | |
Administration fees | |
Class A | | | 96,557 | |
Class C | | | 318 | |
Administrator Class | | | 88 | |
Institutional Class | | | 6,626 | |
Shareholder servicing fees | |
Class A | | | 114,948 | |
Class C | | | 378 | |
Administrator Class | | | 168 | |
Distribution fee | |
Class C | | | 1,136 | |
Custody and accounting fees | | | 4,029 | |
Professional fees | | | 26,186 | |
Registration fees | | | 31,319 | |
Shareholder report expenses | | | 21,952 | |
Trustees’ fees and expenses | | | 10,972 | |
Other fees and expenses | | | 4,460 | |
| | | | |
Total expenses | | | 755,141 | |
Less: Fee waivers and/or expense reimbursements | | | (139,954 | ) |
| | | | |
Net expenses | | | 615,187 | |
| | | | |
Net investment loss | | | (372,780 | ) |
| | | | |
| |
REALIZED AND UNREALIZED GAINS (LOSSES) ON INVESTMENTS | | | | |
|
Net realized gains on: | |
Unaffiliated securities | | | 22,149,917 | |
Affiliated securities | | | 689 | |
| | | | |
Net realized gains on investments | | | 22,150,606 | |
Net change in unrealized gains (losses) on investments | | | (3,559,026 | ) |
| | | | |
Net realized and unrealized gains (losses) on investments | | | 18,591,580 | |
| | | | |
Net increase in net assets resulting from operations | | $ | 18,218,800 | |
| | | | |
The accompanying notes are an integral part of these financial statements.
| | | | |
| 16 | | Wells Fargo Traditional Small Cap Growth Fund | | Statement of changes in net assets |
| | | | | | | | | | | | | | | | |
| | | Six months ended
September 30, 2018
(unaudited) | | | Year ended
March 31, 20181 | |
| |
Operations | | | | | |
Net investment loss | | | | | | $ | (372,780 | ) | | | | | | $ | (710,379 | ) |
Net realized gains on investments | | | | | | | 22,150,606 | | | | | | | | 6,532,249 | |
Net change in unrealized gains (losses) on investments | | | | | | | (3,559,026 | ) | | | | | | | 8,067,432 | |
| | | | |
Net increase in net assets resulting from operations | | | | | | | 18,218,800 | | | | | | | | 13,889,302 | |
| | | | |
| |
Distributions to shareholders | | | | | |
Class A | | | | | | | 0 | | | | | | | | (5,360,360 | ) |
Class C | | | | | | | 0 | | | | | | | | (16,142 | ) |
Administrator Class | | | | | | | 0 | | | | | | | | (7,844 | ) |
Institutional Class | | | | | | | 0 | | | | | | | | (468,228 | ) |
| | | | |
Total distributions to shareholders | | | | | | | 0 | | | | | | | | (5,852,574 | ) |
| | | | |
| | | | |
Capital share transactions | | | Shares | | | | | | | | Shares | | | | | |
Proceeds from shares sold | |
Class A | | | 73,293 | | | | 1,249,411 | | | | 100,773 | | | | 1,525,252 | |
Class C | | | 6,352 | | | | 102,469 | | | | 3,801 | | | | 52,022 | |
Administrator Class | | | 2,464 | | | | 44,433 | | | | 6,799 | | | | 114,428 | |
Institutional Class | | | 97,021 | | | | 1,828,225 | | | | 85,364 | | | | 1,472,577 | |
| | | | |
| | | | | | | 3,224,538 | | | | | | | | 3,164,279 | |
| | | | |
Reinvestment of distributions | |
Class A | | | 0 | | | | 0 | | | | 352,388 | | | | 5,243,537 | |
Class C | | | 0 | | | | 0 | | | | 975 | | | | 13,232 | |
Administrator Class | | | 0 | | | | 0 | | | | 362 | | | | 6,032 | |
Institutional Class | | | 0 | | | | 0 | | | | 26,092 | | | | 443,822 | |
| | | | |
| | | | | | | 0 | | | | | | | | 5,706,623 | |
| | | | |
Payment for shares redeemed | |
Class A | | | (364,160 | ) | | | (6,306,097 | ) | | | (795,898 | ) | | | (11,972,813 | ) |
Class C | | | (2,896 | ) | | | (42,929 | ) | | | (2,471 | ) | | | (34,576 | ) |
Administrator Class | | | (3,057 | ) | | | (52,436 | ) | | | (10,531 | ) | | | (172,453 | ) |
Institutional Class | | | (86,516 | ) | | | (1,679,682 | ) | | | (107,067 | ) | | | (1,838,265 | ) |
| | | | |
| | | | | | | (8,081,144 | ) | | | | | | | (14,018,107 | ) |
| | | | |
Net decrease in net assets resulting from capital share transactions | | | | | | | (4,856,606 | ) | | | | | | | (5,147,205 | ) |
| | | | |
Total increase in net assets | | | | | | | 13,362,194 | | | | | | | | 2,889,523 | |
| | | | |
| | |
Net assets | | | | | | | | |
Beginning of period | | | | | | | 94,022,282 | | | | | | | | 91,132,759 | |
| | | | |
End of period | | | | | | $ | 107,384,476 | | | | | | | $ | 94,022,282 | |
| | | | |
| 1 | Effective for all filings after November 4, 2018, the SEC prospectively eliminated the requirements to parenthetically disclose undistributed net investment income at the end of the period and to disaggregate distributions to shareholders between distributions from net investment income and distributions from realized gains. Accumulated net investment loss at March 31, 2018 was $73,600. The disaggregated distributions information for the year ended March 31, 2018 is included in Note 7, Distributions to Shareholders, in the notes to the financial statements. |
The accompanying notes are an integral part of these financial statements.
| | | | | | |
| Financial highlights | | Wells Fargo Traditional Small Cap Growth Fund | | | 17 | |
(For a share outstanding throughout each period)
| | | | | | | | | | | | | | | | | | | | | | | | | | | | |
| | | Six months ended
September 30, 2018
(unaudited) | | | Year ended March 31 | | | Year ended
October 31, 2013 | |
| CLASS A | | 2018 | | | 2017 | | | 2016 | | | 2015 | | | 20141 | |
Net asset value, beginning of period | | | $15.32 | | | | $14.08 | | | | $12.05 | | | | $18.04 | | | | $20.37 | | | | $23.11 | | | | $17.08 | |
Net investment loss | | | (0.06 | )2 | | | (0.12 | )2 | | | (0.10 | )2 | | | (0.12 | )2 | | | (0.18 | ) | | | (0.09 | )2 | | | (0.11 | ) 2 |
Net realized and unrealized gains (losses) on investments | | | 3.06 | | | | 2.35 | | | | 2.51 | | | | (2.13 | ) | | | 1.33 | | | | 0.96 | | | | 6.34 | |
| | | | | | | | | | | | | | | | | | | | | | | | | | | | |
Total from investment operations | | | 3.00 | | | | 2.23 | | | | 2.41 | | | | (2.25 | ) | | | 1.15 | | | | 0.87 | | | | 6.23 | |
Distributions to shareholders from | | | | | | | | | | | | | | | | | | | | | | | | | | | | |
Net realized gains | | | 0.00 | | | | (0.99 | ) | | | (0.38 | ) | | | (3.74 | ) | | | (3.48 | ) | | | (3.61 | ) | | | (0.20 | ) |
Net asset value, end of period | | | $18.32 | | | | $15.32 | | | | $14.08 | | | | $12.05 | | | | $18.04 | | | | $20.37 | | | | $23.11 | |
Total return3 | | | 19.58 | % | | | 16.08 | % | | | 20.10 | % | | | (12.86 | )% | | | 6.77 | % | | | 4.14 | % | | | 36.98 | % |
Ratios to average net assets (annualized) | | | | | | | | | | | | | | | | | | | | | | | | | | | | |
Gross expenses | | | 1.50 | % | | | 1.52 | % | | | 1.51 | % | | | 1.50 | % | | | 1.47 | % | | | 1.54 | % | | | 1.48 | % |
Net expenses | | | 1.23 | % | | | 1.33 | % | | | 1.33 | % | | | 1.33 | % | | | 1.33 | % | | | 1.33 | % | | | 1.33 | % |
Net investment loss | | | (0.76 | )% | | | (0.79 | )% | | | (0.77 | )% | | | (0.74 | )% | | | (0.87 | )% | | | (1.04 | )% | | | (0.58 | )% |
Supplemental data | | | | | | | | | | | | | | | | | | | | | | | | | | | | |
Portfolio turnover rate | | | 120 | % | | | 44 | % | | | 113 | % | | | 123 | % | | | 73 | % | | | 36 | % | | | 77 | % |
Net assets, end of period (000s omitted) | | | $96,000 | | | | $84,738 | | | | $82,734 | | | | $84,139 | | | | $123,712 | | | | $141,446 | | | | $141,933 | |
| 1 | For the five months ended March 31, 2014. The Fund changed its fiscal year end from October 31 to March 31, effective March 31, 2014. |
| 2 | Calculated based upon average shares outstanding |
| 3 | Total return calculations do not include any sales charges. Returns for periods of less than one year are not annualized. |
The accompanying notes are an integral part of these financial statements.
| | | | |
| 18 | | Wells Fargo Traditional Small Cap Growth Fund | | Financial highlights |
(For a share outstanding throughout each period)
| | | | | | | | | | | | | | | | | | | | | | | | | | | | |
| | | Six months ended
September 30, 2018
(unaudited) | | | Year ended March 31 | | | Year ended
October 31, 2013 | |
| CLASS C | | 2018 | | | 2017 | | | 2016 | | | 2015 | | | 20141 | |
Net asset value, beginning of period | | | $13.94 | | | | $12.99 | | | | $11.22 | | | | $17.21 | | | | $19.73 | | | | $22.56 | | | | $16.80 | |
Net investment loss | | | (0.12 | )2 | | | (0.21 | )2 | | | (0.18 | )2 | | | (0.18 | ) | | | (0.29 | )2 | | | (0.15 | )2 | | | (0.26 | ) |
Net realized and unrealized gains (losses) on investments | | | 2.79 | | | | 2.15 | | | | 2.33 | | | | (2.07 | ) | | | 1.25 | | | | 0.93 | | | | 6.22 | |
| | | | | | | | | | | | | | | | | | | | | | | | | | | | |
Total from investment operations | | | 2.67 | | | | 1.94 | | | | 2.15 | | | | (2.25 | ) | | | 0.96 | | | | 0.78 | | | | 5.96 | |
Distributions to shareholders from | | | | | | | | | | | | | | | | | | | | | | | | | | | | |
Net realized gains | | | 0.00 | | | | (0.99 | ) | | | (0.38 | ) | | | (3.74 | ) | | | (3.48 | ) | | | (3.61 | ) | | | (0.20 | ) |
Net asset value, end of period | | | $16.61 | | | | $13.94 | | | | $12.99 | | | | $11.22 | | | | $17.21 | | | | $19.73 | | | | $22.56 | |
Total return3 | | | 19.15 | % | | | 15.17 | % | | | 19.26 | % | | | (13.55 | )% | | | 5.98 | % | | | 3.85 | % | | | 35.92 | % |
Ratios to average net assets (annualized) | | | | | | | | | | | | | | | | | | | | | | | | | | | | |
Gross expenses | | | 2.25 | % | | | 2.27 | % | | | 2.26 | % | | | 2.25 | % | | | 2.22 | % | | | 2.30 | % | | | 2.23 | % |
Net expenses | | | 1.98 | % | | | 2.08 | % | | | 2.08 | % | | | 2.08 | % | | | 2.08 | % | | | 2.08 | % | | | 2.08 | % |
Net investment loss | | | (1.50 | )% | | | (1.54 | )% | | | (1.52 | )% | | | (1.49 | )% | | | (1.61 | )% | | | (1.81 | )% | | | (1.36 | )% |
Supplemental data | | | | | | | | | | | | | | | | | | | | | | | | | | | | |
Portfolio turnover rate | | | 120 | % | | | 44 | % | | | 113 | % | | | 123 | % | | | 73 | % | | | 36 | % | | | 77 | % |
Net assets, end of period (000s omitted) | | | $383 | | | | $274 | | | | $225 | | | | $162 | | | | $232 | | | | $403 | | | | $150 | |
| 1 | For the five months ended March 31, 2014. The Fund changed its fiscal year end from October 31 to March 31, effective March 31, 2014. |
| 2 | Calculated based upon average shares outstanding |
| 3 | Total return calculations do not include any sales charges. Returns for periods of less than one year are not annualized. |
The accompanying notes are an integral part of these financial statements.
| | | | | | |
| Financial highlights | | Wells Fargo Traditional Small Cap Growth Fund | | | 19 | |
(For a share outstanding throughout each period)
| | | | | | | | | | | | | | | | | | | | | | | | | | | | |
| | | Six months ended
September 30, 2018
(unaudited) | | | Year ended March 31 | | | Year ended
October 31, 2013 | |
| ADMINISTRATOR CLASS | | 2018 | | | 2017 | | | 2016 | | | 2015 | | | 20141 | |
Net asset value, beginning of period | | | $17.14 | | | | $15.63 | | | | $13.29 | | | | $19.44 | | | | $21.65 | | | | $24.33 | | | | $17.94 | |
Net investment loss | | | (0.06 | )2 | | | (0.11 | )2 | | | (0.09 | )2 | | | (0.10 | )2 | | | (0.15 | )2 | | | (0.08 | )2 | | | (0.09 | )2 |
Net realized and unrealized gains (losses) on investments | | | 3.43 | | | | 2.61 | | | | 2.81 | | | | (2.31 | ) | | | 1.42 | | | | 1.01 | | | | 6.68 | |
| | | | | | | | | | | | | | | | | | | | | | | | | | | | |
Total from investment operations | | | 3.37 | | | | 2.50 | | | | 2.72 | | | | (2.41 | ) | | | 1.27 | | | | 0.93 | | | | 6.59 | |
Distributions to shareholders from | | | | | | | | | | | | | | | | | | | | | | | | | | | | |
Net realized gains | | | 0.00 | | | | (0.99 | ) | | | (0.38 | ) | | | (3.74 | ) | | | (3.48 | ) | | | (3.61 | ) | | | (0.20 | ) |
Net asset value, end of period | | | $20.51 | | | | $17.14 | | | | $15.63 | | | | $13.29 | | | | $19.44 | | | | $21.65 | | | | $24.33 | |
Total return3 | | | 19.66 | % | | | 16.21 | % | | | 20.56 | % | | | (12.76 | )% | | | 6.93 | % | | | 4.18 | % | | | 37.21 | % |
Ratios to average net assets (annualized) | | | | | | | | | | | | | | | | | | | | | | | | | | | | |
Gross expenses | | | 1.43 | % | | | 1.44 | % | | | 1.43 | % | | | 1.39 | % | | | 1.29 | % | | | 1.32 | % | | | 1.26 | % |
Net expenses | | | 1.15 | % | | | 1.20 | % | | | 1.20 | % | | | 1.20 | % | | | 1.19 | % | | | 1.19 | % | | | 1.17 | % |
Net investment loss | | | (0.68 | )% | | | (0.66 | )% | | | (0.64 | )% | | | (0.61 | )% | | | (0.73 | )% | | | (0.90 | )% | | | (0.43 | )% |
Supplemental data | | | | | | | | | | | | | | | | | | | | | | | | | | | | |
Portfolio turnover rate | | | 120 | % | | | 44 | % | | | 113 | % | | | 123 | % | | | 73 | % | | | 36 | % | | | 77 | % |
Net assets, end of period (000s omitted) | | | $146 | | | | $133 | | | | $174 | | | | $2,413 | | | | $3,128 | | | | $3,896 | | | | $3,882 | |
| 1 | For the five months ended March 31, 2014. The Fund changed its fiscal year end from October 31 to March 31, effective March 31, 2014. |
| 2 | Calculated based upon average shares outstanding |
| 3 | Returns for periods of less than one year are not annualized. |
The accompanying notes are an integral part of these financial statements.
| | | | |
| 20 | | Wells Fargo Traditional Small Cap Growth Fund | | Financial highlights |
(For a share outstanding throughout each period)
| | | | | | | | | | | | | | | | | | | | | | | | | | | | |
| | | Six months ended
September 30, 2018
(unaudited) | | | Year ended March 31 | | | Year ended
October 31, 2013 | |
| INSTITUTIONAL CLASS | | 2018 | | | 2017 | | | 2016 | | | 2015 | | | 20141 | |
Net asset value, beginning of period | | | $17.53 | | | | $15.94 | | | | $13.54 | | | | $19.69 | | | | $21.84 | | | | $24.50 | | | | $18.03 | |
Net investment income (loss) | | | (0.04 | )2 | | | (0.08 | )2 | | | (0.06 | )2 | | | (0.07 | )2 | | | (0.11 | )2 | | | (0.07 | )2 | | | 0.00 | 2,3 |
Net realized and unrealized gains (losses) on investments | | | 3.51 | | | | 2.66 | | | | 2.84 | | | | (2.34 | ) | | | 1.44 | | | | 1.02 | | | | 6.67 | |
| | | | | | | | | | | | | | | | | | | | | | | | | | | | |
Total from investment operations | | | 3.47 | | | | 2.58 | | | | 2.78 | | | | (2.41 | ) | | | 1.33 | | | | 0.95 | | | | 6.67 | |
Distributions to shareholders from | | | | | | | | | | | | | | | | | | | | | | | | | | | | |
Net realized gains | | | 0.00 | | | | (0.99 | ) | | | (0.38 | ) | | | (3.74 | ) | | | (3.48 | ) | | | (3.61 | ) | | | (0.20 | ) |
Net asset value, end of period | | | $21.00 | | | | $17.53 | | | | $15.94 | | | | $13.54 | | | | $19.69 | | | | $21.84 | | | | $24.50 | |
Total return4 | | | 19.79 | % | | | 16.40 | % | | | 20.62 | % | | | (12.58 | )% | | | 7.16 | % | | | 4.29 | % | | | 37.42 | % |
Ratios to average net assets (annualized) | | | | | | | | | | | | | | | | | | | | | | | | | | | | |
Gross expenses | | | 1.17 | % | | | 1.19 | % | | | 1.18 | % | | | 1.14 | % | | | 1.04 | % | | | 1.10 | % | | | 1.04 | % |
Net expenses | | | 0.90 | % | | | 0.98 | % | | | 0.98 | % | | | 0.98 | % | | | 0.98 | % | | | 0.98 | % | | | 0.98 | % |
Net investment income (loss) | | | (0.43 | )% | | | (0.44 | )% | | | (0.43 | )% | | | (0.39 | )% | | | (0.52 | )% | | | (0.69 | )% | | | 0.01 | % |
Supplemental data | | | | | | | | | | | | | | | | | | | | | | | | | | | | |
Portfolio turnover rate | | | 120 | % | | | 44 | % | | | 113 | % | | | 123 | % | | | 73 | % | | | 36 | % | | | 77 | % |
Net assets, end of period (000s omitted) | | | $10,855 | | | | $8,878 | | | | $8,001 | | | | $8,980 | | | | $11,812 | | | | $17,086 | | | | $17,997 | |
| 1 | For the five months ended March 31, 2014. The Fund changed its fiscal year end from October 31 to March 31, effective March 31, 2014. |
| 2 | Calculated based upon average shares outstanding |
| 3 | Amount is less than $0.005. |
| 4 | Returns for periods of less than one year are not annualized. |
The accompanying notes are an integral part of these financial statements.
| | | | | | |
| Notes to financial statements (unaudited) | | Wells Fargo Traditional Small Cap Growth Fund | | | 21 | |
1. ORGANIZATION
Wells Fargo Funds Trust (the “Trust”), a Delaware statutory trust organized on March 10, 1999, is an open-end management investment company registered under the Investment Company Act of 1940, as amended (the “1940 Act”). As an investment company, the Trust follows the accounting and reporting guidance in Financial Accounting Standards Board (“FASB”) Accounting Standards Codification Topic 946, Financial Services – Investment Companies. These financial statements report on the Wells Fargo Traditional Small Cap Growth Fund (the “Fund”) which is a diversified series of the Trust.
2. SIGNIFICANT ACCOUNTING POLICIES
The following significant accounting policies, which are consistently followed in the preparation of the financial statements of the Fund, are in conformity with U.S. generally accepted accounting principles which require management to make estimates and assumptions that affect the reported amounts of assets and liabilities, disclosure of contingent assets and liabilities at the date of the financial statements, and the reported amounts of revenues and expenses during the reporting period. Actual results could differ from those estimates.
Securities valuation
All investments are valued each business day as of the close of regular trading on the New York Stock Exchange (generally 4 p.m. Eastern Time), although the Fund may deviate from this calculation time under unusual or unexpected circumstances.
Equity securities that are listed on a foreign or domestic exchange or market are valued at the official closing price or, if none, the last sales price. If no sale occurs on the principal exchange or market that day, a fair value price will be determined in accordance with the Fund’s Valuation Procedures.
Investments in registered open-end investment companies are valued at net asset value. Interests in non-registered investment companies that are redeemable at net asset value are fair valued normally at net asset value.
Investments which are not valued using any of the methods discussed above are valued at their fair value, as determined in good faith by the Board of Trustees of the Fund. The Board of Trustees has established a Valuation Committee comprised of the Trustees and has delegated to it the authority to take any actions regarding the valuation of portfolio securities that the Valuation Committee deems necessary or appropriate, including determining the fair value of portfolio securities, unless the determination has been delegated to the Wells Fargo Asset Management Pricing Committee at Wells Fargo Funds Management, LLC (“Funds Management”). The Board of Trustees retains the authority to make or ratify any valuation decisions or approve any changes to the Valuation Procedures as it deems appropriate. On a quarterly basis, the Board of Trustees receives reports on any valuation actions taken by the Valuation Committee or the Wells Fargo Asset Management Pricing Committee which may include items for ratification.
Foreign currency translation
The accounting records of the Fund are maintained in U.S. dollars. The values of other assets and liabilities denominated in foreign currencies are translated into U.S. dollars at rates provided by an independent foreign currency pricing source at a time each business day specified by the Wells Fargo Asset Management Pricing Committee. Purchases and sales of securities, and income and expenses are converted at the rate of exchange on the respective dates of such transactions. Net realized foreign exchange gains or losses arise from sales of foreign currencies, currency gains or losses realized between the trade and settlement dates on securities transactions, and the difference between the amounts of dividends, interest and foreign withholding taxes recorded and the U.S. dollar equivalent of the amounts actually paid or received. Net unrealized foreign exchange gains and losses arise from changes in the fair value of assets and liabilities other than investments in securities resulting from changes in exchange rates. The changes in net assets arising from changes in exchange rates of securities and the changes in net assets resulting from changes in market prices of securities are not separately presented. Such changes are included in net realized and unrealized gains or losses from investments.
Securities lending
The Fund may lend its securities from time to time in order to earn additional income in the form of fees or interest on securities received as collateral or the investment of any cash received as collateral. The Fund continues to receive interest or dividends on the securities loaned. The Fund receives collateral in the form of cash or securities with a value at least equal to the value of the securities on loan. The value of the loaned securities is determined at the close of each business day and any additional required collateral is delivered to the Fund on the next business day. In a securities lending transaction, the net asset value of the Fund will be affected by an increase or decrease in the value of the securities loaned and by an increase or decrease in the value of the instrument in which collateral is invested. The amount of securities lending activity undertaken by the Fund fluctuates from time to time. In the event of default or bankruptcy
| | | | |
| 22 | | Wells Fargo Traditional Small Cap Growth Fund | | Notes to financial statements (unaudited) |
by the borrower, the Fund may be prevented from recovering the loaned securities or gaining access to the collateral or may experience delays or costs in doing so. In addition, the investment of any cash collateral received may lose all or part of its value. The Fund has the right under the lending agreement to recover the securities from the borrower on demand.
The Fund lends its securities through an unaffiliated securities lending agent. Cash collateral received in connection with its securities lending transactions is invested in Securities Lending Cash Investments, LLC (the “Securities Lending Fund”). The Securities Lending Fund is exempt from registration under Section 3(c)(7) of the 1940 Act and is managed by Funds Management and is subadvised by Wells Capital Management Incorporated (“WellsCap”), an affiliate of Funds Management and an indirect wholly owned subsidiary of Wells Fargo & Company (“Wells Fargo”). Funds Management receives an advisory fee starting at 0.05% and declining to 0.01% as the average daily net assets of the Securities Lending Fund increase. All of the fees received by Funds Management are paid to WellsCap for its services as subadviser. The Securities Lending Fund seeks to provide a positive return compared to the daily Fed Funds Open Rate by investing in high-quality, U.S. dollar-denominated short-term money market instruments. Securities Lending Fund investments are valued at the evaluated bid price provided by an independent pricing service. Income earned from investment in the Securities Lending Fund is included in securities lending income from affiliated (net of fees and rebates) on the Statement of Operations.
Security transactions and income recognition
Securities transactions are recorded on a trade date basis. Realized gains or losses are recorded on the basis of identified cost.
Dividend income is recognized on the ex-dividend date.
Income dividends and capital gain distributions from investment companies are recorded on the ex-dividend date. Capital gain distributions from investment companies are treated as realized gains.
Distributions to shareholders
Distributions to shareholders from net investment income and any net realized gains are recorded on the ex-dividend date and paid at least annually. Such distributions are determined in accordance with income tax regulations and may differ from U.S. generally accepted accounting principles. Dividend sources are estimated at the time of declaration. The tax character of distributions is determined as of the Fund’s fiscal year end. Therefore, a portion of the Fund’s distributions made prior to the Fund’s fiscal year end may be categorized as a tax return of capital at year end.
Federal and other taxes
The Fund intends to continue to qualify as a regulated investment company by distributing substantially all of its investment company taxable income and any net realized capital gains (after reduction for capital loss carryforwards) sufficient to relieve it from all, or substantially all, federal income taxes. Accordingly, no provision for federal income taxes was required.
The Fund’s income and federal excise tax returns and all financial records supporting those returns for the prior three fiscal years are subject to examination by the federal and Delaware revenue authorities. Management has analyzed the Fund’s tax positions taken on federal, state, and foreign tax returns for all open tax years and does not believe that there are any uncertain tax positions that require recognition of a tax liability.
As of September 30, 2018, the aggregate cost of all investments for federal income tax purposes was $96,888,827 and the unrealized gains (losses) consisted of:
| | | | |
Gross unrealized gains | | $ | 20,020,334 | |
Gross unrealized losses | | | (2,041,730 | ) |
Net unrealized gains | | $ | 17,978,604 | |
As of March 31, 2018, the Fund had a qualified late-year ordinary loss of $61,372 which was recognized on the first day of the current fiscal year.
Class allocations
The separate classes of shares offered by the Fund differ principally in applicable sales charges, distribution, shareholder servicing, and administration fees. Class specific expenses are charged directly to that share class. Investment income, common expenses, and realized and unrealized gains (losses) on investments are allocated daily to each class of shares based on the relative proportion of net assets of each class.
| | | | | | |
| Notes to financial statements (unaudited) | | Wells Fargo Traditional Small Cap Growth Fund | | | 23 | |
3. FAIR VALUATION MEASUREMENTS
Fair value measurements of investments are determined within a framework that has established a fair value hierarchy based upon the various data inputs utilized in determining the value of the Fund’s investments. The three-level hierarchy gives the highest priority to unadjusted quoted prices in active markets for identical assets or liabilities (Level 1) and the lowest priority to unobservable inputs (Level 3). The Fund’s investments are classified within the fair value hierarchy based on the lowest level of input that is significant to the fair value measurement. The inputs are summarized into three broad levels as follows:
| ∎ | | Level 1 – quoted prices in active markets for identical securities |
| ∎ | | Level 2 – other significant observable inputs (including quoted prices for similar securities, interest rates, prepayment speeds, credit risk, etc.) |
| ∎ | | Level 3 – significant unobservable inputs (including the Fund’s own assumptions in determining the fair value of investments) |
The inputs or methodologies used for valuing investments in securities are not necessarily an indication of the risk associated with investing in those securities.
The following is a summary of the inputs used in valuing the Fund’s assets and liabilities as of September 30, 2018:
| | | | | | | | | | | | | | | | |
| | | Quoted prices (Level 1) | | | Other significant
observable inputs
(Level 2) | | | Significant
unobservable inputs (Level 3) | | | Total | |
Assets | | | | | | | | | | | | | | | | |
Investments in: | | | | | | | | | | | | | | | | |
| | | | |
Common stocks | | | | | | | | | | | | | | | | |
Communication services | | $ | 1,226,035 | | | $ | 0 | | | $ | 0 | | | $ | 1,226,035 | |
Consumer discretionary | | | 18,696,844 | | | | 0 | | | | 0 | | | | 18,696,844 | |
Consumer staples | | | 4,321,726 | | | | 0 | | | | 0 | | | | 4,321,726 | |
Energy | | | 2,420,455 | | | | 0 | | | | 0 | | | | 2,420,455 | |
Financials | | | 2,198,730 | | | | 0 | | | | 0 | | | | 2,198,730 | |
Health care | | | 26,226,486 | | | | 0 | | | | 0 | | | | 26,226,486 | |
Industrials | | | 19,520,119 | | | | 0 | | | | 0 | | | | 19,520,119 | |
Information technology | | | 27,461,748 | | | | 0 | | | | 0 | | | | 27,461,748 | |
Materials | | | 1,933,682 | | | | 0 | | | | 0 | | | | 1,933,682 | |
| | | | |
Short-term investments | | | | | | | | | | | | | | | | |
Investment companies | | | 2,367,984 | | | | 8,493,622 | | | | 0 | | | | 10,861,606 | |
Total assets | | $ | 106,373,809 | | | $ | 8,493,622 | | | $ | 0 | | | $ | 114,867,431 | |
Additional sector, industry or geographic detail is included in the Portfolio of Investments
At September 30, 2018, the Fund did not have any transfers into/out of Level 3.
4. TRANSACTIONS WITH AFFILIATES
Management fee
Funds Management, an indirect wholly owned subsidiary of Wells Fargo, is the manager of the Fund and provides advisory and fund-level administrative services under an investment management agreement. Under the investment management agreement, Funds Management is responsible for, among other services, implementing the investment objectives and strategies of the Fund, supervising the applicable subadviser and providing fund-level administrative services in connection with the Fund’s operations. As compensation for its services under the investment management agreement, Funds Management is entitled to receive an annual management fee starting at 0.85% and declining to 0.71% as the average daily net assets of the Fund increase. For the six months ended September 30, 2018, the management fee was equivalent to an annual rate of 0.85% of the Fund’s average daily net assets.
Funds Management has retained the services of a subadviser to provide daily portfolio management to the Fund. The fee for subadvisory services is borne by Funds Management. WellsCap is the subadviser to the Fund and is entitled to receive a fee from Funds Management at an annual rate starting at 0.55% and declining to 0.40% as the average daily net assets of the Fund increase.
| | | | |
| 24 | | Wells Fargo Traditional Small Cap Growth Fund | | Notes to financial statements (unaudited) |
Administration fees
Under a class-level administration agreement, Funds Management provides class-level administrative services to the Fund, which includes paying fees and expenses for services provided by the transfer agent, sub-transfer agents, omnibus account servicers and record-keepers. As compensation for its services under the class-level administration agreement, Funds Management receives an annual fee which is calculated based on the average daily net assets of each class as follows:
| | | | |
| | | Class-level
administration fee | |
Class A, Class C | | | 0.21 | % |
Administrator Class, Institutional Class | | | 0.13 | |
Funds Management has contractually waived and/or reimbursed management and administration fees to the extent necessary to maintain certain net operating expense ratios for the Fund. When each class of the Fund has exceeded its expense cap, Funds Management has waived fees and/or reimbursed expenses from fund level expenses on a proportionate basis and then from class specific expenses; otherwise, waivers and/or reimbursements are applied against class specific expenses before fund level expenses. Funds Management has committed through July 31, 2019 to waive fees and/or reimburse expenses to the extent necessary to cap the Fund’s expenses at 1.23% for Class A shares, 1.98% for Class C shares, 1.15% for Administrator Class shares, and 0.90% for Institutional Class shares. After this time, the cap may be increased or the commitment to maintain the cap may be terminated only with the approval of the Board of Trustees. Prior to April 2, 2018, the Fund’s expenses were capped at 1.33 % for Class A shares, 2.08 % for Class C shares, 1.20 % for Administrator Class shares, and 0.98% for Institutional Class shares.
Distribution fee
The Trust has adopted a distribution plan for Class C shares of the Fund pursuant to Rule 12b-1 under the 1940 Act. A distribution fee is charged to Class C shares and paid to Wells Fargo Funds Distributor, LLC (“Funds Distributor”), the principal underwriter, at an annual rate of 0.75% of the average daily net assets of Class C shares.
In addition, Funds Distributor is entitled to receive the front-end sales charge from the purchase of Class A shares and a contingent deferred sales charge on the redemption of certain Class A shares. Funds Distributor is also entitled to receive the contingent deferred sales charges from redemptions of Class C shares. For the six months ended September 30, 2018, Funds Distributor received $987 from the sale of Class A shares. No contingent deferred sales charges were incurred by Class A and Class C shares for the six months ended September 30, 2018.
Shareholder servicing fees
The Trust has entered into contracts with one or more shareholder servicing agents, whereby Class A, Class C, and Administrator Class of the Fund are charged a fee at an annual rate of 0.25% of the average daily net assets of each respective class.
A portion of these total shareholder servicing fees were paid to affiliates of Wells Fargo.
Interfund transactions
The Fund may purchase or sell portfolio investment securities to certain other Wells Fargo affiliates pursuant to Rule 17a-7 under the 1940 Act and under procedures adopted by the Board of Trustees. The procedures have been designed to ensure that these interfund transactions, which do not incur broker commissions, are effected at current market prices.
5. INVESTMENT PORTFOLIO TRANSACTIONS
Purchases and sales of investments, excluding U.S. government obligations (if any) and short-term securities, for the six months ended September 30, 2018 were $119,053,413 and $126,892,386, respectively.
6. BANK BORROWINGS
The Trust (excluding the money market funds), Wells Fargo Master Trust and Wells Fargo Variable Trust are parties to a $280,000,000 revolving credit agreement whereby the Fund is permitted to use bank borrowings for temporary or emergency purposes, such as to fund shareholder redemption requests. Interest under the credit agreement is charged to the Fund based on a borrowing rate equal to the higher of the Federal Funds rate in effect on that day plus 1.25% or the overnight LIBOR rate in effect on that day plus 1.25%. In addition, an annual commitment fee equal to 0.25% of the unused balance is allocated to each participating fund.
| | | | | | |
| Notes to financial statements (unaudited) | | Wells Fargo Traditional Small Cap Growth Fund | | | 25 | |
For the six months ended September 30, 2018, there were no borrowings by the Fund under the agreement.
7. DISTRIBUTIONS TO SHAREHOLDERS
Beginning October 2018, the Securities and Exchange Commission eliminated the requirement to separately state the components of distributions to shareholders. The amounts of distributions to shareholders for the year ended March 31, 2018 were as follows:
| | | | |
| | | Net realized
gains | |
Class A | | | $5,360,360 | |
Class C | | | 16,142 | |
Administrator Class | | | 7,844 | |
Institutional Class | | | 468,228 | |
8. CONCENTRATION RISK
Concentration risks result from exposure to a limited number of sectors. A fund that invests a substantial portion of its assets in any sector may be more affected by changes in that sector than would be a fund whose investments are not heavily weighted in any sector.
9. INDEMNIFICATION
Under the Trust’s organizational documents, the officers and Trustees have been granted certain indemnification rights against certain liabilities that may arise out of performance of their duties to the Trust. Additionally, in the normal course of business, the Trust may enter into contracts with service providers that contain a variety of indemnification clauses. The Trust’s maximum exposure under these arrangements is dependent on future claims that may be made against the Fund and, therefore, cannot be estimated.
10. NEW ACCOUNTING PRONOUNCEMENT
In August 2018, FASB issued Accounting Standards Update (“ASU”) No. 2018-13, Fair Value Measurement (Topic 820) Disclosure Framework—Changes to the Disclosure Requirements for Fair Value Measurement. ASU 2018-13 updates the disclosure requirements for fair value measurements by modifying or removing certain disclosures and adding certain new disclosures. The amendments are effective for fiscal years, and interim periods within those fiscal years, beginning after December 15, 2019. Early adoption is permitted. Management has early adopted the removal and modification disclosures, as permitted, and will adopt the additional new disclosures at the effective date.
| | | | |
| 26 | | Wells Fargo Traditional Small Cap Growth Fund | | Other information (unaudited) |
PROXY VOTING INFORMATION
A description of the policies and procedures that the Fund uses to determine how to vote proxies relating to portfolio securities is available, upon request, by calling 1-800-222-8222, visiting our website at wellsfargofunds.com, or visiting the SEC website at sec.gov. Information regarding how the Fund voted proxies relating to portfolio securities during the most recent 12-month period ended June 30 is available on the Fund’s website at wellsfargofunds.com or by visiting the SEC website at sec.gov.
PORTFOLIO HOLDINGS INFORMATION
The complete portfolio holdings for the Fund are publicly available monthly on the Fund’s website (wellsfargofunds.com), on a one-month delayed basis. In addition, top ten holdings information (excluding derivative positions) for the Fund is publicly available on the Fund’s website on a monthly, seven-day or more delayed basis. The Fund files its complete schedule of portfolio holdings with the SEC for the first and third quarters of each fiscal year on Form N-Q, which is available by visiting the SEC website at sec.gov. In addition, the Fund’s Form N-Q may be reviewed and copied at the SEC’s Public Reference Room in Washington, DC, and at regional offices in New York City, at 233 Broadway, and in Chicago, at 175 West Jackson Boulevard, Suite 900. Information about the Public Reference Room may be obtained by calling 1-800-SEC-0330.
| | | | | | |
| Other information (unaudited) | | Wells Fargo Traditional Small Cap Growth Fund | | | 27 | |
BOARD OF TRUSTEES AND OFFICERS
Each of the Trustees and Officers1 listed in the table below acts in identical capacities for each fund in the Wells Fargo family of funds, which consists of 153 mutual funds comprising the Wells Fargo Funds Trust, Wells Fargo Variable Trust, Wells Fargo Master Trust and four closed-end funds (collectively the “Fund Complex”). This table should be read in conjunction with the Prospectus and the Statement of Additional Information2. The mailing address of each Trustee and Officer is 525 Market Street, 12th Floor, San Francisco, CA 94105. Each Trustee and Officer serves an indefinite term, however, each Trustee serves such term until reaching the mandatory retirement age established by the Trustees.
Independent Trustees
| | | | | | |
Name and year of birth | | Position held and length of service* | | Principal occupations during past five years or longer | | Current other
public company or
investment company
directorships |
William R. Ebsworth (Born 1957) | | Trustee, since 2015 | | Retired. From 1984 to 2013, equities analyst, portfolio manager, research director and chief investment officer at Fidelity Management and Research Company in Boston, Tokyo, and Hong Kong, and retired in 2013 as Chief Investment Officer of Fidelity Strategic Advisers, Inc. where he led a team of investment professionals managing client assets. Prior thereto, Board member of Hong Kong Securities Clearing Co., Hong Kong Options Clearing Corp., the Thailand International Fund, Ltd., Fidelity Investments Life Insurance Company, and Empire Fidelity Investments Life Insurance Company. Board member of the Vincent Memorial Hospital Endowment (non-profit organization), where he serves on the Investment Committee and as a Chair of the Audit Committee. Mr. Ebsworth is a CFA® charterholder. | | N/A |
Jane A. Freeman (Born 1953) | | Trustee, since 2015; Chair Liaison, since 2018 | | Retired. From 2012 to 2014 and 1999 to 2008, Chief Financial Officer of Scientific Learning Corporation. From 2008 to 2012, Ms. Freeman provided consulting services related to strategic business projects. Prior to 1999, Portfolio Manager at Rockefeller & Co. and Scudder, Stevens & Clark. Board member of the Harding Loevner Funds from 1996 to 2014, serving as both Lead Independent Director and chair of the Audit Committee. Board member of the Russell Exchange Traded Funds Trust from 2011 to 2012 and the chair of the Audit Committee. Ms. Freeman is a Board Member of The Ruth Bancroft Garden (non-profit organization). She is also an inactive Chartered Financial Analyst. | | N/A |
Isaiah Harris, Jr. (Born 1952) | | Trustee, since 2009 | | Retired. Chairman of the Board of CIGNA Corporation since 2009, and Director since 2005. From 2003 to 2011, Director of Deluxe Corporation. Prior thereto, President and CEO of BellSouth Advertising and Publishing Corp. from 2005 to 2007, President and CEO of BellSouth Enterprises from 2004 to 2005 and President of BellSouth Consumer Services from 2000 to 2003. Emeritus member of the Iowa State University Foundation Board of Governors. Emeritus Member of the Advisory Board of Iowa State University School of Business. Advisory Board Member, Palm Harbor Academy (private school). Advisory Board Member, Child Evangelism Fellowship (non-profit). Mr. Harris is a certified public accountant (inactive status). | | CIGNA Corporation |
Judith M. Johnson (Born 1949) | | Trustee, since 2008; Audit Committee Chairman, since 2009 | | Retired. Prior thereto, Chief Executive Officer and Chief Investment Officer of Minneapolis Employees Retirement Fund from 1996 to 2008. Ms. Johnson is an attorney, certified public accountant and a certified managerial accountant. | | N/A |
David F. Larcker (Born 1950) | | Trustee, since 2009 | | James Irvin Miller Professor of Accounting at the Graduate School of Business, Stanford University, Director of the Corporate Governance Research Initiative and Senior Faculty of The Rock Center for Corporate Governance since 2006. From 2005 to 2008, Professor of Accounting at the Graduate School of Business, Stanford University. Prior thereto, Ernst & Young Professor of Accounting at The Wharton School, University of Pennsylvania from 1985 to 2005. | | N/A |
| | | | |
| 28 | | Wells Fargo Traditional Small Cap Growth Fund | | Other information (unaudited) |
| | | | | | |
Name and year of birth | | Position held and length of service* | | Principal occupations during past five years or longer | | Current other
public company or
investment company
directorships |
Olivia S. Mitchell (Born 1953) | | Trustee, since 2006; Governance Committee Chairman, since 2018 | | International Foundation of Employee Benefit Plans Professor, Wharton School of the University of Pennsylvania since 1993. Director of Wharton’s Pension Research Council and Boettner Center on Pensions & Retirement Research, and Research Associate at the National Bureau of Economic Research. Previously, Cornell University Professor from 1978 to 1993. | | N/A |
Timothy J. Penny (Born 1951) | | Trustee, since 1996; Chairman, since 2018; Vice Chairman, from 2017 to 2018 | | President and Chief Executive Officer of Southern Minnesota Initiative Foundation, a non-profit organization, since 2007. Member of the Board of Trustees of NorthStar Education Finance, Inc., a non-profit organization, since 2007. | | N/A |
James G. Polisson (Born 1959) | | Trustee, since 2018; Advisory Board Member, from 2017 to 2018 | | Retired. Chief Marketing Officer, Source (ETF) UK Services, Ltd, from 2015 to 2017. From 2012 to 2015, Principal of The Polisson Group, LLC, a management consulting, corporate advisory and principal investing company. Chief Executive Officer and Managing Director at Russell Investments, Global Exchange Traded Funds from 2010 to 2012. Managing Director of Barclays Global Investors from 1998 to 2010 and Global Chief Marketing Officer for iShares and Barclays Global Investors from 2000 to 2010. Trustee of the San Francisco Mechanics’ Institute, a non-profit organization, from 2013 to 2015. Board member of the Russell Exchange Traded Fund Trust from 2011 to 2012. Director of Barclays Global Investors Holdings Deutschland GmbH from 2006 to 2009. Mr. Polisson is an attorney and has a retired status with the Massachusetts and District of Columbia Bar Associations. | | N/A |
Michael S. Scofield (Born 1943) | | Trustee, since 2010 | | Served on the Investment Company Institute’s Board of Governors and Executive Committee from 2008-2011 as well the Governing Council of the Independent Directors Council from 2006-2011 and the Independent Directors Council Executive Committee from 2008-2011. Trustee of the Evergreen Fund complex (and its predecessors) from 1984 to 2010. Chairman of the Evergreen Funds from 2000-2010. Former Trustee of the Mentor Funds. Retired Attorney, Law Offices of Michael S. Scofield. | | N/A |
Pamela Wheelock (Born 1959) | | Trustee, since 2018; Advisory Board Member, from 2017 to 2018 | | Chief Operating Officer, Twin Cities Habitat for Humanity, since January, 2017. Vice President of University Services, University of Minnesota from 2012 to 2017. Prior thereto, on the Board of Directors, Governance Committee and Finance Committee for the Minnesota Philanthropy Partners (Saint Paul Foundation) from 2012 to 2018, Interim President and Chief Executive Officer of Blue Cross Blue Shield of Minnesota from 2010 to 2011, Chairman of the Board from 2009 to 2011 and Board Director from 2003 to 2015. Vice President, Leadership and Community Engagement, Bush Foundation, Saint Paul, Minnesota (a private foundation) from 2009 to 2011. Executive Vice President and Chief Financial Officer, Minnesota Sports and Entertainment from 2004 to 2009 and Senior Vice President from 2002 to 2004. Commissioner of Finance, State of Minnesota, from 1999 to 2002. Currently the Board Chair of the Minnesota Wild Foundation since 2010. | | N/A |
| * | Length of service dates reflect the Trustee’s commencement of service with the Trust’s predecessor entities, where applicable. |
| | | | | | |
| Other information (unaudited) | | Wells Fargo Traditional Small Cap Growth Fund | | | 29 | |
Officers
| | | | | | |
Name and year of birth | | Position held and
length of service | | Principal occupations during past five years or longer | | |
Andrew Owen (Born 1960) | | President, since 2017 | | Executive Vice President of Wells Fargo & Company and Head of Affiliated Managers, Wells Fargo Asset Management, since 2014. In addition, Mr. Owen is currently President, Chief Executive Officer and Director of Wells Fargo Funds Management, LLC since 2017. Prior thereto, Executive Vice President responsible for marketing, investments and product development for Wells Fargo Funds Management, LLC, from 2009 to 2014. | | |
Nancy Wiser1 (Born 1967) | | Treasurer, since 2012 | | Executive Vice President of Wells Fargo Funds Management, LLC since 2011. Chief Operating Officer and Chief Compliance Officer at LightBox Capital Management LLC, from 2008 to 2011. | | |
Alexander Kymn3 (Born 1973) | | Secretary, since 2018; Chief Legal Officer, since 2018 | | Senior Company Counsel of Wells Fargo Bank, N.A. since 2018 (previously Senior Counsel from 2007 to 2018). Vice President of Wells Fargo Funds Management, LLC from 2008 to 2014. | | |
Michael H. Whitaker (Born 1967) | | Chief Compliance Officer, since 2016 | | Senior Vice President and Chief Compliance Officer since 2016. Senior Vice President and Chief Compliance Officer for Fidelity Investments from 2007 to 2016. | | |
David Berardi (Born 1975) | | Assistant Treasurer, since 2009 | | Vice President of Wells Fargo Funds Management, LLC since 2009. Vice President of Evergreen Investment Management Company, LLC from 2008 to 2010. Manager of Fund Reporting and Control for Evergreen Investment Management Company, LLC from 2004 to 2010. | | |
Jeremy DePalma1 (Born 1974) | | Assistant Treasurer, since 2009 | | Senior Vice President of Wells Fargo Funds Management, LLC since 2009. Senior Vice President of Evergreen Investment Management Company, LLC from 2008 to 2010 and head of the Fund Reporting and Control Team within Fund Administration from 2005 to 2010. | | |
| 1 | Nancy Wiser acts as Treasurer of 76 funds in the Fund Complex. Jeremy DePalma acts as Treasurer of 77 funds and Assistant Treasurer of 76 funds in the Fund Complex. |
| 2 | The Statement of Additional Information includes additional information about the Trustees and is available, without charge, upon request, by calling 1-800-222-8222 or by visiting the website at wellsfargofunds.com. |
| 3 | Alexander Kymn became the Secretary and Chief Legal Officer effective April 17, 2018. |
| | | | |
| 30 | | Wells Fargo Traditional Small Cap Growth Fund | | Other information (unaudited) |
BOARD CONSIDERATION OF INVESTMENT MANAGEMENT AND SUB-ADVISORY AGREEMENTS:
Wells Fargo Traditional Small Cap Growth Fund
Under the Investment Company Act of 1940 (the “1940 Act”), the Board of Trustees (the “Board”) of Wells Fargo Funds Trust (the “Trust”) must determine annually whether to approve the continuation of the Trust’s investment management and sub-advisory agreements. In this regard, at an in-person meeting held on May 22-23, 2018 (the “Meeting”), the Board, all the members of which have no direct or indirect interest in the investment management and sub-advisory agreements and are not “interested persons” of the Trust, as defined in the 1940 Act (the “Independent Trustees”), reviewed and approved for Wells Fargo Traditional Small Cap Growth Fund (the “Fund”): (i) an investment management agreement (the “Management Agreement”) with Wells Fargo Funds Management, LLC (“Funds Management”); and (ii) an investment sub-advisory agreement (the “Sub-Advisory Agreement”) with Wells Capital Management Incorporated (the “Sub-Adviser”), an affiliate of Funds Management. The Management Agreement and the Sub-Advisory Agreement are collectively referred to as the “Advisory Agreements.”
At the Meeting, the Board considered the factors and reached the conclusions described below relating to the selection of Funds Management and the Sub-Adviser and the approval of the Advisory Agreements. Prior to the Meeting, including at an in-person meeting in April 2018, the Trustees conferred extensively among themselves and with representatives of Funds Management about these matters. Also, the Board has adopted a team-based approach, with each team consisting of a sub-set of Trustees, to assist the full Board in the discharge of its duties in reviewing investment performance and other matters throughout the year. The Independent Trustees were assisted in their evaluation of the Advisory Agreements by independent legal counsel, from whom they received separate legal advice and with whom they met separately.
In providing information to the Board, Funds Management and the Sub-Adviser were guided by a detailed set of requests for information submitted to them by independent legal counsel on behalf of the Independent Trustees at the start of the Board’s annual contract renewal process earlier in 2018. In considering and approving the Advisory Agreements, the Trustees considered the information they believed relevant, including but not limited to the information discussed below. The Board considered not only the specific information presented in connection with the Meeting, but also the knowledge gained over time through interaction with Funds Management and the Sub-Adviser about various topics. In this regard, the Board reviewed reports of Funds Management at each of its quarterly meetings, which included, among other things, portfolio reviews and investment performance reports. In addition, the Board and the teams mentioned above confer with portfolio managers at various times throughout the year. The Board did not identify any particular information or consideration that was all-important or controlling, and each individual Trustee may have attributed different weights to various factors.
After its deliberations, the Board unanimously approved the continuation of the Advisory Agreements for a one-year term and determined that the compensation payable to Funds Management and the Sub-Adviser under each of the Advisory Agreements was reasonable. The Board considered the approval of the Advisory Agreements for the Fund as part of its consideration of agreements for funds across the complex, but its approvals were made on a fund-by-fund basis. The following summarizes a number of important, but not necessarily all, factors considered by the Board in support of its approvals.
Nature, extent and quality of services
The Board received and considered various information regarding the nature, extent and quality of services provided to the Fund by Funds Management and the Sub-Adviser under the Advisory Agreements. This information included a description of the investment advisory services and Fund-level administrative services covered by the Management Agreement, as well as, among other things, a summary of the background and experience of senior management of Wells Fargo Asset Management (“WFAM”), of which Funds Management and the Sub-Adviser are a part, a summary of investments made in the business of WFAM, a summary of certain organizational and personnel changes involving Funds Management and the Sub-Adviser, and a description of Funds Management’s and the Sub-Adviser’s business continuity planning programs and of their approaches to data privacy and cybersecurity. The Board also considered the qualifications, background, tenure and responsibilities of each of the portfolio managers primarily responsible for the day-to-day portfolio management of the Fund.
The Board evaluated the ability of Funds Management and the Sub-Adviser to attract and retain qualified investment professionals, including research, advisory and supervisory personnel. The Board further considered the compliance programs and compliance records of Funds Management and the Sub-Adviser. In addition, the Board took into account the full range of services provided to the Fund by Funds Management and its affiliates.
| | | | | | |
| Other information (unaudited) | | Wells Fargo Traditional Small Cap Growth Fund | | | 31 | |
Fund investment performance and expenses
The Board considered the investment performance results for the Fund over various time periods ended December 31, 2017. The Board considered these results in comparison to the investment performance of funds in a universe that was determined by Broadridge Inc. (“Broadridge”) to be similar to the Fund (the “Universe”), and in comparison to the Fund’s benchmark index and to other comparative data. Broadridge is an independent provider of investment company data. The Board received a description of the methodology used by Broadridge to select the mutual funds in the performance Universe. The Board noted that the investment performance of the Fund (Class A) was lower than the average investment performance of the Universe for all periods under review. The Board also noted that the investment performance of the Fund was lower than its benchmark index, the Russell 2000 Growth Index, for all periods under review.
The Board received information concerning, and discussed factors contributing to, the underperformance of the Fund relative to the Universe and benchmark for the periods identified above. The Board took note of the explanations for the relative underperformance during these periods, including with respect to investment decisions and market factors that affected the Fund’s investment performance. The Board also noted that it had approved changes to the Fund’s principal investment strategies that went effective in 2018.
The Board also received and considered information regarding the Fund’s net operating expense ratios and their various components, including actual management fees, custodian and other non-management fees, and Rule 12b-1 and non-Rule 12b-1 shareholder service fees. The Board considered these ratios in comparison to the median ratios of funds in class-specific expense groups that were determined by Broadridge to be similar to the Fund (the “Groups”). The Board received a description of the methodology used by Broadridge to select the mutual funds in the expense Groups and an explanation of how funds comprising expense groups and their expense ratios may vary from year-to-year. Based on the Broadridge reports, the Board noted that the net operating expense ratios of the Fund were lower than the median net operating expense ratios of the expense Groups for all share classes.
The Board took into account the Fund’s investment performance and expense information provided to it among the factors considered in deciding to re-approve the Advisory Agreements.
Investment management and sub-advisory fee rates
The Board reviewed and considered the contractual fee rates payable by the Fund to Funds Management under the Management Agreement, as well as the contractual fee rates payable by the Fund to Funds Management for class-level administrative services under a Class-Level Administration Agreement, which include, among other things, class-level transfer agency and sub-transfer agency costs (collectively, the “Management Rates”). The Board also reviewed and considered the contractual investment sub-advisory fee rates that are payable by Funds Management to the Sub-Adviser for investment sub-advisory services.
Among other information reviewed by the Board was a comparison of the Fund’s Management Rates with the average contractual investment management fee rates of funds in the expense Groups at a common asset level as well as transfer agency costs of the funds in the expense Groups. The Board noted that the Management Rates of the Fund were in range of the sum of these average rates for the Fund’s expense Groups for all Classes.
The Board also received and considered information about the portion of the total management fee that was retained by Funds Management after payment of the fee to the Sub-Adviser for sub-advisory services. In assessing the reasonableness of this amount, the Board received and evaluated information about the nature and extent of responsibilities retained and risks assumed by Funds Management and not delegated to or assumed by the Sub-Adviser, and about Funds Management’s on-going oversight services. Given the affiliation between Funds Management and the Sub-Adviser, the Board ascribed limited relevance to the allocation of fees between them.
The Board also received and considered information about the nature and extent of services offered and fee rates charged by Funds Management and the Sub-Adviser to other types of clients with investment strategies similar to those of the Fund. In this regard, the Board received information about the significantly greater scope of services, and compliance, reporting and other legal burdens and risks of managing mutual funds compared with those associated with managing assets of non-mutual fund clients such as institutional separate accounts.
Based on its consideration of the factors and information it deemed relevant, including those described here, the Board determined that the compensation payable to Funds Management under the Management Agreement and to the Sub-Adviser under the Sub-Advisory Agreement was reasonable.
| | | | |
| 32 | | Wells Fargo Traditional Small Cap Growth Fund | | Other information (unaudited) |
Profitability
The Board received and considered information concerning the profitability of Funds Management, as well as the profitability of both WFAM and Wells Fargo & Co. (“Wells Fargo”) as a whole, from providing services to the Fund and the fund family as a whole. The Board noted that the Sub-Adviser’s profitability information with respect to providing services to the Fund was subsumed in the WFAM and Wells Fargo profitability analysis.
Funds Management reported on the methodologies and estimates used in calculating profitability, including a description of the methodology used to allocate certain expenses and recent enhancements made to the methodology. Among other things, the Board noted that the levels of profitability reported on a fund-by-fund basis varied widely, depending on factors such as the size and type of fund. Based on its review, the Board did not deem the profits reported by Funds Management, WFAM or Wells Fargo from services provided to the Fund to be at a level that would prevent it from approving the continuation of the Advisory Agreements.
Economies of scale
The Board considered the extent to which Funds Management may experience economies of scale in the provision of management services, and the extent to which scale benefits, if any, would be shared with shareholders. In particular, the Board noted the existence of breakpoints in the Fund’s management fee structure, which operate generally to reduce the Fund’s expense ratios as the Fund grows in size. It considered that, for a small fund or a fund that shrinks in size, breakpoints conversely can result in higher fee levels. The Board also considered that in addition to management fee breakpoints, competitive management fee rates set at the outset without regard to breakpoints and fee waiver and expense reimbursement arrangements, as well as investments in the business intended to enhance services available to Fund shareholders, are means of sharing potential economies of scale with shareholders of the Fund.
The Board concluded that the Fund’s fee and expense arrangements, including contractual breakpoints, constituted a reasonable approach to sharing potential economies of scale with the Fund and its shareholders.
Other benefits to Funds Management and the Sub-Adviser
The Board received and considered information regarding potential “fall-out” or ancillary benefits received by Funds Management and its affiliates, including the Sub-Adviser, as a result of their relationships with the Fund. Ancillary benefits could include, among others, benefits directly attributable to other relationships with the Fund and benefits potentially derived from an increase in Funds Management’s and the Sub-Adviser’s business as a result of their relationships with the Fund. The Board noted that various affiliates of Funds Management may receive distribution-related fees, shareholder servicing payments and sub-transfer agency fees in respect of shares sold or held through them and services provided.
The Board also reviewed information about soft dollar credits earned and utilized by the Sub-Adviser, fees earned by Funds Management and the Sub-Adviser from managing a private investment vehicle for the fund family’s securities lending collateral and commissions earned by an affiliated broker from portfolio transactions.
Based on its consideration of the factors and information it deemed relevant, including those described here, the Board did not find that any ancillary benefits received by Funds Management and its affiliates, including the Sub-Adviser, were unreasonable.
Conclusion
At the Meeting, after considering the above-described factors and based on its deliberations and its evaluation of the information described above, the Board unanimously approved the continuation of the Advisory Agreements for a one-year term and determined that the compensation payable to Funds Management and the Sub-Adviser under each of the Advisory Agreements was reasonable.
| | | | | | |
| Appendix A (unaudited) | | Wells Fargo Traditional Small Cap Growth Fund | | | 33 | |
SALES CHARGE REDUCTIONS AND WAIVERS FOR CERTAIN INTERMEDIARIES
Ameriprise
Effective June 1, 2018, shareholders purchasing Fund shares through an Ameriprise Financial platform or account will be eligible only for the following Class A load waivers (front-end sales charge waivers), which may differ from those disclosed elsewhere in the Fund’s prospectus or Statement of Additional Information.
Front-end Sales Load Waivers on Class A Shares Available at Ameriprise Financial
| | • | | Employer-sponsored retirement plans (e.g., 401(k) plans, 457 plans, employer-sponsored 403(b) plans, profit sharing and money purchase pension plans and defined benefit plans). For purposes of this provision, employer-sponsored retirement plans do not include SEP IRAs, Simple IRAs or SAR-SEPs. |
| | • | | Shares purchased through an Ameriprise Financial investment advisory program (if an Advisory or similar share class for such investment advisory program is not available) |
| | • | | Shares purchased by third party investment advisors on behalf of their advisory clients through Ameriprise Financial’s platform (if an Advisory or similar share class for such investment advisory program is not available) |
| | • | | Shares purchased through reinvestment of distributions and dividend reinvestment when purchasing shares of the same Fund (but not any other fund within the same fund family) |
| | • | | Shares exchanged from Class C shares of the same fund in the month of or following the 10-year anniversary of the purchase date. To the extent that the Fund’s prospectus elsewhere provides for a waiver with respect to such shares following a shorter holding period, that waiver will apply to exchanges following such shorter period. To the extent that the Fund’s prospectus elsewhere provides for a waiver with respect to exchanges of Class C shares for load-waived shares, that waiver will also apply to such exchanges. |
| | • | | Employees and registered representatives of Ameriprise Financial or its affiliates and their immediate family members |
| | • | | Shares purchased by or through qualified accounts (including IRAs, Coverdell Education Savings Accounts, 401(k)s, 403(b) TSCAs subject to ERISA and defined benefit plans) that are held by a covered family member, defined as an Ameriprise financial advisor and/or the advisor’s spouse, advisor’s lineal ascendant (mother, father, grandmother, grandfather, great grandmother, great grandfather), advisor’s lineal descendant (son, step-son, daughter, step-daughter, grandson, granddaughter, great grandson, great granddaughter) or any spouse of a covered family member who is a lineal descendant |
| | • | | Shares purchased from the proceeds of redemptions within the same fund family, provided (1) the repurchase occurs within 90 days following the redemption, (2) the redemption and purchase occur in the same account, and (3) redeemed shares were subject to a front-end or deferred sales load (i.e. Rights of Reinstatement). Subject to the Fund’s policy regarding frequent purchases and redemptions of Fund shares, you may not be able to repurchase shares for the first 30 days after your redemption. |
Automatic Exchange of Class C Shares Available at Ameriprise Financial
| | • | | Class C shares will automatically exchange to Class A shares in the month of the 10-year anniversary of the purchase date. |
Merrill Lynch
Effective April 10, 2017, shareholders purchasing Fund shares through a Merrill Lynch platform or account will be eligible only for the following load waivers (front-end sales charge waivers and contingent deferred, or back-end, sales charge waivers) and discounts, which may differ from those disclosed elsewhere in the Fund’s prospectus or Statement of Additional Information.
Front-end Sales Load Waivers on Class A Shares available at Merrill Lynch
| | • | | Employer-sponsored retirement, deferred compensation and employee benefit plans (including health savings accounts) and trusts used to fund those plans, provided that the shares are not held in a commission-based brokerage account and shares are held for the benefit of the plan |
| | • | | Shares purchased by or through a 529 Plan |
| | • | | Shares purchased through a Merrill Lynch affiliated investment advisory program |
| | | | |
| 34 | | Wells Fargo Traditional Small Cap Growth Fund | | Appendix A (unaudited) |
| | • | | Shares purchased by third party investment advisors on behalf of their advisory clients through Merrill Lynch’s platform |
| | • | | Shares of funds purchased through the Merrill Edge Self-Directed platform (if applicable) |
| | • | | Shares purchased through reinvestment of capital gains distributions and dividend reinvestment when purchasing shares of the same fund (but not any other fund within the fund family) |
| | • | | Shares exchanged from Class C (i.e. level-load) shares of the same fund in the month of or following the 10-year anniversary of the purchase date |
| | • | | Employees and registered representatives of Merrill Lynch or its affiliates and their family members, as defined by Merrill Lynch, which may differ from the definition of family member in the Fund’s prospectus. |
| | • | | Directors or Trustees of the Fund, and employees of the Fund’s investment adviser or any of its affiliates, as described in the Fund’s prospectus |
| | • | | Shares purchased from the proceeds of redemptions within the same fund family, provided (1) the repurchase occurs within 90 days following the redemption, (2) the redemption and purchase occur in the same account, and (3) redeemed shares were subject to a front-end or deferred sales load (known as Rights of Reinstatement). Subject to the Fund’s policy regarding frequent purchases and redemptions of Fund shares, you may not be able to repurchase shares for the first 30 days after your redemption. |
CDSC Waivers on A, B and C Shares available at Merrill Lynch
| | • | | Death or disability of the shareholder |
| | • | | Shares sold as part of a systematic withdrawal plan as described in the Fund’s prospectus |
| | • | | Return of excess contributions from an IRA Account |
| | • | | Shares sold as part of a required minimum distribution for IRA and retirement accounts due to the shareholder reaching age 70½ |
| | • | | Shares sold to pay Merrill Lynch fees but only if the transaction is initiated by Merrill Lynch |
| | • | | Shares acquired through a right of reinstatement |
| | • | | Shares held in retirement brokerage accounts, that are exchanged for a lower cost share class due to transfer to certain fee based accounts or platforms (applicable to A and C shares only) |
Front-end load Discounts Available at Merrill Lynch: Breakpoints, Rights of Accumulation & Letters of Intent
| | • | | Breakpoints as described in the Fund’s prospectus |
| | • | | Rights of Accumulation (ROA) which entitle shareholders to breakpoint discounts will be automatically calculated based on the aggregated holding of fund family assets held by accounts within the purchaser’s household at Merrill Lynch. Eligible fund family assets not held at Merrill Lynch may be included in the ROA calculation only if the shareholder notifies his or her financial advisor about such assets. |
| | • | | Letters of Intent (LOI) which allow for breakpoint discounts based on anticipated purchases within a fund family, through Merrill Lynch, over a 13-month period of time (if applicable) |
Morgan Stanley
Effective on or about July 1, 2018, shareholders purchasing Fund shares through a Morgan Stanley Wealth Management transactional brokerage account will be eligible only for the following Class A load waivers (front-end sales charge waivers), which may differ from and be more limited than those disclosed in the Fund’s prospectus or Statement of Additional Information.
Front-end Sales Load Waivers on Class A Shares Available at Morgan Stanley
| | • | | Employer-sponsored retirement plans (e.g., 401(k) plans, 457 plans, employer-sponsored 403(b) plans, profit sharing and money purchase pension plans and defined benefit plans). For purposes of this provision, employer-sponsored retirement plans do not include SEP IRAs, Simple IRAs, SAR-SEPs or Keogh plans. |
| | • | | Morgan Stanley employee and employee-related accounts according to Morgan Stanley’s account linking rules |
| | • | | Shares purchased through reinvestment of dividends and capital gains distributions when purchasing shares of the same fund |
| | • | | Shares purchased through a Morgan Stanley self-directed brokerage account |
| | | | | | |
| Appendix A (unaudited) | | Wells Fargo Traditional Small Cap Growth Fund | | | 35 | |
| | • | | Class C (i.e., level-load) shares that are no longer subject to a contingent deferred sales charge and are exchanged to Class A shares of the same fund pursuant to Morgan Stanley Wealth Management’s share class exchange program. |
| | • | | Shares purchased from the proceeds of redemptions within the same fund family, provided (i) the repurchase occurs within 90 days following the redemption, (ii) the redemption and purchase occur in the same account, and (iii) redeemed shares were subject to a front-end or deferred sales charge. This waiver is subject to the Fund’s policy regarding frequent purchases and redemption of Fund shares, as discussed under “Account Information—Frequent Purchases and Redemptions of Fund Shares” in the Fund’s prospectus. |
Raymond James & Associates, Inc., Raymond James Financial Services & Raymond James affiliates (“Raymond James”)
Effective on or about March 1, 2019, shareholders purchasing Fund shares through a Raymond James platform or account will be eligible only for the following load waivers (front-end sales charge waivers and contingent deferred, or back-end, sales charge waivers) and discounts, which may differ from those disclosed elsewhere in the Fund’s Prospectus or SAI.
Front-end Sales Load Waivers on Class A shares Available at Raymond James
| | • | | Shares purchased in an investment advisory program. |
| | • | | Shares purchased through reinvestment of capital gains distributions and dividend reinvestment when purchasing shares of the same fund (but not any other fund within the fund family). |
| | • | | Employees and registered representatives of Raymond James or its affiliates and their family members as designated by Raymond James. |
| | • | | Shares purchased from the proceeds of redemptions within the same fund family, provided (1) the repurchase occurs within 90 days following the redemption, (2) the redemption and purchase occur in the same account, and (3) redeemed shares were subject to a front-end or deferred sales load (known as Rights of Reinstatement). |
| | • | | A shareholder in the fund’s Class C shares will have their shares automatically exchanged at net asset value to Class A shares (or the appropriate share class) of the fund if the shares are no longer subject to a CDSC and the exchange is in line with the policies and procedures of Raymond James. |
CDSC Waivers on Class A and C Shares Available at Raymond James
| | • | | Death or disability of the shareholder. |
| | • | | Shares sold as part of a systematic withdrawal plan as described in the Fund’s Prospectus. |
| | • | | Return of excess contributions from an IRA Account. |
| | • | | Shares sold as part of a required minimum distribution for IRA and retirement accounts due to the shareholder reaching age 70½ as described in the Fund’s prospectus. |
| | • | | Shares sold to pay Raymond James fees but only if the transaction is initiated by Raymond James. |
| | • | | Shares acquired through a right of reinstatement. |
Front-end Load Discounts Available at Raymond James: Breakpoints, and/or Rights of Accumulation
| | • | | Breakpoints as described in the Fund’s Prospectus. |
| | • | | Rights of accumulation which entitle shareholders to breakpoint discounts will be automatically calculated based on the aggregated holding of fund family assets held by accounts within the purchaser’s household at Raymond James. Eligible fund family assets not held at Raymond James may be included in the rights of accumulation calculation only if the shareholder notifies his or her financial advisor about such assets. |
This page is intentionally left blank.

For more information
More information about Wells Fargo Funds is available free upon request. To obtain literature, please write, visit the Fund’s website, or call:
Wells Fargo Funds
P.O. Box 219967
Kansas City, MO 64121-9967
Website: wellsfargofunds.com
Individual investors: 1-800-222-8222
Retail investment professionals: 1-888-877-9275
Institutional investment professionals:
1-866-765-0778
This report and the financial statements contained herein are submitted for the general information of the shareholders of the Fund. If this report is used for promotional purposes, distribution of the report must be accompanied or preceded by a current prospectus. Before investing, please consider the investment objectives, risks, charges, and expenses of the investment. For a current prospectus and, if available, a summary prospectus, containing this information, call 1-800-222-8222 or visit the Fund’s website at wellsfargofunds.com. Read the prospectus carefully before you invest or send money.
Wells Fargo Asset Management (WFAM) is the trade name for certain investment advisory/management firms owned by Wells Fargo & Company. These firms include but are not limited to Wells Capital Management Incorporated and Wells Fargo Funds Management, LLC. Certain products managed by WFAM entities are distributed by Wells Fargo Funds Distributor, LLC (a broker/dealer and Member FINRA).
This material is for general informational and educational purposes only and is NOT intended to provide investment advice or a recommendation of any kind—including a recommendation for any specific investment, strategy, or plan.
NOT FDIC INSURED ◾ NO BANK GUARANTEE ◾ MAY LOSE VALUE
© 2018 Wells Fargo Funds Management, LLC. All rights reserved.
| | |
 | | 317301 11-18 SA247/SAR247 09-18 |
Semi-Annual Report
September 30, 2018

Wells Fargo Precious Metals Fund


Reduce clutter. Save trees.
Sign up for electronic delivery of prospectuses and shareholder reports at wellsfargo.com/advantagedelivery
Contents
The views expressed and any forward-looking statements are as of September 30, 2018, unless otherwise noted, and are those of the Fund managers and/or Wells Fargo Funds Management, LLC. Discussions of individual securities, or the markets generally, or any Wells Fargo Fund are not intended as individual recommendations. Future events or results may vary significantly from those expressed in any forward-looking statements. The views expressed are subject to change at any time in response to changing circumstances in the market. Wells Fargo Funds Management, LLC and the Fund disclaim any obligation to publicly update or revise any views expressed or forward-looking statements.
NOT FDIC INSURED ◾ NO BANK GUARANTEE ◾ MAY LOSE VALUE
| | | | |
| 2 | | Wells Fargo Precious Metals Fund | | Letter to shareholders (unaudited) |

Andrew Owen
President
Wells Fargo Funds
The second and third quarters of 2018 were characterized by growing economic and investment activity in the U.S.
Dear Shareholder:
We are pleased to offer you this semi-annual report for the Wells Fargo Precious Metals Fund for the six-month period that ended September 30, 2018. The second and third quarters of 2018 were characterized by growing economic and investment activity in the U.S. In contrast, economies overseas were restrained as geopolitical tensions and rising interest rates diverted investor interest in those markets.
For the period, U.S. stocks, as measured by the S&P 500 Index,1 gained 11.41% and international stocks, as measured by the MSCI ACWI ex USA Index (Net),2 lost 1.93%. Based on the MSCI EM Index (Net),3 emerging market stocks lost 8.97%. For bond investors, the Bloomberg Barclays U.S. Aggregate Bond Index4 lost 0.14% while the Bloomberg Barclays Global Aggregate ex-USD Index5 fell 6.42%. The Bloomberg Barclays Municipal Bond Index6 added 0.72%, and the ICE BofAML U.S. High Yield Index7 was up 3.46%.
Global trade tensions escalated during the second quarter.
During the second quarter of 2018, the U.S. government imposed tariffs, and foreign governments in North America, Europe, and Asia retaliated. The actions marked the initialization of trade tensions that would escalate during the next six months. The increasing tensions chilled investment activity as observers awaited signals of next steps.
Meanwhile, inflation continued an upward trend. The CPI-U8 added 0.1% in June after an increase of 0.2% in both April and May. On a year-over-year basis, the all-items index rose 2.9% for the 12 months that ended June 30, 2018. The index for all items less food and energy rose 2.3% for the same 12-month period.
| 1 | The S&P 500 Index consists of 500 stocks chosen for market size, liquidity, and industry group representation. It is a market-value-weighted index with each stock’s weight in the index proportionate to its market value. You cannot invest directly in an index. |
| 2 | The Morgan Stanley Capital International (MSCI) All Country World Index (ACWI) ex USA Index (Net) is a free-float-adjusted market-capitalization-weighted index that is designed to measure the equity market performance of developed markets, excluding the United States and Canada. Source: MSCI. MSCI makes no express or implied warranties or representations and shall have no liability whatsoever with respect to any MSCI data contained herein. The MSCI data may not be further redistributed or used as a basis for other indices or any securities or financial products. This report is not approved, reviewed, or produced by MSCI. You cannot invest directly in an index. |
| 3 | The MSCI Emerging Markets (EM) Index (Net) is a free-float-adjusted market-capitalization-weighted index that is designed to measure large- and mid-cap equity market performance of emerging markets. The MSCI EM Index (Net) consists of the following 24 emerging market country indices: Brazil, Chile, China, Colombia, Czech Republic, Egypt, Greece, Hungary, India, Indonesia, Korea, Malaysia, Mexico, Pakistan, Peru, the Philippines, Poland, Qatar, Russia, South Africa, Taiwan, Thailand, Turkey, and the United Arab Emirates. You cannot invest directly in an index. |
| 4 | The Bloomberg Barclays U.S. Aggregate Bond Index is a broad-based benchmark that measures the investment-grade, U.S. dollar-denominated, fixed-rate taxable bond market, including Treasuries, government-related and corporate securities, mortgage-backed securities (agency fixed-rate and hybrid adjustable-rate mortgage pass-throughs), asset-backed securities, and commercial mortgage-backed securities. You cannot invest directly in an index. |
| 5 | The Bloomberg Barclays Global Aggregate ex-USD Index is an unmanaged index that provides a broad-based measure of the global investment-grade fixed-income markets excluding the U.S. dollar-denominated debt market. You cannot invest directly in an index. |
| 6 | The Bloomberg Barclays Municipal Bond Index is an unmanaged index composed of long-term tax-exempt bonds with a minimum credit rating of Baa. You cannot invest directly in an index. |
| 7 | The ICE BofAML U.S. High Yield Index is a market-capitalization-weighted index of domestic and Yankee high-yield bonds. The index tracks the performance of high-yield securities traded in the U.S. bond market. You cannot invest directly in an index. Copyright 2018. ICE Data Indices, LLC. All rights reserved. |
| 8 | The Consumer Price Index for All Urban Consumers (CPI-U) measures the changes in the price of a basket of goods and services purchased by urban consumers. The urban consumer population is deemed by many as a better representative measure of the general public because close to 90% of the country’s population lives in highly populated areas. You cannot invest directly in an index. |
| | | | | | |
| Letter to shareholders (unaudited) | | Wells Fargo Precious Metals Fund | | | 3 | |
U.S. stocks gained while international stocks and bonds declined during the summer of 2018.
The U.S. economy strengthened during the summer months. Revised second-quarter gross domestic product data released in August showed the U.S. economy growing at a 4.2% rate. After ticking up slightly in June, the unemployment rate in the U.S. was 3.9% in July and August, according to the U.S. Department of Labor. Wages showed more consistent growth, and consumer confidence remained strong.
Several U.S. equity market indices reached records during August, with the S&P 500 Index gaining 7.76% for the three-month period that ended August 31, 2018. International stock values continued to suffer under the effects of a strong U.S. dollar and continuing trade tensions. The MSCI ACWI ex USA Index (Net) and the MSCI EM Index (Net) were down 4.70% and 1.64%, during the same three-month period.
The U.S. Federal Reserve (Fed) increased the federal funds rate in June, and expectations grew that two more rate increases were in the offing in 2018. Long-term interest rates in the U.S. remained at higher levels relative to the prior 10 years. Rates on 10-year and 30-year Treasury bonds—2.74% and 2.97%, respectively, on March 31, 2018—were 3.05% and 3.19%, respectively, on September 30, off their peak levels on May 17, 2018, of 3.11% and 3.25%, respectively. Some investors became more aware of and concerned about the potential for an inverted yield curve—sometimes a recession signal—as short-term rates increased more quickly than long-term rates. The Fed decided to forgo an interest rate increase at its August meeting.
Internationally, members of Prime Minister Theresa May’s U.K./Brexit negotiating team resigned amid unproductive negotiations. In early August, the Bank of England’s Monetary Policy Committee increased its key interest rate to 0.75%. Central banks in Europe and Japan maintained low interest rates and accommodative monetary policies. Amid rising trade uncertainty, the People’s Bank of China cut reserve requirement ratios and accelerated infrastructure spending and tax cuts for business enterprises and individuals. Nevertheless, a strengthening U.S. dollar and the trade tensions remained headwinds for investors overseas.
Don’t let short-term uncertainty derail long-term investment goals.
Periods of investment uncertainty can present challenges, but experience has taught us that maintaining long-term investment goals can be an effective way to plan for the future. To help you create a sound strategy based on your personal goals and risk tolerance, Wells Fargo Funds offers more than 100 mutual funds spanning a wide range of asset classes and investment styles. Although diversification cannot guarantee an investment profit or prevent losses, we believe it can be an effective way to manage investment risk and potentially smooth out overall portfolio performance. We encourage investors to know their investments and to understand that appropriate levels of risk-taking may unlock opportunities.
The U.S. economy strengthened during the summer months.
| | | | |
| 4 | | Wells Fargo Precious Metals Fund | | Letter to shareholders (unaudited) |
Thank you for choosing to invest with Wells Fargo Funds. We appreciate your confidence in us and remain committed to helping you meet your financial needs.
Sincerely,

Andrew Owen
President
Wells Fargo Funds
Notice to shareholders
At a meeting held on August 14-15, 2018, the Board of Trustees of the Fund approved the following policy which will be effective on or about February 5, 2019:
Class C shares will convert automatically into Class A shares ten years after the initial date of purchase or, if you acquired your Class C shares through an exchange or conversion from another share class, ten years after the date you acquired your Class C shares. When Class C shares that you acquired through a purchase or exchange convert, any other Class C shares that you purchased with reinvested dividends and distributions also will convert into Class A shares on a pro rata basis. A shorter holding period may also apply depending on your intermediary. Please see “Appendix A—Sales Charge Reductions and Waivers for Certain Intermediaries” in the Fund’s prospectus or at the end of this report.
For further information about your Fund, contact your investment professional, visit our website at wellsfargofunds.com, or call us directly at 1-800-222-8222.
This page is intentionally left blank.
| | | | |
| 6 | | Wells Fargo Precious Metals Fund | | Performance highlights (unaudited) |
Investment objective
The Fund seeks long-term capital appreciation.
Manager
Wells Fargo Funds Management, LLC
Subadviser
Wells Capital Management Incorporated
Portfolio managers
Michael Bradshaw, CFA®
Oleg Makhorine
Average annual total returns (%) as of September 30, 20181
| | | | | | | | | | | | | | | | | | | | | | | | | | | | | | | | | | |
| | | | | Including sales charge | | | Excluding sales charge | | | Expense ratios2 (%) | |
| | | Inception date | | 1 year | | | 5 year | | | 10 year | | | 1 year | | | 5 year | | | 10 year | | | Gross | | | Net3 | |
| Class A (EKWAX) | | 1-20-1998 | | | (25.93 | ) | | | (6.87 | ) | | | (4.13 | ) | | | (21.42 | ) | | | (5.76 | ) | | | (3.56 | ) | | | 1.21 | | | | 1.09 | |
| Class C (EKWCX) | | 1-29-1998 | | | (23.02 | ) | | | (6.47 | ) | | | (4.28 | ) | | | (22.02 | ) | | | (6.47 | ) | | | (4.28 | ) | | | 1.96 | | | | 1.84 | |
| Administrator Class (EKWDX) | | 7-30-2010 | | | – | | | | – | | | | – | | | | (21.31 | ) | | | (5.63 | ) | | | (3.43 | ) | | | 1.13 | | | | 0.95 | |
| Institutional Class (EKWYX) | | 2-29-2000 | | | – | | | | – | | | | – | | | | (21.18 | ) | | | (5.49 | ) | | | (3.27 | ) | | | 0.88 | | | | 0.79 | |
| FTSE Gold Mines Index4 | | – | | | – | | | | – | | | | – | | | | (21.33 | ) | | | (4.34 | ) | | | (5.47 | ) | | | – | | | | – | |
| S&P 500 Index5 | | – | | | – | | | | – | | | | – | | | | 17.91 | | | | 13.95 | | | | 11.97 | | | | – | | | | – | |
Figures quoted represent past performance, which is no guarantee of future results, and do not reflect taxes that a shareholder may pay on fund distributions or the redemption of fund shares. Investment return and principal value of an investment will fluctuate so that an investor’s shares, when redeemed, may be worth more or less than their original cost. Performance shown without sales charges would be lower if sales charges were reflected. Current performance may be lower or higher than the performance data quoted, which assumes the reinvestment of dividends and capital gains. Current month-end performance is available on the Fund’s website, wellsfargofunds.com.
While the S&P 500 Index is comprised of U.S. equity securities of companies diversified across ten sectors, the Fund’s holdings are concentrated primarily in precious metals related stocks. Therefore, the performance of the S&P 500 Index is displayed only to show how the concentrated Fund performed compared with a diversified selection of U.S. equity securities.
Index returns do not include transaction costs associated with buying and selling securities, any mutual fund fees or expenses, or any taxes. It is not possible to invest directly in an index.
For Class A shares, the maximum front-end sales charge is 5.75%. For Class C shares, the maximum contingent deferred sales charge is 1.00%. Performance including a contingent deferred sales charge assumes the sales charge for the corresponding time period. Administrator Class and Institutional Class shares are sold without a front-end sales charge or contingent deferred sales charge.
Stock values fluctuate in response to the activities of individual companies and general market and economic conditions. Bond values fluctuate in response to the financial condition of individual issuers, general market and economic conditions, and changes in interest rates. Changes in market conditions and government policies may lead to periods of heightened volatility in the bond market and reduced liquidity for certain bonds held by the Fund. In general, when interest rates rise, bond values fall and investors may lose principal value. Interest rate changes and their impact on the Fund and its share price can be sudden and unpredictable. Funds that concentrate their investments in limited sectors, such as gold-related investments, are more vulnerable to adverse market, economic, regulatory, political, or other developments affecting those sectors. Certain investment strategies tend to increase the total risk of an investment (relative to the broader market). The Fund is exposed to foreign investment risk, geographic, non-diversification risk, smaller-company securities risk, and subsidiary risk. Consult the Fund’s prospectus for additional information on these and other risks.
Please see footnotes on page 7.
| | | | | | |
| Performance highlights (unaudited) | | Wells Fargo Precious Metals Fund | | | 7 | |
| | | | |
| Ten largest holdings (%) as of September 30, 20186 | |
Randgold Resources Limited ADR | | | 7.47 | |
Newmont Mining Corporation | | | 6.89 | |
Kirkland Lake Gold Limited | | | 6.00 | |
Newcrest Mining Limited | | | 5.51 | |
Royal Gold Incorporated | | | 5.40 | |
Gold Bullion | | | 4.62 | |
Kinross Gold Corporation | | | 4.58 | |
Franco-Nevada Corporation-Legend Shares | | | 3.57 | |
Agnico Eagle Mines Limited-U.S. Exchange Traded Shares | | | 3.47 | |
B2Gold Corporation | | | 3.14 | |
|
| Country allocation as of September 30, 20187 |
|
 |
| 1 | Historical performance shown for Administrator Class shares prior to their inception reflects the performance of Institutional Class shares and has been adjusted to reflect the higher expenses applicable to Administrator Class shares. Historical performance shown for all classes of the Fund prior July 19, 2010, is based on the Fund’s predecessor Evergreen Precious Metals Fund. |
| 2 | Reflects the expense ratios as stated in the most recent prospectuses. The expense ratios shown are subject to change and may differ from the annualized expense ratios shown in the financial highlights of this report. |
| 3 | The manager has contractually committed through July 31, 2019, to waive fees and/or reimburse expenses to the extent necessary to cap the Fund’s Total Annual Fund Operating Expenses After Fee Waivers at the amounts shown. After this time, the cap may be increased or the commitment to maintain the cap may be terminated only with the approval of the Board of Trustees. Brokerage commissions, stamp duty fees, interest, taxes, acquired fund fees and expenses (if any), fees and expenses of its wholly-owned subsidiary, and extraordinary expenses are excluded from the expense cap. Without this cap, the Fund’s returns would have been lower. The expense ratio paid by an investor is the net expense ratio (the total annual fund operating expenses after fee waivers) as stated in the prospectuses. |
| 4 | FTSE Gold Mines Index is an unmanaged, open-ended index designed to reflect the performance of the worldwide market in the shares of companies whose principal activity is the mining of gold. You cannot invest directly in an index. |
| 5 | The S&P 500 Index consists of 500 stocks chosen for market size, liquidity, and industry group representation. It is a market-value weighted index with each stock’s weight in the index proportionate to its market value. You cannot invest directly in an index. |
| 6 | The ten largest holdings, excluding cash, cash equivalents and any money market funds, are calculated based on the value of the investments divided by total net assets of the Fund. Holdings are subject to change and may have changed since the date specified. |
| 7 | Amounts are calculated based on the total long-term investments of the Fund. These amounts are subject to change and may have changed since the date specified. |
| | | | |
| 8 | | Wells Fargo Precious Metals Fund | | Fund expenses (unaudited) |
As a shareholder of the Fund, you incur two types of costs: (1) transaction costs, including sales charges (loads) on purchase payments and contingent deferred sales charges (if any) on redemptions and (2) ongoing costs, including management fees, distribution (12b-1) and/or shareholder servicing fees, and other Fund expenses. This example is intended to help you understand your ongoing costs (in dollars) of investing in the Fund and to compare these costs with the ongoing costs of investing in other mutual funds.
The example is based on an investment of $1,000 invested at the beginning of the six-month period and held for the entire period from April 1, 2018 to September 30, 2018.
Actual expenses
The “Actual” line of the table below provides information about actual account values and actual expenses. You may use the information in this line, together with the amount you invested, to estimate the expenses that you paid over the period. Simply divide your account value by $1,000 (for example, an $8,600 account value divided by $1,000 = 8.6), then multiply the result by the number in the “Actual” line under the heading entitled “Expenses paid during period” for your applicable class of shares to estimate the expenses you paid on your account during this period.
Hypothetical example for comparison purposes
The “Hypothetical” line of the table below provides information about hypothetical account values and hypothetical expenses based on the Fund’s actual expense ratio and an assumed rate of return of 5% per year before expenses, which is not the Fund’s actual return. The hypothetical account values and expenses may not be used to estimate the actual ending account balance or expenses you paid for the period. You may use this information to compare the ongoing costs of investing in the Fund and other funds. To do so, compare this 5% hypothetical example with the 5% hypothetical examples that appear in the shareholder reports of the other funds.
Please note that the expenses shown in the table are meant to highlight your ongoing costs only and do not reflect any transactional costs, such as sales charges (loads) and contingent deferred sales charges. Therefore, the “Hypothetical” line of the table is useful in comparing ongoing costs only and will not help you determine the relative total costs of owning different funds. In addition, if these transactional costs were included, your costs would have been higher.
| | | | | | | | | | | | | | | | |
| | | Beginning
account value
4-1-2018 | | | Ending
account value
9-30-2018 | | | Expenses
paid during
the period¹ | | | Annualized net
expense ratio | |
Class A | | | | | | | | | | | | | | | | |
Actual | | $ | 1,000.00 | | | $ | 852.44 | | | $ | 5.06 | | | | 1.09 | % |
Hypothetical (5% return before expenses) | | $ | 1,000.00 | | | $ | 1,019.60 | | | $ | 5.52 | | | | 1.09 | % |
Class C | | | | | | | | | | | | | | | | |
Actual | | $ | 1,000.00 | | | $ | 849.09 | | | $ | 8.53 | | | | 1.84 | % |
Hypothetical (5% return before expenses) | | $ | 1,000.00 | | | $ | 1,015.84 | | | $ | 9.30 | | | | 1.84 | % |
Administrator Class | | | | | | | | | | | | | | | | |
Actual | | $ | 1,000.00 | | | $ | 852.83 | | | $ | 4.41 | | | | 0.95 | % |
Hypothetical (5% return before expenses) | | $ | 1,000.00 | | | $ | 1,020.31 | | | $ | 4.81 | | | | 0.95 | % |
Institutional Class | | | | | | | | | | | | | | | | |
Actual | | $ | 1,000.00 | | | $ | 853.75 | | | $ | 3.67 | | | | 0.79 | % |
Hypothetical (5% return before expenses) | | $ | 1,000.00 | | | $ | 1,021.11 | | | $ | 4.00 | | | | 0.79 | % |
| 1 | Expenses paid is equal to the annualized net expense ratio of each class multiplied by the average account value over the period, multiplied by the number of days in the most recent fiscal half-year divided by the number of days in the fiscal year (to reflect the one-half-year period). |
| | | | | | |
| Consolidated portfolio of investments—September 30, 2018 (unaudited) | | Wells Fargo Precious Metals Fund | | | 9 | |
| | | | | | | | | | | | | | | | |
| Security name | | | | | | | | Shares | | | Value | |
| | | |
Common Stocks: 94.47% | | | | | | | | | | | | | |
| | | |
| Australia: 10.04% | | | | | | | | | | | | | |
Evolution Mining Limited (Materials, Metals & Mining) | | | | | | | | | | | 3,100,000 | | | $ | 5,938,212 | |
Newcrest Mining Limited (Materials, Metals & Mining) | | | | | | | | | | | 982,294 | | | | 13,782,093 | |
Northern Star Resources Limited (Materials, Metals & Mining) | | | | | | | | | | | 900,000 | | | | 5,399,689 | |
| | | | |
| | | | | | | | | | | | | | | 25,119,994 | |
| | | | | | | | | | | | | | | | |
| | | |
| Canada: 60.49% | | | | | | | | | | | | | |
Agnico Eagle Mines Limited-U.S. Exchange Traded Shares (Materials, Metals & Mining) | | | | | | | | | | | 254,164 | | | | 8,692,409 | |
Agnico-Eagle Mines Limited (Materials, Metals & Mining) | | | | | | | | | | | 225,370 | | | | 7,698,157 | |
Agnico-Eagle Mines Limited-Legend Shares (Materials, Metals & Mining) | | | | | | | | | | | 35,000 | | | | 1,197,000 | |
Alamos Gold Incorporated Class A (Materials, Metals & Mining) | | | | | | | | | | | 1,453,980 | | | | 6,675,261 | |
B2Gold Corporation (Materials, Metals & Mining)† | | | | | | | | | | | 3,450,000 | | | | 7,852,746 | |
Barrick Gold Corporation (Materials, Metals & Mining) | | | | | | | | | | | 609,083 | | | | 6,748,640 | |
Centerra Gold Incorporated-Legend Shares (Materials, Metals & Mining)144A | | | | | | | | | | | 350,000 | | | | 1,395,502 | |
Continental Gold Incorporated (Materials, Metals & Mining)† | | | | | | | | | | | 600,000 | | | | 1,221,693 | |
Detour Gold Corporation (Materials, Metals & Mining)† | | | | | | | | | | | 91,057 | | | | 735,985 | |
Detour Gold Corporation-Legend Shares (Materials, Metals & Mining)†144A | | | | | | | | | | | 525,000 | | | | 4,243,410 | |
Detour Gold Corporation-Legend Shares (Materials, Metals & Mining)† | | | | | | | | | | | 90,000 | | | | 727,442 | |
Endeavour Mining Corporation (Materials, Metals & Mining)† | | | | | | | | | | | 390,000 | | | | 6,087,098 | |
Franco-Nevada Corporation (Materials, Metals & Mining) | | | | | | | | | | | 10,000 | | | | 625,556 | |
Franco-Nevada Corporation-Legend Shares (Materials, Metals & Mining)144A | | | | | | | | | | | 142,948 | | | | 8,942,204 | |
Goldcorp Incorporated (Materials, Metals & Mining) | | | | | | | | | | | 737,454 | | | | 7,513,565 | |
Goldcorp Incorporated-U.S. Exchange Traded Shares (Materials, Metals & Mining) | | | | | | | | | | | 265,694 | | | | 2,710,079 | |
IAMGOLD Corporation (Materials, Metals & Mining)† | | | | | | | | | | | 1,675,000 | | | | 6,159,757 | |
Kinross Gold Corporation (Materials, Metals & Mining)† | | | | | | | | | | | 4,200,553 | | | | 11,447,331 | |
Kirkland Lake Gold Limited (Materials, Metals & Mining) | | | | | | | | | | | 792,000 | | | | 15,010,382 | |
Mag Silver Corporation (Materials, Metals & Mining)† | | | | | | | | | | | 600,000 | | | | 4,849,611 | |
Mag Silver Corporation-Legend Shares (Materials, Metals & Mining) | | | | | | | | | | | 100,000 | | | | 808,268 | |
OceanaGold Corporation (Materials, Metals & Mining) | | | | | | | | | | | 1,650,000 | | | | 4,982,000 | |
Osisko Gold Royalties Limited (Materials, Metals & Mining) | | | | | | | | | | | 246,700 | | | | 1,871,761 | |
Pan American Silver Corporation (Materials, Metals & Mining) | | | | | | | | | | | 440,000 | | | | 6,494,400 | |
Pretium Resources Incorporated (Materials, Metals & Mining)† | | | | | | | | | | | 100,000 | | | | 760,268 | |
Semafo Incorporated (Materials, Metals & Mining)† | | | | | | | | | | | 2,560,400 | | | | 6,026,103 | |
SSR Mining Incorporated (Materials, Metals & Mining)† | | | | | | | | | | | 480,000 | | | | 4,180,800 | |
Tahoe Resources Incorporated-Legend Shares (Materials, Metals & Mining) | | | | | | | | | | | 280,000 | | | | 773,894 | |
Torex Gold Resources Incorporated (Materials, Metals & Mining)† | | | | | | | | | | | 275,000 | | | | 2,335,579 | |
Torex Gold Resources Incorporated-Legend Shares (Materials, Metals & Mining)† | | | | | | | | | | | 185,000 | | | | 1,571,207 | |
Torex Gold Resources Incorporated-Legend Shares (Materials, Metals & Mining)†144A | | | | | | | | | | | 266,250 | | | | 2,261,265 | |
Wheaton Precious Metals Corporation (Materials, Metals & Mining) | | | | | | | | | | | 12,950 | | | | 226,586 | |
Wheaton Precious Metals Corporation-U.S. Exchange Traded Shares (Materials, Metals & Mining) | | | | | | | | | | | 400,000 | | | | 7,000,000 | |
Yamana Gold Incorporated (Materials, Metals & Mining) | | | | | | | | | | | 600,000 | | | | 1,495,761 | |
| | | | |
| | | | | | | | | | | | | | | 151,321,720 | |
| | | | | | | | | | | | | | | | |
| | | |
| Peru: 0.67% | | | | | | | | | | | | | |
Compania de Minas Buenaventura SA ADR (Materials, Metals & Mining) | | | | | | | | | | | 125,000 | | | | 1,676,250 | |
| | | | | | | | | | | | | | | | |
| | | |
| South Africa: 0.74% | | | | | | | | | | | | | |
AngloGold Ashanti Limited ADR (Materials, Metals & Mining) | | | | | | | | | | | 215,591 | | | | 1,849,771 | |
| | | | | | | | | | | | | | | | |
The accompanying notes are an integral part of these financial statements.
| | | | |
| 10 | | Wells Fargo Precious Metals Fund | | Consolidated portfolio of investments—September 30, 2018 (unaudited) |
| | | | | | | | | | | | | | | | |
| Security name | | | | | | | | Shares | | | Value | |
| | | | |
| United Kingdom: 10.24% | | | | | | | | | | | | | | | | |
Centamin plc (Materials, Metals & Mining) | | | | | | | | | | | 750,000 | | | $ | 1,038,158 | |
Fresnillo plc (Materials, Metals & Mining) | | | | | | | | | | | 550,000 | | | | 5,888,372 | |
Randgold Resources Limited ADR (Materials, Metals & Mining) | | | | | | | | | | | 265,000 | | | | 18,695,750 | |
| | | | |
| | | | | | | | | | | | | | | 25,622,280 | |
| | | | | | | | | | | | | | | | |
| | | | |
| United States: 12.29% | | | | | | | | | | | | | | | | |
Newmont Mining Corporation (Materials, Metals & Mining) | | | | | | | | | | | 570,455 | | | | 17,227,741 | |
Royal Gold Incorporated (Materials, Metals & Mining) | | | | | | | | | | | 175,436 | | | | 13,519,098 | |
| | | | |
| | | | | | | | | | | | | | | 30,746,839 | |
| | | | | | | | | | | | | | | | |
| | | | |
Total Common Stocks (Cost $208,338,706) | | | | | | | | | | | | | | | 236,336,854 | |
| | | | | | | | | | | | | | | | |
| | | | |
| | | | | | | | | Troy ounces | | | | |
| Commodities: 4.62% | | | | | | | | | | | | | | | | |
Gold Bullion †** | | | | | | | | | | | 9,690 | | | | 11,548,300 | |
| | | | | | | | | | | | | | | | |
| | | | |
Total Commodities (Cost $5,772,407) | | | | | | | | | | | | | | | 11,548,300 | |
| | | | | | | | | | | | | | | | |
| | | | |
| | | Yield | | | | | | Shares | | | | |
| Short-Term Investments: 1.17% | | | | | | | | | | | | | | | | |
| | | | |
| Investment Companies: 1.17% | | | | | | | | | | | | | | | | |
Wells Fargo Government Money Market Fund Select Class (l)(u) | | | 1.99 | % | | | | | | | 2,933,700 | | | | 2,933,700 | |
| | | | | | | | | | | | | | | | |
| | | | |
Total Short-Term Investments (Cost $2,933,700) | | | | | | | | | | | | | | | 2,933,700 | |
| | | | | | | | | | | | | | | | |
| | | | | | | | |
| Total investments in securities (Cost $217,044,813) | | | 100.26 | % | | | 250,818,854 | |
Other assets and liabilities, net | | | (0.26 | ) | | | (655,618 | ) |
| | | | | | | | |
| Total net assets | | | 100.00 | % | | $ | 250,163,236 | |
| | | | | | | | |
| † | Non-income-earning security |
| 144A | The security may be resold in transactions exempt from registration, normally to qualified institutional buyers, pursuant to Rule 144A under the Securities Act of 1933. |
| ** | Represents an investment held in Special Investments (Cayman) SPC, the consolidated entity. |
| (l) | The issuer of the security is an affiliated person of the Fund as defined in the Investment Company Act of 1940. |
| (u) | The rate represents the 7-day annualized yield at period end. |
| | |
| Abbreviations: |
ADR | | American depositary receipt |
Investments in Affiliates
An affiliated investment is an investment in which the Fund owns at least 5% of the outstanding voting shares of the issuer or as a result of other relationships, such as the Fund and the issuer having the same investment manager. Transactions with issuers that were either affiliated persons of the Fund at the beginning of the period or the end of the period were as follows:
| | | | | | | | | | | | | | | | | | | | | | | | | | | | | | | | | | | | |
| | | Shares,
beginning of
period | | | Shares
purchased | | | Shares
sold | | | Shares,
end of
period | | | Net
realized
gains
(losses) | | | Net
change in
unrealized
gains
(losses) | | | Income
from
affiliated
securities | | | Value,
end
of period | | | % of
net
assets | |
Short-Term Investments | | | | | | | | | | | | | | | | | | | | | | | | | | | | | | | | | | | | |
Investment Companies | | | | | | | | | | | | | | | | | | | | | | | | | | | | | | | | | | | | |
Wells Fargo Government Money Market Fund Select Class | | | 4,941,346 | | | | 39,438,431 | | | | 41,446,077 | | | | 2,933,700 | | | $ | 0 | | | $ | 0 | | | $ | 44,205 | | | $ | 2,933,700 | | | | 1.17 | % |
The accompanying notes are an integral part of these financial statements.
| | | | | | |
| Consolidated statement of assets and liabilities—September 30, 2018 (unaudited) | | Wells Fargo Precious Metals Fund | | | 11 | |
| | | | |
| | | | |
| |
Assets | | | | |
Investments in unaffiliated securities, at value (cost $208,338,706) | | $ | 236,336,854 | |
Investments commodities, at value (cost $5,772,407) | | | 11,548,300 | |
Investments in affiliated securities, at value (cost $2,933,700) | | | 2,933,700 | |
Cash | | | 71,903 | |
Foreign currency, at value (cost $718,148) | | | 718,361 | |
Receivable for investments sold | | | 1,291 | |
Receivable for Fund shares sold | | | 539,728 | |
Receivable for dividends | | | 180,497 | |
Prepaid expenses and other assets | | | 64,513 | |
| | | | |
Total assets | | | 252,395,147 | |
| | | | |
| |
Liabilities | | | | |
Payable for Fund shares redeemed | | | 1,839,799 | |
Management fee payable | | | 104,634 | |
Administration fees payable | | | 37,374 | |
Distribution fee payable | | | 14,940 | |
Trustees’ fees and expenses payable | | | 2,869 | |
Accrued expenses and other liabilities | | | 232,295 | |
| | | | |
Total liabilities | | | 2,231,911 | |
| | | | |
Total net assets | | $ | 250,163,236 | |
| | | | |
| |
NET ASSETS CONSIST OF | | | | |
Paid-in capital | | $ | 412,971,249 | |
Total distributable loss | | | (162,808,013 | ) |
| | | | |
Total net assets | | $ | 250,163,236 | |
| | | | |
| |
COMPUTATION OF NET ASSET VALUE AND OFFERING PRICE PER SHARE | | | | |
Net assets – Class A | | $ | 138,344,670 | |
Shares outstanding – Class A1 | | | 4,948,714 | |
Net asset value per share – Class A | | | $27.96 | |
Maximum offering price per share – Class A2 | | | $29.67 | |
Net assets – Class C | | $ | 24,136,673 | |
Shares outstanding – Class C1 | | | 977,324 | |
Net asset value per share – Class C | | | $24.70 | |
Net assets – Administrator Class | | $ | 7,648,262 | |
Shares outstanding – Administrator Class1 | | | 271,046 | |
Net asset value per share – Administrator Class | | | $28.22 | |
Net assets – Institutional Class | | $ | 80,033,631 | |
Shares outstanding – Institutional Class1 | | | 2,815,548 | |
Net asset value per share – Institutional Class | | | $28.43 | |
| 1 | The Fund has an unlimited number of authorized shares. |
| 2 | Maximum offering price is computed as 100/94.25 of net asset value. On investments of $50,000 or more, the offering price is reduced. |
The accompanying notes are an integral part of these financial statements.
| | | | |
| 12 | | Wells Fargo Precious Metals Fund | | Consolidated statement of operations—six months ended September 30, 2018 (unaudited) |
| | | | |
| | | | |
| |
Investment income | | | | |
Dividends (net of foreign withholding taxes of $76,163) | | $ | 1,173,438 | |
Income from affiliated securities | | | 44,205 | |
| | | | |
Total investment income | | | 1,217,643 | |
| | | | |
| |
Expenses | | | | |
Management fee | | | 953,722 | |
Administration fees | | | | |
Class A | | | 172,796 | |
Class C | | | 31,568 | |
Administrator Class | | | 5,738 | |
Institutional Class | | | 58,495 | |
Shareholder servicing fees | | | | |
Class A | | | 205,710 | |
Class C | | | 37,582 | |
Administrator Class | | | 11,034 | |
Distribution fee | | | | |
Class C | | | 112,745 | |
Custody and accounting fees | | | 22,726 | |
Professional fees | | | 32,484 | |
Registration fees | | | 34,721 | |
Shareholder report expenses | | | 37,807 | |
Trustees’ fees and expenses | | | 10,973 | |
Transfer agent fees | | | 2,777 | |
Other fees and expenses | | | 14,338 | |
| | | | |
Total expenses | | | 1,745,216 | |
Less: Fee waivers and/or expense reimbursements | | | (169,454 | ) |
| | | | |
Net expenses | | | 1,575,762 | |
| | | | |
Net investment loss | | | (358,119 | ) |
| | | | |
| |
REALIZED AND UNREALIZED GAINS (LOSSES) ON INVESTMENTS | | | | |
| |
Net realized losses on investments | | | (5,316,703 | ) |
| |
Net change in unrealized gains (losses) on: | | | | |
Unaffiliated securities | | | (37,503,726 | ) |
Commodities | | | (1,305,744 | ) |
| | | | |
Net change in unrealized gains (losses) on investments | | | (38,809,470 | ) |
| | | | |
Net realized and unrealized gains (losses) on investments | | | (44,126,173 | ) |
| | | | |
Net decrease in net assets resulting from operations | | $ | (44,484,292 | ) |
| | | | |
The accompanying notes are an integral part of these financial statements.
| | | | | | |
| Consolidated statement of changes in net assets | | Wells Fargo Precious Metals Fund | | | 13 | |
| | | | | | | | | | | | | | | | |
| | | Six months ended
September 30, 2018
(unaudited) | | | Year ended
March 31, 20181 | |
| | | | |
Operations | | | | | | | | | | | | | | | | |
Net investment loss | | | | | | $ | (358,119 | ) | | | | | | $ | (1,185,623 | ) |
Net realized losses on investments | | | | | | | (5,316,703 | ) | | | | | | | (589,728 | ) |
Net change in unrealized gains (losses) on investments | | | | | | | (38,809,470 | ) | | | | | | | (24,177,396 | ) |
| | | | |
Net decrease in net assets resulting from operations | | | | | | | (44,484,292 | ) | | | | | | | (25,952,747 | ) |
| | | | |
| | | | |
Distributions to shareholders | | | | | | | | | | | | | | | | |
Class A | | | | | | | 0 | | | | | | | | (2,808,058 | ) |
Class C | | | | | | | 0 | | | | | | | | (414,068 | ) |
Administrator Class | | | | | | | 0 | | | | | | | | (169,120 | ) |
Institutional Class | | | | | | | 0 | | | | | | | | (1,238,811 | ) |
| | | | |
Total distributions to shareholders | | | | | | | 0 | | | | | | | | (4,630,057 | ) |
| | | | |
| | | | |
Capital share transactions | | | Shares | | | | | | | | Shares | | | | | |
Proceeds from shares sold | | | | | | | | | | | | | | | | |
Class A | | | 396,810 | | | | 12,500,407 | | | | 1,343,343 | | | | 47,874,671 | |
Class C | | | 18,742 | | | | 532,103 | | | | 71,931 | | | | 2,255,869 | |
Administrator Class | | | 9,742 | | | | 319,156 | | | | 312,074 | | | | 11,409,031 | |
Institutional Class | | | 1,003,606 | | | | 33,389,268 | | | | 1,240,353 | | | | 44,707,060 | |
| | | | |
| | | | | | | 46,740,934 | | | | | | | | 106,246,631 | |
| | | | |
Reinvestment of distributions | | | | | | | | | | | | | | | | |
Class A | | | 0 | | | | 0 | | | | 76,499 | | | | 2,579,538 | |
Class C | | | 0 | | | | 0 | | | | 12,259 | | | | 367,387 | |
Administrator Class | | | 0 | | | | 0 | | | | 4,880 | | | | 165,920 | |
Institutional Class | | | 0 | | | | 0 | | | | 34,049 | | | | 1,164,824 | |
| | | | |
| | | | | | | 0 | | | | | | | | 4,277,669 | |
| | | | |
Payment for shares redeemed | | | | | | | | | | | | | | | | |
Class A | | | (870,454 | ) | | | (27,666,161 | ) | | | (2,732,751 | ) | | | (97,070,775 | ) |
Class B | | | N/A | | | | N/A | | | | (9,235 | )2 | | | (291,832 | )2 |
Class C | | | (176,736 | ) | | | (4,940,881 | ) | | | (467,766 | ) | | | (14,797,679 | ) |
Administrator Class | | | (15,195 | ) | | | (483,972 | ) | | | (463,024 | ) | | | (16,820,569 | ) |
Institutional Class | | | (669,896 | ) | | | (21,681,346 | ) | | | (1,251,776 | ) | | | (44,720,355 | ) |
| | | | |
| | | | | | | (54,772,360 | ) | | | | | | | (173,701,210 | ) |
| | | | |
Net decrease in net assets resulting from capital share transactions | | | | | | | (8,031,426 | ) | | | | | | | (63,176,910 | ) |
| | | | |
Total decrease in net assets | | | | | | | (52,515,718 | ) | | | | | | | (93,759,714 | ) |
| | | | |
| | | | |
Net assets | | | | | | | | | | | | | | | | |
Beginning of period | | | | | | | 302,678,954 | | | | | | | | 396,438,668 | |
| | | | |
End of period | | | | | | $ | 250,163,236 | | | | | | | $ | 302,678,954 | |
| | | | |
| 1 | Effective for all filings after November 4, 2018, the SEC prospectively eliminated the requirements to parenthetically disclose undistributed net investment income at the end of the period and to disaggregate distributions to shareholders between distributions from net investment income and distributions from realized gains. Accumulated net investment loss at March 31, 2018 was $12,736. The disaggregated distributions information for the year ended March 31, 2018 is included in Note 8, Distributions to Shareholders, in the notes to the financial statements. |
| 2 | For the period from April 1, 2017 to May 5, 2017. Effective at the close of business on May 5, 2017, Class B shares were converted to Class A shares and are no longer offered by the Fund. |
The accompanying notes are an integral part of these financial statements.
| | | | |
| 14 | | Wells Fargo Precious Metals Fund | | Consolidated financial highlights |
(For a share outstanding throughout each period)
| | | | | | | | | | | | | | | | | | | | | | | | |
| | | Six months ended
September 30, 2018 (unaudited) | | | Year ended March 31 | |
| CLASS A | | 2018 | | | 2017 | | | 2016 | | | 2015 | | | 20141 | |
Net asset value, beginning of period | | | $32.80 | | | | $35.99 | | | | $32.73 | | | | $28.99 | | | | $36.65 | | | | $53.59 | |
Net investment income (loss) | | | (0.04 | )2 | | | (0.11 | )2 | | | (0.22 | )2 | | | (0.05 | ) | | | (0.11 | )2 | | | 0.05 | 2 |
Net realized and unrealized gains (losses) on investments | | | (4.80 | ) | | | (2.60 | ) | | | 3.85 | | | | 3.79 | | | | (7.55 | ) | | | (16.78 | ) |
| | | | | | | | | | | | | | | | | | | | | | | | |
Total from investment operations | | | (4.84 | ) | | | (2.71 | ) | | | 3.63 | | | | 3.74 | | | | (7.66 | ) | | | (16.73 | ) |
Distributions to shareholders from | | | | | | | | | | | | | | | | | | | | | | | | |
Net investment income | | | 0.00 | | | | (0.48 | ) | | | (0.37 | ) | | | 0.00 | | | | 0.00 | | | | 0.00 | |
Net realized gains | | | 0.00 | | | | 0.00 | | | | 0.00 | | | | 0.00 | | | | 0.00 | | | | (0.21 | ) |
| | | | | | | | | | | | | | | | | | | | | | | | |
Total distributions to shareholders | | | 0.00 | | | | (0.48 | ) | | | (0.37 | ) | | | 0.00 | | | | 0.00 | | | | (0.21 | ) |
Net asset value, end of period | | | $27.96 | | | | $32.80 | | | | $35.99 | | | | $32.73 | | | | $28.99 | | | | $36.65 | |
Total return3 | | | (14.76 | )% | | | (7.56 | )% | | | 11.24 | % | | | 12.90 | % | | | (20.90 | )% | | | (31.17 | )% |
Ratios to average net assets (annualized) | | | | | | | | | | | | | | | | | | | | | | | | |
Gross expenses | | | 1.21 | % | | | 1.21 | % | | | 1.20 | % | | | 1.23 | % | | | 1.23 | % | | | 1.22 | % |
Net expenses | | | 1.09 | % | | | 1.04 | % | | | 1.09 | % | | | 1.10 | % | | | 1.10 | % | | | 1.09 | % |
Net investment income (loss) | | | (0.27 | )% | | | (0.33 | )% | | | (0.57 | )% | | | (0.24 | )% | | | (0.30 | )% | | | 0.12 | % |
Supplemental data | | | | | | | | | | | | | | | | | | | | | | | | |
Portfolio turnover rate | | | 10 | %4 | | | 27 | %4 | | | 21 | %4 | | | 18 | %4 | | | 9 | %4 | | | 16 | % |
Net assets, end of period (000s omitted) | | | $138,345 | | | | $177,859 | | | | $242,423 | | | | $236,310 | | | | $211,477 | | | | $300,906 | |
| 1 | Amounts do not reflect the consolidated results of its wholly-owned subsidiary. |
| 2 | Calculated based upon average shares outstanding |
| 3 | Total return calculations do not include any sales charges. Returns for periods of less than one year are not annualized. |
| 4 | Portfolio turnover rate includes the purchases and sales transactions of its wholly-owned subsidiary. |
The accompanying notes are an integral part of these financial statements.
| | | | | | |
| Consolidated financial highlights | | Wells Fargo Precious Metals Fund | | | 15 | |
(For a share outstanding throughout each period)
| | | | | | | | | | | | | | | | | | | | | | | | |
| | | Six months ended
September 30, 2018 (unaudited) | | | Year ended March 31 | |
| CLASS C | | 2018 | | | 2017 | | | 2016 | | | 2015 | | | 20141 | |
Net asset value, beginning of period | | | $29.09 | | | | $32.07 | | | | $29.10 | | | | $25.97 | | | | $33.08 | | | | $48.76 | |
Net investment loss | | | (0.14 | )2 | | | (0.33 | )2 | | | (0.46 | )2 | | | (0.24 | )2 | | | (0.35 | )2 | | | (0.22 | )2 |
Net realized and unrealized gains (losses) on investments | | | (4.25 | ) | | | (2.30 | ) | | | 3.49 | | | | 3.37 | | | | (6.76 | ) | | | (15.25 | ) |
| | | | | | | | | | | | | | | | | | | | | | | | |
Total from investment operations | | | (4.39 | ) | | | (2.63 | ) | | | 3.03 | | | | 3.13 | | | | (7.11 | ) | | | (15.47 | ) |
Distributions to shareholders from | | | | | | | | | | | | | | | | | | | | | | | | |
Net investment income | | | 0.00 | | | | (0.35 | ) | | | (0.06 | ) | | | 0.00 | | | | 0.00 | | | | 0.00 | |
Net realized gains | | | 0.00 | | | | 0.00 | | | | 0.00 | | | | 0.00 | | | | 0.00 | | | | (0.21 | ) |
| | | | | | | | | | | | | | | | | | | | | | | | |
Total distributions to shareholders | | | 0.00 | | | | (0.35 | ) | | | (0.06 | ) | | | 0.00 | | | | 0.00 | | | | (0.21 | ) |
Net asset value, end of period | | | $24.70 | | | | $29.09 | | | | $32.07 | | | | $29.10 | | | | $25.97 | | | | $33.08 | |
Total return3 | | | (15.09 | )% | | | (8.24 | )% | | | 10.42 | % | | | 12.05 | % | | | (21.49 | )% | | | (31.67 | )% |
Ratios to average net assets (annualized) | | | | | | | | | | | | | | | | | | | | | | | | |
Gross expenses | | | 1.96 | % | | | 1.96 | % | | | 1.95 | % | | | 1.99 | % | | | 1.98 | % | | | 1.97 | % |
Net expenses | | | 1.84 | % | | | 1.79 | % | | | 1.84 | % | | | 1.85 | % | | | 1.85 | % | | | 1.84 | % |
Net investment loss | | | (1.02 | )% | | | (1.07 | )% | | | (1.32 | )% | | | (0.99 | )% | | | (1.06 | )% | | | (0.62 | )% |
Supplemental data | | | | | | | | | | | | | | | | | | | | | | | | |
Portfolio turnover rate | | | 10 | %4 | | | 27 | %4 | | | 21 | %4 | | | 18 | %4 | | | 9 | %4 | | | 16 | % |
Net assets, end of period (000s omitted) | | | $24,137 | | | | $33,022 | | | | $48,710 | | | | $52,648 | | | | $59,074 | | | | $94,865 | |
| 1 | Amounts do not reflect the consolidated results of its wholly-owned subsidiary. |
| 2 | Calculated based upon average shares outstanding |
| 3 | Total return calculations do not include any sales charges. Returns for periods of less than one year are not annualized. |
| 4 | Portfolio turnover rate includes the purchases and sales transactions of its wholly-owned subsidiary. |
The accompanying notes are an integral part of these financial statements.
| | | | |
| 16 | | Wells Fargo Precious Metals Fund | | Consolidated financial highlights |
(For a share outstanding throughout each period)
| | | | | | | | | | | | | | | | | | | | | | | | |
| | | Six months ended
September 30, 2018 (unaudited) | | | Year ended March 31 | |
| ADMINISTRATOR CLASS | | 2018 | | | 2017 | | | 2016 | | | 2015 | | | 20141 | |
Net asset value, beginning of period | | | $33.09 | | | | $36.27 | | | | $32.98 | | | | $29.17 | | | | $36.82 | | | | $53.75 | |
Net investment income (loss) | | | (0.02 | )2 | | | (0.09 | )2 | | | (0.17 | )2 | | | (0.03 | )2 | | | (0.06 | )2 | | | 0.10 | 2 |
Net realized and unrealized gains (losses) on investments | | | (4.85 | ) | | | (2.59 | ) | | | 3.87 | | | | 3.84 | | | | (7.59 | ) | | | (16.82 | ) |
| | | | | | | | | | | | | | | | | | | | | | | | |
Total from investment operations | | | (4.87 | ) | | | (2.68 | ) | | | 3.70 | | | | 3.81 | | | | (7.65 | ) | | | (16.72 | ) |
Distributions to shareholders from | | | | | | | | | | | | | | | | | | | | | | | | |
Net investment income | | | 0.00 | | | | (0.50 | ) | | | (0.41 | ) | | | 0.00 | | | | 0.00 | | | | 0.00 | |
Net realized gains | | | 0.00 | | | | 0.00 | | | | 0.00 | | | | 0.00 | | | | 0.00 | | | | (0.21 | ) |
| | | | | | | | | | | | | | | | | | | | | | | | |
Total distributions to shareholders | | | 0.00 | | | | (0.50 | ) | | | 0.00 | | | | 0.00 | | | | 0.00 | | | | (0.21 | ) |
Net asset value, end of period | | | $28.22 | | | | $33.09 | | | | $36.27 | | | | $32.98 | | | | $29.17 | | | | $36.82 | |
Total return3 | | | (14.72 | )% | | | (7.40 | )% | | | 11.37 | % | | | 13.06 | % | | | (20.78 | )% | | | (31.06 | )% |
Ratios to average net assets (annualized) | | | | | | | | | | | | | | | | | | | | | | | | |
Gross expenses | | | 1.13 | % | | | 1.15 | % | | | 1.12 | % | | | 1.13 | % | | | 1.07 | % | | | 1.04 | % |
Net expenses | | | 0.95 | % | | | 0.91 | % | | | 0.95 | % | | | 0.96 | % | | | 0.96 | % | | | 0.95 | % |
Net investment income (loss) | | | (0.12 | )% | | | (0.25 | )% | | | (0.44 | )% | | | (0.10 | )% | | | (0.17 | )% | | | 0.26 | % |
Supplemental data | | | | | | | | | | | | | | | | | | | | | | | | |
Portfolio turnover rate | | | 10 | %4 | | | 27 | %4 | | | 21 | %4 | | | 18 | %4 | | | 9 | %4 | | | 16 | % |
Net assets, end of period (000s omitted) | | | $7,648 | | | | $9,148 | | | | $15,325 | | | | $16,114 | | | | $21,917 | | | | $32,230 | |
| 1 | Amounts do not reflect the consolidated results of its wholly-owned subsidiary. |
| 2 | Calculated based upon average shares outstanding |
| 3 | Returns for periods of less than one year are not annualized. |
| 4 | Portfolio turnover rate includes the purchases and sales transactions of its wholly-owned subsidiary. |
The accompanying notes are an integral part of these financial statements.
| | | | | | |
| Consolidated financial highlights | | Wells Fargo Precious Metals Fund | | | 17 | |
(For a share outstanding throughout each period)
| | | | | | | | | | | | | | | | | | | | | | | | |
| | | Six months ended
September 30, 2018 (unaudited) | | | Year ended March 31 | |
| INSTITUTIONAL CLASS | | 2018 | | | 2017 | | | 2016 | | | 2015 | | | 20141 | |
Net asset value, beginning of period | | | $33.30 | | | | $36.47 | | | | $33.21 | | | | $29.33 | | | | $36.96 | | | | $53.87 | |
Net investment income (loss) | | | 0.01 | 2 | | | 0.02 | | | | (0.09 | )2 | | | 0.02 | 2 | | | 0.01 | 2 | | | 0.16 | 2 |
Net realized and unrealized gains (losses) on investments | | | (4.88 | ) | | | (2.67 | ) | | | 3.85 | | | | 3.86 | | | | (7.64 | ) | | | (16.86 | ) |
| | | | | | | | | | | | | | | | | | | | | | | | |
Total from investment operations | | | (4.87 | ) | | | (2.65 | ) | | | 3.76 | | | | 3.88 | | | | (7.63 | ) | | | (16.70 | ) |
Distributions to shareholders from | | | | | | | | | | | | | | | | | | | | | | | | |
Net investment income | | | 0.00 | | | | (0.52 | ) | | | (0.50 | ) | | | 0.00 | | | | 0.00 | | | | 0.00 | |
Net realized gains | | | 0.00 | | | | 0.00 | | | | 0.00 | | | | 0.00 | | | | 0.00 | | | | (0.21 | ) |
| | | | | | | | | | | | | | | | | | | | | | | | |
Total distributions to shareholders | | | 0.00 | | | | (0.52 | ) | | | (0.50 | ) | | | 0.00 | | | | 0.00 | | | | (0.21 | ) |
Net asset value, end of period | | | $28.43 | | | | $33.30 | | | | $36.47 | | | | $33.21 | | | | $29.33 | | | | $36.96 | |
Total return3 | | | (14.62 | )% | | | (7.27 | )% | | | 11.49 | % | | | 13.23 | % | | | (20.64 | )% | | | (30.95 | )% |
Ratios to average net assets (annualized) | | | | | | | | | | | | | | | | | | | | | | | | |
Gross expenses | | | 0.88 | % | | | 0.88 | % | | | 0.88 | % | | | 0.88 | % | | | 0.80 | % | | | 0.79 | % |
Net expenses | | | 0.79 | % | | | 0.73 | % | | | 0.79 | % | | | 0.80 | % | | | 0.79 | % | | | 0.78 | % |
Net investment income (loss) | | | 0.04 | % | | | 0.01 | % | | | (0.24 | )% | | | 0.06 | % | | | 0.03 | % | | | 0.41 | % |
Supplemental data | | | | | | | | | | | | | | | | | | | | | | | | |
Portfolio turnover rate | | | 10 | %4 | | | 27 | %4 | | | 21 | %4 | | | 18 | %4 | | | 9 | %4 | | | 16 | % |
Net assets, end of period (000s omitted) | | | $80,034 | | | | $82,650 | | | | $89,680 | | | | $60,156 | | | | $43,014 | | | | $41,993 | |
| 1 | Amounts do not reflect the consolidated results of its wholly-owned subsidiary. |
| 2 | Calculated based upon average shares outstanding |
| 3 | Returns for periods of less than one year are not annualized. |
| 4 | Portfolio turnover rate includes the purchases and sales transactions of its wholly-owned subsidiary. |
The accompanying notes are an integral part of these financial statements.
| | | | |
| 18 | | Wells Fargo Precious Metals Fund | | Notes to consolidated financial statements (unaudited) |
1. ORGANIZATION
Wells Fargo Funds Trust (the “Trust”), a Delaware statutory trust organized on March 10, 1999, is an open-end management investment company registered under the Investment Company Act of 1940, as amended (the “1940 Act”). As an investment company, the Trust follows the accounting and reporting guidance in Financial Accounting Standards Board Accounting (“FASB”) Standards Codification Topic 946, Financial Services – Investment Companies. These financial statements report on the Wells Fargo Precious Metals Fund (the “Fund”) which is a non-diversified series of the Trust.
Effective at the close of business on May 5, 2017, Class B shares were converted to Class A shares and are no longer offered by the Fund. Information for Class B shares reflected in the financial statements represents activity through May 5, 2017.
2. INVESTMENT IN SUBSIDIARY
The Fund invests in precious metals and minerals through Special Investments (Cayman) SPC (the “Subsidiary”), a wholly-owned subsidiary incorporated on May 3, 2005 under the laws of the Cayman Islands as an exempted segregated portfolio company with limited liability. As of September 30, 2018, the Subsidiary held $11,548,300 in gold bullion representing 100% of its net assets. The Fund is the sole shareholder of the Subsidiary. As of September 30, 2018, the Fund held $11,496,956 in the Subsidiary, representing 4.60% of the Fund’s net assets.
The consolidated financial statements of the Fund include the financial results of its wholly-owned subsidiary. The Consolidated Portfolio of Investments includes positions of the Fund and the Subsidiary and the consolidated financial statements include the accounts of the Fund and the Subsidiary. Accordingly, all interfund balances and transactions between the Fund and the Subsidiary have been eliminated in consolidation.
3. SIGNIFICANT ACCOUNTING POLICIES
The following significant accounting policies, which are consistently followed in the preparation of the financial statements of the Fund, are in conformity with U.S. generally accepted accounting principles which require management to make estimates and assumptions that affect the reported amounts of assets and liabilities, disclosure of contingent assets and liabilities at the date of the financial statements, and the reported amounts of revenues and expenses during the reporting period. Actual results could differ from those estimates.
Securities valuation
All investments are valued each business day as of the close of regular trading on the New York Stock Exchange (generally 4 p.m. Eastern Time), although the Fund may deviate from this calculation time under unusual or unexpected circumstances.
Equity securities that are listed on a foreign or domestic exchange or market are valued at the official closing price or, if none, the last sales price. If no sale occurs on the principal exchange or market that day, a fair value price will be determined in accordance with the Fund’s Valuation Procedures.
Investments in commodities are valued at their last traded price.
The values of securities denominated in foreign currencies are translated into U.S. dollars at rates provided by an independent foreign currency pricing source at a time each business day specified by the Wells Fargo Asset Management Pricing Committee at Wells Fargo Funds Management, LLC (“Funds Management”)
Many securities markets and exchanges outside the U.S. close prior to the close of the New York Stock Exchange and therefore may not fully reflect trading or events that occur after the close of the principal exchange in which the foreign securities are traded, but before the close of the New York Stock Exchange. If such trading or events are expected to materially affect the value of such securities, then fair value pricing procedures approved by the Board of Trustees of the Fund are applied. These procedures take into account multiple factors including movements in U.S. securities markets after foreign exchanges close. Foreign securities that are fair valued under these procedures are categorized as Level 2 and the application of these procedures may result in transfers between Level 1 and Level 2. Depending on market activity, such fair valuations may be frequent. Such fair value pricing may result in net asset values that are higher or lower than net asset values based on the last reported sales price or latest quoted bid price. On September 30, 2018, such fair value pricing was not used in pricing foreign securities.
Investments in registered open-end investment companies are valued at net asset value.
Investments which are not valued using any of the methods discussed above are valued at their fair value, as determined in good faith by the Board of Trustees. The Board of Trustees has established a Valuation Committee comprised of the
| | | | | | |
| Notes to consolidated financial statements (unaudited) | | Wells Fargo Precious Metals Fund | | | 19 | |
Trustees and has delegated to it the authority to take any actions regarding the valuation of portfolio securities that the Valuation Committee deems necessary or appropriate, including determining the fair value of portfolio securities, unless the determination has been delegated to the Wells Fargo Asset Management Pricing Committee. The Board of Trustees retains the authority to make or ratify any valuation decisions or approve any changes to the Valuation Procedures as it deems appropriate. On a quarterly basis, the Board of Trustees receives reports on any valuation actions taken by the Valuation Committee or the Wells Fargo Asset Management Pricing Committee which may include items for ratification.
Foreign currency translation
The accounting records of the Fund are maintained in U.S. dollars. The values of other assets and liabilities denominated in foreign currencies are translated into U.S. dollars at rates provided by an independent foreign currency pricing source at a time each business day specified by the Wells Fargo Asset Management Pricing Committee. Purchases and sales of securities, and income and expenses are converted at the rate of exchange on the respective dates of such transactions. Net realized foreign exchange gains or losses arise from sales of foreign currencies, currency gains or losses realized between the trade and settlement dates on securities transactions, and the difference between the amounts of dividends, interest and foreign withholding taxes recorded and the U.S. dollar equivalent of the amounts actually paid or received. Net unrealized foreign exchange gains and losses arise from changes in the fair value of assets and liabilities other than investments in securities resulting from changes in exchange rates. The changes in net assets arising from changes in exchange rates of securities and the changes in net assets resulting from changes in market prices of securities are not separately presented. Such changes are included in net realized and unrealized gains or losses from investments.
Security transactions and income recognition
Securities transactions are recorded on a trade date basis. Realized gains or losses are recorded on the basis of identified cost.
Dividend income is recognized on the ex-dividend date, except for certain dividends from foreign securities, which are recorded as soon as the custodian verifies the ex-dividend date. Dividend income from foreign securities is recorded net of foreign taxes withheld where recovery of such taxes is not assured.
Distributions to shareholders
Distributions to shareholders from net investment income and any net realized gains are recorded on the ex-dividend date and paid at least annually. Such distributions are determined in accordance with income tax regulations and may differ from U.S. generally accepted accounting principles. Dividend sources are estimated at the time of declaration. The tax character of distributions is determined as of the Fund’s fiscal year end. Therefore, a portion of the Fund’s distributions made prior to the Fund’s fiscal year end may be categorized as a tax return of capital at year end.
Federal and other taxes
The Fund intends to continue to qualify as a regulated investment company by distributing substantially all of its investment company taxable income and any net realized capital gains (after reduction for capital loss carryforwards) sufficient to relieve it from all, or substantially all, federal income taxes. Accordingly, no provision for federal income taxes was required.
The Subsidiary is classified as a controlled foreign corporation under Subchapter N of the Internal Revenue Code. Therefore, the Fund is required to increase its taxable income by its share of the Subsidiary’s income. Net investment losses of the Subsidiary cannot be deducted by the Fund in the current period nor carried forward to offset taxable income in future periods.
The Fund’s income and federal excise tax returns and all financial records supporting those returns for the prior three fiscal years are subject to examination by the federal and Delaware revenue authorities. Management has analyzed the Fund’s tax positions taken on federal, state, and foreign tax returns for all open tax years and does not believe that there are any uncertain tax positions that require recognition of a tax liability.
As of September 30, 2018, the aggregate cost of all investments for federal income tax purposes was $159,349,312 and the unrealized gains (losses) consisted of:
| | | | |
Gross unrealized gains | | $ | 153,006,973 | |
Gross unrealized losses | | | (61,537,431 | ) |
Net unrealized gains | | $ | 91,469,542 | |
| | | | |
| 20 | | Wells Fargo Precious Metals Fund | | Notes to consolidated financial statements (unaudited) |
As of March 31, 2018, the Fund had capital loss carryforwards which consist of $25,473,541 in short-term capital losses and $150,718,316 in long-term capital losses.
Class allocations
The separate classes of shares offered by the Fund differ principally in applicable sales charges, distribution, shareholder servicing, and administration fees. Class specific expenses are charged directly to that share class. Investment income, common expenses, and realized and unrealized gains (losses) on investments are allocated daily to each class of shares based on the relative proportion of net assets of each class.
4. FAIR VALUATION MEASUREMENTS
Fair value measurements of investments are determined within a framework that has established a fair value hierarchy based upon the various data inputs utilized in determining the value of the Fund’s investments. The three-level hierarchy gives the highest priority to unadjusted quoted prices in active markets for identical assets or liabilities (Level 1) and the lowest priority to unobservable inputs (Level 3). The Fund’s investments are classified within the fair value hierarchy based on the lowest level of input that is significant to the fair value measurement. The inputs are summarized into three broad levels as follows:
| ∎ | | Level 1 – quoted prices in active markets for identical securities |
| ∎ | | Level 2 – other significant observable inputs (including quoted prices for similar securities, interest rates, prepayment speeds, credit risk, etc.) |
| ∎ | | Level 3 – significant unobservable inputs (including the Fund’s own assumptions in determining the fair value of investments) |
The inputs or methodologies used for valuing investments in securities are not necessarily an indication of the risk associated with investing in those securities.
The following is a summary of the inputs used in valuing the Fund’s assets and liabilities as of September 30, 2018:
| | | | | | | | | | | | | | | | |
| | | Quoted prices
(Level 1) | | | Other significant
observable inputs
(Level 2) | | | Significant
unobservable inputs (Level 3) | | | Total | |
Assets | | | | | | | | | | | | | | | | |
Investments in: | | | | | | | | | | | | | | | | |
| | | | |
Common stocks | | | | | | | | | | | | | | | | |
Australia | | $ | 25,119,994 | | | $ | 0 | | | $ | 0 | | | $ | 25,119,994 | |
Canada | | | 129,401,528 | | | | 21,920,192 | | | | 0 | | | | 151,321,720 | |
Peru | | | 1,676,250 | | | | 0 | | | | 0 | | | | 1,676,250 | |
South Africa | | | 1,849,771 | | | | 0 | | | | 0 | | | | 1,849,771 | |
United Kingdom | | | 25,622,280 | | | | 0 | | | | 0 | | | | 25,622,280 | |
United States | | | 30,746,839 | | | | 0 | | | | 0 | | | | 30,746,839 | |
| | | | |
Commodities | | | 11,548,300 | | | | 0 | | | | 0 | | | | 11,548,300 | |
| | | | |
Short-term investments | | | | | | | | | | | | | | | | |
Investment companies | | | 2,933,700 | | | | 0 | | | | 0 | | | | 2,933,700 | |
Total assets | | $ | 228,898,662 | | | $ | 21,920,192 | | | $ | 0 | | | $ | 250,818,854 | |
Additional sector, industry or geographic detail for each Fund is included in the Portfolio of Investments.
At September 30, 2018 the Fund did not have any transfers into/out of Level 3.
5. TRANSACTIONS WITH AFFILIATES
Management fee
Funds Management, an indirect wholly owned subsidiary of Wells Fargo & Company (“Wells Fargo”), is the manager of the Fund and provides advisory and fund-level administrative services under an investment management agreement. Under the investment management agreement, Funds Management is responsible for, among other services, implementing the investment objectives and strategies of the Fund, supervising the subadviser and providing fund-level
| | | | | | |
| Notes to consolidated financial statements (unaudited) | | Wells Fargo Precious Metals Fund | | | 21 | |
administrative services in connection with the Fund’s operations. As compensation for its services under the investment management agreement, Funds Management is entitled to receive an annual management fee starting at 0.65% and declining to 0.48% as the average daily net assets of the Fund increase. For the six months ended September 30, 2018, the management fee was equivalent to an annual rate of 0.65% of the Fund’s average daily net assets.
The Subsidiary has entered into a separate advisory contract with Funds Management to manage the investment and reinvestment of its assets in conformity with its investment objectives and restrictions. Under this agreement, the Subsidiary does not pay Funds Management a fee for its services.
Funds Management has retained the services of a subadviser to provide daily portfolio management to the Fund. The fee for subadvisory services is borne by Funds Management. Wells Capital Management Incorporated, an affiliate of Funds Management and an indirect wholly owned subsidiary of Wells Fargo, is the subadviser to the Fund and is entitled to receive a fee from Funds Management at an annual rate starting at 0.40% and declining to 0.30% as the average daily net assets of the Fund increase.
Administration fees
Under a class-level administration agreement, Funds Management provides class-level administrative services to the Fund, which includes paying fees and expenses for services provided by the transfer agent, sub-transfer agents, omnibus account servicers and record-keepers. As compensation for its services under the class-level administration agreement, Funds Management receives an annual fee which is calculated based on the average daily net assets of each class as follows:
| | | | |
| | | Class-level
administration fee | |
Class A, Class C | | | 0.21 | % |
Administrator Class, Institutional Class | | | 0.13 | |
Funds Management has contractually waived and/or reimbursed management and administration fees to the extent necessary to maintain certain net operating expense ratios for the Fund. When each class of the Fund has exceeded its expense cap, Funds Management has waived fees and/or reimbursed expenses from fund level expenses on a proportionate basis and then from class specific expenses; otherwise, waivers and/or reimbursements are applied against class specific expenses before fund level expenses. Funds Management has committed through July 31, 2019 to waive fees and/or reimburse expenses to the extent necessary to cap the Fund’s expenses at 1.09% for Class A shares, 1.84% for Class C shares, 0.95% for Administrator Class shares and 0.79% for Institutional Class shares. After this time, the cap may be increased or the commitment to maintain the cap may be terminated only with the approval of the Board of Trustees.
Distribution fee
The Trust has adopted a distribution plan for Class C shares of the Fund pursuant to Rule 12b-1 under the 1940 Act. A distribution fee is charged to Class C shares and paid to Wells Fargo Funds Distributor, LLC (“Funds Distributor”), the principal underwriter, at an annual rate of 0.75% of the average daily net assets of Class C shares.
In addition, Funds Distributor is entitled to receive the front-end sales charge from the purchase of Class A shares and a contingent deferred sales charge on the redemption of certain Class A shares. Funds Distributor is also entitled to receive the contingent deferred sales charges from redemptions of Class C shares. For the six months ended September 30, 2018, Funds Distributor received $1,398 from the sale of Class A shares. No contingent deferred sales charges were incurred by Class A and Class C shares for the six months ended September 30, 2018.
Shareholder servicing fees
The Trust has entered into contracts with one or more shareholder servicing agents, whereby Class A, Class C, and Administrator Class of the Fund are charged a fee at an annual rate of 0.25% of the average daily net assets of each respective class.
A portion of these total shareholder servicing fees were paid to affiliates of Wells Fargo.
Interfund transactions
The Fund may purchase or sell portfolio investment securities to certain other Wells Fargo affiliates pursuant to Rule 17a-7 under the 1940 Act and under procedures adopted by the Board of Trustees. The procedures have been designed to ensure that these interfund transactions, which do not incur broker commissions, are effected at current market prices.
| | | | |
| 22 | | Wells Fargo Precious Metals Fund | | Notes to consolidated financial statements (unaudited) |
6. INVESTMENT PORTFOLIO TRANSACTIONS
Purchases and sales of investments, excluding U.S. government obligations (if any) and short-term securities, for the six months ended September 30, 2018 were $29,475,929 and $34,038,069, respectively. These amounts include purchases and sales transactions of the Subsidiary.
7. BANK BORROWINGS
The Trust (excluding the money market funds), Wells Fargo Master Trust and Wells Fargo Variable Trust are parties to a $280,000,000 revolving credit agreement whereby the Fund is permitted to use bank borrowings for temporary or emergency purposes, such as to fund shareholder redemption requests. Interest under the credit agreement is charged to the Fund based on a borrowing rate equal to the higher of the Federal Funds rate in effect on that day plus 1.25% or the overnight LIBOR rate in effect on that day plus 1.25%. In addition, an annual commitment fee equal to 0.25% of the unused balance is allocated to each participating fund.
For the six months ended September 30, 2018, there were no borrowings by the Fund under the agreement.
8. DISTRIBUTIONS TO SHAREHOLDERS
Beginning October 2018, the Securities and Exchange Commission eliminated the requirement to separately state the components of distributions to shareholders. The amounts of distributions to shareholders for the year ended March 31, 2018 were as follows:
| | | | |
| | | Net investment
income | |
Class A | | | $2,808,058 | |
Class C | | | 414,068 | |
Administrator Class | | | 169,120 | |
Institutional Class | | | 1,238,811 | |
9. CONCENTRATION RISK
The Fund invests a substantial portion of its assets in precious metals companies and, therefore, may be more affected by changes in the precious metals sector than a fund whose investments are not heavily weighted in any sector.
10. INDEMNIFICATION
Under the Trust’s organizational documents, the officers and Trustees have been granted certain indemnification rights against certain liabilities that may arise out of performance of their duties to the Trust. Additionally, in the normal course of business, the Trust may enter into contracts with service providers that contain a variety of indemnification clauses. The Trust’s maximum exposure under these arrangements is dependent on future claims that may be made against the Fund and, therefore, cannot be estimated.
11. NEW ACCOUNTING PRONOUNCEMENT
In August 2018, FASB issued Accounting Standards Update (“ASU”) No. 2018-13, Fair Value Measurement (Topic 820) Disclosure Framework – Changes to the Disclosure Requirements for Fair Value Measurement. ASU 2018-13 updates the disclosure requirements for fair value measurements by modifying or removing certain disclosures and adding certain new disclosures. The amendments are effective for fiscal years, and interim periods within those fiscal years, beginning after December 15, 2019. Early adoption is permitted. Management has early adopted the removal and modification disclosures, as permitted, and will adopt the additional new disclosures at the effective date.
| | | | | | |
| Other information (unaudited) | | Wells Fargo Precious Metals Fund | | | 23 | |
TAX INFORMATION
Pursuant to Section 853 of the Internal Revenue Code, the following amounts have been designated as foreign taxes paid for the fiscal year ended March 31, 2018. These amounts may be less than the actual foreign taxes paid for financial statement purposes. Foreign taxes paid or withheld should be included in taxable income with an offsetting deduction from gross income or as a credit for taxes paid to foreign governments. None of the income was derived from ineligible foreign sources as defined under Section 901(j) of the Internal Revenue Code.
| | | | |
Creditable foreign taxes paid | | Per share amount | | Foreign income as % of ordinary income distributions |
| $213,150 | | $0.0191 | | 47.33% |
PROXY VOTING INFORMATION
A description of the policies and procedures that the Fund uses to determine how to vote proxies relating to portfolio securities is available, upon request, by calling 1-800-222-8222, visiting our website at wellsfargofunds.com, or visiting the SEC website at sec.gov. Information regarding how the Fund voted proxies relating to portfolio securities during the most recent 12-month period ended June 30 is available on the Fund’s website at wellsfargofunds.com or by visiting the SEC website at sec.gov.
PORTFOLIO HOLDINGS INFORMATION
The complete portfolio holdings for the Fund are publicly available monthly on the Fund’s website (wellsfargofunds.com), on a one-month delayed basis. In addition, top ten holdings information (excluding derivative positions) for the Fund is publicly available on the Fund’s website on a monthly, seven-day or more delayed basis. The Fund files its complete schedule of portfolio holdings with the SEC for the first and third quarters of each fiscal year on Form N-Q, which is available by visiting the SEC website at sec.gov. In addition, the Fund’s Form N-Q may be reviewed and copied at the SEC’s Public Reference Room in Washington, DC, and at regional offices in New York City, at 233 Broadway, and in Chicago, at 175 West Jackson Boulevard, Suite 900. Information about the Public Reference Room may be obtained by calling 1-800-SEC-0330.
| | | | |
| 24 | | Wells Fargo Precious Metals Fund | | Other information (unaudited) |
BOARD OF TRUSTEES AND OFFICERS
Each of the Trustees and Officers1 listed in the table below acts in identical capacities for each fund in the Wells Fargo family of funds, which consists of 153 mutual funds comprising the Wells Fargo Funds Trust, Wells Fargo Variable Trust, Wells Fargo Master Trust and four closed-end funds (collectively the “Fund Complex”). This table should be read in conjunction with the Prospectus and the Statement of Additional Information2. The mailing address of each Trustee and Officer is 525 Market Street, 12th Floor, San Francisco, CA 94105. Each Trustee and Officer serves an indefinite term, however, each Trustee serves such term until reaching the mandatory retirement age established by the Trustees.
Independent Trustees
| | | | | | |
Name and year of birth | | Position held and length of service* | | Principal occupations during past five years or longer | | Current other public company or investment company directorships |
| William R. Ebsworth (Born 1957) | | Trustee, since 2015 | | Retired. From 1984 to 2013, equities analyst, portfolio manager, research director and chief investment officer at Fidelity Management and Research Company in Boston, Tokyo, and Hong Kong, and retired in 2013 as Chief Investment Officer of Fidelity Strategic Advisers, Inc. where he led a team of investment professionals managing client assets. Prior thereto, Board member of Hong Kong Securities Clearing Co., Hong Kong Options Clearing Corp., the Thailand International Fund, Ltd., Fidelity Investments Life Insurance Company, and Empire Fidelity Investments Life Insurance Company. Board member of the Vincent Memorial Hospital Endowment (non-profit organization), where he serves on the Investment Committee and as a Chair of the Audit Committee. Mr. Ebsworth is a CFA® charterholder. | | N/A |
Jane A. Freeman (Born 1953) | | Trustee, since 2015; Chair Liaison, since 2018 | | Retired. From 2012 to 2014 and 1999 to 2008, Chief Financial Officer of Scientific Learning Corporation. From 2008 to 2012, Ms. Freeman provided consulting services related to strategic business projects. Prior to 1999, Portfolio Manager at Rockefeller & Co. and Scudder, Stevens & Clark. Board member of the Harding Loevner Funds from 1996 to 2014, serving as both Lead Independent Director and chair of the Audit Committee. Board member of the Russell Exchange Traded Funds Trust from 2011 to 2012 and the chair of the Audit Committee. Ms. Freeman is a Board Member of The Ruth Bancroft Garden (non-profit organization). She is also an inactive Chartered Financial Analyst. | | N/A |
Isaiah Harris, Jr. (Born 1952) | | Trustee, since 2009 | | Retired. Chairman of the Board of CIGNA Corporation since 2009, and Director since 2005. From 2003 to 2011, Director of Deluxe Corporation. Prior thereto, President and CEO of BellSouth Advertising and Publishing Corp. from 2005 to 2007, President and CEO of BellSouth Enterprises from 2004 to 2005 and President of BellSouth Consumer Services from 2000 to 2003. Emeritus member of the Iowa State University Foundation Board of Governors. Emeritus Member of the Advisory Board of Iowa State University School of Business. Advisory Board Member, Palm Harbor Academy (private school). Advisory Board Member, Child Evangelism Fellowship (non-profit). Mr. Harris is a certified public accountant (inactive status). | | CIGNA Corporation |
Judith M. Johnson (Born 1949) | | Trustee, since 2008; Audit Committee Chairman, since 2009 | | Retired. Prior thereto, Chief Executive Officer and Chief Investment Officer of Minneapolis Employees Retirement Fund from 1996 to 2008. Ms. Johnson is an attorney, certified public accountant and a certified managerial accountant. | | N/A |
| | | | | | |
| Other information (unaudited) | | Wells Fargo Precious Metals Fund | | | 25 | |
| | | | | | |
Name and year of birth | | Position held and length of service* | | Principal occupations during past five years or longer | | Current other public company or investment company directorships |
David F. Larcker (Born 1950) | | Trustee, since 2009 | | James Irvin Miller Professor of Accounting at the Graduate School of Business, Stanford University, Director of the Corporate Governance Research Initiative and Senior Faculty of The Rock Center for Corporate Governance since 2006. From 2005 to 2008, Professor of Accounting at the Graduate School of Business, Stanford University. Prior thereto, Ernst & Young Professor of Accounting at The Wharton School, University of Pennsylvania from 1985 to 2005. | | N/A |
Olivia S. Mitchell (Born 1953) | | Trustee, since 2006; Governance Committee Chairman, since 2018 | | International Foundation of Employee Benefit Plans Professor, Wharton School of the University of Pennsylvania since 1993. Director of Wharton’s Pension Research Council and Boettner Center on Pensions & Retirement Research, and Research Associate at the National Bureau of Economic Research. Previously, Cornell University Professor from 1978 to 1993. | | N/A |
Timothy J. Penny (Born 1951) | | Trustee, since 1996; Chairman, since 2018; Vice Chairman, from 2017 to 2018 | | President and Chief Executive Officer of Southern Minnesota Initiative Foundation, a non-profit organization, since 2007. Member of the Board of Trustees of NorthStar Education Finance, Inc., a non-profit organization, since 2007. | | N/A |
James G. Polisson (Born 1959) | | Trustee, since 2018; Advisory Board Member, from 2017 to 2018 | | Retired. Chief Marketing Officer, Source (ETF) UK Services, Ltd, from 2015 to 2017. From 2012 to 2015, Principal of The Polisson Group, LLC, a management consulting, corporate advisory and principal investing company. Chief Executive Officer and Managing Director at Russell Investments, Global Exchange Traded Funds from 2010 to 2012. Managing Director of Barclays Global Investors from 1998 to 2010 and Global Chief Marketing Officer for iShares and Barclays Global Investors from 2000 to 2010. Trustee of the San Francisco Mechanics’ Institute, a non-profit organization, from 2013 to 2015. Board member of the Russell Exchange Traded Fund Trust from 2011 to 2012. Director of Barclays Global Investors Holdings Deutschland GmbH from 2006 to 2009. Mr. Polisson is an attorney and has a retired status with the Massachusetts and District of Columbia Bar Associations. | | N/A |
Michael S. Scofield (Born 1943) | | Trustee, since 2010 | | Served on the Investment Company Institute’s Board of Governors and Executive Committee from 2008-2011 as well the Governing Council of the Independent Directors Council from 2006-2011 and the Independent Directors Council Executive Committee from 2008-2011. Trustee of the Evergreen Fund complex (and its predecessors) from 1984 to 2010. Chairman of the Evergreen Funds from 2000-2010. Former Trustee of the Mentor Funds. Retired Attorney, Law Offices of Michael S. Scofield. | | N/A |
Pamela Wheelock (Born 1959) | | Trustee, since 2018; Advisory Board Member, from 2017 to 2018 | | Chief Operating Officer, Twin Cities Habitat for Humanity, since January, 2017. Vice President of University Services, University of Minnesota from 2012 to 2017. Prior thereto, on the Board of Directors, Governance Committee and Finance Committee for the Minnesota Philanthropy Partners (Saint Paul Foundation) from 2012 to 2018, Interim President and Chief Executive Officer of Blue Cross Blue Shield of Minnesota from 2010 to 2011, Chairman of the Board from 2009 to 2011 and Board Director from 2003 to 2015. Vice President, Leadership and Community Engagement, Bush Foundation, Saint Paul, Minnesota (a private foundation) from 2009 to 2011. Executive Vice President and Chief Financial Officer, Minnesota Sports and Entertainment from 2004 to 2009 and Senior Vice President from 2002 to 2004. Commissioner of Finance, State of Minnesota, from 1999 to 2002. Currently the Board Chair of the Minnesota Wild Foundation since 2010. | | N/A |
| * | Length of service dates reflect the Trustee’s commencement of service with the Trust’s predecessor entities, where applicable. |
| | | | |
| 26 | | Wells Fargo Precious Metals Fund | | Other information (unaudited) |
Officers
| | | | | | |
Name and year of birth | | Position held and length of service | | Principal occupations during past five years or longer | | |
Andrew Owen (Born 1960) | | President, since 2017 | | Executive Vice President of Wells Fargo & Company and Head of Affiliated Managers, Wells Fargo Asset Management, since 2014. In addition, Mr. Owen is currently President, Chief Executive Officer and Director of Wells Fargo Funds Management, LLC since 2017. Prior thereto, Executive Vice President responsible for marketing, investments and product development for Wells Fargo Funds Management, LLC, from 2009 to 2014. | | |
Nancy Wiser1 (Born 1967) | | Treasurer, since 2012 | | Executive Vice President of Wells Fargo Funds Management, LLC since 2011. Chief Operating Officer and Chief Compliance Officer at LightBox Capital Management LLC, from 2008 to 2011. | | |
| Alexander Kymn3 (Born 1973) | | Secretary, since 2018; Chief Legal Officer, since 2018 | | Senior Company Counsel of Wells Fargo Bank, N.A. since 2018 (previously Senior Counsel from 2007 to 2018). Vice President of Wells Fargo Funds Management, LLC from 2008 to 2014. | | |
| Michael H. Whitaker (Born 1967) | | Chief Compliance Officer, since 2016 | | Senior Vice President and Chief Compliance Officer since 2016. Senior Vice President and Chief Compliance Officer for Fidelity Investments from 2007 to 2016. | | |
David Berardi (Born 1975) | | Assistant Treasurer, since 2009 | | Vice President of Wells Fargo Funds Management, LLC since 2009. Vice President of Evergreen Investment Management Company, LLC from 2008 to 2010. Manager of Fund Reporting and Control for Evergreen Investment Management Company, LLC from 2004 to 2010. | | |
| Jeremy DePalma1 (Born 1974) | | Assistant Treasurer, since 2009 | | Senior Vice President of Wells Fargo Funds Management, LLC since 2009. Senior Vice President of Evergreen Investment Management Company, LLC from 2008 to 2010 and head of the Fund Reporting and Control Team within Fund Administration from 2005 to 2010. | | |
| 1 | Nancy Wiser acts as Treasurer of 76 funds in the Fund Complex. Jeremy DePalma acts as Treasurer of 77 funds and Assistant Treasurer of 76 funds in the Fund Complex. |
| 2 | The Statement of Additional Information includes additional information about the Trustees and is available, without charge, upon request, by calling 1-800-222-8222 or by visiting the website at wellsfargofunds.com. |
| 3 | Alexander Kymn became the Secretary and Chief Legal Officer effective April 17, 2018. |
| | | | | | |
| Other information (unaudited) | | Wells Fargo Precious Metals Fund | | | 27 | |
BOARD CONSIDERATION OF INVESTMENT MANAGEMENT AND SUB-ADVISORY AGREEMENTS:
Wells Fargo Precious Metals Fund
Under the Investment Company Act of 1940 (the “1940 Act”), the Board of Trustees (the “Board”) of Wells Fargo Funds Trust (the “Trust”) must determine annually whether to approve the continuation of the Trust’s investment management and sub-advisory agreements. In this regard, at an in-person meeting held on May 22-23, 2018 (the “Meeting”), the Board, all the members of which have no direct or indirect interest in the investment management and sub-advisory agreements and are not “interested persons” of the Trust, as defined in the 1940 Act (the “Independent Trustees”), reviewed and approved for Wells Fargo Precious Metals Fund (the “Fund”): (i) an investment management agreement (the “Management Agreement”) with Wells Fargo Funds Management, LLC (“Funds Management”); and (ii) an investment sub-advisory agreement (the “Sub-Advisory Agreement”) with Wells Capital Management Incorporated (the “Sub-Adviser”), an affiliate of Funds Management. The Management Agreement and the Sub-Advisory Agreement are collectively referred to as the “Advisory Agreements.”
At the Meeting, the Board considered the factors and reached the conclusions described below relating to the selection of Funds Management and the Sub-Adviser and the approval of the Advisory Agreements. Prior to the Meeting, including at an in-person meeting in April 2018, the Trustees conferred extensively among themselves and with representatives of Funds Management about these matters. Also, the Board has adopted a team-based approach, with each team consisting of a sub-set of Trustees, to assist the full Board in the discharge of its duties in reviewing investment performance and other matters throughout the year. The Independent Trustees were assisted in their evaluation of the Advisory Agreements by independent legal counsel, from whom they received separate legal advice and with whom they met separately.
In providing information to the Board, Funds Management and the Sub-Adviser were guided by a detailed set of requests for information submitted to them by independent legal counsel on behalf of the Independent Trustees at the start of the Board’s annual contract renewal process earlier in 2018. In considering and approving the Advisory Agreements, the Trustees considered the information they believed relevant, including but not limited to the information discussed below. The Board considered not only the specific information presented in connection with the Meeting, but also the knowledge gained over time through interaction with Funds Management and the Sub-Adviser about various topics. In this regard, the Board reviewed reports of Funds Management at each of its quarterly meetings, which included, among other things, portfolio reviews and investment performance reports. In addition, the Board and the teams mentioned above confer with portfolio managers at various times throughout the year. The Board did not identify any particular information or consideration that was all-important or controlling, and each individual Trustee may have attributed different weights to various factors.
After its deliberations, the Board unanimously approved the continuation of the Advisory Agreements for a one-year term and determined that the compensation payable to Funds Management and the Sub-Adviser under each of the Advisory Agreements was reasonable. The Board considered the approval of the Advisory Agreements for the Fund as part of its consideration of agreements for funds across the complex, but its approvals were made on a fund-by-fund basis. The following summarizes a number of important, but not necessarily all, factors considered by the Board in support of its approvals.
Nature, extent and quality of services
The Board received and considered various information regarding the nature, extent and quality of services provided to the Fund by Funds Management and the Sub-Adviser under the Advisory Agreements. This information included a description of the investment advisory services and Fund-level administrative services covered by the Management Agreement, as well as, among other things, a summary of the background and experience of senior management of Wells Fargo Asset Management (“WFAM”), of which Funds Management and the Sub-Adviser are a part, a summary of investments made in the business of WFAM, a summary of certain organizational and personnel changes involving Funds Management and the Sub-Adviser, and a description of Funds Management’s and the Sub-Adviser’s business continuity planning programs and of their approaches to data privacy and cybersecurity. The Board also considered the qualifications, background, tenure and responsibilities of each of the portfolio managers primarily responsible for the day-to-day portfolio management of the Fund.
The Board evaluated the ability of Funds Management and the Sub-Adviser to attract and retain qualified investment professionals, including research, advisory and supervisory personnel. The Board further considered the compliance programs and compliance records of Funds Management and the Sub-Adviser. In addition, the Board took into account the full range of services provided to the Fund by Funds Management and its affiliates.
| | | | |
| 28 | | Wells Fargo Precious Metals Fund | | Other information (unaudited) |
Fund investment performance and expenses
The Board considered the investment performance results for the Fund over various time periods ended December 31, 2017. The Board considered these results in comparison to the investment performance of funds in a universe that was determined by Broadridge Inc. (“Broadridge”) to be similar to the Fund (the “Universe”), and in comparison to the Fund’s benchmark index and to other comparative data. Broadridge is an independent provider of investment company data. The Board received a description of the methodology used by Broadridge to select the mutual funds in the performance Universe. The Board noted that the investment performance of the Fund (Class A) was higher than or in range of the average investment performance of the Universe for the five- and ten-year periods under review, but lower than the average investment performance of the Universe for the one- and three-year periods under review. The Board also noted that the investment performance of the Fund was higher than or in range of its benchmark index, the FTSE Gold Mines Index, for the five- and ten-year periods under review, but lower than its benchmark for the one- and three-year periods under review.
The Board received information concerning, and discussed factors contributing to, the underperformance of the Fund relative to the Universe and benchmark for the periods identified above. The Board took note of the explanations for the relative underperformance during these periods, including with respect to investment decisions and market factors that affected the Fund’s investment performance. The Board also took note of the Fund’s outperformance relative to the Universe and benchmark over the longer time periods under review.
The Board also received and considered information regarding the Fund’s net operating expense ratios and their various components, including actual management fees, custodian and other non-management fees, and Rule 12b-1 and non-Rule 12b-1 shareholder service fees. The Board considered these ratios in comparison to the median ratios of funds in class-specific expense groups that were determined by Broadridge to be similar to the Fund (the “Groups”). The Board received a description of the methodology used by Broadridge to select the mutual funds in the expense Groups and an explanation of how funds comprising expense groups and their expense ratios may vary from year-to-year. Based on the Broadridge reports, the Board noted that the net operating expense ratios of the Fund were lower than the median net operating expense ratios of the expense Groups for each share class.
The Board took into account the Fund’s investment performance and expense information provided to it among the factors considered in deciding to re-approve the Advisory Agreements.
Investment management and sub-advisory fee rates
The Board reviewed and considered the contractual fee rates payable by the Fund to Funds Management under the Management Agreement, as well as the contractual fee rates payable by the Fund to Funds Management for class-level administrative services under a Class-Level Administration Agreement, which include, among other things, class-level transfer agency and sub-transfer agency costs (collectively, the “Management Rates”). The Board also reviewed and considered the contractual investment sub-advisory fee rates that are payable by Funds Management to the Sub-Adviser for investment sub-advisory services.
Among other information reviewed by the Board was a comparison of the Fund’s Management Rates with the average contractual investment management fee rates of funds in the expense Groups at a common asset level as well as transfer agency costs of the funds in the expense Groups. The Board noted that the Management Rates of the Fund were lower than the sum of these average rates for the Fund’s expense Groups for all share classes.
The Board also received and considered information about the portion of the total management fee that was retained by Funds Management after payment of the fee to the Sub-Adviser for sub-advisory services. In assessing the reasonableness of this amount, the Board received and evaluated information about the nature and extent of responsibilities retained and risks assumed by Funds Management and not delegated to or assumed by the Sub-Adviser, and about Funds Management’s on-going oversight services. Given the affiliation between Funds Management and the Sub-Adviser, the Board ascribed limited relevance to the allocation of fees between them.
The Board also received and considered information about the nature and extent of services offered and fee rates charged by Funds Management and the Sub-Adviser to other types of clients with investment strategies similar to those of the Fund. In this regard, the Board received information about the significantly greater scope of services, and compliance, reporting and other legal burdens and risks of managing mutual funds compared with those associated with managing assets of non-mutual fund clients such as institutional separate accounts.
Based on its consideration of the factors and information it deemed relevant, including those described here, the Board determined that the compensation payable to Funds Management under the Management Agreement and to the Sub-Adviser under the Sub-Advisory Agreement was reasonable.
| | | | | | |
| Other information (unaudited) | | Wells Fargo Precious Metals Fund | | | 29 | |
Profitability
The Board received and considered information concerning the profitability of Funds Management, as well as the profitability of both WFAM and Wells Fargo & Co. (“Wells Fargo”) as a whole, from providing services to the Fund and the fund family as a whole. The Board noted that the Sub-Adviser’s profitability information with respect to providing services to the Fund was subsumed in the WFAM and Wells Fargo profitability analysis.
Funds Management reported on the methodologies and estimates used in calculating profitability, including a description of the methodology used to allocate certain expenses and recent enhancements made to the methodology. Among other things, the Board noted that the levels of profitability reported on a fund-by-fund basis varied widely, depending on factors such as the size and type of fund. Based on its review, the Board did not deem the profits reported by Funds Management, WFAM or Wells Fargo from services provided to the Fund to be at a level that would prevent it from approving the continuation of the Advisory Agreements.
Economies of scale
The Board considered the extent to which Funds Management may experience economies of scale in the provision of management services, and the extent to which scale benefits, if any, would be shared with shareholders. In particular, the Board noted the existence of breakpoints in the Fund’s management fee structure, which operate generally to reduce the Fund’s expense ratios as the Fund grows in size. It considered that, for a small fund or a fund that shrinks in size, breakpoints conversely can result in higher fee levels. The Board also considered that in addition to management fee breakpoints, competitive management fee rates set at the outset without regard to breakpoints and fee waiver and expense reimbursement arrangements, as well as investments in the business intended to enhance services available to Fund shareholders, are means of sharing potential economies of scale with shareholders of the Fund.
The Board concluded that the Fund’s fee and expense arrangements, including contractual breakpoints, constituted a reasonable approach to sharing potential economies of scale with the Fund and its shareholders.
Other benefits to Funds Management and the Sub-Adviser
The Board received and considered information regarding potential “fall-out” or ancillary benefits received by Funds Management and its affiliates, including the Sub-Adviser, as a result of their relationships with the Fund. Ancillary benefits could include, among others, benefits directly attributable to other relationships with the Fund and benefits potentially derived from an increase in Funds Management’s and the Sub-Adviser’s business as a result of their relationships with the Fund. The Board noted that various affiliates of Funds Management may receive distribution-related fees, shareholder servicing payments and sub-transfer agency fees in respect of shares sold or held through them and services provided.
The Board also reviewed information about soft dollar credits earned and utilized by the Sub-Adviser, fees earned by Funds Management and the Sub-Adviser from managing a private investment vehicle for the fund family’s securities lending collateral and commissions earned by an affiliated broker from portfolio transactions.
Based on its consideration of the factors and information it deemed relevant, including those described here, the Board did not find that any ancillary benefits received by Funds Management and its affiliates, including the Sub-Adviser, were unreasonable.
Conclusion
At the Meeting, after considering the above-described factors and based on its deliberations and its evaluation of the information described above, the Board unanimously approved the continuation of the Advisory Agreements for a one-year term and determined that the compensation payable to Funds Management and the Sub-Adviser under each of the Advisory Agreements was reasonable.
| | | | |
| 30 | | Wells Fargo Precious Metals Fund | | Appendix A (unaudited) |
SALES CHARGE REDUCTIONS AND WAIVERS FOR CERTAIN INTERMEDIARIES
Ameriprise
Effective June 1, 2018, shareholders purchasing Fund shares through an Ameriprise Financial platform or account will be eligible only for the following Class A load waivers (front-end sales charge waivers), which may differ from those disclosed elsewhere in the Fund’s prospectus or Statement of Additional Information.
Front-end Sales Load Waivers on Class A Shares Available at Ameriprise Financial
| | • | | Employer-sponsored retirement plans (e.g., 401(k) plans, 457 plans, employer-sponsored 403(b) plans, profit sharing and money purchase pension plans and defined benefit plans). For purposes of this provision, employer-sponsored retirement plans do not include SEP IRAs, Simple IRAs or SAR-SEPs. |
| | • | | Shares purchased through an Ameriprise Financial investment advisory program (if an Advisory or similar share class for such investment advisory program is not available) |
| | • | | Shares purchased by third party investment advisors on behalf of their advisory clients through Ameriprise Financial’s platform (if an Advisory or similar share class for such investment advisory program is not available) |
| | • | | Shares purchased through reinvestment of distributions and dividend reinvestment when purchasing shares of the same Fund (but not any other fund within the same fund family) |
| | • | | Shares exchanged from Class C shares of the same fund in the month of or following the 10-year anniversary of the purchase date. To the extent that the Fund’s prospectus elsewhere provides for a waiver with respect to such shares following a shorter holding period, that waiver will apply to exchanges following such shorter period. To the extent that the Fund’s prospectus elsewhere provides for a waiver with respect to exchanges of Class C shares for load-waived shares, that waiver will also apply to such exchanges. |
| | • | | Employees and registered representatives of Ameriprise Financial or its affiliates and their immediate family members |
| | • | | Shares purchased by or through qualified accounts (including IRAs, Coverdell Education Savings Accounts, 401(k)s, 403(b) TSCAs subject to ERISA and defined benefit plans) that are held by a covered family member, defined as an Ameriprise financial advisor and/or the advisor’s spouse, advisor’s lineal ascendant (mother, father, grandmother, grandfather, great grandmother, great grandfather), advisor’s lineal descendant (son, step-son, daughter, step-daughter, grandson, granddaughter, great grandson, great granddaughter) or any spouse of a covered family member who is a lineal descendant |
| | • | | Shares purchased from the proceeds of redemptions within the same fund family, provided (1) the repurchase occurs within 90 days following the redemption, (2) the redemption and purchase occur in the same account, and (3) redeemed shares were subject to a front-end or deferred sales load (i.e. Rights of Reinstatement). Subject to the Fund’s policy regarding frequent purchases and redemptions of Fund shares, you may not be able to repurchase shares for the first 30 days after your redemption. |
Automatic Exchange of Class C Shares Available at Ameriprise Financial
| | • | | Class C shares will automatically exchange to Class A shares in the month of the 10-year anniversary of the purchase date. |
Merrill Lynch
Effective April 10, 2017, shareholders purchasing Fund shares through a Merrill Lynch platform or account will be eligible only for the following load waivers (front-end sales charge waivers and contingent deferred, or back-end, sales charge waivers) and discounts, which may differ from those disclosed elsewhere in the Fund’s prospectus or Statement of Additional Information.
Front-end Sales Load Waivers on Class A Shares available at Merrill Lynch
| | • | | Employer-sponsored retirement, deferred compensation and employee benefit plans (including health savings accounts) and trusts used to fund those plans, provided that the shares are not held in a commission-based brokerage account and shares are held for the benefit of the plan |
| | • | | Shares purchased by or through a 529 Plan |
| | • | | Shares purchased through a Merrill Lynch affiliated investment advisory program |
| | | | | | |
| Appendix A (unaudited) | | Wells Fargo Precious Metals Fund | | | 31 | |
| | • | | Shares purchased by third party investment advisors on behalf of their advisory clients through Merrill Lynch’s platform |
| | • | | Shares of funds purchased through the Merrill Edge Self-Directed platform (if applicable) |
| | • | | Shares purchased through reinvestment of capital gains distributions and dividend reinvestment when purchasing shares of the same fund (but not any other fund within the fund family) |
| | • | | Shares exchanged from Class C (i.e. level-load) shares of the same fund in the month of or following the 10-year anniversary of the purchase date |
| | • | | Employees and registered representatives of Merrill Lynch or its affiliates and their family members, as defined by Merrill Lynch, which may differ from the definition of family member in the Fund’s prospectus. |
| | • | | Directors or Trustees of the Fund, and employees of the Fund’s investment adviser or any of its affiliates, as described in the Fund’s prospectus |
| | • | | Shares purchased from the proceeds of redemptions within the same fund family, provided (1) the repurchase occurs within 90 days following the redemption, (2) the redemption and purchase occur in the same account, and (3) redeemed shares were subject to a front-end or deferred sales load (known as Rights of Reinstatement). Subject to the Fund’s policy regarding frequent purchases and redemptions of Fund shares, you may not be able to repurchase shares for the first 30 days after your redemption. |
CDSC Waivers on A, B and C Shares available at Merrill Lynch
| | • | | Death or disability of the shareholder |
| | • | | Shares sold as part of a systematic withdrawal plan as described in the Fund’s prospectus |
| | • | | Return of excess contributions from an IRA Account |
| | • | | Shares sold as part of a required minimum distribution for IRA and retirement accounts due to the shareholder reaching age 701⁄2 |
| | • | | Shares sold to pay Merrill Lynch fees but only if the transaction is initiated by Merrill Lynch |
| | • | | Shares acquired through a right of reinstatement |
| | • | | Shares held in retirement brokerage accounts, that are exchanged for a lower cost share class due to transfer to certain fee based accounts or platforms (applicable to A and C shares only) |
Front-end load Discounts Available at Merrill Lynch: Breakpoints, Rights of Accumulation & Letters of Intent
| | • | | Breakpoints as described in the Fund’s prospectus |
| | • | | Rights of Accumulation (ROA) which entitle shareholders to breakpoint discounts will be automatically calculated based on the aggregated holding of fund family assets held by accounts within the purchaser’s household at Merrill Lynch. Eligible fund family assets not held at Merrill Lynch may be included in the ROA calculation only if the shareholder notifies his or her financial advisor about such assets. |
| | • | | Letters of Intent (LOI) which allow for breakpoint discounts based on anticipated purchases within a fund family, through Merrill Lynch, over a 13-month period of time (if applicable) |
Morgan Stanley
Effective on or about July 1, 2018, shareholders purchasing Fund shares through a Morgan Stanley Wealth Management transactional brokerage account will be eligible only for the following Class A load waivers (front-end sales charge waivers), which may differ from and be more limited than those disclosed in the Fund’s prospectus or Statement of Additional Information.
Front-end Sales Load Waivers on Class A Shares Available at Morgan Stanley
| | • | | Employer-sponsored retirement plans (e.g., 401(k) plans, 457 plans, employer-sponsored 403(b) plans, profit sharing and money purchase pension plans and defined benefit plans). For purposes of this provision, employer-sponsored retirement plans do not include SEP IRAs, Simple IRAs, SAR-SEPs or Keogh plans. |
| | • | | Morgan Stanley employee and employee-related accounts according to Morgan Stanley’s account linking rules |
| | • | | Shares purchased through reinvestment of dividends and capital gains distributions when purchasing shares of the same fund |
| | | | |
| 32 | | Wells Fargo Precious Metals Fund | | Appendix A (unaudited) |
| | • | | Shares purchased through a Morgan Stanley self-directed brokerage account |
| | • | | Class C (i.e., level-load) shares that are no longer subject to a contingent deferred sales charge and are exchanged to Class A shares of the same fund pursuant to Morgan Stanley Wealth Management’s share class exchange program. |
| | • | | Shares purchased from the proceeds of redemptions within the same fund family, provided (i) the repurchase occurs within 90 days following the redemption, (ii) the redemption and purchase occur in the same account, and (iii) redeemed shares were subject to a front-end or deferred sales charge. This waiver is subject to the Fund’s policy regarding frequent purchases and redemption of Fund shares, as discussed under “Account Information—Frequent Purchases and Redemptions of Fund Shares” in the Fund’s prospectus. |
Raymond James & Associates, Inc., Raymond James Financial Services & Raymond James affiliates (“Raymond James”)
Effective on or about March 1, 2019, shareholders purchasing Fund shares through a Raymond James platform or account will be eligible only for the following load waivers (front-end sales charge waivers and contingent deferred, or back-end, sales charge waivers) and discounts, which may differ from those disclosed elsewhere in the Fund’s Prospectus or SAI.
Front-end Sales Load Waivers on Class A shares Available at Raymond James
| | • | | Shares purchased in an investment advisory program. |
| | • | | Shares purchased through reinvestment of capital gains distributions and dividend reinvestment when purchasing shares of the same fund (but not any other fund within the fund family). |
| | • | | Employees and registered representatives of Raymond James or its affiliates and their family members as designated by Raymond James. |
| | • | | Shares purchased from the proceeds of redemptions within the same fund family, provided (1) the repurchase occurs within 90 days following the redemption, (2) the redemption and purchase occur in the same account, and (3) redeemed shares were subject to a front-end or deferred sales load (known as Rights of Reinstatement). |
| | • | | A shareholder in the fund’s Class C shares will have their shares automatically exchanged at net asset value to Class A shares (or the appropriate share class) of the fund if the shares are no longer subject to a CDSC and the exchange is in line with the policies and procedures of Raymond James. |
CDSC Waivers on Class A and C Shares Available at Raymond James
| | • | | Death or disability of the shareholder. |
| | • | | Shares sold as part of a systematic withdrawal plan as described in the Fund’s Prospectus. |
| | • | | Return of excess contributions from an IRA Account. |
| | • | | Shares sold as part of a required minimum distribution for IRA and retirement accounts due to the shareholder reaching age 70½ as described in the Fund’s prospectus. |
| | • | | Shares sold to pay Raymond James fees but only if the transaction is initiated by Raymond James. |
| | • | | Shares acquired through a right of reinstatement. |
Front-end Load Discounts Available at Raymond James: Breakpoints, and/or Rights of Accumulation
| | • | | Breakpoints as described in the Fund’s Prospectus. |
| | • | | Rights of accumulation which entitle shareholders to breakpoint discounts will be automatically calculated based on the aggregated holding of fund family assets held by accounts within the purchaser’s household at Raymond James. Eligible fund family assets not held at Raymond James may be included in the rights of accumulation calculation only if the shareholder notifies his or her financial advisor about such assets. |

For more information
More information about Wells Fargo Funds is available free upon request. To obtain literature, please write, visit the Fund’s website, or call:
Wells Fargo Funds
P.O. Box 219967
Kansas City, MO 64121-9967
Website: wellsfargofunds.com
Individual investors: 1-800-222-8222
Retail investment professionals: 1-888-877-9275
Institutional investment professionals: 1-866-765-0778
This report and the financial statements contained herein are submitted for the general information of the shareholders of the Fund. If this report is used for promotional purposes, distribution of the report must be accompanied or preceded by a current prospectus. Before investing, please consider the investment objectives, risks, charges, and expenses of the investment. For a current prospectus and, if available, a summary prospectus, containing this information, call 1-800-222-8222 or visit the Fund’s website at wellsfargofunds.com. Read the prospectus carefully before you invest or send money.
Wells Fargo Asset Management (WFAM) is the trade name for certain investment advisory/management firms owned by Wells Fargo & Company. These firms include but are not limited to Wells Capital Management Incorporated and Wells Fargo Funds Management, LLC. Certain products managed by WFAM entities are distributed by Wells Fargo Funds Distributor, LLC (a broker/dealer and Member FINRA).
This material is for general informational and educational purposes only and is NOT intended to provide investment advice or a recommendation of any kind—including a recommendation for any specific investment, strategy, or plan.
NOT FDIC INSURED ◾ NO BANK GUARANTEE ◾ MAY LOSE VALUE
© 2018 Wells Fargo Funds Management, LLC. All rights reserved.
| | |
 | | 317302 11-18 SA316/SAR316 09-18 |
Semi-Annual Report
September 30, 2018

Wells Fargo Specialized Technology Fund


Reduce clutter. Save trees.
Sign up for electronic delivery of prospectuses and shareholder reports at wellsfargo.com/advantagedelivery
Contents
The views expressed and any forward-looking statements are as of September 30, 2018, unless otherwise noted, and are those of the Fund managers and/or Wells Fargo Funds Management, LLC. Discussions of individual securities, or the markets generally, or any Wells Fargo Fund are not intended as individual recommendations. Future events or results may vary significantly from those expressed in any forward-looking statements. The views expressed are subject to change at any time in response to changing circumstances in the market. Wells Fargo Funds Management, LLC and the Fund disclaim any obligation to publicly update or revise any views expressed or forward-looking statements.
NOT FDIC INSURED ◾ NO BANK GUARANTEE ◾ MAY LOSE VALUE
| | | | |
| 2 | | Wells Fargo Specialized Technology Fund | | Letter to shareholders (unaudited) |

Andrew Owen
President
Wells Fargo Funds
The second and third quarters of 2018 were characterized by growing economic and investment activity in the U.S.
Dear Shareholder:
We are pleased to offer you this semi-annual report for the Wells Fargo Specialized Technology Fund for the six-month period that ended September 30, 2018. The second and third quarters of 2018 were characterized by growing economic and investment activity in the U.S. In contrast, economies overseas were restrained as geopolitical tensions and rising interest rates diverted investor interest in those markets.
For the period, U.S. stocks, as measured by the S&P 500 Index,1 gained 11.41% and international stocks, as measured by the MSCI ACWI ex USA Index (Net),2 lost 1.93%. Based on the MSCI EM Index (Net),3 emerging market stocks lost 8.97%. For bond investors, the Bloomberg Barclays U.S. Aggregate Bond Index4 lost 0.14% while the Bloomberg Barclays Global Aggregate ex-USD Index5 fell 6.42%. The Bloomberg Barclays Municipal Bond Index6 added 0.72%, and the ICE BofAML U.S. High Yield Index7 was up 3.46%.
Global trade tensions escalated during the second quarter.
During the second quarter of 2018, the U.S. government imposed tariffs, and foreign governments in North America, Europe, and Asia retaliated. The actions marked the initialization of trade tensions that would escalate during the next six months. The increasing tensions chilled investment activity as observers awaited signals of next steps.
Meanwhile, inflation continued an upward trend. The CPI-U8 added 0.1% in June after an increase of 0.2% in both April and May. On a year-over-year basis, the all-items index rose 2.9% for the 12 months that ended June 30, 2018. The index for all items less food and energy rose 2.3% for the same 12-month period.
| 1 | The S&P 500 Index consists of 500 stocks chosen for market size, liquidity, and industry group representation. It is a market-value-weighted index with each stock’s weight in the index proportionate to its market value. You cannot invest directly in an index. |
| 2 | The Morgan Stanley Capital International (MSCI) All Country World Index (ACWI) ex USA Index (Net) is a free-float-adjusted market-capitalization-weighted index that is designed to measure the equity market performance of developed markets, excluding the United States and Canada. Source: MSCI. MSCI makes no express or implied warranties or representations and shall have no liability whatsoever with respect to any MSCI data contained herein. The MSCI data may not be further redistributed or used as a basis for other indices or any securities or financial products. This report is not approved, reviewed, or produced by MSCI. You cannot invest directly in an index. |
| 3 | The MSCI Emerging Markets (EM) Index (Net) is a free-float-adjusted market-capitalization-weighted index that is designed to measure large- and mid-cap equity market performance of emerging markets. The MSCI EM Index (Net) consists of the following 24 emerging market country indices: Brazil, Chile, China, Colombia, Czech Republic, Egypt, Greece, Hungary, India, Indonesia, Korea, Malaysia, Mexico, Pakistan, Peru, the Philippines, Poland, Qatar, Russia, South Africa, Taiwan, Thailand, Turkey, and the United Arab Emirates. You cannot invest directly in an index. |
| 4 | The Bloomberg Barclays U.S. Aggregate Bond Index is a broad-based benchmark that measures the investment-grade, U.S. dollar-denominated, fixed-rate taxable bond market, including Treasuries, government-related and corporate securities, mortgage-backed securities (agency fixed-rate and hybrid adjustable-rate mortgage pass-throughs), asset-backed securities, and commercial mortgage-backed securities. You cannot invest directly in an index. |
| 5 | The Bloomberg Barclays Global Aggregate ex-USD Index is an unmanaged index that provides a broad-based measure of the global investment-grade fixed-income markets excluding the U.S. dollar-denominated debt market. You cannot invest directly in an index. |
| 6 | The Bloomberg Barclays Municipal Bond Index is an unmanaged index composed of long-term tax-exempt bonds with a minimum credit rating of Baa. You cannot invest directly in an index. |
| 7 | The ICE BofAML U.S. High Yield Index is a market-capitalization-weighted index of domestic and Yankee high-yield bonds. The index tracks the performance of high-yield securities traded in the U.S. bond market. You cannot invest directly in an index. Copyright 2018. ICE Data Indices, LLC. All rights reserved. |
| 8 | The Consumer Price Index for All Urban Consumers (CPI-U) measures the changes in the price of a basket of goods and services purchased by urban consumers. The urban consumer population is deemed by many as a better representative measure of the general public because close to 90% of the country’s population lives in highly populated areas. You cannot invest directly in an index. |
| | | | | | |
| Letter to shareholders (unaudited) | | Wells Fargo Specialized Technology Fund | | | 3 | |
U.S. stocks gained while international stocks and bonds declined during the summer of 2018.
The U.S. economy strengthened during the summer months. Revised second-quarter gross domestic product data released in August showed the U.S. economy growing at a 4.2% rate. After ticking up slightly in June, the unemployment rate in the U.S. was 3.9% in July and August, according to the U.S. Department of Labor. Wages showed more consistent growth, and consumer confidence remained strong.
Several U.S. equity market indices reached records during August, with the S&P 500 Index gaining 7.76% for the three-month period that ended August 31, 2018. International stock values continued to suffer under the effects of a strong U.S. dollar and continuing trade tensions. The MSCI ACWI ex USA Index (Net) and the MSCI EM Index (Net) were down 4.70% and 1.64%, during the same three-month period.
The U.S. Federal Reserve (Fed) increased the federal funds rate in June, and expectations grew that two more rate increases were in the offing in 2018. Long-term interest rates in the U.S. remained at higher levels relative to the prior 10 years. Rates on 10-year and 30-year Treasury bonds—2.74% and 2.97%, respectively, on March 31, 2018—were 3.05% and 3.19%, respectively, on September 30, off their peak levels on May 17, 2018, of 3.11% and 3.25%, respectively. Some investors became more aware of and concerned about the potential for an inverted yield curve—sometimes a recession signal—as short-term rates increased more quickly than long-term rates. The Fed decided to forgo an interest rate increase at its August meeting.
Internationally, members of Prime Minister Theresa May’s U.K./Brexit negotiating team resigned amid unproductive negotiations. In early August, the Bank of England’s Monetary Policy Committee increased its key interest rate to 0.75%. Central banks in Europe and Japan maintained low interest rates and accommodative monetary policies. Amid rising trade uncertainty, the People’s Bank of China cut reserve requirement ratios and accelerated infrastructure spending and tax cuts for business enterprises and individuals. Nevertheless, a strengthening U.S. dollar and the trade tensions remained headwinds for investors overseas.
Don’t let short-term uncertainty derail long-term investment goals.
Periods of investment uncertainty can present challenges, but experience has taught us that maintaining long-term investment goals can be an effective way to plan for the future. To help you create a sound strategy based on your personal goals and risk tolerance, Wells Fargo Funds offers more than 100 mutual funds spanning a wide range of asset classes and investment styles. Although diversification cannot guarantee an investment profit or prevent losses, we believe it can be an effective way to manage investment risk and potentially smooth out overall portfolio performance. We encourage investors to know their investments and to understand that appropriate levels of risk-taking may unlock opportunities.
The U.S. economy strengthened during the summer months.
| | | | |
| 4 | | Wells Fargo Specialized Technology Fund | | Letter to shareholders (unaudited) |
Thank you for choosing to invest with Wells Fargo Funds. We appreciate your confidence in us and remain committed to helping you meet your financial needs.
Sincerely,

Andrew Owen
President
Wells Fargo Funds
Notice to shareholders
At a meeting held on August 14-15, 2018, the Board of Trustees of the Fund approved the following policy which will be effective on or about February 5, 2019:
Class C shares will convert automatically into Class A shares ten years after the initial date of purchase or, if you acquired your Class C shares through an exchange or conversion from another share class, ten years after the date you acquired your Class C shares. When Class C shares that you acquired through a purchase or exchange convert, any other Class C shares that you purchased with reinvested dividends and distributions also will convert into Class A shares on a pro rata basis. A shorter holding period may also apply depending on your intermediary. Please see “Appendix A—Sales Charge Reductions and Waivers for Certain Intermediaries” in the Fund’s prospectus or at the end of this report.
For further information about your Fund, contact your investment professional, visit our website at wellsfargofunds.com, or call us directly at 1-800-222-8222.
This page is intentionally left blank.
| | | | |
| 6 | | Wells Fargo Specialized Technology Fund | | Performance highlights (unaudited) |
Investment objective
The Fund seeks long-term capital appreciation.
Manager
Wells Fargo Funds Management, LLC
Subadviser
Allianz Global Investors U.S. LLC
Portfolio managers
Huachen Chen, CFA®
Walter C. Price, Jr., CFA®
Michael A. Seidenberg‡
Average annual total returns (%) as of September 30, 20181
| | | | | | | | | | | | | | | | | | | | | | | | | | | | | | | | | | |
| | | | | Including sales charge | | | Excluding sales charge | | | Expense ratios2 (%) | |
| | | Inception date | | 1 year | | | 5 year | | | 10 year | | | 1 year | | | 5 year | | | 10 year | | | Gross | | | Net3 | |
| Class A (WFSTX) | | 9-18-2000 | | | 32.30 | | | | 18.83 | | | | 17.10 | | | | 40.34 | | | | 20.24 | | | | 17.81 | | | | 1.42 | | | | 1.39 | |
| Class C (WFTCX) | | 9-18-2000 | | | 38.30 | | | | 19.35 | | | | 16.93 | | | | 39.30 | | | | 19.35 | | | | 16.93 | | | | 2.17 | | | | 2.14 | |
| Administrator Class (WFTDX) | | 7-30-2010 | | | – | | | | – | | | | – | | | | 40.55 | | | | 20.41 | | | | 17.97 | | | | 1.34 | | | | 1.29 | |
| Institutional Class (WFTIX) | | 10-31-2016 | | | – | | | | – | | | | – | | | | 40.80 | | | | 20.49 | | | | 18.01 | | | | 1.09 | | | | 1.04 | |
| S&P North American Technology Index4 | | – | | | – | | | | – | | | | – | | | | 36.28 | | | | 22.84 | | | | 17.86 | | | | – | | | | – | |
| S&P 500 Index5 | | – | | | – | | | | – | | | | – | | | | 17.91 | | | | 13.95 | | | | 11.97 | | | | – | | | | – | |
Figures quoted represent past performance, which is no guarantee of future results, and do not reflect taxes that a shareholder may pay on fund distributions or the redemption of fund shares. Investment return and principal value of an investment will fluctuate so that an investor’s shares, when redeemed, may be worth more or less than their original cost. Performance shown without sales charges would be lower if sales charges were reflected. Current performance may be lower or higher than the performance data quoted, which assumes the reinvestment of dividends and capital gains. Current month-end performance is available on the Fund’s website, wellsfargofunds.com.
Please keep in mind that high double-digit returns were primarily achieved during favorable market conditions. You should not expect that such favorable returns can be consistently achieved. A fund’s performance, especially for short time periods, should not be the sole factor in making your investment decision.
While the S&P 500 Index is comprised of U.S. equity securities of companies diversified across ten sectors, the Fund’s holdings are concentrated primarily in technology related stocks. Therefore, the performance of the S&P 500 Index is displayed only to show how the concentrated Fund performed compared with a diversified selection of U.S. equity securities.
Index returns do not include transaction costs associated with buying and selling securities, any mutual fund fees or expenses, or any taxes. It is not possible to invest directly in an index.
For Class A shares, the maximum front-end sales charge is 5.75%. For Class C shares, the maximum contingent deferred sales charge is 1.00%. Performance including a contingent deferred sales charge assumes the sales charge for the corresponding time period. Administrator Class and Institutional Class shares are sold without a front-end sales charge or contingent deferred sales charge.
Stock values fluctuate in response to the activities of individual companies and general market and economic conditions. Funds that concentrate their investments in limited sectors, such as information technology, are more vulnerable to adverse market, economic, regulatory, political, or other developments affecting those sectors. Certain investment strategies tend to increase the total risk of an investment (relative to the broader market). The Fund is exposed to convertible securities risk, foreign investment risk, non-diversification risk, and smaller-company securities risk. Consult the Fund’s prospectus for additional information on these and other risks.
Please see footnotes on page 7.
| | | | | | |
| Performance highlights (unaudited) | | Wells Fargo Specialized Technology Fund | | | 7 | |
| | | | |
| Ten largest holdings (%) as of September 30, 20186 | |
Amazon.com Incorporated | | | 8.60 | |
Apple Incorporated | | | 7.04 | |
Microsoft Corporation | | | 6.24 | |
Square Incorporated Class A | | | 5.75 | |
NetApp Incorporated | | | 5.17 | |
ServiceNow Incorporated | | | 3.62 | |
Paycom Software Incorporated | | | 3.38 | |
Alphabet Incorporated Class A | | | 3.17 | |
Alphabet Incorporated Class C | | | 2.74 | |
Salesforce.com Incorporated | | | 2.58 | |
|
| Industry distribution as of September 30, 20187 |
|
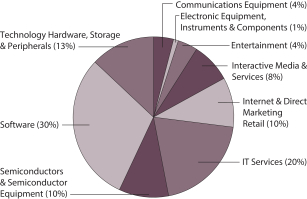 |
| ‡ | Mr. Seidenberg became a portfolio manager of the Fund on August 1, 2018. |
| 1 | Historical performance shown for Administrator Class shares prior to their inception reflects the performance of Class A shares, and includes the higher expenses applicable to Class A shares. If these expenses had not been included, returns for Administrator Class shares would be higher. Historical performance shown for the Institutional Class shares prior to their inception reflects the performance of the Administrator Class shares, and is not adjusted to reflect Institutional Class expenses. If these expenses had been included, returns for Institutional Class shares would be higher. |
| 2 | Reflects the expense ratios as stated in the most recent prospectuses, which include the impact of 0.01% in acquired fund fees and expenses. The expense ratios shown are subject to change and may differ from the annualized expense ratios shown in the financial highlights of this report, which do not include acquired fund fees and expenses. |
| 3 | The manager has contractually committed through July 31, 2019, to waive fees and/or reimburse expenses to the extent necessary to cap the Fund’s Total Annual Fund Operating Expenses After Fee Waivers at 1.38% for Class A, 2.13% for class C, 1.28% for Administrator Class, and 1.03% for Institutional Class. After this time, the cap may be increased or the commitment to maintain the cap may be terminated only with the approval of the Board of Trustees. Brokerage commissions, stamp duty fees, interest, taxes, acquired fund fees and expenses (if any), and extraordinary expenses are excluded from the expense cap. Without this cap, the Fund’s returns would have been lower. The expense ratio paid by an investor is the net expense ratio (the total annual fund operating expenses after fee waivers) as stated in the prospectuses. |
| 4 | The S&P North American Technology Index is a modified market-capitalization-weighted index of select technology stocks. You cannot invest directly in an index. |
| 5 | The S&P 500 Index consists of 500 stocks chosen for market size, liquidity, and industry group representation. It is a market-value weighted index with each stock’s weight in the index proportionate to its market value. You cannot invest directly in an index. |
| 6 | The ten largest holdings, excluding cash, cash equivalents and any money market funds, are calculated based on the value of the investments divided by total net assets of the Fund. Holdings are subject to change and may have changed since the date specified. |
| 7 | Amounts are calculated based on the total long-term investments of the Fund. These amounts are subject to change and may have changed since the date specified. |
| | | | |
| 8 | | Wells Fargo Specialized Technology Fund | | Fund expenses (unaudited) |
As a shareholder of the Fund, you incur two types of costs: (1) transaction costs, including sales charges (loads) on purchase payments and contingent deferred sales charges (if any) on redemptions and (2) ongoing costs, including management fees, distribution (12b-1) and/or shareholder servicing fees, and other Fund expenses. This example is intended to help you understand your ongoing costs (in dollars) of investing in the Fund and to compare these costs with the ongoing costs of investing in other mutual funds.
The example is based on an investment of $1,000 invested at the beginning of the six-month period and held for the entire period from April 1, 2018 to September 30, 2018.
Actual expenses
The “Actual” line of the table below provides information about actual account values and actual expenses. You may use the information in this line, together with the amount you invested, to estimate the expenses that you paid over the period. Simply divide your account value by $1,000 (for example, an $8,600 account value divided by $1,000 = 8.6), then multiply the result by the number in the “Actual” line under the heading entitled “Expenses paid during period” for your applicable class of shares to estimate the expenses you paid on your account during this period.
Hypothetical example for comparison purposes
The “Hypothetical” line of the table below provides information about hypothetical account values and hypothetical expenses based on the Fund’s actual expense ratio and an assumed rate of return of 5% per year before expenses, which is not the Fund’s actual return. The hypothetical account values and expenses may not be used to estimate the actual ending account balance or expenses you paid for the period. You may use this information to compare the ongoing costs of investing in the Fund and other funds. To do so, compare this 5% hypothetical example with the 5% hypothetical examples that appear in the shareholder reports of the other funds.
Please note that the expenses shown in the table are meant to highlight your ongoing costs only and do not reflect any transactional costs, such as sales charges (loads) and contingent deferred sales charges. Therefore, the “Hypothetical” line of the table is useful in comparing ongoing costs only and will not help you determine the relative total costs of owning different funds. In addition, if these transactional costs were included, your costs would have been higher.
| | | | | | | | | | | | | | | | |
| | | Beginning account value 4-1-2018 | | | Ending account value 9-30-2018 | | | Expenses paid during the period¹ | | | Annualized net expense ratio | |
Class A | | | | | | | | | | | | | | | | |
Actual | | $ | 1,000.00 | | | $ | 1,188.92 | | | $ | 7.63 | | | | 1.39 | % |
Hypothetical (5% return before expenses) | | $ | 1,000.00 | | | $ | 1,018.10 | | | $ | 7.03 | | | | 1.39 | % |
Class C | | | | | | | | | | | | | | | | |
Actual | | $ | 1,000.00 | | | $ | 1,184.53 | | | $ | 11.72 | | | | 2.14 | % |
Hypothetical (5% return before expenses) | | $ | 1,000.00 | | | $ | 1,014.34 | | | $ | 10.81 | | | | 2.14 | % |
Administrator Class | | | | | | | | | | | | | | | | |
Actual | | $ | 1,000.00 | | | $ | 1,190.51 | | | $ | 7.14 | | | | 1.30 | % |
Hypothetical (5% return before expenses) | | $ | 1,000.00 | | | $ | 1,018.55 | | | $ | 6.58 | | | | 1.30 | % |
Institutional Class | | | | | | | | | | | | | | | | |
Actual | | $ | 1,000.00 | | | $ | 1,191.37 | | | $ | 5.77 | | | | 1.05 | % |
Hypothetical (5% return before expenses) | | $ | 1,000.00 | | | $ | 1,019.80 | | | $ | 5.32 | | | | 1.05 | % |
| 1 | Expenses paid is equal to the annualized net expense ratio of each class multiplied by the average account value over the period, multiplied by the number of days in the most recent fiscal half-year divided by the number of days in the fiscal year (to reflect the one-half-year period). |
| | | | | | |
| Portfolio of investments—September 30, 2018 (unaudited) | | Wells Fargo Specialized Technology Fund | | | 9 | |
| | | | | | | | | | | | | | | | |
| Security name | | | | | | | | Shares | | | Value | |
| | | |
Common Stocks: 94.00% | | | | | | | | | | | | | |
| | | | |
Communication Services: 11.40% | | | | | | | | | | | | | | | | |
| | | |
| Entertainment: 4.16% | | | | | | | | | | | | | |
Activision Blizzard Incorporated | | | | | | | | | | | 35,755 | | | $ | 2,974,458 | |
Electronic Arts Incorporated † | | | | | | | | | | | 6,490 | | | | 781,980 | |
Netflix Incorporated † | | | | | | | | | | | 24,255 | | | | 9,074,523 | |
Take-Two Interactive Software Incorporated † | | | | | | | | | | | 68,145 | | | | 9,403,329 | |
| | | | |
| | | | | | | | | | | | | | | 22,234,290 | |
| | | | | | | | | | | | | | | | |
| | | |
| Interactive Media & Services: 7.24% | | | | | | | | | | | | | |
Alphabet Incorporated Class A † | | | | | | | | | | | 14,045 | | | | 16,953,439 | |
Alphabet Incorporated Class C † | | | | | | | | | | | 12,310 | | | | 14,691,616 | |
Baidu Incorporated ADR † | | | | | | | | | | | 1,850 | | | | 423,058 | |
Facebook Incorporated Class A † | | | | | | | | | | | 37,195 | | | | 6,117,090 | |
Tencent Holdings Limited | | | | | | | | | | | 3,815 | | | | 157,505 | |
Yandex NV Class A † | | | | | | | | | | | 12,570 | | | | 413,427 | |
| | | | |
| | | | | | | | | | | | | | | 38,756,135 | |
| | | | | | | | | | | | | | | | |
| | | |
Consumer Discretionary: 9.83% | | | | | | | | | | | | | |
| | | | |
| Automobiles: 0.23% | | | | | | | | | | | | | | | | |
Tesla Motors Incorporated †« | | | | | | | | | | | 4,610 | | | | 1,220,590 | |
| | | | | | | | | | | | | | | | |
| | | |
| Internet & Direct Marketing Retail: 9.60% | | | | | | | | | | | | | |
Alibaba Group Holding Limited ADR † | | | | | | | | | | | 1,945 | | | | 320,458 | |
Amazon.com Incorporated † | | | | | | | | | | | 22,970 | | | | 46,008,910 | |
GrubHub Incorporated † | | | | | | | | | | | 36,450 | | | | 5,052,699 | |
| | | | |
| | | | | | | | | | | | | | | 51,382,067 | |
| | | | | | | | | | | | | | | | |
|
Health Care: 0.12% | |
|
| Health Care Technology: 0.12% | |
Veeva Systems Incorporated Class A † | | | | | | | | | | | 5,815 | | | | 633,079 | |
| | | | | | | | | | | | | | | | |
|
Industrials: 0.36% | |
|
| Electrical Equipment: 0.36% | |
Bloom Energy Corporation † | | | | | | | | | | | 56,540 | | | | 1,926,883 | |
| | | | | | | | | | | | | | | | |
| | | | |
Information Technology: 72.29% | | | | | | | | | | | | | | | | |
|
| Communications Equipment: 3.65% | |
Arista Networks Incorporated † | | | | | | | | | | | 31,555 | | | | 8,389,212 | |
Palo Alto Networks Incorporated † | | | | | | | | | | | 49,505 | | | | 11,151,496 | |
| | | | |
| | | | | | | | | | | | | | | 19,540,708 | |
| | | | | | | | | | | | | | | | |
|
| Electronic Equipment, Instruments & Components: 0.91% | |
CDW Corporation of Delaware | | | | | | | | | | | 11,420 | | | | 1,015,466 | |
Cognex Corporation | | | | | | | | | | | 21,455 | | | | 1,197,618 | |
Flex Limited † | | | | | | | | | | | 29,945 | | | | 392,878 | |
IPG Photonics Corporation † | | | | | | | | | | | 6,400 | | | | 998,848 | |
Samsung SDI Company Limited | | | | | | | | | | | 5,560 | | | | 1,295,704 | |
| | | | |
| | | | | | | | | | | | | | | 4,900,514 | |
| | | | | | | | | | | | | | | | |
The accompanying notes are an integral part of these financial statements.
| | | | |
| 10 | | Wells Fargo Specialized Technology Fund | | Portfolio of investments—September 30, 2018 (unaudited) |
| | | | | | | | | | | | | | | | |
| Security name | | | | | | | | Shares | | | Value | |
|
| IT Services: 18.63% | |
Capgemini SA | | | | | | | | | | | 5,725 | | | $ | 720,536 | |
DXC Technology Company | | | | | | | | | | | 118,435 | | | | 11,076,041 | |
MasterCard Incorporated Class A | | | | | | | | | | | 46,325 | | | | 10,312,408 | |
MongoDB Incorporated †« | | | | | | | | | | | 79,970 | | | | 6,521,554 | |
Okta Incorporated † | | | | | | | | | | | 180,095 | | | | 12,671,484 | |
PayPal Holdings Incorporated † | | | | | | | | | | | 74,155 | | | | 6,513,775 | |
Perspecta Incorporated | | | | | | | | | | | 55,804 | | | | 1,435,279 | |
Square Incorporated Class A † | | | | | | | | | | | 310,980 | | | | 30,790,130 | |
Twilio Incorporated Class A † | | | | | | | | | | | 116,880 | | | | 10,084,406 | |
Visa Incorporated Class A | | | | | | | | | | | 63,875 | | | | 9,586,999 | |
| | | | |
| | | | | | | | | | | | | | | 99,712,612 | |
| | | | | | | | | | | | | | | | |
|
| Semiconductors & Semiconductor Equipment: 8.98% | |
Advanced Micro Devices Incorporated † | | | | | | | | | | | 171,310 | | | | 5,291,766 | |
ASML Holding NV « | | | | | | | | | | | 2,465 | | | | 463,469 | |
Broadcom Incorporated | | | | | | | | | | | 14,400 | | | | 3,552,912 | |
Cree Incorporated † | | | | | | | | | | | 93,230 | | | | 3,530,620 | |
Infineon Technologies AG | | | | | | | | | | | 51,605 | | | | 1,172,556 | |
Intel Corporation | | | | | | | | | | | 11,445 | | | | 541,234 | |
Microchip Technology Incorporated « | | | | | | | | | | | 74,415 | | | | 5,872,088 | |
Micron Technology Incorporated † | | | | | | | | | | | 96,815 | | | | 4,378,942 | |
NVIDIA Corporation | | | | | | | | | | | 37,185 | | | | 10,449,729 | |
ON Semiconductor Corporation † | | | | | | | | | | | 30,615 | | | | 564,234 | |
QUALCOMM Incorporated | | | | | | | | | | | 38,665 | | | | 2,785,040 | |
SK Hynix Incorporated | | | | | | | | | | | 4,772 | | | | 314,477 | |
Taiwan Semiconductor Manufacturing Company Limited ADR | | | | | | | | | | | 135,140 | | | | 5,967,782 | |
Teradyne Incorporated | | | | | | | | | | | 85,735 | | | | 3,170,480 | |
| | | | |
| | | | | | | | | | | | | | | 48,055,329 | |
| | | | | | | | | | | | | | | | |
|
| Software: 27.58% | |
Adobe Systems Incorporated † | | | | | | | | | | | 7,900 | | | | 2,132,605 | |
Aspen Technology Incorporated † | | | | | | | | | | | 4,920 | | | | 560,437 | |
Atlassian Corporation plc Class A † | | | | | | | | | | | 32,755 | | | | 3,149,066 | |
Autodesk Incorporated † | | | | | | | | | | | 8,775 | | | | 1,369,865 | |
AVEVA Group plc | | | | | | | | | | | 26,370 | | | | 994,687 | |
Dropbox Incorporated Class A † | | | | | | | | | | | 605 | | | | 16,232 | |
ForeScout Technologies Incorporated † | | | | | | | | | | | 7,965 | | | | 300,758 | |
Guidewire Software Incorporated † | | | | | | | | | | | 4,775 | | | | 482,323 | |
HubSpot Incorporated † | | | | | | | | | | | 9,815 | | | | 1,481,574 | |
Intuit Incorporated | | | | | | | | | | | 2,265 | | | | 515,061 | |
Microsoft Corporation | | | | | | | | | | | 292,245 | | | | 33,424,061 | |
New Relic Incorporated † | | | | | | | | | | | 9,235 | | | | 870,214 | |
Nutanix Incorporated Class A † | | | | | | | | | | | 77,155 | | | | 3,296,062 | |
Oracle Corporation | | | | | | | | | | | 30,730 | | | | 1,584,439 | |
Paycom Software Incorporated † | | | | | | | | | | | 116,555 | | | | 18,113,813 | |
Proofpoint Incorporated † | | | | | | | | | | | 73,945 | | | | 7,862,572 | |
RealPage Incorporated † | | | | | | | | | | | 29,875 | | | | 1,968,763 | |
RingCentral Incorporated Class A † | | | | | | | | | | | 125,855 | | | | 11,710,808 | |
Salesforce.com Incorporated † | | | | | | | | | | | 86,994 | | | | 13,834,656 | |
The accompanying notes are an integral part of these financial statements.
| | | | | | |
| Portfolio of investments—September 30, 2018 (unaudited) | | Wells Fargo Specialized Technology Fund | | | 11 | |
| | | | | | | | | | | | | | | | |
| Security name | | | | | | | | Shares | | | Value | |
|
| Software (continued) | |
ServiceNow Incorporated † | | | | | | | | | | | 99,170 | | | $ | 19,400,627 | |
Sophos Group plc 144A | | | | | | | | | | | 163,120 | | | | 1,037,540 | |
Tableau Software Incorporated Class A † | | | | | | | | | | | 67,900 | | | | 7,587,146 | |
Temenos Group AG | | | | | | | | | | | 11,205 | | | | 1,817,644 | |
Workday Incorporated Class A † | | | | | | | | | | | 76,670 | | | | 11,192,287 | |
Zendesk Incorporated † | | | | | | | | | | | 15,985 | | | | 1,134,935 | |
Zscaler Incorporated † | | | | | | | | | | | 43,465 | | | | 1,772,503 | |
| | | | |
| | | | | | | | | | | | | | | 147,610,678 | |
| | | | | | | | | | | | | | | | |
|
| Technology Hardware, Storage & Peripherals: 12.54% | |
Apple Incorporated | | | | | | | | | | | 166,915 | | | | 37,679,394 | |
NetApp Incorporated | | | | | | | | | | | 322,435 | | | | 27,693,942 | |
Pure Storage Incorporated Class A † | | | | | | | | | | | 67,380 | | | | 1,748,511 | |
| | | | |
| | | | | | | | | | | | | | | 67,121,847 | |
| | | | | | | | | | | | | | | | |
| |
Total Common Stocks (Cost $300,410,041) | | | | 503,094,732 | |
| | | | | | | | | | | | | | | | |
| | | | |
| | | Yield | | | | | | | | | | |
| Short-Term Investments: 7.99% | |
|
| Investment Companies: 7.99% | |
Securities Lending Cash Investment LLC (l)(r)(u) | | | 2.17 | % | | | | | | | 11,346,796 | | | | 11,347,930 | |
Wells Fargo Government Money Market Fund Select Class (l)(u) | | | 1.99 | | | | | | | | 31,430,389 | | | | 31,430,389 | |
| |
Total Short-Term Investments (Cost $42,778,319) | | | | 42,778,319 | |
| | | | | |
| | | | | | | | |
| Total investments in securities (Cost $343,188,360) | | | 101.99 | % | | | 545,873,051 | |
Other assets and liabilities, net | | | (1.99 | ) | | | (10,627,295 | ) |
| | | | | | | | |
| Total net assets | | | 100.00 | % | | $ | 535,245,756 | |
| | | | | | | | |
| † | Non-income-earning security |
| « | All or a portion of this security is on loan. |
| 144A | The security may be resold in transactions exempt from registration, normally to qualified institutional buyers, pursuant to Rule 144A under the Securities Act of 1933. |
| (l) | The issuer of the security is an affiliated person of the Fund as defined in the Investment Company Act of 1940. |
| (r) | The investment is a non-registered investment company purchased with cash collateral received from securities on loan. |
| (u) | The rate represents the 7-day annualized yield at period end. |
Abbreviations:
| ADR | American depositary receipt |
The accompanying notes are an integral part of these financial statements.
| | | | |
| 12 | | Wells Fargo Specialized Technology Fund | | Portfolio of investments—September 30, 2018 (unaudited) |
Investments in Affiliates
An affiliated investment is an investment in which the Fund owns at least 5% of the outstanding voting shares of the issuer or as a result of other relationships, such as the Fund and the issuer having the same investment manager. Transactions with issuers that were either affiliated persons of the Fund at the beginning of the period or the end of the period were as follows:
| | | | | | | | | | | | | | | | | | | | | | | | | | | | | | | | | | | | |
| | | Shares, beginning of period | | | Shares purchased | | | Shares sold | | | Shares, end of period | | | Net realized gains (losses) | | | Net change in
unrealized gains (losses) | | | Income from affiliated securities | | | Value, end of period | | | % of net assets | |
Short-Term Investments | |
Investment Companies | |
Securities Lending Cash Investment LLC | | | 23,934,530 | | | | 104,305,554 | | | | 116,893,288 | | | | 11,346,796 | | | $ | 33 | | | $ | 0 | | | $ | 71,095 | | | $ | 11,347,930 | | | | | |
Wells Fargo Government Money Market Fund Select Class | | | 2,705,051 | | | | 140,768,977 | | | | 112,043,639 | | | | 31,430,389 | | | | 0 | | | | 0 | | | | 223,762 | | | | 31,430,389 | | | | | |
| | | | | | | | | | | | | | | | | | | | | | | | | | | | | | | | | | | | |
| | | | | | | | | | | | | | | | | | $ | 33 | | | $ | 0 | | | $ | 294,857 | | | $ | 42,778,319 | | | | 7.99 | % |
| | | | | | | | | | | | | | | | | | | | | | | | | | | | | | | | | | | | |
The accompanying notes are an integral part of these financial statements.
| | | | | | |
| Statement of assets and liabilities—September 30, 2018 (unaudited) | | Wells Fargo Specialized Technology Fund | | | 13 | |
| | | | |
| | | | |
| |
Assets | | | | |
Investments in unaffiliated securities, (including $11,119,991 of securities loaned), at value (cost $300,410,041) | | $ | 503,094,732 | |
Investments in affiliated securities, at value (cost $42,778,319) | | | 42,778,319 | |
Receivable for investments sold | | | 418,745 | |
Receivable for Fund shares sold | | | 1,040,105 | |
Receivable for dividends | | | 85,375 | |
Receivable for securities lending income | | | 20,725 | |
Prepaid expenses and other assets | | | 48,284 | |
| | | | |
Total assets | | | 547,486,285 | |
| | | | |
| |
Liabilities | | | | |
Payable upon receipt of securities loaned | | | 11,347,874 | |
Management fee payable | | | 370,011 | |
Payable for Fund shares redeemed | | | 213,952 | |
Administration fees payable | | | 85,004 | |
Payable for investments purchased | | | 59,774 | |
Distribution fee payable | | | 10,983 | |
Trustees’ fees and expenses payable | | | 2,337 | |
Due to custodian bank, foreign currency, at value (cost $1,833) | | | 1,831 | |
Accrued expenses and other liabilities | | | 148,763 | |
| | | | |
Total liabilities | | | 12,240,529 | |
| | | | |
Total net assets | | $ | 535,245,756 | |
| | | | |
| |
NET ASSETS CONSIST OF | | | | |
Paid-in capital | | $ | 226,848,165 | |
Total distributable earnings | | | 308,397,591 | |
| | | | |
Total net assets | | $ | 535,245,756 | |
| | | | |
| |
COMPUTATION OF NET ASSET VALUE AND OFFERING PRICE PER SHARE | | | | |
Net assets – Class A | | $ | 435,787,561 | |
Shares outstanding – Class A1 | | | 26,029,144 | |
Net asset value per share – Class A | | | $16.74 | |
Maximum offering price per share – Class A2 | | | $17.76 | |
Net assets – Class C | | $ | 18,108,061 | |
Shares outstanding – Class C1 | | | 1,342,928 | |
Net asset value per share – Class C | | | $13.48 | |
Net assets – Administrator Class | | $ | 25,036,134 | |
Shares outstanding – Administrator Class1 | | | 1,467,941 | |
Net asset value per share – Administrator Class | | | $17.06 | |
Net assets – Institutional Class | | $ | 56,314,000 | |
Shares outstanding – Institutional Class1 | | | 3,289,625 | |
Net asset value per share – Institutional Class | | | $17.12 | |
| 1 | The Fund has an unlimited number of authorized shares. |
| 2 | Maximum offering price is computed as 100/94.25 of net asset value. On investments of $50,000 or more, the offering price is reduced. |
The accompanying notes are an integral part of these financial statements.
| | | | |
| 14 | | Wells Fargo Specialized Technology Fund | | Statement of operations—six months ended September 30, 2018 (unaudited) |
| | | | |
| | | | |
| |
Investment income | | | | |
Dividends (net of foreign withholding taxes of $4,363) | | $ | 975,516 | |
Income from affiliated securities | | | 223,762 | |
Securities lending income from affiliates, net | | | 71,095 | |
| | | | |
Total investment income | | | 1,270,373 | |
| | | | |
| |
Expenses | | | | |
Management fee | | | 2,059,230 | |
Administration fees | | | | |
Class A | | | 409,969 | |
Class C | �� | | 17,740 | |
Administrator Class | | | 13,899 | |
Institutional Class | | | 25,547 | |
Shareholder servicing fees | | | | |
Class A | | | 488,059 | |
Class C | | | 21,119 | |
Administrator Class | | | 26,728 | |
Distribution fee | | | | |
Class C | | | 63,358 | |
Custody and accounting fees | | | 15,034 | |
Professional fees | | | 24,146 | |
Registration fees | | | 46,222 | |
Shareholder report expenses | | | 34,990 | |
Trustees’ fees and expenses | | | 11,948 | |
Other fees and expenses | | | 12,613 | |
| | | | |
Total expenses | | | 3,270,602 | |
Less: Fee waivers and/or expense reimbursements | | | (21,974 | ) |
| | | | |
Net expenses | | | 3,248,628 | |
| | | | |
Net investment loss | | | (1,978,255 | ) |
| | | | |
| |
REALIZED AND UNREALIZED GAINS (LOSSES) ON INVESTMENTS | | | | |
| |
Net realized gains on: | | | | |
Unaffiliated securities | | | 26,397,651 | |
Affiliated securities | | | 33 | |
Forward foreign currency contracts | | | 1,464 | |
| | | | |
Net realized gains on investments | | | 26,399,148 | |
| | | | |
| |
Net change in unrealized gains (losses) on: | | | | |
Unaffiliated securities | | | 56,122,115 | |
Forward foreign currency contracts | | | (860 | ) |
| | | | |
Net change in unrealized gains (losses) on investments | | | 56,121,255 | |
| | | | |
Net realized and unrealized gains (losses) on investments | | | 82,520,403 | |
| | | | |
Net increase in net assets resulting from operations | | $ | 80,542,148 | |
| | | | |
The accompanying notes are an integral part of these financial statements.
| | | | | | |
| Statement of changes in net assets | | Wells Fargo Specialized Technology Fund | | | 15 | |
| | | | | | | | | | | | | | | | |
| | | Six months ended
September 30, 2018
(unaudited) | | | Year ended
March 31, 20181 | |
| | | | |
Operations | | | | | | | | | | | | | | | | |
Net investment loss | | | | | | $ | (1,978,255 | ) | | | | | | $ | (2,968,325 | ) |
Net realized gains on investments | | | | | | | 26,399,148 | | | | | | | | 85,463,589 | |
Net change in unrealized gains (losses) on investments | | | | | | | 56,121,255 | | | | | | | | 45,515,664 | |
| | | | |
Net increase in net assets resulting from operations | | | | | | | 80,542,148 | | | | | | | | 128,010,928 | |
| | | | |
| | | | |
Distributions to shareholders | | | | | | | | | | | | | | | | |
Class A | | | | | | | 0 | | | | | | | | (22,775,603 | ) |
Class C | | | | | | | 0 | | | | | | | | (1,248,847 | ) |
Administrator Class | | | | | | | 0 | | | | | | | | (3,999,359 | ) |
Institutional Class | | | | | | | 0 | | | | | | | | (1,741,744 | ) |
| | | | |
Total distributions to shareholders | | | | | | | 0 | | | | | | | | (29,765,553 | ) |
| | | | |
| | | | |
Capital share transactions | | | Shares | | | | | | | | Shares | | | | | |
Proceeds from shares sold | | | | | | | | | | | | | | | | |
Class A | | | 2,538,295 | | | | 39,981,049 | | | | 2,084,687 | | | | 27,533,950 | |
Class C | | | 142,150 | | | | 1,781,109 | | | | 192,101 | | | | 2,045,595 | |
Administrator Class | | | 304,743 | | | | 4,876,660 | | | | 1,546,441 | | | | 19,850,044 | |
Institutional Class | | | 1,650,908 | | | | 26,295,461 | | | | 564,328 | | | | 7,724,961 | |
| | | | |
| | | | | | | 72,934,279 | | | | | | | | 57,154,550 | |
| | | | |
Reinvestment of distributions | | | | | | | | | | | | | | | | |
Class A | | | 0 | | | | 0 | | | | 1,731,116 | | | | 22,071,725 | |
Class C | | | 0 | | | | 0 | | | | 116,005 | | | | 1,198,329 | |
Administrator Class | | | 0 | | | | 0 | | | | 307,642 | | | | 3,990,121 | |
Institutional Class | | | 0 | | | | 0 | | | | 123,913 | | | | 1,610,864 | |
| | | | |
| | | | | | | 0 | | | | | | | | 28,871,039 | |
| | | | |
Payment for shares redeemed | | | | | | | | | | | | | | | | |
Class A | | | (1,613,843 | ) | | | (24,856,103 | ) | | | (3,040,823 | ) | | | (38,796,202 | ) |
Class C | | | (198,611 | ) | | | (2,480,038 | ) | | | (323,924 | ) | | | (3,371,408 | ) |
Administrator Class | | | (171,132 | ) | | | (2,707,658 | ) | | | (4,102,652 | ) | | | (57,561,216 | ) |
Institutional Class | | | (274,995 | ) | | | (4,319,385 | ) | | | (561,375 | ) | | | (7,267,274 | ) |
| | | | |
| | | | | | | (34,363,184 | ) | | | | | | | (106,996,100 | ) |
| | | | |
Net increase (decrease) in net assets resulting from capital share transactions | | | | | | | 38,571,095 | | | | | | | | (20,970,511 | ) |
| | | | |
Total increase in net assets | | | | | | | 119,113,243 | | | | | | | | 77,274,864 | |
| | | | |
| | | | |
Net assets | | | | | | | | | | | | | | | | |
Beginning of period | | | | | | | 416,132,513 | | | | | | | | 338,857,649 | |
| | | | |
End of period | | | | | | $ | 535,245,756 | | | | | | | $ | 416,132,513 | |
| | | | |
| 1 | Effective for all filings after November 4, 2018, the SEC prospectively eliminated the requirements to parenthetically disclose undistributed net investment income at the end of the period and to disaggregate distributions to shareholders between distributions from net investment income and distributions from realized gains. Accumulated net investment loss at March 31, 2018 was $860. The disaggregated distributions information for the year ended March 31, 2018 is included in Note 7, Distributions to Shareholders, in the notes to the financial statements. |
The accompanying notes are an integral part of these financial statements.
| | | | |
| 16 | | Wells Fargo Specialized Technology Fund | | Financial highlights |
(For a share outstanding throughout each period)
| | | | | | | | | | | | | | | | | | | | | | | | |
| | | Six months ended
September 30, 2018 (unaudited) | | | Year ended March 31 | |
| CLASS A | | 2018 | | | 2017 | | | 2016 | | | 2015 | | | 2014 | |
Net asset value, beginning of period | | | $14.08 | | | | $10.95 | | | | $9.39 | | | | $10.74 | | | | $10.65 | | | | $8.15 | |
Net investment loss | | | (0.07 | ) | | | (0.10 | )1 | | | (0.03 | )1 | | | (0.06 | ) | | | (0.06 | ) | | | (0.06 | ) |
Net realized and unrealized gains (losses) on investments | | | 2.73 | | | | 4.20 | | | | 2.17 | | | | 0.02 | | | | 1.43 | | | | 3.07 | |
| | | | | | | | | | | | | | | | | | | | | | | | |
Total from investment operations | | | 2.66 | | | | 4.10 | | | | 2.14 | | | | (0.04 | ) | | | 1.37 | | | | 3.01 | |
Distributions to shareholders from | | | | | | | | | | | | | | | | | | | | | | | | |
Net realized gains | | | 0.00 | | | | (0.97 | ) | | | (0.58 | ) | | | (1.31 | ) | | | (1.28 | ) | | | (0.51 | ) |
Net asset value, end of period | | | $16.74 | | | | $14.08 | | | | $10.95 | | | | $9.39 | | | | $10.74 | | | | $10.65 | |
Total return2 | | | 18.89 | % | | | 38.41 | % | | | 23.55 | % | | | (0.66 | )% | | | 13.24 | % | | | 37.27 | % |
Ratios to average net assets (annualized) | | | | | | | | | | | | | | | | | | | | | | | | |
Gross expenses | | | 1.40 | % | | | 1.41 | % | | | 1.44 | % | | | 1.45 | % | | | 1.52 | % | | | 1.60 | % |
Net expenses | | | 1.39 | % | | | 1.41 | % | | | 1.44 | % | | | 1.45 | % | | | 1.51 | % | | | 1.56 | % |
Net investment loss | | | (0.85 | )% | | | (0.75 | )% | | | (0.28 | )% | | | (0.53 | )% | | | (0.58 | )% | | | (0.63 | )% |
Supplemental data | | | | | | | | | | | | | | | | | | | | | | | | |
Portfolio turnover rate | | | 55 | % | | | 109 | % | | | 131 | % | | | 153 | % | | | 119 | % | | | 132 | % |
Net assets, end of period (000s omitted) | | | $435,788 | | | | $353,552 | | | | $266,329 | | | | $267,811 | | | | $168,108 | | | | $154,833 | |
| 1 | Calculated based upon average shares outstanding |
| 2 | Total return calculations do not include any sales charges. Returns for periods of less than one year are not annualized. |
The accompanying notes are an integral part of these financial statements.
| | | | | | |
| Financial highlights | | Wells Fargo Specialized Technology Fund | | | 17 | |
(For a share outstanding throughout each period)
| | | | | | | | | | | | | | | | | | | | | | | | |
| | | Six months ended
September 30, 2018 (unaudited) | | | Year ended March 31 | |
| CLASS C | | 2018 | | | 2017 | | | 2016 | | | 2015 | | | 2014 | |
Net asset value, beginning of period | | | $11.38 | | | | $9.06 | | | | $7.92 | | | | $9.33 | | | | $9.47 | | | | $7.35 | |
Net investment loss | | | (0.13 | ) | | | (0.16 | ) | | | (0.09 | )1 | | | (0.12 | )1 | | | (0.13 | )1 | | | (0.12 | )1 |
Net realized and unrealized gains (losses) on investments | | | 2.23 | | | | 3.45 | | | | 1.81 | | | | 0.02 | | | | 1.27 | | | | 2.75 | |
| | | | | | | | | | | | | | | | | | | | | | | | |
Total from investment operations | | | 2.10 | | | | 3.29 | | | | 1.72 | | | | (0.10 | ) | | | 1.14 | | | | 2.63 | |
Distributions to shareholders from | | | | | | | | | | | | | | | | | | | | | | | | |
Net realized gains | | | 0.00 | | | | (0.97 | ) | | | (0.58 | ) | | | (1.31 | ) | | | (1.28 | ) | | | (0.51 | ) |
Net asset value, end of period | | | $13.48 | | | | $11.38 | | | | $9.06 | | | | $7.92 | | | | $9.33 | | | | $9.47 | |
Total return2 | | | 18.45 | % | | | 37.45 | % | | | 22.59 | % | | | (1.45 | )% | | | 12.44 | % | | | 36.14 | % |
Ratios to average net assets (annualized) | | | | | | | | | | | | | | | | | | | | | | | | |
Gross expenses | | | 2.15 | % | | | 2.16 | % | | | 2.19 | % | | | 2.20 | % | | | 2.27 | % | | | 2.35 | % |
Net expenses | | | 2.14 | % | | | 2.16 | % | | | 2.19 | % | | | 2.20 | % | | | 2.26 | % | | | 2.31 | % |
Net investment loss | | | (1.60 | )% | | | (1.49 | )% | | | (1.03 | )% | | | (1.34 | )% | | | (1.33 | )% | | | (1.38 | )% |
Supplemental data | | | | | | | | | | | | | | | | | | | | | | | | |
Portfolio turnover rate | | | 55 | % | | | 109 | % | | | 131 | % | | | 153 | % | | | 119 | % | | | 132 | % |
Net assets, end of period (000s omitted) | | | $18,108 | | | | $15,932 | | | | $12,827 | | | | $13,797 | | | | $14,143 | | | | $10,907 | |
| 1 | Calculated based upon average shares outstanding |
| 2 | Total return calculations do not include any sales charges. Returns for periods of less than one year are not annualized. |
The accompanying notes are an integral part of these financial statements.
| | | | |
| 18 | | Wells Fargo Specialized Technology Fund | | Financial highlights |
(For a share outstanding throughout each period)
| | | | | | | | | | | | | | | | | | | | | | | | |
| | | Six months ended
September 30, 2018 (unaudited) | | | Year ended March 31 | |
| ADMINISTRATOR CLASS | | 2018 | | | 2017 | | | 2016 | | | 2015 | | | 2014 | |
Net asset value, beginning of period | | | $14.34 | | | | $11.12 | | | | $9.52 | | | | $10.86 | | | | $10.74 | | | | $8.20 | |
Net investment loss | | | (0.06 | )1 | | | (0.09 | )1 | | | (0.02 | ) | | | (0.05 | ) | | | (0.05 | ) | | | (0.05 | ) |
Net realized and unrealized gains (losses) on investments | | | 2.78 | | | | 4.28 | | | | 2.20 | | | | 0.02 | | | | 1.45 | | | | 3.10 | |
| | | | | | | | | | | | | | | | | | | | | | | | |
Total from investment operations | | | 2.72 | | | | 4.19 | | | | 2.18 | | | | (0.03 | ) | | | 1.40 | | | | 3.05 | |
Distributions to shareholders from | | | | | | | | | | | | | | | | | | | | | | | | |
Net realized gains | | | 0.00 | | | | (0.97 | ) | | | (0.58 | ) | | | (1.31 | ) | | | (1.28 | ) | | | (0.51 | ) |
Net asset value, end of period | | | $17.06 | | | | $14.34 | | | | $11.12 | | | | $9.52 | | | | $10.86 | | | | $10.74 | |
Total return2 | | | 19.05 | % | | | 38.55 | % | | | 23.65 | % | | | (0.56 | )% | | | 13.42 | % | | | 37.54 | % |
Ratios to average net assets (annualized) | | | | | | | | | | | | | | | | | | | | | | | | |
Gross expenses | | | 1.32 | % | | | 1.33 | % | | | 1.36 | % | | | 1.35 | % | | | 1.36 | % | | | 1.44 | % |
Net expenses | | | 1.30 | % | | | 1.32 | % | | | 1.33 | % | | | 1.33 | % | | | 1.35 | % | | | 1.40 | % |
Net investment loss | | | (0.75 | )% | | | (0.66 | )% | | | (0.17 | )% | | | (0.48 | )% | | | (0.42 | )% | | | (0.48 | )% |
Supplemental data | | | | | | | | | | | | | | | | | | | | | | | | |
Portfolio turnover rate | | | 55 | % | | | 109 | % | | | 131 | % | | | 153 | % | | | 119 | % | | | 132 | % |
Net assets, end of period (000s omitted) | | | $25,036 | | | | $19,140 | | | | $39,833 | | | | $32,373 | | | | $31,842 | | | | $31,681 | |
| 1 | Calculated based upon average shares outstanding |
| 2 | Returns for periods of less than one year are not annualized. |
The accompanying notes are an integral part of these financial statements.
| | | | | | |
| Financial highlights | | Wells Fargo Specialized Technology Fund | | | 19 | |
(For a share outstanding throughout each period)
| | | | | | | | | | | | |
| | | Six months ended
September 30, 2018 (unaudited) | | | Year ended March 31 | |
| INSTITUTIONAL CLASS | | 2018 | | | 20171 | |
Net asset value, beginning of period | | | $14.37 | | | | $11.12 | | | | $10.42 | |
Net investment income (loss) | | | (0.05 | ) | | | (0.05 | ) | | | 0.01 | 2 |
Net realized and unrealized gains (losses) on investments | | | 2.80 | | | | 4.27 | | | | 1.27 | |
| | | | | | | | | | | | |
Total from investment operations | | | 2.75 | | | | 4.22 | | | | 1.28 | |
Distributions to shareholders from | | | | | | | | | | | | |
Net realized gains | | | 0.00 | | | | (0.97 | ) | | | (0.58 | ) |
Net asset value, end of period | | | $17.12 | | | | $14.37 | | | | $11.12 | |
Total return3 | | | 19.14 | % | | | 38.91 | % | | | 12.97 | % |
Ratios to average net assets (annualized) | | | | | | | | | | | | |
Gross expenses | | | 1.07 | % | | | 1.08 | % | | | 1.11 | % |
Net expenses | | | 1.05 | % | | | 1.07 | % | | | 1.08 | % |
Net investment income (loss) | | | (0.51 | )% | | | (0.40 | )% | | | 0.17 | % |
Supplemental data | | | | | | | | | | | | |
Portfolio turnover rate | | | 55 | % | | | 109 | % | | | 131 | % |
Net assets, end of period (000s omitted) | | | $56,314 | | | | $27,509 | | | | $19,869 | |
| 1 | For the period from October 31, 2016 (commencement of class operations) to March 31, 2017 |
| 2 | Calculated based upon average shares outstanding |
| 3 | Returns for periods of less than one year are not annualized. |
The accompanying notes are an integral part of these financial statements.
| | | | |
| 20 | | Wells Fargo Specialized Technology Fund | | Notes to financial statements (unaudited) |
1. ORGANIZATION
Wells Fargo Funds Trust (the “Trust”), a Delaware statutory trust organized on March 10, 1999, is an open-end management investment company registered under the Investment Company Act of 1940, as amended (the “1940 Act”). As an investment company, the Trust follows the accounting and reporting guidance in Financial Accounting Standards Board Accounting Standards Codification Topic 946, Financial Services – Investment Companies. These financial statements report on the Wells Fargo Specialized Technology Fund (the “Fund”) which is a non-diversified series of the Trust.
2. SIGNIFICANT ACCOUNTING POLICIES
The following significant accounting policies, which are consistently followed in the preparation of the financial statements of the Fund, are in conformity with U.S. generally accepted accounting principles which require management to make estimates and assumptions that affect the reported amounts of assets and liabilities, disclosure of contingent assets and liabilities at the date of the financial statements, and the reported amounts of revenues and expenses during the reporting period. Actual results could differ from those estimates.
Securities valuation
All investments are valued each business day as of the close of regular trading on the New York Stock Exchange (generally 4 p.m. Eastern Time), although the Fund may deviate from this calculation time under unusual or unexpected circumstances.
Equity securities that are listed on a foreign or domestic exchange or market are valued at the official closing price or, if none, the last sales price. If no sale occurs on the principal exchange or market that day, a fair value price will be determined in accordance with the Fund’s Valuation Procedures.
The values of securities denominated in foreign currencies are translated into U.S. dollars at rates provided by an independent foreign currency pricing source at a time each business day specified by the Wells Fargo Asset Management Pricing Committee at Wells Fargo Funds Management, LLC (“Funds Management”).
Many securities markets and exchanges outside the U.S. close prior to the close of the New York Stock Exchange and therefore may not fully reflect trading or events that occur after the close of the principal exchange in which the foreign securities are traded, but before the close of the New York Stock Exchange. If such trading or events are expected to materially affect the value of such securities, then fair value pricing procedures approved by the Board of Trustees of the Fund are applied. These procedures take into account multiple factors including movements in U.S. securities markets after foreign exchanges close. Foreign securities that are fair valued under these procedures are categorized as Level 2 and the application of these procedures may result in transfers between Level 1 and Level 2. Depending on market activity, such fair valuations may be frequent. Such fair value pricing may result in net asset values that are higher or lower than net asset values based on the last reported sales price or latest quoted bid price. On September 30, 2018, such fair value pricing was not used in pricing foreign securities.
Investments in registered open-end investment companies are valued at net asset value. Interests in non-registered investment companies that are redeemable at net asset value are fair valued normally at net asset value.
Investments which are not valued using any of the methods discussed above are valued at their fair value, as determined in good faith by the Board of Trustees. The Board of Trustees has established a Valuation Committee comprised of the Trustees and has delegated to it the authority to take any actions regarding the valuation of portfolio securities that the Valuation Committee deems necessary or appropriate, including determining the fair value of portfolio securities, unless the determination has been delegated to the Wells Fargo Asset Management Pricing Committee. The Board of Trustees retains the authority to make or ratify any valuation decisions or approve any changes to the Valuation Procedures as it deems appropriate. On a quarterly basis, the Board of Trustees receives reports on any valuation actions taken by the Valuation Committee or the Wells Fargo Asset Management Pricing Committee which may include items for ratification.
Foreign currency translation
The accounting records of the Fund are maintained in U.S. dollars. The values of other assets and liabilities denominated in foreign currencies are translated into U.S. dollars at rates provided by an independent foreign currency pricing source at a time each business day specified by the Wells Fargo Asset Management Pricing Committee. Purchases and sales of securities, and income and expenses are converted at the rate of exchange on the respective dates of such transactions. Net realized foreign exchange gains or losses arise from sales of foreign currencies, currency gains or losses realized between the trade and settlement dates on securities transactions, and the difference between the amounts of dividends, interest and foreign withholding taxes recorded and the U.S. dollar equivalent of the amounts actually paid or received. Net unrealized foreign exchange gains and losses arise from changes in the fair value of assets and liabilities
| | | | | | |
| Notes to financial statements (unaudited) | | Wells Fargo Specialized Technology Fund | | | 21 | |
other than investments in securities resulting from changes in exchange rates. The changes in net assets arising from changes in exchange rates of securities and the changes in net assets resulting from changes in market prices of securities are not separately presented. Such changes are included in net realized and unrealized gains or losses from investments.
Forward foreign currency contracts
The Fund is subject to foreign currency risk in the normal course of pursuing its investment objectives. A forward foreign currency contract is an agreement between two parties to purchase or sell a specific currency for an agreed-upon price at a future date. The Fund enters into forward foreign currency contracts to facilitate transactions in foreign-denominated securities and to attempt to minimize the risk to the Fund from adverse changes in the relationship between currencies. Forward foreign currency contracts are recorded at the forward rate and marked-to-market daily. When the contracts are closed, realized gains and losses arising from such transactions are recorded as realized gains or losses on forward foreign currency contracts. The Fund could be exposed to risks if the counterparties to the contracts are unable to meet the terms of their contracts or if the value of the foreign currency changes unfavorably. The Fund’s maximum risk of loss from counterparty credit risk is the unrealized gains on the contracts. This risk may be mitigated if there is a master netting arrangement between the Fund and the counterparty.
Securities lending
The Fund may lend its securities from time to time in order to earn additional income in the form of fees or interest on securities received as collateral or the investment of any cash received as collateral. The Fund continues to receive interest or dividends on the securities loaned. The Fund receives collateral in the form of cash or securities with a value at least equal to the value of the securities on loan. The value of the loaned securities is determined at the close of each business day and any additional required collateral is delivered to the Fund on the next business day. In a securities lending transaction, the net asset value of the Fund will be affected by an increase or decrease in the value of the securities loaned and by an increase or decrease in the value of the instrument in which collateral is invested. The amount of securities lending activity undertaken by the Fund fluctuates from time to time. In the event of default or bankruptcy by the borrower, the Fund may be prevented from recovering the loaned securities or gaining access to the collateral or may experience delays or costs in doing so. In addition, the investment of any cash collateral received may lose all or part of its value. The Fund has the right under the lending agreement to recover the securities from the borrower on demand.
The Fund lends its securities through an unaffiliated securities lending agent. Cash collateral received in connection with its securities lending transactions is invested in Securities Lending Cash Investments, LLC (the “Securities Lending Fund”). The Securities Lending Fund is exempt from registration under Section 3(c)(7) of the 1940 Act and is managed by Funds Management and is subadvised by Wells Capital Management Incorporated (“WellsCap”), an affiliate of Funds Management and an indirect wholly owned subsidiary of Wells Fargo & Company (“Wells Fargo”). Funds Management receives an advisory fee starting at 0.05% and declining to 0.01% as the average daily net assets of the Securities Lending Fund increase. All of the fees received by Funds Management are paid to WellsCap for its services as subadviser. The Securities Lending Fund seeks to provide a positive return compared to the daily Fed Funds Open Rate by investing in high-quality, U.S. dollar-denominated short-term money market instruments. Securities Lending Fund investments are valued at the evaluated bid price provided by an independent pricing service. Income earned from investment in the Securities Lending Fund is included in securities lending income from affiliates (net of fees and rebates) on the Statement of Operations.
Security transactions and income recognition
Securities transactions are recorded on a trade date basis. Realized gains or losses are recorded on the basis of identified cost.
Dividend income is recognized on the ex-dividend date, except for certain dividends from foreign securities, which are recorded as soon as the custodian verifies the ex-dividend date. Dividend income from foreign securities is recorded net of foreign taxes withheld where recovery of such taxes is not assured.
Distributions to shareholders
Distributions to shareholders from net investment income and any net realized gains are recorded on the ex-dividend date and paid at least annually. Such distributions are determined in accordance with income tax regulations and may differ from U.S. generally accepted accounting principles. Dividend sources are estimated at the time of declaration. The tax character of distributions is determined as of the Fund’s fiscal year end. Therefore, a portion of the Fund’s distributions made prior to the Fund’s fiscal year end may be categorized as a tax return of capital at year end.
| | | | |
| 22 | | Wells Fargo Specialized Technology Fund | | Notes to financial statements (unaudited) |
Federal and other taxes
The Fund intends to continue to qualify as a regulated investment company by distributing substantially all of its investment company taxable income and any net realized capital gains (after reduction for capital loss carryforwards) sufficient to relieve it from all, or substantially all, federal income taxes. Accordingly, no provision for federal income taxes was required.
The Fund’s income and federal excise tax returns and all financial records supporting those returns for the prior three fiscal years are subject to examination by the federal and Delaware revenue authorities. Management has analyzed the Fund’s tax positions taken on federal, state, and foreign tax returns for all open tax years and does not believe that there are any uncertain tax positions that require recognition of a tax liability.
As of September 30, 2018, the aggregate cost of all investments for federal income tax purposes was $343,176,708 and the unrealized gains (losses) consisted of:
| | | | |
Gross unrealized gains | | $ | 202,744,035 | |
Gross unrealized losses | | | (47,692 | ) |
Net unrealized gains | | $ | 202,696,343 | |
Class allocations
The separate classes of shares offered by the Fund differ principally in applicable sales charges, distribution, shareholder servicing, and administration fees. Class specific expenses are charged directly to that share class. Investment income, common expenses, and realized and unrealized gains (losses) on investments are allocated daily to each class of shares based on the relative proportion of net assets of each class.
3. FAIR VALUATION MEASUREMENTS
Fair value measurements of investments are determined within a framework that has established a fair value hierarchy based upon the various data inputs utilized in determining the value of the Fund’s investments. The three-level hierarchy gives the highest priority to unadjusted quoted prices in active markets for identical assets or liabilities (Level 1) and the lowest priority to unobservable inputs (Level 3). The Fund’s investments are classified within the fair value hierarchy based on the lowest level of input that is significant to the fair value measurement. The inputs are summarized into three broad levels as follows:
| ∎ | | Level 1 – quoted prices in active markets for identical securities |
| ∎ | | Level 2 – other significant observable inputs (including quoted prices for similar securities, interest rates, prepayment speeds, credit risk, etc.) |
| ∎ | | Level 3 – significant unobservable inputs (including the Fund’s own assumptions in determining the fair value of investments) |
The inputs or methodologies used for valuing investments in securities are not necessarily an indication of the risk associated with investing in those securities.
| | | | | | |
| Notes to financial statements (unaudited) | | Wells Fargo Specialized Technology Fund | | | 23 | |
The following is a summary of the inputs used in valuing the Fund’s assets and liabilities as of September 30, 2018:
| | | | | | | | | | | | | | | | |
| | | Quoted prices
(Level 1) | | | Other significant
observable inputs
(Level 2) | | | Significant
unobservable inputs (Level 3) | | | Total | |
Assets | | | | | | | | | | | | | | | | |
Investments in: | | | | | | | | | | | | | | | | |
| | | | |
Common stocks | | | | | | | | | | | | | | | | |
Communication services | | $ | 60,990,425 | | | $ | 0 | | | $ | 0 | | | $ | 60,990,425 | |
Consumer discretionary | | | 52,602,657 | | | | 0 | | | | 0 | | | | 52,602,657 | |
Health care | | | 633,079 | | | | 0 | | | | 0 | | | | 633,079 | |
Industrials | | | 1,926,883 | | | | 0 | | | | 0 | | | | 1,926,883 | |
Information technology | | | 386,941,688 | | | | 0 | | | | 0 | | | | 386,941,688 | |
| | | | |
Short-term investments | | | | | | | | | | | | | | | | |
Investment companies | | | 31,430,389 | | | | 11,347,930 | | | | 0 | | | | 42,778,319 | |
Total assets | | $ | 534,525,121 | | | $ | 11,347,930 | | | $ | 0 | | | $ | 545,873,051 | |
Additional sector, industry or geographic detail is included in the Portfolio of Investments.
At September 30, 2018, the Fund did not have any transfers into/out of Level 3.
4. TRANSACTIONS WITH AFFILIATES AND OTHER EXPENSES
Management fee
Funds Management, an indirect wholly owned subsidiary of Wells Fargo, is the manager of the Fund and provides advisory and fund-level administrative services under an investment management agreement. Under the investment management agreement, Funds Management is responsible for, among other services, implementing the investment objectives and strategies of the Fund, supervising the subadviser and providing fund-level administrative services in connection with the Fund’s operations. As compensation for its services under the investment management agreement, Funds Management is entitled to receive an annual management fee starting at 0.88% and declining to 0.78% as the average daily net assets of the Fund increase. For the six months ended September 30, 2018, the management fee was equivalent to an annual rate of 0.88% of the Fund’s average daily net assets.
Funds Management has retained the services of a subadviser to provide daily portfolio management to the Fund. The fee for subadvisory services is borne by Funds Management. Allianz Global Investors U.S. LLC, which is not an affiliate of Funds Management, is the subadviser to the Fund and is entitled to receive a fee from Funds Management at an annual rate starting at 0.80% and declining to 0.55% as the average daily net assets of the Fund increase.
Administration fees
Under a class-level administration agreement, Funds Management provides class-level administrative services to the Fund, which includes paying fees and expenses for services provided by the transfer agent, sub-transfer agents, omnibus account servicers and record-keepers. As compensation for its services under the class-level administration agreement, Funds Management receives an annual fee which is calculated based on the average daily net assets of each class as follows:
| | | | |
| | | Class-level
administration fee | |
Class A, Class C | | | 0.21 | % |
Administrator Class, Institutional Class | | | 0.13 | |
Funds Management has contractually waived and/or reimbursed management and administration fees to the extent necessary to maintain certain net operating expense ratios for the Fund. When each class of the Fund has exceeded its expense cap, Funds Management has waived fees and/or reimbursed expenses from fund level expenses on a proportionate basis and then from class specific expenses; otherwise, waivers and/or reimbursements are applied against class specific expenses before fund level expenses. Funds Management has committed through July 31, 2019 to waive fees and/or reimburse expenses to the extent necessary to cap the Fund’s expenses at 1.38% for Class A shares, 2.13% for Class C shares, 1.28% for Administrator Class shares, and 1.03% for Institutional Class shares. After this time, the cap may
| | | | |
| 24 | | Wells Fargo Specialized Technology Fund | | Notes to financial statements (unaudited) |
be increased or the commitment to maintain the cap may be terminated only with the approval of the Board of Trustees. Prior to August 1, 2018, the Fund’s expenses were capped at 1.41% for Class A shares, 2.16% for Class C shares, 1.31% for Administrator Class shares, and 1.06% for Institutional Class shares.
Distribution fee
The Trust has adopted a distribution plan for Class C shares of the Fund pursuant to Rule 12b-1 under the 1940 Act. A distribution fee is charged to Class C shares and paid to Wells Fargo Funds Distributor, LLC (“Funds Distributor”), the principal underwriter, at an annual rate of 0.75% of the average daily net assets of Class C shares.
In addition, Funds Distributor is entitled to receive the front-end sales charge from the purchase of Class A shares and a contingent deferred sales charge on the redemption of certain Class A shares. Funds Distributor is also entitled to receive the contingent deferred sales charges from redemptions of Class C shares. For the six months ended September 30, 2018, Funds Distributor received $16,184 from the sale of Class A. No contingent deferred sales charges were incurred by Class A and Class C shares for the six months ended September 30, 2018.
Shareholder servicing fees
The Trust has entered into contracts with one or more shareholder servicing agents, whereby Class A, Class C, and Administrator Class of the Fund are charged a fee at an annual rate of 0.25% of the average daily net assets of each respective class.
A portion of these total shareholder servicing fees were paid to affiliates of Wells Fargo.
Interfund transactions
The Fund may purchase or sell portfolio investment securities to certain other Wells Fargo affiliates pursuant to Rule 17a-7 under the 1940 Act and under procedures adopted by the Board of Trustees. The procedures have been designed to ensure that these interfund transactions, which do not incur broker commissions, are effected at current market prices.
5. INVESTMENT PORTFOLIO TRANSACTIONS
Purchases and sales of investments, excluding U.S. government obligations (if any) and short-term securities, for the six months ended September 30, 2018 were $263,718,964 and $241,618,212, respectively.
6. BANK BORROWINGS
The Trust (excluding the money market funds), Wells Fargo Master Trust and Wells Fargo Variable Trust are parties to a $280,000,000 revolving credit agreement whereby the Fund is permitted to use bank borrowings for temporary or emergency purposes, such as to fund shareholder redemption requests. Interest under the credit agreement is charged to the Fund based on a borrowing rate equal to the higher of the Federal Funds rate in effect on that day plus 1.25% or the overnight LIBOR rate in effect on that day plus 1.25%. In addition, an annual commitment fee equal to 0.25% of the unused balance is allocated to each participating fund.
For the six months ended September 30, 2018, there were no borrowings by the Fund under the agreement.
7. DISTRIBUTIONS TO SHAREHOLDERS
Beginning October 2018, the Securities and Exchange Commission eliminated the requirement to separately state the components of distributions to shareholders. The amounts of distributions to shareholders for the year ended March 31, 2018 were as follows:
| | | | |
| | | Net realized gains | |
Class A | | $ | 22,775,603 | |
Class C | | | 1,248,847 | |
Administrator Class | | | 3,999,359 | |
Institutional Class | | | 1,741,744 | |
8. CONCENTRATION RISK
The Fund invests a substantial portion of its assets in technology companies and, therefore, would be more affected by changes in the technology sector than would be a fund whose investments are not heavily weighted in the sector.
| | | | | | |
| Notes to financial statements (unaudited) | | Wells Fargo Specialized Technology Fund | | | 25 | |
9. INDEMNIFICATION
Under the Trust’s organizational documents, the officers and Trustees have been granted certain indemnification rights against certain liabilities that may arise out of performance of their duties to the Trust. Additionally, in the normal course of business, the Trust may enter into contracts with service providers that contain a variety of indemnification clauses. The Trust’s maximum exposure under these arrangements is dependent on future claims that may be made against the Fund and, therefore, cannot be estimated.
10. NEW ACCOUNTING PRONOUNCEMENT
In August 2018, FASB issued Accounting Standards Update (“ASU”) No. 2018-13, Fair Value Measurement (Topic 820) Disclosure Framework—Changes to the Disclosure Requirements for Fair Value Measurement. ASU 2018-13 updates the disclosure requirements for fair value measurements by modifying or removing certain disclosures and adding certain new disclosures. The amendments are effective for fiscal years, and interim periods within those fiscal years, beginning after December 15, 2019. Early adoption is permitted. Management is currently evaluating the potential impact of this new guidance to the financial statements.
| | | | |
| 26 | | Wells Fargo Specialized Technology Fund | | Other information (unaudited) |
PROXY VOTING INFORMATION
A description of the policies and procedures that the Fund uses to determine how to vote proxies relating to portfolio securities is available, upon request, by calling 1-800-222-8222, visiting our website at wellsfargofunds.com, or visiting the SEC website at sec.gov. Information regarding how the Fund voted proxies relating to portfolio securities during the most recent 12-month period ended June 30 is available on the Fund’s website at wellsfargofunds.com or by visiting the SEC website at sec.gov.
PORTFOLIO HOLDINGS INFORMATION
The complete portfolio holdings for the Fund are publicly available monthly on the Fund’s website (wellsfargofunds.com), on a one-month delayed basis. In addition, top ten holdings information (excluding derivative positions) for the Fund is publicly available on the Fund’s website on a monthly, seven-day or more delayed basis. The Fund files its complete schedule of portfolio holdings with the SEC for the first and third quarters of each fiscal year on Form N-Q, which is available by visiting the SEC website at sec.gov. In addition, the Fund’s Form N-Q may be reviewed and copied at the SEC’s Public Reference Room in Washington, DC, and at regional offices in New York City, at 233 Broadway, and in Chicago, at 175 West Jackson Boulevard, Suite 900. Information about the Public Reference Room may be obtained by calling 1-800-SEC-0330.
| | | | | | |
| Other information (unaudited) | | Wells Fargo Specialized Technology Fund | | | 27 | |
BOARD OF TRUSTEES AND OFFICERS
Each of the Trustees and Officers1 listed in the table below acts in identical capacities for each fund in the Wells Fargo family of funds, which consists of 153 mutual funds comprising the Wells Fargo Funds Trust, Wells Fargo Variable Trust, Wells Fargo Master Trust and four closed-end funds (collectively the “Fund Complex”). This table should be read in conjunction with the Prospectus and the Statement of Additional Information2. The mailing address of each Trustee and Officer is 525 Market Street, 12th Floor, San Francisco, CA 94105. Each Trustee and Officer serves an indefinite term, however, each Trustee serves such term until reaching the mandatory retirement age established by the Trustees.
Independent Trustees
| | | | | | |
Name and year of birth | | Position held and length of service* | | Principal occupations during past five years or longer | | Current other public company or investment company directorships |
William R. Ebsworth (Born 1957) | | Trustee, since 2015 | | Retired. From 1984 to 2013, equities analyst, portfolio manager, research director and chief investment officer at Fidelity Management and Research Company in Boston, Tokyo, and Hong Kong, and retired in 2013 as Chief Investment Officer of Fidelity Strategic Advisers, Inc. where he led a team of investment professionals managing client assets. Prior thereto, Board member of Hong Kong Securities Clearing Co., Hong Kong Options Clearing Corp., the Thailand International Fund, Ltd., Fidelity Investments Life Insurance Company, and Empire Fidelity Investments Life Insurance Company. Board member of the Vincent Memorial Hospital Endowment (non-profit organization), where he serves on the Investment Committee and as a Chair of the Audit Committee. Mr. Ebsworth is a CFA® charterholder. | | N/A |
Jane A. Freeman (Born 1953) | | Trustee, since 2015; Chair Liaison, since 2018 | | Retired. From 2012 to 2014 and 1999 to 2008, Chief Financial Officer of Scientific Learning Corporation. From 2008 to 2012, Ms. Freeman provided consulting services related to strategic business projects. Prior to 1999, Portfolio Manager at Rockefeller & Co. and Scudder, Stevens & Clark. Board member of the Harding Loevner Funds from 1996 to 2014, serving as both Lead Independent Director and chair of the Audit Committee. Board member of the Russell Exchange Traded Funds Trust from 2011 to 2012 and the chair of the Audit Committee. Ms. Freeman is a Board Member of The Ruth Bancroft Garden (non-profit organization). She is also an inactive Chartered Financial Analyst. | | N/A |
Isaiah Harris, Jr. (Born 1952) | | Trustee, since 2009 | | Retired. Chairman of the Board of CIGNA Corporation since 2009, and Director since 2005. From 2003 to 2011, Director of Deluxe Corporation. Prior thereto, President and CEO of BellSouth Advertising and Publishing Corp. from 2005 to 2007, President and CEO of BellSouth Enterprises from 2004 to 2005 and President of BellSouth Consumer Services from 2000 to 2003. Emeritus member of the Iowa State University Foundation Board of Governors. Emeritus Member of the Advisory Board of Iowa State University School of Business. Advisory Board Member, Palm Harbor Academy (private school). Advisory Board Member, Child Evangelism Fellowship (non-profit). Mr. Harris is a certified public accountant (inactive status). | | CIGNA Corporation |
Judith M. Johnson (Born 1949) | | Trustee, since 2008; Audit Committee Chairman, since 2009 | | Retired. Prior thereto, Chief Executive Officer and Chief Investment Officer of Minneapolis Employees Retirement Fund from 1996 to 2008. Ms. Johnson is an attorney, certified public accountant and a certified managerial accountant. | | N/A |
| | | | |
| 28 | | Wells Fargo Specialized Technology Fund | | Other information (unaudited) |
| | | | | | |
Name and year of birth | | Position held and length of service* | | Principal occupations during past five years or longer | | Current other public company or investment company directorships |
David F. Larcker (Born 1950) | | Trustee, since 2009 | | James Irvin Miller Professor of Accounting at the Graduate School of Business, Stanford University, Director of the Corporate Governance Research Initiative and Senior Faculty of The Rock Center for Corporate Governance since 2006. From 2005 to 2008, Professor of Accounting at the Graduate School of Business, Stanford University. Prior thereto, Ernst & Young Professor of Accounting at The Wharton School, University of Pennsylvania from 1985 to 2005. | | N/A |
Olivia S. Mitchell (Born 1953) | | Trustee, since 2006; Governance Committee Chairman, since 2018 | | International Foundation of Employee Benefit Plans Professor, Wharton School of the University of Pennsylvania since 1993. Director of Wharton’s Pension Research Council and Boettner Center on Pensions & Retirement Research, and Research Associate at the National Bureau of Economic Research. Previously, Cornell University Professor from 1978 to 1993. | | N/A |
Timothy J. Penny (Born 1951) | | Trustee, since 1996; Chairman, since 2018; Vice Chairman, from 2017 to 2018 | | President and Chief Executive Officer of Southern Minnesota Initiative Foundation, a non-profit organization, since 2007. Member of the Board of Trustees of NorthStar Education Finance, Inc., a non-profit organization, since 2007. | | N/A |
James G. Polisson (Born 1959) | | Trustee, since 2018; Advisory Board Member, from 2017 to 2018 | | Retired. Chief Marketing Officer, Source (ETF) UK Services, Ltd, from 2015 to 2017. From 2012 to 2015, Principal of The Polisson Group, LLC, a management consulting, corporate advisory and principal investing company. Chief Executive Officer and Managing Director at Russell Investments, Global Exchange Traded Funds from 2010 to 2012. Managing Director of Barclays Global Investors from 1998 to 2010 and Global Chief Marketing Officer for iShares and Barclays Global Investors from 2000 to 2010. Trustee of the San Francisco Mechanics’ Institute, a non-profit organization, from 2013 to 2015. Board member of the Russell Exchange Traded Fund Trust from 2011 to 2012. Director of Barclays Global Investors Holdings Deutschland GmbH from 2006 to 2009. Mr. Polisson is an attorney and has a retired status with the Massachusetts and District of Columbia Bar Associations. | | N/A |
Michael S. Scofield (Born 1943) | | Trustee, since 2010 | | Served on the Investment Company Institute’s Board of Governors and Executive Committee from 2008-2011 as well the Governing Council of the Independent Directors Council from 2006-2011 and the Independent Directors Council Executive Committee from 2008-2011. Trustee of the Evergreen Fund complex (and its predecessors) from 1984 to 2010. Chairman of the Evergreen Funds from 2000-2010. Former Trustee of the Mentor Funds. Retired Attorney, Law Offices of Michael S. Scofield. | | N/A |
Pamela Wheelock (Born 1959) | | Trustee, since 2018; Advisory Board Member, from 2017 to 2018 | | Chief Operating Officer, Twin Cities Habitat for Humanity, since January, 2017. Vice President of University Services, University of Minnesota from 2012 to 2017. Prior thereto, on the Board of Directors, Governance Committee and Finance Committee for the Minnesota Philanthropy Partners (Saint Paul Foundation) from 2012 to 2018, Interim President and Chief Executive Officer of Blue Cross Blue Shield of Minnesota from 2010 to 2011, Chairman of the Board from 2009 to 2011 and Board Director from 2003 to 2015. Vice President, Leadership and Community Engagement, Bush Foundation, Saint Paul, Minnesota (a private foundation) from 2009 to 2011. Executive Vice President and Chief Financial Officer, Minnesota Sports and Entertainment from 2004 to 2009 and Senior Vice President from 2002 to 2004. Commissioner of Finance, State of Minnesota, from 1999 to 2002. Currently the Board Chair of the Minnesota Wild Foundation since 2010. | | N/A |
| * | Length of service dates reflect the Trustee’s commencement of service with the Trust’s predecessor entities, where applicable. |
| | | | | | |
| Other information (unaudited) | | Wells Fargo Specialized Technology Fund | | | 29 | |
Officers
| | | | | | |
Name and year of birth | | Position held and length of service | | Principal occupations during past five years or longer | | |
Andrew Owen (Born 1960) | | President, since 2017 | | Executive Vice President of Wells Fargo & Company and Head of Affiliated Managers, Wells Fargo Asset Management, since 2014. In addition, Mr. Owen is currently President, Chief Executive Officer and Director of Wells Fargo Funds Management, LLC since 2017. Prior thereto, Executive Vice President responsible for marketing, investments and product development for Wells Fargo Funds Management, LLC, from 2009 to 2014. | | |
Nancy Wiser1 (Born 1967) | | Treasurer, since 2012 | | Executive Vice President of Wells Fargo Funds Management, LLC since 2011. Chief Operating Officer and Chief Compliance Officer at LightBox Capital Management LLC, from 2008 to 2011. | | |
Alexander Kymn3 (Born 1973) | | Secretary, since 2018; Chief Legal Officer, since 2018 | | Senior Company Counsel of Wells Fargo Bank, N.A. since 2018 (previously Senior Counsel from 2007 to 2018). Vice President of Wells Fargo Funds Management, LLC from 2008 to 2014. | | |
Michael H. Whitaker (Born 1967) | | Chief Compliance Officer, since 2016 | | Senior Vice President and Chief Compliance Officer since 2016. Senior Vice President and Chief Compliance Officer for Fidelity Investments from 2007 to 2016. | | |
David Berardi (Born 1975) | | Assistant Treasurer, since 2009 | | Vice President of Wells Fargo Funds Management, LLC since 2009. Vice President of Evergreen Investment Management Company, LLC from 2008 to 2010. Manager of Fund Reporting and Control for Evergreen Investment Management Company, LLC from 2004 to 2010. | | |
Jeremy DePalma1 (Born 1974) | | Assistant Treasurer, since 2009 | | Senior Vice President of Wells Fargo Funds Management, LLC since 2009. Senior Vice President of Evergreen Investment Management Company, LLC from 2008 to 2010 and head of the Fund Reporting and Control Team within Fund Administration from 2005 to 2010. | | |
| 1 | Nancy Wiser acts as Treasurer of 76 funds in the Fund Complex. Jeremy DePalma acts as Treasurer of 77 funds and Assistant Treasurer of 76 funds in the Fund Complex. |
| 2 | The Statement of Additional Information includes additional information about the Trustees and is available, without charge, upon request, by calling 1-800-222-8222 or by visiting the website at wellsfargofunds.com. |
| 3 | Alexander Kymn became the Secretary and Chief Legal Officer effective April 17, 2018. |
| | | | |
| 30 | | Wells Fargo Specialized Technology Fund | | Other information (unaudited) |
BOARD CONSIDERATION OF INVESTMENT MANAGEMENT AND SUB-ADVISORY AGREEMENTS:
Wells Fargo Specialized Technology Fund
Under the Investment Company Act of 1940 (the “1940 Act”), the Board of Trustees (the “Board”) of Wells Fargo Funds Trust (the “Trust”) must determine annually whether to approve the continuation of the Trust’s investment management and sub-advisory agreements. In this regard, at an in-person meeting held on May 22-23, 2018 (the “Meeting”), the Board, all the members of which have no direct or indirect interest in the investment management and sub-advisory agreements and are not “interested persons” of the Trust, as defined in the 1940 Act (the “Independent Trustees”), reviewed and approved for Wells Fargo Specialized Technology Fund (the “Fund”): (i) an investment management agreement (the “Management Agreement”) with Wells Fargo Funds Management, LLC (“Funds Management”); and (ii) an investment sub-advisory agreement (the “Sub-Advisory Agreement”) with Allianz Global Investors U.S. LLC (the “Sub-Adviser”). The Management Agreement and the Sub-Advisory Agreement are collectively referred to as the “Advisory Agreements.”
At the Meeting, the Board considered the factors and reached the conclusions described below relating to the selection of Funds Management and the Sub-Adviser and the approval of the Advisory Agreements. Prior to the Meeting, including at an in-person meeting in April 2018, the Trustees conferred extensively among themselves and with representatives of Funds Management about these matters. Also, the Board has adopted a team-based approach, with each team consisting of a sub-set of Trustees, to assist the full Board in the discharge of its duties in reviewing investment performance and other matters throughout the year. The Independent Trustees were assisted in their evaluation of the Advisory Agreements by independent legal counsel, from whom they received separate legal advice and with whom they met separately.
In providing information to the Board, Funds Management and the Sub-Adviser were guided by a detailed set of requests for information submitted to them by independent legal counsel on behalf of the Independent Trustees at the start of the Board’s annual contract renewal process earlier in 2018. In considering and approving the Advisory Agreements, the Trustees considered the information they believed relevant, including but not limited to the information discussed below. The Board considered not only the specific information presented in connection with the Meeting, but also the knowledge gained over time through interaction with Funds Management and the Sub-Adviser about various topics. In this regard, the Board reviewed reports of Funds Management at each of its quarterly meetings, which included, among other things, portfolio reviews and investment performance reports. In addition, the Board and the teams mentioned above confer with portfolio managers at various times throughout the year. The Board did not identify any particular information or consideration that was all-important or controlling, and each individual Trustee may have attributed different weights to various factors.
After its deliberations, the Board unanimously approved the continuation of the Advisory Agreements for a one-year term and determined that the compensation payable to Funds Management and the Sub-Adviser under each of the Advisory Agreements was reasonable. The Board considered the approval of the Advisory Agreements for the Fund as part of its consideration of agreements for funds across the complex, but its approvals were made on a fund-by-fund basis. The following summarizes a number of important, but not necessarily all, factors considered by the Board in support of its approvals.
Nature, extent and quality of services
The Board received and considered various information regarding the nature, extent and quality of services provided to the Fund by Funds Management and the Sub-Adviser under the Advisory Agreements. This information included a description of the investment advisory services and Fund-level administrative services covered by the Management Agreement, as well as, among other things, a summary of the background and experience of senior management of Wells Fargo Asset Management (“WFAM”), of which Funds Management is a part, a summary of investments made in the business of WFAM, a summary of certain organizational and personnel changes involving Funds Management, and a description of Funds Management’s and the Sub-Adviser’s business continuity planning programs and of their approaches to data privacy and cybersecurity. The Board also considered the qualifications, background, tenure and responsibilities of each of the portfolio managers primarily responsible for the day-to-day portfolio management of the Fund.
The Board evaluated the ability of Funds Management and the Sub-Adviser to attract and retain qualified investment professionals, including research, advisory and supervisory personnel. The Board further considered the compliance programs and compliance records of Funds Management and the Sub-Adviser. In addition, the Board took into account the full range of services provided to the Fund by Funds Management and its affiliates.
| | | | | | |
| Other information (unaudited) | | Wells Fargo Specialized Technology Fund | | | 31 | |
Fund investment performance and expenses
The Board considered the investment performance results for the Fund over various time periods ended December 31, 2017. The Board considered these results in comparison to the investment performance of funds in a universe that was determined by Broadridge Inc. (“Broadridge”) to be similar to the Fund (the “Universe”), and in comparison to the Fund’s benchmark index and to other comparative data. Broadridge is an independent provider of investment company data. The Board received a description of the methodology used by Broadridge to select the mutual funds in the performance Universe. The Board noted that the investment performance of the Fund (Class A) was higher than the average performance of the Universe for all periods under review. The Board also noted that the investment performance of the Fund was higher than its benchmark index, the S&P North American Technology TR Index, for the one-year period under review, but lower than its benchmark index for the three-, five- and ten-year periods under review. The Board noted the Fund’s outperformance relative to its peer group and its recent outperformance relative to its benchmark index.
The Board also received and considered information regarding the Fund’s net operating expense ratios and their various components, including actual management fees, custodian and other non-management fees, and Rule 12b-1 and non-Rule 12b-1 shareholder service fees. The Board considered these ratios in comparison to the median ratios of funds in class-specific expense groups that were determined by Broadridge to be similar to the Fund (the “Groups”). The Board received a description of the methodology used by Broadridge to select the mutual funds in the expense Groups and an explanation of how funds comprising expense groups and their expense ratios may vary from year-to-year. Based on the Broadridge reports, the Board noted that the net operating expense ratios of the Fund were in range of the median net operating expense ratios of the expense Groups for each share class.
The Board took into account the Fund’s investment performance and expense information provided to it among the factors considered in deciding to re-approve the Advisory Agreements.
Investment management and sub-advisory fee rates
The Board reviewed and considered the contractual fee rates payable by the Fund to Funds Management under the Management Agreement, as well as the contractual fee rates payable by the Fund to Funds Management for class-level administrative services under a Class-Level Administration Agreement, which include, among other things, class-level transfer agency and sub-transfer agency costs (collectively, the “Management Rates”). The Board also reviewed and considered the contractual investment sub-advisory fee rates that are payable by Funds Management to the Sub-Adviser for investment sub-advisory services.
Among other information reviewed by the Board was a comparison of the Fund’s Management Rates with the average contractual investment management fee rates of funds in the expense Groups at a common asset level as well as transfer agency costs of the other funds in the expense Groups. The Board noted that the Management Rates of the Fund were equal to or in range of the sum of these average rates for the Fund’s expense Groups for all share classes except for Class A. The Board noted that the net operating expense ratios of Class A were in range of the median net operating expense ratios of Class A’s expense Group. The Board also noted that Funds Management provided the Board with additional information about the Fund’s Class A shares in response to a request by the Board, and the Board noted that Funds Management advised the Board that Funds Management would continue to monitor the net operating expenses ratio of the Fund’s Class A shares.
The Board also received and considered information about the portion of the total management fee that was retained by Funds Management after payment of the fee to the Sub-Adviser for sub-advisory services. The Board considered this amount in comparison to the median amount retained by advisers to funds in a sub-advised expense universe that was determined by Broadridge to be similar to the Fund. In assessing the reasonableness of this amount, the Board received and evaluated information about the nature and extent of responsibilities retained and risks assumed by Funds Management and not delegated to or assumed by the Sub-Adviser, and about Funds Management’s on-going oversight services. The Board also considered that the sub-advisory fees paid to the Sub-Adviser had been negotiated by Funds Management on an arm’s length basis.
The Board also received and considered information about the nature and extent of services offered and fee rates charged by Funds Management and the Sub-Adviser to other types of clients with investment strategies similar to those of the Fund. In this regard, the Board received information about the significantly greater scope of services, and compliance, reporting and other legal burdens and risks of managing mutual funds compared with those associated with managing assets of non-mutual fund clients such as collective funds or institutional separate accounts.
Based on its consideration of the factors and information it deemed relevant, including those described here, the Board determined that the compensation payable to Funds Management under the Management Agreement and to the Sub-Adviser under the Sub-Advisory Agreement was reasonable.
| | | | |
| 32 | | Wells Fargo Specialized Technology Fund | | Other information (unaudited) |
Profitability
The Board received and considered information concerning the profitability of Funds Management, as well as the profitability of both WFAM and Wells Fargo & Co. (“Wells Fargo”) as a whole, from providing services to the Fund and the fund family as a whole. Funds Management reported on the methodologies and estimates used in calculating profitability, including a description of the methodology used to allocate certain expenses and recent enhancements made to the methodology. Among other things, the Board noted that the levels of profitability reported on a fund-by-fund basis varied widely, depending on factors such as the size and type of fund. The Board did not consider profitability with respect to the Sub-Adviser, as the sub-advisory fees paid to the Sub-Adviser had been negotiated by Funds Management on an arm’s-length basis.
Based on its review, the Board did not deem the profits reported by Funds Management, WFAM or Wells Fargo from services provided to the Fund to be at a level that would prevent it from approving the continuation of the Advisory Agreements.
Economies of scale
The Board considered the extent to which Funds Management may experience economies of scale in the provision of management services, and the extent to which scale benefits, if any, would be shared with shareholders. In particular, the Board noted the existence of breakpoints in the Fund’s management fee structure, which operate generally to reduce the Fund’s expense ratios as the Fund grows in size. It considered that, for a small fund or a fund that shrinks in size, breakpoints conversely can result in higher fee levels. The Board also considered that in addition to management fee breakpoints, competitive management fee rates set at the outset without regard to breakpoints and fee waiver and expense reimbursement arrangements, as well as investments in the business intended to enhance services available to Fund shareholders, are means of sharing potential economies of scale with shareholders of the Fund.
The Board concluded that the Fund’s fee and expense arrangements, including contractual breakpoints, constituted a reasonable approach to sharing potential economies of scale with the Fund and its shareholders.
Other benefits to Funds Management and the Sub-Adviser
The Board received and considered information regarding potential “fall-out” or ancillary benefits received by Funds Management, the Sub-Adviser, and their affiliates as a result of their relationships with the Fund. Ancillary benefits could include, among others, benefits directly attributable to other relationships with the Fund and benefits potentially derived from an increase in Funds Management’s and the Sub-Adviser’s business as a result of their relationships with the Fund. The Board noted that various affiliates of Funds Management may receive distribution-related fees, shareholder servicing payments and sub-transfer agency fees in respect of shares sold or held through them and services provided.
The Board also reviewed information about soft dollar credits earned and utilized by the Sub-Adviser, fees earned by Funds Management and its affiliate from managing a private investment vehicle for the fund family’s securities lending collateral and commissions earned by an affiliated broker from portfolio transactions.
Based on its consideration of the factors and information it deemed relevant, including those described here, the Board did not find that any ancillary benefits received by Funds Management, the Sub-Adviser, and their affiliates were unreasonable.
Conclusion
At the Meeting, after considering the above-described factors and based on its deliberations and its evaluation of the information described above, the Board unanimously approved the continuation of the Advisory Agreements for a one-year term and determined that the compensation payable to Funds Management and the Sub-Adviser under each of the Advisory Agreements was reasonable.
| | | | | | |
| Appendix A (unaudited) | | Wells Fargo Specialized Technology Fund | | | 33 | |
SALES CHARGE REDUCTIONS AND WAIVERS FOR CERTAIN INTERMEDIARIES
Ameriprise
Effective June 1, 2018, shareholders purchasing Fund shares through an Ameriprise Financial platform or account will be eligible only for the following Class A load waivers (front-end sales charge waivers), which may differ from those disclosed elsewhere in the Fund’s prospectus or Statement of Additional Information.
Front-end Sales Load Waivers on Class A Shares Available at Ameriprise Financial
| | • | | Employer-sponsored retirement plans (e.g., 401(k) plans, 457 plans, employer-sponsored 403(b) plans, profit sharing and money purchase pension plans and defined benefit plans). For purposes of this provision, employer-sponsored retirement plans do not include SEP IRAs, Simple IRAs or SAR-SEPs. |
| | • | | Shares purchased through an Ameriprise Financial investment advisory program (if an Advisory or similar share class for such investment advisory program is not available) |
| | • | | Shares purchased by third party investment advisors on behalf of their advisory clients through Ameriprise Financial’s platform (if an Advisory or similar share class for such investment advisory program is not available) |
| | • | | Shares purchased through reinvestment of distributions and dividend reinvestment when purchasing shares of the same Fund (but not any other fund within the same fund family) |
| | • | | Shares exchanged from Class C shares of the same fund in the month of or following the 10-year anniversary of the purchase date. To the extent that the Fund’s prospectus elsewhere provides for a waiver with respect to such shares following a shorter holding period, that waiver will apply to exchanges following such shorter period. To the extent that the Fund’s prospectus elsewhere provides for a waiver with respect to exchanges of Class C shares for load-waived shares, that waiver will also apply to such exchanges. |
| | • | | Employees and registered representatives of Ameriprise Financial or its affiliates and their immediate family members |
| | • | | Shares purchased by or through qualified accounts (including IRAs, Coverdell Education Savings Accounts, 401(k)s, 403(b) TSCAs subject to ERISA and defined benefit plans) that are held by a covered family member, defined as an Ameriprise financial advisor and/or the advisor’s spouse, advisor’s lineal ascendant (mother, father, grandmother, grandfather, great grandmother, great grandfather), advisor’s lineal descendant (son, step-son, daughter, step-daughter, grandson, granddaughter, great grandson, great granddaughter) or any spouse of a covered family member who is a lineal descendant |
| | • | | Shares purchased from the proceeds of redemptions within the same fund family, provided (1) the repurchase occurs within 90 days following the redemption, (2) the redemption and purchase occur in the same account, and (3) redeemed shares were subject to a front-end or deferred sales load (i.e. Rights of Reinstatement). Subject to the Fund’s policy regarding frequent purchases and redemptions of Fund shares, you may not be able to repurchase shares for the first 30 days after your redemption. |
Automatic Exchange of Class C Shares Available at Ameriprise Financial
| | • | | Class C shares will automatically exchange to Class A shares in the month of the 10-year anniversary of the purchase date. |
Merrill Lynch
Effective April 10, 2017, shareholders purchasing Fund shares through a Merrill Lynch platform or account will be eligible only for the following load waivers (front-end sales charge waivers and contingent deferred, or back-end, sales charge waivers) and discounts, which may differ from those disclosed elsewhere in the Fund’s prospectus or Statement of Additional Information.
Front-end Sales Load Waivers on Class A Shares available at Merrill Lynch
| | • | | Employer-sponsored retirement, deferred compensation and employee benefit plans (including health savings accounts) and trusts used to fund those plans, provided that the shares are not held in a commission-based brokerage account and shares are held for the benefit of the plan |
| | • | | Shares purchased by or through a 529 Plan |
| | • | | Shares purchased through a Merrill Lynch affiliated investment advisory program |
| | | | |
| 34 | | Wells Fargo Specialized Technology Fund | | Appendix A (unaudited) |
| | • | | Shares purchased by third party investment advisors on behalf of their advisory clients through Merrill Lynch’s platform |
| | • | | Shares of funds purchased through the Merrill Edge Self-Directed platform (if applicable) |
| | • | | Shares purchased through reinvestment of capital gains distributions and dividend reinvestment when purchasing shares of the same fund (but not any other fund within the fund family) |
| | • | | Shares exchanged from Class C (i.e. level-load) shares of the same fund in the month of or following the 10-year anniversary of the purchase date |
| | • | | Employees and registered representatives of Merrill Lynch or its affiliates and their family members, as defined by Merrill Lynch, which may differ from the definition of family member in the Fund’s prospectus. |
| | • | | Directors or Trustees of the Fund, and employees of the Fund’s investment adviser or any of its affiliates, as described in the Fund’s prospectus |
| | • | | Shares purchased from the proceeds of redemptions within the same fund family, provided (1) the repurchase occurs within 90 days following the redemption, (2) the redemption and purchase occur in the same account, and (3) redeemed shares were subject to a front-end or deferred sales load (known as Rights of Reinstatement). Subject to the Fund’s policy regarding frequent purchases and redemptions of Fund shares, you may not be able to repurchase shares for the first 30 days after your redemption. |
CDSC Waivers on A, B and C Shares available at Merrill Lynch
| | • | | Death or disability of the shareholder |
| | • | | Shares sold as part of a systematic withdrawal plan as described in the Fund’s prospectus |
| | • | | Return of excess contributions from an IRA Account |
| | • | | Shares sold as part of a required minimum distribution for IRA and retirement accounts due to the shareholder reaching age 701⁄2 |
| | • | | Shares sold to pay Merrill Lynch fees but only if the transaction is initiated by Merrill Lynch |
| | • | | Shares acquired through a right of reinstatement |
| | • | | Shares held in retirement brokerage accounts, that are exchanged for a lower cost share class due to transfer to certain fee based accounts or platforms (applicable to A and C shares only) |
Front-end load Discounts Available at Merrill Lynch: Breakpoints, Rights of Accumulation & Letters of Intent
| | • | | Breakpoints as described in the Fund’s prospectus |
| | • | | Rights of Accumulation (ROA) which entitle shareholders to breakpoint discounts will be automatically calculated based on the aggregated holding of fund family assets held by accounts within the purchaser’s household at Merrill Lynch. Eligible fund family assets not held at Merrill Lynch may be included in the ROA calculation only if the shareholder notifies his or her financial advisor about such assets. |
| | • | | Letters of Intent (LOI) which allow for breakpoint discounts based on anticipated purchases within a fund family, through Merrill Lynch, over a 13-month period of time (if applicable) |
Morgan Stanley
Effective on or about July 1, 2018, shareholders purchasing Fund shares through a Morgan Stanley Wealth Management transactional brokerage account will be eligible only for the following Class A load waivers (front-end sales charge waivers), which may differ from and be more limited than those disclosed in the Fund’s prospectus or Statement of Additional Information.
Front-end Sales Load Waivers on Class A Shares Available at Morgan Stanley
| | • | | Employer-sponsored retirement plans (e.g., 401(k) plans, 457 plans, employer-sponsored 403(b) plans, profit sharing and money purchase pension plans and defined benefit plans). For purposes of this provision, employer-sponsored retirement plans do not include SEP IRAs, Simple IRAs, SAR-SEPs or Keogh plans. |
| | • | | Morgan Stanley employee and employee-related accounts according to Morgan Stanley’s account linking rules |
| | • | | Shares purchased through reinvestment of dividends and capital gains distributions when purchasing shares of the same fund |
| | • | | Shares purchased through a Morgan Stanley self-directed brokerage account |
| | | | | | |
| Appendix A (unaudited) | | Wells Fargo Specialized Technology Fund | | | 35 | |
| | • | | Class C (i.e., level-load) shares that are no longer subject to a contingent deferred sales charge and are exchanged to Class A shares of the same fund pursuant to Morgan Stanley Wealth Management’s share class exchange program. |
| | • | | Shares purchased from the proceeds of redemptions within the same fund family, provided (i) the repurchase occurs within 90 days following the redemption, (ii) the redemption and purchase occur in the same account, and (iii) redeemed shares were subject to a front-end or deferred sales charge. This waiver is subject to the Fund’s policy regarding frequent purchases and redemption of Fund shares, as discussed under “Account Information—Frequent Purchases and Redemptions of Fund Shares” in the Fund’s prospectus. |
Raymond James & Associates, Inc., Raymond James Financial Services & Raymond James affiliates (“Raymond James”)
Effective on or about March 1, 2019, shareholders purchasing Fund shares through a Raymond James platform or account will be eligible only for the following load waivers (front-end sales charge waivers and contingent deferred, or back-end, sales charge waivers) and discounts, which may differ from those disclosed elsewhere in the Fund’s Prospectus or SAI.
Front-end Sales Load Waivers on Class A shares Available at Raymond James
| | • | | Shares purchased in an investment advisory program. |
| | • | | Shares purchased through reinvestment of capital gains distributions and dividend reinvestment when purchasing shares of the same fund (but not any other fund within the fund family). |
| | • | | Employees and registered representatives of Raymond James or its affiliates and their family members as designated by Raymond James. |
| | • | | Shares purchased from the proceeds of redemptions within the same fund family, provided (1) the repurchase occurs within 90 days following the redemption, (2) the redemption and purchase occur in the same account, and (3) redeemed shares were subject to a front-end or deferred sales load (known as Rights of Reinstatement). |
| | • | | A shareholder in the fund’s Class C shares will have their shares automatically exchanged at net asset value to Class A shares (or the appropriate share class) of the fund if the shares are no longer subject to a CDSC and the exchange is in line with the policies and procedures of Raymond James. |
CDSC Waivers on Class A and C Shares Available at Raymond James
| | • | | Death or disability of the shareholder. |
| | • | | Shares sold as part of a systematic withdrawal plan as described in the Fund’s Prospectus. |
| | • | | Return of excess contributions from an IRA Account. |
| | • | | Shares sold as part of a required minimum distribution for IRA and retirement accounts due to the shareholder reaching age 70½ as described in the Fund’s prospectus. |
| | • | | Shares sold to pay Raymond James fees but only if the transaction is initiated by Raymond James. |
| | • | | Shares acquired through a right of reinstatement. |
Front-end Load Discounts Available at Raymond James: Breakpoints, and/or Rights of Accumulation
| | • | | Breakpoints as described in the Fund’s Prospectus. |
| | • | | Rights of accumulation which entitle shareholders to breakpoint discounts will be automatically calculated based on the aggregated holding of fund family assets held by accounts within the purchaser’s household at Raymond James. Eligible fund family assets not held at Raymond James may be included in the rights of accumulation calculation only if the shareholder notifies his or her financial advisor about such assets. |
This page is intentionally left blank.

For more information
More information about Wells Fargo Funds is available free upon request. To obtain literature, please write, visit the Fund’s website, or call:
Wells Fargo Funds
P.O. Box 219967
Kansas City, MO 64121-9967
Website: wellsfargofunds.com
Individual investors: 1-800-222-8222
Retail investment professionals: 1-888-877-9275
Institutional investment professionals: 1-866-765-0778
This report and the financial statements contained herein are submitted for the general information of the shareholders of the Fund. If this report is used for promotional purposes, distribution of the report must be accompanied or preceded by a current prospectus. Before investing, please consider the investment objectives, risks, charges, and expenses of the investment. For a current prospectus and, if available, a summary prospectus, containing this information, call 1-800-222-8222 or visit the Fund’s website at wellsfargofunds.com. Read the prospectus carefully before you invest or send money.
Wells Fargo Asset Management (WFAM) is the trade name for certain investment advisory/management firms owned by Wells Fargo & Company. These firms include but are not limited to Wells Capital Management Incorporated and Wells Fargo Funds Management, LLC. Certain products managed by WFAM entities are distributed by Wells Fargo Funds Distributor, LLC (a broker/dealer and Member FINRA).
This material is for general informational and educational purposes only and is NOT intended to provide investment advice or a recommendation of any kind—including a recommendation for any specific investment, strategy, or plan.
NOT FDIC INSURED ◾ NO BANK GUARANTEE ◾ MAY LOSE VALUE
© 2018 Wells Fargo Funds Management, LLC. All rights reserved.
| | |
 | | 317303 11-18 SA317/SAR317 09-18 |
Semi-Annual Report
September 30, 2018

Wells Fargo Utility and Telecommunications Fund


Reduce clutter. Save trees.
Sign up for electronic delivery of prospectuses and shareholder reports at wellsfargo.com/advantagedelivery
Contents
The views expressed and any forward-looking statements are as of September 30, 2018, unless otherwise noted, and are those of the Fund managers and/or Wells Fargo Funds Management, LLC. Discussions of individual securities, or the markets generally, or any Wells Fargo Fund are not intended as individual recommendations. Future events or results may vary significantly from those expressed in any forward-looking statements. The views expressed are subject to change at any time in response to changing circumstances in the market. Wells Fargo Funds Management, LLC and the Fund disclaim any obligation to publicly update or revise any views expressed or forward-looking statements.
NOT FDIC INSURED ◾ NO BANK GUARANTEE ◾ MAY LOSE VALUE
| | | | |
| 2 | | Wells Fargo Utility and Telecommunications Fund | | Letter to shareholders (unaudited) |

Andrew Owen
President
Wells Fargo Funds
The second and third quarters of 2018 were characterized by growing economic and investment activity in the U.S.
Dear Shareholder:
We are pleased to offer you this semi-annual report for the Wells Fargo Utility and Telecommunications Fund for the six-month period that ended September 30, 2018. The second and third quarters of 2018 were characterized by growing economic and investment activity in the U.S. In contrast, economies overseas were restrained as geopolitical tensions and rising interest rates diverted investor interest in those markets.
For the period, U.S. stocks, as measured by the S&P 500 Index,1 gained 11.41% and international stocks, as measured by the MSCI ACWI ex USA Index (Net),2 lost 1.93%. Based on the MSCI EM Index (Net),3 emerging market stocks lost 8.97%. For bond investors, the Bloomberg Barclays U.S. Aggregate Bond Index4 lost 0.14% while the Bloomberg Barclays Global Aggregate ex-USD Index5 fell 6.42%. The Bloomberg Barclays Municipal Bond Index6 added 0.72%, and the ICE BofAML U.S. High Yield Index7 was up 3.46%.
Global trade tensions escalated during the second quarter.
During the second quarter of 2018, the U.S. government imposed tariffs, and foreign governments in North America, Europe, and Asia retaliated. The actions marked the initialization of trade tensions that would escalate during the next six months. The increasing tensions chilled investment activity as observers awaited signals of next steps.
Meanwhile, inflation continued an upward trend. The CPI-U8 added 0.1% in June after an increase of 0.2% in both April and May. On a year-over-year basis, the all-items index rose 2.9% for the 12 months that ended June 30, 2018. The index for all items less food and energy rose 2.3% for the same 12-month period.
| 1 | The S&P 500 Index consists of 500 stocks chosen for market size, liquidity, and industry group representation. It is a market-value-weighted index with each stock’s weight in the index proportionate to its market value. You cannot invest directly in an index. |
| 2 | The Morgan Stanley Capital International (MSCI) All Country World Index (ACWI) ex USA Index (Net) is a free-float-adjusted market-capitalization-weighted index that is designed to measure the equity market performance of developed markets, excluding the United States and Canada. Source: MSCI. MSCI makes no express or implied warranties or representations and shall have no liability whatsoever with respect to any MSCI data contained herein. The MSCI data may not be further redistributed or used as a basis for other indices or any securities or financial products. This report is not approved, reviewed, or produced by MSCI. You cannot invest directly in an index. |
| 3 | The MSCI Emerging Markets (EM) Index (Net) is a free-float-adjusted market-capitalization-weighted index that is designed to measure large- and mid-cap equity market performance of emerging markets. The MSCI EM Index (Net) consists of the following 24 emerging market country indices: Brazil, Chile, China, Colombia, Czech Republic, Egypt, Greece, Hungary, India, Indonesia, Korea, Malaysia, Mexico, Pakistan, Peru, the Philippines, Poland, Qatar, Russia, South Africa, Taiwan, Thailand, Turkey, and the United Arab Emirates. You cannot invest directly in an index. |
| 4 | The Bloomberg Barclays U.S. Aggregate Bond Index is a broad-based benchmark that measures the investment-grade, U.S. dollar-denominated, fixed-rate taxable bond market, including Treasuries, government-related and corporate securities, mortgage-backed securities (agency fixed-rate and hybrid adjustable-rate mortgage pass-throughs), asset-backed securities, and commercial mortgage-backed securities. You cannot invest directly in an index. |
| 5 | The Bloomberg Barclays Global Aggregate ex-USD Index is an unmanaged index that provides a broad-based measure of the global investment-grade fixed-income markets excluding the U.S. dollar-denominated debt market. You cannot invest directly in an index. |
| 6 | The Bloomberg Barclays Municipal Bond Index is an unmanaged index composed of long-term tax-exempt bonds with a minimum credit rating of Baa. You cannot invest directly in an index. |
| 7 | The ICE BofAML U.S. High Yield Index is a market-capitalization-weighted index of domestic and Yankee high-yield bonds. The index tracks the performance of high-yield securities traded in the U.S. bond market. You cannot invest directly in an index. Copyright 2018. ICE Data Indices, LLC. All rights reserved. |
| 8 | The Consumer Price Index for All Urban Consumers (CPI-U) measures the changes in the price of a basket of goods and services purchased by urban consumers. The urban consumer population is deemed by many as a better representative measure of the general public because close to 90% of the country’s population lives in highly populated areas. You cannot invest directly in an index. |
| | | | | | |
| Letter to shareholders (unaudited) | | Wells Fargo Utility and Telecommunications Fund | | | 3 | |
U.S. stocks gained while international stocks and bonds declined during the summer of 2018.
The U.S. economy strengthened during the summer months. Revised second-quarter gross domestic product data released in August showed the U.S. economy growing at a 4.2% rate. After ticking up slightly in June, the unemployment rate in the U.S. was 3.9% in July and August, according to the U.S. Department of Labor. Wages showed more consistent growth, and consumer confidence remained strong.
Several U.S. equity market indices reached records during August, with the S&P 500 Index gaining 7.76% for the three-month period that ended August 31, 2018. International stock values continued to suffer under the effects of a strong U.S. dollar and continuing trade tensions. The MSCI ACWI ex USA Index (Net) and the MSCI EM Index (Net) were down 4.70% and 1.64%, during the same three-month period.
The U.S. Federal Reserve (Fed) increased the federal funds rate in June, and expectations grew that two more rate increases were in the offing in 2018. Long-term interest rates in the U.S. remained at higher levels relative to the prior 10 years. Rates on 10-year and 30-year Treasury bonds—2.74% and 2.97%, respectively, on March 31, 2018—were 3.05% and 3.19%, respectively, on September 30, off their peak levels on May 17, 2018, of 3.11% and 3.25%, respectively. Some investors became more aware of and concerned about the potential for an inverted yield curve—sometimes a recession signal—as short-term rates increased more quickly than long-term rates. The Fed decided to forgo an interest rate increase at its August meeting.
Internationally, members of Prime Minister Theresa May’s U.K./Brexit negotiating team resigned amid unproductive negotiations. In early August, the Bank of England’s Monetary Policy Committee increased its key interest rate to 0.75%. Central banks in Europe and Japan maintained low interest rates and accommodative monetary policies. Amid rising trade uncertainty, the People’s Bank of China cut reserve requirement ratios and accelerated infrastructure spending and tax cuts for business enterprises and individuals. Nevertheless, a strengthening U.S. dollar and the trade tensions remained headwinds for investors overseas.
Don’t let short-term uncertainty derail long-term investment goals.
Periods of investment uncertainty can present challenges, but experience has taught us that maintaining long-term investment goals can be an effective way to plan for the future. To help you create a sound strategy based on your personal goals and risk tolerance, Wells Fargo Funds offers more than 100 mutual funds spanning a wide range of asset classes and investment styles. Although diversification cannot guarantee an investment profit or prevent losses, we believe it can be an effective way to manage investment risk and potentially smooth out overall portfolio performance. We encourage investors to know their investments and to understand that appropriate levels of risk-taking may unlock opportunities.
The U.S. economy strengthened during the summer months.
| | | | |
| 4 | | Wells Fargo Utility and Telecommunications Fund | | Letter to shareholders (unaudited) |
Thank you for choosing to invest with Wells Fargo Funds. We appreciate your confidence in us and remain committed to helping you meet your financial needs.
Sincerely,

Andrew Owen
President
Wells Fargo Funds
Notice to shareholders
At a meeting held on August 14-15, 2018, the Board of Trustees of the Fund approved the following policy which will be effective on or about February 5, 2019:
Class C shares will convert automatically into Class A shares ten years after the initial date of purchase or, if you acquired your Class C shares through an exchange or conversion from another share class, ten years after the date you acquired your Class C shares. When Class C shares that you acquired through a purchase or exchange convert, any other Class C shares that you purchased with reinvested dividends and distributions also will convert into Class A shares on a pro rata basis. A shorter holding period may also apply depending on your intermediary. Please see “Appendix A—Sales Charge Reductions and Waivers for Certain Intermediaries” in the Fund’s prospectus or at the end of this report.
For further information about your Fund, contact your investment professional, visit our website at wellsfargofunds.com, or call us directly at 1-800-222-8222.
This page is intentionally left blank.
| | | | |
| 6 | | Wells Fargo Utility and Telecommunications Fund | | Performance highlights (unaudited) |
Investment objective
The Fund seeks long-term capital appreciation.
Manager
Wells Fargo Funds Management, LLC
Subadviser
Crow Point Partners, LLC
Portfolio manager
Timothy P. O’Brien, CFA®
Average annual total returns (%) as of September 30, 20181
| | | | | | | | | | | | | | | | | | | | | | | | | | | | | | | | | | |
| | | | | Including sales charge | | | Excluding sales charge | | | Expense ratios2 (%) | |
| | | Inception date | | 1 year | | | 5 year | | | 10 year | | | 1 year | | | 5 year | | | 10 year | | | Gross | | | Net3 | |
| Class A (EVUAX) | | 1-4-1994 | | | (0.56 | ) | | | 7.11 | | | | 7.89 | | | | 5.51 | | | | 8.38 | | | | 8.53 | | | | 1.17 | | | | 1.14 | |
| Class C (EVUCX) | | 9-2-1994 | | | 3.69 | | | | 7.57 | | | | 7.71 | | | | 4.69 | | | | 7.57 | | | | 7.71 | | | | 1.92 | | | | 1.89 | |
| Administrator Class (EVUDX) | | 7-30-2010 | | | – | | | | – | | | | – | | | | 5.66 | | | | 8.59 | | | | 8.71 | | | | 1.09 | | | | 0.95 | |
| Institutional Class (EVUYX) | | 2-28-1994 | | | – | | | | – | | | | – | | | | 5.84 | | | | 8.74 | | | | 8.87 | | | | 0.84 | | | | 0.78 | |
| S&P 500 Utilities Index4 | | – | | | – | | | | – | | | | – | | | | 2.93 | | | | 11.06 | | | | 9.04 | | | | – | | | | – | |
| S&P 500 Index5 | | – | | | – | | | | – | | | | – | | | | 17.91 | | | | 13.95 | | | | 11.97 | | | | – | | | | – | |
Figures quoted represent past performance, which is no guarantee of future results, and do not reflect taxes that a shareholder may pay on fund distributions or the redemption of fund shares. Investment return and principal value of an investment will fluctuate so that an investor’s shares, when redeemed, may be worth more or less than their original cost. Performance shown without sales charges would be lower if sales charges were reflected. Current performance may be lower or higher than the performance data quoted, which assumes the reinvestment of dividends and capital gains. Current month-end performance is available on the Fund’s website, wellsfargofunds.com.
While the S&P 500 Index is comprised of U.S. equity securities of companies diversified across ten sectors, the Fund’s holdings are concentrated primarily in utilities and telecommunication services stocks. Therefore, the performance of the S&P 500 Index is displayed only to show how the concentrated Fund performed compared with a diversified selection of U.S. equity securities.
Index returns do not include transaction costs associated with buying and selling securities, any mutual fund fees or expenses, or any taxes. It is not possible to invest directly in an index.
For Class A shares, the maximum front-end sales charge is 5.75%. For Class C shares, the maximum contingent deferred sales charge is 1.00%. Performance including a contingent deferred sales charge assumes the sales charge for the corresponding time period. Administrator Class and Institutional Class shares are sold without a front-end sales charge or contingent deferred sales charge.
Stock values fluctuate in response to the activities of individual companies and general market and economic conditions. Bond values fluctuate in response to the financial condition of individual issuers, general market and economic conditions, and changes in interest rates. Changes in market conditions and government policies may lead to periods of heightened volatility in the bondmarket and reduced liquidity for certain bonds held by the Fund. In general, when interest rates rise, bond values fall and investors may lose principal value. Interest rate changes and their impact on the Fund and its share price can be sudden and unpredictable. The use of derivatives may reduce returns and/or increase volatility. Funds that concentrate their investments in limited sectors, such as utilities and telecommunication services, are more vulnerable to adverse market, economic, regulatory, political, or other developments affecting those sectors. Certain investment strategies tend to increase the total risk of an investment (relative to the broader market). The Fund is exposed to convertible securities risk, foreign investment risk, high-yield securities risk, smaller-company securities risk, non-diversification risk and subsidiary risk. Consult the Fund’s prospectus for additional information on these and other risks.
Please see footnotes on page 7.
| | | | | | |
| Performance highlights (unaudited) | | Wells Fargo Utility and Telecommunications Fund | | | 7 | |
| | | | |
| Ten largest holdings (%) as of September 30, 20186 | |
Visa Incorporated Class A | | | 10.81 | |
CMS Energy Corporation | | | 7.84 | |
NextEra Energy Incorporated | | | 7.83 | |
Eversource Energy | | | 6.97 | |
Alliant Energy Corporation | | | 6.68 | |
PNM Resources Incorporated | | | 6.31 | |
Sempra Energy | | | 6.07 | |
Shenandoah Telecommunications Company | | | 6.05 | |
Edison International | | | 5.87 | |
MasterCard Incorporated Class A | | | 5.64 | |
|
| Industry distribution as of September 30, 20187 |
|

|
| 1 | Historical performance shown for Administrator Class shares prior to their inception reflects the performance of Institutional Class shares and has been adjusted to reflect the higher expenses applicable to Administrator Class shares. Historical performance shown for all classes of the Fund prior to July 19, 2010, is based on the performance of the Fund’s predecessor, Evergreen Utility and Telecommunications Fund. |
| 2 | Reflects the expense ratios as stated in the most recent prospectuses. The expense ratios shown are subject to change and may differ from the annualized expense ratios shown in the financial highlights of this report. |
| 3 | The manager has contractually committed through July 31, 2019, to waive fees and/or reimburse expenses to the extent necessary to cap the Fund’s Total Annual Fund Operating Expenses After Fee Waivers at the amounts shown. After this time, the cap may be increased or the commitment to maintain the cap may be terminated only with the approval of the Board of Trustees. Brokerage commissions, stamp duty fees, interest, taxes, acquired fund fees and expenses (if any), and extraordinary expenses are excluded from the expense cap. Without this cap, the Fund’s returns would have been lower. The expense ratio paid by an investor is the net expense ratio (the total annual fund operating expenses after fee waivers) as stated in the prospectuses. |
| 4 | The S&P 500 Utilities Index is a market-value-weighted index that measures the performance of all stocks within the utilities sector of the S&P 500 Index. You cannot invest directly in an index. |
| 5 | The S&P 500 Index consists of 500 stocks chosen for market size, liquidity, and industry group representation. It is a market-value-weighted index with each stock’s weight in the index proportionate to its market value. You cannot invest directly in an index. |
| 6 | The ten largest holdings, excluding cash, cash equivalents and any money market funds, are calculated based on the value of the investments divided by total net assets of the Fund. Holdings are subject to change and may have changed since the date specified. |
| 7 | Amounts are calculated based on the total long-term investments of the Fund. These amounts are subject to change and may have changed since the date specified. |
| | | | |
| 8 | | Wells Fargo Utility and Telecommunications Fund | | Fund expenses (unaudited) |
As a shareholder of the Fund, you incur two types of costs: (1) transaction costs, including sales charges (loads) on purchase payments and contingent deferred sales charges (if any) on redemptions and (2) ongoing costs, including management fees, distribution (12b-1) and/or shareholder servicing fees, and other Fund expenses. This example is intended to help you understand your ongoing costs (in dollars) of investing in the Fund and to compare these costs with the ongoing costs of investing in other mutual funds.
The example is based on an investment of $1,000 invested at the beginning of the six-month period and held for the entire period from April 1, 2018 to September 30, 2018.
Actual expenses
The “Actual” line of the table below provides information about actual account values and actual expenses. You may use the information in this line, together with the amount you invested, to estimate the expenses that you paid over the period. Simply divide your account value by $1,000 (for example, an $8,600 account value divided by $1,000 = 8.6), then multiply the result by the number in the “Actual” line under the heading entitled “Expenses paid during period” for your applicable class of shares to estimate the expenses you paid on your account during this period.
Hypothetical example for comparison purposes
The “Hypothetical” line of the table below provides information about hypothetical account values and hypothetical expenses based on the Fund’s actual expense ratio and an assumed rate of return of 5% per year before expenses, which is not the Fund’s actual return. The hypothetical account values and expenses may not be used to estimate the actual ending account balance or expenses you paid for the period. You may use this information to compare the ongoing costs of investing in the Fund and other funds. To do so, compare this 5% hypothetical example with the 5% hypothetical examples that appear in the shareholder reports of the other funds.
Please note that the expenses shown in the table are meant to highlight your ongoing costs only and do not reflect any transactional costs, such as sales charges (loads) and contingent deferred sales charges. Therefore, the “Hypothetical” line of the table is useful in comparing ongoing costs only and will not help you determine the relative total costs of owning different funds. In addition, if these transactional costs were included, your costs would have been higher.
| | | | | | | | | | | | | | | | |
| | | Beginning
account value
4-1-2018 | | | Ending
account value
9-30-2018 | | | Expenses
paid during
the period¹ | | | Annualized net
expense ratio | |
Class A | | | | | | | | | | | | | | | | |
Actual | | $ | 1,000.00 | | | $ | 1,078.53 | | | $ | 5.94 | | | | 1.14 | % |
Hypothetical (5% return before expenses) | | $ | 1,000.00 | | | $ | 1,019.35 | | | $ | 5.77 | | | | 1.14 | % |
Class C | | | | | | | | | | | | | | | | |
Actual | | $ | 1,000.00 | | | $ | 1,074.26 | | | $ | 9.83 | | | | 1.89 | % |
Hypothetical (5% return before expenses) | | $ | 1,000.00 | | | $ | 1,015.59 | | | $ | 9.55 | | | | 1.89 | % |
Administrator Class | | | | | | | | | | | | | | | | |
Actual | | $ | 1,000.00 | | | $ | 1,079.47 | | | $ | 4.95 | | | | 0.95 | % |
Hypothetical (5% return before expenses) | | $ | 1,000.00 | | | $ | 1,020.31 | | | $ | 4.81 | | | | 0.95 | % |
Institutional Class | | | | | | | | | | | | | | | | |
Actual | | $ | 1,000.00 | | | $ | 1,080.52 | | | $ | 4.07 | | | | 0.78 | % |
Hypothetical (5% return before expenses) | | $ | 1,000.00 | | | $ | 1,021.16 | | | $ | 3.95 | | | | 0.78 | % |
| 1 | Expenses paid is equal to the annualized net expense ratio of each class multiplied by the average account value over the period, multiplied by the number of days in the most recent fiscal half-year divided by the number of days in the fiscal year (to reflect the one-half-year period). |
| | | | | | |
| Portfolio of investments—September 30, 2018 (unaudited) | | Wells Fargo Utility and Telecommunications Fund | | | 9 | |
| | | | | | | | | | | | | | | | |
| Security name | | | | | | | | Shares | | | Value | |
| | | |
Common Stocks: 97.42% | | | | | | | | | | | | | |
| | | | |
Communication Services: 15.65% | | | | | | | | | | | | | | | | |
| | | |
| Diversified Telecommunication Services: 5.35% | | | | | | | | | | | | | |
AT&T Incorporated | | | | | | | | | | | 200,000 | | | $ | 6,716,000 | |
Verizon Communications Incorporated | | | | | | | | | | | 250,000 | | | | 13,347,500 | |
| | | | |
| | | | | | | | | | | | | | | 20,063,500 | |
| | | | | | | | | | | | | | | | |
| | | |
| Media: 4.25% | | | | | | | | | | | | | |
Comcast Corporation Class A | | | | | | | | | | | 450,200 | | | | 15,941,582 | |
| | | | | | | | | | | | | | | | |
| | | |
| Wireless Telecommunication Services: 6.05% | | | | | | | | | | | | | |
Shenandoah Telecommunications Company | | | | | | | | | | | 585,000 | | | | 22,668,750 | |
| | | | | | | | | | | | | | | | |
| | | | |
Financials: 0.38% | | | | | | | | | | | | | | | | |
| | | |
| Diversified Financial Services: 0.38% | | | | | | | | | | | | | |
A-Mark Precious Metals Incorporated | | | | | | | | | | | 109,999 | | | | 1,432,187 | |
| | | | | | | | | | | | | | | | |
| | | | |
Industrials: 0.65% | | | | | | | | | | | | | | | | |
| | | |
| Machinery: 0.65% | | | | | | | | | | | | | |
Perma-Pipe International Holdings Incorporated † | | | | | | | | | | | 266,500 | | | | 2,425,150 | |
| | | | | | | | | | | | | | | | |
| | | | |
Information Technology: 16.46% | | | | | | | | | | | | | | | | |
| | | |
| IT Services: 16.46% | | | | | | | | | | | | | |
MasterCard Incorporated Class A | | | | | | | | | | | 95,000 | | | | 21,147,950 | |
Visa Incorporated Class A | | | | | | | | | | | 270,000 | | | | 40,524,300 | |
| | | | |
| | | | | | | | | | | | | | | 61,672,250 | |
| | | | | | | | | | | | | | | | |
| | | | |
Utilities: 64.28% | | | | | | | | | | | | | | | | |
| | | |
| Electric Utilities: 36.96% | | | | | | | | | | | | | |
Alliant Energy Corporation | | | | | | | | | | | 588,000 | | | | 25,031,160 | |
American Electric Power Company Incorporated | | | | | | | | | | | 175,000 | | | | 12,404,000 | |
Edison International | | | | | | | | | | | 325,000 | | | | 21,996,000 | |
Eversource Energy | | | | | | | | | | | 425,000 | | | | 26,112,000 | |
NextEra Energy Incorporated | | | | | | | | | | | 175,000 | | | | 29,330,000 | |
PNM Resources Incorporated | | | | | | | | | | | 600,000 | | | | 23,670,000 | |
| | | | |
| | | | | | | | | | | | | | | 138,543,160 | |
| | | | | | | | | | | | | | | | |
| | | |
| Gas Utilities: 0.02% | | | | | | | | | | | | | |
Spire Incorporated | | | | | | | | | | | 1,000 | | | | 73,550 | |
| | | | | | | | | | | | | | | | |
| | | |
| Multi-Utilities: 22.61% | | | | | | | | | | | | | |
CMS Energy Corporation | | | | | | | | | | | 600,000 | | | | 29,400,000 | |
Dominion Energy Incorporated | | | | | | | | | | | 269,000 | | | | 18,905,320 | |
Hera SpA | | | | | | | | | | | 1,000,000 | | | | 3,113,938 | |
Public Service Enterprise Group Incorporated | | | | | | | | | | | 200,000 | | | | 10,558,000 | |
Sempra Energy | | | | | | | | | | | 200,000 | | | | 22,750,000 | |
| | | | |
| | | | | | | | | | | | | | | 84,727,258 | |
| | | | | | | | | | | | | | | | |
The accompanying notes are an integral part of these financial statements.
| | | | |
| 10 | | Wells Fargo Utility and Telecommunications Fund | | Portfolio of investments—September 30, 2018 (unaudited) |
| | | | | | | | | | | | | | | | |
| Security name | | | | | | | | Shares | | | Value | |
| | | | |
| Water Utilities: 4.69% | | | | | | | | | | | | | | | | |
American Water Works Company Incorporated | | | | | | | | | | | 200,000 | | | $ | 17,594,000 | |
| | | | | | | | | | | | | | | | |
| | | | |
Total Common Stocks (Cost $151,623,490) | | | | | | | | | | | | | | | 365,141,387 | |
| | | | | | | | | | | | | | | | |
| | | | |
| | | Dividend yield | | | | | | | | | | |
| Preferred Stocks: 0.94% | | | | | | | | | | | | | | | | |
| | | | |
Utilities: 0.94% | | | | | | | | | | | | | | | | |
| | | | |
| Electric Utilities: 0.94% | | | | | | | | | | | | | | | | |
Spark Energy Incorporated | | | 4.63 | % | | | | | | | 150,000 | | | | 3,543,000 | |
| | | | | | | | | | | | | | | | |
| | | | |
Total Preferred Stocks (Cost $3,787,500) | | | | | | | | | | | | | | | 3,543,000 | |
| | | | | | | | | | | | | | | | |
| | | | |
| | | Yield | | | | | | | | | | |
| Short-Term Investments: 1.54% | | | | | | | | | | | | | | | | |
| | | | |
| Investment Companies: 1.54% | | | | | | | | | | | | | | | | |
Wells Fargo Government Money Market Fund Select Class (l)(u) | | | 1.99 | | | | | | | | 5,762,193 | | | | 5,762,193 | |
| | | | | | | | | | | | | | | | |
| | | | |
Total Short-Term Investments (Cost $5,762,193) | | | | | | | | | | | | | | | 5,762,193 | |
| | | | | | | | | | | | | | | | |
| | | | | | | | |
| Total investments in securities (Cost $161,173,183) | | | 99.90 | % | | | 374,446,580 | |
Other assets and liabilities, net | | | 0.10 | | | | 377,198 | |
| | | | | | | | |
| Total net assets | | | 100.00 | % | | $ | 374,823,778 | |
| | | | | | | | |
| † | Non-income-earning security |
| (l) | The issuer of the security is an affiliated person of the Fund as defined in the Investment Company Act of 1940. |
| (u) | The rate represents the 7-day annualized yield at period end. |
Investments in Affiliates
An affiliated investment is an investment in which the Fund owns at least 5% of the outstanding voting shares of the issuer or as a result of other relationships, such as the Fund and the issuer having the same investment manager. Transactions with issuers that were either affiliated persons of the Fund at the beginning of the period or the end of the period were as follows:
| | | | | | | | | | | | | | | | | | | | | | | | | | | | | | | | | | | | |
| | | Shares, beginning of period | | | Shares purchased | | | Shares sold | | | Shares, end of period | | | Net realized
gains
(losses) | | | Net change in
unrealized
gains (losses) | | | Income
from
affiliated
securities | | | Value, end of period | | | % of net
assets | |
Common Stocks | | | | | | | | | | | | | | | | | | | | | | | | | | | | | | | | | | | | |
Utilities | | | | | | | | | | | | | | | | | | | | | | | | | | | | | | | | | | | | |
Electric Utilities | | | | | | | | | | | | | | | | | | | | | | | | | | | | | | | | | | | | |
Spark Energy Incorporated Class A* | | | 729,006 | | | | 0 | | | | 729,006 | | | | 0 | | | $ | (158,537 | ) | | $ | (1,882,680 | ) | | $ | 132,132 | | | $ | 0 | | | | 0.00 | % |
| | | | | | | | | |
Short-Term Investments | | | | | | | | | | | | | | | | | | | | | | | | | | | | | | | | | | | | |
Investment Companies | | | | | | | | | | | | | | | | | | | | | | | | | | | | | | | | | | | | |
Securities Lending Cash Investment LLC** | | | 1,328,142 | | | | 2,655,088 | | | | 3,983,230 | | | | 0 | | | | 0 | | | | 0 | | | | 33,162 | | | | 0 | | | | | |
Wells Fargo Government Money Market Fund Select Class | | | 9,340,273 | | | | 37,799,072 | | | | 41,377,152 | | | | 5,762,193 | | | | 0 | | | | 0 | | | | 49,613 | | | | 5,762,193 | | | | | |
| | | | | | | | | |
| | | | | | | | | | | | | | | | | | | | | | | | | | | | | | | 5,762,193 | | | | 1.54 | |
| | | | | | | | | | | | | | | | | | | | | | | | | | | | | | | | | | | | |
| | | | | | | | | | | | | | | | | | $ | (158,537 | ) | | $ | (1,882,680 | ) | | $ | 214,907 | | | $ | 5,762,193 | | | | 1.54 | % |
| | | | | | | | | | | | | | | | | | | | | | | | | | | | | | | | | | | | |
| * | No longer an affiliate of the Fund at the end of the period. |
| ** | No longer held at the end of the period. |
The accompanying notes are an integral part of these financial statements.
| | | | | | |
| Statement of assets and liabilities—September 30, 2018 (unaudited) | | Wells Fargo Utility and Telecommunications Fund | | | 11 | |
| | | | |
| | | | |
| |
Assets | | | | |
Investments in unaffiliated securities, at value (cost $155,410,990) | | $ | 368,684,387 | |
Investments in affiliated securities, at value (cost $5,762,193) | | | 5,762,193 | |
Foreign currency, at value (cost $276,897) | | | 266,227 | |
Receivable for Fund shares sold | | | 111,172 | |
Receivable for dividends | | | 467,892 | |
Prepaid expenses and other assets | | | 33,100 | |
| | | | |
Total assets | | | 375,324,971 | |
| | | | |
| |
Liabilities | | | | |
Management fee payable | | | 185,302 | |
Payable for Fund shares redeemed | | | 99,911 | |
Shareholder servicing fees payable | | | 70,356 | |
Administration fees payable | | | 62,483 | |
Distribution fee payable | | | 25,033 | |
Trustees’ fees and expenses payable | | | 2,329 | |
Accrued expenses and other liabilities | | | 55,779 | |
| | | | |
Total liabilities | | | 501,193 | |
| | | | |
Total net assets | | $ | 374,823,778 | |
| | | | |
| |
NET ASSETS CONSIST OF | | | | |
Paid-in capital | | $ | 159,980,118 | |
Total distributable earnings | | | 214,843,660 | |
| | | | |
Total net assets | | $ | 374,823,778 | |
| | | | |
| |
COMPUTATION OF NET ASSET VALUE AND OFFERING PRICE PER SHARE | | | | |
Net assets – Class A | | $ | 295,718,957 | |
Shares outstanding – Class A1 | | | 13,498,961 | |
Net asset value per share – Class A | | | $21.91 | |
Maximum offering price per share – Class A2 | | | $23.25 | |
Net assets – Class C | | $ | 40,402,397 | |
Shares outstanding – Class C1 | | | 1,843,269 | |
Net asset value per share – Class C | | | $21.92 | |
Net assets – Administrator Class | | $ | 4,479,627 | |
Shares outstanding – Administrator Class1 | | | 204,265 | |
Net asset value per share – Administrator Class | | | $21.93 | |
Net assets – Institutional Class | | $ | 34,222,797 | |
Shares outstanding – Institutional Class1 | | | 1,562,958 | |
Net asset value per share – Institutional Class | | | $21.90 | |
| 1 | The Fund has an unlimited number of authorized shares. |
| 2 | Maximum offering price is computed as 100/94.25 of net asset value. On investments of $50,000 or more, the offering price is reduced. |
The accompanying notes are an integral part of these financial statements.
| | | | |
| 12 | | Wells Fargo Utility and Telecommunications Fund | | Statement of operations—six months ended September 30, 2018 (unaudited) |
| | | | |
| | | | |
| |
Investment income | | | | |
Dividends (net of foreign withholding taxes of $16,751) | | $ | 4,674,484 | |
Income from affiliated securities | | | 214,907 | |
| | | | |
Total investment income | | | 4,889,391 | |
| | | | |
| |
Expenses | | | | |
Management fee | | | 1,187,222 | |
Administration fees | | | | |
Class A | | | 302,336 | |
Class C | | | 42,477 | |
Administrator Class | | | 2,945 | |
Institutional Class | | | 21,044 | |
Shareholder servicing fees | | | | |
Class A | | | 359,923 | |
Class C | | | 50,568 | |
Administrator Class | | | 5,664 | |
Distribution fee | | | | |
Class C | | | 151,704 | |
Custody and accounting fees | | | 11,540 | |
Professional fees | | | 26,104 | |
Registration fees | | | 43,872 | |
Shareholder report expenses | | | 40,030 | |
Trustees’ fees and expenses | | | 11,367 | |
Other fees and expenses | | | 6,415 | |
| | | | |
Total expenses | | | 2,263,211 | |
Less: Fee waivers and/or expense reimbursements | | | (93,338 | ) |
| | | | |
Net expenses | | | 2,169,873 | |
| | | | |
Net investment income | | | 2,719,518 | |
| | | | |
| |
REALIZED AND UNREALIZED GAINS (LOSSES) ON INVESTMENTS | | | | |
| |
Net realized gains (losses) on investments on: | | | | |
Unaffiliated securities | | | 11,097,871 | |
Affiliated securities | | | (158,537 | ) |
| | | | |
Net realized gains on investments | | | 10,939,334 | |
| | | | |
| |
Net change in unrealized gains (losses) on: | | | | |
Unaffiliated securities | | | 15,770,386 | |
Affiliated securities | | | (1,882,680 | ) |
| | | | |
Net change in unrealized gains (losses) on investments | | | 13,887,706 | |
| | | | |
Net realized and unrealized gains (losses) on investments | | | 24,827,040 | |
| | | | |
Net increase in net assets resulting from operations | | $ | 27,546,558 | |
| | | | |
The accompanying notes are an integral part of these financial statements.
| | | | | | |
| Statement of changes in net assets | | Wells Fargo Utility and Telecommunications Fund | | | 13 | |
| | | | | | | | | | | | | | | | |
| | | | |
| | | Six months ended
September 30, 2018
(unaudited) | | | Year ended
March 31, 20181 | |
| | | | |
Operations | | | | | | | | | | | | | | | | |
Net investment income | | | | | | $ | 2,719,518 | | | | | | | $ | 5,986,877 | |
Net realized gains (losses) on investments | | | | | | | 10,939,334 | | | | | | | | (3,563,384 | ) |
Net change in unrealized gains (losses) on investments | | | | | | | 13,887,706 | | | | | | | | 13,369,403 | |
| | | | |
Net increase in net assets resulting from operations | | | | | | | 27,546,558 | | | | | | | | 15,792,896 | |
| | | | |
| | | | |
Distributions to shareholders | | | | | | | | | | | | | | | | |
Class A | | | | | | | (2,064,896 | ) | | | | | | | (5,216,624 | ) |
Class C | | | | | | | (128,319 | ) | | | | | | | (426,300 | ) |
Administrator Class | | | | | | | (36,772 | ) | | | | | | | (90,935 | ) |
Institutional Class | | | | | | | (293,431 | ) | | | | | | | (572,093 | ) |
| | | | |
Total distributions to shareholders | | | | | | | (2,523,418 | ) | | | | | | | (6,305,952 | ) |
| | | | |
| | | | |
Capital share transactions | | | Shares | | | | | | | | Shares | | | | | |
Proceeds from shares sold | | | | | | | | | | | | | | | | |
Class A | | | 145,874 | | | | 3,047,336 | | | | 519,687 | | | | 10,873,178 | |
Class C | | | 29,191 | | | | 618,995 | | | | 32,953 | | | | 695,831 | |
Administrator Class | | | 16,770 | | | | 353,390 | | | | 69,039 | | | | 1,434,536 | |
Institutional Class | | | 250,784 | | | | 5,262,977 | | | | 667,149 | | | | 13,862,735 | |
| | | | |
| | | | | | | 9,282,698 | | | | | | | | 26,866,280 | |
| | | | |
Reinvestment of distributions | | | | | | | | | | | | | | | | |
Class A | | | 91,309 | | | | 1,938,192 | | | | 231,217 | | | | 4,823,724 | |
Class C | | | 5,841 | | | | 123,516 | | | | 19,292 | | | | 401,388 | |
Administrator Class | | | 1,714 | | | | 36,409 | | | | 4,175 | | | | 87,094 | |
Institutional Class | | | 13,529 | | | | 287,406 | | | | 25,626 | | | | 532,962 | |
| | | | |
| | | | | | | 2,385,523 | | | | | | | | 5,845,168 | |
| | | | |
Payment for shares redeemed | | | | | | | | | | | | | | | | |
Class A | | | (766,680 | ) | | | (16,054,839 | ) | | | (2,125,163 | ) | | | (44,280,111 | ) |
Class B | | | N/A | | | | N/A | | | | (34,601 | )2 | | | (704,872 | )2 |
Class C | | | (230,386 | ) | | | (4,815,524 | ) | | | (568,843 | ) | | | (11,910,983 | ) |
Administrator Class | | | (43,788 | ) | | | (920,736 | ) | | | (101,645 | ) | | | (2,105,048 | ) |
Institutional Class | | | (243,881 | ) | | | (5,103,328 | ) | | | (379,011 | ) | | | (7,884,279 | ) |
| | | | |
| | | | | | | (26,894,427 | ) | | | | | | | (66,885,293 | ) |
| | | | |
Net decrease in net assets resulting from capital share transactions | | | | | | | (15,226,206 | ) | | | | | | | (34,173,845 | ) |
| | | | |
Total increase (decrease) in net assets | | | | | | | 9,796,934 | | | | | | | | (24,686,901 | ) |
| | | | |
| | | | |
Net assets | | | | | | | | | | | | | | | | |
Beginning of period | | | | | | | 365,026,844 | | | | | | | | 389,713,745 | |
| | | | |
End of period | | | | | | $ | 374,823,778 | | | | | | | $ | 365,026,844 | |
| | | | |
| 1 | Effective for all filings after November 4, 2018, the SEC prospectively eliminated the requirements to parenthetically disclose undistributed net investment income at the end of the period and to disaggregate distributions to shareholders between distributions from net investment income and distributions from realized gains. Undistributed net investment income at March 31, 2018 was $451,894. The disaggregated distributions information for the year ended March 31, 2018 is included in Note 7, Distributions to Shareholders, in the notes to the financial statements. |
| 2 | For the period from April 1, 2017 to May 5, 2017. Effective at the close of business on May 5, 2017, Class B shares were converted to Class A shares and are no longer offered by the Fund. |
The accompanying notes are an integral part of these financial statements.
| | | | |
| 14 | | Wells Fargo Utility and Telecommunications Fund | | Financial highlights |
(For a share outstanding throughout each period)
| | | | | | | | | | | | | | | | | | | | | | | | |
| | | Six months ended
September 30, 2018 (unaudited) | | | Year ended March 31 | |
| CLASS A | | 2018 | | | 2017 | | | 2016 | | | 2015 | | | 2014 | |
Net asset value, beginning of period | | | $20.46 | | | | $20.01 | | | | $18.70 | | | | $18.23 | | | | $17.71 | | | | $15.85 | |
Net investment income | | | 0.16 | | | | 0.34 | | | | 0.35 | | | | 0.31 | | | | 0.29 | | | | 0.36 | |
Net realized and unrealized gains (losses) on investments | | | 1.44 | | | | 0.47 | | | | 1.30 | | | | 0.45 | | | | 0.57 | | | | 1.84 | |
| | | | | | | | | | | | | | | | | | | | | | | | |
Total from investment operations | | | 1.60 | | | | 0.81 | | | | 1.65 | | | | 0.76 | | | | 0.86 | | | | 2.20 | |
Distributions to shareholders from | | | | | | | | | | | | | | | | | | | | | | | | |
Net investment income | | | (0.15 | ) | | | (0.36 | ) | | | (0.34 | ) | | | (0.29 | ) | | | (0.34 | ) | | | (0.34 | ) |
Net asset value, end of period | | | $21.91 | | | | $20.46 | | | | $20.01 | | | | $18.70 | | | | $18.23 | | | | $17.71 | |
Total return1 | | | 7.85 | % | | | 4.00 | % | | | 8.87 | % | | | 4.30 | % | | | 4.82 | % | | | 14.12 | % |
Ratios to average net assets (annualized) | | | | | | | | | | | | | | | | | | | | | | | | |
Gross expenses | | | 1.19 | % | | | 1.17 | % | | | 1.18 | % | | | 1.20 | % | | | 1.22 | % | | | 1.22 | % |
Net expenses | | | 1.14 | % | | | 1.14 | % | | | 1.14 | % | | | 1.14 | % | | | 1.14 | % | | | 1.14 | % |
Net investment income | | | 1.54 | % | | | 1.60 | % | | | 1.79 | % | | | 1.73 | % | | | 1.57 | % | | | 2.21 | % |
Supplemental data | | | | | | | | | | | | | | | | | | | | | | | | |
Portfolio turnover rate | | | 8 | % | | | 7 | % | | | 22 | % | | | 15 | % | | | 29 | % | | | 20 | % |
Net assets, end of period (000s omitted) | | | $295,719 | | | | $287,047 | | | | $308,152 | | | | $315,238 | | | | $341,342 | | | | $350,029 | |
| 1 | Total return calculations do not include any sales charges. Returns for periods of less than one year are not annualized. |
The accompanying notes are an integral part of these financial statements.
| | | | | | |
| Financial highlights | | Wells Fargo Utility and Telecommunications Fund | | | 15 | |
(For a share outstanding throughout each period)
| | | | | | | | | | | | | | | | | | | | | | | | |
| | | Six months ended
September 30, 2018 (unaudited) | | | Year ended March 31 | |
| CLASS C | | 2018 | | | 2017 | | | 2016 | | | 2015 | | | 2014 | |
Net asset value, beginning of period | | | $20.47 | | | | $20.01 | | | | $18.70 | | | | $18.25 | | | | $17.73 | | | | $15.86 | |
Net investment income | | | 0.06 | | | | 0.13 | | | | 0.16 | | | | 0.17 | 1 | | | 0.15 | | | | 0.24 | 1 |
Net realized and unrealized gains (losses) on investments | | | 1.46 | | | | 0.52 | | | | 1.34 | | | | 0.45 | | | | 0.57 | | | | 1.85 | |
| | | | | | | | | | | | | | | | | | | | | | | | |
Total from investment operations | | | 1.52 | | | | 0.65 | | | | 1.50 | | | | 0.62 | | | | 0.72 | | | | 2.09 | |
Distributions to shareholders from | | | | | | | | | | | | | | | | | | | | | | | | |
Net investment income | | | (0.07 | ) | | | (0.19 | ) | | | (0.19 | ) | | | (0.17 | ) | | | (0.20 | ) | | | (0.22 | ) |
Net asset value, end of period | | | $21.92 | | | | $20.47 | | | | $20.01 | | | | $18.70 | | | | $18.25 | | | | $17.73 | |
Total return2 | | | 7.43 | % | | | 3.24 | % | | | 8.04 | % | | | 3.49 | % | | | 4.04 | % | | | 13.31 | % |
Ratios to average net assets (annualized) | | | | | | | | | | | | | | | | | | | | | | | | |
Gross expenses | | | 1.94 | % | | | 1.92 | % | | | 1.93 | % | | | 1.95 | % | | | 1.97 | % | | | 1.97 | % |
Net expenses | | | 1.89 | % | | | 1.89 | % | | | 1.89 | % | | | 1.89 | % | | | 1.89 | % | | | 1.89 | % |
Net investment income | | | 0.78 | % | | | 0.86 | % | | | 1.02 | % | | | 0.99 | % | | | 0.82 | % | | | 1.46 | % |
Supplemental data | | | | | | | | | | | | | | | | | | | | | | | | |
Portfolio turnover rate | | | 8 | % | | | 7 | % | | | 22 | % | | | 15 | % | | | 29 | % | | | 20 | % |
Net assets, end of period (000s omitted) | | | $40,402 | | | | $41,729 | | | | $51,123 | | | | $57,431 | | | | $63,632 | | | | $61,329 | |
| 1 | Calculated based upon average shares outstanding |
| 2 | Total return calculations do not include any sales charges. Returns for periods of less than one year are not annualized. |
The accompanying notes are an integral part of these financial statements.
| | | | |
| 16 | | Wells Fargo Utility and Telecommunications Fund | | Financial highlights |
(For a share outstanding throughout each period)
| | | | | | | | | | | | | | | | | | | | | | | | |
| | | Six months ended
September 30, 2018 (unaudited) | | | Year ended March 31 | |
| ADMINISTRATOR CLASS | | 2018 | | | 2017 | | | 2016 | | | 2015 | | | 2014 | |
Net asset value, beginning of period | | | $20.48 | | | | $20.03 | | | | $18.72 | | | | $18.25 | | | | $17.73 | | | | $15.86 | |
Net investment income | | | 0.18 | | | | 0.37 | | | | 0.38 | | | | 0.34 | | | | 0.33 | | | | 0.40 | |
Net realized and unrealized gains (losses) on investments | | | 1.44 | | | | 0.48 | | | | 1.30 | | | | 0.45 | | | | 0.56 | | | | 1.84 | |
| | | | | | | | | | | | | | | | | | | | | | | | |
Total from investment operations | | | 1.62 | | | | 0.85 | | | | 1.68 | | | | 0.79 | | | | 0.89 | | | | 2.24 | |
Distributions to shareholders from | | | | | | | | | | | | | | | | | | | | | | | | |
Net investment income | | | (0.17 | ) | | | (0.40 | ) | | | (0.37 | ) | | | (0.32 | ) | | | (0.37 | ) | | | (0.37 | ) |
Net asset value, end of period | | | $21.93 | | | | $20.48 | | | | $20.03 | | | | $18.72 | | | | $18.25 | | | | $17.73 | |
Total return1 | | | 7.95 | % | | | 4.21 | % | | | 9.04 | % | | | 4.49 | % | | | 5.01 | % | | | 14.41 | % |
Ratios to average net assets (annualized) | | | | | | | | | | | | | | | | | | | | | | | | |
Gross expenses | | | 1.11 | % | | | 1.09 | % | | | 1.10 | % | | | 1.09 | % | | | 1.06 | % | | | 1.04 | % |
Net expenses | | | 0.95 | % | | | 0.95 | % | | | 0.95 | % | | | 0.95 | % | | | 0.95 | % | | | 0.95 | % |
Net investment income | | | 1.73 | % | | | 1.80 | % | | | 1.93 | % | | | 1.93 | % | | | 1.79 | % | | | 2.38 | % |
Supplemental data | | | | | | | | | | | | | | | | | | | | | | | | |
Portfolio turnover rate | | | 8 | % | | | 7 | % | | | 22 | % | | | 15 | % | | | 29 | % | | | 20 | % |
Net assets, end of period (000s omitted) | | | $4,480 | | | | $4,702 | | | | $5,168 | | | | $6,740 | | | | $8,365 | | | | $9,383 | |
| 1 | Returns for periods of less than one year are not annualized. |
The accompanying notes are an integral part of these financial statements.
| | | | | | |
| Financial highlights | | Wells Fargo Utility and Telecommunications Fund | | | 17 | |
(For a share outstanding throughout each period)
| | | | | | | | | | | | | | | | | | | | | | | | |
| | | Six months ended
September 30, 2018 (unaudited) | | | Year ended March 31 | |
| INSTITUTIONAL CLASS | | 2018 | | | 2017 | | | 2016 | | | 2015 | | | 2014 | |
Net asset value, beginning of period | | | $20.45 | | | | $20.00 | | | | $18.69 | | | | $18.23 | | | | $17.74 | | | | $15.87 | |
Net investment income | | | 0.20 | | | | 0.42 | | | | 0.42 | | | | 0.36 | 1 | | | 0.35 | 1 | | | 0.42 | |
Net realized and unrealized gains (losses) on investments | | | 1.44 | | | | 0.46 | | | | 1.30 | | | | 0.45 | | | | 0.54 | | | | 1.85 | |
| | | | | | | | | | | | | | | | | | | | | | | | |
Total from investment operations | | | 1.64 | | | | 0.88 | | | | 1.72 | | | | 0.81 | | | | 0.89 | | | | 2.27 | |
Distributions to shareholders from | | | | | | | | | | | | | | | | | | | | | | | | |
Net investment income | | | (0.19 | ) | | | (0.43 | ) | | | (0.41 | ) | | | (0.35 | ) | | | (0.40 | ) | | | (0.40 | ) |
Net asset value, end of period | | | $21.90 | | | | $20.45 | | | | $20.00 | | | | $18.69 | | | | $18.23 | | | | $17.74 | |
Total return2 | | | 8.05 | % | | | 4.38 | % | | | 9.26 | % | | | 4.63 | % | | | 5.02 | % | | | 14.58 | % |
Ratios to average net assets (annualized) | | | | | | | | | | | | | | | | | | | | | | | | |
Gross expenses | | | 0.86 | % | | | 0.84 | % | | | 0.85 | % | | | 0.84 | % | | | 0.79 | % | | | 0.79 | % |
Net expenses | | | 0.78 | % | | | 0.78 | % | | | 0.78 | % | | | 0.78 | % | | | 0.78 | % | | | 0.78 | % |
Net investment income | | | 1.90 | % | | | 1.95 | % | | | 2.18 | % | | | 2.03 | % | | | 1.89 | % | | | 2.56 | % |
Supplemental data | | | | | | | | | | | | | | | | | | | | | | | | |
Portfolio turnover rate | | | 8 | % | | | 7 | % | | | 22 | % | | | 15 | % | | | 29 | % | | | 20 | % |
Net assets, end of period (000s omitted) | | | $34,223 | | | | $31,548 | | | | $24,575 | | | | $15,295 | | | | $14,156 | | | | $10,325 | |
| 1 | Calculated based upon average shares outstanding |
| 2 | Returns for periods of less than one year are not annualized. |
The accompanying notes are an integral part of these financial statements.
| | | | |
| 18 | | Wells Fargo Utility and Telecommunications Fund | | Notes to financial statements (unaudited) |
1. ORGANIZATION
Wells Fargo Funds Trust (the “Trust”), a Delaware statutory trust organized on March 10, 1999, is an open-end management investment company registered under the Investment Company Act of 1940, as amended (the “1940 Act”). As an investment company, the Trust follows the accounting and reporting guidance in Financial Accounting Standards Board (“FASB”) Accounting Standards Codification Topic 946, Financial Services – Investment Companies. These financial statements report on the Wells Fargo Wells Fargo Utility and Telecommunications Fund (the “Fund”) which is a non-diversified series of the Trust.
Effective at the close of business on May 5, 2017, Class B shares were converted to Class A shares and are no longer offered by the Fund. Information for Class B shares reflected in the financial statements represents activity through May 5, 2017.
2. SIGNIFICANT ACCOUNTING POLICIES
The following significant accounting policies, which are consistently followed in the preparation of the financial statements of the Fund, are in conformity with U.S. generally accepted accounting principles which require management to make estimates and assumptions that affect the reported amounts of assets and liabilities, disclosure of contingent assets and liabilities at the date of the financial statements, and the reported amounts of revenues and expenses during the reporting period. Actual results could differ from those estimates.
Securities valuation
All investments are valued each business day as of the close of regular trading on the New York Stock Exchange (generally 4 p.m. Eastern Time), although the Fund may deviate from this calculation time under unusual or unexpected circumstances.
Equity securities that are listed on a foreign or domestic exchange or market are valued at the official closing price or, if none, the last sales price. If no sale occurs on the principal exchange or market that day, a fair value price will be determined in accordance with the Fund’s Valuation Procedures.
The values of securities denominated in foreign currencies are translated into U.S. dollars at rates provided by an independent foreign currency pricing source at a time each business day specified by the Wells Fargo Asset Management Pricing Committee at Wells Fargo Funds Management, LLC (“Funds Management”).
Many securities markets and exchanges outside the U.S. close prior to the close of the New York Stock Exchange and therefore may not fully reflect trading or events that occur after the close of the principal exchange in which the foreign securities are traded, but before the close of the New York Stock Exchange. If such trading or events are expected to materially affect the value of such securities, then fair value pricing procedures approved by the Board of Trustees of the Fund are applied. These procedures take into account multiple factors including movements in U.S. securities markets after foreign exchanges close. Foreign securities that are fair valued under these procedures are categorized as Level 2 and the application of these procedures may result in transfers between Level 1 and Level 2. Depending on market activity, such fair valuations may be frequent. Such fair value pricing may result in net asset values that are higher or lower than net asset values based on the last reported sales price or latest quoted bid price. On September 30, 2018, such fair value pricing was not used in pricing foreign securities.
Investments in registered open-end investment companies are valued at net asset value. Interests in non-registered investment companies that are redeemable at net asset value are fair valued normally at net asset value.
Investments which are not valued using any of the methods discussed above are valued at their fair value, as determined in good faith by the Board of Trustees. The Board of Trustees has established a Valuation Committee comprised of the Trustees and has delegated to it the authority to take any actions regarding the valuation of portfolio securities that the Valuation Committee deems necessary or appropriate, including determining the fair value of portfolio securities, unless the determination has been delegated to the Wells Fargo Asset Management Pricing Committee. The Board of Trustees retains the authority to make or ratify any valuation decisions or approve any changes to the Valuation Procedures as it deems appropriate. On a quarterly basis, the Board of Trustees receives reports on any valuation actions taken by the Valuation Committee or the Wells Fargo Asset Management Pricing Committee which may include items for ratification.
Foreign currency translation
The accounting records of the Fund are maintained in U.S. dollars. The values of other assets and liabilities denominated in foreign currencies are translated into U.S. dollars at rates provided by an independent foreign currency pricing source at a time each business day specified by the Wells Fargo Asset Management Pricing Committee. Purchases and sales of
| | | | | | |
| Notes to financial statements (unaudited) | | Wells Fargo Utility and Telecommunications Fund | | | 19 | |
securities, and income and expenses are converted at the rate of exchange on the respective dates of such transactions. Net realized foreign exchange gains or losses arise from sales of foreign currencies, currency gains or losses realized between the trade and settlement dates on securities transactions, and the difference between the amounts of dividends, interest and foreign withholding taxes recorded and the U.S. dollar equivalent of the amounts actually paid or received. Net unrealized foreign exchange gains and losses arise from changes in the fair value of assets and liabilities other than investments in securities resulting from changes in exchange rates. The changes in net assets arising from changes in exchange rates of securities and the changes in net assets resulting from changes in market prices of securities are not separately presented. Such changes are included in net realized and unrealized gains or losses from investments.
Securities lending
The Fund may lend its securities from time to time in order to earn additional income in the form of fees or interest on securities received as collateral or the investment of any cash received as collateral. The Fund continues to receive interest or dividends on the securities loaned. The Fund receives collateral in the form of cash or securities with a value at least equal to the value of the securities on loan. The value of the loaned securities is determined at the close of each business day and any additional required collateral is delivered to the Fund on the next business day. In a securities lending transaction, the net asset value of the Fund will be affected by an increase or decrease in the value of the securities loaned and by an increase or decrease in the value of the instrument in which collateral is invested. The amount of securities lending activity undertaken by the Fund fluctuates from time to time. In the event of default or bankruptcy by the borrower, the Fund may be prevented from recovering the loaned securities or gaining access to the collateral or may experience delays or costs in doing so. In addition, the investment of any cash collateral received may lose all or part of its value. The Fund has the right under the lending agreement to recover the securities from the borrower on demand.
The Fund lends its securities through an unaffiliated securities lending agent. Cash collateral received in connection with its securities lending transactions is invested in Securities Lending Cash Investments, LLC (the “Securities Lending Fund”). The Securities Lending Fund is exempt from registration under Section 3(c)(7) of the 1940 Act and is managed by Funds Management and is subadvised by Wells Capital Management Incorporated (“WellsCap”), an affiliate of Funds Management and an indirect wholly owned subsidiary of Wells Fargo & Company (“Wells Fargo”). Funds Management receives an advisory fee starting at 0.05% and declining to 0.01% as the average daily net assets of the Securities Lending Fund increase. All of the fees received by Funds Management are paid to WellsCap for its services as subadviser. The Securities Lending Fund seeks to provide a positive return compared to the daily Fed Funds Open Rate by investing in high-quality, U.S. dollar-denominated short-term money market instruments. Securities Lending Fund investments are valued at the evaluated bid price provided by an independent pricing service. Income earned from investment in the Securities Lending Fund, if any, is included in income from affiliated securities on the Statement of Operations.
Security transactions and income recognition
Securities transactions are recorded on a trade date basis. Realized gains or losses are recorded on the basis of identified cost.
Dividend income is recognized on the ex-dividend date, except for certain dividends from foreign securities, which are recorded as soon as the custodian verifies the ex-dividend date. Dividend income from foreign securities is recorded net of foreign taxes withheld where recovery of such taxes is not assured.
Distributions to shareholders
Distributions to shareholders are recorded on the ex-dividend date and paid from net investment income quarterly and any net realized gains are paid at least annually. Such distributions are determined in accordance with income tax regulations and may differ from U.S. generally accepted accounting principles. Dividend sources are estimated at the time of declaration. The tax character of distributions is determined as of the Fund’s fiscal year end. Therefore, a portion of the Fund’s distributions made prior to the Fund’s fiscal year end may be categorized as a tax return of capital at year end.
Federal and other taxes
The Fund intends to continue to qualify as a regulated investment company by distributing substantially all of its investment company taxable income and any net realized capital gains (after reduction for capital loss carryforwards) sufficient to relieve it from all, or substantially all, federal income taxes. Accordingly, no provision for federal income taxes was required.
The Fund’s income and federal excise tax returns and all financial records supporting those returns for the prior three fiscal years are subject to examination by the federal and Delaware revenue authorities. Management has analyzed the
| | | | |
| 20 | | Wells Fargo Utility and Telecommunications Fund | | Notes to financial statements (unaudited) |
Fund’s tax positions taken on federal, state, and foreign tax returns for all open tax years and does not believe that there are any uncertain tax positions that require recognition of a tax liability.
As of September 30, 2018, the aggregate cost of all investments for federal income tax purposes was $166,173,183 and the unrealized gains (losses) consisted of:
| | | | |
Gross unrealized gains | | $ | 213,611,564 | |
Gross unrealized losses | | | (5,338,167 | ) |
Net unrealized gains | | $ | 208,273,397 | |
As of March 31, 2018, the Fund had capital loss carryforwards which consisted of $4,983,682 in short-term capital losses.
Class allocations
The separate classes of shares offered by the Fund differ principally in applicable sales charges, distribution, shareholder servicing, and administration fees. Class specific expenses are charged directly to that share class. Investment income, common expenses, and realized and unrealized gains (losses) on investments are allocated daily to each class of shares based on the relative proportion of net assets of each class.
3. FAIR VALUATION MEASUREMENTS
Fair value measurements of investments are determined within a framework that has established a fair value hierarchy based upon the various data inputs utilized in determining the value of the Fund’s investments. The three-level hierarchy gives the highest priority to unadjusted quoted prices in active markets for identical assets or liabilities (Level 1) and the lowest priority to unobservable inputs (Level 3). The Fund’s investments are classified within the fair value hierarchy based on the lowest level of input that is significant to the fair value measurement. The inputs are summarized into three broad levels as follows:
| ∎ | | Level 1 – quoted prices in active markets for identical securities |
| ∎ | | Level 2 – other significant observable inputs (including quoted prices for similar securities, interest rates, prepayment speeds, credit risk, etc.) |
| ∎ | | Level 3 – significant unobservable inputs (including the Fund’s own assumptions in determining the fair value of investments) |
The inputs or methodologies used for valuing investments in securities are not necessarily an indication of the risk associated with investing in those securities.
The following is a summary of the inputs used in valuing the Fund’s assets and liabilities as of September 30, 2018:
| | | | | | | | | | | | | | | | |
| | | Quoted prices
(Level 1) | | | Other significant observable inputs
(Level 2) | | | Significant
unobservable inputs (Level 3) | | | Total | |
Assets | | | | | | | | | | | | | | | | |
Investments in: | | | | | | | | | | | | | | | | |
| | | | |
Common stocks | | | | | | | | | | | | | | | | |
Communication services | | $ | 58,673,832 | | | $ | 0 | | | $ | 0 | | | $ | 58,673,832 | |
Financials | | | 1,432,187 | | | | 0 | | | | 0 | | | | 1,432,187 | |
Industrials | | | 2,425,150 | | | | 0 | | | | 0 | | | | 2,425,150 | |
Information technology | | | 61,672,250 | | | | 0 | | | | 0 | | | | 61,672,250 | |
Utilities | | | 240,937,968 | | | | 0 | | | | 0 | | | | 240,937,968 | |
| | | | |
Preferred stocks | | | | | | | | | | | | | | | | |
Utilities | | | 3,543,000 | | | | 0 | | | | 0 | | | | 3,543,000 | |
| | | | |
Short-term investments | | | | | | | | | | | | | | | | |
Investment companies | | | 5,762,193 | | | | 0 | | | | 0 | | | | 5,762,193 | |
Total assets | | $ | 374,446,580 | | | $ | 0 | | | $ | 0 | | | $ | 374,446,580 | |
Additional sector, industry or geographic detail is included in the Portfolio of Investments.
At September 30, 2018, the Fund did not have any transfers into/out of Level 3.
| | | | | | |
| Notes to financial statements (unaudited) | | Wells Fargo Utility and Telecommunications Fund | | | 21 | |
4. TRANSACTIONS WITH AFFILIATES AND OTHER EXPENSES
Management fee
Funds Management, an indirect wholly owned subsidiary of Wells Fargo, is the manager of the Fund and provides advisory and fund-level administrative services under an investment management agreement. Under the investment management agreement, Funds Management is responsible for, among other services, implementing the investment objectives and strategies of the Fund, supervising the subadviser and providing fund-level administrative services in connection with the Fund’s operations. As compensation for its services under the investment management agreement, Funds Management is entitled to receive an annual management fee starting at 0.65% and declining to 0.48% as the average daily net assets of the Fund increase. For the six months ended September 30, 2018, the management fee was equivalent to an annual rate of 0.65% of the Fund’s average daily net assets.
Funds Management has retained the services of a subadviser to provide daily portfolio management to the Fund. The fee for subadvisory services is borne by Funds Management. Crow Point Partners, LLC, which is not an affiliate of Funds Management, is the subadviser to the Fund and is entitled to receive a fee from Funds Management at an annual rate starting at 0.20% and declining to 0.10% as the average daily net assets of the Fund increase.
Administration fees
Under a class-level administration agreement, Funds Management provides class-level administrative services to the Fund, which includes paying fees and expenses for services provided by the transfer agent, sub-transfer agents, omnibus account servicers and record-keepers. As compensation for its services under the class-level administration agreement, Funds Management receives an annual fee which is calculated based on the average daily net assets of each class as follows:
| | | | |
| | | Class-level
administration fee | |
Class A, Class C | | | 0.21 | % |
Administrator Class, Institutional Class | | | 0.13 | |
Funds Management has contractually waived and/or reimbursed management and administration fees to the extent necessary to maintain certain net operating expense ratios for the Fund. When each class of the Fund has exceeded its expense cap, Funds Management has waived fees and/or reimbursed expenses from fund level expenses on a proportionate basis and then from class specific expenses; otherwise, waivers and/or reimbursements are applied against class specific expenses before fund level expenses. Funds Management has committed through July 31, 2019 to waive fees and/or reimburse expenses to the extent necessary to cap the Fund’s expenses at 1.14% for Class A shares, 1.89% for Class C shares, 0.95% for Administrator Class shares, and 0.78% for Institutional Class shares. After this time, the cap may be increased or the commitment to maintain the cap may be terminated only with the approval of the Board of Trustees.
Distribution fee
The Trust has adopted a distribution plan for Class C shares of the Fund pursuant to Rule 12b-1 under the 1940 Act. A distribution fee is charged to Class C shares and paid to Wells Fargo Funds Distributor, LLC (“Funds Distributor”), the principal underwriter, at an annual rate of 0.75% of the average daily net assets of Class C shares.
In addition, Funds Distributor is entitled to receive the front-end sales charge from the purchase of Class A shares and a contingent deferred sales charge on the redemption of certain Class A shares. Funds Distributor is also entitled to receive the contingent deferred sales charges from redemptions of Class C shares. For the six months ended September 30, 2018, Funds Distributor received $4,321 from the sale of Class A. No contingent deferred sales charges were incurred by Class A and Class C shares for the six months ended September 30, 2018.
Shareholder servicing fees
The Trust has entered into contracts with one or more shareholder servicing agents, whereby Class A, Class C, and Administrator Class of the Fund are charged a fee at an annual rate of 0.25% of the average daily net assets of each respective class.
A portion of these total shareholder servicing fees were paid to affiliates of Wells Fargo.
Interfund transactions
The Fund may purchase or sell portfolio investment securities to certain other Wells Fargo affiliates pursuant to Rule 17a-7 under the 1940 Act and under procedures adopted by the Board of Trustees. The procedures have been designed to ensure that these interfund transactions, which do not incur broker commissions, are effected at current market prices.
| | | | |
| 22 | | Wells Fargo Utility and Telecommunications Fund | | Notes to financial statements (unaudited) |
5. INVESTMENT PORTFOLIO TRANSACTIONS
Purchases and sales of investments, excluding U.S. government obligations (if any) and short-term securities, for the six months ended September 30, 2018 were $28,287,984 and $36,006,129, respectively.
6. BANK BORROWINGS
The Trust (excluding the money market funds), Wells Fargo Master Trust and Wells Fargo Variable Trust are parties to a $280,000,000 revolving credit agreement whereby the Fund is permitted to use bank borrowings for temporary or emergency purposes, such as to fund shareholder redemption requests. Interest under the credit agreement is charged to the Fund based on a borrowing rate equal to the higher of the Federal Funds rate in effect on that day plus 1.25% or the overnight LIBOR rate in effect on that day plus 1.25%. In addition, an annual commitment fee equal to 0.25% of the unused balance is allocated to each participating fund.
For the six months ended September 30, 2018, there were no borrowings by the Fund under the agreement.
7. DISTRIBUTIONS TO SHAREHOLDERS
Beginning October 2018, the Securities and Exchange Commission eliminated the requirement to separately state the components of distributions to shareholders. The amounts of distributions to shareholders for the year ended March 31, 2018 were as follows:
| | | | |
| | | Net investment income | |
Class A | | | $5,216,624 | |
Class C | | | 426,300 | |
Administrator Class | | | 90,935 | |
Institutional Class | | | 572,093 | |
8. CONCENTRATION RISK
The Fund invests a substantial portion of its assets in utility and telecommunications companies and, therefore, may be more affected by changes in the utility and telecommunications sectors than would be a fund whose investments are not heavily weighted in any sector.
9. INDEMNIFICATION
Under the Trust’s organizational documents, the officers and Trustees have been granted certain indemnification rights against certain liabilities that may arise out of performance of their duties to the Trust. Additionally, in the normal course of business, the Trust may enter into contracts with service providers that contain a variety of indemnification clauses. The Trust’s maximum exposure under these arrangements is dependent on future claims that may be made against the Fund and, therefore, cannot be estimated.
10. NEW ACCOUNTING PRONOUNCEMENT
In August 2018, FASB issued Accounting Standards Update (“ASU”) No. 2018-13, Fair Value Measurement (Topic 820) Disclosure Framework—Changes to the Disclosure Requirements for Fair Value Measurement. ASU 2018-13 updates the disclosure requirements for fair value measurements by modifying or removing certain disclosures and adding certain new disclosures. The amendments are effective for fiscal years, and interim periods within those fiscal years, beginning after December 15, 2019. Early adoption is permitted. Management has early adopted the removal and modification disclosures, as permitted, and will adopt the additional new disclosures at the effective date.
| | | | | | |
| Other information (unaudited) | | Wells Fargo Utility and Telecommunications Fund | | | 23 | |
PROXY VOTING INFORMATION
A description of the policies and procedures that the Fund uses to determine how to vote proxies relating to portfolio securities is available, upon request, by calling 1-800-222-8222, visiting our website at wellsfargofunds.com, or visiting the SEC website at sec.gov. Information regarding how the Fund voted proxies relating to portfolio securities during the most recent 12-month period ended June 30 is available on the Fund’s website at wellsfargofunds.com or by visiting the SEC website at sec.gov.
PORTFOLIO HOLDINGS INFORMATION
The complete portfolio holdings for the Fund are publicly available monthly on the Fund’s website (wellsfargofunds.com), on a one-month delayed basis. In addition, top ten holdings information (excluding derivative positions) for the Fund is publicly available on the Fund’s website on a monthly, seven-day or more delayed basis. The Fund files its complete schedule of portfolio holdings with the SEC for the first and third quarters of each fiscal year on Form N-Q, which is available by visiting the SEC website at sec.gov. In addition, the Fund’s Form N-Q may be reviewed and copied at the SEC’s Public Reference Room in Washington, DC, and at regional offices in New York City, at 233 Broadway, and in Chicago, at 175 West Jackson Boulevard, Suite 900. Information about the Public Reference Room may be obtained by calling 1-800-SEC-0330.
| | | | |
| 24 | | Wells Fargo Utility and Telecommunications Fund | | Other information (unaudited) |
BOARD OF TRUSTEES AND OFFICERS
Each of the Trustees and Officers1 listed in the table below acts in identical capacities for each fund in the Wells Fargo family of funds, which consists of 153 mutual funds comprising the Wells Fargo Funds Trust, Wells Fargo Variable Trust, Wells Fargo Master Trust and four closed-end funds (collectively the “Fund Complex”). This table should be read in conjunction with the Prospectus and the Statement of Additional Information2. The mailing address of each Trustee and Officer is 525 Market Street, 12th Floor, San Francisco, CA 94105. Each Trustee and Officer serves an indefinite term, however, each Trustee serves such term until reaching the mandatory retirement age established by the Trustees.
Independent Trustees
| | | | | | |
Name and year of birth | | Position held and
length of service* | | Principal occupations during past five years or longer | | Current other
public company or
investment company
directorships |
William R. Ebsworth (Born 1957) | | Trustee, since 2015 | | Retired. From 1984 to 2013, equities analyst, portfolio manager, research director and chief investment officer at Fidelity Management and Research Company in Boston, Tokyo, and Hong Kong, and retired in 2013 as Chief Investment Officer of Fidelity Strategic Advisers, Inc. where he led a team of investment professionals managing client assets. Prior thereto, Board member of Hong Kong Securities Clearing Co., Hong Kong Options Clearing Corp., the Thailand International Fund, Ltd., Fidelity Investments Life Insurance Company, and Empire Fidelity Investments Life Insurance Company. Board member of the Vincent Memorial Hospital Endowment (non-profit organization), where he serves on the Investment Committee and as a Chair of the Audit Committee. Mr. Ebsworth is a CFA® charterholder. | | N/A |
Jane A. Freeman (Born 1953) | | Trustee, since 2015; Chair Liaison, since 2018 | | Retired. From 2012 to 2014 and 1999 to 2008, Chief Financial Officer of Scientific Learning Corporation. From 2008 to 2012, Ms. Freeman provided consulting services related to strategic business projects. Prior to 1999, Portfolio Manager at Rockefeller & Co. and Scudder, Stevens & Clark. Board member of the Harding Loevner Funds from 1996 to 2014, serving as both Lead Independent Director and chair of the Audit Committee. Board member of the Russell Exchange Traded Funds Trust from 2011 to 2012 and the chair of the Audit Committee. Ms. Freeman is a Board Member of The Ruth Bancroft Garden (non-profit organization). She is also an inactive Chartered Financial Analyst. | | N/A |
Isaiah Harris, Jr. (Born 1952) | | Trustee, since 2009 | | Retired. Chairman of the Board of CIGNA Corporation since 2009, and Director since 2005. From 2003 to 2011, Director of Deluxe Corporation. Prior thereto, President and CEO of BellSouth Advertising and Publishing Corp. from 2005 to 2007, President and CEO of BellSouth Enterprises from 2004 to 2005 and President of BellSouth Consumer Services from 2000 to 2003. Emeritus member of the Iowa State University Foundation Board of Governors. Emeritus Member of the Advisory Board of Iowa State University School of Business. Advisory Board Member, Palm Harbor Academy (private school). Advisory Board Member, Child Evangelism Fellowship (non-profit). Mr. Harris is a certified public accountant (inactive status). | | CIGNA Corporation |
Judith M. Johnson (Born 1949) | | Trustee, since 2008; Audit Committee Chairman, since 2009 | | Retired. Prior thereto, Chief Executive Officer and Chief Investment Officer of Minneapolis Employees Retirement Fund from 1996 to 2008. Ms. Johnson is an attorney, certified public accountant and a certified managerial accountant. | | N/A |
| | | | | | |
| Other information (unaudited) | | Wells Fargo Utility and Telecommunications Fund | | | 25 | |
| | | | | | |
Name and year of birth | | Position held and
length of service* | | Principal occupations during past five years or longer | | Current other
public company or
investment company
directorships |
David F. Larcker (Born 1950) | | Trustee, since 2009 | | James Irvin Miller Professor of Accounting at the Graduate School of Business, Stanford University, Director of the Corporate Governance Research Initiative and Senior Faculty of The Rock Center for Corporate Governance since 2006. From 2005 to 2008, Professor of Accounting at the Graduate School of Business, Stanford University. Prior thereto, Ernst & Young Professor of Accounting at The Wharton School, University of Pennsylvania from 1985 to 2005. | | N/A |
Olivia S. Mitchell (Born 1953) | | Trustee, since 2006; Governance Committee Chairman, since 2018 | | International Foundation of Employee Benefit Plans Professor, Wharton School of the University of Pennsylvania since 1993. Director of Wharton’s Pension Research Council and Boettner Center on Pensions & Retirement Research, and Research Associate at the National Bureau of Economic Research. Previously, Cornell University Professor from 1978 to 1993. | | N/A |
Timothy J. Penny (Born 1951) | | Trustee, since 1996; Chairman, since 2018; Vice Chairman, from 2017 to 2018 | | President and Chief Executive Officer of Southern Minnesota Initiative Foundation, a non-profit organization, since 2007. Member of the Board of Trustees of NorthStar Education Finance, Inc., a non-profit organization, since 2007. | | N/A |
James G. Polisson (Born 1959) | | Trustee, since 2018; Advisory Board Member, from 2017 to 2018 | | Retired. Chief Marketing Officer, Source (ETF) UK Services, Ltd, from 2015 to 2017. From 2012 to 2015, Principal of The Polisson Group, LLC, a management consulting, corporate advisory and principal investing company. Chief Executive Officer and Managing Director at Russell Investments, Global Exchange Traded Funds from 2010 to 2012. Managing Director of Barclays Global Investors from 1998 to 2010 and Global Chief Marketing Officer for iShares and Barclays Global Investors from 2000 to 2010. Trustee of the San Francisco Mechanics’ Institute, a non-profit organization, from 2013 to 2015. Board member of the Russell Exchange Traded Fund Trust from 2011 to 2012. Director of Barclays Global Investors Holdings Deutschland GmbH from 2006 to 2009. Mr. Polisson is an attorney and has a retired status with the Massachusetts and District of Columbia Bar Associations. | | N/A |
Michael S. Scofield (Born 1943) | | Trustee, since 2010 | | Served on the Investment Company Institute’s Board of Governors and Executive Committee from 2008-2011 as well the Governing Council of the Independent Directors Council from 2006-2011 and the Independent Directors Council Executive Committee from 2008-2011. Trustee of the Evergreen Fund complex (and its predecessors) from 1984 to 2010. Chairman of the Evergreen Funds from 2000-2010. Former Trustee of the Mentor Funds. Retired Attorney, Law Offices of Michael S. Scofield. | | N/A |
Pamela Wheelock (Born 1959) | | Trustee, since 2018; Advisory Board Member, from 2017 to 2018 | | Chief Operating Officer, Twin Cities Habitat for Humanity, since January, 2017. Vice President of University Services, University of Minnesota from 2012 to 2017. Prior thereto, on the Board of Directors, Governance Committee and Finance Committee for the Minnesota Philanthropy Partners (Saint Paul Foundation) from 2012 to 2018, Interim President and Chief Executive Officer of Blue Cross Blue Shield of Minnesota from 2010 to 2011, Chairman of the Board from 2009 to 2011 and Board Director from 2003 to 2015. Vice President, Leadership and Community Engagement, Bush Foundation, Saint Paul, Minnesota (a private foundation) from 2009 to 2011. Executive Vice President and Chief Financial Officer, Minnesota Sports and Entertainment from 2004 to 2009 and Senior Vice President from 2002 to 2004. Commissioner of Finance, State of Minnesota, from 1999 to 2002. Currently the Board Chair of the Minnesota Wild Foundation since 2010. | | N/A |
| * | Length of service dates reflect the Trustee’s commencement of service with the Trust’s predecessor entities, where applicable. |
| | | | |
| 26 | | Wells Fargo Utility and Telecommunications Fund | | Other information (unaudited) |
Officers
| | | | | | |
Name and year of birth | | Position held and
length of service | | Principal occupations during past five years or longer | | |
Andrew Owen (Born 1960) | | President, since 2017 | | Executive Vice President of Wells Fargo & Company and Head of Affiliated Managers, Wells Fargo Asset Management, since 2014. In addition, Mr. Owen is currently President, Chief Executive Officer and Director of Wells Fargo Funds Management, LLC since 2017. Prior thereto, Executive Vice President responsible for marketing, investments and product development for Wells Fargo Funds Management, LLC, from 2009 to 2014. | | |
Nancy Wiser1 (Born 1967) | | Treasurer, since 2012 | | Executive Vice President of Wells Fargo Funds Management, LLC since 2011. Chief Operating Officer and Chief Compliance Officer at LightBox Capital Management LLC, from 2008 to 2011. | | |
Alexander Kymn3 (Born 1973) | | Secretary, since 2018; Chief Legal Officer, since 2018 | | Senior Company Counsel of Wells Fargo Bank, N.A. since 2018 (previously Senior Counsel from 2007 to 2018). Vice President of Wells Fargo Funds Management, LLC from 2008 to 2014. | | |
Michael H. Whitaker (Born 1967) | | Chief Compliance Officer, since 2016 | | Senior Vice President and Chief Compliance Officer since 2016. Senior Vice President and Chief Compliance Officer for Fidelity Investments from 2007 to 2016. | | |
David Berardi (Born 1975) | | Assistant Treasurer, since 2009 | | Vice President of Wells Fargo Funds Management, LLC since 2009. Vice President of Evergreen Investment Management Company, LLC from 2008 to 2010. Manager of Fund Reporting and Control for Evergreen Investment Management Company, LLC from 2004 to 2010. | | |
Jeremy DePalma1 (Born 1974) | | Assistant Treasurer, since 2009 | | Senior Vice President of Wells Fargo Funds Management, LLC since 2009. Senior Vice President of Evergreen Investment Management Company, LLC from 2008 to 2010 and head of the Fund Reporting and Control Team within Fund Administration from 2005 to 2010. | | |
| 1 | Nancy Wiser acts as Treasurer of 76 funds in the Fund Complex. Jeremy DePalma acts as Treasurer of 77 funds and Assistant Treasurer of 76 funds in the Fund Complex. |
| 2 | The Statement of Additional Information includes additional information about the Trustees and is available, without charge, upon request, by calling 1-800-222-8222 or by visiting the website at wellsfargofunds.com. |
| 3 | Alexander Kymn became the Secretary and Chief Legal Officer effective April 17, 2018. |
| | | | | | |
| Other information (unaudited) | | Wells Fargo Utility and Telecommunications Fund | | | 27 | |
BOARD CONSIDERATION OF INVESTMENT MANAGEMENT AND SUB-ADVISORY AGREEMENTS:
Wells Fargo Utility and Telecommunications Fund
Under the Investment Company Act of 1940 (the “1940 Act”), the Board of Trustees (the “Board”) of Wells Fargo Funds Trust (the “Trust”) must determine annually whether to approve the continuation of the Trust’s investment management and sub-advisory agreements. In this regard, at an in-person meeting held on May 22-23, 2018 (the “Meeting”), the Board, all the members of which have no direct or indirect interest in the investment management and sub-advisory agreements and are not “interested persons” of the Trust, as defined in the 1940 Act (the “Independent Trustees”), reviewed and approved for Wells Fargo Utility and Telecommunications Fund (the “Fund”): (i) an investment management agreement (the “Management Agreement”) with Wells Fargo Funds Management, LLC (“Funds Management”); and (ii) an investment sub-advisory agreement (the “Sub-Advisory Agreement”) with Crow Point Partners, LLC (the “Sub-Adviser”). The Management Agreement and the Sub-Advisory Agreement are collectively referred to as the “Advisory Agreements.”
At the Meeting, the Board considered the factors and reached the conclusions described below relating to the selection of Funds Management and the Sub-Adviser and the approval of the Advisory Agreements. Prior to the Meeting, including at an in-person meeting in April 2018, the Trustees conferred extensively among themselves and with representatives of Funds Management about these matters. Also, the Board has adopted a team-based approach, with each team consisting of a sub-set of Trustees, to assist the full Board in the discharge of its duties in reviewing investment performance and other matters throughout the year. The Independent Trustees were assisted in their evaluation of the Advisory Agreements by independent legal counsel, from whom they received separate legal advice and with whom they met separately.
In providing information to the Board, Funds Management and the Sub-Adviser were guided by a detailed set of requests for information submitted to them by independent legal counsel on behalf of the Independent Trustees at the start of the Board’s annual contract renewal process earlier in 2018. In considering and approving the Advisory Agreements, the Trustees considered the information they believed relevant, including but not limited to the information discussed below. The Board considered not only the specific information presented in connection with the Meeting, but also the knowledge gained over time through interaction with Funds Management and the Sub-Adviser about various topics. In this regard, the Board reviewed reports of Funds Management at each of its quarterly meetings, which included, among other things, portfolio reviews and investment performance reports. In addition, the Board and the teams mentioned above confer with portfolio managers at various times throughout the year. The Board did not identify any particular information or consideration that was all-important or controlling, and each individual Trustee may have attributed different weights to various factors.
After its deliberations, the Board unanimously approved the continuation of the Advisory Agreements for a one-year term and determined that the compensation payable to Funds Management and the Sub-Adviser under each of the Advisory Agreements was reasonable. The Board considered the approval of the Advisory Agreements for the Fund as part of its consideration of agreements for funds across the complex, but its approvals were made on a fund-by-fund basis. The following summarizes a number of important, but not necessarily all, factors considered by the Board in support of its approvals.
Nature, extent and quality of services
The Board received and considered various information regarding the nature, extent and quality of services provided to the Fund by Funds Management and the Sub-Adviser under the Advisory Agreements. This information included a description of the investment advisory services and Fund-level administrative services covered by the Management Agreement, as well as, among other things, a summary of the background and experience of senior management of Wells Fargo Asset Management (“WFAM”), of which Funds Management is a part, a summary of investments made in the business of WFAM, a summary of certain organizational and personnel changes involving Funds Management, and a description of Funds Management’s and the Sub-Adviser’s business continuity planning programs and of their approaches to data privacy and cybersecurity. The Board also considered the qualifications, background, tenure and responsibilities of each of the portfolio managers primarily responsible for the day-to-day portfolio management of the Fund.
The Board evaluated the ability of Funds Management and the Sub-Adviser to attract and retain qualified investment professionals, including research, advisory and supervisory personnel. The Board further considered the compliance programs and compliance records of Funds Management and the Sub-Adviser. In addition, the Board took into account the full range of services provided to the Fund by Funds Management and its affiliates.
| | | | |
| 28 | | Wells Fargo Utility and Telecommunications Fund | | Other information (unaudited) |
Fund investment performance and expenses
The Board considered the investment performance results for the Fund over various time periods ended December 31, 2017. The Board considered these results in comparison to the investment performance of funds in a universe that was determined by Broadridge Inc. (“Broadridge”) to be similar to the Fund (the “Universe”), and in comparison to the Fund’s benchmark index and to other comparative data. Broadridge is an independent provider of investment company data. The Board received a description of the methodology used by Broadridge to select the mutual funds in the performance Universe. The Board noted that the investment performance of the Fund (Class A) was higher than or in range of the average performance of the Universe for all periods under review. The Board also noted that the investment performance of the Fund was higher than its benchmark index, the S&P 500 Utilities Index, for the one-year period under review, but lower than its benchmark index for the three-, five- and ten-year periods under review. The Board noted the Fund’s outperformance relative to the Universe.
The Board also received and considered information regarding the Fund’s net operating expense ratios and their various components, including actual management fees, custodian and other non-management fees, and Rule 12b-1 and non-Rule 12b-1 shareholder service fees. The Board considered these ratios in comparison to the median ratios of funds in class-specific expense groups that were determined by Broadridge to be similar to the Fund (the “Groups”). The Board received a description of the methodology used by Broadridge to select the mutual funds in the expense Groups and an explanation of how funds comprising expense groups and their expense ratios may vary from year-to-year. Based on the Broadridge reports, the Board noted that the net operating expense ratios of the Fund were lower than or equal to the median net operating expense ratios of the expense Groups for each share class.
The Board took into account the Fund’s investment performance and expense information provided to it among the factors considered in deciding to re-approve the Advisory Agreements.
Investment management and sub-advisory fee rates
The Board reviewed and considered the contractual fee rates payable by the Fund to Funds Management under the Management Agreement, as well as the contractual fee rates payable by the Fund to Funds Management for class-level administrative services under a Class-Level Administration Agreement, which include, among other things, class-level transfer agency and sub-transfer agency costs (collectively, the “Management Rates”). The Board also reviewed and considered the contractual investment sub-advisory fee rates that are payable by Funds Management to the Sub-Adviser for investment sub-advisory services.
Among other information reviewed by the Board was a comparison of the Fund’s Management Rates with the average contractual investment management fee rates of funds in the expense Groups at a common asset level as well as transfer agency costs of the other funds in the expense Groups. The Board noted that the Management Rates of the Fund were lower than, equal to, or in range of the sum of these average rates for the Fund’s expense Groups for all share classes.
The Board also received and considered information about the portion of the total management fee that was retained by Funds Management after payment of the fee to the Sub-Adviser for sub-advisory services. The Board considered this amount in comparison to the median amount retained by advisers to funds in a sub-advised expense universe that was determined by Broadridge to be similar to the Fund. In assessing the reasonableness of this amount, the Board received and evaluated information about the nature and extent of responsibilities retained and risks assumed by Funds Management and not delegated to or assumed by the Sub-Adviser, and about Funds Management’s on-going oversight services. The Board also considered that the sub-advisory fees paid to the Sub-Adviser had been negotiated by Funds Management on an arm’s length basis.
Based on its consideration of the factors and information it deemed relevant, including those described here, the Board determined that the compensation payable to Funds Management under the Management Agreement and to the Sub-Adviser under the Sub-Advisory Agreement was reasonable.
Profitability
The Board received and considered information concerning the profitability of Funds Management, as well as the profitability of both WFAM and Wells Fargo & Co. (“Wells Fargo”) as a whole, from providing services to the Fund and the fund family as a whole. Funds Management reported on the methodologies and estimates used in calculating profitability, including a description of the methodology used to allocate certain expenses and recent enhancements made to the methodology. Among other things, the Board noted that the levels of profitability reported on a fund-by-fund basis varied widely, depending on factors such as the size and type of fund. The Board did not consider profitability with respect to the Sub-Adviser, as the sub-advisory fees paid to the Sub-Adviser had been negotiated by Funds Management on an arm’s-length basis.
| | | | | | |
| Other information (unaudited) | | Wells Fargo Utility and Telecommunications Fund | | | 29 | |
Based on its review, the Board did not deem the profits reported by Funds Management, WFAM or Wells Fargo from services provided to the Fund to be at a level that would prevent it from approving the continuation of the Advisory Agreements.
Economies of scale
The Board considered the extent to which Funds Management may experience economies of scale in the provision of management services, and the extent to which scale benefits, if any, would be shared with shareholders. In particular, the Board noted the existence of breakpoints in the Fund’s management fee structure, which operate generally to reduce the Fund’s expense ratios as the Fund grows in size. It considered that, for a small fund or a fund that shrinks in size, breakpoints conversely can result in higher fee levels. The Board also considered that in addition to management fee breakpoints, competitive management fee rates set at the outset without regard to breakpoints and fee waiver and expense reimbursement arrangements, as well as investments in the business intended to enhance services available to Fund shareholders, are means of sharing potential economies of scale with shareholders of the Fund.
The Board concluded that the Fund’s fee and expense arrangements, including contractual breakpoints, constituted a reasonable approach to sharing potential economies of scale with the Fund and its shareholders.
Other benefits to Funds Management and the Sub-Adviser
The Board received and considered information regarding potential “fall-out” or ancillary benefits received by Funds Management, the Sub-Adviser, and their affiliates as a result of their relationships with the Fund. Ancillary benefits could include, among others, benefits directly attributable to other relationships with the Fund and benefits potentially derived from an increase in Funds Management’s and the Sub-Adviser’s business as a result of their relationships with the Fund. The Board noted that various affiliates of Funds Management may receive distribution-related fees, shareholder servicing payments and sub-transfer agency fees in respect of shares sold or held through them and services provided.
The Board also reviewed information about soft dollar credits earned and utilized by the Sub-Adviser, fees earned by Funds Management and its affiliate from managing a private investment vehicle for the fund family’s securities lending collateral and commissions earned by an affiliated broker from portfolio transactions.
Based on its consideration of the factors and information it deemed relevant, including those described here, the Board did not find that any ancillary benefits received by Funds Management, the Sub-Adviser, and their affiliates were unreasonable.
Conclusion
At the Meeting, after considering the above-described factors and based on its deliberations and its evaluation of the information described above, the Board unanimously approved the continuation of the Advisory Agreements for a one-year term and determined that the compensation payable to Funds Management and the Sub-Adviser under each of the Advisory Agreements was reasonable.
| | | | |
| 30 | | Wells Fargo Utility and Telecommunications Fund | | Appendix A (unaudited) |
SALES CHARGE REDUCTIONS AND WAIVERS FOR CERTAIN INTERMEDIARIES
Ameriprise
Effective June 1, 2018, shareholders purchasing Fund shares through an Ameriprise Financial platform or account will be eligible only for the following Class A load waivers (front-end sales charge waivers), which may differ from those disclosed elsewhere in the Fund’s prospectus or Statement of Additional Information.
Front-end Sales Load Waivers on Class A Shares Available at Ameriprise Financial
| | • | | Employer-sponsored retirement plans (e.g., 401(k) plans, 457 plans, employer-sponsored 403(b) plans, profit sharing and money purchase pension plans and defined benefit plans). For purposes of this provision, employer-sponsored retirement plans do not include SEP IRAs, Simple IRAs or SAR-SEPs. |
| | • | | Shares purchased through an Ameriprise Financial investment advisory program (if an Advisory or similar share class for such investment advisory program is not available) |
| | • | | Shares purchased by third party investment advisors on behalf of their advisory clients through Ameriprise Financial’s platform (if an Advisory or similar share class for such investment advisory program is not available) |
| | • | | Shares purchased through reinvestment of distributions and dividend reinvestment when purchasing shares of the same Fund (but not any other fund within the same fund family) |
| | • | | Shares exchanged from Class C shares of the same fund in the month of or following the 10-year anniversary of the purchase date. To the extent that the Fund’s prospectus elsewhere provides for a waiver with respect to such shares following a shorter holding period, that waiver will apply to exchanges following such shorter period. To the extent that the Fund’s prospectus elsewhere provides for a waiver with respect to exchanges of Class C shares for load-waived shares, that waiver will also apply to such exchanges. |
| | • | | Employees and registered representatives of Ameriprise Financial or its affiliates and their immediate family members |
| | • | | Shares purchased by or through qualified accounts (including IRAs, Coverdell Education Savings Accounts, 401(k)s, 403(b) TSCAs subject to ERISA and defined benefit plans) that are held by a covered family member, defined as an Ameriprise financial advisor and/or the advisor’s spouse, advisor’s lineal ascendant (mother, father, grandmother, grandfather, great grandmother, great grandfather), advisor’s lineal descendant (son, step-son, daughter, step-daughter, grandson, granddaughter, great grandson, great granddaughter) or any spouse of a covered family member who is a lineal descendant |
| | • | | Shares purchased from the proceeds of redemptions within the same fund family, provided (1) the repurchase occurs within 90 days following the redemption, (2) the redemption and purchase occur in the same account, and (3) redeemed shares were subject to a front-end or deferred sales load (i.e. Rights of Reinstatement). Subject to the Fund’s policy regarding frequent purchases and redemptions of Fund shares, you may not be able to repurchase shares for the first 30 days after your redemption. |
Automatic Exchange of Class C Shares Available at Ameriprise Financial
| | • | | Class C shares will automatically exchange to Class A shares in the month of the 10-year anniversary of the purchase date. |
Merrill Lynch
Effective April 10, 2017, shareholders purchasing Fund shares through a Merrill Lynch platform or account will be eligible only for the following load waivers (front-end sales charge waivers and contingent deferred, or back-end, sales charge waivers) and discounts, which may differ from those disclosed elsewhere in the Fund’s prospectus or Statement of Additional Information.
Front-end Sales Load Waivers on Class A Shares available at Merrill Lynch
| | • | | Employer-sponsored retirement, deferred compensation and employee benefit plans (including health savings accounts) and trusts used to fund those plans, provided that the shares are not held in a commission-based brokerage account and shares are held for the benefit of the plan |
| | • | | Shares purchased by or through a 529 Plan |
| | • | | Shares purchased through a Merrill Lynch affiliated investment advisory program |
| | | | | | |
| Appendix A (unaudited) | | Wells Fargo Utility and Telecommunications Fund | | | 31 | |
| | • | | Shares purchased by third party investment advisors on behalf of their advisory clients through Merrill Lynch’s platform |
| | • | | Shares of funds purchased through the Merrill Edge Self-Directed platform (if applicable) |
| | • | | Shares purchased through reinvestment of capital gains distributions and dividend reinvestment when purchasing shares of the same fund (but not any other fund within the fund family) |
| | • | | Shares exchanged from Class C (i.e. level-load) shares of the same fund in the month of or following the 10-year anniversary of the purchase date |
| | • | | Employees and registered representatives of Merrill Lynch or its affiliates and their family members, as defined by Merrill Lynch, which may differ from the definition of family member in the Fund’s prospectus. |
| | • | | Directors or Trustees of the Fund, and employees of the Fund’s investment adviser or any of its affiliates, as described in the Fund’s prospectus |
| | • | | Shares purchased from the proceeds of redemptions within the same fund family, provided (1) the repurchase occurs within 90 days following the redemption, (2) the redemption and purchase occur in the same account, and (3) redeemed shares were subject to a front-end or deferred sales load (known as Rights of Reinstatement). Subject to the Fund’s policy regarding frequent purchases and redemptions of Fund shares, you may not be able to repurchase shares for the first 30 days after your redemption. |
CDSC Waivers on A, B and C Shares available at Merrill Lynch
| | • | | Death or disability of the shareholder |
| | • | | Shares sold as part of a systematic withdrawal plan as described in the Fund’s prospectus |
| | • | | Return of excess contributions from an IRA Account |
| | • | | Shares sold as part of a required minimum distribution for IRA and retirement accounts due to the shareholder reaching age 701⁄2 |
| | • | | Shares sold to pay Merrill Lynch fees but only if the transaction is initiated by Merrill Lynch |
| | • | | Shares acquired through a right of reinstatement |
| | • | | Shares held in retirement brokerage accounts, that are exchanged for a lower cost share class due to transfer to certain fee based accounts or platforms (applicable to A and C shares only) |
Front-end load Discounts Available at Merrill Lynch: Breakpoints, Rights of Accumulation & Letters of Intent
| | • | | Breakpoints as described in the Fund’s prospectus |
| | • | | Rights of Accumulation (ROA) which entitle shareholders to breakpoint discounts will be automatically calculated based on the aggregated holding of fund family assets held by accounts within the purchaser’s household at Merrill Lynch. Eligible fund family assets not held at Merrill Lynch may be included in the ROA calculation only if the shareholder notifies his or her financial advisor about such assets. |
| | • | | Letters of Intent (LOI) which allow for breakpoint discounts based on anticipated purchases within a fund family, through Merrill Lynch, over a 13-month period of time (if applicable) |
Morgan Stanley
Effective on or about July 1, 2018, shareholders purchasing Fund shares through a Morgan Stanley Wealth Management transactional brokerage account will be eligible only for the following Class A load waivers (front-end sales charge waivers), which may differ from and be more limited than those disclosed in the Fund’s prospectus or Statement of Additional Information.
Front-end Sales Load Waivers on Class A Shares Available at Morgan Stanley
| | • | | Employer-sponsored retirement plans (e.g., 401(k) plans, 457 plans, employer-sponsored 403(b) plans, profit sharing and money purchase pension plans and defined benefit plans). For purposes of this provision, employer-sponsored retirement plans do not include SEP IRAs, Simple IRAs, SAR-SEPs or Keogh plans. |
| | • | | Morgan Stanley employee and employee-related accounts according to Morgan Stanley’s account linking rules |
| | • | | Shares purchased through reinvestment of dividends and capital gains distributions when purchasing shares of the same fund |
| | • | | Shares purchased through a Morgan Stanley self-directed brokerage account |
| | | | |
| 32 | | Wells Fargo Utility and Telecommunications Fund | | Appendix A (unaudited) |
| | • | | Class C (i.e., level-load) shares that are no longer subject to a contingent deferred sales charge and are exchanged to Class A shares of the same fund pursuant to Morgan Stanley Wealth Management’s share class exchange program. |
| | • | | Shares purchased from the proceeds of redemptions within the same fund family, provided (i) the repurchase occurs within 90 days following the redemption, (ii) the redemption and purchase occur in the same account, and (iii) redeemed shares were subject to a front-end or deferred sales charge. This waiver is subject to the Fund’s policy regarding frequent purchases and redemption of Fund shares, as discussed under “Account Information—Frequent Purchases and Redemptions of Fund Shares” in the Fund’s prospectus. |
Raymond James & Associates, Inc., Raymond James Financial Services & Raymond James affiliates (“Raymond James”)
Effective on or about March 1, 2019, shareholders purchasing Fund shares through a Raymond James platform or account will be eligible only for the following load waivers (front-end sales charge waivers and contingent deferred, or back-end, sales charge waivers) and discounts, which may differ from those disclosed elsewhere in the Fund’s Prospectus or SAI.
Front-end Sales Load Waivers on Class A shares Available at Raymond James
| | • | | Shares purchased in an investment advisory program. |
| | • | | Shares purchased through reinvestment of capital gains distributions and dividend reinvestment when purchasing shares of the same fund (but not any other fund within the fund family). |
| | • | | Employees and registered representatives of Raymond James or its affiliates and their family members as designated by Raymond James. |
| | • | | Shares purchased from the proceeds of redemptions within the same fund family, provided (1) the repurchase occurs within 90 days following the redemption, (2) the redemption and purchase occur in the same account, and (3) redeemed shares were subject to a front-end or deferred sales load (known as Rights of Reinstatement). |
| | • | | A shareholder in the fund’s Class C shares will have their shares automatically exchanged at net asset value to Class A shares (or the appropriate share class) of the fund if the shares are no longer subject to a CDSC and the exchange is in line with the policies and procedures of Raymond James. |
CDSC Waivers on Class A and C Shares Available at Raymond James
| | • | | Death or disability of the shareholder. |
| | • | | Shares sold as part of a systematic withdrawal plan as described in the Fund’s Prospectus. |
| | • | | Return of excess contributions from an IRA Account. |
| | • | | Shares sold as part of a required minimum distribution for IRA and retirement accounts due to the shareholder reaching age 70½ as described in the Fund’s prospectus. |
| | • | | Shares sold to pay Raymond James fees but only if the transaction is initiated by Raymond James. |
| | • | | Shares acquired through a right of reinstatement. |
Front-end Load Discounts Available at Raymond James: Breakpoints, and/or Rights of Accumulation
| | • | | Breakpoints as described in the Fund’s Prospectus. |
| | • | | Rights of accumulation which entitle shareholders to breakpoint discounts will be automatically calculated based on the aggregated holding of fund family assets held by accounts within the purchaser’s household at Raymond James. Eligible fund family assets not held at Raymond James may be included in the rights of accumulation calculation only if the shareholder notifies his or her financial advisor about such assets. |

For more information
More information about Wells Fargo Funds is available free upon request. To obtain literature, please write, visit the Fund’s website, or call:
Wells Fargo Funds
P.O. Box 219967
Kansas City, MO 64121-9967
Website: wellsfargofunds.com
Individual investors: 1-800-222-8222
Retail investment professionals: 1-888-877-9275
Institutional investment professionals: 1-866-765-0778
This report and the financial statements contained herein are submitted for the general information of the shareholders of the Fund. If this report is used for promotional purposes, distribution of the report must be accompanied or preceded by a current prospectus. Before investing, please consider the investment objectives, risks, charges, and expenses of the investment. For a current prospectus and, if available, a summary prospectus, containing this information, call 1-800-222-8222 or visit the Fund’s website at wellsfargofunds.com. Read the prospectus carefully before you invest or send money.
Wells Fargo Asset Management (WFAM) is the trade name for certain investment advisory/management firms owned by Wells Fargo & Company. These firms include but are not limited to Wells Capital Management Incorporated and Wells Fargo Funds Management, LLC. Certain products managed by WFAM entities are distributed by Wells Fargo Funds Distributor, LLC (a broker/dealer and Member FINRA).
This material is for general informational and educational purposes only and is NOT intended to provide investment advice or a recommendation of any kind—including a recommendation for any specific investment, strategy, or plan.
NOT FDIC INSURED ◾ NO BANK GUARANTEE ◾ MAY LOSE VALUE
© 2018 Wells Fargo Funds Management, LLC. All rights reserved.
| | |
 | | 317304 11-18 SA318/SAR318 09-18 |
ITEM 2. CODE OF ETHICS
Not applicable.
ITEM 3. AUDIT COMMITTEE FINANCIAL EXPERT
Not applicable.
ITEM 4. PRINCIPAL ACCOUNTANT FEES AND SERVICES
Not applicable.
ITEM 5. AUDIT COMMITTEE OF LISTED REGISTRANTS
Not applicable.
ITEM 6. INVESTMENTS
A Portfolio of Investments for each series of Wells Fargo Funds Trust is included as part of the report to shareholders filed under Item 1 of this Form.
ITEM 7. DISCLOSURE OF PROXY VOTING POLICIES AND PROCEDURES FOR CLOSED-END MANAGEMENT INVESTMENT COMPANIES
Not applicable.
ITEM 8. PORTFOLIO MANAGERS OF CLOSED-END MANAGEMENT INVESTMENT COMPANIES
Not applicable.
ITEM 9. PURCHASES OF EQUITY SECURITIES BY CLOSED-END MANAGEMENT INVESTMENT COMPANY AND AFFILIATED PURCHASERS
Not applicable.
ITEM 10. SUBMISSION OF MATTERS TO A VOTE OF SECURITY HOLDERS
There have been no material changes to the procedures by which shareholders may recommend nominees to the registrant’s Board of Trustees that have been implemented since the registrant’s last provided disclosure in response to the requirements of this Item.
ITEM 11. CONTROLS AND PROCEDURES
(a) The President and Treasurer have concluded that the Wells Fargo Funds Trust (the “Trust”) disclosure controls and procedures (as defined in Rule 30a-3(c) under the Investment Company Act of 1940) provide reasonable assurances that material information relating to the Trust is made known to them by the appropriate persons, based on their evaluation of these controls and procedures as of a date within 90 days of the filing of this report.
(b) There were no significant changes in the Trust’s internal controls over financial reporting (as defined in Rule 30a-3(d) under the Investment Company Act of 1940) that occurred during the second fiscal quarter of the period covered by this report that materially affected, or is reasonably likely to materially affect, the registrant’s internal control over financial reporting.
ITEM 12. EXHIBITS
(a)(1) Not applicable.
(a)(2) Certification pursuant to Rule 30a-2(a) under the Investment Company Act of 1940 (17 CFR 270.30a-2(a)) is filed and attached hereto as Exhibit 99.CERT.
(a)(3) Not applicable.
(b) Certification pursuant to Rule 30a-2(b) under the Investment Company Act of 1940 (17 CFR 270.30a-2(b)) is filed and attached hereto as Exhibit 99.906CERT.
SIGNATURES
Pursuant to the requirements of the Securities Exchange Act of 1934 and the Investment Company Act of 1940, the registrant has duly caused this report to be signed on its behalf by the undersigned, thereunto duly authorized.
| | |
| Wells Fargo Funds Trust |
| |
| By: | | /s/ Andrew Owen |
| |
| | Andrew Owen |
| | President |
| |
| Date: | | November 26, 2018 |
Pursuant to the requirements of the Securities Exchange Act of 1934 and the Investment Company Act of 1940, this report has been signed below by the following persons on behalf of the registrant and in the capacities and on the date indicated.
| | |
| Wells Fargo Funds Trust |
| |
| By: | | /s/ Andrew Owen |
| |
| | Andrew Owen |
| | President |
| |
| Date: | | November 26, 2018 |
| |
| By: | | /s/ Nancy Wiser |
| |
| | Nancy Wiser |
| | Treasurer |
| |
| Date: | | November 26, 2018 |