
UNITED STATES
SECURITIES AND EXCHANGE COMMISSION
Washington, D.C. 20549
FORM N-CSRS
CERTIFIED SHAREHOLDER REPORT OF REGISTERED
MANAGEMENT INVESTMENT COMPANIES
Investment Company Act file number: 811-09253
Wells Fargo Funds Trust
(Exact name of registrant as specified in charter)
525 Market St., San Francisco, CA 94105
(Address of principal executive offices) (Zip code)
C. David Messman
Wells Fargo Funds Management, LLC
525 Market St., San Francisco, CA 94105
(Name and address of agent for service)
Registrant’s telephone number, including area code: 800-222-8222
Date of fiscal year end: January 31
Registrant is making a filing for 8 of its series:
Wells Fargo 100% Treasury Money Market Fund, Wells Fargo Cash Investment Money Market Fund, Wells Fargo Government Money Market Fund, Wells Fargo Heritage Money Market Fund, Wells Fargo Money Market Fund, Wells Fargo Municipal Cash Management Money Market Fund, Wells Fargo National Tax-Free Money Market Fund, and Wells Fargo Treasury Plus Money Market Fund.
Date of reporting period: July 31, 2018
ITEM 1. REPORT TO STOCKHOLDERS
Semi-Annual Report
July 31, 2018

Retail Money Market Funds

| ∎ | | Wells Fargo Money Market Fund |

Reduce clutter. Save trees.
Sign up for electronic delivery of prospectuses and shareholder reports at wellsfargo.com/advantagedelivery
Contents
The views expressed and any forward-looking statements are as of July 31, 2018, unless otherwise noted, and are those of the Fund managers and/or Wells Fargo Funds Management, LLC. Discussions of individual securities, or the markets generally, or any Wells Fargo Fund are not intended as individual recommendations. Future events or results may vary significantly from those expressed in any forward-looking statements. The views expressed are subject to change at any time in response to changing circumstances in the market. Wells Fargo Funds Management, LLC and the Fund disclaim any obligation to publicly update or revise any views expressed or forward-looking statements.
NOT FDIC INSURED ◾ NO BANK GUARANTEE ◾ MAY LOSE VALUE
| | | | |
| 2 | | Wells Fargo Money Market Fund | | Letter to shareholders (unaudited) |

Andrew Owen
President
Wells Fargo Funds
Yields on money market funds benefited during the period.
During February 2018, the U.S. stock market endured a loss of more than 10% before recovering in March and April.
Dear Shareholder:
We are pleased to offer you this semi-annual report for the Wells Fargo Money Market Fund for the six-month period that ended July 31, 2018. Yields on money market funds benefited during the period. As the U.S. Federal Reserve (the Fed) moved toward a more normalized monetary policy after an extended term of low interest rates following the global financial crisis during 2007 and 2008, its steady pace of interest rate increases helped raise yields on short-term money market instruments.
Globally, stock markets followed a less consistent path during the period. After advancing during the summer and fall of 2017 in a roughly synchronized way, economic growth and stock markets globally diverged during the first seven months of 2018. For fixed-income investors, higher U.S. interest rates, rising inflation, and intensifying global geopolitical tensions tended to restrain taxable bond prices while high-yield and municipal bond investors generally enjoyed positive returns.
For the period, U.S. stocks, as measured by the S&P 500 Index,1 gained 0.70%, and international stocks, as measured by the MSCI ACWI ex USA Index (Net),2 fell 6.66%. Emerging market stocks, as measured by the MSCI EM Index (Net),3 dropped 11.94%. In bond markets, the Bloomberg Barclays U.S. Aggregate Bond Index4 declined 0.45% while fixed-income investments outside the U.S. fell 4.57%, according to the Bloomberg Barclays Global Aggregate ex-USD Index.5 The Bloomberg Barclays Municipal Bond Index6 added 1.18%, and the ICE BofAML U.S. High Yield Index7 was up 0.55%.
Volatility reemerged during the first quarter of 2018 as economic signals were mixed.
The first quarter of 2018 began with stock market gains in January following U.S. tax reform that lowered rates for individuals and corporations and deregulation advanced in some economic sectors. Then, investor optimism was supplanted by several concerns. Trade tensions intensified, particularly between the U.S. and China. The U.S. threatened to impose tariffs on a broad range of imported products. Increasing interest rates and inflation also caused concern. During February 2018, the U.S. stock market endured a loss of more than 10% before recovering in March and April. The S&P 500 Index closed the first quarter with a negative return, the first negative quarterly return for the index since 2014.
| 1 | The S&P 500 Index consists of 500 stocks chosen for market size, liquidity, and industry group representation. It is a market-value-weighted index with each stock’s weight in the index proportionate to its market value. You cannot invest directly in an index. |
| 2 | The Morgan Stanley Capital International (MSCI) All Country World Index (ACWI) ex USA Index (Net) is a free-float-adjusted market-capitalization-weighted index that is designed to measure the equity market performance of developed markets, excluding the United States and Canada. Source: MSCI. MSCI makes no express or implied warranties or representations and shall have no liability whatsoever with respect to any MSCI data contained herein. The MSCI data may not be further redistributed or used as a basis for other indices or any securities or financial products. This report is not approved, reviewed, or produced by MSCI. You cannot invest directly in an index. |
| 3 | The MSCI Emerging Markets (EM) Index (Net) is a free-float-adjusted market-capitalization-weighted index that is designed to measure large- and mid-cap equity market performance of emerging markets. The MSCI EM Index (Net) consists of the following 24 emerging market country indices: Brazil, Chile, China, Colombia, Czech Republic, Egypt, Greece, Hungary, India, Indonesia, Korea, Malaysia, Mexico, Pakistan, Peru, the Philippines, Poland, Qatar, Russia, South Africa, Taiwan, Thailand, Turkey, and the United Arab Emirates. You cannot invest directly in an index. |
| 4 | The Bloomberg Barclays U.S. Aggregate Bond Index is a broad-based benchmark that measures the investment-grade, U.S. dollar-denominated, fixed-rate taxable bond market, including Treasuries, government-related and corporate securities, mortgage-backed securities (agency fixed-rate and hybrid adjustable-rate mortgage pass-throughs), asset-backed securities, and commercial mortgage-backed securities. You cannot invest directly in an index. |
| 5 | The Bloomberg Barclays Global Aggregate ex-USD Index is an unmanaged index that provides a broad-based measure of the global investment-grade fixed-income markets excluding the U.S. dollar-denominated debt market. You cannot invest directly in an index. |
| 6 | The Bloomberg Barclays Municipal Bond Index is an unmanaged index composed of long-term tax-exempt bonds with a minimum credit rating of Baa. You cannot invest directly in an index. |
| 7 | The ICE BofAML U.S. High Yield Index is a market-capitalization-weighted index of domestic and Yankee high-yield bonds. The index tracks the performance of high-yield securities traded in the U.S. bond market. You cannot invest directly in an index. Copyright 2018. ICE Data Indices, LLC. All rights reserved. |
| 8 | The Consumer Price Index For All Urban Consumers (CPI-U) measures the changes in the price of a basket of goods and services purchased by urban consumers. The urban consumer population is deemed by many as a better representative measure of the general public because most of the country’s population lives in highly populated areas, which represent close to 90% of the total population. You cannot invest directly in an index. |
| | | | | | |
| Letter to shareholders (unaudited) | | Wells Fargo Money Market Fund | | | 3 | |
The Fed increased the federal funds rate by 25 basis points (bps; 100 bps equal 1.00%) in March 2018 and the rate of inflation reached the Fed’s 2% target for the first time in a year. The unemployment rate fell to 4.1%. The third revision of first-quarter gross domestic product (GDP) growth by the U.S. Bureau of Economic Analysis released during June 2018 was lowered to 2.0%.
Overseas, investment market returns reversed the strong returns of 2017. After having gained 27.19% for the 12-month period that ended on December 31, 2017, the MSCI ACWI ex USA Index (Net) fell 1.46% for the seven-month period that ended July 31, 2018. The U.S. dollar strengthened relative to local currencies, which served to restrain returns.
Global trade tensions escalated during the second quarter and into the third quarter of 2018.
Global trade tensions escalated as the second quarter of 2018 opened and equity markets fell in response before resuming upward momentum later in April. The U.S. government imposed tariffs on products and commodities imported from other markets in North America, Europe, and Asia. In retaliation, governments imposed tariffs on U.S. products and commodities. In addition, the U.S. pushed its North American neighbors to renegotiate the North American Free Trade Agreement, furthering trade tensions and investor uncertainty.
The CPI-U8 added 0.2% in May after a similar increase in April. On a year-over-year basis, the all-items index rose 2.8% for the 12 months that ended May 31, continuing its upward trend since the beginning of the year. The index for all items less food and energy rose 2.2% for the same 12-month period. Interest rates generally increased and the bond markets tended to decline.
During June 2018, the Fed increased the federal funds rate by 25 bps. Investment markets began to anticipate two more rate increases in 2018. Long-term interest rates in the U.S. trended higher—rates on the 10-year and 30-year Treasury bonds moved from 2.46% and 2.81%, respectively, on January 1, 2018, to 2.96% and 3.08%, respectively, on July 31, 2018. While higher at the end of the period, rates were off their peak levels on May 17, 2018, of 3.11% and 3.25%, respectively. Investors became more aware of and concerned about the potential for an inverted yield curve—sometimes a recession signal—as short-term rates increased more quickly than long-term rates.
The unemployment rate fell to 3.9% in July after ticking up slightly in June from May’s 3.8% level, according to the U.S. Department of Labor. The annualized rate of GDP growth for the second quarter of 2018 was reported in July to be 4.1%, the highest level since the third quarter of 2014, according to the U.S. Bureau of Economic Analysis.
Internationally, the prospects for a smooth U.K. Brexit agreement was cast into doubt as members of Prime Minister Theresa May’s negotiating team resigned. Despite the uncertainty, the period closed with expectations that the Bank of England’s Monetary Policy Committee in July would announce an increase in its key interest rate to 0.75%, which it did in early August.
Meanwhile, central banks in Europe and Japan maintained low interest rates and accommodative monetary policies. Amid rising trade uncertainty, People’s Bank of China monetary policies shifted with cuts to reserve requirement ratios and implementation of supportive measures such as accelerated infrastructure spending and tax cuts for small and medium enterprises and for individuals. Nevertheless, a strengthening U.S. dollar and the tensions associated with trade policies remained headwinds for investors overseas.
| | | | |
| 4 | | Wells Fargo Money Market Fund | | Letter to shareholders (unaudited) |
Don’t let short-term uncertainty derail long-term investment goals.
Periods of investment uncertainty can present challenges, but experience has taught us that maintaining long-term investment goals can be an effective way to plan for the future. To help you create a sound strategy based on your personal goals and risk tolerance, Wells Fargo Funds offers more than 100 mutual funds spanning a wide range of asset classes and investment styles. Although diversification cannot guarantee an investment profit or prevent losses, we believe it can be an effective way to manage investment risk and potentially smooth out overall portfolio performance. We encourage investors to know their investments and to understand that appropriate levels of risk-taking may unlock opportunities.
Thank you for choosing to invest with Wells Fargo Funds. We appreciate your confidence in us and remain committed to helping you meet your financial needs.
Sincerely,

Andrew Owen
President
Wells Fargo Funds
For further information about your Fund, contact your investment professional, visit our website at wellsfargofunds.com, or call us directly at 1-800-222-8222.
This page is intentionally left blank.
| | | | |
| 6 | | Wells Fargo Money Market Fund | | Performance highlights (unaudited) |
Investment objective
The Fund seeks current income, while preserving capital and liquidity.
Manager
Wells Fargo Funds Management, LLC
Subadvisers
Wells Capital Management Incorporated
Wells Capital Management Singapore
Portfolio managers
Michael C. Bird, CFA®
Jeffrey L. Weaver, CFA®
Laurie White
Average annual total returns (%) as of July 31, 20181
| | | | | | | | | | | | | | | | | | | | | | | | | | | | | | | | | | |
| | | | | Including sales charge | | | Excluding sales charge | | | Expense ratios2 (%) | |
| | | Inception date | | 1 year | | | 5 year | | | 10 year | | | 1 year | | | 5 year | | | 10 year | | | Gross | | | Net3 | |
| Class A (STGXX) | | 7-1-1992 | | | – | | | | – | | | | – | | | | 1.08 | | | | 0.28 | | | | 0.23 | | | | 0.70 | | | | 0.60 | |
| Class C* | | 6-30-2010 | | | (0.67 | ) | | | 0.07 | | | | 0.09 | | | | 0.33 | | | | 0.07 | | | | 0.09 | | | | 1.45 | | | | 1.35 | |
| Premier Class (WMPXX) | | 3-31-2016 | | | – | | | | – | | | | – | | | | 1.52 | | | | 0.47 | | | | 0.33 | | | | 0.31 | | | | 0.20 | |
| Service Class (WMOXX) | | 6-30-2010 | | | – | | | | – | | | | – | | | | 1.22 | | | | 0.33 | | | | 0.27 | | | | 0.60 | | | | 0.50 | |
Yield summary (%) as of July 31, 20183
| | | | | | | | | | | | | | |
| | | Class A | | Class C* | | | Premier Class | | | Service Class | |
| 7-day current yield | | 1.58 | | | 0.83 | | | | 1.98 | | | | 1.68 | |
| 7-day compound yield | | 1.60 | | | 0.83 | | | | 2.00 | | | | 1.69 | |
| 30-day simple yield | | 1.60 | | | 0.84 | | | | 1.99 | | | | 1.69 | |
| 30-day compound yield | | 1.61 | | | 0.85 | | | | 2.01 | | | | 1.71 | |
| * | | Class C shares are available only to shareholders making an exchange out of Class C shares of another mutual fund within the Wells Fargo family of funds. |
Figures quoted represent past performance, which is no guarantee of future results, and do not reflect taxes that a shareholder may pay on fund distributions or the redemption of fund shares. Investment returns will fluctuate. The Fund’s yield figures more closely reflect the current earnings of the Fund than the total return figures. Current performance may be lower or higher than the performance data quoted, which assumes the reinvestment of dividends and capital gains. Current month-end performance is available on the Fund’s website, wellsfargofunds.com.
Class A shares, Premier Class shares, and Service Class shares are sold without a front-end sales charge or contingent deferred sales charge. For Class C shares, the maximum contingent deferred sales charge is 1.00%. Performance including a contingent deferred sales charge assumes the sales charge for the corresponding time period.
For retail money market funds: You could lose money by investing in the Fund. Although the Fund seeks to preserve the value of your investment at $1.00 per share, it cannot guarantee it will do so. The Fund may impose a fee upon sale of your shares or may temporarily suspend your ability to sell shares if the Fund’s liquidity falls below required minimums because of market conditions or other factors. An investment in the Fund is not insured or guaranteed by the Federal Deposit Insurance Corporation or any other government agency. The Fund’s sponsor has no legal obligation to provide financial support to the Fund, and you should not expect that the sponsor will provide financial support to the Fund at any time.
Please see footnotes on page 7.
| | | | | | |
| Performance highlights (unaudited) | | Wells Fargo Money Market Fund | | | 7 | |
|
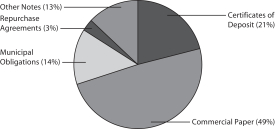
| Portfolio composition as of July 31, 20184 |
|
 |
|
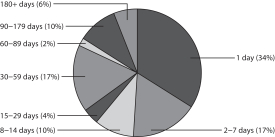
| Effective maturity distribution as of July 31, 20184 |
|
 |
|
| Weighted average maturity as of July 31, 20185 |
14 days |
|
| Weighted average life as of July 31, 20186 |
42 days |
| 1 | Historical performance shown for Class C shares prior to their inception reflects the performance of the former Class B shares. Historical performance shown for the Premier Class shares prior to its inception reflects the performance of Class A shares, and includes expenses that are not applicable to and higher than those of the Premier Class shares. Historical performance shown for Service Class shares prior to their inception reflects the performance of the former Investor Class shares, and includes the higher expenses applicable to the former Investor Class shares. If these expenses had not been included, returns for Service Class shares would be higher. |
| 2 | Reflects the expense ratios as stated in the most recent prospectuses. The expense ratios shown are subject to change and may differ from the annualized expense ratios shown in the financial highlights of this report. |
| 3 | The manager has contractually committed through May 31, 2019, to waive fees and/or reimburse expenses to the extent necessary to cap the Fund’s Total Annual Fund Operating Expenses After Fee Waivers at the amounts shown. After this time, the cap may be increased or the commitment to maintain the cap may be terminated only with the approval of the Board of Trustees. Brokerage commissions, stamp duty fees, interest, taxes, acquired fund fees and expenses (if any), and extraordinary expenses are excluded from the expense cap. Without this cap, the Fund’s returns would have been lower. Without waived fees and/or reimbursed expenses, the Fund’s 7-day current yield would have been 1.46%, 0.70%, 1.85%, 1.56%, and for Class A, Class C, Premier Class, and Service Class, respectively. The expense ratio paid by an investor is the net expense ratio (the total annual fund operating expenses after fee waivers) as stated in the prospectuses. |
| 4 | Amounts are calculated based on the total investments of the Fund. These amounts are subject to change and may have changed since the date specified. |
| 5 | Weighted Average Maturity (WAM): WAM is an average of the effective maturities of all securities held in the portfolio, weighted by each security’s percentage of total investments. The maturity of a portfolio security is the period remaining until the date on which the principal amount is unconditionally required to be paid, or in the case of a security called for redemption, the date on which the redemption payment is unconditionally required to be made. WAM calculations allow for the maturities of certain securities with demand features or periodic interest rate resets to be shortened. WAM is a way to measure a fund’s sensitivity to potential interest rate changes. WAM is subject to change and may have changed since the date specified. |
| 6 | Weighted Average Life (WAL): WAL is an average of the final maturities of all securities held in the portfolio, weighted by their percentage of total investments. The maturity of a portfolio security is the period remaining until the date on which the principal amount is unconditionally required to be paid, or in the case of a security called for redemption, the date on which the redemption payment is unconditionally required to be made. In contrast to WAM, the calculation of WAL allows for the maturities of certain securities with demand features to be shortened, but not the periodic interest rate resets. WAL is a way to measure a fund’s potential sensitivity to credit spread changes. WAL is subject to change and may have changed since the date specified. |
| | | | |
| 8 | | Wells Fargo Money Market Fund | | Fund expenses (unaudited) |
As a shareholder of the Fund, you incur two types of costs: (1) transaction costs, including contingent deferred sales charges (if any) on redemptions and (2) ongoing costs, including management fees, distribution (12b-1) and/or shareholder servicing fees, and other Fund expenses. This example is intended to help you understand your ongoing costs (in dollars) of investing in the Fund and to compare these costs with the ongoing costs of investing in other mutual funds.
The example is based on an investment of $1,000 invested at the beginning of the six-month period and held for the entire period from February 1, 2018 to July 31, 2018.
Actual expenses
The “Actual” line of the table below provides information about actual account values and actual expenses. You may use the information in this line, together with the amount you invested, to estimate the expenses that you paid over the period. Simply divide your account value by $1,000 (for example, an $8,600 account value divided by $1,000 = 8.6), then multiply the result by the number in the “Actual” line under the heading entitled “Expenses paid during period” for your applicable class of shares to estimate the expenses you paid on your account during this period.
Hypothetical example for comparison purposes
The “Hypothetical” line of the table below provides information about hypothetical account values and hypothetical expenses based on the Fund’s actual expense ratio and an assumed rate of return of 5% per year before expenses, which is not the Fund’s actual return. The hypothetical account values and expenses may not be used to estimate the actual ending account balance or expenses you paid for the period. You may use this information to compare the ongoing costs of investing in the Fund and other funds. To do so, compare this 5% hypothetical example with the 5% hypothetical examples that appear in the shareholder reports of the other funds.
Please note that the expenses shown in the table are meant to highlight your ongoing costs only and do not reflect any transactional costs, such as contingent deferred sales charges. Therefore, the “Hypothetical” line of the table is useful in comparing ongoing costs only and will not help you determine the relative total costs of owning different funds. In addition, if these transactional costs were included, your costs would have been higher.
| | | | | | | | | | | | | | | | |
| | | Beginning
account value
2-1-2018 | | | Ending
account value
7-31-2018 | | | Expenses
paid during
the period¹ | | | Annualized net
expense ratio | |
Class A | | | | | | | | | | | | | | | | |
Actual | | $ | 1,000.00 | | | $ | 1,006.77 | | | $ | 3.19 | | | | 0.63 | % |
Hypothetical (5% return before expenses) | | $ | 1,000.00 | | | $ | 1,022.03 | | | $ | 3.21 | | | | 0.63 | % |
Class C | | | | | | | | | | | | | | | | |
Actual | | $ | 1,000.00 | | | $ | 1,002.99 | | | $ | 6.97 | | | | 1.38 | % |
Hypothetical (5% return before expenses) | | $ | 1,000.00 | | | $ | 1,018.25 | | | $ | 7.02 | | | | 1.38 | % |
Premier Class | | | | | | | | | | | | | | | | |
Actual | | $ | 1,000.00 | | | $ | 1,008.89 | | | $ | 1.01 | | | | 0.20 | % |
Hypothetical (5% return before expenses) | | $ | 1,000.00 | | | $ | 1,024.20 | | | $ | 1.02 | | | | 0.20 | % |
Service Class | | | | | | | | | | | | | | | | |
Actual | | $ | 1,000.00 | | | $ | 1,007.39 | | | $ | 2.53 | | | | 0.50 | % |
Hypothetical (5% return before expenses) | | $ | 1,000.00 | | | $ | 1,022.68 | | | $ | 2.55 | | | | 0.50 | % |
| 1 | Expenses paid is equal to the annualized net expense ratio of each class multiplied by the average account value over the period, multiplied by the number of days in the most recent fiscal half-year divided by the number of days in the fiscal year (to reflect the one-half-year period). |
| | | | | | |
| Portfolio of investments—July 31, 2018 (unaudited) | | Wells Fargo Money Market Fund | | | 9 | |
| | | | | | | | | | | | | | | | |
| Security name | | Interest rate | | | Maturity date | | | Principal | | | Value | |
| | | | |
Certificates of Deposit: 21.21% | | | | | | | | | | | | | | | | |
ABN AMRO Funding LLC | | | 1.95 | % | | | 8-1-2018 | | | $ | 15,000,000 | | | $ | 15,000,000 | |
Australia & New Zealand Banking Group | | | 1.89 | | | | 8-1-2018 | | | | 14,000,000 | | | | 14,000,000 | |
BNP Paribas (3 Month LIBOR +0.15%) ± | | | 2.49 | | | | 9-28-2018 | | | | 3,000,000 | | | | 3,000,000 | |
China Construction Bank Corporation NY (1 Month LIBOR +0.25%) ± | | | 2.34 | | | | 7-19-2019 | | | | 7,000,000 | | | | 7,000,000 | |
Commonwealth Bank of Australia (3 Month LIBOR +0.25%) ± | | | 2.59 | | | | 4-3-2019 | | | | 2,000,000 | | | | 2,000,000 | |
Credit Industriel et Commercial (z) | | | 2.28 | | | | 8-20-2018 | | | | 2,000,000 | | | | 1,997,603 | |
Credit Suisse AG (3 Month LIBOR +0.10%) ± | | | 2.43 | | | | 9-21-2018 | | | | 2,000,000 | | | | 2,000,000 | |
DNB Nor Bank ASA | | | 2.26 | | | | 8-1-2018 | | | | 2,000,000 | | | | 2,000,000 | |
HSBC Bank plc | | | 1.95 | | | | 8-1-2018 | | | | 10,000,000 | | | | 10,000,000 | |
HSBC Bank plc (3 Month LIBOR +0.18%) ± | | | 2.54 | | | | 5-10-2019 | | | | 2,500,000 | | | | 2,500,000 | |
KBC Bank | | | 2.20 | | | | 9-12-2018 | | | | 5,000,000 | | | | 5,000,000 | |
Mitsubishi Trust & Bank (1 Month LIBOR +0.23%) ± | | | 2.30 | | | | 1-17-2019 | | | | 5,000,000 | | | | 5,000,000 | |
Mitsubishi Trust & Bank (1 Month LIBOR +0.30%) ± | | | 2.37 | | | | 1-14-2019 | | | | 2,000,000 | | | | 2,000,000 | |
Mizuho Bank Limited (1 Month LIBOR +0.25%) ± | | | 2.32 | | | | 11-26-2018 | | | | 5,000,000 | | | | 5,000,000 | |
National Bank of Kuwait | | | 1.91 | | | | 8-1-2018 | | | | 15,675,000 | | | | 15,675,000 | |
Natixis (1 Month LIBOR +0.25%) ± | | | 2.35 | | | | 12-10-2018 | | | | 3,000,000 | | | | 3,000,000 | |
Natixis (1 Month LIBOR +0.44%) ± | | | 2.51 | | | | 9-17-2018 | | | | 3,000,000 | | | | 3,000,000 | |
Norinchukin Bank (1 Month LIBOR +0.30%) ± | | | 2.39 | | | | 9-10-2018 | | | | 3,000,000 | | | | 3,000,000 | |
Oversea-Chinese Banking Corporation (1 Month LIBOR +0.30%) ± | | | 2.39 | | | | 9-6-2018 | | | | 2,000,000 | | | | 2,000,000 | |
Sumitomo Mitsui Banking Corporation (1 Month LIBOR +0.25%) ± | | | 2.35 | | | | 9-7-2018 | | | | 4,000,000 | | | | 4,000,000 | |
Sumitomo Mitsui Trust NY (3 Month LIBOR +0.05%) ± | | | 2.37 | | | | 12-4-2018 | | | | 5,000,000 | | | | 5,000,000 | |
Sumitomo Mitsui Trust NY (1 Month LIBOR +0.43%) ± | | | 2.51 | | | | 10-11-2018 | | | | 4,000,000 | | | | 4,000,000 | |
Svenska Handelsbanken (1 Month LIBOR +0.16%) ± | | | 2.25 | | | | 9-6-2018 | | | | 2,000,000 | | | | 2,000,000 | |
Toronto Dominion Bank (1 Month LIBOR +0.20%) ± | | | 2.29 | | | | 8-10-2018 | | | | 2,000,000 | | | | 2,000,000 | |
Toronto Dominion Bank (1 Month LIBOR +0.23%) ± | | | 2.32 | | | | 12-6-2018 | | | | 2,000,000 | | | | 2,000,000 | |
| | | | |
Total Certificates of Deposit (Cost $122,172,603) | | | | | | | | | | | | | | | 122,172,603 | |
| | | | | | | | | | | | | | | | |
| | | | |
Commercial Paper: 49.27% | | | | | | | | | | | | | | | | |
| | | | |
| Asset-Backed Commercial Paper: 20.78% | | | | | | | | | | | | | | | | |
Albion Capital Corporation (z) | | | 2.13 | | | | 8-20-2018 | | | | 1,000,000 | | | | 998,876 | |
Alpine Securitization Limited (1 Month LIBOR +0.33%) 144A± | | | 2.42 | | | | 9-6-2018 | | | | 8,000,000 | | | | 8,000,000 | |
Anglesea Funding LLC (1 Month LIBOR +0.23%) 144A± | | | 2.32 | | | | 12-28-2018 | | | | 7,000,000 | | | | 7,000,000 | |
Anglesea Funding LLC (1 Month LIBOR +0.27%) 144A± | | | 2.34 | | | | 10-23-2018 | | | | 3,000,000 | | | | 3,000,000 | |
Antalis SA 144A(z) | | | 2.10 | | | | 8-13-2018 | | | | 2,000,000 | | | | 1,998,600 | |
Antalis SA 144A(z) | | | 2.21 | | | | 8-20-2018 | | | | 2,000,000 | | | | 1,997,678 | |
Antalis SA 144A(z) | | | 2.36 | | | | 8-9-2018 | | | | 3,000,000 | | | | 2,998,433 | |
Atlantic Asset Securitization Corporation (1 Month LIBOR +0.32%) 144A± | | | 2.41 | | | | 11-1-2018 | | | | 4,000,000 | | | | 4,000,000 | |
Bennington Stark Capital Company 144A(z) | | | 2.33 | | | | 8-22-2018 | | | | 2,000,000 | | | | 1,997,293 | |
Cedar Spring Capital Company 144A(z) | | | 2.15 | | | | 8-3-2018 | | | | 3,000,000 | | | | 2,999,642 | |
Cedar Spring Capital Company 144A(z) | | | 2.16 | | | | 9-12-2018 | | | | 4,000,000 | | | | 3,989,967 | |
Cedar Spring Capital Company 144A(z) | | | 2.39 | | | | 9-7-2018 | | | | 2,000,000 | | | | 1,995,108 | |
Chesham Finance Limited 144A(z) | | | 2.00 | | | | 8-1-2018 | | | | 12,000,000 | | | | 12,000,000 | |
Collateralized Commercial Paper II Company LLC (3 Month LIBOR +0.22%) 144A± | | | 2.56 | | | | 1-2-2019 | | | | 3,000,000 | | | | 2,999,991 | |
Concord Minutemen Capital Company LLC 144A(z) | | | 2.38 | | | | 10-29-2018 | | | | 2,000,000 | | | | 1,988,282 | |
Crown Point Capital Company LLC (1 Month LIBOR +0.37%) 144A± | | | 2.45 | | | | 9-19-2018 | | | | 7,000,000 | | | | 7,000,000 | |
Gotham Funding Corporation 144A(z) | | | 2.12 | | | | 8-10-2018 | | | | 1,000,000 | | | | 999,470 | |
Great Bridge Capital Company LLC 144A(z) | | | 2.41 | | | | 9-18-2018 | | | | 1,000,000 | | | | 996,800 | |
Institutional Secured Funding LLC 144A(z) | | | 2.04 | | | | 8-1-2018 | | | | 8,000,000 | | | | 8,000,000 | |
The accompanying notes are an integral part of these financial statements.
| | | | |
| 10 | | Wells Fargo Money Market Fund | | Portfolio of investments—July 31, 2018 (unaudited) |
| | | | | | | | | | | | | | | | |
| Security name | | Interest rate | | | Maturity date | | | Principal | | | Value | |
| | | | |
| Asset-Backed Commercial Paper (continued) | | | | | | | | | | | | | | | | |
Institutional Secured Funding LLC 144A(z) | | | 2.10 | % | | | 8-2-2018 | | | $ | 5,000,000 | | | $ | 4,999,708 | |
Kells Funding LLC 144A(z) | | | 2.25 | | | | 10-9-2018 | | | | 1,000,000 | | | | 995,707 | |
Legacy Capital Company 144A(z) | | | 2.18 | | | | 9-17-2018 | | | | 3,828,000 | | | | 3,817,155 | |
Lexington Parker Capital 144A(z) | | | 2.16 | | | | 9-7-2018 | | | | 3,000,000 | | | | 2,993,371 | |
Manhattan Asset Funding Company LLC 144A(z) | | | 2.12 | | | | 8-7-2018 | | | | 3,000,000 | | | | 2,998,940 | |
Matchpoint Finance plc 144A(z) | | | 1.95 | | | | 8-1-2018 | | | | 7,000,000 | | | | 7,000,000 | |
Mountcliff Funding LLC 144A(z) | | | 2.00 | | | | 8-1-2018 | | | | 7,000,000 | | | | 7,000,000 | |
Mountcliff Funding LLC (1 Month LIBOR +0.25%) 144A± | | | 2.33 | | | | 2-28-2019 | | | | 3,000,000 | | | | 3,000,000 | |
Nieuw Amsterdam Receivables 144A(z) | | | 2.18 | | | | 9-24-2018 | | | | 2,000,000 | | | | 1,993,490 | |
Old Line Funding LLC (1 Month LIBOR +0.45%) 144A± | | | 2.52 | | | | 9-24-2018 | | | | 4,000,000 | | | | 4,000,000 | |
White Plains Capital 144A(z) | | | 2.36 | | | | 9-5-2018 | | | | 5,000,000 | | | | 4,988,576 | |
White Plains Capital 144A(z) | | | 2.54 | | | | 10-10-2018 | | | | 1,000,000 | | | | 995,100 | |
| | | | |
| | | | | | | | | | | | | | | 119,742,187 | |
| | | | | | | | | | | | | | | | |
| | | | |
| Financial Company Commercial Paper: 21.03% | | | | | | | | | | | | | | | | |
Australia & New Zealand Banking Group (1 Month LIBOR +0.17%) 144A± | | | 2.24 | | | | 8-14-2018 | | | | 2,000,000 | | | | 2,000,000 | |
Banco Santander Chile 144A(z) | | | 2.41 | | | | 9-20-2018 | | | | 3,000,000 | | | | 2,990,000 | |
Bank Nederlandse Gemeenten 144A(z) | | | 2.06 | | | | 8-10-2018 | | | | 5,000,000 | | | | 4,997,425 | |
Bank of Nova Scotia (3 Month LIBOR +0.21%) 144A± | | | 2.54 | | | | 12-21-2018 | | | | 3,000,000 | | | | 3,000,000 | |
Commonwealth Bank of Australia (3 Month LIBOR +0.10%) 144A± | | | 2.46 | | | | 5-3-2019 | | | | 4,000,000 | | | | 4,000,000 | |
DBS Bank Limited 144A(z) | | | 2.27 | | | | 10-19-2018 | | | | 3,000,000 | | | | 2,985,122 | |
Federation Des Caisses 144A(z) | | | 2.08 | | | | 8-1-2018 | | | | 4,200,000 | | | | 4,200,000 | |
Federation Des Caisses (1 Month LIBOR +0.26%) 144A± | | | 2.34 | | | | 2-11-2019 | | | | 3,000,000 | | | | 3,000,000 | |
Federation Des Caisses (1 Month LIBOR +0.30%) 144A± | | | 2.36 | | | | 6-25-2019 | | | | 2,000,000 | | | | 2,000,000 | |
Federation Des Caisses (3 Month LIBOR +0.13%) 144A± | | | 2.46 | | | | 5-22-2019 | | | | 1,000,000 | | | | 1,000,000 | |
HSBC Bank plc (1 Month LIBOR +0.42%) 144A± | | | 2.52 | | | | 5-7-2019 | | | | 2,000,000 | | | | 2,000,000 | |
ING Funding LLC (3 Month LIBOR +0.16%) ± | | | 2.50 | | | | 1-7-2019 | | | | 4,000,000 | | | | 4,000,000 | |
ING Funding LLC (1 Month LIBOR +0.25%) ± | | | 2.33 | | | | 2-11-2019 | | | | 2,000,000 | | | | 2,000,019 | |
Intercontinental Exchange 144A(z) | | | 1.95 | | | | 8-1-2018 | | | | 12,000,000 | | | | 12,000,000 | |
Intercontinental Exchange 144A(z) | | | 1.95 | | | | 8-3-2018 | | | | 3,000,000 | | | | 2,999,675 | |
Massachusetts Mutual Life Insurance Company 144A(z) | | | 2.00 | | | | 8-9-2018 | | | | 10,000,000 | | | | 9,995,556 | |
National Australia Bank Limited (1 Month LIBOR +0.16%) 144A± | | | 2.25 | | | | 8-1-2018 | | | | 1,000,000 | | | | 1,000,000 | |
National Australia Bank Limited (1 Month LIBOR +0.18%) 144A± | | | 2.25 | | | | 9-13-2018 | | | | 4,000,000 | | | | 4,000,000 | |
National Securities Clearing Corporation 144A(z) | | | 1.90 | | | | 8-1-2018 | | | | 4,000,000 | | | | 4,000,000 | |
Nederlandse Waterschapsbank NV 144A(z) | | | 2.06 | | | | 8-13-2018 | | | | 5,000,000 | | | | 4,996,567 | |
Nederlandse Waterschapsbank NV 144A(z) | | | 2.06 | | | | 8-14-2018 | | | | 4,000,000 | | | | 3,997,024 | |
NRW Bank 144A(z) | | | 2.00 | | | | 8-7-2018 | | | | 5,000,000 | | | | 4,998,333 | |
Oversea-Chinese Banking Corporation 144A(z) | | | 2.13 | | | | 9-17-2018 | | | | 2,000,000 | | | | 1,994,464 | |
Oversea-Chinese Banking Corporation (1 Month LIBOR +0.25%) 144A± | | | 2.33 | | | | 1-11-2019 | | | | 2,000,000 | | | | 2,000,000 | |
Oversea-Chinese Banking Corporation (1 Month LIBOR +0.25%) 144A± | | | 2.34 | | | | 1-10-2019 | | | | 2,000,000 | | | | 1,999,929 | |
Oversea-Chinese Banking Corporation (3 Month LIBOR +0.14%) 144A± | | | 2.50 | | | | 5-10-2019 | | | | 2,000,000 | | | | 2,000,000 | |
Quebec Province 144A(z) | | | 1.98 | | | | 8-13-2018 | | | | 5,000,000 | | | | 4,996,700 | |
Sumitomo Mitsui Trust 144A(z) | | | 2.30 | | | | 10-15-2018 | | | | 2,000,000 | | | | 1,990,458 | |
Toronto Dominion Bank (1 Month LIBOR +0.30%) 144A± | | | 2.39 | | | | 12-3-2018 | | | | 4,000,000 | | | | 4,000,000 | |
Toronto Dominion Bank (3 Month LIBOR +0.14%) 144A± | | | 2.50 | | | | 5-2-2019 | | | | 3,000,000 | | | | 3,000,000 | |
UBS AG London (1 Month LIBOR +0.24%) 144A± | | | 2.34 | | | | 8-7-2018 | | | | 4,000,000 | | | | 4,000,000 | |
UBS AG London (3 Month LIBOR +0.19%) 144A± | | | 2.52 | | | | 12-10-2018 | | | | 3,000,000 | | | | 3,000,000 | |
Westpac Banking Corporation (1 Month LIBOR +0.18%) 144A± | | | 2.25 | | | | 8-16-2018 | | | | 1,000,000 | | | | 1,000,000 | |
Westpac Banking Corporation (3 Month LIBOR +0.10%) 144A± | | | 2.41 | | | | 5-31-2019 | | | | 5,000,000 | | | | 5,000,000 | |
| | | | |
| | | | | | | | | | | | | | | 121,141,272 | |
| | | | | | | | | | | | | | | | |
The accompanying notes are an integral part of these financial statements.
| | | | | | |
| Portfolio of investments—July 31, 2018 (unaudited) | | Wells Fargo Money Market Fund | | | 11 | |
| | | | | | | | | | | | | | | | |
| Security name | | Interest rate | | | Maturity date | | | Principal | | | Value | |
| | | | |
| Other Commercial Paper: 7.46% | | | | | | | | | | | | | | | | |
China International Marine Containers Company Limited (z) | | | 2.35 | % | | | 8-13-2018 | | | $ | 1,000,000 | | | $ | 999,217 | |
CNPC Finance Limited 144A(z) | | | 2.38 | | | | 8-2-2018 | | | | 3,000,000 | | | | 2,999,802 | |
Glaxosmithkline LLC 144A(z) | | | 2.04 | | | | 8-13-2018 | | | | 10,000,000 | | | | 9,993,200 | |
Komatsu Finance America Incorporated 144A(z) | | | 2.00 | | | | 8-3-2018 | | | | 12,000,000 | | | | 11,998,665 | |
Omers Finance Trust 144A(z) | | | 2.06 | | | | 8-24-2018 | | | | 5,000,000 | | | | 4,993,419 | |
Salt River Project Agricultura (z) | | | 2.21 | | | | 9-17-2018 | | | | 2,000,000 | | | | 1,994,256 | |
Salt River Project Agricultura (z) | | | 2.21 | | | | 9-18-2018 | | | | 2,000,000 | | | | 1,994,133 | |
Toyota Credit Canada Incorporated (1 Month LIBOR +0.42%) ± | | | 2.50 | | | | 10-15-2018 | | | | 3,000,000 | | | | 3,000,000 | |
Toyota Finance Australia Limited (3 Month LIBOR +0.08%) ± | | | 2.41 | | | | 2-15-2019 | | | | 3,000,000 | | | | 3,000,000 | |
Toyota Finance Australia Limited (3 Month LIBOR +0.09%) ± | | | 2.43 | | | | 3-22-2019 | | | | 2,000,000 | | | | 2,000,000 | |
| | | | |
| | | | | | | | | | | | | | | 42,972,692 | |
| | | | | | | | | | | | | | | | |
| | | | |
Total Commercial Paper (Cost $283,856,151) | | | | | | | | | | | | | | | 283,856,151 | |
| | | | | | | | | | | | | | | | |
| | | | |
Municipal Obligations: 14.12% | | | | | | | | | | | | | | | | |
| | | | |
California: 0.17% | | | | | | | | | | | | | | | | |
| | | | |
| Other Municipal Debt: 0.17% | | | | | | | | | | | | | | | | |
Orange County CA Water District (Water Utilities) | | | 2.12 | | | | 8-6-2018 | | | | 1,000,000 | | | | 1,000,000 | |
| | | | | | | | | | | | | | | | |
| | | | |
Colorado: 1.55% | | | | | | | | | | | | | | | | |
| | | | |
| Variable Rate Demand Notes ø: 1.55% | | | | | | | | | | | | | | | | |
Colorado HFA MFHR Class II Series B (Housing Revenue, FHLB SPA) | | | 2.02 | | | | 5-1-2052 | | | | 3,925,000 | | | | 3,925,000 | |
Colorado Tender Option Bond Trust Receipts/Certificates Series 2017-TPG007 (Health Revenue, Bank of America NA LIQ) 144A | | | 2.57 | | | | 10-29-2027 | | | | 5,000,000 | | | | 5,000,000 | |
| | | | |
| | | | | | | | | | | | | | | 8,925,000 | |
| | | | | | | | | | | | | | | | |
| | | | |
Florida: 0.35% | | | | | | | | | | | | | | | | |
| | | | |
| Other Municipal Debt: 0.35% | | | | | | | | | | | | | | | | |
Hillsborough County FL (Miscellaneous Revenue) | | | 2.32 | | | | 8-23-2018 | | | | 2,000,000 | | | | 2,000,000 | |
| | | | | | | | | | | | | | | | |
| | | | |
Georgia: 2.21% | | | | | | | | | | | | | | | | |
| | | | |
| Other Municipal Debt: 0.52% | | | | | | | | | | | | | | | | |
Municipal Electric Authority of Georgia (Utilities Revenue) | | | 2.10 | | | | 8-2-2018 | | | | 3,000,000 | | | | 3,000,000 | |
| | | | | | | | | | | | | | | | |
| | | | |
| Variable Rate Demand Notes ø: 1.69% | | | | | | | | | | | | | | | | |
Columbus GA Housing Development Authority Puttable Floating Option Taxable Notes Series TN-024 (Housing Revenue, ACA Insured, Bank of America NA LIQ) 144A | | | 2.06 | | | | 10-1-2039 | | | | 4,715,000 | | | | 4,715,000 | |
Macon-Bibb County GA Industrial Authority Development Kumho Tire Georgia Incorporated Series A (Industrial Development Revenue, Korea Development Bank LOC) | | | 2.22 | | | | 12-1-2022 | | | | 5,000,000 | | | | 5,000,000 | |
| | | | |
| | | | | | | | | | | | | | | 9,715,000 | |
| | | | | | | | | | | | | | | | |
| | | | |
Illinois: 0.17% | | | | | | | | | | | | | | | | |
| | | | |
| Variable Rate Demand Note ø: 0.17% | | | | | | | | | | | | | | | | |
Tender Option Bond Trust Receipts (Miscellaneous Revenue, Bank of America NA LIQ) 144A | | | 2.57 | | | | 4-1-2048 | | | | 1,000,000 | | | | 1,000,000 | |
| | | | | | | | | | | | | | | | |
The accompanying notes are an integral part of these financial statements.
| | | | |
| 12 | | Wells Fargo Money Market Fund | | Portfolio of investments—July 31, 2018 (unaudited) |
| | | | | | | | | | | | | | | | |
| Security name | | Interest rate | | | Maturity date | | | Principal | | | Value | |
| | | | |
Massachusetts: 0.69% | | | | | | | | | | | | | | | | |
| | | | |
| Other Municipal Debt: 0.69% | | | | | | | | | | | | | | | | |
Massachusetts Educational Financing Authority (Education Revenue) | | | 2.17 | % | | | 8-30-2018 | | | $ | 4,000,000 | | | $ | 4,000,000 | |
| | | | | | | | | | | | | | | | |
| | | | |
New York: 2.95% | | | | | | | | | | | | | | | | |
| | | | |
| Other Municipal Debt: 0.52% | | | | | | | | | | | | | | | | |
Long Island Power Authority (Utilities Revenue) | | | 2.23 | | | | 9-19-2018 | | | | 3,000,000 | | | | 3,000,000 | |
| | | | | | | | | | | | | | | | |
| | | | |
| Variable Rate Demand Notes ø: 2.43% | | | | | | | | | | | | | | | | |
New York HFA Manhattan West Residential Housing Project Series B-2 (Housing Revenue, Bank of China LOC) | | | 2.23 | | | | 11-1-2049 | | | | 10,000,000 | | | | 10,000,000 | |
RBC Municipal Products Incorporated Trust Series E-51 Invesco Van Kampen New York Value Income Trust (Miscellaneous Revenue, Royal Bank of Canada LOC) 144A | | | 2.43 | | | | 12-1-2019 | | | | 4,000,000 | | | | 4,000,000 | |
| | | | |
| | | | | | | | | | | | | | | 14,000,000 | |
| | | | | | | | | | | | | | | | |
| | | | |
Oregon: 1.65% | | | | | | | | | | | | | | | | |
| | | | |
| Other Municipal Debt: 0.78% | | | | | | | | | | | | | | | | |
Port of Portland OR (Transportation Revenue) | | | 2.20 | | | | 8-9-2018 | | | | 4,500,000 | | | | 4,500,000 | |
| | | | | | | | | | | | | | | | |
| | | | |
| Variable Rate Demand Note ø: 0.87% | | | | | | | | | | | | | | | | |
Tender Option Bond Trust Receipts/Certificates Series ZF2515 (Miscellaneous Revenue, Bank of America NA LIQ) 144A | | | 2.03 | | | | 5-1-2035 | | | | 5,000,000 | | | | 5,000,000 | |
| | | | | | | | | | | | | | | | |
| | | | |
Other: 2.64% | | | | | | | | | | | | | | | | |
| | | | |
| Variable Rate Demand Notes ø: 2.64% | | | | | | | | | | | | | | | | |
Jets Stadium Development Bonds Series A-4B (Miscellaneous Revenue, Sumitomo Mitsui Banking Corporation LOC) 144A | | | 2.08 | | | | 4-1-2047 | | | | 6,970,000 | | | | 6,970,000 | |
SSAB AB Series A (Miscellaneous Revenue, DNB Banking ASA LOC) | | | 2.03 | | | | 6-1-2035 | | | | 1,000,000 | | | | 1,000,000 | |
Steadfast Crestvilla LLC Series A (Health Revenue, American AgCredit LOC) | | | 2.08 | | | | 2-1-2056 | | | | 4,240,000 | | | | 4,240,000 | |
Steadfast Crestvilla LLC Series B (Health Revenue, U.S. Bank NA LOC) | | | 2.08 | | | | 2-1-2056 | | | | 3,000,000 | | | | 3,000,000 | |
| | | | |
| | | | | | | | | | | | | | | 15,210,000 | |
| | | | | | | | | | | | | | | | |
| | | | |
Pennsylvania: 0.35% | | | | | | | | | | | | | | | | |
| | | | |
| Variable Rate Demand Note ø: 0.35% | | | | | | | | | | | | | | | | |
RBC Municipal Products Incorporated Trust Series E-52 Invesco Van Kampen Trust (Miscellaneous Revenue, Royal Bank of Canada LOC) 144A | | | 2.43 | | | | 12-1-2019 | | | | 2,000,000 | | | | 2,000,000 | |
| | | | | | | | | | | | | | | | |
| | | | |
Tennessee: 0.87% | | | | | | | | | | | | | | | | |
| | | | |
| Variable Rate Demand Note ø: 0.87% | | | | | | | | | | | | | | | | |
Montgomery County TN Industrial Development Board Hankook Tire Manufacturing Project Series A (Industrial Development Revenue, Kookmin Bank LOC) | | | 2.22 | | | | 12-1-2024 | | | | 5,000,000 | | | | 5,000,000 | |
| | | | | | | | | | | | | | | | |
| | | | |
Texas: 0.52% | | | | | | | | | | | | | | | | |
| | | | |
| Other Municipal Debt: 0.52% | | | | | | | | | | | | | | | | |
Texas Public Finance Authority (Miscellaneous Revenue) | | | 2.11 | | | | 8-8-2018 | | | | 3,000,000 | | | | 3,000,000 | |
| | | | | | | | | | | | | | | | |
| | | | |
Total Municipal Obligations (Cost $81,350,000) | | | | | | | | | | | | | | | 81,350,000 | |
| | | | | | | | | | | | | | | | |
The accompanying notes are an integral part of these financial statements.
| | | | | | |
| Portfolio of investments—July 31, 2018 (unaudited) | | Wells Fargo Money Market Fund | | | 13 | |
| | | | | | | | | | | | | | | | |
| Security name | | Interest rate | | | Maturity date | | | Principal | | | Value | |
| | | | |
Other Notes: 2.60% | | | | | | | | | | | | | | | | |
| | | | |
| Corporate Bonds and Notes: 2.60% | | | | | | | | | | | | | | | | |
Cellmark Incorporated Secured øø§ | | | 2.03 | % | | | 6-1-2038 | | | $ | 4,000,000 | | | $ | 4,000,000 | |
Invesco Dynamic Credit Opportunities Fund Series W-7 øø§ | | | 2.09 | | | | 6-1-2028 | | | | 5,000,000 | | | | 5,000,000 | |
US Bancorp (3 Month LIBOR +0.49%) ± | | | 2.83 | | | | 11-15-2018 | | | | 6,000,000 | | | | 6,006,540 | |
| | | | |
Total Other Notes (Cost $15,006,540) | | | | | | | | | | | | | | | 15,006,540 | |
| | | | | | | | | | | | | | | | |
| | | | |
Repurchase Agreements ^^: 13.36% | | | | | | | | | | | | | | | | |
Bank of America Corporation, dated 7-31-2018, maturity value $48,002,573 (1) | | | 1.93 | | | | 8-1-2018 | | | | 48,000,000 | | | | 48,000,000 | |
GX Clarke & Company, dated 7-31-2018, maturity value $29,001,563 (2) | | | 1.94 | | | | 8-1-2018 | | | | 29,000,000 | | | | 29,000,000 | |
| | | | |
Total Repurchase Agreements (Cost $77,000,000) | | | | | | | | | | | | | | | 77,000,000 | |
| | | | | | | | | | | | | | | | |
| | | | | | | | |
| Total investments in securities (Cost $579,385,294) | | | 100.56 | % | | | 579,385,294 | |
Other assets and liabilities, net | | | (0.56 | ) | | | (3,236,057 | ) |
| | | | | | | | |
| Total net assets | | | 100.00 | % | | $ | 576,149,237 | |
| | | | | | | | |
| ± | Variable rate investment. The rate shown is the rate in effect at period end. |
| (z) | Zero coupon security. The rate represents the current yield to maturity. |
| 144A | The security may be resold in transactions exempt from registration, normally to qualified institutional buyers, pursuant to Rule 144A under the Securities Act of 1933. |
| ø | Variable rate demand notes are subject to a demand feature which reduces the effective maturity. The maturity date shown represents the final maturity date of the security. The interest rate is determined and reset by the issuer daily, weekly, or monthly depending upon the terms of the security. The rate shown is the rate in effect at period end. |
| øø | The interest rate is determined and reset by the issuer periodically depending upon the terms of the security. The rate shown is the rate in effect at period end. |
| § | The security is subject to a demand feature which reduces the effective maturity. |
| | (1) | U.S. government securities, 3.00% to 4.00%, 4-20-2043 to 9-20-2045, fair value including accrued interest is $49,440,000. |
| | (2) | U.S. government securities, 2.00% to 10.00%, 8-15-2018 to 2-1-2057, fair value including accrued interest is $29,870,000. |
Abbreviations:
| ACA | ACA Financial Guaranty Corporation |
| FHLB | Federal Home Loan Bank |
| HFA | Housing Finance Authority |
| LIBOR | London Interbank Offered Rate |
| MFHR | Multifamily housing revenue |
| National | National Public Finance Guarantee Corporation |
| SPA | Standby purchase agreement |
The accompanying notes are an integral part of these financial statements.
| | | | |
| 14 | | Wells Fargo Money Market Fund | | Statement of assets and liabilities—July 31, 2018 (unaudited) |
| | | | |
| | | | |
| |
Assets | | | | |
Investments in unaffiliated securities, at amortized cost | | $ | 502,385,294 | |
Investments in repurchase agreements, at amortized cost | | | 77,000,000 | |
Cash | | | 33,176 | |
Receivable for Fund shares sold | | | 2,734,939 | |
Receivable for interest | | | 601,392 | |
Prepaid expenses and other assets | | | 225,312 | |
| | | | |
Total assets | | | 582,980,113 | |
| | | | |
| |
Liabilities | | | | |
Payable for investments purchased | | | 6,043,363 | |
Payable for Fund shares redeemed | | | 435,628 | |
Administration fees payable | | | 92,434 | |
Management fee payable | | | 31,570 | |
Dividends payable | | | 10,808 | |
Distribution fee payable | | | 3,960 | |
Accrued expenses and other liabilities | | | 213,113 | |
| | | | |
Total liabilities | | | 6,830,876 | |
| | | | |
Total net assets | | $ | 576,149,237 | |
| | | | |
| |
NET ASSETS CONSIST OF | | | | |
Paid-in capital | | $ | 576,878,513 | |
Overdistributed net investment income | | | (355,511 | ) |
Accumulated net realized losses on investments | | | (373,765 | ) |
| | | | |
Total net assets | | $ | 576,149,237 | |
| | | | |
| |
COMPUTATION OF NET ASSET VALUE PER SHARE | | | | |
Net assets – Class A | | $ | 468,357,700 | |
Shares outstanding – Class A1 | | | 468,088,537 | |
Net asset value per share – Class A | | | $1.00 | |
Net assets – Class C | | $ | 5,924,746 | |
Shares outstanding – Class C1 | | | 5,921,267 | |
Net asset value per share – Class C | | | $1.00 | |
Net assets – Premier Class | | $ | 90,006,630 | |
Shares outstanding – Premier Class1 | | | 89,955,291 | |
Net asset value per share – Premier Class | | | $1.00 | |
Net assets – Service Class | | $ | 11,860,161 | |
Shares outstanding – Service Class1 | | | 11,853,332 | |
Net asset value per share – Service Class | | | $1.00 | |
| 1 | The Fund has an unlimited number of authorized shares. |
The accompanying notes are an integral part of these financial statements.
| | | | | | |
| Statement of operations—six months ended July 31, 2018 (unaudited) | | Wells Fargo Money Market Fund | | | 15 | |
| | | | |
| | | | |
| |
Investment income | | | | |
Interest | | $ | 4,931,065 | |
| | | | |
| |
Expenses | | | | |
Management fee | | | 734,407 | |
Administration fees | | | | |
Class A | | | 509,172 | |
Class C | | | 7,712 | |
Premier Class | | | 4,775 | |
Service Class | | | 7,112 | |
Shareholder servicing fees | | | | |
Class A | | | 578,605 | |
Class C | | | 8,763 | |
Service Class | | | 14,817 | |
Distribution fee | | | | |
Class C | | | 26,289 | |
Custody and accounting fees | | | 12,992 | |
Professional fees | | | 25,230 | |
Registration fees | | | 46,230 | |
Shareholder report expenses | | | 272 | |
Trustees’ fees and expenses | | | 9,184 | |
Other fees and expenses | | | 12,824 | |
| | | | |
Total expenses | | | 1,998,384 | |
Less: Fee waivers and/or expense reimbursements | | | (442,830 | ) |
| | | | |
Net expenses | | | 1,555,554 | |
| | | | |
Net investment income | | | 3,375,511 | |
| | | | |
Net realized gains on investments | | | 1,873 | |
| | | | |
Net increase in net assets resulting from operations | | $ | 3,377,384 | |
| | | | |
The accompanying notes are an integral part of these financial statements.
| | | | |
| 16 | | Wells Fargo Money Market Fund | | Statement of changes in net assets |
| | | | | | | | | | | | | | | | |
| | | Six months ended
July 31, 2018 (unaudited) | | | Year ended
January 31, 2018 | |
| | | | |
Operations | | | | | | | | | | | | | | | | |
Net investment income | | | | | | $ | 3,375,511 | | | | | | | $ | 3,274,201 | |
Net realized gains on investments | | | | | | | 1,873 | | | | | | | | 33,646 | |
| | | | |
Net increase in net assets resulting from operations | | | | | | | 3,377,384 | | | | | | | | 3,307,847 | |
| | | | |
| | | | |
Distributions to shareholders from | | | | | | | | | | | | | | | | |
Net investment income | | | | | | | | | | | | | | | | |
Class A | | | | | | | (3,149,695 | ) | | | | | | | (3,150,526 | ) |
Class B | | | | | | | N/A | | | | | | | | (4 | )1 |
Class C | | | | | | | (20,667 | ) | | | | | | | (3,401 | ) |
Premier Class | | | | | | | (117,140 | ) | | | | | | | (1,098 | ) |
Service Class | | | | | | | (88,009 | ) | | | | | | | (119,172 | ) |
| | | | |
Total distributions to shareholders | | | | | | | (3,375,511 | ) | | | | | | | (3,274,201 | ) |
| | | | |
| | | | |
Capital share transactions | | | Shares | | | | | | | | Shares | | | | | |
Proceeds from shares sold | | | | | | | | | | | | | | | | |
Class A | | | 87,761,587 | | | | 87,761,587 | | | | 106,393,075 | | | | 106,393,075 | |
Class C | | | 1,608,012 | | | | 1,608,012 | | | | 3,338,043 | | | | 3,338,043 | |
Premier Class | | | 107,183,963 | | | | 107,183,963 | | | | 6,501 | | | | 6,501 | |
Service Class | | | 1,473,724 | | | | 1,473,724 | | | | 4,295,757 | | | | 4,295,757 | |
| | | | |
| | | | | | | 198,027,286 | | | | | | | | 114,033,376 | |
| | | | |
Reinvestment of distributions | | | | | | | | | | | | | | | | |
Class A | | | 3,112,281 | | | | 3,112,281 | | | | 3,062,652 | | | | 3,062,652 | |
Class B | | | N/A | | | | N/A | | | | 4 | 1 | | | 4 | 1 |
Class C | | | 20,426 | | | | 20,426 | | | | 3,322 | | | | 3,322 | |
Premier Class | | | 116,212 | | | | 116,212 | | | | 564 | | | | 564 | |
Service Class | | | 84,869 | | | | 84,869 | | | | 110,385 | | | | 110,385 | |
| | | | |
| | | | | | | 3,333,788 | | | | | | | | 3,176,927 | |
| | | | |
Payment for shares redeemed | | | | | | | | | | | | | | | | |
Class A | | | (84,885,965 | ) | | | (84,885,965 | ) | | | (187,066,557 | ) | | | (187,066,557 | ) |
Class B | | | N/A | | | | N/A | | | | (195,599 | )1 | | | (195,599 | )1 |
Class C | | | (3,464,462 | ) | | | (3,464,462 | ) | | | (8,870,153 | ) | | | (8,870,153 | ) |
Premier Class | | | (17,445,801 | ) | | | (17,445,801 | ) | | | (6,507 | ) | | | (6,507 | ) |
Service Class | | | (1,607,258 | ) | | | (1,607,258 | ) | | | (14,094,565 | ) | | | (14,094,565 | ) |
| | | | |
| | | | | | | (107,403,486 | ) | | | | | | | (210,233,381 | ) |
| | | | |
Net increase (decrease) in net assets resulting from capital share transactions | | | | | | | 93,957,588 | | | | | | | | (93,023,078 | ) |
| | | | |
Total increase (decrease) in net assets | | | | | | | 93,959,461 | | | | | | | | (92,989,432 | ) |
| | | | |
| | | | |
Net assets | | | | | | | | | | | | | | | | |
Beginning of period | | | | | | | 482,189,776 | | | | | | | | 575,179,208 | |
| | | | |
End of period | | | | | | $ | 576,149,237 | | | | | | | $ | 482,189,776 | |
| | | | |
Overdistributed net investment income | | | | | | $ | (355,511 | ) | | | | | | $ | (355,511 | ) |
| | | | |
| 1 | For the period from February 1, 2017 to July 5, 2017. Effective at the close of business on July 5, 2017, Class B shares were converted to Class A shares and are no longer offered by the Fund. |
The accompanying notes are an integral part of these financial statements.
| | | | | | |
| Financial highlights | | Wells Fargo Money Market Fund | | | 17 | |
(For a share outstanding throughout each period)
| | | | | | | | | | | | | | | | | | | | | | | | |
| | | Six months ended
July 31, 2018 (unaudited) | | | Year ended January 31 | |
| CLASS A | | 2018 | | | 2017 | | | 2016 | | | 2015 | | | 2014 | |
Net asset value, beginning of period | | | $1.00 | | | | $1.00 | | | | $1.00 | | | | $1.00 | | | | $1.00 | | | | $1.00 | |
Net investment income | | | 0.01 | | | | 0.01 | | | | 0.00 | 1 | | | 0.00 | 1 | | | 0.00 | 1 | | | 0.00 | 1 |
Net realized gains on investments | | | 0.00 | 1 | | | 0.00 | 1 | | | 0.00 | 1 | | | 0.00 | 1 | | | 0.00 | 1 | | | 0.00 | 1 |
| | | | | | | | | | | | | | | | | | | | | | | | |
Total from investment operations | | | 0.01 | | | | 0.01 | | | | 0.00 | 1 | | | 0.00 | 1 | | | 0.00 | 1 | | | 0.00 | 1 |
Distributions to shareholders from | | | | | | | | | | | | | | | | | | | | | | | | |
Net investment income | | | (0.01 | ) | | | (0.01 | ) | | | (0.00 | )1 | | | (0.00 | )1 | | | (0.00 | )1 | | | (0.00 | )1 |
Net asset value, end of period | | | $1.00 | | | | $1.00 | | | | $1.00 | | | | $1.00 | | | | $1.00 | | | | $1.00 | |
Total return2 | | | 0.68 | % | | | 0.64 | % | | | 0.05 | % | | | 0.01 | % | | | 0.01 | % | | | 0.01 | % |
Ratios to average net assets (annualized) | | | | | | | | | | | | | | | | | | | | | | | | |
Gross expenses | | | 0.81 | % | | | 0.85 | % | | | 0.83 | % | | | 0.82 | % | | | 0.83 | % | | | 0.82 | % |
Net expenses | | | 0.63 | % | | | 0.65 | % | | | 0.55 | % | | | 0.29 | % | | | 0.19 | % | | | 0.22 | % |
Net investment income | | | 1.36 | % | | | 0.63 | % | | | 0.03 | % | | | 0.01 | % | | | 0.01 | % | | | 0.01 | % |
Supplemental data | | | | | | | | | | | | | | | | | | | | | | | | |
Net assets, end of period (000s omitted) | | | $468,358 | | | | $462,416 | | | | $539,989 | | | | $1,205,785 | | | | $876,562 | | | | $1,468,645 | |
| 1 | Amount is less than $0.005. |
| 2 | Returns for periods of less than one year are not annualized. Total return calculations do not include any sales charges. |
The accompanying notes are an integral part of these financial statements.
| | | | |
| 18 | | Wells Fargo Money Market Fund | | Financial highlights |
(For a share outstanding throughout each period)
| | | | | | | | | | | | | | | | | | | | | | | | |
| | | Six months ended
July 31, 2018 (unaudited) | | | Year ended January 31 | |
| CLASS C | | 2018 | | | 2017 | | | 2016 | | | 2015 | | | 2014 | |
Net asset value, beginning of period | | | $1.00 | | | | $1.00 | | | | $1.00 | | | | $1.00 | | | | $1.00 | | | | $1.00 | |
Net investment income | | | 0.00 | 1 | | | 0.00 | 1 | | | 0.00 | 1 | | | 0.00 | 1 | | | 0.00 | 1 | | | 0.00 | 1 |
Net realized gains on investments | | | 0.00 | 1 | | | 0.00 | 1 | | | 0.00 | 1 | | | 0.00 | 1 | | | 0.00 | 1 | | | 0.00 | 1 |
| | | | | | | | | | | | | | | | | | | | | | | | |
Total from investment operations | | | 0.00 | 1 | | | 0.00 | 1 | | | 0.00 | 1 | | | 0.00 | 1 | | | 0.00 | 1 | | | 0.00 | 1 |
Distributions to shareholders from | | | | | | | | | | | | | | | | | | | | | | | | |
Net investment income | | | (0.00 | )1 | | | (0.00 | )1 | | | (0.00 | )1 | | | (0.00 | )1 | | | (0.00 | )1 | | | (0.00 | )1 |
Net asset value, end of period | | | $1.00 | | | | $1.00 | | | | $1.00 | | | | $1.00 | | | | $1.00 | | | | $1.00 | |
Total return2 | | | 0.30 | % | | | 0.04 | % | | | 0.01 | % | | | 0.01 | % | | | 0.01 | % | | | 0.01 | % |
Ratios to average net assets (annualized) | | | | | | | | | | | | | | | | | | | | | | | | |
Gross expenses | | | 1.57 | % | | | 1.60 | % | | | 1.58 | % | | | 1.57 | % | | | 1.58 | % | | | 1.57 | % |
Net expenses | | | 1.38 | % | | | 1.23 | % | | | 0.60 | % | | | 0.29 | % | | | 0.19 | % | | | 0.22 | % |
Net investment income | | | 0.59 | % | | | 0.03 | % | | | 0.01 | % | | | 0.01 | % | | | 0.01 | % | | | 0.01 | % |
Supplemental data | | | | | | | | | | | | | | | | | | | | | | | | |
Net assets, end of period (000s omitted) | | | $5,925 | | | | $7,763 | | | | $13,293 | | | | $16,617 | | | | $13,628 | | | | $16,270 | |
| 1 | Amount is less than $0.005. |
| 2 | Returns for periods of less than one year are not annualized. Total return calculations do not include any sales charges. |
The accompanying notes are an integral part of these financial statements.
| | | | | | |
| Financial highlights | | Wells Fargo Money Market Fund | | | 19 | |
(For a share outstanding throughout each period)
| | | | | | | | | | | | |
| | | Six months ended
July 31, 2018 (unaudited) | | | Year ended January 31 | |
| PREMIER CLASS | | 2018 | | | 20171 | |
Net asset value, beginning of period | | | $1.00 | | | | $1.00 | | | | $1.00 | |
Net investment income | | | 0.01 | | | | 0.01 | | | | 0.00 | 2 |
Net realized gains on investments | | | 0.00 | 2 | | | 0.00 | 2 | | | 0.00 | 2 |
| | | | | | | | | | | | |
Total from investment operations | | | 0.01 | | | | 0.01 | | | | 0.00 | 2 |
Distributions to shareholders from | | | | | | | | | | | | |
Net investment income | | | (0.01 | ) | | | (0.01 | ) | | | (0.00 | )2 |
Net asset value, end of period | | | $1.00 | | | | $1.00 | | | | $1.00 | |
Total return3 | | | 0.89 | % | | | 1.09 | % | | | 0.36 | % |
Ratios to average net assets (annualized) | | | | | | | | | | | | |
Gross expenses | | | 0.35 | % | | | 0.45 | % | | | 0.45 | % |
Net expenses | | | 0.20 | % | | | 0.20 | % | | | 0.20 | % |
Net investment income | | | 1.96 | % | | | 1.08 | % | | | 0.43 | % |
Supplemental data | | | | | | | | | | | | |
Net assets, end of period (000s omitted) | | | $90,007 | | | | $101 | | | | $100 | |
| 1 | For the period from March 31, 2016 (commencement of class operations) to January 31, 2017. |
| 2 | Amount is less than $0.005. |
| 3 | Returns for periods of less than one year are not annualized. |
The accompanying notes are an integral part of these financial statements.
| | | | |
| 20 | | Wells Fargo Money Market Fund | | Financial highlights |
(For a share outstanding throughout each period)
| | | | | | | | | | | | | | | | | | | | | | | | |
| | | Six months ended
July 31, 2018 (unaudited) | | | Year ended January 31 | |
| SERVICE CLASS | | 2018 | | | 2017 | | | 2016 | | | 2015 | | | 2014 | |
Net asset value, beginning of period | | | $1.00 | | | | $1.00 | | | | $1.00 | | | | $1.00 | | | | $1.00 | | | | $1.00 | |
Net investment income | | | 0.01 | | | | 0.01 | | | | 0.00 | 1 | | | 0.00 | 1 | | | 0.00 | 1 | | | 0.00 | 1 |
Net realized gains on investments | | | 0.00 | 1 | | | 0.00 | 1 | | | 0.00 | 1 | | | 0.00 | 1 | | | 0.00 | 1 | | | 0.00 | 1 |
| | | | | | | | | | | | | | | | | | | | | | | | |
Total from investment operations | | | 0.01 | | | | 0.01 | | | | 0.00 | 1 | | | 0.00 | 1 | | | 0.00 | 1 | | | 0.00 | 1 |
Distributions to shareholders from | | | | | | | | | | | | | | | | | | | | | | | | |
Net investment income | | | (0.01 | ) | | | (0.01 | ) | | | (0.00 | )1 | | | (0.00 | )1 | | | (0.00 | )1 | | | (0.00 | )1 |
Net asset value, end of period | | | $1.00 | | | | $1.00 | | | | $1.00 | | | | $1.00 | | | | $1.00 | | | | $1.00 | |
Total return2 | | | 0.74 | % | | | 0.79 | % | | | 0.11 | % | | | 0.01 | % | | | 0.01 | % | | | 0.01 | % |
Ratios to average net assets (annualized) | | | | | | | | | | | | | | | | | | | | | | | | |
Gross expenses | | | 0.71 | % | | | 0.74 | % | | | 0.72 | % | | | 0.72 | % | | | 0.73 | % | | | 0.72 | % |
Net expenses | | | 0.50 | % | | | 0.50 | % | | | 0.50 | % | | | 0.28 | % | | | 0.19 | % | | | 0.22 | % |
Net investment income | | | 1.48 | % | | | 0.74 | % | | | 0.05 | % | | | 0.01 | % | | | 0.01 | % | | | 0.01 | % |
Supplemental data | | | | | | | | | | | | | | | | | | | | | | | | |
Net assets, end of period (000s omitted) | | | $11,860 | | | | $11,910 | | | | $21,602 | | | | $274,245 | | | | $281,157 | | | | $334,659 | |
| 1 | Amount is less than $0.005. |
| 2 | Returns for periods of less than one year are not annualized. |
The accompanying notes are an integral part of these financial statements.
| | | | | | |
| Notes to financial statements (unaudited) | | Wells Fargo Money Market Fund | | | 21 | |
1. ORGANIZATION
Wells Fargo Funds Trust (the “Trust”), a Delaware statutory trust organized on March 10, 1999, is an open-end management investment company registered under the Investment Company Act of 1940, as amended (the “1940 Act”). As an investment company, the Trust follows the accounting and reporting guidance in Financial Accounting Standards Board Accounting Standards Codification Topic 946, Financial Services – Investment Companies. These financial statements report on the Wells Fargo Money Market Fund (the “Fund”) which is a diversified series of the Trust.
Effective at the close of business on July 5, 2017, Class B shares were converted to Class A shares and are no longer offered by the Fund. Information for Class B shares reflected in the financial statements represents activity through July 5, 2017.
2. SIGNIFICANT ACCOUNTING POLICIES
The following significant accounting policies, which are consistently followed in the preparation of the financial statements of the Fund, are in conformity with U.S. generally accepted accounting principles which require management to make estimates and assumptions that affect the reported amounts of assets and liabilities, disclosure of contingent assets and liabilities at the date of the financial statements, and the reported amounts of revenues and expenses during the reporting period. Actual results could differ from those estimates.
Securities valuation
As permitted under Rule 2a-7 of the 1940 Act, portfolio securities are valued at amortized cost, which approximates fair value. The amortized cost method involves valuing a security at its cost, plus accretion of discount or minus amortization of premium over the period until maturity.
Investments which are not valued using the method discussed above are valued at their fair value, as determined in good faith by the Board of Trustees of the Fund. The Board of Trustees has established a Valuation Committee comprised of the Trustees and has delegated to it the authority to take any actions regarding the valuation of portfolio securities that the Valuation Committee deems necessary or appropriate, including determining the fair value of portfolio securities, unless the determination has been delegated to the Wells Fargo Asset Management Pricing Committee at Wells Fargo Funds Management, LLC (“Funds Management”). The Board of Trustees retains the authority to make or ratify any valuation decisions or approve any changes to the Valuation Procedures as it deems appropriate. On a quarterly basis, the Board of Trustees receives reports on any valuation actions taken by the Valuation Committee or the Wells Fargo Asset Management Pricing Committee which may include items for ratification.
Valuations of fair valued securities are compared to the next actual sales price when available, or other appropriate market values, to assess the continued appropriateness of the fair valuation methodologies used. These securities are fair valued on a day-to-day basis, taking into consideration changes to appropriate market information and any significant changes to the inputs considered in the valuation process until there is a readily available price provided on an exchange or by an independent pricing service. Valuations received from an independent pricing service or independent broker-dealer quotes are periodically validated by comparisons to most recent trades and valuations provided by other independent pricing services in addition to the review of prices by the manager and/or subadvisers. Unobservable inputs used in determining fair valuations are identified based on the type of security, taking into consideration factors utilized by market participants in valuing the investment, knowledge about the issuer and the current market environment.
Repurchase agreements
The Fund may invest in repurchase agreements and may participate in pooled repurchase agreement transactions with other funds advised by Funds Management. Repurchase agreements are agreements where the seller of a security to the Fund agrees to repurchase that security from the Fund at a mutually agreed upon time and price. The repurchase agreements must be fully collateralized based on values that are marked-to-market daily. The collateral may be held by an agent bank under a tri-party agreement. It is the custodian’s responsibility to value collateral daily and to take action to obtain additional collateral as necessary to maintain a market value equal to or greater than the resale price. The repurchase agreements are collateralized by U.S. government securities. There could be potential loss to the Fund in the event that the Fund is delayed or prevented from exercising its rights to dispose of the collateral, including the risk of a possible decline in the value of the underlying obligations during the period in which the Fund seeks to assert its rights.
When-issued transactions
The Fund may purchase securities on a forward commitment or when-issued basis. The Fund records a when-issued transaction on the trade date and will segregate assets in an amount at least equal in value to the Fund’s commitment to purchase when-issued securities. Securities purchased on a when-issued basis are marked-to-market daily and the Fund begins earning interest on the settlement date. Losses may arise due to changes in the market value of the underlying securities or if the counterparty does not perform under the contract.
| | | | |
| 22 | | Wells Fargo Money Market Fund | | Notes to financial statements (unaudited) |
Security transactions and income recognition
Securities transactions are recorded on a trade date basis. Realized gains or losses are recorded on the basis of identified cost.
Interest income is accrued daily and bond discounts are accreted and premiums are amortized daily. To the extent debt obligations are placed on non-accrual status, any related interest income may be reduced by writing off interest receivables when the collection of all or a portion of interest has been determined to be doubtful based on consistently applied procedures and the fair value has decreased. If the issuer subsequently resumes interest payments or when the collectability of interest is reasonably assured, the debt obligation is removed from non-accrual status.
Distributions to shareholders
Distributions to shareholders from net investment income are declared daily and paid monthly. Distributions from net realized gains, if any, are recorded on the ex-dividend date and paid at least annually. Such distributions are determined in accordance with income tax regulations and may differ from U.S. generally accepted accounting principles. Dividend sources are estimated at the time of declaration. The tax character of distributions is determined as of the Fund’s fiscal year end. Therefore, a portion of the Fund’s distributions made prior to the Fund’s fiscal year end may be categorized as a tax return of capital at year end.
Federal and other taxes
The Fund intends to continue to qualify as a regulated investment company by distributing substantially all of its investment company taxable income and any net realized capital gains (after reduction for capital loss carryforwards) sufficient to relieve it from all, or substantially all, federal income taxes. Accordingly, no provision for federal income taxes was required.
The Fund’s income and federal excise tax returns and all financial records supporting those returns for the prior three fiscal years are subject to examination by the federal and Delaware revenue authorities. Management has analyzed the Fund’s tax positions taken on federal, state, and foreign tax returns for all open tax years and does not believe that there are any uncertain tax positions that require recognition of a tax liability.
As of July 31, 2018, the cost of investments for federal income tax purposes is substantially the same as for financial reporting purposes.
As of January 31, 2018, the Fund had capital loss carryforwards available to offset future net realized capital gains in the amount of $375,638 expiring in 2019.
Class allocations
The separate classes of shares offered by the Fund differ principally in applicable sales charges, distribution, shareholder servicing, and administration fees. Class specific expenses are charged directly to that share class. Investment income, common expenses, and realized gains (losses) on investments are allocated daily to each class of shares based on the relative proportion of net assets of each class.
3. FAIR VALUATION MEASUREMENTS
Fair value measurements of investments are determined within a framework that has established a fair value hierarchy based upon the various data inputs utilized in determining the value of the Fund’s investments. The three-level hierarchy gives the highest priority to unadjusted quoted prices in active markets for identical assets or liabilities (Level 1) and the lowest priority to unobservable inputs (Level 3). The Fund’s investments are classified within the fair value hierarchy based on the lowest level of input that is significant to the fair value measurement. The inputs are summarized into three broad levels as follows:
| ∎ | | Level 1 – quoted prices in active markets for identical securities |
| ∎ | | Level 2 – other significant observable inputs (including quoted prices for similar securities, interest rates, prepayment speeds, credit risk, etc.) |
| ∎ | | Level 3 – significant unobservable inputs (including the Fund’s own assumptions in determining the fair value of investments) |
The inputs or methodologies used for valuing investments in securities are not necessarily an indication of the risk associated with investing in those securities.
| | | | | | |
| Notes to financial statements (unaudited) | | Wells Fargo Money Market Fund | | | 23 | |
The following is a summary of the inputs used in valuing the Fund’s assets and liabilities as of July 31, 2018:
| | | | | | | | | | | | | | | | |
| | | Quoted prices
(Level 1) | | | Other significant
observable inputs
(Level 2) | | | Significant
unobservable inputs (Level 3) | | | Total | |
Assets | | | | | | | | | | | | | | | | |
Investments in: | | | | | | | | | | | | | | | | |
| | | | |
Certificates of deposit | | $ | 0 | | | $ | 122,172,603 | | | $ | 0 | | | $ | 122,172,603 | |
| | | | |
Commercial Paper | | | 0 | | | | 283,856,151 | | | | 0 | | | | 283,856,151 | |
| | | | |
Municipal obligations | | | 0 | | | | 81,350,000 | | | | 0 | | | | 81,350,000 | |
| | | | |
Other notes | | | 0 | | | | 15,006,540 | | | | 0 | | | | 15,006,540 | |
Rupurchase agreements | | | 0 | | | | 77,000,000 | | | | 0 | | | | 77,000,000 | |
Total assets | | $ | 0 | | | $ | 579,385,294 | | | $ | 0 | | | $ | 579,385,294 | |
The Fund recognizes transfers between levels within the fair value hierarchy at the end of the reporting period. At July 31, 2018, the Fund did not have any transfers into/out of Level 1, Level 2, or Level 3.
4. TRANSACTIONS WITH AFFILIATES
Management fee
Funds Management, an indirect wholly owned subsidiary of Wells Fargo & Company (“Wells Fargo”), is the manager of the Fund and provides advisory and fund-level administrative services under an investment management agreement. Under the investment management agreement, Funds Management is responsible for, among other services, implementing the investment objectives and strategies of the Fund, supervising the subadvisers and providing fund-level administrative services in connection with the Fund’s operations. As compensation for its services under the investment management agreement, Funds Management is entitled to receive an annual management fee starting at 0.20% and declining to 0.18% as the average daily net assets of the Fund increase. Prior to June 1, 2018, Fund Management received a fee at an annual rate which started at 0.35% and declined to 0.23% as the average daily net assets of the Fund increased. For the six months ended July 31, 2018, the management fee was equivalent to an annual rate of 0.30% of the Fund’s average daily net assets.
Funds Management has retained the services of a certain subadvisers to provide daily portfolio management to the Fund. The fee for subadvisory services is borne by Funds Management. Wells Capital Management Incorporated (“WellsCap”), an affiliate of Funds Management and an indirect wholly owned subsidiary of Wells Fargo, is the subadviser to the Fund and is entitled to receive a fee from Funds Management at an annual rate starting at 0.05% and declining to 0.01% as the average daily net assets of the Fund increase. Wells Capital Management Singapore, a separately identifiable department of Wells Fargo Bank, N.A, an affiliate of Funds Management and wholly owned subsidiary of Wells Fargo, is also a subadviser to the Fund and is entitled to receive a fee from Funds Management at an annual rate starting at 0.0025% and declining to 0.0005% as the average daily net assets of the subadviser’s portion of the Fund increase.
Administration fees
Under a class-level administration agreement, Funds Management provides class-level administrative services to the Fund, which includes paying fees and expenses for services provided by the transfer agent, sub-transfer agents, omnibus account servicers and record-keepers. As compensation for its services under the class-level administration agreement, Funds Management receives an annual fee which is calculated based on the average daily net assets of each class as follows:
| | | | |
| | | Class-level
administration fee | |
Class A, Class C | | | 0.22 | % |
Premier Class | | | 0.08 | |
Service Class | | | 0.12 | |
Funds Management has contractually waived and/or reimbursed management and administration fees to the extent necessary to maintain certain net operating expense ratios for the Fund. When each class of the Fund has exceeded its expense cap, Funds Management has waived fees and/or reimbursed expenses from fund level expenses on a proportionate basis and then from class specific expenses; otherwise, waivers and/or reimbursements are applied against class specific
| | | | |
| 24 | | Wells Fargo Money Market Fund | | Notes to financial statements (unaudited) |
expenses before fund level expenses. Funds Management has committed through May 31, 2019 to waive fees and/or reimburse expenses to the extent necessary to cap the Fund’s expenses at 0.60% for Class A shares, 1.35% for Class C shares, 0.20% for Premier Class shares, and 0.50% for Service Class shares. After this time, the cap may be increased or the commitment to maintain the cap may be terminated only with the approval of the Board of Trustees. Prior to June 1, 2018, the Fund’s expenses were capped at 0.65% for Class A shares and 1.40% for Class C shares.
Distribution fee
The Trust has adopted a distribution plan for Class C shares of the Fund pursuant to Rule 12b-1 under the 1940 Act. A distribution fee is charged to Class C shares and paid to Wells Fargo Funds Distributor, LLC (“Funds Distributor”), the principal underwriter, at an annual rate of 0.75% of the average daily net assets of Class C shares.
In addition, Funds Distributor is also entitled to receive the contingent deferred sales charges from redemptions of Class C shares. No contingent deferred sales charges were incurred by Class C shares for the six months ended July 31, 2018.
Shareholder servicing fees
The Trust has entered into contracts with one or more shareholder servicing agents, whereby Class A, Class C, and Service Class of the Fund are charged a fee at an annual rate of 0.25% of the respective average daily net assets of each class.
A portion of these total shareholder servicing fees were paid to affiliates of Wells Fargo.
Interfund transactions
The Fund may purchase or sell investment securities to certain other Wells Fargo affiliates pursuant to Rule 17a-7 under the 1940 Act and under procedures adopted by the Board of Trustees. The procedures have been designed to ensure that these interfund transactions, which do not incur broker commissions, are effected at current market prices.
5. INDEMNIFICATION
Under the Trust’s organizational documents, the officers and Trustees have been granted certain indemnification rights against certain liabilities that may arise out of performance of their duties to the Trust. Additionally, in the normal course of business, the Trust may enter into contracts with service providers that contain a variety of indemnification clauses. The Trust’s maximum exposure under these arrangements is dependent on future claims that may be made against the Fund and, therefore, cannot be estimated.
| | | | | | |
| Other information (unaudited) | | Wells Fargo Money Market Fund | | | 25 | |
PROXY VOTING INFORMATION
A description of the policies and procedures that the Fund uses to determine how to vote proxies relating to portfolio securities is available, upon request, by calling 1-800-222-8222, visiting our website at wellsfargofunds.com, or visiting the SEC website at sec.gov. Information regarding how the Fund voted proxies relating to portfolio securities during the most recent 12-month period ended June 30 is available on the Fund’s website at wellsfargofunds.com or by visiting the SEC website at sec.gov.
PORTFOLIO HOLDINGS INFORMATION
The complete portfolio holdings for the Fund are publicly available on the Fund’s website (wellsfargofunds.com) on a 1-day delayed basis. The Fund files its complete schedule of portfolio holdings with the SEC for the first and third quarters of each fiscal year on Form N-Q, which is available by visiting the SEC website at sec.gov. In addition, the Fund’s Form N-Q may be reviewed and copied at the SEC’s Public Reference Room in Washington, DC, and at regional offices in New York City, at 233 Broadway, and in Chicago, at 175 West Jackson Boulevard, Suite 900. Information about the Public Reference Room may be obtained by calling 1-800-SEC-0330.
| | | | |
| 26 | | Wells Fargo Money Market Fund | | Other information (unaudited) |
BOARD OF TRUSTEES AND OFFICERS
Each of the Trustees and Officers1 listed in the table below acts in identical capacities for each fund in the Wells Fargo family of funds, which consists of 154 mutual funds comprising the Wells Fargo Funds Trust, Wells Fargo Variable Trust, Wells Fargo Master Trust and four closed-end funds (collectively the “Fund Complex”). This table should be read in conjunction with the Prospectus and the Statement of Additional Information2. The mailing address of each Trustee and Officer is 525 Market Street, 12th Floor, San Francisco, CA 94105. Each Trustee and Officer serves an indefinite term, however, each Trustee serves such term until reaching the mandatory retirement age established by the Trustees.
Independent Trustees
| | | | | | |
Name and year of birth | | Position held and length of service* | | Principal occupations during past five years or longer | | Current other public company or investment company directorships |
| William R. Ebsworth (Born 1957) | | Trustee, since 2015 | | Retired. From 1984 to 2013, equities analyst, portfolio manager, research director and chief investment officer at Fidelity Management and Research Company in Boston, Tokyo, and Hong Kong, and retired in 2013 as Chief Investment Officer of Fidelity Strategic Advisers, Inc. where he led a team of investment professionals managing client assets. Prior thereto, Board member of Hong Kong Securities Clearing Co., Hong Kong Options Clearing Corp., the Thailand International Fund, Ltd., Fidelity Investments Life Insurance Company, and Empire Fidelity Investments Life Insurance Company. Board member of the Forté Foundation (non-profit organization) and the Vincent Memorial Hospital Endowment (non-profit organization), where he serves on the Investment Committee and as a Chair of the Audit Committee. Mr. Ebsworth is a CFA® charterholder. | | Asset Allocation Trust |
Jane A. Freeman (Born 1953) | | Trustee, since 2015; Chair Liaison, since 2018 | | Retired. From 2012 to 2014 and 1999 to 2008, Chief Financial Officer of Scientific Learning Corporation. From 2008 to 2012, Ms. Freeman provided consulting services related to strategic business projects. Prior to 1999, Portfolio Manager at Rockefeller & Co. and Scudder, Stevens & Clark. Board member of the Harding Loevner Funds from 1996 to 2014, serving as both Lead Independent Director and chair of the Audit Committee. Board member of the Russell Exchange Traded Funds Trust from 2011 to 2012 and the chair of the Audit Committee. Ms. Freeman is a Board Member of Ruth Bancroft Garden (non-profit organization) and the Glimmerglass Festival. She is also an inactive Chartered Financial Analyst. | | Asset Allocation Trust |
Isaiah Harris, Jr. (Born 1952) | | Trustee, since 2009 | | Retired. Chairman of the Board of CIGNA Corporation since 2009, and Director since 2005. From 2003 to 2011, Director of Deluxe Corporation. Prior thereto, President and CEO of BellSouth Advertising and Publishing Corp. from 2005 to 2007, President and CEO of BellSouth Enterprises from 2004 to 2005 and President of BellSouth Consumer Services from 2000 to 2003. Emeritus member of the Iowa State University Foundation Board of Governors. Emeritus Member of the Advisory Board of Iowa State University School of Business. Advisory Board Member, Palm Harbor Academy (charter school). Advisory Board Member, Child Evangelism Fellowship (non-profit). Mr. Harris is a certified public accountant (inactive status). | | CIGNA Corporation; Asset Allocation Trust |
Judith M. Johnson (Born 1949) | | Trustee, since 2008;
Audit Committee Chairman, since 2009 | | Retired. Prior thereto, Chief Executive Officer and Chief Investment Officer of Minneapolis Employees Retirement Fund from 1996 to 2008. Ms. Johnson is an attorney, certified public accountant and a certified managerial accountant. | | Asset Allocation Trust |
David F. Larcker (Born 1950) | | Trustee, since 2009 | | James Irvin Miller Professor of Accounting at the Graduate School of Business, Stanford University, Director of the Corporate Governance Research Initiative and Senior Faculty of The Rock Center for Corporate Governance since 2006. From 2005 to 2008, Professor of Accounting at the Graduate School of Business, Stanford University. Prior thereto, Ernst & Young Professor of Accounting at The Wharton School, University of Pennsylvania from 1985 to 2005. | | Asset Allocation Trust |
| | | | | | |
| Other information (unaudited) | | Wells Fargo Money Market Fund | | | 27 | |
| | | | | | |
Name and year of birth | | Position held and length of service* | | Principal occupations during past five years or longer | | Current other public company or investment company directorships |
Olivia S. Mitchell (Born 1953) | | Trustee, since 2006; Governance Committee Chairman, since 2018 | | International Foundation of Employee Benefit Plans Professor, Wharton School of the University of Pennsylvania since 1993. Director of Wharton’s Pension Research Council and Boettner Center on Pensions & Retirement Research, and Research Associate at the National Bureau of Economic Research. Previously, Cornell University Professor from 1978 to 1993. | | Asset Allocation Trust |
Timothy J. Penny (Born 1951) | | Trustee, since 1996; Chairman, since 2018; Vice Chairman, from 2017 to 2018 | | President and Chief Executive Officer of Southern Minnesota Initiative Foundation, a non-profit organization, since 2007. Member of the Board of Trustees of NorthStar Education Finance, Inc., a non-profit organization, since 2007. | | Asset Allocation Trust |
James G. Polisson (Born 1959) | | Trustee, since 2018; Advisory Board Member, from 2017 to 2018 | | Retired. Chief Marketing Officer, Source (ETF) UK Services, Ltd, from 2015 to 2017. From 2012 to 2015, Principal of The Polisson Group, LLC, a management consulting, corporate advisory and principal investing company. Chief Executive Officer and Managing Director at Russell Investments, Global Exchange Traded Funds from 2010 to 2012. Managing Director of Barclays Global Investors from 1998 to 2010 and Global Chief Marketing Officer for iShares and Barclays Global Investors from 2000 to 2010. Trustee of the San Francisco Mechanics’ Institute, a non-profit organization, from 2013 to 2015. Board member of the Russell Exchange Traded Fund Trust from 2011 to 2012. Director of Barclays Global Investors Holdings Deutschland GmbH from 2006 to 2009. Mr. Polisson is an attorney and has a retired status with the Massachusetts and District of Columbia Bar Associations. | | Asset Allocation Trust |
Michael S. Scofield (Born 1943) | | Trustee, since 2010 | | Served on the Investment Company Institute’s Board of Governors and Executive Committee from 2008-2011 as well the Governing Council of the Independent Directors Council from 2006-2011 and the Independent Directors Council Executive Committee from 2008-2011. Trustee of the Evergreen Fund complex (and its predecessors) from 1984 to 2010. Chairman of the Evergreen Funds from 2000-2010. Former Trustee of the Mentor Funds. Retired Attorney, Law Offices of Michael S. Scofield. | | Asset Allocation Trust |
Pamela Wheelock (Born 1959) | | Trustee, since 2018; Advisory Board Member, from 2017 to 2018 | | Chief Operating Officer, Twin Cities Habitat for Humanity, since January, 2017. Vice President of University Services, University of Minnesota from 2012 to 2017. Prior thereto, on the Board of Directors, Goverance Committee and Finance Committee for the Minnesota Philanthropy Partners (Saint Paul Foundation) from 2012 to 2018, Interim President and Chief Executive Officer of Blue Cross Blue shield of Minnesota of Minnesota from 2010 to 2011, Chairman of the Board from 2009 to 2011 and Board Director 003 to 2015. Vice President, Leadership and Community Engagement, Bush Foundation, Saint Paul, Minnesota (a private foundation) from 2009 to 2011. Executive Vice President and Chief Financial Officer, Minnesota Sports and Entertainment from 2004 to 2009 and Senior Vice President from 2002 to 2004. Commissioner of Finance, State of Minnesota, from 1999 to 2002. Currently the Board Chair of the Minnesota Wild Foundation since 2010. | | Asset Allocation Trust |
| * | Length of service dates reflect the Trustee’s commencement of service with the Trust’s predecessor entities, where applicable. |
| | | | |
| 28 | | Wells Fargo Money Market Fund | | Other information (unaudited) |
Officers
| | | | | | |
Name and year of birth | | Position held and length of service | | Principal occupations during past five years or longer | | |
Andrew Owen (Born 1960) | | President, since 2017 | | Executive Vice President of Wells Fargo & Company and Head of Affiliated Managers, Wells Fargo Asset Management, since 2014. In addition, Mr. Owen is currently President, Chief Executive Officer and Director of Wells Fargo Funds Management, LLC since 2017. Prior thereto, Executive Vice President responsible for marketing, investments and product development for Wells Fargo Funds Management, LLC, from 2009 to 2014. | | |
Nancy Wiser1 (Born 1967) | | Treasurer, since 2012 | | Executive Vice President of Wells Fargo Funds Management, LLC since 2011. Chief Operating Officer and Chief Compliance Officer at LightBox Capital Management LLC, from 2008 to 2011. | | |
Alexander Kymn3 (Born 1973) | | Secretary, since 2018; Chief Legal Officer, since 2018 | | Senior Company Counsel of Wells Fargo Bank, N.A. since 2018 (previously Senior Counsel from 2007 to 2018). Vice President of Wells Fargo Funds Management, LLC from 2008 to 2014. | | |
Michael H. Whitaker (Born 1967) | | Chief Compliance Officer, since 2016 | | Senior Vice President and Chief Compliance Officer since 2016. Senior Vice President and Chief Compliance Officer for Fidelity Investments from 2007 to 2016. | | |
David Berardi (Born 1975) | | Assistant Treasurer, since 2009 | | Vice President of Wells Fargo Funds Management, LLC since 2009. Vice President of Evergreen Investment Management Company, LLC from 2008 to 2010. Manager of Fund Reporting and Control for Evergreen Investment Management Company, LLC from 2004 to 2010. | | |
Jeremy DePalma1 (Born 1974) | | Assistant Treasurer, since 2009 | | Senior Vice President of Wells Fargo Funds Management, LLC since 2009. Senior Vice President of Evergreen Investment Management Company, LLC from 2008 to 2010 and head of the Fund Reporting and Control Team within Fund Administration from 2005 to 2010. | | |
| 1 | Nancy Wiser acts as Treasurer of 77 funds in the Fund Complex. Jeremy DePalma acts as Treasurer of 77 funds and Assistant Treasurer of 77 funds in the Fund Complex. |
| 2 | The Statement of Additional Information includes additional information about the Trustees and is available, without charge, upon request, by calling 1-800-222-8222 or by visiting the website at wellsfargofunds.com. |
| 3 | Alexander Kymn became the Secretary and Chief Legal Officer effective April 17, 2018. |
| | | | | | |
| Other information (unaudited) | | Wells Fargo Money Market Fund | | | 29 | |
BOARD CONSIDERATION OF INVESTMENT MANAGEMENT AND SUB-ADVISORY AGREEMENTS:
Wells Fargo Money Market Fund
Under the Investment Company Act of 1940 (the “1940 Act”), the Board of Trustees (the “Board”) of Wells Fargo Funds Trust (the “Trust”) must determine annually whether to approve the continuation of the Trust’s investment management and sub-advisory agreements. In this regard, at an in-person meeting held on May 22-23, 2018 (the “Meeting”), the Board, all the members of which have no direct or indirect interest in the investment management and sub-advisory agreements and are not “interested persons” of the Trust, as defined in the 1940 Act (the “Independent Trustees”), reviewed and approved for Wells Fargo Money Market Fund (the “Fund”): (i) an investment management agreement (the “Management Agreement”) with Wells Fargo Funds Management, LLC (“Funds Management”); (ii) an investment sub-advisory agreement with Wells Capital Management Incorporated (“WellsCap”), an affiliate of Funds Management; and (iii) an investment sub-advisory agreement with Wells Fargo Bank, N.A. d/b/a Wells Capital Management Singapore (“WellsCap Singapore”), an affiliate of Funds Management. The sub-advisory agreements with WellsCap and WellsCap Singapore (the “Sub-Advisers”) are collectively referred to as the Sub-Advisory Agreements, and the Management Agreement and the Sub-Advisory Agreements are collectively referred to as the “Advisory Agreements.”
At the Meeting, the Board considered the factors and reached the conclusions described below relating to the selection of Funds Management and the Sub-Advisers and the approval of the Advisory Agreements. Prior to the Meeting, including at an in-person meeting in April 2018, the Trustees conferred extensively among themselves and with representatives of Funds Management about these matters. Also, the Board has adopted a team-based approach, with each team consisting of a sub-set of Trustees, to assist the full Board in the discharge of its duties in reviewing investment performance and other matters throughout the year. The Independent Trustees were assisted in their evaluation of the Advisory Agreements by independent legal counsel, from whom they received separate legal advice and with whom they met separately.
In providing information to the Board, Funds Management and the Sub-Advisers were guided by a detailed set of requests for information submitted to them by independent legal counsel on behalf of the Independent Trustees at the start of the Board’s annual contract renewal process earlier in 2018. In considering and approving the Advisory Agreements, the Trustees considered the information they believed relevant, including but not limited to the information discussed below. The Board considered not only the specific information presented in connection with the Meeting, but also the knowledge gained over time through interaction with Funds Management and the Sub-Advisers about various topics. In this regard, the Board reviewed reports of Funds Management at each of its quarterly meetings, which included, among other things, portfolio reviews and investment performance reports. In addition, the Board and the teams mentioned above confer with portfolio managers at various times throughout the year. The Board did not identify any particular information or consideration that was all-important or controlling, and each individual Trustee may have attributed different weights to various factors.
After its deliberations, the Board unanimously approved the continuation of the Advisory Agreements for a one-year term and determined that the compensation payable to Funds Management and the Sub-Advisers under each of the Advisory Agreements was reasonable. The Board considered the approval of the Advisory Agreements for the Fund as part of its consideration of agreements for funds across the complex, but its approvals were made on a fund-by-fund basis. The following summarizes a number of important, but not necessarily all, factors considered by the Board in support of its approvals.
Nature, extent and quality of services
The Board received and considered various information regarding the nature, extent and quality of services provided to the Fund by Funds Management and the Sub-Advisers under the Advisory Agreements. This information included a description of the investment advisory services and Fund-level administrative services covered by the Management Agreement, as well as, among other things, a summary of the background and experience of senior management of Wells Fargo Asset Management (“WFAM”), of which Funds Management and the Sub-Advisers are a part, a summary of investments made in the business of WFAM, a summary of certain organizational and personnel changes involving Funds Management and the Sub-Advisers, and a description of Funds Management’s and the Sub-Advisers’ business continuity planning programs and of their approaches to data privacy and cybersecurity. The Board also considered the qualifications, background, tenure and responsibilities of each of the portfolio managers primarily responsible for the day-to-day portfolio management of the Fund.
The Board evaluated the ability of Funds Management and the Sub-Advisers to attract and retain qualified investment professionals, including research, advisory and supervisory personnel. The Board further considered the compliance programs and compliance records of Funds Management and the Sub-Advisers. In addition, the Board took into account the full range of services provided to the Fund by Funds Management and its affiliates.
| | | | |
| 30 | | Wells Fargo Money Market Fund | | Other information (unaudited) |
Fund investment performance and expenses
The Board considered the investment performance results for the Fund over various time periods ended December 31, 2017. The Board considered these results in comparison to the investment performance of funds in a universe that was determined by Broadridge Inc. (“Broadridge”) to be similar to the Fund (the “Universe”) and to other comparative data. Broadridge is an independent provider of investment company data. The Board received a description of the methodology used by Broadridge to select the mutual funds in the performance Universe. The Board noted that the investment performance of the Fund (Class A) was higher than or in range of the average investment performance of the Universe for all periods under review.
The Board also received and considered information regarding the Fund’s net operating expense ratios and their various components, including actual management fees, custodian and other non-management fees, and Rule 12b-1 and non-Rule 12b-1 shareholder service fees. The Board considered these ratios in comparison to the median ratios of funds in class-specific expense groups that were determined by Broadridge to be similar to the Fund (the “Groups”). The Board received a description of the methodology used by Broadridge to select the mutual funds in the expense Groups and an explanation of how funds comprising expense groups and their expense ratios may vary from year-to-year. Based on the Broadridge reports, the Board noted that the net operating expense ratios of the Fund were in range of, lower than, or equal to the median net operating expense ratios of the expense Groups for all share classes except Class C. The Board noted that the net operating expense ratio caps for the Fund’s Class A and Class C would be reduced.
The Board took into account the Fund’s investment performance and expense information provided to it among the factors considered in deciding to re-approve the Advisory Agreements.
Investment management and sub-advisory fee rates
The Board reviewed and considered the contractual fee rates payable by the Fund to Funds Management under the Management Agreement, as well as the contractual fee rates payable by the Fund to Funds Management for class-level administrative services under a Class-Level Administration Agreement, which include, among other things, class-level transfer agency and sub-transfer agency costs (collectively, the “Management Rates”). The Board also reviewed and considered the contractual investment sub-advisory fee rates that are payable by Funds Management to the Sub-Advisers for investment sub-advisory services.
Among other information reviewed by the Board was a comparison of the Fund’s Management Rates with the average contractual investment management fee rates of funds in the expense Groups at a common asset level as well as transfer agency costs of the funds in the expense Groups. The Board noted that the Management Rates of the Fund were lower than or in range of the sum of these average rates for the Fund’s expense Groups for all share classes except Class A and Class C. The Board noted that the net operating expense ratio caps for the Fund’s Class A and Class C would be reduced. The Board also discussed and accepted Funds Management’s proposal to revise the Management Agreement to reduce the management fees paid by the Fund to Funds Management.
The Board also received and considered information about the portion of the total management fee that was retained by Funds Management after payment of the fee to the Sub-Advisers for sub-advisory services. In assessing the reasonableness of this amount, the Board received and evaluated information about the nature and extent of responsibilities retained and risks assumed by Funds Management and not delegated to or assumed by the Sub-Advisers, and about Funds Management’s on-going oversight services. Given the affiliation between Funds Management and the Sub-Advisers, the Board ascribed limited relevance to the allocation of fees between them.
Based on its consideration of the factors and information it deemed relevant, including those described here, the Board determined that the compensation payable to Funds Management under the Management Agreement and to the Sub-Advisers under the Sub-Advisory Agreements was reasonable.
Profitability
The Board received and considered information concerning the profitability of Funds Management, as well as the profitability of both WFAM and Wells Fargo & Co. (“Wells Fargo”) as a whole, from providing services to the Fund and the fund family as a whole. The Board noted that the Sub-Advisers’ profitability information with respect to providing services to the Fund was subsumed in the WFAM and Wells Fargo profitability analysis.
Funds Management reported on the methodologies and estimates used in calculating profitability, including a description of the methodology used to allocate certain expenses and recent enhancements made to the methodology. Among other things, the Board noted that the levels of profitability reported on a fund-by-fund basis varied widely, depending on factors such as the size and type of fund. Based on its review, the Board did not deem the profits reported by Funds Management, WFAM or Wells Fargo from services provided to the Fund to be at a level that would prevent it from approving the continuation of the Advisory Agreements.
| | | | | | |
| Other information (unaudited) | | Wells Fargo Money Market Fund | | | 31 | |
Economies of scale
The Board considered the extent to which Funds Management may experience economies of scale in the provision of management services, and the extent to which scale benefits, if any, would be shared with shareholders. In particular, the Board noted the existence of breakpoints in the Fund’s management fee structure, which operate generally to reduce the Fund’s expense ratios as the Fund grows in size. It considered that, for a small fund or a fund that shrinks in size, breakpoints conversely can result in higher fee levels. The Board also considered that in addition to management fee breakpoints, competitive management fee rates set at the outset without regard to breakpoints and fee waiver and expense reimbursement arrangements, as well as investments in the business intended to enhance services available to Fund shareholders, are means of sharing potential economies of scale with shareholders of the Fund. The also Board discussed and accepted Funds Management’s proposal to revise the Management Agreement to reduce the management fees paid by the Fund to Funds Management.
The Board concluded that the Fund’s fee and expense arrangements, including contractual breakpoints, constituted a reasonable approach to sharing potential economies of scale with the Fund and its shareholders.
Other benefits to Funds Management and the Sub-Advisers
The Board received and considered information regarding potential “fall-out” or ancillary benefits received by Funds Management and its affiliates, including the Sub-Advisers, as a result of their relationships with the Fund. Ancillary benefits could include, among others, benefits directly attributable to other relationships with the Fund and benefits potentially derived from an increase in Funds Management’s and the Sub-Advisers’ business as a result of their relationships with the Fund. The Board noted that various affiliates of Funds Management may receive distribution-related fees, shareholder servicing payments and sub-transfer agency fees in respect of shares sold or held through them and services provided.
The Board also reviewed information about soft dollar credits earned and utilized by the Sub-Advisers, fees earned by Funds Management and WellsCap from managing a private investment vehicle for the fund family’s securities lending collateral and commissions earned by an affiliated broker from portfolio transactions.
Based on its consideration of the factors and information it deemed relevant, including those described here, the Board did not find that any ancillary benefits received by Funds Management and its affiliates, including the Sub-Advisers, were unreasonable.
Conclusion
At the Meeting, after considering the above-described factors and based on its deliberations and its evaluation of the information described above, the Board unanimously approved the continuation of the Advisory Agreements for a one-year term and determined that the compensation payable to Funds Management and the Sub-Advisers under each of the Advisory Agreements was reasonable.
This page is intentionally left blank.

For more information
More information about Wells Fargo Funds is available free upon request. To obtain literature, please write, email, visit the Fund’s website, or call:
Wells Fargo Funds
P.O. Box 219967
Kansas City, MO 64121-9967
Website: wellsfargofunds.com
Individual investors: 1-800-222-8222
Retail investment professionals: 1-888-877-9275
Institutional investment professionals: 1-866-765-0778
This report and the financial statements contained herein are submitted for the general information of the shareholders of the Fund. If this report is used for promotional purposes, distribution of the report must be accompanied or preceded by a current prospectus. Before investing, please consider the investment objectives, risks, charges, and expenses of the investment. For a current prospectus and, if available, a summary prospectus, containing this information, call 1-800-222-8222 or visit the Fund’s website at wellsfargofunds.com. Read the prospectus carefully before you invest or send money.
Wells Fargo Asset Management (WFAM) is the trade name for certain investment advisory/management firms owned by Wells Fargo & Company. These firms include but are not limited to Wells Capital Management Incorporated and Wells Fargo Funds Management, LLC. Certain products managed by WFAM entities are distributed by Wells Fargo Funds Distributor, LLC (a broker/dealer and Member FINRA).
This material is for general informational and educational purposes only and is NOT intended to provide investment advice or a recommendation of any kind—including a recommendation for any specific investment, strategy, or plan.
NOT FDIC INSURED ◾ NO BANK GUARANTEE ◾ MAY LOSE VALUE
© 2018 Wells Fargo Funds Management, LLC. All rights reserved.
| | |
 | | 314805 09-18 SA306/SAR306 07-18 |
Semi-Annual Report
July 31, 2018

Retail Money Market Funds

| ∎ | �� | Wells Fargo National Tax-Free Money Market Fund |

Reduce clutter. Save trees.
Sign up for electronic delivery of prospectuses and shareholder reports at wellsfargo.com/advantagedelivery
Contents
The views expressed and any forward-looking statements are as of July 31, 2018, unless otherwise noted, and are those of the Fund managers and/or Wells Fargo Funds Management, LLC. Discussions of individual securities, or the markets generally, or any Wells Fargo Fund are not intended as individual recommendations. Future events or results may vary significantly from those expressed in any forward-looking statements. The views expressed are subject to change at any time in response to changing circumstances in the market. Wells Fargo Funds Management, LLC and the Fund disclaim any obligation to publicly update or revise any views expressed or forward-looking statements.
NOT FDIC INSURED ◾ NO BANK GUARANTEE ◾ MAY LOSE VALUE
| | | | |
| 2 | | Wells Fargo National Tax-Free Money Market Fund | | Letter to shareholders (unaudited) |

Andrew Owen
President
Wells Fargo Funds
Yields on money market funds benefited during the period.
During February 2018, the U.S. stock market endured a loss of more than 10% before recovering in March and April.
Dear Shareholder:
We are pleased to offer you this semi-annual report for the Wells Fargo National Tax-Free Money Market Fund for the six-month period that ended July 31, 2018. Yields on money market funds benefited during the period. As the U.S. Federal Reserve (the Fed) moved toward a more normalized monetary policy after an extended term of low interest rates following the global financial crisis during 2007 and 2008, its steady pace of interest rate increases helped raise yields on short-term money market instruments.
Globally, stock markets followed a less consistent path during the period. After advancing during the summer and fall of 2017 in a roughly synchronized way, economic growth and stock markets globally diverged during the first seven months of 2018. For fixed-income investors, higher U.S. interest rates, rising inflation, and intensifying global geopolitical tensions tended to restrain taxable bond prices while high-yield and municipal bond investors generally enjoyed positive returns.
For the period, U.S. stocks, as measured by the S&P 500 Index,1 gained 0.70%, and international stocks, as measured by the MSCI ACWI ex USA Index (Net),2 fell 6.66%. Emerging market stocks, as measured by the MSCI EM Index (Net),3 dropped 11.94%. In bond markets, the Bloomberg Barclays U.S. Aggregate Bond Index4 declined 0.45% while fixed-income investments outside the U.S. fell 4.57%, according to the Bloomberg Barclays Global Aggregate ex-USD Index.5 The Bloomberg Barclays Municipal Bond Index6 added 1.18%, and the ICE BofAML U.S. High Yield Index7 was up 0.55%.
Volatility reemerged during the first quarter of 2018 as economic signals were mixed.
The first quarter of 2018 began with stock market gains in January following U.S. tax reform that lowered rates for individuals and corporations and deregulation advanced in some economic sectors. Then, investor optimism was supplanted by several concerns. Trade tensions intensified, particularly between the U.S. and China. The U.S. threatened to impose tariffs on a broad range of imported products. Increasing interest rates and inflation also caused concern. During February 2018, the U.S. stock market endured a loss of more than 10% before recovering in March and April. The S&P 500 Index closed the first quarter with a negative return, the first negative quarterly return for the index since 2014.
| 1 | The S&P 500 Index consists of 500 stocks chosen for market size, liquidity, and industry group representation. It is a market-value-weighted index with each stock’s weight in the index proportionate to its market value. You cannot invest directly in an index. |
| 2 | The Morgan Stanley Capital International (MSCI) All Country World Index (ACWI) ex USA Index (Net) is a free-float-adjusted market-capitalization-weighted index that is designed to measure the equity market performance of developed markets, excluding the United States and Canada. Source: MSCI. MSCI makes no express or implied warranties or representations and shall have no liability whatsoever with respect to any MSCI data contained herein. The MSCI data may not be further redistributed or used as a basis for other indices or any securities or financial products. This report is not approved, reviewed, or produced by MSCI. You cannot invest directly in an index. |
| 3 | The MSCI Emerging Markets (EM) Index (Net) is a free-float-adjusted market-capitalization-weighted index that is designed to measure large- and mid-cap equity market performance of emerging markets. The MSCI EM Index (Net) consists of the following 24 emerging market country indices: Brazil, Chile, China, Colombia, Czech Republic, Egypt, Greece, Hungary, India, Indonesia, Korea, Malaysia, Mexico, Pakistan, Peru, the Philippines, Poland, Qatar, Russia, South Africa, Taiwan, Thailand, Turkey, and the United Arab Emirates. You cannot invest directly in an index. |
| 4 | The Bloomberg Barclays U.S. Aggregate Bond Index is a broad-based benchmark that measures the investment-grade, U.S. dollar-denominated, fixed-rate taxable bond market, including Treasuries, government-related and corporate securities, mortgage-backed securities (agency fixed-rate and hybrid adjustable-rate mortgage pass-throughs), asset-backed securities, and commercial mortgage-backed securities. You cannot invest directly in an index. |
| 5 | The Bloomberg Barclays Global Aggregate ex-USD Index is an unmanaged index that provides a broad-based measure of the global investment-grade fixed-income markets excluding the U.S. dollar-denominated debt market. You cannot invest directly in an index. |
| 6 | The Bloomberg Barclays Municipal Bond Index is an unmanaged index composed of long-term tax-exempt bonds with a minimum credit rating of Baa. You cannot invest directly in an index. |
| 7 | The ICE BofAML U.S. High Yield Index is a market-capitalization-weighted index of domestic and Yankee high-yield bonds. The index tracks the performance of high-yield securities traded in the U.S. bond market. You cannot invest directly in an index. Copyright 2018. ICE Data Indices, LLC. All rights reserved. |
| 8 | The Consumer Price Index For All Urban Consumers (CPI-U) measures the changes in the price of a basket of goods and services purchased by urban consumers. The urban consumer population is deemed by many as a better representative measure of the general public because most of the country’s population lives in highly populated areas, which represent close to 90% of the total population. You cannot invest directly in an index. |
| | | | | | |
| Letter to shareholders (unaudited) | | Wells Fargo National Tax-Free Money Market Fund | | | 3 | |
The Fed increased the federal funds rate by 25 basis points (bps; 100 bps equal 1.00%) in March 2018 and the rate of inflation reached the Fed’s 2% target for the first time in a year. The unemployment rate fell to 4.1%. The third revision of first-quarter gross domestic product (GDP) growth by the U.S. Bureau of Economic Analysis released during June 2018 was lowered to 2.0%.
Overseas, investment market returns reversed the strong returns of 2017. After having gained 27.19% for the 12-month period that ended on December 31, 2017, the MSCI ACWI ex USA Index (Net) fell 1.46% for the seven-month period that ended July 31, 2018. The U.S. dollar strengthened relative to local currencies, which served to restrain returns.
Global trade tensions escalated during the second quarter and into the third quarter of 2018.
Global trade tensions escalated as the second quarter of 2018 opened and equity markets fell in response before resuming upward momentum later in April. The U.S. government imposed tariffs on products and commodities imported from other markets in North America, Europe, and Asia. In retaliation, governments imposed tariffs on U.S. products and commodities. In addition, the U.S. pushed its North American neighbors to renegotiate the North American Free Trade Agreement, furthering trade tensions and investor uncertainty.
The CPI-U8 added 0.2% in May after a similar increase in April. On a year-over-year basis, the all-items index rose 2.8% for the 12 months that ended May 31, continuing its upward trend since the beginning of the year. The index for all items less food and energy rose 2.2% for the same 12-month period. Interest rates generally increased and the bond markets tended to decline.
During June 2018, the Fed increased the federal funds rate by 25 bps. Investment markets began to anticipate two more rate increases in 2018. Long-term interest rates in the U.S. trended higher—rates on the 10-year and 30-year Treasury bonds moved from 2.46% and 2.81%, respectively, on January 1, 2018, to 2.96% and 3.08%, respectively, on July 31, 2018. While higher at the end of the period, rates were off their peak levels on May 17, 2018, of 3.11% and 3.25%, respectively. Investors became more aware of and concerned about the potential for an inverted yield curve—sometimes a recession signal—as short-term rates increased more quickly than long-term rates.
The unemployment rate fell to 3.9% in July after ticking up slightly in June from May’s 3.8% level, according to the U.S. Department of Labor. The annualized rate of GDP growth for the second quarter of 2018 was reported in July to be 4.1%, the highest level since the third quarter of 2014, according to the U.S. Bureau of Economic Analysis.
Internationally, the prospects for a smooth U.K. Brexit agreement was cast into doubt as members of Prime Minister Theresa May’s negotiating team resigned. Despite the uncertainty, the period closed with expectations that the Bank of England’s Monetary Policy Committee in July would announce an increase in its key interest rate to 0.75%, which it did in early August.
Meanwhile, central banks in Europe and Japan maintained low interest rates and accommodative monetary policies. Amid rising trade uncertainty, People’s Bank of China monetary policies shifted with cuts to reserve requirement ratios and implementation of supportive measures such as accelerated infrastructure spending and tax cuts for small and medium enterprises and for individuals. Nevertheless, a strengthening U.S. dollar and the tensions associated with trade policies remained headwinds for investors overseas.
| | | | |
| 4 | | Wells Fargo National Tax-Free Money Market Fund | | Letter to shareholders (unaudited) |
Don’t let short-term uncertainty derail long-term investment goals.
Periods of investment uncertainty can present challenges, but experience has taught us that maintaining long-term investment goals can be an effective way to plan for the future. To help you create a sound strategy based on your personal goals and risk tolerance, Wells Fargo Funds offers more than 100 mutual funds spanning a wide range of asset classes and investment styles. Although diversification cannot guarantee an investment profit or prevent losses, we believe it can be an effective way to manage investment risk and potentially smooth out overall portfolio performance. We encourage investors to know their investments and to understand that appropriate levels of risk-taking may unlock opportunities.
Thank you for choosing to invest with Wells Fargo Funds. We appreciate your confidence in us and remain committed to helping you meet your financial needs.
Sincerely,

Andrew Owen
President
Wells Fargo Funds
For further information about your Fund, contact your investment professional, visit our website at wellsfargofunds.com, or call us directly at 1-800-222-8222.
This page is intentionally left blank.
| | | | |
| 6 | | Wells Fargo National Tax-Free Money Market Fund | | Performance highlights (unaudited) |
Investment objective
The Fund seeks current income exempt from federal income tax, while preserving capital and liquidity.
Manager
Wells Fargo Funds Management, LLC
Subadviser
Wells Capital Management Incorporated
Portfolio managers
James Randazzo
Jeffrey L. Weaver, CFA®
Average annual total returns (%) as of July 31, 2018
| | | | | | | | | | | | | | | | | | | | | | |
| | | | | | | | Expense ratios1 (%) | |
| | | Inception date | | 1 year | | | 5 year | | | 10 year | | | Gross | | | Net2 | |
| Class A (NWMXX) | | 7-28-2003 | | | 0.63 | | | | 0.18 | | | | 0.17 | | | | 0.68 | | | | 0.60 | |
| Administrator Class (WNTXX) | | 4-8-2005 | | | 0.96 | | | | 0.32 | | | | 0.28 | | | | 0.41 | | | | 0.30 | |
| Premier Class (WFNXX) | | 11-8-1999 | | | 1.06 | | | | 0.37 | | | | 0.33 | | | | 0.29 | | | | 0.20 | |
| Service Class (MMIXX) | | 8-3-1993 | | | 0.81 | | | | 0.25 | | | | 0.22 | | | | 0.58 | | | | 0.45 | |
Yield summary (%) as of July 31, 20182
| | | | | | | | | | | | | | |
| | | Class A | | Administrator
Class | | | Premier
Class | | | Service
Class | |
| 7-day current yield | | 0.45 | | | 0.75 | | | | 0.85 | | | | 0.60 | |
| 7-day compound yield | | 0.46 | | | 0.76 | | | | 0.86 | | | | 0.61 | |
| 30-day simple yield | | 0.60 | | | 0.90 | | | | 1.00 | | | | 0.75 | |
| 30-day compound yield | | 0.60 | | | 0.90 | | | | 1.00 | | | | 0.75 | |
Figures quoted represent past performance, which is no guarantee of future results, and do not reflect taxes that a shareholder may pay on fund distributions or the redemption of fund shares. Investment returns will fluctuate. The Fund’s yield figures more closely reflect the current earnings of the Fund than the total return figures. Current performance may be lower or higher than the performance data quoted, which assumes the reinvestment of dividends and capital gains. Current month-end performance is available on the Fund’s website, wellsfargofunds.com.
Each class is sold without a front-end sales charge or contingent deferred sales charge.
For retail money market funds: You could lose money by investing in the Fund. Although the Fund seeks to preserve the value of your investment at $1.00 per share, it cannot guarantee it will do so. The Fund may impose a fee upon sale of your shares or may temporarily suspend your ability to sell shares if the Fund’s liquidity falls below required minimums because of market conditions or other factors. An investment in the Fund is not insured or guaranteed by the Federal Deposit Insurance Corporation or any other government agency. The Fund’s sponsor has no legal obligation to provide financial support to the Fund, and you should not expect that the sponsor will provide financial support to the Fund at any time.
Please see footnotes on page 7.
| | | | | | |
| Performance highlights (unaudited) | | Wells Fargo National Tax-Free Money Market Fund | | | 7 | |
|
| Revenue source distribution as of July 31, 20183 |
|
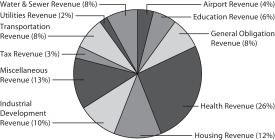
|
|
| Effective maturity distribution as of July 31, 20183 |
|
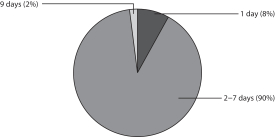
|
|
| Weighted average maturity as of July 31, 20184 |
6 days |
|
| Weighted average life as of July 31, 20185 |
6 days |
| 1 | Reflects the expense ratios as stated in the most recent prospectuses. The expense ratios shown are subject to change and may differ from the annualized expense ratios shown in the financial highlights of this report. |
| 2 | The manager has contractually committed through May 31, 2019, to waive fees and/or reimburse expenses to the extent necessary to cap the Fund’s Total Annual Fund Operating Expenses After Fee Waivers at the amounts shown. After this time, the cap may be increased or the commitment to maintain the cap may be terminated only with the approval of the Board of Trustees. Brokerage commissions, stamp duty fees, interest, taxes, acquired fund fees and expenses (if any), and extraordinary expenses are excluded from the expense cap. Without this cap, the Fund’s returns would have been lower. Without waived fees and/or reimbursed expenses, the Fund’s 7-day current yield would have been 0.39%, 0.66%, 0.78%, and 0.49% for Class A, Administrator Class, Premier Class, and Service Class, respectively. The expense ratio paid by an investor is the net expense ratio (the total annual fund operating expenses after fee waivers) as stated in the prospectuses. |
| 3 | Amounts are calculated based on the total investments of the Fund. These amounts are subject to change and may have changed since the date specified. |
| 4 | Weighted Average Maturity (WAM): WAM is an average of the effective maturities of all securities held in the portfolio, weighted by each security’s percentage of total investments. The maturity of a portfolio security is the period remaining until the date on which the principal amount is unconditionally required to be paid, or in the case of a security called for redemption, the date on which the redemption payment is unconditionally required to be made. WAM calculations allow for the maturities of certain securities with demand features or periodic interest rate resets to be shortened. WAM is a way to measure a fund’s sensitivity to potential interest rate changes. WAM is subject to change and may have changed since the date specified. |
| 5 | Weighted Average Life (WAL): WAL is an average of the final maturities of all securities held in the portfolio, weighted by their percentage of total investments. The maturity of a portfolio security is the period remaining until the date on which the principal amount is unconditionally required to be paid, or in the case of a security called for redemption, the date on which the redemption payment is unconditionally required to be made. In contrast to WAM, the calculation of WAL allows for the maturities of certain securities with demand features to be shortened, but not the periodic interest rate resets. WAL is a way to measure a fund’s potential sensitivity to credit spread changes. WAL is subject to change and may have changed since the date specified. |
| | | | |
| 8 | | Wells Fargo National Tax-Free Money Market Fund | | Fund expenses (unaudited) |
As a shareholder of the Fund, you incur ongoing costs, including management fees, shareholder servicing fees and other Fund expenses. This example is intended to help you understand your ongoing costs (in dollars) of investing in the Fund and to compare these costs with the ongoing costs of investing in other mutual funds.
The example is based on an investment of $1,000 invested at the beginning of the six-month period and held for the entire period from February 1, 2018 to July 31, 2018.
Actual expenses
The “Actual” line of the table below provides information about actual account values and actual expenses. You may use the information in this line, together with the amount you invested, to estimate the expenses that you paid over the period. Simply divide your account value by $1,000 (for example, an $8,600 account value divided by $1,000 = 8.6), then multiply the result by the number in the “Actual” line under the heading entitled “Expenses paid during period” for your applicable class of shares to estimate the expenses you paid on your account during this period.
Hypothetical example for comparison purposes
The “Hypothetical” line of the table below provides information about hypothetical account values and hypothetical expenses based on the Fund’s actual expense ratio and an assumed rate of return of 5% per year before expenses, which is not the Fund’s actual return. The hypothetical account values and expenses may not be used to estimate the actual ending account balance or expenses you paid for the period. You may use this information to compare the ongoing costs of investing in the Fund and other funds. To do so, compare this 5% hypothetical example with the 5% hypothetical examples that appear in the shareholder reports of the other funds.
Please note that the expenses shown in the table are meant to highlight your ongoing costs only. Therefore, the “Hypothetical” line of the table is useful in comparing ongoing costs only and will not help you determine the relative total costs of owning different funds.
| | | | | | | | | | | | | | | | |
| | | Beginning
account value
2-1-2018 | | | Ending
account value
7-31-2018 | | | Expenses
paid during
the period¹ | | | Annualized net
expense ratio | |
Class A | | | | | | | | | | | | | | | | |
Actual | | $ | 1,000.00 | | | $ | 1,003.71 | | | $ | 3.18 | | | | 0.63 | % |
Hypothetical (5% return before expenses) | | $ | 1,000.00 | | | $ | 1,022.03 | | | $ | 3.21 | | | | 0.63 | % |
Administrator Class | | | | | | | | | | | | | | | | |
Actual | | $ | 1,000.00 | | | $ | 1,005.34 | | | $ | 1.52 | | | | 0.30 | % |
Hypothetical (5% return before expenses) | | $ | 1,000.00 | | | $ | 1,023.69 | | | $ | 1.53 | | | | 0.30 | % |
Premier Class | | | | | | | | | | | | | | | | |
Actual | | $ | 1,000.00 | | | $ | 1,005.84 | | | $ | 1.01 | | | | 0.20 | % |
Hypothetical (5% return before expenses) | | $ | 1,000.00 | | | $ | 1,024.20 | | | $ | 1.02 | | | | 0.20 | % |
Service Class | | | | | | | | | | | | | | | | |
Actual | | $ | 1,000.00 | | | $ | 1,004.59 | | | $ | 2.27 | | | | 0.45 | % |
Hypothetical (5% return before expenses) | | $ | 1,000.00 | | | $ | 1,022.94 | | | $ | 2.29 | | | | 0.45 | % |
| 1 | Expenses paid is equal to the annualized net expense ratio of each class multiplied by the average account value over the period, multiplied by the number of days in the most recent fiscal half-year divided by the number of days in the fiscal year (to reflect the one-half-year period). |
| | | | | | |
| Portfolio of investments—July 31, 2018 (unaudited) | | Wells Fargo National Tax-Free Money Market Fund | | | 9 | |
| | | | | | | | | | | | | | | | |
| Security name | | Interest rate | | | Maturity date | | | Principal | | | Value | |
| | | | |
Municipal Obligations: 101.96% | | | | | | | | | | | | | | | | |
| | | | |
Alabama: 0.59% | | | | | | | | | | | | | | | | |
| | | | |
| Variable Rate Demand Note ø: 0.59% | | | | | | | | | | | | | | | | |
Alabama Federal Aid Highway Finance Authority Series 2016-A Tender Option Bond Trust Receipts/Certificates Series 2016-XF2373 (Tax Revenue, Citibank NA LIQ) 144A | | | 0.97 | % | | | 9-1-2024 | | | $ | 5,000,000 | | | $ | 5,000,000 | |
| | | | | | | | | | | | | | | | |
| | | | |
Alaska: 0.48% | | | | | | | | | | | | | | | | |
| | | | |
| Variable Rate Demand Notes ø: 0.48% | | | | | | | | | | | | | | | | |
Alaska Housing Finance Corporation Home Mortgage Series A MFHR (Housing Revenue, Bank of Tokyo-Mitsubishi SPA) | | | 0.90 | | | | 12-1-2040 | | | | 1,500,000 | | | | 1,500,000 | |
Alaska Housing Finance Corporation Series B (Housing Revenue, FHLB SPA) | | | 0.94 | | | | 12-1-2041 | | | | 2,505,000 | | | | 2,505,000 | |
| | | | |
| | | | | | | | | | | | | | | 4,005,000 | |
| | | | | | | | | | | | | | | | |
| | | | |
Arizona: 2.76% | | | | | | | | | | | | | | | | |
| | | | |
| Variable Rate Demand Notes ø: 2.76% | | | | | | | | | | | | | | | | |
Arizona Health Facilities Authority Catholic West Series B (Health Revenue, Barclays Bank LOC) | | | 0.98 | | | | 7-1-2035 | | | | 10,000,000 | | | | 10,000,000 | |
Arizona Tender Option Bond Trust Receipts/Floater Certificates Series 2018-XF2537 (Utilities Revenue, Barclays Bank plc LOC, Barclays Bank plc LIQ) 144A | | | 0.98 | | | | 12-1-2037 | | | | 3,215,000 | | | | 3,215,000 | |
Mesa AZ Utility System Clipper Tax-Exempt Certificate Trust Series 2009-33 (Miscellaneous Revenue, State Street Bank & Trust Company LIQ) | | | 0.97 | | | | 7-1-2024 | | | | 10,055,000 | | | | 10,055,000 | |
| | | | |
| | | | | | | | | | | | | | | 23,270,000 | |
| | | | | | | | | | | | | | | | |
| | | | |
California: 10.36% | | | | | | | | | | | | | | | | |
| | | | |
| Variable Rate Demand Notes ø: 10.36% | | | | | | | | | | | | | | | | |
California Infrastructure & Economic Development Bank Saddleback Valley Christian Schools Project Series A (Miscellaneous Revenue, East West Bank LOC) 144A | | | 0.90 | | | | 12-1-2040 | | | | 14,250,000 | | | | 14,250,000 | |
California Municipal Finance Authority High Desert Foundation Project Series 2012A (Education Revenue, Union Bank NA LOC) | | | 0.99 | | | | 4-1-2042 | | | | 1,180,000 | | | | 1,180,000 | |
California State University Series A Tender Option Bond Trust Receipts/Certificates Series 2017-XF2441 (Education Revenue, Citibank NA LIQ) 144A | | | 0.90 | | | | 5-1-2024 | | | | 2,000,000 | | | | 2,000,000 | |
California Statewide Community Development Authority Uptown Newport Apartments Series 2017 AA & BB (Housing Revenue, East West Bank LOC) | | | 0.90 | | | | 3-1-2057 | | | | 14,575,000 | | | | 14,575,000 | |
California Tender Option Bond Trust Receipts/Certificates Series 2017-XF0579 (GO Revenue, TD Bank NA LIQ) 144A | | | 0.94 | | | | 11-1-2035 | | | | 6,600,000 | | | | 6,600,000 | |
California Tender Option Bond Trust Receipts/Certificates Series 2017-XF0580 (GO Revenue, TD Bank NA LIQ) 144A | | | 0.94 | | | | 11-1-2033 | | | | 3,375,000 | | | | 3,375,000 | |
California Tender Option Bond Trust Receipts/Certificates Series 2018-XF0669 (GO Revenue, Royal Bank of Canada LIQ) 144A | | | 0.95 | | | | 2-1-2026 | | | | 2,500,000 | | | | 2,500,000 | |
California Tender Option Bond Trust Receipts/Certificates Series 2018-XF2630 (Health Revenue, Barclays Bank plc LIQ) 144A | | | 0.96 | | | | 8-1-2045 | | | | 2,900,000 | | | | 2,900,000 | |
California Tender Option Bond Trust Receipts/Certificates Series 2016-XM0147 (Education Revenue, Morgan Stanley Bank LIQ) 144A | | | 0.98 | | | | 1-1-2039 | | | | 10,000,000 | | | | 10,000,000 | |
California Tender Option Bond Trust Receipts/Certificates Series 2018-XG0188 (GO Revenue, Royal Bank of Canada LIQ) 144A | | | 0.95 | | | | 2-1-2026 | | | | 1,600,000 | | | | 1,600,000 | |
California Tender Option Bond Trust Receipts/Floater Certificates Series 2017-BAML01 (Transportation Revenue, Bank of America NA LIQ) 144A | | | 0.95 | | | | 4-1-2047 | | | | 21,445,000 | | | | 21,445,000 | |
Los Angeles CA Department Series C Tender Option Bond Trust Receipts/Certificates Series 2017-XM0533 (Utilities Revenue, Citibank NA LIQ) 144A | | | 0.90 | | | | 7-1-2025 | | | | 2,225,000 | | | | 2,225,000 | |
The accompanying notes are an integral part of these financial statements.
| | | | |
| 10 | | Wells Fargo National Tax-Free Money Market Fund | | Portfolio of investments—July 31, 2018 (unaudited) |
| | | | | | | | | | | | | | | | |
| Security name | | Interest rate | | | Maturity date | | | Principal | | | Value | |
| | | | |
| Variable Rate Demand Notes ø (continued) | | | | | | | | | | | | | | | | |
San Francisco City & County CA Public Utilities Commission Series 3153X (Water & Sewer Revenue, Morgan Stanley Bank LIQ) 144A | | | 0.97 | % | | | 11-1-2039 | | | $ | 2,190,000 | | | $ | 2,190,000 | |
San Joaquin CA Delta Community College Tender Option Bond Trust Receipts/Certificates Series ZF0180 (GO Revenue, JPMorgan Chase & Company LIQ) 144A | | | 1.04 | | | | 8-1-2022 | | | | 2,415,000 | | | | 2,415,000 | |
| | | | |
| | | | | | | | | | | | | | | 87,255,000 | |
| | | | | | | | | | | | | | | | |
| | | | |
Colorado: 1.88% | | | | | | | | | | | | | | | | |
| | | | |
| Variable Rate Demand Notes ø: 1.88% | | | | | | | | | | | | | | | | |
Colorado HFA Catholic Health Initiatives Series 2008-D2 (Health Revenue, Morgan Stanley Bank LIQ) 144A | | | 1.16 | | | | 10-1-2037 | | | | 9,000,000 | | | | 9,000,000 | |
Colorado HFA Single Family Mortgage Bonds Class ll Series 2018B-2 (Housing Revenue, GNMA Insured, FHLB SPA) | | | 0.98 | | | | 11-1-2041 | | | | 5,000,000 | | | | 5,000,000 | |
Colorado Tender Option Bond Trust Receipts/Certificates Series 2018-XF0668 Tengen (Health Revenue, Royal Bank of Canada LIQ) 144A | | | 0.97 | | | | 5-15-2026 | | | | 1,875,000 | | | | 1,875,000 | |
| | | | |
| | | | | | | | | | | | | | | 15,875,000 | |
| | | | | | | | | | | | | | | | |
| | | | |
Connecticut: 1.45% | | | | | | | | | | | | | | | | |
| | | | |
| Variable Rate Demand Notes ø: 1.45% | | | | | | | | | | | | | | | | |
Connecticut FHA Series 2018C-3 (Housing Revenue, TD Bank NA SPA) | | | 0.93 | | | | 11-15-2048 | | | | 4,650,000 | | | | 4,650,000 | |
Connecticut Residual Interest Bond Floater Trust Series 2017-016 (Miscellaneous Revenue, Barclays Bank plc LOC, Barclays Bank plc LIQ) 144A | | | 0.98 | | | | 6-1-2037 | | | | 3,000,000 | | | | 3,000,000 | |
Connecticut Tender Option Bond Trust Receipts/Floater Certificates Series 2017-YX1077 (Tax Revenue, Barclays Bank plc LIQ) 144A | | | 1.00 | | | | 1-1-2036 | | | | 4,550,000 | | | | 4,550,000 | |
| | | | |
| | | | | | | | | | | | | | | 12,200,000 | |
| | | | | | | | | | | | | | | | |
| | | | |
District of Columbia: 0.88% | | | | | | | | | | | | | | | | |
| | | | |
| Variable Rate Demand Notes ø: 0.88% | | | | | | | | | | | | | | | | |
District of Columbia Community Connection Real Estate Foundation Issue Series 2007-A (Miscellaneous Revenue, Manufacturers & Traders LOC) | | | 0.99 | | | | 7-1-2032 | | | | 3,395,000 | | | | 3,395,000 | |
Tender Option Bond Trust Receipts/Certificates Series 2018-XF0621 (Water & Sewer Revenue, Royal Bank of Canada LIQ) 144A | | | 0.97 | | | | 4-1-2026 | | | | 4,000,000 | | | | 4,000,000 | |
| | | | |
| | | | | | | | | | | | | | | 7,395,000 | |
| | | | | | | | | | | | | | | | |
| | | | |
Florida: 4.50% | | | | | | | | | | | | | | | | |
| | | | |
| Variable Rate Demand Notes ø: 4.50% | | | | | | | | | | | | | | | | |
Florida Tender Option Bond Trust Receipts/Certificates Series 2017-ZM0571 (Health Revenue, Morgan Stanley Bank LIQ) 144A | | | 1.04 | | | | 8-15-2047 | | | | 4,730,000 | | | | 4,730,000 | |
Florida Tender Option Bond Trust Receipts/Certificates Series 2018-XF2523 (Health Revenue, Barclays Bank plc LIQ) 144A | | | 1.04 | | | | 8-15-2047 | | | | 10,000,000 | | | | 10,000,000 | |
Florida Tender Option Bond Trust Receipts/Certificates Series 2018-XF2530 (Health Revenue, Citibank NA LIQ) 144A | | | 1.09 | | | | 8-15-2025 | | | | 3,000,000 | | | | 3,000,000 | |
Florida Tender Option Bond Trust Receipts/Certificates Series 2018-XG0173 (Health Revenue, Citibank NA LIQ) 144A | | | 1.09 | | | | 10-1-2025 | | | | 7,000,000 | | | | 7,000,000 | |
Highlands County FL Health Facilities Authority Adventist Health System Sunbelt Obligated Group Series 2012 I-2 (Health Revenue, Adventist Health System) | | | 0.92 | | | | 11-15-2032 | | | | 600,000 | | | | 600,000 | |
Orange County FL School Board Certificate of Participation Series 2009A (Miscellaneous Revenue, AGC Insured, Morgan Stanley Bank LIQ) 144A | | | 1.07 | | | | 8-1-2034 | | | | 3,300,000 | | | | 3,300,000 | |
The accompanying notes are an integral part of these financial statements.
| | | | | | |
| Portfolio of investments—July 31, 2018 (unaudited) | | Wells Fargo National Tax-Free Money Market Fund | | | 11 | |
| | | | | | | | | | | | | | | | |
| Security name | | Interest rate | | | Maturity date | | | Principal | | | Value | |
| | | | |
| Variable Rate Demand Notes ø (continued) | | | | | | | | | | | | | | | | |
Orlando & Orange County FL Expressway Authority Series 2007 (Transportation Revenue, BHAC/AGM Insured, Citibank NA LIQ) | | | 0.98 | % | | | 7-1-2042 | | | $ | 6,000,000 | | | $ | 6,000,000 | |
Pinellas County FL IDA Neighborly Care Network Project Series 2008 (Miscellaneous Revenue, Branch Banking & Trust LOC) | | | 0.95 | | | | 8-1-2028 | | | | 3,245,000 | | | | 3,245,000 | |
| | | | |
| | | | | | | | | | | | | | | 37,875,000 | |
| | | | | | | | | | | | | | | | |
| | | | |
Georgia: 0.44% | | | | | | | | | | | | | | | | |
| | | | |
| Variable Rate Demand Note ø: 0.44% | | | | | | | | | | | | | | | | |
Georgia Tender Option Bond Trust Receipts/Certificates Series 2017-ZF0589 (Education Revenue, Bank of America NA LIQ) 144A | | | 0.98 | | | | 6-1-2049 | | | | 3,750,000 | | | | 3,750,000 | |
| | | | | | | | | | | | | | | | |
| | | | |
Illinois: 5.46% | | | | | | | | | | | | | | | | |
| | | | |
| Variable Rate Demand Notes ø: 5.46% | | | | | | | | | | | | | | | | |
Aurora IL Economic Development Aurora University Series 2004 (Education Revenue, BMO Harris Bank NA LOC) | | | 0.94 | | | | 3-1-2035 | | | | 7,000,000 | | | | 7,000,000 | |
Chicago IL Education Marine Project Series 1984 (Industrial Development Revenue, FHLB LOC) | | | 1.09 | | | | 7-1-2023 | | | | 4,200,000 | | | | 4,200,000 | |
Illinois Educational Facilities Authority Aurora University (Education Revenue, Harris NA LOC) | | | 0.94 | | | | 3-1-2032 | | | | 3,800,000 | | | | 3,800,000 | |
Illinois Finance Authority Advocate Healthcare Network Series 2008C-1 (Health Revenue, JPMorgan Chase & Company SPA) | | | 0.95 | | | | 11-1-2038 | | | | 2,800,000 | | | | 2,800,000 | |
Illinois Finance Authority Little Company of Mary Hospital and Health Care Centers Series 2008A (Health Revenue, Barclays Bank plc LOC) | | | 0.98 | | | | 8-15-2035 | | | | 400,000 | | | | 400,000 | |
Illinois Finance Authority Northwestern Memorial Hospital Series 2007A-3 (Health Revenue, JPMorgan Chase & Company SPA) | | | 1.50 | | | | 8-15-2042 | | | | 3,000,000 | | | | 3,000,000 | |
Illinois State Finance Authority Edward Hospital Obligated Group Series B-2 (Health Revenue, JPMorgan Chase & Company LOC) | | | 0.97 | | | | 2-1-2040 | | | | 655,000 | | | | 655,000 | |
Illinois State Toll Highway Authority Senior Priority Bonds Series 2007A-2A (Transportation Revenue, Bank of Tokyo-Mitsubishi LOC) | | | 0.92 | | | | 7-1-2030 | | | | 5,000,000 | | | | 5,000,000 | |
Illinois Tender Option Bond Trust Receipts/Certificates Series XF2202 (Transportation Revenue, Citibank NA LIQ) 144A | | | 0.97 | | | | 7-1-2023 | | | | 1,140,000 | | | | 1,140,000 | |
Illinois Tender Option Bond Trust Receipts/Certificates Series ZM0120 (Transportation Revenue, Royal Bank of Canada LIQ) 144A | | | 0.99 | | | | 7-1-2023 | | | | 3,100,000 | | | | 3,100,000 | |
Illinois Tender Option Bond Trust Receipts/Floater Certificates Series 2016-XG0008 (Health Revenue, AGC Insured, Bank of America NA LIQ) 144A | | | 1.04 | | | | 8-15-2047 | | | | 10,000,000 | | | | 10,000,000 | |
Quad Cities Regional EDA Augustana College Series 2005 (Education Revenue, Harris NA LOC) | | | 0.95 | | | | 10-1-2035 | | | | 4,900,000 | | | | 4,900,000 | |
| | | | |
| | | | | | | | | | | | | | | 45,995,000 | |
| | | | | | | | | | | | | | | | |
| | | | |
Indiana: 1.62% | | | | | | | | | | | | | | | | |
| | | | |
| Variable Rate Demand Notes ø: 1.62% | | | | | | | | | | | | | | | | |
Indiana Certificate of Participation Clipper Tax-Exempt Certificate Trust Series 2009-34 (Miscellaneous Revenue, State Street Bank & Trust Company LIQ) | | | 0.98 | | | | 7-1-2023 | | | | 9,915,000 | | | | 9,915,000 | |
Indiana Finance Authority Duke Energy Indiana Incorporated Series 2009A-4 (Industrial Development Revenue, Sumitomo Mitsui Banking LOC) | | | 1.45 | | | | 12-1-2039 | | | | 3,700,000 | | | | 3,700,000 | |
| | | | |
| | | | | | | | | | | | | | | 13,615,000 | |
| | | | | | | | | | | | | | | | |
The accompanying notes are an integral part of these financial statements.
| | | | |
| 12 | | Wells Fargo National Tax-Free Money Market Fund | | Portfolio of investments—July 31, 2018 (unaudited) |
| | | | | | | | | | | | | | | | |
| Security name | | Interest rate | | | Maturity date | | | Principal | | | Value | |
| | | | |
Iowa: 3.42% | | | | | | | | | | | | | | | | |
| | | | |
| Variable Rate Demand Notes ø: 3.42% | | | | | | | | | | | | | | | | |
Iowa Finance Authority Midwestern Disaster Area Project (Industrial Development Revenue, Korea Development Bank LOC) | | | 1.20 | % | | | 4-1-2022 | | | $ | 23,340,000 | | | $ | 23,340,000 | |
Iowa Finance Authority Mortgage Securities Program Series D (Housing Revenue, GNMA/FNMA/FHLMC Insured, FHLB SPA) | | | 0.95 | | | | 1-1-2047 | | | | 5,500,000 | | | | 5,500,000 | |
| | | | |
| | | | | | | | | | | | | | | 28,840,000 | |
| | | | | | | | | | | | | | | | |
|
Louisiana: 1.71% | |
|
| Variable Rate Demand Note ø: 1.71% | |
Louisiana HFA Canterbury House Apartments (Housing Revenue, FNMA LOC) | | | 0.93 | | | | 9-15-2040 | | | | 14,420,000 | | | | 14,420,000 | |
| | | | | | | | | | | | | | | | |
|
Maryland: 1.86% | |
|
| Variable Rate Demand Notes ø: 1.86% | |
Maryland Industrial Development Financing Authority Occidental Petroleum Corporation Series 2010 (Industrial Development Revenue) | | | 1.16 | | | | 3-1-2030 | | | | 12,340,000 | | | | 12,340,000 | |
Maryland Tender Option Bond Trust Receipts/Certificates Series 2018-XF0605 (Education Revenue, Bank of America NA LIQ) 144A | | | 1.00 | | | | 5-1-2047 | | | | 3,300,000 | | | | 3,300,000 | |
| | | | |
| | | | | | | | | | | | | | | 15,640,000 | |
| | | | | | | | | | | | | | | | |
|
Michigan: 1.75% | |
|
| Variable Rate Demand Notes ø: 1.75% | |
Michigan Housing Development Authority Series C (Housing Revenue, Barclays Bank plc SPA) | | | 0.99 | | | | 12-1-2035 | | | | 3,075,000 | | | | 3,075,000 | |
Michigan Housing Development Authority Series D (Housing Revenue, Industrial and Commercial Bank of China Limited SPA) | | | 1.05 | | | | 6-1-2030 | | | | 1,690,000 | | | | 1,690,000 | |
St. Joseph MI Hospital Finance Authority Lakeland Hospital Niles & St. Joseph Obligated Group Series 2002 (Health Revenue, AGM Insured, JPMorgan Chase & Company SPA) | | | 1.04 | | | | 1-1-2032 | | | | 9,990,000 | | | | 9,990,000 | |
| | | | |
| | | | | | | | | | | | | | | 14,755,000 | |
| | | | | | | | | | | | | | | | |
|
Minnesota: 2.39% | |
|
| Variable Rate Demand Notes ø: 2.39% | |
Burnsville MN Bridgeway Apartments Project Series 2003 (Housing Revenue, FNMA LOC, FNMA LIQ) | | | 1.02 | | | | 10-15-2033 | | | | 2,375,000 | | | | 2,375,000 | |
Forest Lake MN Kilkenny Court Apartments Project Series 2008 (Housing Revenue, FNMA LOC, FNMA LIQ) | | | 1.03 | | | | 8-15-2038 | | | | 4,500,000 | | | | 4,500,000 | |
Hennepin County MN Series 2013C (GO Revenue, U.S. Bank NA SPA) | | | 0.96 | | | | 12-1-2033 | | | | 925,000 | | | | 925,000 | |
Maple Grove MN MFHR Basswood Trails Apartment Project Series 2002 (Housing Revenue, FHLMC LIQ) | | | 1.02 | | | | 3-1-2029 | | | | 2,340,000 | | | | 2,340,000 | |
Minneapolis & St. Paul MN Housing & RDA Children’s Hospital Clinics Series A (Miscellaneous Revenue, AGM Insured, U.S. Bank NA SPA) | | | 1.48 | | | | 8-15-2037 | | | | 975,000 | | | | 975,000 | |
Minneapolis & St. Paul MN Metropolitan Airports Commission Morgan Stanley Series 3200 (Airport Revenue, Morgan Stanley Bank LIQ) 144A | | | 0.97 | | | | 1-1-2035 | | | | 6,000,000 | | | | 6,000,000 | |
Minnesota HEFAR Concordia University Series P-1 (Education Revenue, U.S. Bank NA LOC) | | | 1.44 | | | | 4-1-2027 | | | | 125,000 | | | | 125,000 | |
Plymouth MN Lancaster Village Apartments Project Series 2001 (Housing Revenue, FNMA LOC, FNMA LIQ) | | | 1.02 | | | | 9-15-2031 | | | | 2,865,000 | | | | 2,865,000 | |
| | | | |
| | | | | | | | | | | | | | | 20,105,000 | |
| | | | | | | | | | | | | | | | |
The accompanying notes are an integral part of these financial statements.
| | | | | | |
| Portfolio of investments—July 31, 2018 (unaudited) | | Wells Fargo National Tax-Free Money Market Fund | | | 13 | |
| | | | | | | | | | | | | | | | |
| Security name | | Interest rate | | | Maturity date | | | Principal | | | Value | |
|
Mississippi: 0.82% | |
|
| Variable Rate Demand Notes ø: 0.82% | |
Mississippi Business Finance Commission Gulf Opportunity Zone Chevron USA Incorporated Project Series E (Industrial Development Revenue) | | | 1.52 | % | | | 12-1-2030 | | | $ | 4,000,000 | | | $ | 4,000,000 | |
Mississippi Series A Clipper Tax Exempt Trust Receipts/Certificates Series 2009-60 (Miscellaneous Revenue, State Street Bank & Trust Company LIQ) | | | 0.99 | | | | 11-1-2018 | | | | 2,900,000 | | | | 2,900,000 | |
| | | | |
| | | | | | | | | | | | | | | 6,900,000 | |
| | | | | | | | | | | | | | | | |
|
Missouri: 3.82% | |
|
| Variable Rate Demand Notes ø: 3.82% | |
Missouri HEFA Series 2018E (Health Revenue) | | | 0.91 | | | | 6-1-2036 | | | | 15,000,000 | | | | 15,000,000 | |
Missouri Tender Option Bond Trust Receipts/Certificates Series 2018-XG0176 (Health Revenue, Royal Bank of Canada LIQ) 144A | | | 1.04 | | | | 5-15-2041 | | | | 7,000,000 | | | | 7,000,000 | |
Missouri Tender Option Bond Trust Receipts/Certificates Series 2015-XF2198 (Water & Sewer Revenue, Citibank NA LIQ) 144A | | | 0.97 | | | | 5-1-2023 | | | | 2,670,000 | | | | 2,670,000 | |
St. Louis County MO Sewer District Wastewater System Series 2013-B (Water & Sewer Revenue, Morgan Stanley Bank LIQ) 144A | | | 0.97 | | | | 5-1-2043 | | | | 7,500,000 | | | | 7,500,000 | |
| | | | |
| | | | | | | | | | | | | | | 32,170,000 | |
| | | | | | | | | | | | | | | | |
|
Nebraska: 1.25% | |
|
| Variable Rate Demand Note ø: 1.25% | |
Nebraska Investment Finance Authority MFHR Apple Creek Associates Project Series 1985-A (Housing Revenue, Northern Trust Company LOC) | | | 1.57 | | | | 9-1-2031 | | | | 10,500,000 | | | | 10,500,000 | |
| | | | | | | | | | | | | | | | |
|
Nevada: 2.56% | |
|
| Variable Rate Demand Notes ø: 2.56% | |
Clark County NV Department of Aviation Subordinate Lien Series D-3 (Airport Revenue, Bank of America NA LOC) | | | 0.91 | | | | 7-1-2029 | | | | 2,975,000 | | | | 2,975,000 | |
Clark County NV Las Vegas McCarran International Airport Series 2010-F-2 (Airport Revenue, Union Bank NA LOC) | | | 0.92 | | | | 7-1-2022 | | | | 13,425,000 | | | | 13,425,000 | |
Nevada Tender Option Bond Trust Receipts/Certificates Series 2018-ZM0639 (GO Revenue, JPMorgan Chase & Company LIQ) 144A | | | 0.97 | | | | 12-1-2025 | | | | 3,240,000 | | | | 3,240,000 | |
Reno NV Renown Regional Medical Center Series B (Health Revenue, Union Bank of California LOC) | | | 0.96 | | | | 6-1-2041 | | | | 1,900,000 | | | | 1,900,000 | |
| | | | |
| | | | | | | | | | | | | | | 21,540,000 | |
| | | | | | | | | | | | | | | | |
|
New Jersey: 3.45% | |
|
| Variable Rate Demand Notes ø: 3.45% | |
New Jersey Tender Option Bond Trust Receipts/Certificates Series 2016-XM0226 (Miscellaneous Revenue, BHAC/National Insured, Bank of America NA LIQ) 144A | | | 0.98 | | | | 7-1-2026 | | | | 3,790,000 | | | | 3,790,000 | |
New Jersey Tender Option Bond Trust Receipts/Certificates Series 2017-ZF2476 (Education Revenue, Citibank NA LIQ) 144A | | | 0.95 | | | | 11-1-2021 | | | | 1,000,000 | | | | 1,000,000 | |
New Jersey Tender Option Bond Trust Receipts/Certificates Series 2017-ZF2477 (Education Revenue, Citibank NA LIQ) 144A | | | 0.95 | | | | 11-1-2021 | | | | 2,000,000 | | | | 2,000,000 | |
New Jersey Tender Option Bond Trust Receipts/Certificates Series 2018-XX1093 (Miscellaneous Revenue, Barclays Bank plc LOC, Barclays Bank plc LIQ) 144A | | | 0.96 | | | | 6-15-2031 | | | | 9,500,000 | | | | 9,500,000 | |
RBC Municipal Products Incorporated Trust Series E-102 New Jersey EDA (Miscellaneous Revenue, Royal Bank of Canada LOC, Royal Bank of Canada LIQ) 144A | | | 0.97 | | | | 8-15-2018 | | | | 10,000,000 | | | | 10,000,000 | |
The accompanying notes are an integral part of these financial statements.
| | | | |
| 14 | | Wells Fargo National Tax-Free Money Market Fund | | Portfolio of investments—July 31, 2018 (unaudited) |
| | | | | | | | | | | | | | | | |
| Security name | | Interest rate | | | Maturity date | | | Principal | | | Value | |
| | | | |
| Variable Rate Demand Notes ø (continued) | | | | | | | | | | | | | | | | |
Tender Option Bond Trust Receipts/Certificates New Jersey EDA Series 2018-XF2538 (Education Revenue, Barclays Bank plc LOC, Barclays Bank plc LIQ) 144A | | | 0.96 | % | | | 6-15-2040 | | | $ | 2,810,000 | | | $ | 2,810,000 | |
| | | | |
| | | | | | | | | | | | | | | 29,100,000 | |
| | | | | | | | | | | | | | | | |
|
New York: 7.62% | |
|
| Variable Rate Demand Notes ø: 7.62% | |
New York Battery Park City Authority Refunding Bond Series 2013-C JPMorgan Chase PUTTER/DRIVER Trust Series 5012 (Miscellaneous Revenue, JPMorgan Chase & Company LOC, JPMorgan Chase & Company LIQ) 144A | | | 1.54 | | | | 11-1-2019 | | | | 3,935,000 | | | | 3,935,000 | |
New York Dormitory Authority Series 12 Clipper Tax-Exempt Certificate Trust Series 2009-35 (Miscellaneous Revenue, State Street Bank & Trust Company LIQ) 144A | | | 0.97 | | | | 3-15-2022 | | | | 3,770,000 | | | | 3,770,000 | |
New York HFA Manhattan Residential Housing Series A (Housing Revenue, Bank of China LOC) | | | 1.10 | | | | 11-1-2049 | | | | 5,470,000 | | | | 5,470,000 | |
New York HFA Manhattan West Residential Housing Series 2015-A (Housing Revenue, Bank of China LOC) | | | 1.10 | | | | 11-1-2049 | | | | 9,250,000 | | | | 9,250,000 | |
New York Metropolitan Transportation Authority Subordinate Bond Series E-4 (Transportation Revenue, Bank of the West LOC) | | | 0.98 | | | | 11-15-2045 | | | | 6,765,000 | | | | 6,765,000 | |
New York NY Fiscal 2006 Series I Subordinate Bond Series I-6 (GO Revenue, Bank of New York Mellon LOC) | | | 1.50 | | | | 4-1-2036 | | | | 5,780,000 | | | | 5,780,000 | |
New York NY Fiscal 2017A-6 Subordinate Bond Series A-6 (GO Revenue, Landesbank Hessen-Thüringen SPA) | | | 1.50 | | | | 8-1-2044 | | | | 8,455,000 | | | | 8,455,000 | |
New York NY Transitional Finance Authority Future Tax Secured Tax-Exempt Bond Fiscal 2015 Subordinate Bonds Series A-3 (Tax Revenue, Mizuho Bank Limited SPA) | | | 1.51 | | | | 8-1-2043 | | | | 2,790,000 | | | | 2,790,000 | |
RBC Municipal Products Incorporated Trust Series E-99 New York City (Tax Revenue, Royal Bank of Canada LOC, Royal Bank of Canada LIQ) 144A | | | 0.97 | | | | 8-1-2021 | | | | 10,000,000 | | | | 10,000,000 | |
Triborough Bridge and Tunnel Authority Series 2005B-3 (Transportation Revenue, State Street Bank & Trust Company LOC) | | | 1.40 | | | | 1-1-2032 | | | | 8,000,000 | | | | 8,000,000 | |
| | | | |
| | | | | | | | | | | | | | | 64,215,000 | |
| | | | | | | | | | | | | | | | |
|
North Carolina: 2.36% | |
|
| Variable Rate Demand Notes ø: 2.36% | |
Charlotte NC Water & Sewer Revenue Tender Option Bond Trust Receipts/Certificates Series 2018-XG0170 (Water & Sewer Revenue, Royal Bank of Canada LIQ) 144A | | | 0.97 | | | | 1-1-2026 | | | | 2,430,000 | | | | 2,430,000 | |
Greensboro NC (GO Revenue, Bank of America NA SPA) | | | 0.94 | | | | 4-1-2019 | | | | 50,000 | | | | 50,000 | |
Greensboro NC (GO Revenue, Bank of America NA SPA) | | | 0.94 | | | | 2-1-2022 | | | | 25,000 | | | | 25,000 | |
North Carolina Tender Option Bond Trust Receipts/Certificates Series 2015-ZM0105 (Education Revenue, Morgan Stanley Bank LIQ) 144A | | | 0.97 | | | | 10-1-2055 | | | | 2,250,500 | | | | 2,250,500 | |
North Carolina Tender Option Bond Trust Receipts/Certificates Series 2017-ZF2490 (Airport Revenue, Barclays Bank plc LIQ) 144A | | | 0.97 | | | | 7-1-2042 | | | | 3,750,000 | | | | 3,750,000 | |
Raleigh Durham NC Airport Series 2008C (Airport Revenue, TD Bank NA LOC) | | | 0.90 | | | | 5-1-2036 | | | | 9,700,000 | | | | 9,700,000 | |
University of North Carolina Chapel Hill Series 2009- A (Education Revenue, TD Bank NA SPA) | | | 0.93 | | | | 2-1-2024 | | | | 1,700,000 | | | | 1,700,000 | |
| | | | |
| | | | | | | | | | | | | | | 19,905,500 | |
| | | | | | | | | | | | | | | | |
|
Ohio: 6.82% | |
|
| Variable Rate Demand Notes ø: 6.82% | |
Montgomery County OH Catholic Health Initiatives Series A (Health Revenue, Morgan Stanley Bank LIQ) 144A | | | 1.16 | | | | 5-1-2034 | | | | 11,465,000 | | | | 11,465,000 | |
Ohio Capital Facilities Lease Adult Correctional Building Fund Series C (Miscellaneous Revenue) | | | 1.00 | | | | 10-1-2036 | | | | 9,000,000 | | | | 9,000,000 | |
The accompanying notes are an integral part of these financial statements.
| | | | | | |
| Portfolio of investments—July 31, 2018 (unaudited) | | Wells Fargo National Tax-Free Money Market Fund | | | 15 | |
| | | | | | | | | | | | | | | | |
| Security name | | Interest rate | | | Maturity date | | | Principal | | | Value | |
| | | | |
| Variable Rate Demand Notes ø (continued) | | | | | | | | | | | | | | | | |
Ohio Tender Option Bond Trust Receipts/Certificates Series 2017-XF2438 (Education Revenue, Citibank NA LIQ) 144A | | | 0.97 | % | | | 12-1-2024 | | | $ | 2,000,000 | | | $ | 2,000,000 | |
Ohio Tender Option Bond Trust Receipts/Certificates Series 2018-XL0074 (Health Revenue, JPMorgan Chase & Company LIQ) 144A | | | 1.09 | | | | 8-1-2024 | | | | 5,580,000 | | | | 5,580,000 | |
RBC Municipal Products Incorporated Trust Series E-104 Ohio Water Development Authority (Water & Sewer Revenue, Royal Bank of Canada LOC, Royal Bank of Canada LIQ) 144A | | | 0.97 | | | | 11-1-2019 | | | | 10,000,000 | | | | 10,000,000 | |
RBC Municipal Products Incorporated Trust Series E-110 (Water & Sewer Revenue, Royal Bank of Canada LOC, Royal Bank of Canada LIQ) 144A | | | 0.97 | | | | 10-1-2020 | | | | 10,000,000 | | | | 10,000,000 | |
Tender Option Bond Trust Receipts/Certificates Northeast Regional Ohio Sewer District Wastewater Series 2015-XF0225 (Water & Sewer Revenue, State Street Bank & Trust Company LIQ) 144A | | | 0.97 | | | | 3-1-2021 | | | | 9,375,000 | | | | 9,375,000 | |
| | | | |
| | | | | | | | | | | | | | | 57,420,000 | |
| | | | | | | | | | | | | | | | |
| | | | |
Other: 1.49% | | | | | | | | | | | | | | | | |
| | | | |
| Variable Rate Demand Notes ø: 1.49% | | | | | | | | | | | | | | | | |
Clipper Tax-Exempt Certificate Trust Series 2009-54 (Miscellaneous Revenue, State Street Bank & Trust Company LIQ) | | | 0.99 | | | | 2-15-2028 | | | | 10,990,000 | | | | 10,990,000 | |
FHLMC MFHR Series M-031 Class A (Housing Revenue, FHLMC LIQ) | | | 0.97 | | | | 12-15-2045 | | | | 980,000 | | | | 980,000 | |
FHLMC MFHR Series M-033 Class A (Housing Revenue, FHLMC LIQ) | | | 0.97 | | | | 3-15-2049 | | | | 565,000 | | | | 565,000 | |
| | | | |
| | | | | | | | | | | | | | | 12,535,000 | |
| | | | | | | | | | | | | | | | |
| | | | |
Pennsylvania: 2.18% | | | | | | | | | | | | | | | | |
| | | | |
| Variable Rate Demand Notes ø: 2.18% | | | | | | | | | | | | | | | | |
Allegheny County PA Hospital Development Authority Series E (Health Revenue, Royal Bank of Canada LOC, Royal Bank of Canada LIQ) 144A | | | 1.50 | | | | 4-1-2022 | | | | 5,320,000 | | | | 5,320,000 | |
Pennsylvania Tender Option Bond Trust Receipts/Certificates Series 2016-ZF0504 (Water & Sewer Revenue, TD Bank NA LIQ) 144A | | | 1.09 | | | | 8-15-2042 | | | | 4,875,000 | | | | 4,875,000 | |
Pennsylvania Tender Option Bond Trust Receipts/Certificates Series 2018-YX1089 (GO Revenue, Barclays Bank plc LIQ) 144A | | | 0.96 | | | | 3-1-2035 | | | | 2,540,000 | | | | 2,540,000 | |
Southcentral Pennsylvania General Authority WellSpan Health Obliged Group Series 2014A Tender Option Bond Trust Receipts/Certificates Series 2015-ZM0081 (Health Revenue, Morgan Stanley Bank LIQ) 144A | | | 0.97 | | | | 6-1-2044 | | | | 3,000,000 | | | | 3,000,000 | |
Westmoreland County PA Municipal Authority Service Series 2016 Tender Option Bond Trust Receipts/Certificates Series 2017-ZF0539 (Water & Sewer Revenue, Build America Mutual Assurance Company Insured, TD Bank NA LIQ) 144A | | | 1.09 | | | | 8-15-2038 | | | | 2,615,000 | | | | 2,615,000 | |
| | | | |
| | | | | | | | | | | | | | | 18,350,000 | |
| | | | | | | | | | | | | | | | |
| | | | |
Rhode Island: 1.19% | | | | | | | | | | | | | | | | |
| | | | |
| Variable Rate Demand Note ø: 1.19% | | | | | | | | | | | | | | | | |
Narragansett Bay RI Commission Wastewater System Series 2013-A Tender Option Trust Receipts/Certificates Series 2016-XM0140 (Water & Sewer Revenue, Royal Bank of Canada LIQ) 144A | | | 0.99 | | | | 9-1-2020 | | | | 10,000,000 | | | | 10,000,000 | |
| | | | | | | | | | | | | | | | |
| | | | |
South Carolina: 1.61% | | | | | | | | | | | | | | | | |
| | | | |
| Variable Rate Demand Notes ø: 1.61% | | | | | | | | | | | | | | | | |
Columbia SC Waterworks Series 2009 (Water & Sewer Revenue, Sumitomo Mitsui Banking LOC) | | | 0.96 | | | | 2-1-2038 | | | | 1,760,000 | | | | 1,760,000 | |
Greenville SC Health System Hospital Series 2014-B Tender Option Bond Trust Receipts/Certificates Series 2015-XF0145 (Health Revenue, TD Bank NA LIQ) 144A | | | 0.98 | | | | 5-30-2022 | | | | 8,020,000 | | | | 8,020,000 | |
The accompanying notes are an integral part of these financial statements.
| | | | |
| 16 | | Wells Fargo National Tax-Free Money Market Fund | | Portfolio of investments—July 31, 2018 (unaudited) |
| | | | | | | | | | | | | | | | |
| Security name | | Interest rate | | | Maturity date | | | Principal | | | Value | |
| | | | |
| Variable Rate Demand Notes ø (continued) | | | | | | | | | | | | | | | | |
South Carolina Educational Facilities Authority for Private Non-Profit Institutions Higher Learning Educational Facilities Spartanburg Methodist Series 2005 (Education Revenue, Branch Banking & Trust LOC) | | | 0.97 | % | | | 8-1-2025 | | | $ | 2,440,000 | | | $ | 2,440,000 | |
South Carolina Jobs EDA Institutional Business & Home Safety Project Series 2009 (Industrial Development Revenue, Branch Banking & Trust LOC) | | | 0.99 | | | | 11-1-2034 | | | | 1,320,000 | | | | 1,320,000 | |
| | | | |
| | | | | | | | | | | | | | | 13,540,000 | |
| | | | | | | | | | | | | | | | |
| | | | |
Tennessee: 2.54% | | | | | | | | | | | | | | | | |
| | | | |
| Variable Rate Demand Notes ø: 2.54% | | | | | | | | | | | | | | | | |
Franklin County TN HEFA Board University of the South Project Series 1998-B (Education Revenue, The University of South Tennessee) | | | 1.01 | | | | 9-1-2023 | | | | 1,200,000 | | | | 1,200,000 | |
Sevier County TN Public Building Authority Local Government Public Improvement Series 6-A1 (Miscellaneous Revenue, Branch Banking & Trust SPA) | | | 0.97 | | | | 6-1-2029 | | | | 3,560,000 | | | | 3,560,000 | |
Shelby County TN Health Educational & Housing Facilities Board Methodist Le Bonheur Series B (Health Revenue, AGM Insured, U.S. Bank NA SPA) | | | 1.44 | | | | 6-1-2042 | | | | 9,400,000 | | | | 9,400,000 | |
Shelby County TN HEFA Multifamily Housing Hedgerow Apartments Series A-1 (Housing Revenue, FNMA LOC, FNMA LIQ) | | | 0.93 | | | | 12-15-2037 | | | | 7,210,000 | | | | 7,210,000 | |
| | | | |
| | | | | | | | | | | | | | | 21,370,000 | |
| | | | | | | | | | | | | | | | |
| | | | |
Texas: 10.53% | | | | | | | | | | | | | | | | |
| | | | |
| Variable Rate Demand Notes ø: 10.53% | | | | | | | | | | | | | | | | |
Bexar County TX Housing Finance Corporation Palisades Park Apartments Project Series 2009 (Housing Revenue, FHLMC LIQ) | | | 1.02 | | | | 9-1-2039 | | | | 3,800,000 | | | | 3,800,000 | |
Brazos Harbor TX Industrial Development Corporation BASF Corporation Project Series 2001 (Industrial Development Revenue, BASF SE) | | | 1.01 | | | | 7-1-2022 | | | | 4,900,000 | | | | 4,900,000 | |
Dickinson TX Independent School District Unlimited Tax School House Refunding Bond Series 2000 (GO Revenue, Societe Generale LIQ) | | | 1.54 | | | | 2-15-2028 | | | | 5,680,000 | | | | 5,680,000 | |
Harris County TX Cultural Educational Facilities Finance Corporation Children’s Hospital Project Series 2009 Citigroup ROC Series 11821 (Health Revenue, Citibank NA LIQ) 144A | | | 1.00 | | | | 5-1-2019 | | | | 2,000,000 | | | | 2,000,000 | |
Harris County TX ECFA Series 2016-ZF2384 (Transportation Revenue, Bank of America NA LIQ) 144A | | | 0.98 | | | | 8-15-2038 | | | | 9,190,000 | | | | 9,190,000 | |
Port Arthur TX Navigation District Industrial Development Corporation Total Petrochemicals USA Incorporated Project (Industrial Development Revenue, Total SA) | | | 1.00 | | | | 6-1-2041 | | | | 5,000,000 | | | | 5,000,000 | |
Port Corpus Christi TX Solid Waste Disposal Flint Hills Resources Project Series 2002-B (Resource Recovery Revenue, Flint Hills Resources LLC) | | | 1.01 | | | | 7-1-2029 | | | | 4,200,000 | | | | 4,200,000 | |
Tarrant County TX Cultural Education Facilities Finance Corporation Series 2973 (Health Revenue, Morgan Stanley Bank LIQ) 144A | | | 1.17 | | | | 11-15-2029 | | | | 23,770,000 | | | | 23,770,000 | |
Tarrant County TX Cultural Educational Facilities Finance Corporation Christus Health Series 2008-C2 (Health Revenue, Bank of New York Mellon LOC) | | | 0.95 | | | | 7-1-2047 | | | | 6,405,000 | | | | 6,405,000 | |
Texas Tender Option Bond Trust Receipts/Certificates Series 2018-XG0163 (GO Revenue, Bank of America NA LIQ) 144A | | | 0.98 | | | | 2-15-2047 | | | | 5,010,000 | | | | 5,010,000 | |
Texas Tender Option Bond Trust Receipts/Certificates Series 2018-XG0164 (GO Revenue, Bank of America NA LIQ) 144A | | | 0.98 | | | | 2-1-2048 | | | | 2,795,000 | | | | 2,795,000 | |
Texas Veterans Bonds Series 2014D (Miscellaneous Revenue, FHLB SPA) | | | 0.95 | | | | 6-1-2045 | | | | 950,000 | | | | 950,000 | |
Texas Veterans Bonds Series 2018 (GO Revenue, FHLB LIQ) | | | 1.04 | | | | 12-1-2049 | | | | 15,000,000 | | | | 15,000,000 | |
| | | | |
| | | | | | | | | | | | | | | 88,700,000 | |
| | | | | | | | | | | | | | | | |
The accompanying notes are an integral part of these financial statements.
| | | | | | |
| Portfolio of investments—July 31, 2018 (unaudited) | | Wells Fargo National Tax-Free Money Market Fund | | | 17 | |
| | | | | | | | | | | | | | | | |
| Security name | | Interest rate | | | Maturity date | | | Principal | | | Value | |
| | | | |
Utah: 1.57% | | | | | | | | | | | | | | | | |
| | | | |
| Variable Rate Demand Notes ø: 1.57% | | | | | | | | | | | | | | | | |
Utah County UT IHC Health Services Series D (Health Revenue, U.S. Bank NA SPA) | | | 1.02 | % | | | 5-15-2049 | | | $ | 3,200,000 | | | $ | 3,200,000 | |
Utah County UT IHC Health Services Series D (Health Revenue, U.S. Bank NA SPA) | | | 1.02 | | | | 5-15-2051 | | | | 7,000,000 | | | | 7,000,000 | |
Utah Tender Option Bond Trust Receipts/Certificates Series 2018-XG0171 (Health Revenue, Royal Bank of Canada LIQ) 144A | | | 1.00 | | | | 11-15-2022 | | | | 3,000,000 | | | | 3,000,000 | |
| | | | |
| | | | | | | | | | | | | | | 13,200,000 | |
| | | | | | | | | | | | | | | | |
| | | | |
Vermont: 0.31% | | | | | | | | | | | | | | | | |
| | | | |
| Variable Rate Demand Note ø: 0.31% | | | | | | | | | | | | | | | | |
Vermont Educational & Health Buildings Financing Agency Landmark College Project Series 2008-A (Education Revenue, TD Bank NA LOC) | | | 1.47 | | | | 7-1-2033 | | | | 2,630,000 | | | | 2,630,000 | |
| | | | | | | | | | | | | | | | |
| | | | |
Virginia: 2.78% | | | | | | | | | | | | | | | | |
| | | | |
| Variable Rate Demand Notes ø: 2.78% | | | | | | | | | | | | | | | | |
Albemarle County VA Sentara Martha Jefferson Hospital Series 2018A (Health Revenue, TD Bank NA SPA) | | | 0.92 | | | | 10-1-2048 | | | | 16,000,000 | | | | 16,000,000 | |
Fairfax County VA EDA Smithsonian Institution Series A (Miscellaneous Revenue, Northern Trust Company SPA) | | | 0.75 | | | | 12-1-2033 | | | | 2,500,000 | | | | 2,500,000 | |
Virginia Tender Option Bond Trust Receipts/Certificates Series 2017-XG0143 (Transportation Revenue, Citibank NA LIQ) 144A | | | 0.96 | | | | 5-1-2025 | | | | 4,950,000 | | | | 4,950,000 | |
| | | | |
| | | | | | | | | | | | | | | 23,450,000 | |
| | | | | | | | | | | | | | | | |
| | | | |
West Virginia: 1.62% | | | | | | | | | | | | | | | | |
| | | | |
| Variable Rate Demand Note ø: 1.62% | | | | | | | | | | | | | | | | |
West Virginia Hospital Finance Authority (Health Revenue, PNC Bank NA LOC) | | | 0.00 | | | | 6-1-2041 | | | | 13,680,000 | | | | 13,680,000 | |
| | | | | | | | | | | | | | | | |
| | | | |
Wisconsin: 4.31% | | | | | | | | | | | | | | | | |
| | | | |
| Variable Rate Demand Notes ø: 4.31% | | | | | | | | | | | | | | | | |
Appleton WI Recovery Zone Facilities Foremost Farms Project Series 2010 (Industrial Development Revenue, CoBank ACB LOC) | | | 1.00 | | | | 5-1-2037 | | | | 20,200,000 | | | | 20,200,000 | |
Milwaukee WI RDA Wisconsin Montessori Society (Education Revenue, U.S. Bank NA LOC) | | | 1.58 | | | | 7-1-2021 | | | | 275,000 | | | | 275,000 | |
Wisconsin HEFA Aurora Health Care Incorporated Series 2012-C (Health Revenue, Bank of Montreal LOC) | | | 1.48 | | | | 7-15-2028 | | | | 3,835,000 | | | | 3,835,000 | |
Wisconsin HEFA Aurora Health Care Series D (Health Revenue, Bank of Montreal LOC) | | | 0.90 | | | | 7-15-2028 | | | | 1,510,000 | | | | 1,510,000 | |
Wisconsin HEFA Aspirus Wausau Hospital Incorporated Obligated Group series 2004B (Housing Revenue, JPMorgan Chase & Company LOC) | | | 0.98 | | | | 8-15-2034 | | | | 1,100,000 | | | | 1,100,000 | |
Wisconsin PFA Midwestern Disaster Area Program Series 2011 (Industrial Development Revenue, Farm Credit Services America LOC) | | | 1.00 | | | | 9-1-2036 | | | | 3,555,000 | | | | 3,555,000 | |
Wisconsin Tender Option Bond Trust Receipts/Certificates Series 2018-XF2634 (Health Revenue, Credit Suisse LIQ) 144A | | | 0.99 | | | | 8-15-2025 | | | | 2,000,000 | | | | 2,000,000 | |
Wisconsin Tender Option Bond Trust Receipts/Certificates Series 2015-XF0127 (Health Revenue, JPMorgan Chase & Company LIQ) 144A | | | 1.12 | | | | 10-1-2020 | | | | 3,815,000 | | | | 3,815,000 | |
| | | | |
| | | | | | | | | | | | | | | 36,290,000 | |
| | | | | | | | | | | | | | | | |
The accompanying notes are an integral part of these financial statements.
| | | | |
| 18 | | Wells Fargo National Tax-Free Money Market Fund | | Portfolio of investments—July 31, 2018 (unaudited) |
| | | | | | | | | | | | | | | | |
| Security name | | Interest rate | | | Maturity date | | | Principal | | | Value | |
| | | | |
Wyoming: 1.58% | | | | | | | | | | | | | | | | |
| | | | |
| Variable Rate Demand Note ø: 1.58% | | | | | | | | | | | | | | | | |
Wyoming Tender Option Bond Trust Receipts/Certificates Series 2018-XL0070 (Utilities Revenue, Build America Mutual Assurance Company Insured, JPMorgan Chase & Company LIQ) 144A | | | 0.97 | % | | | 1-1-2025 | | | $ | 13,330,000 | | | $ | 13,330,000 | |
| | | | | | | | | | | | | | | | |
| | | | |
Total Municipal Obligations (Cost $858,820,500) | | | | | | | | | | | | | | | 858,820,500 | |
| | | | | | | | | | | | | | | | |
| | | | |
Repurchase Agreements: 0.59% | | | | | | | | | | | | | | | | |
Barclay’s Capital Incorporated, dated 7-31-2018, maturity value $5,000,265 ^^ | | | 1.91 | | | | 8-1-2018 | | | | 5,000,000 | | | | 5,000,000 | |
| | | | | | | | | | | | | | | | |
| | | | |
Total Repurchase Agreements (Cost $5,000,000) | | | | | | | | | | | | | | | 5,000,000 | |
| | | | | | | | | | | | | | | | |
| | | | | | | | |
| Total investments in securities (Cost $863,820,500) | | | 102.55 | % | | | 863,820,500 | |
Other assets and liabilities, net | | | (2.55 | ) | | | (21,463,114 | ) |
| | | | | | | | |
| Total net assets | | | 100.00 | % | | $ | 842,357,386 | |
| | | | | | | | |
| ø | Variable rate demand notes are subject to a demand feature which reduces the effective maturity. The maturity date shown represents the final maturity date of the security. The interest rate is determined and reset by the issuer daily, weekly, or monthly depending upon the terms of the security. The rate shown is the rate in effect at period end. |
| 144A | The security may be resold in transactions exempt from registration, normally to qualified institutional buyers, pursuant to Rule 144A under the Securities Act of 1933. |
| ^^ | Collateralized by U.S. government securities, 0.00% to 6.00, 11-8-2018 to 8-15-2047, fair value including accrued interest is $5,100,000. |
Abbreviations:
| AGC | Assured Guaranty Corporation |
| AGM | Assured Guaranty Municipal |
| BHAC | Berkshire Hathaway Assurance Corporation |
| DRIVER | Derivative inverse tax-exempt receipts |
| ECFA | Educational & Cultural Facilities Authority |
| EDA | Economic Development Authority |
| FHA | Federal Housing Administration |
| FHLB | Federal Home Loan Bank |
| FHLMC | Federal Home Loan Mortgage Corporation |
| FNMA | Federal National Mortgage Association |
| GNMA | Government National Mortgage Association |
| HEFA | Health & Educational Facilities Authority |
| HEFAR | Higher Education Facilities Authority Revenue |
| HFA | Housing Finance Authority |
| IDA | Industrial Development Authority |
| IDAG | Industrial Development Agency |
| MFHR | Multifamily housing revenue |
| National | National Public Finance Guarantee Corporation |
| PFA | Public Finance Authority |
| PUTTER | Puttable tax-exempt receipts |
| RDA | Redevelopment Authority |
| ROC | Reset option certificates |
| SPA | Standby purchase agreement |
The accompanying notes are an integral part of these financial statements.
| | | | | | |
| Statement of assets and liabilities—July 31, 2018 (unaudited) | | Wells Fargo National Tax-Free Money Market Fund | | | 19 | |
| | | | |
| | | | |
|
Assets | |
Investments in unaffiliated securities, at amortized cost | | $ | 863,820,500 | |
Cash | | | 130,418 | |
Receivable for investments sold | | | 535,000 | |
Receivable for Fund shares sold | | | 366,052 | |
Receivable for interest | | | 1,637,714 | |
Prepaid expenses and other assets | | | 179,927 | |
| | | | |
Total assets | | | 866,669,611 | |
| | | | |
|
Liabilities | |
Payable for investments purchased | | | 22,219,615 | |
Payable for Fund shares redeemed | | | 1,659,244 | |
Dividends payable | | | 120,550 | |
Administration fees payable | | | 76,044 | |
Management fee payable | | | 51,646 | |
Accrued expenses and other liabilities | | | 185,126 | |
| | | | |
Total liabilities | | | 24,312,225 | |
| | | | |
Total net assets | | $ | 842,357,386 | |
| | | | |
|
NET ASSETS CONSIST OF | |
Paid-in capital | | $ | 842,433,824 | |
Overdistributed net investment income | | | (80,188 | ) |
Accumulated net realized gains on investments | | | 3,750 | |
| | | | |
Total net assets | | $ | 842,357,386 | |
| | | | |
|
COMPUTATION OF NET ASSET VALUE PER SHARE | |
Net assets – Class A | | $ | 111,871,592 | |
Shares outstanding – Class A1 | | | 111,859,863 | |
Net asset value per share – Class A | | | $1.00 | |
Net assets – Administrator Class | | $ | 135,992,127 | |
Shares outstanding – Administrator Class1 | | | 135,978,931 | |
Net asset value per share – Administrator Class | | | $1.00 | |
Net assets – Premier Class | | $ | 530,552,235 | |
Shares outstanding – Premier Class1 | | | 530,513,647 | |
Net asset value per share – Premier Class | | | $1.00 | |
Net assets – Service Class | | $ | 63,941,432 | |
Shares outstanding – Service Class1 | | | 63,934,947 | |
Net asset value per share – Service Class | | | $1.00 | |
| 1 | The Fund has an unlimited number of authorized shares. |
The accompanying notes are an integral part of these financial statements.
| | | | |
| 20 | | Wells Fargo National Tax-Free Money Market Fund | | Statement of operations—six months ended July 31, 2018 (unaudited) |
| | | | |
| | | | |
| |
Investment income | | | | |
Interest | | $ | 5,475,510 | |
| | | | |
| |
Expenses | | | | |
Management fee | | | 596,246 | |
Administration fees | |
Class A | | | 127,657 | |
Administrator Class | | | 67,437 | |
Premier Class | | | 191,886 | |
Service Class | | | 38,613 | |
Shareholder servicing fees | |
Class A | | | 145,065 | |
Administrator Class | | | 67,437 | |
Service Class | | | 80,443 | |
Custody and accounting fees | | | 29,443 | |
Professional fees | | | 21,378 | |
Registration fees | | | 67,794 | |
Shareholder report expenses | | | 18,444 | |
Trustees’ fees and expenses | | | 10,965 | |
Other fees and expenses | | | 16,298 | |
| | | | |
Total expenses | | | 1,479,106 | |
Less: Fee waivers and/or expense reimbursements | | | (288,521 | ) |
| | | | |
Net expenses | | | 1,190,585 | |
| | | | |
Net investment income | | | 4,284,925 | |
| | | | |
Net realized gains on investments | | | 3,512 | |
| | | | |
Net increase in net assets resulting from operations | | $ | 4,288,437 | |
| | | | |
The accompanying notes are an integral part of these financial statements.
| | | | | | |
| Statement of changes in net assets | | Wells Fargo National Tax-Free Money Market Fund | | | 21 | |
| | | | | | | | | | | | | | | | |
| | | Six months ended
July 31, 2018 (unaudited) | | | Year ended
January 31, 2018 | |
| |
Operations | | | | | |
Net investment income | | | | | | $ | 4,284,925 | | | | | | | $ | 3,119,381 | |
Net realized gains on investments | | | | | | | 3,512 | | | | | | | | 242,126 | |
| | | | |
Net increase in net assets resulting from operations | | | | | | | 4,288,437 | | | | | | | | 3,361,507 | |
| | | | |
| |
Distributions to shareholders from | | | | | |
Net investment income | |
Class A | | | | | | | (433,529 | ) | | | | | | | (382,804 | ) |
Administrator Class | | | | | | | (725,799 | ) | | | | | | | (905,450 | ) |
Premier Class | | | | | | | (2,828,718 | ) | | | | | | | (1,498,368 | ) |
Service Class | | | | | | | (296,880 | ) | | | | | | | (332,806 | ) |
Net realized gains | | | | | | | | | | | | | | | | |
Class A | | | | | | | 0 | | | | | | | | (54,456 | ) |
Administrator Class | | | | | | | 0 | | | | | | | | (62,316 | ) |
Premier Class | | | | | | | 0 | | | | | | | | (95,599 | ) |
Service Class | | | | | | | 0 | | | | | | | | (29,513 | ) |
| | | | |
Total distributions to shareholders | | | | | | | (4,284,926 | ) | | | | | | | (3,361,312 | ) |
| | | | |
| | | | |
Capital share transactions | | | Shares | | | | | | | | Shares | | | | | |
Proceeds from shares sold | |
Class A | | | 16,194,086 | | | | 16,194,086 | | | | 31,603,673 | | | | 31,603,673 | |
Administrator Class | | | 26,300,919 | | | | 26,300,919 | | | | 34,823,759 | | | | 34,823,759 | |
Premier Class | | | 608,442,531 | | | | 608,442,531 | | | | 535,069,869 | | | | 535,069,869 | |
Service Class | | | 4,009,618 | | | | 4,009,618 | | | | 5,485,972 | | | | 5,485,972 | |
| | | | |
| | | | | | | 654,947,154 | | | | | | | | 606,983,273 | |
| | | | |
Reinvestment of distributions | |
Class A | | | 423,235 | | | | 423,235 | | | | 427,597 | | | | 427,597 | |
Administrator Class | | | 711,113 | | | | 711,113 | | | | 947,752 | | | | 947,752 | |
Premier Class | | | 2,000,033 | | | | 2,000,033 | | | | 1,256,482 | | | | 1,256,482 | |
Service Class | | | 101,538 | | | | 101,538 | | | | 126,990 | | | | 126,990 | |
| | | | |
| | | | | | | 3,235,919 | | | | | | | | 2,758,821 | |
| | | | |
Payment for shares redeemed | | | | | | | | | | | | | | | | |
Class A | | | (24,265,936 | ) | | | (24,265,936 | ) | | | (48,207,213 | ) | | | (48,207,213 | ) |
Administrator Class | | | (23,979,385 | ) | | | (23,979,385 | ) | | | (58,251,726 | ) | | | (58,251,726 | ) |
Premier Class | | | (419,234,945 | ) | | | (419,234,945 | ) | | | (302,887,004 | ) | | | (302,887,004 | ) |
Service Class | | | (6,628,405 | ) | | | (6,628,405 | ) | | | (12,622,551 | ) | | | (12,622,551 | ) |
| | | | |
| | | | | | | (474,108,671 | ) | | | | | | | (421,968,494 | ) |
| | | | |
Net increase in net assets resulting from capital share transactions | | | | | | | 184,074,402 | | | | | | | | 187,773,600 | |
| | | | |
Total increase in net assets | | | | | | | 184,077,913 | | | | | | | | 187,773,795 | |
| | | | |
| | |
Net assets | | | | | | | | |
Beginning of period | | | | | | | 658,279,473 | | | | | | | | 470,505,678 | |
| | | | |
End of period | | | | | | $ | 842,357,386 | | | | | | | $ | 658,279,473 | |
| | | | |
Overdistributed net investment income | | | | | | $ | (80,188 | ) | | | | | | $ | (80,187 | ) |
| | | | |
The accompanying notes are an integral part of these financial statements.
| | | | |
| 22 | | Wells Fargo National Tax-Free Money Market Fund | | Financial highlights |
(For a share outstanding throughout each period)
| | | | | | | | | | | | | | | | | | | | | | | | |
| | | Six months ended
July 31, 2018 (unaudited) | | | Year ended January 31 | |
| CLASS A | | 2018 | | | 2017 | | | 2016 | | | 2015 | | | 2014 | |
Net asset value, beginning of period | | | $1.00 | | | | $1.00 | | | | $1.00 | | | | $1.00 | | | | $1.00 | | | | $1.00 | |
Net investment income | | | 0.00 | 1 | | | 0.00 | 1 | | | 0.00 | 1 | | | 0.00 | 1 | | | 0.00 | 1 | | | 0.00 | 1 |
Net realized gains on investments | | | 0.00 | 1 | | | 0.00 | 1 | | | 0.00 | 1 | | | 0.00 | 1 | | | 0.00 | 1 | | | 0.00 | 1 |
| | | | | | | | | | | | | | | | | | | | | | | | |
Total from investment operations | | | 0.00 | 1 | | | 0.00 | 1 | | | 0.00 | 1 | | | 0.00 | 1 | | | 0.00 | 1 | | | 0.00 | 1 |
Distributions to shareholders from | | | | | | | | | | | | | | | | | | | | | | | | |
Net investment income | | | (0.00 | )1 | | | (0.00 | )1 | | | (0.00 | )1 | | | (0.00 | )1 | | | (0.00 | )1 | | | (0.00 | )1 |
Net realized gains | | | 0.00 | | | | (0.00 | )1 | | | (0.00 | )1 | | | (0.00 | )1 | | | (0.00 | )1 | | | (0.00 | )1 |
| | | | | | | | | | | | | | | | | | | | | | | | |
Total distributions to shareholders | | | (0.00 | )1 | | | (0.00 | )1 | | | (0.00 | )1 | | | (0.00 | )1 | | | (0.00 | )1 | | | (0.00 | )1 |
Net asset value, end of period | | | $1.00 | | | | $1.00 | | | | $1.00 | | | | $1.00 | | | | $1.00 | | | | $1.00 | |
Total return2 | | | 0.37 | % | | | 0.35 | % | | | 0.13 | % | | | 0.02 | % | | | 0.02 | % | | | 0.02 | % |
Ratios to average net assets (annualized) | | | | | | | | | | | | | | | | | | | | | | | | |
Gross expenses | | | 0.66 | % | | | 0.68 | % | | | 0.65 | % | | | 0.63 | % | | | 0.63 | % | | | 0.63 | % |
Net expenses | | | 0.63 | % | | | 0.64 | % | | | 0.39 | % | | | 0.08 | % | | | 0.08 | % | | | 0.12 | % |
Net investment income | | | 0.75 | % | | | 0.30 | % | | | 0.02 | % | | | 0.01 | % | | | 0.01 | % | | | 0.01 | % |
Supplemental data | | | | | | | | | | | | | | | | | | | | | | | | |
Net assets, end of period (000s omitted) | | | $111,872 | | | | $119,524 | | | | $135,704 | | | | $172,725 | | | | $123,525 | | | | $203,609 | |
| 1 | Amount is less than $0.005. |
| 2 | Returns for periods of less than one year are not annualized. |
The accompanying notes are an integral part of these financial statements.
| | | | | | |
| Financial highlights | | Wells Fargo National Tax-Free Money Market Fund | | | 23 | |
(For a share outstanding throughout each period)
| | | | | | | | | | | | | | | | | | | | | | | | |
| | | Six months ended
July 31, 2018 (unaudited) | | | Year ended January 31 | |
| ADMINISTRATOR CLASS | | 2018 | | | 2017 | | | 2016 | | | 2015 | | | 2014 | |
Net asset value, beginning of period | | | $1.00 | | | | $1.00 | | | | $1.00 | | | | $1.00 | | | | $1.00 | | | | $1.00 | |
Net investment income | | | 0.01 | | | | 0.01 | | | | 0.00 | 1 | | | 0.00 | 1 | | | 0.00 | 1 | | | 0.00 | 1 |
Net realized gains on investments | | | 0.00 | 1 | | | 0.00 | 1 | | | 0.00 | 1 | | | 0.00 | 1 | | | 0.00 | 1 | | | 0.00 | 1 |
| | | | | | | | | | | | | | | | | | | | | | | | |
Total from investment operations | | | 0.01 | | | | 0.01 | | | | 0.00 | 1 | | | 0.00 | 1 | | | 0.00 | 1 | | | 0.00 | 1 |
Distributions to shareholders from | | | | | | | | | | | | | | | | | | | | | | | | |
Net investment income | | | (0.01 | ) | | | (0.01 | ) | | | (0.00 | )1 | | | (0.00 | )1 | | | (0.00 | )1 | | | (0.00 | )1 |
Net realized gains | | | 0.00 | | | | (0.00 | )1 | | | (0.00 | )1 | | | (0.00 | )1 | | | (0.00 | )1 | | | (0.00 | )1 |
| | | | | | | | | | | | | | | | | | | | | | | | |
Total distributions to shareholders | | | (0.01 | ) | | | (0.01 | ) | | | (0.00 | )1 | | | (0.00 | )1 | | | (0.00 | )1 | | | (0.00 | )1 |
Net asset value, end of period | | | $1.00 | | | | $1.00 | | | | $1.00 | | | | $1.00 | | | | $1.00 | | | | $1.00 | |
Total return2 | | | 0.53 | % | | | 0.69 | % | | | 0.33 | % | | | 0.02 | % | | | 0.02 | % | | | 0.02 | % |
Ratios to average net assets (annualized) | | | | | | | | | | | | | | | | | | | | | | | | |
Gross expenses | | | 0.39 | % | | | 0.41 | % | | | 0.40 | % | | | 0.36 | % | | | 0.36 | % | | | 0.36 | % |
Net expenses | | | 0.30 | % | | | 0.30 | % | | | 0.27 | % | | | 0.08 | % | | | 0.08 | % | | | 0.11 | % |
Net investment income | | | 1.08 | % | | | 0.64 | % | | | 0.22 | % | | | 0.01 | % | | | 0.01 | % | | | 0.01 | % |
Supplemental data | | | | | | | | | | | | | | | | | | | | | | | | |
Net assets, end of period (000s omitted) | | | $135,992 | | | | $132,964 | | | | $155,448 | | | | $179,171 | | | | $191,766 | | | | $214,788 | |
| 1 | Amount is less than $0.005. |
| 2 | Returns for periods of less than one year are not annualized. |
The accompanying notes are an integral part of these financial statements.
| | | | |
| 24 | | Wells Fargo National Tax-Free Money Market Fund | | Financial highlights |
(For a share outstanding throughout each period)
| | | | | | | | | | | | | | | | | | | | | | | | |
| | | Six months ended
July 31, 2018 (unaudited) | | | Year ended January 31 | |
| PREMIER CLASS1 | | 2018 | | | 2017 | | | 2016 | | | 2015 | | | 2014 | |
Net asset value, beginning of period | | | $1.00 | | | | $1.00 | | | | $1.00 | | | | $1.00 | | | | $1.00 | | | | $1.00 | |
Net investment income | | | 0.01 | | | | 0.01 | | | | 0.00 | 2 | | | 0.00 | 2 | | | 0.00 | 2 | | | 0.00 | 2 |
Net realized gains on investments | | | 0.00 | 2 | | | 0.00 | 2 | | | 0.00 | 2 | | | 0.00 | 2 | | | 0.00 | 2 | | | 0.00 | 2 |
| | | | | | | | | | | | | | | | | | | | | | | | |
Total from investment operations | | | 0.01 | | | | 0.01 | | | | 0.00 | 2 | | | 0.00 | 2 | | | 0.00 | 2 | | | 0.00 | 2 |
Distributions to shareholders from | | | | | | | | | | | | | | | | | | | | | | | | |
Net investment income | | | (0.01 | ) | | | (0.01 | ) | | | (0.00 | )2 | | | (0.00 | )2 | | | (0.00 | )2 | | | (0.00 | )2 |
Net realized gains | | | 0.00 | | | | (0.00 | )2 | | | (0.00 | )2 | | | (0.00 | )2 | | | (0.00 | )2 | | | (0.00 | )2 |
| | | | | | | | | | | | | | | | | | | | | | | | |
Total distributions to shareholders | | | (0.01 | ) | | | (0.01 | ) | | | (0.00 | )2 | | | (0.00 | )2 | | | (0.00 | )2 | | | (0.00 | )2 |
Net asset value, end of period | | | $1.00 | | | | $1.00 | | | | $1.00 | | | | $1.00 | | | | $1.00 | | | | $1.00 | |
Total return3 | | | 0.58 | % | | | 0.79 | % | | | 0.41 | % | | | 0.02 | % | | | 0.02 | % | | | 0.02 | % |
Ratios to average net assets (annualized) | | | | | | | | | | | | | | | | | | | | | | | | |
Gross expenses | | | 0.27 | % | | | 0.28 | % | | | 0.25 | % | | | 0.24 | % | | | 0.24 | % | | | 0.24 | % |
Net expenses | | | 0.20 | % | | | 0.20 | % | | | 0.18 | % | | | 0.08 | % | | | 0.08 | % | | | 0.11 | % |
Net investment income | | | 1.18 | % | | | 0.79 | % | | | 0.18 | % | | | 0.01 | % | | | 0.01 | % | | | 0.01 | % |
Supplemental data | | | | | | | | | | | | | | | | | | | | | | | | |
Net assets, end of period (000s omitted) | | | $530,552 | | | | $339,331 | | | | $105,881 | | | | $1,677,748 | | | | $2,269,187 | | | | $2,292,160 | |
| 1 | Effective April 1, 2016, Institutional Class was renamed Premier Class. |
| 2 | Amount is less than $0.005. |
| 3 | Returns for periods of less than one year are not annualized. |
The accompanying notes are an integral part of these financial statements.
| | | | | | |
| Financial highlights | | Wells Fargo National Tax-Free Money Market Fund | | | 25 | |
(For a share outstanding throughout each period)
| | | | | | | | | | | | | | | | | | | | | | | | |
| | | Six months ended
July 31, 2018 (unaudited) | | | Year ended January 31 | |
| SERVICE CLASS | | 2018 | | | 2017 | | | 2016 | | | 2015 | | | 2014 | |
Net asset value, beginning of period | | | $1.00 | | | | $1.00 | | | | $1.00 | | | | $1.00 | | | | $1.00 | | | | $1.00 | |
Net investment income | | | 0.00 | 1 | | | 0.01 | | | | 0.00 | 1 | | | 0.00 | 1 | | | 0.00 | 1 | | | 0.00 | 1 |
Net realized gains on investments | | | 0.00 | 1 | | | 0.00 | 1 | | | 0.00 | 1 | | | 0.00 | 1 | | | 0.00 | 1 | | | 0.00 | 1 |
| | | | | | | | | | | | | | | | | | | | | | | | |
Total from investment operations | | | 0.00 | 1 | | | 0.01 | | | | 0.00 | 1 | | | 0.00 | 1 | | | 0.00 | 1 | | | 0.00 | 1 |
Distributions to shareholders from | | | | | | | | | | | | | | | | | | | | | | | | |
Net investment income | | | (0.00 | )1 | | | (0.01 | ) | | | (0.00 | )1 | | | (0.00 | )1 | | | (0.00 | )1 | | | (0.00 | )1 |
Net realized gains | | | 0.00 | | | | (0.00 | )1 | | | (0.00 | )1 | | | (0.00 | )1 | | | (0.00 | )1 | | | (0.00 | )1 |
| | | | | | | | | | | | | | | | | | | | | | | | |
Total distributions to shareholders | | | (0.00 | )1 | | | (0.01 | ) | | | (0.00 | )1 | | | (0.00 | )1 | | | (0.00 | )1 | | | (0.00 | )1 |
Net asset value, end of period | | | $1.00 | | | | $1.00 | | | | $1.00 | | | | $1.00 | | | | $1.00 | | | | $1.00 | |
Total return2 | | | 0.46 | % | | | 0.54 | % | | | 0.20 | % | | | 0.02 | % | | | 0.02 | % | | | 0.02 | % |
Ratios to average net assets (annualized) | | | | | | | | | | | | | | | | | | | | | | | | |
Gross expenses | | | 0.56 | % | | | 0.58 | % | | | 0.54 | % | | | 0.53 | % | | | 0.52 | % | | | 0.53 | % |
Net expenses | | | 0.45 | % | | | 0.45 | % | | | 0.32 | % | | | 0.08 | % | | | 0.08 | % | | | 0.12 | % |
Net investment income | | | 0.92 | % | | | 0.49 | % | | | 0.03 | % | | | 0.01 | % | | | 0.01 | % | | | 0.01 | % |
Supplemental data | | | | | | | | | | | | | | | | | | | | | | | | |
Net assets, end of period (000s omitted) | | | $63,941 | | | | $66,460 | | | | $73,472 | | | | $162,593 | | | | $139,915 | | | | $166,178 | |
| 1 | Amount is less than $0.005. |
| 2 | Returns for periods of less than one year are not annualized. |
The accompanying notes are an integral part of these financial statements.
| | | | |
| 26 | | Wells Fargo National Tax-Free Money Market Fund | | Notes to financial statements (unaudited) |
1. ORGANIZATION
Wells Fargo Funds Trust (the “Trust”), a Delaware statutory trust organized on March 10, 1999, is an open-end management investment company registered under the Investment Company Act of 1940, as amended (the “1940 Act”). As an investment company, the Trust follows the accounting and reporting guidance in Financial Accounting Standards Board Accounting Standards Codification Topic 946, Financial Services – Investment Companies. These financial statements report on the Wells Fargo National Tax-Free Money Market Fund (the “Fund”) which is a diversified series of the Trust.
2. SIGNIFICANT ACCOUNTING POLICIES
The following significant accounting policies, which are consistently followed in the preparation of the financial statements of the Fund, are in conformity with U.S. generally accepted accounting principles which require management to make estimates and assumptions that affect the reported amounts of assets and liabilities, disclosure of contingent assets and liabilities at the date of the financial statements, and the reported amounts of revenues and expenses during the reporting period. Actual results could differ from those estimates.
Securities valuation
As permitted under Rule 2a-7 of the 1940 Act, portfolio securities are valued at amortized cost, which approximates fair value. The amortized cost method involves valuing a security at its cost, plus accretion of discount or minus amortization of premium over the period until maturity.
Investments which are not valued using the method discussed above are valued at their fair value, as determined in good faith by the Board of Trustees of the Funds. The Board of Trustees has established a Valuation Committee comprised of the Trustees and has delegated to it the authority to take any actions regarding the valuation of portfolio securities that the Valuation Committee deems necessary or appropriate, including determining the fair value of portfolio securities, unless the determination has been delegated to the Wells Fargo Asset Management Pricing Committee at Wells Fargo Funds Management, LLC (“Funds Management”). The Board of Trustees retains the authority to make or ratify any valuation decisions or approve any changes to the Valuation Procedures as it deems appropriate. On a quarterly basis, the Board of Trustees receives reports on any valuation actions taken by the Valuation Committee or the Wells Fargo Asset Management Pricing Committee which may include items for ratification.
Valuations of fair valued securities are compared to the next actual sales price when available, or other appropriate market values, to assess the continued appropriateness of the fair valuation methodologies used. These securities are fair valued on a day-to-day basis, taking into consideration changes to appropriate market information and any significant changes to the inputs considered in the valuation process until there is a readily available price provided on an exchange or by an independent pricing service. Valuations received from an independent pricing service or independent broker-dealer quotes are periodically validated by comparisons to most recent trades and valuations provided by other independent pricing services in addition to the review of prices by the manager and/or subadviser. Unobservable inputs used in determining fair valuations are identified based on the type of security, taking into consideration factors utilized by market participants in valuing the investment, knowledge about the issuer and the current market environment.
Repurchase agreements
The Fund may invest in repurchase agreements and may participate in pooled repurchase agreement transactions with other funds advised by Funds Management. Repurchase agreements are agreements where the seller of a security to the Fund agrees to repurchase that security from the Fund at a mutually agreed upon time and price. The repurchase agreements must be fully collateralized based on values that are marked-to-market daily. The collateral may be held by an agent bank under a tri-party agreement. It is the custodian’s responsibility to value collateral daily and to take action to obtain additional collateral as necessary to maintain a market value equal to or greater than the resale price. The repurchase agreements are collateralized by instruments such as U.S. Treasury, federal agency, or high-grade corporate obligations. There could be potential loss to the Fund in the event that the Fund is delayed or prevented from exercising its rights to dispose of the collateral, including the risk of a possible decline in the value of the underlying obligations during the period in which the Fund seeks to assert its rights.
Security transactions and income recognition
Securities transactions are recorded on a trade date basis. Realized gains or losses are recorded on the basis of identified cost.
Interest income is accrued daily and bond discounts are accreted and premiums are amortized daily. To the extent debt obligations are placed on non-accrual status, any related interest income may be reduced by writing off interest receivables when the collection of all or a portion of interest has been determined to be doubtful based on consistently
| | | | | | |
| Notes to financial statements (unaudited) | | Wells Fargo National Tax-Free Money Market Fund | | | 27 | |
applied procedures and the fair value has decreased. If the issuer subsequently resumes interest payments or when the collectability of interest is reasonably assured, the debt obligation is removed from non-accrual status.
Distributions to shareholders
Distributions to shareholders from net investment income are declared daily and paid monthly. Distributions from net realized gains, if any, are recorded on the ex-dividend date and paid at least annually. Such distributions are determined in accordance with income tax regulations and may differ from U.S. generally accepted accounting principles. Dividend sources are estimated at the time of declaration. The tax character of distributions is determined as of the Fund’s fiscal year end. Therefore, a portion of the Fund’s distributions made prior to the Fund’s fiscal year end may be categorized as a tax return of capital at year end.
Federal and other taxes
The Fund intends to continue to qualify as a regulated investment company by distributing substantially all of its investment company taxable and tax-exempt income and any net realized capital gains (after reduction for capital loss carryforwards) sufficient to relieve it from all, or substantially all, federal income taxes. Accordingly, no provision for federal income taxes was required.
The Fund’s income and federal excise tax returns and all financial records supporting those returns for the prior three fiscal years are subject to examination by the federal and Delaware revenue authorities. Management has analyzed the Fund’s tax positions taken on federal, state, and foreign tax returns for all open tax years and does not believe that there are any uncertain tax positions that require recognition of a tax liability.
As of July 31, 2018, the cost of investments for federal income tax purposes is substantially the same as for financial reporting purposes.
Class allocations
The separate classes of shares offered by the Fund differ principally in shareholder servicing and administration fees. Class specific expenses are charged directly to that share class. Investment income, common expenses, and realized gains (losses) on investments are allocated daily to each class of shares based on the relative proportion of net assets of each class.
3. FAIR VALUATION MEASUREMENTS
Fair value measurements of investments are determined within a framework that has established a fair value hierarchy based upon the various data inputs utilized in determining the value of the Fund’s investments. The three-level hierarchy gives the highest priority to unadjusted quoted prices in active markets for identical assets or liabilities (Level 1) and the lowest priority to unobservable inputs (Level 3). The Fund’s investments are classified within the fair value hierarchy based on the lowest level of input that is significant to the fair value measurement. The inputs are summarized into three broad levels as follows:
| ∎ | | Level 1 – quoted prices in active markets for identical securities |
| ∎ | | Level 2 – other significant observable inputs (including quoted prices for similar securities, interest rates, prepayment speeds, credit risk, etc.) |
| ∎ | | Level 3 – significant unobservable inputs (including the Fund’s own assumptions in determining the fair value of investments) |
The inputs or methodologies used for valuing investments in securities are not necessarily an indication of the risk associated with investing in those securities.
The following is a summary of the inputs used in valuing the Fund’s assets and liabilities as of July 31, 2018:
| | | | | | | | | | | | | | | | |
| | | Quoted prices
(Level 1) | | | Other significant
observable inputs
(Level 2) | | | Significant
unobservable inputs (Level 3) | | | Total | |
Assets | | | | | | | | | | | | | | | | |
Investments in: | | | | | | | | | | | | | | | | |
| | | | |
Municipal obligations | | $ | 0 | | | $ | 858,820,500 | | | $ | 0 | | | $ | 858,820,500 | |
Repurchase agreements | | | 0 | | | | 5,000,000 | | | | 0 | | | | 5,000,000 | |
Total assets | | $ | 0 | | | $ | 863,820,500 | | | $ | 0 | | | $ | 863,820,500 | |
| | | | |
| 28 | | Wells Fargo National Tax-Free Money Market Fund | | Notes to financial statements (unaudited) |
The Fund recognizes transfers between levels within the fair value hierarchy at the end of the reporting period. At July 31, 2018, the Fund did not have any transfers into/out of Level 1, Level 2, or Level 3.
4. TRANSACTIONS WITH AFFILIATES
Management fee
Funds Management, an indirect wholly owned subsidiary of Wells Fargo & Company (“Wells Fargo”), is the manager of the Fund and provides advisory and fund-level administrative services under an investment management agreement. Under the investment management agreement, Funds Management is responsible for, among other services, implementing the investment objectives and strategies of the Fund, supervising the subadviser and providing fund-level administrative services in connection with the Fund’s operations. As compensation for its services under the investment management agreement, Funds Management is entitled to receive an annual management fee starting at 0.15% and declining to 0.13% as the average daily net assets of the Fund increase. For the six months ended July 31, 2018, the management fee was equivalent to an annual rate of 0.15% of the Fund’s average daily net assets.
Funds Management has retained the services of a subadviser to provide daily portfolio management to the Fund. The fee for subadvisory services is borne by Funds Management. Wells Capital Management Incorporated, an affiliate of Funds Management and an indirect wholly owned subsidiary of Wells Fargo, is the subadviser to the Fund and is entitled to receive a fee from Funds Management at an annual rate starting at 0.05% and declining to 0.01% as the average daily net assets of the Fund increase.
Administration fees
Under a class-level administration agreement, Funds Management provides class-level administrative services to the Fund, which includes paying fees and expenses for services provided by the transfer agent, sub-transfer agents, omnibus account servicers and record-keepers.
As compensation for its services under the class-level administration agreement, Funds Management receives an annual fee which is calculated based on the average daily net assets of each class as follows:
| | | | |
| | | Class-level
administration fee | |
Class A | | | 0.22 | % |
Administrator Class | | | 0.10 | |
Premier Class | | | 0.08 | |
Service Class | | | 0.12 | |
Funds Management has contractually waived and/or reimbursed management and administration fees to the extent necessary to maintain certain net operating expense ratios for the Fund. When each class of the Fund has exceeded its expense cap, Funds Management has waived fees and/or reimbursed expenses from fund level expenses on a proportionate basis and then from class specific expenses; otherwise, waivers and/or reimbursements are applied against class specific expenses before fund level expenses. Funds Management has committed through May 31, 2019 to waive fees and/or reimburse expenses to the extent necessary to cap the Fund’s expenses at 0.60% for Class A shares, 0.30% for Administrator Class shares, 0.20% for Premier Class shares, and 0.45% for Service Class shares. After this time, the cap may be increased or the commitment to maintain the cap may be terminated only with the approval of the Board of Trustees. Prior to June 1, 2018, the Fund’s expenses were capped at 0.64% for Class A shares.
Shareholder servicing fees
The Trust has entered into contracts with one or more shareholder servicing agents, whereby Class A and Service Class of the Fund is charged a fee at an annual rate of 0.25% of the respective average daily net assets of each class. Administrator Class is charged a fee at an annual rate of 0.10% of its average daily net assets.
A portion of these total shareholder servicing fees were paid to affiliates of Wells Fargo.
Interfund transactions
The Fund may purchase or sell portfolio investment securities to certain other Wells Fargo affiliates pursuant to Rule 17a-7 under the 1940 Act and under procedures adopted by the Board of Trustees. The procedures have been designed to ensure that these interfund transactions, which do not incur broker commissions, are effected at current market prices. Pursuant to these procedures, the Fund had $755,003,000 and $530,802,000 in interfund purchases and sales, respectively, during the year ended July 31, 2018.
| | | | | | |
| Notes to financial statements (unaudited) | | Wells Fargo National Tax-Free Money Market Fund | | | 29 | |
5. INDEMNIFICATION
Under the Trust’s organizational documents, the officers and Trustees have been granted certain indemnification rights against certain liabilities that may arise out of performance of their duties to the Trust. Additionally, in the normal course of business, the Trust may enter into contracts with service providers that contain a variety of indemnification clauses. The Trust’s maximum exposure under these arrangements is dependent on future claims that may be made against the Fund and, therefore, cannot be estimated.
| | | | |
| 30 | | Wells Fargo National Tax-Free Money Market Fund | | Other information (unaudited) |
PROXY VOTING INFORMATION
A description of the policies and procedures that the Fund uses to determine how to vote proxies relating to portfolio securities is available, upon request, by calling 1-800-222-8222, visiting our website at wellsfargofunds.com, or visiting the SEC website at sec.gov. Information regarding how the Fund voted proxies relating to portfolio securities during the most recent 12-month period ended June 30 is available on the Fund’s website at wellsfargofunds.com or by visiting the SEC website at sec.gov.
PORTFOLIO HOLDINGS INFORMATION
The complete portfolio holdings for the Fund are publicly available on the Fund’s website (wellsfargofunds.com) on a 1-day delayed basis. The Fund files its complete schedule of portfolio holdings with the SEC for the first and third quarters of each fiscal year on Form N-Q, which is available by visiting the SEC website at sec.gov. In addition, the Fund’s Form N-Q may be reviewed and copied at the SEC’s Public Reference Room in Washington, DC, and at regional offices in New York City, at 233 Broadway, and in Chicago, at 175 West Jackson Boulevard, Suite 900. Information about the Public Reference Room may be obtained by calling 1-800-SEC-0330.
| | | | | | |
| Other information (unaudited) | | Wells Fargo National Tax-Free Money Market Fund | | | 31 | |
BOARD OF TRUSTEES AND OFFICERS
Each of the Trustees and Officers1 listed in the table below acts in identical capacities for each fund in the Wells Fargo family of funds, which consists of 154 mutual funds comprising the Wells Fargo Funds Trust, Wells Fargo Variable Trust, Wells Fargo Master Trust and four closed-end funds (collectively the “Fund Complex”). This table should be read in conjunction with the Prospectus and the Statement of Additional Information2. The mailing address of each Trustee and Officer is 525 Market Street, 12th Floor, San Francisco, CA 94105. Each Trustee and Officer serves an indefinite term, however, each Trustee serves such term until reaching the mandatory retirement age established by the Trustees.
Independent Trustees
| | | | | | |
Name and year of birth | | Position held and length of service* | | Principal occupations during past five years or longer | | Current other public company or
investment company
directorships |
William R. Ebsworth (Born 1957) | | Trustee, since 2015 | | Retired. From 1984 to 2013, equities analyst, portfolio manager, research director and chief investment officer at Fidelity Management and Research Company in Boston, Tokyo, and Hong Kong, and retired in 2013 as Chief Investment Officer of Fidelity Strategic Advisers, Inc. where he led a team of investment professionals managing client assets. Prior thereto, Board member of Hong Kong Securities Clearing Co., Hong Kong Options Clearing Corp., the Thailand International Fund, Ltd., Fidelity Investments Life Insurance Company, and Empire Fidelity Investments Life Insurance Company. Board member of the Forté Foundation (non-profit organization) and the Vincent Memorial Hospital Endowment (non-profit organization), where he serves on the Investment Committee and as a Chair of the Audit Committee. Mr. Ebsworth is a CFA® charterholder. | | Asset Allocation Trust |
Jane A. Freeman (Born 1953) | | Trustee, since 2015; Chair Liaison, since 2018 | | Retired. From 2012 to 2014 and 1999 to 2008, Chief Financial Officer of Scientific Learning Corporation. From 2008 to 2012, Ms. Freeman provided consulting services related to strategic business projects. Prior to 1999, Portfolio Manager at Rockefeller & Co. and Scudder, Stevens & Clark. Board member of the Harding Loevner Funds from 1996 to 2014, serving as both Lead Independent Director and chair of the Audit Committee. Board member of the Russell Exchange Traded Funds Trust from 2011 to 2012 and the chair of the Audit Committee. Ms. Freeman is a Board Member of Ruth Bancroft Garden (non-profit organization) and the Glimmerglass Festival. She is also an inactive Chartered Financial Analyst. | | Asset Allocation Trust |
Isaiah Harris, Jr. (Born 1952) | | Trustee, since 2009 | | Retired. Chairman of the Board of CIGNA Corporation since 2009, and Director since 2005. From 2003 to 2011, Director of Deluxe Corporation. Prior thereto, President and CEO of BellSouth Advertising and Publishing Corp. from 2005 to 2007, President and CEO of BellSouth Enterprises from 2004 to 2005 and President of BellSouth Consumer Services from 2000 to 2003. Emeritus member of the Iowa State University Foundation Board of Governors. Emeritus Member of the Advisory Board of Iowa State University School of Business. Advisory Board Member, Palm Harbor Academy (charter school). Advisory Board Member, Child Evangelism Fellowship (non-profit). Mr. Harris is a certified public accountant (inactive status). | | CIGNA Corporation; Asset Allocation Trust |
Judith M. Johnson (Born 1949) | | Trustee, since 2008; Audit Committee Chairman, since 2009 | | Retired. Prior thereto, Chief Executive Officer and Chief Investment Officer of Minneapolis Employees Retirement Fund from 1996 to 2008. Ms. Johnson is an attorney, certified public accountant and a certified managerial accountant. | | Asset Allocation Trust |
David F. Larcker (Born 1950) | | Trustee, since 2009 | | James Irvin Miller Professor of Accounting at the Graduate School of Business, Stanford University, Director of the Corporate Governance Research Initiative and Senior Faculty of The Rock Center for Corporate Governance since 2006. From 2005 to 2008, Professor of Accounting at the Graduate School of Business, Stanford University. Prior thereto, Ernst & Young Professor of Accounting at The Wharton School, University of Pennsylvania from 1985 to 2005. | | Asset Allocation Trust |
| | | | |
| 32 | | Wells Fargo National Tax-Free Money Market Fund | | Other information (unaudited) |
| | | | | | |
Name and year of birth | | Position held and length of service* | | Principal occupations during past five years or longer | | Current other public company or
investment company
directorships |
Olivia S. Mitchell (Born 1953) | | Trustee, since 2006; Governance Committee Chairman, since 2018 | | International Foundation of Employee Benefit Plans Professor, Wharton School of the University of Pennsylvania since 1993. Director of Wharton’s Pension Research Council and Boettner Center on Pensions & Retirement Research, and Research Associate at the National Bureau of Economic Research. Previously, Cornell University Professor from 1978 to 1993. | | Asset Allocation Trust |
Timothy J. Penny (Born 1951) | | Trustee, since 1996; Chairman, since 2018; Vice Chairman, from 2017 to 2018 | | President and Chief Executive Officer of Southern Minnesota Initiative Foundation, a non-profit organization, since 2007. Member of the Board of Trustees of NorthStar Education Finance, Inc., a non-profit organization, since 2007. | | Asset Allocation Trust |
James G. Polisson (Born 1959) | | Trustee, since 2018; Advisory Board Member, from 2017 to 2018 | | Retired. Chief Marketing Officer, Source (ETF) UK Services, Ltd, from 2015 to 2017. From 2012 to 2015, Principal of The Polisson Group, LLC, a management consulting, corporate advisory and principal investing company. Chief Executive Officer and Managing Director at Russell Investments, Global Exchange Traded Funds from 2010 to 2012. Managing Director of Barclays Global Investors from 1998 to 2010 and Global Chief Marketing Officer for iShares and Barclays Global Investors from 2000 to 2010. Trustee of the San Francisco Mechanics’ Institute, a non-profit organization, from 2013 to 2015. Board member of the Russell Exchange Traded Fund Trust from 2011 to 2012. Director of Barclays Global Investors Holdings Deutschland GmbH from 2006 to 2009. Mr. Polisson is an attorney and has a retired status with the Massachusetts and District of Columbia Bar Associations. | | Asset Allocation Trust |
Michael S. Scofield (Born 1943) | | Trustee, since 2010 | | Served on the Investment Company Institute’s Board of Governors and Executive Committee from 2008-2011 as well the Governing Council of the Independent Directors Council from 2006-2011 and the Independent Directors Council Executive Committee from 2008-2011. Trustee of the Evergreen Fund complex (and its predecessors) from 1984 to 2010. Chairman of the Evergreen Funds from 2000-2010. Former Trustee of the Mentor Funds. Retired Attorney, Law Offices of Michael S. Scofield. | | Asset Allocation Trust |
Pamela Wheelock (Born 1959) | | Trustee, since 2018; Advisory Board Member, from 2017 to 2018 | | Chief Operating Officer, Twin Cities Habitat for Humanity, since January, 2017. Vice President of University Services, University of Minnesota from 2012 to 2017. Prior thereto, on the Board of Directors, Goverance Committee and Finance Committee for the Minnesota Philanthropy Partners (Saint Paul Foundation) from 2012 to 2018, Interim President and Chief Executive Officer of Blue Cross Blue shield of Minnesota of Minnesota from 2010 to 2011, Chairman of the Board from 2009 to 2011 and Board Director 003 to 2015. Vice President, Leadership and Community Engagement, Bush Foundation, Saint Paul, Minnesota (a private foundation) from 2009 to 2011. Executive Vice President and Chief Financial Officer, Minnesota Sports and Entertainment from 2004 to 2009 and Senior Vice President from 2002 to 2004. Commissioner of Finance, State of Minnesota, from 1999 to 2002. Currently the Board Chair of the Minnesota Wild Foundation since 2010. | | Asset Allocation Trust |
| * | Length of service dates reflect the Trustee’s commencement of service with the Trust’s predecessor entities, where applicable. |
| | | | | | |
| Other information (unaudited) | | Wells Fargo National Tax-Free Money Market Fund | | | 33 | |
Officers
| | | | | | |
Name and year of birth | | Position held and
length of service | | Principal occupations during past five years or longer | | |
Andrew Owen (Born 1960) | | President, since 2017 | | Executive Vice President of Wells Fargo & Company and Head of Affiliated Managers, Wells Fargo Asset Management, since 2014. In addition, Mr. Owen is currently President, Chief Executive Officer and Director of Wells Fargo Funds Management, LLC since 2017. Prior thereto, Executive Vice President responsible for marketing, investments and product development for Wells Fargo Funds Management, LLC, from 2009 to 2014. | | |
Nancy Wiser1 (Born 1967) | | Treasurer, since 2012 | | Executive Vice President of Wells Fargo Funds Management, LLC since 2011. Chief Operating Officer and Chief Compliance Officer at LightBox Capital Management LLC, from 2008 to 2011. | | |
Alexander Kymn3 (Born 1973) | | Secretary, since 2018; Chief Legal Officer, since 2018 | | Senior Company Counsel of Wells Fargo Bank, N.A. since 2018 (previously Senior Counsel from 2007 to 2018). Vice President of Wells Fargo Funds Management, LLC from 2008 to 2014. | | |
Michael H. Whitaker (Born 1967) | | Chief Compliance Officer, since 2016 | | Senior Vice President and Chief Compliance Officer since 2016. Senior Vice President and Chief Compliance Officer for Fidelity Investments from 2007 to 2016. | | |
David Berardi (Born 1975) | | Assistant Treasurer, since 2009 | | Vice President of Wells Fargo Funds Management, LLC since 2009. Vice President of Evergreen Investment Management Company, LLC from 2008 to 2010. Manager of Fund Reporting and Control for Evergreen Investment Management Company, LLC from 2004 to 2010. | | |
Jeremy DePalma1 (Born 1974) | | Assistant Treasurer, since 2009 | | Senior Vice President of Wells Fargo Funds Management, LLC since 2009. Senior Vice President of Evergreen Investment Management Company, LLC from 2008 to 2010 and head of the Fund Reporting and Control Team within Fund Administration from 2005 to 2010. | | |
| 1 | Nancy Wiser acts as Treasurer of 77 funds in the Fund Complex. Jeremy DePalma acts as Treasurer of 77 funds and Assistant Treasurer of 77 funds in the Fund Complex. |
| 2 | The Statement of Additional Information includes additional information about the Trustees and is available, without charge, upon request, by calling 1-800-222-8222 or by visiting the website at wellsfargofunds.com. |
| 3 | Alexander Kymn became the Secretary and Chief Legal Officer effective April 17, 2018. |
| | | | |
| 34 | | Wells Fargo National Tax-Free Money Market Fund | | Other information (unaudited) |
BOARD CONSIDERATION OF INVESTMENT MANAGEMENT AND SUB-ADVISORY AGREEMENTS:
Wells Fargo National Tax-Free Money Market Fund
Under the Investment Company Act of 1940 (the “1940 Act”), the Board of Trustees (the “Board”) of Wells Fargo Funds Trust (the “Trust”) must determine annually whether to approve the continuation of the Trust’s investment management and sub-advisory agreements. In this regard, at an in-person meeting held on May 22-23, 2018 (the “Meeting”), the Board, all the members of which have no direct or indirect interest in the investment management and sub-advisory agreements and are not “interested persons” of the Trust, as defined in the 1940 Act (the “Independent Trustees”), reviewed and approved for Wells Fargo National Tax-Free Money Market Fund (the “Fund”): (i) an investment management agreement (the “Management Agreement”) with Wells Fargo Funds Management, LLC (“Funds Management”); and (ii) an investment sub-advisory agreement (the “Sub-Advisory Agreement”) with Wells Capital Management Incorporated (the “Sub-Adviser”), an affiliate of Funds Management. The Management Agreement and the Sub-Advisory Agreement are collectively referred to as the “Advisory Agreements.”
At the Meeting, the Board considered the factors and reached the conclusions described below relating to the selection of Funds Management and the Sub-Adviser and the approval of the Advisory Agreements. Prior to the Meeting, including at an in-person meeting in April 2018, the Trustees conferred extensively among themselves and with representatives of Funds Management about these matters. Also, the Board has adopted a team-based approach, with each team consisting of a sub-set of Trustees, to assist the full Board in the discharge of its duties in reviewing investment performance and other matters throughout the year. The Independent Trustees were assisted in their evaluation of the Advisory Agreements by independent legal counsel, from whom they received separate legal advice and with whom they met separately.
In providing information to the Board, Funds Management and the Sub-Adviser were guided by a detailed set of requests for information submitted to them by independent legal counsel on behalf of the Independent Trustees at the start of the Board’s annual contract renewal process earlier in 2018. In considering and approving the Advisory Agreements, the Trustees considered the information they believed relevant, including but not limited to the information discussed below. The Board considered not only the specific information presented in connection with the Meeting, but also the knowledge gained over time through interaction with Funds Management and the Sub-Adviser about various topics. In this regard, the Board reviewed reports of Funds Management at each of its quarterly meetings, which included, among other things, portfolio reviews and investment performance reports. In addition, the Board and the teams mentioned above confer with portfolio managers at various times throughout the year. The Board did not identify any particular information or consideration that was all-important or controlling, and each individual Trustee may have attributed different weights to various factors.
After its deliberations, the Board unanimously approved the continuation of the Advisory Agreements for a one-year term and determined that the compensation payable to Funds Management and the Sub-Adviser under each of the Advisory Agreements was reasonable. The Board considered the approval of the Advisory Agreements for the Fund as part of its consideration of agreements for funds across the complex, but its approvals were made on a fund-by-fund basis. The following summarizes a number of important, but not necessarily all, factors considered by the Board in support of its approvals.
Nature, extent and quality of services
The Board received and considered various information regarding the nature, extent and quality of services provided to the Fund by Funds Management and the Sub-Adviser under the Advisory Agreements. This information included a description of the investment advisory services and Fund-level administrative services covered by the Management Agreement, as well as, among other things, a summary of the background and experience of senior management of Wells Fargo Asset Management (“WFAM”), of which Funds Management and the Sub-Adviser are a part, a summary of investments made in the business of WFAM, a summary of certain organizational and personnel changes involving Funds Management and the Sub-Adviser, and a description of Funds Management’s and the Sub-Adviser’s business continuity planning programs and of their approaches to data privacy and cybersecurity. The Board also considered the qualifications, background, tenure and responsibilities of each of the portfolio managers primarily responsible for the day-to-day portfolio management of the Fund.
The Board evaluated the ability of Funds Management and the Sub-Adviser to attract and retain qualified investment professionals, including research, advisory and supervisory personnel. The Board further considered the compliance programs and compliance records of Funds Management and the Sub-Adviser. In addition, the Board took into account the full range of services provided to the Fund by Funds Management and its affiliates.
| | | | | | |
| Other information (unaudited) | | Wells Fargo National Tax-Free Money Market Fund | | | 35 | |
Fund investment performance and expenses
The Board considered the investment performance results for the Fund over various time periods ended December 31, 2017. The Board considered these results in comparison to the investment performance of funds in a universe that was determined by Broadridge Inc. (“Broadridge”) to be similar to the Fund (the “Universe”) and to other comparative data. Broadridge is an independent provider of investment company data. The Board received a description of the methodology used by Broadridge to select the mutual funds in the performance Universe. The Board noted that the investment performance of the Fund (Administrator Class) was higher than the average investment performance of the Universe for all periods under review.
The Board also received and considered information regarding the Fund’s net operating expense ratios and their various components, including actual management fees, custodian and other non-management fees, and Rule 12b-1 and non-Rule 12b-1 shareholder service fees. The Board considered these ratios in comparison to the median ratios of funds in class-specific expense groups that were determined by Broadridge to be similar to the Fund (the “Groups”). The Board received a description of the methodology used by Broadridge to select the mutual funds in the expense Groups and an explanation of how funds comprising expense groups and their expense ratios may vary from year-to-year. Based on the Broadridge reports, the Board noted that the net operating expense ratios of the Fund were lower than, equal to, or in range of the median net operating expense ratios of the expense Groups for each share class except Class A. The Board noted that the net operating expense ratio cap for Class A would be reduced.
The Board took into account the Fund’s investment performance and expense information provided to it among the factors considered in deciding to re-approve the Advisory Agreements.
Investment management and sub-advisory fee rates
The Board reviewed and considered the contractual fee rates payable by the Fund to Funds Management under the Management Agreement, as well as the contractual fee rates payable by the Fund to Funds Management for class-level administrative services under a Class-Level Administration Agreement, which include, among other things, class-level transfer agency and sub-transfer agency costs (collectively, the “Management Rates”). The Board also reviewed and considered the contractual investment sub-advisory fee rates that are payable by Funds Management to the Sub-Adviser for investment sub-advisory services.
Among other information reviewed by the Board was a comparison of the Fund’s Management Rates with the average contractual investment management fee rates of funds in the expense Groups at a common asset level as well as transfer agency costs of the funds in the expense Groups. The Board noted that the Management Rates of the Fund were lower than or in range of the sum of these average rates for the Fund’s expense Groups for all share classes.
The Board also received and considered information about the portion of the total management fee that was retained by Funds Management after payment of the fee to the Sub-Adviser for sub-advisory services. In assessing the reasonableness of this amount, the Board received and evaluated information about the nature and extent of responsibilities retained and risks assumed by Funds Management and not delegated to or assumed by the Sub-Adviser, and about Funds Management’s on-going oversight services. Given the affiliation between Funds Management and the Sub-Adviser, the Board ascribed limited relevance to the allocation of fees between them.
Based on its consideration of the factors and information it deemed relevant, including those described here, the Board determined that the compensation payable to Funds Management under the Management Agreement and to the Sub-Adviser under the Sub-Advisory Agreement was reasonable.
Profitability
The Board received and considered information concerning the profitability of Funds Management, as well as the profitability of both WFAM and Wells Fargo & Co. (“Wells Fargo”) as a whole, from providing services to the Fund and the fund family as a whole. The Board noted that the Sub-Adviser’s profitability information with respect to providing services to the Fund was subsumed in the WFAM and Wells Fargo profitability analysis.
Funds Management reported on the methodologies and estimates used in calculating profitability, including a description of the methodology used to allocate certain expenses and recent enhancements made to the methodology. Among other things, the Board noted that the levels of profitability reported on a fund-by-fund basis varied widely, depending on factors such as the size and type of fund. Based on its review, the Board did not deem the profits reported by Funds Management, WFAM or Wells Fargo from services provided to the Fund to be at a level that would prevent it from approving the continuation of the Advisory Agreements.
| | | | |
| 36 | | Wells Fargo National Tax-Free Money Market Fund | | Other information (unaudited) |
Economies of scale
The Board considered the extent to which Funds Management may experience economies of scale in the provision of management services, and the extent to which scale benefits, if any, would be shared with shareholders. In particular, the Board noted the existence of breakpoints in the Fund’s management fee structure, which operate generally to reduce the Fund’s expense ratios as the Fund grows in size. It considered that, for a small fund or a fund that shrinks in size, breakpoints conversely can result in higher fee levels. The Board also considered that in addition to management fee breakpoints, competitive management fee rates set at the outset without regard to breakpoints and fee waiver and expense reimbursement arrangements, as well as investments in the business intended to enhance services available to Fund shareholders, are means of sharing potential economies of scale with shareholders of the Fund.
The Board concluded that the Fund’s fee and expense arrangements, including contractual breakpoints, constituted a reasonable approach to sharing potential economies of scale with the Fund and its shareholders.
Other benefits to Funds Management and the Sub-Adviser
The Board received and considered information regarding potential “fall-out” or ancillary benefits received by Funds Management and its affiliates, including the Sub-Adviser, as a result of their relationships with the Fund. Ancillary benefits could include, among others, benefits directly attributable to other relationships with the Fund and benefits potentially derived from an increase in Funds Management’s and the Sub-Adviser’s business as a result of their relationships with the Fund. The Board noted that various affiliates of Funds Management may receive distribution-related fees, shareholder servicing payments and sub-transfer agency fees in respect of shares sold or held through them and services provided.
The Board also reviewed information about soft dollar credits earned and utilized by the Sub-Adviser, fees earned by Funds Management and the Sub-Adviser from managing a private investment vehicle for the fund family’s securities lending collateral and commissions earned by an affiliated broker from portfolio transactions.
Based on its consideration of the factors and information it deemed relevant, including those described here, the Board did not find that any ancillary benefits received by Funds Management and its affiliates, including the Sub-Adviser, were unreasonable.
Conclusion
At the Meeting, after considering the above-described factors and based on its deliberations and its evaluation of the information described above, the Board unanimously approved the continuation of the Advisory Agreements for a one-year term and determined that the compensation payable to Funds Management and the Sub-Adviser under each of the Advisory Agreements was reasonable.

For more information
More information about Wells Fargo Funds is available free upon request. To obtain literature, please write, email, visit the Fund’s website, or call:
Wells Fargo Funds
P.O. Box 219967
Kansas City, MO 64121-9967
Website: wellsfargofunds.com
Individual investors: 1-800-222-8222
Retail investment professionals: 1-888-877-9275
Institutional investment professionals: 1-866-765-0778
This report and the financial statements contained herein are submitted for the general information of the shareholders of the Fund. If this report is used for promotional purposes, distribution of the report must be accompanied or preceded by a current prospectus. Before investing, please consider the investment objectives, risks, charges, and expenses of the investment. For a current prospectus and, if available, a summary prospectus, containing this information, call 1-800-222-8222 or visit the Fund’s website at wellsfargofunds.com. Read the prospectus carefully before you invest or send money.
Wells Fargo Asset Management (WFAM) is the trade name for certain investment advisory/management firms owned by Wells Fargo & Company. These firms include but are not limited to Wells Capital Management Incorporated and Wells Fargo Funds Management, LLC. Certain products managed by WFAM entities are distributed by Wells Fargo Funds Distributor, LLC (a broker/dealer and Member FINRA).
This material is for general informational and educational purposes only and is NOT intended to provide investment advice or a recommendation of any kind—including a recommendation for any specific investment, strategy, or plan.
NOT FDIC INSURED ◾ NO BANK GUARANTEE ◾ MAY LOSE VALUE
© 2018 Wells Fargo Funds Management, LLC. All rights reserved.
| | |
 | | 314806 09-18 SA309/SAR309 07-18 |
Semi-Annual Report
July 31, 2018

Institutional Money Market Funds

| ∎ | | Wells Fargo Cash Investment Money Market Fund |

Reduce clutter. Save trees.
Sign up for electronic delivery of prospectuses and shareholder reports at wellsfargo.com/advantagedelivery
Contents
The views expressed and any forward-looking statements are as of July 31, 2018, unless otherwise noted, and are those of the Fund managers and/or Wells Fargo Funds Management, LLC. Discussions of individual securities, or the markets generally, or any Wells Fargo Fund are not intended as individual recommendations. Future events or results may vary significantly from those expressed in any forward-looking statements. The views expressed are subject to change at any time in response to changing circumstances in the market. Wells Fargo Funds Management, LLC and the Fund disclaim any obligation to publicly update or revise any views expressed or forward-looking statements.
NOT FDIC INSURED ◾ NO BANK GUARANTEE ◾ MAY LOSE VALUE
| | | | |
| 2 | | Wells Fargo Cash Investment Money Market Fund | | Letter to shareholders (unaudited) |

Andrew Owen
President
Wells Fargo Funds
Yields on money market funds benefited during the period.
During February 2018, the U.S. stock market endured a loss of more than 10% before recovering in March and April.
Dear Shareholder:
We are pleased to offer you this semi-annual report for the Wells Fargo Cash Investment Money Market Fund for the six-month period that ended July 31, 2018. Yields on money market funds benefited during the period. As the U.S. Federal Reserve (the Fed) moved toward a more normalized monetary policy after an extended term of low interest rates following the global financial crisis during 2007 and 2008, its steady pace of interest rate increases helped raise yields on short-term money market instruments.
Globally, stock markets followed a less consistent path during the period. After advancing during the summer and fall of 2017 in a roughly synchronized way, economic growth and stock markets globally diverged during the first seven months of 2018. For fixed-income investors, higher U.S. interest rates, rising inflation, and intensifying global geopolitical tensions tended to restrain taxable bond prices while high-yield and municipal bond investors generally enjoyed positive returns.
For the period, U.S. stocks, as measured by the S&P 500 Index,1 gained 0.70%, and international stocks, as measured by the MSCI ACWI ex USA Index (Net),2 fell 6.66%. Emerging market stocks, as measured by the MSCI EM Index (Net),3 dropped 11.94%. In bond markets, the Bloomberg Barclays U.S. Aggregate Bond Index4 declined 0.45% while fixed-income investments outside the U.S. fell 4.57%, according to the Bloomberg Barclays Global Aggregate ex-USD Index.5 The Bloomberg Barclays Municipal Bond Index6 added 1.18%, and the ICE BofAML U.S. High Yield Index7 was up 0.55%.
Volatility reemerged during the first quarter of 2018 as economic signals were mixed.
The first quarter of 2018 began with stock market gains in January following U.S. tax reform that lowered rates for individuals and corporations and deregulation advanced in some economic sectors. Then, investor optimism was supplanted by several concerns. Trade tensions intensified, particularly between the U.S. and China. The U.S. threatened to impose tariffs on a broad range of imported products. Increasing interest rates and inflation also caused concern. During February 2018, the U.S. stock market endured a loss of more than 10% before recovering in March and April. The S&P 500 Index closed the first quarter with a negative return, the first negative quarterly return for the index since 2014.
| 1 | The S&P 500 Index consists of 500 stocks chosen for market size, liquidity, and industry group representation. It is a market-value-weighted index with each stock’s weight in the index proportionate to its market value. You cannot invest directly in an index. |
| 2 | The Morgan Stanley Capital International (MSCI) All Country World Index (ACWI) ex USA Index (Net) is a free-float-adjusted market-capitalization-weighted index that is designed to measure the equity market performance of developed markets, excluding the United States and Canada. Source: MSCI. MSCI makes no express or implied warranties or representations and shall have no liability whatsoever with respect to any MSCI data contained herein. The MSCI data may not be further redistributed or used as a basis for other indices or any securities or financial products. This report is not approved, reviewed, or produced by MSCI. You cannot invest directly in an index. |
| 3 | The MSCI Emerging Markets (EM) Index (Net) is a free-float-adjusted market-capitalization-weighted index that is designed to measure large- and mid-cap equity market performance of emerging markets. The MSCI EM Index (Net) consists of the following 24 emerging market country indices: Brazil, Chile, China, Colombia, Czech Republic, Egypt, Greece, Hungary, India, Indonesia, Korea, Malaysia, Mexico, Pakistan, Peru, the Philippines, Poland, Qatar, Russia, South Africa, Taiwan, Thailand, Turkey, and the United Arab Emirates. You cannot invest directly in an index. |
| 4 | The Bloomberg Barclays U.S. Aggregate Bond Index is a broad-based benchmark that measures the investment-grade, U.S. dollar-denominated, fixed-rate taxable bond market, including Treasuries, government-related and corporate securities, mortgage-backed securities (agency fixed-rate and hybrid adjustable-rate mortgage pass-throughs), asset-backed securities, and commercial mortgage-backed securities. You cannot invest directly in an index. |
| 5 | The Bloomberg Barclays Global Aggregate ex-USD Index is an unmanaged index that provides a broad-based measure of the global investment-grade fixed-income markets excluding the U.S. dollar-denominated debt market. You cannot invest directly in an index. |
| 6 | The Bloomberg Barclays Municipal Bond Index is an unmanaged index composed of long-term tax-exempt bonds with a minimum credit rating of Baa. You cannot invest directly in an index. |
| 7 | The ICE BofAML U.S. High Yield Index is a market-capitalization-weighted index of domestic and Yankee high-yield bonds. The index tracks the performance of high-yield securities traded in the U.S. bond market. You cannot invest directly in an index. Copyright 2018. ICE Data Indices, LLC. All rights reserved. |
| 8 | The Consumer Price Index For All Urban Consumers (CPI-U) measures the changes in the price of a basket of goods and services purchased by urban consumers. The urban consumer population is deemed by many as a better representative measure of the general public because most of the country’s population lives in highly populated areas, which represent close to 90% of the total population. You cannot invest directly in an index. |
| | | | | | |
| Letter to shareholders (unaudited) | | Wells Fargo Cash Investment Money Market Fund | | | 3 | |
The Fed increased the federal funds rate by 25 basis points (bps; 100 bps equal 1.00%) in March 2018 and the rate of inflation reached the Fed’s 2% target for the first time in a year. The unemployment rate fell to 4.1%. The third revision of first- quarter gross domestic product (GDP) growth by the U.S. Bureau of Economic Analysis released during June 2018 was lowered to 2.0%.
Overseas, investment market returns reversed the strong returns of 2017. After having gained 27.19% for the 12-month period that ended on December 31, 2017, the MSCI ACWI ex USA Index (Net) fell 1.46% for the seven-month period that ended July 31, 2018. The U.S. dollar strengthened relative to local currencies, which served to restrain returns.
Global trade tensions escalated during the second quarter and into the third quarter of 2018.
Global trade tensions escalated as the second quarter of 2018 opened and equity markets fell in response before resuming upward momentum later in April. The U.S. government imposed tariffs on products and commodities imported from other markets in North America, Europe, and Asia. In retaliation, governments imposed tariffs on U.S. products and commodities. In addition, the U.S. pushed its North American neighbors to renegotiate the North American Free Trade Agreement, furthering trade tensions and investor uncertainty.
The CPI-U8 added 0.2% in May after a similar increase in April. On a year-over-year basis, the all-items index rose 2.8% for the 12 months that ended May 31, continuing its upward trend since the beginning of the year. The index for all items less food and energy rose 2.2% for the same 12-month period. Interest rates generally increased and the bond markets tended to decline.
During June 2018, the Fed increased the federal funds rate by 25 bps. Investment markets began to anticipate two more rate increases in 2018. Long-term interest rates in the U.S. trended higher—rates on the 10-year and 30-year Treasury bonds moved from 2.46% and 2.81%, respectively, on January 1, 2018, to 2.96% and 3.08%, respectively, on July 31, 2018. While higher at the end of the period, rates were off their peak levels on May 17, 2018, of 3.11% and 3.25%, respectively. Investors became more aware of and concerned about the potential for an inverted yield curve—sometimes a recession signal—as short-term rates increased more quickly than long-term rates.
The unemployment rate fell to 3.9% in July after ticking up slightly in June from May’s 3.8% level, according to the U.S. Department of Labor. The annualized rate of GDP growth for the second quarter of 2018 was reported in July to be 4.1%, the highest level since the third quarter of 2014, according to the U.S. Bureau of Economic Analysis.
Internationally, the prospects for a smooth U.K. Brexit agreement was cast into doubt as members of Prime Minister Theresa May’s negotiating team resigned. Despite the uncertainty, the period closed with expectations that the Bank of England’s Monetary Policy Committee in July would announce an increase in its key interest rate to 0.75%, which it did in early August.
Meanwhile, central banks in Europe and Japan maintained low interest rates and accommodative monetary policies. Amid rising trade uncertainty, People’s Bank of China monetary policies shifted with cuts to reserve requirement ratios and implementation of supportive measures such as accelerated infrastructure spending and tax cuts for small and medium enterprises and for individuals. Nevertheless, a strengthening U.S. dollar and the tensions associated with trade policies remained headwinds for investors overseas.
| | | | |
| 4 | | Wells Fargo Cash Investment Money Market Fund | | Letter to shareholders (unaudited) |
Don’t let short-term uncertainty derail long-term investment goals.
Periods of investment uncertainty can present challenges, but experience has taught us that maintaining long-term investment goals can be an effective way to plan for the future. To help you create a sound strategy based on your personal goals and risk tolerance, Wells Fargo Funds offers more than 100 mutual funds spanning a wide range of asset classes and investment styles. Although diversification cannot guarantee an investment profit or prevent losses, we believe it can be an effective way to manage investment risk and potentially smooth out overall portfolio performance. We encourage investors to know their investments and to understand that appropriate levels of risk-taking may unlock opportunities.
Thank you for choosing to invest with Wells Fargo Funds. We appreciate your confidence in us and remain committed to helping you meet your financial needs.
Sincerely,

Andrew Owen
President
Wells Fargo Funds
For further information about your Fund, contact your investment professional, visit our website at wellsfargofunds.com, or call us directly at 1-800-222-8222.
This page is intentionally left blank.
| | | | |
| 6 | | Wells Fargo Cash Investment Money Market Fund | | Performance highlights (unaudited) |
Investment objective
The Fund seeks current income, while preserving capital and liquidity.
Manager
Wells Fargo Funds Management, LLC
Subadvisers
Wells Capital Management Incorporated
Wells Capital Management Singapore
Portfolio managers
Michael C. Bird, CFA®
Jeffrey L. Weaver, CFA®
Laurie White
Average annual total returns (%) as of July 31, 2018
| | | | | | | | | | | | | | | | | | | | | | |
| | | | | | | | Expense ratios1 (%) | |
| | | Inception date | | 1 year | | | 5 year | | | 10 year | | | Gross | | | Net2 | |
| Administrator Class (WFAXX) | | 7-31-2003 | | | 1.40 | | | | 0.44 | | | | 0.36 | | | | 0.38 | | | | 0.35 | |
| Institutional Class (WFIXX) | | 10-14-1987 | | | 1.53 | | | | 0.51 | | | | 0.44 | | | | 0.26 | | | | 0.20 | |
| Select Class (WFQXX) | | 6-29-2007 | | | 1.60 | | | | 0.58 | | | | 0.51 | | | | 0.22 | | | | 0.13 | |
| Service Class (NWIXX) | | 10-14-1987 | | | 1.23 | | | | 0.35 | | | | 0.29 | | | | 0.55 | | | | 0.50 | |
Yield summary (%) as of July 31, 20182
| | | | | | | | | | | | | | |
| | | Administrator
Class | | Institutional
Class | | | Select
Class | | | Service
Class | |
| 7-day current yield | | 1.90 | | | 2.03 | | | | 2.10 | | | | 1.73 | |
| 7-day compound yield | | 1.91 | | | 2.05 | | | | 2.12 | | | | 1.74 | |
| 30-day simple yield | | 1.90 | | | 2.03 | | | | 2.10 | | | | 1.73 | |
| 30-day compound yield | | 1.91 | | | 2.05 | | | | 2.12 | | | | 1.74 | |
Figures quoted represent past performance, which is no guarantee of future results, and do not reflect taxes that a shareholder may pay on fund distributions or the redemption of fund shares. Investment returns will fluctuate. The Fund’s yield figures more closely reflect the current earnings of the Fund than the total return figures. Current performance may be lower or higher than the performance data quoted, which assumes the reinvestment of dividends and capital gains. Current month-end performance is available on the Fund’s website, wellsfargofunds.com.
Each class is sold without a front-end sales charge or contingent deferred sales charge.
For floating NAV money market funds: You could lose money by investing in the Fund. Because the share price of the Fund will fluctuate, when you sell your shares they may be worth more or less than what you originally paid for them. The Fund may impose a fee upon sale of your shares or may temporarily suspend your ability to sell shares if the Fund’s liquidity falls below required minimums because of market conditions or other factors. An investment in the Fund is not insured or guaranteed by the Federal Deposit Insurance Corporation or any other government agency. The Fund’s sponsor has no legal obligation to provide financial support to the Fund, and you should not expect that the sponsor will provide financial support to the Fund at any time.
Please see footnotes on page 7.
| | | | | | |
| Performance highlights (unaudited) | | Wells Fargo Cash Investment Money Market Fund | | | 7 | |
|
| Portfolio composition as of July 31, 20183 |
|
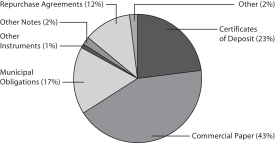 |
|
| Effective maturity distribution as of July 31, 20183 |
|
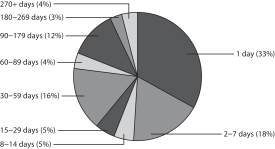 |
|
| Weighted average maturity as of July 31, 20184 |
14 Days |
|
| Weighted average life as of July 31, 20185 |
50 Days |
| 1 | Reflects the expense ratios as stated in the most recent prospectuses. The expense ratios shown are subject to change and may differ from the annualized expense ratios shown in the financial highlights of this report. |
| 2 | The manager has contractually committed through May 31, 2019, to waive fees and/or reimburse expenses to the extent necessary to cap the Fund’s Total Annual Fund Operating Expenses After Fee Waivers at the amounts shown. After this time, the cap may be increased or the commitment to maintain the cap may be terminated only with the approval of the Board of Trustees. Brokerage commissions, stamp duty fees, interest, taxes, acquired fund fees and expenses (if any), and extraordinary expenses are excluded from the expense cap. Without this cap, the Fund’s returns would have been lower. Without waived fees and/or reimbursed expenses, the Fund’s 7-day current yield would have been 1.86%, 1.98%, 2.02%, and 1.69% for Administrator Class, Institutional Class, Select Class, and Service Class, respectively. The expense ratio paid by an investor is the net expense ratio (the total annual fund operating expenses after fee waivers) as stated in the prospectuses. |
| 3 | Amounts are calculated based on the total investments of the Fund. These amounts are subject to change and may have changed since the date specified. |
| 4 | Weighted Average Maturity (WAM): WAM is an average of the effective maturities of all securities held in the portfolio, weighted by each security’s percentage of total investments. The maturity of a portfolio security is the period remaining until the date on which the principal amount is unconditionally required to be paid, or in the case of a security called for redemption, the date on which the redemption payment is unconditionally required to be made. WAM calculations allow for the maturities of certain securities with demand features or periodic interest rate resets to be shortened. WAM is a way to measure a fund’s sensitivity to potential interest rate changes. WAM is subject to change and may have changed since the date specified. |
| 5 | Weighted Average Life (WAL): WAL is an average of the final maturities of all securities held in the portfolio, weighted by their percentage of total investments. The maturity of a portfolio security is the period remaining until the date on which the principal amount is unconditionally required to be paid, or in the case of a security called for redemption, the date on which the redemption payment is unconditionally required to be made. In contrast to WAM, the calculation of WAL allows for the maturities of certain securities with demand features to be shortened, but not the periodic interest rate resets. WAL is a way to measure a fund’s potential sensitivity to credit spread changes. WAL is subject to change and may have changed since the date specified. |
| | | | |
| 8 | | Wells Fargo Cash Investment Money Market Fund | | Fund expenses (unaudited) |
As a shareholder of the Fund, you incur ongoing costs, including management fees, shareholder servicing fees, and other Fund expenses. This example is intended to help you understand your ongoing costs (in dollars) of investing in the Fund and to compare these costs with the ongoing costs of investing in other mutual funds.
The example is based on an investment of $1,000 invested at the beginning of the six-month period and held for the entire period from February 1, 2018 to July 31, 2018.
Actual expenses
The “Actual” line of the table below provides information about actual account values and actual expenses. You may use the information in this line, together with the amount you invested, to estimate the expenses that you paid over the period. Simply divide your account value by $1,000 (for example, an $8,600 account value divided by $1,000 = 8.6), then multiply the result by the number in the “Actual” line under the heading entitled “Expenses paid during period” for your applicable class of shares to estimate the expenses you paid on your account during this period.
Hypothetical example for comparison purposes
The “Hypothetical” line of the table below provides information about hypothetical account values and hypothetical expenses based on the Fund’s actual expense ratio and an assumed rate of return of 5% per year before expenses, which is not the Fund’s actual return. The hypothetical account values and expenses may not be used to estimate the actual ending account balance or expenses you paid for the period. You may use this information to compare the ongoing costs of investing in the Fund and other funds. To do so, compare this 5% hypothetical example with the 5% hypothetical examples that appear in the shareholder reports of the other funds.
Please note that the expenses shown in the table are meant to highlight your ongoing costs only. Therefore, the “Hypothetical” line of the table is useful in comparing ongoing costs only and will not help you determine the relative total costs of owning different funds.
| | | | | | | | | | | | | | | | |
| | | Beginning
account value
2-1-2018 | | | Ending account value
7-31-2018 | | | Expenses
paid during
the period¹ | | | Annualized net
expense ratio | |
Administrator Class | | | | | | | | | | | | | | | | |
Actual | | $ | 1,000.00 | | | $ | 1,008.32 | | | $ | 1.67 | | | | 0.33 | % |
Hypothetical (5% return before expenses) | | $ | 1,000.00 | | | $ | 1,023.54 | | | $ | 1.68 | | | | 0.33 | % |
Institutional Class | | | | | | | | | | | | | | | | |
Actual | | $ | 1,000.00 | | | $ | 1,008.97 | | | $ | 1.01 | | | | 0.20 | % |
Hypothetical (5% return before expenses) | | $ | 1,000.00 | | | $ | 1,024.20 | | | $ | 1.02 | | | | 0.20 | % |
Select Class | | | | | | | | | | | | | | | | |
Actual | | $ | 1,000.00 | | | $ | 1,009.32 | | | $ | 0.66 | | | | 0.13 | % |
Hypothetical (5% return before expenses) | | $ | 1,000.00 | | | $ | 1,024.55 | | | $ | 0.66 | | | | 0.13 | % |
Service Class | | | | | | | | | | | | | | | | |
Actual | | $ | 1,000.00 | | | $ | 1,007.47 | | | $ | 2.53 | | | | 0.50 | % |
Hypothetical (5% return before expenses) | | $ | 1,000.00 | | | $ | 1,022.68 | | | $ | 2.55 | | | | 0.50 | % |
| 1 | Expenses paid is equal to the annualized net expense ratio of each class multiplied by the average account value over the period, multiplied by the number of days in the most recent fiscal half-year divided by the number of days in the fiscal year (to reflect the one-half-year period). |
| | | | | | |
| Portfolio of investments—July 31, 2018 (unaudited) | | Wells Fargo Cash Investment Money Market Fund | | | 9 | |
| | | | | | | | | | | | | | | | |
| Security name | | Interest rate | | | Maturity date | | | Principal | | | Value | |
| | | |
Certificates of Deposit: 22.54% | | | | | | | | | | | | | |
ABN AMRO Funding LLC | | | 1.95 | % | | | 8-1-2018 | | | $ | 34,000,000 | | | $ | 34,000,000 | |
Australia & New Zealand Banking Group | | | 1.89 | | | | 8-1-2018 | | | | 30,000,000 | | | | 30,000,000 | |
BNP Paribas (3 Month LIBOR +0.15%) ± | | | 2.49 | | | | 9-28-2018 | | | | 9,000,000 | | | | 9,001,337 | |
China Construction Bank Corporation NY (1 Month LIBOR +0.25%) ± | | | 2.34 | | | | 7-19-2019 | | | | 15,000,000 | | | | 14,999,333 | |
Commonwealth Bank of Australia (3 Month LIBOR +0.25%) ± | | | 2.59 | | | | 4-3-2019 | | | | 8,000,000 | | | | 8,008,470 | |
Credit Industriel et Commercial (z) | | | 2.28 | | | | 8-20-2018 | | | | 7,000,000 | | | | 6,992,328 | |
Credit Suisse AG (3 Month LIBOR +0.10%) ± | | | 2.43 | | | | 9-21-2018 | | | | 8,000,000 | | | | 8,000,478 | |
DNB Nor Bank ASA | | | 2.26 | | | | 8-1-2018 | | | | 4,000,000 | | | | 4,000,000 | |
HSBC Bank plc | | | 1.95 | | | | 8-1-2018 | | | | 22,000,000 | | | | 22,000,000 | |
HSBC Bank plc (1 Month LIBOR +0.20%) ± | | | 2.30 | | | | 8-9-2018 | | | | 5,000,000 | | | | 5,000,366 | |
HSBC Bank plc (3 Month LIBOR +0.18%) ± | | | 2.54 | | | | 5-10-2019 | | | | 7,500,000 | | | | 7,499,419 | |
KBC Bank | | | 2.20 | | | | 9-12-2018 | | | | 12,000,000 | | | | 12,001,152 | |
Mitsubishi Trust & Bank (1 Month LIBOR +0.23%) ± | | | 2.30 | | | | 1-17-2019 | | | | 10,000,000 | | | | 10,001,325 | |
Mitsubishi Trust & Bank (1 Month LIBOR +0.30%) ± | | | 2.37 | | | | 1-14-2019 | | | | 10,000,000 | | | | 10,004,504 | |
Mizuho Bank Limited (1 Month LIBOR +0.25%) ± | | | 2.32 | | | | 11-26-2018 | | | | 10,000,000 | | | | 10,001,999 | |
Mizuho Bank Limited (1 Month LIBOR +0.44%) ± | | | 2.53 | | | | 10-10-2018 | | | | 7,000,000 | | | | 7,004,323 | |
National Bank of Kuwait | | | 1.91 | | | | 8-1-2018 | | | | 11,875,000 | | | | 11,875,000 | |
Natixis (1 Month LIBOR +0.25%) ± | | | 2.35 | | | | 12-10-2018 | | | | 10,000,000 | | | | 10,001,746 | |
Natixis (1 Month LIBOR +0.44%) ± | | | 2.51 | | | | 9-17-2018 | | | | 7,000,000 | | | | 7,004,130 | |
Norinchukin Bank (1 Month LIBOR +0.30%) ± | | | 2.39 | | | | 9-10-2018 | | | | 8,000,000 | | | | 8,002,970 | |
Oversea-Chinese Banking Corporation (1 Month LIBOR +0.30%) ± | | | 2.39 | | | | 9-6-2018 | | | | 8,000,000 | | | | 8,001,562 | |
Sumitomo Mitsui Banking Corporation (1 Month LIBOR +0.25%) ± | | | 2.35 | | | | 9-7-2018 | | | | 8,000,000 | | | | 8,001,464 | |
Sumitomo Mitsui Trust NY (3 Month LIBOR +0.05%) ± | | | 2.37 | | | | 12-4-2018 | | | | 14,000,000 | | | | 14,002,314 | |
Sumitomo Mitsui Trust NY (1 Month LIBOR +0.43%) ± | | | 2.51 | | | | 10-11-2018 | | | | 15,000,000 | | | | 15,007,679 | |
Svenska Handelsbanken (1 Month LIBOR +0.17%) ± | | | 2.24 | | | | 8-24-2018 | | | | 10,000,000 | | | | 10,001,493 | |
Svenska Handelsbanken (1 Month LIBOR +0.16%) ± | | | 2.25 | | | | 9-6-2018 | | | | 8,000,000 | | | | 8,001,652 | |
Toronto Dominion Bank (1 Month LIBOR +0.20%) ± | | | 2.29 | | | | 8-10-2018 | | | | 10,000,000 | | | | 10,000,788 | |
Toronto Dominion Bank (1 Month LIBOR +0.23%) ± | | | 2.32 | | | | 12-6-2018 | | | | 8,000,000 | | | | 8,001,754 | |
| | | |
Total Certificates of Deposit (Cost $316,366,610) | | | | | | | | | | | | 316,417,586 | |
| | | | | | | | | | | | | | | | |
|
Commercial Paper: 43.29% | |
|
| Asset-Backed Commercial Paper: 22.07% | |
Albion Capital Corporation (z) | | | 2.07 | | | | 8-16-2018 | | | | 4,000,000 | | | | 3,996,728 | |
Albion Capital Corporation (z) | | | 2.13 | | | | 8-20-2018 | | | | 5,000,000 | | | | 4,994,793 | |
Alpine Securitization Limited (1 Month LIBOR +0.33%) ±144A | | | 2.42 | | | | 9-6-2018 | | | | 20,000,000 | | | | 20,000,157 | |
Anglesea Funding LLC (1 Month LIBOR +0.23%) ±144A | | | 2.32 | | | | 1-2-2019 | | | | 5,000,000 | | | | 4,999,902 | |
Anglesea Funding LLC (1 Month LIBOR +0.23%) ±144A | | | 2.32 | | | | 12-28-2018 | | | | 15,000,000 | | | | 14,999,779 | |
Anglesea Funding LLC (1 Month LIBOR +0.27%) ±144A | | | 2.34 | | | | 10-23-2018 | | | | 8,000,000 | | | | 7,999,822 | |
Antalis SA 144A(z) | | | 2.21 | | | | 8-20-2018 | | | | 6,000,000 | | | | 5,993,562 | |
Antalis SA 144A(z) | | | 2.36 | | | | 8-9-2018 | | | | 8,000,000 | | | | 7,996,450 | |
Atlantic Asset Securitization Corporation (1 Month LIBOR +0.32%) ±144A | | | 2.41 | | | | 11-1-2018 | | | | 11,000,000 | | | | 11,006,174 | |
Bedford Row Funding Corporation (1 Month LIBOR +0.34%) ±144A | | | 2.43 | | | | 6-10-2019 | | | | 5,000,000 | | | | 5,003,328 | |
Bennington Stark Capital Company 144A(z) | | | 2.33 | | | | 8-22-2018 | | | | 7,000,000 | | | | 6,991,552 | |
Cedar Spring Capital Company 144A(z) | | | 2.15 | | | | 8-3-2018 | | | | 10,000,000 | | | | 9,998,861 | |
Chesham Finance Limited 144A(z) | | | 2.00 | | | | 8-1-2018 | | | | 36,000,000 | | | | 36,000,000 | |
Collateralized Commercial Paper II Company LLC (3 Month LIBOR +0.22%) ±144A | | | 2.56 | | | | 1-2-2019 | | | | 11,000,000 | | | | 11,007,365 | |
Concord Minutemen Capital Company LLC 144A(z) | | | 2.38 | | | | 10-29-2018 | | | | 4,000,000 | | | | 3,977,157 | |
Crown Point Capital Company LLC (1 Month LIBOR +0.37%) ±144A | | | 2.45 | | | | 9-19-2018 | | | | 22,000,000 | | | | 21,999,483 | |
Gotham Funding Corporation 144A(z) | | | 2.12 | | | | 8-10-2018 | | | | 2,000,000 | | | | 1,999,006 | |
The accompanying notes are an integral part of these financial statements.
| | | | |
| 10 | | Wells Fargo Cash Investment Money Market Fund | | Portfolio of investments—July 31, 2018 (unaudited) |
| | | | | | | | | | | | | | | | |
| Security name | | Interest rate | | | Maturity date | | | Principal | | | Value | |
| | | |
| Asset-Backed Commercial Paper (continued) | | | | | | | | | | | | | |
Great Bridge Capital Company LLC 144A(z) | | | 2.41 | % | | | 9-18-2018 | | | $ | 7,000,000 | | | $ | 6,979,784 | |
Institutional Secured Funding LLC 144A(z) | | | 2.04 | | | | 8-1-2018 | | | | 22,000,000 | | | | 22,000,000 | |
Institutional Secured Funding LLC 144A(z) | | | 2.10 | | | | 8-2-2018 | | | | 10,000,000 | | | | 9,999,453 | |
Kells Funding LLC 144A(z) | | | 2.25 | | | | 10-9-2018 | | | | 5,000,000 | | | | 4,979,329 | |
Lexington Parker Capital 144A(z) | | | 2.16 | | | | 9-7-2018 | | | | 8,000,000 | | | | 7,982,791 | |
Manhattan Asset Funding Company LLC 144A(z) | | | 2.12 | | | | 8-7-2018 | | | | 7,000,000 | | | | 6,997,713 | |
Matchpoint Finance plc 144A(z) | | | 1.95 | | | | 8-1-2018 | | | | 18,000,000 | | | | 18,000,000 | |
Mountcliff Funding LLC 144A(z) | | | 2.00 | | | | 8-1-2018 | | | | 11,000,000 | | | | 11,000,000 | |
Mountcliff Funding LLC (1 Month LIBOR +0.25%) ±144A | | | 2.33 | | | | 2-28-2019 | | | | 5,000,000 | | | | 5,000,000 | |
Old Line Funding LLC (1 Month LIBOR +0.21%) ±144A | | | 2.29 | | | | 8-23-2018 | | | | 7,000,000 | | | | 7,001,234 | |
Old Line Funding LLC (1 Month LIBOR +0.21%) ±144A | | | 2.30 | | | | 8-6-2018 | | | | 8,000,000 | | | | 8,000,374 | |
Old Line Funding LLC (1 Month LIBOR +0.45%) ±144A | | | 2.52 | | | | 9-24-2018 | | | | 8,000,000 | | | | 8,001,738 | |
White Plains Capital 144A(z) | | | 2.36 | | | | 9-5-2018 | | | | 8,000,000 | | | | 7,981,909 | |
White Plains Capital 144A(z) | | | 2.54 | | | | 10-10-2018 | | | | 7,000,000 | | | | 6,966,653 | |
| | | | |
| | | | | | | | | | | | | | | 309,855,097 | |
| | | | | | | | | | | | | | | | |
| | | |
| Financial Company Commercial Paper: 16.81% | | | | | | | | | | | | | |
ASB Finance Limited (3 Month LIBOR +0.20%) ±144A | | | 2.53 | | | | 4-11-2019 | | | | 6,000,000 | | | | 6,002,034 | |
Australia & New Zealand Banking Group (1 Month LIBOR +0.17%) ±144A | | | 2.24 | | | | 8-14-2018 | | | | 10,000,000 | | | | 10,000,943 | |
Banco Santander Chile 144A(z) | | | 2.41 | | | | 9-20-2018 | | | | 7,000,000 | | | | 6,977,931 | |
Bank of Nova Scotia (3 Month LIBOR +0.21%) ±144A | | | 2.54 | | | | 12-21-2018 | | | | 8,000,000 | | | | 8,004,280 | |
Commonwealth Bank of Australia (3 Month LIBOR +0.10%) ±144A | | | 2.46 | | | | 5-3-2019 | | | | 8,000,000 | | | | 7,999,998 | |
DBS Bank Limited 144A(z) | | | 2.27 | | | | 10-19-2018 | | | | 7,000,000 | | | | 6,965,852 | |
Federation des Caisses 144A(z) | | | 2.08 | | | | 8-1-2018 | | | | 4,000,000 | | | | 4,000,000 | |
Federation des Caisses (1 Month LIBOR +0.26%) ±144A | | | 2.34 | | | | 2-11-2019 | | | | 8,000,000 | | | | 8,002,584 | |
Federation des Caisses (1 Month LIBOR +0.30%) ±144A | | | 2.36 | | | | 6-25-2019 | | | | 8,000,000 | | | | 8,001,512 | |
Federation des Caisses (3 Month LIBOR +0.13%) ±144A | | | 2.46 | | | | 5-22-2019 | | | | 4,000,000 | | | | 3,999,668 | |
HSBC Bank plc (1 Month LIBOR +0.42%) ±144A | | | 2.52 | | | | 5-7-2019 | | | | 8,000,000 | | | | 8,010,781 | |
ING Funding LLC (3 Month LIBOR +0.16%) ± | | | 2.50 | | | | 1-7-2019 | | | | 10,000,000 | | | | 10,004,747 | |
ING Funding LLC (1 Month LIBOR +0.25%) ± | | | 2.33 | | | | 2-11-2019 | | | | 8,000,000 | | | | 8,000,900 | |
Intercontinental Exchange 144A(z) | | | 1.95 | | | | 8-1-2018 | | | | 12,000,000 | | | | 12,000,000 | |
Intercontinental Exchange 144A(z) | | | 1.95 | | | | 8-3-2018 | | | | 7,000,000 | | | | 6,999,242 | |
National Australia Bank Limited (1 Month LIBOR +0.16%) ±144A | | | 2.25 | | | | 8-1-2018 | | | | 5,000,000 | | | | 5,000,000 | |
National Australia Bank Limited (1 Month LIBOR +0.18%) ±144A | | | 2.25 | | | | 9-13-2018 | | | | 14,000,000 | | | | 14,003,416 | |
National Securities Clearing Corporation 144A(z) | | | 1.90 | | | | 8-1-2018 | | | | 7,000,000 | | | | 7,000,000 | |
Nederlandse Waterschapsbank NV 144A(z) | | | 2.06 | | | | 8-13-2018 | | | | 10,000,000 | | | | 9,993,210 | |
Nederlandse Waterschapsbank NV 144A(z) | | | 2.06 | | | | 8-14-2018 | | | | 6,000,000 | | | | 5,995,582 | |
Oversea-Chinese Banking Corporation (1 Month LIBOR +0.25%) ±144A | | | 2.33 | | | | 1-11-2019 | | | | 8,000,000 | | | | 8,001,438 | |
Oversea-Chinese Banking Corporation (1 Month LIBOR +0.25%) ±144A | | | 2.34 | | | | 1-10-2019 | | | | 6,000,000 | | | | 6,001,140 | |
Oversea-Chinese Banking Corporation (3 Month LIBOR +0.14%) ±144A | | | 2.50 | | | | 5-10-2019 | | | | 6,000,000 | | | | 5,999,990 | |
Sumitomo Mitsui Trust 144A(z) | | | 2.30 | | | | 10-15-2018 | | | | 5,000,000 | | | | 4,977,375 | |
Toronto Dominion Bank (1 Month LIBOR +0.30%) ±144A | | | 2.39 | | | | 12-3-2018 | | | | 9,000,000 | | | | 9,004,086 | |
Toronto Dominion Bank (3 Month LIBOR +0.14%) ±144A | | | 2.50 | | | | 5-2-2019 | | | | 7,000,000 | | | | 7,002,087 | |
UBS AG London (1 Month LIBOR +0.24%) ±144A | | | 2.34 | | | | 8-7-2018 | | | | 15,000,000 | | | | 15,000,935 | |
UBS AG London (3 Month LIBOR +0.19%) ±144A | | | 2.52 | | | | 12-10-2018 | | | | 7,000,000 | | | | 7,001,957 | |
Westpac Banking Corporation (1 Month LIBOR +0.18%) ±144A | | | 2.25 | | | | 8-16-2018 | | | | 4,000,000 | | | | 4,000,417 | |
Westpac Banking Corporation (3 Month LIBOR +0.10%) ±144A | | | 2.41 | | | | 5-31-2019 | | | | 12,000,000 | | | | 11,998,974 | |
| | | | |
| | | | | | | | | | | | | | | 235,951,079 | |
| | | | | | | | | | | | | | | | |
The accompanying notes are an integral part of these financial statements.
| | | | | | |
| Portfolio of investments—July 31, 2018 (unaudited) | | Wells Fargo Cash Investment Money Market Fund | | | 11 | |
| | | | | | | | | | | | | | | | |
| Security name | | Interest rate | | | Maturity date | | | Principal | | | Value | |
| | | |
| Other Commercial Paper: 4.41% | | | | | | | | | | | | | |
China International Marine Containers Company Limited (z) | | | 2.35 | % | | | 8-13-2018 | | | $ | 5,000,000 | | | $ | 4,996,737 | |
CNPC Finance Limited 144A(z) | | | 2.38 | | | | 8-2-2018 | | | | 8,000,000 | | | | 7,999,535 | |
Komatsu Finance America Incorporated 144A(z) | | | 2.00 | | | | 8-3-2018 | | | | 12,000,000 | | | | 11,998,717 | |
Salt River Project Agricultura (z) | | | 2.21 | | | | 9-17-2018 | | | | 6,000,000 | | | | 5,982,132 | |
Salt River Project Agricultura (z) | | | 2.21 | | | | 9-18-2018 | | | | 6,000,000 | | | | 5,981,753 | |
Toyota Credit Canada Incorporated (1 Month LIBOR +0.42%) ± | | | 2.50 | | | | 10-15-2018 | | | | 8,000,000 | | | | 8,006,016 | |
Toyota Finance Australia Limited (3 Month LIBOR +0.08%) ± | | | 2.41 | | | | 2-15-2019 | | | | 9,000,000 | | | | 9,000,460 | |
Toyota Finance Australia Limited (3 Month LIBOR +0.09%) ± | | | 2.43 | | | | 3-22-2019 | | | | 8,000,000 | | | | 8,000,473 | |
| | | | |
| | | | | | | | | | | | | | | 61,965,823 | |
| | | | | | | | | | | | | | | | |
| | | |
Total Commercial Paper (Cost $607,692,665) | | | | | | | | | | | | 607,771,999 | |
| | | | | | | | | | | | | | | | |
| | | |
Municipal Obligations: 17.36% | | | | | | | | | | | | | |
| | | | |
California: 0.29% | | | | | | | | | | | | | | | | |
| | | | |
| Other Municipal Debt: 0.29% | | | | | | | | | | | | | | | | |
Orange County Water District (Water Utilities) | | | 2.12 | | | | 8-6-2018 | | | | 4,000,000 | | | | 4,000,321 | |
| | | | | | | | | | | | | | | | |
| | | |
Colorado: 3.59% | | | | | | | | | | | | | |
| | | | |
| Variable Rate Demand Notes ø: 3.59% | | | | | | | | | | | | | | | | |
Colorado HFA MFHR Class II Series B (Housing Revenue, FHLB SPA) | | | 2.02 | | | | 5-1-2052 | | | | 29,745,000 | | | | 29,745,000 | |
Colorado Southern Ute Indian Tribe Reservation Series 2007 (Miscellaneous Revenue) | | | 2.15 | | | | 1-1-2027 | | | | 5,540,000 | | | | 5,540,000 | |
Colorado Tender Option Bond Trust Receipts/Certificates Series 2017-TPG007 (Health Revenue, Bank of America NA LIQ) 144A | | | 2.57 | | | | 10-29-2027 | | | | 15,100,000 | | | | 15,100,000 | |
| | | | |
| | | | | | | | | | | | | | | 50,385,000 | |
| | | | | | | | | | | | | | | | |
| | | |
Florida: 0.25% | | | | | | | | | | | | | |
| | | | |
| Other Municipal Debt: 0.25% | | | | | | | | | | | | | | | | |
Hillsborough County FL (Miscellaneous Revenue) | | | 2.32 | | | | 8-23-2018 | | | | 3,507,000 | | | | 3,507,160 | |
| | | | | | | | | | | | | | | | |
| | | |
Georgia: 0.64% | | | | | | | | | | | | | |
| | | | |
| Other Municipal Debt: 0.64% | | | | | | | | | | | | | | | | |
Municipal Electric Authority of Georgia (Utilities Revenue) | | | 2.10 | | | | 8-2-2018 | | | | 9,007,000 | | | | 9,007,043 | |
| | | | | | | | | | | | | | | | |
| | | |
Illinois: 1.22% | | | | | | | | | | | | | |
| | | | |
| Variable Rate Demand Notes ø: 1.22% | | | | | | | | | | | | | | | | |
Illinois Housing Development Authority Series A-2 (Housing Revenue, HUD Insured, FHLB SPA) | | | 2.05 | | | | 7-1-2048 | | | | 7,000,000 | | | | 7,000,000 | |
Tender Option Bond Trust Receipts/Certificates Series 2018-XFT911 (Miscellaneous Revenue, Bank of America NA LIQ) 144A | | | 2.57 | | | | 4-1-2048 | | | | 10,162,000 | | | | 10,162,000 | |
| | | | |
| | | | | | | | | | | | | | | 17,162,000 | |
| | | | | | | | | | | | | | | | |
| | | |
Massachusetts: 0.78% | | | | | | | | | | | | | |
| | | | |
| Other Municipal Debt: 0.78% | | | | | | | | | | | | | | | | |
Massachusetts Educational Financing Authority (Education Revenue) | | | 2.17 | | | | 8-30-2018 | | | | 11,000,000 | | | | 11,001,033 | |
| | | | | | | | | | | | | | | | |
| | | |
New York: 2.14% | | | | | | | | | | | | | |
| | | | |
| Other Municipal Debt: 0.57% | | | | | | | | | | | | | | | | |
Long Island Power Authority (Utilities Revenue) | | | 2.23 | | | | 9-19-2018 | | | | 8,000,000 | | | | 7,999,985 | |
| | | | | | | | | | | | | | | | |
The accompanying notes are an integral part of these financial statements.
| | | | |
| 12 | | Wells Fargo Cash Investment Money Market Fund | | Portfolio of investments—July 31, 2018 (unaudited) |
| | | | | | | | | | | | | | | | |
| Security name | | Interest rate | | | Maturity date | | | Principal | | | Value | |
| | | |
| Variable Rate Demand Notes ø: 1.57% | | | | | | | | | | | | | |
New York HFA 222-East 44th Street Series A (Housing Revenue, Bank of China LOC) | | | 2.10 | % | | | 5-1-2050 | | | $ | 10,000,000 | | | $ | 10,000,000 | |
New York HFA Manhattan West Residential Housing Project Series B-2 (Housing Revenue, Bank of China LOC) | | | 2.12 | | | | 11-1-2049 | | | | 10,000,000 | | | | 10,000,000 | |
RBC Municipal Products Incorporated Trust Series E-51 Invesco Van Kampen New York Value Income Trust (Miscellaneous Revenue, Royal Bank of Canada LOC) 144A | | | 2.43 | | | | 12-1-2019 | | | | 2,000,000 | | | | 2,000,000 | |
| | | | |
| | | | | | | | | | | | | | | 22,000,000 | |
| | | | | | | | | | | | | | | | |
| | | |
Oregon: 0.73% | | | | | | | | | | | | | |
| | | | |
| Other Municipal Debt: 0.66% | | | | | | | | | | | | | | | | |
Port of Portland OR (Transportation Revenue) | | | 2.20 | | | | 8-9-2018 | | | | 9,200,000 | | | | 9,201,125 | |
| | | | | | | | | | | | | | | | |
| | | |
| Variable Rate Demand Note ø: 0.07% | | | | | | | | | | | | | |
Oregon Tender Option Bond Trust Receipts/Certificates Series ZF2515 (Miscellaneous Revenue, Bank of America NA LIQ) 144A | | | 2.03 | | | | 5-1-2035 | | | | 1,000,000 | | | | 1,000,000 | |
| | | | | | | | | | | | | | | | |
| | | |
Other: 3.31% | | | | | | | | | | | | | |
| | | | |
| Variable Rate Demand Notes ø: 3.31% | | | | | | | | | | | | | | | | |
Jets Stadium Development Bonds Series A-4B (Miscellaneous Revenue, Sumitomo Mitsui Banking Corporation LOC) 144A | | | 2.08 | | | | 4-1-2047 | | | | 18,020,000 | | | | 18,020,000 | |
Providence Health & Services Series 12-E (Health Revenue, U.S. Bank NA LOC) | | | 2.07 | | | | 10-1-2042 | | | | 10,000,000 | | | | 10,000,000 | |
SSAB AB Series A (Miscellaneous Revenue, DNB Banking ASA LOC) | | | 2.03 | | | | 6-1-2035 | | | | 6,000,000 | | | | 6,000,000 | |
Steadfast Crestvilla LLC Series A (Health Revenue, American AgCredit LOC) | | | 2.08 | | | | 2-1-2056 | | | | 3,000,000 | | | | 3,000,000 | |
Steadfast Crestvilla LLC Series B (Health Revenue, U.S. Bank NA LOC) | | | 2.08 | | | | 2-1-2056 | | | | 2,000,000 | | | | 2,000,000 | |
Sunroad Centrum Apartments 5 LP Series B (Housing Revenue, FHLB LOC) | | | 2.08 | | | | 8-1-2056 | | | | 4,400,000 | | | | 4,400,000 | |
Tender Option Bond Trust Receipts/Certificates (Miscellaneous Revenue, Citibank NA LIQ) 144A | | | 2.09 | | | | 12-1-2027 | | | | 3,000,000 | | | | 3,000,000 | |
| | | |
| | | | | | | | | | | | 46,420,000 | |
| | | | | | | | | | | | | | | | |
| | | |
Pennsylvania: 1.14% | | | | | | | | | | | | | |
| | | | |
| Variable Rate Demand Note ø: 1.14% | | | | | | | | | | | | | | | | |
RBC Municipal Products Incorporated Trust Series E-52 Invesco Van Kampen Trust (Miscellaneous Revenue, Royal Bank of Canada LOC) 144A | | | 2.43 | | | | 12-1-2019 | | | | 16,000,000 | | | | 16,000,000 | |
| | | | | | | | | | | | | | | | |
| | | |
Rhode Island: 0.71% | | | | | | | | | | | | | |
| | | | |
| Variable Rate Demand Note ø: 0.71% | | | | | | | | | | | | | | | | |
Providence RI St. Joseph Health Obligation Series 16G (Health Revenue, Bank of Tokyo-Mitsubishi LOC) | | | 2.03 | | | | 10-1-2047 | | | | 10,000,000 | | | | 10,000,000 | |
| | | | | | | | | | | | | | | | |
| | | |
Tennessee: 1.71% | | | | | | | | | | | | | |
| | | | |
| Variable Rate Demand Notes ø: 1.71% | | | | | | | | | | | | | | | | |
Montgomery County TN Industrial Development Board Hankook Tire Manufacturing Project Series A (Industrial Development Revenue, Kookmin Bank LOC) 144A | | | 2.22 | | | | 12-1-2024 | | | | 14,000,000 | | | | 14,000,000 | |
Montgomery County TN Industrial Development Board Hankook Tire Manufacturing Project Series A (Industrial Development Revenue, Kookmin Bank LOC) | | | 2.22 | | | | 12-1-2024 | | | | 10,000,000 | | | | 10,000,000 | |
| | | |
| | | | | | | | | | | | 24,000,000 | |
| | | | | | | | | | | | | | | | |
The accompanying notes are an integral part of these financial statements.
| | | | | | |
| Portfolio of investments—July 31, 2018 (unaudited) | | Wells Fargo Cash Investment Money Market Fund | | | 13 | |
| | | | | | | | | | | | | | | | |
| Security name | | Interest rate | | | Maturity date | | | Principal | | | Value | |
| | | |
Texas: 0.85% | | | | | | | | | | | | | |
| | | | |
| Other Municipal Debt: 0.85% | | | | | | | | | | | | | | | | |
Texas Public Finance Authority (Miscellaneous Revenue) | | | 2.10 | % | | | 8-9-2018 | | | $ | 6,000,000 | | | $ | 6,000,071 | |
Texas Public Finance Authority (Miscellaneous Revenue) | | | 2.11 | | | | 8-8-2018 | | | | 6,000,000 | | | | 6,000,077 | |
| | | |
| | | | | | | | | | | | 12,000,148 | |
| | | | | | | | | | | | | | | | |
| | | | |
Total Municipal Obligations (Cost $243,681,000) | | | | | | | | | | | | | | | 243,683,815 | |
| | | | | | | | | | | | | | | | |
| | | |
Other: 2.14% | | | | | | | | | | | | | |
JPMorgan Chase PUTTER/DRIVER Trust Series T0005 related to Blackrock Municipal Income Trust (Miscellaneous Revenue, JPMorgan Chase & Company LIQ) 144A øø§ | | | 2.05 | | | | 1-2-2019 | | | | 30,000,000 | | | | 30,000,000 | |
| | | | | | | | | | | | | | | | |
| | | |
Total Other (Cost $30,000,000) | | | | | | | | | | | | 30,000,000 | |
| | | | | | | | | | | | | | | | |
| | | |
Other Instruments: 1.21% | | | | | | | | | | | | | |
Invesco Dynamic Credit Opportunities Fund Series W-7 § | | | 2.09 | | | | 6-1-2028 | | | | 15,000,000 | | | | 15,000,000 | |
ROC III California Crossings Chino Hills Series A øø§ | | | 2.08 | | | | 1-1-2057 | | | | 2,000,000 | | | | 2,000,000 | |
| | | |
Total Other Instruments (Cost $17,000,000) | | | | | | | | | | | | 17,000,000 | |
| | | | | | | | | | | | | | | | |
| | | |
Other Notes: 1.71% | | | | | | | | | | | | | |
| | | |
| Corporate Bonds and Notes: 1.71% | | | | | | | | | | | | | |
Cellmark Incorporated Secured § | | | 2.03 | | | | 6-1-2038 | | | | 11,000,000 | | | | 11,000,000 | |
US Bancorp (3 Month LIBOR +0.49%) ± | | | 2.83 | | | | 11-15-2018 | | | | 13,000,000 | | | | 13,013,391 | |
| | | |
Total Other Notes (Cost $22,014,168) | | | | | | | | | | | | 24,013,391 | |
| | | | | | | | | | | | | | | | |
| | | |
Repurchase Agreements ^^: 12.53% | | | | | | | | | | | | | |
Bank of America Corporation, dated 7-31-2018, maturity value $105,005,629 (1) | | | 1.93 | | | | 8-1-2018 | | | | 105,000,000 | | | | 105,000,000 | |
GX Clarke & Company, dated 7-31-2018, maturity value $71,003,826 (2) | | | 1.94 | | | | 8-1-2018 | | | | 71,000,000 | | | | 71,000,000 | |
| | | |
Total Short-Term Investments (Cost $176,000,000) | | | | | | | | | | | | 176,000,000 | |
| | | | | | | | | | | | | | | | |
| | | | | | | | |
| Total investments in securities (Cost $1,414,754,443) | | | 100.78 | % | | | 1,414,886,791 | |
Other assets and liabilities, net | | | (0.78 | ) | | | (10,915,388 | ) |
| | | | | | | | |
| Total net assets | | | 100.00 | % | | $ | 1,403,971,403 | |
| | | | | | | | |
| ± | Variable rate investment. The rate shown is the rate in effect at period end. |
| (z) | Zero coupon security. The rate represents the current yield to maturity. |
| 144A | The security may be resold in transactions exempt from registration, normally to qualified institutional buyers, pursuant to Rule 144A under the Securities Act of 1933. |
| ø | Variable rate demand notes are subject to a demand feature which reduces the effective maturity. The maturity date shown represents the final maturity date of the security. The interest rate is determined and reset by the issuer daily, weekly, or monthly depending upon the terms of the security. The rate shown is the rate in effect at period end. |
| øø | The interest rate is determined and reset by the issuer periodically depending upon the terms of the security. The rate shown is the rate in effect at period end. |
| § | The security is subject to a demand feature which reduces the effective maturity. |
| | (1) | U.S. government securities, 3.00% to 4.00%, 4-20-2043 to 9-20-2045, fair value including accrued interest is $108,150,000. |
| | (2) | U.S. government securities, 2.00% to 10.00%, 8-15-2018 to 2-1-2057, fair value including accrued interest is $73,130,000. |
The accompanying notes are an integral part of these financial statements.
| | | | |
| 14 | | Wells Fargo Cash Investment Money Market Fund | | Portfolio of investments—July 31, 2018 (unaudited) |
Abbreviations:
| DRIVER | Derivative inverse tax-exempt receipts |
| FHLB | Federal Home Loan Bank |
| HFA | Housing Finance Authority |
| HUD | Department of Housing and Urban Development |
| LIBOR | London Interbank Offered Rate |
| MFHR | Multifamily housing revenue |
| PUTTER | Puttable tax-exempt receipts |
| ROC | Reset option certificates |
| SPA | Standby purchase agreement |
The accompanying notes are an integral part of these financial statements.
| | | | | | |
| Statement of assets and liabilities—July 31, 2018 (unaudited) | | Wells Fargo Cash Investment Money Market Fund | | | 15 | |
| | | | |
| | | | |
| |
Assets | | | | |
Investments in unaffiliated securities, at value (cost $1,238,754,443) | | $ | 1,238,886,791 | |
Investments in repurchase agreements, at value (cost $176,000,000) | | | 176,000,000 | |
Cash | | | 26,539 | |
Receivable for Fund shares sold | | | 917,050 | |
Receivable for interest | | | 1,792,939 | |
Prepaid expenses and other assets | | | 64,578 | |
| | | | |
Total assets | | | 1,417,687,897 | |
| | | | |
| |
Liabilities | | | | |
Payable for investments purchased | | | 13,093,952 | |
Management fee payable | | | 108,978 | |
Administration fees payable | | | 79,495 | |
Payable for Fund shares redeemed | | | 41,525 | |
Dividends payable | | | 3,056 | |
Accrued expenses and other liabilities | | | 389,488 | |
| | | | |
Total liabilities | | | 13,716,494 | |
| | | | |
Total net assets | | $ | 1,403,971,403 | |
| | | | |
| |
NET ASSETS CONSIST OF | | | | |
Paid-in capital | | $ | 1,403,826,384 | |
Undistributed net investment income | | | 5,938 | |
Accumulated net realized gains on investments | | | 6,733 | |
Net unrealized gains on investments | | | 132,348 | |
| | | | |
Total net assets | | $ | 1,403,971,403 | |
| | | | |
| |
COMPUTATION OF NET ASSET VALUE PER SHARE | | | | |
Net assets – Administrator Class | | $ | 126,395,311 | |
Shares outstanding – Administrator Class1 | | | 126,335,615 | |
Net asset value per share – Administrator Class | | | $1.0005 | |
Net assets – Institutional Class | | $ | 443,321,273 | |
Shares outstanding – Institutional Class1 | | | 443,107,159 | |
Net asset value per share – Institutional Class | | | $1.0005 | |
Net assets – Select Class | | $ | 672,119,443 | |
Shares outstanding – Select Class1 | | | 671,780,693 | |
Net asset value per share – Select Class | | | $1.0005 | |
Net assets – Service Class | | $ | 162,135,376 | |
Shares outstanding – Service Class1 | | | 162,044,201 | |
Net asset value per share – Service Class | | | $1.0006 | |
| 1 | The Fund has an unlimited number of authorized shares. |
The accompanying notes are an integral part of these financial statements.
| | | | |
| 16 | | Wells Fargo Cash Investment Money Market Fund | | Statement of operations—six months ended July 31, 2018 (unaudited) |
| | | | |
| | | | |
| |
Investment income | | | | |
Interest | | $ | 14,641,201 | |
| | | | |
| |
Expenses | | | | |
Management fee | | | 1,102,936 | |
Administration fees | | | | |
Administrator Class | | | 61,853 | |
Institutional Class | | | 194,634 | |
Select Class | | | 141,385 | |
Service Class | | | 92,019 | |
Shareholder servicing fees | | | | |
Administrator Class | | | 61,853 | |
Service Class | | | 191,707 | |
Custody and accounting fees | | | 86,577 | |
Professional fees | | | 20,828 | |
Registration fees | | | 18,140 | |
Shareholder report expenses | | | 17,255 | |
Trustees’ fees and expenses | | | 5,814 | |
Other fees and expenses | | | 41,466 | |
| | | | |
Total expenses | | | 2,036,467 | |
Less: Fee waivers and/or expense reimbursements | | | (502,851 | ) |
| | | | |
Net expenses | | | 1,533,616 | |
| | | | |
Net investment income | | | 13,107,585 | |
| | | | |
| |
REALIZED AND UNREALIZED GAINS (LOSSES) ON INVESTMENTS | | | | |
Net realized gains on investments | | | 6,733 | |
Net change in unrealized gains (losses) on investments | | | (25,022 | ) |
| | | | |
Net realized and unrealized gains (losses) on investments | | | (18,289 | ) |
| | | | |
Net increase in net assets resulting from operations | | $ | 13,089,296 | |
| | | | |
The accompanying notes are an integral part of these financial statements.
| | | | | | |
| Statement of changes in net assets | | Wells Fargo Cash Investment Money Market Fund | | | 17 | |
| | | | | | | | | | | | | | | | |
| | | Six months ended July 31, 2018 (unaudited) | | | Year ended
January 31, 2018 | |
| | | | |
Operations | | | | | | | | | | | | | | | | |
Net investment income | | | | | | $ | 13,107,585 | | | | | | | $ | 19,365,262 | |
Net realized gains on investments | | | | | | | 6,733 | | | | | | | | 158,568 | |
Net change in unrealized gains (losses) on investments | | | | | | | (25,022 | ) | | | | | | | (28,138 | ) |
| | | | |
Net increase in net assets resulting from operations | | | | | | | 13,089,296 | | | | | | | | 19,495,692 | |
| | | | |
| | | | |
Distributions to shareholders from | | | | | | | | | | | | | | | | |
Net investment income | | | | | | | | | | | | | | | | |
Administrator Class | | | | | | | (1,037,543 | ) | | | | | | | (1,125,792 | ) |
Institutional Class | | | | | | | (4,318,446 | ) | | | | | | | (6,993,029 | ) |
Select Class | | | | | | | (6,601,251 | ) | | | | | | | (9,764,841 | ) |
Service Class | | | | | | | (1,150,346 | ) | | | | | | | (1,481,600 | ) |
| | | | |
Total distributions to shareholders | | | | | | | (13,107,586 | ) | | | | | | | (19,365,262 | ) |
| | | | |
| | | | |
Capital share transactions | | | Shares | | | | | | | | Shares | | | | | |
Proceeds from shares sold | | | | | | | | | | | | | | | | |
Administrator Class | | | 102,107,109 | | | | 102,152,722 | | | | 195,185,039 | | | | 195,282,601 | |
Institutional Class | | | 641,368,183 | | | | 641,667,366 | | | | 1,908,490,605 | | | | 1,909,455,936 | |
Select Class | | | 1,666,894,653 | | | | 1,667,682,046 | | | | 3,039,441,713 | | | | 3,040,958,595 | |
Service Class | | | 574,130,945 | | | | 574,429,547 | | | | 1,296,529,040 | | | | 1,297,284,224 | |
| | | | |
| | | | | | | 2,985,931,681 | | | | | | | | 6,442,981,356 | |
| | | | |
Reinvestment of distributions | | | | | | | | | | | | | | | | |
Administrator Class | | | 1,023,191 | | | | 1,023,654 | | | | 1,103,656 | | | | 1,104,204 | |
Institutional Class | | | 4,249,399 | | | | 4,251,318 | | | | 6,770,934 | | | | 6,774,391 | |
Select Class | | | 6,515,015 | | | | 6,518,051 | | | | 9,369,322 | | | | 9,374,001 | |
Service Class | | | 1,125,322 | | | | 1,125,910 | | | | 1,443,685 | | | | 1,444,535 | |
| | | | |
| | | | | | | 12,918,933 | | | | | | | | 18,697,131 | |
| | | | |
Payment for shares redeemed | | | | | | | | | | | | | | | | |
Administrator Class | | | (86,293,132 | ) | | | (86,332,223 | ) | | | (205,288,879 | ) | | | (205,391,015 | ) |
Institutional Class | | | (842,017,818 | ) | | | (842,410,098 | ) | | | (2,031,635,674 | ) | | | (2,032,680,970 | ) |
Select Class | | | (1,718,782,931 | ) | | | (1,719,579,905 | ) | | | (3,204,452,986 | ) | | | (3,206,048,194 | ) |
Service Class | | | (600,743,190 | ) | | | (601,055,631 | ) | | | (1,299,975,132 | ) | | | (1,300,735,721 | ) |
| | | | |
| | | | | | | (3,249,377,857 | ) | | | | | | | (6,744,855,900 | ) |
| | | | |
Net decrease in net assets resulting from capital share transactions | | | | | | | (250,527,243 | ) | | | | | | | (283,177,413 | ) |
| | | | |
Total decrease in net assets | | | | | | | (250,545,533 | ) | | | | | | | (283,046,983 | ) |
| | | | |
| | | | |
Net assets | | | | | | | | | | | | | | | | |
Beginning of period | | | | | | | 1,654,516,936 | | | | | | | | 1,937,563,919 | |
| | | | |
End of period | | | | | | $ | 1,403,971,403 | | | | | | | $ | 1,654,516,936 | |
| | | | |
Undistributed net investment income | | | | | | $ | 5,938 | | | | | | | $ | 5,939 | |
| | | | |
The accompanying notes are an integral part of these financial statements.
| | | | |
| 18 | | Wells Fargo Cash Investment Money Market Fund | | Financial highlights |
(For a share outstanding throughout each period)
| | | | | | | | | | | | | | | | | | | | | | | | |
| | | Six months ended
July 31, 2018 (unaudited) | | | Year ended January 31 | |
| ADMINISTRATOR CLASS | | 2018 | | | 2017 | | | 20161 | | | 20151 | | | 20141 | |
Net asset value, beginning of period | | | $1.0005 | | | | $1.0004 | | | | $1.0000 | | | | $1.00 | | | | $1.00 | | | | $1.00 | |
Net investment income | | | 0.0083 | | | | 0.0096 | | | | 0.0029 | | | | 0.00 | 2 | | | 0.00 | 2 | | | 0.00 | 2 |
Net realized and unrealized gains (losses) on investments | | | (0.0000 | )3 | | | 0.0001 | | | | 0.0004 | | | | 0.00 | 2 | | | 0.00 | 2 | | | 0.00 | 2 |
| | | | | | | | | | | | | | | | | | | | | | | | |
Total from investment operations | | | 0.0083 | | | | 0.0097 | | | | 0.0033 | | | | 0.00 | 2 | | | 0.00 | 2 | | | 0.00 | 2 |
Distributions to shareholders from | | | | | | | | | | | | | | | | | | | | | | | | |
Net investment income | | | (0.0083 | ) | | | (0.0096 | ) | | | (0.0029 | ) | | | (0.00 | )2 | | | (0.00 | )2 | | | 0.00 | 2 |
Net asset value, end of period | | | $1.0005 | | | | $1.0005 | | | | $1.0004 | | | | $1.00 | | | | $1.00 | | | | $1.00 | |
Total return4 | | | 0.83 | % | | | 0.97 | % | | | 0.33 | % | | | 0.03 | % | | | 0.01 | % | | | 0.01 | % |
Ratios to average net assets (annualized) | | | | | | | | | | | | | | | | | | | | | | | | |
Gross expenses | | | 0.38 | % | | | 0.38 | % | | | 0.36 | % | | | 0.35 | % | | | 0.35 | % | | | 0.35 | % |
Net expenses | | | 0.33 | % | | | 0.33 | % | | | 0.33 | % | | | 0.26 | % | | | 0.19 | % | | | 0.22 | % |
Net investment income | | | 1.68 | % | | | 0.96 | % | | | 0.26 | % | | | 0.03 | % | | | 0.01 | % | | | 0.01 | % |
Supplemental data | | | | | | | | | | | | | | | | | | | | | | | | |
Net assets, end of period (000s omitted) | | | $126,395 | | | | $109,551 | | | | $118,548 | | | | $297,396 | | | | $396,339 | | | | $493,087 | |
| 1 | Amounts reflect the Fund transacting shares at a fixed NAV rounded to two decimal places. Beginning October 11, 2016, the Fund began selling and redeeming shares of the Fund at a floating NAV rounded to the fourth decimal place. |
| 2 | Amount is less than $0.005. |
| 3 | Amount is more than $(0.00005). |
| 4 | Returns for periods of less than one year are not annualized. |
The accompanying notes are an integral part of these financial statements.
| | | | | | |
| Financial highlights | | Wells Fargo Cash Investment Money Market Fund | | | 19 | |
(For a share outstanding throughout each period)
| | | | | | | | | | | | | | | | | | | | | | | | |
| | | Six months ended
July 31, 2018 (unaudited) | | | Year ended January 31 | |
| INSTITUTIONAL CLASS | | 2018 | | | 2017 | | | 20161 | | | 20151 | | | 20141 | |
Net asset value, beginning of period | | | $1.0005 | | | | $1.0004 | | | | $1.0000 | | | | $1.00 | | | | $1.00 | | | | $1.00 | |
Net investment income | | | 0.0090 | | | | 0.0109 | | | | 0.0043 | | | | 0.00 | 2 | | | 0.00 | 2 | | | 0.00 | 2 |
Net realized and unrealized gains (losses) on investments | | | (0.0001 | ) | | | 0.0001 | | | | 0.0003 | | | | 0.00 | 2 | | | 0.00 | 2 | | | 0.00 | 2 |
| | | | | | | | | | | | | | | | | | | | | | | | |
Total from investment operations | | | 0.0089 | | | | 0.0110 | | | | 0.0046 | | | | 0.00 | 2 | | | 0.00 | 2 | | | 0.00 | 2 |
Distributions to shareholders from | | | | | | | | | | | | | | | | | | | | | | | | |
Net investment income | | | (0.0089 | ) | | | (0.0109 | ) | | | (0.0042 | ) | | | (0.00 | )2 | | | (0.00 | )2 | | | 0.00 | 2 |
Net asset value, end of period | | | $1.0005 | | | | $1.0005 | | | | $1.0004 | | | | $1.00 | | | | $1.00 | | | | $1.00 | |
Total return3 | | | 0.90 | % | | | 1.10 | % | | | 0.46 | % | | | 0.09 | % | | | 0.01 | % | | | 0.03 | % |
Ratios to average net assets (annualized) | | | | | | | | | | | | | | | | | | | | | | | | |
Gross expenses | | | 0.26 | % | | | 0.26 | % | | | 0.23 | % | | | 0.23 | % | | | 0.23 | % | | | 0.23 | % |
Net expenses | | | 0.20 | % | | | 0.20 | % | | | 0.20 | % | | | 0.20 | % | | | 0.19 | % | | | 0.20 | % |
Net investment income | | | 1.78 | % | | | 1.08 | % | | | 0.37 | % | | | 0.10 | % | | | 0.01 | % | | | 0.03 | % |
Supplemental data | | | | | | | | | | | | | | | | | | | | | | | | |
Net assets, end of period (000s omitted) | | | $443,321 | | | | $639,823 | | | | $756,218 | | | | $5,027,125 | | | | $4,320,392 | | | | $5,127,034 | |
| 1 | Amounts reflect the Fund transacting shares at a fixed NAV rounded to two decimal places. Beginning October 11, 2016, the Fund began selling and redeeming shares of the Fund at a floating NAV rounded to the fourth decimal place. |
| 2 | Amount is less than $0.005. |
| 3 | Returns for periods of less than one year are not annualized. |
The accompanying notes are an integral part of these financial statements.
| | | | |
| 20 | | Wells Fargo Cash Investment Money Market Fund | | Financial highlights |
(For a share outstanding throughout each period)
| | | | | | | | | | | | | | | | | | | | | | | | |
| | | Six months ended
July 31, 2018 (unaudited) | | | Year ended January 31 | |
| SELECT CLASS | | 2018 | | | 2017 | | | 20161 | | | 20151 | | | 20141 | |
Net asset value, beginning of period | | | $1.0005 | | | | $1.0004 | | | | $1.0000 | | | | $1.00 | | | | $1.0000 | | | | $1.0000 | |
Net investment income | | | 0.0093 | | | | 0.0116 | | | | 0.0049 | | | | 0.00 | 2 | | | 0.00 | 2 | | | 0.00 | 2 |
Net realized and unrealized gains (losses) on investments | | | (0.0000 | )3 | | | 0.0001 | | | | 0.0004 | | | | 0.00 | 2 | | | 0.00 | 2 | | | 0.00 | 2 |
| | | | | | | | | | | | | | | | | | | | | | | | |
Total from investment operations | | | 0.0093 | | | | 0.0117 | | | | 0.0053 | | | | 0.00 | 2 | | | 0.00 | 2 | | | 0.00 | 2 |
Distributions to shareholders from | | | | | | | | | | | | | | | | | | | | | | | | |
Net investment income | | | (0.0093 | ) | | | (0.0116 | ) | | | (0.0049 | ) | | | (0.00 | )2 | | | (0.00 | )2 | | | 0.00 | 2 |
Net asset value, end of period | | | $1.0005 | | | | $1.0005 | | | | $1.0004 | | | | $1.00 | | | | $1.00 | | | | $1.00 | |
Total return4 | | | 0.93 | % | | | 1.17 | % | | | 0.53 | % | | | 0.16 | % | | | 0.07 | % | | | 0.10 | % |
Ratios to average net assets (annualized) | | | | | | | | | | | | | | | | | | | | | | | | |
Gross expenses | | | 0.22 | % | | | 0.22 | % | | | 0.19 | % | | | 0.19 | % | | | 0.19 | % | | | 0.19 | % |
Net expenses | | | 0.13 | % | | | 0.13 | % | | | 0.13 | % | | | 0.13 | % | | | 0.13 | % | | | 0.13 | % |
Net investment income | | | 1.87 | % | | | 1.14 | % | | | 0.44 | % | | | 0.16 | % | | | 0.07 | % | | | 0.10 | % |
Supplemental data | | | | | | | | | | | | | | | | | | | | | | | | |
Net assets, end of period (000s omitted) | | | $672,119 | | | | $717,508 | | | | $873,167 | | | | $5,595,704 | | | | $5,889,779 | | | | $7,650,810 | |
| 1 | Amounts reflect the Fund transacting shares at a fixed NAV rounded to two decimal places. Beginning October 11, 2016, the Fund began selling and redeeming shares of the Fund at a floating NAV rounded to the fourth decimal place. |
| 2 | Amount is less than $0.005. |
| 3 | Amount is more than $(0.00005). |
| 4 | Returns for periods of less than one year are not annualized. |
The accompanying notes are an integral part of these financial statements.
| | | | | | |
| Financial highlights | | Wells Fargo Cash Investment Money Market Fund | | | 21 | |
(For a share outstanding throughout each period)
| | | | | | | | | | | | | | | | | | | | | | | | |
| | | Six months ended
July 31, 2018 (unaudited) | | | Year ended January 31 | |
| SERVICE CLASS | | 2018 | | | 2017 | | | 20161 | | | 20151 | | | 20141 | |
Net asset value, beginning of period | | | $1.0006 | | | | $1.0005 | | | | $1.0000 | | | | $1.00 | | | | $1.00 | | | | $1.00 | |
Net investment income | | | 0.0074 | | | | 0.0079 | | | | 0.0011 | | | | 0.00 | 2 | | | 0.00 | 2 | | | 0.00 | 2 |
Net realized and unrealized gains (losses) on investments | | | 0.0001 | | | | 0.0001 | | | | 0.0006 | | | | 0.00 | 2 | | | 0.00 | 2 | | | 0.00 | 2 |
| | | | | | | | | | | | | | | | | | | | | | | | |
Total from investment operations | | | 0.0075 | | | | 0.0080 | | | | 0.0017 | | | | 0.00 | 2 | | | 0.00 | 2 | | | 0.00 | 2 |
Distributions to shareholders from | | | | | | | | | | | | | | | | | | | | | | | | |
Net investment income | | | (0.0075 | ) | | | (0.0079 | ) | | | (0.0012 | ) | | | (0.00 | )2 | | | (0.00 | )2 | | | 0.00 | 2 |
Net asset value, end of period | | | $1.0006 | | | | $1.0006 | | | | $1.0005 | | | | $1.00 | | | | $1.00 | | | | $1.00 | |
Total return3 | | | 0.75 | % | | | 0.80 | % | | | 0.17 | % | | | 0.01 | % | | | 0.01 | % | | | 0.01 | % |
Ratios to average net assets (annualized) | | | | | | | | | | | | | | | | | | | | | | | | |
Gross expenses | | | 0.55 | % | | | 0.55 | % | | | 0.52 | % | | | 0.52 | % | | | 0.52 | % | | | 0.52 | % |
Net expenses | | | 0.50 | % | | | 0.50 | % | | | 0.50 | % | | | 0.28 | % | | | 0.19 | % | | | 0.22 | % |
Net investment income | | | 1.50 | % | | | 0.78 | % | | | 0.08 | % | | | 0.01 | % | | | 0.01 | % | | | 0.01 | % |
Supplemental data | | | | | | | | | | | | | | | | | | | | | | | | |
Net assets, end of period (000s omitted) | | | $162,135 | | | | $187,635 | | | | $189,632 | | | | $1,237,014 | | | | $1,438,336 | | | | $1,448,713 | |
| 1 | Amounts reflect the Fund transacting shares at a fixed NAV rounded to two decimal places. Beginning October 11, 2016, the Fund began selling and redeeming shares of the Fund at a floating NAV rounded to the fourth decimal place. |
| 2 | Amount is less than $0.005. |
| 3 | Returns for periods of less than one year are not annualized. |
The accompanying notes are an integral part of these financial statements.
| | | | |
| 22 | | Wells Fargo Cash Investment Money Market Fund | | Notes to financial statements (unaudited) |
1. ORGANIZATION
Wells Fargo Funds Trust (the “Trust”), a Delaware statutory trust organized on March 10, 1999, is an open-end management investment company registered under the Investment Company Act of 1940, as amended (the “1940 Act”). As an investment company, the Trust follows the accounting and reporting guidance in Financial Accounting Standards Board Accounting Standards Codification Topic 946, Financial Services – Investment Companies. These financial statements report on the Wells Fargo Cash Investment Money Market Fund (the “Fund”) which is a diversified series of the Trust.
2. SIGNIFICANT ACCOUNTING POLICIES
The following significant accounting policies, which are consistently followed in the preparation of the financial statements of the Fund, are in conformity with U.S. generally accepted accounting principles which require management to make estimates and assumptions that affect the reported amounts of assets and liabilities, disclosure of contingent assets and liabilities at the date of the financial statements, and the reported amounts of revenues and expenses during the reporting period. Actual results could differ from those estimates.
Securities valuation
Debt securities are valued at the evaluated bid price provided by an independent pricing service or, if a reliable price is not available, the quoted bid price from an independent broker-dealer.
Investments which are not valued using any of the methods discussed above are valued at their fair value, as determined in good faith by the Board of Trustees of the Fund. The Board of Trustees has established a Valuation Committee comprised of the Trustees and has delegated to it the authority to take any actions regarding the valuation of portfolio securities that the Valuation Committee deems necessary or appropriate, including determining the fair value of portfolio securities, unless the determination has been delegated to the Wells Fargo Asset Management Pricing Committee at Wells Fargo Funds Management, LLC (“Funds Management”). The Board of Trustees retains the authority to make or ratify any valuation decisions or approve any changes to the Valuation Procedures as it deems appropriate. On a quarterly basis, the Board of Trustees receives reports on any valuation actions taken by the Valuation Committee or the Wells Fargo Asset Management Pricing Committee which may include items for ratification.
Valuations of fair valued securities are compared to the next actual sales price when available, or other appropriate market values, to assess the continued appropriateness of the fair valuation methodologies used. These securities are fair valued on a day-to-day basis, taking into consideration changes to appropriate market information and any significant changes to the inputs considered in the valuation process until there is a readily available price provided on an exchange or by an independent pricing service. Valuations received from an independent pricing service or independent broker-dealer quotes are periodically validated by comparisons to most recent trades and valuations provided by other independent pricing services in addition to the review of prices by the manager and/or subadviser. Unobservable inputs used in determining fair valuations are identified based on the type of security, taking into consideration factors utilized by market participants in valuing the investment, knowledge about the issuer and the current market environment.
Repurchase agreements
The Fund may invest in repurchase agreements and may participate in pooled repurchase agreement transactions with other funds advised by Funds Management. Repurchase agreements are agreements where the seller of a security to the Fund agrees to repurchase that security from the Fund at a mutually agreed upon time and price. The repurchase agreements must be fully collateralized based on values that are marked-to-market daily. The collateral may be held by an agent bank under a tri-party agreement. It is the custodian’s responsibility to value collateral daily and to take action to obtain additional collateral as necessary to maintain a market value equal to or greater than the resale price. The repurchase agreements are collateralized by U.S. government securities. There could be potential loss to the Fund in the event that the Fund is delayed or prevented from exercising its rights to dispose of the collateral, including the risk of a possible decline in the value of the underlying obligations during the period in which the Fund seeks to assert its rights.
Security transactions and income recognition
Securities transactions are recorded on a trade date basis. Realized gains or losses are recorded on the basis of identified cost.
Interest income is accrued daily and bond discounts are accreted and premiums are amortized daily. To the extent debt obligations are placed on non-accrual status, any related interest income may be reduced by writing off interest receivables when the collection of all or a portion of interest has been determined to be doubtful based on consistently applied procedures and the fair value has decreased. If the issuer subsequently resumes interest payments or when the collectability of interest is reasonably assured, the debt obligation is removed from non-accrual status.
| | | | | | |
| Notes to financial statements (unaudited) | | Wells Fargo Cash Investment Money Market Fund | | | 23 | |
Distributions to shareholders
Distributions to shareholders from net investment income are accrued daily and paid monthly. Distributions from net realized gains, if any, are recorded on the ex-dividend date. Such distributions are determined in accordance with income tax regulations and may differ from U.S. generally accepted accounting principles. Dividend sources are estimated at the time of declaration. The tax character of distributions is determined as of the Fund’s fiscal year end. Therefore, a portion of the Fund’s distributions made prior to the Fund’s fiscal year end may be categorized as a tax return of capital.
Federal and other taxes
The Fund intends to continue to qualify as a regulated investment company by distributing substantially all of its investment company taxable income and any net realized capital gains (after reduction for capital loss carryforwards) sufficient to relieve it from all, or substantially all, federal income taxes. Accordingly, no provision for federal income taxes was required.
The Fund’s income and federal excise tax returns and all financial records supporting those returns for the prior three fiscal years are subject to examination by the federal and Delaware revenue authorities. Management has analyzed the Fund’s tax positions taken on federal, state, and foreign tax returns for all open tax years and does not believe that there are any uncertain tax positions that require recognition of a tax liability.
As of July 31, 2018, the aggregate cost of all investments for federal income tax purposes was $1,414,754,443 and the unrealized gains (losses) consisted of:
| | | | |
Gross unrealized gains | | $ | 138,056 | |
Gross unrealized losses | | | (5,708 | ) |
Net unrealized gains | | $ | 132,348 | |
Class allocations
The separate classes of shares offered by the Fund differ principally in shareholder servicing and administration fees. Class specific expenses are charged directly to that share class. Investment income, common expenses, and realized and unrealized gains (losses) on investments are allocated daily to each class of shares based on the relative proportion of net assets of each class.
3. FAIR VALUATION MEASUREMENTS
Fair value measurements of investments are determined within a framework that has established a fair value hierarchy based upon the various data inputs utilized in determining the value of the Fund’s investments. The three-level hierarchy gives the highest priority to unadjusted quoted prices in active markets for identical assets or liabilities (Level 1) and the lowest priority to unobservable inputs (Level 3). The Fund’s investments are classified within the fair value hierarchy based on the lowest level of input that is significant to the fair value measurement. The inputs are summarized into three broad levels as follows:
| ∎ | | Level 1 – quoted prices in active markets for identical securities |
| ∎ | | Level 2 – other significant observable inputs (including quoted prices for similar securities, interest rates, prepayment speeds, credit risk, etc.) |
| ∎ | | Level 3 – significant unobservable inputs (including the Fund’s own assumptions in determining the fair value of investments) |
The inputs or methodologies used for valuing investments in securities are not necessarily an indication of the risk associated with investing in those securities.
| | | | |
| 24 | | Wells Fargo Cash Investment Money Market Fund | | Notes to financial statements (unaudited) |
The following is a summary of the inputs used in valuing the Fund’s assets and liabilities as of July 31, 2018:
| | | | | | | | | | | | | | | | |
| | | Quoted prices
(Level 1) | | | Other significant
observable inputs
(Level 2) | | | Significant
unobservable inputs
(Level 3) | | | Total | |
Assets | | | | | | | | | | | | | | | | |
Investments in: | | | | | | | | | | | | | | | | |
| | | | |
Certificates of deposit | | $ | 0 | | | $ | 316,417,586 | | | $ | 0 | | | $ | 316,417,586 | |
| | | | |
Commercial paper | | | 0 | | | | 607,771,999 | | | | 0 | | | | 607,771,999 | |
| | | | |
Municipal obligations | | | 0 | | | | 243,683,815 | | | | 0 | | | | 243,683,815 | |
| | | | |
Other | | | 0 | | | | 30,000,000 | | | | 0 | | | | 30,000,000 | |
| | | | |
Other instruments | | | 0 | | | | 17,000,000 | | | | 0 | | | | 17,000,000 | |
| | | | |
Other notes | | | 0 | | | | 24,013,391 | | | | 0 | | | | 24,013,391 | |
Repurchase agreements | | | 0 | | | | 176,000,000 | | | | 0 | | | | 176,000,000 | |
Total assets | | $ | 0 | | | $ | 1,414,886,791 | | | $ | 0 | | | $ | 1,414,886,791 | |
The Fund recognizes transfers between levels within the fair value hierarchy at the end of the reporting period. At July 31, 2018, the Fund did not have any transfers into/out of Level 1, Level 2, or Level 3.
4. TRANSACTIONS WITH AFFILIATES
Management fee
Funds Management, an indirect wholly owned subsidiary of Wells Fargo & Company (“Wells Fargo”), is the manager of the Fund and provides advisory and fund-level administrative services under an investment management agreement. Under the investment management agreement, Funds Management is responsible for, among other services, implementing the investment objectives and strategies of the Fund, supervising the subadvisers and providing fund-level administrative services in connection with the Fund’s operations. As compensation for its services under the investment management agreement, Funds Management is entitled to receive an annual management fee starting at 0.15% and declining to 0.13% as the average daily net assets of the Fund increase. For the six months ended July 31, 2018, the management fee was equivalent to an annual rate of 0.15% of the Fund’s average daily net assets.
Funds Management has retained the services of certain subadvisers to provide daily portfolio management to the Fund. Wells Capital Management Incorporated (“WellsCap”), an affiliate of Funds Management and an indirect wholly owned subsidiary of Wells Fargo, is a subadviser to the Fund and is entitled to receive a fee from Funds Management at an annual rate starting at 0.05% and declining to 0.01% as the average daily net assets of the Fund increase. Wells Capital Management Singapore, a separately identifiable department of Wells Fargo Bank, N.A., an affiliate of Funds Management and wholly owned subsidiary of Wells Fargo, is also a subadviser to the Fund and is entitled to receive a fee from WellsCap at an annual rate starting at 0.0025% and declining to 0.0005% as the average daily net assets of the Fund increase.
Administration fees
Under a class-level administration agreement, Funds Management provides class-level administrative services to the Fund, which includes paying fees and expenses for services provided by the transfer agent, sub-transfer agents, omnibus account servicers and record-keepers. As compensation for its services under the class-level administration agreement, Funds Management receives an annual fee which is calculated based on the average daily net assets of each class as follows:
| | | | |
| | | Class-level
administration fee | |
Administrator Class | | | 0.10 | % |
Institutional Class | | | 0.08 | |
Select Class | | | 0.04 | |
Service Class | | | 0.12 | |
| | | | | | |
| Notes to financial statements (unaudited) | | Wells Fargo Cash Investment Money Market Fund | | | 25 | |
Funds Management has contractually waived and/or reimbursed management and administration fees to the extent necessary to maintain certain net operating expense ratios for the Fund. Waiver of fees and/or reimbursement of expenses by Funds Management were made first from fund level expenses on a proportionate basis and then from class specific expenses. Funds Management has committed through May 31, 2019 to waive fees and/or reimburse expenses to the extent necessary to cap the Fund’s expenses at 0.35% for Administrator Class shares, 0.20% for Institutional Class shares, 0.13% for Select Class shares, and 0.50% for Service Class shares. After this time, the cap may be increased or the commitment to maintain the cap may be terminated only with the approval of the Board of Trustees. During the six months ended July 31, 2018, Funds Management voluntarily waived additional expenses beyond the contractual expense caps.
Shareholder servicing fees
The Trust has entered into contracts with one or more shareholder servicing agents whereby Administrator Class and Service Class of the Fund are each charged a fee at an annual rate of 0.10% and 0.25% of their respective average daily net assets.
A portion of these total shareholder servicing fees were paid to affiliates of Wells Fargo.
Interfund transactions
The Fund may purchase or sell portfolio investment securities to certain other Wells Fargo affiliates pursuant to Rule 17a-7 under the 1940 Act and under procedures adopted by the Board of Trustees. The procedures have been designed to ensure that these interfund transactions, which do not incur broker commissions, are effected at current market prices.
5. INDEMNIFICATION
Under the Trust’s organizational documents, the officers and Trustees have been granted certain indemnification rights against certain liabilities that may arise out of performance of their duties to the Trust. Additionally, in the normal course of business, the Trust may enter into contracts with service providers that contain a variety of indemnification clauses. The Trust’s maximum exposure under these arrangements is dependent on future claims that may be made against the Fund and, therefore, cannot be estimated.
| | | | |
| 26 | | Wells Fargo Cash Investment Money Market Fund | | Other information (unaudited) |
PROXY VOTING INFORMATION
A description of the policies and procedures that the Fund uses to determine how to vote proxies relating to portfolio securities is available, upon request, by calling 1-800-222-8222, visiting our website at wellsfargofunds.com, or visiting the SEC website at sec.gov. Information regarding how the Fund voted proxies relating to portfolio securities during the most recent 12-month period ended June 30 is available on the Fund’s website at wellsfargofunds.com or by visiting the SEC website at sec.gov.
PORTFOLIO HOLDINGS INFORMATION
The complete portfolio holdings for the Fund are publicly available on the Fund’s website (wellsfargofunds.com) on a 1-day delayed basis. The Fund files its complete schedule of portfolio holdings with the SEC for the first and third quarters of each fiscal year on Form N-Q, which is available by visiting the SEC website at sec.gov. In addition, the Fund’s Form N-Q may be reviewed and copied at the SEC’s Public Reference Room in Washington, DC, and at regional offices in New York City, at 233 Broadway, and in Chicago, at 175 West Jackson Boulevard, Suite 900. Information about the Public Reference Room may be obtained by calling 1-800-SEC-0330.
| | | | | | |
| Other information (unaudited) | | Wells Fargo Cash Investment Money Market Fund | | | 27 | |
BOARD OF TRUSTEES AND OFFICERS
Each of the Trustees and Officers1 listed in the table below acts in identical capacities for each fund in the Wells Fargo family of funds, which consists of 154 mutual funds comprising the Wells Fargo Funds Trust, Wells Fargo Variable Trust, Wells Fargo Master Trust and four closed-end funds (collectively the “Fund Complex”). This table should be read in conjunction with the Prospectus and the Statement of Additional Information2. The mailing address of each Trustee and Officer is 525 Market Street, 12th Floor, San Francisco, CA 94105. Each Trustee and Officer serves an indefinite term, however, each Trustee serves such term until reaching the mandatory retirement age established by the Trustees.
Independent Trustees
| | | | | | |
Name and year of birth | | Position held and length of service* | | Principal occupations during past five years or longer | | Current other public company or
investment company
directorships |
William R. Ebsworth (Born 1957) | | Trustee, since 2015 | | Retired. From 1984 to 2013, equities analyst, portfolio manager, research director and chief investment officer at Fidelity Management and Research Company in Boston, Tokyo, and Hong Kong, and retired in 2013 as Chief Investment Officer of Fidelity Strategic Advisers, Inc. where he led a team of investment professionals managing client assets. Prior thereto, Board member of Hong Kong Securities Clearing Co., Hong Kong Options Clearing Corp., the Thailand International Fund, Ltd., Fidelity Investments Life Insurance Company, and Empire Fidelity Investments Life Insurance Company. Board member of the Forté Foundation (non-profit organization) and the Vincent Memorial Hospital Endowment (non-profit organization), where he serves on the Investment Committee and as a Chair of the Audit Committee. Mr. Ebsworth is a CFA® charterholder. | | Asset Allocation Trust |
Jane A. Freeman (Born 1953) | | Trustee, since 2015; Chair Liaison, since 2018 | | Retired. From 2012 to 2014 and 1999 to 2008, Chief Financial Officer of Scientific Learning Corporation. From 2008 to 2012, Ms. Freeman provided consulting services related to strategic business projects. Prior to 1999, Portfolio Manager at Rockefeller & Co. and Scudder, Stevens & Clark. Board member of the Harding Loevner Funds from 1996 to 2014, serving as both Lead Independent Director and chair of the Audit Committee. Board member of the Russell Exchange Traded Funds Trust from 2011 to 2012 and the chair of the Audit Committee. Ms. Freeman is a Board Member of Ruth Bancroft Garden (non-profit organization) and the Glimmerglass Festival. She is also an inactive Chartered Financial Analyst. | | Asset Allocation Trust |
Isaiah Harris, Jr. (Born 1952) | | Trustee, since 2009 | | Retired. Chairman of the Board of CIGNA Corporation since 2009, and Director since 2005. From 2003 to 2011, Director of Deluxe Corporation. Prior thereto, President and CEO of BellSouth Advertising and Publishing Corp. from 2005 to 2007, President and CEO of BellSouth Enterprises from 2004 to 2005 and President of BellSouth Consumer Services from 2000 to 2003. Emeritus member of the Iowa State University Foundation Board of Governors. Emeritus Member of the Advisory Board of Iowa State University School of Business. Advisory Board Member, Palm Harbor Academy (charter school). Advisory Board Member, Child Evangelism Fellowship (non-profit). Mr. Harris is a certified public accountant (inactive status). | | CIGNA Corporation; Asset Allocation Trust |
Judith M. Johnson (Born 1949) | | Trustee, since 2008; Audit Committee Chairman, since 2009 | | Retired. Prior thereto, Chief Executive Officer and Chief Investment Officer of Minneapolis Employees Retirement Fund from 1996 to 2008. Ms. Johnson is an attorney, certified public accountant and a certified managerial accountant. | | Asset Allocation Trust |
David F. Larcker (Born 1950) | | Trustee, since 2009 | | James Irvin Miller Professor of Accounting at the Graduate School of Business, Stanford University, Director of the Corporate Governance Research Initiative and Senior Faculty of The Rock Center for Corporate Governance since 2006. From 2005 to 2008, Professor of Accounting at the Graduate School of Business, Stanford University. Prior thereto, Ernst & Young Professor of Accounting at The Wharton School, University of Pennsylvania from 1985 to 2005. | | Asset Allocation Trust |
| | | | |
| 28 | | Wells Fargo Cash Investment Money Market Fund | | Other information (unaudited) |
| | | | | | |
Name and year of birth | | Position held and length of service* | | Principal occupations during past five years or longer | | Current other public company or
investment company
directorships |
Olivia S. Mitchell (Born 1953) | | Trustee, since 2006; Governance Committee Chairman, since 2018 | | International Foundation of Employee Benefit Plans Professor, Wharton School of the University of Pennsylvania since 1993. Director of Wharton’s Pension Research Council and Boettner Center on Pensions & Retirement Research, and Research Associate at the National Bureau of Economic Research. Previously, Cornell University Professor from 1978 to 1993. | | Asset Allocation Trust |
Timothy J. Penny (Born 1951) | | Trustee, since 1996; Chairman, since 2018; Vice Chairman, from 2017 to 2018 | | President and Chief Executive Officer of Southern Minnesota Initiative Foundation, a non-profit organization, since 2007. Member of the Board of Trustees of NorthStar Education Finance, Inc., a non-profit organization, since 2007. | | Asset Allocation Trust |
James G. Polisson (Born 1959) | | Trustee, since 2018; Advisory Board Member, from 2017 to 2018 | | Retired. Chief Marketing Officer, Source (ETF) UK Services, Ltd, from 2015 to 2017. From 2012 to 2015, Principal of The Polisson Group, LLC, a management consulting, corporate advisory and principal investing company. Chief Executive Officer and Managing Director at Russell Investments, Global Exchange Traded Funds from 2010 to 2012. Managing Director of Barclays Global Investors from 1998 to 2010 and Global Chief Marketing Officer for iShares and Barclays Global Investors from 2000 to 2010. Trustee of the San Francisco Mechanics’ Institute, a non-profit organization, from 2013 to 2015. Board member of the Russell Exchange Traded Fund Trust from 2011 to 2012. Director of Barclays Global Investors Holdings Deutschland GmbH from 2006 to 2009. Mr. Polisson is an attorney and has a retired status with the Massachusetts and District of Columbia Bar Associations. | | Asset Allocation Trust |
Michael S. Scofield (Born 1943) | | Trustee, since 2010 | | Served on the Investment Company Institute’s Board of Governors and Executive Committee from 2008-2011 as well the Governing Council of the Independent Directors Council from 2006-2011 and the Independent Directors Council Executive Committee from 2008-2011. Trustee of the Evergreen Fund complex (and its predecessors) from 1984 to 2010. Chairman of the Evergreen Funds from 2000-2010. Former Trustee of the Mentor Funds. Retired Attorney, Law Offices of Michael S. Scofield. | | Asset Allocation Trust |
Pamela Wheelock (Born 1959) | | Trustee, since 2018; Advisory Board Member, from 2017 to 2018 | | Chief Operating Officer, Twin Cities Habitat for Humanity, since January, 2017. Vice President of University Services, University of Minnesota from 2012 to 2017. Prior thereto, on the Board of Directors, Goverance Committee and Finance Committee for the Minnesota Philanthropy Partners (Saint Paul Foundation) from 2012 to 2018, Interim President and Chief Executive Officer of Blue Cross Blue shield of Minnesota of Minnesota from 2010 to 2011, Chairman of the Board from 2009 to 2011 and Board Director 003 to 2015. Vice President, Leadership and Community Engagement, Bush Foundation, Saint Paul, Minnesota (a private foundation) from 2009 to 2011. Executive Vice President and Chief Financial Officer, Minnesota Sports and Entertainment from 2004 to 2009 and Senior Vice President from 2002 to 2004. Commissioner of Finance, State of Minnesota, from 1999 to 2002. Currently the Board Chair of the Minnesota Wild Foundation since 2010. | | Asset Allocation Trust |
| * | Length of service dates reflect the Trustee’s commencement of service with the Trust’s predecessor entities, where applicable. |
| | | | | | |
| Other information (unaudited) | | Wells Fargo Cash Investment Money Market Fund | | | 29 | |
Officers
| | | | | | |
Name and year of birth | | Position held and length of service | | Principal occupations during past five years or longer | | |
Andrew Owen (Born 1960) | | President, since 2017 | | Executive Vice President of Wells Fargo & Company and Head of Affiliated Managers, Wells Fargo Asset Management, since 2014. In addition, Mr. Owen is currently President, Chief Executive Officer and Director of Wells Fargo Funds Management, LLC since 2017. Prior thereto, Executive Vice President responsible for marketing, investments and product development for Wells Fargo Funds Management, LLC, from 2009 to 2014. | | |
Nancy Wiser1 (Born 1967) | | Treasurer, since 2012 | | Executive Vice President of Wells Fargo Funds Management, LLC since 2011. Chief Operating Officer and Chief Compliance Officer at LightBox Capital Management LLC, from 2008 to 2011. | | |
Alexander Kymn3 (Born 1973) | | Secretary, since 2018; Chief Legal Officer, since 2018 | | Senior Company Counsel of Wells Fargo Bank, N.A. since 2018 (previously Senior Counsel from 2007 to 2018). Vice President of Wells Fargo Funds Management, LLC from 2008 to 2014. | | |
Michael H. Whitaker (Born 1967) | | Chief Compliance Officer, since 2016 | | Senior Vice President and Chief Compliance Officer since 2016. Senior Vice President and Chief Compliance Officer for Fidelity Investments from 2007 to 2016. | | |
David Berardi (Born 1975) | | Assistant Treasurer, since 2009 | | Vice President of Wells Fargo Funds Management, LLC since 2009. Vice President of Evergreen Investment Management Company, LLC from 2008 to 2010. Manager of Fund Reporting and Control for Evergreen Investment Management Company, LLC from 2004 to 2010. | | |
Jeremy DePalma1 (Born 1974) | | Assistant Treasurer, since 2009 | | Senior Vice President of Wells Fargo Funds Management, LLC since 2009. Senior Vice President of Evergreen Investment Management Company, LLC from 2008 to 2010 and head of the Fund Reporting and Control Team within Fund Administration from 2005 to 2010. | | |
| 1 | Nancy Wiser acts as Treasurer of 77 funds in the Fund Complex. Jeremy DePalma acts as Treasurer of 77 funds and Assistant Treasurer of 77 funds in the Fund Complex. |
| 2 | The Statement of Additional Information includes additional information about the Trustees and is available, without charge, upon request, by calling 1-800-222-8222 or by visiting the website at wellsfargofunds.com. |
| 3 | Alexander Kymn became the Secretary and Chief Legal Officer effective April 17, 2018. |
| | | | |
| 30 | | Wells Fargo Cash Investment Money Market Fund | | Other information (unaudited) |
BOARD CONSIDERATION OF INVESTMENT MANAGEMENT AND SUB-ADVISORY AGREEMENTS:
Wells Fargo Cash Investment Money Market Fund
Under the Investment Company Act of 1940 (the “1940 Act”), the Board of Trustees (the “Board”) of Wells Fargo Funds Trust (the “Trust”) must determine annually whether to approve the continuation of the Trust’s investment management and sub-advisory agreements. In this regard, at an in-person meeting held on May 22-23, 2018 (the “Meeting”), the Board, all the members of which have no direct or indirect interest in the investment management and sub-advisory agreements and are not “interested persons” of the Trust, as defined in the 1940 Act (the “Independent Trustees”), reviewed and approved for Wells Fargo Cash Investment Money Market Fund (the “Fund”): (i) an investment management agreement (the “Management Agreement”) with Wells Fargo Funds Management, LLC (“Funds Management”); (ii) an investment sub-advisory agreement with Wells Capital Management Incorporated (“WellsCap”), an affiliate of Funds Management; and (iii) an investment sub-advisory agreement with Wells Fargo Bank, N.A. d/b/a Wells Capital Management Singapore (“WellsCap Singapore”), an affiliate of Funds Management. The sub-advisory agreements with WellsCap and WellsCap Singapore (the “Sub-Advisers”) are collectively referred to as the Sub-Advisory Agreements, and the Management Agreement and the Sub-Advisory Agreements are collectively referred to as the “Advisory Agreements.”
At the Meeting, the Board considered the factors and reached the conclusions described below relating to the selection of Funds Management and the Sub-Advisers and the approval of the Advisory Agreements. Prior to the Meeting, including at an in-person meeting in April 2018, the Trustees conferred extensively among themselves and with representatives of Funds Management about these matters. Also, the Board has adopted a team-based approach, with each team consisting of a sub-set of Trustees, to assist the full Board in the discharge of its duties in reviewing investment performance and other matters throughout the year. The Independent Trustees were assisted in their evaluation of the Advisory Agreements by independent legal counsel, from whom they received separate legal advice and with whom they met separately.
In providing information to the Board, Funds Management and the Sub-Advisers were guided by a detailed set of requests for information submitted to them by independent legal counsel on behalf of the Independent Trustees at the start of the Board’s annual contract renewal process earlier in 2018. In considering and approving the Advisory Agreements, the Trustees considered the information they believed relevant, including but not limited to the information discussed below. The Board considered not only the specific information presented in connection with the Meeting, but also the knowledge gained over time through interaction with Funds Management and the Sub-Advisers about various topics. In this regard, the Board reviewed reports of Funds Management at each of its quarterly meetings, which included, among other things, portfolio reviews and investment performance reports. In addition, the Board and the teams mentioned above confer with portfolio managers at various times throughout the year. The Board did not identify any particular information or consideration that was all-important or controlling, and each individual Trustee may have attributed different weights to various factors.
After its deliberations, the Board unanimously approved the continuation of the Advisory Agreements for a one-year term and determined that the compensation payable to Funds Management and the Sub-Advisers under each of the Advisory Agreements was reasonable. The Board considered the approval of the Advisory Agreements for the Fund as part of its consideration of agreements for funds across the complex, but its approvals were made on a fund-by-fund basis. The following summarizes a number of important, but not necessarily all, factors considered by the Board in support of its approvals.
Nature, extent and quality of services
The Board received and considered various information regarding the nature, extent and quality of services provided to the Fund by Funds Management and the Sub-Advisers under the Advisory Agreements. This information included a description of the investment advisory services and Fund-level administrative services covered by the Management Agreement, as well as, among other things, a summary of the background and experience of senior management of Wells Fargo Asset Management (“WFAM”), of which Funds Management and the Sub-Advisers are a part, a summary of investments made in the business of WFAM, a summary of certain organizational and personnel changes involving Funds Management and the Sub-Advisers, and a description of Funds Management’s and the Sub-Advisers’ business continuity planning programs and of their approaches to data privacy and cybersecurity. The Board also considered the qualifications, background, tenure and responsibilities of each of the portfolio managers primarily responsible for the day-to-day portfolio management of the Fund.
| | | | | | |
| Other information (unaudited) | | Wells Fargo Cash Investment Money Market Fund | | | 31 | |
The Board evaluated the ability of Funds Management and the Sub-Advisers to attract and retain qualified investment professionals, including research, advisory and supervisory personnel. The Board further considered the compliance programs and compliance records of Funds Management and the Sub-Advisers. In addition, the Board took into account the full range of services provided to the Fund by Funds Management and its affiliates.
Fund investment performance and expenses
The Board considered the investment performance results for the Fund over various time periods ended December 31, 2017. The Board considered these results in comparison to the investment performance of funds in a universe that was determined by Broadridge Inc. (“Broadridge”) to be similar to the Fund (the “Universe”), and to other comparative data. Broadridge is an independent provider of investment company data. The Board received a description of the methodology used by Broadridge to select the mutual funds in the investment performance Universe. The Board noted that the investment performance of the Fund (Administrator Class) was higher than or in range of the average investment performance of the Universe for all periods under review.
The Board also received and considered information regarding the Fund’s net operating expense ratios and their various components, including actual management fees, custodian and other non-management fees, and Rule 12b-1 and non-Rule 12b-1 shareholder service fees. The Board considered these ratios in comparison to the median ratios of funds in class-specific expense groups that were determined by Broadridge to be similar to the Fund (the “Groups”). The Board received a description of the methodology used by Broadridge to select the mutual funds in the expense Groups and an explanation of how funds comprising expense groups and their expense ratios may vary from year-to-year. Based on the Broadridge reports, the Board noted that the net operating expense ratios of the Fund were lower than or in range of the median net operating expense ratios of the expense Groups for all share classes.
The Board took into account the Fund’s investment performance and expense information provided to it among the factors considered in deciding to re-approve the Advisory Agreements.
Investment management and sub-advisory fee rates
The Board reviewed and considered the contractual fee rates payable by the Fund to Funds Management under the Management Agreement, as well as the contractual fee rates payable by the Fund to Funds Management for class-level administrative services under a Class-Level Administration Agreement, which include, among other things, class-level transfer agency and sub-transfer agency costs (collectively, the “Management Rates”). The Board also reviewed and considered the contractual investment sub-advisory fee rates that are payable by Funds Management to the Sub-Advisers for investment sub-advisory services.
Among other information reviewed by the Board was a comparison of the Fund’s Management Rates with the average contractual investment management fee rates of funds in the expense Groups at a common asset level as well as transfer agency costs of the funds in the expense Groups. The Board noted that the Management Rates of the Fund were lower than or in range of the sum of these average rates for the Fund’s expense Groups for all share classes.
The Board also received and considered information about the portion of the total management fee that was retained by Funds Management after payment of the fee to the Sub-Advisers for sub-advisory services. In assessing the reasonableness of this amount, the Board received and evaluated information about the nature and extent of responsibilities retained and risks assumed by Funds Management and not delegated to or assumed by the Sub-Advisers, and about Funds Management’s on-going oversight services. Given the affiliation between Funds Management and the Sub-Advisers, the Board ascribed limited relevance to the allocation of fees between them.
Based on its consideration of the factors and information it deemed relevant, including those described here, the Board determined that the compensation payable to Funds Management under the Management Agreement and to the Sub-Advisers under the Sub-Advisory Agreements was reasonable.
Profitability
The Board received and considered information concerning the profitability of Funds Management, as well as the profitability of both WFAM and Wells Fargo & Co. (“Wells Fargo”) as a whole, from providing services to the Fund and the fund family as a whole. The Board noted that the Sub-Advisers’ profitability information with respect to providing services to the Fund was subsumed in the WFAM and Wells Fargo profitability analysis.
Funds Management reported on the methodologies and estimates used in calculating profitability, including a description of the methodology used to allocate certain expenses and recent enhancements made to the methodology. Among other things, the Board noted that the levels of profitability reported on a fund-by-fund basis varied widely,
| | | | |
| 32 | | Wells Fargo Cash Investment Money Market Fund | | Other information (unaudited) |
depending on factors such as the size and type of fund. Based on its review, the Board did not deem the profits reported by Funds Management, WFAM or Wells Fargo from services provided to the Fund to be at a level that would prevent it from approving the continuation of the Advisory Agreements.
Economies of scale
The Board considered the extent to which Funds Management may experience economies of scale in the provision of management services, and the extent to which scale benefits, if any, would be shared with shareholders. In particular, the Board noted the existence of breakpoints in the Fund’s management fee structure, which operate generally to reduce the Fund’s expense ratios as the Fund grows in size. It considered that, for a small fund or a fund that shrinks in size, breakpoints conversely can result in higher fee levels. The Board also considered that in addition to management fee breakpoints, competitive management fee rates set at the outset without regard to breakpoints and fee waiver and expense reimbursement arrangements, as well as investments in the business intended to enhance services available to Fund shareholders, are means of sharing potential economies of scale with shareholders of the Fund.
The Board concluded that the Fund’s fee and expense arrangements, including contractual breakpoints, constituted a reasonable approach to sharing potential economies of scale with the Fund and its shareholders.
Other benefits to Funds Management and the Sub-Advisers
The Board received and considered information regarding potential “fall-out” or ancillary benefits received by Funds Management and its affiliates, including the Sub-Advisers, as a result of their relationships with the Fund. Ancillary benefits could include, among others, benefits directly attributable to other relationships with the Fund and benefits potentially derived from an increase in Funds Management’s and the Sub-Advisers’ business as a result of their relationships with the Fund. The Board noted that various affiliates of Funds Management may receive distribution-related fees, shareholder servicing payments and sub-transfer agency fees in respect of shares sold or held through them and services provided.
The Board also reviewed information about soft dollar credits earned and utilized by the Sub-Advisers, fees earned by Funds Management and WellsCap from managing a private investment vehicle for the fund family’s securities lending collateral and commissions earned by an affiliated broker from portfolio transactions.
Based on its consideration of the factors and information it deemed relevant, including those described here, the Board did not find that any ancillary benefits received by Funds Management and its affiliates, including the Sub-Advisers, were unreasonable.
Conclusion
At the Meeting, after considering the above-described factors and based on its deliberations and its evaluation of the information described above, the Board unanimously approved the continuation of the Advisory Agreements for a one-year term and determined that the compensation payable to Funds Management and the Sub-Advisers under each of the Advisory Agreements was reasonable.

For more information
More information about Wells Fargo Funds is available free upon request. To obtain literature, please write, email, visit the Fund’s website, or call:
Wells Fargo Funds
P.O. Box 219967
Kansas City, MO 64121-9967
Website: wellsfargofunds.com
Individual investors: 1-800-222-8222
Retail investment professionals: 1-888-877-9275
Institutional investment professionals: 1-866-765-0778
This report and the financial statements contained herein are submitted for the general information of the shareholders of the Fund. If this report is used for promotional purposes, distribution of the report must be accompanied or preceded by a current prospectus. Before investing, please consider the investment objectives, risks, charges, and expenses of the investment. For a current prospectus and, if available, a summary prospectus, containing this information, call 1-800-222-8222 or visit the Fund’s website at wellsfargofunds.com. Read the prospectus carefully before you invest or send money.
Wells Fargo Asset Management (WFAM) is the trade name for certain investment advisory/management firms owned by Wells Fargo & Company. These firms include but are not limited to Wells Capital Management Incorporated and Wells Fargo Funds Management, LLC. Certain products managed by WFAM entities are distributed by Wells Fargo Funds Distributor, LLC (a broker/dealer and Member FINRA).
This material is for general informational and educational purposes only and is NOT intended to provide investment advice or a recommendation of any kind—including a recommendation for any specific investment, strategy, or plan.
NOT FDIC INSURED ◾ NO BANK GUARANTEE ◾ MAY LOSE VALUE
© 2018 Wells Fargo Funds Management, LLC. All rights reserved.
| | |
 | | 314807 09-18 SA302/SAR302 07-18 |
Semi-Annual Report
July 31, 2018

Institutional Money Market Funds

| ∎ | | Wells Fargo Heritage Money Market Fund |

Reduce clutter. Save trees.
Sign up for electronic delivery of prospectuses and shareholder reports at wellsfargo.com/advantagedelivery
Contents
The views expressed and any forward-looking statements are as of July 31, 2018, unless otherwise noted, and are those of the Fund managers and/or Wells Fargo Funds Management, LLC. Discussions of individual securities, or the markets generally, or any Wells Fargo Fund are not intended as individual recommendations. Future events or results may vary significantly from those expressed in any forward-looking statements. The views expressed are subject to change at any time in response to changing circumstances in the market. Wells Fargo Funds Management, LLC and the Fund disclaim any obligation to publicly update or revise any views expressed or forward-looking statements.
NOT FDIC INSURED ◾ NO BANK GUARANTEE ◾ MAY LOSE VALUE
| | | | |
| 2 | | Wells Fargo Heritage Money Market Fund | | Letter to shareholders (unaudited) |

Andrew Owen
President
Wells Fargo Funds
Yields on money market funds benefited during the period.
During February 2018, the U.S. stock market endured a loss of more than 10% before recovering in March and April.
Dear Shareholder:
We are pleased to offer you this semi-annual report for the Wells Fargo Heritage Money Market Fund for the six-month period that ended July 31, 2018. Yields on money market funds benefited during the period. As the U.S. Federal Reserve (the Fed) moved toward a more normalized monetary policy after an extended term of low interest rates following the global financial crisis during 2007 and 2008, its steady pace of interest rate increases helped raise yields on short-term money market instruments.
Globally, stock markets followed a less consistent path during the period. After advancing during the summer and fall of 2017 in a roughly synchronized way, economic growth and stock markets globally diverged during the first seven months of 2018. For fixed-income investors, higher U.S. interest rates, rising inflation, and intensifying global geopolitical tensions tended to restrain taxable bond prices while high-yield and municipal bond investors generally enjoyed positive returns.
For the period, U.S. stocks, as measured by the S&P 500 Index,1 gained 0.70%, and international stocks, as measured by the MSCI ACWI ex USA Index (Net),2 fell 6.66%. Emerging market stocks, as measured by the MSCI EM Index (Net),3 dropped 11.94%. In bond markets, the Bloomberg Barclays U.S. Aggregate Bond Index4 declined 0.45% while fixed-income investments outside the U.S. fell 4.57%, according to the Bloomberg Barclays Global Aggregate ex-USD Index.5 The Bloomberg Barclays Municipal Bond Index6 added 1.18%, and the ICE BofAML U.S. High Yield Index7 was up 0.55%.
Volatility reemerged during the first quarter of 2018 as economic signals were mixed.
The first quarter of 2018 began with stock market gains in January following U.S. tax reform that lowered rates for individuals and corporations and deregulation advanced in some economic sectors. Then, investor optimism was supplanted by several concerns. Trade tensions intensified, particularly between the U.S. and China. The U.S. threatened to impose tariffs on a broad range of imported products. Increasing interest rates and inflation also caused concern. During February 2018, the U.S. stock market endured a loss of more than 10% before recovering in March and April. The S&P 500 Index closed the first quarter with a negative return, the first negative quarterly return for the index since 2014.
| 1 | The S&P 500 Index consists of 500 stocks chosen for market size, liquidity, and industry group representation. It is a market-value-weighted index with each stock’s weight in the index proportionate to its market value. You cannot invest directly in an index. |
| 2 | The Morgan Stanley Capital International (MSCI) All Country World Index (ACWI) ex USA Index (Net) is a free-float-adjusted market-capitalization-weighted index that is designed to measure the equity market performance of developed markets, excluding the United States and Canada. Source: MSCI. MSCI makes no express or implied warranties or representations and shall have no liability whatsoever with respect to any MSCI data contained herein. The MSCI data may not be further redistributed or used as a basis for other indices or any securities or financial products. This report is not approved, reviewed, or produced by MSCI. You cannot invest directly in an index. |
| 3 | The MSCI Emerging Markets (EM) Index (Net) is a free-float-adjusted market-capitalization-weighted index that is designed to measure large- and mid-cap equity market performance of emerging markets. The MSCI EM Index (Net) consists of the following 24 emerging market country indices: Brazil, Chile, China, Colombia, Czech Republic, Egypt, Greece, Hungary, India, Indonesia, Korea, Malaysia, Mexico, Pakistan, Peru, the Philippines, Poland, Qatar, Russia, South Africa, Taiwan, Thailand, Turkey, and the United Arab Emirates. You cannot invest directly in an index. |
| 4 | The Bloomberg Barclays U.S. Aggregate Bond Index is a broad-based benchmark that measures the investment-grade, U.S. dollar-denominated, fixed-rate taxable bond market, including Treasuries, government-related and corporate securities, mortgage-backed securities (agency fixed-rate and hybrid adjustable-rate mortgage pass-throughs), asset-backed securities, and commercial mortgage-backed securities. You cannot invest directly in an index. |
| 5 | The Bloomberg Barclays Global Aggregate ex-USD Index is an unmanaged index that provides a broad-based measure of the global investment-grade fixed-income markets excluding the U.S. dollar-denominated debt market. You cannot invest directly in an index. |
| 6 | The Bloomberg Barclays Municipal Bond Index is an unmanaged index composed of long-term tax-exempt bonds with a minimum credit rating of Baa. You cannot invest directly in an index. |
| 7 | The ICE BofAML U.S. High Yield Index is a market-capitalization-weighted index of domestic and Yankee high-yield bonds. The index tracks the performance of high-yield securities traded in the U.S. bond market. You cannot invest directly in an index. Copyright 2018. ICE Data Indices, LLC. All rights reserved. |
| 8 | The Consumer Price Index For All Urban Consumers (CPI-U) measures the changes in the price of a basket of goods and services purchased by urban consumers. The urban consumer population is deemed by many as a better representative measure of the general public because most of the country’s population lives in highly populated areas, which represent close to 90% of the total population. You cannot invest directly in an index. |
| | | | | | |
| Letter to shareholders (unaudited) | | Wells Fargo Heritage Money Market Fund | | | 3 | |
The Fed increased the federal funds rate by 25 basis points (bps; 100 bps equal 1.00%) in March 2018 and the rate of inflation reached the Fed’s 2% target for the first time in a year. The unemployment rate fell to 4.1%. The third revision of first-quarter gross domestic product (GDP) growth by the U.S. Bureau of Economic Analysis released during June 2018 was lowered to 2.0%.
Overseas, investment market returns reversed the strong returns of 2017. After having gained 27.19% for the 12-month period that ended on December 31, 2017, the MSCI ACWI ex USA Index (Net) fell 1.46% for the seven-month period that ended July 31, 2018. The U.S. dollar strengthened relative to local currencies, which served to restrain returns.
Global trade tensions escalated during the second quarter and into the third quarter of 2018.
Global trade tensions escalated as the second quarter of 2018 opened and equity markets fell in response before resuming upward momentum later in April. The U.S. government imposed tariffs on products and commodities imported from other markets in North America, Europe, and Asia. In retaliation, governments imposed tariffs on U.S. products and commodities. In addition, the U.S. pushed its North American neighbors to renegotiate the North American Free Trade Agreement, furthering trade tensions and investor uncertainty.
The CPI-U8 added 0.2% in May after a similar increase in April. On a year-over-year basis, the all-items index rose 2.8% for the 12 months that ended May 31, continuing its upward trend since the beginning of the year. The index for all items less food and energy rose 2.2% for the same 12-month period. Interest rates generally increased and the bond markets tended to decline.
During June 2018, the Fed increased the federal funds rate by 25 bps. Investment markets began to anticipate two more rate increases in 2018. Long-term interest rates in the U.S. trended higher—rates on the 10-year and 30-year Treasury bonds moved from 2.46% and 2.81%, respectively, on January 1, 2018, to 2.96% and 3.08%, respectively, on July 31, 2018. While higher at the end of the period, rates were off their peak levels on May 17, 2018, of 3.11% and 3.25%, respectively. Investors became more aware of and concerned about the potential for an inverted yield curve—sometimes a recession signal—as short-term rates increased more quickly than long-term rates.
The unemployment rate fell to 3.9% in July after ticking up slightly in June from May’s 3.8% level, according to the U.S. Department of Labor. The annualized rate of GDP growth for the second quarter of 2018 was reported in July to be 4.1%, the highest level since the third quarter of 2014, according to the U.S. Bureau of Economic Analysis.
Internationally, the prospects for a smooth U.K. Brexit agreement was cast into doubt as members of Prime Minister Theresa May’s negotiating team resigned. Despite the uncertainty, the period closed with expectations that the Bank of England’s Monetary Policy Committee in July would announce an increase in its key interest rate to 0.75%, which it did in early August.
Meanwhile, central banks in Europe and Japan maintained low interest rates and accommodative monetary policies. Amid rising trade uncertainty, People’s Bank of China monetary policies shifted with cuts to reserve requirement ratios and implementation of supportive measures such as accelerated infrastructure spending and tax cuts for small and medium enterprises and for individuals. Nevertheless, a strengthening U.S. dollar and the tensions associated with trade policies remained headwinds for investors overseas.
| | | | |
| 4 | | Wells Fargo Heritage Money Market Fund | | Letter to shareholders (unaudited) |
Don’t let short-term uncertainty derail long-term investment goals.
Periods of investment uncertainty can present challenges, but experience has taught us that maintaining long-term investment goals can be an effective way to plan for the future. To help you create a sound strategy based on your personal goals and risk tolerance, Wells Fargo Funds offers more than 100 mutual funds spanning a wide range of asset classes and investment styles. Although diversification cannot guarantee an investment profit or prevent losses, we believe it can be an effective way to manage investment risk and potentially smooth out overall portfolio performance. We encourage investors to know their investments and to understand that appropriate levels of risk-taking may unlock opportunities.
Thank you for choosing to invest with Wells Fargo Funds. We appreciate your confidence in us and remain committed to helping you meet your financial needs.
Sincerely,

Andrew Owen
President
Wells Fargo Funds
For further information about your Fund, contact your investment professional, visit our website at wellsfargofunds.com, or call us directly at 1-800-222-8222.
This page is intentionally left blank.
| | | | |
| 6 | | Wells Fargo Heritage Money Market Fund | | Performance highlights (unaudited) |
Investment objective
The Fund seeks current income, while preserving capital and liquidity.
Manager
Wells Fargo Funds Management, LLC
Subadvisers
Wells Capital Management Incorporated
Wells Capital Management Singapore
Portfolio managers
Michael C. Bird, CFA®
Jeffrey L. Weaver, CFA®
Laurie White
Average annual total returns (%) as of July 31, 20181
| | | | | | | | | | | | | | | | | | | | | | |
| | | | | | | | Expense ratios2 (%) | |
| | | Inception date | | 1 year | | | 5 year | | | 10 year | | | Gross | | | Net3 | |
| Administrator Class (SHMXX) | | 6-29-1995 | | | 1.41 | | | | 0.43 | | | | 0.35 | | | | 0.40 | | | | 0.35 | |
| Institutional Class (SHIXX) | | 3-31-2000 | | | 1.53 | | | | 0.50 | | | | 0.43 | | | | 0.28 | | | | 0.20 | |
| Select Class (WFJXX) | | 6-29-2007 | | | 1.60 | | | | 0.57 | | | | 0.50 | | | | 0.24 | | | | 0.13 | |
| Service Class (WHTXX) | | 6-30-2010 | | | 1.29 | | | | 0.37 | | | | 0.32 | | | | 0.57 | | | | 0.43 | |
Yield summary (%) as of July 31, 20183
| | | | | | | | | | | | | | |
| | | Administrator
Class | | Institutional
Class | | | Select
Class | | | Service
Class | |
| 7-day current yield | | 1.90 | | | 2.03 | | | | 2.10 | | | | 1.80 | |
| 7-day compound yield | | 1.91 | | | 2.05 | | | | 2.12 | | | | 1.81 | |
| 30-day simple yield | | 1.89 | | | 2.02 | | | | 2.09 | | | | 1.79 | |
| 30-day compound yield | | 1.90 | | | 2.03 | | | | 2.11 | | | | 1.80 | |
Figures quoted represent past performance, which is no guarantee of future results, and do not reflect taxes that a shareholder may pay on fund distributions or the redemption of fund shares. Investment returns will fluctuate. The Fund’s yield figures more closely reflect the current earnings of the Fund than the total return figures. Current performance may be lower or higher than the performance data quoted, which assumes the reinvestment of dividends and capital gains. Current month-end performance is available on the Fund’s website, wellsfargofunds.com.
Each class is sold without a front-end sales charge or contingent deferred sales charge.
For floating NAV money market funds: You could lose money by investing in the Fund. Because the share price of the Fund will fluctuate, when you sell your shares they may be worth more or less than what you originally paid for them. The Fund may impose a fee upon sale of your shares or may temporarily suspend your ability to sell shares if the Fund’s liquidity falls below required minimums because of market conditions or other factors. An investment in the Fund is not insured or guaranteed by the Federal Deposit Insurance Corporation or any other government agency. The Fund’s sponsor has no legal obligation to provide financial support to the Fund, and you should not expect that the sponsor will provide financial support to the Fund at any time.
Please see footnotes on page 7.
| | | | | | |
| Performance highlights (unaudited) | | Wells Fargo Heritage Money Market Fund | | | 7 | |
|
| Portfolio composition as of July 31, 20184 |
|
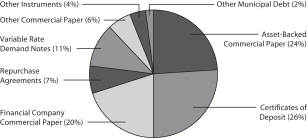 |
|
| Effective maturity distribution as of July 31, 20184 |
|
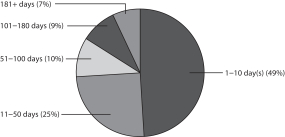 |
|
| Weighted average maturity as of July 31, 20185 |
15 days |
|
| Weighted average life as of July 31, 20186 |
49 days |
| 1 | Historical performance shown for Service Class shares prior to their inception reflects the performance of Administrator Class shares and has not been adjusted to reflect the higher expenses applicable to Service Class shares. If these expenses had not been included, returns for Service Class shares would be lower. |
| 2 | Reflects the expense ratios as stated in the most recent prospectuses. The expense ratios shown are subject to change and may differ from the annualized expense ratios shown in the financial highlights of this report. |
| 3 | The manager has contractually committed through May 31, 2019, to waive fees and/or reimburse expenses to the extent necessary to cap the Fund’s Total Annual Fund Operating Expenses After Fee Waivers at the amounts shown. After this time, the cap may be increased or the commitment to maintain the cap may be terminated only with the approval of the Board of Trustees. Brokerage commissions, stamp duty fees, interest, taxes, acquired fund fees and expenses (if any), and extraordinary expenses are excluded from the expense cap. Without this cap, the Fund’s returns would have been lower. Without waived fees and/or reimbursed expenses, the Fund’s 7-day current yield would have been 1.88.%, 2.00%, 2.04%, and 1.75% for Administrator Class, Institutional Class, Select Class, and Service Class, respectively. The expense ratio paid by an investor is the net expense ratio (the total annual fund operating expenses after fee waivers) as stated in the prospectuses. |
| 4 | Amounts are calculated based on the total investments of the Fund. These amounts are subject to change and may have changed since the date specified. |
| 5 | Weighted Average Maturity (WAM): WAM is an average of the effective maturities of all securities held in the portfolio, weighted by each security’s percentage of total investments. The maturity of a portfolio security is the period remaining until the date on which the principal amount is unconditionally required to be paid, or in the case of a security called for redemption, the date on which the redemption payment is unconditionally required to be made. WAM calculations allow for the maturities of certain securities with demand features or periodic interest rate resets to be shortened. WAM is a way to measure a fund’s sensitivity to potential interest rate changes. WAM is subject to change and may have changed since the date specified. |
| 6 | Weighted Average Life (WAL): WAL is an average of the final maturities of all securities held in the portfolio, weighted by their percentage of total investments. The maturity of a portfolio security is the period remaining until the date on which the principal amount is unconditionally required to be paid, or in the case of a security called for redemption, the date on which the redemption payment is unconditionally required to be made. In contrast to WAM, the calculation of WAL allows for the maturities of certain securities with demand features to be shortened, but not the periodic interest rate resets. WAL is a way to measure a fund’s potential sensitivity to credit spread changes. WAL is subject to change and may have changed since the date specified. |
| | | | |
| 8 | | Wells Fargo Heritage Money Market Fund | | Fund expenses (unaudited) |
As a shareholder of the Fund, you incur ongoing costs, including management fees, shareholder servicing fees, and other Fund expenses. This example is intended to help you understand your ongoing costs (in dollars) of investing in the Fund and to compare these costs with the ongoing costs of investing in other mutual funds.
The example is based on an investment of $1,000 invested at the beginning of the six-month period and held for the entire period from February 1, 2018 to July 31, 2018.
Actual expenses
The “Actual” line of the table below provides information about actual account values and actual expenses. You may use the information in this line, together with the amount you invested, to estimate the expenses that you paid over the period. Simply divide your account value by $1,000 (for example, an $8,600 account value divided by $1,000 = 8.6), then multiply the result by the number in the “Actual” line under the heading entitled “Expenses paid during period” for your applicable class of shares to estimate the expenses you paid on your account during this period.
Hypothetical example for comparison purposes
The “Hypothetical” line of the table below provides information about hypothetical account values and hypothetical expenses based on the Fund’s actual expense ratio and an assumed rate of return of 5% per year before expenses, which is not the Fund’s actual return. The hypothetical account values and expenses may not be used to estimate the actual ending account balance or expenses you paid for the period. You may use this information to compare the ongoing costs of investing in the Fund and other funds. To do so, compare this 5% hypothetical example with the 5% hypothetical examples that appear in the shareholder reports of the other funds.
Please note that the expenses shown in the table are meant to highlight your ongoing costs only. Therefore, the “Hypothetical” line of the table is useful in comparing ongoing costs only and will not help you determine the relative total costs of owning different funds.
| | | | | | | | | | | | | | | | |
| | | Beginning
account value
2-1-2018 | | | Ending
account value
7-31-2018 | | | Expenses
paid during
the period¹ | | | Annualized net
expense ratio | |
Administrator Class | | | | | | | | | | | | | | | | |
Actual | | $ | 1,000.00 | | | $ | 1,008.40 | | | $ | 1.67 | | | | 0.33 | % |
Hypothetical (5% return before expenses) | | $ | 1,000.00 | | | $ | 1,023.54 | | | $ | 1.68 | | | | 0.33 | % |
Institutional Class | | | | | | | | | | | | | | | | |
Actual | | $ | 1,000.00 | | | $ | 1,008.95 | | | $ | 1.01 | | | | 0.20 | % |
Hypothetical (5% return before expenses) | | $ | 1,000.00 | | | $ | 1,024.20 | | | $ | 1.02 | | | | 0.20 | % |
Select Class | | | | | | | | | | | | | | | | |
Actual | | $ | 1,000.00 | | | $ | 1,009.30 | | | $ | 0.66 | | | | 0.13 | % |
Hypothetical (5% return before expenses) | | $ | 1,000.00 | | | $ | 1,024.55 | | | $ | 0.66 | | | | 0.13 | % |
Service Class | | | | | | | | | | | | | | | | |
Actual | | $ | 1,000.00 | | | $ | 1,007.80 | | | $ | 2.18 | | | | 0.43 | % |
Hypothetical (5% return before expenses) | | $ | 1,000.00 | | | $ | 1,023.04 | | | $ | 2.19 | | | | 0.43 | % |
| 1 | Expenses paid is equal to the annualized net expense ratio of each class multiplied by the average account value over the period, multiplied by the number of days in the most recent fiscal half-year divided by the number of days in the fiscal year (to reflect the one-half-year period). |
| | | | | | |
| Portfolio of investments—July 31, 2018 (unaudited) | | Wells Fargo Heritage Money Market Fund | | | 9 | |
| | | | | | | | | | | | | | | | |
| Security name | | Interest rate | | | Maturity date | | | Principal | | | Value | |
|
Certificates of Deposit: 26.19% | |
ABN AMRO Funding LLC | | | 1.95 | % | | | 8-1-2018 | | | $ | 176,000,000 | | | $ | 176,000,000 | |
Australia & New Zealand Banking Group | | | 1.89 | | | | 8-1-2018 | | | | 156,000,000 | | | | 156,000,000 | |
BNP Paribas (3 Month LIBOR +0.15%) ± | | | 2.49 | | | | 9-28-2018 | | | | 38,000,000 | | | | 38,005,645 | |
China Construction Bank Corporation NY (1 Month LIBOR +0.25%) ± | | | 2.34 | | | | 7-19-2019 | | | | 103,000,000 | | | | 102,995,676 | |
Credit Industriel ET Commercial | | | 2.28 | | | | 8-20-2018 | | | | 21,000,000 | | | | 20,976,984 | |
Credit Suisse AG (3 Month LIBOR +0.10%) ± | | | 2.43 | | | | 9-21-2018 | | | | 40,000,000 | | | | 40,002,389 | |
DNB Nor Bank ASA | | | 2.26 | | | | 8-1-2018 | | | | 20,450,000 | | | | 20,450,000 | |
First Abu Dhabi Bank | | | 1.91 | | | | 8-1-2018 | | | | 205,000,000 | | | | 205,000,000 | |
HSBC Bank plc | | | 1.95 | | | | 8-1-2018 | | | | 118,000,000 | | | | 118,000,000 | |
HSBC Bank plc (1 Month LIBOR +0.20%) ± | | | 2.30 | | | | 8-9-2018 | | | | 15,000,000 | | | | 15,001,097 | |
HSBC Bank plc (3 Month LIBOR +0.18%) ± | | | 2.54 | | | | 5-10-2019 | | | | 40,000,000 | | | | 39,996,900 | |
HSBC Bank USA NA (1 Month LIBOR +0.20%) ± | | | 2.29 | | | | 11-2-2018 | | | | 25,000,000 | | | | 25,006,335 | |
HSBC Bank USA NA (1 Month LIBOR +0.20%) ± | | | 2.30 | | | | 11-7-2018 | | | | 25,000,000 | | | | 25,005,839 | |
KBC Bank | | | 2.20 | | | | 9-12-2018 | | | | 83,000,000 | | | | 83,007,965 | |
Mitsubishi Trust & Bank (1 Month LIBOR +0.23%) ± | | | 2.30 | | | | 1-17-2019 | | | | 35,000,000 | | | | 35,004,637 | |
Mitsubishi Trust & Bank (1 Month LIBOR +0.30%) ± | | | 2.37 | | | | 1-14-2019 | | | | 38,000,000 | | | | 38,017,114 | |
Mizuho Bank Limited (1 Month LIBOR +0.25%) ± | | | 2.32 | | | | 11-26-2018 | | | | 35,000,000 | | | | 35,006,995 | |
Mizuho Bank Limited (1 Month LIBOR +0.44%) ± | | | 2.53 | | | | 10-10-2018 | | | | 93,000,000 | | | | 93,057,436 | |
National Australia Bank | | | 2.19 | | | | 8-9-2018 | | | | 2,490,000 | | | | 2,490,105 | |
National Bank of Kuwait | | | 1.91 | | | | 8-1-2018 | | | | 220,150,000 | | | | 220,150,000 | |
Natixis (1 Month LIBOR +0.25%) ± | | | 2.35 | | | | 12-10-2018 | | | | 37,000,000 | | | | 37,006,461 | |
Natixis (1 Month LIBOR +0.44%) ± | | | 2.51 | | | | 9-17-2018 | | | | 65,000,000 | | | | 65,038,351 | |
Norinchukin Bank (1 Month LIBOR +0.30%) ± | | | 2.39 | | | | 9-10-2018 | | | | 39,000,000 | | | | 39,014,481 | |
Oversea-Chinese Banking Corporation (1 Month LIBOR +0.30%) ± | | | 2.39 | | | | 9-6-2018 | | | | 30,000,000 | | | | 30,005,859 | |
Sumitomo Mitsui Banking Corporation (1 Month LIBOR +0.25%) ± | | | 2.35 | | | | 9-7-2018 | | | | 38,000,000 | | | | 38,006,953 | |
Sumitomo Mitsui Trust NY (3 Month LIBOR +0.05%) ± | | | 2.37 | | | | 12-4-2018 | | | | 56,000,000 | | | | 56,009,256 | |
Sumitomo Mitsui Trust NY (1 Month LIBOR +0.43%) ± | | | 2.51 | | | | 10-11-2018 | | | | 81,000,000 | | | | 81,041,466 | |
Svenska Handelsbanken (1 Month LIBOR +0.17%) ± | | | 2.24 | | | | 8-24-2018 | | | | 40,000,000 | | | | 40,005,972 | |
Svenska Handelsbanken (1 Month LIBOR +0.16%) ± | | | 2.25 | | | | 9-6-2018 | | | | 65,000,000 | | | | 65,013,422 | |
Toronto Dominion Bank (1 Month LIBOR +0.20%) ± | | | 2.29 | | | | 8-10-2018 | | | | 33,000,000 | | | | 33,002,602 | |
Toronto Dominion Bank (1 Month LIBOR +0.23%) ± | | | 2.32 | | | | 12-6-2018 | | | | 65,000,000 | | | | 65,014,253 | |
| |
Total Certificates of Deposit (Cost $2,038,064,874) | | | | 2,038,334,193 | |
| | | | | | | | | | | | | | | | |
|
Commercial Paper: 50.76% | |
|
| Asset-Backed Commercial Paper: 24.18% | |
Albion Capital Corporation (z) | | | 2.07 | | | | 8-16-2018 | | | | 16,000,000 | | | | 15,986,913 | |
Albion Capital Corporation (z) | | | 2.13 | | | | 8-20-2018 | | | | 44,000,000 | | | | 43,954,182 | |
Alpine Securitization Limited (1 Month LIBOR +0.33%) 144A± | | | 2.42 | | | | 9-6-2018 | | | | 92,000,000 | | | | 92,000,720 | |
Anglesea Funding LLC (1 Month LIBOR +0.23%) 144A± | | | 2.32 | | | | 1-2-2019 | | | | 20,000,000 | | | | 19,999,608 | |
Anglesea Funding LLC (1 Month LIBOR +0.23%) 144A± | | | 2.32 | | | | 12-28-2018 | | | | 38,000,000 | | | | 37,999,441 | |
Anglesea Funding LLC (1 Month LIBOR +0.25%) 144A± | | | 2.33 | | | | 10-16-2018 | | | | 40,000,000 | | | | 39,999,570 | |
Anglesea Funding LLC (1 Month LIBOR +0.27%) 144A± | | | 2.34 | | | | 10-23-2018 | | | | 39,000,000 | | | | 38,999,131 | |
Antalis SA 144A(z) | | | 2.10 | | | | 8-13-2018 | | | | 38,000,000 | | | | 37,974,515 | |
Antalis SA 144A(z) | | | 2.21 | | | | 8-20-2018 | | | | 27,220,000 | | | | 27,190,794 | |
Antalis SA 144A(z) | | | 2.36 | | | | 8-9-2018 | | | | 39,000,000 | | | | 38,982,693 | |
Atlantic Asset Securitization Corporation (1 Month LIBOR +0.32%) 144A± | | | 2.41 | | | | 11-1-2018 | | | | 55,000,000 | | | | 55,030,872 | |
Bedford Row Funding Corporation (1 Month LIBOR +0.34%) 144A± | | | 2.43 | | | | 6-10-2019 | | | | 35,000,000 | | | | 35,023,299 | |
Bennington Stark Capital Company 144A(z) | | | 2.33 | | | | 8-22-2018 | | | | 31,000,000 | | | | 30,962,585 | |
Cedar Spring Capital Company 144A(z) | | | 2.15 | | | | 8-3-2018 | | | | 62,000,000 | | | | 61,992,939 | |
The accompanying notes are an integral part of these financial statements.
| | | | |
| 10 | | Wells Fargo Heritage Money Market Fund | | Portfolio of investments—July 31, 2018 (unaudited) |
| | | | | | | | | | | | | | | | |
| Security name | | Interest rate | | | Maturity date | | | Principal | | | Value | |
|
| Asset-Backed Commercial Paper (continued) | |
Cedar Spring Capital Company 144A(z) | | | 2.16 | % | | | 9-12-2018 | | | $ | 84,000,000 | | | $ | 83,790,084 | |
Cedar Spring Capital Company 144A(z) | | | 2.39 | | | | 9-7-2018 | | | | 30,000,000 | | | | 29,934,232 | |
Chesham Finance Limited 144A(z) | | | 2.00 | | | | 8-1-2018 | | | | 177,000,000 | | | | 177,000,000 | |
Collateralized Commercial Paper II Company LLC (3 Month LIBOR +0.22%) 144A± | | | 2.56 | | | | 1-2-2019 | | | | 61,000,000 | | | | 61,040,844 | |
Concord Minuteman Capital Company LLC 144A(z) | | | 2.00 | | | | 8-1-2018 | | | | 12,356,000 | | | | 12,356,000 | |
Concord Minutemen Capital Company LLC 144A(z) | | | 2.38 | | | | 10-29-2018 | | | | 24,000,000 | | | | 23,862,940 | |
Crown Point Capital Company LLC (1 Month LIBOR +0.37%) 144A± | | | 2.45 | | | | 9-19-2018 | | | | 101,000,000 | | | | 100,997,628 | |
Gotham Funding Corporation 144A(z) | | | 2.12 | | | | 8-10-2018 | | | | 8,530,000 | | | | 8,525,758 | |
Great Bridge Capital Company LLC 144A(z) | | | 2.41 | | | | 9-18-2018 | | | | 42,000,000 | | | | 41,878,704 | |
Institutional Secured Funding LLC 144A(z) | | | 2.04 | | | | 8-1-2018 | | | | 70,000,000 | | | | 70,000,000 | |
Institutional Secured Funding LLC 144A(z) | | | 2.10 | | | | 8-2-2018 | | | | 117,000,000 | | | | 116,993,594 | |
Kells Funding LLC 144A(z) | | | 2.25 | | | | 10-9-2018 | | | | 29,000,000 | | | | 28,880,107 | |
Komatsu Finance America Incorporated 144A(z) | | | 2.00 | | | | 8-6-2018 | | | | 6,000,000 | | | | 5,998,392 | |
Legacy Capital Company 144A(z) | | | 2.18 | | | | 9-17-2018 | | | | 26,000,000 | | | | 25,928,242 | |
Manhattan Asset Funding Company LLC 144A(z) | | | 2.12 | | | | 8-6-2018 | | | | 15,000,000 | | | | 14,995,931 | |
Manhattan Asset Funding Company LLC 144A(z) | | | 2.12 | | | | 8-7-2018 | | | | 23,000,000 | | | | 22,992,487 | |
Matchpoint Finance plc 144A(z) | | | 1.95 | | | | 8-1-2018 | | | | 57,000,000 | | | | 57,000,000 | |
Mountcliff Funding LLC 144A(z) | | | 2.00 | | | | 8-1-2018 | | | | 132,000,000 | | | | 132,000,000 | |
Mountcliff Funding LLC (1 Month LIBOR +0.25%) 144A± | | | 2.33 | | | | 2-28-2019 | | | | 42,000,000 | | | | 41,999,999 | |
Nieuw Amsterdam Receivables 144A(z) | | | 2.18 | | | | 9-24-2018 | | | | 48,000,000 | | | | 47,851,824 | |
Old Line Funding LLC (1 Month LIBOR +0.21%) 144A± | | | 2.29 | | | | 8-23-2018 | | | | 23,000,000 | | | | 23,004,055 | |
Old Line Funding LLC (1 Month LIBOR +0.20%) 144A± | | | 2.30 | | | | 11-9-2018 | | | | 30,000,000 | | | | 30,006,755 | |
Old Line Funding LLC (1 Month LIBOR +0.21%) 144A± | | | 2.30 | | | | 8-6-2018 | | | | 22,000,000 | | | | 22,001,029 | |
Old Line Funding LLC (1 Month LIBOR +0.45%) 144A± | | | 2.52 | | | | 9-24-2018 | | | | 38,000,000 | | | | 38,008,254 | |
White Plains Capital 144A(z) | | | 2.36 | | | | 9-5-2018 | | | | 57,000,000 | | | | 56,871,101 | |
White Plains Capital 144A(z) | | | 2.54 | | | | 10-10-2018 | | | | 32,000,000 | | | | 31,847,556 | |
| | | | |
| | | | | | | | | | | | | | | 1,881,862,778 | |
| | | | | | | | | | | | | | | | |
| | | | |
| Financial Company Commercial Paper: 20.08% | | | | | | | | | | | | | | | | |
ASB Finance Limited (3 Month LIBOR +0.20%) 144A± | | | 2.53 | | | | 4-11-2019 | | | | 34,000,000 | | | | 34,011,528 | |
Australia & New Zealand Banking Group (1 Month LIBOR +0.17%) 144A± | | | 2.24 | | | | 8-14-2018 | | | | 33,000,000 | | | | 33,003,113 | |
Banco Santander Chile 144A(z) | | | 2.41 | | | | 9-20-2018 | | | | 40,000,000 | | | | 39,873,889 | |
Bank Nederlandse Gemeenten 144A(z) | | | 2.06 | | | | 8-10-2018 | | | | 73,610,000 | | | | 73,573,397 | |
Bank of Nova Scotia (3 Month LIBOR +0.21%) 144A± | | | 2.54 | | | | 12-21-2018 | | | | 39,000,000 | | | | 39,020,866 | |
Commonwealth Bank of Australia (1 Month LIBOR +0.21%) 144A± | | | 2.28 | | | | 11-26-2018 | | | | 50,000,000 | | | | 50,007,314 | |
Commonwealth Bank of Australia (3 Month LIBOR +0.10%) 144A± | | | 2.46 | | | | 5-3-2019 | | | | 38,000,000 | | | | 37,999,991 | |
Commonwealth Bank of Australia (3 Month LIBOR +0.25%) ± | | | 2.59 | | | | 4-3-2019 | | | | 40,000,000 | | | | 40,042,350 | |
DBS Bank Limited 144A(z) | | | 2.27 | | | | 10-19-2018 | | | | 40,000,000 | | | | 39,804,870 | |
Erste Bank der Oesterreichischen Sparkassen AG (1 Month LIBOR +0.19%) 144A± | | | 2.26 | | | | 10-12-2018 | | | | 30,000,000 | | | | 30,008,421 | |
Federation Des Caisses 144A(z) | | | 2.08 | | | | 8-1-2018 | | | | 16,000,000 | | | | 16,000,000 | |
Federation Des Caisses (1 Month LIBOR +0.26%) 144A± | | | 2.34 | | | | 2-11-2019 | | | | 39,000,000 | | | | 39,012,597 | |
Federation Des Caisses (1 Month LIBOR +0.30%) 144A± | | | 2.36 | | | | 6-25-2019 | | | | 40,000,000 | | | | 40,007,560 | |
Federation Des Caisses (3 Month LIBOR +0.13%) 144A± | | | 2.46 | | | | 5-22-2019 | | | | 20,000,000 | | | | 19,998,341 | |
ING Funding LLC (3 Month LIBOR +0.16%) ± | | | 2.50 | | | | 1-7-2019 | | | | 36,000,000 | | | | 36,017,090 | |
ING Funding LLC (1 Month LIBOR +0.25%) ± | | | 2.33 | | | | 2-11-2019 | | | | 40,000,000 | | | | 40,004,498 | |
Intercontinental Exchange 144A(z) | | | 1.95 | | | | 8-1-2018 | | | | 80,200,000 | | | | 80,200,000 | |
Intercontinental Exchange 144A(z) | | | 1.95 | | | | 8-2-2018 | | | | 25,000,000 | | | | 24,998,646 | |
Intercontinental Exchange 144A(z) | | | 1.95 | | | | 8-3-2018 | | | | 36,850,000 | | | | 36,846,008 | |
Lexington Parker Capital 144A(z) | | | 2.16 | | | | 9-7-2018 | | | | 52,000,000 | | | | 51,888,141 | |
National Australia Bank Limited (1 Month LIBOR +0.16%) 144A± | | | 2.25 | | | | 8-1-2018 | | | | 44,000,000 | | | | 44,000,000 | |
The accompanying notes are an integral part of these financial statements.
| | | | | | |
| Portfolio of investments—July 31, 2018 (unaudited) | | Wells Fargo Heritage Money Market Fund | | | 11 | |
| | | | | | | | | | | | | | | | |
| Security name | | Interest rate | | | Maturity date | | | Principal | | | Value | |
| | | | |
| Financial Company Commercial Paper (continued) | | | | | | | | | | | | | | | | |
National Australia Bank Limited (1 Month LIBOR +0.18%) 144A± | | | 2.25 | % | | | 9-13-2018 | | | $ | 52,000,000 | | | $ | 52,012,690 | |
National Australia Bank Limited (1 Month LIBOR +0.20%) 144A± | | | 2.27 | | | | 10-29-2018 | | | | 25,000,000 | | | | 25,006,477 | |
National Securities Clearing Corporation 144A(z) | | | 1.90 | | | | 8-1-2018 | | | | 39,000,000 | | | | 39,000,000 | |
Nederlandse Waterschapsbank NV 144A(z) | | | 2.06 | | | | 8-13-2018 | | | | 70,000,000 | | | | 69,952,470 | |
Nederlandse Waterschapsbank NV 144A(z) | | | 2.06 | | | | 8-14-2018 | | | | 50,000,000 | | | | 49,963,185 | |
NRW Bank 144A(z) | | | 2.00 | | | | 8-7-2018 | | | | 10,000,000 | | | | 9,996,783 | |
Oversea-Chinese Banking Corporation (1 Month LIBOR +0.25%) 144A± | | | 2.33 | | | | 1-11-2019 | | | | 40,000,000 | | | | 40,007,191 | |
Oversea-Chinese Banking Corporation (1 Month LIBOR +0.25%) 144A± | | | 2.34 | | | | 1-10-2019 | | | | 24,000,000 | | | | 24,004,559 | |
Oversea-Chinese Banking Corporation (3 Month LIBOR +0.14%) 144A± | | | 2.50 | | | | 5-10-2019 | | | | 42,000,000 | | | | 41,999,933 | |
Oversea-Chinese Banking Corporation Limited 144A(z) | | | 2.13 | | | | 9-17-2018 | | | | 39,000,000 | | | | 38,894,297 | |
Quebec Province 144A(z) | | | 1.98 | | | | 8-13-2018 | | | | 7,000,000 | | | | 6,995,501 | |
Sumitomo Mitsui Trust 144A(z) | | | 2.30 | | | | 10-15-2018 | | | | 43,000,000 | | | | 42,805,425 | |
Toronto Dominion Bank (1 Month LIBOR +0.30%) 144A± | | | 2.39 | | | | 12-3-2018 | | | | 37,000,000 | | | | 37,016,799 | |
Toronto Dominion Bank (3 Month LIBOR +0.14%) 144A± | | | 2.50 | | | | 5-2-2019 | | | | 40,000,000 | | | | 40,011,924 | |
UBS AG London (1 Month LIBOR +0.24%) 144A± | | | 2.34 | | | | 8-7-2018 | | | | 56,000,000 | | | | 56,003,489 | |
UBS AG London (3 Month LIBOR +0.19%) 144A± | | | 2.52 | | | | 12-10-2018 | | | | 65,000,000 | | | | 65,018,173 | |
Westpac Banking Corporation (1 Month LIBOR +0.18%) 144A± | | | 2.25 | | | | 8-16-2018 | | | | 20,000,000 | | | | 20,002,087 | |
Westpac Banking Corporation (3 Month LIBOR +0.10%) 144A± | | | 2.41 | | | | 5-31-2019 | | | | 58,000,000 | | | | 57,995,039 | |
| | | | |
| | | | | | | | | | | | | | | 1,563,004,642 | |
| | | | | | | | | | | | | | | | |
| | | | |
| Other Commercial Paper: 6.50% | | | | | | | | | | | | | | | | |
Archer Daniels Midland Company 144A(z) | | | 1.93 | | | | 8-1-2018 | | | | 15,000,000 | | | | 15,000,000 | |
China International Marine Containers Company Limited (z) | | | 2.35 | | | | 8-13-2018 | | | | 26,000,000 | | | | 25,983,031 | |
CNPC Finance Limited 144A(z) | | | 2.38 | | | | 8-2-2018 | | | | 64,000,000 | | | | 63,996,277 | |
Glaxosmithkline LLC 144A(z) | | | 2.04 | | | | 8-13-2018 | | | | 30,500,000 | | | | 30,480,094 | |
Glaxosmithkline LLC 144A(z) | | | 2.11 | | | | 9-4-2018 | | | | 80,000,000 | | | | 79,847,605 | |
Komatsu Finance America Incorporated 144A(z) | | | 2.00 | | | | 8-3-2018 | | | | 70,000,000 | | | | 69,992,514 | |
Omers Finance Trust 144A(z) | | | 2.06 | | | | 8-24-2018 | | | | 25,000,000 | | | | 24,968,631 | |
Salt River Project Agricultura (z) | | | 2.11 | | | | 8-15-2018 | | | | 10,000,000 | | | | 9,990,772 | |
Salt River Project Agricultura (z) | | | 2.21 | | | | 9-17-2018 | | | | 32,000,000 | | | | 31,904,704 | |
Salt River Project Agricultura (z) | | | 2.21 | | | | 9-18-2018 | | | | 37,000,000 | | | | 36,887,479 | |
Toyota Credit Canada Incorporated (1 Month LIBOR +0.42%) ± | | | 2.50 | | | | 10-15-2018 | | | | 39,000,000 | | | | 39,029,330 | |
Toyota Finance Australia Limited (3 Month LIBOR +0.08%) ± | | | 2.41 | | | | 2-15-2019 | | | | 38,000,000 | | | | 38,001,941 | |
Toyota Finance Australia Limited (3 Month LIBOR +0.09%) ± | | | 2.43 | | | | 3-22-2019 | | | | 40,000,000 | | | | 40,002,366 | |
| | | | |
| | | | | | | | | | | | | | | 506,084,744 | |
| | | | | | | | | | | | | | | | |
| | | | |
Total Commercial Paper (Cost $3,950,498,528) | | | | | | | | | | | | | | | 3,950,952,164 | |
| | | | | | | | | | | | | | | | |
| | | | |
Municipal Obligations: 12.42% | | | | | | | | | | | | | | | | |
| | | | |
California: 0.27% | | | | | | | | | | | | | | | | |
| | | | |
| Other Municipal Debt: 0.27% | | | | | | | | | | | | | | | | |
Orange County CA Water District (Water Utilities) | | | 2.12 | | | | 8-6-2018 | | | | 21,000,000 | | | | 21,001,686 | |
| | | | | | | | | | | | | | | | |
| | | | |
Colorado: 1.69% | | | | | | | | | | | | | | | | |
| | | | |
| Variable Rate Demand Notes ø: 1.69% | | | | | | | | | | | | | | | | |
Colorado HFA MFHR Class II Series B (Housing Revenue, FHLB SPA) | | | 2.02 | | | | 5-1-2052 | | | | 91,655,000 | | | | 91,655,000 | |
Colorado Southern Ute Indian Tribe Reservation Series 2007 (Miscellaneous Revenue) | | | 2.15 | | | | 1-1-2027 | | | | 40,000,000 | | | | 40,000,000 | |
| | | | |
| | | | | | | | | | | | | | | 131,655,000 | |
| | | | | | | | | | | | | | | | |
The accompanying notes are an integral part of these financial statements.
| | | | |
| 12 | | Wells Fargo Heritage Money Market Fund | | Portfolio of investments—July 31, 2018 (unaudited) |
| | | | | | | | | | | | | | | | |
| Security name | | Interest rate | | | Maturity date | | | Principal | | | Value | |
| | | | |
Georgia: 0.06% | | | | | | | | | | | | | | | | |
| | | | |
| Variable Rate Demand Note ø: 0.06% | | | | | | | | | | | | | | | | |
Macon-Bibb County GA Industrial Authority Development Kumho Tire Georgia Incorporated Series A (Industrial Development Revenue, Korea Development Bank LOC) | | | 2.22 | % | | | 12-1-2022 | | | $ | 5,000,000 | | | $ | 5,000,000 | |
| | | | | | | | | | | | | | | | |
| | | | |
Illinois: 0.23% | | | | | | | | | | | | | | | | |
| | | | |
| Variable Rate Demand Note ø: 0.23% | | | | | | | | | | | | | | | | |
Illinois Housing Development Authority Series A-2 (Housing Revenue, HUD Insured, FHLB SPA) | | | 2.05 | | | | 7-1-2048 | | | | 17,700,000 | | | | 17,700,000 | |
| | | | | | | | | | | | | | | | |
| | | | |
Louisiana: 0.21% | | | | | | | | | | | | | | | | |
| | | | |
| Variable Rate Demand Note ø: 0.21% | | | | | | | | | | | | | | | | |
East Baton Rouge Parish LA Sewerage Commission Revenue Series 2016-XFT904 (Water & Sewer Revenue, Morgan Stanley Bank LIQ) 144A | | | 2.04 | | | | 2-1-2045 | | | | 16,280,000 | | | | 16,280,000 | |
| | | | | | | | | | | | | | | | |
| | | | |
Massachusetts: 0.57% | | | | | | | | | | | | | | | | |
| | | | |
| Other Municipal Debt: 0.57% | | | | | | | | | | | | | | | | |
Massachusetts Educational Financing Authority (Education Revenue) | | | 2.17 | | | | 8-30-2018 | | | | 44,500,000 | | | | 44,504,179 | |
| | | | | | | | | | | | | | | | |
| | | | |
Missouri: 0.07% | | | | | | | | | | | | | | | | |
| | | | |
| Variable Rate Demand Note ø: 0.07% | | | | | | | | | | | | | | | | |
Bridgeton MO IDA Stolze Printing (Industrial Development Revenue, Carrollton Bank LOC) | | | 2.08 | | | | 12-1-2047 | | | | 5,800,000 | | | | 5,800,000 | |
| | | | | | | | | | | | | | | | |
| | | | |
New York: 3.21% | | | | | | | | | | | | | | | | |
| | | | |
| Variable Rate Demand Notes ø: 3.21% | | | | | | | | | | | | | | | | |
Long Island Power Authority (Miscellaneous Revenue) | | | 2.23 | | | | 9-19-2018 | | | | 39,000,000 | | | | 38,999,926 | |
New York Dormitory Authority Personal Income Taxable Series XFT910 (Tax Revenue, Citibank NA LIQ) 144A | | | 2.05 | | | | 3-15-2040 | | | | 12,000,000 | | | | 12,000,000 | |
New York Dormitory Authority Secondary Issues Series B-4 (Tax Revenue, Morgan Stanley Bank LIQ) 144A | | | 2.04 | | | | 3-15-2040 | | | | 16,000,000 | | | | 16,000,000 | |
New York HFA 222 East 44th Street Series A (Housing Revenue, Bank of China LOC) | | | 2.10 | | | | 5-1-2050 | | | | 31,355,000 | | | | 31,355,000 | |
New York HFA Manhattan West Residential Housing Project Series B-1 (Housing Revenue, Bank of China LOC) | | | 2.12 | | | | 11-1-2049 | | | | 23,000,000 | | | | 23,000,000 | |
New York HFA Manhattan West Residential Housing Project Series B-2 (Housing Revenue, Bank of China LOC) | | | 2.12 | | | | 11-1-2049 | | | | 37,250,000 | | | | 37,250,000 | |
New York HFA Manhattan West Residential Housing Project Series B-2 (Housing Revenue, Bank of China LOC) | | | 2.23 | | | | 11-1-2049 | | | | 12,475,000 | | | | 12,475,000 | |
New York HFA Series A (Housing Revenue, Bank of China LOC) | | | 2.12 | | | | 11-1-2049 | | | | 18,650,000 | | | | 18,650,000 | |
New York Municipal Water Finance Authority Series T-30001-I (Water & Sewer Revenue, Citibank NA LIQ) 144A | | | 2.05 | | | | 6-15-2044 | | | | 16,000,000 | | | | 16,000,000 | |
RBC Municipal Products Incorporated Trust Series E-51 Invesco Van Kampen New York Value Income Trust (Miscellaneous Revenue, Royal Bank of Canada LOC) 144A | | | 2.43 | | | | 12-1-2019 | | | | 44,000,000 | | | | 44,000,000 | |
| | | | |
| | | | | | | | | | | | | | | 249,729,926 | |
| | | | | | | | | | | | | | | | |
The accompanying notes are an integral part of these financial statements.
| | | | | | |
| Portfolio of investments—July 31, 2018 (unaudited) | | Wells Fargo Heritage Money Market Fund | | | 13 | |
| | | | | | | | | | | | | | | | |
| Security name | | Interest rate | | | Maturity date | | | Principal | | | Value | |
| | | | |
Ohio: 0.21% | | | | | | | | | | | | | | | | |
| | | | |
| Variable Rate Demand Note ø: 0.21% | | | | | | | | | | | | | | | | |
Akron Student Housing Association LLC Tender Option Bond Trust Receipts/Certificates (Education Revenue, Societe Generale LOC, AGM Insured) 144A | | | 2.05 | % | | | 3-15-2034 | | | $ | 16,680,000 | | | $ | 16,680,000 | |
| | | | | | | | | | | | | | | | |
| | | | |
Other: 4.32% | | | | | | | | | | | | | | | | |
| | | | |
| Variable Rate Demand Notes ø: 4.32% | | | | | | | | | | | | | | | | |
FHLMC MFHR Series M004 Class A (Housing Revenue, FHLMC LIQ) | | | 2.12 | | | | 1-15-2042 | | | | 40,436,775 | | | | 40,436,775 | |
FHLMC MFHR Series M011 Class A (Housing Revenue, FHLMC LIQ) | | | 2.12 | | | | 8-15-2021 | | | | 345,000 | | | | 345,000 | |
Fortenbery Children 2017 Irrevocable Trust (Miscellaneous Revenue, FHLB LOC) | | | 2.03 | | | | 5-1-2037 | | | | 12,275,000 | | | | 12,275,000 | |
Hallmark 75 Ontario LLC (Housing Revenue, FHLB LOC) | | | 2.08 | | | | 12-1-2056 | | | | 10,100,000 | | | | 10,100,000 | |
Jets Stadium Development Bonds Series A-4B (Miscellaneous Revenue, Sumitomo Mitsui Banking Corporation LOC) 144A | | | 2.08 | | | | 4-1-2047 | | | | 42,810,000 | | | | 42,810,000 | |
Providence St. Joseph Health & Services Series 12-E (Health Revenue, U.S. Bank NA LOC) | | | 2.07 | | | | 10-1-2042 | | | | 69,015,000 | | | | 69,015,000 | |
Providence St. Joseph Health & Services Series 16G (Health Revenue, GNMA/FNMA/FHLMC Insured, JPMorgan Chase & Company SPA) | | | 2.03 | | | | 10-1-2047 | | | | 45,000,000 | | | | 45,000,000 | |
SSAB AB Series A (Miscellaneous Revenue, DNB Banking ASA LOC) | | | 2.03 | | | | 6-1-2035 | | | | 13,000,000 | | | | 13,000,000 | |
Steadfast Crestvilla LLC Series A (Health Revenue, American AgCredit LOC) | | | 2.08 | | | | 2-1-2056 | | | | 33,320,000 | | | | 33,320,000 | |
Steadfast Crestvilla LLC Series B (Health Revenue, U.S. Bank NA LOC) | | | 2.08 | | | | 2-1-2056 | | | | 22,040,000 | | | | 22,040,000 | |
Sunroad Centrum Apartments 5 LP Series A (Housing Revenue, FHLB LOC) | | | 2.08 | | | | 8-1-2056 | | | | 12,000,000 | | | | 12,000,000 | |
Sunroad Centrum Apartments 5 LP Series B (Housing Revenue, FHLB LOC) | | | 2.08 | | | | 8-1-2056 | | | | 3,600,000 | | | | 3,600,000 | |
Tender Option Bond Trust Receipts/Certificates (Miscellaneous Revenue, Citibank NA LIQ) 144A | | | 2.09 | | | | 12-1-2027 | | | | 32,000,000 | | | | 32,000,000 | |
| | | | |
| | | | | | | | | | | | | | | 335,941,775 | |
| | | | | | | | | | | | | | | | |
| | | | |
Pennsylvania: 0.09% | | | | | | | | | | | | | | | | |
| | | | |
| Other Municipal Debt: 0.06% | | | | | | | | | | | | | | | | |
University Pittsburgh (Education Revenue) | | | 2.17 | | | | 8-2-2018 | | | | 5,000,000 | | | | 4,999,978 | |
| | | | | | | | | | | | | | | | |
| | | | |
| Variable Rate Demand Note ø: 0.03% | | | | | | | | | | | | | | | | |
RBC Municipal Products Incorporated Trust Series E-52 Invesco Van Kampen Trust (Miscellaneous Revenue, Royal Bank of Canada LOC) 144A | | | 2.43 | | | | 12-1-2019 | | | | 2,000,000 | | | | 2,000,000 | |
| | | | | | | | | | | | | | | | |
| | | | |
Tennessee: 0.83% | | | | | | | | | | | | | | | | |
| | | | |
| Variable Rate Demand Notes ø: 0.83% | | | | | | | | | | | | | | | | |
Montgomery County TN Industrial Development Board Hankook Tire Manufacturing Project Series A (Industrial Development Revenue, Kookmin Bank LOC) | | | 2.22 | | | | 12-1-2024 | | | | 35,000,000 | | | | 35,000,000 | |
Montgomery County TN Industrial Development Board Hankook Tire Manufacturing Project Series A (Industrial Development Revenue, Kookmin Bank LOC) 144A | | | 2.22 | | | | 12-1-2024 | | | | 29,350,000 | | | | 29,350,000 | |
| | | | |
| | | | | | | | | | | | | | | 64,350,000 | |
| | | | | | | | | | | | | | | | |
The accompanying notes are an integral part of these financial statements.
| | | | |
| 14 | | Wells Fargo Heritage Money Market Fund | | Portfolio of investments—July 31, 2018 (unaudited) |
| | | | | | | | | | | | | | | | |
| Security name | | Interest rate | | | Maturity date | | | Principal | | | Value | |
| | | | |
Texas: 0.66% | | | | | | | | | | | | | | | | |
| | | | |
| Other Municipal Debt: 0.66% | | | | | | | | | | | | | | | | |
Texas Public Finance Authority (Miscellaneous Revenue) | | | 2.10 | % | | | 8-9-2018 | | | $ | 22,000,000 | | | $ | 22,000,262 | |
Texas Public Finance Authority (Miscellaneous Revenue) | | | 2.11 | | | | 8-8-2018 | | | | 29,200,000 | | | | 29,200,374 | |
| | | | |
| | | | | | | | | | | | | | | 51,200,636 | |
| | | | | | | | | | | | | | | | |
| | | | |
Total Municipal Obligations (Cost $966,836,775) | | | | | | | | | | | | | | | 966,843,180 | |
| | | | | | | | | | | | | | | | |
| | | | |
Other Instruments: 4.54% | | | | | | | | | | | | | | | | |
ASC Mercer Island LLC §øø | | | 2.08 | | | | 6-1-2057 | | | | 20,000,000 | | | | 20,000,000 | |
Cellmark Incorporated Secured §øø | | | 2.03 | | | | 6-1-2038 | | | | 60,000,000 | | | | 60,000,000 | |
Invesco Dynamic Credit Opportunities Fund Series W-7 § | | | 2.09 | | | | 6-1-2028 | | | | 55,000,000 | | | | 55,000,000 | |
Jefferson Stadium Park L Series A Secured §øø | | | 2.08 | | | | 2-1-2057 | | | | 35,329,000 | | | | 35,329,000 | |
Jefferson Stadium Park L Series B Secured §øø | | | 2.08 | | | | 2-1-2057 | | | | 15,100,000 | | | | 15,100,000 | |
La Mesa Senior Living LP Secured §øø | | | 2.08 | | | | 8-1-2057 | | | | 22,810,000 | | | | 22,810,000 | |
Opus Group AB §øø | | | 2.03 | | | | 10-1-2032 | | | | 25,000,000 | | | | 25,000,000 | |
ROC III CA Crossings Chino Hills Series B §øø | | | 2.08 | | | | 1-1-2057 | | | | 19,600,000 | | | | 19,600,000 | |
ROC III California Crossings Chino Hills Series A §øø | | | 2.08 | | | | 1-1-2057 | | | | 27,400,000 | | | | 27,400,000 | |
US Bancorp (3 Month LIBOR +0.49%) ± | | | 2.83 | | | | 11-15-2018 | | | | 72,780,000 | | | | 72,854,963 | |
| | | | |
Total Other Instruments (Cost $353,098,330) | | | | | | | | | | | | | | | 353,093,963 | |
| | | | | | | | | | | | | | | | |
| | | | |
Short-Term Investments: 7.03% | | | | | | | | | | | | | | | | |
| | | | |
| Repurchase Agreements: 7.03% | | | | | | | | | | | | | | | | |
Bank of America Corporation, dated 7-31-2018, maturity value $547,029,325 ^^ | | | 1.93 | | | | 8-1-2018 | | | | 547,000,000 | | | | 547,000,000 | |
| | | | | | | | | | | | | | | | |
| | | | |
Total Short-Term Investments (Cost $547,000,000) | | | | | | | | | | | | | | | 547,000,000 | |
| | | | | | | | | | | | | | | | |
| | | | | | | | |
| Total investments in securities (Cost $7,855,498,507) | | | 100.94 | % | | | 7,856,223,500 | |
Other assets and liabilities, net | | | (0.94 | ) | | | (73,338,472 | ) |
| | | | | | | | |
| Total net assets | | | 100.00 | % | | $ | 7,782,885,028 | |
| | | | | | | | |
| ± | Variable rate investment. The rate shown is the rate in effect at period end. |
| (z) | Zero coupon security. The rate represents the current yield to maturity. |
| 144A | The security may be resold in transactions exempt from registration, normally to qualified institutional buyers, pursuant to Rule 144A under the Securities Act of 1933. |
| ø | Variable rate demand notes are subject to a demand feature which reduces the effective maturity. The maturity date shown represents the final maturity date of the security. The interest rate is determined and reset by the issuer daily, weekly, or monthly depending upon the terms of the security. The rate shown is the rate in effect at period end. |
| ±± | The coupon of the security is adjusted based on the principal and interest payments received from the underlying pool of mortgages as well as the credit quality and the actual prepayment speed of the underlying mortgages. |
| § | The security is subject to a demand feature which reduces the effective maturity. |
| øø | The interest rate is determined and reset by the issuer periodically depending upon the terms of the security. The rate shown is the rate in effect at period end. |
| ^^ | Collateralized by U.S. government securities, 3.00% to 4.00%, 4-20-2043 to 9-20-2045, fair value including accrued interest is $563,410,000. |
The accompanying notes are an integral part of these financial statements.
| | | | | | |
| Portfolio of investments—July 31, 2018 (unaudited) | | Wells Fargo Heritage Money Market Fund | | | 15 | |
Abbreviations:
| AGM | Assured Guaranty Municipal |
| FHLB | Federal Home Loan Bank |
| FHLMC | Federal Home Loan Mortgage Corporation |
| FNMA | Federal National Mortgage Association |
| GNMA | Government National Mortgage Association |
| HFA | Housing Finance Authority |
| HUD | Department of Housing and Urban Development |
| IDA | Industrial Development Authority |
| LIBOR | London Interbank Offered Rate |
| MFHR | Multifamily housing revenue |
| ROC | Reset option certificates |
| SPA | Standby purchase agreement |
The accompanying notes are an integral part of these financial statements.
| | | | |
| 16 | | Wells Fargo Heritage Money Market Fund | | Statement of assets and liabilities—July 31, 2018 (unaudited) |
| | | | |
| | | | |
|
Assets | |
Investments in unaffiliated securities, at value (cost $7,855,498,507) | | $ | 7,856,223,500 | |
Cash | | | 13,120 | |
Receivable for Fund shares sold | | | 4,000,150 | |
Receivable for interest | | | 8,817,143 | |
| | | | |
Total assets | | | 7,869,053,913 | |
| | | | |
|
Liabilities | |
Payable for investments purchased | | | 78,735,987 | |
Dividends payable | | | 2,013,516 | |
Payable for Fund shares redeemed | | | 1,000,298 | |
Management fee payable | | | 593,695 | |
Administration fees payable | | | 309,058 | |
Accrued expenses and other liabilities | | | 3,516,331 | |
| | | | |
Total liabilities | | | 86,168,885 | |
| | | | |
Total net assets | | $ | 7,782,885,028 | |
| | | | |
|
NET ASSETS CONSIST OF | |
Paid-in capital | | $ | 7,782,483,634 | |
Overdistributed net investment income | | | (352,553 | ) |
Accumulated net realized gains on investments | | | 28,954 | |
Net unrealized gains on investments | | | 724,993 | |
| | | | |
Total net assets | | $ | 7,782,885,028 | |
| | | | |
|
COMPUTATION OF NET ASSET VALUE PER SHARE | |
Net assets – Administrator Class | | $ | 88,698,329 | |
Shares outstanding – Administrator Class1 | | | 88,666,160 | |
Net asset value per share – Administrator Class | | | $1.0004 | |
Net assets – Institutional Class | | $ | 1,644,093,919 | |
Shares outstanding – Institutional Class1 | | | 1,643,522,415 | |
Net asset value per share – Institutional Class | | | $1.0003 | |
Net assets – Select Class | | $ | 5,991,794,365 | |
Shares outstanding – Select Class1 | | | 5,989,205,635 | |
Net asset value per share – Select Class | | | $1.0004 | |
Net assets – Service Class | | $ | 58,298,415 | |
Shares outstanding – Service Class1 | | | 58,278,599 | |
Net asset value per share – Service Class | | | $1.0003 | |
| 1 | The Fund has an unlimited number of authorized shares. |
The accompanying notes are an integral part of these financial statements.
| | | | | | |
| Statement of operations—six months ended July 31, 2018 (unaudited) | | Wells Fargo Heritage Money Market Fund | | | 17 | |
| | | | |
| | | | |
| |
Investment income | | | | |
Interest | | $ | 70,087,822 | |
| | | | |
| |
Expenses | | | | |
Management fee | | | 5,162,794 | |
Administration fees | |
Administrator Class | | | 50,824 | |
Institutional Class | | | 512,908 | |
Select Class | | | 1,115,358 | |
Service Class | | | 36,302 | |
Shareholder servicing fees | |
Administrator Class | | | 50,824 | |
Service Class | | | 69,981 | |
Custody and accounting fees | | | 320,084 | |
Professional fees | | | 31,351 | |
Registration fees | | | 154,809 | |
Shareholder report expenses | | | 25,853 | |
Trustees’ fees and expenses | | | 8,319 | |
Other fees and expenses | | | 161,470 | |
| | | | |
Total expenses | | | 7,700,877 | |
Less: Fee waivers and/or expense reimbursements | | | (2,495,891 | ) |
| | | | |
Net expenses | | | 5,204,986 | |
| | | | |
Net investment income | | | 64,882,836 | |
| | | | |
| |
REALIZED AND UNREALIZED GAINS (LOSSES) ON INVESTMENTS | | | | |
Net realized gains on investments | | | 28,954 | |
Net change in unrealized gains (losses) on investments | | | 219,466 | |
| | | | |
Net realized and unrealized gains (losses) on investments | | | 248,420 | |
| | | | |
Net increase in net assets resulting from operations | | $ | 65,131,256 | |
| | | | |
The accompanying notes are an integral part of these financial statements.
| | | | |
| 18 | | Wells Fargo Heritage Money Market Fund | | Statement of changes in net assets |
| | | | | | | | | | | | | | | | |
| | | Six months ended
July 31, 2018
(unaudited) | | | Year ended
January 31, 2018 | |
| | | | |
Operations | | | | | | | | | | | | | | | | |
Net investment income | | | | | | $ | 64,882,836 | | | | | | | $ | 64,014,600 | |
Net realized gains on investments | | | | | | | 28,954 | | | | | | | | 63,872 | |
Net change in unrealized gains (losses) on investments | | | | | | | 219,466 | | | | | | | | 116,211 | |
| | | | |
Net increase in net assets resulting from operations | | | | | | | 65,131,256 | | | | | | | | 64,194,683 | |
| | | | |
| | | | |
Distributions to shareholders from | | | | | | | | | | | | | | | | |
Net investment income | | | | | | | | | | | | | | | | |
Administrator Class | | | | | | | (844,593 | ) | | | | | | | (808,895 | ) |
Institutional Class | | | | | | | (11,566,558 | ) | | | | | | | (11,149,920 | ) |
Select Class | | | | | | | (51,997,859 | ) | | | | | | | (51,559,917 | ) |
Service Class | | | | | | | (473,826 | ) | | | | | | | (495,868 | ) |
Net realized gains | | | | | | | | | | | | | | | | |
Administrator Class | | | | | | | 0 | | | | | | | | (709 | ) |
Institutional Class | | | | | | | 0 | | | | | | | | (10,041 | ) |
Select Class | | | | | | | 0 | | | | | | | | (48,412 | ) |
Service Class | | | | | | | 0 | | | | | | | | (465 | ) |
| | | | |
Total distributions to shareholders | | | | | | | (64,882,836 | ) | | | | | | | (64,074,227 | ) |
| | | | |
| | | | |
Capital share transactions | | | Shares | | | | | | | | Shares | | | | | |
Proceeds from shares sold | | | | | | | | | | | | | | | | |
Administrator Class | | | 106,885,194 | | | | 106,916,821 | | | | 248,099,059 | | | | 248,174,749 | |
Institutional Class | | | 4,210,725,446 | | | | 4,211,911,906 | | | | 5,717,291,116 | | | | 5,719,078,095 | |
Select Class | | | 17,575,976,628 | | | | 17,582,460,965 | | | | 23,211,492,748 | | | | 23,220,593,461 | |
Service Class | | | 107,579,828 | | | | 107,609,266 | | | | 187,716,630 | | | | 187,774,196 | |
| | | | |
| | | | | | | 22,008,898,958 | | | | | | | | 29,375,620,501 | |
| | | | |
Reinvestment of distributions | | | | | | | | | | | | | | | | |
Administrator Class | | | 765,019 | | | | 765,264 | | | | 754,773 | | | | 755,005 | |
Institutional Class | | | 9,094,170 | | | | 9,096,673 | | | | 8,776,998 | | | | 8,779,616 | |
Select Class | | | 42,568,723 | | | | 42,584,388 | | | | 42,194,536 | | | | 42,211,113 | |
Service Class | | | 360,576 | | | | 360,673 | | | | 394,767 | | | | 394,887 | |
| | | | |
| | | | | | | 52,806,998 | | | | | | | | 52,140,621 | |
| | | | |
Payment for shares redeemed | | | | | | | | | | | | | | | | |
Administrator Class | | | (111,496,253 | ) | | | (111,527,999 | ) | | | (238,910,906 | ) | | | (238,984,011 | ) |
Institutional Class | | | (3,680,767,700 | ) | | | (3,681,765,869 | ) | | | (5,370,441,259 | ) | | | (5,372,100,379 | ) |
Select Class | | | (17,344,694,398 | ) | | | (17,351,116,719 | ) | | | (20,923,225,004 | ) | | | (20,931,345,992 | ) |
Service Class | | | (111,057,497 | ) | | | (111,088,622 | ) | | | (194,136,471 | ) | | | (194,197,088 | ) |
| | | | |
| | | | | | | (21,255,499,209 | ) | | | | | | | (26,736,627,470 | ) |
| | | | |
Net increase in net assets resulting from capital share transactions | | | | | | | 806,206,747 | | | | | | | | 2,691,133,652 | |
| | | | |
Total increase in net assets | | | | | | | 806,455,167 | | | | | | | | 2,691,254,108 | |
| | | | |
| | | | |
Net assets | | | | | | | | | | | | | | | | |
Beginning of period | | | | | | | 6,976,429,861 | | | | | | | | 4,285,175,753 | |
| | | | |
End of period | | | | | | $ | 7,782,885,028 | | | | | | | $ | 6,976,429,861 | |
| | | | |
Overdistributed net investment income | | | | | | $ | (352,553 | ) | | | | | | $ | (352,553 | ) |
| | | | |
The accompanying notes are an integral part of these financial statements.
| | | | | | |
| Financial highlights | | Wells Fargo Heritage Money Market Fund | | | 19 | |
(For a share outstanding throughout each period)
| | | | | | | | | | | | | | | | | | | | | | | | |
| | | Six months ended
July 31, 2018
(unaudited) | | | Year ended January 31 | |
| ADMINISTRATOR CLASS | | 2018 | | | 2017 | | | 20161 | | | 20151 | | | 20141 | |
Net asset value, beginning of period | | | $1.0003 | | | | $1.0003 | | | | $1.0000 | | | | $1.00 | | | | $1.00 | | | | $1.00 | |
Net investment income | | | 0.0083 | | | | 0.0096 | | | | 0.0028 | | | | 0.00 | 2 | | | 0.00 | 2 | | | 0.00 | 2 |
Net realized and unrealized gains (losses) on investments | | | 0.0001 | | | | 0.0000 | 3 | | | 0.0003 | | | | 0.00 | 2 | | | 0.00 | 2 | | | 0.00 | 2 |
| | | | | | | | | | | | | | | | | | | | | | | | |
Total from investment operations | | | 0.0084 | | | | 0.0096 | | | | 0.0031 | | | | 0.00 | 2 | | | 0.00 | 2 | | | 0.00 | 2 |
Distributions to shareholders from | | | | | | | | | | | | | | | | | | | | | | | | |
Net investment income | | | (0.0083 | ) | | | (0.0096 | ) | | | (0.0028 | ) | | | (0.00 | )2 | | | (0.00 | )2 | | | (0.00 | )2 |
Net realized gains | | | 0.0000 | | | | (0.0000 | )3 | | | 0.0000 | | | | 0.00 | | | | 0.00 | | | | 0.00 | |
| | | | | | | | | | | | | | | | | | | | | | | | |
Total distributions to shareholders | | | (0.0083 | ) | | | (0.0096 | ) | | | (0.0028 | ) | | | (0.00 | )2 | | | (0.00 | )2 | | | (0.00 | )2 |
Net asset value, end of period | | | $1.0004 | | | | $1.0003 | | | | $1.0003 | | | | $1.00 | | | | $1.00 | | | | $1.00 | |
Total return4 | | | 0.84 | % | | | 0.96 | % | | | 0.31 | % | | | 0.03 | % | | | 0.01 | % | | | 0.01 | % |
Ratios to average net assets (annualized) | | | | | | | | | | | | | | | | | | | | | | | | |
Gross expenses | | | 0.37 | % | | | 0.40 | % | | | 0.35 | % | | | 0.34 | % | | | 0.34 | % | | | 0.34 | % |
Net expenses | | | 0.33 | % | | | 0.32 | % | | | 0.33 | % | | | 0.25 | % | | | 0.19 | % | | | 0.20 | % |
Net investment income | | | 1.66 | % | | | 0.96 | % | | | 0.24 | % | | | 0.03 | % | | | 0.01 | % | | | 0.01 | % |
Supplemental data | | | | | | | | | | | | | | | | | | | | | | | | |
Net assets, end of period (000s omitted) | | | $88,698 | | | | $92,542 | | | | $82,591 | | | | $258,152 | | | | $312,748 | | | | $286,618 | |
| 1 | Amounts reflect the Fund transacting shares at a fixed NAV rounded to two decimal places. Beginning October 11, 2016, the Fund began selling and redeeming shares of the Fund at a floating NAV rounded to the fourth decimal place. |
| 2 | Amount is less than $0.005. |
| 3 | Amount is less than $0.00005. |
| 4 | Returns for periods of less than one year are not annualized |
The accompanying notes are an integral part of these financial statements.
| | | | |
| 20 | | Wells Fargo Heritage Money Market Fund | | Financial highlights |
(For a share outstanding throughout each period)
| | | | | | | | | | | | | | | | | | | | | | | | |
| | | Six months ended
July 31, 2018
(unaudited) | | | Year ended January 31 | |
| INSTITUTIONAL CLASS | | 2018 | | | 2017 | | | 20161 | | | 20151 | | | 20141 | |
Net asset value, beginning of period | | | $1.0003 | | | | $1.0003 | | | | $1.0000 | | | | $1.00 | | | | $1.00 | | | | $1.00 | |
Net investment income | | | 0.0090 | | | | 0.0108 | | | | 0.0039 | | | | 0.00 | 2 | | | 0.00 | 2 | | | 0.00 | 2 |
Net realized and unrealized gains (losses) on investments | | | (0.0001 | ) | | | 0.0000 | 3 | | | 0.0005 | | | | 0.00 | 2 | | | 0.00 | 2 | | | 0.00 | 2 |
| | | | | | | | | | | | | | | | | | | | | | | | |
Total from investment operations | | | 0.0089 | | | | 0.0108 | | | | 0.0044 | | | | 0.00 | 2 | | | 0.00 | 2 | | | 0.00 | 2 |
Distributions to shareholders from | | | | | | | | | | | | | | | | | | | | | | | | |
Net investment income | | | (0.0089 | ) | | | (0.0108 | ) | | | (0.0041 | ) | | | (0.00 | )2 | | | (0.00 | )2 | | | (0.00 | )2 |
Net realized gains | | | 0.0000 | | | | (0.0000 | )3 | | | 0.0000 | | | | 0.00 | | | | 0.00 | | | | 0.00 | |
| | | | | | | | | | | | | | | | | | | | | | | | |
Total distributions to shareholders | | | (0.0089 | ) | | | (0.0108 | ) | | | (0.0041 | ) | | | (0.00 | )2 | | | (0.00 | )2 | | | (0.00 | )2 |
Net asset value, end of period | | | $1.0003 | | | | $1.0003 | | | | $1.0003 | | | | $1.00 | | | | $1.00 | | | | $1.00 | |
Total return4 | | | 0.90 | % | | | 1.09 | % | | | 0.44 | % | | | 0.08 | % | | | 0.01 | % | | | 0.02 | % |
Ratios to average net assets (annualized) | | | | | | | | | | | | | | | | | | | | | | | | |
Gross expenses | | | 0.25 | % | | | 0.28 | % | | | 0.23 | % | | | 0.22 | % | | | 0.22 | % | | | 0.22 | % |
Net expenses | | | 0.20 | % | | | 0.20 | % | | | 0.20 | % | | | 0.20 | % | | | 0.19 | % | | | 0.19 | % |
Net investment income | | | 1.80 | % | | | 1.11 | % | | | 0.36 | % | | | 0.08 | % | | | 0.01 | % | | | 0.02 | % |
Supplemental data | | | | | | | | | | | | | | | | | | | | | | | | |
Net assets, end of period (000s omitted) | | | $1,644,094 | | | | $1,104,814 | | | | $749,052 | | | | $8,252,614 | | | | $9,397,113 | | | | $10,473,476 | |
| 1 | Amounts reflect the Fund transacting shares at a fixed NAV rounded to two decimal places. Beginning October 11, 2016, the Fund began selling and redeeming shares of the Fund at a floating NAV rounded to the fourth decimal place. |
| 2 | Amount is less than $0.005. |
| 3 | Amount is less than $0.00005. |
| 4 | Returns for periods of less than one year are not annualized |
The accompanying notes are an integral part of these financial statements.
| | | | | | |
| Financial highlights | | Wells Fargo Heritage Money Market Fund | | | 21 | |
(For a share outstanding throughout each period)
| | | | | | | | | | | | | | | | | | | | | | | | |
| | | Six months ended
July 31, 2018
(unaudited) | | | Year ended January 31 | |
| SELECT CLASS | | 2018 | | | 2017 | | | 20161 | | | 20151 | | | 20141 | |
Net asset value, beginning of period | | | $1.0004 | | | | $1.0004 | | | | $1.0000 | | | | $1.00 | | | | $1.00 | | | | $1.00 | |
Net investment income | | | 0.0093 | | | | 0.0116 | | | | 0.0048 | | | | 0.00 | 2 | | | 0.00 | 2 | | | 0.00 | 2 |
Net realized and unrealized gains (losses) on investments | | | 0.0000 | 3 | | | 0.0000 | 3 | | | 0.0004 | | | | 0.00 | 2 | | | 0.00 | 2 | | | 0.00 | 2 |
| | | | | | | | | | | | | | | | | | | | | | | | |
Total from investment operations | | | 0.0093 | | | | 0.0116 | | | | 0.0052 | | | | 0.00 | 2 | | | 0.00 | 2 | | | 0.00 | 2 |
Distributions to shareholders from | | | | | | | | | | | | | | | | | | | | | | | | |
Net investment income | | | (0.0093 | ) | | | (0.0116 | ) | | | (0.0048 | ) | | | (0.00 | )2 | | | (0.00 | )2 | | | (0.00 | )2 |
Net realized gains | | | 0.0000 | | | | (0.0000 | )3 | | | 0.0000 | | | | 0.00 | | | | 0.00 | | | | 0.00 | |
| | | | | | | | | | | | | | | | | | | | | | | | |
Total distributions to shareholders | | | (0.0093 | ) | | | (0.0116 | ) | | | (0.0048 | ) | | | (0.00 | )2 | | | (0.00 | )2 | | | (0.00 | )2 |
Net asset value, end of period | | | $1.0004 | | | | $1.0004 | | | | $1.0004 | | | | $1.00 | | | | $1.00 | | | | $1.00 | |
Total return4 | | | 0.93 | % | | | 1.16 | % | | | 0.52 | % | | | 0.15 | % | | | 0.07 | % | | | 0.09 | % |
Ratios to average net assets (annualized) | | | | | | | | | | | | | | | | | | | | | | | | |
Gross expenses | | | 0.21 | % | | | 0.24 | % | | | 0.19 | % | | | 0.18 | % | | | 0.18 | % | | | 0.18 | % |
Net expenses | | | 0.13 | % | | | 0.12 | % | | | 0.13 | % | | | 0.13 | % | | | 0.13 | % | | | 0.13 | % |
Net investment income | | | 1.86 | % | | | 1.19 | % | | | 0.43 | % | | | 0.16 | % | | | 0.07 | % | | | 0.08 | % |
Supplemental data | | | | | | | | | | | | | | | | | | | | | | | | |
Net assets, end of period (000s omitted) | | | $5,991,794 | | | | $5,717,659 | | | | $3,386,093 | | | | $37,219,390 | | | | $35,247,440 | | | | $30,569,838 | |
| 1 | Amounts reflect the Fund transacting shares at a fixed NAV rounded to two decimal places. Beginning October 11, 2016, the Fund began selling and redeeming shares of the Fund at a floating NAV rounded to the fourth decimal place. |
| 2 | Amount is less than $0.005. |
| 3 | Amount is less than $0.00005. |
| 4 | Returns for periods of less than one year are not annualized |
The accompanying notes are an integral part of these financial statements.
| | | | |
| 22 | | Wells Fargo Heritage Money Market Fund | | Financial highlights |
(For a share outstanding throughout each period)
| | | | | | | | | | | | | | | | | | | | | | | | |
| | | Six months ended
July 31, 2018
(unaudited) | | | Year ended January 31 | |
| SERVICE CLASS | | 2018 | | | 2017 | | | 20161 | | | 20151 | | | 20141 | |
Net asset value, beginning of period | | | $1.0003 | | | | $1.0003 | | | | $1.0000 | | | | $1.00 | | | | $1.00 | | | | $1.00 | |
Net investment income | | | 0.0078 | | | | 0.0085 | | | | 0.0016 | | | | 0.00 | 2 | | | 0.00 | 2 | | | 0.00 | 2 |
Net realized and unrealized gains (losses) on investments | | | 0.0000 | 3 | | | 0.0000 | 3 | | | 0.0005 | | | | 0.00 | 2 | | | 0.00 | 2 | | | 0.00 | 2 |
| | | | | | | | | | | | | | | | | | | | | | | | |
Total from investment operations | | | 0.0078 | | | | 0.0085 | | | | 0.0021 | | | | 0.00 | 2 | | | 0.00 | 2 | | | 0.00 | 2 |
Distributions to shareholders from | | | | | | | | | | | | | | | | | | | | | | | | |
Net investment income | | | (0.0078 | ) | | | (0.0085 | ) | | | (0.0018 | ) | | | (0.00 | )2 | | | (0.00 | )2 | | | (0.00 | )2 |
Net realized gains | | | 0.0000 | | | | (0.0000 | )3 | | | 0.0000 | | | | 0.00 | | | | 0.00 | | | | 0.00 | |
| | | | | | | | | | | | | | | | | | | | | | | | |
Total distributions to shareholders | | | (0.0078 | ) | | | (0.0085 | ) | | | (0.0018 | ) | | | (0.00 | )2 | | | (0.00 | )2 | | | (0.00 | )2 |
Net asset value, end of period | | | $1.0003 | | | | $1.0003 | | | | $1.0003 | | | | $1.00 | | | | $1.00 | | | | $1.00 | |
Total return4 | | | 0.78 | % | | | 0.85 | % | | | 0.21 | % | | | 0.02 | % | | | 0.01 | % | | | 0.01 | % |
Ratios to average net assets (annualized) | | | | | | | | | | | | | | | | | | | | | | | | |
Gross expenses | | | 0.52 | % | | | 0.55 | % | | | 0.52 | % | | | 0.51 | % | | | 0.50 | % | | | 0.50 | % |
Net expenses | | | 0.43 | % | | | 0.43 | % | | | 0.43 | % | | | 0.27 | % | | | 0.19 | % | | | 0.20 | % |
Net investment income | | | 1.57 | % | | | 0.84 | % | | | 0.13 | % | | | 0.02 | % | | | 0.01 | % | | | 0.01 | % |
Supplemental data | | | | | | | | | | | | | | | | | | | | | | | | |
Net assets, end of period (000s omitted) | | | $58,298 | | | | $61,415 | | | | $67,439 | | | | $898,288 | | | | $1,124,475 | | | | $1,064,804 | |
| 1 | Amounts reflect the Fund transacting shares at a fixed NAV rounded to two decimal places. Beginning October 11, 2016, the Fund began selling and redeeming shares of the Fund at a floating NAV rounded to the fourth decimal place. |
| 2 | Amount is less than $0.005. |
| 3 | Amount is less than $0.00005. |
| 4 | Returns for periods of less than one year are not annualized |
The accompanying notes are an integral part of these financial statements.
| | | | | | |
| Notes to financial statements (unaudited) | | Wells Fargo Heritage Money Market Fund | | | 23 | |
1. ORGANIZATION
Wells Fargo Funds Trust (the “Trust”), a Delaware statutory trust organized on March 10, 1999, is an open-end management investment company registered under the Investment Company Act of 1940, as amended (the “1940 Act”). As an investment company, the Trust follows the accounting and reporting guidance in Financial Accounting Standards Board Accounting Standards Codification Topic 946, Financial Services – Investment Companies. These financial statements report on the Wells Fargo Heritage Money Market Fund (the “Fund”) which is a diversified series of the Trust.
2. SIGNIFICANT ACCOUNTING POLICIES
The following significant accounting policies, which are consistently followed in the preparation of the financial statements of the Fund, are in conformity with U.S. generally accepted accounting principles which require management to make estimates and assumptions that affect the reported amounts of assets and liabilities, disclosure of contingent assets and liabilities at the date of the financial statements, and the reported amounts of revenues and expenses during the reporting period. Actual results could differ from those estimates.
Securities valuation
Debt securities are valued at the evaluated bid price provided by an independent pricing service or, if a reliable price is not available, the quoted bid price from an independent broker-dealer.
Investments which are not valued using any of the methods discussed above are valued at their fair value, as determined in good faith by the Board of Trustees of the Fund. The Board of Trustees has established a Valuation Committee comprised of the Trustees and has delegated to it the authority to take any actions regarding the valuation of portfolio securities that the Valuation Committee deems necessary or appropriate, including determining the fair value of portfolio securities, unless the determination has been delegated to the Wells Fargo Asset Management Pricing Committee at Wells Fargo Funds Management, LLC (“Funds Management”). The Board of Trustees retains the authority to make or ratify any valuation decisions or approve any changes to the Valuation Procedures as it deems appropriate. On a quarterly basis, the Board of Trustees receives reports on any valuation actions taken by the Valuation Committee or the Wells Fargo Asset Management Pricing Committee which may include items for ratification.
Valuations of fair valued securities are compared to the next actual sales price when available, or other appropriate market values, to assess the continued appropriateness of the fair valuation methodologies used. These securities are fair valued on a day-to-day basis, taking into consideration changes to appropriate market information and any significant changes to the inputs considered in the valuation process until there is a readily available price provided on an exchange or by an independent pricing service. Valuations received from an independent pricing service or independent broker-dealer quotes are periodically validated by comparisons to most recent trades and valuations provided by other independent pricing services in addition to the review of prices by the manager and/or subadvisers. Unobservable inputs used in determining fair valuations are identified based on the type of security, taking into consideration factors utilized by market participants in valuing the investment, knowledge about the issuer and the current market environment.
Repurchase agreements
The Fund may invest in repurchase agreements and may participate in pooled repurchase agreement transactions with other funds advised by Funds Management. Repurchase agreements are agreements where the seller of a security to the Fund agrees to repurchase that security from the Fund at a mutually agreed upon time and price. The repurchase agreements must be fully collateralized based on values that are marked-to-market daily. The collateral may be held by an agent bank under a tri-party agreement. It is the custodian’s responsibility to value collateral daily and to take action to obtain additional collateral as necessary to maintain a market value equal to or greater than the resale price. The repurchase agreements are collateralized by U.S. government securities. There could be potential loss to the Fund in the event that the Fund is delayed or prevented from exercising its rights to dispose of the collateral, including the risk of a possible decline in the value of the underlying obligations during the period in which the Fund seeks to assert its rights.
When-issued transactions
The Fund may purchase securities on a forward commitment or when-issued basis. The Fund records a when-issued transaction on the trade date and will segregate assets in an amount at least equal in value to the Fund’s commitment to purchase when-issued securities. Securities purchased on a when-issued basis are marked-to-market daily and the Fund begins earning interest on the settlement date. Losses may arise due to changes in the market value of the underlying securities or if the counterparty does not perform under the contract.
| | | | |
| 24 | | Wells Fargo Heritage Money Market Fund | | Notes to financial statements (unaudited) |
Security transactions and income recognition
Securities transactions are recorded on a trade date basis. Realized gains or losses are recorded on the basis of identified cost.
Interest income is accrued daily and bond discounts are accreted and premiums are amortized daily. To the extent debt obligations are placed on non-accrual status, any related interest income may be reduced by writing off interest receivables when the collection of all or a portion of interest has been determined to be doubtful based on consistently applied procedures and the fair value has decreased. If the issuer subsequently resumes interest payments or when the collectability of interest is reasonably assured, the debt obligation is removed from non-accrual status.
Distributions to shareholders
Distributions to shareholders from net investment income are declared daily and paid monthly. Distributions from net realized gains, if any, are recorded on the ex-dividend date and paid at least annually. Such distributions are determined in accordance with income tax regulations and may differ from U.S. generally accepted accounting principles. Dividend sources are estimated at the time of declaration. The tax character of distributions is determined as of the Fund’s fiscal year end. Therefore, a portion of the Fund’s distributions made prior to the Fund’s fiscal year end may be categorized as a tax return of capital at year end.
Federal and other taxes
The Fund intends to continue to qualify as a regulated investment company by distributing substantially all of its investment company taxable income and any net realized capital gains (after reduction for capital loss carryforwards) sufficient to relieve it from all, or substantially all, federal income taxes. Accordingly, no provision for federal income taxes was required.
The Fund’s income and federal excise tax returns and all financial records supporting those returns for the prior three fiscal years are subject to examination by the federal and Delaware revenue authorities. Management has analyzed the Fund’s tax positions taken on federal, state, and foreign tax returns for all open tax years and does not believe that there are any uncertain tax positions that require recognition of a tax liability.
As of July 31, 2018, the aggregate cost of all investments for federal income tax purposes was $7,855,498,507 and the unrealized gains (losses) consisted of:
| | | | |
Gross unrealized gains | | $ | 756,594 | |
Gross unrealized losses | | | (31,601 | ) |
Net unrealized gains | | $ | 724,993 | |
Class allocations
The separate classes of shares offered by the Fund differ principally in shareholder servicing and administration fees. Class specific expenses are charged directly to that share class. Investment income, common expenses, and realized and unrealized gains (losses) on investments are allocated daily to each class of shares based on the relative proportion of net assets of each class.
3. FAIR VALUATION MEASUREMENTS
Fair value measurements of investments are determined within a framework that has established a fair value hierarchy based upon the various data inputs utilized in determining the value of the Fund’s investments. The three-level hierarchy gives the highest priority to unadjusted quoted prices in active markets for identical assets or liabilities (Level 1) and the lowest priority to unobservable inputs (Level 3). The Fund’s investments are classified within the fair value hierarchy based on the lowest level of input that is significant to the fair value measurement. The inputs are summarized into three broad levels as follows:
| ∎ | | Level 1 – quoted prices in active markets for identical securities |
| ∎ | | Level 2 – other significant observable inputs (including quoted prices for similar securities, interest rates, prepayment speeds, credit risk, etc.) |
| ∎ | | Level 3 – significant unobservable inputs (including the Fund’s own assumptions in determining the fair value of investments) |
The inputs or methodologies used for valuing investments in securities are not necessarily an indication of the risk associated with investing in those securities.
| | | | | | |
| Notes to financial statements (unaudited) | | Wells Fargo Heritage Money Market Fund | | | 25 | |
The following is a summary of the inputs used in valuing the Fund’s assets and liabilities as of July 31, 2018:
| | | | | | | | | | | | | | | | |
| | | Quoted prices (Level 1) | | | Other significant observable inputs (Level 2) | | | Significant unobservable inputs (Level 3) | | | Total | |
Assets | | | | | | | | | | | | | | | | |
Investments in: | | | | | | | | | | | | | | | | |
| | | | |
Certificates of deposit | | $ | 0 | | | $ | 2,038,334,193 | | | $ | 0 | | | $ | 2,038,334,193 | |
| | | | |
Asset-backed commercial paper | | | 0 | | | | 1,881,862,778 | | | | 0 | | | | 1,881,862,778 | |
| | | | |
Financial company commercial paper | | | 0 | | | | 1,563,004,642 | | | | 0 | | | | 1,563,004,642 | |
| | | | |
Other commercial paper | | | 0 | | | | 506,084,744 | | | | 0 | | | | 506,084,744 | |
| | | | |
Other municipal debt | | | 0 | | | | 121,706,479 | | | | 0 | | | | 121,706,479 | |
| | | | |
Variable rate demand notes | | | 0 | | | | 845,136,701 | | | | 0 | | | | 845,136,701 | |
| | | | |
Other instruments | | | 0 | | | | 353,093,963 | | | | 0 | | | | 353,093,963 | |
Repurchase agreements | | | 0 | | | | 547,000,000 | | | | 0 | | | | 547,000,000 | |
Total assets | | $ | 0 | | | $ | 7,856,223,500 | | | $ | 0 | | | $ | 7,856,223,500 | |
The Fund recognizes transfers between levels within the fair value hierarchy at the end of the reporting period. At July 31, 2018, the Fund did not have any transfers into/out of Level 1, Level 2, or Level 3.
4. TRANSACTIONS WITH AFFILIATES
Management fee
Funds Management, an indirect wholly owned subsidiary of Wells Fargo & Company (“Wells Fargo”), is the manager of the Fund and provides advisory and fund-level administrative services under an investment management agreement. Under the investment management agreement, Funds Management is responsible for, among other services, implementing the investment objectives and strategies of the Fund, supervising the subadvisers and providing fund-level administrative services in connection with the Fund’s operations. As compensation for its services under the investment management agreement, Funds Management is entitled to receive an annual management fee starting at 0.15% and declining to 0.13% as the average daily net assets of the Fund increase. For the six months ended July 31, 2018, the management fee was equivalent to an annual rate of 0.15% of the Fund’s average daily net assets.
Funds Management has retained the services of a certain subadvisers to provide daily portfolio management to the Fund. The fee for subadvisory services is borne by Funds Management. Wells Capital Management Incorporated (“WellsCap”), an affiliate of Funds Management and an indirect wholly owned subsidiary of Wells Fargo, is a subadviser to the Fund and is entitled to receive a fee from Funds Management at an annual rate starting at 0.05% and declining to 0.01% as the average daily net assets of the Fund increase. Wells Capital Management Singapore, a separately identifiable department of Wells Fargo Bank, N.A., an affiliate of Funds Management and wholly owned subsidiary of Wells Fargo, is also a subadviser to the Fund and is entitled to receive a fee from WellsCap at an annual rate starting at 0.0025% and declining to 0.0005% as the average daily net assets of the Fund increase.
Administration fees
Under a class-level administration agreement, Funds Management provides class-level administrative services to the Fund, which includes paying fees and expenses for services provided by the transfer agent, sub-transfer agents, omnibus account servicers and record-keepers. As compensation for its services under the class-level administration agreement, Funds Management receives an annual fee which is calculated based on the average daily net assets of each class as follows:
| | | | |
| | | Class-level
administration fee | |
Administrator Class | | | 0.10 | % |
Institutional Class | | | 0.08 | |
Select Class | | | 0.04 | |
Service Class | | | 0.12 | |
| | | | |
| 26 | | Wells Fargo Heritage Money Market Fund | | Notes to financial statements (unaudited) |
Funds Management has contractually waived and/or reimbursed management and administration fees to the extent necessary to maintain certain net operating expense ratios for the Fund. When each class of the Fund has exceeded its expense cap, Funds Management has waived fees and/or reimbursed expenses from fund level expenses on a proportionate basis and then from class specific expenses; otherwise, waivers and/or reimbursements are applied against class specific expenses before fund level expenses. Funds Management has committed through May 31, 2019 to waive fees and/or reimburse expenses to the extent necessary to cap the Fund’s expenses at 0.35% for Administrator Class shares, 0.20% for Institutional Class shares, 0.13% for Select Class shares, and 0.43% for Service Class shares. After this time, the cap may be increased or the commitment to maintain the cap may be terminated only with the approval of the Board of Trustees. During the six months ended July 31, 2018, Funds Management voluntarily waived additional expenses beyond the contractual expense caps.
Shareholder servicing fees
The Trust has entered into contracts with one or more shareholder servicing agents, whereby Administrator Class and Service Class of the Fund are charged a fee at an annual rate of 0.10% and 0.25%, respectively, of their average daily net assets.
A portion of these total shareholder servicing fees were paid to affiliates of Wells Fargo.
Interfund transactions
The Fund may purchase or sell investment securities to other Wells Fargo affiliates pursuant to Rule 17a-7 of the 1940 Act and under procedures adopted by the Board of Trustees. The procedures have been designed to ensure that these interfund transactions, which do not incur broker commissions, are effected at current market prices.
5. INDEMNIFICATION
Under the Trust’s organizational documents, the officers and Trustees have been granted certain indemnification rights against certain liabilities that may arise out of performance of their duties to the Trust. Additionally, in the normal course of business, the Trust may enter into contracts with service providers that contain a variety of indemnification clauses. The Trust’s maximum exposure under these arrangements is dependent on future claims that may be made against the Fund and, therefore, cannot be estimated.
| | | | | | |
| Other information (unaudited) | | Wells Fargo Heritage Money Market Fund | | | 27 | |
PROXY VOTING INFORMATION
A description of the policies and procedures that the Fund uses to determine how to vote proxies relating to portfolio securities is available, upon request, by calling 1-800-222-8222, visiting our website at wellsfargofunds.com, or visiting the SEC website at sec.gov. Information regarding how the Fund voted proxies relating to portfolio securities during the most recent 12-month period ended June 30 is available on the Fund’s website at wellsfargofunds.com or by visiting the SEC website at sec.gov.
PORTFOLIO HOLDINGS INFORMATION
The complete portfolio holdings for the Fund are publicly available on the Fund’s website (wellsfargofunds.com) on a 1-day delayed basis. The Fund files its complete schedule of portfolio holdings with the SEC for the first and third quarters of each fiscal year on Form N-Q, which is available by visiting the SEC website at sec.gov. In addition, the Fund’s Form N-Q may be reviewed and copied at the SEC’s Public Reference Room in Washington, DC, and at regional offices in New York City, at 233 Broadway, and in Chicago, at 175 West Jackson Boulevard, Suite 900. Information about the Public Reference Room may be obtained by calling 1-800-SEC-0330.
| | | | |
| 28 | | Wells Fargo Heritage Money Market Fund | | Other information (unaudited) |
BOARD OF TRUSTEES AND OFFICERS
Each of the Trustees and Officers1 listed in the table below acts in identical capacities for each fund in the Wells Fargo family of funds, which consists of 154 mutual funds comprising the Wells Fargo Funds Trust, Wells Fargo Variable Trust, Wells Fargo Master Trust and four closed-end funds (collectively the “Fund Complex”). This table should be read in conjunction with the Prospectus and the Statement of Additional Information2. The mailing address of each Trustee and Officer is 525 Market Street, 12th Floor, San Francisco, CA 94105. Each Trustee and Officer serves an indefinite term, however, each Trustee serves such term until reaching the mandatory retirement age established by the Trustees.
Independent Trustees
| | | | | | |
Name and year of birth | | Position held and length of service* | | Principal occupations during past five years or longer | | Current other public company or
investment company directorships |
William R. Ebsworth (Born 1957) | | Trustee, since 2015 | | Retired. From 1984 to 2013, equities analyst, portfolio manager, research director and chief investment officer at Fidelity Management and Research Company in Boston, Tokyo, and Hong Kong, and retired in 2013 as Chief Investment Officer of Fidelity Strategic Advisers, Inc. where he led a team of investment professionals managing client assets. Prior thereto, Board member of Hong Kong Securities Clearing Co., Hong Kong Options Clearing Corp., the Thailand International Fund, Ltd., Fidelity Investments Life Insurance Company, and Empire Fidelity Investments Life Insurance Company. Board member of the Forté Foundation (non-profit organization) and the Vincent Memorial Hospital Endowment (non-profit organization), where he serves on the Investment Committee and as a Chair of the Audit Committee. Mr. Ebsworth is a CFA® charterholder. | | Asset Allocation Trust |
Jane A. Freeman (Born 1953) | | Trustee, since 2015; Chair Liaison, since 2018 | | Retired. From 2012 to 2014 and 1999 to 2008, Chief Financial Officer of Scientific Learning Corporation. From 2008 to 2012, Ms. Freeman provided consulting services related to strategic business projects. Prior to 1999, Portfolio Manager at Rockefeller & Co. and Scudder, Stevens & Clark. Board member of the Harding Loevner Funds from 1996 to 2014, serving as both Lead Independent Director and chair of the Audit Committee. Board member of the Russell Exchange Traded Funds Trust from 2011 to 2012 and the chair of the Audit Committee. Ms. Freeman is a Board Member of Ruth Bancroft Garden (non-profit organization) and the Glimmerglass Festival. She is also an inactive Chartered Financial Analyst. | | Asset Allocation Trust |
Isaiah Harris, Jr. (Born 1952) | | Trustee, since 2009 | | Retired. Chairman of the Board of CIGNA Corporation since 2009, and Director since 2005. From 2003 to 2011, Director of Deluxe Corporation. Prior thereto, President and CEO of BellSouth Advertising and Publishing Corp. from 2005 to 2007, President and CEO of BellSouth Enterprises from 2004 to 2005 and President of BellSouth Consumer Services from 2000 to 2003. Emeritus member of the Iowa State University Foundation Board of Governors. Emeritus Member of the Advisory Board of Iowa State University School of Business. Advisory Board Member, Palm Harbor Academy (charter school). Advisory Board Member, Child Evangelism Fellowship (non-profit). Mr. Harris is a certified public accountant (inactive status). | | CIGNA Corporation; Asset Allocation Trust |
Judith M. Johnson (Born 1949) | | Trustee, since 2008; Audit Committee Chairman, since 2009 | | Retired. Prior thereto, Chief Executive Officer and Chief Investment Officer of Minneapolis Employees Retirement Fund from 1996 to 2008. Ms. Johnson is an attorney, certified public accountant and a certified managerial accountant. | | Asset Allocation Trust |
David F. Larcker (Born 1950) | | Trustee, since 2009 | | James Irvin Miller Professor of Accounting at the Graduate School of Business, Stanford University, Director of the Corporate Governance Research Initiative and Senior Faculty of The Rock Center for Corporate Governance since 2006. From 2005 to 2008, Professor of Accounting at the Graduate School of Business, Stanford University. Prior thereto, Ernst & Young Professor of Accounting at The Wharton School, University of Pennsylvania from 1985 to 2005. | | Asset Allocation Trust |
| | | | | | |
| Other information (unaudited) | | Wells Fargo Heritage Money Market Fund | | | 29 | |
| | | | | | |
Name and year of birth | | Position held and length of service* | | Principal occupations during past five years or longer | | Current other public company or
investment company directorships |
Olivia S. Mitchell (Born 1953) | | Trustee, since 2006; Governance Committee Chairman, since 2018 | | International Foundation of Employee Benefit Plans Professor, Wharton School of the University of Pennsylvania since 1993. Director of Wharton’s Pension Research Council and Boettner Center on Pensions & Retirement Research, and Research Associate at the National Bureau of Economic Research. Previously, Cornell University Professor from 1978 to 1993. | | Asset Allocation Trust |
Timothy J. Penny (Born 1951) | | Trustee, since 1996; Chairman, since 2018; Vice Chairman, from 2017 to 2018 | | President and Chief Executive Officer of Southern Minnesota Initiative Foundation, a non-profit organization, since 2007. Member of the Board of Trustees of NorthStar Education Finance, Inc., a non-profit organization, since 2007. | | Asset Allocation Trust |
James G. Polisson (Born 1959) | | Trustee, since 2018; Advisory Board Member, from 2017 to 2018 | | Retired. Chief Marketing Officer, Source (ETF) UK Services, Ltd, from 2015 to 2017. From 2012 to 2015, Principal of The Polisson Group, LLC, a management consulting, corporate advisory and principal investing company. Chief Executive Officer and Managing Director at Russell Investments, Global Exchange Traded Funds from 2010 to 2012. Managing Director of Barclays Global Investors from 1998 to 2010 and Global Chief Marketing Officer for iShares and Barclays Global Investors from 2000 to 2010. Trustee of the San Francisco Mechanics’ Institute, a non-profit organization, from 2013 to 2015. Board member of the Russell Exchange Traded Fund Trust from 2011 to 2012. Director of Barclays Global Investors Holdings Deutschland GmbH from 2006 to 2009. Mr. Polisson is an attorney and has a retired status with the Massachusetts and District of Columbia Bar Associations. | | Asset Allocation Trust |
Michael S. Scofield (Born 1943) | | Trustee, since 2010 | | Served on the Investment Company Institute’s Board of Governors and Executive Committee from 2008-2011 as well the Governing Council of the Independent Directors Council from 2006-2011 and the Independent Directors Council Executive Committee from 2008-2011. Trustee of the Evergreen Fund complex (and its predecessors) from 1984 to 2010. Chairman of the Evergreen Funds from 2000-2010. Former Trustee of the Mentor Funds. Retired Attorney, Law Offices of Michael S. Scofield. | | Asset Allocation Trust |
Pamela Wheelock (Born 1959) | | Trustee, since 2018; Advisory Board Member, from 2017 to 2018 | | Chief Operating Officer, Twin Cities Habitat for Humanity, since January, 2017. Vice President of University Services, University of Minnesota from 2012 to 2017. Prior thereto, on the Board of Directors, Goverance Committee and Finance Committee for the Minnesota Philanthropy Partners (Saint Paul Foundation) from 2012 to 2018, Interim President and Chief Executive Officer of Blue Cross Blue shield of Minnesota of Minnesota from 2010 to 2011, Chairman of the Board from 2009 to 2011 and Board Director 003 to 2015. Vice President, Leadership and Community Engagement, Bush Foundation, Saint Paul, Minnesota (a private foundation) from 2009 to 2011. Executive Vice President and Chief Financial Officer, Minnesota Sports and Entertainment from 2004 to 2009 and Senior Vice President from 2002 to 2004. Commissioner of Finance, State of Minnesota, from 1999 to 2002. Currently the Board Chair of the Minnesota Wild Foundation since 2010. | | Asset Allocation Trust |
| * | Length of service dates reflect the Trustee’s commencement of service with the Trust’s predecessor entities, where applicable. |
| | | | |
| 30 | | Wells Fargo Heritage Money Market Fund | | Other information (unaudited) |
Officers
| | | | | | |
Name and year of birth | | Position held and
length of service | | Principal occupations during past five years or longer | | |
Andrew Owen (Born 1960) | | President, since 2017 | | Executive Vice President of Wells Fargo & Company and Head of Affiliated Managers, Wells Fargo Asset Management, since 2014. In addition, Mr. Owen is currently President, Chief Executive Officer and Director of Wells Fargo Funds Management, LLC since 2017. Prior thereto, Executive Vice President responsible for marketing, investments and product development for Wells Fargo Funds Management, LLC, from 2009 to 2014. | | |
Nancy Wiser1 (Born 1967) | | Treasurer, since 2012 | | Executive Vice President of Wells Fargo Funds Management, LLC since 2011. Chief Operating Officer and Chief Compliance Officer at LightBox Capital Management LLC, from 2008 to 2011. | | |
Alexander Kymn3 (Born 1973) | | Secretary, since 2018; Chief Legal Officer, since 2018 | | Senior Company Counsel of Wells Fargo Bank, N.A. since 2018 (previously Senior Counsel from 2007 to 2018). Vice President of Wells Fargo Funds Management, LLC from 2008 to 2014. | | |
Michael H. Whitaker (Born 1967) | | Chief Compliance Officer, since 2016 | | Senior Vice President and Chief Compliance Officer since 2016. Senior Vice President and Chief Compliance Officer for Fidelity Investments from 2007 to 2016. | | |
David Berardi (Born 1975) | | Assistant Treasurer, since 2009 | | Vice President of Wells Fargo Funds Management, LLC since 2009. Vice President of Evergreen Investment Management Company, LLC from 2008 to 2010. Manager of Fund Reporting and Control for Evergreen Investment Management Company, LLC from 2004 to 2010. | | |
Jeremy DePalma1 (Born 1974) | | Assistant Treasurer, since 2009 | | Senior Vice President of Wells Fargo Funds Management, LLC since 2009. Senior Vice President of Evergreen Investment Management Company, LLC from 2008 to 2010 and head of the Fund Reporting and Control Team within Fund Administration from 2005 to 2010. | | |
| 1 | Nancy Wiser acts as Treasurer of 77 funds in the Fund Complex. Jeremy DePalma acts as Treasurer of 77 funds and Assistant Treasurer of 77 funds in the Fund Complex. |
| 2 | The Statement of Additional Information includes additional information about the Trustees and is available, without charge, upon request, by calling 1-800-222-8222 or by visiting the website at wellsfargofunds.com. |
| 3 | Alexander Kymn became the Secretary and Chief Legal Officer effective April 17, 2018. |
| | | | | | |
| Other information (unaudited) | | Wells Fargo Heritage Money Market Fund | | | 31 | |
BOARD CONSIDERATION OF INVESTMENT MANAGEMENT AND SUB-ADVISORY AGREEMENTS:
Wells Fargo Heritage Money Market Fund
Under the Investment Company Act of 1940 (the “1940 Act”), the Board of Trustees (the “Board”) of Wells Fargo Funds Trust (the “Trust”) must determine annually whether to approve the continuation of the Trust’s investment management and sub-advisory agreements. In this regard, at an in-person meeting held on May 22-23, 2018 (the “Meeting”), the Board, all the members of which have no direct or indirect interest in the investment management and sub-advisory agreements and are not “interested persons” of the Trust, as defined in the 1940 Act (the “Independent Trustees”), reviewed and approved for Wells Fargo Heritage Money Market Fund (the “Fund”): (i) an investment management agreement (the “Management Agreement”) with Wells Fargo Funds Management, LLC (“Funds Management”); (ii) an investment sub-advisory agreement with Wells Capital Management Incorporated (“WellsCap”), an affiliate of Funds Management; and (iii) an investment sub-advisory agreement with Wells Fargo Bank, N.A. d/b/a Wells Capital Management Singapore (“WellsCap Singapore”), an affiliate of Funds Management. The sub-advisory agreements with WellsCap and WellsCap Singapore (the “Sub-Advisers”) are collectively referred to as the Sub-Advisory Agreements, and the Management Agreement and the Sub-Advisory Agreements are collectively referred to as the “Advisory Agreements.”
At the Meeting, the Board considered the factors and reached the conclusions described below relating to the selection of Funds Management and the Sub-Advisers and the approval of the Advisory Agreements. Prior to the Meeting, including at an in-person meeting in April 2018, the Trustees conferred extensively among themselves and with representatives of Funds Management about these matters. Also, the Board has adopted a team-based approach, with each team consisting of a sub-set of Trustees, to assist the full Board in the discharge of its duties in reviewing investment performance and other matters throughout the year. The Independent Trustees were assisted in their evaluation of the Advisory Agreements by independent legal counsel, from whom they received separate legal advice and with whom they met separately.
In providing information to the Board, Funds Management and the Sub-Advisers were guided by a detailed set of requests for information submitted to them by independent legal counsel on behalf of the Independent Trustees at the start of the Board’s annual contract renewal process earlier in 2018. In considering and approving the Advisory Agreements, the Trustees considered the information they believed relevant, including but not limited to the information discussed below. The Board considered not only the specific information presented in connection with the Meeting, but also the knowledge gained over time through interaction with Funds Management and the Sub-Advisers about various topics. In this regard, the Board reviewed reports of Funds Management at each of its quarterly meetings, which included, among other things, portfolio reviews and investment performance reports. In addition, the Board and the teams mentioned above confer with portfolio managers at various times throughout the year. The Board did not identify any particular information or consideration that was all-important or controlling, and each individual Trustee may have attributed different weights to various factors.
After its deliberations, the Board unanimously approved the continuation of the Advisory Agreements for a one-year term and determined that the compensation payable to Funds Management and the Sub-Advisers under each of the Advisory Agreements was reasonable. The Board considered the approval of the Advisory Agreements for the Fund as part of its consideration of agreements for funds across the complex, but its approvals were made on a fund-by-fund basis. The following summarizes a number of important, but not necessarily all, factors considered by the Board in support of its approvals.
Nature, extent and quality of services
The Board received and considered various information regarding the nature, extent and quality of services provided to the Fund by Funds Management and the Sub-Advisers under the Advisory Agreements. This information included a description of the investment advisory services and Fund-level administrative services covered by the Management Agreement, as well as, among other things, a summary of the background and experience of senior management of Wells Fargo Asset Management (“WFAM”), of which Funds Management and the Sub-Advisers are a part, a summary of investments made in the business of WFAM, a summary of certain organizational and personnel changes involving Funds Management and the Sub-Advisers, and a description of Funds Management’s and the Sub-Advisers’ business continuity planning programs and of their approaches to data privacy and cybersecurity. The Board also considered the qualifications, background, tenure and responsibilities of each of the portfolio managers primarily responsible for the day-to-day portfolio management of the Fund.
The Board evaluated the ability of Funds Management and the Sub-Advisers to attract and retain qualified investment professionals, including research, advisory and supervisory personnel. The Board further considered the compliance
| | | | |
| 32 | | Wells Fargo Heritage Money Market Fund | | Other information (unaudited) |
programs and compliance records of Funds Management and the Sub-Advisers. In addition, the Board took into account the full range of services provided to the Fund by Funds Management and its affiliates.
Fund investment performance and expenses
The Board considered the investment performance results for the Fund over various time periods ended December 31, 2017. The Board considered these results in comparison to the investment performance of funds in a universe that was determined by Broadridge Inc. (“Broadridge”) to be similar to the Fund (the “Universe”), and to other comparative data. Broadridge is an independent provider of investment company data. The Board received a description of the methodology used by Broadridge to select the mutual funds in the investment performance Universe. The Board noted that the investment performance of the Fund (Administrator Class) was higher than, equal to, or in range of the average investment performance of the Universe for all periods under review.
The Board also received and considered information regarding the Fund’s net operating expense ratios and their various components, including actual management fees, custodian and other non-management fees, and Rule 12b-1 and non-Rule 12b-1 shareholder service fees. The Board considered these ratios in comparison to the median ratios of funds in class-specific expense groups that were determined by Broadridge to be similar to the Fund (the “Groups”). The Board received a description of the methodology used by Broadridge to select the mutual funds in the expense Groups and an explanation of how funds comprising expense groups and their expense ratios may vary from year-to-year. Based on the Broadridge reports, the Board noted that the net operating expense ratios of the Fund were lower than or in range of the median net operating expense ratios of the expense Groups for all share classes.
The Board took into account the Fund’s investment performance and expense information provided to it among the factors considered in deciding to re-approve the Advisory Agreements.
Investment management and sub-advisory fee rates
The Board reviewed and considered the contractual fee rates payable by the Fund to Funds Management under the Management Agreement, as well as the contractual fee rates payable by the Fund to Funds Management for class-level administrative services under a Class-Level Administration Agreement, which include, among other things, class-level transfer agency and sub-transfer agency costs (collectively, the “Management Rates”). The Board also reviewed and considered the contractual investment sub-advisory fee rates that are payable by Funds Management to the Sub-Advisers for investment sub-advisory services.
Among other information reviewed by the Board was a comparison of the Fund’s Management Rates with the average contractual investment management fee rates of funds in the expense Groups at a common asset level as well as transfer agency costs of the funds in the expense Groups. The Board noted that the Management Rates of the Fund were equal to or in range of the sum of these average rates for the Fund’s expense Groups for all share classes.
The Board also received and considered information about the portion of the total management fee that was retained by Funds Management after payment of the fee to the Sub-Advisers for sub-advisory services. In assessing the reasonableness of this amount, the Board received and evaluated information about the nature and extent of responsibilities retained and risks assumed by Funds Management and not delegated to or assumed by the Sub-Advisers, and about Funds Management’s on-going oversight services. Given the affiliation between Funds Management and the Sub-Advisers, the Board ascribed limited relevance to the allocation of fees between them.
Based on its consideration of the factors and information it deemed relevant, including those described here, the Board determined that the compensation payable to Funds Management under the Management Agreement and to the Sub-Advisers under the Sub-Advisory Agreements was reasonable.
Profitability
The Board received and considered information concerning the profitability of Funds Management, as well as the profitability of both WFAM and Wells Fargo & Co. (“Wells Fargo”) as a whole, from providing services to the Fund and the fund family as a whole. The Board noted that the Sub-Advisers’ profitability information with respect to providing services to the Fund was subsumed in the WFAM and Wells Fargo profitability analysis.
Funds Management reported on the methodologies and estimates used in calculating profitability, including a description of the methodology used to allocate certain expenses and recent enhancements made to the methodology. Among other things, the Board noted that the levels of profitability reported on a fund-by-fund basis varied widely, depending on factors such as the size and type of fund. Based on its review, the Board did not deem the profits reported by Funds Management, WFAM or Wells Fargo from services provided to the Fund to be at a level that would prevent it from approving the continuation of the Advisory Agreements.
| | | | | | |
| Other information (unaudited) | | Wells Fargo Heritage Money Market Fund | | | 33 | |
Economies of scale
The Board considered the extent to which Funds Management may experience economies of scale in the provision of management services, and the extent to which scale benefits, if any, would be shared with shareholders. In particular, the Board noted the existence of breakpoints in the Fund’s management fee structure, which operate generally to reduce the Fund’s expense ratios as the Fund grows in size. It considered that, for a small fund or a fund that shrinks in size, breakpoints conversely can result in higher fee levels. The Board also considered that in addition to management fee breakpoints, competitive management fee rates set at the outset without regard to breakpoints and fee waiver and expense reimbursement arrangements, as well as investments in the business intended to enhance services available to Fund shareholders, are means of sharing potential economies of scale with shareholders of the Fund.
The Board concluded that the Fund’s fee and expense arrangements, including contractual breakpoints, constituted a reasonable approach to sharing potential economies of scale with the Fund and its shareholders.
Other benefits to Funds Management and the Sub-Advisers
The Board received and considered information regarding potential “fall-out” or ancillary benefits received by Funds Management and its affiliates, including the Sub-Advisers, as a result of their relationships with the Fund. Ancillary benefits could include, among others, benefits directly attributable to other relationships with the Fund and benefits potentially derived from an increase in Funds Management’s and the Sub-Advisers’ business as a result of their relationships with the Fund. The Board noted that various affiliates of Funds Management may receive distribution-related fees, shareholder servicing payments and sub-transfer agency fees in respect of shares sold or held through them and services provided.
The Board also reviewed information about soft dollar credits earned and utilized by the Sub-Advisers, fees earned by Funds Management and WellsCap from managing a private investment vehicle for the fund family’s securities lending collateral and commissions earned by an affiliated broker from portfolio transactions.
Based on its consideration of the factors and information it deemed relevant, including those described here, the Board did not find that any ancillary benefits received by Funds Management and its affiliates, including the Sub-Advisers, were unreasonable.
Conclusion
At the Meeting, after considering the above-described factors and based on its deliberations and its evaluation of the information described above, the Board unanimously approved the continuation of the Advisory Agreements for a one-year term and determined that the compensation payable to Funds Management and the Sub-Advisers under each of the Advisory Agreements was reasonable.
This page is intentionally left blank.
This page is intentionally left blank.
This page is intentionally left blank.

For more information
More information about Wells Fargo Funds is available free upon request. To obtain literature, please write, email, visit the Fund’s website, or call:
Wells Fargo Funds
P.O. Box 219967
Kansas City, MO 64121-9967
Website: wellsfargofunds.com
Individual investors: 1-800-222-8222
Retail investment professionals: 1-888-877-9275
Institutional investment professionals: 1-866-765-0778
This report and the financial statements contained herein are submitted for the general information of the shareholders of the Fund. If this report is used for promotional purposes, distribution of the report must be accompanied or preceded by a current prospectus. Before investing, please consider the investment objectives, risks, charges, and expenses of the investment. For a current prospectus and, if available, a summary prospectus, containing this information, call 1-800-222-8222 or visit the Fund’s website at wellsfargofunds.com. Read the prospectus carefully before you invest or send money.
Wells Fargo Asset Management (WFAM) is the trade name for certain investment advisory/management firms owned by Wells Fargo & Company. These firms include but are not limited to Wells Capital Management Incorporated and Wells Fargo Funds Management, LLC. Certain products managed by WFAM entities are distributed by Wells Fargo Funds Distributor, LLC (a broker/dealer and Member FINRA).
This material is for general informational and educational purposes only and is NOT intended to provide investment advice or a recommendation of any kind—including a recommendation for any specific investment, strategy, or plan.
NOT FDIC INSURED ◾ NO BANK GUARANTEE ◾ MAY LOSE VALUE
© 2018 Wells Fargo Funds Management, LLC. All rights reserved.
| | |
 | | 314808 09-18 SA304/SAR304 07-18 |
Semi-Annual Report
July 31, 2018

Institutional Money Market Funds

| ∎ | | Wells Fargo Municipal Cash Management Money Market Fund |

Reduce clutter. Save trees.
Sign up for electronic delivery of prospectuses and shareholder reports at wellsfargo.com/advantagedelivery
Contents
The views expressed and any forward-looking statements are as of July 31, 2018, unless otherwise noted, and are those of the Fund managers and/or Wells Fargo Funds Management, LLC. Discussions of individual securities, or the markets generally, or any Wells Fargo Fund are not intended as individual recommendations. Future events or results may vary significantly from those expressed in any forward-looking statements. The views expressed are subject to change at any time in response to changing circumstances in the market. Wells Fargo Funds Management, LLC and the Fund disclaim any obligation to publicly update or revise any views expressed or forward-looking statements.
NOT FDIC INSURED ◾ NO BANK GUARANTEE ◾ MAY LOSE VALUE
| | | | |
| 2 | | Wells Fargo Municipal Cash Management Money Market Fund | | Letter to shareholders (unaudited) |

Andrew Owen
President
Wells Fargo Funds
Yields on money market funds benefited during the period.
During February 2018, the U.S. stock market endured a loss of more than 10% before recovering in March and April.
Dear Shareholder:
We are pleased to offer you this semi-annual report for the Wells Fargo Municipal Cash Management Money Market Fund for the six-month period that ended July 31, 2018. Yields on money market funds benefited during the period. As the U.S. Federal Reserve (the Fed) moved toward a more normalized monetary policy after an extended term of low interest rates following the global financial crisis during 2007 and 2008, its steady pace of interest rate increases helped raise yields on short-term money market instruments.
Globally, stock markets followed a less consistent path during the period. After advancing during the summer and fall of 2017 in a roughly synchronized way, economic growth and stock markets globally diverged during the first seven months of 2018. For fixed-income investors, higher U.S. interest rates, rising inflation, and intensifying global geopolitical tensions tended to restrain taxable bond prices while high-yield and municipal bond investors generally enjoyed positive returns.
For the period, U.S. stocks, as measured by the S&P 500 Index,1 gained 0.70%, and international stocks, as measured by the MSCI ACWI ex USA Index (Net),2 fell 6.66%. Emerging market stocks, as measured by the MSCI EM Index (Net),3 dropped 11.94%. In bond markets, the Bloomberg Barclays U.S. Aggregate Bond Index4 declined 0.45% while fixed-income investments outside the U.S. fell 4.57%, according to the Bloomberg Barclays Global Aggregate ex-USD Index.5 The Bloomberg Barclays Municipal Bond added 1.18%, and the ICE BofAML U.S. High Yield Index7 was up 0.55%.
Volatility reemerged during the first quarter of 2018 as economic signals were mixed.
The first quarter of 2018 began with stock market gains in January following U.S. tax reform that lowered rates for individuals and corporations and deregulation advanced in some economic sectors. Then, investor optimism was supplanted by several concerns. Trade tensions intensified, particularly between the U.S. and China. The U.S. threatened to impose tariffs on a broad range of imported products. Increasing interest rates and inflation also caused concern. During February 2018, the U.S. stock market endured a loss of more than 10% before recovering in March and April. The S&P 500 Index closed the first quarter with a negative return, the first negative quarterly return for the index since 2014.
| 1 | The S&P 500 Index consists of 500 stocks chosen for market size, liquidity, and industry group representation. It is a market-value-weighted index with each stock’s weight in the index proportionate to its market value. You cannot invest directly in an index. |
| 2 | The Morgan Stanley Capital International (MSCI) All Country World Index (ACWI) ex USA Index (Net) is a free-float-adjusted market-capitalization-weighted index that is designed to measure the equity market performance of developed markets, excluding the United States and Canada. Source: MSCI. MSCI makes no express or implied warranties or representations and shall have no liability whatsoever with respect to any MSCI data contained herein. The MSCI data may not be further redistributed or used as a basis for other indices or any securities or financial products. This report is not approved, reviewed, or produced by MSCI. You cannot invest directly in an index. |
| 3 | The MSCI Emerging Markets (EM) Index (Net) is a free-float-adjusted market-capitalization-weighted index that is designed to measure large- and mid-cap equity market performance of emerging markets. The MSCI EM Index (Net) consists of the following 24 emerging market country indices: Brazil, Chile, China, Colombia, Czech Republic, Egypt, Greece, Hungary, India, Indonesia, Korea, Malaysia, Mexico, Pakistan, Peru, the Philippines, Poland, Qatar, Russia, South Africa, Taiwan, Thailand, Turkey, and the United Arab Emirates. You cannot invest directly in an index. |
| 4 | The Bloomberg Barclays U.S. Aggregate Bond Index is a broad-based benchmark that measures the investment-grade, U.S. dollar-denominated, fixed-rate taxable bond market, including Treasuries, government-related and corporate securities, mortgage-backed securities (agency fixed-rate and hybrid adjustable-rate mortgage pass-throughs), asset-backed securities, and commercial mortgage-backed securities. You cannot invest directly in an index. |
| 5 | The Bloomberg Barclays Global Aggregate ex-USD Index is an unmanaged index that provides a broad-based measure of the global investment-grade fixed-income markets excluding the U.S. dollar-denominated debt market. You cannot invest directly in an index. |
| 6 | The Bloomberg Barclays Municipal Bond Index is an unmanaged index composed of long-term tax-exempt bonds with a minimum credit rating of Baa. You cannot invest directly in an index. |
| 7 | The ICE BofAML U.S. High Yield Index is a market-capitalization-weighted index of domestic and Yankee high-yield bonds. The index tracks the performance of high-yield securities traded in the U.S. bond market. You cannot invest directly in an index. Copyright 2018. ICE Data Indices, LLC. All rights reserved. |
| 8 | The Consumer Price Index For All Urban Consumers (CPI-U) measures the changes in the price of a basket of goods and services purchased by urban consumers. The urban consumer population is deemed by many as a better representative measure of the general public because most of the country’s population lives in highly populated areas, which represent close to 90% of the total population. You cannot invest directly in an index. |
| | | | | | |
| Letter to shareholders (unaudited) | | Wells Fargo Municipal Cash Management Money Market Fund | | | 3 | |
The Fed increased the federal funds rate by 25 basis points (bps; 100 bps equal 1.00%) in March 2018 and the rate of inflation reached the Fed’s 2% target for the first time in a year. The unemployment rate fell to 4.1%. The third revision of first-quarter gross domestic product (GDP) growth by the U.S. Bureau of Economic Analysis released during June 2018 was lowered to 2.0%.
Overseas, investment market returns reversed the strong returns of 2017. After having gained 27.19% for the 12-month period that ended on December 31, 2017, the MSCI ACWI ex USA Index (Net) fell 1.46% for the seven-month period that ended July 31, 2018. The U.S. dollar strengthened relative to local currencies, which served to restrain returns.
Global trade tensions escalated during the second quarter and into the third quarter of 2018.
Global trade tensions escalated as the second quarter of 2018 opened and equity markets fell in response before resuming upward momentum later in April. The U.S. government imposed tariffs on products and commodities imported from other markets in North America, Europe, and Asia. In retaliation, governments imposed tariffs on U.S. products and commodities. In addition, the U.S. pushed its North American neighbors to renegotiate the North American Free Trade Agreement, furthering trade tensions and investor uncertainty.
The CPI-U8 added 0.2% in May after a similar increase in April. On a year-over-year basis, the all-items index rose 2.8% for the 12 months that ended May 31, continuing its upward trend since the beginning of the year. The index for all items less food and energy rose 2.2% for the same 12-month period. Interest rates generally increased and the bond markets tended to decline.
During June 2018, the Fed increased the federal funds rate by 25 bps. Investment markets began to anticipate two more rate increases in 2018. Long-term interest rates in the U.S. trended higher—rates on the 10-year and 30-year Treasury bonds moved from 2.46% and 2.81%, respectively, on January 1, 2018, to 2.96% and 3.08%, respectively, on July 31, 2018. While higher at the end of the period, rates were off their peak levels on May 17, 2018, of 3.11% and 3.25%, respectively. Investors became more aware of and concerned about the potential for an inverted yield curve—sometimes a recession signal—as short-term rates increased more quickly than long-term rates.
The unemployment rate fell to 3.9% in July after ticking up slightly in June from May’s 3.8% level, according to the U.S. Department of Labor. The annualized rate of GDP growth for the second quarter of 2018 was reported in July to be 4.1%, the highest level since the third quarter of 2014, according to the U.S. Bureau of Economic Analysis.
Internationally, the prospects for a smooth U.K. Brexit agreement was cast into doubt as members of Prime Minister Theresa May’s negotiating team resigned. Despite the uncertainty, the period closed with expectations that the Bank of England’s Monetary Policy Committee in July would announce an increase in its key interest rate to 0.75%, which it did in early August.
Meanwhile, central banks in Europe and Japan maintained low interest rates and accommodative monetary policies. Amid rising trade uncertainty, People’s Bank of China monetary policies shifted with cuts to reserve requirement ratios and implementation of supportive measures such as accelerated infrastructure spending and tax cuts for small and medium enterprises and for individuals. Nevertheless, a strengthening U.S. dollar and the tensions associated with trade policies remained headwinds for investors overseas.
| | | | |
| 4 | | Wells Fargo Municipal Cash Management Money Market Fund | | Letter to shareholders (unaudited) |
Don’t let short-term uncertainty derail long-term investment goals.
Periods of investment uncertainty can present challenges, but experience has taught us that maintaining long-term investment goals can be an effective way to plan for the future. To help you create a sound strategy based on your personal goals and risk tolerance, Wells Fargo Funds offers more than 100 mutual funds spanning a wide range of asset classes and investment styles. Although diversification cannot guarantee an investment profit or prevent losses, we believe it can be an effective way to manage investment risk and potentially smooth out overall portfolio performance. We encourage investors to know their investments and to understand that appropriate levels of risk-taking may unlock opportunities.
Thank you for choosing to invest with Wells Fargo Funds. We appreciate your confidence in us and remain committed to helping you meet your financial needs.
Sincerely,

Andrew Owen
President
Wells Fargo Funds
For further information about your Fund, contact your investment professional, visit our website at wellsfargofunds.com, or call us directly at 1-800-222-8222.
This page is intentionally left blank.
| | | | |
| 6 | | Wells Fargo Municipal Cash Management Money Market Fund | | Performance highlights (unaudited) |
Investment objective
The Fund seeks current income exempt from regular federal income tax, while preserving capital and liquidity.
Manager
Wells Fargo Funds Management, LLC
Subadviser
Wells Capital Management Incorporated
Portfolio managers
James Randazzo
Jeffrey L. Weaver, CFA®
Average annual total returns (%) as of July 31, 20181
| | | | | | | | | | | | | | | | | | | | | | |
| | | | | | | | Expense ratios2 (%) | |
| | | Inception date | | 1 year | | | 5 year | | | 10 year | | | Gross | | | Net3 | |
| Administrator Class (WUCXX) | | 7-9-2010 | | | 0.96 | | | | 0.34 | | | | 0.35 | | | | 0.41 | | | | 0.30 | |
| Institutional Class (EMMXX) | | 11-20-1996 | | | 1.06 | | | | 0.39 | | | | 0.39 | | | | 0.29 | | | | 0.20 | |
| Service Class (EISXX) | | 11-25-1996 | | | 0.81 | | | | 0.27 | | | | 0.27 | | | | 0.58 | | | | 0.45 | |
Yield summary (%) as of July 31, 20183
| | | | | | | | | | |
| | | Administrator
Class | | Institutional
Class | | | Service
Class | |
| 7-day current yield | | 0.85 | | | 0.95 | | | | 0.70 | |
| 7-day compound yield | | 0.86 | | | 0.96 | | | | 0.70 | |
| 30-day simple yield | | 0.90 | | | 1.00 | | | | 0.75 | |
| 30-day compound yield | | 0.90 | | | 1.00 | | | | 0.75 | |
Figures quoted represent past performance, which is no guarantee of future results, and do not reflect taxes that a shareholder may pay on fund distributions or the redemption of fund shares. Investment returns will fluctuate. The Fund’s yield figures more closely reflect the current earnings of the Fund than the total return figures. Current performance may be lower or higher than the performance data quoted, which assumes the reinvestment of dividends and capital gains. Current month-end performance is available on the Fund’s website, wellsfargofunds.com.
Each class is sold without a front-end sales charge or contingent deferred sales charge.
For floating NAV money market funds: You could lose money by investing in the Fund. Because the share price of the Fund will fluctuate, when you sell your shares they may be worth more or less than what you originally paid for them. The Fund may impose a fee upon sale of your shares or may temporarily suspend your ability to sell shares if the Fund’s liquidity falls below required minimums because of market conditions or other factors. An investment in the Fund is not insured or guaranteed by the Federal Deposit Insurance Corporation or any other government agency. The Fund’s sponsor has no legal obligation to provide financial support to the Fund, and you should not expect that the sponsor will provide financial support to the Fund at any time.
Please see footnotes on page 7.
| | | | | | |
| Performance highlights (unaudited) | | Wells Fargo Municipal Cash Management Money Market Fund | | | 7 | |
|
| Revenue source distribution as of July 31, 20184 |
|
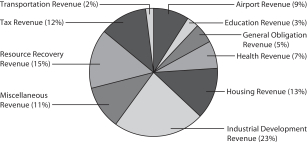 |
|
| Effective maturity distribution as of July 31, 20184 |
|
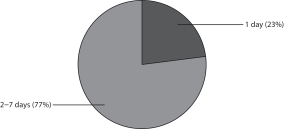
|
|
| Weighted average maturity as of July 31, 20185 |
6 Days |
|
| Weighted average life as of July 31, 20186 |
6 Days |
| 1 | Historical performance shown for Administrator Class shares prior to their inception reflects the performance of Institutional Class shares, and has not been adjusted to include the higher expenses applicable to Administrator Class shares. If these expenses had been included, returns for Administrator Class shares would be lower. Historical performance shown for all classes of the Fund prior to July 12, 2010, is based on the performance of the Fund’s predecessor, Evergreen Institutional Municipal Money Market Fund. |
| 2 | Reflects the expense ratios as stated in the most recent prospectuses. The expense ratios shown are subject to change and may differ from the annualized expense ratios shown in the financial highlights of this report. |
| 3 | The manager has contractually committed through May 31, 2019, to waive fees and/or reimburse expenses to the extent necessary to cap the Fund’s Total Annual Fund Operating Expenses After Fee Waivers at the amounts shown. After this time, the cap may be increased or the commitment to maintain the cap may be terminated only with the approval of the Board of Trustees. Brokerage commissions, stamp duty fees, interest, taxes, acquired fund fees and expenses (if any), and extraordinary expenses are excluded from the expense cap. Without this cap, the Fund’s returns would have been lower. Without waived fees and/or reimbursed expenses, the Fund’s 7-day current yield would have been 0.70%, 0.82%, and 0.53% for Administrator Class, Institutional Class, and Service Class, respectively. The expense ratio paid by an investor is the net expense ratio (the total annual fund operating expenses after fee waivers) as stated in the prospectuses. |
| 4 | Amounts are calculated based on the total investments of the Fund. These amounts are subject to change and may have changed since the date specified. |
| 5 | Weighted Average Maturity (WAM): WAM is an average of the effective maturities of all securities held in the portfolio, weighted by each security’s percentage of total investments. The maturity of a portfolio security is the period remaining until the date on which the principal amount is unconditionally required to be paid, or in the case of a security called for redemption, the date on which the redemption payment is unconditionally required to be made. WAM calculations allow for the maturities of certain securities with demand features or periodic interest rate resets to be shortened. WAM is a way to measure a fund’s sensitivity to potential interest rate changes. WAM is subject to change and may have changed since the date specified. |
| 6 | Weighted Average Life (WAL): WAL is an average of the final maturities of all securities held in the portfolio, weighted by their percentage of total investments. The maturity of a portfolio security is the period remaining until the date on which the principal amount is unconditionally required to be paid, or in the case of a security called for redemption, the date on which the redemption payment is unconditionally required to be made. In contrast to WAM, the calculation of WAL allows for the maturities of certain securities with demand features to be shortened, but not the periodic interest rate resets. WAL is a way to measure a fund’s potential sensitivity to credit spread changes. WAL is subject to change and may have changed since the date specified. |
| | | | |
| 8 | | Wells Fargo Municipal Cash Management Money Market Fund | | Fund expenses (unaudited) |
As a shareholder of the Fund, you incur ongoing costs, including management fees, shareholder servicing fees, and other Fund expenses. This example is intended to help you understand your ongoing costs (in dollars) of investing in the Fund and to compare these costs with the ongoing costs of investing in other mutual funds.
The example is based on an investment of $1,000 invested at the beginning of the six-month period and held for the entire period from February 1, 2018 to July 31, 2018.
Actual expenses
The “Actual” line of the table below provides information about actual account values and actual expenses. You may use the information in this line, together with the amount you invested, to estimate the expenses that you paid over the period. Simply divide your account value by $1,000 (for example, an $8,600 account value divided by $1,000 = 8.6), then multiply the result by the number in the “Actual” line under the heading entitled “Expenses paid during period” for your applicable class of shares to estimate the expenses you paid on your account during this period.
Hypothetical example for comparison purposes
The “Hypothetical” line of the table below provides information about hypothetical account values and hypothetical expenses based on the Fund’s actual expense ratio and an assumed rate of return of 5% per year before expenses, which is not the Fund’s actual return. The hypothetical account values and expenses may not be used to estimate the actual ending account balance or expenses you paid for the period. You may use this information to compare the ongoing costs of investing in the Fund and other funds. To do so, compare this 5% hypothetical example with the 5% hypothetical examples that appear in the shareholder reports of the other funds.
Please note that the expenses shown in the table are meant to highlight your ongoing costs only. Therefore, the “Hypothetical” line of the table is useful in comparing ongoing costs only and will not help you determine the relative total costs of owning different funds.
| | | | | | | | | | | | | | | | |
| | | Beginning
account value
2-1-2018 | | | Ending
account value
7-31-2018 | | | Expenses
paid during
the period¹ | | | Annualized net
expense ratio | |
Administrator Class | | | | | | | | | | | | | | | | |
Actual | | $ | 1,000.00 | | | $ | 1,005.56 | | | $ | 1.52 | | | | 0.30 | % |
Hypothetical (5% return before expenses) | | $ | 1,000.00 | | | $ | 1,023.69 | | | $ | 1.53 | | | | 0.30 | % |
Institutional Class | | | | | | | | | | | | | | | | |
Actual | | $ | 1,000.00 | | | $ | 1,006.05 | | | $ | 1.01 | | | | 0.20 | % |
Hypothetical (5% return before expenses) | | $ | 1,000.00 | | | $ | 1,024.20 | | | $ | 1.02 | | | | 0.20 | % |
Service Class | | | | | | | | | | | | | | | | |
Actual | | $ | 1,000.00 | | | $ | 1,004.81 | | | $ | 2.27 | | | | 0.45 | % |
Hypothetical (5% return before expenses) | | $ | 1,000.00 | | | $ | 1,022.94 | | | $ | 2.29 | | | | 0.45 | % |
| 1 | Expenses paid is equal to the annualized net expense ratio of each class multiplied by the average account value over the period, multiplied by the number of days in the most recent fiscal half-year divided by the number of days in the fiscal year (to reflect the one-half-year period). |
| | | | | | |
| Portfolio of investments—July 31, 2018 (unaudited) | | Wells Fargo Municipal Cash Management Money Market Fund | | | 9 | |
| | | | | | | | | | | | | | | | |
| Security name | | Interest rate | | | Maturity date | | | Principal | | | Value | |
| | | | |
Municipal Obligations: 88.93% | | | | | | | | | | | | | | | | |
| | | | |
Arizona: 6.37% | | | | | | | | | | | | | | | | |
| | | | |
| Variable Rate Demand Notes ø: 6.37% | | | | | | | | | | | | | | | | |
Arizona Tender Option Bond Trust Receipts/Certificates Series 2017-XM0563 (Miscellaneous Revenue, Royal Bank of Canada LIQ) 144A | | | 1.01 | % | | | 7-1-2025 | | | $ | 5,400,000 | | | $ | 5,400,000 | |
Maricopa County AZ IDA Solid Waste Disposal Series 2006 (Resource Recovery Revenue, Farm Credit Services America LOC) | | | 1.05 | | | | 8-1-2026 | | | | 2,500,000 | | | | 2,500,000 | |
Pinal County AZ IDA Shamrock Farms Project (Resource Recovery Revenue, Farm Credit Services America LOC) | | | 1.07 | | | | 8-1-2022 | | | | 3,700,000 | | | | 3,700,000 | |
Pinal County AZ IDA Solid Waste Disposal Feenstra Investments LLC Project Series 2002 (Resource Recovery Revenue, Farm Credit Services America LOC) | | | 1.07 | | | | 8-1-2027 | | | | 1,250,000 | | | | 1,250,000 | |
| | | | |
| | | | | | | | | | | | | | | 12,850,000 | |
| | | | | | | | | | | | | | | | |
| | | | |
California: 3.74% | | | | | | | | | | | | | | | | |
| | | | |
| Variable Rate Demand Notes ø: 3.74% | | | | | | | | | | | | | | | | |
California PCFA Solid Waste Milk Time Dairy Farms Project (Resource Recovery Revenue, Rabobank LOC) | | | 1.07 | | | | 11-1-2027 | | | | 1,400,000 | | | | 1,400,000 | |
California Tender Option Bond Trust Receipts/Certificates Series 2018-ZM0642 (Airport Revenue, JPMorgan Chase & Company LIQ) 144A | | | 1.14 | | | | 5-1-2024 | | | | 4,360,000 | | | | 4,360,000 | |
Modesto CA MFHR Live Oak Apartments Project (Housing Revenue, FNMA Insured, FNMA LIQ) | | | 0.78 | | | | 9-15-2024 | | | | 1,775,000 | | | | 1,775,000 | |
| | | | |
| | | | | | | | | | | | | | | 7,535,000 | |
| | | | | | | | | | | | | | | | |
| | | | |
Colorado: 0.69% | | | | | | | | | | | | | | | | |
| | | | |
| Variable Rate Demand Notes ø: 0.69% | | | | | | | | | | | | | | | | |
Arapahoe County CO Cottrell Printing Project (Industrial Development Revenue, U.S. Bank NA LOC) | | | 1.09 | | | | 10-1-2019 | | | | 645,000 | | | | 645,000 | |
Town of Hudson CO Series A (Industrial Development Revenue, U.S. Bank NA LOC) | | | 1.14 | | | | 11-1-2020 | | | | 735,000 | | | | 735,000 | |
| | | | |
| | | | | | | | | | | | | | | 1,380,000 | |
| | | | | | | | | | | | | | | | |
| | | | |
Florida: 3.55% | | | | | | | | | | | | | | | | |
| | | | |
| Variable Rate Demand Notes ø: 3.55% | | | | | | | | | | | | | | | | |
Florida Tender Option Bond Trust Receipts/Certificates Series 2016-ZF0286 (Airport Revenue, AGC Insured, TD Bank NA LIQ) 144A | | | 1.29 | | | | 10-1-2038 | | | | 6,655,000 | | | | 6,655,000 | |
Florida Tender Option Bond Trust Receipts/Certificates Series 2017-ZM0571 (Health Revenue, Morgan Stanley Bank LIQ) 144A | | | 1.04 | | | | 8-15-2047 | | | | 500,000 | | | | 500,000 | |
| | | | |
| | | | | | | | | | | | | | | 7,155,000 | |
| | | | | | | | | | | | | | | | |
| | | | |
Illinois: 11.15% | | | | | | | | | | | | | | | | |
| | | | |
| Variable Rate Demand Notes ø: 11.15% | | | | | | | | | | | | | | | | |
Chicago IL Enterprise Zone Gardner Gibson Project (Industrial Development Revenue, BMO Harris Bank NA LOC) | | | 1.05 | | | | 7-1-2033 | | | | 1,780,000 | | | | 1,780,000 | |
Illinois Finance Authority Northwestern Memorial Hospital Series 2007A-3 (Health Revenue, JPMorgan Chase & Company SPA) | | | 1.50 | | | | 8-15-2042 | | | | 4,000,000 | | | | 4,000,000 | |
Lake County IL Multi-Family Housing (Housing Revenue, FHLMC LIQ) | | | 1.06 | | | | 11-1-2034 | | | | 5,035,000 | | | | 5,035,000 | |
Peoria County IL Caterpillar Incorporated Project (Industrial Development Revenue, Caterpillar Incorporated LOC) | | | 1.16 | | | | 2-1-2030 | | | | 4,300,000 | | | | 4,300,000 | |
Southwestern IL Development Authority Solid Waste Disposal Center Ethanol Series B (Resource Recovery Revenue, Reliance Bank LOC) | | | 1.07 | | | | 1-1-2033 | | | | 7,370,000 | | | | 7,370,000 | |
| | | | |
| | | | | | | | | | | | | | | 22,485,000 | |
| | | | | | | | | | | | | | | | |
The accompanying notes are an integral part of these financial statements.
| | | | |
| 10 | | Wells Fargo Municipal Cash Management Money Market Fund | | Portfolio of investments—July 31, 2018 (unaudited) |
| | | | | | | | | | | | | | | | |
| Security name | | Interest rate | | | Maturity date | | | Principal | | | Value | |
| | | | |
Indiana: 3.98% | | | | | | | | | | | | | | | | |
| | | | |
| Variable Rate Demand Notes ø: 3.98% | | | | | | | | | | | | | | | | |
Indiana Certificate of Participation Clipper Tax-Exempt Certificate Trust Series 2009-34 (Miscellaneous Revenue, State Street Bank & Trust Company LIQ) | | | 0.98 | % | | | 7-1-2023 | | | $ | 1,380,000 | | | $ | 1,380,000 | |
Indiana Finance Authority Duke Energy Indiana Incorporated Series 2009A-4 (Industrial Development Revenue, Sumitomo Mitsui Banking LOC) | | | 1.45 | | | | 12-1-2039 | | | | 1,000,000 | | | | 1,000,000 | |
Jeffersonville IN Economic Development Eagle Steel Products Incorporated Project (Industrial Development Revenue, Bank of America NA LOC) | | | 1.31 | | | | 12-1-2027 | | | | 3,015,000 | | | | 3,015,000 | |
Noblesville IN Greystone Apartments Project Series B (Housing Revenue, FHLB LOC) | | | 1.00 | | | | 3-1-2041 | | | | 1,395,000 | | | | 1,395,000 | |
St. Joseph County IN Midcorr Land Development LLC Project (Industrial Development Revenue, PNC Bank NA LOC) | | | 1.05 | | | | 10-1-2023 | | | | 1,230,000 | | | | 1,230,000 | |
| | | | |
| | | | | | | | | | | | | | | 8,020,000 | |
| | | | | | | | | | | | | | | | |
| | | | |
Iowa: 1.03% | | | | | | | | | | | | | | | | |
| | | | |
| Variable Rate Demand Note ø: 1.03% | | | | | | | | | | | | | | | | |
Iowa Finance Authority John Maassen & Sons Project (Industrial Development Revenue, Farm Credit Services America LOC) | | | 1.05 | | | | 11-1-2035 | | | | 2,075,000 | | | | 2,075,000 | |
| | | | | | | | | | | | | | | | |
| | | | |
Kansas: 0.44% | | | | | | | | | | | | | | | | |
| | | | |
| Variable Rate Demand Note ø: 0.44% | | | | | | | | | | | | | | | | |
Nemaha County KS Midwest AG Services LLC Project (Industrial Development Revenue, CoBank ACB LOC) | | | 1.07 | | | | 11-1-2020 | | | | 890,000 | | | | 890,000 | |
| | | | | | | | | | | | | | | | |
| | | | |
Kentucky: 0.62% | | | | | | | | | | | | | | | | |
| | | | |
| Variable Rate Demand Note ø: 0.62% | | | | | | | | | | | | | | | | |
Jefferson County KY Industrial Building Dant Growth LLC Project Series 2002 (Industrial Development Revenue, Stock Yards Bank & Trust LOC) | | | 1.05 | | | | 9-1-2022 | | | | 1,250,000 | | | | 1,250,000 | |
| | | | | | | | | | | | | | | | |
| | | | |
Louisiana: 1.98% | | | | | | | | | | | | | | | | |
| | | | |
| Variable Rate Demand Note ø: 1.98% | | | | | | | | | | | | | | | | |
Louisiana Local Government Environmental Facilities CDA Honeywell International Incorporated Project (Industrial Development Revenue, Honeywell International Incorporated LOC) | | | 1.11 | | | | 12-1-2036 | | | | 4,000,000 | | | | 4,000,000 | |
| | | | | | | | | | | | | | | | |
| | | | |
Michigan: 4.28% | | | | | | | | | | | | | | | | |
| | | | |
| Variable Rate Demand Notes ø: 4.28% | | | | | | | | | | | | | | | | |
Michigan Strategic Fund Limited Obligation Series 1982 (Resource Recovery Revenue, Farm Credit Services America LOC) | | | 1.05 | | | | 6-1-2024 | | | | 2,800,000 | | | | 2,800,000 | |
Michigan Tender Option Bond Trust Receipts/Certificates
Series 2018-ZM0614 (Education Revenue, Morgan Stanley Bank LIQ) 144A | | | 1.12 | | | | 11-1-2028 | | | | 5,835,000 | | | | 5,835,000 | |
| | | | |
| | | | | | | | | | | | | | | 8,635,000 | |
| | | | | | | | | | | | | | | | |
| | | | |
Minnesota: 0.37% | | | | | | | | | | | | | | | | |
| | | | |
| Variable Rate Demand Note ø: 0.37% | | | | | | | | | | | | | | | | |
Forest Lake MN Kilkenny Court Apartments Project Series 2008 (Housing Revenue, FNMA LOC, FNMA LIQ) | | | 1.03 | | | | 8-15-2038 | | | | 750,000 | | | | 750,000 | |
| | | | | | | | | | | | | | | | |
The accompanying notes are an integral part of these financial statements.
| | | | | | |
| Portfolio of investments—July 31, 2018 (unaudited) | | Wells Fargo Municipal Cash Management Money Market Fund | | | 11 | |
| | | | | | | | | | | | | | | | |
| Security name | | Interest rate | | | Maturity date | | | Principal | | | Value | |
| | | | |
Mississippi: 2.63% | | | | | | | | | | | | | | | | |
| | | | |
| Variable Rate Demand Notes ø: 2.63% | | | | | | | | | | | | | | | | |
Mississippi Business Finance Commission Gulf Opportunity Zone Chevron USA Incorporated Project Series E (Industrial Development Revenue) | | | 1.52 | % | | | 12-1-2030 | | | $ | 4,310,000 | | | $ | 4,310,000 | |
Mississippi Series A Clipper Tax Exempt Trust Receipts/Certificates Series 2009-60 (Miscellaneous Revenue, State Street Bank & Trust Company LIQ) | | | 0.99 | | | | 11-1-2018 | | | | 1,000,000 | | | | 1,000,000 | |
| | | | |
| | | | | | | | | | | | | | | 5,310,000 | |
| | | | | | | | | | | | | | | | |
| | | | |
Missouri: 0.64% | | | | | | | | | | | | | | | | |
| | | | |
| Variable Rate Demand Note ø: 0.64% | | | | | | | | | | | | | | | | |
St. Charles County MO IDA Kuenz Heating & Sheet Metal Series 2001 (Industrial Development Revenue, U.S. Bank NA LOC) | | | 1.16 | | | | 4-1-2026 | | | | 1,290,000 | | | | 1,290,000 | |
| | | | | | | | | | | | | | | | |
| | | | |
Nebraska: 2.91% | | | | | | | | | | | | | | | | |
| | | | |
| Variable Rate Demand Note ø: 2.91% | | | | | | | | | | | | | | | | |
Nebraska Tender Option Bond Trust Receipts/Certificates Series XM0184 (Airport Revenue, AGC Insured, Bank of America NA LIQ) 144A | | | 1.09 | | | | 10-1-2033 | | | | 5,865,000 | | | | 5,865,000 | |
| | | | | | | | | | | | | | | | |
| | | | |
Nevada: 1.65% | | | | | | | | | | | | | | | | |
| | | | |
| Variable Rate Demand Note ø: 1.65% | | | | | | | | | | | | | | | | |
Nevada Tender Option Bond Trust Receipts/Certificates Series 2018-ZM0634 (GO Revenue, Royal Bank of Canada LIQ) 144A | | | 0.97 | | | | 12-1-2025 | | | | 3,330,000 | | | | 3,330,000 | |
| | | | | | | | | | | | | | | | |
| | | | |
New York: 10.71% | | | | | | | | | | | | | | | | |
| | | | |
| Variable Rate Demand Notes ø: 10.71% | | | | | | | | | | | | | | | | |
New York Battery Park City Authority Refunding Bond Series 2013-C JPMorgan Chase PUTTER/DRIVER Trust Series 5012 (Miscellaneous Revenue, JPMorgan Chase & Company LOC, JPMorgan Chase & Company LIQ) 144A | | | 1.54 | | | | 11-1-2019 | | | | 7,000,000 | | | | 7,000,000 | |
New York Homeowner Mortgage Agency Series 210 (Housing Revenue, Barclays Bank plc SPA) | | | 1.00 | | | | 10-1-2039 | | | | 3,500,000 | | | | 3,500,000 | |
New York NY Transitional Finance Authority Future Tax Secured Tax-Exempt Bond Fiscal 2015 Subordinate Bonds Series A-3 (Tax Revenue, Mizuho Bank Limited SPA) | | | 1.51 | | | | 8-1-2043 | | | | 6,100,000 | | | | 6,100,000 | |
Triborough Bridge and Tunnel Authority Series 2005B-3 (Transportation Revenue, State Street Bank & Trust Company LOC) | | | 1.40 | | | | 1-1-2032 | | | | 5,000,000 | | | | 5,000,000 | |
| | | | |
| | | | | | | | | | | | | | | 21,600,000 | |
| | | | | | | | | | | | | | | | |
| | | | |
North Carolina: 0.77% | | | | | | | | | | | | | | | | |
| | | | |
| Variable Rate Demand Note ø: 0.77% | | | | | | | | | | | | | | | | |
Rockingham County NC Industrial Facilities & PCFA Innofa USA Project Series 2007 (Industrial Development Revenue, Branch Banking & Trust LOC) | | | 1.00 | | | | 1-1-2027 | | | | 1,550,000 | | | | 1,550,000 | |
| | | | | | | | | | | | | | | | |
| | | | |
North Dakota: 0.46% | | | | | | | | | | | | | | | | |
| | | | |
| Variable Rate Demand Note ø: 0.46% | | | | | | | | | | | | | | | | |
Mandan ND IDA Cloverdale Foods Company Project (Industrial Development Revenue, BNC National Bank LOC) | | | 1.14 | | | | 12-1-2022 | | | | 935,000 | | | | 935,000 | |
| | | | | | | | | | | | | | | | |
| | | | |
Ohio: 1.04% | | | | | | | | | | | | | | | | |
| | | | |
| Variable Rate Demand Note ø: 1.04% | | | | | | | | | | | | | | | | |
Montgomery County OH Catholic Health Initiatives Series A (Health Revenue, Morgan Stanley Bank LIQ) 144A | | | 1.16 | | | | 5-1-2034 | | | | 2,100,000 | | | | 2,100,000 | |
| | | | | | | | | | | | | | | | |
The accompanying notes are an integral part of these financial statements.
| | | | |
| 12 | | Wells Fargo Municipal Cash Management Money Market Fund | | Portfolio of investments—July 31, 2018 (unaudited) |
| | | | | | | | | | | | | | | | |
| Security name | | Interest rate | | | Maturity date | | | Principal | | | Value | |
| | | | |
Oregon: 0.38% | | | | | | | | | | | | | | | | |
| | | | |
| Variable Rate Demand Note ø: 0.38% | | | | | | | | | | | | | | | | |
Portland OR Portland International Airport Series 18-A (Airport Revenue, Bank of China LOC) | | | 1.00 | % | | | 7-1-2026 | | | $ | 755,000 | | | $ | 755,000 | |
| | | | | | | | | | | | | | | | |
| | | | |
Other: 3.95% | | | | | | | | | | | | | | | | |
| | | | |
| Variable Rate Demand Notes ø: 3.95% | | | | | | | | | | | | | | | | |
Clipper Tax-Exempt Certificate Trust Series 2009-54 (Miscellaneous Revenue, State Street Bank & Trust Company LIQ) | | | 0.99 | | | | 2-15-2028 | | | | 4,000,000 | | | | 4,000,000 | |
FHLMC MFHR Series M-031 Class A (Housing Revenue, FHLMC LIQ) | | | 0.97 | | | | 12-15-2045 | | | | 2,135,000 | | | | 2,135,000 | |
FHLMC MFHR Series M-033 Class A (Housing Revenue, FHLMC LIQ) | | | 0.97 | | | | 3-15-2049 | | | | 1,835,000 | | | | 1,835,000 | |
| | | | |
| | | | | | | | | | | | | | | 7,970,000 | |
| | | | | | | | | | | | | | | | |
| | | | |
Pennsylvania: 3.19% | | | | | | | | | | | | | | | | |
| | | | |
| Variable Rate Demand Notes ø: 3.19% | | | | | | | | | | | | | | | | |
Allegheny County PA Hospital Development Authority Series E (Health Revenue, Royal Bank of Canada LOC, Royal Bank of Canada LIQ) 144A | | | 1.50 | | | | 4-1-2022 | | | | 2,500,000 | | | | 2,500,000 | |
Pennsylvania EDFA Series D-7 (Industrial Development Revenue, PNC Bank NA LOC) | | | 1.05 | | | | 8-1-2022 | | | | 500,000 | | | | 500,000 | |
Pennsylvania EDFA Series G-10 (Miscellaneous Revenue, PNC Bank NA LOC) | | | 1.05 | | | | 12-1-2025 | | | | 2,000,000 | | | | 2,000,000 | |
Pennsylvania Tender Option Bond Trust Receipts/Certificates Series 2016-ZF0281 (Housing Revenue, TD Bank NA LIQ) 144A | | | 1.00 | | | | 10-1-2033 | | | | 1,435,000 | | | | 1,435,000 | |
| | | | |
| | | | | | | | | | | | | | | 6,435,000 | |
| | | | | | | | | | | | | | | | |
| | | | |
Tennessee: 2.33% | | | | | | | | | | | | | | | | |
| | | | |
| Variable Rate Demand Note ø: 2.33% | | | | | | | | | | | | | | | | |
Shelby County TN Health Educational & Housing Facilities Board Methodist Le Bonheur Series B (Health Revenue, AGM Insured, U.S. Bank NA SPA) | | | 1.44 | | | | 6-1-2042 | | | | 4,700,000 | | | | 4,700,000 | |
| | | | | | | | | | | | | | | | |
| | | | |
Texas: 11.74% | | | | | | | | | | | | | | | | |
| | | | |
| Variable Rate Demand Notes ø: 11.74% | | | | | | | | | | | | | | | | |
Brazos Harbor TX Industrial Development Corporation (Industrial Development Revenue, BASF SE LOC) | | | 1.05 | | | | 10-1-2036 | | | | 5,000,000 | | | | 5,000,000 | |
Dallam County TX Industrial Development Corporation Dalhart Jersey Ranch Incorporated Series 2008 (Resource Recovery Revenue, CoBank ACB LOC) | | | 1.05 | | | | 8-1-2039 | | | | 1,675,000 | | | | 1,675,000 | |
Dickinson TX Independent School District Unlimited Tax School House Refunding Bond Series 2000 (GO Revenue, Societe Generale LIQ) | | | 1.54 | | | | 2-15-2028 | | | | 7,000,000 | | | | 7,000,000 | |
Port Arthur TX Navigation District Jefferson County Total Petrochemicals USA Incorporated Project Series 2003-C (Industrial Development Revenue, Total SA LOC) | | | 1.00 | | | | 4-1-2027 | | | | 3,000,000 | | | | 3,000,000 | |
Port Corpus Christi TX Flint Hills Resources Project Series A (Resource Recovery Revenue, Flint Hills Resources LLC) | | | 1.08 | | | | 4-1-2028 | | | | 7,000,000 | | | | 7,000,000 | |
| | | | |
| | | | | | | | | | | | | | | 23,675,000 | |
| | | | | | | | | | | | | | | | |
| | | | |
Virginia: 0.65% | | | | | | | | | | | | | | | | |
| | | | |
| Variable Rate Demand Note ø: 0.65% | | | | | | | | | | | | | | | | |
Chesterfield County VA IDA Super Radiator Coils Project Series A (Industrial Development Revenue, Marshall & Ilsley Bank LOC) | | | 1.00 | | | | 4-1-2026 | | | | 1,300,000 | | | | 1,300,000 | |
| | | | | | | | | | | | | | | | |
The accompanying notes are an integral part of these financial statements.
| | | | | | |
| Portfolio of investments—July 31, 2018 (unaudited) | | Wells Fargo Municipal Cash Management Money Market Fund | | | 13 | |
| | | | | | | | | | | | | | | | |
| Security name | | Interest rate | | | Maturity date | | | Principal | | | Value | |
| | | | |
Washington: 3.03% | | | | | | | | | | | | | | | | |
| | | | |
| Variable Rate Demand Notes ø: 3.03% | | | | | | | | | | | | | | | | |
Washington Finance Authority Smith Brothers Farms Incorporated Series 2001 (Industrial Development Revenue, Northwest Farm Credit LOC) | | | 1.05 | % | | | 9-1-2021 | | | $ | 3,300,000 | | | $ | 3,300,000 | |
Washington Housing Finance Commission Whisperwood Apartments Project Series A (Housing Revenue, FNMA LOC, FNMA LIQ) | | | 1.00 | | | | 5-15-2035 | | | | 1,590,000 | | | | 1,590,000 | |
Yakima County WA Solid Waste Disposal George Deruyter & Son Project Series 2006 (Resource Recovery Revenue, Northwest Farm Credit LOC) | | | 1.05 | | | | 8-1-2026 | | | | 1,215,000 | | | | 1,215,000 | |
| | | | |
| | | | | | | | | | | | | | | 6,105,000 | |
| | | | | | | | | | | | | | | | |
| | | | |
West Virginia: 1.34% | | | | | | | | | | | | | | | | |
| | | | |
| Variable Rate Demand Note ø: 1.34% | | | | | | | | | | | | | | | | |
West Virginia EDA Collins Hardwood Company LLC (Industrial Development Revenue, American AgCredit LOC) | | | 1.07 | | | | 10-1-2031 | | | | 2,700,000 | | | | 2,700,000 | |
| | | | | | | | | | | | | | | | |
| | | | |
Wisconsin: 3.31% | | | | | | | | | | | | | | | | |
| | | | |
| Variable Rate Demand Notes ø: 3.31% | | | | | | | | | | | | | | | | |
Manitowoc WI CDA Regency House Project (Housing Revenue, Bank First National LOC) | | | 1.16 | | | | 11-1-2020 | | | | 985,000 | | | | 985,000 | |
Sheboygan WI Vortex Liquid Color Project (Industrial Development Revenue, Bank First National LOC) | | | 1.16 | | | | 11-1-2020 | | | | 680,000 | | | | 680,000 | |
Wisconsin Housing & EDA Home Ownership Series C (Housing Revenue, Royal Bank of Canada SPA) | | | 0.95 | | | | 3-1-2039 | | | | 5,000,000 | | | | 5,000,000 | |
| | | | |
| | | | | | | | | | | | | | | 6,665,000 | |
| | | | | | | | | | | | | | | | |
| | | | |
Total Municipal Obligations (Cost $179,310,000) | | | | | | | | | | | | | | | 179,310,000 | |
| | | | | | | | | | | | | | | | |
| | | | |
Other: 8.28% | | | | | | | | | | | | | | | | |
Nuveen California Dividend Advantage Municipal Fund Variable Rate Demand Preferred Shares Series 3 (Deutsche Bank LIQ) 144Aø | | | 1.04 | | | | 3-1-2040 | | | | 3,000,000 | | | | 3,000,000 | |
Nuveen Quality Municipal Income Fund Variable Rate Demand Preferred Shares Series 1-2118 (Barclays Bank LIQ) 144Aø | | | 1.09 | | | | 5-1-2041 | | | | 5,000,000 | | | | 5,000,000 | |
Western Asset Intermediate Municipal Fund Incorporated Variable Rate Demand Preferred Shares Series 1 (Citibank NA LIQ) 144Aø | | | 1.09 | | | | 2-25-2045 | | | | 5,000,000 | | | | 5,000,000 | |
Western Asset Municipal Partners Incorporated Variable Rate Demand Preferred Shares Series 1 (Citibank NA LIQ) 144Aø | | | 1.09 | | | | 3-11-2045 | | | | 3,700,000 | | | | 3,700,000 | |
| | | | |
Total Other (Cost $16,700,000) | | | | | | | | | | | | | | | 16,700,000 | |
| | | | | | | | | | | | | | | | |
| | | | |
Repurchase Agreements: 2.48% | | | | | | | | | | | | | | | | |
Barclay’s Capital Incorporated, dated 7-31-2018, maturity value $5,000,265 ^^ | | | 1.91 | | | | 8-1-2018 | | | | 5,000,000 | | | | 5,000,000 | |
| | | | | | | | | | | | | | | | |
| | | | |
Total Repurchase Agreements (Cost $5,000,000) | | | | | | | | | | | | | | | 5,000,000 | |
| | | | | | | | | | | | | | | | |
| | | | | | | | |
| Total investments in securities (Cost $201,010,000) | | | 99.69 | % | | | 201,010,000 | |
Other assets and liabilities, net | | | 0.31 | | | | 618,167 | |
| | | | | | | | |
| Total net assets | | | 100.00 | % | | $ | 201,628,167 | |
| | | | | | | | |
The accompanying notes are an integral part of these financial statements.
| | | | |
| 14 | | Wells Fargo Municipal Cash Management Money Market Fund | | Portfolio of investments—July 31, 2018 (unaudited) |
| ø | Variable rate demand notes are subject to a demand feature which reduces the effective maturity. The maturity date shown represents the final maturity date of the security. The interest rate is determined and reset by the issuer daily, weekly, or monthly depending upon the terms of the security. The rate shown is the rate in effect at period end. |
| 144A | The security may be resold in transactions exempt from registration, normally to qualified institutional buyers, pursuant to Rule 144A under the Securities Act of 1933. |
| ^^ | Collateralized by U.S. government securities, 0.00% to 6.00%, 11-8-2018 to 8-15-2047, fair value including accrued interest is $5,100,000. |
Abbreviations:
| AGC | Assured Guaranty Corporation |
| AGM | Assured Guaranty Municipal |
| CDA | Community Development Authority |
| DRIVER | Derivative inverse tax-exempt receipts |
| EDA | Economic Development Authority |
| EDFA | Economic Development Finance Authority |
| FHLB | Federal Home Loan Bank |
| FHLMC | Federal Home Loan Mortgage Corporation |
| FNMA | Federal National Mortgage Association |
| IDA | Industrial Development Authority |
| MFHR | Multifamily housing revenue |
| PCFA | Pollution Control Financing Authority |
| PUTTER | Puttable tax-exempt receipts |
| SPA | Standby purchase agreement |
The accompanying notes are an integral part of these financial statements.
| | | | | | |
| Statement of assets and liabilities—July 31, 2018 (unaudited) | | Wells Fargo Municipal Cash Management Money Market Fund | | | 15 | |
| | | | |
| | | | |
| |
Assets | | | | |
Investments in unaffiliated securities, at value (cost $201,010,000) | | $ | 201,010,000 | |
Cash | | | 141,949 | |
Receivable for investments sold | | | 180,000 | |
Receivable for interest | | | 422,076 | |
Prepaid expenses and other assets | | | 55,773 | |
| | | | |
Total assets | | | 201,809,798 | |
| | | | |
| |
Liabilities | | | | |
Shareholder report expenses payable | | | 81,109 | |
Custodian and accounting fees payable | | | 25,726 | |
Administration fees payable | | | 17,684 | |
Professional fees payable | | | 15,757 | |
Management fee payable | | | 6,215 | |
Payable for Fund shares redeemed | | | 4,488 | |
Dividends payable | | | 4,058 | |
Accrued expenses and other liabilities | | | 26,594 | |
| | | | |
Total liabilities | | | 181,631 | |
| | | | |
Total net assets | | $ | 201,628,167 | |
| | | | |
| |
NET ASSETS CONSIST OF | | | | |
Paid-in capital | | $ | 201,501,125 | |
Overdistributed net investment income | | | (75,241 | ) |
Accumulated net realized gains on investments | | | 202,283 | |
| | | | |
Total net assets | | $ | 201,628,167 | |
| | | | |
| |
COMPUTATION OF NET ASSET VALUE PER SHARE | | | | |
Net assets – Administrator Class | | $ | 6,270,611 | |
Shares outstanding – Administrator Class1 | | | 6,264,276 | |
Net asset value per share – Administrator Class | | | $1.0010 | |
Net assets – Institutional Class | | $ | 174,517,837 | |
Shares outstanding – Institutional Class1 | | | 174,332,904 | |
Net asset value per share – Institutional Class | | | $1.0011 | |
Net assets – Service Class | | $ | 20,839,719 | |
Shares outstanding – Service Class1 | | | 20,818,308 | |
Net asset value per share – Service Class | | | $1.0010 | |
| 1 | The Fund has an unlimited number of authorized shares. |
The accompanying notes are an integral part of these financial statements.
| | | | |
| 16 | | Wells Fargo Municipal Cash Management Money Market Fund | | Statement of operations—six months ended July 31, 2018 (unaudited) |
| | | | |
| | | | |
| |
Investment income | | | | |
Interest | | $ | 1,910,726 | |
| | | | |
| |
Expenses | | | | |
Management fee | | | 203,607 | |
Administration fees | | | | |
Administrator Class | | | 2,239 | |
Institutional Class | | | 98,871 | |
Service Class | | | 11,892 | |
Shareholder servicing fees | | | | |
Administrator Class | | | 2,239 | |
Service Class | | | 24,776 | |
Custody and accounting fees | | | 16,060 | |
Professional fees | | | 19,398 | |
Registration fees | | | 39,326 | |
Shareholder report expenses | | | 6,996 | |
Trustees’ fees and expenses | | | 9,468 | |
Other fees and expenses | | | 11,372 | |
| | | | |
Total expenses | | | 446,244 | |
Less: Fee waivers and/or expense reimbursements | | | (147,753 | ) |
| | | | |
Net expenses | | | 298,491 | |
| | | | |
Net investment income | | | 1,612,235 | |
| | | | |
Net realized gains on investments | | | 1,463 | |
| | | | |
Net increase in net assets resulting from operations | | $ | 1,613,698 | |
| | | | |
The accompanying notes are an integral part of these financial statements.
| | | | | | |
| Statement of changes in net assets | | Wells Fargo Municipal Cash Management Money Market Fund | | | 17 | |
| | | | | | | | | | | | | | | | |
| | | Six months ended
July 31, 2018
(unaudited) | | | Year ended
January 31, 2018 | |
| | | | |
Operations | | | | | | | | | | | | | | | | |
Net investment income | | | | | | $ | 1,612,235 | | | | | | | $ | 2,669,470 | |
Net realized gains on investments | | | | | | | 1,463 | | | | | | | | 200,819 | |
Net change in unrealized gains (losses) on investments | | | | | | | 0 | | | | | | | | (175 | ) |
| | | | |
Net increase in net assets resulting from operations | | | | | | | 1,613,698 | | | | | | | | 2,870,114 | |
| | | | |
| | | | |
Distributions to shareholders from | | | | | | | | | | | | | | | | |
Net investment income | | | | | | | | | | | | | | | | |
Administrator Class | | | | | | | (24,497 | ) | | | | | | | (22,145 | ) |
Institutional Class | | | | | | | (1,492,026 | ) | | | | | | | (2,533,504 | ) |
Service Class | | | | | | | (95,712 | ) | | | | | | | (113,982 | ) |
Net realized gains | | | | | | | | | | | | | | | | |
Administrator Class | | | | | | | 0 | | | | | | | | (9 | ) |
Institutional Class | | | | | | | 0 | | | | | | | | (1,014 | ) |
Service Class | | | | | | | 0 | | | | | | | | (53 | ) |
| | | | |
Total distributions to shareholders | | | | | | | (1,612,235 | ) | | | | | | | (2,670,707 | ) |
| | | | |
| | | | |
Capital share transactions | | | Shares | | | | | | | | Shares | | | | | |
Proceeds from shares sold | | | | | | | | | | | | | | | | |
Administrator Class | | | 2,997,003 | | | | 3,000,000 | | | | 0 | | | | 0 | |
Institutional Class | | | 2,353,629,065 | | | | 2,356,218,058 | | | | 6,592,288,860 | | | | 6,598,075,845 | |
Service Class | | | 5,512,007 | | | | 5,517,518 | | | | 5,397,387 | | | | 5,401,673 | |
| | | | |
| | | | | | | 2,364,735,576 | | | | | | | | 6,603,477,518 | |
| | | | |
Reinvestment of distributions | | | | | | | | | | | | | | | | |
Administrator Class | | | 23,914 | | | | 23,938 | | | | 21,782 | | | | 21,800 | |
Institutional Class | | | 1,481,388 | | | | 1,483,018 | | | | 2,498,994 | | | | 2,501,356 | |
Service Class | | | 70,831 | | | | 70,901 | | | | 79,884 | | | | 79,954 | |
| | | | |
| | | | | | | 1,577,857 | | | | | | | | 2,603,110 | |
| | | | |
Payment for shares redeemed | | | | | | | | | | | | | | | | |
Institutional Class | | | (2,516,631,262 | ) | | | (2,519,399,556 | ) | | | (6,521,302,596 | ) | | | (6,527,059,643 | ) |
Service Class | | | (4,099,790 | ) | | | (4,103,891 | ) | | | (10,091,953 | ) | | | (10,099,803 | ) |
| | | | |
| | | | | | | (2,523,503,447 | ) | | | | | | | (6,537,159,446 | ) |
| | | | |
Net increase (decrease) in net assets resulting from capital share transactions | | | | | | | (157,190,014 | ) | | | | | | | 68,921,182 | |
| | | | |
Total increase (decrease) in net assets | | | | | | | (157,188,551 | ) | | | | | | | 69,120,589 | |
| | | | |
| | | | |
Net assets | | | | | | | | | | | | | | | | |
Beginning of period | | | | | | | 358,816,718 | | | | | | | | 289,696,129 | |
| | | | |
End of period | | | | | | $ | 201,628,167 | | | | | | | $ | 358,816,718 | |
| | | | |
Overdistributed net investment income | | | | | | $ | (75,241 | ) | | | | | | $ | (75,241 | ) |
| | | | |
The accompanying notes are an integral part of these financial statements.
| | | | |
| 18 | | Wells Fargo Municipal Cash Management Money Market Fund | | Financial highlights |
(For a share outstanding throughout each period)
| | | | | | | | | | | | | | | | | | | | | | | | |
| | | Six months ended
July 31, 2018 (unaudited) | | | Year ended January 31 | |
| ADMINISTRATOR CLASS | | 2018 | | | 2017 | | | 20161 | | | 20151 | | | 20141 | |
Net asset value, beginning of period | | | $1.0010 | | | | $1.0005 | | | | $1.0000 | | | | $1.00 | | | | $1.00 | | | | $1.00 | |
Net investment income | | | 0.0055 | | | | 0.0069 | | | | 0.0031 | | | | 0.00 | 2 | | | 0.00 | 2 | | | 0.00 | 2 |
Net realized and unrealized gains (losses) on investments | | | 0.0000 | 3 | | | 0.0005 | | | | 0.0008 | | | | 0.00 | 2 | | | 0.00 | 2 | | | 0.00 | 2 |
| | | | | | | | | | | | | | | | | | | | | | | | |
Total from investment operations | | | 0.0055 | | | | 0.0074 | | | | 0.0039 | | | | 0.00 | 2 | | | 0.00 | 2 | | | 0.00 | 2 |
Distributions to shareholders from | | | | | | | | | | | | | | | | | | | | | | | | |
Net investment income | | | (0.0055 | ) | | | (0.0069 | ) | | | (0.0030 | ) | | | (0.00 | )2 | | | (0.00 | )2 | | | (0.00 | )2 |
Net realized gains | | | 0.0000 | | | | (0.0000 | )3 | | | (0.0004 | ) | | | (0.00 | )2 | | | (0.00 | )2 | | | (0.00 | )2 |
| | | | | | | | | | | | | | | | | | | | | | | | |
Total distributions to shareholders | | | (0.0055 | ) | | | (0.0069 | ) | | | (0.0034 | ) | | | (0.00 | )2 | | | (0.00 | )2 | | | (0.00 | )2 |
Net asset value, end of period | | | $1.0010 | | | | $1.0010 | | | | $1.0005 | | | | $1.00 | | | | $1.00 | | | | $1.00 | |
Total return4 | | | 0.56 | % | | | 0.74 | % | | | 0.35 | % | | | 0.02 | % | | | 0.02 | % | | | 0.04 | % |
Ratios to average net assets (annualized) | | | | | | | | | | | | | | | | | | | | | | | | |
Gross expenses | | | 0.43 | % | | | 0.41 | % | | | 0.39 | % | | | 0.37 | % | | | 0.37 | % | | | 0.36 | % |
Net expenses | | | 0.30 | % | | | 0.30 | % | | | 0.27 | % | | | 0.10 | % | | | 0.11 | % | | | 0.15 | % |
Net investment income | | | 1.09 | % | | | 0.68 | % | | | 0.29 | % | | | 0.01 | % | | | 0.01 | % | | | 0.01 | % |
Supplemental data | | | | | | | | | | | | | | | | | | | | | | | | |
Net assets, end of period (000s omitted) | | | $6,271 | | | | $3,247 | | | | $3,223 | | | | $3,537 | | | | $3,536 | | | | $3,536 | |
| 1 | Amounts reflect the Fund transacting shares at a fixed NAV rounded to two decimal places. Beginning October 11, 2016, the Fund began selling and redeeming shares of the Fund at a floating NAV rounded to the fourth decimal place. |
| 2 | Amount is less than $0.005. |
| 3 | Amount is less than $0.00005. |
| 4 | Returns for periods of less than one year are not annualized. |
The accompanying notes are an integral part of these financial statements.
| | | | | | |
| Financial highlights | | Wells Fargo Municipal Cash Management Money Market Fund | | | 19 | |
(For a share outstanding throughout each period)
| | | | | | | | | | | | | | | | | | | | | | | | |
| | | Six months ended
July 31, 2018 (unaudited) | | | Year ended January 31 | |
| INSTITUTIONAL CLASS | | 2018 | | | 2017 | | | 20161 | | | 20151 | | | 20141 | |
Net asset value, beginning of period | | | $1.0011 | | | | $1.0005 | | | | $1.0000 | | | | $1.00 | | | | $1.00 | | | | $1.00 | |
Net investment income | | | 0.0057 | | | | 0.0080 | | | | 0.0035 | | | | 0.00 | 2 | | | 0.00 | 2 | | | 0.00 | 2 |
Net realized and unrealized gains (losses) on investments | | | 0.0003 | | | | 0.0005 | | | | 0.0012 | | | | 0.00 | 2 | | | 0.00 | 2 | | | 0.00 | 2 |
| | | | | | | | | | | | | | | | | | | | | | | | |
Total from investment operations | | | 0.0060 | | | | 0.0085 | | | | 0.0047 | | | | 0.00 | 2 | | | 0.00 | 2 | | | 0.00 | 2 |
Distributions to shareholders from | | | | | | | | | | | | | | | | | | | | | | | | |
Net investment income | | | (0.0060 | ) | | | (0.0079 | ) | | | (0.0038 | ) | | | (0.00 | )2 | | | (0.00 | )2 | | | (0.00 | )2 |
Net realized gains | | | 0.0000 | | | | (0.0000 | )3 | | | (0.0004 | ) | | | (0.00 | )2 | | | (0.00 | )2 | | | (0.00 | )2 |
| | | | | | | | | | | | | | | | | | | | | | | | |
Total distributions to shareholders | | | (0.0060 | ) | | | (0.0079 | ) | | | (0.0042 | ) | | | (0.00 | )2 | | | (0.00 | )2 | | | (0.00 | )2 |
Net asset value, end of period | | | $1.0011 | | | | $1.0011 | | | | $1.0005 | | | | $1.00 | | | | $1.00 | | | | $1.00 | |
Total return4 | | | 0.61 | % | | | 0.85 | % | | | 0.44 | % | | | 0.02 | % | | | 0.02 | % | | | 0.04 | % |
Ratios to average net assets (annualized) | | | | | | | | | | | | | | | | | | | | | | | | |
Gross expenses | | | 0.31 | % | | | 0.29 | % | | | 0.26 | % | | | 0.25 | % | | | 0.25 | % | | | 0.24 | % |
Net expenses | | | 0.20 | % | | | 0.20 | % | | | 0.18 | % | | | 0.10 | % | | | 0.11 | % | | | 0.15 | % |
Net investment income | | | 1.21 | % | | | 0.79 | % | | | 0.27 | % | | | 0.01 | % | | | 0.01 | % | | | 0.01 | % |
Supplemental data | | | | | | | | | | | | | | | | | | | | | | | | |
Net assets, end of period (000s omitted) | | | $174,518 | | | | $336,215 | | | | $262,511 | | | | $953,036 | | | | $1,008,667 | | | | $1,104,686 | |
| 1 | Amounts reflect the Fund transacting shares at a fixed NAV rounded to two decimal places. Beginning October 11, 2016, the Fund began selling and redeeming shares of the Fund at a floating NAV rounded to the fourth decimal place. |
| 2 | Amount is less than $0.005. |
| 3 | Amount is less than $0.00005. |
| 4 | Returns for periods of less than one year are not annualized. |
The accompanying notes are an integral part of these financial statements.
| | | | |
| 20 | | Wells Fargo Municipal Cash Management Money Market Fund | | Financial highlights |
(For a share outstanding throughout each period)
| | | | | | | | | | | | | | | | | | | | | | | | |
| | | Six months ended
July 31, 2018 (unaudited) | | | Year ended January 31 | |
| SERVICE CLASS | | 2018 | | | 2017 | | | 20161 | | | 20151 | | | 20141 | |
Net asset value, beginning of period | | | $1.0010 | | | | $1.0005 | | | | $1.0000 | | | | $1.00 | | | | $1.00 | | | | $1.00 | |
Net investment income | | | 0.0046 | | | | 0.0059 | | | | 0.0037 | | | | 0.00 | 2 | | | 0.00 | 2 | | | 0.00 | 2 |
Net realized and unrealized gains (losses) on investments | | | 0.0002 | | | | 0.0000 | 3 | | | (0.0010 | ) | | | 0.00 | 2 | | | 0.00 | 2 | | | 0.00 | 2 |
| | | | | | | | | | | | | | | | | | | | | | | | |
Total from investment operations | | | 0.0048 | | | | 0.0059 | | | | 0.0027 | | | | 0.00 | 2 | | | 0.00 | 2 | | | 0.00 | 2 |
Distributions to shareholders from | | | | | | | | | | | | | | | | | | | | | | | | |
Net investment income | | | (0.0048 | ) | | | (0.0054 | ) | | | (0.0018 | ) | | | (0.00 | )2 | | | (0.00 | )2 | | | (0.00 | )2 |
Net realized gains | | | 0.0000 | | | | (0.0000 | )3 | | | (0.0004 | ) | | | (0.00 | )2 | | | (0.00 | )2 | | | (0.00 | )2 |
| | | | | | | | | | | | | | | | | | | | | | | | |
Total distributions to shareholders | | | (0.0048 | ) | | | (0.0054 | ) | | | (0.0022 | ) | | | (0.00 | )2 | | | (0.00 | )2 | | | (0.00 | )2 |
Net asset value, end of period | | | $1.0010 | | | | $1.0010 | | | | $1.0005 | | | | $1.00 | | | | $1.00 | | | | $1.00 | |
Total return4 | | | 0.48 | % | | | 0.59 | % | | | 0.23 | % | | | 0.02 | % | | | 0.02 | % | | | 0.04 | % |
Ratios to average net assets (annualized) | | | | | | | | | | | | | | | | | | | | | | | | |
Gross expenses | | | 0.60 | % | | | 0.58 | % | | | 0.49 | % | | | 0.48 | % | | | 0.47 | % | | | 0.48 | % |
Net expenses | | | 0.45 | % | | | 0.45 | % | | | 0.35 | % | | | 0.10 | % | | | 0.11 | % | | | 0.15 | % |
Net investment income | | | 0.97 | % | | | 0.53 | % | | | 0.09 | % | | | 0.01 | % | | | 0.01 | % | | | 0.01 | % |
Supplemental data | | | | | | | | | | | | | | | | | | | | | | | | |
Net assets, end of period (000s omitted) | | | $20,840 | | | | $19,355 | | | | $23,962 | | | | $108,484 | | | | $140,465 | | | | $175,358 | |
| 1 | Amounts reflect the Fund transacting shares at a fixed NAV rounded to two decimal places. Beginning October 11, 2016, the Fund began selling and redeeming shares of the Fund at a floating NAV rounded to the fourth decimal place. |
| 2 | Amount is less than $0.005. |
| 3 | Amount is less than $0.00005. |
| 4 | Returns for periods of less than one year are not annualized. |
The accompanying notes are an integral part of these financial statements.
| | | | | | |
| Notes to financial statements (unaudited) | | Wells Fargo Municipal Cash Management Money Market Fund | | | 21 | |
1. ORGANIZATION
Wells Fargo Funds Trust (the “Trust”), a Delaware statutory trust organized on March 10, 1999, is an open-end management investment company registered under the Investment Company Act of 1940, as amended (the “1940 Act”). As an investment company, the Trust follows the accounting and reporting guidance in Financial Accounting Standards Board Accounting Standards Codification Topic 946, Financial Services – Investment Companies. These financial statements report on the Wells Fargo Municipal Cash Management Money Market Fund (the “Fund”) which is a diversified series of the Trust.
2. SIGNIFICANT ACCOUNTING POLICIES
The following significant accounting policies, which are consistently followed in the preparation of the financial statements of the Fund, are in conformity with U.S. generally accepted accounting principles which require management to make estimates and assumptions that affect the reported amounts of assets and liabilities, disclosure of contingent assets and liabilities at the date of the financial statements, and the reported amounts of revenues and expenses during the reporting period. Actual results could differ from those estimates.
Securities valuation
Debt securities are valued at the evaluated bid price provided by an independent pricing service or, if a reliable price is not available, the quoted bid price from an independent broker-dealer.
Investments which are not valued using any of the methods discussed above are valued at their fair value, as determined in good faith by the Board of Trustees of the Fund. The Board of Trustees has established a Valuation Committee comprised of the Trustees and has delegated to it the authority to take any actions regarding the valuation of portfolio securities that the Valuation Committee deems necessary or appropriate, including determining the fair value of portfolio securities, unless the determination has been delegated to the Wells Fargo Asset Management Pricing Committee at Wells Fargo Funds Management, LLC (“Funds Management”). The Board of Trustees retains the authority to make or ratify any valuation decisions or approve any changes to the Valuation Procedures as it deems appropriate. On a quarterly basis, the Board of Trustees receives reports on any valuation actions taken by the Valuation Committee or the Wells Fargo Asset Management Pricing Committee which may include items for ratification.
Valuations of fair valued securities are compared to the next actual sales price when available, or other appropriate market values, to assess the continued appropriateness of the fair valuation methodologies used. These securities are fair valued on a day-to-day basis, taking into consideration changes to appropriate market information and any significant changes to the inputs considered in the valuation process until there is a readily available price provided on an exchange or by an independent pricing service. Valuations received from an independent pricing service or independent broker-dealer quotes are periodically validated by comparisons to most recent trades and valuations provided by other independent pricing services in addition to the review of prices by the manager and/or subadviser. Unobservable inputs used in determining fair valuations are identified based on the type of security, taking into consideration factors utilized by market participants in valuing the investment, knowledge about the issuer and the current market environment.
Repurchase agreements
The Fund may invest in repurchase agreements and may participate in pooled repurchase agreement transactions with other funds advised by Funds Management. Repurchase agreements are agreements where the seller of a security to the Fund agrees to repurchase that security from the Fund at a mutually agreed upon time and price. The repurchase agreements must be fully collateralized based on values that are marked-to-market daily. The collateral may be held by an agent bank under a tri-party agreement. It is the custodian’s responsibility to value collateral daily and to take action to obtain additional collateral as necessary to maintain a market value equal to or greater than the resale price. The repurchase agreements are collateralized by U.S. government securities. There could be potential loss to the Fund in the event that the Fund is delayed or prevented from exercising its rights to dispose of the collateral, including the risk of a possible decline in the value of the underlying obligations during the period in which the Fund seeks to assert its rights.
Security transactions and income recognition
Securities transactions are recorded on a trade date basis. Realized gains or losses are recorded on the basis of identified cost.
Interest income is accrued daily and bond discounts are accreted and premiums are amortized daily. To the extent debt obligations are placed on non-accrual status, any related interest income may be reduced by writing off interest receivables when the collection of all or a portion of interest has been determined to be doubtful based on consistently applied procedures and the fair value has decreased. If the issuer subsequently resumes interest payments or when the collectability of interest is reasonably assured, the debt obligation is removed from non-accrual status.
| | | | |
| 22 | | Wells Fargo Municipal Cash Management Money Market Fund | | Notes to financial statements (unaudited) |
Distributions to shareholders
Distributions to shareholders from net investment income are declared daily and paid monthly. Distributions from net realized gains, if any, are recorded on the ex-dividend date and paid at least annually. Such distributions are determined in accordance with income tax regulations and may differ from U.S. generally accepted accounting principles. Dividend sources are estimated at the time of declaration. The tax character of distributions is determined as of the Fund’s fiscal year end. Therefore, a portion of the Fund’s distributions made prior to the Fund’s fiscal year end may be categorized as a tax return of capital at year end.
Federal and other taxes
The Fund intends to continue to qualify as a regulated investment company by distributing substantially all of its investment company taxable and tax-exempt income and any net realized capital gains (after reduction for capital loss carryforwards) sufficient to relieve it from all, or substantially all, federal income taxes. Accordingly, no provision for federal income taxes was required.
The Fund’s income and federal excise tax returns and all financial records supporting those returns for the prior three fiscal years are subject to examination by the federal and Delaware revenue authorities. Management has analyzed the Fund’s tax positions taken on federal, state, and foreign tax returns for all open tax years and does not believe that there are any uncertain tax positions that require recognition of a tax liability.
As of July 31, 2018, the cost of investments for federal income tax purposes is substantially the same as for financial reporting purposes.
Class allocations
The separate classes of shares offered by the Fund differ principally in shareholder servicing and administration fees. Class specific expenses are charged directly to that share class. Investment income, common expenses, and realized and unrealized gains (losses) on investments are allocated daily to each class of shares based on the relative proportion of net assets of each class.
3. FAIR VALUATION MEASUREMENTS
Fair value measurements of investments are determined within a framework that has established a fair value hierarchy based upon the various data inputs utilized in determining the value of the Fund’s investments. The three-level hierarchy gives the highest priority to unadjusted quoted prices in active markets for identical assets or liabilities (Level 1) and the lowest priority to unobservable inputs (Level 3). The Fund’s investments are classified within the fair value hierarchy based on the lowest level of input that is significant to the fair value measurement. The inputs are summarized into three broad levels as follows:
| ∎ | | Level 1 – quoted prices in active markets for identical securities |
| ∎ | | Level 2 – other significant observable inputs (including quoted prices for similar securities, interest rates, prepayment speeds, credit risk, etc.) |
| ∎ | | Level 3 – significant unobservable inputs (including the Fund’s own assumptions in determining the fair value of investments) |
The inputs or methodologies used for valuing investments in securities are not necessarily an indication of the risk associated with investing in those securities.
The following is a summary of the inputs used in valuing the Fund’s assets and liabilities as of July 31, 2018:
| | | | | | | | | | | | | | | | |
| | | Quoted prices
(Level 1) | | | Other significant
observable inputs
(Level 2) | | | Significant
unobservable inputs (Level 3) | | | Total | |
Assets | | | | | | | | | | | | | | | | |
Investments in: | | | | | | | | | | | | | | | | |
| | | | |
Municipal obligations | | $ | 0 | | | $ | 179,310,000 | | | $ | 0 | | | $ | 179,310,000 | |
| | | | |
Other | | | 0 | | | | 16,700,000 | | | | 0 | | | | 16,700,000 | |
| | | | |
Repurchase agreements | | | 0 | | | | 5,000,000 | | | | 0 | | | | 5,000,000 | |
Total assets | | $ | 0 | | | $ | 201,010,000 | | | $ | 0 | | | $ | 201,010,000 | |
The Fund recognizes transfers between levels within the fair value hierarchy at the end of the reporting period. At July 31, 2018, the Fund did not have any transfers into/out of Level 1, Level 2, or Level 3.
| | | | | | |
| Notes to financial statements (unaudited) | | Wells Fargo Municipal Cash Management Money Market Fund | | | 23 | |
4. TRANSACTIONS WITH AFFILIATES
Management fee
Funds Management, an indirect wholly owned subsidiary of Wells Fargo & Company (“Wells Fargo”), is the manager of the Fund and provides advisory and fund-level administrative services under an investment management agreement. Under the investment management agreement, Funds Management is responsible for, among other services, implementing the investment objectives and strategies of the Fund, supervising the subadviser and providing fund-level administrative services in connection with the Fund’s operations. As compensation for its services under the investment management agreement, Funds Management is entitled to receive an annual management fee starting at 0.15% and declining to 0.13% as the average daily net assets of the Fund increase. For the six months ended July 31, 2018, the management fee was equivalent to an annual rate of 0.15% of the Fund’s average daily net assets.
Funds Management has retained the services of a subadviser to provide daily portfolio management to the Fund. The fee for subadvisory services is borne by Funds Management. Wells Capital Management Incorporated, an affiliate of Funds Management and an indirect wholly owned subsidiary of Wells Fargo, is the subadviser to the Fund and is entitled to receive a fee from Funds Management at an annual rate starting at 0.05% and declining to 0.01% as the average daily net assets of the Fund increase.
Administration fees
Under a class-level administration agreement, Funds Management provides class-level administrative services to the Fund, which includes paying fees and expenses for services provided by the transfer agent, sub-transfer agents, omnibus account servicers and record-keepers. As compensation for its services under the class-level administration agreement, Funds Management receives an annual fee which is calculated based on the average daily net assets of each class as follows:
| | | | |
| | | Class-level
administration fee | |
Administrator Class | | | 0.10 | % |
Institutional Class | | | 0.08 | |
Service Class | | | 0.12 | |
Funds Management has contractually waived and/or reimbursed management and administration fees to the extent necessary to maintain certain net operating expense ratios for the Fund. When each class of the Fund has exceeded its expense cap, Funds Management has waived fees and/or reimbursed expenses from fund level expenses on a proportionate basis and then from class specific expenses; otherwise, waivers and/or reimbursements are applied against class specific expenses before fund level expenses. Funds Management has committed through May 31, 2019 to waive fees and/or reimburse expenses to the extent necessary to cap the Fund’s expenses at 0.30% for Administrator Class shares, 0.20% for Institutional Class shares and 0.45% for Service Class shares. After this time, the cap may be increased or the commitment to maintain the cap may be terminated only with the approval of the Board of Trustees.
Shareholder servicing fees
The Trust has entered into contracts with one or more shareholder servicing agents. Administrator Class and Service Class of the Fund are charged a fee at an annual rate of 0.10% and 0.25%, respectively, of their average daily net assets.
A portion of these total shareholder servicing fees were paid to affiliates of Wells Fargo.
Interfund transactions
The Fund may purchase or sell portfolio investment securities to certain other Wells Fargo affiliates pursuant to Rule 17a-7 under the 1940 Act and under procedures adopted by the Board of Trustees. The procedures have been designed to ensure that these interfund transactions, which do not incur broker commissions, are effected at current market prices. Pursuant to these procedures, the Fund had $500,170,000 and $661,635,000 in interfund purchases and sales, respectively, during the six months ended July 31, 2018.
5. INDEMNIFICATION
Under the Trust’s organizational documents, the officers and Trustees have been granted certain indemnification rights against certain liabilities that may arise out of performance of their duties to the Trust. Additionally, in the normal course of business, the Trust may enter into contracts with service providers that contain a variety of indemnification clauses. The Trust’s maximum exposure under these arrangements is dependent on future claims that may be made against the Fund and, therefore, cannot be estimated.
| | | | |
| 24 | | Wells Fargo Municipal Cash Management Money Market Fund | | Other information (unaudited) |
PROXY VOTING INFORMATION
A description of the policies and procedures that the Fund uses to determine how to vote proxies relating to portfolio securities is available, upon request, by calling 1-800-222-8222, visiting our website at wellsfargofunds.com, or visiting the SEC website at sec.gov. Information regarding how the Fund voted proxies relating to portfolio securities during the most recent 12-month period ended June 30 is available on the Fund’s website at wellsfargofunds.com or by visiting the SEC website at sec.gov.
PORTFOLIO HOLDINGS INFORMATION
The complete portfolio holdings for the Fund are publicly available on the Fund’s website (wellsfargofunds.com) on a 1-day delayed basis. The Fund files its complete schedule of portfolio holdings with the SEC for the first and third quarters of each fiscal year on Form N-Q, which is available by visiting the SEC website at sec.gov. In addition, the Fund’s Form N-Q may be reviewed and copied at the SEC’s Public Reference Room in Washington, DC, and at regional offices in New York City, at 233 Broadway, and in Chicago, at 175 West Jackson Boulevard, Suite 900. Information about the Public Reference Room may be obtained by calling 1-800-SEC-0330.
| | | | | | |
| Other information (unaudited) | | Wells Fargo Municipal Cash Management Money Market Fund | | | 25 | |
BOARD OF TRUSTEES AND OFFICERS
Each of the Trustees and Officers1 listed in the table below acts in identical capacities for each fund in the Wells Fargo family of funds, which consists of 154 mutual funds comprising the Wells Fargo Funds Trust, Wells Fargo Variable Trust, Wells Fargo Master Trust and four closed-end funds (collectively the “Fund Complex”). This table should be read in conjunction with the Prospectus and the Statement of Additional Information2. The mailing address of each Trustee and Officer is 525 Market Street, 12th Floor, San Francisco, CA 94105. Each Trustee and Officer serves an indefinite term, however, each Trustee serves such term until reaching the mandatory retirement age established by the Trustees.
Independent Trustees
| | | | | | |
Name and year of birth | | Position held and length of service* | | Principal occupations during past five years or longer | | Current other public company or investment company
directorships |
William R. Ebsworth (Born 1957) | | Trustee, since 2015 | | Retired. From 1984 to 2013, equities analyst, portfolio manager, research director and chief investment officer at Fidelity Management and Research Company in Boston, Tokyo, and Hong Kong, and retired in 2013 as Chief Investment Officer of Fidelity Strategic Advisers, Inc. where he led a team of investment professionals managing client assets. Prior thereto, Board member of Hong Kong Securities Clearing Co., Hong Kong Options Clearing Corp., the Thailand International Fund, Ltd., Fidelity Investments Life Insurance Company, and Empire Fidelity Investments Life Insurance Company. Board member of the Forté Foundation (non-profit organization) and the Vincent Memorial Hospital Endowment (non-profit organization), where he serves on the Investment Committee and as a Chair of the Audit Committee. Mr. Ebsworth is a CFA® charterholder. | | Asset Allocation Trust |
Jane A. Freeman (Born 1953) | | Trustee, since 2015; Chair Liaison, since 2018 | | Retired. From 2012 to 2014 and 1999 to 2008, Chief Financial Officer of Scientific Learning Corporation. From 2008 to 2012, Ms. Freeman provided consulting services related to strategic business projects. Prior to 1999, Portfolio Manager at Rockefeller & Co. and Scudder, Stevens & Clark. Board member of the Harding Loevner Funds from 1996 to 2014, serving as both Lead Independent Director and chair of the Audit Committee. Board member of the Russell Exchange Traded Funds Trust from 2011 to 2012 and the chair of the Audit Committee. Ms. Freeman is a Board Member of Ruth Bancroft Garden (non-profit organization) and the Glimmerglass Festival. She is also an inactive Chartered Financial Analyst. | | Asset Allocation Trust |
Isaiah Harris, Jr. (Born 1952) | | Trustee, since 2009 | | Retired. Chairman of the Board of CIGNA Corporation since 2009, and Director since 2005. From 2003 to 2011, Director of Deluxe Corporation. Prior thereto, President and CEO of BellSouth Advertising and Publishing Corp. from 2005 to 2007, President and CEO of BellSouth Enterprises from 2004 to 2005 and President of BellSouth Consumer Services from 2000 to 2003. Emeritus member of the Iowa State University Foundation Board of Governors. Emeritus Member of the Advisory Board of Iowa State University School of Business. Advisory Board Member, Palm Harbor Academy (charter school). Advisory Board Member, Child Evangelism Fellowship (non-profit). Mr. Harris is a certified public accountant (inactive status). | | CIGNA Corporation; Asset Allocation Trust |
Judith M. Johnson (Born 1949) | | Trustee, since 2008; Audit Committee Chairman, since 2009 | | Retired. Prior thereto, Chief Executive Officer and Chief Investment Officer of Minneapolis Employees Retirement Fund from 1996 to 2008. Ms. Johnson is an attorney, certified public accountant and a certified managerial accountant. | | Asset Allocation Trust |
David F. Larcker (Born 1950) | | Trustee, since 2009 | | James Irvin Miller Professor of Accounting at the Graduate School of Business, Stanford University, Director of the Corporate Governance Research Initiative and Senior Faculty of The Rock Center for Corporate Governance since 2006. From 2005 to 2008, Professor of Accounting at the Graduate School of Business, Stanford University. Prior thereto, Ernst & Young Professor of Accounting at The Wharton School, University of Pennsylvania from 1985 to 2005. | | Asset Allocation Trust |
| | | | |
| 26 | | Wells Fargo Municipal Cash Management Money Market Fund | | Other information (unaudited) |
| | | | | | |
Name and year of birth | | Position held and length of service* | | Principal occupations during past five years or longer | | Current other public company or investment company
directorships |
Olivia S. Mitchell (Born 1953) | | Trustee, since 2006; Governance Committee Chairman, since 2018 | | International Foundation of Employee Benefit Plans Professor, Wharton School of the University of Pennsylvania since 1993. Director of Wharton’s Pension Research Council and Boettner Center on Pensions & Retirement Research, and Research Associate at the National Bureau of Economic Research. Previously, Cornell University Professor from 1978 to 1993. | | Asset Allocation Trust |
Timothy J. Penny (Born 1951) | | Trustee, since 1996; Chairman, since 2018; Vice Chairman, from 2017 to 2018 | | President and Chief Executive Officer of Southern Minnesota Initiative Foundation, a non-profit organization, since 2007. Member of the Board of Trustees of NorthStar Education Finance, Inc., a non-profit organization, since 2007. | | Asset Allocation Trust |
James G. Polisson (Born 1959) | | Trustee, since 2018; Advisory Board Member, from 2017 to 2018 | | Retired. Chief Marketing Officer, Source (ETF) UK Services, Ltd, from 2015 to 2017. From 2012 to 2015, Principal of The Polisson Group, LLC, a management consulting, corporate advisory and principal investing company. Chief Executive Officer and Managing Director at Russell Investments, Global Exchange Traded Funds from 2010 to 2012. Managing Director of Barclays Global Investors from 1998 to 2010 and Global Chief Marketing Officer for iShares and Barclays Global Investors from 2000 to 2010. Trustee of the San Francisco Mechanics’ Institute, a non-profit organization, from 2013 to 2015. Board member of the Russell Exchange Traded Fund Trust from 2011 to 2012. Director of Barclays Global Investors Holdings Deutschland GmbH from 2006 to 2009. Mr. Polisson is an attorney and has a retired status with the Massachusetts and District of Columbia Bar Associations. | | Asset Allocation Trust |
Michael S. Scofield (Born 1943) | | Trustee, since 2010 | | Served on the Investment Company Institute’s Board of Governors and Executive Committee from 2008-2011 as well the Governing Council of the Independent Directors Council from 2006-2011 and the Independent Directors Council Executive Committee from 2008-2011. Trustee of the Evergreen Fund complex (and its predecessors) from 1984 to 2010. Chairman of the Evergreen Funds from 2000-2010. Former Trustee of the Mentor Funds. Retired Attorney, Law Offices of Michael S. Scofield. | | Asset Allocation Trust |
Pamela Wheelock (Born 1959) | | Trustee, since 2018; Advisory Board Member, from 2017 to 2018 | | Chief Operating Officer, Twin Cities Habitat for Humanity, since January, 2017. Vice President of University Services, University of Minnesota from 2012 to 2017. Prior thereto, on the Board of Directors, Goverance Committee and Finance Committee for the Minnesota Philanthropy Partners (Saint Paul Foundation) from 2012 to 2018, Interim President and Chief Executive Officer of Blue Cross Blue shield of Minnesota of Minnesota from 2010 to 2011, Chairman of the Board from 2009 to 2011 and Board Director 003 to 2015. Vice President, Leadership and Community Engagement, Bush Foundation, Saint Paul, Minnesota (a private foundation) from 2009 to 2011. Executive Vice President and Chief Financial Officer, Minnesota Sports and Entertainment from 2004 to 2009 and Senior Vice President from 2002 to 2004. Commissioner of Finance, State of Minnesota, from 1999 to 2002. Currently the Board Chair of the Minnesota Wild Foundation since 2010. | | Asset Allocation Trust |
| * | Length of service dates reflect the Trustee’s commencement of service with the Trust’s predecessor entities, where applicable. |
| | | | | | |
| Other information (unaudited) | | Wells Fargo Municipal Cash Management Money Market Fund | | | 27 | |
Officers
| | | | | | |
Name and year of birth | | Position held and
length of service | | Principal occupations during past five years or longer | | |
Andrew Owen (Born 1960) | | President, since 2017 | | Executive Vice President of Wells Fargo & Company and Head of Affiliated Managers, Wells Fargo Asset Management, since 2014. In addition, Mr. Owen is currently President, Chief Executive Officer and Director of Wells Fargo Funds Management, LLC since 2017. Prior thereto, Executive Vice President responsible for marketing, investments and product development for Wells Fargo Funds Management, LLC, from 2009 to 2014. | | |
Nancy Wiser1 (Born 1967) | | Treasurer, since 2012 | | Executive Vice President of Wells Fargo Funds Management, LLC since 2011. Chief Operating Officer and Chief Compliance Officer at LightBox Capital Management LLC, from 2008 to 2011. | | |
Alexander Kymn3 (Born 1973) | | Secretary, since 2018; Chief Legal Officer, since 2018 | | Senior Company Counsel of Wells Fargo Bank, N.A. since 2018 (previously Senior Counsel from 2007 to 2018). Vice President of Wells Fargo Funds Management, LLC from 2008 to 2014. | | |
Michael H. Whitaker (Born 1967) | | Chief Compliance Officer, since 2016 | | Senior Vice President and Chief Compliance Officer since 2016. Senior Vice President and Chief Compliance Officer for Fidelity Investments from 2007 to 2016. | | |
David Berardi (Born 1975) | | Assistant Treasurer, since 2009 | | Vice President of Wells Fargo Funds Management, LLC since 2009. Vice President of Evergreen Investment Management Company, LLC from 2008 to 2010. Manager of Fund Reporting and Control for Evergreen Investment Management Company, LLC from 2004 to 2010. | | |
Jeremy DePalma1 (Born 1974) | | Assistant Treasurer, since 2009 | | Senior Vice President of Wells Fargo Funds Management, LLC since 2009. Senior Vice President of Evergreen Investment Management Company, LLC from 2008 to 2010 and head of the Fund Reporting and Control Team within Fund Administration from 2005 to 2010. | | |
| 1 | Nancy Wiser acts as Treasurer of 77 funds in the Fund Complex. Jeremy DePalma acts as Treasurer of 77 funds and Assistant Treasurer of 77 funds in the Fund Complex. |
| 2 | The Statement of Additional Information includes additional information about the Trustees and is available, without charge, upon request, by calling 1-800-222-8222 or by visiting the website at wellsfargofunds.com. |
| 3 | Alexander Kymn became the Secretary and Chief Legal Officer effective April 17, 2018. |
| | | | |
| 28 | | Wells Fargo Municipal Cash Management Money Market Fund | | Other information (unaudited) |
BOARD CONSIDERATION OF INVESTMENT MANAGEMENT AND SUB-ADVISORY AGREEMENTS:
Wells Fargo Municipal Cash Management Money Market Fund
Under the Investment Company Act of 1940 (the “1940 Act”), the Board of Trustees (the “Board”) of Wells Fargo Funds Trust (the “Trust”) must determine annually whether to approve the continuation of the Trust’s investment management and sub-advisory agreements. In this regard, at an in-person meeting held on May 22-23, 2018 (the “Meeting”), the Board, all the members of which have no direct or indirect interest in the investment management and sub-advisory agreements and are not “interested persons” of the Trust, as defined in the 1940 Act (the “Independent Trustees”), reviewed and approved for Wells Fargo Municipal Cash Management Money Market Fund (the “Fund”): (i) an investment management agreement (the “Management Agreement”) with Wells Fargo Funds Management, LLC (“Funds Management”); and (ii) an investment sub-advisory agreement (the “Sub-Advisory Agreement”) with Wells Capital Management Incorporated (the “Sub-Adviser”), an affiliate of Funds Management. The Management Agreement and the Sub-Advisory Agreement are collectively referred to as the “Advisory Agreements.”
At the Meeting, the Board considered the factors and reached the conclusions described below relating to the selection of Funds Management and the Sub-Adviser and the approval of the Advisory Agreements. Prior to the Meeting, including at an in-person meeting in April 2018, the Trustees conferred extensively among themselves and with representatives of Funds Management about these matters. Also, the Board has adopted a team-based approach, with each team consisting of a sub-set of Trustees, to assist the full Board in the discharge of its duties in reviewing investment performance and other matters throughout the year. The Independent Trustees were assisted in their evaluation of the Advisory Agreements by independent legal counsel, from whom they received separate legal advice and with whom they met separately.
In providing information to the Board, Funds Management and the Sub-Adviser were guided by a detailed set of requests for information submitted to them by independent legal counsel on behalf of the Independent Trustees at the start of the Board’s annual contract renewal process earlier in 2018. In considering and approving the Advisory Agreements, the Trustees considered the information they believed relevant, including but not limited to the information discussed below. The Board considered not only the specific information presented in connection with the Meeting, but also the knowledge gained over time through interaction with Funds Management and the Sub-Adviser about various topics. In this regard, the Board reviewed reports of Funds Management at each of its quarterly meetings, which included, among other things, portfolio reviews and investment performance reports. In addition, the Board and the teams mentioned above confer with portfolio managers at various times throughout the year. The Board did not identify any particular information or consideration that was all-important or controlling, and each individual Trustee may have attributed different weights to various factors.
After its deliberations, the Board unanimously approved the continuation of the Advisory Agreements for a one-year term and determined that the compensation payable to Funds Management and the Sub-Adviser under each of the Advisory Agreements was reasonable. The Board considered the approval of the Advisory Agreements for the Fund as part of its consideration of agreements for funds across the complex, but its approvals were made on a fund-by-fund basis. The following summarizes a number of important, but not necessarily all, factors considered by the Board in support of its approvals.
Nature, extent and quality of services
The Board received and considered various information regarding the nature, extent and quality of services provided to the Fund by Funds Management and the Sub-Adviser under the Advisory Agreements. This information included a description of the investment advisory services and Fund-level administrative services covered by the Management Agreement, as well as, among other things, a summary of the background and experience of senior management of Wells Fargo Asset Management (“WFAM”), of which Funds Management and the Sub-Adviser are a part, a summary of investments made in the business of WFAM, a summary of certain organizational and personnel changes involving Funds Management and the Sub-Adviser, and a description of Funds Management’s and the Sub-Adviser’s business continuity planning programs and of their approaches to data privacy and cybersecurity. The Board also considered the qualifications, background, tenure and responsibilities of each of the portfolio managers primarily responsible for the day-to-day portfolio management of the Fund.
The Board evaluated the ability of Funds Management and the Sub-Adviser to attract and retain qualified investment professionals, including research, advisory and supervisory personnel. The Board further considered the compliance programs and compliance records of Funds Management and the Sub-Adviser. In addition, the Board took into account the full range of services provided to the Fund by Funds Management and its affiliates.
| | | | | | |
| Other information (unaudited) | | Wells Fargo Municipal Cash Management Money Market Fund | | | 29 | |
Fund investment performance and expenses
The Board considered the investment performance results for the Fund over various time periods ended December 31, 2017. The Board considered these results in comparison to the investment performance of funds in a universe that was determined by Broadridge Inc. (“Broadridge”) to be similar to the Fund (the “Universe”) and to other comparative data. Broadridge is an independent provider of investment company data. The Board received a description of the methodology used by Broadridge to select the mutual funds in the performance Universe. The Board noted that the investment performance of the Fund (Institutional Class) was higher than the average investment performance of the Universe for all periods under review.
The Board also received and considered information regarding the Fund’s net operating expense ratios and their various components, including actual management fees, custodian and other non-management fees, and Rule 12b-1 and non-Rule 12b-1 shareholder service fees. The Board considered these ratios in comparison to the median ratios of funds in class-specific expense groups that were determined by Broadridge to be similar to the Fund (the “Groups”). The Board received a description of the methodology used by Broadridge to select the mutual funds in the expense Groups and an explanation of how funds comprising expense groups and their expense ratios may vary from year-to-year. Based on the Broadridge reports, the Board noted that the net operating expense ratios of the Fund were in range of the median net operating expense ratios of the expense Groups for the Administrator Class and Institutional Class, but higher than the median net operating expense ratios of the expense Group for the Service Class.
The Board took into account the Fund’s investment performance and expense information provided to it among the factors considered in deciding to re-approve the Advisory Agreements.
Investment management and sub-advisory fee rates
The Board reviewed and considered the contractual fee rates payable by the Fund to Funds Management under the Management Agreement, as well as the contractual fee rates payable by the Fund to Funds Management for class-level administrative services under a Class-Level Administration Agreement, which include, among other things, class-level transfer agency and sub-transfer agency costs (collectively, the “Management Rates”). The Board also reviewed and considered the contractual investment sub-advisory fee rates that are payable by Funds Management to the Sub-Adviser for investment sub-advisory services.
Among other information reviewed by the Board was a comparison of the Fund’s Management Rates with the average contractual investment management fee rates of funds in the expense Groups at a common asset level as well as transfer agency costs of the funds in the expense Groups. The Board noted that the Management Rates of the Fund were lower than, equal to, or in range of the sum of these average rates for the Fund’s expense Groups for all share classes.
The Board also received and considered information about the portion of the total management fee that was retained by Funds Management after payment of the fee to the Sub-Adviser for sub-advisory services. In assessing the reasonableness of this amount, the Board received and evaluated information about the nature and extent of responsibilities retained and risks assumed by Funds Management and not delegated to or assumed by the Sub-Adviser, and about Funds Management’s on-going oversight services. Given the affiliation between Funds Management and the Sub-Adviser, the Board ascribed limited relevance to the allocation of fees between them.
Based on its consideration of the factors and information it deemed relevant, including those described here, the Board determined that the compensation payable to Funds Management under the Management Agreement and to the Sub-Adviser under the Sub-Advisory Agreement was reasonable.
Profitability
The Board received and considered information concerning the profitability of Funds Management, as well as the profitability of both WFAM and Wells Fargo & Co. (“Wells Fargo”) as a whole, from providing services to the Fund and the fund family as a whole. The Board noted that the Sub-Adviser’s profitability information with respect to providing services to the Fund was subsumed in the WFAM and Wells Fargo profitability analysis.
Funds Management reported on the methodologies and estimates used in calculating profitability, including a description of the methodology used to allocate certain expenses and recent enhancements made to the methodology. Among other things, the Board noted that the levels of profitability reported on a fund-by-fund basis varied widely, depending on factors such as the size and type of fund. Based on its review, the Board did not deem the profits reported by Funds Management, WFAM or Wells Fargo from services provided to the Fund to be at a level that would prevent it from approving the continuation of the Advisory Agreements.
| | | | |
| 30 | | Wells Fargo Municipal Cash Management Money Market Fund | | Other information (unaudited) |
Economies of scale
The Board considered the extent to which Funds Management may experience economies of scale in the provision of management services, and the extent to which scale benefits, if any, would be shared with shareholders. In particular, the Board noted the existence of breakpoints in the Fund’s management fee structure, which operate generally to reduce the Fund’s expense ratios as the Fund grows in size. It considered that, for a small fund or a fund that shrinks in size, breakpoints conversely can result in higher fee levels. The Board also considered that in addition to management fee breakpoints, competitive management fee rates set at the outset without regard to breakpoints and fee waiver and expense reimbursement arrangements, as well as investments in the business intended to enhance services available to Fund shareholders, are means of sharing potential economies of scale with shareholders of the Fund.
The Board concluded that the Fund’s fee and expense arrangements, including contractual breakpoints, constituted a reasonable approach to sharing potential economies of scale with the Fund and its shareholders.
Other benefits to Funds Management and the Sub-Adviser
The Board received and considered information regarding potential “fall-out” or ancillary benefits received by Funds Management and its affiliates, including the Sub-Adviser, as a result of their relationships with the Fund. Ancillary benefits could include, among others, benefits directly attributable to other relationships with the Fund and benefits potentially derived from an increase in Funds Management’s and the Sub-Adviser’s business as a result of their relationships with the Fund. The Board noted that various affiliates of Funds Management may receive distribution-related fees, shareholder servicing payments and sub-transfer agency fees in respect of shares sold or held through them and services provided.
The Board also reviewed information about soft dollar credits earned and utilized by the Sub-Adviser, fees earned by Funds Management and the Sub-Adviser from managing a private investment vehicle for the fund family’s securities lending collateral and commissions earned by an affiliated broker from portfolio transactions.
Based on its consideration of the factors and information it deemed relevant, including those described here, the Board did not find that any ancillary benefits received by Funds Management and its affiliates, including the Sub-Adviser, were unreasonable.
Conclusion
At the Meeting, after considering the above-described factors and based on its deliberations and its evaluation of the information described above, the Board unanimously approved the continuation of the Advisory Agreements for a one-year term and determined that the compensation payable to Funds Management and the Sub-Adviser under each of the Advisory Agreements was reasonable.
This page is intentionally left blank.
This page is intentionally left blank.

For more information
More information about Wells Fargo Funds is available free upon request. To obtain literature, please write, email, visit the Fund’s website, or call:
Wells Fargo Funds
P.O. Box 219967
Kansas City, MO 64121-9967
Website: wellsfargofunds.com
Individual investors: 1-800-222-8222
Retail investment professionals: 1-888-877-9275
Institutional investment professionals: 1-866-765-0778
This report and the financial statements contained herein are submitted for the general information of the shareholders of the Fund. If this report is used for promotional purposes, distribution of the report must be accompanied or preceded by a current prospectus. Before investing, please consider the investment objectives, risks, charges, and expenses of the investment. For a current prospectus and, if available, a summary prospectus, containing this information, call 1-800-222-8222 or visit the Fund’s website at wellsfargofunds.com. Read the prospectus carefully before you invest or send money.
Wells Fargo Asset Management (WFAM) is the trade name for certain investment advisory/management firms owned by Wells Fargo & Company. These firms include but are not limited to Wells Capital Management Incorporated and Wells Fargo Funds Management, LLC. Certain products managed by WFAM entities are distributed by Wells Fargo Funds Distributor, LLC (a broker/dealer and Member FINRA).
This material is for general informational and educational purposes only and is NOT intended to provide investment advice or a recommendation of any kind—including a recommendation for any specific investment, strategy, or plan.
NOT FDIC INSURED ◾ NO BANK GUARANTEE ◾ MAY LOSE VALUE
© 2018 Wells Fargo Funds Management, LLC. All rights reserved.
| | |
 | | 314809 09-18 SA307/SAR307 07-18 |
Semi-Annual Report
July 31, 2018

Government Money Market Funds

| ∎ | | Wells Fargo Government Money Market Fund |

Reduce clutter. Save trees.
Sign up for electronic delivery of prospectuses and shareholder reports at wellsfargo.com/advantagedelivery
Contents
The views expressed and any forward-looking statements are as of July 31, 2018, unless otherwise noted, and are those of the Fund managers and/or Wells Fargo Funds Management, LLC. Discussions of individual securities, or the markets generally, or any Wells Fargo Fund are not intended as individual recommendations. Future events or results may vary significantly from those expressed in any forward-looking statements. The views expressed are subject to change at any time in response to changing circumstances in the market. Wells Fargo Funds Management, LLC and the Fund disclaim any obligation to publicly update or revise any views expressed or forward-looking statements.
NOT FDIC INSURED ◾ NO BANK GUARANTEE ◾ MAY LOSE VALUE
| | | | |
| 2 | | Wells Fargo Government Money Market Fund | | Letter to shareholders (unaudited) |

Andrew Owen
President
Wells Fargo Funds
Yields on money market funds benefited during the period.
During February 2018, the U.S. stock market endured a loss of more than 10% before recovering in March and April.
Dear Shareholder:
We are pleased to offer you this semi-annual report for the Wells Fargo Government Money Market Fund for the six-month period that ended July 31, 2018. Yields on money market funds benefited during the period. As the U.S. Federal Reserve (the Fed) moved toward a more normalized monetary policy after an extended term of low interest rates following the global financial crisis during 2007 and 2008, its steady pace of interest rate increases helped raise yields on short-term money market instruments.
Globally, stock markets followed a less consistent path during the period. After advancing during the summer and fall of 2017 in a roughly synchronized way, economic growth and stock markets globally diverged during the first seven months of 2018. For fixed-income investors, higher U.S. interest rates, rising inflation, and intensifying global geopolitical tensions tended to restrain taxable bond prices while high-yield and municipal bond investors generally enjoyed positive returns.
For the period, U.S. stocks, as measured by the S&P 500 Index,1 gained 0.70%, and international stocks, as measured by the MSCI ACWI ex USA Index (Net),2 fell 6.66%. Emerging market stocks, as measured by the MSCI EM Index (Net),3 dropped 11.94%. In bond markets, the Bloomberg Barclays U.S. Aggregate Bond Index4 declined 0.45% while fixed-income investments outside the U.S. fell 4.57%, according to the Bloomberg Barclays Global Aggregate ex-USD Index.5 The Bloomberg Barclays Municipal Bond Index6 added 1.18%, and the ICE BofAML U.S. High Yield Index7 was up 0.55%.
Volatility reemerged during the first quarter of 2018 as economic signals were mixed.
The first quarter of 2018 began with stock market gains in January following U.S. tax reform that lowered rates for individuals and corporations and deregulation advanced in some economic sectors. Then, investor optimism was supplanted by several concerns. Trade tensions intensified, particularly between the U.S. and China. The U.S. threatened to impose tariffs on a broad range of imported products. Increasing interest rates and inflation also caused concern. During February 2018, the U.S. stock market endured a loss of more than 10% before recovering in March and April. The S&P 500 Index closed the first quarter with a negative return, the first negative quarterly return for the index since 2014.
| 1 | The S&P 500 Index consists of 500 stocks chosen for market size, liquidity, and industry group representation. It is a market-value-weighted index with each stock’s weight in the index proportionate to its market value. You cannot invest directly in an index. |
| 2 | The Morgan Stanley Capital International (MSCI) All Country World Index (ACWI) ex USA Index (Net) is a free-float-adjusted market-capitalization-weighted index that is designed to measure the equity market performance of developed markets, excluding the United States and Canada. Source: MSCI. MSCI makes no express or implied warranties or representations and shall have no liability whatsoever with respect to any MSCI data contained herein. The MSCI data may not be further redistributed or used as a basis for other indices or any securities or financial products. This report is not approved, reviewed, or produced by MSCI. You cannot invest directly in an index. |
| 3 | The MSCI Emerging Markets (EM) Index (Net) is a free-float-adjusted market-capitalization-weighted index that is designed to measure large- and mid-cap equity market performance of emerging markets. The MSCI EM Index (Net) consists of the following 24 emerging market country indices: Brazil, Chile, China, Colombia, Czech Republic, Egypt, Greece, Hungary, India, Indonesia, Korea, Malaysia, Mexico, Pakistan, Peru, the Philippines, Poland, Qatar, Russia, South Africa, Taiwan, Thailand, Turkey, and the United Arab Emirates. You cannot invest directly in an index. |
| 4 | The Bloomberg Barclays U.S. Aggregate Bond Index is a broad-based benchmark that measures the investment-grade, U.S. dollar-denominated, fixed-rate taxable bond market, including Treasuries, government-related and corporate securities, mortgage-backed securities (agency fixed-rate and hybrid adjustable-rate mortgage pass-throughs), asset-backed securities, and commercial mortgage-backed securities. You cannot invest directly in an index. |
| 5 | The Bloomberg Barclays Global Aggregate ex-USD Index is an unmanaged index that provides a broad-based measure of the global investment-grade fixed-income markets excluding the U.S. dollar-denominated debt market. You cannot invest directly in an index. |
| 6 | The Bloomberg Barclays Municipal Bond Index is an unmanaged index composed of long-term tax-exempt bonds with a minimum credit rating of Baa. You cannot invest directly in an index. |
| 7 | The ICE BofAML U.S. High Yield Index is a market-capitalization-weighted index of domestic and Yankee high-yield bonds. The index tracks the performance of high-yield securities traded in the U.S. bond market. You cannot invest directly in an index. Copyright 2018. ICE Data Indices, LLC. All rights reserved. |
| 8 | The Consumer Price Index For All Urban Consumers (CPI-U) measures the changes in the price of a basket of goods and services purchased by urban consumers. The urban consumer population is deemed by many as a better representative measure of the general public because most of the country’s population lives in highly populated areas, which represent close to 90% of the total population. You cannot invest directly in an index. |
| | | | | | |
| Letter to shareholders (unaudited) | | Wells Fargo Government Money Market Fund | | | 3 | |
The Fed increased the federal funds rate by 25 basis points (bps; 100 bps equal 1.00%) in March 2018 and the rate of inflation reached the Fed’s 2% target for the first time in a year. The unemployment rate fell to 4.1%. The third revision of first-quarter gross domestic product (GDP) growth by the U.S. Bureau of Economic Analysis released during June 2018 was lowered to 2.0%.
Overseas, investment market returns reversed the strong returns of 2017. After having gained 27.19% for the 12-month period that ended on December 31, 2017, the MSCI ACWI ex USA Index (Net) fell 1.46% for the seven-month period that ended July 31, 2018. The U.S. dollar strengthened relative to local currencies, which served to restrain returns.
Global trade tensions escalated during the second quarter and into the third quarter of 2018.
Global trade tensions escalated as the second quarter of 2018 opened and equity markets fell in response before resuming upward momentum later in April. The U.S. government imposed tariffs on products and commodities imported from other markets in North America, Europe, and Asia. In retaliation, governments imposed tariffs on U.S. products and commodities. In addition, the U.S. pushed its North American neighbors to renegotiate the North American Free Trade Agreement, furthering trade tensions and investor uncertainty.
The CPI-U8 added 0.2% in May after a similar increase in April. On a year-over-year basis, the all-items index rose 2.8% for the 12 months that ended May 31, continuing its upward trend since the beginning of the year. The index for all items less food and energy rose 2.2% for the same 12-month period. Interest rates generally increased and the bond markets tended to decline.
During June 2018, the Fed increased the federal funds rate by 25 bps. Investment markets began to anticipate two more rate increases in 2018. Long-term interest rates in the U.S. trended higher—rates on the 10-year and 30-year Treasury bonds moved from 2.46% and 2.81%, respectively, on January 1, 2018, to 2.96% and 3.08%, respectively, on July 31, 2018. While higher at the end of the period, rates were off their peak levels on May 17, 2018, of 3.11% and 3.25%, respectively. Investors became more aware of and concerned about the potential for an inverted yield curve—sometimes a recession signal—as short-term rates increased more quickly than long-term rates.
The unemployment rate fell to 3.9% in July after ticking up slightly in June from May’s 3.8% level, according to the U.S. Department of Labor. The annualized rate of GDP growth for the second quarter of 2018 was reported in July to be 4.1%, the highest level since the third quarter of 2014, according to the U.S. Bureau of Economic Analysis.
Internationally, the prospects for a smooth U.K. Brexit agreement was cast into doubt as members of Prime Minister Theresa May’s negotiating team resigned. Despite the uncertainty, the period closed with expectations that the Bank of England’s Monetary Policy Committee in July would announce an increase in its key interest rate to 0.75%, which it did in early August.
Meanwhile, central banks in Europe and Japan maintained low interest rates and accommodative monetary policies. Amid rising trade uncertainty, People’s Bank of China monetary policies shifted with cuts to reserve requirement ratios and implementation of supportive measures such as accelerated infrastructure spending and tax cuts for small and medium enterprises and for individuals. Nevertheless, a strengthening U.S. dollar and the tensions associated with trade policies remained headwinds for investors overseas.
| | | | |
| 4 | | Wells Fargo Government Money Market Fund | | Letter to shareholders (unaudited) |
Don’t let short-term uncertainty derail long-term investment goals.
Periods of investment uncertainty can present challenges, but experience has taught us that maintaining long-term investment goals can be an effective way to plan for the future. To help you create a sound strategy based on your personal goals and risk tolerance, Wells Fargo Funds offers more than 100 mutual funds spanning a wide range of asset classes and investment styles. Although diversification cannot guarantee an investment profit or prevent losses, we believe it can be an effective way to manage investment risk and potentially smooth out overall portfolio performance. We encourage investors to know their investments and to understand that appropriate levels of risk-taking may unlock opportunities.
Thank you for choosing to invest with Wells Fargo Funds. We appreciate your confidence in us and remain committed to helping you meet your financial needs.
Sincerely,

Andrew Owen
President
Wells Fargo Funds
For further information about your Fund, contact your investment professional, visit our website at wellsfargofunds.com, or call us directly at 1-800-222-8222.
This page is intentionally left blank.
| | | | |
| 6 | | Wells Fargo Government Money Market Fund | | Performance highlights (unaudited) |
Investment objective
The Fund seeks current income, while preserving capital and liquidity.
Manager
Wells Fargo Funds Management, LLC
Subadviser
Wells Capital Management Incorporated
Portfolio managers
Michael C. Bird, CFA®
Jeffrey L. Weaver, CFA®
Laurie White
Average annual total returns (%) as of July 31, 20181
| | | | | | | | | | | | | | | | | | | | | | |
| | | | | | | | Expense ratios2 (%) | |
| | | Inception date | | 1 year | | | 5 year | | | 10 year | | | Gross | | | Net3 | |
| Class A (WFGXX) | | 11-8-1999 | | | 0.83 | | | | 0.19 | | | | 0.15 | | | | 0.61 | | | | 0.60 | |
| Administrator Class (WGAXX) | | 7-31-2003 | | | 1.10 | | | | 0.29 | | | | 0.21 | | | | 0.34 | | | | 0.34 | |
| Institutional Class (GVIXX) | | 7-28-2003 | | | 1.24 | | | | 0.36 | | | | 0.27 | | | | 0.22 | | | | 0.20 | |
| Select Class (WFFXX) | | 6-30-2015 | | | 1.30 | | | | 0.40 | | | | 0.28 | | | | 0.18 | | | | 0.14 | |
| Service Class (NWGXX) | | 11-16-1987 | | | 0.94 | | | | 0.23 | | | | 0.17 | | | | 0.51 | | | | 0.50 | |
| Sweep Class | | 6-30-2010 | | | 0.67 | | | | 0.15 | | | | 0.13 | | | | 0.77 | | | | 0.77 | |
Yield summary (%) as of July 31, 20183
| | | | | | | | | | | | | | | | | | | | | | |
| | | Class A | | Administrator
Class | | | Institutional
Class | | | Select
Class | | | Service
Class | | | Sweep
Class | |
| 7-day current yield | | 1.37 | | | 1.63 | | | | 1.77 | | | | 1.83 | | | | 1.47 | | | | 1.20 | |
| 7-day compound yield | | 1.38 | | | 1.64 | | | | 1.78 | | | | 1.84 | | | | 1.48 | | | | 1.21 | |
| 30-day simple yield | | 1.37 | | | 1.63 | | | | 1.77 | | | | 1.83 | | | | 1.47 | | | | 1.20 | |
| 30-day compound yield | | 1.38 | | | 1.65 | | | | 1.78 | | | | 1.85 | | | | 1.48 | | | | 1.21 | |
Figures quoted represent past performance, which is no guarantee of future results, and do not reflect taxes that a shareholder may pay on fund distributions or the redemption of fund shares. Investment returns will fluctuate. The Fund’s yield figures more closely reflect the current earnings of the Fund than the total return figures. Current performance may be lower or higher than the performance data quoted, which assumes the reinvestment of dividends and capital gains. Current month-end performance is available on the Fund’s website, wellsfargofunds.com.
Each class is sold without a front-end sales charge or contingent deferred sales charge.
For government money market funds: You could lose money by investing in the Fund. Although the Fund seeks to preserve the value of your investment at $1.00 per share, it cannot guarantee it will do so. An investment in the Fund is not insured or guaranteed by the Federal Deposit Insurance Corporation or any other government agency. The Fund’s sponsor has no legal obligation to provide financial support to the Fund, and you should not expect that the sponsor will provide financial support to the Fund at any time.
Please see footnotes on page 7.
| | | | | | |
| Performance highlights (unaudited) | | Wells Fargo Government Money Market Fund | | | 7 | |
| | |
| Portfolio composition as of July 31, 20184 |
|
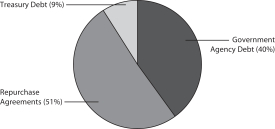
|
| | |
| Effective maturity distribution as of July 31, 20184 |
|
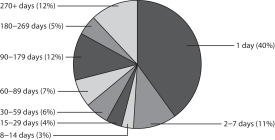 |
|
| Weighted average maturity as of July 31, 20185 |
22 days |
|
| Weighted average life as of July 31, 20186 |
93 days |
| 1 | Historical performance shown for the Select Class shares prior to their inception reflects the performance of the Institutional Class shares, and includes the higher expenses applicable to Institutional Class shares. If these expenses had not been included, returns for Select Class shares would be higher. Historical performance shown for Sweep Class shares prior to their inception reflects the performance of Service Class shares, and has not been adjusted to include the higher expenses applicable to Sweep Class shares. If these expenses had been included, returns for Sweep Class shares would be lower. |
| 2 | Reflects the expense ratios as stated in the most recent prospectuses. The expense ratios shown are subject to change and may differ from the annualized expense ratios shown in the financial highlights of this report. |
| 3 | The manager has contractually committed through May 31, 2019, to waive fees and/or reimburse expenses to the extent necessary to cap the Fund’s Total Annual Fund Operating Expenses After Fee Waivers at 0.60% for Class A, 0.35% for Administrator Class, 0.20% for Institutional Class, 0.14% for Select Class, 0.50% for Service Class, and 0.77% for Sweep Class. After this time, the cap may be increased or the commitment to maintain the cap may be terminated only with the approval of the Board of Trustees. Brokerage commissions, stamp duty fees, interest, taxes, acquired fund fees and expenses (if any), and extraordinary expenses are excluded from the expense cap. Without this cap, the Fund’s returns would have been lower. Without waived fees and/or reimbursed expenses, the Fund’s 7-day current yield would have been 1.36%, 1.63%, 1.75%, 1.79%, 1.46%, and 1.20% for Class A, Administrator Class, Institutional Class, Select Class, Service Class, and Sweep Class, respectively. The expense ratio paid by an investor is the net expense ratio (the total annual fund operating expenses after fee waivers) as stated in the prospectuses. |
| 4 | Amounts are calculated based on the total investments of the Fund. These amounts are subject to change and may have changed since the date specified. |
| 5 | Weighted Average Maturity (WAM): WAM is an average of the effective maturities of all securities held in the portfolio, weighted by each security’s percentage of total investments. The maturity of a portfolio security is the period remaining until the date on which the principal amount is unconditionally required to be paid, or in the case of a security called for redemption, the date on which the redemption payment is unconditionally required to be made. WAM calculations allow for the maturities of certain securities with demand features or periodic interest rate resets to be shortened. WAM is a way to measure a fund’s sensitivity to potential interest rate changes. WAM is subject to change and may have changed since the date specified. |
| 6 | Weighted Average Life (WAL): WAL is an average of the final maturities of all securities held in the portfolio, weighted by their percentage of total investments. The maturity of a portfolio security is the period remaining until the date on which the principal amount is unconditionally required to be paid, or in the case of a security called for redemption, the date on which the redemption payment is unconditionally required to be made. In contrast to WAM, the calculation of WAL allows for the maturities of certain securities with demand features to be shortened, but not the periodic interest rate resets. WAL is a way to measure a fund’s potential sensitivity to credit spread changes. WAL is subject to change and may have changed since the date specified. |
| | | | |
| 8 | | Wells Fargo Government Money Market Fund | | Fund expenses (unaudited) |
As a shareholder of the Fund, you incur ongoing costs, including management fees, distribution (12b-1) and/or shareholder servicing fees, and other Fund expenses. This example is intended to help you understand your ongoing costs (in dollars) of investing in the Fund and to compare these costs with the ongoing costs of investing in other mutual funds.
The example is based on an investment of $1,000 invested at the beginning of the six-month period and held for the entire period from February 1, 2018 to July 31, 2018.
Actual expenses
The “Actual” line of the table below provides information about actual account values and actual expenses. You may use the information in this line, together with the amount you invested, to estimate the expenses that you paid over the period. Simply divide your account value by $1,000 (for example, an $8,600 account value divided by $1,000 = 8.6), then multiply the result by the number in the “Actual” line under the heading entitled “Expenses paid during period” for your applicable class of shares to estimate the expenses you paid on your account during this period.
Hypothetical example for comparison purposes
The “Hypothetical” line of the table below provides information about hypothetical account values and hypothetical expenses based on the Fund’s actual expense ratio and an assumed rate of return of 5% per year before expenses, which is not the Fund’s actual return. The hypothetical account values and expenses may not be used to estimate the actual ending account balance or expenses you paid for the period. You may use this information to compare the ongoing costs of investing in the Fund and other funds. To do so, compare this 5% hypothetical example with the 5% hypothetical examples that appear in the shareholder reports of the other funds.
Please note that the expenses shown in the table are meant to highlight your ongoing costs only. Therefore, the “Hypothetical” line of the table is useful in comparing ongoing costs only and will not help you determine the relative total costs of owning different funds.
| | | | | | | | | | | | | | | | |
| | | Beginning
account value
2-1-2018 | | | Ending
account value
7-31-2018 | | | Expenses
paid during
the period¹ | | | Annualized net
expense ratio | |
Class A | | | | | | | | | | | | | | | | |
Actual | | $ | 1,000.00 | | | $ | 1,005.55 | | | $ | 3.03 | | | | 0.60 | % |
Hypothetical (5% return before expenses) | | $ | 1,000.00 | | | $ | 1,022.18 | | | $ | 3.06 | | | | 0.60 | % |
Administrator Class | | | | | | | | | | | | | | | | |
Actual | | $ | 1,000.00 | | | $ | 1,006.89 | | | $ | 1.72 | | | | 0.34 | % |
Hypothetical (5% return before expenses) | | $ | 1,000.00 | | | $ | 1,023.49 | | | $ | 1.73 | | | | 0.34 | % |
Institutional Class | | | | | | | | | | | | | | | | |
Actual | | $ | 1,000.00 | | | $ | 1,007.57 | | | $ | 1.01 | | | | 0.20 | % |
Hypothetical (5% return before expenses) | | $ | 1,000.00 | | | $ | 1,024.20 | | | $ | 1.02 | | | | 0.20 | % |
Select Class | | | | | | | | | | | | | | | | |
Actual | | $ | 1,000.00 | | | $ | 1,007.87 | | | $ | 0.71 | | | | 0.14 | % |
Hypothetical (5% return before expenses) | | $ | 1,000.00 | | | $ | 1,024.50 | | | $ | 0.71 | | | | 0.14 | % |
Service Class | | | | | | | | | | | | | | | | |
Actual | | $ | 1,000.00 | | | $ | 1,006.07 | | | $ | 2.53 | | | | 0.50 | % |
Hypothetical (5% return before expenses) | | $ | 1,000.00 | | | $ | 1,022.68 | | | $ | 2.55 | | | | 0.50 | % |
Sweep Class | | | | | | | | | | | | | | | | |
Actual | | $ | 1,000.00 | | | $ | 1,004.74 | | | $ | 3.89 | | | | 0.77 | % |
Hypothetical (5% return before expenses) | | $ | 1,000.00 | | | $ | 1,021.32 | | | $ | 3.92 | | | | 0.77 | % |
| 1 | Expenses paid is equal to the annualized net expense ratio of each class multiplied by the average account value over the period, multiplied by the number of days in the most recent fiscal half-year divided by the number of days in the fiscal year (to reflect the one-half-year period). |
| | | | | | |
| Portfolio of investments—July 31, 2018 (unaudited) | | Wells Fargo Government Money Market Fund | | | 9 | |
| | | | | | | | | | | | | | | | |
| Security name | | Interest rate | | | Maturity date | | | Principal | | | Value | |
|
Government Agency Debt: 39.89% | |
FFCB | | | 0.93 | % | | | 9-6-2018 | | | $ | 15,000,000 | | | $ | 14,989,586 | |
FFCB (z) | | | 1.60 | | | | 8-2-2018 | | | | 100,000,000 | | | | 99,995,611 | |
FFCB (z) | | | 1.61 | | | | 8-6-2018 | | | | 100,000,000 | | | | 99,977,917 | |
FFCB (z) | | | 1.62 | | | | 8-21-2018 | | | | 20,000,000 | | | | 19,982,222 | |
FFCB (z) | | | 1.64 | | | | 8-17-2018 | | | | 15,000,000 | | | | 14,989,200 | |
FFCB (z) | | | 1.65 | | | | 8-22-2018 | | | | 100,000,000 | | | | 99,904,917 | |
FFCB (z) | | | 1.68 | | | | 9-7-2018 | | | | 50,000,000 | | | | 49,914,438 | |
FFCB (z) | | | 1.69 | | | | 9-26-2018 | | | | 100,000,000 | | | | 99,740,222 | |
FFCB (z) | | | 1.87 | | | | 12-17-2018 | | | | 10,000,000 | | | | 9,929,467 | |
FFCB (z) | | | 1.89 | | | | 9-27-2018 | | | | 17,000,000 | | | | 16,949,666 | |
FFCB (1 Month LIBOR -0.14%) ± | | | 1.93 | | | | 8-24-2018 | | | | 300,000,000 | | | | 299,999,427 | |
FFCB (1 Month LIBOR -0.14%) ± | | | 1.94 | | | | 6-13-2019 | | | | 88,000,000 | | | | 87,912,131 | |
FFCB (1 Month LIBOR -0.13%) ± | | | 1.94 | | | | 8-15-2018 | | | | 50,000,000 | | | | 49,999,865 | |
FFCB (1 Month LIBOR -0.15%) ± | | | 1.95 | | | | 1-4-2019 | | | | 200,000,000 | | | | 199,998,282 | |
FFCB (1 Month LIBOR -0.10%) ± | | | 1.97 | | | | 7-25-2019 | | | | 250,000,000 | | | | 249,990,141 | |
FFCB (1 Month LIBOR -0.10%) ± | | | 1.97 | | | | 8-15-2019 | | | | 118,000,000 | | | | 117,990,747 | |
FFCB (1 Month LIBOR -0.08%) ± | | | 1.98 | | | | 10-25-2019 | | | | 208,000,000 | | | | 207,995,985 | |
FFCB (1 Month LIBOR -0.08%) ± | | | 1.99 | | | | 11-12-2019 | | | | 100,000,000 | | | | 100,000,213 | |
FFCB (1 Month LIBOR -0.10%) ± | | | 1.99 | | | | 7-19-2019 | | | | 145,000,000 | | | | 144,992,878 | |
FFCB (1 Month LIBOR -0.08%) ± | | | 1.99 | | | | 7-15-2019 | | | | 200,000,000 | | | | 199,990,435 | |
FFCB (1 Month LIBOR -0.09%) ± | | | 1.99 | | | | 8-19-2019 | | | | 200,000,000 | | | | 199,989,334 | |
FFCB (1 Month LIBOR -0.10%) ± | | | 1.99 | | | | 12-2-2019 | | | | 37,000,000 | | | | 36,986,251 | |
FFCB (1 Month LIBOR -0.08%) ± | | | 2.00 | | | | 4-29-2019 | | | | 100,000,000 | | | | 99,996,967 | |
FFCB (1 Month LIBOR -0.08%) ± | | | 2.00 | | | | 1-30-2020 | | | | 75,000,000 | | | | 74,991,110 | |
FFCB (1 Month LIBOR -0.10%) ± | | | 2.00 | | | | 10-8-2019 | | | | 116,500,000 | | | | 116,467,605 | |
FFCB (z) | | | 2.00 | | | | 10-23-2018 | | | | 75,000,000 | | | | 74,655,896 | |
FFCB (1 Month LIBOR -0.08%) ± | | | 2.00 | | | | 9-23-2019 | | | | 150,000,000 | | | | 149,999,239 | |
FFCB (1 Month LIBOR -0.07%) ± | | | 2.00 | | | | 9-12-2019 | | | | 100,000,000 | | | | 99,994,414 | |
FFCB (1 Month LIBOR -0.08%) ± | | | 2.01 | | | | 6-10-2019 | | | | 200,000,000 | | | | 199,983,150 | |
FFCB (1 Month LIBOR -0.08%) ± | | | 2.01 | | | | 11-20-2019 | | | | 150,000,000 | | | | 149,960,241 | |
FFCB (1 Month LIBOR -0.07%) ± | | | 2.01 | | | | 4-18-2019 | | | | 150,000,000 | | | | 150,011,711 | |
FFCB (1 Month LIBOR -0.08%) ± | | | 2.01 | | | | 6-5-2019 | | | | 35,000,000 | | | | 34,998,537 | |
FFCB (1 Month LIBOR -0.08%) ± | | | 2.01 | | | | 7-10-2019 | | | | 147,200,000 | | | | 147,200,000 | |
FFCB (z) | | | 2.01 | | | | 10-29-2018 | | | | 50,000,000 | | | | 49,752,778 | |
FFCB (1 Month LIBOR -0.05%) ± | | | 2.02 | | | | 3-12-2020 | | | | 250,000,000 | | | | 249,987,934 | |
FFCB (1 Month LIBOR -0.06%) ± | | | 2.02 | | | | 2-27-2020 | | | | 48,500,000 | | | | 48,496,951 | |
FFCB (1 Month LIBOR -0.05%) ± | | | 2.03 | | | | 5-14-2020 | | | | 300,000,000 | | | | 299,978,701 | |
FFCB (U.S. Treasury 3 Month Bill Money Market Yield +0.05%) ± | | | 2.06 | | | | 3-23-2020 | | | | 200,000,000 | | | | 199,986,913 | |
FFCB (U.S. Treasury 3 Month Bill Money Market Yield +0.05%) ± | | | 2.06 | | | | 6-18-2020 | | | | 100,000,000 | | | | 99,991,542 | |
FFCB (U.S. Treasury 3 Month Bill Money Market Yield +0.05%) ± | | | 2.06 | | | | 4-16-2020 | | | | 350,000,000 | | | | 349,976,215 | |
FFCB (1 Month LIBOR -0.03%) ± | | | 2.07 | | | | 4-9-2020 | | | | 250,000,000 | | | | 249,978,983 | |
FFCB (U.S. Treasury 3 Month Bill Money Market Yield +0.07%) ± | | | 2.08 | | | | 5-15-2020 | | | | 225,000,000 | | | | 225,006,264 | |
FFCB (U.S. Treasury 3 Month Bill Money Market Yield +0.09%) ± | | | 2.10 | | | | 3-26-2020 | | | | 100,000,000 | | | | 99,995,084 | |
FFCB (1 Month LIBOR +0.02%) ± | | | 2.11 | | | | 10-3-2018 | | | | 75,000,000 | | | | 75,000,698 | |
FFCB (1 Month LIBOR +0.03%) ± | | | 2.11 | | | | 8-22-2018 | | | | 250,000,000 | | | | 249,999,396 | |
FFCB (3 Month LIBOR -0.20%) ± | | | 2.12 | | | | 3-6-2020 | | | | 75,000,000 | | | | 74,995,244 | |
FFCB (1 Month LIBOR +0.05%) ± | | | 2.12 | | | | 11-15-2018 | | | | 250,000,000 | | | | 249,998,539 | |
FFCB (1 Month LIBOR +0.05%) ± | | | 2.13 | | | | 1-27-2020 | | | | 158,500,000 | | | | 158,759,234 | |
FFCB (3 Month LIBOR -0.21%) ± | | | 2.13 | | | | 8-15-2018 | | | | 25,000,000 | | | | 24,999,913 | |
FFCB (1 Month LIBOR +0.07%) ± | | | 2.14 | | | | 11-29-2018 | | | | 100,000,000 | | | | 99,998,345 | |
The accompanying notes are an integral part of these financial statements.
| | | | |
| 10 | | Wells Fargo Government Money Market Fund | | Portfolio of investments—July 31, 2018 (unaudited) |
| | | | | | | | | | | | | | | | |
| Security name | | Interest rate | | | Maturity date | | | Principal | | | Value | |
|
Government Agency Debt (continued) | |
FFCB (3 Month LIBOR -0.20%) ± | | | 2.14 | % | | | 1-9-2019 | | | $ | 25,000,000 | | | $ | 25,000,000 | |
FFCB (3 Month LIBOR -0.20%) ± | | | 2.14 | | | | 4-16-2019 | | | | 25,000,000 | | | | 24,998,318 | |
FFCB (1 Month LIBOR +0.05%) ± | | | 2.14 | | | | 1-3-2019 | | | | 50,000,000 | | | | 50,000,000 | |
FFCB (3 Month LIBOR -0.19%) ± | | | 2.15 | | | | 6-13-2019 | | | | 125,000,000 | | | | 125,001,730 | |
FFCB (z) | | | 2.16 | | | | 1-22-2019 | | | | 40,000,000 | | | | 39,588,200 | |
FFCB (1 Month LIBOR +0.07%) ± | | | 2.17 | | | | 1-8-2019 | | | | 125,000,000 | | | | 125,000,000 | |
FFCB (1 Month LIBOR +0.09%) ± | | | 2.17 | | | | 10-11-2018 | | | | 375,000,000 | | | | 374,996,193 | |
FFCB (3 Month LIBOR -0.17%) ± | | | 2.17 | | | | 4-9-2020 | | | | 100,000,000 | | | | 99,993,307 | |
FFCB (1 Month LIBOR +0.09%) ± | | | 2.17 | | | | 9-19-2018 | | | | 300,000,000 | | | | 299,998,784 | |
FFCB (1 Month LIBOR +0.09%) ± | | | 2.17 | | | | 10-19-2018 | | | | 150,000,000 | | | | 150,000,000 | |
FFCB (3 Month LIBOR -0.15%) ± | | | 2.18 | | | | 3-2-2020 | | | | 100,000,000 | | | | 99,996,848 | |
FFCB (3 Month LIBOR -0.14%) ± | | | 2.18 | | | | 8-28-2019 | | | | 25,000,000 | | | | 25,000,000 | |
FFCB (1 Month LIBOR +0.10%) ± | | | 2.19 | | | | 10-3-2018 | | | | 249,000,000 | | | | 248,997,554 | |
FFCB (1 Month LIBOR +0.11%) ± | | | 2.19 | | | | 9-6-2018 | | | | 175,000,000 | | | | 175,000,000 | |
FFCB (3 Month LIBOR -0.13%) ± | | | 2.20 | | | | 9-12-2019 | | | | 100,000,000 | | | | 99,995,540 | |
FFCB (3 Month LIBOR -0.15%) ± | | | 2.21 | | | | 11-14-2018 | | | | 27,550,000 | | | | 27,550,257 | |
FFCB (3 Month LIBOR -0.12%) ± | | | 2.22 | | | | 1-27-2020 | | | | 10,000,000 | | | | 10,014,634 | |
FFCB (3 Month LIBOR -0.13%) ± | | | 2.23 | | | | 8-14-2019 | | | | 100,000,000 | | | | 99,995,858 | |
FFCB (1 Month LIBOR +0.14%) ± | | | 2.23 | | | | 8-1-2018 | | | | 69,000,000 | | | | 69,000,000 | |
FFCB (3 Month LIBOR -0.13%) ± | | | 2.23 | | | | 8-1-2019 | | | | 100,000,000 | | | | 100,000,000 | |
FFCB (1 Month LIBOR +0.15%) ± | | | 2.24 | | | | 4-3-2019 | | | | 14,330,000 | | | | 14,354,543 | |
FFCB (1 Month LIBOR +0.16%) ± | | | 2.25 | | | | 12-2-2019 | | | | 25,000,000 | | | | 25,078,798 | |
FFCB (z) | | | 2.28 | | | | 3-4-2019 | | | | 25,000,000 | | | | 24,664,063 | |
FFCB (1 Month LIBOR +0.19%) ± | | | 2.29 | | | | 8-8-2018 | | | | 40,000,000 | | | | 40,000,388 | |
FFCB (3 Month LIBOR +0.04%) ± | | | 2.37 | | | | 11-16-2018 | | | | 8,500,000 | | | | 8,504,923 | |
FHLB (z) | | | 1.91 | | | | 8-15-2018 | | | | 300,000,000 | | | | 299,777,634 | |
FHLB | | | 0.63 | | | | 8-7-2018 | | | | 96,810,000 | | | | 96,795,336 | |
FHLB | | | 0.88 | | | | 10-1-2018 | | | | 75,265,000 | | | | 75,168,824 | |
FHLB (z) | | | 1.28 | | | | 9-26-2018 | | | | 268,000,000 | | | | 267,193,057 | |
FHLB | | | 1.50 | | | | 11-20-2018 | | | | 43,000,000 | | | | 42,978,548 | |
FHLB (z) | | | 1.89 | | | | 8-8-2018 | | | | 150,000,000 | | | | 149,945,196 | |
FHLB (z) | | | 1.89 | | | | 8-22-2018 | | | | 100,000,000 | | | | 99,890,333 | |
FHLB (z) | | | 1.90 | | | | 8-3-2018 | | | | 502,000,000 | | | | 501,947,220 | |
FHLB (z) | | | 1.90 | | | | 8-10-2018 | | | | 150,000,000 | | | | 149,929,125 | |
FHLB (z) | | | 1.90 | | | | 8-7-2018 | | | | 400,000,000 | | | | 399,873,541 | |
FHLB (z) | | | 1.92 | | | | 9-13-2018 | | | | 100,000,000 | | | | 99,773,056 | |
FHLB (z) | | | 1.92 | | | | 8-20-2018 | | | | 150,000,000 | | | | 149,848,792 | |
FHLB (z) | | | 1.92 | | | | 8-23-2018 | | | | 100,000,000 | | | | 99,882,972 | |
FHLB (z) | | | 1.92 | | | | 8-24-2018 | | | | 150,000,000 | | | | 149,816,575 | |
FHLB (z) | | | 1.93 | | | | 8-31-2018 | | | | 250,000,000 | | | | 249,599,792 | |
FHLB (1 Month LIBOR -0.16%) ± | | | 1.93 | | | | 8-1-2018 | | | | 150,000,000 | | | | 150,000,000 | |
FHLB (1 Month LIBOR -0.14%) ± | | | 1.93 | | | | 10-16-2018 | | | | 100,000,000 | | | | 100,000,000 | |
FHLB (1 Month LIBOR -0.14%) ± | | | 1.93 | | | | 12-14-2018 | | | | 200,000,000 | | | | 200,000,000 | |
FHLB (1 Month LIBOR -0.14%) ± | | | 1.93 | | | | 12-14-2018 | | | | 200,000,000 | | | | 200,000,000 | |
FHLB (1 Month LIBOR -0.14%) ± | | | 1.94 | | | | 10-26-2018 | | | | 100,000,000 | | | | 100,000,000 | |
FHLB (1 Month LIBOR -0.14%) ± | | | 1.94 | | | | 8-28-2018 | | | | 150,000,000 | | | | 150,000,000 | |
FHLB (1 Month LIBOR -0.14%) ± | | | 1.94 | | | | 11-16-2018 | | | | 150,000,000 | | | | 150,000,000 | |
FHLB (1 Month LIBOR -0.14%) ± | | | 1.94 | | | | 2-28-2019 | | | | 300,000,000 | | | | 300,000,000 | |
FHLB (1 Month LIBOR -0.13%) ± | | | 1.94 | | | | 11-15-2018 | | | | 150,000,000 | | | | 150,000,000 | |
The accompanying notes are an integral part of these financial statements.
| | | | | | |
| Portfolio of investments—July 31, 2018 (unaudited) | | Wells Fargo Government Money Market Fund | | | 11 | |
| | | | | | | | | | | | | | | | |
| Security name | | Interest rate | | | Maturity date | | | Principal | | | Value | |
|
Government Agency Debt (continued) | |
FHLB (1 Month LIBOR -0.13%) ± | | | 1.94 | % | | | 4-15-2019 | | | $ | 200,000,000 | | | $ | 200,000,000 | |
FHLB (1 Month LIBOR -0.14%) ± | | | 1.95 | | | | 11-23-2018 | | | | 250,000,000 | | | | 250,000,000 | |
FHLB (z) | | | 1.95 | | | | 9-5-2018 | | | | 14,000,000 | | | | 13,973,636 | |
FHLB (1 Month LIBOR -0.12%) ± | | | 1.95 | | | | 9-12-2018 | | | | 300,000,000 | | | | 300,000,000 | |
FHLB (1 Month LIBOR -0.15%) ± | | | 1.95 | | | | 11-1-2018 | | | | 150,000,000 | | | | 150,000,000 | |
FHLB (1 Month LIBOR -0.13%) ± | | | 1.95 | | | | 7-16-2019 | | | | 100,000,000 | | | | 100,000,000 | |
FHLB (1 Month LIBOR -0.12%) ± | | | 1.95 | | | | 8-24-2018 | | | | 100,000,000 | | | | 100,000,000 | |
FHLB (1 Month LIBOR -0.13%) ± | | | 1.95 | | | | 1-18-2019 | | | | 400,000,000 | | | | 400,000,000 | |
FHLB (1 Month LIBOR -0.14%) ± | | | 1.95 | | | | 12-3-2018 | | | | 200,000,000 | | | | 200,000,000 | |
FHLB (1 Month LIBOR -0.13%) ±%% | | | 1.95 | | | | 1-22-2019 | | | | 200,000,000 | | | | 200,000,000 | |
FHLB (1 Month LIBOR -0.13%) ±%% | | | 1.95 | | | | 2-6-2019 | | | | 200,000,000 | | | | 200,000,000 | |
FHLB (1 Month LIBOR -0.13%) ± | | | 1.95 | | | | 8-21-2018 | | | | 150,000,000 | | | | 150,000,000 | |
FHLB (1 Month LIBOR -0.13%) ± | | | 1.95 | | | | 10-23-2018 | | | | 200,000,000 | | | | 200,000,000 | |
FHLB (1 Month LIBOR -0.13%) ± | | | 1.95 | | | | 3-22-2019 | | | | 200,000,000 | | | | 200,000,000 | |
FHLB (z) | | | 1.95 | | | | 9-18-2018 | | | | 123,222,000 | | | | 122,903,266 | |
FHLB (z) | | | 1.95 | | | | 9-27-2018 | | | | 650,000,000 | | | | 647,999,459 | |
FHLB (1 Month LIBOR -0.13%) ± | | | 1.96 | | | | 9-6-2018 | | | | 100,000,000 | | | | 100,000,000 | |
FHLB (1 Month LIBOR -0.13%) ± | | | 1.96 | | | | 10-10-2018 | | | | 100,000,000 | | | | 100,000,000 | |
FHLB (1 Month LIBOR -0.14%) ± | | | 1.96 | | | | 12-7-2018 | | | | 500,000,000 | | | | 500,000,000 | |
FHLB (1 Month LIBOR -0.12%) ± | | | 1.96 | | | | 4-18-2019 | | | | 300,000,000 | | | | 300,000,000 | |
FHLB (1 Month LIBOR -0.13%) ± | | | 1.96 | | | | 11-20-2018 | | | | 100,000,000 | | | | 100,000,000 | |
FHLB (1 Month LIBOR -0.13%) ± | | | 1.96 | | | | 12-10-2018 | | | | 200,000,000 | | | | 200,000,000 | |
FHLB (1 Month LIBOR -0.12%) ± | | | 1.96 | | | | 2-22-2019 | | | | 200,000,000 | | | | 200,000,000 | |
FHLB (1 Month LIBOR -0.12%) ± | | | 1.96 | | | | 2-22-2019 | | | | 200,000,000 | | | | 200,000,000 | |
FHLB (1 Month LIBOR -0.14%) ± | | | 1.97 | | | | 12-4-2018 | | | | 150,000,000 | | | | 150,000,000 | |
FHLB (1 Month LIBOR -0.12%) ± | | | 1.97 | | | | 12-10-2018 | | | | 150,000,000 | | | | 150,000,000 | |
FHLB (1 Month LIBOR -0.11%) ± | | | 1.97 | | | | 10-26-2018 | | | | 150,000,000 | | | | 150,000,000 | |
FHLB (z) | | | 1.97 | | | | 10-2-2018 | | | | 150,000,000 | | | | 149,494,958 | |
FHLB (z) | | | 1.97 | | | | 10-10-2018 | | | | 200,000,000 | | | | 199,238,167 | |
FHLB (1 Month LIBOR -0.13%) ± | | | 1.97 | | | | 9-5-2018 | | | | 150,000,000 | | | | 150,000,000 | |
FHLB (1 Month LIBOR -0.12%) ± | | | 1.97 | | | | 9-6-2018 | | | | 150,000,000 | | | | 150,000,000 | |
FHLB (1 Month LIBOR -0.11%) ± | | | 1.97 | | | | 2-22-2019 | | | | 150,000,000 | | | | 150,000,000 | |
FHLB (1 Month LIBOR -0.13%) ± | | | 1.97 | | | | 9-7-2018 | | | | 150,000,000 | | | | 150,000,000 | |
FHLB (1 Month LIBOR -0.13%) ± | | | 1.97 | | | | 6-7-2019 | | | | 205,000,000 | | | | 204,997,886 | |
FHLB (1 Month LIBOR -0.11%) ± | | | 1.97 | | | | 12-11-2018 | | | | 250,000,000 | | | | 250,000,000 | |
FHLB (1 Month LIBOR -0.12%) ± | | | 1.98 | | | | 9-7-2018 | | | | 100,000,000 | | | | 100,000,000 | |
FHLB (1 Month LIBOR -0.09%) ± | | | 1.98 | | | | 11-28-2018 | | | | 150,000,000 | | | | 150,000,000 | |
FHLB (1 Month LIBOR -0.10%) ± | | | 1.98 | | | | 12-18-2018 | | | | 154,000,000 | | | | 154,000,402 | |
FHLB (1 Month LIBOR -0.10%) ± | | | 1.98 | | | | 12-21-2018 | | | | 100,000,000 | | | | 100,000,000 | |
FHLB (z) | | | 1.98 | | | | 10-12-2018 | | | | 250,000,000 | | | | 249,014,000 | |
FHLB (1 Month LIBOR -0.09%) ± | | | 1.98 | | | | 1-14-2019 | | | | 250,000,000 | | | | 250,013,515 | |
FHLB (1 Month LIBOR -0.09%) ± | | | 1.98 | | | | 7-16-2019 | | | | 100,000,000 | | | | 100,000,000 | |
FHLB (1 Month LIBOR -0.09%) ± | | | 1.98 | | | | 7-17-2019 | | | | 100,000,000 | | | | 100,000,077 | |
FHLB (1 Month LIBOR -0.09%) ± | | | 1.99 | | | | 7-22-2019 | | | | 100,000,000 | | | | 100,000,044 | |
FHLB (1 Month LIBOR -0.10%) ± | | | 1.99 | | | | 10-21-2019 | | | | 200,000,000 | | | | 200,000,000 | |
FHLB (1 Month LIBOR -0.08%) ± | | | 1.99 | | | | 3-15-2019 | | | | 100,000,000 | | | | 100,000,000 | |
FHLB (1 Month LIBOR -0.08%) ± | | | 1.99 | | | | 11-13-2018 | | | | 75,000,000 | | | | 75,000,000 | |
FHLB (z) | | | 2.00 | | | | 10-5-2018 | | | | 50,000,000 | | | | 49,821,250 | |
FHLB (1 Month LIBOR -0.08%) ± | | | 2.00 | | | | 3-19-2019 | | | | 100,000,000 | | | | 100,000,000 | |
FHLB (1 Month LIBOR -0.08%) ± | | | 2.01 | | | | 3-20-2019 | | | | 100,000,000 | | | | 100,000,000 | |
The accompanying notes are an integral part of these financial statements.
| | | | |
| 12 | | Wells Fargo Government Money Market Fund | | Portfolio of investments—July 31, 2018 (unaudited) |
| | | | | | | | | | | | | | | | |
| Security name | | Interest rate | | | Maturity date | | | Principal | | | Value | |
|
Government Agency Debt (continued) | |
FHLB (1 Month LIBOR -0.09%) ± | | | 2.01 | % | | | 11-8-2018 | | | $ | 75,000,000 | | | $ | 75,000,000 | |
FHLB (1 Month LIBOR -0.06%) ± | | | 2.01 | | | | 4-26-2019 | | | | 150,000,000 | | | | 150,000,000 | |
FHLB (1 Month LIBOR -0.06%) ± | | | 2.02 | | | | 12-16-2019 | | | | 114,100,000 | | | | 114,156,554 | |
FHLB (1 Month LIBOR -0.08%) ± | | | 2.02 | | | | 2-4-2019 | | | | 100,000,000 | | | | 100,000,000 | |
FHLB (1 Month LIBOR -0.05%) ± | | | 2.02 | | | | 12-13-2019 | | | | 100,000,000 | | | | 100,000,000 | |
FHLB (z) | | | 2.03 | | | | 11-8-2018 | | | | 150,000,000 | | | | 149,166,750 | |
FHLB (1 Month LIBOR -0.05%) ± | | | 2.05 | | | | 10-9-2019 | | | | 150,000,000 | | | | 150,000,000 | |
FHLB (z) | | | 2.07 | | | | 11-27-2018 | | | | 100,000,000 | | | | 99,326,417 | |
FHLB (3 Month LIBOR -0.28%) ±%% | | | 2.07 | | | | 2-4-2019 | | | | 200,000,000 | | | | 200,000,000 | |
FHLB (z) | | | 2.07 | | | | 11-30-2018 | | | | 50,000,000 | | | | 49,655,486 | |
FHLB (U.S. Treasury 3 Month Bill Money Market Yield +0.07%) ± | | | 2.08 | | | | 1-30-2020 | | | | 150,000,000 | | | | 150,000,000 | |
FHLB (z) | | | 2.10 | | | | 12-10-2018 | | | | 200,000,000 | | | | 198,486,222 | |
FHLB (3 Month LIBOR -0.24%) ± | | | 2.10 | | | | 10-16-2018 | | | | 150,000,000 | | | | 150,000,000 | |
FHLB (3 Month LIBOR -0.26%) ± | | | 2.10 | | | | 8-7-2018 | | | | 150,000,000 | | | | 150,000,000 | |
FHLB (3 Month LIBOR -0.21%) ± | | | 2.12 | | | | 6-19-2020 | | | | 200,000,000 | | | | 200,000,000 | |
FHLB (3 Month LIBOR -0.21%) ± | | | 2.13 | | | | 10-26-2018 | | | | 200,000,000 | | | | 200,000,000 | |
FHLB (3 Month LIBOR -0.21%) ± | | | 2.13 | | | | 7-6-2020 | | | | 200,000,000 | | | | 200,000,000 | |
FHLB (3 Month LIBOR -0.20%) ± | | | 2.13 | | | | 1-18-2019 | | | | 300,000,000 | | | | 300,005,901 | |
FHLB (3 Month LIBOR -0.16%) ± | | | 2.16 | | | | 6-5-2019 | | | | 10,000,000 | | | | 10,003,257 | |
FHLB (3 Month LIBOR -0.16%) ± | | | 2.16 | | | | 5-28-2019 | | | | 27,500,000 | | | | 27,503,180 | |
FHLB (3 Month LIBOR -0.16%) ± | | | 2.16 | | | | 5-28-2019 | | | | 550,000,000 | | | | 550,111,459 | |
FHLB (3 Month LIBOR -0.16%) ± | | | 2.17 | | | | 6-12-2019 | | | | 422,490,000 | | | | 422,485,304 | |
FHLB (3 Month LIBOR -0.16%) ± | | | 2.17 | | | | 5-24-2019 | | | | 42,000,000 | | | | 42,005,445 | |
FHLB (3 Month LIBOR -0.16%) ± | | | 2.17 | | | | 5-24-2019 | | | | 200,000,000 | | | | 200,022,980 | |
FHLB (3 Month LIBOR -0.19%) ± | | | 2.17 | | | | 11-2-2018 | | | | 91,400,000 | | | | 91,391,633 | |
FHLB (3 Month LIBOR -0.14%) ± | | | 2.19 | | | | 12-20-2019 | | | | 250,000,000 | | | | 249,958,147 | |
FHLB (3 Month LIBOR -0.16%) ± | | | 2.19 | | | | 1-24-2019 | | | | 100,000,000 | | | | 100,000,000 | |
FHLB (3 Month LIBOR -0.15%) ± | | | 2.19 | | | | 1-2-2020 | | | | 150,000,000 | | | | 150,000,000 | |
FHLB (3 Month LIBOR -0.16%) ± | | | 2.19 | | | | 1-22-2019 | | | | 100,000,000 | | | | 100,000,000 | |
FHLB (3 Month LIBOR -0.14%) ± | | | 2.20 | | | | 12-26-2019 | | | | 225,000,000 | | | | 225,000,000 | |
FHLB (3 Month LIBOR -0.12%) ± | | | 2.21 | | | | 12-13-2019 | | | | 150,000,000 | | | | 150,000,000 | |
FHLB (3 Month LIBOR -0.12%) ± | | | 2.22 | | | | 10-5-2018 | | | | 50,000,000 | | | | 49,999,849 | |
FHLMC | | | 0.88 | | | | 10-12-2018 | | | | 260,689,000 | | | | 260,294,656 | |
FHLMC (z) | | | 1.87 | | | | 8-20-2018 | | | | 50,000,000 | | | | 49,950,917 | |
FHLMC (z) | | | 1.90 | | | | 8-10-2018 | | | | 35,000,000 | | | | 34,983,419 | |
FHLMC (z) | | | 1.93 | | | | 9-24-2018 | | | | 100,000,000 | | | | 99,712,000 | |
FHLMC (z) | | | 1.93 | | | | 9-25-2018 | | | | 200,000,000 | | | | 199,413,334 | |
FHLMC (1 Month LIBOR -0.15%) ± | | | 1.93 | | | | 8-22-2018 | | | | 250,000,000 | | | | 250,000,000 | |
FHLMC (z) | | | 1.94 | | | | 10-1-2018 | | | | 100,000,000 | | | | 99,672,972 | |
FHLMC (1 Month LIBOR -0.13%) ± | | | 1.95 | | | | 11-27-2018 | | | | 50,000,000 | | | | 50,000,000 | |
FHLMC (1 Month LIBOR -0.10%) ± | | | 2.00 | | | | 8-8-2019 | | | | 100,000,000 | | | | 100,000,000 | |
FNMA | | | 1.13 | | | | 10-19-2018 | | | | 67,844,000 | | | | 67,769,069 | |
FNMA | | | 1.13 | | | | 12-14-2018 | | | | 27,992,000 | | | | 27,911,924 | |
FNMA | | | 1.63 | | | | 11-27-2018 | | | | 94,475,000 | | | | 94,404,198 | |
FNMA | | | 1.88 | | | | 9-18-2018 | | | | 33,455,000 | | | | 33,464,732 | |
FNMA (1 Month LIBOR +0.00%) ± | | | 2.07 | | | | 2-28-2019 | | | | 15,000,000 | | | | 15,009,620 | |
Overseas Private Investment Corporation (3 Month U.S. Treasury Bill +0.00%) ±§ | | | 2.00 | | | | 8-15-2019 | | | | 10,000,000 | | | | 10,000,000 | |
Overseas Private Investment Corporation (3 Month U.S. Treasury Bill +0.00%) ±§ | | | 2.00 | | | | 11-15-2022 | | | | 21,700,000 | | | | 21,700,000 | |
Overseas Private Investment Corporation (3 Month U.S. Treasury Bill +0.00%) ±§ | | | 2.00 | | | | 11-15-2023 | | | | 20,000,000 | | | | 20,000,000 | |
Overseas Private Investment Corporation (3 Month U.S. Treasury Bill +0.00%) ±§ | | | 2.00 | | | | 6-28-2032 | | | | 32,740,350 | | | | 32,740,350 | |
The accompanying notes are an integral part of these financial statements.
| | | | | | |
| Portfolio of investments—July 31, 2018 (unaudited) | | Wells Fargo Government Money Market Fund | | | 13 | |
| | | | | | | | | | | | | | | | |
| Security name | | Interest rate | | | Maturity date | | | Principal | | | Value | |
|
Government Agency Debt (continued) | |
Overseas Private Investment Corporation (3 Month U.S. Treasury Bill +0.00%) ±§ | | | 2.00 | % | | | 10-15-2039 | | | $ | 14,965,000 | | | $ | 14,965,000 | |
Overseas Private Investment Corporation (3 Month U.S. Treasury Bill +0.00%) ±§ | | | 2.00 | | | | 10-15-2039 | | | | 15,000,000 | | | | 15,000,000 | |
Overseas Private Investment Corporation (3 Month U.S. Treasury Bill +0.00%) ±§ | | | 2.00 | | | | 7-7-2040 | | | | 11,000,000 | | | | 11,000,000 | |
Overseas Private Investment Corporation (3 Month U.S. Treasury Bill +0.00%) ±§ | | | 2.00 | | | | 7-7-2040 | | | | 20,000,000 | | | | 20,000,000 | |
Overseas Private Investment Corporation (3 Month U.S. Treasury Bill +0.00%) ±§ | | | 2.00 | | | | 7-7-2040 | | | | 8,500,000 | | | | 8,500,000 | |
Overseas Private Investment Corporation (3 Month U.S. Treasury Bill +0.00%) ±§ | | | 2.00 | | | | 10-15-2040 | | | | 7,000,000 | | | | 7,000,000 | |
Overseas Private Investment Corporation (3 Month U.S. Treasury Bill +0.00%) ±§ | | | 2.01 | | | | 12-15-2019 | | | | 16,632,000 | | | | 16,632,000 | |
Overseas Private Investment Corporation (3 Month U.S. Treasury Bill +0.00%) ±§ | | | 2.01 | | | | 7-9-2026 | | | | 75,148,000 | | | | 75,148,000 | |
Overseas Private Investment Corporation (3 Month U.S. Treasury Bill +0.00%) ±§ | | | 2.01 | | | | 1-15-2030 | | | | 17,358,491 | | | | 17,358,491 | |
Overseas Private Investment Corporation (3 Month U.S. Treasury Bill +0.00%) ±§ | | | 2.01 | | | | 9-2-2031 | | | | 11,755,000 | | | | 11,755,000 | |
Overseas Private Investment Corporation (3 Month U.S. Treasury Bill +0.00%) ±§ | | | 2.01 | | | | 9-2-2031 | | | | 8,830,000 | | | | 8,830,000 | |
Overseas Private Investment Corporation (3 Month U.S. Treasury Bill +0.00%) ±§ | | | 2.01 | | | | 9-2-2031 | | | | 5,875,000 | | | | 5,875,000 | |
Overseas Private Investment Corporation (3 Month U.S. Treasury Bill +0.00%) ±§ | | | 2.01 | | | | 9-2-2031 | | | | 6,730,000 | | | | 6,730,000 | |
Overseas Private Investment Corporation (3 Month U.S. Treasury Bill +0.00%) ±§ | | | 2.01 | | | | 9-30-2031 | | | | 11,664,950 | | | | 11,664,950 | |
Overseas Private Investment Corporation (3 Month U.S. Treasury Bill +0.00%) ±§ | | | 2.01 | | | | 5-15-2033 | | | | 3,791,294 | | | | 3,791,294 | |
Overseas Private Investment Corporation (3 Month U.S. Treasury Bill +0.00%) ±§ | | | 2.01 | | | | 1-15-2040 | | | | 11,952,000 | | | | 11,952,000 | |
Overseas Private Investment Corporation (3 Month U.S. Treasury Bill +0.00%) ±§ | | | 2.01 | | | | 7-15-2040 | | | | 9,870,300 | | | | 9,870,300 | |
Overseas Private Investment Corporation (3 Month U.S. Treasury Bill +0.00%) ±§ | | | 2.02 | | | | 10-15-2032 | | | | 23,530,769 | | | | 23,530,769 | |
Overseas Private Investment Corporation (3 Month U.S. Treasury Bill +0.00%) ±§ | | | 2.02 | | | | 6-15-2034 | | | | 19,018,376 | | | | 19,018,376 | |
Overseas Private Investment Corporation (3 Month U.S. Treasury Bill +0.00%) ±§ | | | 2.04 | | | | 1-20-2035 | | | | 4,000,000 | | | | 4,000,000 | |
Overseas Private Investment Corporation (3 Month U.S. Treasury Bill +0.00%) ±§ | | | 2.04 | | | | 1-20-2035 | | | | 12,000,000 | | | | 12,000,000 | |
Overseas Private Investment Corporation (3 Month U.S. Treasury Bill +0.00%) ±§ | | | 2.04 | | | | 1-20-2035 | | | | 10,400,000 | | | | 10,400,000 | |
Overseas Private Investment Corporation (3 Month U.S. Treasury Bill +0.00%) ±§ | | | 2.04 | | | | 1-20-2035 | | | | 9,900,000 | | | | 9,900,000 | |
Overseas Private Investment Corporation (3 Month U.S. Treasury Bill +0.00%) ±§ | | | 2.04 | | | | 4-20-2035 | | | | 5,000,000 | | | | 5,000,000 | |
Overseas Private Investment Corporation (3 Month U.S. Treasury Bill +0.00%) ±§ | | | 2.04 | | | | 4-20-2035 | | | | 17,500,000 | | | | 17,500,000 | |
Overseas Private Investment Corporation (3 Month U.S. Treasury Bill +0.00%) ±§ | | | 2.04 | | | | 4-20-2035 | | | | 5,000,000 | | | | 5,000,000 | |
Overseas Private Investment Corporation Series 1 (3 Month U.S. Treasury Bill +0.00%) ±§ | | | 2.01 | | | | 9-30-2031 | | | | 4,592,500 | | | | 4,592,500 | |
Overseas Private Investment Corporation Series 1 (3 Month U.S. Treasury Bill +0.00%) ±§ | | | 2.01 | | | | 1-15-2040 | | | | 9,960,000 | | | | 9,960,000 | |
Overseas Private Investment Corporation Series 1 (3 Month U.S. Treasury Bill +0.00%) ±§ | | | 2.04 | | | | 8-15-2026 | | | | 15,820,605 | | | | 15,820,605 | |
Overseas Private Investment Corporation Series 2 (3 Month U.S. Treasury Bill +0.00%) ± | | | 2.00 | | | | 10-10-2025 | | | | 7,094,250 | | | | 7,094,250 | |
Overseas Private Investment Corporation Series 2 (3 Month U.S. Treasury Bill +0.00%) ±§ | | | 2.01 | | | | 9-30-2031 | | | | 10,746,450 | | | | 10,746,450 | |
Overseas Private Investment Corporation Series 2-2 (3 Month U.S. Treasury Bill +0.00%) ±§ | | | 2.01 | | | | 7-15-2040 | | | | 3,489,500 | | | | 3,489,500 | |
Overseas Private Investment Corporation Series 24YR (3 Month U.S. Treasury Bill +0.00%) ±§ | | | 2.00 | | | | 7-7-2040 | | | | 8,600,000 | | | | 8,600,000 | |
Overseas Private Investment Corporation Series 3 (3 Month U.S. Treasury Bill +0.00%) ±§ | | | 2.00 | | | | 10-10-2025 | | | | 9,222,525 | | | | 9,222,525 | |
Overseas Private Investment Corporation Series 3 (3 Month U.S. Treasury Bill +0.00%) ±§ | | | 2.01 | | | | 7-15-2026 | | | | 5,563,140 | | | | 5,563,140 | |
Overseas Private Investment Corporation Series 4 (3 Month U.S. Treasury Bill +0.00%) ±§ | | | 2.01 | | | | 9-2-2031 | | | | 3,500,000 | | | | 3,500,000 | |
Overseas Private Investment Corporation Series 4 (3 Month U.S. Treasury Bill +0.00%) ±§ | | | 2.01 | | | | 9-30-2031 | | | | 6,245,800 | | | | 6,245,800 | |
Overseas Private Investment Corporation Series 4 (3 Month U.S. Treasury Bill +0.00%) ±§ | | | 2.02 | | | | 11-15-2033 | | | | 25,162,394 | | | | 25,162,381 | |
The accompanying notes are an integral part of these financial statements.
| | | | |
| 14 | | Wells Fargo Government Money Market Fund | | Portfolio of investments—July 31, 2018 (unaudited) |
| | | | | | | | | | | | | | | | |
| Security name | | Interest rate | | | Maturity date | | | Principal | | | Value | |
| | | | |
Government Agency Debt (continued) | | | | | | | | | | | | | | | | |
Overseas Private Investment Corporation Series 4 (3 Month U.S. Treasury Bill +0.00%) ±§ | | | 2.04 | % | | | 1-20-2035 | | | $ | 9,000,000 | | | $ | 9,000,000 | |
Overseas Private Investment Corporation Series 5 (3 Month U.S. Treasury Bill +0.00%) ±§ | | | 2.01 | | | | 9-30-2031 | | | | 6,429,500 | | | | 6,429,500 | |
Overseas Private Investment Corporation Series 6 (3 Month U.S. Treasury Bill +0.00%) ±§ | | | 2.00 | | | | 7-7-2040 | | | | 4,900,000 | | | | 4,900,000 | |
Overseas Private Investment Corporation Series 6 (3 Month U.S. Treasury Bill +0.00%) ±§ | | | 2.01 | | | | 9-30-2031 | | | | 6,429,500 | | | | 6,429,500 | |
Overseas Private Investment Corporation Series 7 (3 Month U.S. Treasury Bill +0.00%) ±§ | | | 2.01 | | | | 9-30-2031 | | | | 3,674,000 | | | | 3,674,000 | |
Overseas Private Investment Corporation Series 8 (3 Month U.S. Treasury Bill +0.00%) ±§ | | | 2.01 | | | | 9-30-2031 | | | | 13,777,500 | | | | 13,777,500 | |
Overseas Private Investment Corporation Series 9 (3 Month U.S. Treasury Bill +0.00%) ±§ | | | 2.01 | | | | 9-30-2031 | | | | 4,316,950 | | | | 4,316,950 | |
Overseas Private Investment Corporation Series 9 (3 Month U.S. Treasury Bill +0.00%) ±§ | | | 2.02 | | | | 5-15-2030 | | | | 26,316,000 | | | | 26,316,000 | |
| |
Total Government Agency Debt (Cost $29,277,554,694) | | | | 29,277,554,694 | |
| | | | | | | | | | | | | | | | |
| | | | |
Repurchase Agreements ^^: 51.99% | | | | | | | | | | | | | | | | |
Bank of America Corporation, dated 7-31-2018, maturity value $1,200,064,333 (1) | | | 1.93 | | | | 8-1-2018 | | | | 1,200,000,000 | | | | 1,200,000,000 | |
Bank of Montreal, dated 7-31-2018, maturity value $325,017,424 (2) | | | 1.93 | | | | 8-1-2018 | | | | 325,000,000 | | | | 325,000,000 | |
Bank of Montreal, dated 7-31-2018, maturity value $550,029,486 (3) | | | 1.93 | | | | 8-1-2018 | | | | 550,000,000 | | | | 550,000,000 | |
Bank of Nova Scotia, dated 7-31-2018, maturity value $400,021,444 (4) | | | 1.93 | | | | 8-1-2018 | | | | 400,000,000 | | | | 400,000,000 | |
Barclays Capital Incorporated, dated 7-26-2018, maturity value $300,112,000 (5) | | | 1.92 | | | | 8-2-2018 | | | | 300,000,000 | | | | 300,000,000 | |
BNP Paribas Securities Corporation, dated 5-4-2018, maturity value $301,448,417 (6) | | | 1.91 | | | | 8-3-2018 | | | | 300,000,000 | | | | 300,000,000 | |
BNP Paribas Securities Corporation, dated 5-7-2018, maturity value $301,472,000 (7) | | | 1.92 | | | | 8-7-2018 | | | | 300,000,000 | | | | 300,000,000 | |
BNP Paribas Securities Corporation, dated 5-11-2018, maturity value $201,007,889 (8) | | | 1.93 | | | | 8-13-2018 | | | | 200,000,000 | | | | 200,000,000 | |
BNP Paribas Securities Corporation, dated 5-21-2018, maturity value $150,751,333 (9) | | | 1.96 | | | | 8-21-2018 | | | | 150,000,000 | | | | 150,000,000 | |
BNP Paribas Securities Corporation, dated 7-2-2018, maturity value $200,653,333 (10) | | | 1.96 | | | | 8-31-2018 | | | | 200,000,000 | | | | 200,000,000 | |
BNP Paribas Securities Corporation, dated 7-31-2018, maturity value $1,500,080,417 (11) | | | 1.93 | | | | 8-1-2018 | | | | 1,500,000,000 | | | | 1,500,000,000 | |
BNP Paribas Securities Corporation, dated 7-31-2018, maturity value $100,005,333 (12) | | | 1.92 | | | | 8-1-2018 | | | | 100,000,000 | | | | 100,000,000 | |
BNP Paribas Securities Corporation, dated 7-31-2018, maturity value $375,139,271 (13) | | | 1.91 | | | | 8-7-2018 | | | | 375,000,000 | | | | 375,000,000 | |
BNP Paribas Securities Corporation, dated 7-31-2018, maturity value $835,044,301 (14) | | | 1.91 | | | | 8-1-2018 | | | | 835,000,000 | | | | 835,000,000 | |
Citibank NA, dated 7-26-2018, maturity value $250,093,333 (15) | | | 1.92 | | | | 8-2-2018 | | | | 250,000,000 | | | | 250,000,000 | |
Citibank NA, dated 7-31-2018, maturity value $250,013,403 (16) | | | 1.93 | | | | 8-1-2018 | | | | 250,000,000 | | | | 250,000,000 | |
Citigroup Global Markets Incorporated, dated 7-31-2018, maturity value $250,093,333 (17) | | | 1.92 | | | | 8-7-2018 | | | | 250,000,000 | | | | 250,000,000 | |
Citigroup Global Markets Incorporated, dated 7-31-2018, maturity value $500,026,806 (18) | | | 1.93 | | | | 8-1-2018 | | | | 500,000,000 | | | | 500,000,000 | |
Credit Agricole SA, dated 7-31-2018, maturity value $1,000,053,611 (19) | | | 1.93 | | | | 8-1-2018 | | | | 1,000,000,000 | | | | 1,000,000,000 | |
Credit Agricole SA, dated 7-31-2018, maturity value $250,012,847 (20) | | | 1.85 | | | | 8-1-2018 | | | | 250,000,000 | | | | 250,000,000 | |
Deutsche Bank Securities, dated 7-31-2018, maturity value $600,032,000 (21) | | | 1.92 | | | | 8-1-2018 | | | | 600,000,000 | | | | 600,000,000 | |
Deutsche Bank Securities, dated 7-31-2018, maturity value $700,037,528 (22) | | | 1.93 | | | | 8-1-2018 | | | | 700,000,000 | | | | 700,000,000 | |
The accompanying notes are an integral part of these financial statements.
| | | | | | |
| Portfolio of investments—July 31, 2018 (unaudited) | | Wells Fargo Government Money Market Fund | | | 15 | |
| | | | | | | | | | | | | | | | |
| Security name | | Interest rate | | | Maturity date | | | Principal | | | Value | |
| | | | |
Repurchase Agreements ^^ (continued) | | | | | | | | | | | | | | | | |
Fixed Income Clearing Corporation, dated 7-31-2018, maturity value $1,000,053,056 (23) | | | 1.91 | % | | | 8-1-2018 | | | $ | 1,000,000,000 | | | $ | 1,000,000,000 | |
Fixed Income Clearing Corporation, dated 7-31-2018, maturity value $100,002,778 (24) | | | 1.00 | | | | 8-1-2018 | | | | 100,000,000 | | | | 100,000,000 | |
Fixed Income Clearing Corporation, dated 7-31-2018, maturity value $500,024,306 (25) | | | 1.75 | | | | 8-1-2018 | | | | 500,000,000 | | | | 500,000,000 | |
Fixed Income Clearing Corporation, dated 7-31-2018, maturity value $500,025,000 (26) | | | 1.80 | | | | 8-1-2018 | | | | 500,000,000 | | | | 500,000,000 | |
Fixed Income Clearing Corporation, dated 7-31-2018, maturity value $800,039,556 (27) | | | 1.78 | | | | 8-1-2018 | | | | 800,000,000 | | | | 800,000,000 | |
Goldman Sachs & Company, dated 7-31-2018, maturity value $185,006,424 (28) | | | 1.25 | | | | 8-1-2018 | | | | 185,000,000 | | | | 185,000,000 | |
Goldman Sachs & Company, dated 7-31-2018, maturity value $200,010,500 (29) | | | 1.89 | | | | 8-1-2018 | | | | 200,000,000 | | | | 200,000,000 | |
HSBC Securities Incorporated, dated 7-31-2018, maturity value $450,022,750 (30) | | | 1.82 | | | | 8-1-2018 | | | | 450,000,000 | | | | 450,000,000 | |
ING Financial Markets LLC, dated 5-8-2018, maturity value $202,091,556 (31) | | | 2.08 | | | | 11-5-2018 | | | | 200,000,000 | | | | 200,000,000 | |
ING Financial Markets LLC, dated 6-1-2018, maturity value $200,664,222 (32) | | | 1.96 | | | | 8-1-2018 | | | | 200,000,000 | | | | 200,000,000 | |
ING Financial Markets LLC, dated 6-4-2018, maturity value $300,985,000 (33) | | | 1.97 | | | | 8-3-2018 | | | | 300,000,000 | | | | 300,000,000 | |
ING Financial Markets LLC, dated 6-12-2018, maturity value $150,765,000 (34) | | | 2.04 | | | | 9-10-2018 | | | | 150,000,000 | | | | 150,000,000 | |
ING Financial Markets LLC, dated 7-6-2018, maturity value $451,500,000 (35) | | | 2.00 | | | | 9-4-2018 | | | | 450,000,000 | | | | 450,000,000 | |
ING Financial Markets LLC, dated 7-9-2018, maturity value $350,663,542 (36) | | | 1.95 | | | | 8-13-2018 | | | | 350,000,000 | | | | 350,000,000 | |
ING Financial Markets LLC, dated 7-18-2018, maturity value $250,473,958 (37) | | | 1.95 | | | | 8-22-2018 | | | | 250,000,000 | | | | 250,000,000 | |
ING Financial Markets LLC, dated 7-27-2018, maturity value $300,111,417 (38) | | | 1.91 | | | | 8-3-2018 | | | | 300,000,000 | | | | 300,000,000 | |
ING Financial Markets LLC, dated 7-31-2018, maturity value $200,010,556 (39) | | | 1.90 | | | | 8-1-2018 | | | | 200,000,000 | | | | 200,000,000 | |
ING Financial Markets LLC, dated 7-31-2018, maturity value $350,130,667 (40) | | | 1.92 | | | | 8-7-2018 | | | | 350,000,000 | | | | 350,000,000 | |
ING Financial Markets LLC, dated 7-31-2018, maturity value $450,024,125 (41) | | | 1.93 | | | | 8-1-2018 | | | | 450,000,000 | | | | 450,000,000 | |
ING Financial Markets LLC, dated 7-31-2018, maturity value $850,045,694 (42) | | | 1.91 | | | | 8-1-2018 | | | | 850,000,597 | | | | 850,000,597 | |
JPMorgan Securities, dated 7-31-2018, maturity value $2,500,134,028 (43) | | | 1.93 | | | | 8-1-2018 | | | | 2,500,000,000 | | | | 2,500,000,000 | |
JPMorgan Securities, dated 7-31-2018, maturity value $600,032,000 (44) | | | 1.92 | | | | 8-1-2018 | | | | 600,000,000 | | | | 600,000,000 | |
Merrill Lynch Pierce Fenner Smith Incorporated, dated 7-31-2018, maturity value $100,005,361 (45) | | | 1.93 | | | | 8-1-2018 | | | | 100,000,000 | | | | 100,000,000 | |
MetLife Incorporated, dated 7-31-2018, maturity value $600,033,075 (46) | | | 1.92 | | | | 8-1-2018 | | | | 600,001,075 | | | | 600,001,075 | |
Mitsubishi Bank, dated 7-31-2018, maturity value $750,040,208 (47) | | | 1.93 | | | | 8-1-2018 | | | | 750,000,000 | | | | 750,000,000 | |
Mizuho Bank, dated 7-31-2018, maturity value $650,034,847 (48) | | | 1.93 | | | | 8-1-2018 | | | | 650,000,000 | | | | 650,000,000 | |
MUFG Securities Canada Limited, dated 7-31-2018, maturity value $2,000,106,111 (49) | | | 1.91 | | | | 8-1-2018 | | | | 2,000,000,000 | | | | 2,000,000,000 | |
Nomura Securities International Incorporated, dated 7-31-2018, maturity value $1,000,373,333 (50) | | | 1.92 | | | | 8-7-2018 | | | | 1,000,000,000 | | | | 1,000,000,000 | |
Nomura Securities International Incorporated, dated 7-31-2018, maturity value $1,600,084,889 (51) | | | 1.91 | | | | 8-1-2018 | | | | 1,600,000,000 | | | | 1,600,000,000 | |
Prudential Insurance Company of America, dated 7-31-2018, maturity value $165,970,193 (52) | | | 1.94 | | | | 8-1-2018 | | | | 165,961,250 | | | | 165,961,250 | |
Prudential Insurance Company of America, dated 7-31-2018, maturity value $467,747,705 (53) | | | 1.94 | | | | 8-1-2018 | | | | 467,722,500 | | | | 467,722,500 | |
RBC Capital Markets, dated 5-4-2018, maturity value $251,187,500 (54)§ | | | 1.90 | | | | 8-2-2018 | | | | 250,000,000 | | | | 250,000,000 | |
RBC Capital Markets, dated 7-9-2018, maturity value $300,932,833 (55)§ | | | 1.93 | | | | 9-5-2018 | | | | 300,000,000 | | | | 300,000,000 | |
RBC Capital Markets, dated 7-13-2018, maturity value $300,624,000 (56)§ | | | 1.92 | | | | 8-21-2018 | | | | 300,000,000 | | | | 300,000,000 | |
RBC Capital Markets, dated 7-31-2018, maturity value $1,500,080,417 (57) | | | 1.93 | | | | 8-1-2018 | | | | 1,500,000,000 | | | | 1,500,000,000 | |
RBC Dominion, dated 7-11-2018, maturity value $200,426,667 (58)§ | | | 1.92 | | | | 8-20-2018 | | | | 200,000,000 | | | | 200,000,000 | |
Royal Bank of Canada, dated 7-25-2018, maturity value $250,092,847 (59) | | | 1.91 | | | | 8-1-2018 | | | | 250,000,000 | | | | 250,000,000 | |
Royal Bank of Canada, dated 7-26-2018, maturity value $850,317,333 (60) | | | 1.92 | | | | 8-2-2018 | | | | 850,000,000 | | | | 850,000,000 | |
Royal Bank of Canada, dated 7-27-2018, maturity value $600,222,833 (61) | | | 1.91 | | | | 8-3-2018 | | | | 600,000,000 | | | | 600,000,000 | |
Royal Bank of Canada, dated 7-30-2018, maturity value $250,092,361 (62) | | | 1.90 | | | | 8-6-2018 | | | | 250,000,000 | | | | 250,000,000 | |
Royal Bank of Canada, dated 7-31-2018, maturity value $1,000,053,611 (63) | | | 1.93 | | | | 8-1-2018 | | | | 1,000,000,000 | | | | 1,000,000,000 | |
The accompanying notes are an integral part of these financial statements.
| | | | |
| 16 | | Wells Fargo Government Money Market Fund | | Portfolio of investments—July 31, 2018 (unaudited) |
| | | | | | | | | | | | | | | | |
| Security name | | Interest rate | | | Maturity date | | | Principal | | | Value | |
| | | | |
Repurchase Agreements ^^ (continued) | | | | | | | | | | | | | | | | |
Royal Bank of Scotland, dated 7-31-2018, maturity value $1,000,053,056 (64) | | | 1.91 | % | | | 8-1-2018 | | | $ | 1,000,000,000 | | | $ | 1,000,000,000 | |
Societe Generale, dated 6-11-2018, maturity value $250,816,667 (65) | | | 1.96 | | | | 8-10-2018 | | | | 250,000,000 | | | | 250,000,000 | |
Societe Generale, dated 7-31-2018, maturity value $1,650,088,458 (66) | | | 1.93 | | | | 8-1-2018 | | | | 1,650,000,000 | | | | 1,650,000,000 | |
Societe Generale, dated 7-31-2018, maturity value $200,010,722 (67) | | | 1.93 | | | | 8-1-2018 | | | | 200,000,000 | | | | 200,000,000 | |
TD Securities, dated 7-31-2018, maturity value $800,042,889 (68) | | | 1.93 | | | | 8-1-2018 | | | | 800,000,000 | | | | 800,000,000 | |
| |
Total Repurchase Agreements (Cost $38,153,685,422) | | | | 38,153,685,422 | |
| | | | | | | | | | | | | | | | |
| | | | |
Treasury Debt: 9.32% | | | | | | | | | | | | | | | | |
U.S. Treasury Bill (z)## | | | 1.76 | | | | 8-9-2018 | | | | 700,000,000 | | | | 699,728,467 | |
U.S. Treasury Bill (z) | | | 1.79 | | | | 8-30-2018 | | | | 100,000,000 | | | | 99,851,444 | |
U.S. Treasury Bill (z) | | | 1.80 | | | | 8-16-2018 | | | | 290,000,000 | | | | 289,784,230 | |
U.S. Treasury Bill (z) | | | 1.85 | | | | 8-23-2018 | | | | 230,000,000 | | | | 229,741,924 | |
U.S. Treasury Bill (z) | | | 1.91 | | | | 9-6-2018 | | | | 300,000,000 | | | | 299,429,000 | |
U.S. Treasury Bill (z) | | | 1.95 | | | | 10-4-2018 | | | | 290,000,000 | | | | 289,001,334 | |
U.S. Treasury Bill (z) | | | 1.96 | | | | 9-20-2018 | | | | 30,000,000 | | | | 29,919,167 | |
U.S. Treasury Bill (z) | | | 1.98 | | | | 10-18-2018 | | | | 70,000,000 | | | | 69,701,975 | |
U.S. Treasury Bill (z) | | | 1.98 | | | | 10-11-2018 | | | | 90,000,000 | | | | 89,650,917 | |
U.S. Treasury Bill (z) | | | 2.01 | | | | 11-8-2018 | | | | 70,000,000 | | | | 69,616,444 | |
U.S. Treasury Bill (z) | | | 2.02 | | | | 11-1-2018 | | | | 80,000,000 | | | | 79,591,239 | |
U.S. Treasury Bill (z) | | | 2.05 | | | | 11-29-2018 | | | | 100,000,000 | | | | 99,323,333 | |
U.S. Treasury Bill (z) | | | 2.09 | | | | 12-20-2018 | | | | 300,000,000 | | | | 297,567,750 | |
U.S. Treasury Bill (z) | | | 2.10 | | | | 12-6-2018 | | | | 420,000,000 | | | | 416,925,136 | |
U.S. Treasury Bill (z) | | | 2.10 | | | | 11-23-2018 | | | | 100,000,000 | | | | 99,341,333 | |
U.S. Treasury Bill (z) | | | 2.11 | | | | 12-27-2018 | | | | 300,000,000 | | | | 297,428,500 | |
U.S. Treasury Bill (z) | | | 2.12 | | | | 12-13-2018 | | | | 370,000,000 | | | | 367,117,474 | |
U.S. Treasury Bill (z) | | | 2.16 | | | | 1-24-2019 | | | | 150,000,000 | | | | 148,434,333 | |
U.S. Treasury Bill (z) | | | 2.16 | | | | 1-31-2019 | | | | 220,000,000 | | | | 217,600,381 | |
U.S. Treasury Bill (z) | | | 2.17 | | | | 1-17-2019 | | | | 150,000,000 | | | | 148,489,563 | |
U.S. Treasury Note | | | 0.75 | | | | 9-30-2018 | | | | 50,000,000 | | | | 49,923,058 | |
U.S. Treasury Note | | | 0.75 | | | | 10-31-2018 | | | | 114,000,000 | | | | 113,628,886 | |
U.S. Treasury Note | | | 0.75 | | | | 2-15-2019 | | | | 220,000,000 | | | | 218,252,255 | |
U.S. Treasury Note | | | 0.88 | | | | 10-15-2018 | | | | 250,000,000 | | | | 249,570,757 | |
U.S. Treasury Note | | | 1.00 | | | | 11-30-2018 | | | | 180,000,000 | | | | 179,336,729 | |
U.S. Treasury Note | | | 1.00 | | | | 3-15-2019 | | | | 150,000,000 | | | | 148,834,659 | |
U.S. Treasury Note | | | 1.25 | | | | 10-31-2018 | | | | 170,000,000 | | | | 169,792,059 | |
U.S. Treasury Note | | | 1.25 | | | | 11-30-2018 | | | | 150,000,000 | | | | 149,697,132 | |
U.S. Treasury Note | | | 1.38 | | | | 9-30-2018 | | | | 360,000,000 | | | | 359,786,281 | |
U.S. Treasury Note | | | 1.38 | | | | 11-30-2018 | | | | 110,000,000 | | | | 109,854,713 | |
U.S. Treasury Note | | | 1.38 | | | | 2-28-2019 | | | | 220,000,000 | | | | 218,891,841 | |
U.S. Treasury Note | | | 1.50 | | | | 8-31-2018 | | | | 50,000,000 | | | | 49,980,485 | |
U.S. Treasury Note | | | 1.50 | | | | 1-31-2019 | | | | 65,000,000 | | | | 64,777,103 | |
U.S. Treasury Note | | | 1.50 | | | | 2-28-2019 | | | | 158,000,000 | | | | 157,332,270 | |
U.S. Treasury Note | | | 1.63 | | | | 3-31-2019 | | | | 75,000,000 | | | | 74,664,518 | |
U.S. Treasury Note | | | 1.63 | | | | 4-30-2019 | | | | 30,000,000 | | | | 29,840,625 | |
U.S. Treasury Note | | | 1.75 | | | | 10-31-2018 | | | | 41,575,000 | | | | 41,581,109 | |
U.S. Treasury Note | | | 2.75 | | | | 2-15-2019 | | | | 113,000,000 | | | | 113,299,378 | |
| |
Total Treasury Debt (Cost $6,837,287,802) | | | | 6,837,287,802 | |
| | | | | | | | | | | | | | | | |
| | | | | | | | |
| Total investments in securities (Cost $74,268,527,918) | | | 101.20 | % | | | 74,268,527,918 | |
Other assets and liabilities, net | | | (1.20 | ) | | | (883,730,922 | ) |
| | | | | | | | |
| Total net assets | | | 100.00 | % | | $ | 73,384,796,996 | |
| | | | | | | | |
The accompanying notes are an integral part of these financial statements.
| | | | | | |
| Portfolio of investments—July 31, 2018 (unaudited) | | Wells Fargo Government Money Market Fund | | | 17 | |
| (z) | Zero coupon security. The rate represents the current yield to maturity. |
| ± | Variable rate investment. The rate shown is the rate in effect at period end. |
| %% | The security is issued on a when-issued basis. |
| § | The security is subject to a demand feature which reduces the effective maturity. |
| | (1) | U.S. government securities, 3.00% to 4.00%, 4-20-2043 to 9-20-2045, fair value including accrued interest is $1,236,000,000. |
| | (2) | U.S. government securities, 0.00% to 5.00%, 2-28-2019 to 7-1-2048, fair value including accrued interest is $334,702,586. |
| | (3) | U.S. government securities, 1.43% to 7.45%, 10-24-2019 to 7-1-2048, fair value including accrued interest is $566,472,083. |
| | (4) | U.S. government securities, 1.05% to 5.00%, 8-10-2020 to 7-1-2048, fair value including accrued interest is $411,978,297. |
| | (5) | U.S. government securities, 3.50% to 6.50%, 8-25-2018 to 10-1-2047, fair value including accrued interest is $309,000,000. |
| | (6) | U.S. government securities, 0.00% to 7.50%, 8-16-2018 to 4-20-2048, fair value including accrued interest is $308,066,542. |
| | (7) | U.S. government securities, 0.00% to 8.75%, 8-16-2018 to 7-1-2048, fair value including accrued interest is $308,305,990. |
| | (8) | U.S. government securities, 0.00% to 6.63%, 8-16-2018 to 5-20-2048, fair value including accrued interest is $205,746,842. |
| | (9) | U.S. government securities, 0.00% to 8.13%, 8-16-2018 to 7-20-2048, fair value including accrued interest is $154,440,556. |
| | (10) | U.S. government securities, 0.00% to 7.50%, 8-16-2018 to 6-20-2048, fair value including accrued interest is $205,728,352. |
| | (11) | U.S. government securities, 0.00% to 8.75%, 8-16-2018 to 6-20-2048, fair value including accrued interest is $1,534,024,750. |
| | (12) | U.S. government securities, 0.00% to 6.25%, 8-16-2018 to 3-9-2038, fair value including accrued interest is $102,000,089. |
| | (13) | U.S. government securities, 0.00% to 7.50%, 8-16-2018 to 12-15-2042, fair value including accrued interest is $382,500,003. |
| | (14) | U.S. government securities, 0.00% to 7.50%, 8-15-2018 to 5-15-2047, fair value including accrued interest is $851,700,000. |
| | (15) | U.S. government securities, 0.00% to 9.00%, 8-16-2018 to 9-15-2060, fair value including accrued interest is $255,825,924. |
| | (16) | U.S. government securities, 0.00% to 8.50%, 8-31-2018 to 10-20-2067, fair value including accrued interest is $255,858,581. |
| | (17) | U.S. government securities, 0.00% to 8.50%, 8-15-2018 to 6-20-2067, fair value including accrued interest is $255,029,245. |
| | (18) | U.S. government securities, 0.00% to 6.38%, 11-15-2018 to 6-1-2047, fair value including accrued interest is $510,000,417. |
| | (19) | U.S. government securities, 1.34% to 6.50%, 5-30-2019 to 7-1-2048, fair value including accrued interest is $1,029,376,490. |
| | (20) | U.S. government securities, 2.25%, 3-31-2020, fair value including accrued interest is $255,000,030. |
| | (21) | U.S. government securities, 0.00% to 4.63%, 8-30-2018 to 5-15-2045, fair value including accrued interest is $612,000,000. |
| | (22) | U.S. government securities, 0.00% to 6.75%, 3-8-2019 to 10-1-2037, fair value including accrued interest is $714,029,601. |
| | (23) | U.S. government securities, 3.75%, 11-15-2043, fair value including accrued interest is $1,020,002,517. |
| | (24) | U.S. government securities, 0.13%, 4-15-2019, fair value including accrued interest is $102,002,995. |
| | (25) | U.S. government securities, 0.38% to 2.38%, 8-15-2026 to 11-15-2027, fair value including accrued interest is $510,003,394. |
| | (26) | U.S. government securities, 2.75% to 3.63%, 8-15-2042 to 8-15-2043, fair value including accrued interest is $510,000,963. |
| | (27) | U.S. government securities, 2.75% to 5.25%, 11-15-2027 to 8-15-2042, fair value including accrued interest is $816,001,407. |
| | (28) | U.S. government securities, 0.00% to 3.88%, 8-16-2018 to 2-15-2046, fair value including accrued interest is $188,700,013. |
| | (29) | U.S. government securities, 3.24% to 6.50%, 7-1-2024 to 8-1-2048, fair value including accrued interest is $206,000,000. |
| | (30) | U.S. government securities, 0.00%, 11-8-2018 to 1-10-2019, fair value is $459,000,039. |
| | (31) | U.S. government securities, 2.50% to 6.00%, 12-1-2024 to 5-1-2048, fair value including accrued interest is $206,000,000. |
| | (32) | U.S. government securities, 2.00% to 6.00%, 3-1-2023 to 2-1-2048, fair value including accrued interest is $206,000,000. |
| | (33) | U.S. government securities, 2.00% to 5.50%, 5-1-2026 to 2-1-2048, fair value including accrued interest is $309,000,000. |
| | (34) | U.S. government securities, 2.40% to 7.00%, 10-1-2022 to 3-1-2048, fair value including accrued interest is $154,500,000. |
| | (35) | U.S. government securities, 2.50% to 7.50%, 9-1-2020 to 6-1-2048, fair value including accrued interest is $463,500,000. |
| | (36) | U.S. government securities, 2.00% to 6.00%, 4-1-2023 to 2-1-2048, fair value including accrued interest is $360,500,000. |
| | (37) | U.S. government securities, 2.50% to 7.00%, 1-1-2026 to 3-1-2048, fair value including accrued interest is $257,500,000. |
| | (38) | U.S. government securities, 2.50% to 7.00%, 12-1-2022 to 6-1-2048, fair value including accrued interest is $309,000,000. |
| | (39) | U.S. government securities, 2.40% to 5.50%, 3-1-2023 to 4-1-2048, fair value including accrued interest is $206,000,324. |
| | (40) | U.S. government securities, 2.00% to 6.00%, 1-1-2019 to 7-1-2048, fair value including accrued interest is $360,500,000. |
| | (41) | U.S. government securities, 2.50% to 6.50%, 12-1-2024 to 7-12048, fair value including accrued interest is $463,500,000. |
| | (42) | U.S. government securities, 1.63% to 3.63%, 8-15-2019 to 2-15-2026, fair value including accrued interest is $867,347,548. |
| | (43) | U.S. government securities, 2.00% to 10.50%, 10-1-2018 to 8-1-2048, fair value including accrued interest is $2,575,014,490. |
| | (44) | U.S. government securities, 0.00% to 8.83%, 10-15-2018 to 4-15-2030, fair value including accrued interest is $612,004,352. |
| | (45) | U.S. government securities, 3.50% to 4.50%, 8-1-2047 to 4-1-2048, fair value including accrued interest is $103,000,000. |
| | (46) | U.S. government securities, 1.25% to 1.63%, 5-31-2019 to 8-31-2019, fair value including accrued interest is $610,684,734. |
| | (47) | U.S. government securities, 1.96% to 5.50%, 5-1-2019 to 11-20-2065, fair value including accrued interest is $772,500,000. |
The accompanying notes are an integral part of these financial statements.
| | | | |
| 18 | | Wells Fargo Government Money Market Fund | | Portfolio of investments—July 31, 2018 (unaudited) |
| | (48) | U.S. government securities, 2.00% to 5.50%, 12-1-2028 to 2-1-2057, fair value including accrued interest is $669,500,000. |
| | (49) | U.S. government securities, 0.50% to 4.25%, 1-1-2019 to 11-15-2045, fair value including accrued interest is $2,040,000,003. |
| | (50) | U.S. government securities, 0.00% to 8.13%, 8-15-2018 to 2-15-2048, fair value including accrued interest is $1,020,000,000. |
| | (51) | U.S. government securities, 0.00% to 7.63%, 8-16-2018 to 8-15-2044, fair value including accrued interest is $1,632,000,068. |
| | (52) | U.S. government securities, 0.00% to 3.00%, 5-15-2020 to 5-15-2045, fair value including accrued interest is $169,280,475. |
| | (53) | U.S. government securities, 0.00%, 11-15-2021 to 8-15-2026, fair value is $477,076,950. |
| | (54) | U.S. government securities, 0.13% to 5.00%, 4-15-2019 to 5-20-2068, fair value including accrued interest is $257,488,050. |
| | (55) | U.S. government securities, 0.11% to 4.90%, 4-15-2019 to 1-1-2057, fair value including accrued interest is $308,983,222. |
| | (56) | U.S. government securities, 1.38% to 2.75%, 7-15-2019 to 8-15-2042, fair value including accrued interest is $306,000,025. |
| | (57) | U.S. government securities, 0.00% to 6.00%, 8-31-2018 to 5-15-2048, fair value including accrued interest is $1,541,238,697. |
| | (58) | U.S. government securities, 0.00% to 2.75%, 4-15-2019 to 2-15-2047, fair value including accrued interest is $204,000,003. |
| | (59) | U.S. government securities, 2.11% to 5.00%, 7-1-2027 to 1-1-2057, fair value including accrued interest is $257,500,001. |
| | (60) | U.S. government securities, 2.11% to 6.50%, 1-1-2023 to 1-1-2057, fair value including accrued interest is $875,500,000. |
| | (61) | U.S. government securities, 0.11% to 5.00%, 4-15-2019 to 5-20-2068, fair value including accrued interest is $617,983,869. |
| | (62) | U.S. government securities, 0.11% to 5.50%, 4-15-2019 to 1-1-2057, fair value including accrued interest is $257,325,134. |
| | (63) | U.S. government securities, 0.11% to 5.00%, 4-15-2019 to 11-20-2065, fair value including accrued interest is $1,029,991,033. |
| | (64) | U.S. government securities, 0.00% to 6.63%, 8-31-2018 to 8-15-2047, fair value including accrued interest is $1,020,000,008. |
| | (65) | U.S. government securities, 0.00% to 5.00%, 7-20-2026 to 6-15-2053, fair value including accrued interest is $257,499,202. |
| | (66) | U.S. government securities, 0.11% to 3.88%, 4-30-2019 to 2-15-2046, fair value including accrued interest is $1,683,000,106. |
| | (67) | U.S. government securities, 3.50% to 4.50%, 7-20-2046 to 6-20-2048, fair value including accrued interest is $206,000,001. |
| | (68) | U.S. government securities, 2.50% to 5.50%, 3-1-2026 to 5-1-2048, fair value including accrued interest is $824,000,000. |
| ## | All or a portion of this security is segregated for when-issued securities. |
Abbreviations:
| FFCB | Federal Farm Credit Banks |
| FHLB | Federal Home Loan Bank |
| FHLMC | Federal Home Loan Mortgage Corporation |
| FNMA | Federal National Mortgage Association |
| LIBOR | London Interbank Offered Rate |
The accompanying notes are an integral part of these financial statements.
| | | | | | |
| Statement of assets and liabilities—July 31, 2018 (unaudited) | | Wells Fargo Government Money Market Fund | | | 19 | |
| | | | |
| | | | |
| |
Assets | | | | |
Investments in unaffiliated securities, at amortized cost | | $ | 36,114,842,496 | |
Investments in repurchase agreements, at amortized cost | | | 38,153,685,422 | |
Cash | | | 165,329,328 | |
Receivable for Fund shares sold | | | 2,675,008 | |
Receivable for interest | | | 56,674,041 | |
Prepaid expenses and other assets | | | 934,897 | |
| | | | |
Total assets | | | 74,494,141,192 | |
| | | | |
| |
Liabilities | | | | |
Payable for investments purchased | | | 1,040,138,179 | |
Dividends payable | | | 54,573,614 | |
Management fee payable | | | 6,577,990 | |
Administration fees payable | | | 3,662,750 | |
Payable for Fund shares redeemed | | | 2,029,377 | |
Distribution fee payable | | | 30 | |
Accrued expenses and other liabilities | | | 2,362,256 | |
| | | | |
Total liabilities | | | 1,109,344,196 | |
| | | | |
Total net assets | | $ | 73,384,796,996 | |
| | | | |
| |
NET ASSETS CONSIST OF | | | | |
Paid-in capital | | $ | 73,384,628,855 | |
Undistributed net investment income | | | 51,952 | |
Accumulated net realized gains on investments | | | 116,189 | |
| | | | |
Total net assets | | $ | 73,384,796,996 | |
| | | | |
| |
COMPUTATION OF NET ASSET VALUE PER SHARE | | | | |
Net assets – Class A | | $ | 274,980,177 | |
Shares outstanding – Class A1 | | | 274,979,831 | |
Net asset value per share – Class A | | | $1.00 | |
Net assets – Administrator Class | | $ | 1,725,894,589 | |
Shares outstanding – Administrator Class1 | | | 1,725,898,794 | |
Net asset value per share – Administrator Class | | | $1.00 | |
Net assets – Institutional Class | | $ | 25,317,798,619 | |
Shares outstanding – Institutional Class1 | | | 25,317,719,643 | |
Net asset value per share – Institutional Class | | | $1.00 | |
Net assets – Select Class | | $ | 43,594,513,240 | |
Shares outstanding – Select Class1 | | | 43,594,486,036 | |
Net asset value per share – Select Class | | | $1.00 | |
Net assets – Service Class | | $ | 2,471,510,296 | |
Shares outstanding – Service Class1 | | | 2,471,506,380 | |
Net asset value per share – Service Class | | | $1.00 | |
Net assets – Sweep Class | | $ | 100,075 | |
Shares outstanding – Sweep Class1 | | | 100,075 | |
Net asset value per share – Sweep Class | | | $1.00 | |
| 1 | The Fund has an unlimited number of authorized shares. |
The accompanying notes are an integral part of these financial statements.
| | | | |
| 20 | | Wells Fargo Government Money Market Fund | | Statement of operations—six months ended July 31, 2018 (unaudited) |
| | | | |
| | | | |
| |
Investment income | | | | |
Interest | | $ | 623,846,622 | |
| | | | |
| |
Expenses | | | | |
Management fee | | | 47,860,520 | |
Administration fees | | | | |
Class A | | | 290,322 | |
Administrator Class | | | 802,535 | |
Institutional Class | | | 9,055,062 | |
Select Class | | | 9,099,971 | |
Service Class | | | 1,488,358 | |
Sweep Class | | | 14 | |
Shareholder servicing fees | | | | |
Class A | | | 329,911 | |
Administrator Class | | | 802,535 | |
Service Class | | | 3,100,746 | |
Sweep Class | | | 125 | |
Distribution fee | | | | |
Sweep Class | | | 174 | |
Custody and accounting fees | | | 1,168,085 | |
Professional fees | | | 29,523 | |
Registration fees | | | 123,470 | |
Shareholder report expenses | | | 44,931 | |
Trustees’ fees and expenses | | | 10,561 | |
Other fees and expenses | | | 284,213 | |
| | | | |
Total expenses | | | 74,491,056 | |
Less: Fee waivers and/or expense reimbursements | | | (10,298,557 | ) |
| | | | |
Net expenses | | | 64,192,499 | |
| | | | |
Net investment income | | | 559,654,123 | |
| | | | |
Net realized gains on investments | | | 78,412 | |
| | | | |
Net increase in net assets resulting from operations | | $ | 559,732,535 | |
| | | | |
The accompanying notes are an integral part of these financial statements.
| | | | | | |
| Statement of changes in net assets | | Wells Fargo Government Money Market Fund | | | 21 | |
| | | | | | | | | | | | | | | | |
| | | Six months ended
July 31, 2018
(unaudited) | | | Year ended
January 31, 2018 | |
| | | |
Operations | | | | | | | | | | | | |
Net investment income | | | | | | $ | 559,654,123 | | | | | | | $ | 541,486,847 | |
Net realized gains on investments | | | | | | | 78,412 | | | | | | | | 221,993 | |
| | | | |
Net increase in net assets resulting from operations | | | | | | | 559,732,535 | | | | | | | | 541,708,840 | |
| | | | |
| | | |
Distributions to shareholders from | | | | | | | | | | | | |
Net investment income | | | | | | | | | | | | | | | | |
Class A | | | | | | | (1,477,666 | ) | | | | | | | (1,001,046 | ) |
Administrator Class | | | | | | | (11,211,834 | ) | | | | | | | (5,781,998 | ) |
Institutional Class | | | | | | | (173,032,019 | ) | | | | | | | (176,872,690 | ) |
Select Class | | | | | | | (358,763,104 | ) | | | | | | | (343,698,404 | ) |
Service Class | | | | | | | (15,169,026 | ) | | | | | | | (14,132,467 | ) |
Sweep Class | | | | | | | (474 | ) | | | | | | | (242 | ) |
Net realized gains | | | | | | | | | | | | | | | | |
Class A | | | | | | | 0 | | | | | | | | (808 | ) |
Administrator Class | | | | | | | 0 | | | | | | | | (3,433 | ) |
Institutional Class | | | | | | | 0 | | | | | | | | (73,726 | ) |
Select Class | | | | | | | 0 | | | | | | | | (150,798 | ) |
Service Class | | | | | | | 0 | | | | | | | | (7,779 | ) |
Sweep Class | | | | | | | 0 | | | | | | | | (1 | ) |
| | | | |
Total distributions to shareholders | | | | | | | (559,654,123 | ) | | | | | | | (541,723,392 | ) |
| | | | |
| | | | |
Capital share transactions | | | Shares | | | | | | | | Shares | | | | | |
Proceeds from shares sold | | | | | | | | | | | | | | | | |
Class A | | | 80,505,444 | | | | 80,505,444 | | | | 120,907,015 | | | | 120,907,015 | |
Administrator Class | | | 4,481,914,929 | | | | 4,481,914,929 | | | | 7,034,796,210 | | | | 7,034,796,210 | |
Institutional Class | | | 77,799,123,013 | | | | 77,799,123,013 | | | | 141,879,382,084 | | | | 141,879,382,084 | |
Select Class | | | 237,648,717,175 | | | | 237,648,717,175 | | | | 442,120,856,126 | | | | 442,120,856,126 | |
Service Class | | | 36,017,532,001 | | | | 36,017,532,001 | | | | 86,534,648,298 | | | | 86,534,648,298 | |
| | | | |
| | | | | | | 356,027,792,562 | | | | | | | | 677,690,589,733 | |
| | | | |
Reinvestment of distributions | | | | | | | | | | | | | | | | |
Class A | | | 1,469,079 | | | | 1,469,079 | | | | 998,459 | | | | 998,459 | |
Administrator Class | | | 3,474,873 | | | | 3,474,873 | | | | 1,796,796 | | | | 1,796,796 | |
Institutional Class | | | 58,715,771 | | | | 58,715,771 | | | | 68,325,146 | | | | 68,325,146 | |
Select Class | | | 219,620,926 | | | | 219,620,926 | | | | 205,315,441 | | | | 205,315,441 | |
Service Class | | | 2,092,037 | | | | 2,092,037 | | | | 2,433,539 | | | | 2,433,539 | |
Sweep Class | | | 0 | | | | 0 | | | | 70 | | | | 70 | |
| | | | |
| | | | | | | 285,372,686 | | | | | | | | 278,869,451 | |
| | | | |
Payment for shares redeemed | | | | | | | | | | | | | | | | |
Class A | | | (71,729,261 | ) | | | (71,729,261 | ) | | | (131,252,757 | ) | | | (131,252,757 | ) |
Administrator Class | | | (4,314,253,304 | ) | | | (4,314,253,304 | ) | | | (5,925,317,715 | ) | | | (5,925,317,715 | ) |
Institutional Class | | | (74,471,442,021 | ) | | | (74,471,442,021 | ) | | | (143,258,743,793 | ) | | | (143,258,743,793 | ) |
Select Class | | | (240,562,553,738 | ) | | | (240,562,553,738 | ) | | | (435,036,950,209 | ) | | | (435,036,950,209 | ) |
Service Class | | | (36,055,015,861 | ) | | | (36,055,015,861 | ) | | | (87,022,938,107 | ) | | | (87,022,938,107 | ) |
| | | | |
| | | | | | | (355,474,994,185 | ) | | | | | | | (671,375,202,581 | ) |
| | | | |
Net increase in net assets resulting from capital share transactions | | | | | | | 838,171,063 | | | | | | | | 6,594,256,603 | |
| | | | |
Total increase in net assets | | | | | | | 838,249,475 | | | | | | | | 6,594,242,051 | |
| | | | |
| | |
Net assets | | | | | | | | |
Beginning of period | | | | | | | 72,546,547,521 | | | | | | | | 65,952,305,470 | |
| | | | |
End of period | | | | | | $ | 73,384,796,996 | | | | | | | $ | 72,546,547,521 | |
| | | | |
Undistributed net investment income | | | | | | $ | 51,952 | | | | | | | $ | 51,952 | |
| | | | |
The accompanying notes are an integral part of these financial statements.
| | | | |
| 22 | | Wells Fargo Government Money Market Fund | | Financial highlights |
(For a share outstanding throughout each period)
| | | | | | | | | | | | | | | | | | | | | | | | |
| | | Six months ended
July 31, 2018 (unaudited) | | | Year ended January 31 | |
| CLASS A | | 2018 | | | 2017 | | | 2016 | | | 2015 | | | 2014 | |
Net asset value, beginning of period | | | $1.00 | | | | $1.00 | | | | $1.00 | | | | $1.00 | | | | $1.00 | | | | $1.00 | |
Net investment income | | | 0.01 | | | | 0.00 | 1 | | | 0.00 | 1 | | | 0.00 | 1 | | | 0.00 | 1 | | | 0.00 | 1 |
Net realized gains (losses) on investments | | | 0.00 | 1 | | | 0.00 | 1 | | | 0.00 | 1 | | | 0.00 | 1 | | | (0.00 | )2 | | | 0.00 | 1 |
| | | | | | | | | | | | | | | | | | | | | | | | |
Total from investment operations | | | 0.01 | | | | 0.00 | 1 | | | 0.00 | 1 | | | 0.00 | 1 | | | 0.00 | 1 | | | 0.00 | 1 |
Distributions to shareholders from | | | | | | | | | | | | | | | | | | | | | | | | |
Net investment income | | | (0.01 | ) | | | (0.00 | )1 | | | (0.00 | )1 | | | (0.00 | )1 | | | (0.00 | )1 | | | (0.00 | )1 |
Net realized gains | | | 0.00 | | | | (0.00 | )1 | | | 0.00 | | | | 0.00 | | | | (0.00 | )1 | | | (0.00 | )1 |
| | | | | | | | | | | | | | | | | | | | | | | | |
Total distributions to shareholders | | | (0.01 | ) | | | (0.00 | )1 | | | (0.00 | )1 | | | (0.00 | )1 | | | (0.00 | )1 | | | (0.00 | )1 |
Net asset value, end of period | | | $1.00 | | | | $1.00 | | | | $1.00 | | | | $1.00 | | | | $1.00 | | | | $1.00 | |
Total return3 | | | 0.56 | % | | | 0.38 | % | | | 0.01 | % | | | 0.01 | % | | | 0.01 | % | | | 0.01 | % |
Ratios to average net assets (annualized) | | | | | | | | | | | | | | | | | | | | | | | | |
Gross expenses | | | 0.61 | % | | | 0.61 | % | | | 0.61 | % | | | 0.61 | % | | | 0.61 | % | | | 0.61 | % |
Net expenses | | | 0.60 | % | | | 0.61 | % | | | 0.41 | % | | | 0.13 | % | | | 0.09 | % | | | 0.10 | % |
Net investment income | | | 1.12 | % | | | 0.38 | % | | | 0.01 | % | | | 0.01 | % | | | 0.01 | % | | | 0.01 | % |
Supplemental data | | | | | | | | | | | | | | | | | | | | | | | | |
Net assets, end of period (000s omitted) | | | $274,980 | | | | $264,735 | | | | $274,083 | | | | $265,119 | | | | $308,757 | | | | $406,489 | |
| 1 | Amount is less than $0.005. |
| 2 | Amount is more than $(0.005). |
| 3 | Returns for periods of less than one year are not annualized. |
The accompanying notes are an integral part of these financial statements.
| | | | | | |
| Financial highlights | | Wells Fargo Government Money Market Fund | | | 23 | |
(For a share outstanding throughout each period)
| | | | | | | | | | | | | | | | | | | | | | | | |
| | | Six months ended
July 31, 2018 (unaudited) | | | Year ended January 31 | |
| ADMINISTRATOR CLASS | | 2018 | | | 2017 | | | 2016 | | | 2015 | | | 2014 | |
Net asset value, beginning of period | | | $1.00 | | | | $1.00 | | | | $1.00 | | | | $1.00 | | | | $1.00 | | | | $1.00 | |
Net investment income | | | 0.01 | | | | 0.01 | | | | 0.00 | 1 | | | 0.00 | 1 | | | 0.00 | 1 | | | 0.00 | 1 |
Net realized gains (losses) on investments | | | 0.00 | 1 | | | 0.00 | 1 | | | 0.00 | 1 | | | 0.00 | 1 | | | (0.00 | )2 | | | 0.00 | 1 |
| | | | | | | | | | | | | | | | | | | | | | | | |
Total from investment operations | | | 0.01 | | | | 0.01 | | | | 0.00 | 1 | | | 0.00 | 1 | | | 0.00 | 1 | | | 0.00 | 1 |
Distributions to shareholders from | | | | | | | | | | | | | | | | | | | | | | | | |
Net investment income | | | (0.01 | ) | | | (0.01 | ) | | | (0.00 | )1 | | | (0.00 | )1 | | | (0.00 | )1 | | | (0.00 | )1 |
Net realized gains | | | 0.00 | | | | (0.00 | )1 | | | 0.00 | | | | 0.00 | | | | (0.00 | )1 | | | (0.00 | )1 |
| | | | | | | | | | | | | | | | | | | | | | | | |
Total distributions to shareholders | | | (0.01 | ) | | | (0.01 | ) | | | (0.00 | )1 | | | (0.00 | )1 | | | (0.00 | )1 | | | (0.00 | )1 |
Net asset value, end of period | | | $1.00 | | | | $1.00 | | | | $1.00 | | | | $1.00 | | | | $1.00 | | | | $1.00 | |
Total return3 | | | 0.69 | % | | | 0.65 | % | | | 0.10 | % | | | 0.01 | % | | | 0.01 | % | | | 0.01 | % |
Ratios to average net assets (annualized) | | | | | | | | | | | | | | | | | | | | | | | | |
Gross expenses | | | 0.34 | % | | | 0.34 | % | | | 0.34 | % | | | 0.34 | % | | | 0.34 | % | | | 0.34 | % |
Net expenses | | | 0.34 | % | | | 0.34 | % | | | 0.31 | % | | | 0.12 | % | | | 0.09 | % | | | 0.09 | % |
Net investment income | | | 1.40 | % | | | 0.72 | % | | | 0.11 | % | | | 0.01 | % | | | 0.01 | % | | | 0.01 | % |
Supplemental data | | | | | | | | | | | | | | | | | | | | | | | | |
Net assets, end of period (000s omitted) | | | $1,725,895 | | | | $1,554,764 | | | | $443,500 | | | | $382,043 | | | | $644,666 | | | | $596,022 | |
| 1 | Amount is less than $0.005. |
| 2 | Amount is more than $(0.005). |
| 3 | Returns for periods of less than one year are not annualized. |
The accompanying notes are an integral part of these financial statements.
| | | | |
| 24 | | Wells Fargo Government Money Market Fund | | Financial highlights |
(For a share outstanding throughout each period)
| | | | | | | | | | | | | | | | | | | | | | | | |
| | | Six months ended
July 31, 2018 (unaudited) | | | Year ended January 31 | |
| INSTITUTIONAL CLASS | | 2018 | | | 2017 | | | 2016 | | | 2015 | | | 2014 | |
Net asset value, beginning of period | | | $1.00 | | | | $1.00 | | | | $1.00 | | | | $1.00 | | | | $1.00 | | | | $1.00 | |
Net investment income | | | 0.01 | | | | 0.01 | | | | 0.00 | 1 | | | 0.00 | 1 | | | 0.00 | 1 | | | 0.00 | 1 |
Net realized gains (losses) on investments | | | 0.00 | 1 | | | 0.00 | 1 | | | 0.00 | 1 | | | 0.00 | 1 | | | (0.00 | )2 | | | 0.00 | 1 |
| | | | | | | | | | | | | | | | | | | | | | | | |
Total from investment operations | | | 0.01 | | | | 0.01 | | | | 0.00 | 1 | | | 0.00 | 1 | | | 0.00 | 1 | | | 0.00 | 1 |
Distributions to shareholders from | | | | | | | | | | | | | | | | | | | | | | | | |
Net investment income | | | (0.01 | ) | | | (0.01 | ) | | | (0.00 | )1 | | | (0.00 | )1 | | | (0.00 | )1 | | | (0.00 | )1 |
Net realized gains | | | 0.00 | | | | (0.00 | )1 | | | 0.00 | | | | 0.00 | | | | (0.00 | )1 | | | (0.00 | )1 |
| | | | | | | | | | | | | | | | | | | | | | | | |
Total distributions to shareholders | | | (0.01 | ) | | | (0.01 | ) | | | (0.00 | )1 | | | (0.00 | )1 | | | (0.00 | )1 | | | (0.00 | )1 |
Net asset value, end of period | | | $1.00 | | | | $1.00 | | | | $1.00 | | | | $1.00 | | | | $1.00 | | | | $1.00 | |
Total return3 | | | 0.76 | % | | | 0.79 | % | | | 0.24 | % | | | 0.02 | % | | | 0.01 | % | | | 0.01 | % |
Ratios to average net assets (annualized) | | | | | | | | | | | | | | | | | | | | | | | | |
Gross expenses | | | 0.22 | % | | | 0.22 | % | | | 0.22 | % | | | 0.22 | % | | | 0.22 | % | | | 0.22 | % |
Net expenses | | | 0.20 | % | | | 0.20 | % | | | 0.17 | % | | | 0.12 | % | | | 0.09 | % | | | 0.10 | % |
Net investment income | | | 1.53 | % | | | 0.79 | % | | | 0.25 | % | | | 0.02 | % | | | 0.01 | % | | | 0.01 | % |
Supplemental data | | | | | | | | | | | | | | | | | | | | | | | | |
Net assets, end of period (000s omitted) | | | $25,317,799 | | | | $21,931,321 | | | | $23,242,417 | | | | $14,212,988 | | | | $17,509,698 | | | | $20,793,077 | |
| 1 | Amount is less than $0.005. |
| 2 | Amount is more than $(0.005). |
| 3 | Returns for periods of less than one year are not annualized. |
The accompanying notes are an integral part of these financial statements.
| | | | | | |
| Financial highlights | | Wells Fargo Government Money Market Fund | | | 25 | |
(For a share outstanding throughout each period)
| | | | | | | | | | | | | | | | |
| | | Six months ended
July 31, 2018 (unaudited) | | | Year ended January 31 | |
| SELECT CLASS | | 2018 | | | 2017 | | | 20161 | |
Net asset value, beginning of period | | | $1.00 | | | | $1.00 | | | | $1.00 | | | | $1.00 | |
Net investment income | | | 0.01 | | | | 0.01 | | | | 0.00 | 2 | | | 0.00 | 2 |
Net realized gains on investments | | | 0.00 | 2 | | | 0.00 | | | | 0.00 | 2 | | | 0.00 | 2 |
| | | | | | | | | | | | | | | | |
Total from investment operations | | | 0.01 | | | | 0.01 | | | | 0.00 | 2 | | | 0.00 | 2 |
Distributions to shareholders from | | | | | | | | | | | | | | | | |
Net investment income | | | (0.01 | ) | | | (0.01 | ) | | | (0.00 | )2 | | | (0.00 | )2 |
Net realized gains | | | 0.00 | | | | (0.00 | )2 | | | 0.00 | | | | 0.00 | |
| | | | | | | | | | | | | | | | |
Total distributions to shareholders | | | (0.01 | ) | | | (0.01 | ) | | | (0.00 | )2 | | | (0.00 | )2 |
Net asset value, end of period | | | $1.00 | | | | $1.00 | | | | $1.00 | | | | $1.00 | |
Total return3 | | | 0.79 | % | | | 0.85 | % | | | 0.30 | % | | | 0.04 | % |
Ratios to average net assets (annualized) | | | | | | | | | | | | | | | | |
Gross expenses | | | 0.18 | % | | | 0.18 | % | | | 0.18 | % | | | 0.18 | % |
Net expenses | | | 0.14 | % | | | 0.14 | % | | | 0.11 | % | | | 0.10 | % |
Net investment income | | | 1.58 | % | | | 0.86 | % | | | 0.34 | % | | | 0.08 | % |
Supplemental data | | | | | | | | | | | | | | | | |
Net assets, end of period (000s omitted) | | | $43,594,513 | | | | $46,288,730 | | | | $38,999,425 | | | | $7,985,195 | |
| 1 | For the period from June 30, 2015 (commencement of class operations) to January 31, 2016 |
| 2 | Amount is less than $0.005. |
| 3 | Returns for periods of less than one year are not annualized. |
The accompanying notes are an integral part of these financial statements.
| | | | |
| 26 | | Wells Fargo Government Money Market Fund | | Financial highlights |
(For a share outstanding throughout each period)
| | | | | | | | | | | | | | | | | | | | | | | | |
| | | Six months ended
July 31, 2018 (unaudited) | | | Year ended January 31 | |
| SERVICE CLASS | | 2018 | | | 2017 | | | 2016 | | | 2015 | | | 2014 | |
Net asset value, beginning of period | | | $1.00 | | | | $1.00 | | | | $1.00 | | | | $1.00 | | | | $1.00 | | | | $1.00 | |
Net investment income | | | 0.01 | | | | 0.00 | 1 | | | 0.00 | 1 | | | 0.00 | 1 | | | 0.00 | 1 | | | 0.00 | 1 |
Net realized gains (losses) on investments | | | 0.00 | 1 | | | 0.00 | 1 | | | 0.00 | 1 | | | 0.00 | 1 | | | (0.00 | )2 | | | 0.00 | 1 |
| | | | | | | | | | | | | | | | | | | | | | | | |
Total from investment operations | | | 0.01 | | | | 0.00 | 1 | | | 0.00 | 1 | | | 0.00 | 1 | | | 0.00 | 1 | | | 0.00 | 1 |
Distributions to shareholders from | | | | | | | | | | | | | | | | | | | | | | | | |
Net investment income | | | (0.01 | ) | | | (0.00 | )1 | | | (0.00 | )1 | | | (0.00 | )1 | | | (0.00 | )1 | | | (0.00 | )1 |
Net realized gains | | | 0.00 | | | | (0.00 | )1 | | | 0.00 | | | | 0.00 | | | | (0.00 | )1 | | | (0.00 | )1 |
| | | | | | | | | | | | | | | | | | | | | | | | |
Total distributions to shareholders | | | (0.01 | ) | | | (0.00 | )1 | | | (0.00 | )1 | | | (0.00 | )1 | | | (0.00 | )1 | | | (0.00 | )1 |
Net asset value, end of period | | | $1.00 | | | | $1.00 | | | | $1.00 | | | | $1.00 | | | | $1.00 | | | | $1.00 | |
Total return3 | | | 0.61 | % | | | 0.49 | % | | | 0.02 | % | | | 0.01 | % | | | 0.01 | % | | | 0.01 | % |
Ratios to average net assets (annualized) | | | | | | | | | | | | | | | | | | | | | | | | |
Gross expenses | | | 0.51 | % | | | 0.51 | % | | | 0.51 | % | | | 0.51 | % | | | 0.51 | % | | | 0.51 | % |
Net expenses | | | 0.50 | % | | | 0.50 | % | | | 0.40 | % | | | 0.13 | % | | | 0.09 | % | | | 0.10 | % |
Net investment income | | | 1.22 | % | | | 0.48 | % | | | 0.02 | % | | | 0.01 | % | | | 0.01 | % | | | 0.01 | % |
Supplemental data | | | | | | | | | | | | | | | | | | | | | | | | |
Net assets, end of period (000s omitted) | | | $2,471,510 | | | | $2,506,898 | | | | $2,992,780 | | | | $2,963,813 | | | | $4,129,813 | | | | $4,140,419 | |
| 1 | Amount is less than $0.005. |
| 2 | Amount is more than $(0.005). |
| 3 | Returns for periods of less than one year are not annualized. |
The accompanying notes are an integral part of these financial statements.
| | | | | | |
| Financial highlights | | Wells Fargo Government Money Market Fund | | | 27 | |
(For a share outstanding throughout each period)
| | | | | | | | | | | | | | | | | | | | | | | | |
| | | Six months ended
July 31, 2018 (unaudited) | | | Year ended January 31 | |
| SWEEP CLASS | | 2018 | | | 2017 | | | 2016 | | | 2015 | | | 2014 | |
Net asset value, beginning of period | | | $1.00 | | | | $1.00 | | | | $1.00 | | | | $1.00 | | | | $1.00 | | | | $1.00 | |
Net investment income | | | 0.00 | 1 | | | 0.00 | 1 | | | 0.00 | 1 | | | 0.00 | 1 | | | 0.00 | 1 | | | 0.00 | 1 |
Net realized gains (losses) on investments | | | 0.00 | 1 | | | 0.00 | 1 | | | 0.00 | 1 | | | 0.00 | 1 | | | (0.00 | )2 | | | 0.00 | 1 |
| | | | | | | | | | | | | | | | | | | | | | | | |
Total from investment operations | | | 0.00 | 1 | | | 0.00 | 1 | | | 0.00 | 1 | | | 0.00 | 1 | | | 0.00 | 1 | | | 0.00 | 1 |
Distributions to shareholders from | | | | | | | | | | | | | | | | | | | | | | | | |
Net investment income | | | (0.00 | )1 | | | (0.00 | )1 | | | (0.00 | )1 | | | (0.00 | )1 | | | (0.00 | )1 | | | (0.00 | )1 |
Net realized gains | | | 0.00 | | | | (0.00 | )1 | | | 0.00 | | | | 0.00 | | | | (0.00 | )1 | | | (0.00 | )1 |
| | | | | | | | | | | | | | | | | | | | | | | | |
Total distributions to shareholders | | | (0.00 | )1 | | | (0.00 | )1 | | | (0.00 | )1 | | | (0.00 | )1 | | | (0.00 | )1 | | | (0.00 | )1 |
Net asset value, end of period | | | $1.00 | | | | $1.00 | | | | $1.00 | | | | $1.00 | | | | $1.00 | | | | $1.00 | |
Total return3 | | | 0.47 | % | | | 0.24 | % | | | 0.01 | % | | | 0.01 | % | | | 0.01 | % | | | 0.01 | % |
Ratios to average net assets (annualized) | | | | | | | | | | | | | | | | | | | | | | | | |
Gross expenses | | | 0.77 | % | | | 0.77 | % | | | 0.96 | % | | | 0.96 | % | | | 0.96 | % | | | 0.96 | % |
Net expenses | | | 0.77 | % | | | 0.75 | % | | | 0.38 | % | | | 0.13 | % | | | 0.09 | % | | | 0.10 | % |
Net investment income | | | 0.95 | % | | | 0.24 | % | | | 0.01 | % | | | 0.01 | % | | | 0.01 | % | | | 0.01 | % |
Supplemental data | | | | | | | | | | | | | | | | | | | | | | | | |
Net assets, end of period (000s omitted) | | | $100 | | | | $100 | | | | $100 | | | | $2,977 | | | | $6,615 | | | | $18,244 | |
| 1 | Amount is less than $0.005. |
| 2 | Amount is more than $(0.005). |
| 3 | Returns for periods of less than one year are not annualized. |
The accompanying notes are an integral part of these financial statements.
| | | | |
| 28 | | Wells Fargo Government Money Market Fund | | Notes to financial statements (unaudited) |
1. ORGANIZATION
Wells Fargo Funds Trust (the “Trust”), a Delaware statutory trust organized on March 10, 1999, is an open-end management investment company registered under the Investment Company Act of 1940, as amended (the “1940 Act”). As an investment company, the Trust follows the accounting and reporting guidance in Financial Accounting Standards Board Accounting Standards Codification Topic 946, Financial Services – Investment Companies. These financial statements report on the Wells Fargo Government Money Market Fund (the “Fund”) which is a diversified series of the Trust.
2. SIGNIFICANT ACCOUNTING POLICIES
The following significant accounting policies, which are consistently followed in the preparation of the financial statements of the Fund, are in conformity with U.S. generally accepted accounting principles which require management to make estimates and assumptions that affect the reported amounts of assets and liabilities, disclosure of contingent assets and liabilities at the date of the financial statements, and the reported amounts of revenues and expenses during the reporting period. Actual results could differ from those estimates.
Securities valuation
As permitted under Rule 2a-7 of the 1940 Act, portfolio securities are valued at amortized cost, which approximates fair value. The amortized cost method involves valuing a security at its cost, plus accretion of discount or minus amortization of premium over the period until maturity.
Investments which are not valued using the method discussed above are valued at their fair value, as determined in good faith by the Board of Trustees of the Fund. The Board of Trustees has established a Valuation Committee comprised of the Trustees and has delegated to it the authority to take any actions regarding the valuation of portfolio securities that the Valuation Committee deems necessary or appropriate, including determining the fair value of portfolio securities, unless the determination has been delegated to the Wells Fargo Asset Management Pricing Committee at Wells Fargo Funds Management, LLC (“Funds Management”). The Board of Trustees retains the authority to make or ratify any valuation decisions or approve any changes to the Valuation Procedures as it deems appropriate. On a quarterly basis, the Board of Trustees receives reports on any valuation actions taken by the Valuation Committee or the Wells Fargo Asset Management Pricing Committee which may include items for ratification.
Valuations of fair valued securities are compared to the next actual sales price when available, or other appropriate market values, to assess the continued appropriateness of the fair valuation methodologies used. These securities are fair valued on a day-to-day basis, taking into consideration changes to appropriate market information and any significant changes to the inputs considered in the valuation process until there is a readily available price provided on an exchange or by an independent pricing service. Valuations received from an independent pricing service or independent broker-dealer quotes are periodically validated by comparisons to most recent trades and valuations provided by other independent pricing services in addition to the review of prices by the manager and/or subadviser. Unobservable inputs used in determining fair valuations are identified based on the type of security, taking into consideration factors utilized by market participants in valuing the investment, knowledge about the issuer and the current market environment.
Repurchase agreements
The Fund may invest in repurchase agreements and may participate in pooled repurchase agreement transactions with other funds advised by Funds Management. Repurchase agreements are agreements where the seller of a security to the Fund agrees to repurchase that security from the Fund at a mutually agreed upon time and price. The repurchase agreements must be fully collateralized based on values that are marked-to-market daily. The collateral may be held by an agent bank under a tri-party agreement. It is the custodian’s responsibility to value collateral daily and to take action to obtain additional collateral as necessary to maintain a market value equal to or greater than the resale price. The repurchase agreements are collateralized by U.S. government securities. There could be potential loss to the Fund in the event that the Fund is delayed or prevented from exercising its rights to dispose of the collateral, including the risk of a possible decline in the value of the underlying obligations during the period in which the Fund seeks to assert its rights.
When-issued transactions
The Fund may purchase securities on a forward commitment or when-issued basis. The Fund records a when-issued transaction on the trade date and will segregate assets in an amount at least equal in value to the Fund’s commitment to purchase when-issued securities. Securities purchased on a when-issued basis are marked-to-market daily and the Fund begins earning interest on the settlement date. Losses may arise due to changes in the market value of the underlying securities or if the counterparty does not perform under the contract.
Security transactions and income recognition
Securities transactions are recorded on a trade date basis. Realized gains or losses are recorded on the basis of identified cost.
| | | | | | |
| Notes to financial statements (unaudited) | | Wells Fargo Government Money Market Fund | | | 29 | |
Interest income is accrued daily and bond discounts are accreted and premiums are amortized daily.To the extent debt obligations are placed on non-accrual status, any related interest income may be reduced by writing off interest receivables when the collection of all or a portion of interest has been determined to be doubtful based on consistently applied procedures and the fair value has decreased. If the issuer subsequently resumes interest payments or when the collectability of interest is reasonably assured, the debt obligation is removed from non-accrual status.
Distributions to shareholders
Distributions to shareholders from net investment income are declared daily and paid monthly. Distributions from net realized gains, if any, are recorded on the ex-dividend date and paid at least annually. Such distributions are determined in accordance with income tax regulations and may differ from U.S. generally accepted accounting principles. Dividend sources are estimated at the time of declaration. The tax character of distributions is determined as of the Fund’s fiscal year end. Therefore, a portion of the Fund’s distributions made prior to the Fund’s fiscal year end may be categorized as a tax return of capital at year end.
Federal and other taxes
The Fund intends to continue to qualify as a regulated investment company by distributing substantially all of its investment company taxable income and any net realized capital gains (after reduction for capital loss carryforwards) sufficient to relieve it from all, or substantially all, federal income taxes. Accordingly, no provision for federal income taxes was required.
The Fund’s income and federal excise tax returns and all financial records supporting those returns for the prior three fiscal years are subject to examination by the federal and Delaware revenue authorities. Management has analyzed the Fund’s tax positions taken on federal, state, and foreign tax returns for all open tax years and does not believe that there are any uncertain tax positions that require recognition of a tax liability.
As of July 31, 2018, the cost of investments for federal income tax purposes is substantially the same as for financial reporting purposes.
Class allocations
The separate classes of shares offered by the Fund differ principally in distribution, shareholder servicing, and administration fees. Class specific expenses are charged directly to that share class. Investment income, common expenses, and realized gains (losses) on investments are allocated daily to each class of shares based on the relative proportion of net assets of each class.
3. FAIR VALUATION MEASUREMENTS
Fair value measurements of investments are determined within a framework that has established a fair value hierarchy based upon the various data inputs utilized in determining the value of the Fund’s investments. The three-level hierarchy gives the highest priority to unadjusted quoted prices in active markets for identical assets or liabilities (Level 1) and the lowest priority to unobservable inputs (Level 3). The Fund’s investments are classified within the fair value hierarchy based on the lowest level of input that is significant to the fair value measurement. The inputs are summarized into three broad levels as follows:
| ∎ | | Level 1 – quoted prices in active markets for identical securities |
| ∎ | | Level 2 – other significant observable inputs (including quoted prices for similar securities, interest rates, prepayment speeds, credit risk, etc.) |
| ∎ | | Level 3 – significant unobservable inputs (including the Fund’s own assumptions in determining the fair value of investments) |
The inputs or methodologies used for valuing investments in securities are not necessarily an indication of the risk associated with investing in those securities.
The following is a summary of the inputs used in valuing the Fund’s assets and liabilities as of July 31, 2018:
| | | | | | | | | | | | | | | | |
| | | Quoted prices
(Level 1) | | | Other significant
observable inputs
(Level 2) | | | Significant
unobservable inputs (Level 3) | | | Total | |
Assets | | | | | | | | | | | | | | | | |
Investments in: | | | | | | | | | | | | | | | | |
| | | | |
Government agency debt | | $ | 0 | | | $ | 29,277,554,694 | | | $ | 0 | | | $ | 29,277,554,694 | |
| | | | |
Repurchase agreements | | | 0 | | | | 38,153,685,422 | | | | 0 | | | | 38,153,685,422 | |
Treasury debt | | | 0 | | | | 6,837,287,802 | | | | 0 | | | | 6,837,287,802 | |
Total assets | | $ | 0 | | | $ | 74,268,527,918 | | | $ | 0 | | | $ | 74,268,527,918 | |
| | | | |
| 30 | | Wells Fargo Government Money Market Fund | | Notes to financial statements (unaudited) |
The Fund recognizes transfers between levels within the fair value hierarchy at the end of the reporting period. At July 31, 2018, the Fund did not have any transfers into/out of Level 1, Level 2, or Level 3.
4. TRANSACTIONS WITH AFFILIATES
Management fee
Funds Management, an indirect wholly owned subsidiary of Wells Fargo & Company (“Wells Fargo”), is the manager of the Fund and provides advisory and fund-level administrative services under an investment management agreement. Under the investment management agreement, Funds Management is responsible for, among other services, implementing the investment objectives and strategies of the Fund, supervising the subadviser and providing fund-level administrative services in connection with the Fund’s operations. As compensation for its services under the investment management agreement, Funds Management is entitled to receive an annual management fee starting at 0.15% and declining to 0.13% as the average daily net assets of the Fund increase. For the six months ended July 31, 2018, the management fee was equivalent to an annual rate of 0.13% of the Fund’s average daily net assets.
Funds Management has retained the services of a subadviser to provide daily portfolio management to the Fund. The fee for subadvisory services is borne by Funds Management. Wells Capital Management Incorporated, an affiliate of Funds Management and an indirect wholly owned subsidiary of Wells Fargo, is the subadviser to the Fund and is entitled to receive a fee from Funds Management at an annual rate starting at 0.05% and declining to 0.01% as the average daily net assets of the Fund increase.
Administration fees
Under a class-level administration agreement, Funds Management provides class-level administrative services to the Fund, which includes paying fees and expenses for services provided by the transfer agent, sub-transfer agents, omnibus account servicers and record-keepers. As compensation for its services under the class-level administration agreement, Funds Management receives an annual fee which is calculated based on the average daily net assets of each class as follows:
| | | | |
| | | Class-level
administration fee | |
Class A | | | 0.22 | % |
Administrator Class | | | 0.10 | |
Institutional Class | | | 0.08 | |
Select Class | | | 0.04 | |
Service Class | | | 0.12 | |
Sweep Class | | | 0.03 | |
Funds Management has contractually waived and/or reimbursed management and administration fees to the extent necessary to maintain certain net operating expense ratios for the Fund. When each class of the Fund has exceeded its expense cap, Funds Management has waived fees and/or reimbursed expenses from fund level expenses on a proportionate basis and then from class specific expenses; otherwise, waivers and/or reimbursements are applied against class specific expenses before fund level expenses. Funds Management has committed through May 31, 2019 to waive fees and/or reimburse expenses to the extent necessary to cap the Fund’s expenses at 0.60% for Class A shares, 0.35% for Administrator Class shares, 0.20% for Institutional Class shares, 0.14% for Select Class shares, 0.50% for Service Class shares, and 0.77% for Sweep Class shares. Prior to June 1, 2018, the Fund’s expenses were capped at 0.65% for Class A shares, 0.16% for Select Class shares, and 0.79% for Sweep Class shares. After this time, the cap may be increased or the commitment to maintain the cap may be terminated only with the approval of the Board of Trustees.
Distribution fee
The Trust has adopted a distribution plan for Sweep Class shares of the Fund pursuant to Rule 12b-1 under the 1940 Act. A distribution fee is charged to Sweep Class shares and paid to Wells Fargo Funds Distributor, LLC, the principal underwriter, at an annual rate of 0.35% of the average daily net assets of Sweep Class shares.
Shareholder servicing fees
The Trust has entered into contracts with one or more shareholder servicing agents, whereby Class A, Service Class, and Sweep Class of the Fund are charged a fee at an annual rate of 0.25% of the respective average daily net assets of each class. Administrator Class is charged a fee at an annual rate of 0.10% of its average daily net assets.
A portion of these total shareholder servicing fees were paid to affiliates of Wells Fargo.
| | | | | | |
| Notes to financial statements (unaudited) | | Wells Fargo Government Money Market Fund | | | 31 | |
Interfund transactions
The Fund may purchase or sell investment securities to other Wells Fargo affiliates pursuant to Rule 17a-7 under the 1940 Act and under procedures adopted by the Board of Trustees. The procedures have been designed to ensure that these interfund transactions, which do not incur broker commissions, are effected at current market prices.
5. INDEMNIFICATION
Under the Trust’s organizational documents, the officers and Trustees have been granted certain indemnification rights against certain liabilities that may arise out of performance of their duties to the Trust. Additionally, in the normal course of business, the Trust may enter into contracts with service providers that contain a variety of indemnification clauses. The Trust’s maximum exposure under these arrangements is dependent on future claims that may be made against the Fund and, therefore, cannot be estimated.
| | | | |
| 32 | | Wells Fargo Government Money Market Fund | | Other information (unaudited) |
PROXY VOTING INFORMATION
A description of the policies and procedures that the Fund uses to determine how to vote proxies relating to portfolio securities is available, upon request, by calling 1-800-222-8222, visiting our website at wellsfargofunds.com, or visiting the SEC website at sec.gov. Information regarding how the Fund voted proxies relating to portfolio securities during the most recent 12-month period ended June 30 is available on the Fund’s website at wellsfargofunds.com or by visiting the SEC website at sec.gov.
PORTFOLIO HOLDINGS INFORMATION
The complete portfolio holdings for the Fund are publicly available on the Fund’s website (wellsfargofunds.com) on a 1-day delayed basis. The Fund files its complete schedule of portfolio holdings with the SEC for the first and third quarters of each fiscal year on Form N-Q, which is available by visiting the SEC website at sec.gov. In addition, the Fund’s Form N-Q may be reviewed and copied at the SEC’s Public Reference Room in Washington, DC, and at regional offices in New York City, at 233 Broadway, and in Chicago, at 175 West Jackson Boulevard, Suite 900. Information about the Public Reference Room may be obtained by calling 1-800-SEC-0330.
| | | | | | |
| Other information (unaudited) | | Wells Fargo Government Money Market Fund | | | 33 | |
BOARD OF TRUSTEES AND OFFICERS
Each of the Trustees and Officers1 listed in the table below acts in identical capacities for each fund in the Wells Fargo family of funds, which consists of 154 mutual funds comprising the Wells Fargo Funds Trust, Wells Fargo Variable Trust, Wells Fargo Master Trust and four closed-end funds (collectively the “Fund Complex”). This table should be read in conjunction with the Prospectus and the Statement of Additional Information2. The mailing address of each Trustee and Officer is 525 Market Street, 12th Floor, San Francisco, CA 94105. Each Trustee and Officer serves an indefinite term, however, each Trustee serves such term until reaching the mandatory retirement age established by the Trustees.
Independent Trustees
| | | | | | |
Name and year of birth | | Position held and length of service* | | Principal occupations during past five years or longer | | Current other
public company or
investment company
directorships |
William R. Ebsworth (Born 1957) | | Trustee, since 2015 | | Retired. From 1984 to 2013, equities analyst, portfolio manager, research director and chief investment officer at Fidelity Management and Research Company in Boston, Tokyo, and Hong Kong, and retired in 2013 as Chief Investment Officer of Fidelity Strategic Advisers, Inc. where he led a team of investment professionals managing client assets. Prior thereto, Board member of Hong Kong Securities Clearing Co., Hong Kong Options Clearing Corp., the Thailand International Fund, Ltd., Fidelity Investments Life Insurance Company, and Empire Fidelity Investments Life Insurance Company. Board member of the Forté Foundation (non-profit organization) and the Vincent Memorial Hospital Endowment (non-profit organization), where he serves on the Investment Committee and as a Chair of the Audit Committee. Mr. Ebsworth is a CFA® charterholder. | | Asset Allocation Trust |
Jane A. Freeman (Born 1953) | | Trustee, since 2015; Chair Liaison, since 2018 | | Retired. From 2012 to 2014 and 1999 to 2008, Chief Financial Officer of Scientific Learning Corporation. From 2008 to 2012, Ms. Freeman provided consulting services related to strategic business projects. Prior to 1999, Portfolio Manager at Rockefeller & Co. and Scudder, Stevens & Clark. Board member of the Harding Loevner Funds from 1996 to 2014, serving as both Lead Independent Director and chair of the Audit Committee. Board member of the Russell Exchange Traded Funds Trust from 2011 to 2012 and the chair of the Audit Committee. Ms. Freeman is a Board Member of Ruth Bancroft Garden (non-profit organization) and the Glimmerglass Festival. She is also an inactive Chartered Financial Analyst. | | Asset Allocation Trust |
Isaiah Harris, Jr. (Born 1952) | | Trustee, since 2009 | | Retired. Chairman of the Board of CIGNA Corporation since 2009, and Director since 2005. From 2003 to 2011, Director of Deluxe Corporation. Prior thereto, President and CEO of BellSouth Advertising and Publishing Corp. from 2005 to 2007, President and CEO of BellSouth Enterprises from 2004 to 2005 and President of BellSouth Consumer Services from 2000 to 2003. Emeritus member of the Iowa State University Foundation Board of Governors. Emeritus Member of the Advisory Board of Iowa State University School of Business. Advisory Board Member, Palm Harbor Academy (charter school). Advisory Board Member, Child Evangelism Fellowship (non-profit). Mr. Harris is a certified public accountant (inactive status). | | CIGNA Corporation; Asset Allocation Trust |
Judith M. Johnson (Born 1949) | | Trustee, since 2008; Audit Committee Chairman, since 2009 | | Retired. Prior thereto, Chief Executive Officer and Chief Investment Officer of Minneapolis Employees Retirement Fund from 1996 to 2008. Ms. Johnson is an attorney, certified public accountant and a certified managerial accountant. | | Asset Allocation Trust |
David F. Larcker (Born 1950) | | Trustee, since 2009 | | James Irvin Miller Professor of Accounting at the Graduate School of Business, Stanford University, Director of the Corporate Governance Research Initiative and Senior Faculty of The Rock Center for Corporate Governance since 2006. From 2005 to 2008, Professor of Accounting at the Graduate School of Business, Stanford University. Prior thereto, Ernst & Young Professor of Accounting at The Wharton School, University of Pennsylvania from 1985 to 2005. | | Asset Allocation Trust |
| | | | |
| 34 | | Wells Fargo Government Money Market Fund | | Other information (unaudited) |
| | | | | | |
Name and year of birth | | Position held and length of service* | | Principal occupations during past five years or longer | | Current other
public company or
investment company
directorships |
Olivia S. Mitchell (Born 1953) | | Trustee, since 2006; Governance Committee Chairman, since 2018 | | International Foundation of Employee Benefit Plans Professor, Wharton School of the University of Pennsylvania since 1993. Director of Wharton’s Pension Research Council and Boettner Center on Pensions & Retirement Research, and Research Associate at the National Bureau of Economic Research. Previously, Cornell University Professor from 1978 to 1993. | | Asset Allocation Trust |
Timothy J. Penny (Born 1951) | | Trustee, since 1996; Chairman, since 2018; Vice Chairman, from 2017 to 2018 | | President and Chief Executive Officer of Southern Minnesota Initiative Foundation, a non-profit organization, since 2007. Member of the Board of Trustees of NorthStar Education Finance, Inc., a non-profit organization, since 2007. | | Asset Allocation Trust |
James G. Polisson (Born 1959) | | Trustee, since 2018; Advisory Board Member, from 2017 to 2018 | | Retired. Chief Marketing Officer, Source (ETF) UK Services, Ltd, from 2015 to 2017. From 2012 to 2015, Principal of The Polisson Group, LLC, a management consulting, corporate advisory and principal investing company. Chief Executive Officer and Managing Director at Russell Investments, Global Exchange Traded Funds from 2010 to 2012. Managing Director of Barclays Global Investors from 1998 to 2010 and Global Chief Marketing Officer for iShares and Barclays Global Investors from 2000 to 2010. Trustee of the San Francisco Mechanics’ Institute, a non-profit organization, from 2013 to 2015. Board member of the Russell Exchange Traded Fund Trust from 2011 to 2012. Director of Barclays Global Investors Holdings Deutschland GmbH from 2006 to 2009. Mr. Polisson is an attorney and has a retired status with the Massachusetts and District of Columbia Bar Associations. | | Asset Allocation Trust |
Michael S. Scofield (Born 1943) | | Trustee, since 2010 | | Served on the Investment Company Institute’s Board of Governors and Executive Committee from 2008-2011 as well the Governing Council of the Independent Directors Council from 2006-2011 and the Independent Directors Council Executive Committee from 2008-2011. Trustee of the Evergreen Fund complex (and its predecessors) from 1984 to 2010. Chairman of the Evergreen Funds from 2000-2010. Former Trustee of the Mentor Funds. Retired Attorney, Law Offices of Michael S. Scofield. | | Asset Allocation Trust |
Pamela Wheelock (Born 1959) | | Trustee, since 2018; Advisory Board Member, from 2017 to 2018 | | Chief Operating Officer, Twin Cities Habitat for Humanity, since January, 2017. Vice President of University Services, University of Minnesota from 2012 to 2017. Prior thereto, on the Board of Directors, Goverance Committee and Finance Committee for the Minnesota Philanthropy Partners (Saint Paul Foundation) from 2012 to 2018, Interim President and Chief Executive Officer of Blue Cross Blue shield of Minnesota of Minnesota from 2010 to 2011, Chairman of the Board from 2009 to 2011 and Board Director 003 to 2015. Vice President, Leadership and Community Engagement, Bush Foundation, Saint Paul, Minnesota (a private foundation) from 2009 to 2011. Executive Vice President and Chief Financial Officer, Minnesota Sports and Entertainment from 2004 to 2009 and Senior Vice President from 2002 to 2004. Commissioner of Finance, State of Minnesota, from 1999 to 2002. Currently the Board Chair of the Minnesota Wild Foundation since 2010. | | Asset Allocation Trust |
| * | Length of service dates reflect the Trustee’s commencement of service with the Trust’s predecessor entities, where applicable. |
| | | | | | |
| Other information (unaudited) | | Wells Fargo Government Money Market Fund | | | 35 | |
Officers
| | | | | | |
Name and year of birth | | Position held and length of service | | Principal occupations during past five years or longer | | |
Andrew Owen (Born 1960) | | President, since 2017 | | Executive Vice President of Wells Fargo & Company and Head of Affiliated Managers, Wells Fargo Asset Management, since 2014. In addition, Mr. Owen is currently President, Chief Executive Officer and Director of Wells Fargo Funds Management, LLC since 2017. Prior thereto, Executive Vice President responsible for marketing, investments and product development for Wells Fargo Funds Management, LLC, from 2009 to 2014. | | |
Nancy Wiser1 (Born 1967) | | Treasurer, since 2012 | | Executive Vice President of Wells Fargo Funds Management, LLC since 2011. Chief Operating Officer and Chief Compliance Officer at LightBox Capital Management LLC, from 2008 to 2011. | | |
Alexander Kymn3 (Born 1973) | | Secretary, since 2018; Chief Legal Officer, since 2018 | | Senior Company Counsel of Wells Fargo Bank, N.A. since 2018 (previously Senior Counsel from 2007 to 2018). Vice President of Wells Fargo Funds Management, LLC from 2008 to 2014. | | |
Michael H. Whitaker (Born 1967) | | Chief Compliance Officer, since 2016 | | Senior Vice President and Chief Compliance Officer since 2016. Senior Vice President and Chief Compliance Officer for Fidelity Investments from 2007 to 2016. | | |
David Berardi (Born 1975) | | Assistant Treasurer, since 2009 | | Vice President of Wells Fargo Funds Management, LLC since 2009. Vice President of Evergreen Investment Management Company, LLC from 2008 to 2010. Manager of Fund Reporting and Control for Evergreen Investment Management Company, LLC from 2004 to 2010. | | |
Jeremy DePalma1 (Born 1974) | | Assistant Treasurer, since 2009 | | Senior Vice President of Wells Fargo Funds Management, LLC since 2009. Senior Vice President of Evergreen Investment Management Company, LLC from 2008 to 2010 and head of the Fund Reporting and Control Team within Fund Administration from 2005 to 2010. | | |
| 1 | Nancy Wiser acts as Treasurer of 77 funds in the Fund Complex. Jeremy DePalma acts as Treasurer of 77 funds and Assistant Treasurer of 77 funds in the Fund Complex. |
| 2 | The Statement of Additional Information includes additional information about the Trustees and is available, without charge, upon request, by calling 1-800-222-8222 or by visiting the website at wellsfargofunds.com. |
| 3 | Alexander Kymn became the Secretary and Chief Legal Officer effective April 17, 2018. |
| | | | |
| 36 | | Wells Fargo Government Money Market Fund | | Other information (unaudited) |
BOARD CONSIDERATION OF INVESTMENT MANAGEMENT AND SUB-ADVISORY AGREEMENTS:
Wells Fargo Government Money Market Fund
Under the Investment Company Act of 1940 (the “1940 Act”), the Board of Trustees (the “Board”) of Wells Fargo Funds Trust (the “Trust”) must determine annually whether to approve the continuation of the Trust’s investment management and sub-advisory agreements. In this regard, at an in-person meeting held on May 22-23, 2018 (the “Meeting”), the Board, all the members of which have no direct or indirect interest in the investment management and sub-advisory agreements and are not “interested persons” of the Trust, as defined in the 1940 Act (the “Independent Trustees”), reviewed and approved for Wells Fargo Government Money Market Fund (the “Fund”): (i) an investment management agreement (the “Management Agreement”) with Wells Fargo Funds Management, LLC (“Funds Management”); and (ii) an investment sub-advisory agreement (the “Sub-Advisory Agreement”) with Wells Capital Management Incorporated (the “Sub-Adviser”), an affiliate of Funds Management. The Management Agreement and the Sub-Advisory Agreement are collectively referred to as the “Advisory Agreements.”
At the Meeting, the Board considered the factors and reached the conclusions described below relating to the selection of Funds Management and the Sub-Adviser and the approval of the Advisory Agreements. Prior to the Meeting, including at an in-person meeting in April 2018, the Trustees conferred extensively among themselves and with representatives of Funds Management about these matters. Also, the Board has adopted a team-based approach, with each team consisting of a sub-set of Trustees, to assist the full Board in the discharge of its duties in reviewing investment performance and other matters throughout the year. The Independent Trustees were assisted in their evaluation of the Advisory Agreements by independent legal counsel, from whom they received separate legal advice and with whom they met separately.
In providing information to the Board, Funds Management and the Sub-Adviser were guided by a detailed set of requests for information submitted to them by independent legal counsel on behalf of the Independent Trustees at the start of the Board’s annual contract renewal process earlier in 2018. In considering and approving the Advisory Agreements, the Trustees considered the information they believed relevant, including but not limited to the information discussed below. The Board considered not only the specific information presented in connection with the Meeting, but also the knowledge gained over time through interaction with Funds Management and the Sub-Adviser about various topics. In this regard, the Board reviewed reports of Funds Management at each of its quarterly meetings, which included, among other things, portfolio reviews and investment performance reports. In addition, the Board and the teams mentioned above confer with portfolio managers at various times throughout the year. The Board did not identify any particular information or consideration that was all-important or controlling, and each individual Trustee may have attributed different weights to various factors.
After its deliberations, the Board unanimously approved the continuation of the Advisory Agreements for a one-year term and determined that the compensation payable to Funds Management and the Sub-Adviser under each of the Advisory Agreements was reasonable. The Board considered the approval of the Advisory Agreements for the Fund as part of its consideration of agreements for funds across the complex, but its approvals were made on a fund-by-fund basis. The following summarizes a number of important, but not necessarily all, factors considered by the Board in support of its approvals.
Nature, extent and quality of services
The Board received and considered various information regarding the nature, extent and quality of services provided to the Fund by Funds Management and the Sub-Adviser under the Advisory Agreements. This information included a description of the investment advisory services and Fund-level administrative services covered by the Management Agreement, as well as, among other things, a summary of the background and experience of senior management of Wells Fargo Asset Management (“WFAM”), of which Funds Management and the Sub-Adviser are a part, a summary of investments made in the business of WFAM, a summary of certain organizational and personnel changes involving Funds Management and the Sub-Adviser, and a description of Funds Management’s and the Sub-Adviser’s business continuity planning programs and of their approaches to data privacy and cybersecurity. The Board also considered the qualifications, background, tenure and responsibilities of each of the portfolio managers primarily responsible for the day-to-day portfolio management of the Fund.
The Board evaluated the ability of Funds Management and the Sub-Adviser to attract and retain qualified investment professionals, including research, advisory and supervisory personnel. The Board further considered the compliance programs and compliance records of Funds Management and the Sub-Adviser. In addition, the Board took into account the full range of services provided to the Fund by Funds Management and its affiliates.
| | | | | | |
| Other information (unaudited) | | Wells Fargo Government Money Market Fund | | | 37 | |
Fund investment performance and expenses
The Board considered the investment performance results for the Fund over various time periods ended December 31, 2017. The Board considered these results in comparison to the investment performance of funds in a universe that was determined by Broadridge Inc. (“Broadridge”) to be similar to the Fund (the “Universe”), and in comparison to the Fund’s benchmark index and to other comparative data. Broadridge is an independent provider of investment company data. The Board received a description of the methodology used by Broadridge to select the mutual funds in the performance Universe. The Board noted that the investment performance of the Fund (Class Admin) was higher than or in range of the average investment performance of the Universe for all periods under review. The Board also noted that the investment performance of the Fund was higher than its benchmark index, the Lipper U.S. Government Money Market Funds Index, for all periods under review.
The Board also received and considered information regarding the Fund’s net operating expense ratios and their various components, including actual management fees, custodian and other non-management fees, and Rule 12b-1 and non-Rule 12b-1 shareholder service fees. The Board considered these ratios in comparison to the median ratios of funds in class-specific expense groups that were determined by Broadridge to be similar to the Fund (the “Groups”). The Board received a description of the methodology used by Broadridge to select the mutual funds in the expense Groups and an explanation of how funds comprising expense groups and their expense ratios may vary from year-to-year. Based on the Broadridge reports, the Board noted that the net operating expense ratios of the Fund were lower than or in range of the median net operating expense ratios of the expense Groups for the Administrator, Institutional, Service and Select share classes, but higher than the median net operating expense ratios of the expense Groups for Class A and Sweep Class. The Board noted that the net operating expense ratio caps for the Fund’s Sweep Class, Select Class, and Class A would be reduced.
The Board took into account the Fund’s investment performance and expense information provided to it among the factors considered in deciding to re-approve the Advisory Agreements.
Investment management and sub-advisory fee rates
The Board reviewed and considered the contractual fee rates payable by the Fund to Funds Management under the Management Agreement, as well as the contractual fee rates payable by the Fund to Funds Management for class-level administrative services under a Class-Level Administration Agreement, which include, among other things, class-level transfer agency and sub-transfer agency costs (collectively, the “Management Rates”). The Board also reviewed and considered the contractual investment sub-advisory fee rates that are payable by Funds Management to the Sub-Adviser for investment sub-advisory services.
Among other information reviewed by the Board was a comparison of the Fund’s Management Rates with the average contractual investment management fee rates of funds in the expense Groups at a common asset level as well as transfer agency costs of the funds in the expense Groups. The Board noted that the Management Rates of the Fund were lower than, equal to, or in range of the sum of these average rates for the Fund’s expense Groups for all share classes.
The Board also received and considered information about the portion of the total management fee that was retained by Funds Management after payment of the fee to the Sub-Adviser for sub-advisory services. In assessing the reasonableness of this amount, the Board received and evaluated information about the nature and extent of responsibilities retained and risks assumed by Funds Management and not delegated to or assumed by the Sub-Adviser, and about Funds Management’s on-going oversight services. Given the affiliation between Funds Management and the Sub-Adviser, the Board ascribed limited relevance to the allocation of fees between them.
Based on its consideration of the factors and information it deemed relevant, including those described here, the Board determined that the compensation payable to Funds Management under the Management Agreement and to the Sub-Adviser under the Sub-Advisory Agreement was reasonable.
Profitability
The Board received and considered information concerning the profitability of Funds Management, as well as the profitability of both WFAM and Wells Fargo & Co. (“Wells Fargo”) as a whole, from providing services to the Fund and the fund family as a whole. The Board noted that the Sub-Adviser’s profitability information with respect to providing services to the Fund was subsumed in the WFAM and Wells Fargo profitability analysis.
Funds Management reported on the methodologies and estimates used in calculating profitability, including a description of the methodology used to allocate certain expenses and recent enhancements made to the methodology. Among other things, the Board noted that the levels of profitability reported on a fund-by-fund basis varied widely, depending on factors such as the size and type of fund. Based on its review, the Board did not deem the profits reported by Funds Management, WFAM or Wells Fargo from services provided to the Fund to be at a level that would prevent it from approving the continuation of the Advisory Agreements.
| | | | |
| 38 | | Wells Fargo Government Money Market Fund | | Other information (unaudited) |
Economies of scale
The Board considered the extent to which Funds Management may experience economies of scale in the provision of management services, and the extent to which scale benefits, if any, would be shared with shareholders. In particular, the Board noted the existence of breakpoints in the Fund’s management fee structure, which operate generally to reduce the Fund’s expense ratios as the Fund grows in size. It considered that, for a small fund or a fund that shrinks in size, breakpoints conversely can result in higher fee levels. The Board also considered that in addition to management fee breakpoints, competitive management fee rates set at the outset without regard to breakpoints and fee waiver and expense reimbursement arrangements, as well as investments in the business intended to enhance services available to Fund shareholders, are means of sharing potential economies of scale with shareholders of the Fund.
The Board concluded that the Fund’s fee and expense arrangements, including contractual breakpoints, constituted a reasonable approach to sharing potential economies of scale with the Fund and its shareholders.
Other benefits to Funds Management and the Sub-Adviser
The Board received and considered information regarding potential “fall-out” or ancillary benefits received by Funds Management and its affiliates, including the Sub-Adviser, as a result of their relationships with the Fund. Ancillary benefits could include, among others, benefits directly attributable to other relationships with the Fund and benefits potentially derived from an increase in Funds Management’s and the Sub-Adviser’s business as a result of their relationships with the Fund. The Board noted that various affiliates of Funds Management may receive distribution-related fees, shareholder servicing payments and sub-transfer agency fees in respect of shares sold or held through them and services provided.
The Board also reviewed information about soft dollar credits earned and utilized by the Sub-Adviser, fees earned by Funds Management and the Sub-Adviser from managing a private investment vehicle for the fund family’s securities lending collateral and commissions earned by an affiliated broker from portfolio transactions.
Based on its consideration of the factors and information it deemed relevant, including those described here, the Board did not find that any ancillary benefits received by Funds Management and its affiliates, including the Sub-Adviser, were unreasonable.
Conclusion
At the Meeting, after considering the above-described factors and based on its deliberations and its evaluation of the information described above, the Board unanimously approved the continuation of the Advisory Agreements for a one-year term and determined that the compensation payable to Funds Management and the Sub-Adviser under each of the Advisory Agreements was reasonable.
This page is intentionally left blank.
This page is intentionally left blank.

For more information
More information about Wells Fargo Funds is available free upon request. To obtain literature, please write, email, visit the Fund’s website, or call:
Wells Fargo Funds
P.O. Box 219967
Kansas City, MO 64121-9967
Website: wellsfargofunds.com
Individual investors: 1-800-222-8222
Retail investment professionals: 1-888-877-9275
Institutional investment professionals:
1-866-765-0778
This report and the financial statements contained herein are submitted for the general information of the shareholders of the Fund. If this report is used for promotional purposes, distribution of the report must be accompanied or preceded by a current prospectus. Before investing, please consider the investment objectives, risks, charges, and expenses of the investment. For a current prospectus and, if available, a summary prospectus, containing this information, call 1-800-222-8222 or visit the Fund’s website at wellsfargofunds.com. Read the prospectus carefully before you invest or send money.
Wells Fargo Asset Management (WFAM) is the trade name for certain investment advisory/management firms owned by Wells Fargo & Company. These firms include but are not limited to Wells Capital Management Incorporated and Wells Fargo Funds Management, LLC. Certain products managed by WFAM entities are distributed by Wells Fargo Funds Distributor, LLC (a broker/dealer and Member FINRA).
This material is for general informational and educational purposes only and is NOT intended to provide investment advice or a recommendation of any kind—including a recommendation for any specific investment, strategy, or plan.
NOT FDIC INSURED ◾ NO BANK GUARANTEE ◾ MAY LOSE VALUE
© 2018 Wells Fargo Funds Management, LLC. All rights reserved.
| | |
 | | 314812 09-18 SA303/SAR303 07-18 |
Semi-Annual Report
July 31, 2018

Government Money Market Funds

| ∎ | | Wells Fargo 100% Treasury Money Market Fund |

Reduce clutter. Save trees.
Sign up for electronic delivery of prospectuses and shareholder reports at wellsfargo.com/advantagedelivery
Contents
The views expressed and any forward-looking statements are as of July 31, 2018, unless otherwise noted, and are those of the Fund managers and/or Wells Fargo Funds Management, LLC. Discussions of individual securities, or the markets generally, or any Wells Fargo Fund are not intended as individual recommendations. Future events or results may vary significantly from those expressed in any forward-looking statements. The views expressed are subject to change at any time in response to changing circumstances in the market. Wells Fargo Funds Management, LLC and the Fund disclaim any obligation to publicly update or revise any views expressed or forward-looking statements.
NOT FDIC INSURED ◾ NO BANK GUARANTEE ◾ MAY LOSE VALUE
| | | | |
| 2 | | Wells Fargo 100% Treasury Money Market Fund | | Letter to shareholders (unaudited) |

Andrew Owen
President
Wells Fargo Funds
Yields on money market funds benefited during the period.
During February 2018, the U.S. stock market endured a loss of more than 10% before recovering in March and April.
Dear Shareholder:
We are pleased to offer you this semi-annual report for the Wells Fargo 100% Treasury Money Market Fund for the six-month period that ended July 31, 2018. Yields on money market funds benefited during the period. As the U.S. Federal Reserve (the Fed) moved toward a more normalized monetary policy after an extended term of low interest rates following the global financial crisis during 2007 and 2008, its steady pace of interest rate increases helped raise yields on short-term money market instruments.
Globally, stock markets followed a less consistent path during the period. After advancing during the summer and fall of 2017 in a roughly synchronized way, economic growth and stock markets globally diverged during the first seven months of 2018. For fixed-income investors, higher U.S. interest rates, rising inflation, and intensifying global geopolitical tensions tended to restrain taxable bond prices while high-yield and municipal bond investors generally enjoyed positive returns.
For the period, U.S. stocks, as measured by the S&P 500 Index,1 gained 0.70%, and international stocks, as measured by the MSCI ACWI ex USA Index (Net),2 fell 6.66%. Emerging market stocks, as measured by the MSCI EM Index (Net),3 dropped 11.94%. In bond markets, the Bloomberg Barclays U.S. Aggregate Bond Index4 declined 0.45% while fixed-income investments outside the U.S. fell 4.57%, according to the Bloomberg Barclays Global Aggregate ex-USD Index.5 The Bloomberg Barclays Municipal Bond Index6 added 1.18%, and the ICE BofAML U.S. High Yield Index7 was up 0.55%.
Volatility reemerged during the first quarter of 2018 as economic signals were mixed.
The first quarter of 2018 began with stock market gains in January following U.S. tax reform that lowered rates for individuals and corporations and deregulation advanced in some economic sectors. Then, investor optimism was supplanted by several concerns. Trade tensions intensified, particularly between the U.S. and China. The U.S. threatened to impose tariffs on a broad range of imported products. Increasing interest rates and inflation also caused concern. During February 2018, the U.S. stock market endured a loss of more than 10% before recovering in March and April. The S&P 500 Index closed the first quarter with a negative return, the first negative quarterly return for the index since 2014.
| 1 | The S&P 500 Index consists of 500 stocks chosen for market size, liquidity, and industry group representation. It is a market-value-weighted index with each stock’s weight in the index proportionate to its market value. You cannot invest directly in an index. |
| 2 | The Morgan Stanley Capital International (MSCI) All Country World Index (ACWI) ex USA Index (Net) is a free-float-adjusted market-capitalization-weighted index that is designed to measure the equity market performance of developed markets, excluding the United States and Canada. Source: MSCI. MSCI makes no express or implied warranties or representations and shall have no liability whatsoever with respect to any MSCI data contained herein. The MSCI data may not be further redistributed or used as a basis for other indices or any securities or financial products. This report is not approved, reviewed, or produced by MSCI. You cannot invest directly in an index. |
| 3 | The MSCI Emerging Markets (EM) Index (Net) is a free-float-adjusted market-capitalization-weighted index that is designed to measure large- and mid-cap equity market performance of emerging markets. The MSCI EM Index (Net) consists of the following 24 emerging market country indices: Brazil, Chile, China, Colombia, Czech Republic, Egypt, Greece, Hungary, India, Indonesia, Korea, Malaysia, Mexico, Pakistan, Peru, the Philippines, Poland, Qatar, Russia, South Africa, Taiwan, Thailand, Turkey, and the United Arab Emirates. You cannot invest directly in an index. |
| 4 | The Bloomberg Barclays U.S. Aggregate Bond Index is a broad-based benchmark that measures the investment-grade, U.S. dollar-denominated, fixed-rate taxable bond market, including Treasuries, government-related and corporate securities, mortgage-backed securities (agency fixed-rate and hybrid adjustable-rate mortgage pass-throughs), asset-backed securities, and commercial mortgage-backed securities. You cannot invest directly in an index. |
| 5 | The Bloomberg Barclays Global Aggregate ex-USD Index is an unmanaged index that provides a broad-based measure of the global investment-grade fixed-income markets excluding the U.S. dollar-denominated debt market. You cannot invest directly in an index. |
| 6 | The Bloomberg Barclays Municipal Bond Index is an unmanaged index composed of long-term tax-exempt bonds with a minimum credit rating of Baa. You cannot invest directly in an index. |
| 7 | The ICE BofAML U.S. High Yield Index is a market-capitalization-weighted index of domestic and Yankee high-yield bonds. The index tracks the performance of high-yield securities traded in the U.S. bond market. You cannot invest directly in an index. Copyright 2018. ICE Data Indices, LLC. All rights reserved. |
| 8 | The Consumer Price Index For All Urban Consumers (CPI-U) measures the changes in the price of a basket of goods and services purchased by urban consumers. The urban consumer population is deemed by many as a better representative measure of the general public because most of the country’s population lives in highly populated areas, which represent close to 90% of the total population. You cannot invest directly in an index. |
| | | | | | |
| Letter to shareholders (unaudited) | | Wells Fargo 100% Treasury Money Market Fund | | | 3 | |
The Fed increased the federal funds rate by 25 basis points (bps; 100 bps equal 1.00%) in March 2018 and the rate of inflation reached the Fed’s 2% target for the first time in a year. The unemployment rate fell to 4.1%. The third revision of first-quarter gross domestic product (GDP) growth by the U.S. Bureau of Economic Analysis released during June 2018 was lowered to 2.0%.
Overseas, investment market returns reversed the strong returns of 2017. After having gained 27.19% for the 12-month period that ended on December 31, 2017, the MSCI ACWI ex USA Index (Net) fell 1.46% for the seven-month period that ended July 31, 2018. The U.S. dollar strengthened relative to local currencies, which served to restrain returns.
Global trade tensions escalated during the second quarter and into the third quarter of 2018.
Global trade tensions escalated as the second quarter of 2018 opened and equity markets fell in response before resuming upward momentum later in April. The U.S. government imposed tariffs on products and commodities imported from other markets in North America, Europe, and Asia. In retaliation, governments imposed tariffs on U.S. products and commodities. In addition, the U.S. pushed its North American neighbors to renegotiate the North American Free Trade Agreement, furthering trade tensions and investor uncertainty.
The CPI-U8 added 0.2% in May after a similar increase in April. On a year-over-year basis, the all-items index rose 2.8% for the 12 months that ended May 31, continuing its upward trend since the beginning of the year. The index for all items less food and energy rose 2.2% for the same 12-month period. Interest rates generally increased and the bond markets tended to decline.
During June 2018, the Fed increased the federal funds rate by 25 bps. Investment markets began to anticipate two more rate increases in 2018. Long-term interest rates in the U.S. trended higher—rates on the 10-year and 30-year Treasury bonds moved from 2.46% and 2.81%, respectively, on January 1, 2018, to 2.96% and 3.08%, respectively, on July 31, 2018. While higher at the end of the period, rates were off their peak levels on May 17, 2018, of 3.11% and 3.25%, respectively. Investors became more aware of and concerned about the potential for an inverted yield curve—sometimes a recession signal—as short-term rates increased more quickly than long-term rates.
The unemployment rate fell to 3.9% in July after ticking up slightly in June from May’s 3.8% level, according to the U.S. Department of Labor. The annualized rate of GDP growth for the second quarter of 2018 was reported in July to be 4.1%, the highest level since the third quarter of 2014, according to the U.S. Bureau of Economic Analysis.
Internationally, the prospects for a smooth U.K. Brexit agreement was cast into doubt as members of Prime Minister Theresa May’s negotiating team resigned. Despite the uncertainty, the period closed with expectations that the Bank of England’s Monetary Policy Committee in July would announce an increase in its key interest rate to 0.75%, which it did in early August.
Meanwhile, central banks in Europe and Japan maintained low interest rates and accommodative monetary policies. Amid rising trade uncertainty, People’s Bank of China monetary policies shifted with cuts to reserve requirement ratios and implementation of supportive measures such as accelerated infrastructure spending and tax cuts for small and medium enterprises and for individuals. Nevertheless, a strengthening U.S. dollar and the tensions associated with trade policies remained headwinds for investors overseas.
| | | | |
| 4 | | Wells Fargo 100% Treasury Money Market Fund | | Letter to shareholders (unaudited) |
Don’t let short-term uncertainty derail long-term investment goals.
Periods of investment uncertainty can present challenges, but experience has taught us that maintaining long-term investment goals can be an effective way to plan for the future. To help you create a sound strategy based on your personal goals and risk tolerance, Wells Fargo Funds offers more than 100 mutual funds spanning a wide range of asset classes and investment styles. Although diversification cannot guarantee an investment profit or prevent losses, we believe it can be an effective way to manage investment risk and potentially smooth out overall portfolio performance. We encourage investors to know their investments and to understand that appropriate levels of risk-taking may unlock opportunities.
Thank you for choosing to invest with Wells Fargo Funds. We appreciate your confidence in us and remain committed to helping you meet your financial needs.
Sincerely,

Andrew Owen
President
Wells Fargo Funds
For further information about your Fund, contact your investment professional, visit our website at wellsfargofunds.com, or call us directly at 1-800-222-8222.
This page is intentionally left blank.
| | | | |
| 6 | | Wells Fargo 100% Treasury Money Market Fund | | Performance highlights (unaudited) |
Investment objective
The Fund seeks current income exempt from most state and local individual income taxes, while preserving capital and liquidity.
Manager
Wells Fargo Funds Management, LLC
Subadviser
Wells Capital Management Incorporated
Portfolio managers
Michael C. Bird, CFA®
Jeffrey L. Weaver, CFA®
Laurie White
Average annual total returns (%) as of July 31, 20181
| | | | | | | | | | | | | | | | | | | | | | |
| | | | | | | | | | | | | | Expense ratios2 (%) | |
| | | Inception date | | 1 year | | | 5 year | | | 10 year | | | Gross | | | Net3 | |
| Class A (WFTXX) | | 11-8-1999 | | | 0.78 | | | | 0.17 | | | | 0.12 | | | | 0.68 | | | | 0.60 | |
| Administrator Class (WTRXX) | | 6-30-2010 | | | 1.12 | | | | 0.29 | | | | 0.18 | | | | 0.41 | | | | 0.30 | |
| Institutional Class (WOTXX) | | 10-31-2014 | | | 1.23 | | | | 0.34 | | | | 0.21 | | | | 0.29 | | | | 0.20 | |
| Service Class (NWTXX) | | 12-3-1990 | | | 0.92 | | | | 0.21 | | | | 0.14 | | | | 0.58 | | | | 0.50 | |
| Sweep Class | | 6-30-2010 | | | 0.59 | | | | 0.12 | | | | 0.10 | | | | 0.84 | | | | 0.83 | |
Yield summary (%) as of July 31, 20183
| | | | | | | | | | | | | | | | | | |
| | | Class A | | Administrator
Class | | | Institutional
Class | | | Service
Class | | | Sweep
Class | |
| 7-day current yield | | 1.35 | | | 1.65 | | | | 1.75 | | | | 1.45 | | | | 1.12 | |
| 7-day compound yield | | 1.35 | | | 1.66 | | | | 1.76 | | | | 1.46 | | | | 1.12 | |
| 30-day simple yield | | 1.32 | | | 1.62 | | | | 1.72 | | | | 1.42 | | | | 1.09 | |
| 30-day compound yield | | 1.33 | | | 1.64 | | | | 1.74 | | | | 1.43 | | | | 1.10 | |
Figures quoted represent past performance, which is no guarantee of future results, and do not reflect taxes that a shareholder may pay on fund distributions or the redemption of fund shares. Investment returns will fluctuate. The Fund’s yield figures more closely reflect the current earnings of the Fund than the total return figures. Current performance may be lower or higher than the performance data quoted, which assumes the reinvestment of dividends and capital gains. Current month-end performance is available on the Fund’s website, wellsfargofunds.com.
Each class is sold without a front-end sales charge or contingent deferred sales charge.
For government money market funds: You could lose money by investing in the Fund. Although the Fund seeks to preserve the value of your investment at $1.00 per share, it cannot guarantee it will do so. An investment in the Fund is not insured or guaranteed by the Federal Deposit Insurance Corporation or any other government agency. The Fund’s sponsor has no legal obligation to provide financial support to the Fund, and you should not expect that the sponsor will provide financial support to the Fund at any time.
Please see footnotes on page 7.
| | | | | | |
| Performance highlights (unaudited) | | Wells Fargo 100% Treasury Money Market Fund | | | 7 | |
|
| Portfolio composition as of July 31, 20184 |
|
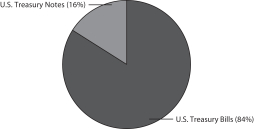
|
|
| Effective maturity distribution as of July 31, 20184 |
|
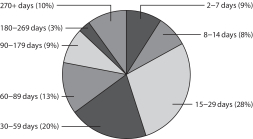 |
|
| Weighted average maturity as of July 31, 20185 |
34 days |
|
| Weighted average life as of July 31, 20186 |
78 days |
| 1 | Historical performance shown for Administrator Class shares prior to their inception reflects the performance of Service Class shares, and includes the higher expenses applicable to Service Class shares. If these expenses had not been included, returns for Administrator Class shares would be higher. Historical performance shown for Institutional Class shares prior to their inception reflects the performance of Administrator Class shares, and includes the higher expenses applicable to Administrator Class shares. If these expenses had not been included, returns for Institutional Class shares would be higher. Historical performance shown for Sweep Class shares prior to their inception reflects the performance of Service Class shares, and has not been adjusted to reflect the higher expenses applicable to Sweep Class shares. If these expenses had been adjusted, returns for Sweep Class shares would be lower. |
| 2 | Reflects the expense ratios as stated in the most recent prospectuses. The expense ratios shown are subject to change and may differ from the annualized expense ratios shown in the financial highlights of this report. |
| 3 | The manager has contractually committed through May 31, 2019, to waive fees and/or reimburse expenses to the extent necessary to cap the Fund’s Total Annual Fund Operating Expenses After Fee Waivers at the amounts shown. After this time, the cap may be increased or the commitment to maintain the cap may be terminated only with the approval of the Board of Trustees. Brokerage commissions, stamp duty fees, interest, taxes, acquired fund fees and expenses (if any), and extraordinary expenses are excluded from the expense cap. Without this cap, the Fund’s returns would have been lower. Without waived fees and/or reimbursed expenses, the Fund’s 7-day current yield would have been 1.28%, 1.55%, 1.67%, 1.38%, and 1.12% for Class A, Administrator Class, Institutional Class, Service Class, and Sweep Class, respectively. The expense ratio paid by an investor is the net expense ratio (the total annual fund operating expenses after fee waivers) as stated in the prospectuses. |
| 4 | Amounts are calculated based on the total investments of the Fund. These amounts are subject to change and may have changed since the date specified. |
| 5 | Weighted Average Maturity (WAM): WAM is an average of the effective maturities of all securities held in the portfolio, weighted by each security’s percentage of total investments. The maturity of a portfolio security is the period remaining until the date on which the principal amount is unconditionally required to be paid, or in the case of a security called for redemption, the date on which the redemption payment is unconditionally required to be made. WAM calculations allow for the maturities of certain securities with demand features or periodic interest rate resets to be shortened. WAM is a way to measure a fund’s sensitivity to potential interest rate changes. WAM is subject to change and may have changed since the date specified. |
| 6 | Weighted Average Life (WAL): WAL is an average of the final maturities of all securities held in the portfolio, weighted by their percentage of total investments. The maturity of a portfolio security is the period remaining until the date on which the principal amount is unconditionally required to be paid, or in the case of a security called for redemption, the date on which the redemption payment is unconditionally required to be made. In contrast to WAM, the calculation of WAL allows for the maturities of certain securities with demand features to be shortened, but not the periodic interest rate resets. WAL is a way to measure a fund’s potential sensitivity to credit spread changes. WAL is subject to change and may have changed since the date specified. |
| | | | |
| 8 | | Wells Fargo 100% Treasury Money Market Fund | | Fund expenses (unaudited) |
As a shareholder of the Fund, you incur ongoing costs, including management fees, distribution (12b-1) and/or shareholder servicing fees, and other Fund expenses. This example is intended to help you understand your ongoing costs (in dollars) of investing in the Fund and to compare these costs with the ongoing costs of investing in other mutual funds.
The example is based on an investment of $1,000 invested at the beginning of the six-month period and held for the entire period from February 1, 2018 to July 31, 2018.
Actual expenses
The “Actual” line of the table below provides information about actual account values and actual expenses. You may use the information in this line, together with the amount you invested, to estimate the expenses that you paid over the period. Simply divide your account value by $1,000 (for example, an $8,600 account value divided by $1,000 = 8.6), then multiply the result by the number in the “Actual” line under the heading entitled “Expenses paid during period” for your applicable class of shares to estimate the expenses you paid on your account during this period.
Hypothetical example for comparison purposes
The “Hypothetical” line of the table below provides information about hypothetical account values and hypothetical expenses based on the Fund’s actual expense ratio and an assumed rate of return of 5% per year before expenses, which is not the Fund’s actual return. The hypothetical account values and expenses may not be used to estimate the actual ending account balance or expenses you paid for the period. You may use this information to compare the ongoing costs of investing in the Fund and other funds. To do so, compare this 5% hypothetical example with the 5% hypothetical examples that appear in the shareholder reports of the other funds.
Please note that the expenses shown in the table are meant to highlight your ongoing costs only. Therefore, the “Hypothetical” line of the table is useful in comparing ongoing costs only and will not help you determine the relative total costs of owning different funds.
| | | | | | | | | | | | | | | | |
| | | Beginning
account value
2-1-2018 | | | Ending
account value
7-31-2018 | | | Expenses
paid during
the period¹ | | | Annualized net
expense ratio | |
Class A | | | | | | | | | | | | | | | | |
Actual | | $ | 1,000.00 | | | $ | 1,005.26 | | | $ | 3.23 | | | | 0.64 | % |
Hypothetical (5% return before expenses) | | $ | 1,000.00 | | | $ | 1,021.98 | | | $ | 3.26 | | | | 0.64 | % |
Administrator Class | | | | | | | | | | | | | | | | |
Actual | | $ | 1,000.00 | | | $ | 1,006.92 | | | $ | 1.52 | | | | 0.30 | % |
Hypothetical (5% return before expenses) | | $ | 1,000.00 | | | $ | 1,023.69 | | | $ | 1.53 | | | | 0.30 | % |
Institutional Class | | | | | | | | | | | | | | | | |
Actual | | $ | 1,000.00 | | | $ | 1,007.42 | | | $ | 1.01 | | | | 0.20 | % |
Hypothetical (5% return before expenses) | | $ | 1,000.00 | | | $ | 1,024.20 | | | $ | 1.02 | | | | 0.20 | % |
Service Class | | | | | | | | | | | | | | | | |
Actual | | $ | 1,000.00 | | | $ | 1,005.93 | | | $ | 2.53 | | | | 0.50 | % |
Hypothetical (5% return before expenses) | | $ | 1,000.00 | | | $ | 1,022.68 | | | $ | 2.55 | | | | 0.50 | % |
Sweep Class | | | | | | | | | | | | | | | | |
Actual | | $ | 1,000.00 | | | $ | 1,004.28 | | | $ | 4.19 | | | | 0.83 | % |
Hypothetical (5% return before expenses) | | $ | 1,000.00 | | | $ | 1,021.02 | | | $ | 4.23 | | | | 0.83 | % |
| 1 | Expenses paid is equal to the annualized net expense ratio of each class multiplied by the average account value over the period, multiplied by the number of days in the most recent fiscal half-year divided by the number of days in the fiscal year (to reflect the one-half-year period). |
| | | | | | |
| Portfolio of investments—July 31, 2018 (unaudited) | | Wells Fargo 100% Treasury Money Market Fund | | | 9 | |
| | | | | | | | | | | | | | | | |
| Security name | | Interest rate | | | Maturity date | | | Principal | | | Value | |
|
Treasury Debt: 104.66% | |
U.S. Treasury Bill (z) | | | 0.41 | % | | | 8-30-2018 | | | $ | 1,213,000,000 | | | $ | 1,211,194,314 | |
U.S. Treasury Bill (z) | | | 1.70 | | | | 11-1-2018 | | | | 400,000,000 | | | | 397,983,844 | |
U.S. Treasury Bill (z) | | | 1.84 | | | | 8-2-2018 | | | | 941,650,000 | | | | 941,601,906 | |
U.S. Treasury Bill (z) | | | 1.85 | | | | 8-9-2018 | | | | 903,185,000 | | | | 902,813,785 | |
U.S. Treasury Bill (z) | | | 1.88 | | | | 8-23-2018 | | | | 1,064,910,000 | | | | 1,063,686,589 | |
U.S. Treasury Bill (z) | | | 1.91 | | | | 9-27-2018 | | | | 200,000,000 | | | | 199,398,333 | |
U.S. Treasury Bill (z) | | | 1.91 | | | | 9-6-2018 | | | | 550,600,000 | | | | 549,552,137 | |
U.S. Treasury Bill (z) | | | 1.94 | | | | 10-4-2018 | | | | 340,000,000 | | | | 338,834,844 | |
U.S. Treasury Bill (z) | | | 1.96 | | | | 9-20-2018 | | | | 40,000,000 | | | | 39,892,222 | |
U.S. Treasury Bill (z) | | | 1.96 | | | | 10-11-2018 | | | | 360,000,000 | | | | 358,613,035 | |
U.S. Treasury Bill (z) | | | 1.98 | | | | 10-25-2018 | | | | 300,000,000 | | | | 298,601,042 | |
U.S. Treasury Bill (z) | | | 1.99 | | | | 10-18-2018 | | | | 300,000,000 | | | | 298,716,792 | |
U.S. Treasury Bill (z) | | | 2.02 | | | | 11-8-2018 | | | | 20,000,000 | | | | 19,890,248 | |
U.S. Treasury Bill (z) | | | 2.02 | | | | 11-15-2018 | | | | 100,000,000 | | | | 99,409,227 | |
U.S. Treasury Bill (z) | | | 2.05 | | | | 8-16-2018 | | | | 1,986,700,000 | | | | 1,985,127,895 | |
U.S. Treasury Bill (z) | | | 2.06 | | | | 11-29-2018 | | | | 20,000,000 | | | | 19,864,000 | |
U.S. Treasury Bill (z) | | | 2.09 | | | | 12-20-2018 | | | | 40,000,000 | | | | 39,675,700 | |
U.S. Treasury Bill (z) | | | 2.10 | | | | 11-23-2018 | | | | 20,000,000 | | | | 19,868,583 | |
U.S. Treasury Bill (z) | | | 2.10 | | | | 12-6-2018 | | | | 40,000,000 | | | | 39,707,036 | |
U.S. Treasury Bill (z) | | | 2.11 | | | | 12-27-2018 | | | | 40,000,000 | | | | 39,657,133 | |
U.S. Treasury Bill (z) | | | 2.12 | | | | 12-13-2018 | | | | 50,000,000 | | | | 49,610,469 | |
U.S. Treasury Bill (z) | | | 2.16 | | | | 1-24-2019 | | | | 20,000,000 | | | | 19,791,244 | |
U.S. Treasury Bill (z) | | | 2.16 | | | | 1-31-2019 | | | | 30,000,000 | | | | 29,672,779 | |
U.S. Treasury Bill (z) | | | 2.17 | | | | 1-17-2019 | | | | 20,000,000 | | | | 19,798,608 | |
U.S. Treasury Bill (z) | | | 3.83 | | | | 9-13-2018 | | | | 100,000,000 | | | | 99,767,167 | |
U.S. Treasury Note | | | 0.75 | | | | 9-30-2018 | | | | 40,000,000 | | | | 39,927,938 | |
U.S. Treasury Note | | | 0.75 | | | | 2-15-2019 | | | | 20,000,000 | | | | 19,841,114 | |
U.S. Treasury Note | | | 0.88 | | | | 10-15-2018 | | | | 40,000,000 | | | | 39,933,722 | |
U.S. Treasury Note | | | 1.00 | | | | 11-30-2018 | | | | 30,000,000 | | | | 29,889,455 | |
U.S. Treasury Note | | | 1.00 | | | | 3-15-2019 | | | | 20,000,000 | | | | 19,844,621 | |
U.S. Treasury Note | | | 1.25 | | | | 10-31-2018 | | | | 20,000,000 | | | | 19,978,332 | |
U.S. Treasury Note | | | 1.25 | | | | 4-30-2019 | | | | 12,000,000 | | | | 11,903,204 | |
U.S. Treasury Note | | | 1.38 | | | | 9-30-2018 | | | | 20,000,000 | | | | 19,991,020 | |
U.S. Treasury Note | | | 1.38 | | | | 2-28-2019 | | | | 30,000,000 | | | | 29,848,881 | |
U.S. Treasury Note | | | 1.50 | | | | 8-31-2018 | | | | 20,000,000 | | | | 19,992,194 | |
U.S. Treasury Note | | | 1.50 | | | | 1-31-2019 | | | | 20,000,000 | | | | 19,931,706 | |
U.S. Treasury Note | | | 1.50 | | | | 2-28-2019 | | | | 10,000,000 | | | | 9,956,877 | |
U.S. Treasury Note | | | 1.63 | | | | 3-31-2019 | | | | 10,000,000 | | | | 9,955,269 | |
U.S. Treasury Note (U.S. Treasury 3 Month Bill Money Market Yield +0.00%) ± | | | 1.98 | | | | 1-31-2020 | | | | 270,000,000 | | | | 269,907,962 | |
U.S. Treasury Note (U.S. Treasury 3 Month Bill Money Market Yield +0.03%) ± | | | 2.01 | | | | 4-30-2020 | | | | 360,000,000 | | | | 359,995,870 | |
U.S. Treasury Note (U.S. Treasury 3 Month Bill Money Market Yield +0.04%) ± | | | 2.02 | | | | 7-31-2020 | | | | 150,000,000 | | | | 150,008,919 | |
U.S. Treasury Note (U.S. Treasury 3 Month Bill Money Market Yield +0.05%) ± | | | 2.03 | | | | 10-31-2019 | | | | 195,000,000 | | | | 195,037,661 | |
U.S. Treasury Note (U.S. Treasury 3 Month Bill Money Market Yield +0.06%) ± | | | 2.04 | | | | 7-31-2019 | | | | 60,000,000 | | | | 60,002,192 | |
U.S. Treasury Note (U.S. Treasury 3 Month Bill Money Market Yield +0.14%) ± | | | 2.12 | | | | 1-31-2019 | | | | 225,000,000 | | | | 225,015,381 | |
U.S. Treasury Note (U.S. Treasury 3 Month Bill Money Market Yield +0.17%) ± | | | 2.15 | | | | 10-31-2018 | | | | 150,000,000 | | | | 149,999,563 | |
U.S. Treasury Note | | | 2.75 | | | | 2-15-2019 | | | | 10,000,000 | | | | 10,026,494 | |
| |
Total Treasury Debt (Cost $10,793,717,307) | | | | 10,793,717,307 | |
| | | | | | | | | | | | | | | | |
| | | | | | | | |
| Total investments in securities (Cost $10,793,717,307) | | | 104.66 | % | | | 10,793,717,307 | |
Other assets and liabilities, net | | | (4.66 | ) | | | (480,993,863 | ) |
| | | | | | | | |
| Total net assets | | | 100.00 | % | | $ | 10,312,723,444 | |
| | | | | | | | |
| (z) | Zero coupon security. The rate represents the current yield to maturity. |
| ± | Variable rate investment. The rate shown is the rate in effect at period end. |
The accompanying notes are an integral part of these financial statements.
| | | | |
| 10 | | Wells Fargo 100% Treasury Money Market Fund | | Statement of assets and liabilities—July 31, 2018 (unaudited) |
| | | | |
| | | | |
| |
Assets | | | | |
Investments in unaffiliated securities, at amortized cost | | $ | 10,793,717,307 | |
Cash | | | 11,912 | |
Receivable for investments sold | | | 897,520,168 | |
Receivable for Fund shares sold | | | 21,594,422 | |
Receivable for interest | | | 1,216,390 | |
Prepaid expenses and other assets | | | 136,554 | |
| | | | |
Total assets | | | 11,714,196,753 | |
| | | | |
| |
Liabilities | | | | |
Payable for investments purchased | | | 1,388,191,513 | |
Dividends payable | | | 5,769,594 | |
Payable for Fund shares redeemed | | | 3,960,235 | |
Management fee payable | | | 1,058,894 | |
Administration fees payable | | | 829,555 | |
Distribution fee payable | | | 117,261 | |
Accrued expenses and other liabilities | | | 1,546,257 | |
| | | | |
Total liabilities | | | 1,401,473,309 | |
| | | | |
Total net assets | | $ | 10,312,723,444 | |
| | | | |
| |
NET ASSETS CONSIST OF | | | | |
Paid-in capital | | $ | 10,312,461,415 | |
Undistributed net investment income | | | 507,472 | |
Accumulated net realized losses on investments | | | (245,443 | ) |
| | | | |
Total net assets | | $ | 10,312,723,444 | |
| | | | |
| |
COMPUTATION OF NET ASSET VALUE PER SHARE | | | | |
Net assets – Class A | | $ | 207,983,542 | |
Shares outstanding – Class A1 | | | 207,968,118 | |
Net asset value per share – Class A | | | $1.00 | |
Net assets – Administrator Class | | $ | 712,261,829 | |
Shares outstanding – Administrator Class1 | | | 712,204,599 | |
Net asset value per share – Administrator Class | | | $1.00 | |
Net assets – Institutional Class | | $ | 6,150,050,887 | |
Shares outstanding – Institutional Class1 | | | 6,149,592,857 | |
Net asset value per share – Institutional Class | | | $1.00 | |
Net assets – Service Class | | $ | 2,860,262,714 | |
Shares outstanding – Service Class1 | | | 2,860,047,584 | |
Net asset value per share – Service Class | | | $1.00 | |
Net assets – Sweep Class | | $ | 382,164,472 | |
Shares outstanding – Sweep Class1 | | | 382,137,805 | |
Net asset value per share – Sweep Class | | | $1.00 | |
| 1 | The Fund has an unlimited number of authorized shares. |
The accompanying notes are an integral part of these financial statements.
| | | | | | |
| Statement of operations—six months ended July 31, 2018 (unaudited) | | Wells Fargo 100% Treasury Money Market Fund | | | 11 | |
| | | | |
| | | | |
| |
Investment income | | | | |
Interest | | $ | 85,681,008 | |
| | | | |
| |
Expenses | | | | |
Management fee | | | 13,576,138 | |
Administration fees | | | | |
Class A | | | 277,994 | |
Administrator Class | | | 410,479 | |
Institutional Class | | | 2,254,734 | |
Service Class | | | 1,756,286 | |
Sweep Class | | | 61,563 | |
Shareholder servicing fees | | | | |
Class A | | | 315,902 | |
Administrator Class | | | 410,479 | |
Service Class | | | 3,658,717 | |
Sweep Class | | | 513,021 | |
Distribution fee | | | | |
Sweep Class | | | 718,230 | |
Custody and accounting fees | | | 181,218 | |
Professional fees | | | 26,071 | |
Registration fees | | | 112,268 | |
Shareholder report expenses | | | 41,682 | |
Trustees’ fees and expenses | | | 6,959 | |
Other fees and expenses | | | 63,669 | |
| | | | |
Total expenses | | | 24,385,410 | |
Less: Fee waivers and/or expense reimbursements | | | (7,692,781 | ) |
| | | | |
Net expenses | | | 16,692,629 | |
| | | | |
Net investment income | | | 68,988,379 | |
| | | | |
Net realized losses on investments | | | (290,057 | ) |
| | | | |
Net increase in net assets resulting from operations | | $ | 68,698,322 | |
| | | | |
The accompanying notes are an integral part of these financial statements.
| | | | |
| 12 | | Wells Fargo 100% Treasury Money Market Fund | | Statement of changes in net assets |
| | | | | | | | | | | | | | | | |
| | | Six months ended
July 31, 2018
(unaudited) | | | Year ended
January 31, 2018 | |
| | | | |
Operations | | | | | | | | | | | | | | | | |
Net investment income | | | | | | $ | 68,988,379 | | | | | | | $ | 57,973,078 | |
Net realized losses on investments | | | | | | | (290,057 | ) | | | | | | | (87,084 | ) |
| | | | |
Net increase in net assets resulting from operations | | | | | | | 68,698,322 | | | | | | | | 57,885,994 | |
| | | | |
| | | | |
Distributions to shareholders from | | | | | | | | | | | | | | | | |
Net investment income | | | | | | | | | | | | | | | | |
Class A | | | | | | | (1,306,634 | ) | | | | | | | (965,544 | ) |
Administrator Class | | | | | | | (5,677,420 | ) | | | | | | | (6,627,174 | ) |
Institutional Class | | | | | | | (42,351,485 | ) | | | | | | | (34,332,395 | ) |
Service Class | | | | | | | (17,402,533 | ) | | | | | | | (14,586,653 | ) |
Sweep Class | | | | | | | (1,745,954 | ) | | | | | | | (831,054 | ) |
Net realized gains | | | | | | | | | | | | | | | | |
Class A | | | | | | | 0 | | | | | | | | (17,037 | ) |
Administrator Class | | | | | | | 0 | | | | | | | | (59,926 | ) |
Institutional Class | | | | | | | 0 | | | | | | | | (263,674 | ) |
Service Class | | | | | | | 0 | | | | | | | | (158,024 | ) |
Sweep Class | | | | | | | 0 | | | | | | | | (26,189 | ) |
| | | | |
Total distributions to shareholders | | | | | | | (68,484,026 | ) | | | | | | | (57,867,670 | ) |
| | | | |
| | | | |
Capital share transactions | | | Shares | | | | | | | | Shares | | | | | |
Proceeds from shares sold | | | | | | | | | | | | | | | | |
Class A | | | 462,180,930 | | | | 462,180,930 | | | | 1,135,806,761 | | | | 1,135,806,761 | |
Administrator Class | | | 2,040,821,023 | | | | 2,040,821,023 | | | | 3,968,753,750 | | | | 3,968,753,750 | |
Institutional Class | | | 8,461,681,225 | | | | 8,461,681,225 | | | | 13,161,870,367 | | | | 13,161,870,367 | |
Service Class | | | 9,044,693,788 | | | | 9,044,693,788 | | | | 19,403,845,448 | | | | 19,403,845,448 | |
Sweep Class | | | 2,095,883,834 | | | | 2,095,883,834 | | | | 3,679,356,512 | | | | 3,679,356,512 | |
| | | | |
| | | | | | | 22,105,260,800 | | | | | | | | 41,349,632,838 | |
| | | | |
Reinvestment of distributions | | | | | | | | | | | | | | | | |
Class A | | | 1,304,927 | | | | 1,304,927 | | | | 981,504 | | | | 981,504 | |
Administrator Class | | | 3,045,916 | | | | 3,045,916 | | | | 3,277,129 | | | | 3,277,129 | |
Institutional Class | | | 29,534,950 | | | | 29,534,950 | | | | 22,397,562 | | | | 22,397,562 | |
Service Class | | | 3,809,608 | | | | 3,809,608 | | | | 2,682,696 | | | | 2,682,696 | |
Sweep Class | | | 1,745,954 | | | | 1,745,954 | | | | 857,222 | | | | 857,222 | |
| | | | |
| | | | | | | 39,441,355 | | | | | | | | 30,196,113 | |
| | | | |
Payment for shares redeemed | | | | | | | | | | | | | | | | |
Class A | | | (546,746,155 | ) | | | (546,746,155 | ) | | | (1,209,172,771 | ) | | | (1,209,172,771 | ) |
Administrator Class | | | (2,246,075,874 | ) | | | (2,246,075,874 | ) | | | (4,284,479,032 | ) | | | (4,284,479,032 | ) |
Institutional Class | | | (7,042,068,494 | ) | | | (7,042,068,494 | ) | | | (12,050,337,321 | ) | | | (12,050,337,321 | ) |
Service Class | | | (9,133,784,660 | ) | | | (9,133,784,660 | ) | | | (19,798,151,954 | ) | | | (19,798,151,954 | ) |
Sweep Class | | | (2,197,166,179 | ) | | | (2,197,166,179 | ) | | | (3,870,749,117 | ) | | | (3,870,749,117 | ) |
| | | | |
| | | | | | | (21,165,841,362 | ) | | | | | | | (41,212,890,195 | ) |
| | | | |
Net increase in net assets resulting from capital share transactions | | | | | | | 978,860,793 | | | | | | | | 166,938,756 | |
| | | | |
Total increase in net assets | | | | | | | 979,075,089 | | | | | | | | 166,957,080 | |
| | | | |
| | | | |
Net assets | | | | | | | | | | | | | | | | |
Beginning of period | | | | | | | 9,333,648,355 | | | | | | | | 9,166,691,275 | |
| | | | |
End of period | | | | | | $ | 10,312,723,444 | | | | | | | $ | 9,333,648,355 | |
| | | | |
Undistributed net investment income | | | | | | $ | 507,472 | | | | | | | $ | 3,119 | |
| | | | |
The accompanying notes are an integral part of these financial statements.
| | | | | | |
| Financial highlights | | Wells Fargo 100% Treasury Money Market Fund | | | 13 | |
(For a share outstanding throughout each period)
| | | | | | | | | | | | | | | | | | | | | | | | |
| | | Six months ended
July 31, 2018 (unaudited) | | | Year ended January 31 | |
| CLASS A | | 2018 | | | 2017 | | | 2016 | | | 2015 | | | 2014 | |
Net asset value, beginning of period | | | $1.00 | | | | $1.00 | | | | $1.00 | | | | $1.00 | | | | $1.00 | | | | $1.00 | |
Net investment income (loss) | | | 0.01 | | | | 0.00 | 1 | | | 0.00 | 1 | | | 0.00 | 1,2 | | | (0.00 | )2,3 | | | 0.00 | 1 |
Net realized gains (losses) on investments | | | 0.00 | 1 | | | (0.00 | )2 | | | 0.00 | 1 | | | (0.00 | )2 | | | 0.00 | 1 | | | 0.00 | 1 |
| | | | | | | | | | | | | | | | | | | | | | | | |
Total from investment operations | | | 0.01 | | | | 0.00 | 1 | | | 0.00 | 1 | | | (0.00 | )2 | | | 0.00 | 1 | | | 0.00 | 1 |
Distributions to shareholders from | | | | | | | | | | | | | | | | | | | | | | | | |
Net investment income | | | (0.01 | ) | | | (0.00 | )1 | | | (0.00 | )1 | | | (0.00 | )1 | | | (0.00 | )1 | | | (0.00 | )1 |
Net realized gains | | | 0.00 | | | | (0.00 | )1 | | | (0.00 | )1 | | | (0.00 | )1 | | | (0.00 | )1 | | | (0.00 | )1 |
| | | | | | | | | | | | | | | | | | | | | | | | |
Total distributions to shareholders | | | (0.01 | ) | | | (0.00 | )1 | | | (0.00 | )1 | | | (0.00 | )1 | | | (0.00 | )1 | | | (0.00 | )1 |
Net asset value, end of period | | | $1.00 | | | | $1.00 | | | | $1.00 | | | | $1.00 | | | | $1.00 | | | | $1.00 | |
Total return4 | | | 0.53 | % | | | 0.32 | % | | | 0.01 | % | | | 0.00 | % | | | 0.00 | % | | | 0.00 | % |
Ratios to average net assets (annualized) | | | | | | | | | | | | | | | | | | | | | | | | |
Gross expenses | | | 0.76 | % | | | 0.79 | % | | | 0.79 | % | | | 0.79 | % | | | 0.79 | % | | | 0.79 | % |
Net expenses | | | 0.64 | % | | | 0.64 | % | | | 0.36 | % | | | 0.08 | % | | | 0.04 | % | | | 0.06 | % |
Net investment income (loss) | | | 1.04 | % | | | 0.31 | % | | | 0.00 | % | | | 0.00 | % | | | (0.00 | )% | | | 0.00 | % |
Supplemental data | | | | | | | | | | | | | | | | | | | | | | | | |
Net assets, end of period (000s omitted) | | | $207,984 | | | | $291,246 | | | | $363,639 | | | | $464,176 | | | | $1,009,623 | | | | $932,956 | |
| 1 | Amount is less than $0.005. |
| 2 | Amount is more than $(0.005). |
| 3 | Calculated based upon average shares outstanding |
| 4 | Returns for periods of less than one year are not annualized. |
The accompanying notes are an integral part of these financial statements.
| | | | |
| 14 | | Wells Fargo 100% Treasury Money Market Fund | | Financial highlights |
(For a share outstanding throughout each period)
| | | | | | | | | | | | | | | | | | | | | | | | |
| | | Six months ended
July 31, 2018 (unaudited) | | | Year ended January 31 | |
| ADMINISTRATOR CLASS | | 2018 | | | 2017 | | | 2016 | | | 2015 | | | 2014 | |
Net asset value, beginning of period | | | $1.00 | | | | $1.00 | | | | $1.00 | | | | $1.00 | | | | $1.00 | | | | $1.00 | |
Net investment income (loss) | | | 0.01 | | | | 0.01 | | | | 0.00 | 1 | | | 0.00 | 1 | | | (0.00 | )2,3 | | | 0.00 | 1 |
Net realized gains (losses) on investments | | | 0.00 | 1 | | | 0.00 | 1 | | | 0.00 | 1 | | | (0.00 | )2 | | | 0.00 | 1 | | | 0.00 | 1 |
| | | | | | | | | | | | | | | | | | | | | | | | |
Total from investment operations | | | 0.01 | | | | 0.01 | | | | 0.00 | 1 | | | (0.00 | )2 | | | 0.00 | 1 | | | 0.00 | 1 |
Distributions to shareholders from | | | | | | | | | | | | | | | | | | | | | | | | |
Net investment income | | | (0.01 | ) | | | (0.01 | ) | | | (0.00 | )1 | | | (0.00 | )1 | | | (0.00 | )1 | | | (0.00 | )1 |
Net realized gains | | | 0.00 | | | | (0.00 | )1 | | | (0.00 | )1 | | | (0.00 | )1 | | | (0.00 | )1 | | | (0.00 | )1 |
| | | | | | | | | | | | | | | | | | | | | | | | |
Total distributions to shareholders | | | (0.01 | ) | | | (0.01 | ) | | | (0.00 | )1 | | | (0.00 | )1 | | | (0.00 | )1 | | | (0.00 | )1 |
Net asset value, end of period | | | $1.00 | | | | $1.00 | | | | $1.00 | | | | $1.00 | | | | $1.00 | | | | $1.00 | |
Total return4 | | | 0.69 | % | | | 0.67 | % | | | 0.07 | % | | | 0.00 | % | | | 0.00 | % | | | 0.00 | % |
Ratios to average net assets (annualized) | | | | | | | | | | | | | | | | | | | | | | | | |
Gross expenses | | | 0.48 | % | | | 0.52 | % | | | 0.52 | % | | | 0.51 | % | | | 0.51 | % | | | 0.51 | % |
Net expenses | | | 0.30 | % | | | 0.30 | % | | | 0.30 | % | | | 0.08 | % | | | 0.04 | % | | | 0.06 | % |
Net investment income (loss) | | | 1.39 | % | | | 0.64 | % | | | 0.06 | % | | | 0.00 | % | | | (0.00 | )% | | | 0.00 | % |
Supplemental data | | | | | | | | | | | | | | | | | | | | | | | | |
Net assets, end of period (000s omitted) | | | $712,262 | | | | $914,471 | | | | $1,226,947 | | | | $1,945,991 | | | | $2,656,805 | | | | $2,754,138 | |
| 1 | Amount is less than $0.005. |
| 2 | Amount is more than $(0.005). |
| 3 | Calculated based upon average shares outstanding |
| 4 | Returns for periods of less than one year are not annualized. |
The accompanying notes are an integral part of these financial statements.
| | | | | | |
| Financial highlights | | Wells Fargo 100% Treasury Money Market Fund | | | 15 | |
(For a share outstanding throughout each period)
| | | | | | | | | | | | | | | | | | | | |
| | | Six months ended
July 31, 2018 (unaudited) | | | Year ended January 31 | |
| INSTITUTIONAL CLASS | | 2018 | | | 2017 | | | 2016 | | | 20151 | |
Net asset value, beginning of period | | | $1.00 | | | | $1.00 | | | | $1.00 | | | | $1.00 | | | | $1.00 | |
Net investment income (loss) | | | 0.01 | | | | 0.01 | | | | 0.00 | 2 | | | 0.00 | 2 | | | (0.00 | )3,4 |
Net realized gains (losses) on investments | | | 0.00 | 2 | | | 0.00 | 2 | | | 0.00 | 2 | | | (0.00 | )3 | | | 0.00 | 2 |
| | | | | | | | | | | | | | | | | | | | |
Total from investment operations | | | 0.01 | 2 | | | 0.00 | 2 | | | 0.00 | 2 | | | 0.00 | 2 | | | 0.00 | 2 |
Distributions to shareholders from | | | | | | | | | | | | | | | | | | | | |
Net investment income | | | (0.01 | ) | | | (0.01 | ) | | | (0.00 | )2 | | | (0.00 | )2 | | | (0.00 | )2 |
Net realized gains | | | 0.00 | | | | (0.00 | ) | | | (0.00 | )2 | | | (0.00 | )2 | | | (0.00 | )2 |
| | | | | | | | | | | | | | | | | | | | |
Total distributions to shareholders | | | (0.01 | ) | | | (0.01 | ) | | | (0.00 | )2 | | | (0.00 | )2 | | | (0.00 | )2 |
Net asset value, end of period | | | $1.00 | | | | $1.00 | | | | $1.00 | | | | $1.00 | | | | $1.00 | |
Total return5 | | | 0.74 | % | | | 0.77 | % | | | 0.17 | % | | | 0.01 | % | | | 0.00 | % |
Ratios to average net assets (annualized) | | | | | | | | | | | | | | | | | | | | |
Gross expenses | | | 0.36 | % | | | 0.40 | % | | | 0.40 | % | | | 0.40 | % | | | 0.39 | % |
Net expenses | | | 0.20 | % | | | 0.20 | % | | | 0.20 | % | | | 0.11 | % | | | 0.04 | % |
Net investment income (loss) | | | 1.51 | % | | | 0.78 | % | | | 0.18 | % | | | 0.01 | % | | | (0.00 | )% |
Supplemental data | | | | | | | | | | | | | | | | | | | | |
Net assets, end of period (000s omitted) | | | $6,150,051 | | | | $4,700,731 | | | | $3,566,678 | | | | $632,263 | | | | $100 | |
| 1 | For the period from October 31, 2014 (commencement of operations) to January 31, 2015 |
| 2 | Amount is less than $0.005. |
| 3 | Amount is more than $(0.005). |
| 4 | Calculated based upon average shares outstanding |
| 5 | Returns for periods of less than one year are not annualized. |
The accompanying notes are an integral part of these financial statements.
| | | | |
| 16 | | Wells Fargo 100% Treasury Money Market Fund | | Financial highlights |
(For a share outstanding throughout each period)
| | | | | | | | | | | | | | | | | | | | | | | | |
| | | Six months ended
July 31, 2018 (unaudited) | | | Year ended January 31 | |
| SERVICE CLASS | | 2018 | | | 2017 | | | 2016 | | | 2015 | | | 2014 | |
Net asset value, beginning of period | | | $1.00 | | | | $1.00 | | | | $1.00 | | | | $1.00 | | | | $1.00 | | | | $1.00 | |
Net investment income (loss) | | | 0.01 | | | | 0.00 | 1 | | | 0.00 | 1 | | | 0.00 | 1 | | | (0.00 | )2,3 | | | 0.00 | 1 |
Net realized gains (losses) on investments | | | 0.00 | 1 | | | (0.00 | )2 | | | 0.00 | 1 | | | (0.00 | )2 | | | 0.00 | 1 | | | 0.00 | 1 |
| | | | | | | | | | | | | | | | | | | | | | | | |
Total from investment operations | | | 0.01 | | | | (0.00 | )2 | | | 0.00 | 1 | | | (0.00 | )2 | | | 0.00 | 1 | | | 0.00 | 1 |
Distributions to shareholders from | | | | | | | | | | | | | | | | | | | | | | | | |
Net investment income | | | (0.01 | ) | | | (0.00 | )1 | | | (0.00 | )1 | | | (0.00 | )1 | | | (0.00 | )1 | | | (0.00 | )1 |
Net realized gains | | | 0.00 | | | | (0.00 | )1 | | | (0.00 | )1 | | | (0.00 | )1 | | | (0.00 | )1 | | | (0.00 | )1 |
| | | | | | | | | | | | | | | | | | | | | | | | |
Total distributions to shareholders | | | (0.01 | ) | | | (0.00 | )1 | | | (0.00 | )1 | | | (0.00 | )1 | | | (0.00 | )1 | | | (0.00 | )1 |
Net asset value, end of period | | | $1.00 | | | | $1.00 | | | | $1.00 | | | | $1.00 | | | | $1.00 | | | | $1.00 | |
Total return4 | | | 0.59 | % | | | 0.46 | % | | | 0.01 | % | | | 0.00 | % | | | 0.00 | % | | | 0.00 | % |
Ratios to average net assets (annualized) | | | | | | | | | | | | | | | | | | | | | | | | |
Gross expenses | | | 0.65 | % | | | 0.69 | % | | | 0.69 | % | | | 0.69 | % | | | 0.68 | % | | | 0.68 | % |
Net expenses | | | 0.50 | % | | | 0.50 | % | | | 0.36 | % | | | 0.09 | % | | | 0.05 | % | | | 0.07 | % |
Net investment income (loss) | | | 1.20 | % | | | 0.45 | % | | | 0.00 | % | | | 0.00 | % | | | (0.00 | )% | | | 0.00 | % |
Supplemental data | | | | | | | | | | | | | | | | | | | | | | | | |
Net assets, end of period (000s omitted) | | | $2,860,263 | | | | $2,945,498 | | | | $3,337,172 | | | | $5,614,425 | | | | $6,962,725 | | | | $7,491,653 | |
| 1 | Amount is less than $0.005. |
| 2 | Amount is more than $(0.005). |
| 3 | Calculated based upon average shares outstanding |
| 4 | Returns for periods of less than one year are not annualized. |
The accompanying notes are an integral part of these financial statements.
| | | | | | |
| Financial highlights | | Wells Fargo 100% Treasury Money Market Fund | | | 17 | |
(For a share outstanding throughout each period)
| | | | | | | | | | | | | | | | | | | | | | | | |
| | | Six months ended
July 31, 2018 (unaudited) | | | Year ended January 31 | |
| SWEEP CLASS | | 2018 | | | 2017 | | | 2016 | | | 2015 | | | 2014 | |
Net asset value, beginning of period | | | $1.00 | | | | $1.00 | | | | $1.00 | | | | $1.00 | | | | $1.00 | | | | $1.00 | |
Net investment income (loss) | | | 0.00 | 1 | | | 0.00 | 1 | | | 0.00 | 1 | | | 0.00 | 1 | | | (0.00 | )2,3 | | | 0.00 | 1 |
Net realized gains (losses) on investments | | | 0.00 | 1 | | | (0.00 | )2 | | | 0.00 | 1 | | | (0.00 | )2 | | | 0.00 | 1 | | | 0.00 | 1 |
| | | | | | | | | | | | | | | | | | | | | | | | |
Total from investment operations | | | 0.00 | 1 | | | 0.00 | 1 | | | 0.00 | 1 | | | (0.00 | )2 | | | 0.00 | 1 | | | 0.00 | 1 |
Distributions to shareholders from | | | | | | | | | | | | | | | | | | | | | | | | |
Net investment income | | | (0.00 | )1 | | | (0.00 | )1 | | | (0.00 | )1 | | | (0.00 | )1 | | | (0.00 | )1 | | | (0.00 | )1 |
Net realized gains | | | 0.00 | | | | (0.00 | )1 | | | (0.00 | )1 | | | (0.00 | )1 | | | (0.00 | )1 | | | (0.00 | )1 |
| | | | | | | | | | | | | | | | | | | | | | | | |
Total distributions to shareholders | | | (0.00 | )1 | | | (0.00 | )1 | | | (0.00 | )1 | | | (0.00 | )1 | | | (0.00 | )1 | | | (0.00 | )1 |
Net asset value, end of period | | | $1.00 | | | | $1.00 | | | | $1.00 | | | | $1.00 | | | | $1.00 | | | | $1.00 | |
Total return4 | | | 0.43 | % | | | 0.18 | % | | | 0.01 | % | | | 0.00 | % | | | 0.00 | % | | | 0.00 | % |
Ratios to average net assets (annualized) | | | | | | | | | | | | | | | | | | | | | | | | |
Gross expenses | | | 0.91 | % | | | 0.95 | % | | | 1.11 | % | | | 1.14 | % | | | 1.14 | % | | | 1.14 | % |
Net expenses | | | 0.83 | % | | | 0.77 | % | | | 0.36 | % | | | 0.09 | % | | | 0.04 | % | | | 0.06 | % |
Net investment income (loss) | | | 0.86 | % | | | 0.16 | % | | | 0.00 | % | | | 0.00 | % | | | (0.00 | )% | | | 0.00 | % |
Supplemental data | | | | | | | | | | | | | | | | | | | | | | | | |
Net assets, end of period (000s omitted) | | | $382,164 | | | | $481,702 | | | | $672,256 | | | | $473,246 | | | | $427,778 | | | | $390,560 | |
| 1 | Amount is less than $0.005. |
| 2 | Amount is more than $(0.005). |
| 3 | Calculated based upon average shares outstanding |
| 4 | Returns for periods of less than one year are not annualized. |
The accompanying notes are an integral part of these financial statements.
| | | | |
| 18 | | Wells Fargo 100% Treasury Money Market Fund | | Notes to financial statements (unaudited) |
1. ORGANIZATION
Wells Fargo Funds Trust (the “Trust”), a Delaware statutory trust organized on March 10, 1999, is an open-end management investment company registered under the Investment Company Act of 1940, as amended (the “1940 Act”). As an investment company, the Trust follows the accounting and reporting guidance in Financial Accounting Standards Board Accounting Standards Codification Topic 946, Financial Services – Investment Companies. These financial statements report on the Wells Fargo 100% Treasury Money Market Fund (the “Fund”) which is a diversified series of the Trust.
2. SIGNIFICANT ACCOUNTING POLICIES
The following significant accounting policies, which are consistently followed in the preparation of the financial statements of the Fund, are in conformity with U.S. generally accepted accounting principles which require management to make estimates and assumptions that affect the reported amounts of assets and liabilities, disclosure of contingent assets and liabilities at the date of the financial statements, and the reported amounts of revenues and expenses during the reporting period. Actual results could differ from those estimates.
Securities valuation
As permitted under Rule 2a-7 of the 1940 Act, portfolio securities are valued at amortized cost, which approximates fair value. The amortized cost method involves valuing a security at its cost, plus accretion of discount or minus amortization of premium over the period until maturity.
Investments which are not valued using the method discussed above are valued at their fair value, as determined in good faith by the Board of Trustees of the Fund. The Board of Trustees has established a Valuation Committee comprised of the Trustees and has delegated to it the authority to take any actions regarding the valuation of portfolio securities that the Valuation Committee deems necessary or appropriate, including determining the fair value of portfolio securities, unless the determination has been delegated to the Wells Fargo Asset Management Pricing Committee at Wells Fargo Funds Management, LLC (“Funds Management”). The Board of Trustees retains the authority to make or ratify any valuation decisions or approve any changes to the Valuation Procedures as it deems appropriate. On a quarterly basis, the Board of Trustees receives reports on any valuation actions taken by the Valuation Committee or the Wells Fargo Asset Management Pricing Committee which may include items for ratification.
Valuations of fair valued securities are compared to the next actual sales price when available, or other appropriate market values, to assess the continued appropriateness of the fair valuation methodologies used. These securities are fair valued on a day-to-day basis, taking into consideration changes to appropriate market information and any significant changes to the inputs considered in the valuation process until there is a readily available price provided on an exchange or by an independent pricing service. Valuations received from an independent pricing service or independent broker-dealer quotes are periodically validated by comparisons to most recent trades and valuations provided by other independent pricing services in addition to the review of prices by the manager and/or subadviser. Unobservable inputs used in determining fair valuations are identified based on the type of security, taking into consideration factors utilized by market participants in valuing the investment, knowledge about the issuer and the current market environment.
Security transactions and income recognition
Securities transactions are recorded on a trade date basis. Realized gains or losses are recorded on the basis of identified cost.
Interest income is accrued daily and bond discounts are accreted and premiums are amortized daily.To the extent debt obligations are placed on non-accrual status, any related interest income may be reduced by writing off interest receivables when the collection of all or a portion of interest has been determined to be doubtful based on consistently applied procedures and the fair value has decreased. If the issuer subsequently resumes interest payments or when the collectability of interest is reasonably assured, the debt obligation is removed from non-accrual status.
Distributions to shareholders
Distributions to shareholders from net investment income are declared daily and paid monthly. Distributions from net realized gains, if any, are recorded on the ex-dividend date and paid at least annually. Such distributions are determined in accordance with income tax egulations and may differ from U.S. generally accepted accounting principles. Dividend sources are estimated at the time of declaration. The tax character of distributions is determined as of the Fund’s fiscal year end. Therefore, a portion of the Fund’s distributions made prior to the Fund’s fiscal year end may be categorized as a tax return of capital at year end.
| | | | | | |
| Notes to financial statements (unaudited) | | Wells Fargo 100% Treasury Money Market Fund | | | 19 | |
Federal and other taxes
The Fund intends to continue to qualify as a regulated investment company by distributing substantially all of its investment company taxable income and any net realized capital gains (after reduction for capital loss carryforwards) sufficient to relieve it from all, or substantially all, federal income taxes. Accordingly, no provision for federal income taxes was required.
The Fund’s income and federal excise tax returns and all financial records supporting those returns for the prior three fiscal years are subject to examination by the federal and Delaware revenue authorities. Management has analyzed the Fund’s tax positions taken on federal, state, and foreign tax returns for all open tax years and does not believe that there are any uncertain tax positions that require recognition of a tax liability.
As of July 31, 2018, the cost of investments for federal income tax purposes is substantially the same as for financial reporting purposes.
Class allocations
The separate classes of shares offered by the Fund differ principally in distribution, shareholder servicing, and administration fees. Class specific expenses are charged directly to that share class. Investment income, common expenses, and realized gains (losses) on investments are allocated daily to each class of shares based on the relative proportion of net assets of each class.
3. FAIR VALUATION MEASUREMENTS
Fair value measurements of investments are determined within a framework that has established a fair value hierarchy based upon the various data inputs utilized in determining the value of the Fund’s investments. The three-level hierarchy gives the highest priority to unadjusted quoted prices in active markets for identical assets or liabilities (Level 1) and the lowest priority to unobservable inputs (Level 3). The Fund’s investments are classified within the fair value hierarchy based on the lowest level of input that is significant to the fair value measurement. The inputs are summarized into three broad levels as follows:
| ∎ | | Level 1 – quoted prices in active markets for identical securities |
| ∎ | | Level 2 – other significant observable inputs (including quoted prices for similar securities, interest rates, prepayment speeds, credit risk, etc.) |
| ∎ | | Level 3 – significant unobservable inputs (including the Fund’s own assumptions in determining the fair value of investments) |
The inputs or methodologies used for valuing investments in securities are not necessarily an indication of the risk associated with investing in those securities.
The following is a summary of the inputs used in valuing the Fund’s assets and liabilities as of July 31, 2018:
| | | | | | | | | | | | | | | | |
| | | Quoted prices
(Level 1) | | | Other significant
observable inputs (Level 2) | | | Significant
unobservable inputs (Level 3) | | | Total | |
Assets | | | | | | | | | | | | | | | | |
Investments in: | | | | | | | | | | | | | | | | |
| | | | |
Treasury debt | | $ | 0 | | | $ | 10,793,717,307 | | | $ | 0 | | | $ | 10,793,717,307 | |
The Fund recognizes transfers between levels within the fair value hierarchy at the end of the reporting period. At July 31, 2018, the Fund did not have any transfers into/out of Level 1, Level 2, or Level 3.
4. TRANSACTIONS WITH AFFILIATES
Management fee
Funds Management, an indirect wholly owned subsidiary of Wells Fargo & Company (“Wells Fargo”), is the manager of the Fund and provides advisory and fund-level administrative services under an investment management agreement. Under the investment management agreement, Funds Management is responsible for, among other services, implementing the investment objectives and strategies of the Fund, supervising the subadviser and providing fund-level administrative services in connection with the Fund’s operations. As compensation for its services under the investment management agreement, Funds Management is entitled to receive an annual management fee starting at 0.20% and declining to 0.18%
| | | | |
| 20 | | Wells Fargo 100% Treasury Money Market Fund | | Notes to financial statements (unaudited) |
as the average daily net assets of the Fund increase. Prior to June 1, 2018, Fund Management received a fee at an annual rate which started at 0.35% and declined to 0.23% as the average daily net assets of the Fund increased. For the six months ended July 31, 2018, the management fee was equivalent to an annual rate of 0.27% of the Fund’s average daily net assets.
Funds Management has retained the services of a subadviser to provide daily portfolio management to the Fund. The fee for subadvisory services is borne by Funds Management. Wells Capital Management Incorporated, an affiliate of Funds Management and an indirect wholly owned subsidiary of Wells Fargo, is the subadviser to the Fund and is entitled to receive a fee from Funds Management at an annual rate starting at 0.05% and declining to 0.01% as the average daily net assets of the Fund increase.
Administration fees
Under a class-level administration agreement, Funds Management provides class-level administrative services to the Fund, which includes paying fees and expenses for services provided by the transfer agent, sub-transfer agents, omnibus account servicers and record-keepers. As compensation for its services under the class-level administration agreement, Funds Management receives an annual fee which is calculated based on the average daily net assets of each class as follows:
| | | | |
| | | Class-level
administration fee | |
Class A | | | 0.22 | % |
Administrator Class | | | 0.10 | |
Institutional Class | | | 0.08 | |
Service Class | | | 0.12 | |
Sweep Class | | | 0.03 | |
Funds Management has contractually waived and/or reimbursed management and administration fees to the extent necessary to maintain certain net operating expense ratios for the Fund. When each class of the Fund has exceeded its expense cap, Funds Management has waived fees and/or reimbursed expenses from fund level expenses on a proportionate basis and then from class specific expenses; otherwise, waivers and/or reimbursements are applied against class specific expenses before fund level expenses. Funds Management has committed through May 31, 2019 to waive fees and/or reimburse expenses to the extent necessary to cap the Fund’s expenses at 0.60% for Class A shares, 0.30% for Administrator Class shares, 0.20% for Institutional Class shares, 0.50% for Service Class shares, and 0.83% for Sweep Class shares. After this time, the cap may be increased or the commitment to maintain the cap may be terminated only with the approval of the Board of Trustees. Prior to June 1, 2018, the Fund’s expenses were capped at 0.65% for Class A shares.
Distribution fee
The Trust has adopted a distribution plan for Sweep Class shares of the Fund pursuant to Rule 12b-1 under the 1940 Act. A distribution fee is charged to Sweep Class shares and paid to Wells Fargo Funds Distributor, LLC, the principal underwriter, at an annual rate of 0.35% of the average daily net assets of Sweep Class shares.
Shareholder servicing fees
The Trust has entered into contracts with one or more shareholder servicing agents, whereby Class A, Service Class, and Sweep Class of the Fund are charged a fee at an annual rate of 0.25% of the average daily net assets of each respective class. Administrator Class is charged a fee at an annual rate of 0.10% of its average daily net assets.
A portion of these total shareholder servicing fees were paid to affiliates of Wells Fargo.
Interfund transactions
The Fund may purchase or sell portfolio investment securities to certain other Wells Fargo affiliates pursuant to Rule 17a-7 under the 1940 Act and under procedures adopted by the Board of Trustees. The procedures have been designed to ensure that these interfund transactions, which do not incur broker commissions, are effected at current market prices.
5. INDEMNIFICATION
Under the Trust’s organizational documents, the officers and Trustees have been granted certain indemnification rights against certain liabilities that may arise out of performance of their duties to the Trust. Additionally, in the normal course of business, the Trust may enter into contracts with service providers that contain a variety of indemnification clauses. The Trust’s maximum exposure under these arrangements is dependent on future claims that may be made against the Fund and, therefore, cannot be estimated.
| | | | | | |
| Other information (unaudited) | | Wells Fargo 100% Treasury Money Market Fund | | | 21 | |
PROXY VOTING INFORMATION
A description of the policies and procedures that the Fund uses to determine how to vote proxies relating to portfolio securities is available, upon request, by calling 1-800-222-8222, visiting our website at wellsfargofunds.com, or visiting the SEC website at sec.gov. Information regarding how the Fund voted proxies relating to portfolio securities during the most recent 12-month period ended June 30 is available on the Fund’s website at wellsfargofunds.com or by visiting the SEC website at sec.gov.
PORTFOLIO HOLDINGS INFORMATION
The complete portfolio holdings for the Fund are publicly available on the Fund’s website (wellsfargofunds.com) on a 1-day delayed basis. The Fund files its complete schedule of portfolio holdings with the SEC for the first and third quarters of each fiscal year on Form N-Q, which is available by visiting the SEC website at sec.gov. In addition, the Fund’s Form N-Q may be reviewed and copied at the SEC’s Public Reference Room in Washington, DC, and at regional offices in New York City, at 233 Broadway, and in Chicago, at 175 West Jackson Boulevard, Suite 900. Information about the Public Reference Room may be obtained by calling 1-800-SEC-0330.
| | | | |
| 22 | | Wells Fargo 100% Treasury Money Market Fund | | Other information (unaudited) |
BOARD OF TRUSTEES AND OFFICERS
Each of the Trustees and Officers1 listed in the table below acts in identical capacities for each fund in the Wells Fargo family of funds, which consists of 154 mutual funds comprising the Wells Fargo Funds Trust, Wells Fargo Variable Trust, Wells Fargo Master Trust and four closed-end funds (collectively the “Fund Complex”). This table should be read in conjunction with the Prospectus and the Statement of Additional Information2. The mailing address of each Trustee and Officer is 525 Market Street, 12th Floor, San Francisco, CA 94105. Each Trustee and Officer serves an indefinite term, however, each Trustee serves such term until reaching the mandatory retirement age established by the Trustees.
Independent Trustees
| | | | | | |
Name and
year of birth | | Position held and
length of service* | | Principal occupations during past five years or longer | | Current other
public company or
investment company
directorships |
| William R. Ebsworth (Born 1957) | | Trustee, since 2015 | | Retired. From 1984 to 2013, equities analyst, portfolio manager, research director and chief investment officer at Fidelity Management and Research Company in Boston, Tokyo, and Hong Kong, and retired in 2013 as Chief Investment Officer of Fidelity Strategic Advisers, Inc. where he led a team of investment professionals managing client assets. Prior thereto, Board member of Hong Kong Securities Clearing Co., Hong Kong Options Clearing Corp., the Thailand International Fund, Ltd., Fidelity Investments Life Insurance Company, and Empire Fidelity Investments Life Insurance Company. Board member of the Forté Foundation (non-profit organization) and the Vincent Memorial Hospital Endowment (non-profit organization), where he serves on the Investment Committee and as a Chair of the Audit Committee. Mr. Ebsworth is a CFA® charterholder. | | Asset Allocation Trust |
Jane A. Freeman (Born 1953) | | Trustee, since 2015; Chair Liaison, since 2018 | | Retired. From 2012 to 2014 and 1999 to 2008, Chief Financial Officer of Scientific Learning Corporation. From 2008 to 2012, Ms. Freeman provided consulting services related to strategic business projects. Prior to 1999, Portfolio Manager at Rockefeller & Co. and Scudder, Stevens & Clark. Board member of the Harding Loevner Funds from 1996 to 2014, serving as both Lead Independent Director and chair of the Audit Committee. Board member of the Russell Exchange Traded Funds Trust from 2011 to 2012 and the chair of the Audit Committee. Ms. Freeman is a Board Member of Ruth Bancroft Garden (non-profit organization) and the Glimmerglass Festival. She is also an inactive Chartered Financial Analyst. | | Asset Allocation Trust |
Isaiah Harris, Jr. (Born 1952) | | Trustee, since 2009 | | Retired. Chairman of the Board of CIGNA Corporation since 2009, and Director since 2005. From 2003 to 2011, Director of Deluxe Corporation. Prior thereto, President and CEO of BellSouth Advertising and Publishing Corp. from 2005 to 2007, President and CEO of BellSouth Enterprises from 2004 to 2005 and President of BellSouth Consumer Services from 2000 to 2003. Emeritus member of the Iowa State University Foundation Board of Governors. Emeritus Member of the Advisory Board of Iowa State University School of Business. Advisory Board Member, Palm Harbor Academy (charter school). Advisory Board Member, Child Evangelism Fellowship (non-profit). Mr. Harris is a certified public accountant (inactive status). | | CIGNA Corporation; Asset Allocation Trust |
Judith M. Johnson (Born 1949) | | Trustee, since 2008; Audit Committee Chairman, since 2009 | | Retired. Prior thereto, Chief Executive Officer and Chief Investment Officer of Minneapolis Employees Retirement Fund from 1996 to 2008. Ms. Johnson is an attorney, certified public accountant and a certified managerial accountant. | | Asset Allocation Trust |
David F. Larcker (Born 1950) | | Trustee, since 2009 | | James Irvin Miller Professor of Accounting at the Graduate School of Business, Stanford University, Director of the Corporate Governance Research Initiative and Senior Faculty of The Rock Center for Corporate Governance since 2006. From 2005 to 2008, Professor of Accounting at the Graduate School of Business, Stanford University. Prior thereto, Ernst & Young Professor of Accounting at The Wharton School, University of Pennsylvania from 1985 to 2005. | | Asset Allocation Trust |
| | | | | | |
| Other information (unaudited) | | Wells Fargo 100% Treasury Money Market Fund | | | 23 | |
| | | | | | |
Name and
year of birth | | Position held and
length of service* | | Principal occupations during past five years or longer | | Current other
public company or
investment company
directorships |
Olivia S. Mitchell (Born 1953) | | Trustee, since 2006; Governance Committee Chairman, since 2018 | | International Foundation of Employee Benefit Plans Professor, Wharton School of the University of Pennsylvania since 1993. Director of Wharton’s Pension Research Council and Boettner Center on Pensions & Retirement Research, and Research Associate at the National Bureau of Economic Research. Previously, Cornell University Professor from 1978 to 1993. | | Asset Allocation Trust |
Timothy J. Penny (Born 1951) | | Trustee, since 1996; Chairman, since 2018; Vice Chairman, from 2017 to 2018 | | President and Chief Executive Officer of Southern Minnesota Initiative Foundation, a non-profit organization, since 2007. Member of the Board of Trustees of NorthStar Education Finance, Inc., a non-profit organization, since 2007. | | Asset Allocation Trust |
James G. Polisson (Born 1959) | | Trustee, since 2018; Advisory Board Member, from 2017 to 2018 | | Retired. Chief Marketing Officer, Source (ETF) UK Services, Ltd, from 2015 to 2017. From 2012 to 2015, Principal of The Polisson Group, LLC, a management consulting, corporate advisory and principal investing company. Chief Executive Officer and Managing Director at Russell Investments, Global Exchange Traded Funds from 2010 to 2012. Managing Director of Barclays Global Investors from 1998 to 2010 and Global Chief Marketing Officer for iShares and Barclays Global Investors from 2000 to 2010. Trustee of the San Francisco Mechanics’ Institute, a non-profit organization, from 2013 to 2015. Board member of the Russell Exchange Traded Fund Trust from 2011 to 2012. Director of Barclays Global Investors Holdings Deutschland GmbH from 2006 to 2009. Mr. Polisson is an attorney and has a retired status with the Massachusetts and District of Columbia Bar Associations. | | Asset Allocation Trust |
Michael S. Scofield (Born 1943) | | Trustee, since 2010 | | Served on the Investment Company Institute’s Board of Governors and Executive Committee from 2008-2011 as well the Governing Council of the Independent Directors Council from 2006-2011 and the Independent Directors Council Executive Committee from 2008-2011. Trustee of the Evergreen Fund complex (and its predecessors) from 1984 to 2010. Chairman of the Evergreen Funds from 2000-2010. Former Trustee of the Mentor Funds. Retired Attorney, Law Offices of Michael S. Scofield. | | Asset Allocation Trust |
Pamela Wheelock (Born 1959) | | Trustee, since 2018; Advisory Board Member, from 2017 to 2018 | | Chief Operating Officer, Twin Cities Habitat for Humanity, since January, 2017. Vice President of University Services, University of Minnesota from 2012 to 2017. Prior thereto, on the Board of Directors, Goverance Committee and Finance Committee for the Minnesota Philanthropy Partners (Saint Paul Foundation) from 2012 to 2018, Interim President and Chief Executive Officer of Blue Cross Blue shield of Minnesota of Minnesota from 2010 to 2011, Chairman of the Board from 2009 to 2011 and Board Director 003 to 2015. Vice President, Leadership and Community Engagement, Bush Foundation, Saint Paul, Minnesota (a private foundation) from 2009 to 2011. Executive Vice President and Chief Financial Officer, Minnesota Sports and Entertainment from 2004 to 2009 and Senior Vice President from 2002 to 2004. Commissioner of Finance, State of Minnesota, from 1999 to 2002. Currently the Board Chair of the Minnesota Wild Foundation since 2010. | | Asset Allocation Trust |
| * | Length of service dates reflect the Trustee’s commencement of service with the Trust’s predecessor entities, where applicable. |
| | | | |
| 24 | | Wells Fargo 100% Treasury Money Market Fund | | Other information (unaudited) |
Officers
| | | | | | |
Name and year of birth | | Position held and length of service | | Principal occupations during past five years or longer | | |
Andrew Owen (Born 1960) | | President, since 2017 | | Executive Vice President of Wells Fargo & Company and Head of Affiliated Managers, Wells Fargo Asset Management, since 2014. In addition, Mr. Owen is currently President, Chief Executive Officer and Director of Wells Fargo Funds Management, LLC since 2017. Prior thereto, Executive Vice President responsible for marketing, investments and product development for Wells Fargo Funds Management, LLC, from 2009 to 2014. | | |
Nancy Wiser1 (Born 1967) | | Treasurer, since 2012 | | Executive Vice President of Wells Fargo Funds Management, LLC since 2011. Chief Operating Officer and Chief Compliance Officer at LightBox Capital Management LLC, from 2008 to 2011. | | |
Alexander Kymn3 (Born 1973) | | Secretary, since 2018; Chief Legal Officer, since 2018 | | Senior Company Counsel of Wells Fargo Bank, N.A. since 2018 (previously Senior Counsel from 2007 to 2018). Vice President of Wells Fargo Funds Management, LLC from 2008 to 2014. | | |
Michael H. Whitaker (Born 1967) | | Chief Compliance Officer, since 2016 | | Senior Vice President and Chief Compliance Officer since 2016. Senior Vice President and Chief Compliance Officer for Fidelity Investments from 2007 to 2016. | | |
David Berardi (Born 1975) | | Assistant Treasurer, since 2009 | | Vice President of Wells Fargo Funds Management, LLC since 2009. Vice President of Evergreen Investment Management Company, LLC from 2008 to 2010. Manager of Fund Reporting and Control for Evergreen Investment Management Company, LLC from 2004 to 2010. | | |
Jeremy DePalma1 (Born 1974) | | Assistant Treasurer, since 2009 | | Senior Vice President of Wells Fargo Funds Management, LLC since 2009. Senior Vice President of Evergreen Investment Management Company, LLC from 2008 to 2010 and head of the Fund Reporting and Control Team within Fund Administration from 2005 to 2010. | | |
| 1 | Nancy Wiser acts as Treasurer of 77 funds in the Fund Complex. Jeremy DePalma acts as Treasurer of 77 funds and Assistant Treasurer of 77 funds in the Fund Complex. |
| 2 | The Statement of Additional Information includes additional information about the Trustees and is available, without charge, upon request, by calling 1-800-222-8222 or by visiting the website at wellsfargofunds.com. |
| 3 | Alexander Kymn became the Secretary and Chief Legal Officer effective April 17, 2018. |
| | | | | | |
| Other information (unaudited) | | Wells Fargo 100% Treasury Money Market Fund | | | 25 | |
BOARD CONSIDERATION OF INVESTMENT MANAGEMENT AND SUB-ADVISORY AGREEMENTS:
Wells Fargo 100% Treasury Money Market Fund
Under the Investment Company Act of 1940 (the “1940 Act”), the Board of Trustees (the “Board”) of Wells Fargo Funds Trust (the “Trust”) must determine annually whether to approve the continuation of the Trust’s investment management and sub-advisory agreements. In this regard, at an in-person meeting held on May 22-23, 2018 (the “Meeting”), the Board, all the members of which have no direct or indirect interest in the investment management and sub-advisory agreements and are not “interested persons” of the Trust, as defined in the 1940 Act (the “Independent Trustees”), reviewed and approved for Wells Fargo 100% Treasury Money Market Fund (the “Fund”): (i) an investment management agreement (the “Management Agreement”) with Wells Fargo Funds Management, LLC (“Funds Management”); and (ii) an investment sub-advisory agreement (the “Sub-Advisory Agreement”) with Wells Capital Management Incorporated (the “Sub-Adviser”), an affiliate of Funds Management. The Management Agreement and the Sub-Advisory Agreement are collectively referred to as the “Advisory Agreements.”
At the Meeting, the Board considered the factors and reached the conclusions described below relating to the selection of Funds Management and the Sub-Adviser and the approval of the Advisory Agreements. Prior to the Meeting, including at an in-person meeting in April 2018, the Trustees conferred extensively among themselves and with representatives of Funds Management about these matters. Also, the Board has adopted a team-based approach, with each team consisting of a sub-set of Trustees, to assist the full Board in the discharge of its duties in reviewing investment performance and other matters throughout the year. The Independent Trustees were assisted in their evaluation of the Advisory Agreements by independent legal counsel, from whom they received separate legal advice and with whom they met separately.
In providing information to the Board, Funds Management and the Sub-Adviser were guided by a detailed set of requests for information submitted to them by independent legal counsel on behalf of the Independent Trustees at the start of the Board’s annual contract renewal process earlier in 2018. In considering and approving the Advisory Agreements, the Trustees considered the information they believed relevant, including but not limited to the information discussed below. The Board considered not only the specific information presented in connection with the Meeting, but also the knowledge gained over time through interaction with Funds Management and the Sub-Adviser about various topics. In this regard, the Board reviewed reports of Funds Management at each of its quarterly meetings, which included, among other things, portfolio reviews and investment performance reports. In addition, the Board and the teams mentioned above confer with portfolio managers at various times throughout the year. The Board did not identify any particular information or consideration that was all-important or controlling, and each individual Trustee may have attributed different weights to various factors.
After its deliberations, the Board unanimously approved the continuation of the Advisory Agreements for a one-year term and determined that the compensation payable to Funds Management and the Sub-Adviser under each of the Advisory Agreements was reasonable. The Board considered the approval of the Advisory Agreements for the Fund as part of its consideration of agreements for funds across the complex, but its approvals were made on a fund-by-fund basis. The following summarizes a number of important, but not necessarily all, factors considered by the Board in support of its approvals.
Nature, extent and quality of services
The Board received and considered various information regarding the nature, extent and quality of services provided to the Fund by Funds Management and the Sub-Adviser under the Advisory Agreements. This information included a description of the investment advisory services and Fund-level administrative services covered by the Management Agreement, as well as, among other things, a summary of the background and experience of senior management of Wells Fargo Asset Management (“WFAM”), of which Funds Management and the Sub-Adviser are a part, a summary of investments made in the business of WFAM, a summary of certain organizational and personnel changes involving Funds Management and the Sub-Adviser, and a description of Funds Management’s and the Sub-Adviser’s business continuity planning programs and of their approaches to data privacy and cybersecurity. The Board also considered the qualifications, background, tenure and responsibilities of each of the portfolio managers primarily responsible for the day-to-day portfolio management of the Fund.
The Board evaluated the ability of Funds Management and the Sub-Adviser to attract and retain qualified investment professionals, including research, advisory and supervisory personnel. The Board further considered the compliance programs and compliance records of Funds Management and the Sub-Adviser. In addition, the Board took into account the full range of services provided to the Fund by Funds Management and its affiliates.
| | | | |
| 26 | | Wells Fargo 100% Treasury Money Market Fund | | Other information (unaudited) |
Fund investment performance and expenses
The Board considered the investment performance results for the Fund over various time periods ended December 31, 2017. The Board considered these results in comparison to the investment performance of funds in a universe that was determined by Broadridge Inc. (“Broadridge”) to be similar to the Fund (the “Universe”), and in comparison to the Fund’s benchmark index and to other comparative data. Broadridge is an independent provider of investment company data. The Board received a description of the methodology used by Broadridge to select the mutual funds in the performance Universe. The Board noted that the investment performance of the Fund (Service Class) was higher than or equal to the average investment performance of the Universe for all periods under review. The Board also noted that the investment performance of the Fund was higher than or equal to its benchmark index, the Lipper U.S. Treasury Money Market Funds Index, for all periods under review.
The Board also received and considered information regarding the Fund’s net operating expense ratios and their various components, including actual management fees, custodian and other non-management fees, and Rule 12b-1 and non-Rule 12b-1 shareholder service fees. The Board considered these ratios in comparison to the median ratios of funds in class-specific expense groups that were determined by Broadridge to be similar to the Fund (the “Groups”). The Board received a description of the methodology used by Broadridge to select the mutual funds in the expense Groups and an explanation of how funds comprising expense groups and their expense ratios may vary from year-to-year. Based on the Broadridge reports, the Board noted that the net operating expense ratios of the Fund were equal to or in range of the median net operating expense ratios of the expense Groups for Administrator Class and Institutional Class shares, but higher than the median net operating expense ratios of the expense Groups for the Fund’s Class A, Sweep Class and Service Class. The Board noted that the net operating expense ratio cap for Class A would be reduced.
The Board took into account the Fund’s investment performance and expense information provided to it among the factors considered in deciding to re-approve the Advisory Agreements.
Investment management and sub-advisory fee rates
The Board reviewed and considered the contractual fee rates payable by the Fund to Funds Management under the Management Agreement, as well as the contractual fee rates payable by the Fund to Funds Management for class-level administrative services under a Class-Level Administration Agreement, which include, among other things, class-level transfer agency and sub-transfer agency costs (collectively, the “Management Rates”). The Board also reviewed and considered the contractual investment sub-advisory fee rates that are payable by Funds Management to the Sub-Adviser for investment sub-advisory services.
Among other information reviewed by the Board was a comparison of the Fund’s Management Rates with the average contractual investment management fee rates of funds in the expense Groups at a common asset level as well as transfer agency costs of the funds in the expense Groups. The Board noted that the Management Rates of the Fund were in range of the sum of these average rates for the Fund’s expense Group for Sweep Class, but higher than the sum of these average rates for the Fund’s expense Groups for Class A, Administrator Class, Institutional Class, and Service Class. The also Board discussed and accepted Funds Management’s proposal to revise the Management Agreement to reduce the management fees paid by the Fund to Funds Management.
The Board also received and considered information about the portion of the total management fee that was retained by Funds Management after payment of the fee to the Sub-Adviser for sub-advisory services. In assessing the reasonableness of this amount, the Board received and evaluated information about the nature and extent of responsibilities retained and risks assumed by Funds Management and not delegated to or assumed by the Sub-Adviser, and about Funds Management’s on-going oversight services. Given the affiliation between Funds Management and the Sub-Adviser, the Board ascribed limited relevance to the allocation of fees between them.
Based on its consideration of the factors and information it deemed relevant, including those described here, the Board determined that the compensation payable to Funds Management under the Management Agreement and to the Sub-Adviser under the Sub-Advisory Agreement was reasonable.
Profitability
The Board received and considered information concerning the profitability of Funds Management, as well as the profitability of both WFAM and Wells Fargo & Co. (“Wells Fargo”) as a whole, from providing services to the Fund and the fund family as a whole. The Board noted that the Sub-Adviser’s profitability information with respect to providing services to the Fund was subsumed in the WFAM and Wells Fargo profitability analysis.
Funds Management reported on the methodologies and estimates used in calculating profitability, including a description of the methodology used to allocate certain expenses and recent enhancements made to the methodology.
| | | | | | |
| Other information (unaudited) | | Wells Fargo 100% Treasury Money Market Fund | | | 27 | |
Among other things, the Board noted that the levels of profitability reported on a fund-by-fund basis varied widely, depending on factors such as the size and type of fund. Based on its review, the Board did not deem the profits reported by Funds Management, WFAM or Wells Fargo from services provided to the Fund to be at a level that would prevent it from approving the continuation of the Advisory Agreements.
Economies of scale
The Board considered the extent to which Funds Management may experience economies of scale in the provision of management services, and the extent to which scale benefits, if any, would be shared with shareholders. In particular, the Board noted the existence of breakpoints in the Fund’s management fee structure, which operate generally to reduce the Fund’s expense ratios as the Fund grows in size. It considered that, for a small fund or a fund that shrinks in size, breakpoints conversely can result in higher fee levels. The Board also considered that in addition to management fee breakpoints, competitive management fee rates set at the outset without regard to breakpoints and fee waiver and expense reimbursement arrangements, as well as investments in the business intended to enhance services available to Fund shareholders, are means of sharing potential economies of scale with shareholders of the Fund. The also Board discussed and accepted Funds Management’s proposal to revise the Management Agreement to reduce the management fees paid by the Fund to Funds Management.
The Board concluded that the Fund’s fee and expense arrangements, including contractual breakpoints, constituted a reasonable approach to sharing potential economies of scale with the Fund and its shareholders.
Other benefits to Funds Management and the Sub-Adviser
The Board received and considered information regarding potential “fall-out” or ancillary benefits received by Funds Management and its affiliates, including the Sub-Adviser, as a result of their relationships with the Fund. Ancillary benefits could include, among others, benefits directly attributable to other relationships with the Fund and benefits potentially derived from an increase in Funds Management’s and the Sub-Adviser’s business as a result of their relationships with the Fund. The Board noted that various affiliates of Funds Management may receive distribution-related fees, shareholder servicing payments and sub-transfer agency fees in respect of shares sold or held through them and services provided.
The Board also reviewed information about soft dollar credits earned and utilized by the Sub-Adviser, fees earned by Funds Management and the Sub-Adviser from managing a private investment vehicle for the fund family’s securities lending collateral and commissions earned by an affiliated broker from portfolio transactions.
Based on its consideration of the factors and information it deemed relevant, including those described here, the Board did not find that any ancillary benefits received by Funds Management and its affiliates, including the Sub-Adviser, were unreasonable.
Conclusion
At the Meeting, after considering the above-described factors and based on its deliberations and its evaluation of the information described above, the Board unanimously approved the continuation of the Advisory Agreements for a one-year term and determined that the compensation payable to Funds Management and the Sub-Adviser under each of the Advisory Agreements was reasonable.
This page is intentionally left blank.

For more information
More information about Wells Fargo Funds is available free upon request. To obtain literature, please write, email, visit the Fund’s website, or call:
Wells Fargo Funds
P.O. Box 219967
Kansas City, MO 64121-9967
Website: wellsfargofunds.com
Individual investors: 1-800-222-8222
Retail investment professionals: 1-888-877-9275
Institutional investment professionals:
1-866-765-0778
This report and the financial statements contained herein are submitted for the general information of the shareholders of the Fund. If this report is used for promotional purposes, distribution of the report must be accompanied or preceded by a current prospectus. Before investing, please consider the investment objectives, risks, charges, and expenses of the investment. For a current prospectus and, if available, a summary prospectus, containing this information, call 1-800-222-8222 or visit the Fund’s website at wellsfargofunds.com. Read the prospectus carefully before you invest or send money.
Wells Fargo Asset Management (WFAM) is the trade name for certain investment advisory/management firms owned by Wells Fargo & Company. These firms include but are not limited to Wells Capital Management Incorporated and Wells Fargo Funds Management, LLC. Certain products managed by WFAM entities are distributed by Wells Fargo Funds Distributor, LLC (a broker/dealer and Member FINRA).
This material is for general informational and educational purposes only and is NOT intended to provide investment advice or a recommendation of any kind—including a recommendation for any specific investment, strategy, or plan.
NOT FDIC INSURED ◾ NO BANK GUARANTEE ◾ MAY LOSE VALUE
© 2018 Wells Fargo Funds Management, LLC. All rights reserved.
| | |
 | | 314810 09-18 SA300/SAR300 07-18 |
Semi-Annual Report
July 31, 2018

Government Money Market Funds

| ∎ | | Wells Fargo Treasury Plus Money Market Fund |

Reduce clutter. Save trees.
Sign up for electronic delivery of prospectuses and shareholder reports at wellsfargo.com/advantagedelivery
Contents
The views expressed and any forward-looking statements are as of July 31, 2018, unless otherwise noted, and are those of the Fund managers and/or Wells Fargo Funds Management, LLC. Discussions of individual securities, or the markets generally, or any Wells Fargo Fund are not intended as individual recommendations. Future events or results may vary significantly from those expressed in any forward-looking statements. The views expressed are subject to change at any time in response to changing circumstances in the market. Wells Fargo Funds Management, LLC and the Fund disclaim any obligation to publicly update or revise any views expressed or forward-looking statements.
NOT FDIC INSURED ◾ NO BANK GUARANTEE ◾ MAY LOSE VALUE
| | | | |
| 2 | | Wells Fargo Treasury Plus Money Market Fund | | Letter to shareholders (unaudited) |

Andrew Owen
President
Wells Fargo Funds
Yields on money market funds benefited during the period.
During February 2018, the U.S. stock market endured a loss of more than 10% before recovering in March and April.
Dear Shareholder:
We are pleased to offer you this semi-annual report for the Wells Fargo Treasury Plus Money Market Fund for the six-month period that ended July 31, 2018. Yields on money market funds benefited during the period. As the U.S. Federal Reserve (the Fed) moved toward a more normalized monetary policy after an extended term of low interest rates following the global financial crisis during 2007 and 2008, its steady pace of interest rate increases helped raise yields on short-term money market instruments.
Globally, stock markets followed a less consistent path during the period. After advancing during the summer and fall of 2017 in a roughly synchronized way, economic growth and stock markets globally diverged during the first seven months of 2018. For fixed-income investors, higher U.S. interest rates, rising inflation, and intensifying global geopolitical tensions tended to restrain taxable bond prices while high-yield and municipal bond investors generally enjoyed positive returns.
For the period, U.S. stocks, as measured by the S&P 500 Index,1 gained 0.70%, and international stocks, as measured by the MSCI ACWI ex USA Index (Net),2 fell 6.66%. Emerging market stocks, as measured by the MSCI EM Index (Net),3 dropped 11.94%. In bond markets, the Bloomberg Barclays U.S. Aggregate Bond Index4 declined 0.45% while fixed-income investments outside the U.S. fell 4.57%, according to the Bloomberg Barclays Global Aggregate ex-USD Index.5 The Bloomberg Barclays Municipal Bond Index6 added 1.18%, and the ICE BofAML U.S. High Yield Index7 was up 0.55%.
Volatility reemerged during the first quarter of 2018 as economic signals were mixed.
The first quarter of 2018 began with stock market gains in January following U.S. tax reform that lowered rates for individuals and corporations and deregulation advanced in some economic sectors. Then, investor optimism was supplanted by several concerns. Trade tensions intensified, particularly between the U.S. and China. The U.S. threatened to impose tariffs on a broad range of imported products. Increasing interest rates and inflation also caused concern. During February 2018, the U.S. stock market endured a loss of more than 10% before recovering in March and April. The S&P 500 Index closed the first quarter with a negative return, the first negative quarterly return for the index since 2014.
| 1 | The S&P 500 Index consists of 500 stocks chosen for market size, liquidity, and industry group representation. It is a market-value-weighted index with each stock’s weight in the index proportionate to its market value. You cannot invest directly in an index. |
| 2 | The Morgan Stanley Capital International (MSCI) All Country World Index (ACWI) ex USA Index (Net) is a free-float-adjusted market-capitalization-weighted index that is designed to measure the equity market performance of developed markets, excluding the United States and Canada. Source: MSCI. MSCI makes no express or implied warranties or representations and shall have no liability whatsoever with respect to any MSCI data contained herein. The MSCI data may not be further redistributed or used as a basis for other indices or any securities or financial products. This report is not approved, reviewed, or produced by MSCI. You cannot invest directly in an index. |
| 3 | The MSCI Emerging Markets (EM) Index (Net) is a free-float-adjusted market-capitalization-weighted index that is designed to measure large- and mid-cap equity market performance of emerging markets. The MSCI EM Index (Net) consists of the following 24 emerging market country indices: Brazil, Chile, China, Colombia, Czech Republic, Egypt, Greece, Hungary, India, Indonesia, Korea, Malaysia, Mexico, Pakistan, Peru, the Philippines, Poland, Qatar, Russia, South Africa, Taiwan, Thailand, Turkey, and the United Arab Emirates. You cannot invest directly in an index. |
| 4 | The Bloomberg Barclays U.S. Aggregate Bond Index is a broad-based benchmark that measures the investment-grade, U.S. dollar-denominated, fixed-rate taxable bond market, including Treasuries, government-related and corporate securities, mortgage-backed securities (agency fixed-rate and hybrid adjustable-rate mortgage pass-throughs), asset-backed securities, and commercial mortgage-backed securities. You cannot invest directly in an index. |
| 5 | The Bloomberg Barclays Global Aggregate ex-USD Index is an unmanaged index that provides a broad-based measure of the global investment-grade fixed-income markets excluding the U.S. dollar-denominated debt market. You cannot invest directly in an index. |
| 6 | The Bloomberg Barclays Municipal Bond Index is an unmanaged index composed of long-term tax-exempt bonds with a minimum credit rating of Baa. You cannot invest directly in an index. |
| 7 | The ICE BofAML U.S. High Yield Index is a market-capitalization-weighted index of domestic and Yankee high-yield bonds. The index tracks the performance of high-yield securities traded in the U.S. bond market. You cannot invest directly in an index. Copyright 2018. ICE Data Indices, LLC. All rights reserved. |
| 8 | The Consumer Price Index For All Urban Consumers (CPI-U) measures the changes in the price of a basket of goods and services purchased by urban consumers. The urban consumer population is deemed by many as a better representative measure of the general public because most of the country’s population lives in highly populated areas, which represent close to 90% of the total population. You cannot invest directly in an index. |
| | | | | | |
| Letter to shareholders (unaudited) | | Wells Fargo Treasury Plus Money Market Fund | | | 3 | |
The Fed increased the federal funds rate by 25 basis points (bps; 100 bps equal 1.00%) in March 2018 and the rate of inflation reached the Fed’s 2% target for the first time in a year. The unemployment rate fell to 4.1%. The third revision of first- quarter gross domestic product (GDP) growth by the U.S. Bureau of Economic Analysis released during June 2018 was lowered to 2.0%.
Overseas, investment market returns reversed the strong returns of 2017. After having gained 27.19% for the 12-month period that ended on December 31, 2017, the MSCI ACWI ex USA Index (Net) fell 1.46% for the seven-month period that ended July 31, 2018. The U.S. dollar strengthened relative to local currencies, which served to restrain returns.
Global trade tensions escalated during the second quarter and into the third quarter of 2018.
Global trade tensions escalated as the second quarter of 2018 opened and equity markets fell in response before resuming upward momentum later in April. The U.S. government imposed tariffs on products and commodities imported from other markets in North America, Europe, and Asia. In retaliation, governments imposed tariffs on U.S. products and commodities. In addition, the U.S. pushed its North American neighbors to renegotiate the North American Free Trade Agreement, furthering trade tensions and investor uncertainty.
The CPI-U8 added 0.2% in May after a similar increase in April. On a year-over-year basis, the all-items index rose 2.8% for the 12 months that ended May 31, continuing its upward trend since the beginning of the year. The index for all items less food and energy rose 2.2% for the same 12-month period. Interest rates generally increased and the bond markets tended to decline.
During June 2018, the Fed increased the federal funds rate by 25 bps. Investment markets began to anticipate two more rate increases in 2018. Long-term interest rates in the U.S. trended higher—rates on the 10-year and 30-year Treasury bonds moved from 2.46% and 2.81%, respectively, on January 1, 2018, to 2.96% and 3.08%, respectively, on July 31, 2018. While higher at the end of the period, rates were off their peak levels on May 17, 2018, of 3.11% and 3.25%, respectively. Investors became more aware of and concerned about the potential for an inverted yield curve—sometimes a recession signal—as short-term rates increased more quickly than long-term rates.
The unemployment rate fell to 3.9% in July after ticking up slightly in June from May’s 3.8% level, according to the U.S. Department of Labor. The annualized rate of GDP growth for the second quarter of 2018 was reported in July to be 4.1%, the highest level since the third quarter of 2014, according to the U.S. Bureau of Economic Analysis.
Internationally, the prospects for a smooth U.K. Brexit agreement was cast into doubt as members of Prime Minister Theresa May’s negotiating team resigned. Despite the uncertainty, the period closed with expectations that the Bank of England’s Monetary Policy Committee in July would announce an increase in its key interest rate to 0.75%, which it did in early August.
Meanwhile, central banks in Europe and Japan maintained low interest rates and accommodative monetary policies. Amid rising trade uncertainty, People’s Bank of China monetary policies shifted with cuts to reserve requirement ratios and implementation of supportive measures such as accelerated infrastructure spending and tax cuts for small and medium enterprises and for individuals. Nevertheless, a strengthening U.S. dollar and the tensions associated with trade policies remained headwinds for investors overseas.
| | | | |
| 4 | | Wells Fargo Treasury Plus Money Market Fund | | Letter to shareholders (unaudited) |
Don’t let short-term uncertainty derail long-term investment goals.
Periods of investment uncertainty can present challenges, but experience has taught us that maintaining long-term investment goals can be an effective way to plan for the future. To help you create a sound strategy based on your personal goals and risk tolerance, Wells Fargo Funds offers more than 100 mutual funds spanning a wide range of asset classes and investment styles. Although diversification cannot guarantee an investment profit or prevent losses, we believe it can be an effective way to manage investment risk and potentially smooth out overall portfolio performance. We encourage investors to know their investments and to understand that appropriate levels of risk-taking may unlock opportunities.
Thank you for choosing to invest with Wells Fargo Funds. We appreciate your confidence in us and remain committed to helping you meet your financial needs.
Sincerely,

Andrew Owen
President
Wells Fargo Funds
For further information about your Fund, contact your investment professional, visit our website at wellsfargofunds.com, or call us directly at 1-800-222-8222.
This page is intentionally left blank.
| | | | |
| 6 | | Wells Fargo Treasury Plus Money Market Fund | | Performance highlights (unaudited) |
Investment objective
The Fund seeks current income, while preserving capital and liquidity.
Manager
Wells Fargo Funds Management, LLC
Subadviser
Wells Capital Management Incorporated
Portfolio managers
Michael C. Bird, CFA®
Jeffrey L. Weaver, CFA®
Laurie White
Average annual total returns (%) as of July 31, 20181
| | | | | | | | | | | | | | | | | | | | | | |
| | | | | | | | Expense ratios2 (%) | |
| | | Inception date | | 1 year | | | 5 year | | | 10 year | | | Gross | | | Net3 | |
| Class A (PIVXX) | | 7-28-2003 | | | 0.81 | | | | 0.19 | | | | 0.12 | | | | 0.62 | | | | 0.60 | |
| Administrator Class (WTPXX) | | 3-31-2008 | | | 1.08 | | | | 0.28 | | | | 0.17 | | | | 0.35 | | | | 0.35 | |
| Institutional Class (PISXX) | | 8-11-1995 | | | 1.23 | | | | 0.35 | | | | 0.22 | | | | 0.23 | | | | 0.20 | |
| Service Class (PRVXX) | | 10-1-1985 | | | 0.98 | | | | 0.24 | | | | 0.15 | | | | 0.52 | | | | 0.45 | |
| Sweep Class | | 6-30-2010 | | | 0.65 | | | | 0.15 | | | | 0.10 | | | | 0.78 | | | | 0.78 | |
Yield summary (%) as of July 31, 20183
| | | | | | | | | | | | | | | | | | |
| | | Class A | | Administrator
Class | | | Institutional
Class | | | Service
Class | | | Sweep
Class | |
| 7-day current yield | | 1.35 | | | 1.60 | | | | 1.75 | | | | 1.50 | | | | 1.18 | |
| 7-day compound yield | | 1.36 | | | 1.62 | | | | 1.76 | | | | 1.51 | | | | 1.18 | |
| 30-day simple yield | | 1.35 | | | 1.60 | | | | 1.75 | | | | 1.50 | | | | 1.18 | |
| 30-day compound yield | | 1.36 | | | 1.62 | | | | 1.76 | | | | 1.51 | | | | 1.18 | |
Figures quoted represent past performance, which is no guarantee of future results, and do not reflect taxes that a shareholder may pay on fund distributions or the redemption of fund shares. Investment returns will fluctuate. The Fund’s yield figures more closely reflect the current earnings of the Fund than the total return figures. Current performance may be lower or higher than the performance data quoted, which assumes the reinvestment of dividends and capital gains. Current month-end performance is available on the Fund’s website, wellsfargofunds.com.
Each class is sold without a front-end sales charge or contingent deferred sales charge.
For government money market funds: You could lose money by investing in the Fund. Although the Fund seeks to preserve the value of your investment at $1.00 per share, it cannot guarantee it will do so. An investment in the Fund is not insured or guaranteed by the Federal Deposit Insurance Corporation or any other government agency. The Fund’s sponsor has no legal obligation to provide financial support to the Fund, and you should not expect that the sponsor will provide financial support to the Fund at any time.
Please see footnotes on page 7.
| | | | | | |
| Performance highlights (unaudited) | | Wells Fargo Treasury Plus Money Market Fund | | | 7 | |
|
| Portfolio composition as of July 31, 20184 |
|
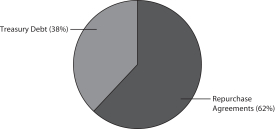 |
|
| Effective maturity distribution as of July 31, 20184 |
|
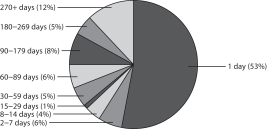 |
|
| Weighted average maturity as of July 31, 20185 |
22 days |
|
| Weighted average life as of July 31, 20186 |
98 days |
| 1 | Historical performance shown for Sweep Class shares prior to their inception reflects the performance of Class A shares, and has not been adjusted to include the higher expenses applicable to Sweep Class shares. If these expenses had been adjusted, returns for Sweep Class shares would be lower. |
| 2 | Reflects the expense ratios as stated in the most recent prospectuses. The expense ratios shown are subject to change and may differ from the annualized expense ratios shown in the financial highlights of this report. |
| 3 | The manager has contractually committed through May 31, 2019, to waive fees and/or reimburse expenses to the extent necessary to cap the Fund’s Total Annual Fund Operating Expenses After Fee Waivers at 0.60% for Class A, 0.35% for Administrator Class, 0.20% for Institutional Class, 0.45% for Service Class, and 0.83% for Sweep Class. After this time, the cap may be increased or the commitment to maintain the cap may be terminated only with the approval of the Board of Trustees. Brokerage commissions, stamp duty fees, interest, taxes, acquired fund fees and expenses (if any), and extraordinary expenses are excluded from the cap. Without this cap, the Fund’s returns would have been lower. Without waived fees and/or reimbursed expenses, the Fund’s 7-day current yield would have been 1.33%, 1.60%, 1.72%, 1.43%, and 1.18% for Class A, Administrator Class, Institutional Class, Service Class, and Sweep Class, respectively. The expense ratio paid by an investor is the net expense ratio (the total annual fund operating expenses after fee waivers) as stated in the prospectuses. |
| 4 | Amounts are calculated based on the total investments of the Fund. These amounts are subject to change and may have changed since the date specified. |
| 5 | Weighted Average Maturity (WAM): WAM is an average of the effective maturities of all securities held in the portfolio, weighted by each security’s percentage of total investments. The maturity of a portfolio security is the period remaining until the date on which the principal amount is unconditionally required to be paid, or in the case of a security called for redemption, the date on which the redemption payment is unconditionally required to be made. WAM calculations allow for the maturities of certain securities with demand features or periodic interest rate resets to be shortened. WAM is a way to measure a fund’s sensitivity to potential interest rate changes. WAM is subject to change and may have changed since the date specified. |
| 6 | Weighted Average Life (WAL): WAL is an average of the final maturities of all securities held in the portfolio, weighted by their percentage of total investments. The maturity of a portfolio security is the period remaining until the date on which the principal amount is unconditionally required to be paid, or in the case of a security called for redemption, the date on which the redemption payment is unconditionally required to be made. In contrast to WAM, the calculation of WAL allows for the maturities of certain securities with demand features to be shortened, but not the periodic interest rate resets. WAL is a way to measure a fund’s potential sensitivity to credit spread changes. WAL is subject to change and may have changed since the date specified. |
| | | | |
| 8 | | Wells Fargo Treasury Plus Money Market Fund | | Fund expenses (unaudited) |
As a shareholder of the Fund, you incur ongoing costs, including management fees, distribution (12b-1) and/or shareholder servicing fees, and other Fund expenses. This example is intended to help you understand your ongoing costs (in dollars) of investing in the Fund and to compare these costs with the ongoing costs of investing in other mutual funds.
The example is based on an investment of $1,000 invested at the beginning of the six-month period and held for the entire period from February 1, 2018 to July 31, 2018.
Actual expenses
The “Actual” line of the table below provides information about actual account values and actual expenses. You may use the information in this line, together with the amount you invested, to estimate the expenses that you paid over the period. Simply divide your account value by $1,000 (for example, an $8,600 account value divided by $1,000 = 8.6), then multiply the result by the number in the “Actual” line under the heading entitled “Expenses paid during period” for your applicable class of shares to estimate the expenses you paid on your account during this period.
Hypothetical example for comparison purposes
The “Hypothetical” line of the table below provides information about hypothetical account values and hypothetical expenses based on the Fund’s actual expense ratio and an assumed rate of return of 5% per year before expenses, which is not the Fund’s actual return. The hypothetical account values and expenses may not be used to estimate the actual ending account balance or expenses you paid for the period. You may use this information to compare the ongoing costs of investing in the Fund and other funds. To do so, compare this 5% hypothetical example with the 5% hypothetical examples that appear in the shareholder reports of the other funds.
Please note that the expenses shown in the table are meant to highlight your ongoing costs only. Therefore, the “Hypothetical” line of the table is useful in comparing ongoing costs only and will not help you determine the relative total costs of owning different funds.
| | | | | | | | | | | | | | | | |
| | | Beginning
account value
2-1-2018 | | | Ending
account value
7-31-2018 | | | Expenses
paid during
the period¹ | | | Annualized net
expense ratio | |
|
Class A | | | | | | | | | | | | | | | | |
Actual | | $ | 1,000.00 | | | $ | 1,005.39 | | | $ | 3.08 | | | | 0.61 | % |
Hypothetical (5% return before expenses) | | $ | 1,000.00 | | | $ | 1,022.13 | | | $ | 3.11 | | | | 0.61 | % |
Administrator Class | | | | | | | | | | | | | | | | |
Actual | | $ | 1,000.00 | | | $ | 1,006.71 | | | $ | 1.77 | | | | 0.35 | % |
Hypothetical (5% return before expenses) | | $ | 1,000.00 | | | $ | 1,023.44 | | | $ | 1.79 | | | | 0.35 | % |
Institutional Class | | | | | | | | | | | | | | | | |
Actual | | $ | 1,000.00 | | | $ | 1,007.43 | | | $ | 1.01 | | | | 0.20 | % |
Hypothetical (5% return before expenses) | | $ | 1,000.00 | | | $ | 1,024.20 | | | $ | 1.02 | | | | 0.20 | % |
Service Class | | | | | | | | | | | | | | | | |
Actual | | $ | 1,000.00 | | | $ | 1,006.19 | | | $ | 2.28 | | | | 0.45 | % |
Hypothetical (5% return before expenses) | | $ | 1,000.00 | | | $ | 1,022.94 | | | $ | 2.29 | | | | 0.45 | % |
Sweep Class | | | | | | | | | | | | | | | | |
Actual | | $ | 1,000.00 | | | $ | 1,004.57 | | | $ | 3.89 | | | | 0.77 | % |
Hypothetical (5% return before expenses) | | $ | 1,000.00 | | | $ | 1,021.32 | | | $ | 3.92 | | | | 0.77 | % |
| 1 | Expenses paid is equal to the annualized net expense ratio of each class multiplied by the average account value over the period, multiplied by the number of days in the most recent fiscal half-year divided by the number of days in the fiscal year (to reflect the one-half-year period). |
| | | | | | |
| Portfolio of investments—July 31, 2018 (unaudited) | | Wells Fargo Treasury Plus Money Market Fund | | | 9 | |
| | | | | | | | | | | | | | | | |
| Security name | | Interest rate | | | Maturity date | | | Principal | | | Value | |
| | | | |
Repurchase Agreements ^^: 63.63% | | | | | | | | | | | | | | | | |
Bank of Montreal, dated 7-31-2018, maturity value $100,005,139 (1) | | | 1.85 | % | | | 8-1-2018 | | | $ | 100,000,000 | | | $ | 100,000,000 | |
Barclays Capital Incorporated, dated 7-31-2018, maturity value $950,050,403 (2) | | | 1.91 | | | | 8-1-2018 | | | | 950,000,000 | | | | 950,000,000 | |
BNP Paribas, dated 7-2-2018, maturity value $200,650,000 (3) | | | 1.95 | | | | 8-31-2018 | | | | 200,000,000 | | | | 200,000,000 | |
BNP Paribas, dated 7-31-2018, maturity value $415,022,018 (4) | | | 1.91 | | | | 8-1-2018 | | | | 415,000,000 | | | | 415,000,000 | |
BNP Paribas, dated 7-31-2018, maturity value $75,027,854 (5) | | | 1.91 | | | | 8-7-2018 | | | | 75,000,000 | | | | 75,000,000 | |
Citigroup Global Markets Incorporated, dated 7-26-2018, maturity value $250,092,361 (6) | | | 1.90 | | | | 8-2-2018 | | | | 250,000,000 | | | | 250,000,000 | |
Deutsche Bank Securities, dated 7-31-2018, maturity value $400,021,333 (7) | | | 1.92 | | | | 8-1-2018 | | | | 400,000,000 | | | | 400,000,000 | |
Fixed Income Clearing Corporation, dated 7-31-2018, maturity value $2,000,106,111 (8) | | | 1.91 | | | | 8-1-2018 | | | | 2,000,000,000 | | | | 2,000,000,000 | |
Goldman Sachs & Company, dated 7-31-2018, maturity value $15,000,521 (9) | | | 1.25 | | | | 8-1-2018 | | | | 15,000,000 | | | | 15,000,000 | |
HSBC Securities USA Incorporated, dated 7-31-2018, maturity value $50,002,528 (10) | | | 1.82 | | | | 8-1-2018 | | | | 50,000,000 | | | | 50,000,000 | |
ING Financial Markets LLC, dated 7-31-2018, maturity value $150,008,337 (11) | | | 1.91 | | | | 8-1-2018 | | | | 150,000,379 | | | | 150,000,379 | |
JPMorgan Securities, dated 7-2-2018, maturity value $550,889,167 (12)¢øø§ | | | 1.91 | | | | 8-1-2018 | | | | 550,000,000 | | | | 550,000,000 | |
JPMorgan Securities, dated 7-31-2018, maturity value $1,125,059,688 (13) | | | 1.91 | | | | 8-1-2018 | | | | 1,125,000,000 | | | | 1,125,000,000 | |
Merrill Pierce Fenner Smith Incorporated, dated 7-31-2018, maturity value $180,009,550 (14) | | | 1.91 | | | | 8-1-2018 | | | | 180,000,000 | | | | 180,000,000 | |
MetLife Incorporated, dated 7-31-2018, maturity value $100,007,508 (15) | | | 1.92 | | | | 8-1-2018 | | | | 100,002,175 | | | | 100,002,175 | |
Nomura, dated 7-31-2018, maturity value $200,074,667 (16) | | | 1.92 | | | | 8-7-2018 | | | | 200,000,000 | | | | 200,000,000 | |
Prudential, dated 7-31-2018, maturity value $111,058,236 (17) | | | 1.94 | | | | 8-1-2018 | | | | 111,079,250 | | | | 111,079,250 | |
Prudential, dated 7-31-2018, maturity value $264,601,758 (18) | | | 1.94 | | | | 8-1-2018 | | | | 264,587,500 | | | | 264,587,500 | |
RBC Capital Markets, dated 7-13-2018, maturity value $50,104,000 (19)¢øø§ | | | 1.92 | | | | 8-21-2018 | | | | 50,000,000 | | | | 50,000,000 | |
RBC Dominion Securities Incorporated, dated 7-11-2018, maturity value $300,640,000 (20)¢øø§ | | | 1.92 | | | | 8-20-2018 | | | | 300,000,000 | | | | 300,000,000 | |
RBC Dominion Securities Incorporated, dated 7-31-2018, maturity value $100,005,000 (21) | | | 1.80 | | | | 8-1-2018 | | | | 100,000,000 | | | | 100,000,000 | |
RBC Dominion Securities Incorporated, dated 7-31-2018, maturity value $500,026,528 (22) | | | 1.91 | | | | 8-1-2018 | | | | 500,000,000 | | | | 500,000,000 | |
Royal Bank of Scotland, dated 7-31-2018, maturity value $500,026,528 (23) | | | 1.91 | | | | 8-1-2018 | | | | 500,000,000 | | | | 500,000,000 | |
Societe Generale NY, dated 6-11-2018, maturity value $250,812,500 (24) | | | 1.95 | | | | 8-10-2018 | | | | 250,000,000 | | | | 250,000,000 | |
| | | |
Total Repurchase Agreements (Cost $8,835,669,304) | | | | | | | | | | | | 8,835,669,304 | |
| | | | | | | | | | | | | | | | |
| | | |
Treasury Debt: 39.18% | | | | | | | | | | | | | |
U.S. Treasury Bill (z) | | | 1.78 | | | | 8-30-2018 | | | | 300,000,000 | | | | 299,555,500 | |
U.S. Treasury Bill (z) | | | 1.79 | | | | 8-9-2018 | | | | 260,000,000 | | | | 259,897,527 | |
U.S. Treasury Bill (z) | | | 1.84 | | | | 8-16-2018 | | | | 150,000,000 | | | | 149,885,580 | |
U.S. Treasury Bill (z) | | | 1.85 | | | | 8-23-2018 | | | | 50,000,000 | | | | 49,943,903 | |
U.S. Treasury Bill (z) | | | 1.91 | | | | 9-6-2018 | | | | 80,000,000 | | | | 79,848,100 | |
U.S. Treasury Bill (z) | | | 1.95 | | | | 10-4-2018 | | | | 270,000,000 | | | | 269,070,667 | |
U.S. Treasury Bill (z) | | | 1.96 | | | | 9-20-2018 | | | | 30,000,000 | | | | 29,919,167 | |
U.S. Treasury Bill (z) | | | 1.97 | | | | 10-11-2018 | | | | 119,000,000 | | | | 118,540,797 | |
U.S. Treasury Bill (z) | | | 1.98 | | | | 10-18-2018 | | | | 30,000,000 | | | | 29,872,275 | |
U.S. Treasury Bill (z) | | | 2.01 | | | | 11-8-2018 | | | | 60,000,000 | | | | 59,671,609 | |
U.S. Treasury Bill (z) | | | 2.01 | | | | 11-1-2018 | | | | 40,000,000 | | | | 39,796,680 | |
U.S. Treasury Bill (z) | | | 2.05 | | | | 11-15-2018 | | | | 30,000,000 | | | | 29,820,507 | |
U.S. Treasury Bill (z) | | | 2.05 | | | | 11-29-2018 | | | | 130,000,000 | | | | 129,117,667 | |
U.S. Treasury Bill (z) | | | 2.09 | | | | 12-20-2018 | | | | 60,000,000 | | | | 59,513,550 | |
U.S. Treasury Bill (z) | | | 2.10 | | | | 12-6-2018 | | | | 90,000,000 | | | | 89,340,870 | |
The accompanying notes are an integral part of these financial statements.
| | | | |
| 10 | | Wells Fargo Treasury Plus Money Market Fund | | Portfolio of investments—July 31, 2018 (unaudited) |
| | | | | | | | | | | | | | | | |
| Security name | | Interest rate | | | Maturity date | | | Principal | | | Value | |
| | | |
Treasury Debt (continued) | | | | | | | | | | | | | |
U.S. Treasury Bill (z) | | | 2.10 | % | | | 11-23-2018 | | | $ | 130,000,000 | | | $ | 129,144,208 | |
U.S. Treasury Bill (z) | | | 2.11 | | | | 12-27-2018 | | | | 60,000,000 | | | | 59,485,700 | |
U.S. Treasury Bill (z) | | | 2.12 | | | | 12-13-2018 | | | | 80,000,000 | | | | 79,376,751 | |
U.S. Treasury Bill (z) | | | 2.16 | | | | 1-24-2019 | | | | 30,000,000 | | | | 29,686,867 | |
U.S. Treasury Bill (z) | | | 2.16 | | | | 1-31-2019 | | | | 50,000,000 | | | | 49,454,632 | |
U.S. Treasury Bill (z) | | | 2.17 | | | | 1-17-2019 | | | | 30,000,000 | | | | 29,697,913 | |
U.S. Treasury Note | | | 0.75 | | | | 9-30-2018 | | | | 30,000,000 | | | | 29,953,835 | |
U.S. Treasury Note | | | 0.75 | | | | 10-31-2018 | | | | 30,000,000 | | | | 29,902,338 | |
U.S. Treasury Note | | | 0.75 | | | | 2-15-2019 | | | | 60,000,000 | | | | 59,523,342 | |
U.S. Treasury Note | | | 0.88 | | | | 10-15-2018 | | | | 169,365,000 | | | | 169,078,536 | |
U.S. Treasury Note | | | 1.00 | | | | 11-30-2018 | | | | 30,000,000 | | | | 29,889,455 | |
U.S. Treasury Note | | | 1.00 | | | | 3-15-2019 | | | | 30,000,000 | | | | 29,766,932 | |
U.S. Treasury Note | | | 1.25 | | | | 10-31-2018 | | | | 60,000,000 | | | | 59,929,055 | |
U.S. Treasury Note | | | 1.25 | | | | 11-30-2018 | | | | 46,000,000 | | | | 45,907,185 | |
U.S. Treasury Note | | | 1.38 | | | | 9-30-2018 | | | | 280,000,000 | | | | 279,822,839 | |
U.S. Treasury Note | | | 1.38 | | | | 11-30-2018 | | | | 40,000,000 | | | | 39,947,168 | |
U.S. Treasury Note | | | 1.38 | | | | 2-28-2019 | | | | 50,000,000 | | | | 49,748,089 | |
U.S. Treasury Note | | | 1.50 | | | | 8-31-2018 | | | | 30,000,000 | | | | 29,988,291 | |
U.S. Treasury Note | | | 1.50 | | | | 1-31-2019 | | | | 130,000,000 | | | | 129,549,815 | |
U.S. Treasury Note | | | 1.50 | | | | 2-28-2019 | | | | 40,000,000 | | | | 39,831,591 | |
U.S. Treasury Note | | | 1.63 | | | | 3-31-2019 | | | | 15,000,000 | | | | 14,932,904 | |
U.S. Treasury Note | | | 1.63 | | | | 4-30-2019 | | | | 50,000,000 | | | | 49,734,532 | |
U.S. Treasury Note (U.S. Treasury 3 Month Bill Money Market Yield +0.00%) ± | | | 1.98 | | | | 1-31-2020 | | | | 430,000,000 | | | | 429,843,568 | |
U.S. Treasury Note (U.S. Treasury 3 Month Bill Money Market Yield +0.03%) ± | | | 2.01 | | | | 4-30-2020 | | | | 650,000,000 | | | | 650,001,457 | |
U.S. Treasury Note (U.S. Treasury 3 Month Bill Money Market Yield +0.04%) ± | | | 2.02 | | | | 7-31-2020 | | | | 250,000,000 | | | | 250,014,864 | |
U.S. Treasury Note (U.S. Treasury 3 Month Bill Money Market Yield +0.05%) ± | | | 2.03 | | | | 10-31-2019 | | | | 307,000,000 | | | | 307,058,817 | |
U.S. Treasury Note (U.S. Treasury 3 Month Bill Money Market Yield +0.06%) ± | | | 2.04 | | | | 7-31-2019 | | | | 90,000,000 | | | | 90,003,287 | |
U.S. Treasury Note (U.S. Treasury 3 Month Bill Money Market Yield +0.14%) ± | | | 2.12 | | | | 1-31-2019 | | | | 270,000,000 | | | | 270,017,441 | |
U.S. Treasury Note (U.S. Treasury 3 Month Bill Money Market Yield +0.17%) ± | | | 2.15 | | | | 10-31-2018 | | | | 260,000,000 | | | | 259,996,735 | |
U.S. Treasury Note | | | 2.75 | | | | 2-15-2019 | | | | 25,000,000 | | | | 25,066,234 | |
| | | |
Total Treasury Debt (Cost $5,440,148,780) | | | | | | | | | | | | 5,440,148,780 | |
| | | | | | | | | | | | | |
| | | | | | | | |
| Total investments in securities (Cost $14,275,818,084) | | | 102.81 | % | | | 14,275,818,084 | |
Other assets and liabilities, net | | | (2.81 | ) | | | (389,965,943 | ) |
| | | | | | | | |
| Total net assets | | | 100.00 | % | | $ | 13,885,852,141 | |
| | | | | | | | |
| | (1) | U.S. government securities, 1.88% to 3.13%, 5-15-2019 to 3-31-2023, fair value including accrued interest is $102,000,033. |
| | (2) | U.S. government securities, 0.00% to 6.00%, 11-8-2018 to 8-15-2047, fair value including accrued interest is $969,000,035. |
| | (3) | U.S. government securities, 0.00% to 8.50%, 8-15-2018 to 11-15-2044, fair value including accrued interest is $204,000,000. |
| | (4) | U.S. government securities, 0.00% to 7.50%, 8-15-2018 to 5-15-2047, fair value including accrued interest is $423,300,000. |
| | (5) | U.S. government securities, 0.00% to 7.50%, 8-16-2018 to 12-15-2042, fair value including accrued interest is $76,500,001. |
| | (6) | U.S. government securities, 1.63% to 4.25, 4-30-2019 to 11-15-2040, fair value including accrued interest is $255,000,060. |
| | (7) | U.S. government securities, 0.00% to 4.63%, 8-30-2018 to 5-15-2045, fair value including accrued interest is $408,000,000. |
| | (8) | U.S. government securities, 3.00% to 3.75%, 11-15-2043 to 11-15-2044, fair value including accrued interest is $2,040,001,612. |
| | (9) | U.S. government securities, 0.00% to 3.88%, 8-16-2018 to 2-15-2046, fair value including accrued interest is $15,300,001. |
| | (10) | U.S. government securities, 0.00%, 11-8-2018 to 1-10-2019, fair value is $51,000,004. |
| | (11) | U.S. government securities, 1.88% to 2.00%, 8-31-2022 to 10-31-2022, fair value including accrued interest is $153,061,611. |
| | (12) | U.S. government securities, 1.75% to 4.50%, 4-30-2020 to 5-15-2046, fair value including accrued interest is $561,003,321. |
| | (13) | U.S. government securities, 1.63% to 3.63%, 3-15-2020 to 5-15-2045, fair value including accrued interest is $1,147,508,159. |
The accompanying notes are an integral part of these financial statements.
| | | | | | |
| Portfolio of investments—July 31, 2018 (unaudited) | | Wells Fargo Treasury Plus Money Market Fund | | | 11 | |
| | (14) | U.S. government securities, 2.75%, 2-15-2028, fair value including accrued interest is $183,600,079. |
| | (15) | U.S. government securities, 1.25%, 8-31-2019, fair value including accrued interest is $101,469,623. |
| | (16) | U.S. government securities, 0.00% to 8.13%, 8-15-2018 to 2-15-2048, fair value including accrued interest is $204,000,000. |
| | (17) | U.S. government securities, 0.00% to 3.00%, 4-30-2020 to 8-15-2045, fair value including accrued interest is $113,300,835. |
| | (18) | U.S. government securities, 0.00% to 2.38%, 4-30-2022 to 2-15-2026, fair value including accrued interest is $269,879,250. |
| | (19) | U.S. government securities, 1.38% to 2.75%, 7-15-2019 to 8-15-2042, fair value including accrued interest is $51,000,004. |
| | (20) | U.S. government securities, 0.00% to 2.75%, 4-15-2019 to 2-15-2047, fair value including accrued interest is $306,000,005. |
| | (21) | U.S. government securities, 0.63% to 3.00%, 7-15-2019 to 2-15-2046, fair value including accrued interest is $102,000,079. |
| | (22) | U.S. government securities, 0.00% to 3.76%, 8-15-2018 to 11-15-2047, fair value including accrued interest is $510,000,031. |
| | (23) | U.S. government securities, 0.00% to 6.63%, 8-31-2018 to 8-15-2047, fair value including accrued interest is $510,000,004. |
| | (24) | U.S. government securities, 0.00% to 3.75%, 8-31-2018 to 5-15-2046, fair value including accrued interest is $255,000,061. |
| ¢ | The security represents a long-dated and extendible repurchase agreement which automatically renews on previously set terms. The maturity date represents the next put date. |
| øø | The interest rate is determined and reset by the issuer periodically depending upon the terms of the security. The rate shown is the rate in effect at period end. |
| § | The security is subject to a demand feature which reduces the effective maturity. |
| (z) | Zero coupon security. The rate represents the current yield to maturity. |
| ± | Variable rate investment. The rate shown is the rate in effect at period end. |
The accompanying notes are an integral part of these financial statements.
| | | | |
| 12 | | Wells Fargo Treasury Plus Money Market Fund | | Statement of assets and liabilities—July 31, 2018 (unaudited) |
| | | | |
| | | | |
| |
Assets | | | | |
Investments in repurchase agreements, at amortized cost | | $ | 8,835,669,304 | |
Investments in unaffiliated securities, at amortized cost | | | 5,440,148,780 | |
Cash | | | 6,125,655 | |
Receivable for Fund shares sold | | | 12,708,740 | |
Receivable for interest | | | 6,808,918 | |
Prepaid expenses and other assets | | | 714,498 | |
| | | | |
Total assets | | | 14,302,175,895 | |
| | | | |
| |
Liabilities | | | | |
Payable for investments purchased | | | 398,949,997 | |
Dividends payable | | | 12,749,892 | |
Management fee payable | | | 1,399,425 | |
Administration fees payable | | | 1,205,269 | |
Payable for Fund shares redeemed | | | 855,465 | |
Distribution fee payable | | | 30 | |
Accrued expenses and other liabilities | | | 1,163,676 | |
| | | | |
Total liabilities | | | 416,323,754 | |
| | | | |
Total net assets | | $ | 13,885,852,141 | |
| | | | |
| |
NET ASSETS CONSIST OF | | | | |
Paid-in capital | | $ | 13,886,026,267 | |
Overdistributed net investment income | | | (289,731 | ) |
Accumulated net realized gains on investments | | | 115,605 | |
| | | | |
Total net assets | | $ | 13,885,852,141 | |
| | | | |
| |
COMPUTATION OF NET ASSET VALUE PER SHARE | | | | |
Net assets – Class A | | $ | 1,309,313,901 | |
Shares outstanding – Class A1 | | | 1,309,132,655 | |
Net asset value per share – Class A | | | $1.00 | |
Net assets – Administrator Class | | $ | 33,162,211 | |
Shares outstanding – Administrator Class1 | | | 33,157,315 | |
Net asset value per share – Administrator Class | | | $1.00 | |
Net assets – Institutional Class | | $ | 11,214,007,694 | |
Shares outstanding – Institutional Class1 | | | 11,212,435,558 | |
Net asset value per share – Institutional Class | | | $1.00 | |
Net assets – Service Class | | $ | 1,329,268,247 | |
Shares outstanding – Service Class1 | | | 1,329,082,068 | |
Net asset value per share – Service Class | | | $1.00 | |
Net assets – Sweep Class | | $ | 100,088 | |
Shares outstanding – Sweep Class1 | | | 100,073 | |
Net asset value per share – Sweep Class | | | $1.00 | |
| 1 | The Fund has an unlimited number of authorized shares. |
The accompanying notes are an integral part of these financial statements.
| | | | | | |
| Statement of operations—six months ended July 31, 2018 (unaudited) | | Wells Fargo Treasury Plus Money Market Fund | | | 13 | |
| | | | |
| | | | |
| |
Investment income | | | | |
Interest | | $ | 123,614,619 | |
| | | | |
| |
Expenses | | | | |
Management fee | | | 10,265,040 | |
Administration fees | | | | |
Class A | | | 1,493,955 | |
Administrator Class | | | 68,378 | |
Institutional Class | | | 4,707,721 | |
Service Class | | | 830,224 | |
Sweep Class | | | 14 | |
Shareholder servicing fees | | | | |
Class A | | | 1,697,676 | |
Administrator Class | | | 68,378 | |
Service Class | | | 1,729,633 | |
Sweep Class | | | 125 | |
Distribution fee | | | | |
Sweep Class | | | 174 | |
Custody and accounting fees | | | 227,591 | |
Professional fees | | | 24,578 | |
Registration fees | | | 45,152 | |
Shareholder report expenses | | | 19,410 | |
Trustees’ fees and expenses | | | 8,504 | |
Other fees and expenses | | | 38,217 | |
| | | | |
Total expenses | | | 21,224,770 | |
Less: Fee waivers and/or expense reimbursements | | | (1,962,358 | ) |
| | | | |
Net expenses | | | 19,262,412 | |
| | | | |
Net investment income | | | 104,352,207 | |
| | | | |
Net realized gains on investments | | | 34,317 | |
| | | | |
Net increase in net assets resulting from operations | | $ | 104,386,524 | |
| | | | |
The accompanying notes are an integral part of these financial statements.
| | | | |
| 14 | | Wells Fargo Treasury Plus Money Market Fund | | Statement of changes in net assets |
| | | | | | | | | | | | | | | | |
| | | Six months ended
July 31, 2018
(unaudited) | | | Year ended
January 31, 2018 | |
| | | | |
Operations | | | | | | | | | | | | | | | | |
Net investment income | | | | | | $ | 104,352,207 | | | | | | | $ | 114,264,498 | |
Net realized gains on investments | | | | | | | 34,317 | | | | | | | | 81,289 | |
| | | | |
Net increase in net assets resulting from operations | | | | | | | 104,386,524 | | | | | | | | 114,345,787 | |
| | | | |
| | | | |
Distributions to shareholders from | | | | | | | | | | | | | | | | |
Net investment income | | | | | | | | | | | | | | | | |
Class A | | | | | | | (7,389,549 | ) | | | | | | | (5,757,833 | ) |
Administrator Class | | | | | | | (886,886 | ) | | | | | | | (532,884 | ) |
Institutional Class | | | | | | | (87,512,043 | ) | | | | | | | (100,053,459 | ) |
Service Class | | | | | | | (8,563,272 | ) | | | | | | | (7,920,085 | ) |
Sweep Class | | | | | | | (457 | ) | | | | | | | (237 | ) |
Net realized gains | | | | | | | | | | | | | | | | |
Class A | | | | | | | 0 | | | | | | | | (7,685 | ) |
Administrator Class | | | | | | | 0 | | | | | | | | (158 | ) |
Institutional Class | | | | | | | 0 | | | | | | | | (63,379 | ) |
Service Class | | | | | | | 0 | | | | | | | | (6,202 | ) |
Sweep Class | | | | | | | 0 | | | | | | | | (1 | ) |
| | | | |
Total distributions to shareholders | | | | | | | (104,352,207 | ) | | | | | | | (114,341,923 | ) |
| | | | |
| | | | |
Capital share transactions | | | Shares | | | | | | | | Shares | | | | | |
Proceeds from shares sold | | | | | | | | | | | | | | | | |
Class A | | | 4,823,516,569 | | | | 4,823,516,569 | | | | 9,977,869,822 | | | | 9,977,869,822 | |
Administrator Class | | | 575,432,135 | | | | 575,432,135 | | | | 947,917,891 | | | | 947,917,891 | |
Institutional Class | | | 50,598,733,929 | | | | 50,598,733,929 | | | | 129,675,413,942 | | | | 129,675,413,942 | |
Service Class | | | 3,108,742,318 | | | | 3,108,742,318 | | | | 6,215,918,108 | | | | 6,215,918,108 | |
| | | | |
| | | | | | | 59,106,424,951 | | | | | | | | 146,817,119,763 | |
| | | | |
Reinvestment of distributions | |
Class A | | | 3,445,453 | | | | 3,445,453 | | | | 2,542,405 | | | | 2,542,405 | |
Administrator Class | | | 776,283 | | | | 776,283 | | | | 471,776 | | | | 471,776 | |
Institutional Class | | | 29,973,957 | | | | 29,973,957 | | | | 33,325,578 | | | | 33,325,578 | |
Service Class | | | 2,557,054 | | | | 2,557,054 | | | | 2,548,849 | | | | 2,548,849 | |
Sweep Class | | | 0 | | | | 0 | | | | 68 | | | | 68 | |
| | | | |
| | | | | | | 36,752,747 | | | | | | | | 38,888,676 | |
| | | | |
Payment for shares redeemed | |
Class A | | | (4,809,377,091 | ) | | | (4,809,377,091 | ) | | | (10,434,003,791 | ) | | | (10,434,003,791 | ) |
Administrator Class | | | (685,240,303 | ) | | | (685,240,303 | ) | | | (912,432,946 | ) | | | (912,432,946 | ) |
Institutional Class | | | (52,499,939,645 | ) | | | (52,499,939,645 | ) | | | (128,113,332,177 | ) | | | (128,113,332,177 | ) |
Service Class | | | (3,241,361,757 | ) | | | (3,241,361,757 | ) | | | (6,259,590,464 | ) | | | (6,259,590,464 | ) |
| | | | |
| | | | | | | (61,235,918,796 | ) | | | | | | | (145,719,359,378 | ) |
| | | | |
Net increase (decrease) in net assets resulting from capital share transactions | | | | | | | (2,092,741,098 | ) | | | | | | | 1,136,649,061 | |
| | | | |
Total increase (decrease) in net assets | | | | | | | (2,092,706,781 | ) | | | | | | | 1,136,652,925 | |
| | | | |
| | | | |
Net assets | | | | | | | | | | | | | | | | |
Beginning of period | | | | | | | 15,978,558,922 | | | | | | | | 14,841,905,997 | |
| | | | |
End of period | | | | | | $ | 13,885,852,141 | | | | | | | $ | 15,978,558,922 | |
| | | | |
Overdistributed net investment income | | | | | | $ | (289,731 | ) | | | | | | $ | (289,731 | ) |
| | | | |
The accompanying notes are an integral part of these financial statements.
| | | | | | |
| Financial highlights | | Wells Fargo Treasury Plus Money Market Fund | | | 15 | |
(For a share outstanding throughout each period)
| | | | | | | | | | | | | | | | | | | | | | | | |
| | | Six months ended July 31, 2018 (unaudited) | | | Year ended January 31 | |
| CLASS A | | 2018 | | | 2017 | | | 2016 | | | 2015 | | | 2014 | |
Net asset value, beginning of period | | | $1.00 | | | | $1.00 | | | | $1.00 | | | | $1.00 | | | | $1.00 | | | | $1.00 | |
Net investment income | | | 0.01 | | | | 0.00 | 1 | | | 0.00 | 1 | | | 0.00 | 1 | | | 0.00 | 1 | | | 0.00 | 1 |
Net realized gains (losses) on investments | | | 0.00 | 1 | | | 0.00 | 1 | | | 0.00 | 1 | | | 0.00 | 1 | | | (0.00 | )2 | | | 0.00 | 1 |
| | | | | | | | | | | | | | | | | | | | | | | | |
Total from investment operations | | | 0.01 | | | | 0.00 | 1 | | | 0.00 | 1 | | | 0.00 | 1 | | | 0.00 | 1 | | | 0.00 | 1 |
Distributions to shareholders from | | | | | | | | | | | | | | | | | | | | | | | | |
Net investment income | | | (0.01 | ) | | | (0.00 | )1 | | | (0.00 | )1 | | | (0.00 | )1 | | | (0.00 | )1 | | | (0.00 | )1 |
Net realized gains | | | 0.00 | | | | (0.00 | )1 | | | 0.00 | | | | 0.00 | | | | (0.00 | )1 | | | (0.00 | )1 |
| | | | | | | | | | | | | | | | | | | | | | | | |
Total distributions to shareholders | | | (0.01 | ) | | | (0.00 | )1 | | | (0.00 | )1 | | | (0.00 | )1 | | | (0.00 | )1 | | | (0.00 | )1 |
Net asset value, end of period | | | $1.00 | | | | $1.00 | | | | $1.00 | | | | $1.00 | | | | $1.00 | | | | $1.00 | |
Total return3 | | | 0.54 | % | | | 0.38 | % | | | 0.01 | % | | | 0.01 | % | | | 0.01 | % | | | 0.01 | % |
Ratios to average net assets (annualized) | | | | | | | | | | | | | | | | | | | | | | | | |
Gross expenses | | | 0.62 | % | | | 0.62 | % | | | 0.62 | % | | | 0.62 | % | | | 0.62 | % | | | 0.62 | % |
Net expenses | | | 0.61 | % | | | 0.61 | % | | | 0.39 | % | | | 0.11 | % | | | 0.06 | % | | | 0.06 | % |
Net investment income | | | 1.09 | % | | | 0.38 | % | | | 0.01 | % | | | 0.01 | % | | | 0.01 | % | | | 0.01 | % |
Supplemental data | | | | | | | | | | | | | | | | | | | | | | | | |
Net assets, end of period (000s omitted) | | | $1,309,314 | | | | $1,291,723 | | | | $1,745,419 | | | | $1,956,626 | | | | $1,733,107 | | | | $1,998,010 | |
| 1 | Amount is less than $0.005. |
| 2 | Amount is more than $(0.005). |
| 3 | Returns for periods of less than one year are not annualized. |
The accompanying notes are an integral part of these financial statements.
| | | | |
| 16 | | Wells Fargo Treasury Plus Money Market Fund | | Financial highlights |
(For a share outstanding throughout each period)
| | | | | | | | | | | | | | | | | | | | | | | | |
| | | Six months ended
July 31, 2018 (unaudited) | | | Year ended January 31 | |
| ADMINISTRATOR CLASS | | 2018 | | | 2017 | | | 2016 | | | 2015 | | | 2014 | |
Net asset value, beginning of period | | | $1.00 | | | | $1.00 | | | | $1.00 | | | | $1.00 | | | | $1.00 | | | | $1.00 | |
Net investment income | | | 0.01 | | | | 0.01 | | | | 0.00 | 1 | | | 0.00 | 1 | | | 0.00 | 1 | | | 0.00 | 1 |
Net realized gains (losses) on investments | | | 0.00 | 1 | | | 0.00 | 1 | | | 0.00 | 1 | | | 0.00 | 1 | | | (0.00 | )2 | | | 0.00 | 1 |
| | | | | | | | | | | | | | | | | | | | | | | | |
Total from investment operations | | | 0.01 | | | | 0.01 | | | | 0.00 | 1 | | | 0.00 | 1 | | | 0.00 | 1 | | | 0.00 | 1 |
Distributions to shareholders from | | | | | | | | | | | | | | | | | | | | | | | | |
Net investment income | | | (0.01 | ) | | | (0.01 | ) | | | (0.00 | )1 | | | (0.00 | )1 | | | (0.00 | )1 | | | (0.00 | )1 |
Net realized gains | | | 0.00 | | | | (0.00 | )1 | | | 0.00 | | | | 0.00 | | | | (0.00 | )1 | | | (0.00 | )1 |
| | | | | | | | | | | | | | | | | | | | | | | | |
Total distributions to shareholders | | | (0.01 | ) | | | (0.01 | ) | | | (0.00 | )1 | | | (0.00 | )1 | | | (0.00 | )1 | | | (0.00 | )1 |
Net asset value, end of period | | | $1.00 | | | | $1.00 | | | | $1.00 | | | | $1.00 | | | | $1.00 | | | | $1.00 | |
Total return3 | | | 0.67 | % | | | 0.65 | % | | | 0.06 | % | | | 0.01 | % | | | 0.01 | % | | | 0.01 | % |
Ratios to average net assets (annualized) | | | | | | | | | | | | | | | | | | | | | | | | |
Gross expenses | | | 0.35 | % | | | 0.35 | % | | | 0.34 | % | | | 0.34 | % | | | 0.34 | % | | | 0.34 | % |
Net expenses | | | 0.35 | % | | | 0.35 | % | | | 0.34 | % | | | 0.10 | % | | | 0.06 | % | | | 0.07 | % |
Net investment income | | | 1.30 | % | | | 0.61 | % | | | 0.05 | % | | | 0.01 | % | | | 0.01 | % | | | 0.01 | % |
Supplemental data | | | | | | | | | | | | | | | | | | | | | | | | |
Net assets, end of period (000s omitted) | | | $33,162 | | | | $142,198 | | | | $106,246 | | | | $101,432 | | | | $106,179 | | | | $98,633 | |
| 1 | Amount is less than $0.005. |
| 2 | Amount is more than $(0.005). |
| 3 | Returns for periods of less than one year are not annualized. |
The accompanying notes are an integral part of these financial statements.
| | | | | | |
| Financial highlights | | Wells Fargo Treasury Plus Money Market Fund | | | 17 | |
(For a share outstanding throughout each period)
| | | | | | | | | | | | | | | | | | | | | | | | |
| | | Six months ended
July 31, 2018 (unaudited) | | | Year ended January 31 | |
| INSTITUTIONAL CLASS | | 2018 | | | 2017 | | | 2016 | | | 2015 | | | 2014 | |
Net asset value, beginning of period | | | $1.00 | | | | $1.00 | | | | $1.00 | | | | $1.00 | | | | $1.00 | | | | $1.00 | |
Net investment income | | | 0.01 | | | | 0.01 | | | | 0.00 | 1 | | | 0.00 | 1 | | | 0.00 | 1 | | | 0.00 | 1 |
Net realized gains (losses) on investments | | | 0.00 | 1 | | | 0.00 | 1 | | | 0.00 | 1 | | | 0.00 | 1 | | | (0.00 | )2 | | | 0.00 | 1 |
| | | | | | | | | | | | | | | | | | | | | | | | |
Total from investment operations | | | 0.01 | | | | 0.01 | 1 | | | 0.00 | 1 | | | 0.00 | 1 | | | 0.00 | 1 | | | 0.00 | 1 |
Distributions to shareholders from | | | | | | | | | | | | | | | | | | | | | | | | |
Net investment income | | | (0.01 | ) | | | (0.01 | ) | | | (0.00 | )1 | | | (0.00 | )1 | | | (0.00 | )1 | | | (0.00 | )1 |
Net realized gains | | | 0.00 | | | | (0.00 | )1 | | | 0.00 | | | | 0.00 | | | | (0.00 | )1 | | | (0.00 | )1 |
| | | | | | | | | | | | | | | | | | | | | | | | |
Total distributions to shareholders | | | (0.01 | ) | | | (0.01 | ) | | | (0.00 | )1 | | | (0.00 | )1 | | | (0.00 | )1 | | | (0.00 | )1 |
Net asset value, end of period | | | $1.00 | | | | $1.00 | | | | $1.00 | | | | $1.00 | | | | $1.00 | | | | $1.00 | |
Total return3 | | | 0.74 | % | | | 0.79 | % | | | 0.20 | % | | | 0.02 | % | | | 0.01 | % | | | 0.01 | % |
Ratios to average net assets (annualized) | | | | | | | | | | | | | | | | | | | | | | | | |
Gross expenses | | | 0.23 | % | | | 0.23 | % | | | 0.23 | % | | | 0.23 | % | | | 0.23 | % | | | 0.23 | % |
Net expenses | | | 0.20 | % | | | 0.20 | % | | | 0.20 | % | | | 0.10 | % | | | 0.06 | % | | | 0.06 | % |
Net investment income | | | 1.49 | % | | | 0.81 | % | | | 0.20 | % | | | 0.02 | % | | | 0.01 | % | | | 0.01 | % |
Supplemental data | | | | | | | | | | | | | | | | | | | | | | | | |
Net assets, end of period (000s omitted) | | | $11,214,008 | | | | $13,085,244 | | | | $11,489,674 | | | | $12,617,153 | | | | $11,190,887 | | | | $9,522,210 | |
| 1 | Amount is less than $0.005. |
| 2 | Amount is more than $(0.005). |
| 3 | Returns for periods of less than one year are not annualized. |
The accompanying notes are an integral part of these financial statements.
| | | | |
| 18 | | Wells Fargo Treasury Plus Money Market Fund | | Financial highlights |
(For a share outstanding throughout each period)
| | | | | | | | | | | | | | | | | | | | | | | | |
| | | Six months ended
July 31, 2018 (unaudited) | | | Year ended January 31 | |
| SERVICE CLASS | | 2018 | | | 2017 | | | 2016 | | | 2015 | | | 2014 | |
Net asset value, beginning of period | | | $1.00 | | | | $1.00 | | | | $1.00 | | | | $1.00 | | | | $1.00 | | | | $1.00 | |
Net investment income | | | 0.01 | | | | 0.01 | | | | 0.00 | 1 | | | 0.00 | 1 | | | 0.00 | 1 | | | 0.00 | 1 |
Net realized gains (losses) on investments | | | 0.00 | 1 | | | 0.00 | 1 | | | 0.00 | 1 | | | 0.00 | 1 | | | (0.00 | )2 | | | 0.00 | 1 |
| | | | | | | | | | | | | | | | | | | | | | | | |
Total from investment operations | | | 0.01 | | | | 0.01 | | | | 0.00 | 1 | | | 0.00 | 1 | | | 0.00 | 1 | | | 0.00 | 1 |
Distributions to shareholders from | | | | | | | | | | | | | | | | | | | | | | | | |
Net investment income | | | (0.01 | ) | | | (0.01 | ) | | | (0.00 | )1 | | | (0.00 | )1 | | | (0.00 | )1 | | | (0.00 | )1 |
Net realized gains | | | 0.00 | | | | (0.00 | )1 | | | 0.00 | | | | 0.00 | | | | (0.00 | )1 | | | (0.00 | )1 |
| | | | | | | | | | | | | | | | | | | | | | | | |
Total distributions to shareholders | | | (0.01 | ) | | | (0.01 | ) | | | (0.00 | )1 | | | (0.00 | )1 | | | (0.00 | )1 | | | (0.00 | )1 |
Net asset value, end of period | | | $1.00 | | | | $1.00 | | | | $1.00 | | | | $1.00 | | | | $1.00 | | | | $1.00 | |
Total return3 | | | 0.62 | % | | | 0.54 | % | | | 0.02 | % | | | 0.01 | % | | | 0.01 | % | | | 0.01 | % |
Ratios to average net assets (annualized) | | | | | | | | | | | | | | | | | | | | | | | | |
Gross expenses | | | 0.52 | % | | | 0.52 | % | | | 0.52 | % | | | 0.52 | % | | | 0.52 | % | | | 0.52 | % |
Net expenses | | | 0.45 | % | | | 0.45 | % | | | 0.38 | % | | | 0.11 | % | | | 0.06 | % | | | 0.06 | % |
Net investment income | | | 1.24 | % | | | 0.54 | % | | | 0.03 | % | | | 0.01 | % | | | 0.01 | % | | | 0.01 | % |
Supplemental data | | | | | | | | | | | | | | | | | | | | | | | | |
Net assets, end of period (000s omitted) | | | $1,329,268 | | | | $1,459,295 | | | | $1,500,467 | | | | $1,339,895 | | | | $1,845,375 | | | | $1,589,951 | |
| 1 | Amount is less than $0.005. |
| 2 | Amount is more than $(0.005). |
| 3 | Returns for periods of less than one year are not annualized. |
The accompanying notes are an integral part of these financial statements.
| | | | | | |
| Financial highlights | | Wells Fargo Treasury Plus Money Market Fund | | | 19 | |
(For a share outstanding throughout each period)
| | | | | | | | | | | | | | | | | | | | | | | | |
| | | Six months ended
July 31, 2018 (unaudited) | | | Year ended January 31 | |
| SWEEP CLASS | | 2018 | | | 2017 | | | 2016 | | | 2015 | | | 2014 | |
Net asset value, beginning of period | | | $1.00 | | | | $1.00 | | | | $1.00 | | | | $1.00 | | | | $1.00 | | | | $1.00 | |
Net investment income | | | 0.00 | 1 | | | 0.00 | 1 | | | 0.00 | 1,2 | | | 0.00 | 1 | | | 0.00 | 1 | | | 0.00 | 1 |
Net realized gains (losses) on investments | | | 0.00 | 1 | | | 0.00 | 1 | | | 0.00 | 1 | | | 0.00 | 1 | | | (0.00 | )3 | | | 0.00 | 1 |
| | | | | | | | | | | | | | | | | | | | | | | | |
Total from investment operations | | | 0.00 | 1 | | | 0.00 | 1 | | | 0.00 | 1 | | | 0.00 | 1 | | | 0.00 | 1 | | | 0.00 | 1 |
Distributions to shareholders from | | | | | | | | | | | | | | | | | | | | | | | | |
Net investment income | | | (0.00 | )1 | | | (0.00 | )1 | | | (0.00 | )1 | | | (0.00 | )1 | | | (0.00 | )1 | | | (0.00 | )1 |
Net realized gains | | | 0.00 | | | | (0.00 | )1 | | | 0.00 | | | | 0.00 | | | | (0.00 | )1 | | | (0.00 | )1 |
| | | | | | | | | | | | | | | | | | | | | | | | |
Total distributions to shareholders | | | (0.00 | )1 | | | (0.00 | )1 | | | (0.00 | )1 | | | (0.00 | )1 | | | (0.00 | )1 | | | (0.00 | )1 |
Net asset value, end of period | | | $1.00 | | | | $1.00 | | | | $1.00 | | | | $1.00 | | | | $1.00 | | | | $1.00 | |
Total return4 | | | 0.46 | % | | | 0.24 | % | | | 0.01 | % | | | 0.01 | % | | | 0.01 | % | | | 0.01 | % |
Ratios to average net assets (annualized) | | | | | | | | | | | | | | | | | | | | | | | | |
Gross expenses | | | 0.77 | % | | | 0.77 | % | | | 0.96 | % | | | 0.97 | % | | | 0.97 | % | | | 0.97 | % |
Net expenses | | | 0.77 | % | | | 0.75 | % | | | 0.34 | % | | | 0.11 | % | | | 0.06 | % | | | 0.06 | % |
Net investment income | | | 0.92 | % | | | 0.24 | % | | | 0.01 | % | | | 0.01 | % | | | 0.01 | % | | | 0.01 | % |
Supplemental data | | | | | | | | | | | | | | | | | | | | | | | | |
Net assets, end of period (000s omitted) | | | $100 | | | | $100 | | | | $100 | | | | $3,145 | | | | $3,054 | | | | $20,122 | |
| 1 | Amount is less than $0.005. |
| 2 | Calculated based upon average shares outstanding |
| 3 | Amount is more than $(0.005). |
| 4 | Returns for periods of less than one year are not annualized. |
The accompanying notes are an integral part of these financial statements.
| | | | |
| 20 | | Wells Fargo Treasury Plus Money Market Fund | | Notes to financial statements (unaudited) |
1. ORGANIZATION
Wells Fargo Funds Trust (the “Trust”), a Delaware statutory trust organized on March 10, 1999, is an open-end management investment company registered under the Investment Company Act of 1940, as amended (the “1940 Act”). As an investment company, the Trust follows the accounting and reporting guidance in Financial Accounting Standards Board Accounting Standards Codification Topic 946, Financial Services – Investment Companies. These financial statements report on the Wells Fargo Treasury Plus Money Market Fund (the “Fund”) which is a diversified series of the Trust.
2. SIGNIFICANT ACCOUNTING POLICIES
The following significant accounting policies, which are consistently followed in the preparation of the financial statements of the Fund, are in conformity with U.S. generally accepted accounting principles which require management to make estimates and assumptions that affect the reported amounts of assets and liabilities, disclosure of contingent assets and liabilities at the date of the financial statements, and the reported amounts of revenues and expenses during the reporting period. Actual results could differ from those estimates.
Securities valuation
As permitted under Rule 2a-7 of the 1940 Act, portfolio securities are valued at amortized cost, which approximates fair value. The amortized cost method involves valuing a security at its cost, plus accretion of discount or minus amortization of premium over the period until maturity.
Investments which are not valued using the method discussed above are valued at their fair value, as determined in good faith by the Board of Trustees of the Fund. The Board of Trustees has established a Valuation Committee comprised of the Trustees and has delegated to it the authority to take any actions regarding the valuation of portfolio securities that the Valuation Committee deems necessary or appropriate, including determining the fair value of portfolio securities, unless the determination has been delegated to the Wells Fargo Asset Management Pricing Committee at Wells Fargo Funds Management, LLC (“Funds Management”). The Board of Trustees retains the authority to make or ratify any valuation decisions or approve any changes to the Valuation Procedures as it deems appropriate. On a quarterly basis, the Board of Trustees receives reports on any valuation actions taken by the Valuation Committee or the Wells Fargo Asset Management Pricing Committee which may include items for ratification.
Valuations of fair valued securities are compared to the next actual sales price when available, or other appropriate market values, to assess the continued appropriateness of the fair valuation methodologies used. These securities are fair valued on a day-to-day basis, taking into consideration changes to appropriate market information and any significant changes to the inputs considered in the valuation process until there is a readily available price provided on an exchange or by an independent pricing service. Valuations received from an independent pricing service or independent broker-dealer quotes are periodically validated by comparisons to most recent trades and valuations provided by other independent pricing services in addition to the review of prices by the manager and/or subadviser. Unobservable inputs used in determining fair valuations are identified based on the type of security, taking into consideration factors utilized by market participants in valuing the investment, knowledge about the issuer and the current market environment.
Repurchase agreements
The Fund may invest in repurchase agreements and may participate in pooled repurchase agreement transactions with other funds advised by Funds Management. Repurchase agreements are agreements where the seller of a security to the Fund agrees to repurchase that security from the Fund at a mutually agreed upon time and price. The repurchase agreements must be fully collateralized based on values that are marked-to-market daily. The collateral may be held by an agent bank under a tri-party agreement. It is the custodian’s responsibility to value collateral daily and to take action to obtain additional collateral as necessary to maintain a market value equal to or greater than the resale price. The repurchase agreements are collateralized by U.S. government securities. There could be potential loss to the Fund in the event that the Fund is delayed or prevented from exercising its rights to dispose of the collateral, including the risk of a possible decline in the value of the underlying obligations during the period in which the Fund seeks to assert its rights.
When-issued transactions
The Fund may purchase securities on a forward commitment or when-issued basis. The Fund records a when-issued transaction on the trade date and will segregate assets in an amount at least equal in value to the Fund’s commitment to purchase when-issued securities. Securities purchased on a when-issued basis are marked-to-market daily and the Fund begins earning interest on the settlement date. Losses may arise due to changes in the market value of the underlying securities or if the counterparty does not perform under the contract.
| | | | | | |
| Notes to financial statements (unaudited) | | Wells Fargo Treasury Plus Money Market Fund | | | 21 | |
Security transactions and income recognition
Securities transactions are recorded on a trade date basis. Realized gains or losses are recorded on the basis of identified cost.
Interest income is accrued daily and bond discounts are accreted and premiums are amortized daily.To the extent debt obligations are placed on non-accrual status, any related interest income may be reduced by writing off interest receivables when the collection of all or a portion of interest has been determined to be doubtful based on consistently applied procedures and the fair value has decreased. If the issuer subsequently resumes interest payments or when the collectability of interest is reasonably assured, the debt obligation is removed from non-accrual status.
Distributions to shareholders
Distributions to shareholders from net investment income are declared daily and paid monthly. Distributions from net realized gains, if any, are recorded on the ex-dividend date and paid at least annually. Such distributions are determined in accordance with income tax regulations and may differ from U.S. generally accepted accounting principles. Dividend sources are estimated at the time of declaration. The tax character of distributions is determined as of the Fund’s fiscal year end. Therefore, a portion of the Fund’s distributions made prior to the Fund’s fiscal year end may be categorized as a tax return of capital at year end.
Federal and other taxes
The Fund intends to continue to qualify as a regulated investment company by distributing substantially all of its investment company taxable income and any net realized capital gains (after reduction for capital loss carryforwards) sufficient to relieve it from all, or substantially all, federal income taxes. Accordingly, no provision for federal income taxes was required.
The Fund’s income and federal excise tax returns and all financial records supporting those returns for the prior three fiscal years are subject to examination by the federal and Delaware revenue authorities. Management has analyzed the Fund’s tax positions taken on federal, state, and foreign tax returns for all open tax years and does not believe that there are any uncertain tax positions that require recognition of a tax liability.
As of July 31, 2018, the cost of investments for federal income tax purposes is substantially the same as for financial reporting purposes.
Class allocations
The separate classes of shares offered by the Fund differ principally distribution, shareholder servicing, and administration fees. Class specific expenses are charged directly to that share class. Investment income, common expenses, and realized gains (losses) on investments are allocated daily to each class of shares based on the relative proportion of net assets of each class.
3. FAIR VALUATION MEASUREMENTS
Fair value measurements of investments are determined within a framework that has established a fair value hierarchy based upon the various data inputs utilized in determining the value of the Fund’s investments. The three-level hierarchy gives the highest priority to unadjusted quoted prices in active markets for identical assets or liabilities (Level 1) and the lowest priority to unobservable inputs (Level 3). The Fund’s investments are classified within the fair value hierarchy based on the lowest level of input that is significant to the fair value measurement. The inputs are summarized into three broad levels as follows:
| ∎ | | Level 1 – quoted prices in active markets for identical securities |
| ∎ | | Level 2 – other significant observable inputs (including quoted prices for similar securities, interest rates, prepayment speeds, credit risk, etc.) |
| ∎ | | Level 3 – significant unobservable inputs (including the Fund’s own assumptions in determining the fair value of investments) |
The inputs or methodologies used for valuing investments in securities are not necessarily an indication of the risk associated with investing in those securities.
| | | | |
| 22 | | Wells Fargo Treasury Plus Money Market Fund | | Notes to financial statements (unaudited) |
The following is a summary of the inputs used in valuing the Fund’s assets and liabilities as of July 31, 2018:
| | | | | | | | | | | | | | | | |
| | | Quoted prices
(Level 1) | | | Other significant
observable inputs
(Level 2) | | | Significant
unobservable inputs (Level 3) | | | Total | |
Assets | | | | | | | | | | | | | | | | |
Investments In: | | | | | | | | | | | | | | | | |
| | | | |
Repurchase agreements | | $ | 0 | | | $ | 8,835,669,304 | | | $ | 0 | | | $ | 8,835,669,304 | |
Treasury debt | | | 0 | | | | 5,440,148,780 | | | | 0 | | | | 5,440,148,780 | |
Total assets | | $ | 0 | | | $ | 14,275,818,084 | | | $ | 0 | | | $ | 14,275,818,084 | |
The Fund recognizes transfers between levels within the fair value hierarchy at the end of the reporting period. At July 31, 2018, the Fund did not have any transfers into/out of Level 1, Level 2, or Level 3.
4. TRANSACTIONS WITH AFFILIATES
Management fee
Funds Management, an indirect wholly owned subsidiary of Wells Fargo & Company (“Wells Fargo”), is the manager of the Fund and provides advisory and fund-level administrative services under an investment management agreement. Under the investment management agreement, Funds Management is responsible for, among other services, implementing the investment objectives and strategies of the Fund, supervising the subadviser and providing fund-level administrative services in connection with the Fund’s operations. As compensation for its services under the investment management agreement, Funds Management is entitled to receive an annual management fee starting at 0.15% and declining to 0.13% as the average daily net assets of the Fund increase. For the six months ended July 31, 2018, the management fee was equivalent to an annual rate of 0.14% of the Fund’s average daily net assets.
Funds Management has retained the services of a subadviser to provide daily portfolio management to the Fund. The fee for subadvisory services is borne by Funds Management. Wells Capital Management Incorporated, an affiliate of Funds Management and an indirect wholly owned subsidiary of Wells Fargo, is the subadviser to the Fund and is entitled to receive a fee from Funds Management at an annual rate starting at 0.05% and declining to 0.01% as the average daily net assets of the Fund increase.
Administration fees
Under a class-level administration agreement, Funds Management provides class-level administrative services to the Fund, which includes paying fees and expenses for services provided by the transfer agent, sub-transfer agents, omnibus account servicers and record-keepers. As compensation for its services under the class-level administration agreement, Funds Management receives an annual fee which is calculated based on the average daily net assets of each class as follows:
| | | | |
| | | Class-level
administration fee | |
Class A | | | 0.22 | % |
Administrator Class | | | 0.10 | |
Institutional Class | | | 0.08 | |
Service Class | | | 0.12 | |
Sweep Class | | | 0.03 | |
Funds Management has contractually waived and/or reimbursed management and administration fees to the extent necessary to maintain certain net operating expense ratios for the Fund. When each class of the Fund has exceeded its expense cap, Funds Management has waived fees and/or reimbursed expenses from fund level expenses on a proportionate basis and then from class specific expenses; otherwise, waivers and/or reimbursements are applied against class specific expenses before fund level expenses. Funds Management has committed through May 31, 2019 to waive fees and/or reimburse expenses to the extent necessary to cap the Fund’s expenses at 0.60% for Class A shares, 0.35% for Administrator Class shares, 0.20% for Institutional Class shares, 0.45% for Service Class shares, and 0.83% for Sweep Class shares. After this time, the cap may be increased or the commitment to maintain the cap may be terminated only with the approval of the Board of Trustees. Prior to June 1, 2018, the Fund’s expenses were capped at 0.65% for Class A shares.
| | | | | | |
| Notes to financial statements (unaudited) | | Wells Fargo Treasury Plus Money Market Fund | | | 23 | |
Distribution fee
The Trust has adopted a distribution plan for Sweep Class shares of the Fund pursuant to Rule 12b-1 under the 1940 Act. A distribution fee is charged to Sweep Class shares and paid to Wells Fargo Funds Distributor, LLC, the principal underwriter, at an annual rate of 0.35% of the average daily net assets of Sweep Class shares.
Shareholder servicing fees
The Trust has entered into contracts with one or more shareholder servicing agents, whereby Class A, Service Class, and Sweep Class of the Fund are charged a fee at an annual rate of 0.25% of the respective average daily net assets of each class. Administrator Class is charged a fee at an annual rate of 0.10% of its average daily net assets.
A portion of these total shareholder servicing fees were paid to affiliates of Wells Fargo.
Interfund transactions
The Fund may purchase or sell portfolio investment securities to certain other Wells Fargo affiliates pursuant to Rule 17a-7 under the 1940 Act and under procedures adopted by the Board of Trustees. The procedures have been designed to ensure that these interfund transactions, which do not incur broker commissions, are effected at current market prices.
5. INDEMNIFICATION
Under the Trust’s organizational documents, the officers and Trustees have been granted certain indemnification rights against certain liabilities that may arise out of performance of their duties to the Trust. Additionally, in the normal course of business, the Trust may enter into contracts with service providers that contain a variety of indemnification clauses. The Trust’s maximum exposure under these arrangements is dependent on future claims that may be made against the Fund and, therefore, cannot be estimated.
| | | | |
| 24 | | Wells Fargo Treasury Plus Money Market Fund | | Other information (unaudited) |
PROXY VOTING INFORMATION
A description of the policies and procedures that the Fund uses to determine how to vote proxies relating to portfolio securities is available, upon request, by calling 1-800-222-8222, visiting our website at wellsfargofunds.com, or visiting the SEC website at sec.gov. Information regarding how the Fund voted proxies relating to portfolio securities during the most recent 12-month period ended June 30 is available on the Fund’s website at wellsfargofunds.com or by visiting the SEC website at sec.gov.
PORTFOLIO HOLDINGS INFORMATION
The complete portfolio holdings for the Fund are publicly available on the Fund’s website (wellsfargofunds.com) on a 1-day delayed basis. The Fund files its complete schedule of portfolio holdings with the SEC for the first and third quarters of each fiscal year on Form N-Q, which is available by visiting the SEC website at sec.gov. In addition, the Fund’s Form N-Q may be reviewed and copied at the SEC’s Public Reference Room in Washington, DC, and at regional offices in New York City, at 233 Broadway, and in Chicago, at 175 West Jackson Boulevard, Suite 900. Information about the Public Reference Room may be obtained by calling 1-800-SEC-0330.
| | | | | | |
| Other information (unaudited) | | Wells Fargo Treasury Plus Money Market Fund | | | 25 | |
BOARD OF TRUSTEES AND OFFICERS
Each of the Trustees and Officers1 listed in the table below acts in identical capacities for each fund in the Wells Fargo family of funds, which consists of 154 mutual funds comprising the Wells Fargo Funds Trust, Wells Fargo Variable Trust, Wells Fargo Master Trust and four closed-end funds (collectively the “Fund Complex”). This table should be read in conjunction with the Prospectus and the Statement of Additional Information2. The mailing address of each Trustee and Officer is 525 Market Street, 12th Floor, San Francisco, CA 94105. Each Trustee and Officer serves an indefinite term, however, each Trustee serves such term until reaching the mandatory retirement age established by the Trustees.
Independent Trustees
| | | | | | |
Name and
year of birth | | Position held and
length of service* | | Principal occupations during past five years or longer | | Current other
public company or
investment company
directorships |
William R. Ebsworth (Born 1957) | | Trustee, since 2015 | | Retired. From 1984 to 2013, equities analyst, portfolio manager, research director and chief investment officer at Fidelity Management and Research Company in Boston, Tokyo, and Hong Kong, and retired in 2013 as Chief Investment Officer of Fidelity Strategic Advisers, Inc. where he led a team of investment professionals managing client assets. Prior thereto, Board member of Hong Kong Securities Clearing Co., Hong Kong Options Clearing Corp., the Thailand International Fund, Ltd., Fidelity Investments Life Insurance Company, and Empire Fidelity Investments Life Insurance Company. Board member of the Forté Foundation (non-profit organization) and the Vincent Memorial Hospital Endowment (non-profit organization), where he serves on the Investment Committee and as a Chair of the Audit Committee. Mr. Ebsworth is a CFA® charterholder. | | Asset Allocation Trust |
Jane A. Freeman (Born 1953) | | Trustee, since 2015; Chair Liaison, since 2018 | | Retired. From 2012 to 2014 and 1999 to 2008, Chief Financial Officer of Scientific Learning Corporation. From 2008 to 2012, Ms. Freeman provided consulting services related to strategic business projects. Prior to 1999, Portfolio Manager at Rockefeller & Co. and Scudder, Stevens & Clark. Board member of the Harding Loevner Funds from 1996 to 2014, serving as both Lead Independent Director and chair of the Audit Committee. Board member of the Russell Exchange Traded Funds Trust from 2011 to 2012 and the chair of the Audit Committee. Ms. Freeman is a Board Member of Ruth Bancroft Garden (non-profit organization) and the Glimmerglass Festival. She is also an inactive Chartered Financial Analyst. | | Asset Allocation Trust |
Isaiah Harris, Jr. (Born 1952) | | Trustee, since 2009 | | Retired. Chairman of the Board of CIGNA Corporation since 2009, and Director since 2005. From 2003 to 2011, Director of Deluxe Corporation. Prior thereto, President and CEO of BellSouth Advertising and Publishing Corp. from 2005 to 2007, President and CEO of BellSouth Enterprises from 2004 to 2005 and President of BellSouth Consumer Services from 2000 to 2003. Emeritus member of the Iowa State University Foundation Board of Governors. Emeritus Member of the Advisory Board of Iowa State University School of Business. Advisory Board Member, Palm Harbor Academy (charter school). Advisory Board Member, Child Evangelism Fellowship (non-profit). Mr. Harris is a certified public accountant (inactive status). | | CIGNA Corporation; Asset Allocation Trust |
Judith M. Johnson
(Born 1949) | | Trustee, since 2008; Audit Committee Chairman, since 2009 | | Retired. Prior thereto, Chief Executive Officer and Chief Investment Officer of Minneapolis Employees Retirement Fund from 1996 to 2008. Ms. Johnson is an attorney, certified public accountant and a certified managerial accountant. | | Asset Allocation Trust |
David F. Larcker (Born 1950) | | Trustee, since 2009 | | James Irvin Miller Professor of Accounting at the Graduate School of Business, Stanford University, Director of the Corporate Governance Research Initiative and Senior Faculty of The Rock Center for Corporate Governance since 2006. From 2005 to 2008, Professor of Accounting at the Graduate School of Business, Stanford University. Prior thereto, Ernst & Young Professor of Accounting at The Wharton School, University of Pennsylvania from 1985 to 2005. | | Asset Allocation Trust |
| | | | |
| 26 | | Wells Fargo Treasury Plus Money Market Fund | | Other information (unaudited) |
| | | | | | |
Name and
year of birth | | Position held and
length of service* | | Principal occupations during past five years or longer | | Current other
public company or
investment company
directorships |
Olivia S. Mitchell (Born 1953) | | Trustee, since 2006; Governance Committee Chairman, since 2018 | | International Foundation of Employee Benefit Plans Professor, Wharton School of the University of Pennsylvania since 1993. Director of Wharton’s Pension Research Council and Boettner Center on Pensions & Retirement Research, and Research Associate at the National Bureau of Economic Research. Previously, Cornell University Professor from 1978 to 1993. | | Asset Allocation Trust |
Timothy J. Penny (Born 1951) | | Trustee, since 1996; Chairman, since 2018; Vice Chairman, from 2017 to 2018 | | President and Chief Executive Officer of Southern Minnesota Initiative Foundation, a non-profit organization, since 2007. Member of the Board of Trustees of NorthStar Education Finance, Inc., a non-profit organization, since 2007. | | Asset Allocation Trust |
James G. Polisson (Born 1959) | | Trustee, since 2018; Advisory Board Member, from 2017 to 2018 | | Retired. Chief Marketing Officer, Source (ETF) UK Services, Ltd, from 2015 to 2017. From 2012 to 2015, Principal of The Polisson Group, LLC, a management consulting, corporate advisory and principal investing company. Chief Executive Officer and Managing Director at Russell Investments, Global Exchange Traded Funds from 2010 to 2012. Managing Director of Barclays Global Investors from 1998 to 2010 and Global Chief Marketing Officer for iShares and Barclays Global Investors from 2000 to 2010. Trustee of the San Francisco Mechanics’ Institute, a non-profit organization, from 2013 to 2015. Board member of the Russell Exchange Traded Fund Trust from 2011 to 2012. Director of Barclays Global Investors Holdings Deutschland GmbH from 2006 to 2009. Mr. Polisson is an attorney and has a retired status with the Massachusetts and District of Columbia Bar Associations. | | Asset Allocation Trust |
Michael S. Scofield (Born 1943) | | Trustee, since 2010 | | Served on the Investment Company Institute’s Board of Governors and Executive Committee from 2008-2011 as well the Governing Council of the Independent Directors Council from 2006-2011 and the Independent Directors Council Executive Committee from 2008-2011. Trustee of the Evergreen Fund complex (and its predecessors) from 1984 to 2010. Chairman of the Evergreen Funds from 2000-2010. Former Trustee of the Mentor Funds. Retired Attorney, Law Offices of Michael S. Scofield. | | Asset Allocation Trust |
Pamela Wheelock (Born 1959) | | Trustee, since 2018; Advisory Board Member, from 2017 to 2018 | | Chief Operating Officer, Twin Cities Habitat for Humanity, since January, 2017. Vice President of University Services, University of Minnesota from 2012 to 2017. Prior thereto, on the Board of Directors, Goverance Committee and Finance Committee for the Minnesota Philanthropy Partners (Saint Paul Foundation) from 2012 to 2018, Interim President and Chief Executive Officer of Blue Cross Blue shield of Minnesota of Minnesota from 2010 to 2011, Chairman of the Board from 2009 to 2011 and Board Director 003 to 2015. Vice President, Leadership and Community Engagement, Bush Foundation, Saint Paul, Minnesota (a private foundation) from 2009 to 2011. Executive Vice President and Chief Financial Officer, Minnesota Sports and Entertainment from 2004 to 2009 and Senior Vice President from 2002 to 2004. Commissioner of Finance, State of Minnesota, from 1999 to 2002. Currently the Board Chair of the Minnesota Wild Foundation since 2010. | | Asset Allocation Trust |
| * | Length of service dates reflect the Trustee’s commencement of service with the Trust’s predecessor entities, where applicable. |
| | | | | | |
| Other information (unaudited) | | Wells Fargo Treasury Plus Money Market Fund | | | 27 | |
Officers
| | | | | | |
Name and
year of birth | | Position held and
length of service | | Principal occupations during past five years or longer | | |
Andrew Owen (Born 1960) | | President, since 2017 | | Executive Vice President of Wells Fargo & Company and Head of Affiliated Managers, Wells Fargo Asset Management, since 2014. In addition, Mr. Owen is currently President, Chief Executive Officer and Director of Wells Fargo Funds Management, LLC since 2017. Prior thereto, Executive Vice President responsible for marketing, investments and product development for Wells Fargo Funds Management, LLC, from 2009 to 2014. | | |
Nancy Wiser1 (Born 1967) | | Treasurer, since 2012 | | Executive Vice President of Wells Fargo Funds Management, LLC since 2011. Chief Operating Officer and Chief Compliance Officer at LightBox Capital Management LLC, from 2008 to 2011. | | |
Alexander Kymn3 (Born 1973) | | Secretary, since 2018; Chief Legal Officer, since 2018 | | Senior Company Counsel of Wells Fargo Bank, N.A. since 2018 (previously Senior Counsel from 2007 to 2018). Vice President of Wells Fargo Funds Management, LLC from 2008 to 2014. | | |
Michael H. Whitaker (Born 1967) | | Chief Compliance Officer, since 2016 | | Senior Vice President and Chief Compliance Officer since 2016. Senior Vice President and Chief Compliance Officer for Fidelity Investments from 2007 to 2016. | | |
David Berardi (Born 1975) | | Assistant Treasurer, since 2009 | | Vice President of Wells Fargo Funds Management, LLC since 2009. Vice President of Evergreen Investment Management Company, LLC from 2008 to 2010. Manager of Fund Reporting and Control for Evergreen Investment Management Company, LLC from 2004 to 2010. | | |
Jeremy DePalma1 (Born 1974) | | Assistant Treasurer, since 2009 | | Senior Vice President of Wells Fargo Funds Management, LLC since 2009. Senior Vice President of Evergreen Investment Management Company, LLC from 2008 to 2010 and head of the Fund Reporting and Control Team within Fund Administration from 2005 to 2010. | | |
| 1 | Nancy Wiser acts as Treasurer of 77 funds in the Fund Complex. Jeremy DePalma acts as Treasurer of 77 funds and Assistant Treasurer of 77 funds in the Fund Complex. |
| 2 | The Statement of Additional Information includes additional information about the Trustees and is available, without charge, upon request, by calling 1-800-222-8222 or by visiting the website at wellsfargofunds.com. |
| 3 | Alexander Kymn became the Secretary and Chief Legal Officer effective April 17, 2018. |
| | | | |
| 28 | | Wells Fargo Treasury Plus Money Market Fund | | Other information (unaudited) |
BOARD CONSIDERATION OF INVESTMENT MANAGEMENT AND SUB-ADVISORY AGREEMENTS:
Wells Fargo Treasury Plus Money Market Fund
Under the Investment Company Act of 1940 (the “1940 Act”), the Board of Trustees (the “Board”) of Wells Fargo Funds Trust (the “Trust”) must determine annually whether to approve the continuation of the Trust’s investment management and sub-advisory agreements. In this regard, at an in-person meeting held on May 22-23, 2018 (the “Meeting”), the Board, all the members of which have no direct or indirect interest in the investment management and sub-advisory agreements and are not “interested persons” of the Trust, as defined in the 1940 Act (the “Independent Trustees”), reviewed and approved for Wells Fargo Treasury Plus Money Market Fund (the “Fund”): (i) an investment management agreement (the “Management Agreement”) with Wells Fargo Funds Management, LLC (“Funds Management”); and (ii) an investment sub-advisory agreement (the “Sub-Advisory Agreement”) with Wells Capital Management Incorporated (the “Sub-Adviser”), an affiliate of Funds Management. The Management Agreement and the Sub-Advisory Agreement are collectively referred to as the “Advisory Agreements.”
At the Meeting, the Board considered the factors and reached the conclusions described below relating to the selection of Funds Management and the Sub-Adviser and the approval of the Advisory Agreements. Prior to the Meeting, including at an in-person meeting in April 2018, the Trustees conferred extensively among themselves and with representatives of Funds Management about these matters. Also, the Board has adopted a team-based approach, with each team consisting of a sub-set of Trustees, to assist the full Board in the discharge of its duties in reviewing investment performance and other matters throughout the year. The Independent Trustees were assisted in their evaluation of the Advisory Agreements by independent legal counsel, from whom they received separate legal advice and with whom they met separately.
In providing information to the Board, Funds Management and the Sub-Adviser were guided by a detailed set of requests for information submitted to them by independent legal counsel on behalf of the Independent Trustees at the start of the Board’s annual contract renewal process earlier in 2018. In considering and approving the Advisory Agreements, the Trustees considered the information they believed relevant, including but not limited to the information discussed below. The Board considered not only the specific information presented in connection with the Meeting, but also the knowledge gained over time through interaction with Funds Management and the Sub-Adviser about various topics. In this regard, the Board reviewed reports of Funds Management at each of its quarterly meetings, which included, among other things, portfolio reviews and investment performance reports. In addition, the Board and the teams mentioned above confer with portfolio managers at various times throughout the year. The Board did not identify any particular information or consideration that was all-important or controlling, and each individual Trustee may have attributed different weights to various factors.
After its deliberations, the Board unanimously approved the continuation of the Advisory Agreements for a one-year term and determined that the compensation payable to Funds Management and the Sub-Adviser under each of the Advisory Agreements was reasonable. The Board considered the approval of the Advisory Agreements for the Fund as part of its consideration of agreements for funds across the complex, but its approvals were made on a fund-by-fund basis. The following summarizes a number of important, but not necessarily all, factors considered by the Board in support of its approvals.
Nature, extent and quality of services
The Board received and considered various information regarding the nature, extent and quality of services provided to the Fund by Funds Management and the Sub-Adviser under the Advisory Agreements. This information included a description of the investment advisory services and Fund-level administrative services covered by the Management Agreement, as well as, among other things, a summary of the background and experience of senior management of Wells Fargo Asset Management (“WFAM”), of which Funds Management and the Sub-Adviser are a part, a summary of investments made in the business of WFAM, a summary of certain organizational and personnel changes involving Funds Management and the Sub-Adviser, and a description of Funds Management’s and the Sub-Adviser’s business continuity planning programs and of their approaches to data privacy and cybersecurity. The Board also considered the qualifications, background, tenure and responsibilities of each of the portfolio managers primarily responsible for the day-to-day portfolio management of the Fund.
The Board evaluated the ability of Funds Management and the Sub-Adviser to attract and retain qualified investment professionals, including research, advisory and supervisory personnel. The Board further considered the compliance programs and compliance records of Funds Management and the Sub-Adviser. In addition, the Board took into account the full range of services provided to the Fund by Funds Management and its affiliates.
| | | | | | |
| Other information (unaudited) | | Wells Fargo Treasury Plus Money Market Fund | | | 29 | |
Fund investment performance and expenses
The Board considered the investment performance results for the Fund over various time periods ended December 31, 2017. The Board considered these results in comparison to the investment performance of funds in a universe that was determined by Broadridge Inc. (“Broadridge”) to be similar to the Fund (the “Universe”), and in comparison to the Fund’s benchmark index and to other comparative data. Broadridge is an independent provider of investment company data. The Board received a description of the methodology used by Broadridge to select the mutual funds in the performance Universe. The Board noted that the investment performance of the Fund (Institutional Class) was higher than the average investment performance of the Universe for all periods under review. The Board also noted that the investment performance of the Fund was higher than its benchmark index, the Lipper U.S. Treasury Money Market Funds Index, for all periods under review.
The Board also received and considered information regarding the Fund’s net operating expense ratios and their various components, including actual management fees, custodian and other non-management fees, and Rule 12b-1 and non-Rule 12b-1 shareholder service fees. The Board considered these ratios in comparison to the median ratios of funds in class-specific expense groups that were determined by Broadridge to be similar to the Fund (the “Groups”). The Board received a description of the methodology used by Broadridge to select the mutual funds in the expense Groups and an explanation of how funds comprising expense groups and their expense ratios may vary from year-to-year. Based on the Broadridge reports, the Board noted that the net operating expense ratios of the Fund were in range of than the median net operating expense ratios of the expense Groups for Service Class, Institutional Class, and Administrator Class, but higher than the median net operating expense ratios of the expense Groups for the Class A and Sweep Class. The Board noted that the net operating expense ratio caps for Class A would be reduced.
The Board took into account the Fund’s investment performance and expense information provided to it among the factors considered in deciding to re-approve the Advisory Agreements.
Investment management and sub-advisory fee rates
The Board reviewed and considered the contractual fee rates payable by the Fund to Funds Management under the Management Agreement, as well as the contractual fee rates payable by the Fund to Funds Management for class-level administrative services under a Class-Level Administration Agreement, which include, among other things, class-level transfer agency and sub-transfer agency costs (collectively, the “Management Rates”). The Board also reviewed and considered the contractual investment sub-advisory fee rates that are payable by Funds Management to the Sub-Adviser for investment sub-advisory services.
Among other information reviewed by the Board was a comparison of the Fund’s Management Rates with the average contractual investment management fee rates of funds in the expense Groups at a common asset level as well as transfer agency costs of the funds in the expense Groups. The Board noted that the Management Rates of the Fund were lower than or in range of the sum of these average rates for the Fund’s expense Groups for all share classes.
The Board also received and considered information about the portion of the total management fee that was retained by Funds Management after payment of the fee to the Sub-Adviser for sub-advisory services. In assessing the reasonableness of this amount, the Board received and evaluated information about the nature and extent of responsibilities retained and risks assumed by Funds Management and not delegated to or assumed by the Sub-Adviser, and about Funds Management’s on-going oversight services. Given the affiliation between Funds Management and the Sub-Adviser, the Board ascribed limited relevance to the allocation of fees between them.
Based on its consideration of the factors and information it deemed relevant, including those described here, the Board determined that the compensation payable to Funds Management under the Management Agreement and to the Sub-Adviser under the Sub-Advisory Agreement was reasonable.
Profitability
The Board received and considered information concerning the profitability of Funds Management, as well as the profitability of both WFAM and Wells Fargo & Co. (“Wells Fargo”) as a whole, from providing services to the Fund and the fund family as a whole. The Board noted that the Sub-Adviser’s profitability information with respect to providing services to the Fund was subsumed in the WFAM and Wells Fargo profitability analysis.
Funds Management reported on the methodologies and estimates used in calculating profitability, including a description of the methodology used to allocate certain expenses and recent enhancements made to the methodology. Among other things, the Board noted that the levels of profitability reported on a fund-by-fund basis varied widely, depending on factors such as the size and type of fund. Based on its review, the Board did not deem the profits reported
| | | | |
| 30 | | Wells Fargo Treasury Plus Money Market Fund | | Other information (unaudited) |
by Funds Management, WFAM or Wells Fargo from services provided to the Fund to be at a level that would prevent it from approving the continuation of the Advisory Agreements.
Economies of scale
The Board considered the extent to which Funds Management may experience economies of scale in the provision of management services, and the extent to which scale benefits, if any, would be shared with shareholders. In particular, the Board noted the existence of breakpoints in the Fund’s management fee structure, which operate generally to reduce the Fund’s expense ratios as the Fund grows in size. It considered that, for a small fund or a fund that shrinks in size, breakpoints conversely can result in higher fee levels. The Board also considered that in addition to management fee breakpoints, competitive management fee rates set at the outset without regard to breakpoints and fee waiver and expense reimbursement arrangements, as well as investments in the business intended to enhance services available to Fund shareholders, are means of sharing potential economies of scale with shareholders of the Fund.
The Board concluded that the Fund’s fee and expense arrangements, including contractual breakpoints, constituted a reasonable approach to sharing potential economies of scale with the Fund and its shareholders.
Other benefits to Funds Management and the Sub-Adviser
The Board received and considered information regarding potential “fall-out” or ancillary benefits received by Funds Management and its affiliates, including the Sub-Adviser, as a result of their relationships with the Fund. Ancillary benefits could include, among others, benefits directly attributable to other relationships with the Fund and benefits potentially derived from an increase in Funds Management’s and the Sub-Adviser’s business as a result of their relationships with the Fund. The Board noted that various affiliates of Funds Management may receive distribution-related fees, shareholder servicing payments and sub-transfer agency fees in respect of shares sold or held through them and services provided.
The Board also reviewed information about soft dollar credits earned and utilized by the Sub-Adviser, fees earned by Funds Management and the Sub-Adviser from managing a private investment vehicle for the fund family’s securities lending collateral and commissions earned by an affiliated broker from portfolio transactions.
Based on its consideration of the factors and information it deemed relevant, including those described here, the Board did not find that any ancillary benefits received by Funds Management and its affiliates, including the Sub-Adviser, were unreasonable.
Conclusion
At the Meeting, after considering the above-described factors and based on its deliberations and its evaluation of the information described above, the Board unanimously approved the continuation of the Advisory Agreements for a one-year term and determined that the compensation payable to Funds Management and the Sub-Adviser under each of the Advisory Agreements was reasonable.
This page is intentionally left blank.
This page is intentionally left blank.

For more information
More information about Wells Fargo Funds is available free upon request. To obtain literature, please write, email, visit the Fund’s website, or call:
Wells Fargo Funds
P.O. Box 219967
Kansas City, MO 64121-9967
Website: wellsfargofunds.com
Individual investors: 1-800-222-8222
Retail investment professionals: 1-888-877-9275
Institutional investment professionals: 1-866-765-0778
This report and the financial statements contained herein are submitted for the general information of the shareholders of the Fund. If this report is used for promotional purposes, distribution of the report must be accompanied or preceded by a current prospectus. Before investing, please consider the investment objectives, risks, charges, and expenses of the investment. For a current prospectus and, if available, a summary prospectus, containing this information, call 1-800-222-8222 or visit the Fund’s website at wellsfargofunds.com. Read the prospectus carefully before you invest or send money.
Wells Fargo Asset Management (WFAM) is the trade name for certain investment advisory/management firms owned by Wells Fargo & Company. These firms include but are not limited to Wells Capital Management Incorporated and Wells Fargo Funds Management, LLC. Certain products managed by WFAM entities are distributed by Wells Fargo Funds Distributor, LLC (a broker/dealer and Member FINRA).
This material is for general informational and educational purposes only and is NOT intended to provide investment advice or a recommendation of any kind—including a recommendation for any specific investment, strategy, or plan.
NOT FDIC INSURED ◾ NO BANK GUARANTEE ◾ MAY LOSE VALUE
© 2018 Wells Fargo Funds Management, LLC. All rights reserved.
| | |
 | | 314811 09-18 SA314/SAR314 07-18 |
ITEM 2. CODE OF ETHICS
Not applicable.
ITEM 3. AUDIT COMMITTEE FINANCIAL EXPERT
Not applicable.
ITEM 4. PRINCIPAL ACCOUNTANT FEES AND SERVICES
Not applicable.
ITEM 5. AUDIT COMMITTEE OF LISTED REGISTRANTS
Not applicable.
ITEM 6. INVESTMENTS
A Portfolio of Investments for each series of Wells Fargo Funds Trust is included as part of the report to shareholders filed under Item 1 of this Form.
ITEM 7. DISCLOSURE OF PROXY VOTING POLICIES AND PROCEDURES FOR CLOSED-END MANAGEMENT INVESTMENT COMPANIES
Not applicable.
ITEM 8. PORTFOLIO MANAGERS OF CLOSED-END MANAGEMENT INVESTMENT COMPANIES
Not applicable.
ITEM 9. PURCHASES OF EQUITY SECURITIES BY CLOSED-END MANAGEMENT INVESTMENT COMPANY AND AFFILIATED PURCHASERS
Not applicable.
ITEM 10. SUBMISSION OF MATTERS TO A VOTE OF SECURITY HOLDERS
There have been no material changes to the procedures by which shareholders may recommend nominees to the registrant’s Board of Trustees that have been implemented since the registrant’s last provided disclosure in response to the requirements of this Item.
ITEM 11. CONTROLS AND PROCEDURES
(a) The President and Treasurer have concluded that the Wells Fargo Funds Trust (the “Trust”) disclosure controls and procedures (as defined in Rule 30a-3(c) under the Investment Company Act of 1940) provide reasonable assurances that material information relating to the Trust is made known to them by the appropriate persons, based on their evaluation of these controls and procedures as of a date within 90 days of the filing of this report.
(b) There were no significant changes in the Trust’s internal controls over financial reporting (as defined in Rule 30a-3(d) under the Investment Company Act of 1940) that occurred during the second fiscal quarter of the period covered by this report that materially affected, or is reasonably likely to materially affect, the registrant’s internal control over financial reporting.
ITEM 12. EXHIBITS
(a)(1) Not applicable.
(a)(2) Certification pursuant to Rule 30a-2(a) under the Investment Company Act of 1940 (17 CFR 270.30a-2(a)) is filed and attached hereto as Exhibit 99.CERT.
(a)(3) Not applicable.
(b) Certification pursuant to Rule 30a-2(b) under the Investment Company Act of 1940 (17 CFR 270.30a-2(b)) is filed and attached hereto as Exhibit 99.906CERT.
SIGNATURES
Pursuant to the requirements of the Securities Exchange Act of 1934 and the Investment Company Act of 1940, the registrant has duly caused this report to be signed on its behalf by the undersigned, thereunto duly authorized.
| | |
| Wells Fargo Funds Trust |
| |
| By: | | |
| |
| | /s/ Andrew Owen |
| |
| | Andrew Owen |
| | President |
| |
| Date: | | September 24, 2018 |
Pursuant to the requirements of the Securities Exchange Act of 1934 and the Investment Company Act of 1940, this report has been signed below by the following persons on behalf of the registrant and in the capacities and on the date indicated.
| | |
| Wells Fargo Funds Trust |
| |
| By: | | |
| |
| | /s/ Andrew Owen |
| |
| | Andrew Owen |
| | President |
| |
| Date: | | September 24, 2018 |
| |
| By: | | |
| |
| | /s/ Nancy Wiser |
| |
| | Nancy Wiser |
| | Treasurer |
| |
| Date: | | September 24, 2018 |