
UNITED STATES
SECURITIES AND EXCHANGE COMMISSION
Washington, D.C. 20549
FORM N-CSRS
CERTIFIED SHAREHOLDER REPORT OF REGISTERED
MANAGEMENT INVESTMENT COMPANIES
Investment Company Act file number: 811-09253
Wells Fargo Funds Trust
(Exact name of registrant as specified in charter)
525 Market St., San Francisco, CA 94105
(Address of principal executive offices) (Zip code)
C. David Messman
Wells Fargo Funds Management, LLC
525 Market St., San Francisco, CA 94105
(Name and address of agent for service)
Registrant’s telephone number, including area code: 800-222-8222
Date of fiscal year end: December 31
Registrant is making a filing for Wells Fargo Managed Account CoreBuilder Shares – Series M
Date of reporting period: June 30, 2018
| ITEM 1. | REPORT TO STOCKHOLDERS |
Semi-Annual Report
June 30, 2018

Wells Fargo Managed Account

| ∎ | | Wells Fargo Managed Account CoreBuilder® Shares – Series M |

Reduce clutter. Save trees.
Sign up for electronic delivery of prospectuses and shareholder reports at wellsfargo.com/advantagedelivery
Contents
The views expressed and any forward-looking statements are as of June 30, 2018, unless otherwise noted, and are those of the Fund managers and/or Wells Fargo Funds Management, LLC. Discussions of individual securities, or the markets generally, or any Wells Fargo Fund are not intended as individual recommendations. Future events or results may vary significantly from those expressed in any forward-looking statements. The views expressed are subject to change at any time in response to changing circumstances in the market. Wells Fargo Funds Management, LLC and the Fund disclaim any obligation to publicly update or revise any views expressed or forward-looking statements.
NOT FDIC INSURED ◾ NO BANK GUARANTEE ◾ MAY LOSE VALUE
| | | | |
| 2 | | Wells Fargo Managed Account CoreBuilder Shares – Series M | | Performance highlights (unaudited) |
Investment objective
The Fund seeks total return, consisting of current income and capital appreciation.
Manager
Wells Fargo Funds Management, LLC
Subadviser
Wells Capital Management Incorporated
Portfolio managers
Lyle J. Fitterer, CFA®, CPA
Robert J. Miller
Adrian Van Poppel‡
Average annual total returns (%) as of June 30, 2018
| | | | | | | | | | | | | | |
| | | Inception date | | 1 year | | | 5 year | | | 10 year | |
| Wells Fargo Managed Account CoreBuilder Shares – Series M | | 4-14-2008 | | | 3.93 | | | | 4.87 | | | | 7.07 | |
| Bloomberg Barclays Municipal Bond Index1 | | – | | | 1.56 | | | | 3.53 | | | | 4.43 | |
Figures quoted represent past performance, which is no guarantee of future results, and do not reflect taxes that a shareholder may pay on fund distributions or the redemption of fund shares. Investment return and principal value of an investment will fluctuate so that an investor’s shares, when redeemed, may be worth more or less than their original cost. Current performance may be lower or higher than the performance data quoted, which assumes the reinvestment of dividends and capital gains. Current month-end performance is available by calling 1-888-877-9275.
Shares are sold without a front-end sales charge or contingent deferred sales charge.
Index returns do not include transaction costs associated with buying and selling securities, any mutual fund fees or expenses, or any taxes. It is not possible to invest directly in an index.
Bond values fluctuate in response to the financial condition of individual issuers, general market and economic conditions, and changes in interest rates. Changes in market conditions and government policies may lead to periods of heightened volatility in the bond market and reduced liquidity for certain bonds held by the Fund. In general, when interest rates rise, bond values fall and investors may lose principal value. Interest rate changes and their impact on the Fund and its share price can be sudden and unpredictable. The use of derivatives may reduce returns and/or increase volatility. Certain investment strategies tend to increase the total risk of an investment (relative to the broader market). The Fund is exposed to high-yield securities risk and municipal securities risk. Consult the Fund’s prospectus for additional information on these and other risks. A portion of the Fund’s income may be subject to federal, state, and/or local income taxes or the Alternative Minimum Tax (AMT). Any capital gains distributions may be taxable.
CoreBuilder Shares are a series of investment options within the separately managed accounts advised or subadvised by Wells Fargo Funds Management, LLC. The shares are fee-waived mutual funds that enable certain separately managed account investors to achieve greater diversification than smaller managed accounts might otherwise achieve.
Please remember that shares of the Fund may be purchased only by or on behalf of separately managed account clients where Wells Fargo Funds Management, LLC has an agreement to serve as investment adviser or subadviser to the account with the separately managed account sponsor (typically a registered investment adviser or broker/dealer) or directly with the client.
Please see footnotes on page 3.
| | | | | | |
| Performance highlights (unaudited) | | Wells Fargo Managed Account CoreBuilder Shares – Series M | | | 3 | |
| | |
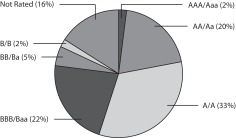
| Credit quality as of June 30, 20182 |
|
|
| | |
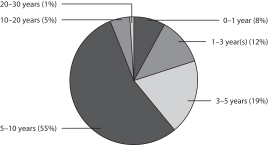
| Effective maturity distribution of June 30, 20183 |
|
 |
| ‡ | Mr. Poppel became a portfolio manager of the Fund on May 1, 2018. |
| 1 | The Bloomberg Barclays Municipal Bond Index is an unmanaged index composed of long-term tax-exempt bonds with a minimum credit rating of Baa. You cannot invest directly in an index. |
| 2 | The credit quality distribution of portfolio holdings reflected in the chart is based on ratings from Standard & Poor’s, Moody’s Investors Service, and/or Fitch Ratings Ltd. Credit quality ratings apply to the underlying holdings of the Fund and not to the Fund itself. The percentages of the Fund’s portfolio with the ratings depicted in the chart are calculated based on the total market value of fixed income securities held by the Fund. If a security was rated by all three rating agencies, the middle rating was utilized. If rated by two of three rating agencies, the lower rating was utilized, and if rated by one of the rating agencies, that rating was utilized. Standard & Poor’s rates the creditworthiness of bonds, ranging from AAA (highest) to D (lowest). Ratings from A to CCC may be modified by the addition of a plus (+) or minus (-) sign to show relative standing within the rating categories. Standard & Poor’s rates the creditworthiness of short-term notes from SP-1 (highest) to SP-3 (lowest). Moody’s rates the creditworthiness of bonds, ranging from Aaa (highest) to C (lowest). Ratings Aa to B may be modified by the addition of a number 1 (highest) to 3 (lowest) to show relative standing within the ratings categories. Moody’s rates the creditworthiness of short-term U.S. tax-exempt municipal securities from MIG 1/VMIG 1 (highest) to SG (lowest). Fitch rates the creditworthiness of bonds, ranging from AAA (highest) to D (lowest). Credit quality distribution is subject to change and may have changed since the date specified. |
| 3 | Amounts are calculated based on the total long-term investments of the Fund. These amounts are subject to change and may have changed since the date specified. |
| | | | |
| 4 | | Wells Fargo Managed Account CoreBuilder Shares – Series M | | Fund expenses (unaudited) |
As a shareholder of the Fund, you incur ongoing costs and other Fund expenses. This example is intended to help you understand your ongoing costs (in dollars) of investing in the Fund and to compare these costs with the ongoing costs of investing in other mutual funds.
The example is based on an investment of $1,000 invested at the beginning of the six-month period and held for the entire period from January 1, 2018 to June 30, 2018.
Actual expenses
The “Actual” line of the table below provides information about actual account values and actual expenses. You may use the information in this line, together with the amount you invested, to estimate the expenses that you paid over the period. Simply divide your account value by $1,000 (for example, an $8,600 account value divided by $1,000 = 8.6), then multiply the result by the number in the “Actual” line under the heading entitled “Expenses paid during period” for your applicable class of shares to estimate the expenses you paid on your account during this period.
Hypothetical example for comparison purposes
The “Hypothetical” line of the table below provides information about hypothetical account values and hypothetical expenses based on the Fund’s actual expense ratio and an assumed rate of return of 5% per year before expenses, which is not the Fund’s actual return. The hypothetical account values and expenses may not be used to estimate the actual ending account balance or expenses you paid for the period. You may use this information to compare the ongoing costs of investing in the Fund and other funds. To do so, compare this 5% hypothetical example with the 5% hypothetical examples that appear in the shareholder reports of the other funds.
Please note that the expenses shown in the table are meant to highlight your ongoing costs. Therefore, the “Hypothetical” line of the table is useful in comparing ongoing costs only and will not help you determine the relative total costs of owning different funds.
| | | | | | | | | | | | | | | | |
| | | Beginning
account value
1-1-2018 | | | Ending
account value
6-30-2018 | | | Expenses
paid during
the period¹ | | | Annualized net
expense ratio | |
Actual | | $ | 1,000.00 | | | $ | 1,037.75 | | | $ | 0.00 | * | | | 0.00 | %* |
Hypothetical (5% return before expenses) | | $ | 1,000.00 | | | $ | 1,024.79 | | | $ | 0.00 | * | | | 0.00 | %* |
| 1 | Expenses paid is equal to the annualized net expense ratio multiplied by the average account value over the period, multiplied by the number of days in the most recent fiscal half-year divided by the number of days in the fiscal year (to reflect the one-half-year period). |
| * | Generally, no ordinary operating fees or expenses are charged to the Fund. Wells Fargo Funds Management, LLC has contractually committed to irrevocably absorb and pay or reimburse all ordinary operating expenses of the Fund, except portfolio transactions or other investment-related costs (e.g., commissions), fees payable for services provided by the Fund’s securities lending agent (if any), interest, taxes, leverage expenses and other expenses not incurred in the ordinary course of the Fund’s business. This commitment has an indefinite term. |
| | | | | | |
| Portfolio of investments—June 30, 2018 (unaudited) | | Wells Fargo Managed Account CoreBuilder Shares – Series M | | | 5 | |
| | | | | | | | | | | | | | | | |
| Security name | | Interest rate | | | Maturity date | | | Principal | | | Value | |
|
Municipal Obligations: 98.52% | |
|
Alabama: 0.83% | |
|
| GO Revenue: 0.07% | |
Jefferson County AL Series A | | | 4.90 | % | | | 4-1-2021 | | | $ | 415,000 | | | $ | 426,811 | |
| | | | | | | | | | | | | | | | |
|
| Miscellaneous Revenue: 0.60% | |
Alabama Federal Aid Highway Finance Authority Series A | | | 5.00 | | | | 9-1-2035 | | | | 3,250,000 | | | | 3,755,472 | |
| | | | | | | | | | | | | | | | |
|
| Water & Sewer Revenue: 0.16% | |
Jefferson County AL CAB Series B (AGM Insured) ¤ | | | 0.00 | | | | 10-1-2026 | | | | 1,350,000 | | | | 999,405 | |
| | | | | | | | | | | | | | | | |
| | | | |
| | | | | | | | | | | | | | | 5,181,688 | |
| | | | | | | | | | | | | | | | |
|
Arizona: 3.24% | |
|
| Education Revenue: 2.12% | |
Florence AZ IDA Legacy Traditional School Project Queen Creek & Casa Grande Campuses | | | 5.00 | | | | 7-1-2023 | | | | 650,000 | | | | 681,258 | |
La Paz County AZ IDA Educational Facility Imagine Schools West Middle Project Series A 144A | | | 4.90 | | | | 6-15-2028 | | | | 570,000 | | | | 563,360 | |
La Paz County AZ IDA Educational Facility Imagine Schools West Middle Project Series A 144A | | | 5.75 | | | | 6-15-2038 | | | | 1,000,000 | | | | 1,007,610 | |
Maricopa County AZ IDA Horizon Community Learning Center Project | | | 5.00 | | | | 7-1-2035 | | | | 3,000,000 | | | | 3,114,060 | |
Phoenix AZ IDA Education Great Hearts Academies-Veritas Project | | | 6.00 | | | | 7-1-2032 | | | | 600,000 | | | | 670,722 | |
Phoenix AZ IDA Education Great Hearts Academies-Veritas Project | | | 6.25 | | | | 7-1-2032 | | | | 295,000 | | | | 325,332 | |
Pima County AZ IDA Educational Facility Charter School Project Series R | | | 2.88 | | | | 7-1-2021 | | | | 610,000 | | | | 613,398 | |
Pima County AZ IDA Educational Facility Desert Heights Charter School | | | 7.00 | | | | 5-1-2034 | | | | 1,000,000 | | | | 1,079,510 | |
Pima County AZ IDA New Plan Learning Project Series A | | | 7.75 | | | | 7-1-2035 | | | | 985,000 | | | | 993,057 | |
Pima County AZ IDA Noah Webster Schools Project Series A | | | 6.75 | | | | 12-15-2033 | | | | 1,120,000 | | | | 1,214,125 | |
Pima County AZ IDA Paideia Academies Project 144A | | | 5.00 | | | | 7-1-2025 | | | | 670,000 | | | | 672,747 | |
Pima County AZ IDA Paideia Academies Project 144A | | | 6.00 | | | | 7-1-2035 | | | | 1,025,000 | | | | 1,043,122 | |
Pima County AZ IDA Paideia Academies Project 144A | | | 6.13 | | | | 7-1-2045 | | | | 1,000,000 | | | | 1,016,170 | |
Yavapai County AZ IDA Business & Equine Center Project 144A | | | 4.63 | | | | 3-1-2022 | | | | 270,000 | | | | 276,977 | |
| | | | |
| | | | | | | | | | | | | | | 13,271,448 | |
| | | | | | | | | | | | | | | | |
|
| GO Revenue: 0.08% | |
Verrado AZ Community Facilities District #1 144A | | | 5.00 | | | | 7-15-2022 | | | | 500,000 | | | | 519,200 | |
| | | | | | | | | | | | | | | | |
|
| Health Revenue: 0.24% | |
Tempe AZ IDA Mirabella ASU Project Series A 144A | | | 6.13 | | | | 10-1-2047 | | | | 1,400,000 | | | | 1,499,260 | |
| | | | | | | | | | | | | | | | |
|
| Resource Recovery Revenue: 0.21% | |
Yavapai County AZ IDA Waste Management Incorporated Project | | | 2.80 | | | | 6-1-2027 | | | | 1,300,000 | | | | 1,306,136 | |
| | | | | | | | | | | | | | | | |
|
| Tax Revenue: 0.21% | |
City of San Luis AZ Pledged Excise Tax Series A (Build America Mutual Assurance Company Insured) | | | 5.00 | | | | 7-1-2038 | | | | 1,200,000 | | | | 1,329,384 | |
| | | | | | | | | | | | | | | | |
|
| Utilities Revenue: 0.38% | |
Salt Verde Financial Corporation (Citibank NA Guaranty Agreement) | | | 5.00 | | | | 12-1-2032 | | | | 2,055,000 | | | | 2,409,138 | |
| | | | | | | | | | | | | | | | |
| | | | |
| | | | | | | | | | | | | | | 20,334,566 | |
| | | | | | | | | | | | | | | | |
The accompanying notes are an integral part of these financial statements.
| | | | |
| 6 | | Wells Fargo Managed Account CoreBuilder Shares – Series M | | Portfolio of investments—June 30, 2018 (unaudited) |
| | | | | | | | | | | | | | | | |
| Security name | | Interest rate | | | Maturity date | | | Principal | | | Value | |
|
California: 3.40% | |
|
| Airport Revenue: 1.78% | |
San Francisco CA City & County Airport Commission San Francisco International Airport Series B | | | 5.00 | % | | | 5-1-2046 | | | $ | 10,000,000 | | | $ | 11,171,200 | |
| | | | | | | | | | | | | | | | |
|
| Education Revenue: 0.52% | |
California Municipal Finance Authority Charter School Albert Einstein Academies Project Series A | | | 7.13 | | | | 8-1-2043 | | | | 1,000,000 | | | | 1,094,670 | |
California School Finance Authority View Park Elementary & Middle Schools Series A | | | 4.75 | | | | 10-1-2024 | | | | 415,000 | | | | 431,467 | |
California School Finance Authority View Park Elementary & Middle Schools Series A | | | 5.63 | | | | 10-1-2034 | | | | 575,000 | | | | 609,190 | |
University of California Series AI | | | 5.00 | | | | 5-15-2038 | | | | 1,000,000 | | | | 1,120,190 | |
| | | | |
| | | | | | | | | | | | | | | 3,255,517 | |
| | | | | | | | | | | | | | | | |
|
| GO Revenue: 0.18% | |
California Prerefunded Bond | | | 6.00 | | | | 4-1-2038 | | | | 70,000 | | | | 72,423 | |
California Unrefunded Bond | | | 6.00 | | | | 4-1-2038 | | | | 130,000 | | | | 134,192 | |
Compton CA Community College District Election of 2002 CAB Series C ¤ | | | 0.00 | | | | 8-1-2029 | | | | 500,000 | | | | 331,665 | |
Hawthorne CA School District CAB Series C (National Insured) ¤ | | | 0.00 | | | | 11-1-2025 | | | | 100,000 | | | | 81,862 | |
Peralta CA Community College District Alameda County | | | 5.00 | | | | 8-1-2024 | | | | 450,000 | | | | 504,108 | |
| | | | |
| | | | | | | | | | | | | | | 1,124,250 | |
| | | | | | | | | | | | | | | | |
|
| Health Revenue: 0.23% | |
California Statewide CDA Sutter Health Series A | | | 6.00 | | | | 8-15-2042 | | | | 100,000 | | | | 109,251 | |
San Buenaventura CA Community Mental Health System | | | 6.25 | | | | 12-1-2020 | | | | 150,000 | | | | 163,410 | |
University of California Regents Medical Center Prerefunded Bond Series J | | | 5.25 | | | | 5-15-2038 | | | | 780,000 | | | | 905,627 | |
University of California Regents Medical Center Unrefunded Bond Series J | | | 5.25 | | | | 5-15-2038 | | | | 220,000 | | | | 249,064 | |
| | | | |
| | | | | | | | | | | | | | | 1,427,352 | |
| | | | | | | | | | | | | | | | |
|
| Industrial Development Revenue: 0.25% | |
California PCFA Solid Waste Disposal AMT Green Bond Calplant I Project 144A | | | 8.00 | | | | 7-1-2039 | | | | 1,430,000 | | | | 1,550,048 | |
| | | | | | | | | | | | | | | | |
|
| Miscellaneous Revenue: 0.35% | |
Anaheim CA PFA Convention Center Expansion Project Series A | | | 5.00 | | | | 5-1-2046 | | | | 1,000,000 | | | | 1,116,360 | |
California Public Works Board Department of General Services Buildings 8 & 9A | | | 6.25 | | | | 4-1-2034 | | | | 250,000 | | | | 259,112 | |
Palo Alto CA Improvement Bond Act of 1915 | | | 4.00 | | | | 9-2-2020 | | | | 240,000 | | | | 251,309 | |
San Diego CA Public Financing Authority Capital Improvement Project Series B | | | 5.00 | | | | 10-15-2029 | | | | 500,000 | | | | 587,840 | |
| | | | |
| | | | | | | | | | | | | | | 2,214,621 | |
| | | | | | | | | | | | | | | | |
|
| Water & Sewer Revenue: 0.09% | |
Los Angeles CA DW&P Series A | | | 5.00 | | | | 7-1-2039 | | | | 500,000 | | | | 565,615 | |
| | | | | | | | | | | | | | | | |
| | | | |
| | | | | | | | | | | | | | | 21,308,603 | |
| | | | | | | | | | | | | | | | |
|
Colorado: 2.03% | |
|
| Education Revenue: 0.82% | |
Colorado ECFA Charter School American Academy Project | | | 7.13 | | | | 12-1-2033 | | | | 200,000 | | | | 208,632 | |
Colorado ECFA Charter School American Academy Project | | | 7.25 | | | | 12-1-2028 | | | | 250,000 | | | | 260,920 | |
Colorado ECFA Charter School American Academy Project | | | 7.63 | | | | 12-1-2040 | | | | 260,000 | | | | 271,755 | |
Colorado ECFA Charter School Banning Lewis Ranch Academy Project Series A | | | 6.00 | | | | 12-15-2037 | | | | 1,500,000 | | | | 1,456,425 | |
Colorado ECFA Charter School Community Leadership Academy Second Campus Project | | | 7.00 | | | | 8-1-2033 | | | | 485,000 | | | | 552,197 | |
The accompanying notes are an integral part of these financial statements.
| | | | | | |
| Portfolio of investments—June 30, 2018 (unaudited) | | Wells Fargo Managed Account CoreBuilder Shares – Series M | | | 7 | |
| | | | | | | | | | | | | | | | |
| Security name | | Interest rate | | | Maturity date | | | Principal | | | Value | |
|
| Education Revenue (continued) | |
Colorado ECFA Charter School Rocky Mountain Classical Academy Project Series A | | | 8.13 | % | | | 9-1-2048 | | | $ | 1,000,000 | | | $ | 1,292,060 | |
Regents of the University of Colorado Certificate of Participation Series 2013A | | | 5.00 | | | | 11-1-2028 | | | | 1,000,000 | | | | 1,126,610 | |
| | | | |
| | | | | | | | | | | | | | | 5,168,599 | |
| | | | | | | | | | | | | | | | |
|
| GO Revenue: 0.11% | |
Southlands CO Metropolitan District #1 Series A-2 | | | 5.00 | | | | 12-1-2047 | | | | 650,000 | | | | 693,180 | |
| | | | | | | | | | | | | | | | |
|
| Health Revenue: 0.65% | |
Colorado Health Facilities Authority Catholic Health Initiatives Series A | | | 5.00 | | | | 7-1-2039 | | | | 4,000,000 | | | | 4,080,960 | |
| | | | | | | | | | | | | | | | |
|
| Industrial Development Revenue: 0.45% | |
Denver CO Convention Center Hotel Authority Senior Revenue Refunding Bonds Series 2016 | | | 5.00 | | | | 12-1-2033 | | | | 2,500,000 | | | | 2,814,475 | |
| | | | | | | | | | | | | | | | |
| | | | |
| | | | | | | | | | | | | | | 12,757,214 | |
| | | | | | | | | | | | | | | | |
|
Connecticut: 0.48% | |
|
| GO Revenue: 0.48% | |
Hamden CT (Build America Mutual Assurance Company Insured) | | | 5.00 | | | | 8-15-2024 | | | | 450,000 | | | | 503,140 | |
Hamden CT (Build America Mutual Assurance Company Insured) | | | 5.00 | | | | 8-15-2025 | | | | 275,000 | | | | 311,429 | |
Hartford CT | | | 5.00 | | | | 4-1-2028 | | | | 2,055,000 | | | | 2,212,783 | |
| | | | |
| | | | | | | | | | | | | | | 3,027,352 | |
| | | | | | | | | | | | | | | | |
|
Delaware: 0.24% | |
|
| Education Revenue: 0.24% | |
Delaware EDA Odyssey Charter School Incorporated Project Series A 144A | | | 7.00 | | | | 9-1-2045 | | | | 1,500,000 | | | | 1,499,805 | |
| | | | | | | | | | | | | | | | |
|
District of Columbia: 0.05% | |
|
| Education Revenue: 0.01% | |
District of Columbia Cesar Chavez Public Charter School | | | 6.50 | | | | 11-15-2021 | | | | 40,000 | | | | 41,006 | |
| | | | | | | | | | | | | | | | |
|
| Miscellaneous Revenue: 0.04% | |
District of Columbia Association of American Medical Colleges Series A | | | 5.00 | | | | 10-1-2024 | | | | 270,000 | | | | 303,399 | |
| | | | | | | | | | | | | | | | |
| | | | |
| | | | | | | | | | | | | | | 344,405 | |
| | | | | | | | | | | | | | | | |
|
Florida: 1.79% | |
|
| Airport Revenue: 0.18% | |
Miami-Dade County FL Seaport AMT Series B | | | 6.00 | | | | 10-1-2033 | | | | 1,000,000 | | | | 1,139,320 | |
| | | | | | | | | | | | | | | | |
|
| Education Revenue: 0.94% | |
Florida Development Finance Corporation Educational Facilities Renaissance Charter School Project Series A | | | 8.50 | | | | 6-15-2044 | | | | 1,000,000 | | | | 1,145,170 | |
Florida Higher Educational Facilities Financing Authority Jacksonville University 144A | | | 4.50 | | | | 6-1-2033 | | | | 1,300,000 | | | | 1,333,436 | |
Miami-Dade County FL IDA Aspira Florida Project Series 2016A 144A | | | 5.75 | | | | 11-1-2036 | | | | 2,000,000 | | | | 1,914,700 | |
Miami-Dade County FL IDA Youth Co-Op Charter School Project Series 2015A 144A | | | 5.75 | | | | 9-15-2035 | | | | 1,500,000 | | | | 1,515,690 | |
| | | | |
| | | | | | | | | | | | | | | 5,908,996 | |
| | | | | | | | | | | | | | | | |
The accompanying notes are an integral part of these financial statements.
| | | | |
| 8 | | Wells Fargo Managed Account CoreBuilder Shares – Series M | | Portfolio of investments—June 30, 2018 (unaudited) |
| | | | | | | | | | | | | | | | |
| Security name | | Interest rate | | | Maturity date | | | Principal | | | Value | |
|
| Health Revenue: 0.04% | |
Holmes County FL Hospital Corporation Doctors Memorial Hospital Project | | | 6.00 | % | | | 11-1-2038 | | | $ | 250,000 | | | $ | 238,690 | |
| | | | | | | | | | | | | | | | |
|
| Miscellaneous Revenue: 0.63% | |
CityPlace Florida Community Development District | | | 5.00 | | | | 5-1-2022 | | | | 500,000 | | | | 545,725 | |
Miami-Dade County FL School Board Certificate of Participation Series A | | | 5.00 | | | | 5-1-2031 | | | | 3,000,000 | | | | 3,421,740 | |
| | | | |
| | | | | | | | | | | | | | | 3,967,465 | |
| | | | | | | | | | | | | | | | |
| | | | |
| | | | | | | | | | | | | | | 11,254,471 | |
| | | | | | | | | | | | | | | | |
|
Georgia: 2.82% | |
|
| Health Revenue: 0.85% | |
Atlanta GA Development Authority Senior Health Georgia Proton Treatment Center Series A-1 | | | 6.00 | | | | 1-1-2023 | | | | 1,500,000 | | | | 1,488,960 | |
Atlanta GA Development Authority Senior Health Georgia Proton Treatment Center Series A-1 | | | 7.00 | | | | 1-1-2040 | | | | 2,000,000 | | | | 1,963,000 | |
Fulton County GA Development Authority Hospital WellStar Health System Series A | | | 5.00 | | | | 4-1-2042 | | | | 1,000,000 | | | | 1,111,310 | |
Washington Counties GA Wilkes Payroll Development Authority Subordinate Bond Series C ¤ | | | 0.00 | | | | 12-1-2021 | | | | 815,000 | | | | 756,646 | |
| | | | |
| | | | | | | | | | | | | | | 5,319,916 | |
| | | | | | | | | | | | | | | | |
|
| Industrial Development Revenue: 0.01% | |
Atlanta GA Development Authority Tuff Yamacraw LLC Project Series A (Ambac Insured) | | | 5.00 | | | | 1-1-2027 | | | | 50,000 | | | | 53,907 | |
| | | | | | | | | | | | | | | | |
|
| Utilities Revenue: 1.96% | |
Main Street Natural Gas Incorporated Georgia Gas Project Series A (Royal Bank of Canada LIQ) | | | 4.00 | | | | 4-1-2048 | | | | 7,500,000 | | | | 8,022,600 | |
Main Street Natural Gas Incorporated Georgia Gas Project Sub Series C | | | 4.00 | | | | 8-1-2048 | | | | 4,000,000 | | | | 4,280,720 | |
| | | | |
| | | | | | | | | | | | | | | 12,303,320 | |
| | | | | | | | | | | | | | | | |
| | | | |
| | | | | | | | | | | | | | | 17,677,143 | |
| | | | | | | | | | | | | | | | |
|
Guam: 0.50% | |
|
| Miscellaneous Revenue: 0.17% | |
Guam Government Limited Obligation Bonds Section 30 Series A | | | 5.38 | | | | 12-1-2024 | | | | 1,000,000 | | | | 1,051,440 | |
| | | | | | | | | | | | | | | | |
|
| Tax Revenue: 0.06% | |
Guam Government Business Privilege Tax Series A | | | 5.00 | | | | 1-1-2031 | | | | 365,000 | | | | 384,582 | |
| | | | | | | | | | | | | | | | |
|
| Utilities Revenue: 0.09% | |
Guam Power Authority Series A (AGM Insured) | | | 5.00 | | | | 10-1-2020 | | | | 500,000 | | | | 531,950 | |
| | | | | | | | | | | | | | | | |
|
| Water & Sewer Revenue: 0.18% | |
Guam Government Waterworks Authority Water & Wastewater System Project Series 2013 | | | 5.25 | | | | 7-1-2021 | | | | 550,000 | | | | 595,529 | |
Guam Government Waterworks Authority Water & Wastewater System Project Series 2013 | | | 5.25 | | | | 7-1-2022 | | | | 500,000 | | | | 552,765 | |
| | | | |
| | | | | | | | | | | | | | | 1,148,294 | |
| | | | | | | | | | | | | | | | |
| | | | |
| | | | | | | | | | | | | | | 3,116,266 | |
| | | | | | | | | | | | | | | | |
The accompanying notes are an integral part of these financial statements.
| | | | | | |
| Portfolio of investments—June 30, 2018 (unaudited) | | Wells Fargo Managed Account CoreBuilder Shares – Series M | | | 9 | |
| | | | | | | | | | | | | | | | |
| Security name | | Interest rate | | | Maturity date | | | Principal | | | Value | |
|
Idaho: 0.29% | |
|
| Education Revenue: 0.29% | |
Idaho Housing & Finance Association Idaho Arts Charter School Series A 144A | | | 5.00 | % | | | 12-1-2036 | | | $ | 1,000,000 | | | $ | 1,065,540 | |
Idaho Housing & Finance Association Legacy Public Charter School Incorporated Project Series A | | | 5.85 | | | | 5-1-2033 | | | | 480,000 | | | | 485,376 | |
Idaho Housing & Finance Association Liberty Charter School Series A | | | 6.00 | | | | 6-1-2038 | | | | 250,000 | | | | 250,307 | |
| | | | |
| | | | | | | | | | | | | | | 1,801,223 | |
| | | | | | | | | | | | | | | | |
|
Illinois: 21.15% | |
|
| Airport Revenue: 1.90% | |
Chicago IL Midway Airport Second Lien Refunding Bonds Series A | | | 5.50 | | | | 1-1-2031 | | | | 4,500,000 | | | | 4,993,695 | |
Chicago IL O’Hare International Airport | | | 5.00 | | | | 1-1-2035 | | | | 1,000,000 | | | | 1,038,690 | |
Chicago IL O’Hare International Airport | | | 5.00 | | | | 1-1-2035 | | | | 1,350,000 | | | | 1,402,231 | |
Chicago IL O’Hare International Airport AMT Senior Lien Series C | | | 5.50 | | | | 1-1-2044 | | | | 1,000,000 | | | | 1,103,500 | |
Chicago IL O’Hare International Airport Customer Facility Charge Senior Lien Series D | | | 5.75 | | | | 1-1-2043 | | | | 1,500,000 | | | | 1,689,705 | |
Chicago IL O’Hare International Airport Senior Lien | | | 5.25 | | | | 1-1-2032 | | | | 1,000,000 | | | | 1,109,030 | |
Chicago IL O’Hare International Airport Transportation Infrastructure Properties Obligated Group | | | 5.00 | | | | 7-1-2038 | | | | 500,000 | | | | 555,220 | |
| | | | |
| | | | | | | | | | | | | | | 11,892,071 | |
| | | | | | | | | | | | | | | | |
|
| Education Revenue: 0.38% | |
Illinois Finance Authority Charter Schools Refunding & Improvement Bonds Series A | | | 7.13 | | | | 10-1-2041 | | | | 200,000 | | | | 211,886 | |
Illinois Finance Authority Wesleyan University | | | 5.00 | | | | 9-1-2046 | | | | 2,000,000 | | | | 2,148,080 | |
| | | | |
| | | | | | | | | | | | | | | 2,359,966 | |
| | | | | | | | | | | | | | | | |
|
| GO Revenue: 7.68% | |
Bureau County IL Township High School District #502 Series A (Build America Mutual Assurance Company Insured) | | | 6.25 | | | | 12-1-2033 | | | | 750,000 | | | | 907,125 | |
Chicago IL Board of Education Series A (National Insured) | | | 5.25 | | | | 12-1-2021 | | | | 2,555,000 | | | | 2,735,715 | |
Chicago IL Board of Education Series C | | | 5.25 | | | | 12-1-2025 | | | | 1,000,000 | | | | 1,003,760 | |
Chicago IL CAB City Colleges (National Insured) ¤ | | | 0.00 | | | | 1-1-2027 | | | | 6,000,000 | | | | 4,155,960 | |
Chicago IL CAB Series C ¤ | | | 0.00 | | | | 1-1-2021 | | | | 610,000 | | | | 553,971 | |
Chicago IL City Colleges Capital Improvement Project CAB (National Insured) ¤ | | | 0.00 | | | | 1-1-2031 | | | | 800,000 | | | | 463,864 | |
Chicago IL Emergency Telephone System Project (National Insured) | | | 5.50 | | | | 1-1-2023 | | | | 555,000 | | | | 597,291 | |
Chicago IL Library Project Series D | | | 5.00 | | | | 1-1-2021 | | | | 440,000 | | | | 444,308 | |
Chicago IL Modern Schools Across Chicago Program Series A | | | 4.00 | | | | 12-1-2018 | | | | 445,000 | | | | 448,378 | |
Chicago IL Neighborhoods Alive 21 Program Series B | | | 5.50 | | | | 1-1-2032 | | | | 1,300,000 | | | | 1,397,487 | |
Chicago IL Park District Limited Tax Park Bonds Series 2016A | | | 5.00 | | | | 1-1-2030 | | | | 1,000,000 | | | | 1,115,570 | |
Chicago IL Park District Limited Tax Park Bonds Series 2016A | | | 5.00 | | | | 1-1-2031 | | | | 1,000,000 | | | | 1,107,160 | |
Chicago IL Park District Limited Tax Park Bonds Series 2016A | | | 5.00 | | | | 1-1-2032 | | | | 1,225,000 | | | | 1,350,305 | |
Chicago IL Park District Limited Tax Park Bonds Series 2016A | | | 5.00 | | | | 1-1-2035 | | | | 1,000,000 | | | | 1,089,190 | |
Chicago IL Park District Unlimited Tax Refunding Bonds Series 2016A | | | 5.00 | | | | 11-15-2028 | | | | 1,655,000 | | | | 1,885,111 | |
Chicago IL Park District Unlimited Tax Refunding Bonds Series 2016E | | | 5.00 | | | | 11-15-2029 | | | | 1,735,000 | | | | 1,957,149 | |
Chicago IL Series A | | | 6.00 | | | | 1-1-2038 | | | | 2,500,000 | | | | 2,814,900 | |
Chicago IL Series C | | | 4.00 | | | | 1-1-2021 | | | | 750,000 | | | | 765,900 | |
Chicago IL Series C (National Insured) | | | 5.00 | | | | 1-1-2029 | | | | 875,000 | | | | 877,205 | |
Cook County IL School District #144 Prairie Hills CAB Refunding Bond Series C (AGM Insured) ¤ | | | 0.00 | | | | 12-1-2025 | | | | 675,000 | | | | 514,775 | |
Cook County IL School District #159 Matteson-Richton Park CAB (AGM Insured) ¤ | | | 0.00 | | | | 12-1-2023 | | | | 615,000 | | | | 507,289 | |
The accompanying notes are an integral part of these financial statements.
| | | | |
| 10 | | Wells Fargo Managed Account CoreBuilder Shares – Series M | | Portfolio of investments—June 30, 2018 (unaudited) |
| | | | | | | | | | | | | | | | |
| Security name | | Interest rate | | | Maturity date | | | Principal | | | Value | |
|
| GO Revenue (continued) | |
Cook County IL Series A | | | 5.00 | % | | | 11-15-2020 | | | $ | 770,000 | | | $ | 821,274 | |
Cook County IL Series A | | | 5.25 | | | | 11-15-2022 | | | | 2,940,000 | | | | 3,141,390 | |
Illinois (AGM Insured) | | | 5.00 | | | | 4-1-2026 | | | | 1,130,000 | | | | 1,240,254 | |
Illinois Series 2010 (AGM Insured) | | | 5.00 | | | | 1-1-2023 | | | | 820,000 | | | | 845,978 | |
Illinois Series 2013 | | | 5.50 | | | | 7-1-2038 | | | | 1,000,000 | | | | 1,050,210 | |
Illinois Series A | | | 4.00 | | | | 9-1-2019 | | | | 600,000 | | | | 600,972 | |
Illinois Series A (AGM Insured) | | | 5.00 | | | | 4-1-2024 | | | | 1,905,000 | | | | 2,076,640 | |
Kane, Cook & DuPage Counties IL Series A | | | 5.00 | | | | 1-1-2034 | | | | 1,000,000 | | | | 1,103,280 | |
Kane, Cook & DuPage Counties IL Series D | | | 5.00 | | | | 1-1-2034 | | | | 1,700,000 | | | | 1,875,576 | |
Lake County IL School District #38 Big Hollow CAB (Ambac Insured) ¤ | | | 0.00 | | | | 2-1-2019 | | | | 75,000 | | | | 73,868 | |
Village Bolingbrook IL (AGM Insured) | | | 5.00 | | | | 1-1-2031 | | | | 500,000 | | | | 548,405 | |
Will County IL Lincoln-Way Community High School District #210 CAB Series B ¤ | | | 0.00 | | | | 1-1-2027 | | | | 1,030,000 | | | | 672,065 | |
Will County IL Lincoln-Way Community High School District #210 CAB Series B ¤ | | | 0.00 | | | | 1-1-2028 | | | | 475,000 | | | | 292,025 | |
Will County IL Lincoln-Way Community High School District #210 CAB Series B ¤ | | | 0.00 | | | | 1-1-2033 | | | | 1,625,000 | | | | 730,243 | |
Will County IL Lincoln-Way Community High School District #210 Series A (AGM Insured) | | | 5.00 | | | | 1-1-2027 | | | | 4,000,000 | | | | 4,307,840 | |
Will County IL Lincoln-Way Community High School District #210 Series A | | | 5.00 | | | | 1-1-2030 | | | | 1,000,000 | | | | 986,250 | |
Winnebago County IL Series A (AGM Insured) | | | 4.00 | | | | 12-30-2025 | | | | 1,035,000 | | | | 1,121,319 | |
| | | | |
| | | | | | | | | | | | | | | 48,180,002 | |
| | | | | | | | | | | | | | | | |
|
| Miscellaneous Revenue: 1.22% | |
Chicago IL Board of Education Lease Certificates Refunding Bond Series A (National Insured) | | | 6.00 | | | | 1-1-2020 | | | | 135,000 | | | | 138,409 | |
Illinois Finance Authority Rogers Park Montessori School | | | 5.00 | | | | 2-1-2024 | | | | 445,000 | | | | 460,958 | |
Illinois Finance Authority The Art Institute of Chicago Series A | | | 6.00 | | | | 3-1-2038 | | | | 400,000 | | | | 411,652 | |
Illinois Prerefunded Bond | | | 5.00 | | | | 3-1-2034 | | | | 5,000 | | | | 5,525 | |
Illinois State | | | 5.00 | | | | 2-1-2021 | | | | 3,000,000 | | | | 3,121,200 | |
Illinois State | | | 5.00 | | | | 5-1-2025 | | | | 870,000 | | | | 918,485 | |
Illinois State | | | 5.50 | | | | 7-1-2025 | | | | 1,250,000 | | | | 1,338,212 | |
Illinois University Certificate of Participation Capital Improvement Project | | | 4.25 | | | | 4-1-2020 | | | | 715,000 | | | | 731,281 | |
Illinois Unrefunded Bond | | | 5.00 | | | | 3-1-2034 | | | | 495,000 | | | | 536,035 | |
| | | | |
| | | | | | | | | | | | | | | 7,661,757 | |
| | | | | | | | | | | | | | | | |
|
| Tax Revenue: 7.23% | |
Chicago IL Certificate of Participation River Point Plaza Redevelopment Project Series A 144A | | | 4.84 | | | | 4-15-2028 | | | | 2,500,000 | | | | 2,499,300 | |
Chicago IL Metropolitan Pier & Exposition Authority CAB McCormick Place Expansion Project Series A (National Insured) ¤ | | | 0.00 | | | | 12-15-2030 | | | | 11,000,000 | | | | 6,382,750 | |
Chicago IL Metropolitan Pier & Exposition Authority CAB McCormick Place Expansion Project Series B (National Insured) ¤ | | | 0.00 | | | | 6-15-2029 | | | | 1,950,000 | | | | 1,215,962 | |
Chicago IL Metropolitan Pier & Exposition Authority CAB McCormick Place Expansion Project Series B | | | 5.00 | | | | 12-15-2028 | | | | 3,000,000 | | | | 3,152,190 | |
Chicago IL Sales Tax | | | 5.00 | | | | 1-1-2031 | | | | 4,525,000 | | | | 5,234,475 | |
Chicago IL Sales Tax | | | 5.00 | | | | 1-1-2032 | | | | 850,000 | | | | 983,271 | |
Chicago IL Sales Tax | | | 5.00 | | | | 1-1-2033 | | | | 2,785,000 | | | | 3,221,660 | |
Chicago IL Sales Tax Refunding Bond | | | 5.00 | | | | 1-1-2019 | | | | 705,000 | | | | 712,142 | |
Chicago IL Sales Tax Refunding Bond | | | 5.00 | | | | 1-1-2025 | | | | 1,775,000 | | | | 1,860,537 | |
Chicago IL Sales Tax Refunding Bond | | | 5.00 | | | | 1-1-2030 | | | | 2,250,000 | | | | 2,602,777 | |
Illinois Sales Tax Revenue Build Illinois Bond | | | 5.00 | | | | 6-15-2029 | | | | 1,000,000 | | | | 1,069,770 | |
The accompanying notes are an integral part of these financial statements.
| | | | | | |
| Portfolio of investments—June 30, 2018 (unaudited) | | Wells Fargo Managed Account CoreBuilder Shares – Series M | | | 11 | |
| | | | | | | | | | | | | | | | |
| Security name | | Interest rate | | | Maturity date | | | Principal | | | Value | |
|
| Tax Revenue (continued) | |
Illinois Sales Tax Revenue Build Illinois Bond | | | 5.00 | % | | | 6-15-2032 | | | $ | 1,560,000 | | | $ | 1,665,175 | |
Illinois Sales Tax Revenue Second Series (National Insured) | | | 5.75 | | | | 6-15-2020 | | | | 1,005,000 | | | | 1,070,928 | |
Illinois Series 2013 | | | 5.00 | | | | 6-15-2024 | | | | 1,000,000 | | | | 1,103,940 | |
Illinois Series A | | | 4.00 | | | | 1-1-2029 | | | | 1,000,000 | | | | 968,300 | |
Illinois Series A | | | 5.00 | | | | 6-1-2019 | | | | 465,000 | | | | 475,314 | |
Illinois Sports Facilities Authority State Tax Supported CAB (AGM Insured) | | | 5.25 | | | | 6-15-2031 | | | | 2,500,000 | | �� | | 2,728,900 | |
Illinois Sports Facilities Authority State Tax Supported Refunding Bond (AGM Insured) | | | 5.00 | | | | 6-15-2028 | | | | 1,500,000 | | | | 1,629,960 | |
Illinois State Series A | | | 5.00 | | | | 1-1-2027 | | | | 2,000,000 | | | | 2,061,980 | |
Metropolitan Pier & Exposition Authority CAB McCormick Place Expansion Project Series A (National Insured) ¤ | | | 0.00 | | | | 12-15-2019 | | | | 1,135,000 | | | | 1,086,887 | |
Metropolitan Pier & Exposition Authority CAB McCormick Place Expansion Project Series B-1 (AGM Insured) ¤ | | | 0.00 | | | | 6-15-2027 | | | | 5,150,000 | | | | 3,625,652 | |
| | | | |
| | | | | | | | | | | | | | | 45,351,870 | |
| | | | | | | | | | | | | | | | |
|
| Tobacco Revenue: 0.54% | |
Railsplitter IL Tobacco Settlement Authority | | | 5.00 | | | | 6-1-2024 | | | | 3,000,000 | | | | 3,385,080 | |
| | | | | | | | | | | | | | | | |
|
| Transportation Revenue: 0.17% | |
Illinois Toll Highway Authority Toll Senior Series B | | | 5.00 | | | | 1-1-2039 | | | | 1,000,000 | | | | 1,100,620 | |
| | | | | | | | | | | | | | | | |
|
| Water & Sewer Revenue: 2.03% | |
Chicago IL Wastewater Second Lien Transmission Revenue Project Bonds Series 2014 | | | 5.00 | | | | 1-1-2025 | | | | 1,155,000 | | | | 1,279,232 | |
Chicago IL Wastewater Transmission Second Lien | | | 5.00 | | | | 1-1-2027 | | | | 1,000,000 | | | | 1,074,130 | |
Chicago IL Water Revenue Refunding Second Lien | | | 5.00 | | | | 11-1-2025 | | | | 2,600,000 | | | | 2,941,510 | |
Chicago IL Water Revenue Second Lien Project | | | 5.00 | | | | 11-1-2026 | | | | 2,750,000 | | | | 3,048,017 | |
Chicago IL Waterworks Second Lien | | | 5.00 | | | | 11-1-2030 | | | | 1,000,000 | | | | 1,077,620 | |
Chicago IL Waterworks Second Lien Revenue Bonds Series 2004 | | | 5.00 | | | | 11-1-2027 | | | | 2,250,000 | | | | 2,538,675 | |
Chicago IL Waterworks Second Lien Revenue Bonds Series 2012 | | | 4.00 | | | | 11-1-2020 | | | | 770,000 | | | | 802,509 | |
| | | | |
| | | | | | | | | | | | | | | 12,761,693 | |
| | | | | | | | | | | | | | | | |
| | | | |
| | | | | | | | | | | | | | | 132,693,059 | |
| | | | | | | | | | | | | | | | |
|
Indiana: 3.78% | |
|
| Health Revenue: 1.99% | |
Indiana Finance Authority Health System Franciscan Alliance Incorporated Obligated Group Series C | | | 4.00 | | | | 11-1-2034 | | | | 5,360,000 | | | | 5,541,275 | |
Indiana Health & Educational Facility Financing Authority Series 2006B | | | 1.75 | | | | 11-15-2031 | | | | 7,000,000 | | | | 6,930,420 | |
| | | | |
| | | | | | | | | | | | | | | 12,471,695 | |
| | | | | | | | | | | | | | | | |
|
| Industrial Development Revenue: 0.17% | |
Indiana Finance Authority Ohio River Bridges East End Crossing Project Series A | | | 5.00 | | | | 7-1-2035 | | | | 1,000,000 | | | | 1,075,780 | |
| | | | | | | | | | | | | | | | |
|
| Miscellaneous Revenue: 0.59% | |
Indiana Finance Authority Series M | | | 5.00 | | | | 7-1-2029 | | | | 605,000 | | | | 669,929 | |
Indianapolis IN Local Public Improvement Series 2015E | | | 5.00 | | | | 1-1-2035 | | | | 2,675,000 | | | | 3,068,412 | |
| | | | |
| | | | | | | | | | | | | | | 3,738,341 | |
| | | | | | | | | | | | | | | | |
|
| Resource Recovery Revenue: 0.80% | |
Whiting IN BP Products North America Incorporated Project | | | 2.26 | | | | 12-1-2044 | | | | 5,000,000 | | | | 5,012,050 | |
| | | | | | | | | | | | | | | | |
The accompanying notes are an integral part of these financial statements.
| | | | |
| 12 | | Wells Fargo Managed Account CoreBuilder Shares – Series M | | Portfolio of investments—June 30, 2018 (unaudited) |
| | | | | | | | | | | | | | | | |
| Security name | | Interest rate | | | Maturity date | | | Principal | | | Value | |
|
| Water & Sewer Revenue: 0.23% | |
Indiana Finance Authority Wastewater Utility Project Series A | | | 5.25 | % | | | 10-1-2031 | | | $ | 1,310,000 | | | $ | 1,431,830 | |
| | | | | | | | | | | | | | | | |
| | | | |
| | | | | | | | | | | | | | | 23,729,696 | |
| | | | | | | | | | | | | | | | |
|
Iowa: 0.17% | |
|
| Miscellaneous Revenue: 0.17% | |
Coralville IA Certificate of Participation | | | 4.00 | | | | 6-1-2020 | | | | 500,000 | | | | 519,895 | |
Coralville IA Certificate of Participation | | | 4.00 | | | | 6-1-2021 | | | | 500,000 | | | | 525,670 | |
| | | | |
| | | | | | | | | | | | | | | 1,045,565 | |
| | | | | | | | | | | | | | | | |
|
Kansas: 1.03% | |
|
| Tax Revenue: 1.03% | |
Wyandotte County & Kansas City KS Special Obligation Vacation Village Project Area 4 Major Multi-Sport Athletic Complex Project CAB Series 2015 144A¤ | | | 0.00 | | | | 9-1-2034 | | | | 17,785,000 | | | | 6,460,046 | |
| | | | | | | | | | | | | | | | |
|
Kentucky: 0.41% | |
|
| Transportation Revenue: 0.14% | |
Kentucky Public Transportation Infrastructure Authority Downtown Crossing Project CAB Series B ¤ | | | 0.00 | | | | 7-1-2029 | | | | 1,400,000 | | | | 880,726 | |
| | | | | | | | | | | | | | | | |
|
| Utilities Revenue: 0.27% | |
Paducah KY Electric Plant (AGM Insured) | | | 5.00 | | | | 10-1-2035 | | | | 1,510,000 | | | | 1,669,773 | |
| | | | | | | | | | | | | | | | |
| | | | |
| | | | | | | | | | | | | | | 2,550,499 | |
| | | | | | | | | | | | | | | | |
|
Louisiana: 0.74% | |
|
| Airport Revenue: 0.08% | |
New Orleans LA Aviation Board Gulf Opportunity Zone Consolidated Rental Car Series A | | | 6.50 | | | | 1-1-2040 | | | | 500,000 | | | | 510,265 | |
| | | | | | | | | | | | | | | | |
|
| GO Revenue: 0.18% | |
Louisiana Series A | | | 5.00 | | | | 8-1-2026 | | | | 1,000,000 | | | | 1,118,980 | |
| | | | | | | | | | | | | | | | |
|
| Water & Sewer Revenue: 0.48% | |
Shreveport LA Water & Sewer Series A (Build America Mutual Assurance Company Insured) | | | 4.00 | | | | 12-1-2018 | | | | 3,000,000 | | | | 3,029,340 | |
| | | | | | | | | | | | | | | | |
| | | | |
| | | | | | | | | | | | | | | 4,658,585 | |
| | | | | | | | | | | | | | | | |
|
Maine: 0.06% | |
|
| Airport Revenue: 0.06% | |
Portland ME General Airport | | | 5.00 | | | | 7-1-2022 | | | | 150,000 | | | | 164,651 | |
Portland ME General Airport | | | 5.00 | | | | 7-1-2023 | | | | 175,000 | | | | 193,947 | |
| | | | |
| | | | | | | | | | | | | | | 358,598 | |
| | | | | | | | | | | | | | | | |
|
Maryland: 0.41% | |
|
| Education Revenue: 0.41% | |
Prince George’s County MD Chesapeake Lighthouse Charter School Project Series 2016-A | | | 5.75 | | | | 8-1-2033 | | | | 1,000,000 | | | | 994,970 | |
The accompanying notes are an integral part of these financial statements.
| | | | | | |
| Portfolio of investments—June 30, 2018 (unaudited) | | Wells Fargo Managed Account CoreBuilder Shares – Series M | | | 13 | |
| | | | | | | | | | | | | | | | |
| Security name | | Interest rate | | | Maturity date | | | Principal | | | Value | |
|
| Education Revenue (continued) | |
Prince George’s County MD Chesapeake Lighthouse Charter School Project Series 2016-A | | | 7.00 | % | | | 8-1-2046 | | | $ | 1,500,000 | | | $ | 1,586,685 | |
| | | | |
| | | | | | | | | | | | | | | 2,581,655 | |
| | | | | | | | | | | | | | | | |
|
Massachusetts: 2.07% | |
|
| Education Revenue: 0.02% | |
Massachusetts Development Finance Agency Sabis International Charter Series A | | | 8.00 | | | | 4-15-2039 | | | | 100,000 | | | | 108,040 | |
| | | | | | | | | | | | | | | | |
|
| GO Revenue: 0.87% | |
Massachusetts Series D | | | 4.00 | | | | 5-1-2036 | | | | 5,225,000 | | | | 5,502,709 | |
| | | | | | | | | | | | | | | | |
|
| Health Revenue: 0.91% | |
Massachusetts Development Finance Agency Partners Healthcare Series S-4 | | | 5.00 | | | | 7-1-2038 | | | | 5,000,000 | | | | 5,692,450 | |
| | | | | | | | | | | | | | | | |
|
| Tax Revenue: 0.27% | |
Massachusetts School Building Authority Series A | | | 5.00 | | | | 11-15-2034 | | | | 1,470,000 | | | | 1,683,885 | |
| | | | | | | | | | | | | | | | |
| | | | |
| | | | | | | | | | | | | | | 12,987,084 | |
| | | | | | | | | | | | | | | | |
|
Michigan: 6.64% | |
|
| Education Revenue: 0.20% | |
Michigan Public Educational Facilities Authority Bradford Academy Project †† | | | 8.00 | | | | 9-1-2021 | | | | 100,000 | | | | 86,080 | |
Michigan Public Educational Facilities Authority Landmark Academy Project Series 2010 | | | 6.00 | | | | 6-1-2020 | | | | 205,000 | | | | 205,609 | |
Oakland County MI Economic Development Corporation The Academy of The Sacred Heart Project Series A | | | 6.50 | | | | 12-15-2036 | | | | 490,000 | | | | 496,757 | |
Western Michigan University | | | 5.25 | | | | 11-15-2031 | | | | 400,000 | | | | 453,192 | |
| | | | |
| | | | | | | | | | | | | | | 1,241,638 | |
| | | | | | | | | | | | | | | | |
|
| GO Revenue: 0.14% | |
Wayne County MI Building Improvement Series A | | | 6.75 | | | | 11-1-2039 | | | | 880,000 | | | | 894,441 | |
| | | | | | | | | | | | | | | | |
|
| Health Revenue: 1.90% | |
Michigan Finance Authority Trinity Health Credit Group Series A | | | 5.00 | | | | 12-1-2047 | | | | 11,000,000 | | | | 11,897,600 | |
| | | | | | | | | | | | | | | | |
|
| Tax Revenue: 1.46% | |
Michigan Strategic Fund Limited Obligation Events Center Project Series A | | | 4.13 | | | | 7-1-2045 | | | | 7,500,000 | | | | 7,512,075 | |
Taylor MI Tax Increment Refunding Bond Series B (AGM Insured) | | | 4.00 | | | | 5-1-2020 | | | | 785,000 | | | | 786,303 | |
Taylor MI Tax Increment Refunding Bond Series B (AGM Insured) | | | 4.00 | | | | 5-1-2021 | | | | 870,000 | | | | 871,357 | |
| | | | |
| | | | | | | | | | | | | | | 9,169,735 | |
| | | | | | | | | | | | | | | | |
|
| Water & Sewer Revenue: 2.94% | |
Detroit MI Water Supply System Second Lien Series B (AGM Insured) | | | 7.00 | | | | 7-1-2036 | | | | 715,000 | | | | 752,723 | |
Great Lakes Michigan Water Authority Sewage Disposal System Series 2016-C | | | 5.00 | | | | 7-1-2036 | | | | 3,560,000 | | | | 3,934,797 | |
Great Lakes Michigan Water Authority Water Supply System Series 2016-D | | | 4.00 | | | | 7-1-2032 | | | | 4,000,000 | | | | 4,107,480 | |
Great Lakes Michigan Water Authority Water Supply System Series 2016-D (AGM Insured) | | | 4.00 | | | | 7-1-2033 | | | | 4,000,000 | | | | 4,138,400 | |
Michigan Finance Authority Local Government Loan Program Series D | | | 5.00 | | | | 7-1-2030 | | | | 4,000,000 | | | | 4,429,000 | |
The accompanying notes are an integral part of these financial statements.
| | | | |
| 14 | | Wells Fargo Managed Account CoreBuilder Shares – Series M | | Portfolio of investments—June 30, 2018 (unaudited) |
| | | | | | | | | | | | | | | | |
| Security name | | Interest rate | | | Maturity date | | | Principal | | | Value | |
|
| Water & Sewer Revenue (continued) | |
Michigan Finance Authority Local Government Loan Program Series D4 | | | 5.00 | % | | | 7-1-2029 | | | $ | 1,000,000 | | | $ | 1,107,820 | |
| | | | |
| | | | | | | | | | | | | | | 18,470,220 | |
| | | | | | | | | | | | | | | | |
| | | | |
| | | | | | | | | | | | | | | 41,673,634 | |
| | | | | | | | | | | | | | | | |
|
Minnesota: 0.08% | |
|
| Education Revenue: 0.08% | |
Independence MN Charter School Lease Series A | | | 4.25 | | | | 7-1-2026 | | | | 500,000 | | | | 479,035 | |
| | | | | | | | | | | | | | | | |
|
Mississippi: 1.05% | |
|
| Miscellaneous Revenue: 0.72% | |
Mississippi City of Jackson Convention Center Series A (Municipal Government Guaranty Insured) | | | 5.00 | | | | 3-1-2026 | | | | 3,050,000 | | | | 3,404,898 | |
Mississippi Development Bank Special Obligation Jackson Water & Sewer System Project Series A (AGM Insured) | | | 5.00 | | | | 9-1-2030 | | | | 1,000,000 | | | | 1,088,270 | |
| | | | |
| | | | | | | | | | | | | | | 4,493,168 | |
| | | | | | | | | | | | | | | | |
|
| Resource Recovery Revenue: 0.33% | |
Mississippi Business Finance Corporation AMT Waste Pro USA Incorporated Project 144A | | | 5.00 | | | | 2-1-2036 | | | | 2,000,000 | | | | 2,077,560 | |
| | | | | | | | | | | | | | | | |
| | | | |
| | | | | | | | | | | | | | | 6,570,728 | |
| | | | | | | | | | | | | | | | |
|
Missouri: 0.26% | |
|
| Health Revenue: 0.18% | |
Missouri HEFA | | | 5.00 | | | | 2-1-2021 | | | | 800,000 | | | | 851,880 | |
Missouri HEFA | | | 5.00 | | | | 2-1-2022 | | | | 220,000 | | | | 238,394 | |
| | | | |
| | | | | | | | | | | | | | | 1,090,274 | |
| | | | | | | | | | | | | | | | |
|
| Tax Revenue: 0.08% | |
Raymore MO Tax Increment Refunding & Improvement Raymore Galleria Project Series A | | | 4.00 | | | | 5-1-2020 | | | | 515,000 | | | | 518,842 | |
| | | | | | | | | | | | | | | | |
| | | | |
| | | | | | | | | | | | | | | 1,609,116 | |
| | | | | | | | | | | | | | | | |
|
New Hampshire: 0.71% | |
|
| Water & Sewer Revenue: 0.71% | |
New Hampshire Business Authority Water Facility Pennichuck Water Works Incorporated Project Series A | | | 5.00 | | | | 1-1-2026 | | | | 1,000,000 | | | | 1,109,750 | |
New Hampshire Business Authority Water Facility Pennichuck Water Works Incorporated Project Series A | | | 5.00 | | | | 1-1-2027 | | | | 845,000 | | | | 929,677 | |
New Hampshire Business Authority Water Facility Pennichuck Water Works Incorporated Project Series A | | | 5.00 | | | | 1-1-2028 | | | | 480,000 | | | | 525,446 | |
New Hampshire Business Authority Water Facility Pennichuck Water Works Incorporated Project Series A | | | 5.00 | | | | 1-1-2028 | | | | 1,690,000 | | | | 1,860,859 | |
| | | | |
| | | | | | | | | | | | | | | 4,425,732 | |
| | | | | | | | | | | | | | | | |
|
New Jersey: 8.47% | |
|
| Education Revenue: 1.68% | |
New Jersey EDA Educational Facilities Series AB | | | 5.00 | | | | 6-1-2022 | | | | 1,875,000 | | | | 2,015,231 | |
The accompanying notes are an integral part of these financial statements.
| | | | | | |
| Portfolio of investments—June 30, 2018 (unaudited) | | Wells Fargo Managed Account CoreBuilder Shares – Series M | | | 15 | |
| | | | | | | | | | | | | | | | |
| Security name | | Interest rate | | | Maturity date | | | Principal | | | Value | |
|
| Education Revenue (continued) | |
New Jersey EDA Hatikvah International Academy Charter School Project Series A 144A | | | 5.00 | % | | | 7-1-2027 | | | $ | 500,000 | | | $ | 513,855 | |
New Jersey EDA Hatikvah International Academy Charter School Project Series A 144A | | | 5.25 | | | | 7-1-2037 | | | | 1,500,000 | | | | 1,512,840 | |
New Jersey EDA School Facilities Drew University Series C (National Insured) | | | 5.25 | | | | 7-1-2020 | | | | 2,060,000 | | | | 2,199,462 | |
New Jersey EDA Student Loan Series 1 | | | 5.50 | | | | 12-1-2021 | | | | 2,900,000 | | | | 3,190,696 | |
New Jersey Educational Facilities Authority Higher Education Facilities Trust Fund | | | 5.00 | | | | 6-15-2025 | | | | 1,000,000 | | | | 1,086,080 | |
| | | | |
| | | | | | | | | | | | | | | 10,518,164 | |
| | | | | | | | | | | | | | | | |
|
| GO Revenue: 0.62% | |
City of Bayonne NJ School District (AGM Insured) | | | 5.00 | | | | 7-15-2021 | | | | 1,300,000 | | | | 1,403,844 | |
Newark NJ Qualified General Improvement Series A | | | 5.00 | | | | 7-15-2025 | | | | 2,355,000 | | | | 2,490,695 | |
| | | | |
| | | | | | | | | | | | | | | 3,894,539 | |
| | | | | | | | | | | | | | | | |
|
| Housing Revenue: 1.72% | |
New Jersey Housing and Mortgage Finance Agency Series B | | | 3.40 | | | | 4-1-2026 | | | | 4,430,000 | | | | 4,429,823 | |
New Jersey Housing and Mortgage Finance Agency Series B | | | 3.30 | | | | 10-1-2025 | | | | 4,400,000 | | | | 4,399,868 | |
New Jersey Housing and Mortgage Finance Agency Series B | | | 3.45 | | | | 10-1-2026 | | | | 1,940,000 | | | | 1,941,319 | |
| | | | |
| | | | | | | | | | | | | | | 10,771,010 | |
| | | | | | | | | | | | | | | | |
|
| Miscellaneous Revenue: 3.63% | |
Essex County NJ Improvement Authority Lease Newark Project Series A | | | 6.25 | | | | 11-1-2030 | | | | 1,490,000 | | | | 1,562,697 | |
New Jersey EDA Police Barracks Project | | | 5.00 | | | | 6-15-2020 | | | | 285,000 | | | | 298,364 | |
New Jersey EDA Prerefunded Bond Motor Vehicle Surcharges Series A (National Insured) | | | 5.25 | | | | 7-1-2026 | | | | 45,000 | | | | 54,134 | |
New Jersey EDA School Facilities Construction Notes Series PP | | | 5.00 | | | | 6-15-2019 | | | | 1,800,000 | | | | 1,850,202 | |
New Jersey EDA School Facilities Construction Project Series NN | | | 5.00 | | | | 3-1-2027 | | | | 3,150,000 | | | | 3,338,937 | |
New Jersey EDA School Facilities Construction Project Series NN | | | 5.00 | | | | 3-1-2028 | | | | 5,000,000 | | | | 5,286,700 | |
New Jersey EDA Unrefunded Bond Motor Vehicle Surcharges Series A (National Insured) | | | 5.25 | | | | 7-1-2026 | | | | 205,000 | | | | 232,888 | |
New Jersey TTFA Series A | | | 5.00 | | | | 6-15-2020 | | | | 1,600,000 | | | | 1,679,392 | |
New Jersey TTFA Series A | | | 5.25 | | | | 12-15-2022 | | | | 600,000 | | | | 655,836 | |
New Jersey TTFA Series B (National Insured) | | | 5.50 | | | | 12-15-2021 | | | | 7,115,000 | | | | 7,803,874 | |
| | | | |
| | | | | | | | | | | | | | | 22,763,024 | |
| | | | | | | | | | | | | | | | |
|
| Transportation Revenue: 0.82% | |
New Jersey TTFA CAB Series A ¤ | | | 0.00 | | | | 12-15-2031 | | | | 2,500,000 | | | | 1,397,750 | |
New Jersey TTFA Series A | | | 5.00 | | | | 6-15-2029 | | | | 2,000,000 | | | | 2,187,720 | |
New Jersey TTFA Series AA | | | 5.00 | | | | 6-15-2045 | | | | 1,500,000 | | | | 1,582,755 | |
| | | | |
| | | | | | | | | | | | | | | 5,168,225 | |
| | | | | | | | | | | | | | | | |
| | | | |
| | | | | | | | | | | | | | | 53,114,962 | |
| | | | | | | | | | | | | | | | |
|
New Mexico: 0.43% | |
|
| Utilities Revenue: 0.43% | |
New Mexico Municipal Energy Acquisition Authority Gas Supply Subordinate Bond Series B (1 Month LIBOR +0.75%) (Royal Bank of Canada SPA) ± | | | 2.08 | | | | 11-1-2039 | | | | 2,725,000 | | | | 2,727,562 | |
| | | | | | | | | | | | | | | | |
|
New York: 5.33% | |
|
| Airport Revenue: 0.18% | |
New York Transportation Development Corporation Special Facilities Laguardia Airport Project Series 2018 | | | 5.00 | | | | 1-1-2030 | | | | 1,000,000 | | | | 1,135,850 | |
| | | | | | | | | | | | | | | | |
The accompanying notes are an integral part of these financial statements.
| | | | |
| 16 | | Wells Fargo Managed Account CoreBuilder Shares – Series M | | Portfolio of investments—June 30, 2018 (unaudited) |
| | | | | | | | | | | | | | | | |
| Security name | | Interest rate | | | Maturity date | | | Principal | | | Value | |
|
| Education Revenue: 0.69% | |
Hempstead Town NY Local Development Corporation The Academy Charter School Project Series A | | | 6.24 | % | | | 2-1-2047 | | | $ | 3,500,000 | | | $ | 3,283,350 | |
Hempstead Town NY Local Development Corporation The Academy Charter School Project Series A | | | 7.65 | | | | 2-1-2044 | | | | 500,000 | | | | 516,870 | |
Monroe County NY IDAG Refunding Bond Monroe Community College Association (AGM Insured) | | | 5.00 | | | | 1-15-2038 | | | | 500,000 | | | | 545,040 | |
| | | | |
| | | | | | | | | | | | | | | 4,345,260 | |
| | | | | | | | | | | | | | | | |
|
| GO Revenue: 0.20% | |
Nassau County NY Series F | | | 5.00 | | | | 10-1-2020 | | | | 150,000 | | | | 156,351 | |
New York NY Series F-1 | | | 5.00 | | | | 3-1-2032 | | | | 1,000,000 | | | | 1,111,180 | |
| | | | |
| | | | | | | | | | | | | | | 1,267,531 | |
| | | | | | | | | | | | | | | | |
|
| Health Revenue: 0.37% | |
Onondaga NY Civic Development Corporation St. Joseph’s Hospital Health Center Project Series A | | | 4.63 | | | | 7-1-2022 | | | | 1,500,000 | | | | 1,545,795 | |
Onondaga NY Civic Development Corporation St. Joseph’s Hospital Health Center Project Series A | | | 5.00 | | | | 7-1-2019 | | | | 750,000 | | | | 761,115 | |
| | | | |
| | | | | | | | | | | | | | | 2,306,910 | |
| | | | | | | | | | | | | | | | |
|
| Miscellaneous Revenue: 0.03% | |
New York Dormitory Authority State University Educational Facilities Series A | | | 5.50 | | | | 5-15-2019 | | | | 170,000 | | | | 175,829 | |
| | | | | | | | | | | | | | | | |
|
| Tax Revenue: 1.42% | |
New York Dormitory Authority Series B | | | 5.00 | | | | 2-15-2044 | | | | 8,000,000 | | | | 8,917,920 | |
| | | | | | | | | | | | | | | | |
|
| Tobacco Revenue: 0.09% | |
Suffolk NY Tobacco Asset Securitization Corporation | | | 5.00 | | | | 6-1-2024 | | | | 500,000 | | | | 555,355 | |
| | | | | | | | | | | | | | | | |
|
| Transportation Revenue: 0.92% | |
New York Metropolitan Transportation Authority Series C | | | 5.25 | | | | 11-15-2031 | | | | 5,000,000 | | | | 5,781,350 | |
| | | | | | | | | | | | | | | | |
|
| Utilities Revenue: 0.72% | |
New York NY IDA Brooklyn Navy Yard Cogeneration Partners LP | | | 5.65 | | | | 10-1-2028 | | | | 1,500,000 | | | | 1,514,430 | |
New York NY IDA Brooklyn Navy Yard Cogeneration Partners LP | | | 5.75 | | | | 10-1-2036 | | | | 3,000,000 | | | | 3,028,860 | |
| | | | |
| | | | | | | | | | | | | | | 4,543,290 | |
| | | | | | | | | | | | | | | | |
|
| Water & Sewer Revenue: 0.71% | |
New York NY Municipal Water Finance Authority Adjusted Fiscal 2013 Subordinate Bond Series AA-2 (Bank of Tokyo-Mitsubishi SPA) ø | | | 1.55 | | | | 6-15-2046 | | | | 4,040,000 | | | | 4,040,000 | |
Western Nassau County NY Water Authority Series B | | | 5.00 | | | | 4-1-2025 | | | | 340,000 | | | | 391,758 | |
| | | | |
| | | | | | | | | | | | | | | 4,431,758 | |
| | | | | | | | | | | | | | | | |
| | | | |
| | | | | | | | | | | | | | | 33,461,053 | |
| | | | | | | | | | | | | | | | |
|
Ohio: 2.32% | |
|
| Health Revenue: 0.45% | |
Cleveland Cuyahoga County OH Port Authority Economic Development Center for Dialysis Care Project Series A | | | 5.00 | | | | 12-1-2037 | | | | 2,700,000 | | | | 2,802,546 | |
| | | | | | | | | | | | | | | | |
The accompanying notes are an integral part of these financial statements.
| | | | | | |
| Portfolio of investments—June 30, 2018 (unaudited) | | Wells Fargo Managed Account CoreBuilder Shares – Series M | | | 17 | |
| | | | | | | | | | | | | | | | |
| Security name | | Interest rate | | | Maturity date | | | Principal | | | Value | |
|
| Miscellaneous Revenue: 0.82% | |
Maple Heights OH City School District Certificate of Participation | | | 6.00 | % | | | 11-1-2028 | | | $ | 620,000 | | | $ | 629,108 | |
Ohio Private Activity Bond AMT Portsmouth Bypass Project (AGM Insured) | | | 5.00 | | | | 12-31-2035 | | | | 2,000,000 | | | | 2,201,560 | |
Ohio Private Activity Bond Series A (AGM Insured) | | | 5.00 | | | | 12-31-2029 | | | | 2,070,000 | | | | 2,304,510 | |
| | | | |
| | | | | | | | | | | | | | | 5,135,178 | |
| | | | | | | | | | | | | | | | |
|
| Resource Recovery Revenue: 0.57% | |
Ohio Air Quality Development Authority Ohio Valley Electric Corporation Series E | | | 5.63 | | | | 10-1-2019 | | | | 3,500,000 | | | | 3,592,225 | |
| | | | | | | | | | | | | | | | |
|
| Utilities Revenue: 0.48% | |
Lancaster OH Port Authority (1 Month LIBOR +0.72%) (Royal Bank of Canada SPA) ± | | | 2.05 | | | | 5-1-2038 | | | | 3,000,000 | | | | 3,003,540 | |
| | | | | | | | | | | | | | | | |
| | | | |
| | | | | | | | | | | | | | | 14,533,489 | |
| | | | | | | | | | | | | | | | |
|
Oklahoma: 0.48% | |
|
| Health Revenue: 0.13% | |
Oklahoma Development Finance Authority OU Medicine Project Series B | | | 5.50 | | | | 8-15-2057 | | | | 750,000 | | | | 853,523 | |
| | | | | | | | | | | | | | | | |
|
| Miscellaneous Revenue: 0.35% | |
Garfield County OK Educational Facilities Authority Enid Public Schools Project | | | 5.00 | | | | 9-1-2027 | | | | 1,895,000 | | | | 2,188,232 | |
| | | | | | | | | | | | | | | | |
| | | | |
| | | | | | | | | | | | | | | 3,041,755 | |
| | | | | | | | | | | | | | | | |
|
Oregon: 0.11% | |
|
| Education Revenue: 0.03% | |
Oregon Facilities Authority Southern Oregon University Project (AGM Insured) | | | 4.00 | | | | 7-1-2023 | | | | 185,000 | | | | 195,776 | |
| | | | | | | | | | | | | | | | |
|
| Health Revenue: 0.08% | |
Deschutes County OR Hospital Facilities Authority Cascade Healthcare Community Incorporated Project | | | 8.25 | | | | 1-1-2038 | | | | 500,000 | | | | 516,410 | |
| | | | | | | | | | | | | | | | |
| | | | |
| | | | | | | | | | | | | | | 712,186 | |
| | | | | | | | | | | | | | | | |
|
Pennsylvania: 8.83% | |
|
| Airport Revenue: 0.45% | |
Philadelphia PA Airport Series A | | | 5.00 | | | | 7-1-2047 | | | | 1,500,000 | | | | 1,683,405 | |
Philadelphia PA Airport Series B | | | 5.00 | | | | 7-1-2042 | | | | 1,000,000 | | | | 1,126,400 | |
| | | | |
| | | | | | | | | | | | | | | 2,809,805 | |
| | | | | | | | | | | | | | | | |
|
| Education Revenue: 1.02% | |
Allegheny County PA IDA Propel Charter School Sunrise Project | | | 5.25 | | | | 7-15-2023 | | | | 405,000 | | | | 422,893 | |
East Hempfield Township PA IDA Student Services Incorporated Student Housing Project Millersville University | | | 5.00 | | | | 7-1-2021 | | | | 660,000 | | | | 703,190 | |
East Hempfield Township PA IDA Student Services Incorporated Student Housing Project Millersville University | | | 5.00 | | | | 7-1-2023 | | | | 760,000 | | | | 830,756 | |
Philadelphia PA Authority for Industrial Development Southwest Leadership Academy Series A | | | 6.47 | | | | 11-1-2037 | | | | 2,500,000 | | | | 2,445,825 | |
Philadelphia PA IDA 1st Philadelphia Preparatory Charter School Project Series A | | | 7.00 | | | | 6-15-2033 | | | | 1,000,000 | | | | 1,125,320 | |
Philadelphia PA IDA Discovery Charter School Project | | | 5.00 | | | | 4-1-2022 | | | | 370,000 | | | | 373,493 | |
Philadelphia PA IDA Mariana Bracetti Academy Project | | | 6.25 | | | | 12-15-2021 | | | | 155,000 | | | | 168,001 | |
Philadelphia PA IDA New Foundations Charter School Project | | | 6.00 | | | | 12-15-2027 | | | | 280,000 | | | | 305,712 | |
| | | | |
| | | | | | | | | | | | | | | 6,375,190 | |
| | | | | | | | | | | | | | | | |
The accompanying notes are an integral part of these financial statements.
| | | | |
| 18 | | Wells Fargo Managed Account CoreBuilder Shares – Series M | | Portfolio of investments—June 30, 2018 (unaudited) |
| | | | | | | | | | | | | | | | |
| Security name | | Interest rate | | | Maturity date | | | Principal | | | Value | |
|
| GO Revenue: 1.86% | |
Allegheny County PA Series C-72 | | | 5.25 | % | | | 12-1-2032 | | | $ | 1,000,000 | | | $ | 1,128,630 | |
Philadelphia PA Refunding Bond Series A | | | 5.25 | | | | 7-15-2033 | | | | 1,000,000 | | | | 1,111,760 | |
Philadelphia PA School District Series C | | | 5.00 | | | | 9-1-2020 | | | | 250,000 | | | | 265,835 | |
Philadelphia PA School District Series E | | | 5.25 | | | | 9-1-2022 | | | | 1,350,000 | | | | 1,433,160 | |
Philadelphia PA School District Series F | | | 5.00 | | | | 9-1-2036 | | | | 3,000,000 | | | | 3,330,420 | |
Philadelphia PA School District Series F | | | 5.00 | | | | 9-1-2037 | | | | 1,000,000 | | | | 1,107,890 | |
Philadelphia PA School District Unrefunded Bond Series F | | | 5.00 | | | | 9-1-2030 | | | | 1,000,000 | | | | 1,126,810 | |
Philadelphia PA Series A | | | 5.00 | | | | 8-1-2025 | | | | 1,905,000 | | | | 2,184,197 | |
| | | | |
| | | | | | | | | | | | | | | 11,688,702 | |
| | | | | | | | | | | | | | | | |
|
| Health Revenue: 0.32% | |
Berks County PA Municipal Authority Reading Hospital & Medical Center Project Series B | | | 3.01 | | | | 11-1-2039 | | | | 2,000,000 | | | | 2,030,500 | |
| | | | | | | | | | | | | | | | |
|
| Industrial Development Revenue: 1.83% | |
Pennsylvania EDFA Bridges Finco LP | | | 5.00 | | | | 12-31-2034 | | | | 5,000,000 | | | | 5,504,250 | |
York County PA IDA Philadelphia Electric Company Project Series A | | | 2.55 | | | | 6-1-2036 | | | | 6,000,000 | | | | 5,996,580 | |
| | | | |
| | | | | | | | | | | | | | | 11,500,830 | |
| | | | | | | | | | | | | | | | |
|
| Miscellaneous Revenue: 2.55% | |
Commonwealth Financing Authority Pennsylvania Series B-1 (AGM Insured) | | | 5.00 | | | | 6-1-2025 | | | | 500,000 | | | | 574,085 | |
Delaware Valley PA Regional Finance Authority Local Government Series A (Ambac Insured) | | | 5.50 | | | | 8-1-2028 | | | | 1,400,000 | | | | 1,670,144 | |
Philadelphia PA IDA Cultural & Commercial Corridors Program Series A | | | 5.00 | | | | 12-1-2025 | | | | 1,995,000 | | | | 2,286,849 | |
Philadelphia PA IDA National Board of Medical Examiners Project | | | 5.00 | | | | 5-1-2026 | | | | 1,420,000 | | | | 1,645,752 | |
Philadelphia PA Public School Building Authority Unrefunded Bond Series A | | | 5.00 | | | | 6-1-2036 | | | | 4,525,000 | | | | 5,019,175 | |
Philadelphia PA Public School Building Authority Harrisburg School District Project Series A (AGM Insured) | | | 5.00 | | | | 12-1-2023 | | | | 1,710,000 | | | | 1,921,390 | |
Philadelphia PA Public School Building Authority Prerefunded Bond Series A | | | 5.00 | | | | 6-1-2036 | | | | 190,000 | | | | 225,826 | |
Philadelphia PA Municipal Authority Revenue Refunding City Agreement Juvenile | | | 5.00 | | | | 4-1-2033 | | | | 2,355,000 | | | | 2,624,648 | |
| | | | |
| | | | | | | | | | | | | | | 15,967,869 | |
| | | | | | | | | | | | | | | | |
|
| Resource Recovery Revenue: 0.00% | |
Delaware County PA IDA Resource Recovery Facility Series A | | | 6.20 | | | | 7-1-2019 | | | | 20,000 | | | | 20,051 | |
| | | | | | | | | | | | | | | | |
|
| Transportation Revenue: 0.38% | |
Pennsylvania Turnpike Commission Series A-1 | | | 5.00 | | | | 12-1-2047 | | | | 1,000,000 | | | | 1,121,920 | |
Pennsylvania Turnpike Commission Subordinate Bond Series E | | | 6.38 | | | | 12-1-2038 | | | | 1,000,000 | | | | 1,238,770 | |
| | | | |
| | | | | | | | | | | | | | | 2,360,690 | |
| | | | | | | | | | | | | | | | |
|
| Water & Sewer Revenue: 0.42% | |
Philadelphia PA Water & Sewer Series B | | | 5.00 | | | | 7-1-2032 | | | | 1,145,000 | | | | 1,304,006 | |
Reading PA Water Authority Series 2011 | | | 5.25 | | | | 12-1-2036 | | | | 1,250,000 | | | | 1,359,138 | |
| | | | |
| | | | | | | | | | | | | | | 2,663,144 | |
| | | | | | | | | | | | | | | | |
| | | | |
| | | | | | | | | | | | | | | 55,416,781 | |
| | | | | | | | | | | | | | | | |
The accompanying notes are an integral part of these financial statements.
| | | | | | |
| Portfolio of investments—June 30, 2018 (unaudited) | | Wells Fargo Managed Account CoreBuilder Shares – Series M | | | 19 | |
| | | | | | | | | | | | | | | | |
| Security name | | Interest rate | | | Maturity date | | | Principal | | | Value | |
|
South Carolina: 1.93% | |
|
| Education Revenue: 0.17% | |
South Carolina Jobs EDA York Preparatory Academy Project Series A | | | 7.00 | % | | | 11-1-2033 | | | $ | 1,000,000 | | | $ | 1,061,610 | |
| | | | | | | | | | | | | | | | |
|
| Health Revenue: 0.11% | |
Lexington County SC Health Services District Lexmed Obligated Group | | | 5.00 | | | | 11-1-2022 | | | | 620,000 | | | | 682,918 | |
| | | | | | | | | | | | | | | | |
|
| Miscellaneous Revenue: 0.53% | |
South Carolina Public Service Authority Series C | | | 5.00 | | | | 12-1-2030 | | | | 3,010,000 | | | | 3,341,040 | |
| | | | | | | | | | | | | | | | |
|
| Resource Recovery Revenue: 0.25% | |
South Carolina Jobs EDA Solid Waste Disposal AMT RePower South Berkeley LLC Project Green Bond 144A | | | 6.00 | | | | 2-1-2035 | | | | 1,500,000 | | | | 1,528,080 | |
| | | | | | | | | | | | | | | | |
|
| Water & Sewer Revenue: 0.87% | |
Columbia SC Waterworks & Sewer System | | | 5.00 | | | | 2-1-2043 | | | | 5,000,000 | | | | 5,478,450 | |
| | | | | | | | | | | | | | | | |
| | | | |
| | | | | | | | | | | | | | | 12,092,098 | |
| | | | | | | | | | | | | | | | |
|
Tennessee: 0.79% | |
|
| Health Revenue: 0.49% | |
Metropolitan Government of Nashville & Davidson County TN Health & Educational Facilities Board Series 2001B-1 | | | 1.55 | | | | 11-15-2030 | | | | 3,100,000 | | | | 3,076,037 | |
| | | | | | | | | | | | | | | | |
|
| Tax Revenue: 0.28% | |
Bristol TN Industrial Development Board The Pinnacle Project Series A 144A | | | 5.13 | | | | 12-1-2042 | | | | 1,800,000 | | | | 1,742,292 | |
| | | | | | | | | | | | | | | | |
|
| Utilities Revenue: 0.02% | |
Tennessee Energy Acquisition Corporation Series A | | | 5.25 | | | | 9-1-2018 | | | | 150,000 | | | | 150,863 | |
| | | | | | | | | | | | | | | | |
| | | | |
| | | | | | | | | | | | | | | 4,969,192 | |
| | | | | | | | | | | | | | | | |
|
Texas: 7.62% | |
|
| Airport Revenue: 0.44% | |
Austin TX Airport System AMT | | | 5.00 | | | | 11-15-2044 | | | | 2,500,000 | | | | 2,728,650 | |
| | | | | | | | | | | | | | | | |
|
| Education Revenue: 1.17% | |
Arlington TX Higher Education Finance Corporation Universal Academy Project Series A | | | 7.13 | | | | 3-1-2044 | | | | 1,250,000 | | | | 1,288,150 | |
Clifton TX Higher Educational Finance Corporation International Leadership Series A | | | 5.50 | | | | 8-15-2035 | | | | 2,000,000 | | | | 2,054,320 | |
Clifton TX Higher Educational Finance Corporation International Leadership Series A | | | 5.75 | | | | 8-15-2038 | | | | 1,000,000 | | | | 1,036,510 | |
Clifton TX Higher Educational Finance Corporation Uplift Education Project Series A | | | 3.10 | | | | 12-1-2022 | | | | 1,545,000 | | | | 1,548,770 | |
Houston TX Higher Education Finance Corporation Series A | | | 4.00 | | | | 2-15-2022 | | | | 120,000 | | | | 123,647 | |
New Hope Cultural Educational Facilities Finance Corporation Series A 144A | | | 5.00 | | | | 8-15-2026 | | | | 500,000 | | | | 511,400 | |
Newark TX Higher Educatinal Finance Corporation Austin Achieve Public School Incorporated Series A | | | 5.00 | | | | 6-15-2032 | | | | 750,000 | | | | 755,588 | |
| | | | |
| | | | | | | | | | | | | | | 7,318,385 | |
| | | | | | | | | | | | | | | | |
|
| GO Revenue: 1.41% | |
Arlington TX Permanent Improvement Refunding Bonds Series | | | 5.00 | | | | 8-15-2023 | | | | 2,940,000 | | | | 3,349,983 | |
Harris County TX Port of Houston Authority Series D-1 | | | 5.00 | | | | 10-1-2035 | | | | 2,190,000 | | | | 2,335,920 | |
Houston TX Public Improvement Refunding Bonds Series A | | | 5.00 | | | | 3-1-2029 | | | | 1,000,000 | | | | 1,166,450 | |
The accompanying notes are an integral part of these financial statements.
| | | | |
| 20 | | Wells Fargo Managed Account CoreBuilder Shares – Series M | | Portfolio of investments—June 30, 2018 (unaudited) |
| | | | | | | | | | | | | | | | |
| Security name | | Interest rate | | | Maturity date | | | Principal | | | Value | |
|
| GO Revenue (continued) | |
Northside TX Independent School District Building Project | | | 2.00 | % | | | 8-1-2044 | | | $ | 2,000,000 | | | $ | 2,005,300 | |
| | | | |
| | | | | | | | | | | | | | | 8,857,653 | |
| | | | | | | | | | | | | | | | |
|
| Miscellaneous Revenue: 1.48% | |
Lewisville TX Combination Contract Castle Hills Public Improvement Bonds District #6 144A | | | 6.00 | | | | 9-1-2037 | | | | 6,000,000 | | | | 6,252,540 | |
Texas Transportation Commission Highway | | | 5.00 | | | | 4-1-2028 | | | | 2,605,000 | | | | 3,052,852 | |
| | | | |
| | | | | | | | | | | | | | | 9,305,392 | |
| | | | | | | | | | | | | | | | |
|
| Resource Recovery Revenue: 1.19% | |
Gulf Coast Waste Disposal Authority Waste Management of Texas Series B | | | 2.25 | | | | 5-1-2028 | | | | 7,500,000 | | | | 7,492,575 | |
| | | | | | | | | | | | | | | | |
|
| Transportation Revenue: 1.65% | |
North Texas Tollway Authority System Series A | | | 5.00 | | | | 1-1-2023 | | | | 3,500,000 | | | | 3,926,755 | |
North Texas Tollway Authority System Series B | | | 5.00 | | | | 1-1-2026 | | | | 350,000 | | | | 373,835 | |
Texas Private Activity Bond Surface Transportation Corporation LBJ Infrastructure Project | | | 7.50 | | | | 6-30-2033 | | | | 250,000 | | | | 274,293 | |
Texas Private Activity Bond Surface Transportation Corporation Project NTE Mobility Partners Segments LLC | | | 7.00 | | | | 12-31-2038 | | | | 1,300,000 | | | | 1,540,708 | |
Texas Tender Option Bond Trust Receipts/Floater Certificates Series 2015-XM0085 (Barclays Bank plc LIQ) 144Aø | | | 1.71 | | | | 7-1-2021 | | | | 4,215,000 | | | | 4,215,000 | |
| | | | |
| | | | | | | | | | | | | | | 10,330,591 | |
| | | | | | | | | | | | | | | | |
|
| Utilities Revenue: 0.05% | |
Texas SA Energy Acquisition Public Facility Corporation Gas Supply | | | 5.50 | | | | 8-1-2019 | | | | 330,000 | | | | 342,573 | |
| | | | | | | | | | | | | | | | |
|
| Water & Sewer Revenue: 0.23% | |
Upper Trinity TX Regional Water District (Build America Mutual Assurance Company Insured) | | | 5.00 | | | | 8-1-2028 | | | | 750,000 | | | | 854,798 | |
Upper Trinity TX Regional Water District (Build America Mutual Assurance Company Insured) | | | 5.00 | | | | 8-1-2029 | | | | 500,000 | | | | 565,875 | |
| | | | |
| | | | | | | | | | | | | | | 1,420,673 | |
| | | | | | | | | | | | | | | | |
| | | | |
| | | | | | | | | | | | | | | 47,796,492 | |
| | | | | | | | | | | | | | | | |
|
Utah: 0.87% | |
|
| Education Revenue: 0.87% | |
Utah Charter School Finance Authority Christian School Early Light Academy Project 144A | | | 4.50 | | | | 7-15-2027 | | | | 900,000 | | | | 889,470 | |
Utah Charter School Finance Authority Freedom Academy Foundation Project (CSCE Insured) 144A | | | 5.25 | | | | 6-15-2037 | | | | 4,500,000 | | | | 4,564,035 | |
| | | | |
| | | | | | | | | | | | | | | 5,453,505 | |
| | | | | | | | | | | | | | | | |
|
Vermont: 0.55% | |
|
| Airport Revenue: 0.06% | |
Burlington VT Airport (AGM Insured) | | | 5.00 | | | | 7-1-2018 | | | | 280,000 | | | | 280,000 | |
Burlington VT Airport (AGM Insured) | | | 5.00 | | | | 7-1-2019 | | | | 100,000 | | | | 103,120 | |
| | | | |
| | | | | | | | | | | | | | | 383,120 | |
| | | | | | | | | | | | | | | | |
The accompanying notes are an integral part of these financial statements.
| | | | | | |
| Portfolio of investments—June 30, 2018 (unaudited) | | Wells Fargo Managed Account CoreBuilder Shares – Series M | | | 21 | |
| | | | | | | | | | | | | | | | |
| Security name | | Interest rate | | | Maturity date | | | Principal | | | Value | |
|
| Education Revenue: 0.49% | |
Vermont Student Assistance Corporation Series B Class A-2 (3 Month LIBOR +3.00%) ± | | | 5.32 | % | | | 12-3-2035 | | | $ | 500,000 | | | $ | 530,150 | |
Vermont Student Assistance Corporation Series B Class B (1 Month LIBOR +1.00%) ± | | | 2.98 | | | | 6-2-2042 | | | | 2,566,137 | | | | 2,527,799 | |
| | | | |
| | | | | | | | | | | | | | | 3,057,949 | |
| | | | | | | | | | | | | | | | |
| | | | |
| | | | | | | | | | | | | | | 3,441,069 | |
| | | | | | | | | | | | | | | | |
|
Virginia: 0.69% | |
|
| Transportation Revenue: 0.69% | |
Virginia Commonweallth Transportation Series A | | | 5.00 | | | | 5-15-2028 | | | | 2,000,000 | | | | 2,394,860 | |
Virginia Small Business Financing Authority Senior Lien 95 Express Lanes LLC Project | | | 5.00 | | | | 7-1-2034 | | | | 1,800,000 | | | | 1,911,816 | |
| | | | |
| | | | | | | | | | | | | | | 4,306,676 | |
| | | | | | | | | | | | | | | | |
|
Washington: 3.61% | |
|
| GO Revenue: 2.09% | |
King County WA Public Hospital District #1 Valley Medical Center Refunding Bond | | | 5.00 | | | | 12-1-2035 | | | | 5,500,000 | | | | 6,194,595 | |
King County WA Public Hospital District Series 2016 | | | 5.00 | | | | 12-1-2036 | | | | 475,000 | | | | 533,871 | |
Washington State Series D | | | 5.00 | | | | 2-1-2037 | | | | 5,620,000 | | | | 6,384,826 | |
| | | | |
| | | | | | | | | | | | | | | 13,113,292 | |
| | | | | | | | | | | | | | | | |
|
| Health Revenue: 1.52% | |
Washington HCFR Catholic Health Initiatives Series A | | | 5.00 | | | | 1-1-2029 | | | | 1,300,000 | | | | 1,461,200 | |
Washington HCFR Catholic Health Initiatives Series B (SIFMA Municipal Swap +1.00%) ± | | | 2.51 | | | | 1-1-2035 | | | | 5,000,000 | | | | 5,014,050 | |
Washington HCFR Catholic Health Initiatives Series B (SIFMA Municipal Swap +1.40%) ± | | | 2.91 | | | | 1-1-2035 | | | | 3,000,000 | | | | 3,031,620 | |
| | | | |
| | | | | | | | | | | | | | | 9,506,870 | |
| | | | | | | | | | | | | | | | |
| | | | |
| | | | | | | | | | | | | | | 22,620,162 | |
| | | | | | | | | | | | | | | | |
|
Wisconsin: 2.26% | |
|
| Airport Revenue: 0.43% | |
Wisconsin PFA Airport Facilities Series C | | | 5.00 | | | | 7-1-2042 | | | | 2,585,000 | | | | 2,734,310 | |
| | | | | | | | | | | | | | | | |
|
| Education Revenue: 1.83% | |
Wisconsin PFA Carolina International School Series A 144A | | | 7.20 | | | | 8-1-2048 | | | | 1,000,000 | | | | 1,087,270 | |
Wisconsin PFA Lease Development University of Kansas Campus Development Project | | | 5.00 | | | | 3-1-2046 | | | | 4,500,000 | | | | 4,953,150 | |
Wisconsin PFA Pine Lake Preparatory 144A | | | 4.95 | | | | 3-1-2030 | | | | 1,370,000 | | | | 1,411,429 | |
Wisconsin PFA Research Triangle High School Project Series 2015-A 144A | | | 5.63 | | | | 7-1-2045 | | | | 1,790,000 | | | | 1,805,322 | |
Wisconsin PFA Research Triangle High School Project Series A 144A | | | 4.38 | | | | 7-1-2025 | | | | 460,000 | | | | 465,667 | |
Wisconsin PFA Research Triangle High School Project Series A 144A | | | 5.38 | | | | 7-1-2035 | | | | 1,730,000 | | | | 1,745,622 | |
| | | | |
| | | | | | | | | | | | | | | 11,468,460 | |
| | | | | | | | | | | | | | | | |
| | | | |
| | | | | | | | | | | | | | | 14,202,770 | |
| | | | | | | | | | | | | | | | |
| |
Total Municipal Obligations (Cost $609,189,814) | | | | 618,015,520 | |
| | | | | | | | | | | | | | | | |
The accompanying notes are an integral part of these financial statements.
| | | | |
| 22 | | Wells Fargo Managed Account CoreBuilder Shares – Series M | | Portfolio of investments—June 30, 2018 (unaudited) |
| | | | | | | | | | | | | | | | |
| Security name | | Yield | | | | | | Shares | | | Value | |
|
Short-Term Investments: 0.17% | |
|
| Investment Companies: 0.17% | |
Wells Fargo Municipal Cash Management Money Market Fund Institutional Class (l)(u) | | | 1.43 | % | | | | | | | 1,048,899 | | | $ | 1,050,052 | |
| | | | | | | | | | | | | | | | |
| |
Total Short-Term Investments (Cost $1,049,877) | | | | 1,050,052 | |
| | | | | | | | | | | | | | | | |
| | | | | | | | |
| Total investments in securities (Cost $610,239,691) | | | 98.69 | % | | | 619,065,572 | |
Other assets and liabilities, net | | | 1.31 | | | | 8,246,360 | |
| | | | | | | | |
| Total net assets | | | 100.00 | % | | $ | 627,311,932 | |
| | | | | | | | |
| ¤ | The security is issued in zero coupon form with no periodic interest payments. |
| 144A | The security may be resold in transactions exempt from registration, normally to qualified institutional buyers, pursuant to Rule 144A under the Securities Act of 1933. |
| †† | On the last interest date, partial interest was paid. |
| ± | Variable rate investment. The rate shown is the rate in effect at period end. |
| ø | Variable rate demand notes are subject to a demand feature which reduces the effective maturity. The maturity date shown represents the final maturity date of the security. The interest rate is determined and reset by the issuer daily, weekly, or monthly depending upon the terms of the security. The rate shown is the rate in effect at period end. |
| (l) | The issuer of the security is an affiliated person of the Fund as defined in the Investment Company Act of 1940. |
| (u) | The rate represents the 7-day annualized yield at period end. |
Abbreviations:
| AGM | Assured Guaranty Municipal |
| Ambac | Ambac Financial Group Incorporated |
| AMT | Alternative minimum tax |
| CAB | Capital appreciation bond |
| CDA | Community Development Authority |
| DW&P | Department of Water & Power |
| ECFA | Educational & Cultural Facilities Authority |
| EDA | Economic Development Authority |
| EDFA | Economic Development Finance Authority |
| HCFR | Healthcare facilities revenue |
| HEFA | Health & Educational Facilities Authority |
| IDA | Industrial Development Authority |
| IDAG | Industrial Development Agency |
| LIBOR | London Interbank Offered Rate |
| National | National Public Finance Guarantee Corporation |
| PCFA | Pollution Control Financing Authority |
| PFA | Public Finance Authority |
| SPA | Standby purchase agreement |
| TTFA | Transportation Trust Fund Authority |
Investments in Affiliates
An affiliated investment is an investment in which the Fund owns at least 5% of the outstanding voting shares of the issuer or as a result of other relationships, such as the Fund and the issuer having the same investment manager. Transactions with issuers that were either affiliated persons of the Fund at the beginning of the period or the end of the period were as follows:
| | | | | | | | | | | | | | | | | | | | | | | | | | | | | | | | | | | | |
| | | Shares, beginning of period | | | Shares purchased | | | Shares
sold | | | Shares, end of period | | | Net
realized
gains
(losses) | | | Net
change in
unrealized
gains
(losses) | | | Income
from
affiliated
securities | | | Value, end of period | | | % of
net
asset
value | |
Short-Term Investments | | | | | | | | | | | | | | | | | | | | | | | | | | | | | | | | | | | | |
Investment Companies | | | | | | | | | | | | | | | | | | | | | | | | | | | | | | | | | | | | |
Wells Fargo Municipal Cash Management Fund Institutional Class | | | 2,218,109 | | | | 112,695,703 | | | | 113,864,913 | | | | 1,048,899 | | | $ | 365 | | | $ | (366 | ) | | $ | 18,197 | | | $ | 1,050,052 | | | | 0.17 | % |
The accompanying notes are an integral part of these financial statements.
| | | | | | |
| Statement of assets and liabilities—June 30, 2018 (unaudited) | | Wells Fargo Managed Account CoreBuilder Shares – Series M | | | 23 | |
| | | | |
| | | | |
| |
Assets | | | | |
Investments in unaffiliated securities, at value (cost $609,189,814) | | $ | 618,015,520 | |
Investments in affiliated securities, at value (cost $1,049,877) | | | 1,050,052 | |
Receivable for investments sold | | | 740,000 | |
Receivable for Fund shares sold | | | 2,261,817 | |
Receivable for interest | | | 7,713,237 | |
Receivable from manager | | | 907 | |
Prepaid expenses and other assets | | | 25,643 | |
| | | | |
Total assets | | | 629,807,176 | |
| | | | |
| |
Liabilities | | | | |
Dividends payable | | | 1,887,418 | |
Payable for Fund shares redeemed | | | 593,943 | |
Payable to the broker | | | 13,883 | |
| | | | |
Total liabilities | | | 2,495,244 | |
| | | | |
Total net assets | | $ | 627,311,932 | |
| | | | |
| |
NET ASSETS CONSIST OF | | | | |
Paid-in capital | | $ | 624,882,972 | |
Undistributed net investment income | | | 78,251 | |
Accumulated net realized losses on investments | | | (6,433,951 | ) |
Net unrealized gains on investments | | | 8,784,660 | |
| | | | |
Total net assets | | $ | 627,311,932 | |
| | | | |
| |
COMPUTATION OF NET ASSET VALUE PER SHARE | | | | |
Net assets | | $ | 627,311,932 | |
Shares outstanding1 | | | 53,186,545 | |
Net asset value per share | | | $11.79 | |
| 1 | The Fund has an unlimited number of authorized shares. |
The accompanying notes are an integral part of these financial statements.
| | | | |
| 24 | | Wells Fargo Managed Account CoreBuilder Shares – Series M | | Statement of operations—six months ended June 30, 2018 (unaudited) |
| | | | |
| | | | |
| |
Investment income | | | | |
Interest | | $ | 11,278,896 | |
Income from affiliated securities | | | 18,197 | |
| | | | |
Total investment income | | | 11,297,093 | |
| | | | |
| |
Expenses | | | | |
Professional fees | | | 2,066 | |
Registration fees | | | 46,569 | |
Shareholder report expenses | | | 13,476 | |
Trustees’ fees and expenses | | | 10,510 | |
Other fees and expenses | | | 5,992 | |
| | | | |
Total expenses | | | 78,613 | |
Less: Fee waivers and/or expense reimbursements | | | (78,613 | ) |
| | | | |
Net expenses | | | 0 | |
| | | | |
Net investment income | | | 11,297,093 | |
| | | | |
| |
REALIZED AND UNREALIZED GAINS (LOSSES) ON INVESTMENTS | | | | |
| |
Net realized gains (losses) on: | | | | |
Unaffiliated securities | | | (5,329,345 | ) |
Affiliated securities | | | 365 | |
Credit default swap contracts | | | 416,031 | |
| | | | |
Net realized losses on investments | | | (4,912,949 | ) |
| | | | |
| |
Net change in unrealized gains (losses) on: | | | | |
Unaffiliated securities | | | (1,399,062 | ) |
Affiliated securities | | | (366 | ) |
Credit default swap contracts | | | 64,766 | |
| | | | |
Net change in unrealized gains (losses) on investments | | | (1,334,662 | ) |
| | | | |
Net realized and unrealized gains (losses) on investments | | | (6,247,611 | ) |
| | | | |
Net increase in net assets resulting from operations | | $ | 5,049,482 | |
| | | | |
The accompanying notes are an integral part of these financial statements.
| | | | | | |
| Statement of changes in net assets | | Wells Fargo Managed Account CoreBuilder Shares – Series M | | | 25 | |
| | | | | | | | | | | | | | | | |
| | | Six months ended June 30, 2018
(unaudited) | | | Year ended
December 31, 2017 | |
| | | | |
Operations | | | | | | | | | | | | | | | | |
Net investment income | | | | | | $ | 11,297,093 | | | | | | | $ | 19,924,311 | |
Net realized losses on investments | | | | | | | (4,912,949 | ) | | | | | | | (612,881 | ) |
Net change in unrealized gains (losses) on investments | | | | | | | (1,334,662 | ) | | | | | | | 20,599,326 | |
| | | | |
Net increase in net assets resulting from operations | | | | | | | 5,049,482 | | | | | | | | 39,910,756 | |
| | | | |
Distributions to shareholders from net investment income | | | | | | | (11,217,217 | ) | | | | | | | (19,802,652 | ) |
| | | | |
| | | | |
Capital share transactions | | | Shares | | | | | | | | Shares | | | | | |
Proceeds from shares sold | | | 9,200,538 | | | | 108,329,945 | | | | 15,616,924 | | | | 183,098,308 | |
Payment for shares redeemed | | | (7,918,366 | ) | | | (93,191,740 | ) | | | (10,559,184 | ) | | | (123,912,129 | ) |
| | | | |
Net increase in net assets resulting from capital share transactions | | | | | | | 15,138,205 | | | | | | | | 59,186,179 | |
| | | | |
Total increase in net assets | | | | | | | 8,970,470 | | | | | | | | 79,294,283 | |
| | | | |
| | | | |
Net assets | | | | | | | | | | | | | | | | |
Beginning of period | | | | | | | 618,341,462 | | | | | | | | 539,047,179 | |
| | | | |
End of period | | | | | | $ | 627,311,932 | | | | | | | $ | 618,341,462 | |
| | | | |
Undistributed (overdistributed) net investment income | | | | | | $ | 78,251 | | | | | | | $ | (1,625 | ) |
| | | | |
The accompanying notes are an integral part of these financial statements.
| | | | |
| 26 | | Wells Fargo Managed Account CoreBuilder Shares – Series M | | Financial highlights |
(For a share outstanding throughout each period)
| | | | | | | | | | | | | | | | | | | | | | | | |
| | | Six months ended June 30, 2018 (unaudited) | | | Year ended December 31 | |
| | | 2017 | | | 2016 | | | 2015 | | | 2014 | | | 2013 | |
Net asset value, beginning of period | | | $11.91 | | | | $11.51 | | | | $11.96 | | | | $11.86 | | | | $10.99 | | | | $11.61 | |
Net investment income | | | 0.21 | | | | 0.40 | | | | 0.37 | | | | 0.41 | | | | 0.44 | | | | 0.44 | |
Net realized and unrealized gains (losses) on investments | | | (0.12 | ) | | | 0.40 | | | | (0.45 | ) | | | 0.10 | | | | 1.00 | | | | (0.60 | ) |
| | | | | | | | | | | | | | | | | | | | | | | | |
Total from investment operations | | | 0.09 | | | | 0.80 | | | | (0.08 | ) | | | 0.51 | | | | 1.44 | | | | (0.16 | ) |
Distributions to shareholders from | | | | | | | | | | | | | | | | | | | | | | | | |
Net investment income | | | (0.21 | ) | | | (0.40 | ) | | | (0.37 | ) | | | (0.41 | ) | | | (0.44 | ) | | | (0.43 | ) |
Net realized gains | | | 0.00 | | | | 0.00 | | | | 0.00 | | | | 0.00 | | | | (0.13 | ) | | | (0.03 | ) |
| | | | | | | | | | | | | | | | | | | | | | | | |
Total distributions to shareholders | | | (0.21 | ) | | | (0.40 | ) | | | (0.37 | ) | | | (0.41 | ) | | | (0.57 | ) | | | (0.46 | ) |
Net asset value, end of period | | | $11.79 | | | | $11.91 | | | | $11.51 | | | | $11.96 | | | | $11.86 | | | | $10.99 | |
Total return1 | | | 0.77 | % | | | 7.02 | % | | | (0.75 | )% | | | 4.38 | % | | | 13.27 | % | | | (1.37 | )% |
Ratios to average net assets (annualized) | | | | | | | | | | | | | | | | | | | | | | | | |
Gross expenses | | | 0.03 | % | | | 0.04 | % | | | 0.04 | % | | | 0.07 | % | | | 0.10 | % | | | 0.08 | % |
Net expenses | | | 0.00 | %2 | | | 0.00 | %2 | | | 0.00 | %2 | | | 0.00 | %2 | | | 0.00 | %2 | | | 0.00 | %2 |
Net investment income | | | 3.63 | % | | | 3.39 | % | | | 3.05 | % | | | 3.45 | % | | | 3.66 | % | | | 3.94 | % |
Supplemental data | | | | | | | | | | | | | | | | | | | | | | | | |
Portfolio turnover rate | | | 4 | % | | | 19 | % | | | 15 | % | | | 21 | % | | | 37 | % | | | 56 | % |
Net assets, end of period (000s omitted) | | | $627,312 | | | | $618,341 | | | | $539,047 | | | | $361,409 | | | | $222,616 | | | | $104,914 | |
| 1 | Returns for periods of less than one year are not annualized. |
| 2 | The manager has contractually committed to irrevocably absorb and pay or reimburse all ordinary operating expenses of the Fund, except portfolio transactions or other investment-related costs (e.g., commissions), fees payable for services provided by the Fund’s securities lending agent (if any), interest, taxes, leverage expenses, and other expenses not incurred in the ordinary course of the Fund’s business. This commitment has an indefinite term. |
The accompanying notes are an integral part of these financial statements.
| | | | | | |
| Notes to financial statements (unaudited) | | Wells Fargo Managed Account CoreBuilder Shares – Series M | | | 27 | |
1. ORGANIZATION
Wells Fargo Funds Trust (the “Trust”), a Delaware statutory trust organized on March 10, 1999, is an open-end management investment company registered under the Investment Company Act of 1940, as amended (the “1940 Act”). As an investment company, the Trust follows the accounting and reporting guidance in Financial Accounting Standards Board (“FASB”) Accounting Standards Codification Topic 946, Financial Services – Investment Companies. These financial statements report on the Wells Fargo Managed Account CoreBuilder Shares – Series M (the “Fund”) which is a diversified series of the Trust.
The Fund is a special purpose municipal bond fund that is used in combination with selected individual securities to effectively model institutional-level investment strategies. As an investment option within the separately managed accounts advised or subadvised by Wells Fargo Funds Management, LLC (“Funds Management”), the Fund enables certain separately managed account investors to achieve greater diversification than small managed accounts might otherwise achieve.
2. SIGNIFICANT ACCOUNTING POLICIES
The following significant accounting policies, which are consistently followed in the preparation of the financial statements of the Fund, are in conformity with U.S. generally accepted accounting principles which require management to make estimates and assumptions that affect the reported amounts of assets and liabilities, disclosure of contingent assets and liabilities at the date of the financial statements, and the reported amounts of revenues and expenses during the reporting period. Actual results could differ from those estimates.
Securities valuation
All investments are valued each business day as of the close of regular trading on the New York Stock Exchange (generally 4 p.m. Eastern Time), although the Fund may deviate from this calculation time under unusual or unexpected circumstances.
Debt securities are valued at the evaluated bid price provided by an independent pricing service or, if a reliable price is not available, the quoted bid price from an independent broker-dealer.
Futures contracts listed on a foreign or domestic exchange or market are valued at the official closing price or, if none, the last sales price.
Swap contracts are valued at the evaluated price provided by an independent pricing service or, if a reliable price is not available, the quoted bid price from an independent broker-dealer.
Investments in registered open-end investment companies are valued at net asset value.
Investments which are not valued using any of the methods discussed above are valued at their fair value, as determined in good faith by the Board of Trustees of the Fund. The Board of Trustees has established a Valuation Committee comprised of the Trustees and has delegated to it the authority to take any actions regarding the valuation of portfolio securities that the Valuation Committee deems necessary or appropriate, including determining the fair value of portfolio securities, unless the determination has been delegated to the Wells Fargo Asset Management Pricing Committee at Wells Fargo Funds Management, LLC (“Funds Management”). The Board of Trustees retains the authority to make or ratify any valuation decisions or approve any changes to the Valuation Procedures as it deems appropriate. On a quarterly basis, the Board of Trustees receives reports on any valuation actions taken by the Valuation Committee or the Wells Fargo Asset Management Pricing Committee which may include items for ratification.
Valuations of fair valued securities are compared to the next actual sales price when available, or other appropriate market values, to assess the continued appropriateness of the fair valuation methodologies used. These securities are fair valued on a day-to-day basis, taking into consideration changes to appropriate market information and any significant changes to the inputs considered in the valuation process until there is a readily available price provided on an exchange or by an independent pricing service. Valuations received from an independent pricing service or independent broker-dealer quotes are periodically validated by comparisons to most recent trades and valuations provided by other independent pricing services in addition to the review of prices by the manager and/or subadviser. Unobservable inputs used in determining fair valuations are identified based on the type of security, taking into consideration factors utilized by market participants in valuing the investment, knowledge about the issuer and the current market environment.
When-issued transactions
The Fund may purchase securities on a forward commitment or when-issued basis. The Fund records a when-issued transaction on the trade date and will segregate assets in an amount at least equal in value to the Fund’s commitment to
| | | | |
| 28 | | Wells Fargo Managed Account CoreBuilder Shares – Series M | | Notes to financial statements (unaudited) |
purchase when-issued securities. Securities purchased on a when-issued basis are marked-to-market daily and the Fund begins earning interest on the settlement date. Losses may arise due to changes in the market value of the underlying securities or if the counterparty does not perform under the contract.
Futures contracts
The Fund is subject to interest rate risk in the normal course of pursuing its investment objectives. Futures contracts are agreements between the Fund and a counterparty to buy or sell a specific amount of a commodity, financial instrument or currency at specified price and on a specified date. The Fund may buy and sell futures contracts in order to gain exposure to, or protect against, changes in interest rates. The primary risks associated with the use of futures contracts are the imperfect correlation between changes in market values of securities held by the Fund and the prices of futures contracts, and the possibility of an illiquid market. Futures contracts are generally entered into on a regulated futures exchange and cleared through a clearinghouse associated with the exchange. With futures contracts, there is minimal counterparty risk to the Fund since futures contracts are exchange traded and the exchange’s clearinghouse, as counterparty to all exchange traded futures, guarantees the futures contracts against default.
Upon entering into a futures contracts, the Fund is required to deposit either cash or securities (initial margin) with the broker in an amount equal to a certain percentage of the contract value. Subsequent payments (variation margin) are paid to or from the broker each day equal to the daily changes in the contract value. Such payments are recorded as unrealized gains or losses and, if any, shown as variation margin receivable (payable) in the Statement of Assets and Liabilities. Should the Fund fail to make requested variation margin payments, the broker can gain access to the initial margin to satisfy the Fund’s payment obligations. When the contracts are closed, a realized gain or loss is recorded in the Statement of Operations.
Swap contracts
Swap contracts are agreements between the Fund and a counterparty to exchange a series of cash flows over a specified period. Swap agreements are privately negotiated contracts between the Fund and a counterparty in the OTC market and may be entered into as a bilateral contract (“OTC swaps”) or centrally cleared (“centrally cleared swaps”) with a central clearinghouse.
For OTC swaps, any upfront premiums paid and any upfront fees received are shown as swap premiums paid and swap premiums received, respectively, in the Statement of Assets and Liabilities and amortized over the term of the contract. The daily fluctuations in market value are recorded as unrealized gains or losses on OTC swaps in the Statement of Assets and Liabilities. Payments received or paid are recorded in the Statement of Operations as realized gains or losses, respectively. When an OTC swap is terminated, a realized gain or loss is recorded in the Statement of Operations equal to the difference between the proceeds from (or cost of) the closing transaction and the Fund’s basis in the contract, if any. Generally, the basis of the contract is the premium received or paid.
In a centrally cleared swap, immediately following execution of the swap contract, the swap contract is novated to a central counterparty (the “CCP”) and the Fund’s counterparty on the swap agreement becomes the CCP. Upon entering into a centrally cleared swap, the Fund is required to deposit an initial margin with the broker in the form of cash or securities. Securities deposited as initial margin are designated in the Portfolio of Investments and cash deposited is shown as cash segregated for centrally cleared swaps in the Statement of Assets and Liabilities. Pursuant to the contract, the Fund agrees to receive from or pay to the broker an amount of cash equal to the daily fluctuation in market value of the contract (“variation margin”). The variation margin is recorded as an unrealized gain (or loss) and shown as variation margin receivable (or payable) on centrally cleared swaps in the Statement of Assets and Liabilities. Payments received from (paid to) the counterparty, including at termination, are recorded as realized gains (losses) in the Statement of Operations.
Credit default swaps
The Fund is subject to credit risk in the normal course of pursuing its investment objectives. The Fund may enter into credit default swaps for hedging or speculative purposes to provide or receive a measure of protection against default on a referenced entity, obligation or index or a basket of single-name issuers or traded indexes. An index credit default swap references all the names in the index, and if a credit event is triggered, the credit event is settled based on that name’s weight in the index. Credit default swaps are agreements in which the protection buyer pays fixed periodic payments to the protection seller in consideration for a promise from the protection seller to make a specific payment should a negative credit event take place with respect to the referenced entity (e.g., bankruptcy, failure to pay, obligation acceleration, repudiation, moratorium or restructuring).
| | | | | | |
| Notes to financial statements (unaudited) | | Wells Fargo Managed Account CoreBuilder Shares – Series M | | | 29 | |
The Fund may enter into credit default swaps as either the seller of protection or the buyer of protection. If the Fund is the buyer of protection and a credit event occurs, the Fund will either receive from the seller an amount equal to the notional amount of the swap and deliver the referenced security or underlying securities comprising the index, or receive a net settlement of cash equal to the notional amount of the swap less the recovery value of the security or underlying securities comprising the index. If the Fund is the seller of protection and a credit event occurs, the Fund will either pay the buyer an amount equal to the notional amount of the swap and take delivery of the referenced security or underlying securities comprising the index or pay a net settlement of cash equal to the notional amount of the swap less the recovery value of the security or underlying securities comprising the index.
As the seller of protection, the Fund is subject to investment exposure on the notional amount of the swap and has assumed the risk of default of the underlying security or index. As the buyer of protection, the Fund could be exposed to risks if the seller of the protection defaults on its obligation to perform, or if there are unfavorable changes in the fluctuation of interest rates.
Security transactions and income recognition
Securities transactions are recorded on a trade date basis. Realized gains or losses are recorded on the basis of identified cost.
Interest income is accrued daily and bond discounts are accreted and premiums are amortized daily. To the extent debt obligations are placed on non-accrual status, any related interest income may be reduced by writing off interest receivables when the collection of all or a portion of interest has been determined to be doubtful based on consistently applied procedures and the fair value has decreased. If the issuer subsequently resumes interest payments or when the collectability of interest is reasonably assured, the debt obligation is removed from non-accrual status.
Distributions to shareholders
Distributions to shareholders from net investment income are declared daily and paid monthly. Distributions from net realized gains, if any, are recorded on the ex-dividend date and paid at least annually. Such distributions are determined in accordance with income tax regulations and may differ from U.S. generally accepted accounting principles. Dividend sources are estimated at the time of declaration. The tax character of distributions is determined as of the Fund’s fiscal year end. Therefore, a portion of the Fund’s distributions made prior to the Fund’s fiscal year end may be categorized as a tax return of capital at year end.
Federal and other taxes
The Fund intends to continue to qualify as a regulated investment company by distributing substantially all of its investment company taxable and tax-exempt income and any net realized capital gains (after reduction for capital loss carryforwards) sufficient to relieve it from all, or substantially all, federal income taxes. Accordingly, no provision for federal income taxes was required.
The Fund’s income and federal excise tax returns and all financial records supporting those returns for the prior three fiscal years are subject to examination by the federal and Delaware revenue authorities. Management has analyzed the Fund’s tax positions taken on federal, state, and foreign tax returns for all open tax years and does not believe that there are any uncertain tax positions that require recognition of a tax liability.
As of June 30, 2018, the aggregate cost of all investments for federal income tax purposes was $610,239,584 and the unrealized gains (losses) consisted of:
| | | | |
Gross unrealized gains | | $ | 12,163,234 | |
Gross unrealized losses | | | (3,337,246 | ) |
Net unrealized gains | | $ | 8,825,988 | |
As of December 31, 2017 the Fund had capital loss carryforwards which consist of $1,406,502 in short-term capital losses and $155,616 in long-term capital losses.
As of December 31, 2017 the Fund had a qualified late-year ordinary loss of $64,766 which was recognized on the current fiscal year.
| | | | |
| 30 | | Wells Fargo Managed Account CoreBuilder Shares – Series M | | Notes to financial statements (unaudited) |
3. FAIR VALUATION MEASUREMENTS
Fair value measurements of investments are determined within a framework that has established a fair value hierarchy based upon the various data inputs utilized in determining the value of the Fund’s investments. The three-level hierarchy gives the highest priority to unadjusted quoted prices in active markets for identical assets or liabilities (Level 1) and the lowest priority to unobservable inputs (Level 3). The Fund’s investments are classified within the fair value hierarchy based on the lowest level of input that is significant to the fair value measurement. The inputs are summarized into three broad levels as follows:
| ∎ | | Level 1 – quoted prices in active markets for identical securities |
| ∎ | | Level 2 – other significant observable inputs (including quoted prices for similar securities, interest rates, prepayment speeds, credit risk, etc.) |
| ∎ | | Level 3 – significant unobservable inputs (including the Fund’s own assumptions in determining the fair value of investments) |
The inputs or methodologies used for valuing investments in securities are not necessarily an indication of the risk associated with investing in those securities.
The following is a summary of the inputs used in valuing the Fund’s assets and liabilities as of June 30, 2018:
| | | | | | | | | | | | | | | | |
| | | Quoted prices
(Level 1) | | | Other significant
observable inputs
(Level 2) | | | Significant
unobservable inputs (Level 3) | | | Total | |
|
Assets | | | | | | | | | | | | | | | | |
Investments in: | | | | | | | | | | | | | | | | |
| | | | |
Municipal obligations | | $ | 0 | | | $ | 618,015,520 | | | $ | 0 | | | $ | 618,015,520 | |
| | | | |
Short-term investments | | | | | | | | | | | | | | | | |
Investment companies | | | 1,050,052 | | | | 0 | | | | 0 | | | | 1,050,052 | |
Total assets | | $ | 1,050,052 | | | $ | 618,015.520 | | | $ | 0 | | | $ | 619,065,572 | |
The Fund recognizes transfers between levels within the fair value hierarchy at the end of the reporting period. At June 30, 2018, the Fund did not have any transfers into/out of Level 1, Level 2, or Level 3.
4. TRANSACTIONS WITH AFFILIATES
The Trust has entered into an advisory contract with Funds Management, an indirect wholly owned subsidiary of Wells Fargo & Company (“Wells Fargo”). The manager is responsible for implementing investment policies and guidelines and for supervising the subadviser, who is responsible for day-to-day portfolio management of the Fund. For providing these services, Funds Management does not receive a fee from the Fund but is entitled to receive fees from the sponsors of the wrap-fee programs. Out of these fees, Funds Management pays Wells Capital Management Incorporated, an affiliate of Funds Management and an indirect wholly owned subsidiary of Wells Fargo, for its services as the subadviser to the Fund.
Generally, no ordinary operating fees or expenses are charged to the Fund. Funds Management has contractually committed to irrevocably absorb and pay or reimburse all ordinary operating expenses of the Fund, except portfolio transactions or other investment-related costs (e.g., commissions), fees payable for services provided by the Fund’s securities lending agent (if any), interest, taxes, leverage expenses, and other expenses not incurred in the ordinary course of the Fund’s business. This commitment has an indefinite term.
Interfund transactions
The Fund may purchase or sell portfolio investment securities to certain other Wells Fargo affiliates pursuant to Rule 17a-7 under the 1940 Act and under procedures adopted by the Board of Trustees. The procedures have been designed to ensure that these interfund transactions, which do not incur broker commissions, are effected at current market prices. if these amounts were > 1% of purchase or sales: Pursuant to these procedures, the Fund had $16,685,000 and $45,330,000 in interfund purchases and sales, respectively, during the six months ended June 30, 2018.
5. INVESTMENT PORTFOLIO TRANSACTIONS
Purchases and sales of investments, excluding U.S. government obligations (if any) and short-term securities, for the six months ended June 30, 2018 were $26,501,575 and $25,862,118, respectively
| | | | | | |
| Notes to financial statements (unaudited) | | Wells Fargo Managed Account CoreBuilder Shares – Series M | | | 31 | |
6. DERIVATIVE TRANSACTIONS
During the six months ended June 30, 2018, the Fund entered into credit default swap contracts as a substitute for taking a position in the underlying security or basket of securities or to potentially enhance the Fund’s total return. The Fund had an average notional balance on credit default swaps of $4,982,320 during the six months ended June 30, 2018.
The fair value, realized gains or losses and change in unrealized gains or losses, if any, on derivative instruments are reflected in the corresponding financial statement captions.
7. BANK BORROWINGS
The Trust (excluding the money market funds and certain other funds) and Wells Fargo Variable Trust are parties to a $280,000,000 revolving credit agreement whereby the Fund is permitted to use bank borrowings for temporary or emergency purposes, such as to fund shareholder redemption requests. Interest under the credit agreement is charged to the Fund based on a borrowing rate equal to the higher of the Federal Funds rate in effect on that day plus 1.25% or the overnight LIBOR rate in effect on that day plus 1.25%. In addition, an annual commitment fee equal to 0.25% of the unused balance is allocated to each participating fund.
For the six months ended June 30, 2018, there were no borrowings by the Fund under the agreement.
8. CONCENTRATION RISK
Concentration risk exists when a shareholder owns a large amount of shares of the Fund. A fund with a concentration of ownership may be more affected by the investment activity of those shareholders than would be a fund that does not have any ownership concentration. As of June 30, 2018, two unaffiliated shareholders owned 76% of the Fund and an affiliate of Wells Fargo owned 11% of the Fund.
9. INDEMNIFICATION
Under the Trust’s organizational documents, the officers and Trustees have been granted certain indemnification rights against certain liabilities that may arise out of performance of their duties to the Trust. Additionally, in the normal course of business, the Trust may enter into contracts with service providers that contain a variety of indemnification clauses. The Trust’s maximum exposure under these arrangements is dependent on future claims that may be made against the Fund and, therefore, cannot be estimated.
10. NEW ACCOUNTING PRONOUNCEMENT
In March 2017, FASB issued Accounting Standards Update (“ASU”) No. 2017-08, Premium Amortization on Purchased Callable Debt Securities. ASU 2017-08 shortens the amortization period for certain callable debt securities held at a premium. The amendments require the premium to be amortized to the earliest call date. The amendments do not require an accounting change for securities held a at a discount; the discount continues to be amortized to maturity. ASU 2017-08 is effective for fiscal years beginning after December 15, 2018 and for interim periods within those fiscal years. Management is currently evaluating the potential impact of this new guidance to the financial statements.
| | | | |
| 32 | | Wells Fargo Managed Account CoreBuilder Shares – Series M | | Other information (unaudited) |
PROXY VOTING INFORMATION
A description of the policies and procedures that the Fund uses to determine how to vote proxies relating to portfolio securities is available, upon request, by calling 1-888-877-9275, visiting our website at wellsfargofunds.com, or visiting the SEC website at sec.gov. Information regarding how the Fund voted proxies relating to portfolio securities during the most recent 12-month period ended June 30 is available on the Fund’s website at wellsfargofunds.com or by visiting the SEC website at sec.gov.
PORTFOLIO HOLDINGS INFORMATION
The complete portfolio holdings for the Fund are publicly available monthly on the Fund’s website (wellsfargofunds.com), on a one-month delayed basis. In addition, top ten holdings information (excluding derivative positions) for the Fund is publicly available on the Fund’s website on a monthly, seven-day or more delayed basis. The Fund files its complete schedule of portfolio holdings with the SEC for the first and third quarters of each fiscal year on Form N-Q, which is available by visiting the SEC website at sec.gov. In addition, the Fund’s Form N-Q may be reviewed and copied at the SEC’s Public Reference Room in Washington, DC, and at regional offices in New York City, at 233 Broadway, and in Chicago, at 175 West Jackson Boulevard, Suite 900. Information about the Public Reference Room may be obtained by calling 1-800-SEC-0330.
| | | | | | |
| Other information (unaudited) | | Wells Fargo Managed Account CoreBuilder Shares – Series M | | | 33 | |
BOARD OF TRUSTEES AND OFFICERS
Each of the Trustees and Officers1 listed in the table below acts in identical capacities for each fund in the Wells Fargo family of funds, which consists of 154 mutual funds comprising the Wells Fargo Funds Trust, Wells Fargo Variable Trust, Wells Fargo Master Trust and four closed-end funds (collectively the “Fund Complex”). This table should be read in conjunction with the Prospectus and the Statement of Additional Information2. The mailing address of each Trustee and Officer is 525 Market Street, 12th Floor, San Francisco, CA 94105. Each Trustee and Officer serves an indefinite term, however, each Trustee serves such term until reaching the mandatory retirement age established by the Trustees.
Independent Trustees
| | | | | | |
Name and year of birth | | Position held and length of service* | | Principal occupations during past five years or longer | | Current other public company or
investment company
directorships |
William R. Ebsworth
(Born 1957) | | Trustee, since 2015 | | Retired. From 1984 to 2013, equities analyst, portfolio manager, research director and chief investment officer at Fidelity Management and Research Company in Boston, Tokyo, and Hong Kong, and retired in 2013 as Chief Investment Officer of Fidelity Strategic Advisers, Inc. where he led a team of investment professionals managing client assets. Prior thereto, Board member of Hong Kong Securities Clearing Co., Hong Kong Options Clearing Corp., the Thailand International Fund, Ltd., Fidelity Investments Life Insurance Company, and Empire Fidelity Investments Life Insurance Company. Board member of the Forté Foundation (non-profit organization) and the Vincent Memorial Hospital Endowment (non-profit organization), where he serves on the Investment Committee and as a Chair of the Audit Committee. Mr. Ebsworth is a CFA® charterholder. | | Asset Allocation Trust |
Jane A. Freeman
(Born 1953) | | Trustee, since 2015; Chair Liaison, since 2018 | | Retired. From 2012 to 2014 and 1999 to 2008, Chief Financial Officer of Scientific Learning Corporation. From 2008 to 2012, Ms. Freeman provided consulting services related to strategic business projects. Prior to 1999, Portfolio Manager at Rockefeller & Co. and Scudder, Stevens & Clark. Board member of the Harding Loevner Funds from 1996 to 2014, serving as both Lead Independent Director and chair of the Audit Committee. Board member of the Russell Exchange Traded Funds Trust from 2011 to 2012 and the chair of the Audit Committee. Ms. Freeman is a Board Member of Ruth Bancroft Garden (non-profit organization) and the Glimmerglass Festival. She is also an inactive Chartered Financial Analyst. | | Asset Allocation Trust |
Isaiah Harris, Jr.
(Born 1952) | | Trustee, since 2009 | | Retired. Chairman of the Board of CIGNA Corporation since 2009, and Director since 2005. From 2003 to 2011, Director of Deluxe Corporation. Prior thereto, President and CEO of BellSouth Advertising and Publishing Corp. from 2005 to 2007, President and CEO of BellSouth Enterprises from 2004 to 2005 and President of BellSouth Consumer Services from 2000 to 2003. Emeritus member of the Iowa State University Foundation Board of Governors. Emeritus Member of the Advisory Board of Iowa State University School of Business. Advisory Board Member, Palm Harbor Academy (charter school). Advisory Board Member, Child Evangelism Fellowship (non-profit). Mr. Harris is a certified public accountant (inactive status). | | CIGNA Corporation; Asset Allocation Trust |
Judith M. Johnson
(Born 1949) | | Trustee, since 2008; Audit Committee Chairman, since 2009 | | Retired. Prior thereto, Chief Executive Officer and Chief Investment Officer of Minneapolis Employees Retirement Fund from 1996 to 2008. Ms. Johnson is an attorney, certified public accountant and a certified managerial accountant. | | Asset Allocation Trust |
David F. Larcker
(Born 1950) | | Trustee, since 2009 | | James Irvin Miller Professor of Accounting at the Graduate School of Business, Stanford University, Director of the Corporate Governance Research Initiative and Senior Faculty of The Rock Center for Corporate Governance since 2006. From 2005 to 2008, Professor of Accounting at the Graduate School of Business, Stanford University. Prior thereto, Ernst & Young Professor of Accounting at The Wharton School, University of Pennsylvania from 1985 to 2005. | | Asset Allocation Trust |
| | | | |
| 34 | | Wells Fargo Managed Account CoreBuilder Shares – Series M | | Other information (unaudited) |
| | | | | | |
Name and year of birth | | Position held and length of service* | | Principal occupations during past five years or longer | | Current other public company or
investment company
directorships |
Olivia S. Mitchell
(Born 1953) | | Trustee, since 2006; Governance Committee Chairman, since 2018 | | International Foundation of Employee Benefit Plans Professor, Wharton School of the University of Pennsylvania since 1993. Director of Wharton’s Pension Research Council and Boettner Center on Pensions & Retirement Research, and Research Associate at the National Bureau of Economic Research. Previously, Cornell University Professor from 1978 to 1993. | | Asset Allocation Trust |
Timothy J. Penny
(Born 1951) | | Trustee, since 1996; Chairman, since 2018; Vice Chairman, from 2017 to 2018 | | President and Chief Executive Officer of Southern Minnesota Initiative Foundation, a non-profit organization, since 2007. Member of the Board of Trustees of NorthStar Education Finance, Inc., a non-profit organization, since 2007. | | Asset Allocation Trust |
James G. Polisson
(Born 1959) | | Trustee, since 2018; Advisory Board Member, from 2017 to 2018 | | Retired. Chief Marketing Officer, Source (ETF) UK Services, Ltd, from 2015 to 2017. From 2012 to 2015, Principal of The Polisson Group, LLC, a management consulting, corporate advisory and principal investing company. Chief Executive Officer and Managing Director at Russell Investments, Global Exchange Traded Funds from 2010 to 2012. Managing Director of Barclays Global Investors from 1998 to 2010 and Global Chief Marketing Officer for iShares and Barclays Global Investors from 2000 to 2010. Trustee of the San Francisco Mechanics’ Institute, a non-profit organization, from 2013 to 2015. Board member of the Russell Exchange Traded Fund Trust from 2011 to 2012. Director of Barclays Global Investors Holdings Deutschland GmbH from 2006 to 2009. Mr. Polisson is an attorney and has a retired status with the Massachusetts and District of Columbia Bar Associations. | | Asset Allocation Trust |
Michael S. Scofield
(Born 1943) | | Trustee, since 2010 | | Served on the Investment Company Institute’s Board of Governors and Executive Committee from 2008-2011 as well the Governing Council of the Independent Directors Council from 2006-2011 and the Independent Directors Council Executive Committee from 2008-2011. Trustee of the Evergreen Fund complex (and its predecessors) from 1984 to 2010. Chairman of the Evergreen Funds from 2000-2010. Former Trustee of the Mentor Funds. Retired Attorney, Law Offices of Michael S. Scofield. | | Asset Allocation Trust |
Pamela Wheelock
(Born 1959) | | Trustee, since 2018; Advisory Board Member, from 2017 to 2018 | | Chief Operating Officer, Twin Cities Habitat for Humanity, since January, 2017. Vice President of University Services, University of Minnesota from 2012 to 2017. Prior thereto, on the Board of Directors, Goverance Committee and Finance Committee for the Minnesota Philanthropy Partners (Saint Paul Foundation) from 2012 to 2018, Interim President and Chief Executive Officer of Blue Cross Blue shield of Minnesota of Minnesota from 2010 to 2011, Chairman of the Board from 2009 to 2011 and Board Director 003 to 2015. Vice President, Leadership and Community Engagement, Bush Foundation, Saint Paul, Minnesota (a private foundation) from 2009 to 2011. Executive Vice President and Chief Financial Officer, Minnesota Sports and Entertainment from 2004 to 2009 and Senior Vice President from 2002 to 2004. Commissioner of Finance, State of Minnesota, from 1999 to 2002. Currently the Board Chair of the Minnesota Wild Foundation since 2010. | | Asset Allocation Trust |
| * | Length of service dates reflect the Trustee’s commencement of service with the Trust’s predecessor entities, where applicable. |
| | | | | | |
| Other information (unaudited) | | Wells Fargo Managed Account CoreBuilder Shares – Series M | | | 35 | |
Officers
| | | | | | |
Name and year of birth | | Position held and
length of service | | Principal occupations during past five years or longer | | |
Andrew Owen
(Born 1960) | | President, since 2017 | | Executive Vice President of Wells Fargo & Company and Head of Affiliated Managers, Wells Fargo Asset Management, since 2014. In addition, Mr. Owen is currently President, Chief Executive Officer and Director of Wells Fargo Funds Management, LLC since 2017. Prior thereto, Executive Vice President responsible for marketing, investments and product development for Wells Fargo Funds Management, LLC, from 2009 to 2014. | | |
Nancy Wiser1
(Born 1967) | | Treasurer, since 2012 | | Executive Vice President of Wells Fargo Funds Management, LLC since 2011. Chief Operating Officer and Chief Compliance Officer at LightBox Capital Management LLC, from 2008 to 2011. | | |
Alexander Kymn3
(Born 1973) | | Secretary, since 2018; Chief Legal Officer, since 2018 | | Senior Company Counsel of Wells Fargo Bank, N.A. since 2018 (previously Senior Counsel from 2007 to 2018). Vice President of Wells Fargo Funds Management, LLC from 2008 to 2014. | | |
Michael H. Whitaker
(Born 1967) | | Chief Compliance Officer, since 2016 | | Senior Vice President and Chief Compliance Officer since 2016. Senior Vice President and Chief Compliance Officer for Fidelity Investments from 2007 to 2016. | | |
David Berardi
(Born 1975) | | Assistant Treasurer, since 2009 | | Vice President of Wells Fargo Funds Management, LLC since 2009. Vice President of Evergreen Investment Management Company, LLC from 2008 to 2010. Manager of Fund Reporting and Control for Evergreen Investment Management Company, LLC from 2004 to 2010. | | |
Jeremy DePalma1
(Born 1974) | | Assistant Treasurer, since 2009 | | Senior Vice President of Wells Fargo Funds Management, LLC since 2009. Senior Vice President of Evergreen Investment Management Company, LLC from 2008 to 2010 and head of the Fund Reporting and Control Team within Fund Administration from 2005 to 2010. | | |
| 1 | Nancy Wiser acts as Treasurer of 77 funds in the Fund Complex. Jeremy DePalma acts as Treasurer of 77 funds and Assistant Treasurer of 77 funds in the Fund Complex. |
| 2 | The Statement of Additional Information includes additional information about the Trustees and is available, without charge, upon request, by calling 1-888-877-9275 or by visiting the website at wellsfargofunds.com. |
| 3 | Alexander Kymn became the Secretary and Chief Legal Officer effective April 17, 2018. |
| | | | |
| 36 | | Wells Fargo Managed Account CoreBuilder Shares – Series M | | Other information (unaudited) |
BOARD CONSIDERATION OF INVESTMENT ADVISORY AND SUB-ADVISORY AGREEMENTS:
Wells Fargo Managed Account CoreBuilder Shares – Series M
Under the Investment Company Act of 1940 (the “1940 Act”), the Board of Trustees (the “Board”) of Wells Fargo Funds Trust (the “Trust”) must determine annually whether to approve the continuation of the Trust’s investment advisory and sub-advisory agreements. In this regard, at an in-person meeting held on May 22-23, 2018 (the “Meeting”), the Board, all the members of which have no direct or indirect interest in the investment advisory and sub-advisory agreements and are not “interested persons” of the Trust, as defined in the 1940 Act (the “Independent Trustees”), reviewed and approved for Wells Fargo Managed Account CoreBuilder Shares – Series M (the “Fund”): (i) an investment advisory agreement (the “Advisory Agreement”) with Wells Fargo Funds Management, LLC (“Funds Management”); and (ii) an investment sub-advisory agreement (the “Sub-Advisory Agreement”) with Wells Capital Management Incorporated (the “Sub-Adviser”), an affiliate of Funds Management. The Advisory Agreement and the Sub-Advisory Agreement are collectively referred to as the “Advisory Agreements.”
At the Meeting, the Board considered the factors and reached the conclusions described below relating to the selection of Funds Management and the Sub-Adviser and the approval of the Advisory Agreements. Prior to the Meeting, including at an in-person meeting in April 2018, the Trustees conferred extensively among themselves and with representatives of Funds Management about these matters. Also, the Board has adopted a team-based approach, with each team consisting of a sub-set of Trustees, to assist the full Board in the discharge of its duties in reviewing investment performance and other matters throughout the year. The Independent Trustees were assisted in their evaluation of the Advisory Agreements by independent legal counsel, from whom they received separate legal advice and with whom they met separately.
In providing information to the Board, Funds Management and the Sub-Adviser were guided by a detailed set of requests for information submitted to them by independent legal counsel on behalf of the Independent Trustees at the start of the Board’s annual contract renewal process earlier in 2018. In considering and approving the Advisory Agreements, the Trustees considered the information they believed relevant, including but not limited to the information discussed below. The Board considered not only the specific information presented in connection with the Meeting, but also the knowledge gained over time through interaction with Funds Management and the Sub-Adviser about various topics. In this regard, the Board reviewed reports of Funds Management at each of its quarterly meetings, which included, among other things, portfolio reviews and investment performance reports. In addition, the Board and the teams mentioned above confer with portfolio managers at various times throughout the year. The Board did not identify any particular information or consideration that was all-important or controlling, and each individual Trustee may have attributed different weights to various factors.
After its deliberations, the Board unanimously approved the continuation of the Advisory Agreements for an additional one-year period, determined that the absence of any compensation payable by the Fund to Funds Management pursuant to the Advisory Agreement was reasonable, and determined that the compensation payable by Funds Management to the Sub-Adviser pursuant to the Sub-Advisory Agreement was reasonable. The Board considered the continuation of the Advisory Agreements for the Fund as part of its consideration of agreements for funds across the complex, but its approvals were made on a fund-by-fund basis. The following summarizes a number of important, but not necessarily all, factors considered by the Board in support of its approvals.
Nature, extent and quality of services
The Board received and considered various information regarding the nature, extent and quality of services provided to the Fund by Funds Management and the Sub-Adviser under the Advisory Agreements. This information included, among other things, a summary of the background and experience of senior management of Wells Fargo Asset Management (“WFAM”), of which Funds Management and the Sub-Adviser are a part, a summary of investments made in the business of WFAM, a summary of certain organizational and personnel changes involving Funds Management and the Sub-Adviser, and a description of Funds Management’s and the Sub-Adviser’s business continuity planning programs and of their approaches to data privacy and cybersecurity. The Board also considered the qualifications, background, tenure and responsibilities of each of the portfolio managers primarily responsible for the day-to-day portfolio management of the Fund.
The Board evaluated the ability of Funds Management and the Sub-Adviser to attract and retain qualified investment professionals, including research, advisory and supervisory personnel. The Board further considered the compliance programs and compliance records of Funds Management and the Sub-Adviser. In addition, the Board took into account the full range of services provided to the Fund by Funds Management and its affiliates.
Fund investment performance and expenses
The Board received and considered information regarding the “zero fee and expense” structure of the Fund. Specifically, the Board noted that the Fund’s gross operating expense ratio and each of its various components, including advisory fees,
| | | | | | |
| Other information (unaudited) | | Wells Fargo Managed Account CoreBuilder Shares – Series M | | | 37 | |
administration fees, custody fees, Rule 12b-1 fees, and other fees, were zero. The Board also noted Funds Management’s representations that the Fund is a special purpose mutual fund for use exclusively within Funds Management’s separately managed account (“SMA”) advisory business and, as such, Funds Management would assume and pay or reimburse under an Expense Assumption Agreement all of the ordinary operating expenses of the Fund excluding portfolio transaction or other investment related costs, fees payable for services provided by the Fund’s securities lending agent, interest, taxes, leverage expenses, and other expenses not incurred in the ordinary cost of the Fund’s business. The Board further noted that Funds Management is paid a negotiated fee by each SMA sponsor and that the fee level is identical for all sponsors of SMAs that invest in the Fund.
In light of this unique fee and distribution structure, the Board does not conduct an investment performance and fee review relative to a peer group or universe. The Board took into account the fee and distribution structure of the Fund in deciding to re-approve the Advisory Agreements for the Fund.
Investment advisory and sub-advisory fee rates
The Board reviewed and considered that the contractual investment advisory fee rate payable by the Fund to Funds Management for investment advisory services (the “Advisory Agreement Rate”) was zero, and also reviewed and considered that the Fund’s other expenses would normally be zero, because of Funds Management’s commitment to assume and pay or reimburse all of the ordinary operating expenses of the Fund under an Expense Assumption Agreement. The Board also reviewed and considered the contractual investment sub-advisory fee rate payable by Funds Management to the Sub-Adviser for investment sub-advisory services (the “Sub-Advisory Agreement Rate”), and that such fees are paid from the fees Funds Management receives from SMA sponsors and not by the Fund.
Based on its consideration of the factors and information it deemed relevant, including those described here, the Board determined that the absence of any compensation payable by the Fund to Funds Management pursuant to the Advisory Agreement was reasonable, and determined that the compensation payable by Funds Management to the Sub-Adviser pursuant to the Sub-Advisory Agreement was reasonable.
Profitability
The Board received and considered information concerning the profitability of Funds Management, as well as the profitability of both WFAM and Wells Fargo & Co. (“Wells Fargo”) as a whole, from providing services to the fund family as a whole. The Board noted that the Sub-Adviser’s profitability information with respect to providing services to the Fund was subsumed in the WFAM and Wells Fargo profitability analysis. The Board did not receive or consider to be necessary separate profitability information with respect to the Fund in light of its unique fee and distribution structure.
Funds Management reported on the methodologies and estimates used in calculating profitability, including a description of the methodology used to allocate certain expenses and recent enhancements made to the methodology. Based on its review, the Board did not deem the profits reported by Funds Management, WFAM or Wells Fargo from services provided to the Fund to be at a level that would prevent it from approving the continuation of the Advisory Agreements.
Economies of scale
In light of the unique fee and distribution structure of the Fund, the Board did not conduct an analysis of economies of scale in the context of reviewing the Fund’s Advisory Agreements.
Other benefits to Funds Management and the Sub-Adviser
The Board received and considered information regarding potential “fall-out” or ancillary benefits received by Funds Management and its affiliates, including the Sub-Adviser, as a result of their relationships with the Fund. Ancillary benefits could include, among others, benefits directly attributable to other relationships with the Fund and benefits potentially derived from an increase in Funds Management’s and the Sub-Adviser’s business as a result of their relationships with the Fund.
The Board noted that Funds Management receives payments from the SMA sponsors and that it had agreed to assume and pay or reimburse certain operating expenses of the Fund. The Board also reviewed information about whether and to what extent soft dollar credits are sought and how any such credits are utilized, and any benefits that might be realized by an affiliated broker that handles portfolio transactions for the Fund.
Based on its consideration of the factors and information it deemed relevant, including those described here, the Board did not find that any ancillary benefits received by Funds Management and its affiliates, including the Sub-Adviser, were unreasonable.
| | | | |
| 38 | | Wells Fargo Managed Account CoreBuilder Shares – Series M | | Other information (unaudited) |
Conclusion
At the Meeting, after considering the above-described factors and based on its deliberations and its evaluation of the information described above, the Board unanimously approved the continuation of the Advisory Agreements for an additional one-year period, determined that the absence of any compensation payable by the Fund to Funds Management pursuant to the Advisory Agreement was reasonable, and determined that the compensation payable by Funds Management to the Sub-Adviser pursuant to the Sub-Advisory Agreement was reasonable.
This page is intentionally left blank.
This page is intentionally left blank.

For more information
More information about Wells Fargo Funds is available free upon request. To obtain literature, please write, email, visit the Fund’s website, or call:
Wells Fargo Funds
Attn: Managed Account Services
P.O. Box 1450
Milwaukee, WI 53201
Email: MAS@wellsfargo.com
Website: wellsfargofunds.com
Managed Account Services: 1-800-368-0627
Sales Support Inquiries: 1-800-368-1683
This report and the financial statements contained herein are submitted for the general information of the shareholders of the Fund. If this report is used for promotional purposes, distribution of the report must be accompanied or preceded by a current prospectus. Before investing, please consider the investment objectives, risks, charges, and expenses of the investment. For a current prospectus and, if available, a summary prospectus, containing this information, call 1-888-877-9275. Read the prospectus carefully before you invest or send money.
Wells Fargo Asset Management (WFAM) is a trade name for certain investment advisory/management firms owned by Wells Fargo & Company. These firms include but are not limited to Wells Capital Management Incorporated and Wells Fargo Funds Management, LLC. Certain products managed by WFAM entities are distributed by Wells Fargo Funds Distributor, LLC (a broker/dealer and Member FINRA).
This material is for general informational and educational purposes only and is NOT intended to provide investment advice or a recommendation of any kind—including a recommendation for any specific investment, strategy, or plan.
NOT FDIC INSURED ◾ NO BANK GUARANTEE ◾ MAY LOSE VALUE
© 2018 Wells Fargo Funds Management, LLC. All rights reserved.
| | |
 | | 314251 08-18 SCBM/SAR130 06-18 |
Not applicable.
| ITEM 3. | AUDIT COMMITTEE FINANCIAL EXPERT |
Not applicable.
| ITEM 4. | PRINCIPAL ACCOUNTANT FEES AND SERVICES |
Not applicable.
| ITEM 5. | AUDIT COMMITTEE OF LISTED REGISTRANTS |
Not applicable.
A Portfolio of Investments for each series of Wells Fargo Funds Trust is included as part of the report to shareholders filed under Item 1 of this Form.
| ITEM 7. | DISCLOSURE OF PROXY VOTING POLICIES AND PROCEDURES FOR CLOSED-END MANAGEMENT INVESTMENT COMPANIES |
Not applicable.
| ITEM 8. | PORTFOLIO MANAGERS OF CLOSED-END MANAGEMENT INVESTMENT COMPANIES |
Not applicable.
| ITEM 9. | PURCHASES OF EQUITY SECURITIES BY CLOSED-END MANAGEMEENT INVESTMENT COMPANY AND AFFILIATED PURCHASERS |
Not applicable.
| ITEM 10. | SUBMISSION OF MATTERS TO A VOTE OF SECURITY HOLDERS |
There have been no material changes to the procedures by which shareholders may recommend nominees to the registrant’s Board of Trustees that have been implemented since the registrant’s last provided disclosure in response to the requirements of this Item.
| ITEM 11. | CONTROLS AND PROCEDURES |
(a) The President and Treasurer have concluded that the Wells Fargo Funds Trust (the “Trust”) disclosure controls and procedures (as defined in Rule 30a-3(c) under the Investment Company Act of 1940) provide reasonable assurances that material information relating to the Trust is made known to them by the appropriate persons, based on their evaluation of these controls and procedures as of a date within 90 days of the filing of this report.
(b) There were no significant changes in the Trust’s internal controls over financial reporting (as defined in Rule 30a-3(d) under the Investment Company Act of 1940) that occurred during the second fiscal quarter of the period covered by this report that materially affected, or is reasonably likely to materially affect, the registrant’s internal control over financial reporting.
(a)(1) Not applicable.
(a)(2) Certification pursuant to Rule 30a-2(a) under the Investment Company Act of 1940 (17 CFR 270.30a-2(a)) is filed and attached hereto as Exhibit 99.CERT.
(a)(3) Not applicable.
(b) Certification pursuant to Rule 30a-2(b) under the Investment Company Act of 1940 (17 CFR 270.30a-2(b)) is filed and attached hereto as Exhibit 99.906CERT.
SIGNATURES
Pursuant to the requirements of the Securities Exchange Act of 1934 and the Investment Company Act of 1940, the registrant has duly caused this report to be signed on its behalf by the undersigned, thereunto duly authorized.
| | |
Wells Fargo Funds Trust |
| By: | | |
| | /s/ Andrew Owen |
| |
| | Andrew Owen |
| | President |
| |
| Date: | | August 24, 2018 |
Pursuant to the requirements of the Securities Exchange Act of 1934 and the Investment Company Act of 1940, this report has been signed below by the following persons on behalf of the registrant and in the capacities and on the date indicated.
| | |
Wells Fargo Funds Trust |
| By: | | |
| | /s/ Andrew Owen |
| |
| | Andrew Owen |
| | President |
| |
| Date: | | August 24, 2018 |
| |
| By: | | |
| | /s/ Nancy Wiser |
| |
| | Nancy Wiser |
| | Treasurer |
| |
| Date: | | August 24, 2018 |