
UNITED STATES
SECURITIES AND EXCHANGE COMMISSION
Washington, D.C. 20549
FORM N-CSRS
CERTIFIED SHAREHOLDER REPORT OF REGISTERED
MANAGEMENT INVESTMENT COMPANIES
Investment Company Act file number: 811-09253
Wells Fargo Funds Trust
(Exact name of registrant as specified in charter)
525 Market St., San Francisco, CA 94105
(Address of principal executive offices) (Zip code)
C. David Messman
Wells Fargo Funds Management, LLC
525 Market St., San Francisco, CA 94105
(Name and address of agent for service)
Registrant’s telephone number, including area code: 800-222-8222
Date of fiscal year end: August 31
Registrant is making a filing for 9 of its series:
Wells Fargo Adjustable Rate Government Fund, Wells Fargo Conservative Income Fund, Wells Fargo Government Securities Fund, Wells Fargo High Yield Bond Fund, Wells Fargo Core Plus Bond Fund, Wells Fargo Short Duration Government Bond Fund, Wells Fargo Short-Term Bond Fund, Wells Fargo Short-Term High Yield Bond Fund, and Wells Fargo Ultra Short-Term Income Fund.
Date of reporting period: February 28, 2018
ITEM 1. REPORT TO STOCKHOLDERS
Semi-Annual Report
February 28, 2018

Wells Fargo Adjustable Rate Government Fund


Reduce clutter. Save trees.
Sign up for electronic delivery of prospectuses and shareholder reports at wellsfargo.com/advantagedelivery
Contents
The views expressed and any forward-looking statements are as of February 28, 2018, unless otherwise noted, and are those of the Fund managers and/or Wells Fargo Funds Management, LLC. Discussions of individual securities, or the markets generally, or any Wells Fargo Fund are not intended as individual recommendations. Future events or results may vary significantly from those expressed in any forward-looking statements. The views expressed are subject to change at any time in response to changing circumstances in the market. Wells Fargo Funds Management, LLC and the Fund disclaim any obligation to publicly update or revise any views expressed or forward-looking statements.
NOT FDIC INSURED ◾ NO BANK GUARANTEE ◾ MAY LOSE VALUE
| | | | |
| 2 | | Wells Fargo Adjustable Rate Government Fund | | Letter to shareholders (unaudited) |

Andrew Owen
President
Wells Fargo Funds
During the period, stocks globally delivered positive returns.
Dear Shareholder:
We are pleased to offer you this semi-annual report for the Wells Fargo Adjustable Rate Government Fund for the six-month period that ended February 28, 2018. During the period, stocks globally delivered positive returns. For the period, U.S. stocks, as measured by the S&P 500 Index1, gained 10.84% and international stocks, as measured by the MSCI ACWI ex USA Index (Net)2, gained 7.59%. In bond markets, the Bloomberg Barclays U.S. Aggregate Bond Index3 declined 2.18% and the Bloomberg Barclays Municipal Bond Index4 lost 1.24% while fixed-income investments outside the U.S. gained 2.52%, according to the Bloomberg Barclays Global Aggregate ex-USD Index5. The ICE BofAML U.S. High Yield Index6 earned 1.01% during the period.
U.S. stocks advanced as business-friendly policies and regulations, newly implemented tax reform, increased hiring activity, and consistent corporate profits led to higher investor and consumer confidence. Internationally, stocks gained as unemployment fell and wages increased in the U.K.; the Bank of Japan continued its accommodative monetary policies; and industrial production, retail sales, and fixed asset investment increased in China. Stock returns in the emerging markets were strong, with the MSCI EM Index (Net)7 gaining 10.58% for the period.
Reactions to U.S. interest-rate increases were uneven across the yield curve and globally.
The U.S. Federal Reserve (Fed) increased the federal funds rate twice during the six-month period. Following a federal funds rate increase in June to a range of 1.00% to 1.25%, 10-year U.S. Treasury yields declined, the yield curve flattened, and long-term bond prices benefited.
Internationally, central banks maintained low interest rates and accommodative monetary policies that supported business activity and stock values in foreign markets. A weaker U.S. dollar was generally supportive of business activity in regions around the globe.
Positive economic and market news continued as 2017 closed and 2018 began.
During the fourth quarter of 2017, stock markets continued the move higher. Third-quarter economic output in the U.S. grew at a 3.2% annual rate. The unemployment rate fell to a 17-year low of 4.1%. Tax reform and wage growth encouraged increased business and consumer spending.
Fed officials announced in October 2017 plans to begin unwinding its $4.5 trillion portfolio of bonds and other assets accumulated during rounds of quantitative easing conducted since the 2008–2009 recession. Still, restrained inflation kept long-term bond rates steady and the flattening of the yield curve persisted.
| 1 | The S&P 500 Index consists of 500 stocks chosen for market size, liquidity, and industry group representation. It is a market-value-weighted index with each stock’s weight in the index proportionate to its market value. You cannot invest directly in an index. |
| 2 | The Morgan Stanley Capital International (MSCI) All Country World Index (ACWI) ex USA Index (Net) is a free-float-adjusted market-capitalization-weighted index that is designed to measure the equity market performance of developed markets, excluding the United States and Canada. Source: MSCI. MSCI makes no express or implied warranties or representations and shall have no liability whatsoever with respect to any MSCI data contained herein. The MSCI data may not be further redistributed or used as a basis for other indices or any securities or financial products. This report is not approved, reviewed, or produced by MSCI. You cannot invest directly in an index. |
| 3 | The Bloomberg Barclays U.S. Aggregate Bond Index is a broad-based benchmark that measures the investment-grade, U.S. dollar-denominated, fixed-rate taxable bond market, including Treasuries, government-related and corporate securities, mortgage-backed securities (agency fixed-rate and hybrid adjustable-rate mortgage pass-throughs), asset-backed securities, and commercial mortgage-backed securities. You cannot invest directly in an index. |
| 4 | The Bloomberg Barclays Municipal Bond Index is an unmanaged index composed of long-term tax-exempt bonds with a minimum credit rating of Baa. You cannot invest directly in an index. |
| 5 | The Bloomberg Barclays Global Aggregate ex-USD Index is an unmanaged index that provides a broad-based measure of the global investment-grade fixed-income markets excluding the U.S. dollar-denominated debt market. You cannot invest directly in an index. |
| 6 | The ICE BofAML U.S. High Yield Index is a market-capitalization-weighted index of domestic and Yankee high-yield bonds. The index tracks the performance of high-yield securities traded in the U.S. bond market. You cannot invest directly in an index. Copyright 2018. ICE Data Indices, LLC. All rights reserved. |
| 7 | The MSCI Emerging Markets (EM) Index (Net) is a free-float-adjusted market-capitalization-weighted index that is designed to measure large- and mid-cap equity market performance of emerging markets. The MSCI EM Index (Net) consists of the following 24 emerging markets country indices: Brazil, Chile, China, Colombia, Czech Republic, Egypt, Greece, Hungary, India, Indonesia, Korea, Malaysia, Mexico, Pakistan, Peru, the Philippines, Poland, Qatar, Russia, South Africa, Taiwan, Thailand, Turkey, and the United Arab Emirates. You cannot invest directly in an index. |
| | | | | | |
| Letter to shareholders (unaudited) | | Wells Fargo Adjustable Rate Government Fund | | | 3 | |
October 2017 also marked one year since the regulatory reform of money market investing in the U.S. By December 2017, money market fund asset levels exceeded their December 2016 levels, reflecting continued investor demand for short-term investment opportunities offered in money market funds.
In December, the Organisation for Economic Co-operation and Development (OECD) reported that the global economy was expanding at its fastest rate since 2010; all 35 countries the OECD follows were on track to expand for 2017. International economies benefited from economic stimulus, which accelerated trade growth; improving employment; increased investment; and firming commodity prices.
The Fed raised the federal funds rate target to a range of 1.25% to 1.50% in December 2017 and began reducing its bond portfolio.
2018 opened with continued stock advances, then volatility.
Improving business and economic data globally continued to support stock advances through January 2018. Even political wrangling in the U.S. over budget resolutions could not dissuade investors from buying stocks as payrolls and factory orders increased. Long-term interest rates in the U.S. trended higher as the yield curve steepened—the 10-year Treasury rate moved from 2.46% to 2.84% and the 30-year rate moved from 2.81% to 3.08% during January 2018.
Investor sentiment shifted in February. Concerns about inflation began to emerge in the U.S. as readings from the Producer Price Index in January rose 2.5% year over year. During February 2018, the U.S. market endured a loss of more than 10% before recovering much of that loss, but volatility affected stocks globally throughout the month.
During January 2018, purchasing managers’ indexes in China, the eurozone, India, and Japan reported data for December that indicated continued growth. International stock values fell during February 2018, swept up in the selling momentum in U.S. markets.
Don’t let short-term uncertainty derail long-term investment goals.
Periods of investment uncertainty can present challenges, but experience has taught us that maintaining long-term investment goals can be an effective way to plan for the future. To help you create a sound strategy based on your personal goals and risk tolerance, Wells Fargo Funds offers more than 100 mutual funds spanning a wide range of asset classes and investment styles. Although diversification cannot guarantee an investment profit or prevent losses, we believe it can be an effective way to manage investment risk and potentially smooth out overall portfolio performance. We encourage investors to know their investments and to understand that appropriate levels of risk-taking may unlock opportunities.
Thank you for choosing to invest with Wells Fargo Funds. We appreciate your confidence in us and remain committed to helping you meet your financial needs.
Sincerely,

Andrew Owen
President
Wells Fargo Funds
During February 2018, the U.S. market endured a loss of more than 10% before recovering much of that loss, but volatility affected stocks globally throughout the month.
For further information about your Fund, contact your investment professional, visit our website at wellsfargofunds.com, or call us directly at 1-800-222-8222.
| | | | |
| 4 | | Wells Fargo Adjustable Rate Government Fund | | Performance highlights (unaudited) |
Investment objective
The Fund seeks current income consistent with capital preservation.
Manager
Wells Fargo Funds Management, LLC
Subadviser
Wells Capital Management Incorporated
Portfolio managers
Christopher Y. Kauffman, CFA®
Michal Stanczyk
Average annual total returns (%) as of February 28, 20181
| | | | | | | | | | | | | | | | | | | | | | | | | | | | | | | | | | |
| | | | | Including sales charge | | | Excluding sales charge | | | Expense ratios2 (%) | |
| | | Inception date | | 1 year | | | 5 year | | | 10 year | | | 1 year | | | 5 year | | | 10 year | | | Gross | | | Net3 | |
| Class A (ESAAX) | | 6-30-2000 | | | (1.78 | ) | | | (0.12 | ) | | | 0.97 | | | | 0.19 | | | | 0.29 | | | | 1.18 | | | | 0.80 | | | | 0.74 | |
| Class C (ESACX) | | 6-30-2000 | | | (1.67 | ) | | | (0.45 | ) | | | 0.42 | | | | (0.67 | ) | | | (0.45 | ) | | | 0.42 | | | | 1.55 | | | | 1.49 | |
| Administrator Class (ESADX) | | 7-30-2010 | | | – | | | | – | | | | – | | | | 0.44 | | | | 0.46 | | | | 1.33 | | | | 0.74 | | | | 0.60 | |
| Institutional Class (EKIZX) | | 10-1-1991 | | | – | | | | – | | | | – | | | | 0.47 | | | | 0.58 | | | | 1.46 | | | | 0.47 | | | | 0.46 | |
| Bloomberg Barclays 6-Month Treasury Bill Index4 | | – | | | – | | | | – | | | | – | | | | 1.04 | | | | 0.48 | | | | 0.64 | | | | – | | | | – | |
Figures quoted represent past performance, which is no guarantee of future results, and do not reflect taxes that a shareholder may pay on fund distributions or the redemption of fund shares. Investment return and principal value of an investment will fluctuate so that an investor’s shares, when redeemed, may be worth more or less than their original cost. Performance shown without sales charges would be lower if sales charges were reflected. Current performance may be lower or higher than the performance data quoted, which assumes the reinvestment of dividends and capital gains. Current month-end performance is available on the Fund’s website, wellsfargofunds.com.
Index returns do not include transaction costs associated with buying and selling securities, any mutual fund fees or expenses, or any taxes. It is not possible to invest directly in an index.
For Class A shares, the maximum front-end sales charge is 2.00%. For Class C shares, the maximum contingent deferred sales charge is 1.00%. Performance including a contingent deferred sales charge assumes the sales charge for the corresponding time period. Administrator Class and Institutional Class shares are sold without a front-end sales charge or contingent deferred sales charge.
Bond values fluctuate in response to the financial condition of individual issuers, general market and economic conditions, and changes in interest rates. Changes in market conditions and government policies may lead to periods of heightened volatility in the bond market and reduced liquidity for certain bonds held by the Fund. In general, when interest rates rise, bond values fall and investors may lose principal value. Interest-rate changes and their impact on the Fund and its share price can be sudden and unpredictable. The use of derivatives may reduce returns and/or increase volatility. Securities issued by U.S. government agencies or government-sponsored entities may not be guaranteed by the U.S. Treasury. Certain investment strategies tend to increase the total risk of an investment (relative to the broader market). The Fund is exposed to mortgage- and asset-backed securities risk. The U.S. government guarantee applies to certain underlying securities and not to shares of the Fund. Consult the Fund’s prospectus for additional information on these and other risks.
Please see footnotes on page 5.
| | | | | | |
| Performance highlights (unaudited) | | Wells Fargo Adjustable Rate Government Fund | | | 5 | |
| | | | |
| Ten largest holdings (%) as of February 28, 20185 | |
FNMA Series 2003-W18 Class 2A, 3.72%, 6-25-2043 | | | 1.92 | |
FNMA Series 2002-66 Class A3, 3.83%, 4-25-2042 | | | 1.91 | |
FNMA Series 2004-W15 Class 3A, 3.61%, 6-25-2044 | | | 1.46 | |
FNMA Series 2006-W01 Class 3A, 3.26%, 10-25-2045 | | | 1.25 | |
FHLMC Series T-67 Class 1A1C, 3.41%, 3-25-2036 | | | 1.21 | |
GNMA Series 2017-H11 Class FE, 1.95%, 5-20-2067 | | | 1.12 | |
FNMA Series 2004-W12 Class 2A, 3.78%, 6-25-2044 | | | 1.10 | |
FNMA Series 2001-T12 Class A4, 3.96%, 8-25-2041 | | | 1.04 | |
FHLMC Series T-67 Class 2A1C, 3.30%, 3-25-2036 | | | 0.98 | |
FHLMC Series T-62 Class 1A1, 2.26%, 10-25-2044 | | | 0.89 | |
|
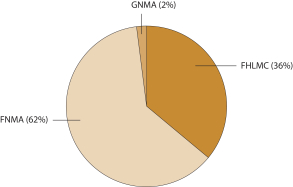
| Portfolio allocation as of February 28, 20186 |
|
|
| 1 | Historical performance shown for Administrator Class shares prior to their inception reflects the performance of Institutional Class shares, adjusted to reflect the higher expenses applicable to Administrator Class shares. Historical performance shown for all classes of the Fund prior to July 12, 2010, is based on the performance of the Fund’s predecessor, Evergreen Adjustable Rate Fund. |
| 2 | Reflects the expense ratios as stated in the most recent prospectuses. The expense ratios shown are subject to change and may differ from the annualized expense ratios shown in the financial highlights of this report. |
| 3 | The manager has contractually committed through December 31, 2018, to waive fees and/or reimburse expenses to the extent necessary to cap the Fund’s Total Annual Fund Operating Expenses After Fee Waivers at the amounts shown. After this time, the cap may be increased or the commitment to maintain the cap may be terminated only with the approval of the Board of Trustees. Brokerage commissions, stamp duty fees, interest, taxes, acquired fund fees and expenses, and extraordinary expenses are excluded from the expense cap. Without this cap, the Fund’s returns would have been lower. The expense ratio paid by an investor is the net expense ratio (the total annual fund operating expenses after fee waivers) as stated in the prospectuses. |
| 4 | The Bloomberg Barclays 6-Month Treasury Bill Index tracks the performance and attributes of recently issued 6-month U.S. Treasury bills. The index follows Bloomberg Barclays’ monthly rebalancing conventions. You cannot invest directly in an index. |
| 5 | The ten largest holdings, excluding cash and cash equivalents, are calculated based on the value of the investments divided by total net assets of the Fund. Holdings are subject to change and may have changed since the date specified. |
| 6 | Amounts are calculated based on the total long-term investments of the Fund. These amounts are subject to change and may have changed since the date specified. |
| | | | |
| 6 | | Wells Fargo Adjustable Rate Government Fund | | Fund expenses (unaudited) |
As a shareholder of the Fund, you incur two types of costs: (1) transaction costs, including sales charges (loads) on purchase payments and contingent deferred sales charges (if any) on redemptions and (2) ongoing costs, including management fees, distribution (12b-1) and/or shareholder servicing fees, and other Fund expenses. This example is intended to help you understand your ongoing costs (in dollars) of investing in the Fund and to compare these costs with the ongoing costs of investing in other mutual funds.
The example is based on an investment of $1,000 invested at the beginning of the six-month period and held for the entire period from September 1, 2017 to February 28, 2018.
Actual expenses
The “Actual” line of the table below provides information about actual account values and actual expenses. You may use the information in this line, together with the amount you invested, to estimate the expenses that you paid over the period. Simply divide your account value by $1,000 (for example, an $8,600 account value divided by $1,000 = 8.6), then multiply the result by the number in the “Actual” line under the heading entitled “Expenses paid during period” for your applicable class of shares to estimate the expenses you paid on your account during this period.
Hypothetical example for comparison purposes
The “Hypothetical” line of the table below provides information about hypothetical account values and hypothetical expenses based on the Fund’s actual expense ratio and an assumed rate of return of 5% per year before expenses, which is not the Fund’s actual return. The hypothetical account values and expenses may not be used to estimate the actual ending account balance or expenses you paid for the period. You may use this information to compare the ongoing costs of investing in the Fund and other funds. To do so, compare this 5% hypothetical example with the 5% hypothetical examples that appear in the shareholder reports of the other funds.
Please note that the expenses shown in the table are meant to highlight your ongoing costs only and do not reflect any transactional costs, such as sales charges (loads) and contingent deferred sales charges. Therefore, the “Hypothetical” line of the table is useful in comparing ongoing costs only and will not help you determine the relative total costs of owning different funds. In addition, if these transactional costs were included, your costs would have been higher.
| | | | | | | | | | | | | | | | |
| | | Beginning account value 9-1-2017 | | | Ending account value 2-28-2018 | | | Expenses paid during the period¹ | | | Annualized net expense ratio | |
Class A | | | | | | | | | | | | | | | | |
Actual | | $ | 1,000.00 | | | $ | 995.20 | | | $ | 3.66 | | | | 0.74 | % |
Hypothetical (5% return before expenses) | | $ | 1,000.00 | | | $ | 1,021.12 | | | $ | 3.71 | | | | 0.74 | % |
Class C | | | | | | | | | | | | | | | | |
Actual | | $ | 1,000.00 | | | $ | 991.51 | | | $ | 7.36 | | | | 1.49 | % |
Hypothetical (5% return before expenses) | | $ | 1,000.00 | | | $ | 1,017.41 | | | $ | 7.45 | | | | 1.49 | % |
Administrator Class | | | | | | | | | | | | | | | | |
Actual | | $ | 1,000.00 | | | $ | 995.91 | | | $ | 2.97 | | | | 0.60 | % |
Hypothetical (5% return before expenses) | | $ | 1,000.00 | | | $ | 1,021.82 | | | $ | 3.01 | | | | 0.60 | % |
Institutional Class | | | | | | | | | | | | | | | | |
Actual | | $ | 1,000.00 | | | $ | 996.65 | | | $ | 2.28 | | | | 0.46 | % |
Hypothetical (5% return before expenses) | | $ | 1,000.00 | | | $ | 1,022.51 | | | $ | 2.31 | | | | 0.46 | % |
| 1 | Expenses paid is equal to the annualized net expense ratio of each class multiplied by the average account value over the period, multiplied by the number of days in the most recent fiscal half-year divided by the number of days in the fiscal year (to reflect the one-half-year period). |
| | | | | | |
| Portfolio of investments—February 28, 2018 (unaudited) | | Wells Fargo Adjustable Rate Government Fund | | | 7 | |
| | | | | | | | | | | | | | | | |
| Security name | | Interest rate | | | Maturity date | | | Principal | | | Value | |
|
Agency Securities: 97.33% | |
FDIC Series 2010-S2 Class 3A (1 Month LIBOR +0.70%) 144A± | | | 2.26 | % | | | 12-29-2045 | | | $ | 484,138 | | | $ | 484,756 | |
FHLMC (10 Year Treasury Constant Maturity -0.85%) ± | | | 1.74 | | | | 3-15-2024 | | | | 462,260 | | | | 458,872 | |
FHLMC (1 Year Treasury Constant Maturity +0.71%) ± | | | 1.76 | | | | 4-1-2030 | | | | 59,147 | | | | 59,362 | |
FHLMC (11th District Cost of Funds +1.25%) ± | | | 1.88 | | | | 5-1-2019 | | | | 2,105 | | | | 2,096 | |
FHLMC (11th District Cost of Funds +1.25%) ± | | | 1.98 | | | | 1-1-2030 | | | | 3,292 | | | | 3,241 | |
FHLMC (11th District Cost of Funds +1.25%) ± | | | 1.98 | | | | 1-1-2030 | | | | 3,319 | | | | 3,286 | |
FHLMC (11th District Cost of Funds +1.25%) ± | | | 1.98 | | | | 7-1-2030 | | | | 152,040 | | | | 149,995 | |
FHLMC (11th District Cost of Funds +1.25%) ± | | | 1.99 | | | | 7-1-2018 | | | | 155 | | | | 155 | |
FHLMC (11th District Cost of Funds +1.25%) ± | | | 1.99 | | | | 1-1-2019 | | | | 456 | | | | 455 | |
FHLMC (11th District Cost of Funds +1.25%) ± | | | 1.99 | | | | 2-1-2019 | | | | 1,550 | | | | 1,544 | |
FHLMC (11th District Cost of Funds +1.25%) ± | | | 1.99 | | | | 2-1-2035 | | | | 190,456 | | | | 188,233 | |
FHLMC (11th District Cost of Funds +1.25%) ± | | | 2.00 | | | | 5-1-2018 | | | | 102 | | | | 102 | |
FHLMC (11th District Cost of Funds +1.25%) ± | | | 2.00 | | | | 6-1-2018 | | | | 992 | | | | 990 | |
FHLMC (11th District Cost of Funds +1.25%) ± | | | 2.00 | | | | 9-1-2018 | | | | 90 | | | | 89 | |
FHLMC (11th District Cost of Funds +0.00%) ± | | | 2.03 | | | | 3-1-2018 | | | | 68 | | | | 68 | |
FHLMC (11th District Cost of Funds +1.44%) ± | | | 2.08 | | | | 6-1-2020 | | | | 13,991 | | | | 13,912 | |
FHLMC (11th District Cost of Funds +1.36%) ± | | | 2.09 | | | | 10-1-2030 | | | | 6,017 | | | | 5,989 | |
FHLMC (11th District Cost of Funds +1.50%) ± | | | 2.24 | | | | 8-1-2018 | | | | 109 | | | | 109 | |
FHLMC (11th District Cost of Funds +0.00%) ± | | | 2.27 | | | | 10-1-2018 | | | | 697 | | | | 697 | |
FHLMC (11th District Cost of Funds +1.72%) ± | | | 2.45 | | | | 1-1-2022 | | | | 5,977 | | | | 5,969 | |
FHLMC (11th District Cost of Funds +1.25%) ± | | | 2.52 | | | | 11-1-2030 | | | | 193,118 | | | | 193,366 | |
FHLMC (11th District Cost of Funds +1.88%) ± | | | 2.52 | | | | 6-1-2019 | | | | 22,620 | | | | 22,597 | |
FHLMC (11th District Cost of Funds +0.00%) ± | | | 2.53 | | | | 12-1-2018 | | | | 246 | | | | 246 | |
FHLMC (11th District Cost of Funds +1.91%) ± | | | 2.53 | | | | 12-1-2018 | | | | 900 | | | | 898 | |
FHLMC (11th District Cost of Funds +1.88%) ± | | | 2.64 | | | | 3-1-2025 | | | | 214,564 | | | | 213,829 | |
FHLMC (11th District Cost of Funds +2.00%) ± | | | 2.66 | | | | 6-1-2029 | | | | 171,037 | | | | 171,821 | |
FHLMC (12 Month Treasury Average +1.90%) ± | | | 2.68 | | | | 5-1-2028 | | | | 228,650 | | | | 236,813 | |
FHLMC (11th District Cost of Funds +2.25%) ± | | | 2.88 | | | | 8-1-2019 | | | | 6,824 | | | | 6,839 | |
FHLMC (1 Year Treasury Constant Maturity +2.13%) ± | | | 2.88 | | | | 7-1-2019 | | | | 504 | | | | 503 | |
FHLMC (11th District Cost of Funds +2.14%) ± | | | 2.89 | | | | 7-1-2018 | | | | 1,733 | | | | 1,730 | |
FHLMC (1 Year Treasury Constant Maturity +2.17%) ± | | | 2.94 | | | | 5-1-2037 | | | | 201,867 | | | | 211,097 | |
FHLMC (1 Year Treasury Constant Maturity +2.23%) ± | | | 2.98 | | | | 4-1-2034 | | | | 344,426 | | | | 361,754 | |
FHLMC (1 Year Treasury Constant Maturity +1.88%) ± | | | 2.98 | | | | 5-1-2035 | | | | 308,982 | | | | 322,528 | |
FHLMC (1 Year Treasury Constant Maturity +2.25%) ± | | | 3.00 | | | | 5-1-2034 | | | | 244,986 | | | | 258,434 | |
FHLMC (11th District Cost of Funds +2.39%) ± | | | 3.02 | | | | 6-1-2021 | | | | 47,581 | | | | 47,898 | |
FHLMC (11th District Cost of Funds +1.53%) ± | | | 3.03 | | | | 6-1-2019 | | | | 5,059 | | | | 5,068 | |
FHLMC (6 Month LIBOR +1.42%) ± | | | 3.03 | | | | 2-1-2037 | | | | 6,705 | | | | 6,881 | |
FHLMC (1 Year Treasury Constant Maturity +1.55%) ± | | | 3.07 | | | | 7-1-2030 | | | | 4,941 | | | | 4,922 | |
FHLMC (1 Year Treasury Constant Maturity +2.23%) ± | | | 3.08 | | | | 4-1-2034 | | | | 447,785 | | | | 468,295 | |
FHLMC (1 Year Treasury Constant Maturity +2.05%) ± | | | 3.10 | | | | 1-1-2030 | | | | 17,970 | | | | 18,526 | |
FHLMC (1 Year Treasury Constant Maturity +2.05%) ± | | | 3.11 | | | | 8-1-2033 | | | | 1,651,044 | | | | 1,716,821 | |
FHLMC (1 Year Treasury Constant Maturity +2.36%) ± | | | 3.11 | | | | 4-1-2038 | | | | 1,882,273 | | | | 1,997,278 | |
FHLMC (1 Year Treasury Constant Maturity +2.18%) ± | | | 3.11 | | | | 4-1-2023 | | | | 199,536 | | | | 200,855 | |
FHLMC (1 Year Treasury Constant Maturity +2.02%) ± | | | 3.13 | | | | 12-1-2035 | | | | 561,030 | | | | 585,550 | |
FHLMC (1 Year Treasury Constant Maturity +2.23%) ± | | | 3.13 | | | | 5-1-2034 | | | | 1,735,320 | | | | 1,827,130 | |
FHLMC (6 Month LIBOR +1.66%) ± | | | 3.16 | | | | 6-1-2037 | | | | 414,893 | | | | 427,684 | |
FHLMC (1 Year Treasury Constant Maturity +2.23%) ± | | | 3.19 | | | | 3-1-2034 | | | | 798,121 | | | | 835,712 | |
FHLMC (1 Year Treasury Constant Maturity +2.25%) ± | | | 3.19 | | | | 3-1-2036 | | | | 701,941 | | | | 735,701 | |
FHLMC (3 Year Treasury Constant Maturity +2.27%) ± | | | 3.19 | | | | 4-1-2032 | | | | 89,262 | | | | 90,592 | |
FHLMC (1 Year Treasury Constant Maturity +2.25%) ± | | | 3.20 | | | | 9-1-2038 | | | | 243,438 | | | | 248,034 | |
The accompanying notes are an integral part of these financial statements.
| | | | |
| 8 | | Wells Fargo Adjustable Rate Government Fund | | Portfolio of investments—February 28, 2018 (unaudited) |
| | | | | | | | | | | | | | | | |
| Security name | | Interest rate | | | Maturity date | | | Principal | | | Value | |
| | | | |
Agency Securities (continued) | | | | | | | | | | | | | | | | |
FHLMC (6 Month LIBOR +1.70%) ± | | | 3.22 | % | | | 1-1-2037 | | | $ | 1,205,689 | | | $ | 1,254,999 | |
FHLMC (12 Month Treasury Average +2.46%) ± | | | 3.23 | | | | 10-1-2029 | | | | 106,947 | | | | 109,422 | |
FHLMC (1 Year Treasury Constant Maturity +2.23%) ± | | | 3.23 | | | | 5-1-2032 | | | | 43,906 | | | | 45,511 | |
FHLMC (1 Year Treasury Constant Maturity +2.23%) ± | | | 3.23 | | | | 9-1-2035 | | | | 1,540,515 | | | | 1,627,499 | |
FHLMC (1 Year Treasury Constant Maturity +1.99%) ± | | | 3.24 | | | | 11-1-2034 | | | | 304,987 | | | | 318,879 | |
FHLMC (1 Year Treasury Constant Maturity +2.10%) ± | | | 3.24 | | | | 10-1-2037 | | | | 1,344,006 | | | | 1,411,178 | |
FHLMC (1 Year Treasury Constant Maturity +2.23%) ± | | | 3.24 | | | | 3-1-2034 | | | | 727,415 | | | | 760,863 | |
FHLMC (1 Year Treasury Constant Maturity +2.02%) ± | | | 3.25 | | | | 5-1-2020 | | | | 119 | | | | 120 | |
FHLMC (1 Year Treasury Constant Maturity +2.24%) ± | | | 3.26 | | | | 8-1-2027 | | | | 5,503 | | | | 5,556 | |
FHLMC (1 Year Treasury Constant Maturity +2.25%) ± | | | 3.26 | | | | 4-1-2038 | | | | 1,177,407 | | | | 1,245,804 | |
FHLMC (1 Year Treasury Constant Maturity +2.01%) ± | | | 3.26 | | | | 6-1-2020 | | | | 499 | | | | 497 | |
FHLMC (1 Year Treasury Constant Maturity +2.23%) ± | | | 3.26 | | | | 5-1-2038 | | | | 979,050 | | | | 1,031,789 | |
FHLMC (1 Year Treasury Constant Maturity +2.25%) ± | | | 3.26 | | | | 6-1-2035 | | | | 130,824 | | | | 138,365 | |
FHLMC (1 Year Treasury Constant Maturity +2.40%) ± | | | 3.27 | | | | 7-1-2029 | | | | 56,583 | | | | 58,935 | |
FHLMC (US Treasury H15 Treasury Bill 6 Month Auction High Discount +1.75%) ± | | | 3.27 | | | | 1-1-2023 | | | | 29,580 | | | | 30,870 | |
FHLMC (1 Year Treasury Constant Maturity +2.29%) ± | | | 3.29 | | | | 9-1-2033 | | | | 865,260 | | | | 915,572 | |
FHLMC (12 Month Treasury Average +2.37%) ± | | | 3.29 | | | | 6-1-2028 | | | | 98,462 | | | | 100,737 | |
FHLMC (1 Year Treasury Constant Maturity +2.21%) ± | | | 3.30 | | | | 11-1-2036 | | | | 1,131,446 | | | | 1,192,565 | |
FHLMC (1 Year Treasury Constant Maturity +2.28%) ± | | | 3.30 | | | | 4-1-2037 | | | | 1,562,379 | | | | 1,651,581 | |
FHLMC (1 Year Treasury Constant Maturity +2.24%) ± | | | 3.31 | | | | 8-1-2035 | | | | 533,409 | | | | 562,919 | |
FHLMC (1 Year Treasury Constant Maturity +2.24%) ± | | | 3.31 | | | | 3-1-2027 | | | | 97,423 | | | | 98,883 | |
FHLMC (1 Year Treasury Constant Maturity +2.31%) ± | | | 3.31 | | | | 6-1-2035 | | | | 531,492 | | | | 556,912 | |
FHLMC (1 Year Treasury Constant Maturity +2.44%) ± | | | 3.32 | | | | 4-1-2029 | | | | 102,649 | | | | 103,915 | |
FHLMC (1 Year Treasury Constant Maturity +2.03%) ± | | | 3.32 | | | | 3-1-2025 | | | | 66,470 | | | | 68,575 | |
FHLMC (1 Year Treasury Constant Maturity +2.21%) ± | | | 3.32 | | | | 1-1-2037 | | | | 1,200,213 | | | | 1,262,200 | |
FHLMC (1 Year Treasury Constant Maturity +2.22%) ± | | | 3.32 | | | | 7-1-2036 | | | | 340,941 | | | | 364,905 | |
FHLMC (1 Year Treasury Constant Maturity +2.25%) ± | | | 3.33 | | | | 11-1-2036 | | | | 1,076,551 | | | | 1,135,173 | |
FHLMC (1 Year Treasury Constant Maturity +2.23%) ± | | | 3.33 | | | | 5-1-2038 | | | | 1,318,957 | | | | 1,391,362 | |
FHLMC (1 Year Treasury Constant Maturity +2.24%) ± | | | 3.33 | | | | 4-1-2037 | | | | 579,860 | | | | 609,682 | |
FHLMC (1 Year Treasury Constant Maturity +2.25%) ± | | | 3.34 | | | | 8-1-2035 | | | | 1,962,359 | | | | 2,069,693 | |
FHLMC (1 Year Treasury Constant Maturity +2.48%) ± | | | 3.34 | | | | 6-1-2030 | | | | 99,502 | | | | 101,548 | |
FHLMC (1 Year Treasury Constant Maturity +2.22%) ± | | | 3.35 | | | | 8-1-2033 | | | | 237,726 | | | | 249,775 | |
FHLMC (1 Year Treasury Constant Maturity +2.16%) ± | | | 3.35 | | | | 6-1-2033 | | | | 474,562 | | | | 495,141 | |
FHLMC (1 Year Treasury Constant Maturity +2.25%) ± | | | 3.35 | | | | 11-1-2035 | | | | 1,115,944 | | | | 1,175,360 | |
FHLMC (1 Year Treasury Constant Maturity +2.60%) ± | | | 3.35 | | | | 6-1-2032 | | | | 141,574 | | | | 143,342 | |
FHLMC (1 Year Treasury Constant Maturity +2.23%) ± | | | 3.35 | | | | 10-1-2033 | | | | 57,101 | | | | 57,449 | |
FHLMC (1 Year Treasury Constant Maturity +2.23%) ± | | | 3.35 | | | | 11-1-2026 | | | | 72,654 | | | | 74,789 | |
FHLMC (1 Year Treasury Constant Maturity +2.25%) ± | | | 3.35 | | | | 10-1-2034 | | | | 1,024,725 | | | | 1,079,494 | |
FHLMC (1 Year Treasury Constant Maturity +2.24%) ± | | | 3.35 | | | | 2-1-2036 | | | | 1,128,710 | | | | 1,189,298 | |
FHLMC (6 Month LIBOR +1.73%) ± | | | 3.36 | | | | 6-1-2024 | | | | 7,526 | | | | 7,529 | |
FHLMC (1 Year Treasury Constant Maturity +2.30%) ± | | | 3.36 | | | | 1-1-2036 | | | | 634,154 | | | | 670,438 | |
FHLMC (1 Year Treasury Constant Maturity +2.18%) ± | | | 3.36 | | | | 6-1-2036 | | | | 1,086,817 | | | | 1,140,797 | |
FHLMC (1 Year Treasury Constant Maturity +2.35%) ± | | | 3.37 | | | | 7-1-2038 | | | | 1,424,014 | | | | 1,506,745 | |
FHLMC (1 Year Treasury Constant Maturity +2.31%) ± | | | 3.37 | | | | 9-1-2029 | | | | 751,108 | | | | 786,131 | |
FHLMC (1 Year Treasury Constant Maturity +2.26%) ± | | | 3.37 | | | | 5-1-2034 | | | | 1,491,156 | | | | 1,567,321 | |
FHLMC (1 Year Treasury Constant Maturity +2.27%) ± | | | 3.37 | | | | 10-1-2036 | | | | 727,553 | | | | 765,065 | |
FHLMC (1 Year Treasury Constant Maturity +2.34%) ± | | | 3.38 | | | | 2-1-2036 | | | | 115,425 | | | | 121,835 | |
FHLMC (1 Year Treasury Constant Maturity +2.29%) ± | | | 3.39 | | | | 9-1-2030 | | | | 228,933 | | | | 239,617 | |
FHLMC (1 Year Treasury Constant Maturity +2.02%) ± | | | 3.39 | | | | 5-1-2020 | | | | 217 | | | | 216 | |
FHLMC (1 Year Treasury Constant Maturity +2.33%) ± | | | 3.39 | | | | 9-1-2032 | | | | 1,672,607 | | | | 1,761,155 | |
The accompanying notes are an integral part of these financial statements.
| | | | | | |
| Portfolio of investments—February 28, 2018 (unaudited) | | Wells Fargo Adjustable Rate Government Fund | | | 9 | |
| | | | | | | | | | | | | | | | |
| Security name | | Interest rate | | | Maturity date | | | Principal | | | Value | |
| | | | |
Agency Securities (continued) | | | | | | | | | | | | | | | | |
FHLMC (1 Year Treasury Constant Maturity +2.34%) ± | | | 3.39 | % | | | 7-1-2034 | | | $ | 586,041 | | | $ | 610,166 | |
FHLMC (1 Year Treasury Constant Maturity +2.27%) ± | | | 3.40 | | | | 7-1-2031 | | | | 1,130,209 | | | | 1,164,179 | |
FHLMC (1 Year Treasury Constant Maturity +2.32%) ± | | | 3.40 | | | | 6-1-2035 | | | | 1,146,562 | | | | 1,211,108 | |
FHLMC (1 Year Treasury Constant Maturity +2.48%) ± | | | 3.40 | | | | 2-1-2030 | | | | 52,004 | | | | 52,645 | |
FHLMC (1 Year Treasury Constant Maturity +2.26%) ± | | | 3.40 | | | | 2-1-2036 | | | | 598,858 | | | | 631,190 | |
FHLMC (1 Year Treasury Constant Maturity +2.24%) ± | | | 3.41 | | | | 2-1-2036 | | | | 765,627 | | | | 800,944 | |
FHLMC (1 Year Treasury Constant Maturity +2.35%) ± | | | 3.41 | | | | 2-1-2031 | | | | 578,470 | | | | 606,003 | |
FHLMC (12 Month LIBOR +1.67%) ± | | | 3.42 | | | | 8-1-2035 | | | | 146,490 | | | | 150,135 | |
FHLMC (1 Year Treasury Constant Maturity +2.47%) ± | | | 3.42 | | | | 7-1-2034 | | | | 835,226 | | | | 877,195 | |
FHLMC (1 Year Treasury Constant Maturity +2.25%) ± | | | 3.42 | | | | 2-1-2036 | | | | 1,226,414 | | | | 1,292,344 | |
FHLMC (1 Year Treasury Constant Maturity +2.20%) ± | | | 3.43 | | | | 12-1-2034 | | | | 468,570 | | | | 491,744 | |
FHLMC (1 Year Treasury Constant Maturity +2.28%) ± | | | 3.43 | | | | 10-1-2036 | | | | 577,335 | | | | 608,112 | |
FHLMC (1 Year Treasury Constant Maturity +2.40%) ± | | | 3.43 | | | | 9-1-2031 | | | | 69,329 | | | | 70,277 | |
FHLMC (1 Year Treasury Constant Maturity +2.27%) ± | | | 3.43 | | | | 11-1-2029 | | | | 152,079 | | | | 154,438 | |
FHLMC (1 Year Treasury Constant Maturity +2.25%) ± | | | 3.43 | | | | 9-1-2033 | | | | 214,982 | | | | 226,465 | |
FHLMC (12 Month LIBOR +1.68%) ± | | | 3.43 | | | | 2-1-2037 | | | | 320,447 | | | | 335,256 | |
FHLMC (1 Year Treasury Constant Maturity +2.23%) ± | | | 3.45 | | | | 7-1-2034 | | | | 153,112 | | | | 161,083 | |
FHLMC (1 Year Treasury Constant Maturity +2.18%) ± | | | 3.45 | | | | 8-1-2034 | | | | 983,641 | | | | 1,031,283 | |
FHLMC (1 Year Treasury Constant Maturity +2.30%) ± | | | 3.45 | | | | 3-1-2037 | | | | 397,740 | | | | 418,936 | |
FHLMC (1 Year Treasury Constant Maturity +2.32%) ± | | | 3.46 | | | | 7-1-2038 | | | | 706,143 | | | | 743,476 | |
FHLMC (1 Year Treasury Constant Maturity +2.22%) ± | | | 3.46 | | | | 10-1-2033 | | | | 322,159 | | | | 338,870 | |
FHLMC (1 Year Treasury Constant Maturity +2.25%) ± | | | 3.47 | | | | 4-1-2036 | | | | 597,348 | | | | 628,355 | |
FHLMC (1 Year Treasury Constant Maturity +2.22%) ± | | | 3.47 | | | | 10-1-2033 | | | | 713,499 | | | | 750,475 | |
FHLMC (1 Year Treasury Constant Maturity +2.22%) ± | | | 3.47 | | | | 10-1-2033 | | | | 1,359,568 | | | | 1,426,004 | |
FHLMC (1 Year Treasury Constant Maturity +2.37%) ± | | | 3.47 | | | | 7-1-2027 | | | | 588,551 | | | | 592,109 | |
FHLMC (1 Year Treasury Constant Maturity +2.48%) ± | | | 3.48 | | | | 10-1-2025 | | | | 30,020 | | | | 30,086 | |
FHLMC (12 Month LIBOR +1.73%) ± | | | 3.48 | | | | 1-1-2035 | | | | 424,663 | | | | 446,725 | |
FHLMC (1 Year Treasury Constant Maturity +2.48%) ± | | | 3.48 | | | | 10-1-2025 | | | | 68,036 | | | | 69,166 | |
FHLMC (1 Year Treasury Constant Maturity +2.33%) ± | | | 3.48 | | | | 9-1-2033 | | | | 795,057 | | | | 839,503 | |
FHLMC (1 Year Treasury Constant Maturity +2.22%) ± | | | 3.48 | | | | 12-1-2033 | | | | 719,079 | | | | 750,463 | |
FHLMC (1 Year Treasury Constant Maturity +2.24%) ± | | | 3.48 | | | | 1-1-2036 | | | | 1,573,854 | | | | 1,651,761 | |
FHLMC (1 Year Treasury Constant Maturity +2.32%) ± | | | 3.48 | | | | 7-1-2031 | | | | 184,592 | | | | 194,447 | |
FHLMC (12 Month LIBOR +1.74%) ± | | | 3.49 | | | | 12-1-2036 | | | | 451,632 | | | | 471,656 | |
FHLMC (1 Year Treasury Constant Maturity +2.23%) ± | | | 3.49 | | | | 1-1-2034 | | | | 922,544 | | | | 965,640 | |
FHLMC (1 Year Treasury Constant Maturity +2.39%) ± | | | 3.49 | | | | 6-1-2035 | | | | 1,774,575 | | | | 1,851,695 | |
FHLMC (1 Year Treasury Constant Maturity +2.28%) ± | | | 3.49 | | | | 2-1-2036 | | | | 830,872 | | | | 875,077 | |
FHLMC (1 Year Treasury Constant Maturity +2.43%) ± | | | 3.50 | | | | 8-1-2029 | | | | 87,935 | | | | 89,149 | |
FHLMC (1 Year Treasury Constant Maturity +2.25%) ± | | | 3.50 | | | | 10-1-2034 | | | | 1,566,339 | | | | 1,647,693 | |
FHLMC (12 Month LIBOR +1.75%) ± | | | 3.50 | | | | 4-1-2035 | | | | 245,880 | | | | 258,538 | |
FHLMC (1 Year Treasury Constant Maturity +2.29%) ± | | | 3.50 | | | | 11-1-2027 | | | | 492,166 | | | | 514,982 | |
FHLMC (1 Year Treasury Constant Maturity +2.36%) ± | | | 3.50 | | | | 1-1-2028 | | | | 2,539 | | | | 2,668 | |
FHLMC (1 Year Treasury Constant Maturity +2.43%) ± | | | 3.50 | | | | 6-1-2025 | | | | 60,623 | | | | 61,291 | |
FHLMC (1 Year Treasury Constant Maturity +2.44%) ± | | | 3.51 | | | | 11-1-2029 | | | | 672,715 | | | | 701,581 | |
FHLMC (12 Month LIBOR +1.76%) ± | | | 3.51 | | | | 5-1-2037 | | | | 1,325,359 | | | | 1,390,109 | |
FHLMC (1 Year Treasury Constant Maturity +2.29%) ± | | | 3.52 | | | | 11-1-2029 | | | | 161,926 | | | | 166,345 | |
FHLMC (1 Year Treasury Constant Maturity +2.37%) ± | | | 3.52 | | | | 1-1-2037 | | | | 1,830,724 | | | | 1,932,046 | |
FHLMC (1 Year Treasury Constant Maturity +2.27%) ± | | | 3.52 | | | | 5-1-2025 | | | | 70,862 | | | | 71,619 | |
FHLMC (1 Year Treasury Constant Maturity +2.25%) ± | | | 3.52 | | | | 5-1-2034 | | | | 94,913 | | | | 99,891 | |
FHLMC (1 Year Treasury Constant Maturity +2.52%) ± | | | 3.52 | | | | 11-1-2029 | | | | 108,910 | | | | 112,271 | |
FHLMC (12 Month LIBOR +1.78%) ± | | | 3.53 | | | | 11-1-2035 | | | | 453,292 | | | | 475,507 | |
The accompanying notes are an integral part of these financial statements.
| | | | |
| 10 | | Wells Fargo Adjustable Rate Government Fund | | Portfolio of investments—February 28, 2018 (unaudited) |
| | | | | | | | | | | | | | | | |
| Security name | | Interest rate | | | Maturity date | | | Principal | | | Value | |
| | | | |
Agency Securities (continued) | | | | | | | | | | | | | | | | |
FHLMC (11th District Cost of Funds +2.18%) ± | | | 3.53 | % | | | 12-1-2025 | | | $ | 42,270 | | | $ | 42,597 | |
FHLMC (1 Year Treasury Constant Maturity +2.48%) ± | | | 3.53 | | | | 6-1-2030 | | | | 277,670 | | | | 289,548 | |
FHLMC (1 Year Treasury Constant Maturity +2.36%) ± | | | 3.53 | | | | 6-1-2035 | | | | 539,702 | | | | 570,155 | |
FHLMC (1 Year Treasury Constant Maturity +2.24%) ± | | | 3.54 | | | | 7-1-2037 | | | | 567,475 | | | | 596,730 | |
FHLMC (1 Year Treasury Constant Maturity +2.48%) ± | | | 3.54 | | | | 10-1-2024 | | | | 86,688 | | | | 90,094 | |
FHLMC (12 Month LIBOR +1.77%) ± | | | 3.54 | | | | 6-1-2035 | | | | 1,176,684 | | | | 1,237,082 | |
FHLMC (12 Month LIBOR +1.78%) ± | | | 3.55 | | | | 10-1-2035 | | | | 1,092,286 | | | | 1,147,629 | |
FHLMC (12 Month LIBOR +1.76%) ± | | | 3.55 | | | | 10-1-2036 | | | | 604,489 | | | | 634,660 | |
FHLMC (1 Year Treasury Constant Maturity +2.48%) ± | | | 3.55 | | | | 6-1-2035 | | | | 1,678,829 | | | | 1,779,222 | |
FHLMC (1 Year Treasury Constant Maturity +2.26%) ± | | | 3.55 | | | | 9-1-2038 | | | | 704,229 | | | | 729,861 | |
FHLMC (12 Month LIBOR +1.91%) ± | | | 3.55 | | | | 3-1-2032 | | | | 829,763 | | | | 875,462 | |
FHLMC (US Treasury H15 Treasury Bill 6 Month Auction High Discount +1.94%) ± | | | 3.56 | | | | 7-1-2024 | | | | 33,551 | | | | 33,410 | |
FHLMC (1 Year Treasury Constant Maturity +2.33%) ± | | | 3.57 | | | | 10-1-2033 | | | | 1,940,498 | | | | 2,033,247 | |
FHLMC (1 Year Treasury Constant Maturity +2.25%) ± | | | 3.57 | | | | 1-1-2037 | | | | 180,906 | | | | 189,395 | |
FHLMC (1 Year Treasury Constant Maturity +2.27%) ± | | | 3.57 | | | | 2-1-2034 | | | | 743,076 | | | | 785,344 | |
FHLMC (3 Year Treasury Constant Maturity +2.44%) ± | | | 3.58 | | | | 5-1-2031 | | | | 118,038 | | | | 123,350 | |
FHLMC (12 Month LIBOR +1.75%) ± | | | 3.58 | | | | 6-1-2033 | | | | 759,955 | | | | 798,474 | |
FHLMC (1 Year Treasury Constant Maturity +2.27%) ± | | | 3.59 | | | | 2-1-2034 | | | | 1,598,371 | | | | 1,675,789 | |
FHLMC (1 Year Treasury Constant Maturity +2.28%) ± | | | 3.59 | | | | 1-1-2035 | | | | 352,097 | | | | 369,827 | |
FHLMC (12 Month LIBOR +1.84%) ± | | | 3.60 | | | | 4-1-2035 | | | | 1,387,116 | | | | 1,464,965 | |
FHLMC (1 Year Treasury Constant Maturity +2.36%) ± | | | 3.60 | | | | 1-1-2028 | | | | 18,510 | | | | 19,282 | |
FHLMC (1 Year Treasury Constant Maturity +2.22%) ± | | | 3.60 | | | | 1-1-2033 | | | | 596,231 | | | | 623,950 | |
FHLMC (12 Month LIBOR +1.75%) ± | | | 3.60 | | | | 5-1-2033 | | | | 194,452 | | | | 205,428 | |
FHLMC (12 Month LIBOR +1.82%) ± | | | 3.60 | | | | 5-1-2039 | | | | 911,617 | | | | 956,615 | |
FHLMC (6 Month LIBOR +2.12%) ± | | | 3.62 | | | | 5-1-2037 | | | | 148,216 | | | | 155,737 | |
FHLMC (6 Month LIBOR +2.08%) ± | | | 3.62 | | | | 6-1-2026 | | | | 884,115 | | | | 908,734 | |
FHLMC (12 Month LIBOR +1.87%) ± | | | 3.62 | | | | 4-1-2037 | | | | 542,151 | | | | 571,928 | |
FHLMC (US Treasury H15 Treasury Bill 6 Month Auction High Discount +2.50%) ± | | | 3.63 | | | | 11-1-2018 | | | | 492 | | | | 490 | |
FHLMC (1 Year Treasury Constant Maturity +2.24%) ± | | | 3.63 | | | | 11-1-2022 | | | | 90,831 | | | | 93,170 | |
FHLMC (1 Year Treasury Constant Maturity +2.43%) ± | | | 3.63 | | | | 10-1-2030 | | | | 1,614,831 | | | | 1,688,194 | |
FHLMC (2 Year Treasury Constant Maturity +2.44%) ± | | | 3.64 | | | | 8-1-2029 | | | | 105,458 | | | | 108,278 | |
FHLMC (1 Year Treasury Constant Maturity +2.30%) ± | | | 3.66 | | | | 11-1-2035 | | | | 1,127,120 | | | | 1,186,559 | |
FHLMC (1 Year Treasury Constant Maturity +2.38%) ± | | | 3.67 | | | | 4-1-2034 | | | | 518,637 | | | | 539,692 | |
FHLMC (12 Month LIBOR +1.87%) ± | | | 3.68 | | | | 9-1-2036 | | | | 735,027 | | | | 773,405 | |
FHLMC (12 Month LIBOR +1.91%) ± | | | 3.68 | | | | 4-1-2037 | | | | 702,659 | | | | 737,116 | |
FHLMC (12 Month LIBOR +1.87%) ± | | | 3.68 | | | | 5-1-2035 | | | | 181,567 | | | | 191,467 | |
FHLMC (12 Month LIBOR +1.93%) ± | | | 3.69 | | | | 4-1-2035 | | | | 975,042 | | | | 1,030,453 | |
FHLMC (1 Year Treasury Constant Maturity +2.58%) ± | | | 3.70 | | | | 8-1-2030 | | | | 2,928,146 | | | | 3,054,145 | |
FHLMC (5 Year Treasury Constant Maturity +2.13%) ± | | | 3.70 | | | | 8-1-2029 | | | | 9,390 | | | | 9,301 | |
FHLMC (1 Year Treasury Constant Maturity +2.25%) ± | | | 3.70 | | | | 2-1-2036 | | | | 1,244,604 | | | | 1,308,696 | |
FHLMC (1 Year Treasury Constant Maturity +2.23%) ± | | | 3.71 | | | | 2-1-2034 | | | | 971,245 | | | | 1,013,185 | |
FHLMC (12 Month LIBOR +1.98%) ± | | | 3.73 | | | | 11-1-2032 | | | | 117,115 | | | | 119,137 | |
FHLMC (1 Year Treasury Constant Maturity +2.23%) ± | | | 3.73 | | | | 2-1-2034 | | | | 495,287 | | | | 520,035 | |
FHLMC (12 Month LIBOR +1.99%) ± | | | 3.75 | | | | 7-1-2036 | | | | 721,321 | | | | 756,801 | |
FHLMC (1 Year Treasury Constant Maturity +2.45%) ± | | | 3.76 | | | | 12-1-2032 | | | | 557,702 | | | | 583,837 | |
FHLMC (1 Year Treasury Constant Maturity +2.36%) ± | | | 3.77 | | | | 2-1-2035 | | | | 1,120,737 | | | | 1,183,144 | |
FHLMC (6 Month LIBOR +2.38%) ± | | | 3.79 | | | | 2-1-2024 | | | | 18,160 | | | | 18,233 | |
FHLMC (1 Year Treasury Constant Maturity +2.55%) ± | | | 3.80 | | | | 9-1-2029 | | | | 132,295 | | | | 134,633 | |
FHLMC (11th District Cost of Funds +2.57%) ± | | | 3.80 | | | | 12-1-2025 | | | | 378,364 | | | | 395,307 | |
FHLMC (1 Year Treasury Constant Maturity +2.67%) ± | | | 3.81 | | | | 5-1-2028 | | | | 228,652 | | | | 236,782 | |
The accompanying notes are an integral part of these financial statements.
| | | | | | |
| Portfolio of investments—February 28, 2018 (unaudited) | | Wells Fargo Adjustable Rate Government Fund | | | 11 | |
| | | | | | | | | | | | | | | | |
| Security name | | Interest rate | | | Maturity date | | | Principal | | | Value | |
| | | | |
Agency Securities (continued) | | | | | | | | | | | | | | | | |
FHLMC (1 Year Treasury Constant Maturity +2.44%) ± | | | 3.82 | % | | | 2-1-2029 | | | $ | 4,407 | | | $ | 4,396 | |
FHLMC (1 Year Treasury Constant Maturity +2.48%) ± | | | 3.82 | | | | 6-1-2030 | | | | 33,001 | | | | 33,529 | |
FHLMC (1 Year Treasury Constant Maturity +2.61%) ± | | | 3.82 | | | | 9-1-2030 | | | | 105,203 | | | | 107,013 | |
FHLMC (Federal Cost of Funds +2.72%) ± | | | 3.89 | | | | 4-1-2023 | | | | 12,720 | | | | 12,865 | |
FHLMC (3 Year Treasury Constant Maturity +2.44%) ± | | | 3.89 | | | | 5-1-2032 | | | | 221,670 | | | | 219,477 | |
FHLMC (3 Year Treasury Constant Maturity +2.65%) ± | | | 3.91 | | | | 6-1-2035 | | | | 1,000,651 | | | | 1,039,943 | |
FHLMC | | | 4.00 | | | | 12-15-2023 | | | | 11,091 | | | | 11,110 | |
FHLMC (5 Year Treasury Constant Maturity +2.44%) ± | | | 4.02 | | | | 8-1-2027 | | | | 63,136 | | | | 63,288 | |
FHLMC (FHLMC National Average Mortgage Contract +3.27%) ± | | | 4.27 | | | | 2-1-2021 | | | | 13,208 | | | | 13,340 | |
FHLMC (6 Month LIBOR +3.30%) ± | | | 4.86 | | | | 11-1-2026 | | | | 99,040 | | | | 102,219 | |
FHLMC | | | 5.00 | | | | 10-1-2022 | | | | 8,996 | | | | 9,283 | |
FHLMC (1 Year Treasury Constant Maturity +2.32%) ± | | | 5.50 | | | | 8-1-2024 | | | | 254,726 | | | | 257,418 | |
FHLMC | | | 6.50 | | | | 4-1-2018 | | | | 1,765 | | | | 1,764 | |
FHLMC Series 0020 Class F ±± | | | 2.05 | | | | 7-1-2029 | | | | 13,583 | | | | 13,862 | |
FHLMC Series 1671 Class QA (11th District Cost of Funds +0.95%) ± | | | 1.70 | | | | 2-15-2024 | | | | 590,190 | | | | 601,866 | |
FHLMC Series 1686 Class FE (11th District Cost of Funds +1.10%) ± | | | 1.85 | | | | 2-15-2024 | | | | 20,778 | | | | 21,210 | |
FHLMC Series 1730 Class FA (10 Year Treasury Constant Maturity -0.60%) ± | | | 1.99 | | | | 5-15-2024 | | | | 138,282 | | | | 138,109 | |
FHLMC Series 2315 Class FW (1 Month LIBOR +0.55%) ± | | | 2.14 | | | | 4-15-2027 | | | | 91,558 | | | | 92,735 | |
FHLMC Series 2391 Class EF (1 Month LIBOR +0.50%) ± | | | 2.09 | | | | 6-15-2031 | | | | 78,807 | | | | 79,257 | |
FHLMC Series 2454 Class SL (1 Month LIBOR +8.00%) ±(c) | | | 6.41 | | | | 3-15-2032 | | | | 154,287 | | | | 28,549 | |
FHLMC Series 2461 Class FI (1 Month LIBOR +0.50%) ± | | | 2.09 | | | | 4-15-2028 | | | | 115,020 | | | | 115,494 | |
FHLMC Series 2464 Class FE (1 Month LIBOR +1.00%) ± | | | 2.59 | | | | 3-15-2032 | | | | 100,560 | | | | 103,594 | |
FHLMC Series 2466 Class FV (1 Month LIBOR +0.55%) ± | | | 2.14 | | | | 3-15-2032 | | | | 197,231 | | | | 200,301 | |
FHLMC Series 2538 Class F (1 Month LIBOR +0.60%) ± | | | 2.19 | | | | 12-15-2032 | | | | 442,296 | | | | 448,932 | |
FHLMC Series 3335 Class FT (1 Month LIBOR +0.15%) ± | | | 1.74 | | | | 8-15-2019 | | | | 5,941 | | | | 5,940 | |
FHLMC Series 3436 Class A ±± | | | 3.29 | | | | 11-15-2036 | | | | 958,032 | | | | 1,010,633 | |
FHLMC Series T-15 Class A6 (1 Month LIBOR +0.40%) ± | | | 1.96 | | | | 11-25-2028 | | | | 572,379 | | | | 569,393 | |
FHLMC Series T-16 Class A (1 Month LIBOR +0.35%) ± | | | 1.97 | | | | 6-25-2029 | | | | 1,379,207 | | | | 1,380,912 | |
FHLMC Series T-20 Class A7 (1 Month LIBOR +0.30%) ± | | | 1.92 | | | | 12-25-2029 | | | | 2,644,435 | | | | 2,593,889 | |
FHLMC Series T-21 Class A (1 Month LIBOR +0.36%) ± | | | 1.98 | | | | 10-25-2029 | | | | 1,332,940 | | | | 1,322,949 | |
FHLMC Series T-23 Class A (1 Month LIBOR +0.28%) ± | | | 1.90 | | | | 5-25-2030 | | | | 1,636,618 | | | | 1,632,431 | |
FHLMC Series T-27 Class A (1 Month LIBOR +0.30%) ± | | | 1.92 | | | | 10-25-2030 | | | | 1,097,851 | | | | 1,099,946 | |
FHLMC Series T-30 Class A7 (1 Month LIBOR +0.36%) ± | | | 1.98 | | | | 12-25-2030 | | | | 1,150,433 | | | | 1,113,233 | |
FHLMC Series T-35 Class A (1 Month LIBOR +0.28%) ± | | | 1.90 | | | | 9-25-2031 | | | | 3,085,718 | | | | 3,051,741 | |
FHLMC Series T-48 Class 2A ±± | | | 3.78 | | | | 7-25-2033 | | | | 2,305,704 | | | | 2,334,081 | |
FHLMC Series T-54 Class 4A ±± | | | 3.61 | | | | 2-25-2043 | | | | 1,539,014 | | | | 1,543,965 | |
FHLMC Series T-55 Class 1A1 | | | 6.50 | | | | 3-25-2043 | | | | 66,306 | | | | 73,444 | |
FHLMC Series T-56 Class 3AF (1 Month LIBOR +1.00%) ± | | | 2.62 | | | | 5-25-2043 | | | | 1,010,803 | | | | 1,034,276 | |
FHLMC Series T-62 Class 1A1 (12 Month Treasury Average +1.20%) ± | | | 2.26 | | | | 10-25-2044 | | | | 3,883,186 | | | | 3,936,829 | |
FHLMC Series T-63 Class 1A1 (12 Month Treasury Average +1.20%) ± | | | 2.26 | | | | 2-25-2045 | | | | 3,481,690 | | | | 3,506,889 | |
FHLMC Series T-66 Class 2A1 ±± | | | 3.58 | | | | 1-25-2036 | | | | 2,277,484 | | | | 2,305,902 | |
FHLMC Series T-67 Class 1A1C ±± | | | 3.41 | | | | 3-25-2036 | | | | 5,215,824 | | | | 5,363,091 | |
FHLMC Series T-67 Class 2A1C ±± | | | 3.30 | | | | 3-25-2036 | | | | 4,238,192 | | | | 4,323,970 | |
FHLMC Series T-75 Class A1 (1 Month LIBOR +0.04%) ± | | | 1.60 | | | | 12-25-2036 | | | | 1,469,797 | | | | 1,465,122 | |
FNMA (1 Month LIBOR +0.35%) ± | | | 1.91 | | | | 8-25-2018 | | | | 604,655 | | | | 605,157 | |
FNMA (11th District Cost of Funds +1.25%) ± | | | 1.94 | | | | 4-1-2021 | | | | 28,440 | | | | 28,276 | |
FNMA (11th District Cost of Funds +1.25%) ± | | | 1.95 | | | | 11-1-2024 | | | | 3,329 | | | | 3,322 | |
FNMA (11th District Cost of Funds +1.25%) ± | | | 1.98 | | | | 3-1-2033 | | | | 139,178 | | | | 141,193 | |
FNMA (11th District Cost of Funds +1.25%) ± | | | 1.99 | | | | 11-1-2023 | | | | 27,474 | | | | 27,254 | |
FNMA (11th District Cost of Funds +1.25%) ± | | | 1.99 | | | | 4-1-2019 | | | | 357 | | | | 356 | |
The accompanying notes are an integral part of these financial statements.
| | | | |
| 12 | | Wells Fargo Adjustable Rate Government Fund | | Portfolio of investments—February 28, 2018 (unaudited) |
| | | | | | | | | | | | | | | | |
| Security name | | Interest rate | | | Maturity date | | | Principal | | | Value | |
| | | | |
Agency Securities (continued) | | | | | | | | | | | | | | | | |
FNMA (11th District Cost of Funds +1.26%) ± | | | 1.99 | % | | | 1-1-2035 | | | $ | 1,003,493 | | | $ | 1,011,098 | |
FNMA (11th District Cost of Funds +1.25%) ± | | | 2.00 | | | | 4-1-2042 | | | | 2,133,591 | | | | 2,158,640 | |
FNMA (11th District Cost of Funds +1.25%) ± | | | 2.00 | | | | 10-1-2044 | | | | 1,120,670 | | | | 1,134,627 | |
FNMA (11th District Cost of Funds +1.25%) ± | | | 2.00 | | | | 3-1-2021 | | | | 105 | | | | 104 | |
FNMA (11th District Cost of Funds +1.42%) ± | | | 2.07 | | | | 4-1-2018 | | | | 18 | | | | 18 | |
FNMA (11th District Cost of Funds +1.25%) ± | | | 2.10 | | | | 11-1-2020 | | | | 157,572 | | | | 156,650 | |
FNMA (11th District Cost of Funds +1.50%) ± | | | 2.13 | | | | 6-1-2019 | | | | 86 | | | | 86 | |
FNMA (11th District Cost of Funds +1.25%) ± | | | 2.14 | | | | 1-1-2038 | | | | 148,940 | | | | 148,560 | |
FNMA (11th District Cost of Funds +1.45%) ± | | | 2.20 | | | | 4-1-2024 | | | | 1,866,287 | | | | 1,871,630 | |
FNMA (11th District Cost of Funds +1.50%) ± | | | 2.25 | | | | 1-1-2019 | | | | 6,563 | | | | 6,547 | |
FNMA (11th District Cost of Funds +1.50%) ± | | | 2.25 | | | | 5-1-2019 | | | | 31 | | | | 31 | |
FNMA (11th District Cost of Funds +1.25%) ± | | | 2.27 | | | | 9-1-2037 | | | | 2,317,259 | | | | 2,341,323 | |
FNMA (1 Year Treasury Constant Maturity +1.25%) ± | | | 2.28 | | | | 1-1-2021 | | | | 1,551 | | | | 1,572 | |
FNMA (1 Year Treasury Constant Maturity +1.25%) ± | | | 2.28 | | | | 1-1-2021 | | | | 1,087 | | | | 1,102 | |
FNMA (11th District Cost of Funds +1.78%) ± | | | 2.33 | | | | 1-1-2036 | | | | 337,408 | | | | 339,585 | |
FNMA (11th District Cost of Funds +1.63%) ± | | | 2.34 | | | | 5-1-2028 | | | | 20,756 | | | | 20,751 | |
FNMA (11th District Cost of Funds +1.25%) ± | | | 2.35 | | | | 4-1-2018 | | | | 2,836 | | | | 2,831 | |
FNMA (6 Month LIBOR +1.00%) ± | | | 2.38 | | | | 12-1-2020 | | | | 8,882 | | | | 8,858 | |
FNMA (3 Year Treasury Constant Maturity +1.21%) ± | | | 2.45 | | | | 3-1-2030 | | | | 18,196 | | | | 18,134 | |
FNMA (1 Year Treasury Constant Maturity +1.58%) ± | | | 2.46 | | | | 3-1-2034 | | | | 383,852 | | | | 402,853 | |
FNMA (1 Year Treasury Constant Maturity +1.67%) ± | | | 2.46 | | | | 4-1-2033 | | | | 187,312 | | | | 196,531 | |
FNMA (11th District Cost of Funds +1.78%) ± | | | 2.46 | | | | 5-1-2028 | | | | 59,163 | | | | 59,289 | |
FNMA (11th District Cost of Funds +1.25%) ± | | | 2.50 | | | | 10-1-2018 | | | | 3,095 | | | | 3,089 | |
FNMA (6 Month LIBOR +1.00%) ± | | | 2.50 | | | | 6-1-2021 | | | | 22,691 | | | | 23,284 | |
FNMA (11th District Cost of Funds +1.78%) ± | | | 2.52 | | | | 3-1-2033 | | | | 279,277 | | | | 279,920 | |
FNMA (11th District Cost of Funds +1.87%) ± | | | 2.52 | | | | 10-1-2024 | | | | 1,200 | | | | 1,201 | |
FNMA (11th District Cost of Funds +1.78%) ± | | | 2.53 | | | | 11-1-2022 | | | | 29,206 | | | | 29,233 | |
FNMA (11th District Cost of Funds +1.83%) ± | | | 2.53 | | | | 1-1-2036 | | | | 66,284 | | | | 66,637 | |
FNMA (12 Month Treasury Average +1.40%) ± | | | 2.53 | | | | 12-1-2030 | | | | 92,618 | | | | 92,517 | |
FNMA (1 Month LIBOR +1.17%) ± | | | 2.55 | | | | 5-1-2029 | | | | 45,709 | | | | 47,344 | |
FNMA (6 Month LIBOR +1.08%) ± | | | 2.58 | | | | 9-1-2032 | | | | 55,248 | | | | 55,174 | |
FNMA (1 Year Treasury Constant Maturity +1.50%) ± | | | 2.59 | | | | 8-1-2030 | | | | 1,239,458 | | | | 1,269,057 | |
FNMA (11th District Cost of Funds +1.89%) ± | | | 2.60 | | | | 9-1-2030 | | | | 335,539 | | | | 339,995 | |
FNMA (11th District Cost of Funds +1.86%) ± | | | 2.61 | | | | 9-1-2019 | | | | 5,958 | | | | 5,958 | |
FNMA (11th District Cost of Funds +1.87%) ± | | | 2.61 | | | | 10-1-2027 | | | | 493,319 | | | | 504,287 | |
FNMA (1 Year Treasury Constant Maturity +1.52%) ± | | | 2.63 | | | | 8-1-2033 | | | | 1,244,888 | | | | 1,284,167 | |
FNMA (11th District Cost of Funds +2.00%) ± | | | 2.65 | | | | 7-1-2028 | | | | 1,178 | | | | 1,195 | |
FNMA (6 Month LIBOR +1.18%) ± | | | 2.68 | | | | 8-1-2033 | | | | 180,319 | | | | 187,365 | |
FNMA (11th District Cost of Funds +1.96%) ± | | | 2.70 | | | | 1-1-2021 | | | | 91,123 | | | | 91,229 | |
FNMA (11th District Cost of Funds +1.97%) ± | | | 2.72 | | | | 9-1-2021 | | | | 20,595 | | | | 20,603 | |
FNMA (11th District Cost of Funds +1.74%) ± | | | 2.72 | | | | 4-1-2030 | | | | 2,509 | | | | 2,502 | |
FNMA (6 Month LIBOR +1.38%) ± | | | 2.75 | | | | 8-1-2031 | | | | 132,454 | | | | 134,875 | |
FNMA (11th District Cost of Funds +1.25%) ± | | | 2.76 | | | | 5-1-2018 | | | | 4,867 | | | | 4,859 | |
FNMA (11th District Cost of Funds +1.25%) ± | | | 2.76 | | | | 10-1-2018 | | | | 6,702 | | | | 6,694 | |
FNMA (1 Year Treasury Constant Maturity +1.89%) ± | | | 2.77 | | | | 6-1-2032 | | | | 62,371 | | | | 62,988 | |
FNMA (11th District Cost of Funds +2.02%) ± | | | 2.77 | | | | 11-1-2024 | | | | 32,141 | | | | 32,419 | |
FNMA (6 Month LIBOR +1.15%) ± | | | 2.77 | | | | 8-1-2032 | | | | 228,879 | | | | 228,906 | |
FNMA (11th District Cost of Funds +1.25%) ± | | | 2.79 | | | | 7-1-2020 | | | | 597,160 | | | | 598,410 | |
FNMA (6 Month LIBOR +1.42%) ± | | | 2.80 | | | | 9-1-2031 | | | | 152,937 | | | | 156,991 | |
FNMA (11th District Cost of Funds +2.12%) ± | | | 2.81 | | | | 4-1-2020 | | | | 1,248,263 | | | | 1,246,777 | |
The accompanying notes are an integral part of these financial statements.
| | | | | | |
| Portfolio of investments—February 28, 2018 (unaudited) | | Wells Fargo Adjustable Rate Government Fund | | | 13 | |
| | | | | | | | | | | | | | | | |
| Security name | | Interest rate | | | Maturity date | | | Principal | | | Value | |
| | | | |
Agency Securities (continued) | | | | | | | | | | | | | | | | |
FNMA (1 Year Treasury Constant Maturity +1.76%) ± | | | 2.85 | % | | | 8-1-2032 | | | $ | 138,034 | | | $ | 140,699 | |
FNMA (11th District Cost of Funds +1.25%) ± | | | 2.85 | | | | 3-1-2019 | | | | 71,250 | | | | 71,248 | |
FNMA (1 Year Treasury Constant Maturity +2.12%) ± | | | 2.87 | | | | 3-1-2031 | | | | 34,498 | | | | 34,740 | |
FNMA (6 Month LIBOR +1.16%) ± | | | 2.87 | | | | 8-1-2033 | | | | 3,499 | | | | 3,561 | |
FNMA (US Treasury H15 Treasury Bill 6 Month Auction High Discount +1.75%) ± | | | 2.92 | | | | 7-1-2020 | | | | 1,807 | | | | 1,818 | |
FNMA (1 Year Treasury Constant Maturity +2.13%) ± | | | 2.92 | | | | 5-1-2033 | | | | 526,827 | | | | 555,487 | |
FNMA (1 Year Treasury Constant Maturity +1.88%) ± | | | 2.93 | | | | 8-1-2031 | | | | 60,534 | | | | 63,177 | |
FNMA (1 Year Treasury Constant Maturity +1.89%) ± | | | 2.93 | | | | 7-1-2038 | | | | 924,534 | | | | 963,218 | |
FNMA (6 Month LIBOR +1.44%) ± | | | 2.94 | | | | 12-1-2031 | | | | 111,594 | | | | 113,327 | |
FNMA (1 Year Treasury Constant Maturity +2.18%) ± | | | 2.94 | | | | 5-1-2035 | | | | 226,779 | | | | 239,945 | |
FNMA (6 Month LIBOR +1.42%) ± | | | 2.96 | | | | 12-1-2031 | | | | 227,818 | | | | 236,542 | |
FNMA (1 Year Treasury Constant Maturity +2.22%) ± | | | 2.97 | | | | 4-1-2030 | | | | 14,730 | | | | 14,837 | |
FNMA (1 Year Treasury Constant Maturity +2.13%) ± | | | 2.97 | | | | 5-1-2033 | | | | 983,196 | | | | 1,034,074 | |
FNMA (1 Year Treasury Constant Maturity +2.21%) ± | | | 2.97 | | | | 5-1-2037 | | | | 958,491 | | | | 1,010,143 | |
FNMA (6 Month LIBOR +1.37%) ± | | | 2.99 | | | | 1-1-2032 | | | | 229,271 | | | | 237,504 | |
FNMA (1 Year Treasury Constant Maturity +2.25%) ± | | | 3.00 | | | | 6-1-2025 | | | | 6,537 | | | | 6,586 | |
FNMA (6 Month LIBOR +1.38%) ± | | | 3.00 | | | | 12-1-2031 | | | | 19,477 | | | | 19,451 | |
FNMA (1 Year Treasury Constant Maturity +2.12%) ± | | | 3.00 | | | | 5-1-2034 | | | | 573,962 | | | | 605,309 | |
FNMA (12 Month Treasury Average +1.91%) ± | | | 3.01 | | | | 6-1-2035 | | | | 684,013 | | | | 713,964 | |
FNMA (3 Year Treasury Constant Maturity +2.14%) ± | | | 3.02 | | | | 10-1-2025 | | | | 6,686 | | | | 6,630 | |
FNMA (1 Year Treasury Constant Maturity +2.07%) ± | | | 3.02 | | | | 4-1-2030 | | | | 84,828 | | | | 86,274 | |
FNMA (1 Year Treasury Constant Maturity +2.28%) ± | | | 3.03 | | | | 7-1-2024 | | | | 10,110 | | | | 10,146 | |
FNMA (1 Year Treasury Constant Maturity +2.15%) ± | | | 3.03 | | | | 4-1-2033 | | | | 1,034,742 | | | | 1,091,811 | |
FNMA (6 Month LIBOR +1.50%) ± | | | 3.03 | | | | 10-1-2037 | | | | 1,120,365 | | | | 1,159,336 | |
FNMA (1 Year Treasury Constant Maturity +2.26%) ± | | | 3.03 | | | | 5-1-2035 | | | | 429,472 | | | | 456,000 | |
FNMA (1 Year Treasury Constant Maturity +2.22%) ± | | | 3.03 | | | | 4-1-2033 | | | | 815,671 | | | | 854,892 | |
FNMA (1 Year Treasury Constant Maturity +2.01%) ± | | | 3.04 | | | | 11-1-2027 | | | | 25,395 | | | | 25,645 | |
FNMA (12 Month Treasury Average +1.90%) ± | | | 3.04 | | | | 11-1-2035 | | | | 991,193 | | | | 1,034,820 | |
FNMA (6 Month LIBOR +1.55%) ± | | | 3.05 | | | | 12-1-2022 | | | | 6,914 | | | | 6,945 | |
FNMA (12 Month Treasury Average +1.90%) ± | | | 3.05 | | | | 11-1-2035 | | | | 42,038 | | | | 43,865 | |
FNMA (11th District Cost of Funds +1.21%) ± | | | 3.06 | | | | 10-1-2034 | | | | 133,517 | | | | 135,196 | |
FNMA (6 Month LIBOR +1.55%) ± | | | 3.06 | | | | 3-1-2034 | | | | 319,626 | | | | 330,840 | |
FNMA (12 Month Treasury Average +1.97%) ± | | | 3.07 | | | | 7-1-2035 | | | | 835,795 | | | | 874,019 | |
FNMA (12 Month Treasury Average +1.91%) ± | | | 3.07 | | | | 1-1-2036 | | | | 2,409,848 | | | | 2,516,220 | |
FNMA (1 Year Treasury Constant Maturity +2.31%) ± | | | 3.07 | | | | 5-1-2035 | | | | 1,161,204 | | | | 1,232,025 | |
FNMA (1 Year Treasury Constant Maturity +2.10%) ± | | | 3.07 | | | | 7-1-2035 | | | | 400,147 | | | | 414,883 | |
FNMA (1 Year Treasury Constant Maturity +2.08%) ± | | | 3.07 | | | | 9-1-2035 | | | | 1,745,449 | | | | 1,838,813 | |
FNMA (3 Year Treasury Constant Maturity +1.83%) ± | | | 3.08 | | | | 4-1-2020 | | | | 110 | | | | 110 | |
FNMA (12 Month Treasury Average +1.98%) ± | | | 3.08 | | | | 7-1-2035 | | | | 1,162,984 | | | | 1,216,695 | |
FNMA (12 Month Treasury Average +1.93%) ± | | | 3.08 | | | | 11-1-2035 | | | | 169,635 | | | | 177,667 | |
FNMA (1 Year Treasury Constant Maturity +2.09%) ± | | | 3.09 | | | | 8-1-2025 | | | | 21,163 | | | | 21,588 | |
FNMA (1 Year Treasury Constant Maturity +2.03%) ± | | | 3.10 | | | | 12-1-2032 | | | | 649,106 | | | | 670,380 | |
FNMA (1 Year Treasury Constant Maturity +2.11%) ± | | | 3.11 | | | | 9-1-2036 | | | | 582,120 | | | | 607,058 | |
FNMA (1 Year Treasury Constant Maturity +1.74%) ± | | | 3.12 | | | | 1-1-2035 | | | | 89,630 | | | | 93,662 | |
FNMA (1 Year Treasury Constant Maturity +2.24%) ± | | | 3.12 | | | | 7-1-2028 | | | | 173 | | | | 180 | |
FNMA (1 Year Treasury Constant Maturity +2.21%) ± | | | 3.12 | | | | 6-1-2035 | | | | 892,633 | | | | 945,066 | |
FNMA (6 Month LIBOR +1.63%) ± | | | 3.13 | | | | 1-1-2022 | | | | 6,802 | | | | 6,805 | |
FNMA (12 Month Treasury Average +1.97%) ± | | | 3.13 | | | | 12-1-2035 | | | | 3,156,547 | | | | 3,301,791 | |
FNMA (1 Year Treasury Constant Maturity +2.04%) ± | | | 3.13 | | | | 6-1-2034 | | | | 783,045 | | | | 823,101 | |
FNMA (12 Month Treasury Average +1.98%) ± | | | 3.13 | | | | 10-1-2035 | | | | 584,963 | | | | 610,395 | |
The accompanying notes are an integral part of these financial statements.
| | | | |
| 14 | | Wells Fargo Adjustable Rate Government Fund | | Portfolio of investments—February 28, 2018 (unaudited) |
| | | | | | | | | | | | | | | | |
| Security name | | Interest rate | | | Maturity date | | | Principal | | | Value | |
| | | | |
Agency Securities (continued) | | | | | | | | | | | | | | | | |
FNMA (1 Year Treasury Constant Maturity +2.15%) ± | | | 3.13 | % | | | 1-1-2037 | | | $ | 1,107,054 | | | $ | 1,167,747 | |
FNMA (1 Year Treasury Constant Maturity +2.22%) ± | | | 3.13 | | | | 5-1-2033 | | | | 222,252 | | | | 234,377 | |
FNMA (12 Month Treasury Average +1.99%) ± | | | 3.14 | | | | 11-1-2035 | | | | 1,161,909 | | | | 1,216,054 | |
FNMA (6 Month LIBOR +1.54%) ± | | | 3.14 | | | | 1-1-2035 | | | | 1,551,726 | | | | 1,605,983 | |
FNMA (1 Year Treasury Constant Maturity +2.21%) ± | | | 3.14 | | | | 6-1-2033 | | | | 275,497 | | | | 286,107 | |
FNMA (Federal Cost of Funds +2.00%) ± | | | 3.15 | | | | 8-1-2029 | | | | 57,552 | | | | 61,841 | |
FNMA (3 Year Treasury Constant Maturity +2.15%) ± | | | 3.15 | | | | 8-1-2031 | | | | 36,980 | | | | 37,303 | |
FNMA (1 Year Treasury Constant Maturity +2.11%) ± | | | 3.15 | | | | 7-1-2035 | | | | 733,497 | | | | 767,920 | |
FNMA (1 Year Treasury Constant Maturity +2.18%) ± | | | 3.15 | | | | 6-1-2035 | | | | 416,987 | | | | 440,638 | |
FNMA (11th District Cost of Funds +1.25%) ± | | | 3.15 | | | | 4-1-2034 | | | | 1,494,246 | | | | 1,545,355 | |
FNMA (1 Year Treasury Constant Maturity +2.40%) ± | | | 3.15 | | | | 6-1-2024 | | | | 38,863 | | | | 38,840 | |
FNMA (1 Year Treasury Constant Maturity +2.19%) ± | | | 3.16 | | | | 3-1-2035 | | | | 824,881 | | | | 864,186 | |
FNMA (1 Year Treasury Constant Maturity +1.82%) ± | | | 3.16 | | | | 4-1-2038 | | | | 576,196 | | | | 603,691 | |
FNMA (1 Year Treasury Constant Maturity +2.12%) ± | | | 3.16 | | | | 8-1-2026 | | | | 50,689 | | | | 51,619 | |
FNMA (12 Month Treasury Average +1.99%) ± | | | 3.16 | | | | 8-1-2035 | | | | 95,053 | | | | 95,988 | |
FNMA (1 Year Treasury Constant Maturity +1.70%) ± | | | 3.16 | | | | 2-1-2033 | | | | 344,452 | | | | 357,292 | |
FNMA (1 Year Treasury Constant Maturity +2.19%) ± | | | 3.17 | | | | 7-1-2035 | | | | 1,050,279 | | | | 1,106,597 | |
FNMA (1 Year Treasury Constant Maturity +2.32%) ± | | | 3.17 | | | | 4-1-2028 | | | | 259,072 | | | | 268,018 | |
FNMA (1 Year Treasury Constant Maturity +2.22%) ± | | | 3.18 | | | | 6-1-2027 | | | | 86,699 | | | | 88,282 | |
FNMA (1 Year Treasury Constant Maturity +2.07%) ± | | | 3.18 | | | | 12-1-2033 | | | | 788,419 | | | | 814,939 | |
FNMA (1 Year Treasury Constant Maturity +2.20%) ± | | | 3.19 | | | | 6-1-2033 | | | | 633,207 | | | | 663,317 | |
FNMA (1 Year Treasury Constant Maturity +2.17%) ± | | | 3.19 | | | | 10-1-2035 | | | | 1,744,138 | | | | 1,841,671 | |
FNMA (1 Year Treasury Constant Maturity +2.22%) ± | | | 3.20 | | | | 6-1-2035 | | | | 857,334 | | | | 903,805 | |
FNMA (US Treasury H15 Treasury Bill 6 Month Auction High Discount +2.13%) ± | | | 3.20 | | | | 4-1-2018 | | | | 1,324 | | | | 1,326 | |
FNMA (US Treasury H15 Treasury Bill 6 Month Auction High Discount +2.00%) ± | | | 3.21 | | | | 10-1-2018 | | | | 3,587 | | | | 3,599 | |
FNMA (12 Month Treasury Average +2.08%) ± | | | 3.21 | | | | 1-1-2035 | | | | 493,645 | | | | 517,758 | |
FNMA (3 Year Treasury Constant Maturity +2.47%) ± | | | 3.22 | | | | 6-1-2024 | | | | 18,929 | | | | 18,872 | |
FNMA (6 Month LIBOR +1.55%) ± | | | 3.22 | | | | 2-1-2033 | | | | 204,078 | | | | 211,139 | |
FNMA (1 Year Treasury Constant Maturity +2.22%) ± | | | 3.22 | | | | 7-1-2035 | | | | 233,544 | | | | 246,257 | |
FNMA (1 Year Treasury Constant Maturity +2.14%) ± | | | 3.23 | | | | 10-1-2033 | | | | 341,599 | | | | 359,107 | |
FNMA (1 Year Treasury Constant Maturity +2.21%) ± | | | 3.23 | | | | 9-1-2035 | | | | 603,203 | | | | 635,891 | |
FNMA (1 Year Treasury Constant Maturity +2.35%) ± | | | 3.23 | | | | 6-1-2027 | | | | 74,078 | | | | 75,154 | |
FNMA (1 Year Treasury Constant Maturity +2.19%) ± | | | 3.24 | | | | 2-1-2036 | | | | 724,841 | | | | 763,996 | |
FNMA (1 Year Treasury Constant Maturity +2.23%) ± | | | 3.24 | | | | 1-1-2032 | | | | 61,044 | | | | 61,676 | |
FNMA (6 Month LIBOR +1.74%) ± | | | 3.24 | | | | 10-1-2024 | | | | 41,107 | | | | 41,255 | |
FNMA (6 Month LIBOR +1.74%) ± | | | 3.24 | | | | 12-1-2024 | | | | 59,887 | | | | 60,129 | |
FNMA (1 Year Treasury Constant Maturity +2.24%) ± | | | 3.24 | | | | 12-1-2040 | | | | 1,776,737 | | | | 1,881,943 | |
FNMA (1 Year Treasury Constant Maturity +2.18%) ± | | | 3.24 | | | | 4-1-2038 | | | | 1,109,925 | | | | 1,167,546 | |
FNMA (1 Year Treasury Constant Maturity +2.20%) ± | | | 3.25 | | | | 6-1-2036 | | | | 1,435,021 | | | | 1,512,052 | |
FNMA (Federal Cost of Funds +1.75%) ± | | | 3.25 | | | | 8-1-2018 | | | | 7,010 | | | | 7,023 | |
FNMA (1 Year Treasury Constant Maturity +2.00%) ± | | | 3.25 | | | | 2-1-2020 | | | | 282 | | | | 281 | |
FNMA (Federal Cost of Funds +2.00%) ± | | | 3.25 | | | | 11-1-2028 | | | | 1,891 | | | | 1,902 | |
FNMA (Federal Cost of Funds +1.75%) ± | | | 3.25 | | | | 12-1-2028 | | | | 4,763 | | | | 4,780 | |
FNMA (Federal Cost of Funds +1.75%) ± | | | 3.25 | | | | 1-1-2029 | | | | 1,423 | | | | 1,433 | |
FNMA (1 Year Treasury Constant Maturity +2.18%) ± | | | 3.25 | | | | 9-1-2036 | | | | 647,337 | | | | 683,163 | |
FNMA (1 Year Treasury Constant Maturity +2.11%) ± | | | 3.26 | | | | 5-1-2035 | | | | 773,557 | | | | 812,660 | |
FNMA (1 Year Treasury Constant Maturity +2.21%) ± | | | 3.26 | | | | 7-1-2033 | | | | 66,039 | | | | 69,852 | |
FNMA (6 Month LIBOR +1.68%) ± | | | 3.27 | | | | 11-1-2034 | | | | 434,889 | | | | 453,123 | |
FNMA (US Treasury H15 Treasury Bill 6 Month Auction High Discount +2.13%) ± | | | 3.27 | | | | 7-1-2018 | | | | 5,160 | | | | 5,166 | |
FNMA (1 Year Treasury Constant Maturity +2.27%) ± | | | 3.27 | | | | 6-1-2036 | | | | 167,663 | | | | 176,522 | |
The accompanying notes are an integral part of these financial statements.
| | | | | | |
| Portfolio of investments—February 28, 2018 (unaudited) | | Wells Fargo Adjustable Rate Government Fund | | | 15 | |
| | | | | | | | | | | | | | | | |
| Security name | | Interest rate | | | Maturity date | | | Principal | | | Value | |
| | | | |
Agency Securities (continued) | | | | | | | | | | | | | | | | |
FNMA (1 Year Treasury Constant Maturity +2.23%) ± | | | 3.27 | % | | | 1-1-2035 | | | $ | 620,676 | | | $ | 656,657 | |
FNMA (1 Year Treasury Constant Maturity +2.22%) ± | | | 3.28 | | | | 8-1-2026 | | | | 329,903 | | | | 346,605 | |
FNMA (12 Month LIBOR +1.53%) ± | | | 3.28 | | | | 9-1-2035 | | | | 1,396,129 | | | | 1,454,641 | |
FNMA (1 Year Treasury Constant Maturity +2.18%) ± | | | 3.28 | | | | 1-1-2036 | | | | 973,953 | | | | 1,028,301 | |
FNMA (1 Year Treasury Constant Maturity +2.21%) ± | | | 3.28 | | | | 7-1-2040 | | | | 2,202,591 | | | | 2,324,018 | |
FNMA (1 Year Treasury Constant Maturity +2.31%) ± | | | 3.28 | | | | 4-1-2038 | | | | 683,191 | | | | 713,366 | |
FNMA (1 Year Treasury Constant Maturity +2.15%) ± | | | 3.28 | | | | 4-1-2040 | | | | 164,189 | | | | 172,837 | |
FNMA (1 Year Treasury Constant Maturity +2.11%) ± | | | 3.29 | | | | 5-1-2034 | | | | 692,919 | | | | 727,906 | |
FNMA (1 Year Treasury Constant Maturity +2.23%) ± | | | 3.29 | | | | 3-1-2038 | | | | 1,763,027 | | | | 1,858,046 | |
FNMA (1 Year Treasury Constant Maturity +2.30%) ± | | | 3.29 | | | | 9-1-2037 | | | | 747,970 | | | | 794,572 | |
FNMA (1 Year Treasury Constant Maturity +2.25%) ± | | | 3.29 | | | | 4-1-2033 | | | | 658,059 | | | | 695,762 | |
FNMA (1 Year Treasury Constant Maturity +2.29%) ± | | | 3.29 | | | | 6-1-2037 | | | | 779,798 | | | | 821,731 | |
FNMA (1 Year Treasury Constant Maturity +2.23%) ± | | | 3.29 | | | | 7-1-2037 | | | | 574,562 | | | | 605,621 | |
FNMA (12 Month Treasury Average +2.15%) ± | | | 3.29 | | | | 8-1-2036 | | | | 2,040,187 | | | | 2,147,967 | |
FNMA (1 Year Treasury Constant Maturity +2.21%) ± | | | 3.29 | | | | 1-1-2027 | | | | 355,162 | | | | 358,001 | |
FNMA (Federal Cost of Funds +2.00%) ± | | | 3.30 | | | | 2-1-2029 | | | | 14,515 | | | | 14,595 | |
FNMA (1 Year Treasury Constant Maturity +2.13%) ± | | | 3.31 | | | | 10-1-2025 | | | | 94,882 | | | | 96,995 | |
FNMA (12 Month Treasury Average +2.49%) ± | | | 3.31 | | | | 6-1-2040 | | | | 854,879 | | | | 890,605 | |
FNMA (1 Year Treasury Constant Maturity +2.19%) ± | | | 3.31 | | | | 5-1-2036 | | | | 1,025,677 | | | | 1,080,460 | |
FNMA (1 Year Treasury Constant Maturity +2.27%) ± | | | 3.31 | | | | 5-1-2034 | | | | 360,429 | | | | 378,517 | |
FNMA (1 Year Treasury Constant Maturity +2.28%) ± | | | 3.31 | | | | 4-1-2024 | | | | 12,934 | | | | 13,269 | |
FNMA (1 Year Treasury Constant Maturity +2.19%) ± | | | 3.32 | | | | 8-1-2033 | | | | 1,471,085 | | | | 1,553,247 | |
FNMA (1 Year Treasury Constant Maturity +2.20%) ± | | | 3.32 | | | | 5-1-2033 | | | | 331,155 | | | | 346,852 | |
FNMA (1 Year Treasury Constant Maturity +2.20%) ± | | | 3.32 | | | | 10-1-2036 | | | | 917,007 | | | | 967,895 | |
FNMA (1 Year Treasury Constant Maturity +2.31%) ± | | | 3.32 | | | | 2-1-2035 | | | | 846,716 | | | | 890,805 | |
FNMA (1 Year Treasury Constant Maturity +2.22%) ± | | | 3.32 | | | | 7-1-2035 | | | | 891,310 | | | | 942,138 | |
FNMA (1 Year Treasury Constant Maturity +2.21%) ± | | | 3.32 | | | | 8-1-2035 | | | | 1,567,084 | | | | 1,653,263 | |
FNMA (1 Year Treasury Constant Maturity +2.19%) ± | | | 3.32 | | | | 12-1-2040 | | | | 362,041 | | | | 381,407 | |
FNMA (1 Year Treasury Constant Maturity +2.19%) ± | | | 3.32 | | | | 6-1-2036 | | | | 1,551,051 | | | | 1,636,331 | |
FNMA (1 Year Treasury Constant Maturity +2.21%) ± | | | 3.32 | | | | 5-1-2033 | | | | 1,637,509 | | | | 1,703,171 | |
FNMA (1 Year Treasury Constant Maturity +2.19%) ± | | | 3.32 | | | | 12-1-2034 | | | | 958,086 | | | | 1,010,823 | |
FNMA (1 Year Treasury Constant Maturity +2.18%) ± | | | 3.33 | | | | 1-1-2033 | | | | 2,250,957 | | | | 2,322,120 | |
FNMA (1 Year Treasury Constant Maturity +2.22%) ± | | | 3.33 | | | | 12-1-2040 | | | | 1,021,361 | | | | 1,078,739 | |
FNMA (Federal Cost of Funds +2.00%) ± | | | 3.33 | | | | 1-1-2029 | | | | 1,130 | | | | 1,147 | |
FNMA (1 Year Treasury Constant Maturity +2.30%) ± | | | 3.33 | | | | 9-1-2030 | | | | 117,165 | | | | 119,492 | |
FNMA (1 Year Treasury Constant Maturity +2.21%) ± | | | 3.34 | | | | 7-1-2035 | | | | 725,647 | | | | 765,080 | |
FNMA (1 Year Treasury Constant Maturity +2.19%) ± | | | 3.34 | | | | 12-1-2035 | | | | 374,206 | | | | 393,783 | |
FNMA (1 Year Treasury Constant Maturity +2.23%) ± | | | 3.34 | | | | 11-1-2037 | | | | 777,254 | | | | 820,511 | |
FNMA (1 Year Treasury Constant Maturity +2.35%) ± | | | 3.34 | | | | 12-1-2030 | | | | 712,136 | | | | 745,922 | |
FNMA (1 Year Treasury Constant Maturity +2.21%) ± | | | 3.34 | | | | 6-1-2034 | | | | 1,952,945 | | | | 2,059,822 | |
FNMA (1 Year Treasury Constant Maturity +2.08%) ± | | | 3.34 | | | | 11-1-2035 | | | | 774,974 | | | | 810,106 | |
FNMA (1 Year Treasury Constant Maturity +2.21%) ± | | | 3.35 | | | | 12-1-2036 | | | | 546,069 | | | | 576,111 | |
FNMA (1 Year Treasury Constant Maturity +2.24%) ± | | | 3.35 | | | | 1-1-2037 | | | | 1,345,589 | | | | 1,420,954 | |
FNMA (1 Year Treasury Constant Maturity +2.35%) ± | | | 3.35 | | | | 6-1-2030 | | | | 53,317 | | | | 54,476 | |
FNMA (6 Month LIBOR +1.98%) ± | | | 3.35 | | | | 9-1-2033 | | | | 55,911 | | | | 56,135 | |
FNMA (1 Year Treasury Constant Maturity +2.14%) ± | | | 3.35 | | | | 12-1-2034 | | | | 995,966 | | | | 1,047,756 | |
FNMA (1 Year Treasury Constant Maturity +2.43%) ± | | | 3.35 | | | | 7-1-2037 | | | | 1,765,415 | | | | 1,869,669 | |
FNMA (1 Year Treasury Constant Maturity +2.18%) ± | | | 3.36 | | | | 9-1-2035 | | | | 1,399,763 | | | | 1,474,843 | |
FNMA (6 Month LIBOR +1.84%) ± | | | 3.36 | | | | 4-1-2033 | | | | 381,845 | | | | 400,409 | |
FNMA (1 Year Treasury Constant Maturity +2.21%) ± | | | 3.36 | | | | 9-1-2033 | | | | 623,609 | | | | 650,062 | |
The accompanying notes are an integral part of these financial statements.
| | | | |
| 16 | | Wells Fargo Adjustable Rate Government Fund | | Portfolio of investments—February 28, 2018 (unaudited) |
| | | | | | | | | | | | | | | | |
| Security name | | Interest rate | | | Maturity date | | | Principal | | | Value | |
| | | | |
Agency Securities (continued) | | | | | | | | | | | | | | | | |
FNMA (1 Year Treasury Constant Maturity +2.32%) ± | | | 3.36 | % | | | 10-1-2034 | | | $ | 778,192 | | | $ | 825,464 | |
FNMA (1 Year Treasury Constant Maturity +2.14%) ± | | | 3.36 | | | | 7-1-2029 | | | | 499,967 | | | | 525,020 | |
FNMA (1 Year Treasury Constant Maturity +2.29%) ± | | | 3.36 | | | | 10-1-2036 | | | | 754,768 | | | | 797,385 | |
FNMA (1 Year Treasury Constant Maturity +2.25%) ± | | | 3.37 | | | | 5-1-2036 | | | | 1,778,509 | | | | 1,857,101 | |
FNMA (1 Year Treasury Constant Maturity +2.40%) ± | | | 3.37 | | | | 7-1-2037 | | | | 640,285 | | | | 673,298 | |
FNMA (US Treasury H15 Treasury Bill 6 Month Auction High Discount +2.25%) ± | | | 3.37 | | | | 7-1-2020 | | | | 20,281 | | | | 20,297 | |
FNMA (1 Year Treasury Constant Maturity +2.17%) ± | | | 3.37 | | | | 11-1-2038 | | | | 664,540 | | | | 697,367 | |
FNMA (1 Year Treasury Constant Maturity +2.21%) ± | | | 3.37 | | | | 11-1-2035 | | | | 1,390,620 | | | | 1,466,467 | |
FNMA (1 Year Treasury Constant Maturity +2.12%) ± | | | 3.38 | | | | 10-1-2035 | | | | 168,992 | | | | 176,798 | |
FNMA (1 Year Treasury Constant Maturity +2.17%) ± | | | 3.38 | | | | 9-1-2035 | | | | 203,679 | | | | 213,565 | |
FNMA (1 Year Treasury Constant Maturity +2.28%) ± | | | 3.38 | | | | 4-1-2024 | | | | 42,045 | | | | 42,279 | |
FNMA (1 Year Treasury Constant Maturity +2.23%) ± | | | 3.38 | | | | 10-1-2035 | | | | 1,012,228 | | | | 1,067,709 | |
FNMA (12 Month Treasury Average +2.24%) ± | | | 3.38 | | | | 9-1-2036 | | | | 513,993 | | | | 542,745 | |
FNMA (1 Year Treasury Constant Maturity +2.21%) ± | | | 3.39 | | | | 2-1-2034 | | | | 1,691,019 | | | | 1,766,958 | |
FNMA (12 Month LIBOR +1.58%) ± | | | 3.39 | | | | 6-1-2035 | | | | 1,861,747 | | | | 1,950,591 | |
FNMA (1 Year Treasury Constant Maturity +2.21%) ± | | | 3.40 | | | | 7-1-2038 | | | | 1,355,918 | | | | 1,420,028 | |
FNMA (12 Month LIBOR +1.61%) ± | | | 3.40 | | | | 1-1-2040 | | | | 274,475 | | | | 286,041 | |
FNMA (1 Year Treasury Constant Maturity +2.24%) ± | | | 3.40 | | | | 9-1-2022 | | | | 122,516 | | | | 123,225 | |
FNMA (12 Month LIBOR +1.65%) ± | | | 3.40 | | | | 9-1-2037 | | | | 587,773 | | | | 615,265 | |
FNMA (1 Year Treasury Constant Maturity +2.28%) ± | | | 3.40 | | | | 9-1-2026 | | | | 35,462 | | | | 36,248 | |
FNMA (1 Year Treasury Constant Maturity +2.24%) ± | | | 3.40 | | | | 2-1-2033 | | | | 146,850 | | | | 150,278 | |
FNMA (1 Year Treasury Constant Maturity +2.34%) ± | | | 3.40 | | | | 3-1-2033 | | | | 1,151,671 | | | | 1,217,779 | |
FNMA (12 Month LIBOR +1.65%) ± | | | 3.41 | | | | 9-1-2036 | | | | 715,525 | | | | 746,116 | |
FNMA (1 Year Treasury Constant Maturity +2.25%) ± | | | 3.41 | | | | 10-1-2029 | | | | 73,242 | | | | 74,627 | |
FNMA (1 Year Treasury Constant Maturity +2.09%) ± | | | 3.41 | | | | 1-1-2036 | | | | 181,722 | | | | 190,504 | |
FNMA (12 Month LIBOR +1.66%) ± | | | 3.41 | | | | 11-1-2038 | | | | 789,939 | | | | 826,438 | |
FNMA (12 Month Treasury Average +2.24%) ± | | | 3.41 | | | | 8-1-2035 | | | | 940,200 | | | | 985,354 | |
FNMA (1 Year Treasury Constant Maturity +2.20%) ± | | | 3.41 | | | | 12-1-2032 | | | | 594,358 | | | | 625,602 | |
FNMA (12 Month LIBOR +1.67%) ± | | | 3.42 | | | | 9-1-2034 | | | | 1,174,178 | | | | 1,231,192 | |
FNMA (1 Year Treasury Constant Maturity +2.17%) ± | | | 3.42 | | | | 12-1-2039 | | | | 204,376 | | | | 210,860 | |
FNMA (1 Year Treasury Constant Maturity +2.24%) ± | | | 3.42 | | | | 5-1-2035 | | | | 1,524,982 | | | | 1,608,200 | |
FNMA (1 Year Treasury Constant Maturity +2.26%) ± | | | 3.42 | | | | 12-1-2040 | | | | 2,683,021 | | | | 2,831,010 | |
FNMA (12 Month LIBOR +1.67%) ± | | | 3.42 | | | | 7-1-2035 | | | | 1,718,534 | | | | 1,803,655 | |
FNMA (6 Month LIBOR +1.93%) ± | | | 3.43 | | | | 6-1-2032 | | | | 70,868 | | | | 71,723 | |
FNMA (1 Year Treasury Constant Maturity +2.51%) ± | | | 3.43 | | | | 12-1-2021 | | | | 15,371 | | | | 15,432 | |
FNMA (12 Month LIBOR +1.67%) ± | | | 3.45 | | | | 9-1-2038 | | | | 907,555 | | | | 952,559 | |
FNMA (1 Year Treasury Constant Maturity +2.36%) ± | | | 3.45 | | | | 7-1-2028 | | | | 591,337 | | | | 611,052 | |
FNMA (1 Year Treasury Constant Maturity +2.26%) ± | | | 3.45 | | | | 1-1-2038 | | | | 724,068 | | | | 760,620 | |
FNMA (12 Month LIBOR +1.64%) ± | | | 3.46 | | | | 12-1-2033 | | | | 1,248,283 | | | | 1,307,069 | |
FNMA (12 Month Treasury Average +2.33%) ± | | | 3.47 | | | | 5-1-2036 | | | | 382,292 | | | | 404,232 | |
FNMA (12 Month LIBOR +1.74%) ± | | | 3.47 | | | | 4-1-2033 | | | | 448,954 | | | | 467,448 | |
FNMA (1 Year Treasury Constant Maturity +2.41%) ± | | | 3.47 | | | | 5-1-2027 | | | | 61,694 | | | | 63,789 | |
FNMA (1 Year Treasury Constant Maturity +2.22%) ± | | | 3.47 | | | | 10-1-2034 | | | | 438,886 | | | | 463,312 | |
FNMA (1 Year Treasury Constant Maturity +2.32%) ± | | | 3.47 | | | | 1-1-2037 | | | | 926,231 | | | | 974,193 | |
FNMA (12 Month Treasury Average +2.61%) ± | | | 3.47 | | | | 7-1-2039 | | | | 1,846,949 | | | | 1,948,228 | |
FNMA (1 Year Treasury Constant Maturity +2.22%) ± | | | 3.47 | | | | 6-1-2026 | | | | 56,578 | | | | 57,980 | |
FNMA (1 Year Treasury Constant Maturity +2.47%) ± | | | 3.48 | | | | 9-1-2035 | | | | 64,543 | | | | 68,655 | |
FNMA (1 Year Treasury Constant Maturity +2.23%) ± | | | 3.48 | | | | 7-1-2030 | | | | 528,636 | | | | 553,565 | |
FNMA (1 Year Treasury Constant Maturity +2.34%) ± | | | 3.49 | | | | 4-1-2036 | | | | 904,294 | | | | 956,779 | |
FNMA (12 Month Treasury Average +2.36%) ± | | | 3.49 | | | | 8-1-2040 | | | | 612,332 | | | | 632,140 | |
The accompanying notes are an integral part of these financial statements.
| | | | | | |
| Portfolio of investments—February 28, 2018 (unaudited) | | Wells Fargo Adjustable Rate Government Fund | | | 17 | |
| | | | | | | | | | | | | | | | |
| Security name | | Interest rate | | | Maturity date | | | Principal | | | Value | |
| | | | |
Agency Securities (continued) | | | | | | | | | | | | | | | | |
FNMA (12 Month LIBOR +1.74%) ± | | | 3.49 | % | | | 5-1-2032 | | | $ | 173,095 | | | $ | 176,837 | |
FNMA (1 Year Treasury Constant Maturity +1.63%) ± | | | 3.49 | | | | 11-1-2029 | | | | 7,815 | | | | 7,821 | |
FNMA (12 Month LIBOR +1.72%) ± | | | 3.50 | | | | 2-1-2038 | | | | 704,203 | | | | 740,245 | |
FNMA (1 Year Treasury Constant Maturity +2.37%) ± | | | 3.50 | | | | 1-1-2029 | | | | 249,810 | | | | 257,571 | |
FNMA (1 Year Treasury Constant Maturity +2.13%) ± | | | 3.50 | | | | 1-1-2027 | | | | 16,300 | | | | 16,351 | |
FNMA (1 Year Treasury Constant Maturity +2.38%) ± | | | 3.50 | | | | 7-1-2027 | | | | 99,983 | | | | 102,113 | |
FNMA (1 Year Treasury Constant Maturity +2.29%) ± | | | 3.50 | | | | 12-1-2030 | | | | 69,620 | | | | 70,994 | |
FNMA (12 Month LIBOR +1.75%) ± | | | 3.50 | | | | 4-1-2034 | | | | 473,083 | | | | 496,779 | |
FNMA (12 Month LIBOR +1.75%) ± | | | 3.50 | | | | 5-1-2035 | | | | 1,006,648 | | | | 1,059,419 | |
FNMA (1 Year Treasury Constant Maturity +2.57%) ± | | | 3.50 | | | | 5-1-2035 | | | | 1,227,240 | | | | 1,303,496 | |
FNMA (1 Year Treasury Constant Maturity +2.33%) ± | | | 3.51 | | | | 11-1-2024 | | | | 71,732 | | | | 74,210 | |
FNMA (12 Month LIBOR +1.71%) ± | | | 3.51 | | | | 4-1-2034 | | | | 695,509 | | | | 731,743 | |
FNMA (12 Month LIBOR +1.71%) ± | | | 3.51 | | | | 3-1-2037 | | | | 469,069 | | | | 492,988 | |
FNMA (1 Year Treasury Constant Maturity +2.41%) ± | | | 3.52 | | | | 9-1-2030 | | | | 298,928 | | | | 316,756 | |
FNMA (1 Year Treasury Constant Maturity +2.64%) ± | | | 3.52 | | | | 3-1-2030 | | | | 10,053 | | | | 10,276 | |
FNMA (1 Year Treasury Constant Maturity +2.31%) ± | | | 3.52 | | | | 1-1-2026 | | | | 241,834 | | | | 250,473 | |
FNMA (12 Month LIBOR +1.73%) ± | | | 3.52 | | | | 6-1-2041 | | | | 686,544 | | | | 716,066 | |
FNMA (12 Month LIBOR +1.75%) ± | | | 3.53 | | | | 7-1-2035 | | | | 638,094 | | | | 672,462 | |
FNMA (1 Year Treasury Constant Maturity +2.50%) ± | | | 3.53 | | | | 10-1-2029 | | | | 364,127 | | | | 378,343 | |
FNMA (12 Month LIBOR +1.75%) ± | | | 3.55 | | | | 1-1-2035 | | | | 729,876 | | | | 765,326 | |
FNMA (1 Year Treasury Constant Maturity +2.36%) ± | | | 3.55 | | | | 11-1-2034 | | | | 482,700 | | | | 511,772 | |
FNMA (1 Year Treasury Constant Maturity +2.18%) ± | | | 3.55 | | | | 12-1-2024 | | | | 25,726 | | | | 25,827 | |
FNMA (6 Month LIBOR +2.00%) ± | | | 3.55 | | | | 10-1-2024 | | | | 118,407 | | | | 122,399 | |
FNMA (1 Year Treasury Constant Maturity +2.31%) ± | | | 3.56 | | | | 12-1-2034 | | | | 781,474 | | | | 824,771 | |
FNMA (12 Month LIBOR +1.73%) ± | | | 3.56 | | | | 12-1-2033 | | | | 1,075,530 | | | | 1,131,879 | |
FNMA (US Treasury H15 Treasury Bill 6 Month Auction High Discount +2.23%) ± | | | 3.56 | | | | 7-1-2025 | | | | 2,308 | | | | 2,412 | |
FNMA (12 Month Treasury Average +2.81%) ± | | | 3.56 | | | | 9-1-2032 | | | | 1,442,595 | | | | 1,530,198 | |
FNMA (1 Year Treasury Constant Maturity +2.32%) ± | | | 3.57 | | | | 5-1-2025 | | | | 35,781 | | | | 35,881 | |
FNMA (12 Month LIBOR +1.76%) ± | | | 3.57 | | | | 6-1-2036 | | | | 392,371 | | | | 412,260 | |
FNMA (12 Month LIBOR +1.83%) ± | | | 3.58 | | | | 1-1-2033 | | | | 921,645 | | | | 969,905 | |
FNMA (12 Month LIBOR +1.82%) ± | | | 3.58 | | | | 4-1-2035 | | | | 1,181,487 | | | | 1,246,832 | |
FNMA (12 Month LIBOR +1.72%) ± | | | 3.58 | | | | 6-1-2035 | | | | 206,257 | | | | 217,136 | |
FNMA (12 Month LIBOR +1.80%) ± | | | 3.58 | | | | 7-1-2033 | | | | 721,709 | | | | 761,318 | |
FNMA (5 Year Treasury Constant Maturity +1.90%) ± | | | 3.59 | | | | 9-1-2031 | | | | 219,242 | | | | 223,082 | |
FNMA (1 Year Treasury Constant Maturity +2.33%) ± | | | 3.59 | | | | 9-1-2028 | | | | 89,952 | | | | 91,397 | |
FNMA (1 Year Treasury Constant Maturity +2.22%) ± | | | 3.60 | | | | 8-1-2031 | | | | 111,618 | | | | 113,373 | |
FNMA (1 Year Treasury Constant Maturity +2.20%) ± | | | 3.60 | | | | 2-1-2035 | | | | 252,099 | | | | 265,154 | |
FNMA (1 Year Treasury Constant Maturity +2.29%) ± | | | 3.60 | | | | 1-1-2031 | | | | 396,305 | | | | 416,786 | |
FNMA (12 Month Treasury Average +2.48%) ± | | | 3.61 | | | | 4-1-2036 | | | | 3,396,970 | | | | 3,617,278 | |
FNMA (Federal Cost of Funds +2.38%) ± | | | 3.62 | | | | 2-1-2029 | | | | 1,178,541 | | | | 1,217,148 | |
FNMA (1 Year Treasury Constant Maturity +2.25%) ± | | | 3.62 | | | | 6-1-2027 | | | | 879 | | | | 899 | |
FNMA (1 Year Treasury Constant Maturity +2.37%) ± | | | 3.62 | | | | 7-1-2027 | | | | 22,965 | | | | 23,042 | |
FNMA (12 Month LIBOR +1.80%) ± | | | 3.64 | | | | 5-1-2033 | | | | 614,186 | | | | 648,150 | |
FNMA (12 Month LIBOR +1.82%) ± | | | 3.64 | | | | 12-1-2046 | | | | 640,301 | | | | 676,786 | |
FNMA (1 Year Treasury Constant Maturity +2.38%) ± | | | 3.64 | | | | 8-1-2035 | | | | 687,346 | | | | 722,866 | |
FNMA (12 Month Treasury Average +2.81%) ± | | | 3.64 | | | | 4-1-2040 | | | | 1,912,098 | | | | 2,027,025 | |
FNMA (1 Year Treasury Constant Maturity +2.37%) ± | | | 3.65 | | | | 9-1-2030 | | | | 687,902 | | | | 728,350 | |
FNMA (12 Month LIBOR +1.90%) ± | | | 3.65 | | | | 10-1-2034 | | | | 519,189 | | | | 553,839 | |
FNMA (6 Month LIBOR +2.09%) ± | | | 3.66 | | | | 2-1-2033 | | | | 366,330 | | | | 384,490 | |
FNMA (1 Year Treasury Constant Maturity +2.42%) ± | | | 3.66 | | | | 9-1-2033 | | | | 551,811 | | | | 584,601 | |
The accompanying notes are an integral part of these financial statements.
| | | | |
| 18 | | Wells Fargo Adjustable Rate Government Fund | | Portfolio of investments—February 28, 2018 (unaudited) |
| | | | | | | | | | | | | | | | |
| Security name | | Interest rate | | | Maturity date | | | Principal | | | Value | |
| | | | |
Agency Securities (continued) | | | | | | | | | | | | | | | | |
FNMA (12 Month LIBOR +1.91%) ± | | | 3.66 | % | | | 8-1-2034 | | | $ | 1,777,925 | | | $ | 1,883,510 | |
FNMA (12 Month LIBOR +1.83%) ± | | | 3.67 | | | | 6-1-2041 | | | | 758,299 | | | | 791,787 | |
FNMA (1 Year Treasury Constant Maturity +2.18%) ± | | | 3.68 | | | | 1-1-2035 | | | | 89,280 | | | | 93,274 | |
FNMA (1 Year Treasury Constant Maturity +2.50%) ± | | | 3.68 | | | | 9-1-2030 | | | | 550,463 | | | | 576,442 | |
FNMA (1 Year Treasury Constant Maturity +2.32%) ± | | | 3.70 | | | | 1-1-2028 | | | | 3,318 | | | | 3,314 | |
FNMA (1 Year Treasury Constant Maturity +2.32%) ± | | | 3.70 | | | | 6-1-2032 | | | | 27,283 | | | | 27,369 | |
FNMA (6 Month LIBOR +2.43%) ± | | | 3.71 | | | | 1-1-2033 | | | | 94,222 | | | | 96,054 | |
FNMA (12 Month LIBOR +1.96%) ± | | | 3.71 | | | | 9-1-2035 | | | | 497,728 | | | | 527,758 | |
FNMA (11th District Cost of Funds +2.04%) ± | | | 3.74 | | | | 7-1-2021 | | | | 28,677 | | | | 28,741 | |
FNMA (1 Year Treasury Constant Maturity +2.87%) ± | | | 3.75 | | | | 8-1-2030 | | | | 82,577 | | | | 84,145 | |
FNMA (12 Month LIBOR +1.89%) ± | | | 3.75 | | | | 5-1-2037 | | | | 1,804,481 | | | | 1,903,347 | |
FNMA (US Treasury H15 Treasury Bill 6 Month Auction High Discount +2.38%) ± | | | 3.75 | | | | 2-1-2019 | | | | 145 | | | | 145 | |
FNMA (1 Year Treasury Constant Maturity +2.50%) ± | | | 3.75 | | | | 3-1-2027 | | | | 86,605 | | | | 89,339 | |
FNMA (1 Year Treasury Constant Maturity +2.52%) ± | | | 3.77 | | | | 11-1-2024 | | | | 63,476 | | | | 64,014 | |
FNMA (3 Year Treasury Constant Maturity +2.15%) ± | | | 3.77 | | | | 10-1-2024 | | | | 34,355 | | | | 34,524 | |
FNMA (1 Year Treasury Constant Maturity +2.28%) ± | | | 3.78 | | | | 2-1-2037 | | | | 1,351,290 | | | | 1,431,278 | |
FNMA (1 Year Treasury Constant Maturity +2.64%) ± | | | 3.78 | | | | 7-1-2028 | | | | 158,535 | | | | 163,729 | |
FNMA (6 Month LIBOR +2.25%) ± | | | 3.79 | | | | 3-1-2034 | | | | 1,086,481 | | | | 1,151,314 | |
FNMA (1 Year Treasury Constant Maturity +2.51%) ± | | | 3.80 | | | | 5-1-2035 | | | | 1,664,837 | | | | 1,770,382 | |
FNMA (1 Year Treasury Constant Maturity +2.60%) ± | | | 3.85 | | | | 10-1-2025 | | | | 8,180 | | | | 8,318 | |
FNMA (5 Year Treasury Constant Maturity +2.43%) ± | | | 3.85 | | | | 6-1-2028 | | | | 30,622 | | | | 30,831 | |
FNMA (1 Year Treasury Constant Maturity +2.58%) ± | | | 3.89 | | | | 3-1-2032 | | | | 118,815 | | | | 121,647 | |
FNMA (3 Year Treasury Constant Maturity +3.20%) ± | | | 3.95 | | | | 9-1-2023 | | | | 771 | | | | 769 | |
FNMA (1 Year Treasury Constant Maturity +2.60%) ± | | | 3.97 | | | | 2-1-2028 | | | | 37,646 | | | | 37,780 | |
FNMA (1 Year Treasury Constant Maturity +2.64%) ± | | | 3.98 | | | | 10-1-2028 | | | | 119,481 | | | | 122,561 | |
FNMA (1 Year Treasury Constant Maturity +2.50%) ± | | | 4.00 | | | | 6-1-2032 | | | | 90,795 | | | | 92,587 | |
FNMA (11th District Cost of Funds +1.86%) ± | | | 4.06 | | | | 5-1-2034 | | | | 203,501 | | | | 210,857 | |
FNMA (5 Year Treasury Constant Maturity +2.46%) ± | | | 4.06 | | | | 6-1-2019 | | | | 683 | | | | 684 | |
FNMA (3 Year Treasury Constant Maturity +2.20%) ± | | | 4.08 | | | | 5-1-2025 | | | | 55 | | | | 55 | |
FNMA (6 Month LIBOR +2.64%) ± | | | 4.10 | | | | 4-1-2033 | | | | 265,706 | | | | 279,414 | |
FNMA (6 Month LIBOR +2.48%) ± | | | 4.11 | | | | 7-1-2033 | | | | 35,540 | | | | 35,810 | |
FNMA (1 Year Treasury Constant Maturity +2.89%) ± | | | 4.14 | | | | 1-1-2031 | | | | 56,730 | | | | 57,215 | |
FNMA (6 Month LIBOR +2.65%) ± | | | 4.15 | | | | 4-1-2024 | | | | 194,641 | | | | 205,241 | |
FNMA (3 Year Treasury Constant Maturity +2.38%) ± | | | 4.25 | | | | 10-1-2021 | | | | 2,522 | | | | 2,509 | |
FNMA (11th District Cost of Funds +1.93%) ± | | | 4.26 | | | | 12-1-2036 | | | | 113,901 | | | | 120,229 | |
FNMA (6 Month LIBOR +3.11%) ± | | | 4.29 | | | | 9-1-2033 | | | | 39,310 | | | | 39,728 | |
FNMA (11th District Cost of Funds +1.83%) ± | | | 4.29 | | | | 6-1-2034 | | | | 171,986 | | | | 178,873 | |
FNMA (6 Month LIBOR +2.70%) ± | | | 4.30 | | | | 1-1-2033 | | | | 63,001 | | | | 64,027 | |
FNMA ±± | | | 4.31 | | | | 11-1-2019 | | | | 116 | | | | 111 | |
FNMA (6 Month LIBOR +2.72%) ± | | | 4.42 | | | | 5-1-2033 | | | | 1,004,759 | | | | 1,080,347 | |
FNMA (11th District Cost of Funds +1.25%) ± | | | 4.68 | | | | 1-1-2019 | | | | 34,908 | | | | 34,965 | |
FNMA (11th District Cost of Funds +1.25%) ± | | | 4.73 | | | | 2-1-2019 | | | | 39,940 | | | | 40,342 | |
FNMA (6 Month LIBOR +3.45%) ± | | | 4.95 | | | | 4-1-2032 | | | | 164,207 | | | | 162,984 | |
FNMA (11th District Cost of Funds +1.75%) ± | | | 5.00 | | | | 6-1-2028 | | | | 2,298 | | | | 2,300 | |
FNMA (11th District Cost of Funds +1.25%) ± | | | 5.01 | | | | 4-1-2018 | | | | 514 | | | | 514 | |
FNMA (6 Month LIBOR +3.47%) ± | | | 5.01 | | | | 12-1-2032 | | | | 152,120 | | | | 156,836 | |
FNMA (6 Month LIBOR +3.42%) ± | | | 5.05 | | | | 4-1-2033 | | | | 183,990 | | | | 189,332 | |
FNMA (6 Month LIBOR +3.68%) ± | | | 5.32 | | | | 11-1-2031 | | | | 95,743 | | | | 95,170 | |
FNMA (6 Month LIBOR +3.57%) ± | | | 5.32 | | | | 11-1-2031 | | | | 14,244 | | | | 14,136 | |
FNMA | | | 5.50 | | | | 9-1-2019 | | | | 252 | | | | 253 | |
The accompanying notes are an integral part of these financial statements.
| | | | | | |
| Portfolio of investments—February 28, 2018 (unaudited) | | Wells Fargo Adjustable Rate Government Fund | | | 19 | |
| | | | | | | | | | | | | | | | |
| Security name | | Interest rate | | | Maturity date | | | Principal | | | Value | |
| | | | |
Agency Securities (continued) | | | | | | | | | | | | | | | | |
FNMA (11th District Cost of Funds +1.25%) ± | | | 5.69 | % | | | 1-1-2019 | | | $ | 12,339 | | | $ | 12,412 | |
FNMA (1 Year Treasury Constant Maturity +1.75%) ± | | | 6.00 | | | | 1-1-2020 | | | | 2,825 | | | | 2,782 | |
FNMA (11th District Cost of Funds +1.90%) ± | | | 6.45 | | | | 2-1-2034 | | | | 33,504 | | | | 33,268 | |
FNMA | | | 6.50 | | | | 8-1-2028 | | | | 53,644 | | | | 55,299 | |
FNMA | | | 6.50 | | | | 5-1-2031 | | | | 139,548 | | | | 155,418 | |
FNMA | | | 7.06 | | | | 11-1-2024 | | | | 10,170 | | | | 10,198 | |
FNMA | | | 7.06 | | | | 12-1-2024 | | | | 25,360 | | | | 25,474 | |
FNMA | | | 7.06 | | | | 3-1-2025 | | | | 46,305 | | | | 47,179 | |
FNMA | | | 7.06 | | | | 3-1-2025 | | | | 4,335 | | | | 4,347 | |
FNMA | | | 7.06 | | | | 1-1-2027 | | | | 26,022 | | | | 26,064 | |
FNMA | | | 7.50 | | | | 1-1-2031 | | | | 63,692 | | | | 68,398 | |
FNMA | | | 7.50 | | | | 1-1-2033 | | | | 225,376 | | | | 246,639 | |
FNMA | | | 7.50 | | | | 5-1-2033 | | | | 176,696 | | | | 193,730 | |
FNMA | | | 7.50 | | | | 5-1-2033 | | | | 169,399 | | | | 183,451 | |
FNMA | | | 7.50 | | | | 6-1-2033 | | | | 29,085 | | | | 29,290 | |
FNMA | | | 7.50 | | | | 7-1-2033 | | | | 45,150 | | | | 46,384 | |
FNMA | | | 7.50 | | | | 8-1-2033 | | | | 96,076 | | | | 100,929 | |
FNMA | | | 8.00 | | | | 12-1-2026 | | | | 79,233 | | | | 86,490 | |
FNMA | | | 8.00 | | | | 2-1-2030 | | | | 184 | | | | 185 | |
FNMA | | | 8.00 | | | | 3-1-2030 | | | | 269 | | | | 291 | |
FNMA | | | 8.00 | | | | 7-1-2031 | | | | 27,707 | | | | 27,922 | |
FNMA | | | 8.00 | | | | 5-1-2033 | | | | 92,163 | | | | 98,680 | |
FNMA | | | 8.50 | | | | 10-1-2026 | | | | 3,411 | | | | 3,458 | |
FNMA | | | 8.50 | | | | 6-1-2030 | | | | 46,657 | | | | 48,228 | |
FNMA | | | 8.51 | | | | 8-15-2024 | | | | 42,472 | | | | 44,873 | |
FNMA | | | 10.00 | | | | 1-20-2021 | | | | 5,155 | | | | 5,223 | |
FNMA Series 1989-74 Class J | | | 9.80 | | | | 10-25-2019 | | | | 4,731 | | | | 4,924 | |
FNMA Series 1989-96 Class H | | | 9.00 | | | | 12-25-2019 | | | | 1,793 | | | | 1,859 | |
FNMA Series 1992-39 Class FA (7-Year Treasury Constant Maturity +0.00%) ± | | | 2.53 | | | | 3-25-2022 | | | | 98,188 | | | | 98,123 | |
FNMA Series 1992-45 Class F (7-Year Treasury Constant Maturity +0.00%) ± | | | 2.80 | | | | 4-25-2022 | | | | 16,734 | | �� | | 16,571 | |
FNMA Series 1992-87 Class Z | | | 8.00 | | | | 5-25-2022 | | | | 9,621 | | | | 10,332 | |
FNMA Series 1993-113 Class FA (10 Year Treasury Constant Maturity -0.65%) ± | | | 2.22 | | | | 7-25-2023 | | | | 64,882 | | | | 64,761 | |
FNMA Series 1993-247 Class FM (11th District Cost of Funds +1.20%) ± | | | 1.95 | | | | 12-25-2023 | | | | 295,496 | | | | 301,540 | |
FNMA Series 1994-14 Class F (11th District Cost of Funds +1.60%) ± | | | 2.35 | | | | 10-25-2023 | | | | 174,646 | | | | 179,952 | |
FNMA Series 2001-50 Class BA | | | 7.00 | | | | 10-25-2041 | | | | 154,573 | | | | 172,329 | |
FNMA Series 2001-63 Class FD (1 Month LIBOR +0.60%) ± | | | 2.19 | | | | 12-18-2031 | | | | 156,195 | | | | 158,570 | |
FNMA Series 2001-81 Class F (1 Month LIBOR +0.55%) ± | | | 2.17 | | | | 1-25-2032 | | | | 62,222 | | | | 63,262 | |
FNMA Series 2001-T08 Class A1 | | | 7.50 | | | | 7-25-2041 | | | | 135,957 | | | | 154,351 | |
FNMA Series 2001-T10 Class A2 | | | 7.50 | | | | 12-25-2041 | | | | 2,529,085 | | | | 2,883,550 | |
FNMA Series 2001-T12 Class A2 | | | 7.50 | | | | 8-25-2041 | | | | 192,272 | | | | 220,195 | |
FNMA Series 2001-T12 Class A4 ±± | | | 3.96 | | | | 8-25-2041 | | | | 4,411,079 | | | | 4,582,026 | |
FNMA Series 2001-W01 Class AV1 (1 Month LIBOR +0.24%) ± | | | 1.86 | | | | 8-25-2031 | | | | 66,231 | | | | 64,519 | |
FNMA Series 2001-W03 Class A ±± | | | 7.00 | | | | 9-25-2041 | | | | 543,261 | | | | 575,829 | |
FNMA Series 2002-05 Class FD (1 Month LIBOR +0.90%) ± | | | 2.52 | | | | 2-25-2032 | | | | 131,978 | | | | 135,120 | |
FNMA Series 2002-33 Class A4 ±± | | | 5.13 | | | | 11-25-2030 | | | | 136,730 | | | | 142,490 | |
FNMA Series 2002-59 Class F (1 Month LIBOR +0.40%) ± | | | 2.02 | | | | 9-25-2032 | | | | 426,152 | | | | 426,479 | |
FNMA Series 2002-66 Class A3 ±± | | | 3.83 | | | | 4-25-2042 | | | | 8,101,674 | | | | 8,441,902 | |
FNMA Series 2002-T12 Class A3 | | | 7.50 | | | | 5-25-2042 | | | | 1,347,773 | | | | 1,565,758 | |
FNMA Series 2002-T12 Class A5 ±± | | | 4.36 | | | | 10-25-2041 | | | | 1,818,150 | | | | 1,874,322 | |
FNMA Series 2002-T18 Class A5 ±± | | | 4.19 | | | | 5-25-2042 | | | | 3,405,583 | | | | 3,520,279 | |
The accompanying notes are an integral part of these financial statements.
| | | | |
| 20 | | Wells Fargo Adjustable Rate Government Fund | | Portfolio of investments—February 28, 2018 (unaudited) |
| | | | | | | | | | | | | | | | |
| Security name | | Interest rate | | | Maturity date | | | Principal | | | Value | |
| | | | |
Agency Securities (continued) | | | | | | | | | | | | | | | | |
FNMA Series 2002-T19 Class A4 ±± | | | 4.09 | % | | | 3-25-2042 | | | $ | 199,791 | | | $ | 210,519 | |
FNMA Series 2002-W01 Class 3A ±± | | | 3.74 | | | | 4-25-2042 | | | | 1,111,049 | | | | 1,121,667 | |
FNMA Series 2002-W04 Class A6 ±± | | | 3.99 | | | | 5-25-2042 | | | | 1,851,815 | | | | 1,907,207 | |
FNMA Series 2003-07 Class A2 ±± | | | 3.37 | | | | 5-25-2042 | | | | 817,189 | | | | 828,794 | |
FNMA Series 2003-17 Class FN (1 Month LIBOR +0.30%) ± | | | 1.92 | | | | 3-25-2018 | | | | 29 | | | | 29 | |
FNMA Series 2003-63 Class A8 ±± | | | 3.68 | | | | 1-25-2043 | | | | 1,343,054 | | | | 1,388,894 | |
FNMA Series 2003-W02 Class 1A3 | | | 7.50 | | | | 7-25-2042 | | | | 397,322 | | | | 460,114 | |
FNMA Series 2003-W04 Class 5A ±± | | | 3.64 | | | | 10-25-2042 | | | | 1,063,063 | | | | 1,075,080 | |
FNMA Series 2003-W08 Class 4A ±± | | | 3.87 | | | | 11-25-2042 | | | | 1,380,028 | | | | 1,425,923 | |
FNMA Series 2003-W09 Class A (1 Month LIBOR +0.12%) ± | | | 1.74 | | | | 6-25-2033 | | | | 1,965,087 | | | | 1,928,327 | |
FNMA Series 2003-W10 Class 2A ±± | | | 3.62 | | | | 6-25-2043 | | | | 2,707,667 | | | | 2,724,497 | |
FNMA Series 2003-W18 Class 2A ±± | | | 3.72 | | | | 6-25-2043 | | | | 8,360,662 | | | | 8,499,402 | |
FNMA Series 2004-31 Class FG (1 Month LIBOR +0.40%) ± | | | 2.02 | | | | 8-25-2033 | | | | 82,564 | | | | 82,634 | |
FNMA Series 2004-38 Class FT (1 Month LIBOR +0.43%) ± | | | 2.05 | | | | 10-25-2033 | | | | 63,130 | | | | 63,250 | |
FNMA Series 2004-T03 Class 1A3 | | | 7.00 | | | | 2-25-2044 | | | | 499,925 | | | | 566,945 | |
FNMA Series 2004-T03 Class 2A ±± | | | 3.65 | | | | 8-25-2043 | | | | 1,533,687 | | | | 1,615,835 | |
FNMA Series 2004-W01 Class 2A2 | | | 7.00 | | | | 12-25-2033 | | | | 273,399 | | | | 310,028 | |
FNMA Series 2004-W01 Class 3A ±± | | | 3.80 | | | | 1-25-2043 | | | | 79,348 | | | | 80,799 | |
FNMA Series 2004-W02 Class 5A | | | 7.50 | | | | 3-25-2044 | | | | 127,246 | | | | 141,164 | |
FNMA Series 2004-W12 Class 2A ±± | | | 3.78 | | | | 6-25-2044 | | | | 4,709,531 | | | | 4,887,018 | |
FNMA Series 2004-W15 Class 3A ±± | | | 3.61 | | | | 6-25-2044 | | | | 6,330,508 | | | | 6,445,217 | |
FNMA Series 2005-57 Class EG (1 Month LIBOR +0.30%) ± | | | 1.92 | | | | 3-25-2035 | | | | 62,027 | | | | 62,046 | |
FNMA Series 2005-W03 Class 3A ±± | | | 3.46 | | | | 4-25-2045 | | | | 1,249,105 | | | | 1,263,682 | |
FNMA Series 2006-15 Class FW (1 Month LIBOR +0.30%) ± | | | 1.92 | | | | 1-25-2036 | | | | 154,893 | | | | 155,475 | |
FNMA Series 2006-W01 Class 3A ±± | | | 3.26 | | | | 10-25-2045 | | | | 5,315,041 | | | | 5,541,300 | |
FNMA Series 2007-95 Class A2 (1 Month LIBOR +0.25%) ± | | | 1.87 | | | | 8-27-2036 | | | | 436,029 | | | | 434,392 | |
FNMA Series 2012-47 Class FW ±± | | | 3.32 | | | | 5-25-2027 | | | | 491,947 | | | | 511,727 | |
FNMA Series G92-20 Class FB (7-Year Treasury Constant Maturity +0.00%) ± | | | 2.80 | | | | 4-25-2022 | | | | 11,572 | | | | 11,535 | |
FNMA Series G93-1 Class K | | | 6.68 | | | | 1-25-2023 | | | | 276,069 | | | | 291,481 | |
FNMA Series G93-19 Class FD (10 Year Treasury Constant Maturity -0.65%) ± | | | 2.22 | | | | 4-25-2023 | | | | 179,331 | | | | 179,307 | |
GNMA | | | 6.45 | | | | 4-20-2025 | | | | 37,099 | | | | 41,764 | |
GNMA | | | 6.45 | | | | 9-20-2025 | | | | 37,129 | | | | 43,247 | |
GNMA | | | 6.50 | | | | 6-20-2034 | | | | 75,096 | | | | 76,567 | |
GNMA | | | 6.50 | | | | 8-20-2034 | | | | 504,151 | | | | 545,214 | |
GNMA | | | 6.50 | | | | 8-20-2034 | | | | 104,431 | | | | 107,622 | |
GNMA | | | 6.75 | | | | 2-15-2029 | | | | 78,606 | | | | 87,460 | |
GNMA | | | 7.00 | | | | 7-20-2034 | | | | 54,669 | | | | 55,565 | |
GNMA | | | 9.00 | | | | 3-15-2020 | | | | 809 | | | | 812 | |
GNMA | | | 9.00 | | | | 8-15-2021 | | | | 155 | | | | 155 | |
GNMA | | | 9.00 | | | | 8-20-2024 | | | | 112 | | | | 114 | |
GNMA | | | 9.00 | | | | 9-20-2024 | | | | 988 | | | | 1,015 | |
GNMA | | | 9.00 | | | | 11-20-2024 | | | | 134 | | | | 135 | |
GNMA | | | 9.00 | | | | 1-20-2025 | | | | 5,418 | | | | 5,961 | |
GNMA | | | 9.00 | | | | 2-20-2025 | | | | 16,862 | | | | 18,421 | |
GNMA Series 2011-H12 Class FA (1 Month LIBOR +0.49%) ± | | | 2.05 | | | | 2-20-2061 | | | | 2,741,095 | | | | 2,745,113 | |
GNMA Series 2011-H17 Class FA (1 Month LIBOR +0.53%) ± | | | 2.09 | | | | 6-20-2061 | | | | 1,137,451 | | | | 1,140,471 | |
GNMA Series 2017-H11 Class FE (12 Month LIBOR +0.18%) ± | | | 1.95 | | | | 5-20-2067 | | | | 4,979,253 | | | | 4,964,012 | |
| |
Total Agency Securities (Cost $425,550,516) | | | | 430,781,901 | |
| | | | | | | | | | | | | | | | |
The accompanying notes are an integral part of these financial statements.
| | | | | | |
| Portfolio of investments—February 28, 2018 (unaudited) | | Wells Fargo Adjustable Rate Government Fund | | | 21 | |
| | | | | | | | | | | | | | | | |
| Security name | | Yield | | | | | | Shares | | | Value | |
| | | | |
Short-Term Investments: 1.97% | | | | | | | | | | | | | | | | |
| | | | |
| Investment Companies: 1.97% | | | | | | | | | | | | | | | | |
Wells Fargo Government Money Market Fund Select Class (l)(u) | | | 1.29 | % | | | | | | | 8,712,877 | | | $ | 8,712,877 | |
| | | | | | | | | | | | | | | | |
| |
Total Short-Term Investments (Cost $8,712,877) | | | | 8,712,877 | |
| | | | | | | | | | | | | | | | |
| | | | | | | | |
| Total investments in securities (Cost $434,263,393) | | | 99.30 | % | | | 439,494,778 | |
Other assets and liabilities, net | | | 0.70 | | | | 3,086,358 | |
| | | | | | | | |
| Total net assets | | | 100.00 | % | | $ | 442,581,136 | |
| | | | | | | | |
| 144A | The security may be resold in transactions exempt from registration, normally to qualified institutional buyers, pursuant to Rule 144A under the Securities Act of 1933. |
| ± | Variable rate investment. The rate shown is the rate in effect at period end. |
| ±± | The coupon of the security is adjusted based on the principal and interest payments received from the underlying pool of mortgages as well as the credit quality and the actual prepayment speed of the underlying mortgages. |
| (c) | Investment in an interest-only security entitles holders to receive only the interest payments on the underlying mortgages. The prinicipal amount shown is the notional amount of the underlying mortgages. The rate represents the coupon rate. |
| (l) | The issuer of the security is an affiliated person of the Fund as defined in the Investment Company Act of 1940. |
| (u) | The rate represents the 7-day annualized yield at period end. |
Investments in Affiliates
An affiliated investment is an investment in which the Fund owns at least 5% of the outstanding voting shares of the issuer or as a result of other relationships, such as the Fund and the issuer having the same investment manager. Transactions with issuers that were either affiliated persons of the Fund at the beginning of the period or the end of the period were as follows:
| | | | | | | | | | | | | | | | | | | | | | | | | | | | | | | | | | | | |
| | | Shares, beginning of period | | | Shares purchased | | | Shares sold | | | Shares, end of period | | | Net realized gains (losses) | | | Net change in unrealized gains (losses) | | | Income from affiliated securities | | | Value, end of period | | | % of net assets | |
Short-Term Investments | | | | | | | | | | | | | | | | | | | | | | | | | | | | | | | | | | | | |
Investment Companies | | | | | | | | | | | | | | | | | | | | | | | | | | | | | | | | | | | | |
Wells Fargo Government Money Market Fund Select Class | | | 8,353,190 | | | | 112,311,275 | | | | 111,951,588 | | | | 8,712,877 | | | $ | 0 | | | $ | 0 | | | $ | 42,199 | | | $ | 8,712,877 | | | | 1.97 | % |
The accompanying notes are an integral part of these financial statements.
| | | | |
| 22 | | Wells Fargo Adjustable Rate Government Fund | | Statement of assets and liabilities—February 28, 2018 (unaudited) |
| | | | |
| | | | |
| |
Assets | | | | |
Investments in unaffiliated securities, at value (cost $425,550,516) | | $ | 430,781,901 | |
Investments in affiliated securities, at value (cost $8,712,877) | | | 8,712,877 | |
Principal paydown receivable | | | 2,315,519 | |
Receivable for Fund shares sold | | | 90,716 | |
Receivable for interest | | | 1,427,114 | |
Prepaid expenses and other assets | | | 140,250 | |
| | | | |
Total assets | | | 443,468,377 | |
| | | | |
| |
Liabilities | | | | |
Payable for Fund shares redeemed | | | 326,795 | |
Dividends payable | | | 200,169 | |
Management fee payable | | | 97,570 | |
Custodian and accounting fees payable | | | 75,264 | |
Administration fees payable | | | 38,893 | |
Distribution fee payable | | | 30,624 | |
Trustees’ fees and expenses payable | | | 1,805 | |
Accrued expenses and other liabilities | | | 116,121 | |
| | | | |
Total liabilities | | | 887,241 | |
| | | | |
Total net assets | | $ | 442,581,136 | |
| | | | |
| |
NET ASSETS CONSIST OF | | | | |
Paid-in capital | | $ | 439,236,550 | |
Overdistributed net investment income | | | (100,005 | ) |
Accumulated net realized losses on investments | | | (1,786,794 | ) |
Net unrealized gains on investments | | | 5,231,385 | |
| | | | |
Total net assets | | $ | 442,581,136 | |
| | | | |
| |
COMPUTATION OF NET ASSET VALUE AND OFFERING PRICE PER SHARE | | | | |
Net assets – Class A | | $ | 129,371,170 | |
Shares outstanding – Class A1 | | | 14,463,228 | |
Net asset value per share – Class A | | | $8.94 | |
Maximum offering price per share – Class A2 | | | $9.12 | |
Net assets – Class C | | $ | 52,685,252 | |
Shares outstanding – Class C1 | | | 5,890,445 | |
Net asset value per share – Class C | | | $8.94 | |
Net assets – Administrator Class | | $ | 13,580,226 | |
Shares outstanding – Administrator Class1 | | | 1,518,140 | |
Net asset value per share – Administrator Class | | | $8.95 | |
Net assets – Institutional Class | | $ | 246,944,488 | |
Shares outstanding – Institutional Class1 | | | 27,606,396 | |
Net asset value per share – Institutional Class | | | $8.95 | |
| 1 | The Fund has an unlimited number of authorized shares. |
| 2 | Maximum offering price is computed as 100/98 of net asset value. On investments of $50,000 or more, the offering price is reduced. |
The accompanying notes are an integral part of these financial statements.
| | | | | | |
| Statement of operations—six months ended February 28, 2018 (unaudited) | | Wells Fargo Adjustable Rate Government Fund | | | 23 | |
| | | | |
| | | | |
| |
Investment income | | | | |
Interest | | $ | 4,762,996 | |
Income from affiliated securities | | | 42,199 | |
| | | | |
Total investment income | | | 4,805,195 | |
| | | | |
| |
Expenses | | | | |
Management fee | | | 888,594 | |
Administration fees | | | | |
Class A | | | 110,112 | |
Class C | | | 45,139 | |
Administrator Class | | | 7,608 | |
Institutional Class | | | 119,395 | |
Shareholder servicing fees | | | | |
Class A | | | 172,050 | |
Class C | | | 70,530 | |
Administrator Class | | | 18,812 | |
Distribution fee | | | | |
Class C | | | 211,589 | |
Custody and accounting fees | | | 38,526 | |
Professional fees | | | 32,857 | |
Registration fees | | | 48,740 | |
Shareholder report expenses | | | 15,582 | |
Trustees’ fees and expenses | | | 14,987 | |
Other fees and expenses | | | 5,960 | |
| | | | |
Total expenses | | | 1,800,481 | |
Less: Fee waivers and/or expense reimbursements | | | (138,685 | ) |
| | | | |
Net expenses | | | 1,661,796 | |
| | | | |
Net investment income | | | 3,143,399 | |
| | | | |
| |
REALIZED AND UNREALIZED GAINS (LOSSES) ON INVESTMENTS | | | | |
Net realized gains on investments | | | 515,562 | |
Net change in unrealized gains (losses) on investments | | | (1,339,527 | ) |
| | | | |
Net realized and unrealized gains (losses) on investments | | | (823,965 | ) |
| | | | |
Net increase in net assets resulting from operations | | $ | 2,319,434 | |
| | | | |
The accompanying notes are an integral part of these financial statements.
| | | | |
| 24 | | Wells Fargo Adjustable Rate Government Fund | | Statement of changes in net assets |
| | | | | | | | | | | | | | | | |
| | | Six months ended February 28, 2018 (unaudited) | | | Year ended August 31, 2017 | |
| | | | |
Operations | | | | | | | | | | | | | | | | |
Net investment income | | | | | | $ | 3,143,399 | | | | | | | $ | 6,832,710 | |
Net realized gains on investments | | | | | | | 515,562 | | | | | | | | 1,558,231 | |
Net change in unrealized gains (losses) on investments | | | | | | | (1,339,527 | ) | | | | | | | (5,258,425 | ) |
| | | | |
Net increase in net assets resulting from operations | | | | | | | 2,319,434 | | | | | | | | 3,132,516 | |
| | | | |
| | | | |
Distributions to shareholders from | | | | | | | | | | | | | | | | |
Net investment income | | | | | | | | | | | | | | | | |
Class A | | | | | | | (786,900 | ) | | | | | | | (1,238,794 | ) |
Class B | | | | | | | N/A | | | | | | | | (5 | )1 |
Class C | | | | | | | (110,896 | ) | | | | | | | (27,529 | ) |
Administrator Class | | | | | | | (97,621 | ) | | | | | | | (324,646 | ) |
Institutional Class | | | | | | | (2,055,740 | ) | | | | | | | (5,899,360 | ) |
| | | | |
Total distributions to shareholders | | | | | | | (3,051,157 | ) | | | | | | | (7,490,334 | ) |
| | | | |
| | | | |
Capital share transactions | | | Shares | | | | | | | | Shares | | | | | |
Proceeds from shares sold | | | | | | | | | | | | | | | | |
Class A | | | 300,775 | | | | 2,696,840 | | | | 3,084,824 | | | | 27,722,527 | |
Class C | | | 82,980 | | | | 744,110 | | | | 174,032 | | | | 1,564,611 | |
Administrator Class | | | 104,450 | | | | 936,516 | | | | 1,084,425 | | | | 9,765,946 | |
Institutional Class | | | 3,789,497 | | | | 33,991,595 | | | | 17,873,034 | | | | 160,859,388 | |
| | | | |
| | | | | | | 38,369,061 | | | | | | | | 199,912,472 | |
| | | | |
Reinvestment of distributions | | | | | | | | | | | | | | | | |
Class A | | | 63,257 | | | | 566,693 | | | | 111,286 | | | | 1,000,787 | |
Class B | | | N/A | | | | N/A | | | | 1 | 1 | | | 5 | 1 |
Class C | | | 11,961 | | | | 107,026 | | | | 2,348 | | | | 21,130 | |
Administrator Class | | | 10,720 | | | | 96,071 | | | | 33,857 | | | | 304,570 | |
Institutional Class | | | 174,509 | | | | 1,564,162 | | | | 499,163 | | | | 4,490,201 | |
| | | | |
| | | | | | | 2,333,952 | | | | | | | | 5,816,693 | |
| | | | |
Payment for shares redeemed | | | | | | | | | | | | | | | | |
Class A | | | (3,080,508 | ) | | | (27,614,567 | ) | | | (5,118,157 | ) | | | (46,046,224 | ) |
Class B | | | N/A | | | | N/A | | | | (7,783 | )1 | | | (70,136 | )1 |
Class C | | | (985,592 | ) | | | (8,836,498 | ) | | | (4,209,467 | ) | | | (37,840,666 | ) |
Administrator Class | | | (695,407 | ) | | | (6,234,003 | ) | | | (5,862,305 | ) | | | (52,736,098 | ) |
Institutional Class | | | (20,713,357 | ) | | | (185,757,739 | ) | | | (51,978,754 | ) | | | (467,553,596 | ) |
| | | | |
| | | | | | | (228,442,807 | ) | | | | | | | (604,246,720 | ) |
| | | | |
Net decrease in net assets resulting from capital share transactions | | | | | | | (187,739,794 | ) | | | | | | | (398,517,555 | ) |
| | | | |
Total decrease in net assets | | | | | | | (188,471,517 | ) | | | | | | | (402,875,373 | ) |
| | | | |
| | | | |
Net assets | | | | | | | | | | | | | | | | |
Beginning of period | | | | | | | 631,052,653 | | | | | | | | 1,033,928,026 | |
| | | | |
End of period | | | | | | $ | 442,581,136 | | | | | | | $ | 631,052,653 | |
| | | | |
Overdistributed net investment income | | | | | | $ | (100,005 | ) | | | | | | $ | (192,247 | ) |
| | | | |
| 1 | For the period from September 1, 2016 to December 5, 2016. Effective at the close of business on December 5, 2016, Class B shares were converted to Class A shares and are no longer offered by the Fund. |
The accompanying notes are an integral part of these financial statements.
| | | | | | |
| Financial highlights | | Wells Fargo Adjustable Rate Government Fund | | | 25 | |
(For a share outstanding throughout each period)
| | | | | | | | | | | | | | | | | | | | | | | | |
| | | Six months ended February 28, 2018 (unaudited) | | | Year ended August 31 | |
| CLASS A | | | 2017 | | | 2016 | | | 2015 | | | 2014 | | | 2013 | |
Net asset value, beginning of period | | | $8.96 | | | | $9.01 | | | | $9.10 | | | | $9.15 | | | | $9.14 | | | | $9.19 | |
Net investment income | | | 0.05 | | | | 0.06 | | | | 0.04 | | | | 0.05 | | | | 0.06 | | | | 0.06 | |
Net realized and unrealized gains (losses) on investments | | | (0.02 | ) | | | (0.04 | ) | | | (0.06 | ) | | | (0.03 | ) | | | 0.02 | | | | (0.04 | ) |
| | | | | | | | | | | | | | | | | | | | | | | | |
Total from investment operations | | | 0.03 | | | | 0.02 | | | | (0.02 | ) | | | 0.02 | | | | 0.08 | | | | 0.02 | |
Distributions to shareholders from | | | | | | | | | | | | | | | | | | | | | | | | |
Net investment income | | | (0.05 | ) | | | (0.07 | ) | | | (0.05 | ) | | | (0.05 | ) | | | (0.06 | ) | | | (0.07 | ) |
Tax basis return of capital | | | 0.00 | | | | 0.00 | | | | (0.02 | ) | | | (0.02 | ) | | | (0.01 | ) | | | (0.00 | )1 |
| | | | | | | | | | | | | | | | | | | | | | | | |
Total distributions to shareholders | | | (0.05 | ) | | | (0.07 | ) | | | (0.07 | ) | | | (0.07 | ) | | | (0.07 | ) | | | (0.07 | ) |
Net asset value, end of period | | | $8.94 | | | | $8.96 | | | | $9.01 | | | | $9.10 | | | | $9.15 | | | | $9.14 | |
Total return2 | | | 0.35 | % | | | 0.23 | % | | | (0.19 | )% | | | 0.24 | % | | | 0.90 | % | | | 0.23 | % |
Ratios to average net assets (annualized) | | | | | | | | | | | | | | | | | | | | | | | | |
Gross expenses | | | 0.82 | % | | | 0.80 | % | | | 0.78 | % | | | 0.79 | % | | | 0.80 | % | | | 0.84 | % |
Net expenses | | | 0.74 | % | | | 0.74 | % | | | 0.74 | % | | | 0.74 | % | | | 0.74 | % | | | 0.74 | % |
Net investment income | | | 1.17 | % | | | 0.72 | % | | | 0.56 | % | | | 0.58 | % | | | 0.64 | % | | | 0.71 | % |
Supplemental data | | | | | | | | | | | | | | | | | | | | | | | | |
Portfolio turnover rate | | | 0 | % | | | 2 | % | | | 13 | % | | | 10 | % | | | 18 | % | | | 10 | % |
Net assets, end of period (000s omitted) | | | $129,371 | | | | $153,953 | | | | $172,131 | | | | $215,830 | | | | $251,686 | | | | $281,028 | |
| 1 | Amount is less than $0.005. |
| 2 | Total return calculations do not include any sales charges. Returns for periods of less than one year are not annualized. |
The accompanying notes are an integral part of these financial statements.
| | | | |
| 26 | | Wells Fargo Adjustable Rate Government Fund | | Financial highlights |
(For a share outstanding throughout each period)
| | | | | | | | | | | | | | | | | | | | | | | | |
| | | Six months ended February 28, 2018 (unaudited) | | | Year ended August 31 | |
| CLASS C | | | 2017 | | | 2016 | | | 2015 | | | 2014 | | | 2013 | |
Net asset value, beginning of period | | | $8.96 | | | | $9.01 | | | | $9.10 | | | | $9.15 | | | | $9.14 | | | | $9.19 | |
Net investment income (loss) | | | 0.02 | 1 | | | (0.00 | )1,2 | | | (0.02 | )1 | | | (0.01 | )1 | | | (0.01 | )1 | | | (0.00 | )1,2 |
Net realized and unrealized gains (losses) on investments | | | (0.02 | ) | | | (0.05 | ) | | | (0.07 | ) | | | (0.04 | ) | | | 0.02 | | | | (0.05 | ) |
| | | | | | | | | | | | | | | | | | | | | | | | |
Total from investment operations | | | 0.00 | | | | (0.05 | ) | | | (0.09 | ) | | | (0.05 | ) | | | 0.01 | | | | (0.05 | ) |
Distributions to shareholders from | | | | | | | | | | | | | | | | | | | | | | | | |
Net investment income | | | (0.02 | ) | | | (0.00 | )2 | | | (0.00 | )2 | | | (0.00 | )2 | | | (0.00 | )2 | | | (0.00 | )2 |
Tax basis return of capital | | | 0.00 | | | | 0.00 | | | | (0.00 | )2 | | | (0.00 | )2 | | | (0.00 | )2 | | | (0.00 | )2 |
| | | | | | | | | | | | | | | | | | | | | | | | |
Total distributions to shareholders | | | (0.02 | ) | | | (0.00 | )2 | | | (0.00 | )2 | | | (0.00 | )2 | | | (0.00 | )2 | | | (0.00 | )2 |
Net asset value, end of period | | | $8.94 | | | | $8.96 | | | | $9.01 | | | | $9.10 | | | | $9.15 | | | | $9.14 | |
Total return3 | | | (0.02 | )% | | | (0.52 | )% | | | (0.94 | )% | | | (0.51 | )% | | | 0.15 | % | | | (0.52 | )% |
Ratios to average net assets (annualized) | | | | | | | | | | | | | | | | | | | | | | | | |
Gross expenses | | | 1.57 | % | | | 1.55 | % | | | 1.53 | % | | | 1.54 | % | | | 1.55 | % | | | 1.59 | % |
Net expenses | | | 1.49 | % | | | 1.49 | % | | | 1.49 | % | | | 1.49 | % | | | 1.49 | % | | | 1.49 | % |
Net investment income (loss) | | | 0.42 | % | | | (0.04 | )% | | | (0.19 | )% | | | (0.16 | )% | | | (0.11 | )% | | | (0.04 | )% |
Supplemental data | | | | | | | | | | | | | | | | | | | | | | | | |
Portfolio turnover rate | | | 0 | % | | | 2 | % | | | 13 | % | | | 10 | % | | | 18 | % | | | 10 | % |
Net assets, end of period (000s omitted) | | | $52,685 | | | | $60,766 | | | | $97,452 | | | | $121,117 | | | | $148,523 | | | | $190,110 | |
| 1 | Calculated based upon average shares outstanding |
| 2 | Amount is less than $0.005. |
| 3 | Total return calculations do not include any sales charges. Returns for periods of less than one year are not annualized. |
The accompanying notes are an integral part of these financial statements.
| | | | | | |
| Financial highlights | | Wells Fargo Adjustable Rate Government Fund | | | 27 | |
(For a share outstanding throughout each period)
| | | | | | | | | | | | | | | | | | | | | | | | |
| | | Six months ended February 28, 2018 (unaudited) | | | Year ended August 31 | |
| ADMINISTRATOR CLASS | | | 2017 | | | 2016 | | | 2015 | | | 2014 | | | 2013 | |
Net asset value, beginning of period | | | $8.96 | | | | $9.01 | | | | $9.10 | | | | $9.15 | | | | $9.14 | | | | $9.19 | |
Net investment income | | | 0.06 | 1 | | | 0.07 | 1 | | | 0.06 | | | | 0.06 | | | | 0.07 | | | | 0.08 | |
Net realized and unrealized gains (losses) on investments | | | (0.01 | ) | | | (0.04 | ) | | | (0.06 | ) | | | (0.03 | ) | | | 0.03 | | | | (0.05 | ) |
| | | | | | | | | | | | | | | | | | | | | | | | |
Total from investment operations | | | 0.05 | | | | 0.03 | | | | 0.00 | | | | 0.03 | | | | 0.10 | | | | 0.03 | |
Distributions to shareholders from | | | | | | | | | | | | | | | | | | | | | | | | |
Net investment income | | | (0.06 | ) | | | (0.08 | ) | | | (0.07 | ) | | | (0.06 | ) | | | (0.07 | ) | | | (0.08 | ) |
Tax basis return of capital | | | 0.00 | | | | 0.00 | | | | (0.02 | ) | | | (0.02 | ) | | | (0.02 | ) | | | (0.00 | )2 |
| | | | | | | | | | | | | | | | | | | | | | | | |
Total distributions to shareholders | | | (0.06 | ) | | | (0.08 | ) | | | (0.09 | ) | | | (0.08 | ) | | | (0.09 | ) | | | (0.08 | ) |
Net asset value, end of period | | | $8.95 | | | | $8.96 | �� | | | $9.01 | | | | $9.10 | | | | $9.15 | | | | $9.14 | |
Total return3 | | | 0.54 | % | | | 0.37 | % | | | (0.05 | )% | | | 0.38 | % | | | 1.05 | % | | | 0.37 | % |
Ratios to average net assets (annualized) | | | | | | | | | | | | | | | | | | | | | | | | |
Gross expenses | | | 0.76 | % | | | 0.74 | % | | | 0.72 | % | | | 0.72 | % | | | 0.73 | % | | | 0.77 | % |
Net expenses | | | 0.60 | % | | | 0.60 | % | | | 0.60 | % | | | 0.60 | % | | | 0.60 | % | | | 0.60 | % |
Net investment income | | | 1.31 | % | | | 0.82 | % | | | 0.71 | % | | | 0.72 | % | | | 0.78 | % | | | 0.85 | % |
Supplemental data | | | | | | | | | | | | | | | | | | | | | | | | |
Portfolio turnover rate | | | 0 | % | | | 2 | % | | | 13 | % | | | 10 | % | | | 18 | % | | | 10 | % |
Net assets, end of period (000s omitted) | | | $13,580 | | | | $18,805 | | | | $61,658 | | | | $66,037 | | | | $124,345 | | | | $102,284 | |
| 1 | Calculated based upon average shares outstanding |
| 2 | Amount is less than $0.005. |
| 3 | Returns for periods of less than one year are not annualized. |
The accompanying notes are an integral part of these financial statements.
| | | | |
| 28 | | Wells Fargo Adjustable Rate Government Fund | | Financial highlights |
(For a share outstanding throughout each period)
| | | | | | | | | | | | | | | | | | | | | | | | |
| | | Six months ended February 28, 2018 (unaudited) | | | Year ended August 31 | |
| INSTITUTIONAL CLASS | | | 2017 | | | 2016 | | | 2015 | | | 2014 | | | 2013 | |
Net asset value, beginning of period | | | $8.96 | | | | $9.01 | | | | $9.10 | | | | $9.15 | | | | $9.14 | | | | $9.19 | |
Net investment income | | | 0.08 | | | | 0.09 | | | | 0.08 | | | | 0.08 | | | | 0.08 | | | | 0.09 | 1 |
Net realized and unrealized gains (losses) on investments | | | (0.03 | ) | | | (0.04 | ) | | | (0.07 | ) | | | (0.03 | ) | | | 0.03 | | | | (0.04 | ) |
| | | | | | | | | | | | | | | | | | | | | | | | |
Total from investment operations | | | 0.05 | | | | 0.05 | | | | 0.01 | | | | 0.05 | | | | 0.11 | | | | 0.05 | |
Distributions to shareholders from | | | | | | | | | | | | | | | | | | | | | | | | |
Net investment income | | | (0.06 | ) | | | (0.10 | ) | | | (0.07 | ) | | | (0.08 | ) | | | (0.08 | ) | | | (0.10 | ) |
Tax basis return of capital | | | 0.00 | | | | 0.00 | | | | (0.03 | ) | | | (0.02 | ) | | | (0.02 | ) | | | (0.00 | )2 |
| | | | | | | | | | | | | | | | | | | | | | | | |
Total distributions to shareholders | | | (0.06 | ) | | | (0.10 | ) | | | (0.10 | ) | | | (0.10 | ) | | | (0.10 | ) | | | (0.10 | ) |
Net asset value, end of period | | | $8.95 | | | | $8.96 | | | | $9.01 | | | | $9.10 | | | | $9.15 | | | | $9.14 | |
Total return3 | | | 0.61 | % | | | 0.51 | % | | | 0.09 | % | | | 0.52 | % | | | 1.19 | % | | | 0.50 | % |
Ratios to average net assets (annualized) | | | | | | | | | | | | | | | | | | | | | | | | |
Gross expenses | | | 0.49 | % | | | 0.47 | % | | | 0.45 | % | | | 0.46 | % | | | 0.47 | % | | | 0.51 | % |
Net expenses | | | 0.46 | % | | | 0.46 | % | | | 0.45 | % | | | 0.46 | % | | | 0.46 | % | | | 0.47 | % |
Net investment income | | | 1.42 | % | | | 0.98 | % | | | 0.84 | % | | | 0.87 | % | | | 0.93 | % | | | 0.98 | % |
Supplemental data | | | | | | | | | | | | | | | | | | | | | | | | |
Portfolio turnover rate | | | 0 | % | | | 2 | % | | | 13 | % | | | 10 | % | | | 18 | % | | | 10 | % |
Net assets, end of period (000s omitted) | | | $246,944 | | | | $397,529 | | | | $702,617 | | | | $906,536 | | | | $844,221 | | | | $906,698 | |
| 1 | Calculated based upon average shares outstanding |
| 2 | Amount is less than $0.005. |
| 3 | Returns for periods of less than one year are not annualized. |
The accompanying notes are an integral part of these financial statements.
| | | | | | |
| Notes to financial statements (unaudited) | | Wells Fargo Adjustable Rate Government Fund | | | 29 | |
1. ORGANIZATION
Wells Fargo Funds Trust (the “Trust”), a Delaware statutory trust organized on March 10, 1999, is an open-end management investment company registered under the Investment Company Act of 1940, as amended (the “1940 Act”). As an investment company, the Trust follows the accounting and reporting guidance in Financial Accounting Standards Board Accounting Standards Codification Topic 946, Financial Services – Investment Companies. These financial statements report on the Wells Fargo Adjustable Rate Government Fund (the “Fund”) which is a diversified series of the Trust.
Effective at the close of business on December 5, 2016, Class B shares were converted to Class A shares and are no longer offered by the Fund. Information for Class B shares reflected in the financial statements represents activity through December 5, 2016.
2. SIGNIFICANT ACCOUNTING POLICIES
The following significant accounting policies, which are consistently followed in the preparation of the financial statements of the Fund, are in conformity with U.S. generally accepted accounting principles which require management to make estimates and assumptions that affect the reported amounts of assets and liabilities, disclosure of contingent assets and liabilities at the date of the financial statements, and the reported amounts of revenues and expenses during the reporting period. Actual results could differ from those estimates.
Securities valuation
All investments are valued each business day as of the close of regular trading on the New York Stock Exchange (generally 4 p.m. Eastern Time), although the Fund may deviate from this calculation time under unusual or unexpected circumstances.
Debt securities are valued at the evaluated bid price provided by an independent pricing service or, if a reliable price is not available, the quoted bid price from an independent broker-dealer.
Investments in registered open-end investment companies are valued at net asset value.
Investments which are not valued using any of the methods discussed above are valued at their fair value, as determined in good faith by the Board of Trustees of the Fund. The Board of Trustees has established a Valuation Committee comprised of the Trustees and has delegated to it the authority to take any actions regarding the valuation of portfolio securities that the Valuation Committee deems necessary or appropriate, including determining the fair value of portfolio securities, unless the determination has been delegated to the Wells Fargo Asset Management Pricing Committee at Wells Fargo Funds Management, LLC (“Funds Management”). The Board of Trustees retains the authority to make or ratify any valuation decisions or approve any changes to the Valuation Procedures as it deems appropriate. On a quarterly basis, the Board of Trustees receives reports on any valuation actions taken by the Valuation Committee or the Wells Fargo Asset Management Pricing Committee which may include items for ratification.
Valuations of fair valued securities are compared to the next actual sales price when available, or other appropriate market values, to assess the continued appropriateness of the fair valuation methodologies used. These securities are fair valued on a day-to-day basis, taking into consideration changes to appropriate market information and any significant changes to the inputs considered in the valuation process until there is a readily available price provided on an exchange or by an independent pricing service. Valuations received from an independent pricing service or independent broker-dealer quotes are periodically validated by comparisons to most recent trades and valuations provided by other independent pricing services in addition to the review of prices by the manager and/or subadviser. Unobservable inputs used in determining fair valuations are identified based on the type of security, taking into consideration factors utilized by market participants in valuing the investment, knowledge about the issuer and the current market environment.
Security transactions and income recognition
Securities transactions are recorded on a trade date basis. Realized gains or losses are recorded on the basis of identified cost.
Interest income is accrued daily and bond discounts are accreted and premiums are amortized daily. To the extent debt obligations are placed on non-accrual status, any related interest income may be reduced by writing off interest receivables when the collection of all or a portion of interest has been determined to be doubtful based on consistently applied procedures and the fair value has decreased. If the issuer subsequently resumes interest payments or when the collectability of interest is reasonably assured, the debt obligation is removed from non-accrual status.
| | | | |
| 30 | | Wells Fargo Adjustable Rate Government Fund | | Notes to financial statements (unaudited) |
Distributions to shareholders
Distributions to shareholders from net investment income are accrued daily and paid monthly. Distributions from net realized gains, if any, are recorded on the ex-dividend date and paid at least annually. Such distributions are determined in accordance with income tax regulations and may differ from U.S. generally accepted accounting principles. Dividend sources are estimated at the time of declaration. The tax character of distributions is determined as of the Fund’s fiscal year end. Therefore, a portion of the Fund’s distributions made prior to the Fund’s fiscal year end may be categorized as a tax return of capital at year end.
Federal and other taxes
The Fund intends to continue to qualify as a regulated investment company by distributing substantially all of its investment company taxable income and any net realized capital gains (after reduction for capital loss carryforwards) sufficient to relieve it from all, or substantially all, federal income taxes. Accordingly, no provision for federal income taxes was required.
The Fund’s income and federal excise tax returns and all financial records supporting those returns for the prior three fiscal years are subject to examination by the federal and Delaware revenue authorities. Management has analyzed the Fund’s tax positions taken on federal, state, and foreign tax returns for all open tax years and does not believe that there are any uncertain tax positions that require recognition of a tax liability.
As of February 28, 2018, the aggregate cost of all investments for federal income tax purposes was $434,306,318 and the unrealized gains (losses) consisted of:
| | | | |
Gross unrealized gains | | $ | 6,090,505 | |
Gross unrealized losses | | | (902,045 | ) |
Net unrealized gains | | $ | 5,188,460 | |
As of August 31, 2017, the Fund had capital loss carryforwards available to offset future net realized capital gains in the amount of $1,705,150 expiring in 2018 and $66,443 expiring in 2019.
Class allocations
The separate classes of shares offered by the Fund differ principally in applicable sales charges, distribution, shareholder servicing, and administration fees. Class specific expenses are charged directly to that share class. Investment income, common expenses, and realized and unrealized gains (losses) on investments are allocated daily to each class of shares based on the relative proportion of net assets of each class.
3. FAIR VALUATION MEASUREMENTS
Fair value measurements of investments are determined within a framework that has established a fair value hierarchy based upon the various data inputs utilized in determining the value of the Fund’s investments. The three-level hierarchy gives the highest priority to unadjusted quoted prices in active markets for identical assets or liabilities (Level 1) and the lowest priority to unobservable inputs (Level 3). The Fund’s investments are classified within the fair value hierarchy based on the lowest level of input that is significant to the fair value measurement. The inputs are summarized into three broad levels as follows:
| ∎ | | Level 1 – quoted prices in active markets for identical securities |
| ∎ | | Level 2 – other significant observable inputs (including quoted prices for similar securities, interest rates, prepayment speeds, credit risk, etc.) |
| ∎ | | Level 3 – significant unobservable inputs (including the Fund’s own assumptions in determining the fair value of investments) |
The inputs or methodologies used for valuing investments in securities are not necessarily an indication of the risk associated with investing in those securities.
| | | | | | |
| Notes to financial statements (unaudited) | | Wells Fargo Adjustable Rate Government Fund | | | 31 | |
The following is a summary of the inputs used in valuing the Fund’s assets and liabilities as of February 28, 2018:
| | | | | | | | | | | | | | | | |
| | | Quoted prices (Level 1) | | | Other significant observable inputs (Level 2) | | | Significant unobservable inputs (Level 3) | | | Total | |
Assets | | | | | | | | | | | | | | | | |
Investments in: | | | | | | | | | | | | | | | | |
| | | | |
Agency securities | | $ | 0 | | | $ | 430,781,901 | | | $ | 0 | | | $ | 430,781,901 | |
| | | | |
Short-term investments | | | | | | | | | | | | | | | | |
Investment companies | | | 8,712,877 | | | | 0 | | | | 0 | | | | 8,712,877 | |
Total assets | | $ | 8,712,877 | | | $ | 430,781,901 | | | $ | 0 | | | $ | 439,494,778 | |
The Fund recognizes transfers between levels within the fair value hierarchy at the end of the reporting period. At February 28, 2018, the Fund did not have any transfers into/out of Level 1, Level 2, or Level 3.
4. TRANSACTIONS WITH AFFILIATES
Management fee
Funds Management, an indirect wholly owned subsidiary of Wells Fargo & Company (“Wells Fargo”), is the manager of the Fund and provides advisory and fund-level administrative services under an investment management agreement. Under the investment management agreement, Funds Management is responsible for, among other services, implementing the investment objectives and strategies of the Fund, supervising the subadviser, providing fund-level administrative services in connection with the Fund’s operations, and providing any other fund-level administrative services reasonably necessary for the operation of the Fund. As compensation for its services under the investment management agreement, Funds Management is entitled to receive an annual management fee starting at 0.35% and declining to 0.255% as the average daily net assets of the Fund increase. For the six months ended February 28, 2018, the management fee was equivalent to an annual rate of 0.35% of the Fund’s average daily net assets.
Funds Management has retained the services of a subadviser to provide daily portfolio management to the Fund. The fee for subadvisory services is borne by Funds Management. Wells Capital Management Incorporated, an affiliate of Funds Management and an indirect wholly owned subsidiary of Wells Fargo, is the subadviser to the Fund and is entitled to receive a fee from Funds Management at an annual rate starting at 0.20% and declining to 0.10% as the average daily net assets of the Fund increase.
Administration fees
Under a class-level administration agreement, Funds Management provides class-level administrative services to the Fund, which includes paying fees and expenses for services provided by the transfer agent, sub-transfer agents, omnibus account servicers and record-keepers. As compensation for its services under the class-level administration agreement, Funds Management receives an annual fee which is calculated based on the average daily net assets of each class as follows:
| | | | |
| | | Class-level administration fee | |
Class A, Class C | | | 0.16 | % |
Administrator Class | | | 0.10 | |
Institutional Class | | | 0.08 | |
Funds Management has contractually waived and/or reimbursed management and administration fees to the extent necessary to maintain certain net operating expense ratios for the Fund. Waiver of fees and/or reimbursement of expenses by Funds Management were made first from fund level expenses on a proportionate basis and then from class specific expenses. Funds Management has committed through December 31, 2018 to waive fees and/or reimburse expenses to the extent necessary to cap the Fund’s expenses at 0.74% for Class A shares, 1.49% for Class C shares, 0.60% for Administrator Class shares, and 0.46% for Institutional Class shares. After this time, the cap may be increased or the commitment to maintain the cap may be terminated only with the approval of the Board of Trustees.
| | | | |
| 32 | | Wells Fargo Adjustable Rate Government Fund | | Notes to financial statements (unaudited) |
Distribution fee
The Trust has adopted a distribution plan for Class C shares of the Fund pursuant to Rule 12b-1 under the 1940 Act. A distribution fee is charged to Class C shares and paid to Wells Fargo Funds Distributor, LLC (“Funds Distributor”), the principal underwriter, at an annual rate of 0.75% of the average daily net assets of Class C shares.
In addition, Funds Distributor is entitled to receive the front-end sales charge from the purchase of Class A shares and a contingent deferred sales charge on the redemption of certain Class A shares. Funds Distributor is also entitled to receive the contingent deferred sales charges from redemptions of Class C shares. For the six month ended February 28, 2018, Funds Distributor received $35 from the sale of Class A shares. No contingent deferred sales charges were incurred by Class A and Class C shares for the six months ended February 28, 2018.
Shareholder servicing fees
The Trust has entered into contracts with one or more shareholder servicing agents, whereby Class A, Class C, and Administrator Class of the Fund are charged a fee at an annual rate of 0.25% of the average daily net assets of each respective class.
A portion of these total shareholder servicing fees were paid to affiliates of Wells Fargo.
Interfund transactions
The Fund may purchase or sell portfolio investment securities to certain other Wells Fargo affiliates pursuant to Rule 17a-7 under the 1940 Act and under procedures adopted by the Board of Trustees. The procedures have been designed to ensure that these interfund transactions, which do not incur broker commissions, are effected at current market prices.
5. INVESTMENT PORTFOLIO TRANSACTIONS
Purchases and sales of U.S. government securities, excluding short-term securities, for the six month ended February 28, 2018 were $36,232 and $125,719,844, respectively.
6. BANK BORROWINGS
The Trust (excluding the money market funds and certain other funds) and Wells Fargo Variable Trust are parties to a $280,000,000 revolving credit agreement whereby the Fund is permitted to use bank borrowings for temporary or emergency purposes, such as to fund shareholder redemption requests. Interest under the credit agreement is charged to the Fund based on a borrowing rate equal to the higher of the Federal Funds rate in effect on that day plus 1.25% or the overnight LIBOR rate in effect on that day plus 1.25%. In addition, an annual commitment fee equal to 0.25% of the unused balance is allocated to each participating fund.
For the six month ended February 28, 2018, there were no borrowings by the Fund under the agreement.
7. INDEMNIFICATION
Under the Trust’s organizational documents, the officers and Trustees have been granted certain indemnification rights against certain liabilities that may arise out of performance of their duties to the Trust. Additionally, in the normal course of business, the Trust may enter into contracts with service providers that contain a variety of indemnification clauses. The Trust’s maximum exposure under these arrangements is dependent on future claims that may be made against the Fund and, therefore, cannot be estimated.
| | | | | | |
| Other information (unaudited) | | Wells Fargo Adjustable Rate Government Fund | | | 33 | |
PROXY VOTING INFORMATION
A description of the policies and procedures that the Fund uses to determine how to vote proxies relating to portfolio securities is available, upon request, by calling 1-800-222-8222, visiting our website at wellsfargofunds.com, or visiting the SEC website at sec.gov. Information regarding how the Fund voted proxies relating to portfolio securities during the most recent 12-month period ended June 30 is available on the Fund’s website at wellsfargofunds.com or by visiting the SEC website at sec.gov.
PORTFOLIO HOLDINGS INFORMATION
The complete portfolio holdings for the Fund are publicly available monthly on the Fund’s website (wellsfargofunds.com), on a one-month delayed basis. In addition, top ten holdings information (excluding derivative positions) for the Fund is publicly available on the Fund’s website on a monthly, seven-day or more delayed basis. The Fund files its complete schedule of portfolio holdings with the SEC for the first and third quarters of each fiscal year on Form N-Q, which is available by visiting the SEC website at sec.gov. In addition, the Fund’s Form N-Q may be reviewed and copied at the SEC’s Public Reference Room in Washington, DC, and at regional offices in New York City, at 233 Broadway, and in Chicago, at 175 West Jackson Boulevard, Suite 900. Information about the Public Reference Room may be obtained by calling 1-800-SEC-0330.
| | | | |
| 34 | | Wells Fargo Adjustable Rate Government Fund | | Other information (unaudited) |
BOARD OF TRUSTEES AND OFFICERS
Each of the Trustees and Officers1 listed in the table below acts in identical capacities for each fund in the Wells Fargo family of funds, which consists of 153 mutual funds comprising the Wells Fargo Funds Trust, Wells Fargo Variable Trust, Wells Fargo Master Trust and four closed-end funds (collectively the “Fund Complex”). This table should be read in conjunction with the Prospectus and the Statement of Additional Information2. The mailing address of each Trustee and Officer is 525 Market Street, 12th Floor, San Francisco, CA 94105. Each Trustee and Officer serves an indefinite term, however, each Trustee serves such term until reaching the mandatory retirement age established by the Trustees.
Independent Trustees
| | | | | | |
Name and year of birth | | Position held and length of service* | | Principal occupations during past five years or longer | | Current other public company or investment company directorships |
William R. Ebsworth (Born 1957) | | Trustee, since 2015 | | Retired. From 1984 to 2013, equities analyst, portfolio manager, research director and chief investment officer at Fidelity Management and Research Company in Boston, Tokyo, and Hong Kong, and retired in 2013 as Chief Investment Officer of Fidelity Strategic Advisers, Inc. where he led a team of investment professionals managing client assets. Prior thereto, Board member of Hong Kong Securities Clearing Co., Hong Kong Options Clearing Corp., the Thailand International Fund, Ltd., Fidelity Investments Life Insurance Company, and Empire Fidelity Investments Life Insurance Company. Board member of the Forté Foundation (non-profit organization) and the Vincent Memorial Hospital Endowment (non-profit organization), where he serves on the Investment Committee and as a Chair of the Audit Committee. Mr. Ebsworth is a CFA® charterholder. | | Asset Allocation Trust |
Jane A. Freeman** (Born 1953) | | Trustee, since 2015; Chair Liaison, since 2018 | | Retired. From 2012 to 2014 and 1999 to 2008, Chief Financial Officer of Scientific Learning Corporation. From 2008 to 2012, Ms. Freeman provided consulting services related to strategic business projects. Prior to 1999, Portfolio Manager at Rockefeller & Co. and Scudder, Stevens & Clark. Board member of the Harding Loevner Funds from 1996 to 2014, serving as both Lead Independent Director and chair of the Audit Committee. Board member of the Russell Exchange Traded Funds Trust from 2011 to 2012 and the chair of the Audit Committee. Ms. Freeman is a Board Member of Ruth Bancroft Garden (non-profit organization) and the Glimmerglass Festival. She is also an inactive Chartered Financial Analyst. | | Asset Allocation Trust |
Isaiah Harris, Jr. (Born 1952) | | Trustee, since 2009 | | Retired. Chairman of the Board of CIGNA Corporation since 2009, and Director since 2005. From 2003 to 2011, Director of Deluxe Corporation. Prior thereto, President and CEO of BellSouth Advertising and Publishing Corp. from 2005 to 2007, President and CEO of BellSouth Enterprises from 2004 to 2005 and President of BellSouth Consumer Services from 2000 to 2003. Emeritus member of the Iowa State University Foundation Board of Governors. Emeritus Member of the Advisory Board of Iowa State University School of Business. Advisory Board Member, Palm Harbor Academy (charter school). Advisory Board Member, Child Evangelism Fellowship (non-profit). Mr. Harris is a certified public accountant (inactive status). | | CIGNA Corporation; Asset Allocation Trust |
Judith M. Johnson (Born 1949) | | Trustee, since 2008; Audit Committee Chairman, since 2008 | | Retired. Prior thereto, Chief Executive Officer and Chief Investment Officer of Minneapolis Employees Retirement Fund from 1996 to 2008. Ms. Johnson is an attorney, certified public accountant and a certified managerial accountant. | | Asset Allocation Trust |
David F. Larcker (Born 1950) | | Trustee, since 2009 | | James Irvin Miller Professor of Accounting at the Graduate School of Business, Stanford University, Director of the Corporate Governance Research Initiative and Senior Faculty of The Rock Center for Corporate Governance since 2006. From 2005 to 2008, Professor of Accounting at the Graduate School of Business, Stanford University. Prior thereto, Ernst & Young Professor of Accounting at The Wharton School, University of Pennsylvania from 1985 to 2005. | | Asset Allocation Trust |
| | | | | | |
| Other information (unaudited) | | Wells Fargo Adjustable Rate Government Fund | | | 35 | |
| | | | | | |
Name and year of birth | | Position held and length of service* | | Principal occupations during past five years or longer | | Current other public company or investment company directorships |
Olivia S. Mitchell*** (Born 1953) | | Trustee, since 2006; Governance Committee Chairman, since 2018 | | International Foundation of Employee Benefit Plans Professor, Wharton School of the University of Pennsylvania since 1993. Director of Wharton’s Pension Research Council and Boettner Center on Pensions & Retirement Research, and Research Associate at the National Bureau of Economic Research. Previously, Cornell University Professor from 1978 to 1993. | | Asset Allocation Trust |
Timothy J. Penny**** (Born 1951) | | Trustee, since 1996; Chairman, since 2018; Vice Chairman, from 2017 to 2018 | | President and Chief Executive Officer of Southern Minnesota Initiative Foundation, a non-profit organization, since 2007. Member of the Board of Trustees of NorthStar Education Finance, Inc., a non-profit organization, since 2007. | | Asset Allocation Trust |
James G. Polisson***** (Born 1959) | | Trustee, since 2018; Advisory Board Member, from 2017 to 2018 | | Retired. Chief Marketing Officer, Source (ETF) UK Services, Ltd, from 2015 to 2017. From 2012 to 2015, Principal of The Polisson Group, LLC, a management consulting, corporate advisory and principal investing company. Chief Executive Officer and Managing Director at Russell Investments, Global Exchange Traded Funds from 2010 to 2012. Managing Director of Barclays Global Investors from 1998 to 2010 and Global Chief Marketing Officer for iShares and Barclays Global Investors from 2000 to 2010. Trustee of the San Francisco Mechanics’ Institute, a non-profit organization, from 2013 to 2015. Board member of the Russell Exchange Traded Fund Trust from 2011 to 2012. Director of Barclays Global Investors Holdings Deutschland GmbH from 2006 to 2009. Mr. Polisson is an attorney and has a retired status with the Massachusetts and District of Columbia Bar Associations. | | Asset Allocation Trust |
Michael S. Scofield (Born 1943) | | Trustee, since 2010 | | Served on the Investment Company Institute’s Board of Governors and Executive Committee from 2008-2011 as well the Governing Council of the Independent Directors Council from 2006-2011 and the Independent Directors Council Executive Committee from 2008-2011. Trustee of the Evergreen Fund complex (and its predecessors) from 1984 to 2010. Chairman of the Evergreen Funds from 2000-2010. Former Trustee of the Mentor Funds. Retired Attorney, Law Offices of Michael S. Scofield. | | Asset Allocation Trust |
Pamela Wheelock***** (Born 1959) | | Trustee, since 2018; Advisory Board Member, from 2017 to 2018 | | Chief Operating Officer, Twin Cities Habitat for Humanity, since January, 2017. Vice President of University Services, University of Minnesota from 2012 to 2017. Prior thereto, Interim President and Chief Executive Officer of Blue Cross Blue Shield of Minnesota from 2010 to 2011, Chairman of the Board from 2009 to 2011 and Board Director from 2003 to 2015. Vice President, Leadership and Community Engagement, Bush Foundation, Saint Paul, Minnesota (a private foundation) from 2009 to 2011. Executive Vice President and Chief Financial Officer, Minnesota Sports and Entertainment from 2004 to 2009 and Senior Vice President from 2002 to 2004. Commissioner of Finance, State of Minnesota, from 1999 to 2002. Currently on the Board of Directors, Governance Committee and Finance Committee, for the Minnesota Philanthropy Partners (Saint Paul Foundation) since 2012 and Board Chair of the Minnesota Wild Foundation since 2010. | | Asset Allocation Trust |
| * | Length of service dates reflect the Trustee’s commencement of service with the Trust’s predecessor entities, where applicable. |
| ** | Jane Freeman became Chair Liaison effective January 1, 2018. |
| *** | Olivia Mitchell became Chairman of the Governance Committee effective January 1, 2018. |
| **** | Timothy Penny became Chairman effective January 1, 2018. |
| ***** | James Polisson and Pamela Wheelock each became a Trustee effective January 1, 2018. |
| | | | |
| 36 | | Wells Fargo Adjustable Rate Government Fund | | Other information (unaudited) |
Officers
| | | | | | |
Name and year of birth | | Position held and length of service | | Principal occupations during past five years or longer | | |
Andrew Owen (Born 1960) | | President, since 2017 | | Executive Vice President of Wells Fargo & Company and Head of Affiliated Managers, Wells Fargo Asset Management, since 2014. In addition, Mr. Owen is currently President, Chief Executive Officer and Director of Wells Fargo Funds Management, LLC since 2017. Prior thereto, Executive Vice President responsible for marketing, investments and product development for Wells Fargo Funds Management, LLC, from 2009 to 2014. | | |
Nancy Wiser1 (Born 1967) | | Treasurer, since 2012 | | Executive Vice President of Wells Fargo Funds Management, LLC since 2011. Chief Operating Officer and Chief Compliance Officer at LightBox Capital Management LLC, from 2008 to 2011. | | |
Alexander Kymn* (Born 1973) | | Secretary, since 2018; Chief Legal Officer, since 2018 | | Senior Company Counsel of Wells Fargo Bank, N.A. since 2018 (previously Senior Counsel from 2007 to 2018). Vice President of Wells Fargo Funds Management, LLC from 2008 to 2014. | | |
C. David Messman** (Born 1960) | | Secretary, since 2000; Chief Legal Officer, since 2003 | | Senior Vice President and Secretary of Wells Fargo Funds Management, LLC since 2001. Assistant General Counsel of Wells Fargo Bank, N.A. since 2013 and Vice President and Managing Counsel of Wells Fargo Bank, N.A. from 1996 to 2013. | | |
Michael H. Whitaker (Born 1967) | | Chief Compliance Officer, since 2016 | | Senior Vice President and Chief Compliance Officer since 2016. Senior Vice President and Chief Compliance Officer for Fidelity Investments from 2007 to 2016. | | |
David Berardi (Born 1975) | | Assistant Treasurer, since 2009 | | Vice President of Wells Fargo Funds Management, LLC since 2009. Vice President of Evergreen Investment Management Company, LLC from 2008 to 2010. Manager of Fund Reporting and Control for Evergreen Investment Management Company, LLC from 2004 to 2010. | | |
Jeremy DePalma1 (Born 1974) | | Assistant Treasurer, since 2009 | | Senior Vice President of Wells Fargo Funds Management, LLC since 2009. Senior Vice President of Evergreen Investment Management Company, LLC from 2008 to 2010 and head of the Fund Reporting and Control Team within Fund Administration from 2005 to 2010. | | |
| 1 | Nancy Wiser acts as Treasurer of 77 funds in the Fund Complex. Jeremy DePalma acts as Treasurer of 76 funds and Assistant Treasurer of 77 funds in the Fund Complex. |
| 2 | The Statement of Additional Information includes additional information about the Trustees and is available, without charge, upon request, by calling 1-800-222-8222 or by visiting the website at wellsfargofunds.com. |
| * | Alexander Kymn became the Secretary and Chief Legal Officer effective April 17, 2018. |
| ** | David Messman was the Secretary and Chief Legal Officer until April 16, 2018. |
| | | | | | |
| List of abbreviations | | Wells Fargo Adjustable Rate Government Fund | | | 37 | |
The following is a list of common abbreviations for terms and entities that may have appeared in this report.
| ACA | — ACA Financial Guaranty Corporation |
| ADR | — American depositary receipt |
| ADS | — American depositary shares |
| AGC | — Assured Guaranty Corporation |
| AGM | — Assured Guaranty Municipal |
| Ambac | — Ambac Financial Group Incorporated |
| AMT | — Alternative minimum tax |
| BAN | — Bond anticipation notes |
| BHAC | — Berkshire Hathaway Assurance Corporation |
| CAB | — Capital appreciation bond |
| CCAB | — Convertible capital appreciation bond |
| CDA | — Community Development Authority |
| CDO | — Collateralized debt obligation |
| CLO | — Collateralized loan obligation |
| DRIVER | — Derivative inverse tax-exempt receipts |
| DW&P | — Department of Water & Power |
| DWR | — Department of Water Resources |
| ECFA | — Educational & Cultural Facilities Authority |
| EDA | — Economic Development Authority |
| EDFA | — Economic Development Finance Authority |
| ETF | — Exchange-traded fund |
| FDIC | — Federal Deposit Insurance Corporation |
| FFCB | — Federal Farm Credit Banks |
| FGIC | — Financial Guaranty Insurance Corporation |
| FHA | — Federal Housing Administration |
| FHLB | — Federal Home Loan Bank |
| FHLMC | — Federal Home Loan Mortgage Corporation |
| FICO | — The Financing Corporation |
| FNMA | — Federal National Mortgage Association |
| GDR | — Global depositary receipt |
| GNMA | — Government National Mortgage Association |
| HCFR | — Healthcare facilities revenue |
| HEFA | — Health & Educational Facilities Authority |
| HEFAR | — Higher education facilities authority revenue |
| HFA | — Housing Finance Authority |
| HFFA | — Health Facilities Financing Authority |
| HUD | — Department of Housing and Urban Development |
| IDA | — Industrial Development Authority |
| IDAG | — Industrial Development Agency |
| KRW | — Republic of Korea won |
| LIBOR | — London Interbank Offered Rate |
| LIFER | — Long Inverse Floating Exempt Receipts |
| LLC | — Limited liability company |
| LLLP | — Limited liability limited partnership |
| LLP | — Limited liability partnership |
| MBIA | — Municipal Bond Insurance Association |
| MFHR | — Multifamily housing revenue |
| MSTR | — Municipal securities trust receipts |
| MUD | — Municipal Utility District |
| National | — National Public Finance Guarantee Corporation |
| PCFA | — Pollution Control Financing Authority |
| PCL | — Public Company Limited |
| PCR | — Pollution control revenue |
| PFA | — Public Finance Authority |
| PFFA | — Public Facilities Financing Authority |
| PFOTER | — Puttable floating option tax-exempt receipts |
| PJSC | — Public Joint Stock Company |
| plc | — Public limited company |
| PUTTER | — Puttable tax-exempt receipts |
| R&D | — Research & development |
| Radian | — Radian Asset Assurance |
| RAN | — Revenue anticipation notes |
| RDA | — Redevelopment Agency |
| RDFA | — Redevelopment Finance Authority |
| REIT | — Real estate investment trust |
| ROC | — Reset option certificates |
| SAVRS | — Select auction variable rate securities |
| SBA | — Small Business Authority |
| SDR | — Swedish depositary receipt |
| SFHR | — Single-family housing revenue |
| SFMR | — Single-family mortgage revenue |
| SIFMA | — Securities Industry and Financial Markets Association |
| SPA | — Standby purchase agreement |
| SPDR | — Standard & Poor’s Depositary Receipts |
| SPEAR | — Short Puttable Exempt Adjustable Receipts |
| STRIPS | — Separate trading of registered interest and |
| TAN | — Tax anticipation notes |
| TIPS | — Treasury inflation-protected securities |
| TRAN | — Tax revenue anticipation notes |
| TTFA | — Transportation Trust Fund Authority |
| TVA | — Tennessee Valley Authority |
This page is intentionally left blank.
This page is intentionally left blank.
This page is intentionally left blank.

For more information
More information about Wells Fargo Funds is available free upon request. To obtain literature, please write, email, visit the Fund’s website, or call:
Wells Fargo Funds
P.O. Box 8266
Boston, MA 02266-8266
Email: fundservice@wellsfargo.com
Website: wellsfargofunds.com
Individual investors: 1-800-222-8222
Retail investment professionals: 1-888-877-9275
Institutional investment professionals:
1-866-765-0778
This report and the financial statements contained herein are submitted for the general information of the shareholders of the Fund. If this report is used for promotional purposes, distribution of the report must be accompanied or preceded by a current prospectus. Before investing, please consider the investment objectives, risks, charges, and expenses of the investment. For a current prospectus and, if available, a summary prospectus, containing this information, call 1-800-222-8222 or visit the Fund’s website at wellsfargofunds.com. Read the prospectus carefully before you invest or send money.
Wells Fargo Asset Management (WFAM) is a trade name used by the asset management businesses of Wells Fargo & Company. Wells Fargo Funds Management, LLC, a wholly owned subsidiary of Wells Fargo & Company, provides investment advisory and administrative services for Wells Fargo Funds. Other affiliates of Wells Fargo & Company provide subadvisory and other services for the funds. The funds are distributed by Wells Fargo Funds Distributor, LLC, Member FINRA, an affiliate of Wells Fargo & Company. Neither Wells Fargo Funds Distributor nor Wells Fargo Funds Management holds fund shareholder accounts or assets. This material is for general informational and educational purposes only and is NOT intended to provide investment advice or a recommendation of any kind—including a recommendation for any specific investment, strategy, or plan.
NOT FDIC INSURED ◾ NO BANK GUARANTEE ◾ MAY LOSE VALUE
© 2018 Wells Fargo Funds Management, LLC. All rights reserved.
| | |
 | | 309366 04-18 SA215/SAR215 02-18 |
Semi-Annual Report
February 28, 2018

Wells Fargo Conservative Income Fund


Reduce clutter. Save trees.
Sign up for electronic delivery of prospectuses and shareholder reports at wellsfargo.com/advantagedelivery
Contents
The views expressed and any forward-looking statements are as of February 28, 2018, unless otherwise noted, and are those of the Fund managers and/or Wells Fargo Funds Management, LLC. Discussions of individual securities, or the markets generally, or any Wells Fargo Fund are not intended as individual recommendations. Future events or results may vary significantly from those expressed in any forward-looking statements. The views expressed are subject to change at any time in response to changing circumstances in the market. Wells Fargo Funds Management, LLC and the Fund disclaim any obligation to publicly update or revise any views expressed or forward-looking statements.
NOT FDIC INSURED ◾ NO BANK GUARANTEE ◾ MAY LOSE VALUE
| | | | |
| 2 | | Wells Fargo Conservative Income Fund | | Letter to shareholders (unaudited) |

Andrew Owen
President
Wells Fargo Funds
During the period, stocks globally delivered
positive returns.
Dear Shareholder:
We are pleased to offer you this semi-annual report for the Wells Fargo Conservative Income Fund for the six-month period that ended February 28, 2018. During the period, stocks globally delivered positive returns. For the period, U.S. stocks, as measured by the S&P 500 Index1, gained 10.84% and international stocks, as measured by the MSCI ACWI ex USA Index (Net)2, gained 7.59%. In bond markets, the Bloomberg Barclays U.S. Aggregate Bond Index3 declined 2.18% and the Bloomberg Barclays Municipal Bond Index4 lost 1.24% while fixed-income investments outside the U.S. gained 2.52%, according to the Bloomberg Barclays Global Aggregate ex-USD Index5. The ICE BofAML U.S. High Yield Index6 earned 1.01% during the period.
U.S. stocks advanced as business-friendly policies and regulations, newly implemented tax reform, increased hiring activity, and consistent corporate profits led to higher investor and consumer confidence. Internationally, stocks gained as unemployment fell and wages increased in the U.K.; the Bank of Japan continued its accommodative monetary policies; and industrial production, retail sales, and fixed asset investment increased in China. Stock returns in the emerging markets were strong, with the MSCI EM Index (Net)7 gaining 10.58% for the period.
Reactions to U.S. interest-rate increases were uneven across the yield curve and globally.
The U.S. Federal Reserve (Fed) increased the federal funds rate twice during the six-month period. Following a federal funds rate increase in June to a range of 1.00% to 1.25%, 10-year U.S. Treasury yields declined, the yield curve flattened, and long-term bond prices benefited.
Internationally, central banks maintained low interest rates and accommodative monetary policies that supported business activity and stock values in foreign markets. A weaker U.S. dollar was generally supportive of business activity in regions around the globe.
Positive economic and market news continued as 2017 closed and 2018 began.
During the fourth quarter of 2017, stock markets continued the move higher. Third-quarter economic output in the U.S. grew at a 3.2% annual rate. The unemployment rate fell to a 17-year low of 4.1%. Tax reform and wage growth encouraged increased business and consumer spending.
Fed officials announced in October 2017 plans to begin unwinding its $4.5 trillion portfolio of bonds and other assets accumulated during rounds of quantitative easing conducted since the 2008–2009 recession. Still, restrained inflation kept long-term bond rates steady and the flattening of the yield curve persisted.
| 1 | The S&P 500 Index consists of 500 stocks chosen for market size, liquidity, and industry group representation. It is a market-value-weighted index with each stock’s weight in the index proportionate to its market value. You cannot invest directly in an index. |
| 2 | The Morgan Stanley Capital International (MSCI) All Country World Index (ACWI) ex USA Index (Net) is a free-float-adjusted market-capitalization-weighted index that is designed to measure the equity market performance of developed markets, excluding the United States and Canada. Source: MSCI. MSCI makes no express or implied warranties or representations and shall have no liability whatsoever with respect to any MSCI data contained herein. The MSCI data may not be further redistributed or used as a basis for other indices or any securities or financial products. This report is not approved, reviewed, or produced by MSCI. You cannot invest directly in an index. |
| 3 | The Bloomberg Barclays U.S. Aggregate Bond Index is a broad-based benchmark that measures the investment-grade, U.S. dollar-denominated, fixed-rate taxable bond market, including Treasuries, government-related and corporate securities, mortgage-backed securities (agency fixed-rate and hybrid adjustable-rate mortgage pass-throughs), asset-backed securities, and commercial mortgage-backed securities. You cannot invest directly in an index. |
| 4 | The Bloomberg Barclays Municipal Bond Index is an unmanaged index composed of long-term tax-exempt bonds with a minimum credit rating of Baa. You cannot invest directly in an index. |
| 5 | The Bloomberg Barclays Global Aggregate ex-USD Index is an unmanaged index that provides a broad-based measure of the global investment-grade fixed-income markets excluding the U.S. dollar-denominated debt market. You cannot invest directly in an index. |
| 6 | The ICE BofAML U.S. High Yield Index is a market-capitalization-weighted index of domestic and Yankee high-yield bonds. The index tracks the performance of high-yield securities traded in the U.S. bond market. You cannot invest directly in an index. Copyright 2018. ICE Data Indices, LLC. All rights reserved. |
| 7 | The MSCI Emerging Markets (EM) Index (Net) is a free-float-adjusted market-capitalization-weighted index that is designed to measure large- and mid-cap equity market performance of emerging markets. The MSCI EM Index (Net) consists of the following 24 emerging markets country indices: Brazil, Chile, China, Colombia, Czech Republic, Egypt, Greece, Hungary, India, Indonesia, Korea, Malaysia, Mexico, Pakistan, Peru, the Philippines, Poland, Qatar, Russia, South Africa, Taiwan, Thailand, Turkey, and the United Arab Emirates. You cannot invest directly in an index. |
| | | | | | |
| Letter to shareholders (unaudited) | | Wells Fargo Conservative Income Fund | | | 3 | |
October 2017 also marked one year since the regulatory reform of money market investing in the U.S. By December 2017, money market fund asset levels exceeded their December 2016 levels, reflecting continued investor demand for short-term investment opportunities offered in money market funds.
In December, the Organisation for Economic Co-operation and Development (OECD) reported that the global economy was expanding at its fastest rate since 2010; all 35 countries the OECD follows were on track to expand for 2017. International economies benefited from economic stimulus, which accelerated trade growth; improving employment; increased investment; and firming commodity prices.
The Fed raised the federal funds rate target to a range of 1.25% to 1.50% in December 2017 and began reducing its bond portfolio.
2018 opened with continued stock advances, then volatility.
Improving business and economic data globally continued to support stock advances through January 2018. Even political wrangling in the U.S. over budget resolutions could not dissuade investors from buying stocks as payrolls and factory orders increased. Long-term interest rates in the U.S. trended higher as the yield curve steepened—the 10-year Treasury rate moved from 2.46% to 2.84% and the 30-year rate moved from 2.81% to 3.08% during January 2018.
Investor sentiment shifted in February. Concerns about inflation began to emerge in the U.S. as readings from the Producer Price Index in January rose 2.5% year over year. During February 2018, the U.S. market endured a loss of more than 10% before recovering much of that loss, but volatility affected stocks globally throughout the month.
During January 2018, purchasing managers’ indexes in China, the eurozone, India, and Japan reported data for December that indicated continued growth. International stock values fell during February 2018, swept up in the selling momentum in U.S. markets.
Don’t let short-term uncertainty derail long-term investment goals.
Periods of investment uncertainty can present challenges, but experience has taught us that maintaining long-term investment goals can be an effective way to plan for the future. To help you create a sound strategy based on your personal goals and risk tolerance, Wells Fargo Funds offers more than 100 mutual funds spanning a wide range of asset classes and investment styles. Although diversification cannot guarantee an investment profit or prevent losses, we believe it can be an effective way to manage investment risk and potentially smooth out overall portfolio performance. We encourage investors to know their investments and to understand that appropriate levels of risk-taking may unlock opportunities.
Thank you for choosing to invest with Wells Fargo Funds. We appreciate your confidence in us and remain committed to helping you meet your financial needs.
Sincerely,

Andrew Owen
President
Wells Fargo Funds
During February 2018, the U.S. market endured a loss of more than 10% before recovering much of that loss, but volatility affected stocks globally throughout the month.
For further information about your Fund, contact your investment professional, visit our website at wellsfargofunds.com, or call us directly at 1-800-222-8222.
| | | | |
| 4 | | Wells Fargo Conservative Income Fund | | Performance highlights (unaudited) |
Investment objective
The Fund seeks current income consistent with capital preservation.
Manager
Wells Fargo Funds Management, LLC
Subadviser
Wells Capital Management Incorporated
Portfolio managers
Andrew M. Greenberg, CFA®
Anthony J. Melville, CFA®
Jeffrey L. Weaver, CFA®
Average annual total returns (%) as of February 28, 2018
| | | | | | | | | | | | | | | | | | |
| | | | | | | | | | | Expense ratios1 (%) | |
| | | Inception date | | 1 year | | | Since inception | | | Gross | | | Net2 | |
| Institutional Class (WCIIX) | | 5-31-2013 | | | 1.22 | | | | 0.75 | | | | 0.36 | | | | 0.27 | |
| Bloomberg Barclays 6-9 Month Treasury Bill Index3 | | – | | | 0.76 | | | | 0.35 | * | | | – | | | | – | |
| * | | Based on inception date of the Institutional Class. |
Figures quoted represent past performance, which is no guarantee of future results, and do not reflect taxes that a shareholder may pay on fund distributions or the redemption of fund shares. Investment return and principal value of an investment will fluctuate so that an investor’s shares, when redeemed, may be worth more or less than their original cost. Current performance may be lower or higher than the performance data quoted, which assumes the reinvestment of dividends and capital gains. Current month-end performance is available on the Fund’s website, wellsfargofunds.com.
Index returns do not include transaction costs associated with buying and selling securities, any mutual fund fees or expenses, or any taxes. It is not possible to invest directly in an index.
Institutional Class shares are sold without a front-end sales charge or contingent deferred sales charge.
Bond values fluctuate in response to the financial condition of individual issuers, general market and economic conditions, and changes in interest rates. Changes in market conditions and government policies may lead to periods of heightened volatility in the bond market and reduced liquidity for certain bonds held by the Fund. In general, when interest rates rise, bond values fall and investors may lose principal value. Interest-rate changes and their impact on the Fund and its share price can be sudden and unpredictable. The use of derivatives may reduce returns and/or increase volatility. Certain investment strategies tend to increase the total risk of an investment (relative to the broader market). The Fund is exposed to foreign investment risk, mortgage- and asset-backed securities risk, and municipal securities risk. Consult the Fund’s prospectus for additional information on these and other risks.
Please see footnotes on page 5.
| | | | | | |
| Performance highlights (unaudited) | | Wells Fargo Conservative Income Fund | | | 5 | |
| | | | |
| Ten largest holdings (%) as of February 28, 20184 | |
American Express Credit Corporation, 2.15%, 3-18-2019 | | | 1.97 | |
New York Life Global Funding, 1.97%, 4-9-2020 | | | 1.83 | |
Japan Tobacco Incorporated, 2.10%, 7-23-2018 | | | 1.61 | |
Santander Retail Auto Lease Trust Series 2017-A Class A2A, 2.02%, 3-20-2020 | | | 1.51 | |
Anheuser-Busch InBev Finance Company, 1.90%, 2-1-2019 | | | 1.42 | |
Berkshire Hathaway Finance Corporation, 2.07%, 3-7-2018 | | | 1.38 | |
Hyundai Auto Lease Securitization Trust Series 2018-A Class A2A, 2.55%, 8-17-2020 | | | 1.38 | |
Gilead Sciences Incorporated, 1.85%, 9-4-2018 | | | 1.38 | |
Cards II Trust Series 2017-1A Class A, 1.96%, 4-18-2022 | | | 1.36 | |
MMAF Equipment Finance LLC Series 2017-B Class A2, 1.93%, 10-15-2020 | | | 1.31 | |
|
| Portfolio allocation as of February 28, 20185 |
|
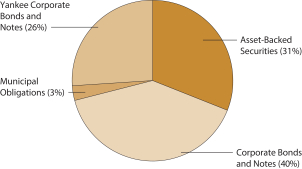
|
| 1 | Reflects the expense ratios as stated in the most recent prospectus. The expense ratios shown are subject to change and may differ from the annualized expense ratio shown in the financial highlights of this report. |
| 2 | The manager has contractually committed through December 31, 2018, to waive fees and/or reimburse expenses to the extent necessary to cap the Fund’s Total Annual Fund Operating Expenses After Fee Waivers at the amount shown. After this time, the cap may be increased or the commitment to maintain the cap may be terminated only with the approval of the Board of Trustees. Brokerage commissions, stamp duty fees, interest, taxes, acquired fund fees and expenses, and extraordinary expenses are excluded from the expense cap. Without this cap, the Fund’s returns would have been lower. The expense ratio paid by an investor is the net expense ratio (the total annual fund operating expenses after fee waivers) as stated in the prospectus. |
| 3 | The Bloomberg Barclays 6-9 Month Treasury Bill Index includes all publicly issued zero-coupon U.S. Treasury bills that have a remaining maturity of less than nine months and more than six, are rated investment-grade, and have $250 million or more of outstanding face value. You cannot invest directly in an index. |
| 4 | The ten largest holdings, excluding cash and cash equivalents, are calculated based on the value of the investments divided by total net assets of the Fund. Holdings are subject to change and may have changed since the date specified. |
| 5 | Amounts are calculated based on the total long-term investments of the Fund. These amounts are subject to change and may have changed since the date specified. |
| | | | |
| 6 | | Wells Fargo Conservative Income Fund | | Fund expenses (unaudited) |
As a shareholder of the Fund, you incur ongoing costs including management fees and other Fund expenses, This example is intended to help you understand your ongoing costs (in dollars) of investing in the Fund and to compare these costs with the ongoing costs of investing in other mutual funds.
The example is based on an investment of $1,000 invested at the beginning of the six-month period and held for the entire period from September 1, 2017 to February 28, 2018.
Actual expenses
The “Actual” line of the table below provides information about actual account values and actual expenses. You may use the information in this line, together with the amount you invested, to estimate the expenses that you paid over the period. Simply divide your account value by $1,000 (for example, an $8,600 account value divided by $1,000 = 8.6), then multiply the result by the number in the “Actual” line under the heading entitled “Expenses paid during period” for your applicable class of shares to estimate the expenses you paid on your account during this period.
Hypothetical example for comparison purposes
The “Hypothetical” line of the table below provides information about hypothetical account values and hypothetical expenses based on the Fund’s actual expense ratio and an assumed rate of return of 5% per year before expenses, which is not the Fund’s actual return. The hypothetical account values and expenses may not be used to estimate the actual ending account balance or expenses you paid for the period. You may use this information to compare the ongoing costs of investing in the Fund and other funds. To do so, compare this 5% hypothetical example with the 5% hypothetical examples that appear in the shareholder reports of the other funds.
Please note that the expenses shown in the table are meant to highlight your ongoing costs. Therefore, the “Hypothetical” line of the table is useful in comparing ongoing costs and will not help you determine the relative total costs of owning different funds.
| | | | | | | | | | | | | | | | |
| | | Beginning
account value
9-1-2017 | | | Ending
account value
2-28-2018 | | | Expenses
paid during
the period¹ | | | Annualized net
expense ratio | |
Institutional Class | | | | | | | | | | | | | | | | |
Actual | | $ | 1,000.00 | | | $ | 1,005.56 | | | $ | 1.34 | | | | 0.27 | % |
Hypothetical (5% return before expenses) | | $ | 1,000.00 | | | $ | 1,023.46 | | | $ | 1.35 | | | | 0.27 | % |
| 1 | Expenses paid is equal to the annualized net expense ratio multiplied by the average account value over the period, multiplied by the number of days in the most recent fiscal half-year divided by the number of days in the fiscal year (to reflect the one-half-year period). |
| | | | | | |
| Portfolio of investments—February 28, 2018 (unaudited) | | Wells Fargo Conservative Income Fund | | | 7 | |
| | | | | | | | | | | | | | | | |
| Security name | | Interest rate | | | Maturity date | | | Principal | | | Value | |
| | | | |
Asset-Backed Securities: 24.54% | | | | | | | | | | | | | | | | |
Bank of the West Auto Trust Series 2017-1 Class A2 144A | | | 1.78 | % | | | 2-15-2021 | | | $ | 2,000,000 | | | $ | 1,991,198 | |
BMW Vehicle Lease Trust Series 2016-2 Class A3 | | | 1.43 | | | | 9-20-2019 | | | | 6,000,000 | | | | 5,968,580 | |
Canadian Pacer Auto Receivables Trust Series 2017-1A Class A2A 144A | | | 1.77 | | | | 12-19-2019 | | | | 1,575,000 | | | | 1,570,255 | |
Cards II Trust Series 2017-1A Class A (1 Month LIBOR +0.37%) 144A± | | | 1.96 | | | | 4-18-2022 | | | | 6,900,000 | | | | 6,912,948 | |
CarMax Auto Owner Trust Series 2017-1 Class A2 | | | 1.54 | | | | 2-18-2020 | | | | 3,173,720 | | | | 3,167,743 | |
CCG Receivables Trust Series 2018-1 Class A1 144A | | | 1.85 | | | | 2-14-2019 | | | | 3,355,000 | | | | 3,355,073 | |
Dell Equipment Finance Trust Series 2017-1 Class A2 144A | | | 1.86 | | | | 6-24-2019 | | | | 1,365,013 | | | | 1,362,470 | |
Dell Equipment Finance Trust Series 2017-2 Class A2A 144A | | | 1.97 | | | | 2-24-2020 | | | | 2,450,000 | | | | 2,439,937 | |
Evergreen Credit Card Trust Series 2016-1 Class A (1 Month LIBOR +0.72%) 144A± | | | 2.31 | | | | 4-15-2020 | | | | 5,000,000 | | | | 5,004,070 | |
Evergreen Credit Card Trust Series 2017-1 Class A (1 Month LIBOR +0.26%) 144A± | | | 1.85 | | | | 10-15-2021 | | | | 3,500,000 | | | | 3,504,995 | |
Ford Credit Auto Lease Trust Series 2017-B Class A2A | | | 1.80 | | | | 6-15-2020 | | | | 4,430,000 | | | | 4,411,114 | |
Ford Credit Auto Owner Trust Series 2016-B Class A3 | | | 1.33 | | | | 10-15-2020 | | | | 1,538,930 | | | | 1,528,833 | |
GM Financial Automobile Leasing Trust Series 2011-1 Class A2A | | | 2.39 | | | | 4-20-2020 | | | | 2,900,000 | | | | 2,895,529 | |
GM Financial Automobile Leasing Trust Series 2016-2 Class A3 | | | 1.62 | | | | 9-20-2019 | | | | 4,639,362 | | | | 4,626,290 | |
GM Financial Automobile Leasing Trust Series 2017-2 Class A2A | | | 1.72 | | | | 1-21-2020 | | | | 920,332 | | | | 916,644 | |
GM Financial Securitized Term Auto Receivables Trust Series 2018-1 Class A2A | | | 2.08 | | | | 1-19-2021 | | | | 1,000,000 | | | | 997,348 | |
Hertz Fleet Lease Funding LP Series 2017-1 Class A1 (1 Month LIBOR +0.65%) 144A± | | | 2.23 | | | | 4-10-2031 | | | | 2,000,000 | | | | 2,001,151 | |
Honda Auto Receivables Owner Trust Series 2018-1 Class A2 | | | 2.36 | | | | 6-15-2020 | | | | 2,000,000 | | | | 1,999,995 | |
Hyundai Auto Lease Securitization Trust Series 2017-C Class A2A 144A | | | 1.89 | | | | 3-16-2020 | | | | 3,150,000 | | | | 3,131,347 | |
Hyundai Auto Lease Securitization Trust Series 2018-A Class A2A 144A | | | 2.55 | | | | 8-17-2020 | | | | 7,000,000 | | | | 6,999,313 | |
John Deere Owner Trust Series 2016-B Class A3 | | | 1.25 | | | | 6-15-2020 | | | | 5,290,000 | | | | 5,252,278 | |
John Deere Owner Trust Series 2018-1A Class A2 | | | 1.95 | | | | 3-15-2019 | | | | 5,000,000 | | | | 5,000,000 | |
Kubota Credit Owner Trust Series 2017-1A Class A2 144A | | | 1.66 | | | | 5-15-2020 | | | | 4,725,000 | | | | 4,700,111 | |
MMAF Equipment Finance LLC Series 2017-B Class A2 144A | | | 1.93 | | | | 10-15-2020 | | | | 6,700,000 | | | | 6,662,255 | |
Nissan Auto Receivables Owner Trust Series 2015-A Class A4 | | | 1.50 | | | | 9-15-2021 | | | | 3,000,000 | | | | 2,978,761 | |
Nissan Auto Receivables Owner Trust Series 2016-A Class A3 | | | 1.34 | | | | 10-15-2020 | | | | 4,908,131 | | | | 4,873,751 | |
Oscar US Funding Trust Series 2016-2A Class A2A 144A | | | 2.31 | | | | 11-15-2019 | | | | 487,238 | | | | 486,110 | |
Oscar US Funding Trust Series 2017-1A Class A2B (1 Month LIBOR +0.80%) 144A± | | | 2.38 | | | | 5-11-2020 | | | | 1,995,390 | | | | 1,997,286 | |
Oscar US Funding Trust Series 2017-2A Class A2A 144A | | | 2.13 | | | | 11-10-2020 | | | | 565,000 | | | | 562,103 | |
Santander Retail Auto Lease Trust Series 2017-A Class A2A 144A | | | 2.02 | | | | 3-20-2020 | | | | 7,700,000 | | | | 7,668,967 | |
TCF Auto Receivables Owner Trust Series 2016-1A Class A 144A | | | 1.93 | | | | 6-15-2022 | | | | 2,938,893 | | | | 2,914,491 | |
Tesla Auto Lease Trust Series 2018-A Class A 144A | | | 2.32 | | | | 12-20-2019 | | | | 1,415,321 | | | | 1,413,918 | |
Tesla Auto Lease Trust Series 2018-A Class C 144A | | | 2.97 | | | | 4-20-2020 | | | | 1,870,000 | | | | 1,867,335 | |
Trillium Credit Card Trust II Series 2016-1A Class A (1 Month LIBOR +0.72%) 144A± | | | 2.34 | | | | 5-26-2021 | | | | 6,650,000 | | | | 6,659,353 | |
Verizon Owner Trust Series 2017-3A Class A1B (1 Month LIBOR +0.27%) 144A± | | | 1.86 | | | | 4-20-2022 | | | | 3,500,000 | | | | 3,507,331 | |
Volvo Financial Equipment LLC Series 2018-1A Class A2 144A | | | 2.26 | | | | 9-15-2020 | | | | 3,335,000 | | | | 3,327,742 | |
| | | | |
Total Asset-Backed Securities (Cost $124,910,536) | | | | | | | | | | | | | | | 124,656,625 | |
| | | | | | | | | | | | | | | | |
| | | | |
Corporate Bonds and Notes: 31.71% | | | | | | | | | | | | | | | | |
| | | | |
Consumer Discretionary: 0.84% | | | | | | | | | | | | | | | | |
| | | | |
| Media: 0.84% | | | | | | | | | | | | | | | | |
NBCUniversal Enterprise Incorporated (3 Month LIBOR +0.69%) 144A± | | | 2.41 | | | | 4-15-2018 | | | | 4,250,000 | | | | 4,252,852 | |
| | | | | | | | | | | | | | | | |
| | | | |
Consumer Staples: 1.42% | | | | | | | | | | | | | | | | |
| | | | |
| Beverages: 1.42% | | | | | | | | | | | | | | | | |
Anheuser-Busch InBev Finance Company | | | 1.90 | | | | 2-1-2019 | | | | 7,250,000 | | | | 7,200,900 | |
| | | | | | | | | | | | | | | | |
The accompanying notes are an integral part of these financial statements.
| | | | |
| 8 | | Wells Fargo Conservative Income Fund | | Portfolio of investments—February 28, 2018 (unaudited) |
| | | | | | | | | | | | | | | | |
| Security name | | Interest rate | | | Maturity date | | | Principal | | | Value | |
| | | | |
Financials: 24.04% | | | | | | | | | | | | | | | | |
| | | | |
| Banks: 6.44% | | | | | | | | | | | | | | | | |
Bank of America Corporation | | | 6.88 | % | | | 11-15-2018 | | | $ | 1,260,000 | | | $ | 1,300,510 | |
Branch Banking & Trust Corporation (3 Month LIBOR +0.57%) ± | | | 2.16 | | | | 6-15-2020 | | | | 2,000,000 | | | | 2,011,947 | |
Branch Banking & Trust Corporation (3 Month LIBOR +0.45%) ± | | | 2.17 | | | | 1-15-2020 | | | | 2,000,000 | | | | 2,008,837 | |
Branch Banking & Trust Corporation (3 Month LIBOR +0.72%) ± | | | 2.44 | | | | 1-15-2020 | | | | 1,830,000 | | | | 1,844,955 | |
Citibank NA (3 Month LIBOR +0.34%) ± | | | 1.97 | | | | 3-20-2019 | | | | 3,000,000 | | | | 3,003,840 | |
Citibank NA (3 Month LIBOR +0.35%) ± | | | 2.19 | | | | 2-12-2021 | | | | 4,000,000 | | | | 3,997,796 | |
HSBC USA Incorporated | | | 2.63 | | | | 9-24-2018 | | | | 2,730,000 | | | | 2,733,477 | |
JPMorgan Chase & Company (3 Month LIBOR +0.29%) ± | | | 2.06 | | | | 2-1-2021 | | | | 3,500,000 | | | | 3,499,755 | |
JPMorgan Chase & Company (3 Month LIBOR +0.84%) ± | | | 2.50 | | | | 3-22-2019 | | | | 4,000,000 | | | | 4,030,518 | |
Manufacturers & Traders Trust Company | | | 2.30 | | | | 1-30-2019 | | | | 2,000,000 | | | | 1,996,924 | |
MUFG Union Bank NA | | | 2.25 | | | | 5-6-2019 | | | | 2,000,000 | | | | 1,987,548 | |
US Bancorp | | | 1.95 | | | | 11-15-2018 | | | | 4,300,000 | | | | 4,291,422 | |
| | | | |
| | | | | | | | | | | | | | | 32,707,529 | |
| | | | | | | | | | | | | | | | |
| | | | |
| Capital Markets: 2.11% | | | | | | | | | | | | | | | | |
Goldman Sachs Group Incorporated (3 Month LIBOR +1.04%) ± | | | 2.79 | | | | 4-25-2019 | | | | 4,000,000 | | | | 4,031,720 | |
Goldman Sachs Group Incorporated (3 Month LIBOR +1.20%) ± | | | 2.97 | | | | 4-30-2018 | | | | 624,000 | | | | 624,945 | |
Morgan Stanley (3 Month LIBOR +0.85%) ± | | | 2.59 | | | | 1-24-2019 | | | | 1,000,000 | | | | 1,005,560 | |
Morgan Stanley (3 Month LIBOR +1.38%) ± | | | 3.15 | | | | 2-1-2019 | | | | 5,000,000 | | | | 5,047,554 | |
| | | | |
| | | | | | | | | | | | | | | 10,709,779 | |
| | | | | | | | | | | | | | | | |
| | | | |
| Consumer Finance: 7.03% | | | | | | | | | | | | | | | | |
American Express Credit Corporation (3 Month LIBOR +0.33%) ± | | | 2.12 | | | | 5-3-2019 | | | | 1,000,000 | | | | 1,001,930 | |
American Express Credit Corporation (3 Month LIBOR +0.55%) ± | | | 2.15 | | | | 3-18-2019 | | | | 9,950,000 | | | | 9,985,627 | |
BMW US Capital LLC (3 Month LIBOR +0.41%) 144A± | | | 2.00 | | | | 9-13-2019 | | | | 4,000,000 | | | | 4,019,080 | |
Caterpillar Financial Services Corporation (3 Month LIBOR +0.13%) ± | | | 1.61 | | | | 11-29-2019 | | | | 5,000,000 | | | | 5,000,773 | |
Caterpillar Financial Services Corporation | | | 1.70 | | | | 6-16-2018 | | | | 2,478,000 | | | | 2,474,363 | |
Daimler Finance North America LLC 144A | | | 1.65 | | | | 3-2-2018 | | | | 1,190,000 | | | | 1,190,000 | |
Daimler Finance North America LLC (3 Month LIBOR +0.53%) 144A± | | | 2.32 | | | | 5-5-2020 | | | | 4,000,000 | | | | 4,015,365 | |
Daimler Finance North America LLC (3 Month LIBOR +0.62%) 144A± | | | 2.39 | | | | 10-30-2019 | | | | 2,000,000 | | | | 2,009,359 | |
Nissan Motor Acceptance Corporation (3 Month LIBOR +0.39%) 144A± | | | 2.11 | | | | 7-13-2020 | | | | 3,000,000 | | | | 3,006,842 | |
Nissan Motor Acceptance Corporation (3 Month LIBOR +1.01%) 144A± | | | 2.53 | | | | 3-8-2019 | | | | 3,000,000 | | | | 3,022,941 | |
| | | | |
| | | | | | | | | | | | | | | 35,726,280 | |
| | | | | | | | | | | | | | | | |
| | | | |
| Insurance: 8.46% | | | | | | | | | | | | | | | | |
Berkshire Hathaway Finance Corporation (3 Month LIBOR +0.55%) ± | | | 2.07 | | | | 3-7-2018 | | | | 7,000,000 | | | | 7,000,569 | |
Jackson National Life Insurance Company 144A | | | 4.70 | | | | 6-1-2018 | | | | 4,800,000 | | | | 4,828,681 | |
Metropolitan Life Global Funding I (3 Month LIBOR +0.22%) 144A± | | | 1.83 | | | | 9-19-2019 | | | | 3,000,000 | | | | 3,005,988 | |
Metropolitan Life Global Funding I (3 Month LIBOR +0.23%) 144A± | | | 1.94 | | | | 1-8-2021 | | | | 1,500,000 | | | | 1,496,028 | |
Metropolitan Life Global Funding I (3 Month LIBOR +0.40%) 144A± | | | 1.95 | | | | 6-12-2020 | | | | 3,000,000 | | | | 3,014,925 | |
Metropolitan Life Global Funding I 144A | | | 3.65 | | | | 6-14-2018 | | | | 575,000 | | | | 577,529 | |
New York Life Global Funding (3 Month LIBOR +0.27%) 144A± | | | 1.97 | | | | 4-9-2020 | | | | 9,250,000 | | | | 9,275,916 | |
Pricoa Global Funding 1 144A | | | 1.90 | | | | 9-21-2018 | | | | 1,795,000 | | | | 1,789,525 | |
Protective Life Global Funding (3 Month LIBOR +0.55%) 144A± | | | 2.07 | | | | 6-8-2018 | | | | 6,000,000 | | | | 6,007,155 | |
Reliance Standard Life Insurance 144A | | | 2.15 | | | | 10-15-2018 | | | | 6,000,000 | | | | 5,993,791 | |
| | | | |
| | | | | | | | | | | | | | | 42,990,107 | |
| | | | | | | | | | | | | | | | |
The accompanying notes are an integral part of these financial statements.
| | | | | | |
| Portfolio of investments—February 28, 2018 (unaudited) | | Wells Fargo Conservative Income Fund | | | 9 | |
| | | | | | | | | | | | | | | | |
| Security name | | Interest rate | | | Maturity date | | | Principal | | | Value | |
| | | | |
Health Care: 2.16% | | | | | | | | | | | | | | | | |
| | | | |
| Biotechnology: 1.37% | | | | | | | | | | | | | | | | |
Gilead Sciences Incorporated | | | 1.85 | % | | | 9-4-2018 | | | $ | 7,000,000 | | | $ | 6,985,416 | |
| | | | | | | | | | | | | | | | |
| | | | |
| Health Care Equipment & Supplies: 0.79% | | | | | | | | | | | | | | | | |
Medtronic Incorporated | | | 1.50 | | | | 3-15-2018 | | | | 4,000,000 | | | | 3,999,184 | |
| | | | | | | | | | | | | | | | |
| | | | |
Information Technology: 0.91% | | | | | | | | | | | | | | | | |
| | | | |
| Semiconductors & Semiconductor Equipment: 0.91% | | | | | | | | | | | | | | | | |
Qualcomm Incorporated (3 Month LIBOR +0.55%) ± | | | 2.43 | | | | 5-20-2020 | | | | 4,600,000 | | | | 4,611,536 | |
| | | | | | | | | | | | | | | | |
| | | | |
Materials: 0.68% | | | | | | | | | | | | | | | | |
| | | | |
| Chemicals: 0.68% | | | | | | | | | | | | | | | | |
Praxair Incorporated | | | 1.25 | | | | 11-7-2018 | | | | 3,500,000 | | | | 3,474,569 | |
| | | | | | | | | | | | | | | | |
| | | | |
Utilities: 1.66% | | | | | | | | | | | | | | | | |
| | | | |
| Electric Utilities: 1.66% | | | | | | | | | | | | | | | | |
Duke Energy Florida LLC | | | 2.10 | | | | 12-15-2019 | | | | 1,425,000 | | | | 1,418,008 | |
Duke Energy Progress LLC (3 Month LIBOR +0.18%) ± | | | 1.70 | | | | 9-8-2020 | | | | 4,000,000 | | | | 4,004,883 | |
PacifiCorp | | | 5.65 | | | | 7-15-2018 | | | | 3,000,000 | | | | 3,035,873 | |
| | | | |
| | | | | | | | | | | | | | | 8,458,764 | |
| | | | | | | | | | | | | | | | |
| | | | |
Total Corporate Bonds and Notes (Cost $161,099,139) | | | | | | | | | | | | | | | 161,116,916 | |
| | | | | | | | | | | | | | | | |
| | | | |
Municipal Obligations: 2.40% | | | | | | | | | | | | | | | | |
| | | | |
| Colorado: 1.18% | | | | | | | | | | | | | | | | |
Colorado Tender Option Bond Trust Receipts/Certificates Series 2017-TPG007 (Health Revenue, Bank of America NA LIQ) 144Aø | | | 2.09 | | | | 10-29-2027 | | | | 6,000,000 | | | | 6,000,000 | |
| | | | | | | | | | | | | | | | |
| | | | |
| Kentucky: 0.92% | | | | | | | | | | | | | | | | |
Louisville Jefferson County KY Metropolitan Government Series A (GO Revenue) | | | 1.95 | | | | 12-1-2018 | | | | 4,690,000 | | | | 4,677,431 | |
| | | | | | | | | | | | | | | | |
| | | | |
| Texas: 0.30% | | | | | | | | | | | | | | | | |
Houston Texas Taxable Pension Obligation (GO Revenue) | | | 2.20 | | | | 3-1-2019 | | | | 1,500,000 | | | | 1,495,380 | |
| | | | | | | | | | | | | | | | |
| | | | |
Total Municipal Obligations (Cost $12,190,000) | | | | | | | | | | | | | | | 12,172,811 | |
| | | | | | | | | | | | | | | | |
| | | | |
Yankee Corporate Bonds and Notes: 19.04% | | | | | | | | | | | | | | | | |
| | | | |
Consumer Staples: 1.61% | | | | | | | | | | | | | | | | |
| | | | |
| Tobacco: 1.61% | | | | | | | | | | | | | | | | |
Japan Tobacco Incorporated 144A | | | 2.10 | | | | 7-23-2018 | | | | 8,200,000 | | | | 8,196,548 | |
| | | | | | | | | | | | | | | | |
| | | | |
Energy: 1.83% | | | | | | | | | | | | | | | | |
| | | | |
| Oil, Gas & Consumable Fuels: 1.83% | | | | | | | | | | | | | | | | |
BP Capital Markets plc (3 Month LIBOR +0.35%) ± | | | 2.18 | | | | 8-14-2018 | | | | 6,650,000 | | | | 6,657,474 | |
BP Capital Markets plc | | | 2.50 | | | | 12-10-2018 | | | | 2,640,000 | | | | 2,642,651 | |
| | | | |
| | | | | | | | | | | | | | | 9,300,125 | |
| | | | | | | | | | | | | | | | |
The accompanying notes are an integral part of these financial statements.
| | | | |
| 10 | | Wells Fargo Conservative Income Fund | | Portfolio of investments—February 28, 2018 (unaudited) |
| | | | | | | | | | | | | | | | |
| Security name | | Interest rate | | | Maturity date | | | Principal | | | Value | |
| | | | |
Financials: 15.60% | | | | | | | | | | | | | | | | |
| | | | |
| Banks: 12.60% | | | | | | | | | | | | | | | | |
ABN AMRO Bank NV 144A | | | 2.10 | % | | | 1-18-2019 | | | $ | 5,000,000 | | | $ | 4,978,575 | |
ABN AMRO Bank NV 144A | | | 2.50 | | | | 10-30-2018 | | | | 2,000,000 | | | | 2,000,694 | |
Australia & New Zealand Banking Group (3 Month LIBOR +0.32%) 144A± | | | 2.12 | | | | 11-9-2020 | | | | 1,000,000 | | | | 1,000,625 | |
Bank of Tokyo-Mitsubishi UFJ Limited (3 Month LIBOR +1.02%) 144A± | | | 2.59 | | | | 9-14-2018 | | | | 1,250,000 | | | | 1,255,722 | |
Banque Federative du Credit Mutuel SA (3 Month LIBOR +0.49%) 144A± | | | 2.23 | | | | 7-20-2020 | | | | 1,500,000 | | | | 1,507,696 | |
Barclays Bank plc (3 Month LIBOR +0.46%) ± | | | 2.16 | | | | 1-11-2021 | | | | 5,000,000 | | | | 5,009,835 | |
BNZ International Funding of London (3 Month LIBOR +0.70%) 144A± | | | 2.59 | | | | 2-21-2020 | | | | 1,750,000 | | | | 1,761,606 | |
Canadian Imperial Bank of Commerce (3 Month LIBOR +0.32%) ± | | | 2.09 | | | | 2-2-2021 | | | | 2,000,000 | | | | 2,001,648 | |
Commonwealth Bank of Australia (3 Month LIBOR +0.40%) 144A± | | | 2.00 | | | | 9-18-2020 | | | | 3,000,000 | | | | 3,007,530 | |
ING Bank NV (3 Month LIBOR +0.61%) 144A± | | | 2.45 | | | | 8-15-2019 | | | | 3,600,000 | | | | 3,617,139 | |
National Australia Bank (3 Month LIBOR +0.35%) 144A± | | | 2.06 | | | | 1-12-2021 | | | | 2,000,000 | | | | 2,000,885 | |
National Australia Bank (3 Month LIBOR +0.69%) 144A± | | | 2.23 | | | | 12-9-2019 | | | | 2,200,000 | | | | 2,216,153 | |
National Australia Bank (3 Month LIBOR +0.51%) 144A± | | | 2.41 | | | | 5-22-2020 | | | | 1,000,000 | | | | 1,004,436 | |
Nordea Bank AB (3 Month LIBOR +0.47%) 144A± | | | 1.95 | | | | 5-29-2020 | | | | 5,000,000 | | | | 5,021,922 | |
Rabobank Nederland NV (3 Month LIBOR +0.51%) ± | | | 2.31 | | | | 8-9-2019 | | | | 3,000,000 | | | | 3,013,961 | |
Santander UK Group Holdings plc (3 Month LIBOR +0.30%) ± | | | 2.09 | | | | 11-3-2020 | | | | 3,000,000 | | | | 2,998,328 | |
Santander UK Group Holdings plc | | | 2.00 | | | | 8-24-2018 | | | | 3,000,000 | | | | 2,995,544 | |
Sumitomo Mitsui Banking Corporation (3 Month LIBOR +0.31%) ± | | | 2.04 | | | | 10-18-2019 | | | | 4,600,000 | | | | 4,604,416 | |
Sumitomo Mitsui Banking Corporation (3 Month LIBOR +0.54%) ± | | | 2.24 | | | | 1-11-2019 | | | | 2,000,000 | | | | 2,006,158 | |
Sumitomo Mitsui Trust Bank Limited (3 Month LIBOR +0.91%) 144A± | | | 2.64 | | | | 10-18-2019 | | | | 6,000,000 | | | | 6,048,760 | |
The Bank of Nova Scotia (3 Month LIBOR +0.29%) ± | | | 1.99 | | | | 1-8-2021 | | | | 1,000,000 | | | | 999,747 | |
Westpac Banking Corporation (3 Month LIBOR +0.34%) ± | | | 2.09 | | | | 1-25-2021 | | | | 5,000,000 | | | | 5,008,202 | |
| | | | |
| | | | | | | | | | | | | | | 64,059,582 | |
| | | | | | | | | | | | | | | | |
| | | | |
| Capital Markets: 1.42% | | | | | | | | | | | | | | | | |
Siemens Financieringsmaatschappij NV (3 Month LIBOR +0.32%) 144A± | | | 1.88 | | | | 9-13-2019 | | | | 4,610,000 | | | | 4,626,732 | |
Siemens Financieringsmaatschappij NV (3 Month LIBOR +0.34%) 144A± | | | 1.94 | | | | 3-16-2020 | | | | 2,560,000 | | | | 2,571,857 | |
| | | | |
| | | | | | | | | | | | | | | 7,198,589 | |
| | | | | | | | | | | | | | | | |
| | | | |
| Diversified Financial Services: 1.58% | | | | | | | | | | | | | | | | |
UBS AG (3 Month LIBOR +0.48%) 144A± | | | 1.96 | | | | 12-1-2020 | | | | 4,000,000 | | | | 4,006,488 | |
UBS AG (3 Month LIBOR +0.58%) 144A± | | | 2.10 | | | | 6-8-2020 | | | | 4,000,000 | | | | 4,018,224 | |
| | | | |
| | | | | | | | | | | | | | | 8,024,712 | |
| | | | | | | | | | | | | | | | |
| | | | |
Total Yankee Corporate Bonds and Notes (Cost $96,608,280) | | | | | | | | | | | | | | | 96,779,556 | |
| | | | | | | | | | | | | | | | |
| | | | |
Yankee Government Bonds: 1.03% | | | | | | | | | | | | | | | | |
Export-Import Bank of Korea (3 Month LIBOR +0.70%) ± | | | 2.64 | | | | 5-26-2019 | | | | 4,000,000 | | | | 4,007,720 | |
Export-Import Bank of Korea | | | 2.88 | | | | 9-17-2018 | | | | 1,200,000 | | | | 1,200,802 | |
| | | | |
Total Yankee Government Bonds (Cost $5,206,759) | | | | | | | | | | | | | | | 5,208,522 | |
| | | | | | | | | | | | | | | | |
| | | | |
Short-Term Investments: 20.68% | | | | | | | | | | | | | | | | |
| | | | |
| Certificates of Deposit: 1.28% | | | | | | | | | | | | | | | | |
Barclays Bank plc (1 Month LIBOR +0.50%) ± | | | 2.08 | | | | 4-3-2018 | | | | 3,000,000 | | | | 3,001,815 | |
Credit Suisse | | | 2.82 | | | | 3-8-2018 | | | | 3,500,000 | | | | 3,500,338 | |
| | | | |
| | | | | | | | | | | | | | | 6,502,153 | |
| | | | | | | | | | | | | | | | |
The accompanying notes are an integral part of these financial statements.
| | | | | | |
| Portfolio of investments—February 28, 2018 (unaudited) | | Wells Fargo Conservative Income Fund | | | 11 | |
| | | | | | | | | | | | | | | | |
| Security name | | Interest rate | | | Maturity date | | | Principal | | | Value | |
| | | | |
| Commercial Paper: 19.39% | | | | | | | | | | | | | | | | |
Anglesea Funding LLC 144A(p)(z) | | | 1.50 | % | | | 4-3-2018 | | | $ | 11,000,000 | | | $ | 10,982,681 | |
Atlantic Asset Securitization LLC (p)(z) | | | 1.66 | | | | 4-9-2018 | | | | 6,000,000 | | | | 5,988,087 | |
Atlantic Asset Securitization LLC 144A(p)(z) | | | 1.78 | | | | 5-15-2018 | | | | 2,600,000 | | | | 2,589,127 | |
Atlantic Asset Securitization LLC 144A(p)(z) | | | 1.89 | | | | 5-14-2018 | | | | 2,000,000 | | | | 1,991,771 | |
AXA Financial Incorporated 144A(z) | | | 1.69 | | | | 3-15-2018 | | | | 5,650,000 | | | | 5,645,787 | |
CNPC Finance Hong Kong Limited 144A(z) | | | 1.85 | | | | 3-13-2018 | | | | 9,750,000 | | | | 9,744,613 | |
CRC Funding LLC 144A(p)(z) | | | 1.42 | | | | 3-12-2018 | | | | 2,000,000 | | | | 1,998,990 | |
CRC Funding LLC 144A(p)(z) | | | 1.76 | | | | 5-10-2018 | | | | 3,500,000 | | | | 3,486,726 | |
Fairway Finance Corporation 144A(p)(z) | | | 1.79 | | | | 4-24-2018 | | | | 3,000,000 | | | | 2,991,553 | |
Gotham Funding Corporation 144A(p)(z) | | | 1.54 | | | | 3-20-2018 | | | | 1,900,000 | | | | 1,898,330 | |
La Fayette Asset Securitization LLC 144A(p)(z) | | | 1.57 | | | | 3-22-2018 | | | | 4,000,000 | | | | 3,996,052 | |
La Fayette Asset Securitization LLC 144A(p)(z) | | | 1.76 | | | | 5-3-2018 | | | | 7,600,000 | | | | 7,574,661 | |
LMA Americas LLC 144A(p)(z) | | | 1.64 | | | | 5-3-2018 | | | | 5,000,000 | | | | 4,982,969 | |
LMA Americas LLC 144A(p)(z) | | | 1.67 | | | | 4-11-2018 | | | | 1,000,000 | | | | 997,954 | |
Old Line Funding LLC (1 Month LIBOR +0.20%) 144A(p)(z) | | | 1.78 | | | | 11-9-2018 | | | | 7,000,000 | | | | 6,998,124 | |
Old Line Funding LLC 144A(p)(z) | | | 1.83 | | | | 5-16-2018 | | | | 1,900,000 | | | | 1,891,974 | |
Starbird Funding Corporation 144A(p)(z) | | | 1.62 | | | | 4-16-2018 | | | | 1,400,000 | | | | 1,396,745 | |
Thunder Bay Funding LLC 144A(p)(z) | | | 2.04 | | | | 6-22-2018 | | | | 5,000,000 | | | | 4,966,940 | |
Toyota Industries Commercial Finance Incorporated 144A(z) | | | 2.12 | | | | 11-1-2018 | | | | 7,000,000 | | | | 6,894,719 | |
Versailles Cds LLC 144A(p)(z) | | | 1.71 | | | | 4-11-2018 | | | | 3,500,000 | | | | 3,492,675 | |
Victory Receivables 144A(p)(z) | | | 1.78 | | | | 4-30-2018 | | | | 7,000,000 | | | | 6,977,974 | |
White Plains Capital 144A(z) | | | 1.71 | | | | 3-13-2018 | | | | 1,000,000 | | | | 999,335 | |
| | | | |
| | | | | | | | | | | | | | | 98,487,787 | |
| | | | | | | | | | | | | | | | |
| | | | |
| | | Yield | | | | | | Shares | | | | |
| Investment Companies: 0.01% | | | | | | | | | | | | | | | | |
Wells Fargo Government Money Market Fund Select Class (l)(u) | | | 1.29 | | | | | | | | 56,620 | | | | 56,620 | |
| | | | | | | | | | | | | | | | |
| | | | |
Total Short-Term Investments (Cost $105,064,069) | | | | | | | | | | | | | | | 105,046,560 | |
| | | | | | | | | | | | | | | | |
| | | | | | | | |
| Total investments in securities (Cost $505,078,783) | | | 99.40 | % | | | 504,980,990 | |
Other assets and liabilities, net | | | 0.60 | | | | 3,033,682 | |
| | | | | | | | |
| Total net assets | | | 100.00 | % | | $ | 508,014,672 | |
| | | | | | | | |
| 144A | The security may be resold in transactions exempt from registration, normally to qualified institutional buyers, pursuant to Rule 144A under the Securities Act of 1933. |
| ± | Variable rate investment. The rate shown is the rate in effect at period end. |
| ø | Variable rate demand notes are subject to a demand feature which reduces the effective maturity. The maturity date shown represents the final maturity date of the security. The interest rate is determined and reset by the issuer daily, weekly, or monthly depending upon the terms of the security. The rate shown is the rate in effect at period end. |
| (p) | Asset-backed commercial paper |
| (z) | Zero coupon security. The rate represents the current yield to maturity. |
| (l) | The issuer of the security is an affiliated person of the Fund as defined in the Investment Company Act of 1940. |
| (u) | The rate represents the 7-day annualized yield at period end. |
The accompanying notes are an integral part of these financial statements.
| | | | |
| 12 | | Wells Fargo Conservative Income Fund | | Portfolio of investments—February 28, 2018 (unaudited) |
Investments in Affiliates
An affiliated investment is an investment in which the Fund owns at least 5% of the outstanding voting shares of the issuer or as a result of other relationships, such as the Fund and the issuer having the same investment manager. Transactions with issuers that were either affiliated persons of the Fund at the beginning of the period or the end of the period were as follows:
| | | | | | | | | | | | | | | | | | | | | | | | | | | | | | | | | | | | |
| | | Shares,
beginning of
period | | | Shares
purchased | | | Shares
sold | | | Shares,
end of
period | | | Net
realized
gains
(losses) | | | Net
change in
unrealized
gains
(losses) | | | Income
from
affiliated
securities | | | Value,
end
of period | | | % of
net
assets | |
Short-Term Investments | | | | | | | | | | | | | | | | | | | | | | | | | | | | | | | | | | | | |
Investment Companies | | | | | | | | | | | | | | | | | | | | | | | | | | | | | | | | | | | | |
Wells Fargo Government Money Market Fund Select Class | | | 275,037 | | | | 141,238,283 | | | | 141,456,700 | | | | 56,620 | | | $ | 0 | | | $ | 0 | | | $ | 8,156 | | | $ | 56,620 | | | | 0.01 | % |
The accompanying notes are an integral part of these financial statements.
| | | | | | |
| Statement of assets and liabilities—February 28, 2018 (unaudited) | | Wells Fargo Conservative Income Fund | | | 13 | |
| | | | |
| | | | |
| |
Assets | | | | |
Investments in unaffiliated securities, at value (cost $505,022,163) | | $ | 504,924,370 | |
Investments in affiliated securities, at value (cost $56,620) | | | 56,620 | |
Receivable for investments sold | | | 1,051,013 | |
Receivable for Fund shares sold | | | 4,149,000 | |
Receivable for interest | | | 1,162,303 | |
Prepaid expenses and other assets | | | 49,122 | |
| | | | |
Total assets | | | 511,392,428 | |
| | | | |
| |
Liabilities | | | | |
Payable for investments purchased | | | 3,059,128 | |
Payable for Fund shares redeemed | | | 133,527 | |
Dividends payable | | | 73,984 | |
Management fee payable | | | 63,767 | |
Administration fee payable | | | 31,954 | |
Trustees’ fees and expenses payable | | | 1,715 | |
Accrued expenses and other liabilities | | | 13,681 | |
| | | | |
Total liabilities | | | 3,377,756 | |
| | | | |
Total net assets | | $ | 508,014,672 | |
| | | | |
| |
NET ASSETS CONSIST OF | | | | |
Paid-in capital | | $ | 508,560,490 | |
Undistributed net investment income | | | 4,600 | |
Accumulated net realized losses on investments | | | (452,625 | ) |
Net unrealized losses on investments | | | (97,793 | ) |
| | | | |
Total net assets | | $ | 508,014,672 | |
| | | | |
| |
COMPUTATION OF NET ASSET VALUE PER SHARE | | | | |
Net assets – Institutional Class | | $ | 508,014,672 | |
Shares outstanding – Institutional Class1 | | | 50,858,642 | |
Net asset value per share – Institutional Class | | | $9.99 | |
| 1 | The Fund has an unlimited number of authorized shares. |
The accompanying notes are an integral part of these financial statements.
| | | | |
| 14 | | Wells Fargo Conservative Income Fund | | Statement of operations—six months ended February 28, 2018 (unaudited) |
| | | | |
| | | | |
| |
Investment income | | | | |
Interest (net of foreign interest withholding taxes of $913) | | $ | 4,430,916 | |
Income from affiliated securities | | | 8,156 | |
| | | | |
Total investment income | | | 4,439,072 | |
| | | | |
| |
Expenses | | | | |
Management fee | | | 632,651 | |
Administration fee | | | | |
Institutional Class | | | 202,448 | |
Custody and accounting fees | | | 14,478 | |
Professional fees | | | 20,086 | |
Registration fees | | | 31,916 | |
Shareholder report expenses | | | 1,082 | |
Trustees’ fees and expenses | | | 7,972 | |
Other fees and expenses | | | 2,836 | |
| | | | |
Total expenses | | | 913,469 | |
Less: Fee waivers and/or expense reimbursements | | | (230,206 | ) |
| | | | |
Net expenses | | | 683,263 | |
| | | | |
Net investment income | | | 3,755,809 | |
| | | | |
| |
REALIZED AND UNREALIZED GAINS (LOSSES) ON INVESTMENTS | | | | |
Net realized losses on investments | | | (452,208 | ) |
Net change in unrealized gains (losses) on investments | | | (780,307 | ) |
| | | | |
Net realized and unrealized gains (losses) on investments | | | (1,232,515 | ) |
| | | | |
Net increase in net assets resulting from operations | | $ | 2,523,294 | |
| | | | |
The accompanying notes are an integral part of these financial statements.
| | | | | | |
| Statement of changes in net assets | | Wells Fargo Conservative Income Fund | | | 15 | |
| | | | | | | | | | | | | | | | |
| | | Six months ended
February 28, 2018 (unaudited) | | | Year ended
August 31, 2017 | |
| | | | |
Operations | | | | | | | | | | | | | | | | |
Net investment income | | | | | | $ | 3,755,809 | | | | | | | $ | 5,763,414 | |
Net realized gains (losses) on investments | | | | | | | (452,208 | ) | | | | | | | 376,009 | |
Net change in unrealized gains (losses) on investments | | | | | | | (780,307 | ) | | | | | | | (76,758 | ) |
| | | | |
Net increase in net assets resulting from operations | | | | | | | 2,523,294 | | | | | | | | 6,062,665 | |
| | | | |
| | | | |
Distributions to shareholders from | | | | | | | | | | | | | | | | |
Net investment income – Institutional Class | | | | | | | (3,756,303 | ) | | | | | | | (5,765,706 | ) |
Net realized gains – Institutional Class | | | | | | | (148,163 | ) | | | | | | | 0 | |
| | | | |
Total distributions to shareholders | | | | | | | (3,904,466 | ) | | | | | | | (5,765,706 | ) |
| | | | |
| | | | |
Capital share transactions | | | Shares | | | | | | | | Shares | | | | | |
Proceeds from shares sold – Institutional Class | | | 37,136,629 | | | | 371,621,639 | | | | 32,361,100 | | | | 323,882,718 | |
Reinvestment of distributions – Institutional Class | | | 329,189 | | | | 3,292,027 | | | | 500,446 | | | | 5,007,754 | |
Payment for shares redeemed – Institutional Class | | | (28,468,633 | ) | | | (284,756,862 | ) | | | (45,740,798 | ) | | | (457,777,428 | ) |
| | | | |
Net increase (decrease) in net assets resulting from capital share transactions | | | | | | | 90,156,804 | | | | | | | | (128,886,956 | ) |
| | | | |
Total increase (decrease) in net assets | | | | | | | 88,775,632 | | | | | | | | (128,589,997 | ) |
| | | | |
| | | | |
Net assets | | | | | | | | | | | | | | | | |
Beginning of period | | | | | | | 419,239,040 | | | | | | | | 547,829,037 | |
| | | | |
End of period | | | | | | $ | 508,014,672 | | | | | | | $ | 419,239,040 | |
| | | | |
Undistributed net investment income | | | | | | $ | 4,600 | | | | | | | $ | 5,094 | |
| | | | |
The accompanying notes are an integral part of these financial statements.
| | | | |
| 16 | | Wells Fargo Conservative Income Fund | | Financial highlights |
(For a share outstanding throughout each period)
| | | | | | | | | | | | | | | | | | | | | | | | |
| | | Six months ended
February 28, 2018 (unaudited) | | | Year ended August 31 | |
| INSTITUTIONAL CLASS | | | 2017 | | | 2016 | | | 2015 | | | 2014 | | | 20131 | |
Net asset value, beginning of period | | | $10.01 | | | | $10.01 | | | | $10.00 | | | | $10.02 | | | | $9.99 | | | | $10.00 | |
Net investment income | | | 0.07 | | | | 0.12 | | | | 0.07 | | | | 0.05 | | | | 0.04 | | | | 0.01 | |
Net realized and unrealized gains (losses) on investments | | | (0.02 | ) | | | 0.00 | 2 | | | 0.01 | | | | (0.02 | ) | | | 0.03 | | | | (0.01 | ) |
| | | | | | | | | | | | | | | | | | | | | | | | |
Total from investment operations | | | 0.05 | | | | 0.12 | | | | 0.08 | | | | 0.03 | | | | 0.07 | | | | 0.00 | |
Distributions to shareholders from | | | | | | | | | | | | | | | | | | | | | | | | |
Net investment income | | | (0.07 | ) | | | (0.12 | ) | | | (0.07 | ) | | | (0.05 | ) | | | (0.04 | ) | | | (0.01 | ) |
Net realized gains | | | (0.00 | )2 | | | 0.00 | | | | 0.00 | | | | (0.00 | )2 | | | (0.00 | )2 | | | 0.00 | |
| | | | | | | | | | | | | | | | | | | | | | | | |
Total distributions to shareholders | | | (0.07 | ) | | | (0.12 | ) | | | (0.07 | ) | | | (0.05 | ) | | | (0.04 | ) | | | (0.01 | ) |
Net asset value, end of period | | | $9.99 | | | | $10.01 | | | | $10.01 | | | | $10.00 | | | | $10.02 | | | | $9.99 | |
Total return3 | | | 0.56 | % | | | 1.20 | % | | | 0.79 | % | | | 0.28 | % | | | 0.74 | % | | | 0.01 | % |
Ratios to average net assets (annualized) | | | | | | | | | | | | | | | | | | | | | | | | |
Gross expenses | | | 0.36 | % | | | 0.36 | % | | | 0.36 | % | | | 0.38 | % | | | 0.43 | % | | | 0.74 | % |
Net expenses | | | 0.27 | % | | | 0.27 | % | | | 0.27 | % | | | 0.27 | % | | | 0.27 | % | | | 0.27 | % |
Net investment income | | | 1.48 | % | | | 1.17 | % | | | 0.72 | % | | | 0.48 | % | | | 0.44 | % | | | 0.44 | % |
Supplemental data | | | | | | | | | | | | | | | | | | | | | | | | |
Portfolio turnover rate | | | 97 | % | | | 197 | % | | | 269 | % | | | 80 | % | | | 55 | % | | | 10 | % |
Net assets, end of period (000s omitted) | | | $508,015 | | | | $419,239 | | | | $547,829 | | | | $336,608 | | | | $143,418 | | | | $49,983 | |
| 1 | For the period from May 31, 2013 (commencement of class operations) to August 31, 2013 |
| 2 | Amount is less than $0.005. |
| 3 | Returns for periods of less than one year are not annualized. |
The accompanying notes are an integral part of these financial statements.
| | | | | | |
| Notes to financial statements (unaudited) | | Wells Fargo Conservative Income Fund | | | 17 | |
1. ORGANIZATION
Wells Fargo Funds Trust (the “Trust”), a Delaware statutory trust organized on March 10, 1999, is an open-end management investment company registered under the Investment Company Act of 1940, as amended (the “1940 Act”). As an investment company, the Trust follows the accounting and reporting guidance in Financial Accounting Standards Board Accounting Standards Codification Topic 946, Financial Services – Investment Companies. These financial statements report on the Wells Fargo Conservative Income Fund (the “Fund”) which is a diversified series of the Trust.
2. SIGNIFICANT ACCOUNTING POLICIES
The following significant accounting policies, which are consistently followed in the preparation of the financial statements of the Fund, are in conformity with U.S. generally accepted accounting principles which require management to make estimates and assumptions that affect the reported amounts of assets and liabilities, disclosure of contingent assets and liabilities at the date of the financial statements, and the reported amounts of revenues and expenses during the reporting period. Actual results could differ from those estimates.
Securities valuation
All investments are valued each business day as of the close of regular trading on the New York Stock Exchange (generally 4 p.m. Eastern Time), although the Fund may deviate from this calculation time under unusual or unexpected circumstances.
Debt securities are valued at the evaluated bid price provided by an independent pricing service or, if a reliable price is not available, the quoted bid price from an independent broker-dealer.
Futures that are listed on a foreign or domestic exchange or market are valued at the official closing price or, if none, the last sales price.
Investments in registered open-end investment companies are valued at net asset value.
Investments which are not valued using any of the methods discussed above are valued at their fair value, as determined in good faith by the Board of Trustees of the Fund. The Board of Trustees has established a Valuation Committee comprised of the Trustees and has delegated to it the authority to take any actions regarding the valuation of portfolio securities that the Valuation Committee deems necessary or appropriate, including determining the fair value of portfolio securities, unless the determination has been delegated to the Wells Fargo Asset Management Pricing Committee at Wells Fargo Funds Management, LLC (“Funds Management”). The Board of Trustees retains the authority to make or ratify any valuation decisions or approve any changes to the Valuation Procedures as it deems appropriate. On a quarterly basis, the Board of Trustees receives reports on any valuation actions taken by the Valuation Committee or the Wells Fargo Asset Management Pricing Committee which may include items for ratification.
Valuations of fair valued securities are compared to the next actual sales price when available, or other appropriate market values, to assess the continued appropriateness of the fair valuation methodologies used. These securities are fair valued on a day-to-day basis, taking into consideration changes to appropriate market information and any significant changes to the inputs considered in the valuation process until there is a readily available price provided on an exchange or by an independent pricing service. Valuations received from an independent pricing service or independent broker-dealer quotes are periodically validated by comparisons to most recent trades and valuations provided by other independent pricing services in addition to the review of prices by the manager and/or subadviser. Unobservable inputs used in determining fair valuations are identified based on the type of security, taking into consideration factors utilized by market participants in valuing the investment, knowledge about the issuer and the current market environment.
When-issued transactions
The Fund may purchase securities on a forward commitment or when-issued basis. The Fund records a when-issued transaction on the trade date and will segregate assets in an amount at least equal in value to the Fund’s commitment to purchase when-issued securities. Securities purchased on a when-issued basis are marked-to-market daily and the Fund begins earning interest on the settlement date. Losses may arise due to changes in the market value of the underlying securities or if the counterparty does not perform under the contract.
Futures contracts
The Fund is subject to interest rate risk in the normal course of pursuing its investment objectives. The Fund may buy and sell futures contracts in order to gain exposure to, or protect against, changes in interest rates. The primary risks associated with the use of futures contracts are the imperfect correlation between changes in market values of securities held by the Fund and the prices of futures contracts, and the possibility of an illiquid market.
| | | | |
| 18 | | Wells Fargo Conservative Income Fund | | Notes to financial statements (unaudited) |
The aggregate principal amounts of the contracts are not recorded in the financial statements. Fluctuations in the value of the contracts are recorded in the Statement of Assets and Liabilities as an asset or liability and in the Statement of Operations as unrealized gains or losses until the contracts are closed, at which point they are recorded as net realized gains or losses on futures contracts. With futures contracts, there is minimal counterparty risk to the Fund since futures are exchange traded and the exchange’s clearinghouse, as counterparty to all exchange traded futures, guarantees the futures against default.
Security transactions and income recognition
Securities transactions are recorded on a trade date basis. Realized gains or losses are recorded on the basis of identified cost.
Interest income is accrued daily and bond discounts are accreted and premiums are amortized daily. To the extent debt obligations are placed on non-accrual status, any related interest income may be reduced by writing off interest receivables when the collection of all or a portion of interest has been determined to be doubtful based on consistently applied procedures and the fair value has decreased. If the issuer subsequently resumes interest payments or when the collectability of interest is reasonably assured, the debt obligation is removed from non-accrual status.
Income from foreign securities is recorded net of foreign taxes withheld where recovery of such taxes is not assured.
Distributions to shareholders
Distributions to shareholders from net investment income are declared daily and paid monthly. Distributions from net realized gains, if any, are recorded on the ex-dividend date and paid at least annually. Such distributions are determined in accordance with income tax regulations and may differ from U.S. generally accepted accounting principles. Dividend sources are estimated at the time of declaration. The tax character of distributions is determined as of the Fund’s fiscal year end. Therefore, a portion of the Fund’s distributions made prior to the Fund’s fiscal year end may be categorized as a tax return of capital at year end.
Federal and other taxes
The Fund intends to continue to qualify as a regulated investment company by distributing substantially all of its investment company taxable income and any net realized capital gains (after reduction for capital loss carryforwards) sufficient to relieve it from all, or substantially all, federal income taxes. Accordingly, no provision for federal income taxes was required.
The Fund’s income and federal excise tax returns and all financial records supporting those returns for the prior three fiscal years are subject to examination by the federal and Delaware revenue authorities. Management has analyzed the Fund’s tax positions taken on federal, state, and foreign tax returns for all open tax years and does not believe that there are any uncertain tax positions that require recognition of a tax liability.
As of February 28, 2018, the aggregate cost of all investments for federal income tax purposes was $505,078,682 and the unrealized gains (losses) consisted of:
| | | | |
Gross unrealized gains | | $ | 491,849 | |
Gross unrealized losses | | | (589,541 | ) |
Net unrealized losses | | $ | (97,692 | ) |
3. FAIR VALUATION MEASUREMENTS
Fair value measurements of investments are determined within a framework that has established a fair value hierarchy based upon the various data inputs utilized in determining the value of the Fund’s investments. The three-level hierarchy gives the highest priority to unadjusted quoted prices in active markets for identical assets or liabilities (Level 1) and the lowest priority to unobservable inputs (Level 3). The Fund’s investments are classified within the fair value hierarchy based on the lowest level of input that is significant to the fair value measurement. The inputs are summarized into three broad levels as follows:
| ∎ | | Level 1 – quoted prices in active markets for identical securities |
| ∎ | | Level 2 – other significant observable inputs (including quoted prices for similar securities, interest rates, prepayment speeds, credit risk, etc.) |
| ∎ | | Level 3 – significant unobservable inputs (including the Fund’s own assumptions in determining the fair value of investments) |
| | | | | | |
| Notes to financial statements (unaudited) | | Wells Fargo Conservative Income Fund | | | 19 | |
The inputs or methodologies used for valuing investments in securities are not necessarily an indication of the risk associated with investing in those securities.
The following is a summary of the inputs used in valuing the Fund’s assets and liabilities as of February 28, 2018:
| | | | | | | | | | | | | | | | |
| | | Quoted prices
(Level 1) | | | Other significant
observable inputs
(Level 2) | | | Significant
unobservable inputs (Level 3) | | | Total | |
Assets | | | | | | | | | | | | | | | | |
Investments in: | | | | | | | | | | | | | | | | |
| | | | |
Asset-backed securities | | $ | 0 | | | $ | 124,656,625 | | | $ | 0 | | | $ | 124,656,625 | |
| | | | |
Corporate bonds and notes | | | 0 | | | | 161,116,916 | | | | 0 | | | | 161,116,916 | |
| | | | |
Municipal obligations | | | 0 | | | | 12,172,811 | | | | 0 | | | | 12,172,811 | |
| | | | |
Yankee corporate bonds and notes | | | 0 | | | | 96,779,556 | | | | 0 | | | | 96,779,556 | |
| | | | |
Yankee government bonds | | | 0 | | | | 5,208,522 | | | | 0 | | | | 5,208,522 | |
| | | | |
Short-term investments | | | | | | | | | | | | | | | | |
Certificates of deposit | | | 0 | | | | 6,502,153 | | | | 0 | | | | 6,502,153 | |
Commercial paper | | | 0 | | | | 98,487,787 | | | | 0 | | | | 98,487,787 | |
Investment companies | | | 56,620 | | | | 0 | | | | 0 | | | | 56,620 | |
Total assets | | $ | 56,620 | | | $ | 504,924,370 | | | $ | 0 | | | $ | 504,980,990 | |
The Fund recognizes transfers between levels within the fair value hierarchy at the end of the reporting period. At February 28, 2018, the Fund did not have any transfers into/out of Level 1, Level 2, or Level 3.
4. TRANSACTIONS WITH AFFILIATES
Management fee
Funds Management, an indirect wholly owned subsidiary of Wells Fargo & Company (“Wells Fargo”), is the manager of the Fund and provides advisory and fund-level administrative services under an investment management agreement. Under the investment management agreement, Funds Management is responsible for, among other services, implementing the investment objectives and strategies of the Fund, supervising the subadviser, providing fund-level administrative services in connection with the Fund’s operations, and providing any other fund-level administrative services reasonably necessary for the operation of the Fund. As compensation for its services under the investment management agreement, Funds Management is entitled to receive an annual management fee starting at 0.25% and declining to 0.18% as the average daily net assets of the Fund increase. For the six months ended February 28, 2018, the management fee was equivalent to an annual rate of 0.25% of the Fund’s average daily net assets.
Funds Management has retained the services of a subadviser to provide daily portfolio management to the Fund. The fee for subadvisory services is borne by Funds Management. Wells Capital Management Incorporated, an affiliate of Funds Management and an indirect wholly owned subsidiary of Wells Fargo, is the subadviser to the Fund and is entitled to receive a fee from Funds Management at an annual rate starting at 0.10% and declining to 0.05% as the average daily net assets of the Fund increase.
Administration fee
Under a class-level administration agreement, Funds Management provides class-level administrative services to the Fund, which includes paying fees and expenses for services provided by the transfer agent, sub-transfer agents, omnibus account servicers and record-keepers. As compensation for its services under the class-level administration agreement, Funds Management receives an annual fee of 0.08% which is calculated based on the average daily net assets of the Institutional Class.
Funds Management has contractually waived and/or reimbursed management and administration fees to the extent necessary to maintain certain net operating expense ratios for the Fund. Waiver of fees and/or reimbursement of expenses by Funds Management were made first from fund level expenses on a proportionate basis and then from class specific expenses. Funds Management has committed through December 31, 2018 to waive fees and/or reimburse expenses to the extent necessary to cap the Fund’s expenses at 0.27% for Institutional Class shares. After this time, the cap may be increased or the commitment to maintain the cap may be terminated only with the approval of the Board of Trustees.
| | | | |
| 20 | | Wells Fargo Conservative Income Fund | | Notes to financial statements (unaudited) |
Interfund transactions
The Fund may purchase or sell investment securities to other Wells Fargo affiliates pursuant to Rule 17a-7 under the 1940 Act and under procedures adopted by the Board of Trustees. The procedures have been designed to ensure that these interfund transactions, which do not incur broker commissions, are effected at current market prices. Pursuant to these procedures, the Fund had $4,963,085 in interfund purchases during the six months ended February 28, 2018.
5. INVESTMENT PORTFOLIO TRANSACTIONS
Purchases and sales of investments, excluding U.S. government obligations (if any) and short-term securities, for the six months ended February 28, 2018 were $420,339,086 and $401,150,896, respectively.
6. BANK BORROWINGS
The Trust (excluding the money market funds and certain other funds) and Wells Fargo Variable Trust are parties to a $280,000,000 revolving credit agreement whereby the Fund is permitted to use bank borrowings for temporary or emergency purposes, such as to fund shareholder redemption requests. Interest under the credit agreement is charged to the Fund based on a borrowing rate equal to the higher of the Federal Funds rate in effect on that day plus 1.25% or the overnight LIBOR rate in effect on that day plus 1.25%. In addition, an annual commitment fee equal to 0.25% of the unused balance is allocated to each participating fund.
For the six months ended February 28, 2018, there were no borrowings by the Fund under the agreement.
7. INDEMNIFICATION
Under the Trust’s organizational documents, the officers and Trustees have been granted certain indemnification rights against certain liabilities that may arise out of performance of their duties to the Trust. Additionally, in the normal course of business, the Trust may enter into contracts with service providers that contain a variety of indemnification clauses. The Trust’s maximum exposure under these arrangements is dependent on future claims that may be made against the Fund and, therefore, cannot be estimated.
| | | | | | |
| Other information (unaudited) | | Wells Fargo Conservative Income Fund | | | 21 | |
PROXY VOTING INFORMATION
A description of the policies and procedures that the Fund uses to determine how to vote proxies relating to portfolio securities is available, upon request, by calling 1-800-222-8222, visiting our website at wellsfargofunds.com, or visiting the SEC website at sec.gov. Information regarding how the Fund voted proxies relating to portfolio securities during the most recent 12-month period ended June 30 is available on the Fund’s website at wellsfargofunds.com or by visiting the SEC website at sec.gov.
PORTFOLIO HOLDINGS INFORMATION
The complete portfolio holdings for the Fund are publicly available monthly on the Fund’s website (wellsfargofunds.com), on a one-month delayed basis. In addition, top ten holdings information (excluding derivative positions) for the Fund is publicly available on the Fund’s website on a monthly, seven-day or more delayed basis. The Fund files its complete schedule of portfolio holdings with the SEC for the first and third quarters of each fiscal year on Form N-Q, which is available by visiting the SEC website at sec.gov. In addition, the Fund’s Form N-Q may be reviewed and copied at the SEC’s Public Reference Room in Washington, DC, and at regional offices in New York City, at 233 Broadway, and in Chicago, at 175 West Jackson Boulevard, Suite 900. Information about the Public Reference Room may be obtained by calling 1-800-SEC-0330.
| | | | |
| 22 | | Wells Fargo Conservative Income Fund | | Other information (unaudited) |
BOARD OF TRUSTEES AND OFFICERS
Each of the Trustees and Officers1 listed in the table below acts in identical capacities for each fund in the Wells Fargo family of funds, which consists of 153 mutual funds comprising the Wells Fargo Funds Trust, Wells Fargo Variable Trust, Wells Fargo Master Trust and four closed-end funds (collectively the “Fund Complex”). This table should be read in conjunction with the Prospectus and the Statement of Additional Information2. The mailing address of each Trustee and Officer is 525 Market Street, 12th Floor, San Francisco, CA 94105. Each Trustee and Officer serves an indefinite term, however, each Trustee serves such term until reaching the mandatory retirement age established by the Trustees.
Independent Trustees
| | | | | | |
Name and year of birth | | Position held and length of service* | | Principal occupations during past five years or longer | | Current other public company or
investment company
directorships |
| William R. Ebsworth (Born 1957) | | Trustee, since 2015 | | Retired. From 1984 to 2013, equities analyst, portfolio manager, research director and chief investment officer at Fidelity Management and Research Company in Boston, Tokyo, and Hong Kong, and retired in 2013 as Chief Investment Officer of Fidelity Strategic Advisers, Inc. where he led a team of investment professionals managing client assets. Prior thereto, Board member of Hong Kong Securities Clearing Co., Hong Kong Options Clearing Corp., the Thailand International Fund, Ltd., Fidelity Investments Life Insurance Company, and Empire Fidelity Investments Life Insurance Company. Board member of the Forté Foundation (non-profit organization) and the Vincent Memorial Hospital Endowment (non-profit organization), where he serves on the Investment Committee and as a Chair of the Audit Committee. Mr. Ebsworth is a CFA® charterholder. | | Asset Allocation Trust |
Jane A. Freeman** (Born 1953) | | Trustee, since 2015; Chair Liaison, since 2018 | | Retired. From 2012 to 2014 and 1999 to 2008, Chief Financial Officer of Scientific Learning Corporation. From 2008 to 2012, Ms. Freeman provided consulting services related to strategic business projects. Prior to 1999, Portfolio Manager at Rockefeller & Co. and Scudder, Stevens & Clark. Board member of the Harding Loevner Funds from 1996 to 2014, serving as both Lead Independent Director and chair of the Audit Committee. Board member of the Russell Exchange Traded Funds Trust from 2011 to 2012 and the chair of the Audit Committee. Ms. Freeman is a Board Member of Ruth Bancroft Garden (non-profit organization) and the Glimmerglass Festival. She is also an inactive Chartered Financial Analyst. | | Asset Allocation Trust |
Isaiah Harris, Jr. (Born 1952) | | Trustee, since 2009 | | Retired. Chairman of the Board of CIGNA Corporation since 2009, and Director since 2005. From 2003 to 2011, Director of Deluxe Corporation. Prior thereto, President and CEO of BellSouth Advertising and Publishing Corp. from 2005 to 2007, President and CEO of BellSouth Enterprises from 2004 to 2005 and President of BellSouth Consumer Services from 2000 to 2003. Emeritus member of the Iowa State University Foundation Board of Governors. Emeritus Member of the Advisory Board of Iowa State University School of Business. Advisory Board Member, Palm Harbor Academy (charter school). Advisory Board Member, Child Evangelism Fellowship (non-profit). Mr. Harris is a certified public accountant (inactive status). | | CIGNA Corporation; Asset Allocation Trust |
Judith M. Johnson (Born 1949) | | Trustee, since 2008; Audit Committee Chairman, since 2008 | | Retired. Prior thereto, Chief Executive Officer and Chief Investment Officer of Minneapolis Employees Retirement Fund from 1996 to 2008. Ms. Johnson is an attorney, certified public accountant and a certified managerial accountant. | | Asset Allocation Trust |
David F. Larcker (Born 1950) | | Trustee, since 2009 | | James Irvin Miller Professor of Accounting at the Graduate School of Business, Stanford University, Director of the Corporate Governance Research Initiative and Senior Faculty of The Rock Center for Corporate Governance since 2006. From 2005 to 2008, Professor of Accounting at the Graduate School of Business, Stanford University. Prior thereto, Ernst & Young Professor of Accounting at The Wharton School, University of Pennsylvania from 1985 to 2005. | | Asset Allocation Trust |
| | | | | | |
| Other information (unaudited) | | Wells Fargo Conservative Income Fund | | | 23 | |
| | | | | | |
Name and year of birth | | Position held and length of service* | | Principal occupations during past five years or longer | | Current other public company or
investment company
directorships |
| Olivia S. Mitchell*** (Born 1953) | | Trustee, since 2006; Governance Committee Chairman, since 2018 | | International Foundation of Employee Benefit Plans Professor, Wharton School of the University of Pennsylvania since 1993. Director of Wharton’s Pension Research Council and Boettner Center on Pensions & Retirement Research, and Research Associate at the National Bureau of Economic Research. Previously, Cornell University Professor from 1978 to 1993. | | Asset Allocation Trust |
| Timothy J. Penny**** (Born 1951) | | Trustee, since 1996; Chairman, since 2018; Vice Chairman, from 2017 to 2018 | | President and Chief Executive Officer of Southern Minnesota Initiative Foundation, a non-profit organization, since 2007. Member of the Board of Trustees of NorthStar Education Finance, Inc., a non-profit organization, since 2007. | | Asset Allocation Trust |
| James G. Polisson***** (Born 1959) | | Trustee, since 2018; Advisory Board Member, from 2017 to 2018 | | Retired. Chief Marketing Officer, Source (ETF) UK Services, Ltd, from 2015 to 2017. From 2012 to 2015, Principal of The Polisson Group, LLC, a management consulting, corporate advisory and principal investing company. Chief Executive Officer and Managing Director at Russell Investments, Global Exchange Traded Funds from 2010 to 2012. Managing Director of Barclays Global Investors from 1998 to 2010 and Global Chief Marketing Officer for iShares and Barclays Global Investors from 2000 to 2010. Trustee of the San Francisco Mechanics’ Institute, a non-profit organization, from 2013 to 2015. Board member of the Russell Exchange Traded Fund Trust from 2011 to 2012. Director of Barclays Global Investors Holdings Deutschland GmbH from 2006 to 2009. Mr. Polisson is an attorney and has a retired status with the Massachusetts and District of Columbia Bar Associations. | | Asset Allocation Trust |
Michael S. Scofield (Born 1943) | | Trustee, since 2010 | | Served on the Investment Company Institute’s Board of Governors and Executive Committee from 2008-2011 as well the Governing Council of the Independent Directors Council from 2006-2011 and the Independent Directors Council Executive Committee from 2008-2011. Trustee of the Evergreen Fund complex (and its predecessors) from 1984 to 2010. Chairman of the Evergreen Funds from 2000-2010. Former Trustee of the Mentor Funds. Retired Attorney, Law Offices of Michael S. Scofield. | | Asset Allocation Trust |
| Pamela Wheelock***** (Born 1959) | | Trustee, since 2018; Advisory Board Member, from 2017 to 2018 | | Chief Operating Officer, Twin Cities Habitat for Humanity, since January, 2017. Vice President of University Services, University of Minnesota from 2012 to 2017. Prior thereto, Interim President and Chief Executive Officer of Blue Cross Blue Shield of Minnesota from 2010 to 2011, Chairman of the Board from 2009 to 2011 and Board Director from 2003 to 2015. Vice President, Leadership and Community Engagement, Bush Foundation, Saint Paul, Minnesota (a private foundation) from 2009 to 2011. Executive Vice President and Chief Financial Officer, Minnesota Sports and Entertainment from 2004 to 2009 and Senior Vice President from 2002 to 2004. Commissioner of Finance, State of Minnesota, from 1999 to 2002. Currently on the Board of Directors, Governance Committee and Finance Committee, for the Minnesota Philanthropy Partners (Saint Paul Foundation) since 2012 and Board Chair of the Minnesota Wild Foundation since 2010. | | Asset Allocation Trust |
| * | Length of service dates reflect the Trustee’s commencement of service with the Trust’s predecessor entities, where applicable. |
| ** | Jane Freeman became Chair Liaison effective January 1, 2018. |
| *** | Olivia Mitchell became Chairman of the Governance Committee effective January 1, 2018. |
| **** | Timothy Penny became Chairman effective January 1, 2018. |
| ***** | James Polisson and Pamela Wheelock each became a Trustee effective January 1, 2018. |
| | | | |
| 24 | | Wells Fargo Conservative Income Fund | | Other information (unaudited) |
Officers
| | | | | | |
Name and year of birth | | Position held and length of service | | Principal occupations during past five years or longer | | |
Andrew Owen (Born 1960) | | President, since 2017 | | Executive Vice President of Wells Fargo & Company and Head of Affiliated Managers, Wells Fargo Asset Management, since 2014. In addition, Mr. Owen is currently President, Chief Executive Officer and Director of Wells Fargo Funds Management, LLC since 2017. Prior thereto, Executive Vice President responsible for marketing, investments and product development for Wells Fargo Funds Management, LLC, from 2009 to 2014. | | |
Nancy Wiser1 (Born 1967) | | Treasurer, since 2012 | | Executive Vice President of Wells Fargo Funds Management, LLC since 2011. Chief Operating Officer and Chief Compliance Officer at LightBox Capital Management LLC, from 2008 to 2011. | | |
Alexander Kymn* (Born 1973) | | Secretary, since 2018; Chief Legal Officer, since 2018 | | Senior Company Counsel of Wells Fargo Bank, N.A. since 2018 (previously Senior Counsel from 2007 to 2018). Vice President of Wells Fargo Funds Management, LLC from 2008 to 2014. | | |
C. David Messman** (Born 1960) | | Secretary, since 2000; Chief Legal Officer, since 2003 | | Senior Vice President and Secretary of Wells Fargo Funds Management, LLC since 2001. Assistant General Counsel of Wells Fargo Bank, N.A. since 2013 and Vice President and Managing Counsel of Wells Fargo Bank, N.A. from 1996 to 2013. | | |
Michael H. Whitaker (Born 1967) | | Chief Compliance Officer, since 2016 | | Senior Vice President and Chief Compliance Officer since 2016. Senior Vice President and Chief Compliance Officer for Fidelity Investments from 2007 to 2016. | | |
David Berardi (Born 1975) | | Assistant Treasurer, since 2009 | | Vice President of Wells Fargo Funds Management, LLC since 2009. Vice President of Evergreen Investment Management Company, LLC from 2008 to 2010. Manager of Fund Reporting and Control for Evergreen Investment Management Company, LLC from 2004 to 2010. | | |
Jeremy DePalma1 (Born 1974) | | Assistant Treasurer, since 2009 | | Senior Vice President of Wells Fargo Funds Management, LLC since 2009. Senior Vice President of Evergreen Investment Management Company, LLC from 2008 to 2010 and head of the Fund Reporting and Control Team within Fund Administration from 2005 to 2010. | | |
| 1 | Nancy Wiser acts as Treasurer of 77 funds in the Fund Complex. Jeremy DePalma acts as Treasurer of 76 funds and Assistant Treasurer of 77 funds in the Fund Complex. |
| 2 | The Statement of Additional Information includes additional information about the Trustees and is available, without charge, upon request, by calling 1-800-222-8222 or by visiting the website at wellsfargofunds.com. |
| * | Alexander Kymn became the Secretary and Chief Legal Officer effective April 17, 2018. |
| ** | David Messman was the Secretary and Chief Legal Officer until April 16, 2018. |
| | | | | | |
| List of abbreviations | | Wells Fargo Conservative Income Fund | | | 25 | |
The following is a list of common abbreviations for terms and entities that may have appeared in this report.
| ACA | — ACA Financial Guaranty Corporation |
| ADR | — American depositary receipt |
| ADS | — American depositary shares |
| AGC | — Assured Guaranty Corporation |
| AGM | — Assured Guaranty Municipal |
| Ambac | — Ambac Financial Group Incorporated |
| AMT | — Alternative minimum tax |
| BAN | — Bond anticipation notes |
| BHAC | — Berkshire Hathaway Assurance Corporation |
| CAB | — Capital appreciation bond |
| CCAB | — Convertible capital appreciation bond |
| CDA | — Community Development Authority |
| CDO | — Collateralized debt obligation |
| CLO | — Collateralized loan obligation |
| DRIVER | — Derivative inverse tax-exempt receipts |
| DW&P | — Department of Water & Power |
| DWR | — Department of Water Resources |
| ECFA | — Educational & Cultural Facilities Authority |
| EDA | — Economic Development Authority |
| EDFA | — Economic Development Finance Authority |
| ETF | — Exchange-traded fund |
| FDIC | — Federal Deposit Insurance Corporation |
| FFCB | — Federal Farm Credit Banks |
| FGIC | — Financial Guaranty Insurance Corporation |
| FHA | — Federal Housing Administration |
| FHLB | — Federal Home Loan Bank |
| FHLMC | — Federal Home Loan Mortgage Corporation |
| FICO | — The Financing Corporation |
| FNMA | — Federal National Mortgage Association |
| GDR | — Global depositary receipt |
| GNMA | — Government National Mortgage Association |
| HCFR | — Healthcare facilities revenue |
| HEFA | — Health & Educational Facilities Authority |
| HEFAR | — Higher education facilities authority revenue |
| HFA | — Housing Finance Authority |
| HFFA | — Health Facilities Financing Authority |
| HUD | — Department of Housing and Urban Development |
| IDA | — Industrial Development Authority |
| IDAG | — Industrial Development Agency |
| KRW | — Republic of Korea won |
| LIBOR | — London Interbank Offered Rate |
| LIFER | — Long Inverse Floating Exempt Receipts |
| LLC | — Limited liability company |
| LLLP | — Limited liability limited partnership |
| LLP | — Limited liability partnership |
| MBIA | — Municipal Bond Insurance Association |
| MFHR | — Multifamily housing revenue |
| MSTR | — Municipal securities trust receipts |
| MUD | — Municipal Utility District |
| National | — National Public Finance Guarantee Corporation |
| PCFA | — Pollution Control Financing Authority |
| PCL | — Public Company Limited |
| PCR | — Pollution control revenue |
| PFA | — Public Finance Authority |
| PFFA | — Public Facilities Financing Authority |
| PFOTER | — Puttable floating option tax-exempt receipts |
| PJSC | — Public Joint Stock Company |
| plc | — Public limited company |
| PUTTER | — Puttable tax-exempt receipts |
| R&D | — Research & development |
| Radian | — Radian Asset Assurance |
| RAN | — Revenue anticipation notes |
| RDA | — Redevelopment Agency |
| RDFA | — Redevelopment Finance Authority |
| REIT | — Real estate investment trust |
| ROC | — Reset option certificates |
| SAVRS | — Select auction variable rate securities |
| SBA | — Small Business Authority |
| SDR | — Swedish depositary receipt |
| SFHR | — Single-family housing revenue |
| SFMR | — Single-family mortgage revenue |
| SIFMA | — Securities Industry and Financial Markets Association |
| SPA | — Standby purchase agreement |
| SPDR | — Standard & Poor’s Depositary Receipts |
| SPEAR | — Short Puttable Exempt Adjustable Receipts |
| STRIPS | — Separate trading of registered interest and |
| TAN | — Tax anticipation notes |
| TIPS | — Treasury inflation-protected securities |
| TRAN | — Tax revenue anticipation notes |
| TTFA | — Transportation Trust Fund Authority |
| TVA | — Tennessee Valley Authority |
This page is intentionally left blank.
This page is intentionally left blank.
This page is intentionally left blank.

For more information
More information about Wells Fargo Funds is available free upon request. To obtain literature, please write, email, visit the Fund’s website, or call:
Wells Fargo Funds
P.O. Box 8266
Boston, MA 02266-8266
Email: fundservice@wellsfargo.com
Website: wellsfargofunds.com
Individual investors: 1-800-222-8222
Retail investment professionals: 1-888-877-9275
Institutional investment professionals: 1-866-765-0778
This report and the financial statements contained herein are submitted for the general information of the shareholders of the Fund. If this report is used for promotional purposes, distribution of the report must be accompanied or preceded by a current prospectus. Before investing, please consider the investment objectives, risks, charges, and expenses of the investment. For a current prospectus and, if available, a summary prospectus, containing this information, call 1-800-222-8222 or visit the Fund’s website at wellsfargofunds.com. Read the prospectus carefully before you invest or send money.
Wells Fargo Asset Management (WFAM) is a trade name used by the asset management businesses of Wells Fargo & Company. Wells Fargo Funds Management, LLC, a wholly owned subsidiary of Wells Fargo & Company, provides investment advisory and administrative services for Wells Fargo Funds. Other affiliates of Wells Fargo & Company provide subadvisory and other services for the funds. The funds are distributed by Wells Fargo Funds Distributor, LLC, Member FINRA, an affiliate of Wells Fargo & Company. Neither Wells Fargo Funds Distributor nor Wells Fargo Funds Management holds fund shareholder accounts or assets. This material is for general informational and educational purposes only and is NOT intended to provide investment advice or a recommendation of any kind—including a recommendation for any specific investment, strategy, or plan.
NOT FDIC INSURED ◾ NO BANK GUARANTEE ◾ MAY LOSE VALUE
© 2018 Wells Fargo Funds Management, LLC. All rights reserved.
| | |
 | | 302023 04-18 SA265/SAR265 02-18 |
Semi-Annual Report
February 28, 2018

Wells Fargo Government Securities Fund


Reduce clutter. Save trees.
Sign up for electronic delivery of prospectuses and shareholder reports at wellsfargo.com/advantagedelivery
Contents
The views expressed and any forward-looking statements are as of February 28, 2018, unless otherwise noted, and are those of the Fund managers and/or Wells Fargo Funds Management, LLC. Discussions of individual securities, or the markets generally, or any Wells Fargo Fund are not intended as individual recommendations. Future events or results may vary significantly from those expressed in any forward-looking statements. The views expressed are subject to change at any time in response to changing circumstances in the market. Wells Fargo Funds Management, LLC and the Fund disclaim any obligation to publicly update or revise any views expressed or forward-looking statements.
NOT FDIC INSURED ◾ NO BANK GUARANTEE ◾ MAY LOSE VALUE
| | | | |
| 2 | | Wells Fargo Government Securities Fund | | Letter to shareholders (unaudited) |

Andrew Owen
President
Wells Fargo Funds
During the period, stocks globally delivered positive returns.
Dear Shareholder:
We are pleased to offer you this semi-annual report for the Wells Fargo Government Securities Fund for the six-month period that ended February 28, 2018. During the period, stocks globally delivered positive returns. For the period, U.S. stocks, as measured by the S&P 500 Index1, gained 10.84% and international stocks, as measured by the MSCI ACWI ex USA Index (Net)2, gained 7.59%. In bond markets, the Bloomberg Barclays U.S. Aggregate Bond Index3 declined 2.18% and the Bloomberg Barclays Municipal Bond Index4 lost 1.24% while fixed-income investments outside the U.S. gained 2.52%, according to the Bloomberg Barclays Global Aggregate ex-USD Index5. The ICE BofAML U.S. High Yield Index6 earned 1.01% during the period.
U.S. stocks advanced as business-friendly policies and regulations, newly implemented tax reform, increased hiring activity, and consistent corporate profits led to higher investor and consumer confidence. Internationally, stocks gained as unemployment fell and wages increased in the U.K.; the Bank of Japan continued its accommodative monetary policies; and industrial production, retail sales, and fixed asset investment increased in China. Stock returns in the emerging markets were strong, with the MSCI EM Index (Net)7 gaining 10.58% for the period.
Reactions to U.S. interest-rate increases were uneven across the yield curve and globally.
The U.S. Federal Reserve (Fed) increased the federal funds rate twice during the six-month period. Following a federal funds rate increase in June to a range of 1.00% to 1.25%, 10-year U.S. Treasury yields declined, the yield curve flattened, and long-term bond prices benefited.
Internationally, central banks maintained low interest rates and accommodative monetary policies that supported business activity and stock values in foreign markets. A weaker U.S. dollar was generally supportive of business activity in regions around the globe.
Positive economic and market news continued as 2017 closed and 2018 began.
During the fourth quarter of 2017, stock markets continued the move higher. Third-quarter economic output in the U.S. grew at a 3.2% annual rate. The unemployment rate fell to a 17-year low of 4.1%. Tax reform and wage growth encouraged increased business and consumer spending.
Fed officials announced in October 2017 plans to begin unwinding its $4.5 trillion portfolio of bonds and other assets accumulated during rounds of quantitative easing conducted since the 2008–2009 recession. Still, restrained inflation kept long-term bond rates steady and the flattening of the yield curve persisted.
| 1 | The S&P 500 Index consists of 500 stocks chosen for market size, liquidity, and industry group representation. It is a market-value-weighted index with each stock’s weight in the index proportionate to its market value. You cannot invest directly in an index. |
| 2 | The Morgan Stanley Capital International (MSCI) All Country World Index (ACWI) ex USA Index (Net) is a free-float-adjusted market-capitalization-weighted index that is designed to measure the equity market performance of developed markets, excluding the United States and Canada. Source: MSCI. MSCI makes no express or implied warranties or representations and shall have no liability whatsoever with respect to any MSCI data contained herein. The MSCI data may not be further redistributed or used as a basis for other indices or any securities or financial products. This report is not approved, reviewed, or produced by MSCI. You cannot invest directly in an index. |
| 3 | The Bloomberg Barclays U.S. Aggregate Bond Index is a broad-based benchmark that measures the investment-grade, U.S. dollar-denominated, fixed-rate taxable bond market, including Treasuries, government-related and corporate securities, mortgage-backed securities (agency fixed-rate and hybrid adjustable-rate mortgage pass-throughs), asset-backed securities, and commercial mortgage-backed securities. You cannot invest directly in an index. |
| 4 | The Bloomberg Barclays Municipal Bond Index is an unmanaged index composed of long-term tax-exempt bonds with a minimum credit rating of Baa. You cannot invest directly in an index. |
| 5 | The Bloomberg Barclays Global Aggregate ex-USD Index is an unmanaged index that provides a broad-based measure of the global investment-grade fixed-income markets excluding the U.S. dollar-denominated debt market. You cannot invest directly in an index. |
| 6 | The ICE BofAML U.S. High Yield Index is a market-capitalization-weighted index of domestic and Yankee high-yield bonds. The index tracks the performance of high-yield securities traded in the U.S. bond market. You cannot invest directly in an index. Copyright 2018. ICE Data Indices, LLC. All rights reserved. |
| 7 | The MSCI Emerging Markets (EM) Index (Net) is a free-float-adjusted market-capitalization-weighted index that is designed to measure large- and mid-cap equity market performance of emerging markets. The MSCI EM Index (Net) consists of the following 24 emerging markets country indices: Brazil, Chile, China, Colombia, Czech Republic, Egypt, Greece, Hungary, India, Indonesia, Korea, Malaysia, Mexico, Pakistan, Peru, the Philippines, Poland, Qatar, Russia, South Africa, Taiwan, Thailand, Turkey, and the United Arab Emirates. You cannot invest directly in an index. |
| | | | | | |
| Letter to shareholders (unaudited) | | Wells Fargo Government Securities Fund | | | 3 | |
October 2017 also marked one year since the regulatory reform of money market investing in the U.S. By December 2017, money market fund asset levels exceeded their December 2016 levels, reflecting continued investor demand for short-term investment opportunities offered in money market funds.
In December, the Organisation for Economic Co-operation and Development (OECD) reported that the global economy was expanding at its fastest rate since 2010; all 35 countries the OECD follows were on track to expand for 2017. International economies benefited from economic stimulus, which accelerated trade growth; improving employment; increased investment; and firming commodity prices.
The Fed raised the federal funds rate target to a range of 1.25% to 1.50% in December 2017 and began reducing its bond portfolio.
2018 opened with continued stock advances, then volatility.
Improving business and economic data globally continued to support stock advances through January 2018. Even political wrangling in the U.S. over budget resolutions could not dissuade investors from buying stocks as payrolls and factory orders increased. Long-term interest rates in the U.S. trended higher as the yield curve steepened—the 10-year Treasury rate moved from 2.46% to 2.84% and the 30-year rate moved from 2.81% to 3.08% during January 2018.
Investor sentiment shifted in February. Concerns about inflation began to emerge in the U.S. as readings from the Producer Price Index in January rose 2.5% year over year. During February 2018, the U.S. market endured a loss of more than 10% before recovering much of that loss, but volatility affected stocks globally throughout the month.
During January 2018, purchasing managers’ indexes in China, the eurozone, India, and Japan reported data for December that indicated continued growth. International stock values fell during February 2018, swept up in the selling momentum in U.S. markets.
Don’t let short-term uncertainty derail long-term investment goals.
Periods of investment uncertainty can present challenges, but experience has taught us that maintaining long-term investment goals can be an effective way to plan for the future. To help you create a sound strategy based on your personal goals and risk tolerance, Wells Fargo Funds offers more than 100 mutual funds spanning a wide range of asset classes and investment styles. Although diversification cannot guarantee an investment profit or prevent losses, we believe it can be an effective way to manage investment risk and potentially smooth out overall portfolio performance. We encourage investors to know their investments and to understand that appropriate levels of risk-taking may unlock opportunities.
Thank you for choosing to invest with Wells Fargo Funds. We appreciate your confidence in us and remain committed to helping you meet your financial needs.
Sincerely,

Andrew Owen
President
Wells Fargo Funds
During February 2018, the U.S. market endured a loss of more than 10% before recovering much of that loss, but volatility affected stocks globally throughout the month.
For further information about your Fund, contact your investment professional, visit our website at wellsfargofunds.com, or call us directly at 1-800-222-8222.
| | | | |
| 4 | | Wells Fargo Government Securities Fund | | Performance highlights (unaudited) |
Investment objective
The Fund seeks current income.
Manager
Wells Fargo Funds Management, LLC
Subadviser
Wells Capital Management Incorporated
Portfolio managers
Christopher Y. Kauffman, CFA®
Jay N. Mueller, CFA®
Michal Stanczyk
Average annual total returns (%) as of February 28, 20181
| | | | | | | | | | | | | | | | | | | | | | | | | | | | | | | | | | |
| | | | | Including sales charge | | | Excluding sales charge | | | Expense ratios2 (%) | |
| | | Inception date | | 1 year | | | 5 year | | | 10 year | | | 1 year | | | 5 year | | | 10 year | | | Gross | | | Net3 | |
| Class A (SGVDX) | | 8-31-1999 | | | (4.88 | ) | | | (0.06 | ) | | | 2.24 | | | | (0.40 | ) | | | 0.86 | | | | 2.71 | | | | 0.87 | | | | 0.85 | |
| Class C (WGSCX) | | 12-26-2002 | | | (2.14 | ) | | | 0.13 | | | | 1.95 | | | | (1.14 | ) | | | 0.13 | | | | 1.95 | | | | 1.62 | | | | 1.60 | |
| Administrator Class (WGSDX) | | 4-8-2005 | | | – | | | | – | | | | – | | | | (0.19 | ) | | | 1.09 | | | | 2.93 | | | | 0.81 | | | | 0.64 | |
| Institutional Class (SGVIX) | | 8-31-1999 | | | – | | | | – | | | | – | | | | (0.03 | ) | | | 1.24 | | | | 3.10 | | | | 0.54 | | | | 0.48 | |
| Bloomberg Barclays U.S. Aggregate ex Credit Index4 | | – | | | – | | | | – | | | | – | | | | (0.20 | ) | | | 1.25 | | | | 3.09 | | | | – | | | | – | |
| Bloomberg Barclays Intermediate U.S. Government Bond Index5 | | – | | | – | | | | – | | | | – | | | | (0.61 | ) | | | 0.66 | | | | 2.22 | | | | – | | | | – | |
Figures quoted represent past performance, which is no guarantee of future results, and do not reflect taxes that a shareholder may pay on fund distributions or the redemption of fund shares. Investment return and principal value of an investment will fluctuate so that an investor’s shares, when redeemed, may be worth more or less than their original cost. Performance shown without sales charges would be lower if sales charges were reflected. Current performance may be lower or higher than the performance data quoted, which assumes the reinvestment of dividends and capital gains. Current month-end performance is available on the Fund’s website, wellsfargofunds.com.
Index returns do not include transaction costs associated with buying and selling securities, any mutual fund fees or expenses, or any taxes. It is not possible to invest directly in an index.
For Class A shares, the maximum front-end sales charge is 4.50%. For Class C shares, the maximum contingent deferred sales charge is 1.00%. Performance including a contingent deferred sales charge assumes the sales charge for the corresponding time period. Administrator Class and Institutional Class shares are sold without a front-end sales charge or contingent deferred sales charge.
Bond values fluctuate in response to the financial condition of individual issuers, general market and economic conditions, and changes in interest rates. Changes in market conditions and government policies may lead to periods of heightened volatility in the bond market and reduced liquidity for certain bonds held by the Fund. In general, when interest rates rise, bond values fall and investors may lose principal value. Interest-rate changes and their impact on the Fund and its share price can be sudden and unpredictable. The use of derivatives may reduce returns and/or increase volatility. Securities issued by U.S. government agencies or government sponsored entities may not be guaranteed by the U.S. Treasury. Certain investment strategies tend to increase the total risk of an investment (relative to the broader market). The Fund is exposed to mortgage- and asset-backed securities risk. The U.S. government guarantee applies to certain underlying securities and not to shares of the Fund. Consult the Fund’s prospectus for additional information on these and other risks.
Please see footnotes on page 5.
| | | | | | |
| Performance highlights (unaudited) | | Wells Fargo Government Securities Fund | | | 5 | |
| | | | |
| Ten largest holdings (%) as of February 28, 20186 | |
FNMA, 4.50%, 3-13-2048 | | | 4.73 | |
U.S. Treasury Note, 1.75%, 5-15-2023 | | | 4.29 | |
GNMA, 3.50%, 3-28-2048 | | | 3.89 | |
U.S. Treasury Bond, 3.75%, 11-15-2043 | | | 3.65 | |
FNMA, 3.00%, 9-1-2036 | | | 3.32 | |
Resolution Funding Corporation STRIPS, 0.00%, 7-15-2020 | | | 3.06 | |
Resolution Funding Corporation STRIPS, 0.00%,
10-15-2019 | | | 2.67 | |
FNMA, 4.00%, 4-1-2046 | | | 2.39 | |
FNMA, 3.50%, 3-15-2033 | | | 2.21 | |
GNMA, 4.00%, 12-20-2047 | | | 2.13 | |
|
| Portfolio allocation as of February 28, 20187 |
|
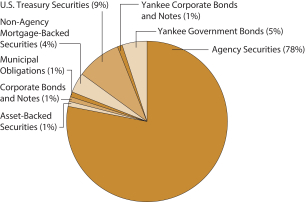 |
| 1 | Effective June 20, 2008, the Advisor Class was renamed Class A and modified to assume the features and attributes of Class A. Historical performance shown for Class A shares through June 19, 2008, includes Advisor Class expenses. |
| 2 | Reflects the expense ratios as stated in the most recent prospectuses. The expense ratios shown are subject to change and may differ from the annualized expense ratios shown in the financial highlights of this report. |
| 3 | The manager has contractually committed through December 31, 2018, to waive fees and/or reimburse expenses to the extent necessary to cap the Fund’s Total Annual Fund Operating Expenses After Fee Waivers at the amounts shown. After this time, the cap may be increased or the commitment to maintain the cap may be terminated only with the approval of the Board of Trustees. Brokerage commissions, stamp duty fees, interest, taxes, acquired fund fees and expenses, and extraordinary expenses are excluded from the expense cap. Without this cap, the Fund’s returns would have been lower. The expense ratio paid by an investor is the net expense ratio (the total annual fund operating expenses after fee waivers) as stated in the prospectuses. |
| 4 | The Bloomberg Barclays U.S. Aggregate ex Credit Index is composed of the Bloomberg Barclays U.S. Government Bond Index and the Bloomberg Barclays U.S. Mortgage-Backed Securities Index and it includes Treasury issues, agency issues, and mortgage backed securities. You cannot invest directly in an index. |
| 5 | The Bloomberg Barclays Intermediate U.S. Government Bond Index is an unmanaged index composed of U.S. government securities with maturities in the one to 10-year range, including securities issued by the U.S. Treasury and U.S. government agencies. You cannot invest directly in an index. |
| 6 | The ten largest holdings, excluding cash and cash equivalents, are calculated based on the value of the investments divided by total net assets of the Fund. Holdings are subject to change and may have changed since the date specified. |
| 7 | Amounts are calculated based on the total long-term investments of the Fund. These amounts are subject to change and may have changed since the date specified. |
| | | | |
| 6 | | Wells Fargo Government Securities Fund | | Fund expenses (unaudited) |
As a shareholder of the Fund, you incur two types of costs: (1) transaction costs, including sales charges (loads) on purchase payments and contingent deferred sales charges (if any) on redemptions and (2) ongoing costs, including management fees, distribution (12b-1) and/or shareholder servicing fees, and other Fund expenses. This example is intended to help you understand your ongoing costs (in dollars) of investing in the Fund and to compare these costs with the ongoing costs of investing in other mutual funds.
The example is based on an investment of $1,000 invested at the beginning of the six-month period and held for the entire period from September 1, 2017 to February 28, 2018.
Actual expenses
The “Actual” line of the table below provides information about actual account values and actual expenses. You may use the information in this line, together with the amount you invested, to estimate the expenses that you paid over the period. Simply divide your account value by $1,000 (for example, an $8,600 account value divided by $1,000 = 8.6), then multiply the result by the number in the “Actual” line under the heading entitled “Expenses paid during period” for your applicable class of shares to estimate the expenses you paid on your account during this period.
Hypothetical example for comparison purposes
The “Hypothetical” line of the table below provides information about hypothetical account values and hypothetical expenses based on the Fund’s actual expense ratio and an assumed rate of return of 5% per year before expenses, which is not the Fund’s actual return. The hypothetical account values and expenses may not be used to estimate the actual ending account balance or expenses you paid for the period. You may use this information to compare the ongoing costs of investing in the Fund and other funds. To do so, compare this 5% hypothetical example with the 5% hypothetical examples that appear in the shareholder reports of the other funds.
Please note that the expenses shown in the table are meant to highlight your ongoing costs only and do not reflect any transactional costs, such as sales charges (loads) and contingent deferred sales charges. Therefore, the “Hypothetical” line of the table is useful in comparing ongoing costs only and will not help you determine the relative total costs of owning different funds. In addition, if these transactional costs were included, your costs would have been higher.
| | | | | | | | | | | | | | | | |
| | | Beginning
account value
9-1-2017 | | | Ending
account value
2-28-2018 | | | Expenses
paid during
the period¹ | | | Annualized net
expense ratio | |
Class A | | | | | | | | | | | | | | | | |
Actual | | $ | 1,000.00 | | | $ | 976.81 | | | $ | 4.17 | | | | 0.85 | % |
Hypothetical (5% return before expenses) | | $ | 1,000.00 | | | $ | 1,020.58 | | | $ | 4.26 | | | | 0.85 | % |
Class C | | | | | | | | | | | | | | | | |
Actual | | $ | 1,000.00 | | | $ | 973.18 | | | $ | 7.83 | | | | 1.60 | % |
Hypothetical (5% return before expenses) | | $ | 1,000.00 | | | $ | 1,016.86 | | | $ | 8.00 | | | | 1.60 | % |
Administrator Class | | | | | | | | | | | | | | | | |
Actual | | $ | 1,000.00 | | | $ | 977.83 | | | $ | 3.14 | | | | 0.64 | % |
Hypothetical (5% return before expenses) | | $ | 1,000.00 | | | $ | 1,021.62 | | | $ | 3.21 | | | | 0.64 | % |
Institutional Class | | | | | | | | | | | | | | | | |
Actual | | $ | 1,000.00 | | | $ | 978.58 | | | $ | 2.35 | | | | 0.48 | % |
Hypothetical (5% return before expenses) | | $ | 1,000.00 | | | $ | 1,022.41 | | | $ | 2.41 | | | | 0.48 | % |
| 1 | Expenses paid is equal to the annualized net expense ratio of each class multiplied by the average account value over the period, multiplied by the number of days in the most recent fiscal half-year divided by the number of days in the fiscal year (to reflect the one-half-year period). |
| | | | | | |
| Portfolio of investments—February 28, 2018 (unaudited) | | Wells Fargo Government Securities Fund | | | 7 | |
| | | | | | | | | | | | | | | | |
| Security name | | Interest rate | | | Maturity date | | | Principal | | | Value | |
| | | | |
Agency Securities: 88.93% | | | | | | | | | | | | | | | | |
FDIC Series 2010-R1 Class A 144A | | | 2.18 | % | | | 5-25-2050 | | | $ | 359,843 | | | $ | 360,450 | |
FDIC Series 2013-R1 Class A 144A | | | 1.15 | | | | 3-25-2033 | | | | 2,011,123 | | | | 1,980,475 | |
FHLB | | | 5.63 | | | | 3-14-2036 | | | | 6,020,000 | | | | 7,927,311 | |
FHLMC | | | 1.42 | | | | 5-25-2021 | | | | 3,468,224 | | | | 3,405,187 | |
FHLMC (1 Month LIBOR +0.50%) ± | | | 2.09 | | | | 8-15-2037 | | | | 3,751,860 | | | | 3,782,494 | |
FHLMC (1 Month LIBOR +0.67%) ± | | | 2.25 | | | | 2-25-2023 | | | | 734,066 | | | | 737,514 | |
FHLMC | | | 2.38 | | | | 4-25-2023 | | | | 2,663,103 | | | | 2,616,758 | |
FHLMC | | | 2.46 | | | | 3-25-2022 | | | | 3,909,098 | | | | 3,863,972 | |
FHLMC | | | 2.62 | | | | 12-25-2026 | | | | 4,098,866 | | | | 3,994,173 | |
FHLMC | | | 2.75 | | | | 3-25-2027 | | | | 6,640,844 | | | | 6,546,361 | |
FHLMC (1 Month LIBOR +1.18%) ± | | | 2.77 | | | | 12-15-2036 | | | | 408,730 | | | | 423,705 | |
FHLMC (1 Year Treasury Constant Maturity +2.13%) ± | | | 2.89 | | | | 10-1-2026 | | | | 152,596 | | | | 157,385 | |
FHLMC | | | 2.90 | | | | 4-25-2026 | | | | 6,545,795 | | | | 6,485,868 | |
FHLMC | | | 3.00 | | | | 5-15-2026 | | | | 900,257 | | | | 904,933 | |
FHLMC | | | 3.00 | | | | 1-15-2054 | | | | 195,057 | | | | 193,380 | |
FHLMC (1 Year Treasury Constant Maturity +2.25%) ± | | | 3.25 | | | | 6-1-2032 | | | | 39,907 | | | | 41,463 | |
FHLMC ±± | | | 3.31 | | | | 5-25-2023 | | | | 2,800,000 | | | | 2,850,158 | |
FHLMC (1 Year Treasury Constant Maturity +2.40%) ± | | | 3.35 | | | | 7-1-2029 | | | | 99,745 | | | | 103,077 | |
FHLMC (11th District Cost of Funds +1.25%) ± | | | 3.37 | | | | 7-1-2032 | | | | 526,908 | | | | 529,453 | |
FHLMC | | | 3.50 | | | | 8-1-2045 | | | | 6,266,777 | | | | 6,273,175 | |
FHLMC | | | 3.50 | | | | 11-1-2045 | | | | 11,232,726 | | | | 11,244,201 | |
FHLMC | | | 3.50 | | | | 12-1-2045 | | | | 7,966,851 | | | | 7,974,989 | |
FHLMC | | | 3.50 | | | | 12-1-2045 | | | | 2,593,485 | | | | 2,596,128 | |
FHLMC (3 Year Treasury Constant Maturity +2.25%) ± | | | 3.52 | | | | 5-1-2026 | | | | 44,168 | | | | 43,933 | |
FHLMC (12 Month LIBOR +1.91%) ± | | | 3.66 | | | | 9-1-2031 | | | | 3,499 | | | | 3,529 | |
FHLMC (12 Month LIBOR +1.91%) ± | | | 3.66 | | | | 9-1-2031 | | | | 46,347 | | | | 46,481 | |
FHLMC (12 Month LIBOR +2.00%) ± | | | 3.75 | | | | 1-1-2038 | | | | 1,090,856 | | | | 1,150,398 | |
FHLMC | | | 4.00 | | | | 12-15-2024 | | | | 1,850,000 | | | | 1,915,463 | |
FHLMC | | | 4.00 | | | | 6-1-2044 | | | | 5,645,553 | | | | 5,808,934 | |
FHLMC | | | 4.50 | | | | 3-1-2042 | | | | 487,578 | | | | 515,186 | |
FHLMC | | | 4.50 | | | | 9-1-2044 | | | | 4,373,901 | | | | 4,596,511 | |
FHLMC | | | 5.00 | | | | 5-1-2018 | | | | 2,351 | | | | 2,386 | |
FHLMC | | | 5.00 | | | | 4-1-2019 | | | | 9,333 | | | | 9,469 | |
FHLMC | | | 5.00 | | | | 4-1-2019 | | | | 15,449 | | | | 15,675 | |
FHLMC | | | 5.00 | | | | 6-1-2019 | | | | 69,597 | | | | 70,613 | |
FHLMC | | | 5.00 | | | | 8-1-2019 | | | | 201,821 | | | | 204,864 | |
FHLMC | | | 5.00 | | | | 10-1-2019 | | | | 83,300 | | | | 84,516 | |
FHLMC | | | 5.00 | | | | 2-1-2020 | | | | 281,667 | | | | 288,092 | |
FHLMC | | | 5.00 | | | | 8-1-2040 | | | | 1,344,203 | | | | 1,452,476 | |
FHLMC | | | 5.11 | | | | 5-25-2019 | | | | 1,140,000 | | | | 1,164,425 | |
FHLMC | | | 5.50 | | | | 7-1-2035 | | | | 3,942,922 | | | | 4,342,366 | |
FHLMC | | | 5.50 | | | | 12-1-2038 | | | | 2,357,472 | | | | 2,584,766 | |
FHLMC | | | 6.00 | | | | 10-1-2032 | | | | 33,222 | | | | 37,361 | |
FHLMC | | | 6.00 | | | | 5-25-2043 | | | | 4,741,921 | | | | 5,168,736 | |
FHLMC (1 Year Treasury Constant Maturity +2.13%) ± | | | 6.38 | | | | 1-1-2026 | | | | 60,649 | | | | 58,617 | |
FHLMC | | | 6.50 | | | | 4-1-2018 | | | | 10 | | | | 10 | |
FHLMC | | | 6.50 | | | | 4-1-2021 | | | | 2,451 | | | | 2,511 | |
FHLMC | | | 6.50 | | | | 4-1-2022 | | | | 45,708 | | | | 51,469 | |
FHLMC | | | 6.50 | | | | 9-1-2028 | | | | 18,859 | | | | 21,237 | |
FHLMC | | | 6.50 | | | | 9-1-2028 | | | | 19,687 | | | | 22,168 | |
The accompanying notes are an integral part of these financial statements.
| | | | |
| 8 | | Wells Fargo Government Securities Fund | | Portfolio of investments—February 28, 2018 (unaudited) |
| | | | | | | | | | | | | | | | |
| Security name | | Interest rate | | | Maturity date | | | Principal | | | Value | |
| | | | |
Agency Securities (continued) | | | | | | | | | | | | | | | | |
FHLMC | | | 6.50 | % | | | 7-1-2031 | | | $ | 3 | | | $ | 3 | |
FHLMC | | | 7.00 | | | | 12-1-2023 | | | | 2,907 | | | | 3,146 | |
FHLMC | | | 7.00 | | | | 5-1-2024 | | | | 8,215 | | | | 8,277 | |
FHLMC | | | 7.00 | | | | 12-1-2026 | | | | 2,029 | | | | 2,071 | |
FHLMC | | | 7.00 | | | | 12-1-2026 | | | | 450 | | | | 482 | |
FHLMC | | | 7.00 | | | | 4-1-2029 | | | | 1,738 | | | | 1,930 | |
FHLMC | | | 7.00 | | | | 5-1-2029 | | | | 9,511 | | | | 10,487 | |
FHLMC | | | 7.00 | | | | 4-1-2032 | | | | 108,807 | | | | 121,410 | |
FHLMC | | | 7.50 | | | | 11-1-2031 | | | | 194,578 | | | | 221,984 | |
FHLMC | | | 7.50 | | | | 4-1-2032 | | | | 173,258 | | | | 195,878 | |
FHLMC | | | 8.00 | | | | 8-1-2023 | | | | 8,711 | | | | 9,224 | |
FHLMC | | | 8.00 | | | | 6-1-2024 | | | | 4,603 | | | | 4,982 | |
FHLMC | | | 8.00 | | | | 6-1-2024 | | | | 2,934 | | | | 2,982 | |
FHLMC | | | 8.00 | | | | 6-1-2024 | | | | 7,238 | | | | 7,613 | |
FHLMC | | | 8.00 | | | | 8-1-2026 | | | | 16,363 | | | | 18,691 | |
FHLMC | | | 8.00 | | | | 11-1-2026 | | | | 15,298 | | | | 17,258 | |
FHLMC | | | 8.00 | | | | 11-1-2028 | | | | 10,973 | | | | 12,001 | |
FHLMC | | | 8.50 | | | | 7-1-2022 | | | | 1,208 | | | | 1,226 | |
FHLMC | | | 8.50 | | | | 12-1-2025 | | | | 10,609 | | | | 11,643 | |
FHLMC | | | 8.50 | | | | 5-1-2026 | | | | 1,598 | | | | 1,730 | |
FHLMC | | | 8.50 | | | | 8-1-2026 | | | | 5,256 | | | | 5,334 | |
FHLMC | | | 8.50 | | | | 8-1-2026 | | | | 19,089 | | | | 19,156 | |
FHLMC | | | 9.00 | | | | 8-1-2019 | | | | 6 | | | | 6 | |
FHLMC | | | 9.00 | | | | 12-1-2019 | | | | 47 | | | | 48 | |
FHLMC | | | 9.00 | | | | 1-1-2020 | | | | 5 | | | | 5 | |
FHLMC | | | 9.00 | | | | 2-1-2020 | | | | 58 | | | | 60 | |
FHLMC | | | 9.00 | | | | 3-1-2020 | | | | 371 | | | | 372 | |
FHLMC | | | 9.00 | | | | 9-1-2020 | | | | 59 | | | | 61 | |
FHLMC | | | 9.00 | | | | 9-1-2020 | | | | 349 | | | | 352 | |
FHLMC | | | 9.00 | | | | 12-1-2020 | | | | 12 | | | | 12 | |
FHLMC | | | 9.00 | | | | 3-1-2021 | | | | 1,108 | | | | 1,118 | |
FHLMC | | | 9.00 | | | | 4-1-2021 | | | | 2,663 | | | | 2,677 | |
FHLMC | | | 9.00 | | | | 4-1-2021 | | | | 1,911 | | | | 1,924 | |
FHLMC | | | 9.00 | | | | 4-1-2021 | | | | 113 | | | | 119 | |
FHLMC | | | 9.00 | | | | 7-1-2021 | | | | 2,214 | | | | 2,222 | |
FHLMC | | | 9.00 | | | | 7-1-2021 | | | | 2,433 | | | | 2,461 | |
FHLMC | | | 9.00 | | | | 8-1-2021 | | | | 218 | | | | 231 | |
FHLMC | | | 9.00 | | | | 7-1-2022 | | | | 283 | | | | 286 | |
FHLMC | | | 9.00 | | | | 9-1-2024 | | | | 369 | | | | 373 | |
FHLMC | | | 9.50 | | | | 8-1-2018 | | | | 2 | | | | 2 | |
FHLMC | | | 9.50 | | | | 8-1-2019 | | | | 16 | | | | 17 | |
FHLMC | | | 9.50 | | | | 2-1-2020 | | | | 1 | | | | 1 | |
FHLMC | | | 9.50 | | | | 6-1-2020 | | | | 22 | | | | 22 | |
FHLMC | | | 9.50 | | | | 8-1-2020 | | | | 91 | | | | 95 | |
FHLMC | | | 9.50 | | | | 9-1-2020 | | | | 446 | | | | 450 | |
FHLMC | | | 9.50 | | | | 9-1-2020 | | | | 15 | | | | 15 | |
FHLMC | | | 9.50 | | | | 9-1-2020 | | | | 10 | | | | 10 | |
FHLMC | | | 9.50 | | | | 10-1-2020 | | | | 16 | | | | 16 | |
FHLMC | | | 9.50 | | | | 10-1-2020 | | | | 25 | | | | 26 | |
FHLMC | | | 9.50 | | | | 11-1-2020 | | | | 36 | | | | 38 | |
The accompanying notes are an integral part of these financial statements.
| | | | | | |
| Portfolio of investments—February 28, 2018 (unaudited) | | Wells Fargo Government Securities Fund | | | 9 | |
| | | | | | | | | | | | | | | | |
| Security name | | Interest rate | | | Maturity date | | | Principal | | | Value | |
| | | | |
Agency Securities (continued) | | | | | | | | | | | | | | | | |
FHLMC | | | 9.50 | % | | | 5-1-2021 | | | $ | 105 | | | $ | 111 | |
FHLMC | | | 9.50 | | | | 9-17-2022 | | | | 93,926 | | | | 93,327 | |
FHLMC | | | 9.50 | | | | 4-1-2025 | | | | 17,288 | | | | 17,547 | |
FHLMC | | | 10.00 | | | | 1-1-2019 | | | | 2 | | | | 2 | |
FHLMC | | | 10.00 | | | | 12-1-2019 | | | | 82 | | | | 84 | |
FHLMC | | | 10.00 | | | | 3-1-2020 | | | | 2 | | | | 2 | |
FHLMC | | | 10.00 | | | | 6-1-2020 | | | | 9 | | | | 9 | |
FHLMC | | | 10.00 | | | | 8-1-2020 | | | | 17 | | | | 17 | |
FHLMC | | | 10.00 | | | | 10-1-2021 | | | | 14,794 | | | | 14,926 | |
FHLMC | | | 10.00 | | | | 8-17-2022 | | | | 4,443 | | | | 4,423 | |
FHLMC | | | 10.00 | | | | 2-17-2025 | | | | 154,924 | | | | 158,298 | |
FHLMC | | | 10.50 | | | | 5-1-2019 | | | | 2 | | | | 2 | |
FHLMC | | | 10.50 | | | | 6-1-2019 | | | | 2 | | | | 2 | |
FHLMC | | | 10.50 | | | | 8-1-2019 | | | | 3,138 | | | | 3,161 | |
FHLMC | | | 10.50 | | | | 12-1-2019 | | | | 7,459 | | | | 7,478 | |
FHLMC | | | 10.50 | | | | 5-1-2020 | | | | 3,752 | | | | 3,789 | |
FHLMC | | | 10.50 | | | | 8-1-2020 | | | | 5,286 | | | | 5,322 | |
FHLMC | | | 10.50 | | | | 8-1-2020 | | | | 18,052 | | | | 18,052 | |
FHLMC Series 2015-SC01 Class 1A | | | 3.50 | | | | 5-25-2045 | | | | 2,578,074 | | | | 2,529,880 | |
FHLMC Series 2758 Class FH (1 Month LIBOR +0.35%) ± | | | 1.94 | | | | 3-15-2019 | | | | 268,321 | | | | 268,541 | |
FHLMC Series 2882 Class TF (1 Month LIBOR +0.25%) ± | | | 1.84 | | | | 10-15-2034 | | | | 497,568 | | | | 498,617 | |
FHLMC Series 3767 Class PD | | | 4.00 | | | | 7-15-2040 | | | | 54,489 | | | | 54,727 | |
FHLMC Series 3948 Class DA | | | 3.00 | | | | 12-15-2024 | | | | 288,432 | | | | 290,107 | |
FHLMC Series K020 Class X1 ±±(c) | | | 1.42 | | | | 5-25-2022 | | | | 45,093,062 | | | | 2,209,686 | |
FHLMC Series KJ14 Class A1 | | | 2.20 | | | | 11-25-2023 | | | | 5,325,233 | | | | 5,163,220 | |
FHLMC Series M036 Class A | | | 4.16 | | | | 12-15-2029 | | | | 3,870,000 | | | | 3,797,167 | |
FHLMC Series T-15 Class A6 (1 Month LIBOR +0.40%) ± | | | 1.96 | | | | 11-25-2028 | | | | 266,786 | | | | 265,394 | |
FHLMC Series T-23 Class A (1 Month LIBOR +0.28%) ± | | | 1.90 | | | | 5-25-2030 | | | | 677,892 | | | | 676,158 | |
FHLMC Series T-35 Class A (1 Month LIBOR +0.28%) ± | | | 1.90 | | | | 9-25-2031 | | | | 879,586 | | | | 869,901 | |
FHLMC Series T-42 Class A6 | | | 9.50 | | | | 2-25-2042 | | | | 860,220 | | | | 1,034,501 | |
FHLMC Series T-55 Class 2A1 ±± | | | 3.17 | | | | 3-25-2043 | | | | 488,403 | | | | 484,536 | |
FHLMC Series T-57 Class 1A1 | | | 6.50 | | | | 7-25-2043 | | | | 1,148,918 | | | | 1,298,029 | |
FHLMC Series T-57 Class 2A1 ±± | | | 3.70 | | | | 7-25-2043 | | | | 2,179,539 | | | | 2,304,225 | |
FHLMC Series T-62 Class 1A1 (12 Month Treasury Average +1.20%) ± | | | 2.26 | | | | 10-25-2044 | | | | 1,303,706 | | | | 1,321,716 | |
FHLMC Series T-67 Class 1A1C ±± | | | 3.41 | | | | 3-25-2036 | | | | 915,011 | | | | 940,846 | |
FHLMC Series T-67 Class 2A1C ±± | | | 3.30 | | | | 3-25-2036 | | | | 1,643,356 | | | | 1,676,616 | |
FHLMC Series T-75 Class A1 (1 Month LIBOR +0.04%) ± | | | 1.60 | | | | 12-25-2036 | | | | 1,674,833 | | | | 1,669,506 | |
FNMA ¤ | | | 0.00 | | | | 10-9-2019 | | | | 9,590,000 | | | | 9,229,553 | |
FNMA ¤ | | | 0.00 | | | | 5-15-2030 | | | | 7,700,000 | | | | 5,091,799 | |
FNMA ¤(a) | | | 0.00 | | | | 4-2-2018 | | | | 12,000,000 | | | | 11,988,947 | |
FNMA | | | 1.71 | | | | 12-1-2022 | | | | 3,875,418 | | | | 3,770,674 | |
FNMA | | | 1.78 | | | | 5-1-2020 | | | | 913,465 | | | | 894,705 | |
FNMA (1 Month LIBOR +0.25%) ± | | | 1.80 | | | | 6-27-2036 | | | | 122,931 | | | | 120,652 | |
FNMA (1 Month LIBOR +0.35%) ± | | | 1.97 | | | | 2-25-2032 | | | | 715,672 | | | | 720,932 | |
FNMA (1 Month LIBOR +0.48%) ± | | | 2.10 | | | | 9-25-2037 | | | | 3,181,219 | | | | 3,182,999 | |
FNMA (11th District Cost of Funds +1.27%) ± | | | 2.11 | | | | 5-1-2036 | | | | 1,691,659 | | | | 1,712,475 | |
FNMA | | | 2.13 | | | | 4-24-2026 | | | | 1,800,000 | | | | 1,687,423 | |
FNMA (1 Month LIBOR +0.55%) ± | | | 2.17 | | | | 4-25-2050 | | | | 2,321,121 | | | | 2,325,298 | |
FNMA (11th District Cost of Funds +1.66%) ± | | | 2.40 | | | | 5-1-2023 | | | | 265,054 | | | | 264,767 | |
FNMA (11th District Cost of Funds +1.25%) ± | | | 2.46 | | | | 9-1-2027 | | | | 224,214 | | | | 225,713 | |
The accompanying notes are an integral part of these financial statements.
| | | | |
| 10 | | Wells Fargo Government Securities Fund | | Portfolio of investments—February 28, 2018 (unaudited) |
| | | | | | | | | | | | | | | | |
| Security name | | Interest rate | | | Maturity date | | | Principal | | | Value | |
| | | | |
Agency Securities (continued) | | | | | | | | | | | | | | | | |
FNMA %% | | | 2.50 | % | | | 3-15-2033 | | | $ | 4,960,000 | | | $ | 4,838,131 | |
FNMA | | | 2.50 | | | | 4-25-2039 | | | | 95,621 | | | | 94,572 | |
FNMA (12 Month LIBOR +1.61%) ± | | | 2.50 | | | | 5-1-2046 | | | | 5,450,569 | | | | 5,419,212 | |
FNMA | | | 2.55 | | | | 3-1-2022 | | | | 1,631,776 | | | | 1,610,294 | |
FNMA | | | 2.56 | | | | 3-1-2021 | | | | 951,549 | | | | 941,354 | |
FNMA | | | 2.73 | | | | 1-1-2024 | | | | 488,042 | | | | 479,338 | |
FNMA ±± | | | 2.78 | | | | 2-25-2027 | | | | 10,000,000 | | | | 9,643,328 | |
FNMA | | | 2.86 | | | | 11-1-2021 | | | | 2,604,135 | | | | 2,597,531 | |
FNMA | | | 3.00 | | | | 5-1-2027 | | | | 1,713,700 | | | | 1,716,213 | |
FNMA %% | | | 3.00 | | | | 3-15-2033 | | | | 13,275,000 | | | | 13,220,034 | |
FNMA | | | 3.00 | | | | 4-1-2045 | | | | 141,087 | | | | 137,314 | |
FNMA | | | 3.00 | | | | 11-1-2045 | | | | 11,192,781 | | | | 10,865,137 | |
FNMA ## | | | 3.00 | | | | 12-1-2045 | | | | 25,751,411 | | | | 24,980,963 | |
FNMA | | | 3.00 | | | | 11-1-2046 | | | | 7,620,187 | | | | 7,392,201 | |
FNMA | | | 3.00 | | | | 12-1-2046 | | | | 844,736 | | | | 819,463 | |
FNMA | | | 3.02 | | | | 2-1-2026 | | | | 6,284,629 | | | | 6,211,757 | |
FNMA (11th District Cost of Funds +1.25%) ± | | | 3.14 | | | | 5-1-2036 | | | | 573,728 | | | | 598,618 | |
FNMA (1 Year Treasury Constant Maturity +2.22%) ± | | | 3.16 | | | | 6-1-2032 | | | | 120,665 | | | | 126,080 | |
FNMA (1 Year Treasury Constant Maturity +2.21%) ± | | | 3.19 | | | | 9-1-2031 | | | | 32,924 | | | | 34,645 | |
FNMA (1 Year Treasury Constant Maturity +2.23%) ± | | | 3.29 | | | | 12-1-2040 | | | | 26,933 | | | | 28,287 | |
FNMA (1 Year Treasury Constant Maturity +2.30%) ± | | | 3.30 | | | | 6-1-2034 | | | | 480,551 | | | | 504,379 | |
FNMA (12 Month LIBOR +1.54%) ± | | | 3.30 | | | | 1-1-2043 | | | | 409,443 | | | | 420,254 | |
FNMA | | | 3.31 | | | | 9-25-2020 | | | | 4,324,773 | | | | 4,366,255 | |
FNMA | | | 3.36 | | | | 1-1-2024 | | | | 6,267,357 | | | | 6,310,175 | |
FNMA (1 Year Treasury Constant Maturity +2.27%) ± | | | 3.36 | | | | 9-1-2031 | | | | 301,560 | | | | 314,591 | |
FNMA | | | 3.38 | | | | 9-1-2020 | | | | 1,910,775 | | | | 1,939,305 | |
FNMA (12 Month LIBOR +1.64%) ± | | | 3.39 | | | | 4-1-2032 | | | | 89,808 | | | | 91,233 | |
FNMA (1 Year Treasury Constant Maturity +2.19%) ± | | | 3.43 | | | | 11-1-2031 | | | | 132,967 | | | | 139,135 | |
FNMA (12 Month LIBOR +1.73%) ± | | | 3.48 | | | | 9-1-2036 | | | | 700,349 | | | | 734,064 | |
FNMA | | | 3.49 | | | | 12-1-2020 | | | | 3,448,012 | | | | 3,509,978 | |
FNMA %% | | | 3.50 | | | | 3-15-2033 | | | | 16,320,000 | | | | 16,594,005 | |
FNMA | | | 3.50 | | | | 2-1-2043 | | | | 71,861 | | | | 72,175 | |
FNMA | | | 3.50 | | | | 2-1-2045 | | | | 2,236,221 | | | | 2,237,798 | |
FNMA | | | 3.50 | | | | 4-1-2045 | | | | 6,300,437 | | | | 6,295,485 | |
FNMA | | | 3.50 | | | | 8-1-2045 | | | | 783,059 | | | | 782,683 | |
FNMA | | | 3.50 | | | | 12-1-2045 | | | | 3,065,325 | | | | 3,064,486 | |
FNMA | | | 3.50 | | | | 2-1-2046 | | | | 4,672,474 | | | | 4,671,433 | |
FNMA | | | 3.50 | | | | 5-1-2046 | | | | 6,828,662 | | | | 6,827,144 | |
FNMA %% | | | 3.50 | | | | 3-13-2048 | | | | 9,950,000 | | | | 9,932,898 | |
FNMA (1 Year Treasury Constant Maturity +2.23%) ± | | | 3.50 | | | | 12-1-2034 | | | | 889,740 | | | | 929,810 | |
FNMA (12 Month LIBOR +1.82%) ± | | | 3.57 | | | | 8-1-2036 | | | | 1,003,829 | | | | 1,055,471 | |
FNMA (1 Year Treasury Constant Maturity +2.43%) ± | | | 3.57 | | | | 10-1-2027 | | | | 166,435 | | | | 172,167 | |
FNMA (1 Year Treasury Constant Maturity +2.03%) ± | | | 3.89 | | | | 2-1-2027 | | | | 49,484 | | | | 49,672 | |
FNMA | | | 4.00 | | | | 5-1-2021 | | | | 323,078 | | | | 330,922 | |
FNMA | | | 4.00 | | | | 10-25-2025 | | | | 991,080 | | | | 23,879 | |
FNMA ## | | | 4.00 | | | | 4-1-2046 | | | | 17,565,399 | | | | 18,012,300 | |
FNMA | | | 4.00 | | | | 3-1-2047 | | | | 1,697,123 | | | | 1,756,246 | |
FNMA %% | | | 4.00 | | | | 3-13-2048 | | | | 6,475,000 | | | | 6,632,954 | |
FNMA (1 Year Treasury Constant Maturity +2.31%) ± | | | 4.22 | | | | 7-1-2026 | | | | 153,557 | | | | 160,121 | |
FNMA | | | 4.50 | | | | 12-1-2018 | | | | 80,411 | | | | 80,934 | |
The accompanying notes are an integral part of these financial statements.
| | | | | | |
| Portfolio of investments—February 28, 2018 (unaudited) | | Wells Fargo Government Securities Fund | | | 11 | |
| | | | | | | | | | | | | | | | |
| Security name | | Interest rate | | | Maturity date | | | Principal | | | Value | |
| | | | |
Agency Securities (continued) | | | | | | | | | | | | | | | | |
FNMA | | | 4.50 | % | | | 1-1-2026 | | | $ | 879,179 | | | $ | 884,904 | |
FNMA | | | 4.50 | | | | 10-1-2046 | | | | 557,811 | | | | 584,784 | |
FNMA %% | | | 4.50 | | | | 3-13-2048 | | | | 34,002,000 | | | | 35,610,454 | |
FNMA | | | 4.68 | | | | 2-1-2020 | | | | 3,078,801 | | | | 3,191,309 | |
FNMA | | | 4.79 | | | | 5-1-2019 | | | | 2,031,974 | | | | 2,065,993 | |
FNMA | | | 5.00 | | | | 12-1-2018 | | | | 50,782 | | | | 51,424 | |
FNMA | | | 5.00 | | | | 6-1-2019 | | | | 18,147 | | | | 18,376 | |
FNMA | | | 5.00 | | | | 4-1-2023 | | | | 308,234 | | | | 321,298 | |
FNMA | | | 5.00 | | | | 6-1-2023 | | | | 534,561 | | | | 561,232 | |
FNMA (6 Month LIBOR +2.86%) ± | | | 5.00 | | | | 4-1-2033 | | | | 21,192 | | | | 21,953 | |
FNMA | | | 5.00 | | | | 3-1-2034 | | | | 551,929 | | | | 595,690 | |
FNMA | | | 5.00 | | | | 8-1-2040 | | | | 7,052,488 | | | | 7,657,589 | |
FNMA | | | 5.00 | | | | 10-1-2040 | | | | 778,040 | | | | 840,861 | |
FNMA | | | 5.00 | | | | 1-1-2042 | | | | 660,839 | | | | 714,132 | |
FNMA (6 Month LIBOR +3.13%) ± | | | 5.36 | | | | 7-1-2033 | | | | 145,171 | | | | 148,841 | |
FNMA | | | 5.39 | | | | 1-1-2024 | | | | 1,822,258 | | | | 1,928,746 | |
FNMA | | | 5.50 | | | | 6-1-2020 | | | | 227,332 | | | | 231,660 | |
FNMA | | | 5.50 | | | | 11-1-2023 | | | | 85,398 | | | | 89,521 | |
FNMA | | | 5.50 | | | | 1-1-2025 | | | | 46,611 | | | | 48,523 | |
FNMA | | | 5.50 | | | | 1-1-2025 | | | | 215,602 | | | | 225,105 | |
FNMA | | | 5.50 | | | | 9-1-2033 | | | | 2,106,201 | | | | 2,315,095 | |
FNMA | | | 5.50 | | | | 9-1-2033 | | | | 904,140 | | | | 992,944 | |
FNMA | | | 5.50 | | | | 8-1-2035 | | | | 637,131 | | | | 699,737 | |
FNMA | | | 5.50 | | | | 1-1-2037 | | | | 664,915 | | | | 730,436 | |
FNMA | | | 5.50 | | | | 4-1-2040 | | | | 1,723,350 | | | | 1,893,823 | |
FNMA | | | 5.55 | | | | 9-1-2019 | | | | 51,573 | | | | 51,504 | |
FNMA | | | 5.61 | | | | 2-1-2021 | | | | 1,378,750 | | | | 1,421,037 | |
FNMA | | | 5.67 | | | | 11-1-2021 | | | | 5,120,291 | | | | 5,384,155 | |
FNMA | | | 5.75 | | | | 5-1-2021 | | | | 3,213,652 | | | | 3,379,192 | |
FNMA | | | 5.95 | | | | 6-1-2024 | | | | 1,629,978 | | | | 1,750,619 | |
FNMA | | | 6.00 | | | | 3-1-2024 | | | | 74,392 | | | | 82,539 | |
FNMA | | | 6.00 | | | | 1-1-2028 | | | | 1,060,464 | | | | 1,177,362 | |
FNMA | | | 6.00 | | | | 2-1-2035 | | | | 1,434,057 | | | | 1,557,101 | |
FNMA | | | 6.00 | | | | 11-1-2037 | | | | 498,449 | | | | 555,699 | |
FNMA | | | 6.00 | | | | 7-1-2038 | | | | 206,466 | | | | 230,409 | |
FNMA %% | | | 6.00 | | | | 3-13-2048 | | | | 11,085,000 | | | | 12,310,845 | |
FNMA | | | 6.08 | | | | 1-1-2019 | | | | 200,216 | | | | 199,949 | |
FNMA | | | 6.50 | | | | 1-1-2024 | | | | 25,953 | | | | 28,905 | |
FNMA | | | 6.50 | | | | 3-1-2028 | | | | 29,757 | | | | 31,468 | |
FNMA | | | 6.50 | | | | 12-1-2029 | | | | 245,910 | | | | 273,876 | |
FNMA | | | 6.50 | | | | 11-1-2031 | | | | 57,133 | | | | 63,631 | |
FNMA | | | 6.50 | | | | 7-1-2036 | | | | 419,630 | | | | 469,168 | |
FNMA | | | 6.50 | | | | 7-1-2036 | | | | 378,629 | | | | 424,841 | |
FNMA | | | 6.50 | | | | 7-25-2042 | | | | 1,579,593 | | | | 1,767,587 | |
FNMA | | | 7.00 | | | | 11-1-2026 | | | | 8,359 | | | | 9,028 | |
FNMA | | | 7.00 | | | | 9-1-2031 | | | | 4,335 | | | | 4,342 | |
FNMA | | | 7.00 | | | | 1-1-2032 | | | | 5,384 | | | | 5,930 | |
FNMA | | | 7.00 | | | | 2-1-2032 | | | | 96,208 | | | | 109,336 | |
FNMA | | | 7.00 | | | | 10-1-2032 | | | | 209,230 | | | | 238,584 | |
FNMA | | | 7.00 | | | | 2-1-2034 | | | | 2,040 | | | | 2,230 | |
The accompanying notes are an integral part of these financial statements.
| | | | |
| 12 | | Wells Fargo Government Securities Fund | | Portfolio of investments—February 28, 2018 (unaudited) |
| | | | | | | | | | | | | | | | |
| Security name | | Interest rate | | | Maturity date | | | Principal | | | Value | |
| | | | |
Agency Securities (continued) | | | | | | | | | | | | | | | | |
FNMA | | | 7.00 | % | | | 4-1-2034 | | | $ | 156,209 | | | $ | 178,378 | |
FNMA | | | 7.00 | | | | 1-1-2036 | | | | 6,436 | | | | 6,793 | |
FNMA | | | 7.00 | | | | 9-1-2036 | | | | 45,573 | | | | 46,719 | |
FNMA | | | 7.50 | | | | 9-1-2031 | | | | 99,535 | | | | 114,925 | |
FNMA | | | 7.50 | | | | 11-25-2031 | | | | 429,604 | | | | 489,565 | |
FNMA | | | 7.50 | | | | 2-1-2032 | | | | 34,064 | | | | 39,075 | |
FNMA | | | 7.50 | | | | 10-1-2037 | | | | 1,008,266 | | | | 1,168,521 | |
FNMA | | | 8.00 | | | | 5-1-2027 | | | | 35,145 | | | | 35,540 | |
FNMA | | | 8.00 | | | | 10-1-2027 | | | | 3,021 | | | | 3,035 | |
FNMA | | | 8.00 | | | | 6-1-2028 | | | | 5,502 | | | | 6,009 | |
FNMA | | | 8.00 | | | | 2-1-2030 | | | | 57,183 | | | | 62,100 | |
FNMA | | | 8.00 | | | | 7-1-2031 | | | | 1,251,929 | | | | 1,434,481 | |
FNMA | | | 8.50 | | | | 8-1-2024 | | | | 22,003 | | | | 23,655 | |
FNMA | | | 8.50 | | | | 5-1-2026 | | | | 114,905 | | | | 124,628 | |
FNMA | | | 8.50 | | | | 7-1-2026 | | | | 24,391 | | | | 25,268 | |
FNMA | | | 8.50 | | | | 8-1-2026 | | | | 12,445 | | | | 12,566 | |
FNMA | | | 8.50 | | | | 10-1-2026 | | | | 62 | | | | 62 | |
FNMA | | | 8.50 | | | | 10-1-2026 | | | | 5,039 | | | | 5,053 | |
FNMA | | | 8.50 | | | | 11-1-2026 | | | | 28,820 | | | | 29,302 | |
FNMA | | | 8.50 | | | | 11-1-2026 | | | | 8,157 | | | | 8,432 | |
FNMA | | | 8.50 | | | | 12-1-2026 | | | | 149,444 | | | | 167,877 | |
FNMA | | | 8.50 | | | | 12-1-2026 | | | | 16,645 | | | | 18,319 | |
FNMA | | | 8.50 | | | | 12-1-2026 | | | | 272 | | | | 273 | |
FNMA | | | 8.50 | | | | 2-1-2027 | | | | 235 | | | | 259 | |
FNMA | | | 8.50 | | | | 2-1-2027 | | | | 6,821 | | | | 6,840 | |
FNMA | | | 8.50 | | | | 3-1-2027 | | | | 809 | | | | 859 | |
FNMA | | | 8.50 | | | | 6-1-2027 | | | | 69,602 | | | | 72,156 | |
FNMA | | | 8.50 | | | | 7-1-2029 | | | | 834 | | | | 837 | |
FNMA | | | 9.00 | | | | 3-1-2021 | | | | 7,911 | | | | 7,979 | |
FNMA | | | 9.00 | | | | 6-1-2021 | | | | 86 | | | | 91 | |
FNMA | | | 9.00 | | | | 7-1-2021 | | | | 7,000 | | | | 7,046 | |
FNMA | | | 9.00 | | | | 8-1-2021 | | | | 108 | | | | 114 | |
FNMA | | | 9.00 | | | | 10-1-2021 | | | | 1,133 | | | | 1,142 | |
FNMA | | | 9.00 | | | | 1-1-2025 | | | | 17,206 | | | | 18,770 | |
FNMA | | | 9.00 | | | | 3-1-2025 | | | | 1,991 | | | | 2,008 | |
FNMA | | | 9.00 | | | | 3-1-2025 | | | | 1,081 | | | | 1,084 | |
FNMA | | | 9.00 | | | | 4-1-2025 | | | | 1,233 | | | | 1,236 | |
FNMA | | | 9.00 | | | | 7-1-2028 | | | | 5,186 | | | | 5,243 | |
FNMA | | | 9.50 | | | | 11-1-2020 | | | | 67 | | | | 71 | |
FNMA | | | 9.50 | | | | 12-15-2020 | | | | 12,310 | | | | 12,474 | |
FNMA | | | 9.50 | | | | 1-1-2021 | | | | 9,992 | | | | 10,132 | |
FNMA | | | 9.50 | | | | 6-1-2022 | | | | 674 | | | | 680 | |
FNMA | | | 9.50 | | | | 7-1-2028 | | | | 6,161 | | | | 6,182 | |
FNMA | | | 10.00 | | | | 12-1-2020 | | | | 8,271 | | | | 8,343 | |
FNMA | | | 11.00 | | | | 10-15-2020 | | | | 519 | | | | 528 | |
FNMA Series 1988-7 Class Z | | | 9.25 | | | | 4-25-2018 | | | | 71 | | | | 72 | |
FNMA Series 1989-10 Class Z | | | 9.50 | | | | 3-25-2019 | | | | 16,189 | | | | 16,549 | |
FNMA Series 1989-100 Class Z | | | 8.75 | | | | 12-25-2019 | | | | 10,118 | | | | 10,461 | |
FNMA Series 1989-12 Class Y | | | 10.00 | | | | 3-25-2019 | | | | 16,106 | | | | 16,486 | |
FNMA Series 1989-22 Class G | | | 10.00 | | | | 5-25-2019 | | | | 36,786 | | | | 37,775 | |
The accompanying notes are an integral part of these financial statements.
| | | | | | |
| Portfolio of investments—February 28, 2018 (unaudited) | | Wells Fargo Government Securities Fund | | | 13 | |
| | | | | | | | | | | | | | | | |
| Security name | | Interest rate | | | Maturity date | | | Principal | | | Value | |
| | | | |
Agency Securities (continued) | | | | | | | | | | | | | | | | |
FNMA Series 1989-63 Class Z | | | 9.40 | % | | | 10-25-2019 | | | $ | 1,841 | | | $ | 1,900 | |
FNMA Series 1989-98 Class E | | | 9.20 | | | | 12-25-2019 | | | | 12,380 | | | | 12,657 | |
FNMA Series 1990-144 Class W | | | 9.50 | | | | 12-25-2020 | | | | 28,548 | | | | 30,585 | |
FNMA Series 1990-75 Class Z | | | 9.50 | | | | 7-25-2020 | | | | 52,390 | | | | 55,444 | |
FNMA Series 1990-84 Class Y | | | 9.00 | | | | 7-25-2020 | | | | 5,556 | | | | 5,822 | |
FNMA Series 1990-96 Class Z | | | 9.67 | | | | 8-25-2020 | | | | 80,283 | | | | 85,276 | |
FNMA Series 1991-5 Class Z | | | 8.75 | | | | 1-25-2021 | | | | 13,177 | | | | 13,721 | |
FNMA Series 1991-85 Class Z | | | 8.00 | | | | 6-25-2021 | | | | 22,598 | | | | 23,957 | |
FNMA Series 1992-45 Class Z | | | 8.00 | | | | 4-25-2022 | | | | 61,250 | | | | 65,649 | |
FNMA Series 1999-W6 Class A ±± | | | 9.16 | | | | 9-25-2028 | | | | 2,090 | | | | 2,093 | |
FNMA Series 2000-T6 Class A2 | | | 9.50 | | | | 11-25-2040 | | | | 786,868 | | | | 894,970 | |
FNMA Series 2001-T10 Class A3 | | | 9.50 | | | | 12-25-2041 | | | | 1,059,503 | | | | 1,219,247 | |
FNMA Series 2001-T12 Class A3 | | | 9.50 | | | | 8-25-2041 | | | | 277,049 | | | | 330,592 | |
FNMA Series 2002-T12 Class A5 ±± | | | 4.36 | | | | 10-25-2041 | | | | 1,025,367 | | | | 1,057,046 | |
FNMA Series 2002-T19 Class A1 | | | 6.50 | | | | 7-25-2042 | | | | 4,356,767 | | | | 4,931,050 | |
FNMA Series 2002-T5 Class A1 (1 Month LIBOR +0.12%) ± | | | 1.80 | | | | 5-25-2032 | | | | 243,253 | | | | 242,679 | |
FNMA Series 2002-W4 Class A4 | | | 6.25 | | | | 5-25-2042 | | | | 674,932 | | | | 744,172 | |
FNMA Series 2003-T2 Class A1 (1 Month LIBOR +0.14%) ± | | | 1.90 | | | | 3-25-2033 | | | | 1,121,452 | | | | 1,099,204 | |
FNMA Series 2003-W09 Class A (1 Month LIBOR +0.12%) ± | | | 1.74 | | | | 6-25-2033 | | | | 107,988 | | | | 105,968 | |
FNMA Series 2003-W1 Class 1A1 ±± | | | 5.44 | | | | 12-25-2042 | | | | 651,500 | | | | 684,807 | |
FNMA Series 2003-W11 Class A1 ±± | | | 4.55 | | | | 6-25-2033 | | | | 90,282 | | | | 94,180 | |
FNMA Series 2003-W3 Class 1A4 ±± | | | 3.74 | | | | 8-25-2042 | | | | 2,705,484 | | | | 2,835,603 | |
FNMA Series 2003-W5 Class A (1 Month LIBOR +0.11%) ± | | | 1.73 | | | | 4-25-2033 | | | | 354,299 | | | | 340,999 | |
FNMA Series 2003-W6 Class 6A ±± | | | 3.85 | | | | 8-25-2042 | | | | 1,685,693 | | | | 1,730,820 | |
FNMA Series 2003-W6 Class PT4 ±± | | | 8.32 | | | | 10-25-2042 | | | | 1,642,398 | | | | 1,990,900 | |
FNMA Series 2003-W8 Class PT1 ±± | | | 10.49 | | | | 12-25-2042 | | | | 619,495 | | | | 694,036 | |
FNMA Series 2004-79 Class FA (1 Month LIBOR +0.29%) ± | | | 1.91 | | | | 8-25-2032 | | | | 332,666 | | | | 333,202 | |
FNMA Series 2004-T1 Class 1A2 | | | 6.50 | | | | 1-25-2044 | | | | 621,484 | | | | 690,723 | |
FNMA Series 2004-W01 Class 2A2 | | | 7.00 | | | | 12-25-2033 | | | | 1,335,933 | | | | 1,514,917 | |
FNMA Series 2004-W15 Class 1A3 | | | 7.00 | | | | 8-25-2044 | | | | 837,409 | | | | 951,141 | |
FNMA Series 2005-71 Class DB | | | 4.50 | | | | 8-25-2025 | | | | 772,871 | | | | 792,893 | |
FNMA Series 2007-W10 Class 2A ±± | | | 6.34 | | | | 8-25-2047 | | | | 448,685 | | | | 481,817 | |
FNMA Series 2011-15 Class HI (c) | | | 5.50 | | | | 3-25-2026 | | | | 665,164 | | | | 34,366 | |
FNMA Series 2011-42 Class A | | | 3.00 | | | | 2-25-2024 | | | | 92,940 | | | | 93,057 | |
FNMA Series 2015-M10 Class FA (1 Month LIBOR +0.25%) ± | | | 1.81 | | | | 3-25-2019 | | | | 918,354 | | | | 917,879 | |
FNMA Series 265 Class 2 | | | 9.00 | | | | 3-25-2024 | | | | 85,745 | | | | 97,391 | |
FNMA Series G-8 Class E | | | 9.00 | | | | 4-25-2021 | | | | 42,063 | | | | 43,990 | |
FNMA Series G92-30 Class Z | | | 7.00 | | | | 6-25-2022 | | | | 58,979 | | | | 61,300 | |
FNMA Series G93-39 Class ZQ | | | 6.50 | | | | 12-25-2023 | | | | 1,263,581 | | | | 1,343,183 | |
GNMA (1 Year Treasury Constant Maturity +0.45%) ± | | | 2.07 | | | | 5-20-2066 | | | | 6,450,539 | | | | 6,472,429 | |
GNMA (1 Month LIBOR +0.70%) ± | | | 2.26 | | | | 8-20-2065 | | | | 3,795,750 | | | | 3,839,501 | |
GNMA (1 Month LIBOR +0.73%) ± | | | 2.29 | | | | 9-20-2063 | | | | 4,425,572 | | | | 4,461,215 | |
GNMA (1 Month LIBOR +0.90%) ± | | | 2.46 | | | | 8-20-2065 | | | | 4,018,752 | | | | 4,082,286 | |
GNMA (1 Month LIBOR +0.90%) ± | | | 2.46 | | | | 4-20-2066 | | | | 5,211,589 | | | | 5,299,309 | |
GNMA (1 Year Treasury Constant Maturity +1.50%) ± | | | 3.00 | | | | 8-20-2020 | | | | 57,997 | | | | 58,139 | |
GNMA | | | 3.00 | | | | 11-20-2045 | | | | 15,421,767 | | | | 15,097,140 | |
GNMA (1 Year Treasury Constant Maturity +1.50%) ± | | | 3.13 | | | | 11-20-2020 | | | | 35,442 | | | | 35,622 | |
GNMA %% | | | 3.50 | | | | 3-20-2048 | | | | 29,105,000 | | | | 29,267,578 | |
GNMA | | | 4.00 | | | | 12-20-2047 | | | | 15,579,819 | | | | 16,009,054 | |
GNMA | | | 5.00 | | | | 7-20-2040 | | | | 1,445,715 | | | | 1,550,994 | |
The accompanying notes are an integral part of these financial statements.
| | | | |
| 14 | | Wells Fargo Government Securities Fund | | Portfolio of investments—February 28, 2018 (unaudited) |
| | | | | | | | | | | | | | | | |
| Security name | | Interest rate | | | Maturity date | | | Principal | | | Value | |
| | | | |
Agency Securities (continued) | | | | | | | | | | | | | | | | |
GNMA | | | 5.50 | % | | | 4-20-2034 | | | $ | 1,059,628 | | | $ | 1,125,643 | |
GNMA | | | 6.00 | | | | 8-20-2034 | | | | 109,537 | | | | 114,247 | |
GNMA | | | 6.50 | | | | 12-15-2025 | | | | 26,487 | | | | 29,470 | |
GNMA | | | 6.50 | | | | 5-15-2029 | | | | 708 | | | | 787 | |
GNMA | | | 6.50 | | | | 5-15-2031 | | | | 1,310 | | | | 1,457 | |
GNMA | | | 6.50 | | | | 9-20-2033 | | | | 52,110 | | | | 58,674 | |
GNMA | | | 7.00 | | | | 12-15-2022 | | | | 24,120 | | | | 25,181 | |
GNMA | | | 7.00 | | | | 5-15-2026 | | | | 2,478 | | | | 2,624 | |
GNMA | | | 7.00 | | | | 3-15-2028 | | | | 40,417 | | | | 42,891 | |
GNMA | | | 7.00 | | | | 4-15-2031 | | | | 1,011 | | | | 1,029 | |
GNMA | | | 7.00 | | | | 8-15-2031 | | | | 19,800 | | | | 20,566 | |
GNMA | | | 7.00 | | | | 3-15-2032 | | | | 14,810 | | | | 15,090 | |
GNMA | | | 7.34 | | | | 10-20-2021 | | | | 32,107 | | | | 32,429 | |
GNMA | | | 7.34 | | | | 2-20-2022 | | | | 5,221 | | | | 5,232 | |
GNMA | | | 7.34 | | | | 9-20-2022 | | | | 9,428 | | | | 9,450 | |
GNMA | | | 8.00 | | | | 6-15-2023 | | | | 3,592 | | | | 3,825 | |
GNMA | | | 8.00 | | | | 12-15-2023 | | | | 220,710 | | | | 240,353 | |
GNMA | | | 8.00 | | | | 2-15-2024 | | | | 722 | | | | 772 | |
GNMA | | | 8.00 | | | | 9-15-2024 | | | | 3,434 | | | | 3,506 | |
GNMA | | | 8.00 | | | | 6-15-2025 | | | | 66 | | | | 66 | |
GNMA | | | 8.35 | | | | 4-15-2020 | | | | 69,075 | | | | 70,699 | |
GNMA | | | 8.40 | | | | 5-15-2020 | | | | 51,657 | | | | 52,979 | |
GNMA | | | 9.50 | | | | 10-20-2019 | | | | 5,808 | | | | 5,826 | |
GNMA Series 2002-53 Class IO ±±(c) | | | 0.60 | | | | 4-16-2042 | | | | 428,604 | | | | 21 | |
GNMA Series 2005-23 Class IO ±±(c) | | | 0.01 | | | | 6-17-2045 | | | | 3,103,339 | | | | 1,036 | |
GNMA Series 2006-32 Class C ±± | | | 5.37 | | | | 11-16-2038 | | | | 1,727,696 | | | | 1,741,956 | |
GNMA Series 2006-32 Class XM ±±(c) | | | 0.02 | | | | 11-16-2045 | | | | 9,203,073 | | | | 6,210 | |
GNMA Series 2006-68 Class D ±± | | | 5.31 | | | | 12-16-2037 | | | | 1,181,492 | | | | 1,190,970 | |
GNMA Series 2007-69 Class D ±± | | | 5.25 | | | | 6-16-2041 | | | | 677,361 | | | | 696,830 | |
GNMA Series 2008-22 Class XM ±±(c) | | | 0.90 | | | | 2-16-2050 | | | | 18,249,548 | | | | 425,550 | |
GNMA Series 2012-12 Class HD | | | 2.00 | | | | 5-20-2062 | | | | 1,844,430 | | | | 1,831,872 | |
GNMA Series 2016-H07 Class FE (1 Month LIBOR +1.15%) ± | | | 2.71 | | | | 3-20-2066 | | | | 4,535,382 | | | | 4,662,758 | |
GNMA Series 2016-H07 Class FH (1 Month LIBOR +1.00%) ± | | | 2.56 | | | | 2-20-2066 | | | | 4,098,526 | | | | 4,185,438 | |
Resolution Funding Corporation STRIPS ¤ | | | 0.00 | | | | 10-15-2019 | | | | 20,805,000 | | | | 20,050,090 | |
Resolution Funding Corporation STRIPS ¤ | | | 0.00 | | | | 7-15-2020 | | | | 24,300,000 | | | | 23,019,994 | |
Resolution Funding Corporation STRIPS ¤ | | | 0.00 | | | | 4-15-2030 | | | | 6,100,000 | | | | 4,079,867 | |
TVA ¤ | | | 0.00 | | | | 11-1-2025 | | | | 10,000,000 | | | | 7,799,882 | |
TVA | | | 2.88 | | | | 2-1-2027 | | | | 7,080,000 | | | | 6,963,215 | |
TVA | | | 4.63 | | | | 9-15-2060 | | | | 7,550,000 | | | | 8,917,464 | |
TVA | | | 5.38 | | | | 4-1-2056 | | | | 4,900,000 | | | | 6,498,385 | |
| |
Total Agency Securities (Cost $672,953,430) | | | | 668,964,212 | |
| | | | | | | | | | | | | | | | |
| | | | |
Asset-Backed Securities: 1.49% | | | | | | | | | | | | | | | | |
Chesapeake Funding LLC Series 2017-3A Class A 144A | | | 1.91 | | | | 8-15-2029 | | | | 6,900,000 | | | | 6,842,936 | |
MMAF Equipment Finance LLC Series 2017-AA Class A4 144A | | | 2.41 | | | | 8-16-2024 | | | | 4,445,000 | | | | 4,369,214 | |
| | | | |
Total Asset-Backed Securities (Cost $11,343,758) | | | | | | | | | | | | | | | 11,212,150 | |
| | | | | | | | | | | | | | | | |
The accompanying notes are an integral part of these financial statements.
| | | | | | |
| Portfolio of investments—February 28, 2018 (unaudited) | | Wells Fargo Government Securities Fund | | | 15 | |
| | | | | | | | | | | | | | | | |
| Security name | | Interest rate | | | Maturity date | | | Principal | | | Value | |
| | | | |
Corporate Bonds and Notes: 1.07% | | | | | | | | | | | | | | | | |
| | | | |
Utilities: 1.07 | | | | | | | | | | | | | | | | |
| | | | |
| Electric Utilities: 1.07% | | | | | | | | | | | | | | | | |
Cleveland Thermal LLC | | | 6.25 | % | | | 11-1-2018 | | | $ | 205,000 | | | $ | 209,721 | |
Cleveland Thermal LLC | | | 7.75 | | | | 11-1-2025 | | | | 2,665,000 | | | | 2,831,868 | |
Cleveland Thermal LLC | | | 8.00 | | | | 11-1-2028 | | | | 1,800,000 | | | | 1,915,645 | |
Cleveland Thermal LLC | | | 8.25 | | | | 11-1-2037 | | | | 2,880,000 | | | | 3,069,734 | |
| |
Total Corporate Bonds and Notes (Cost $8,830,368) | | | | 8,026,968 | |
| | | | | | | | | | | | | | | | |
| | | | |
Municipal Obligations: 1.91% | | | | | | | | | | | | | | | | |
| | | | |
| Iowa: 1.04% | | | | | | | | | | | | | | | | |
Iowa Finance Authority Midwestern Disaster Area Project (Industrial Development Revenue, Korea Development Bank LOC) ø | | | 1.27 | | | | 4-1-2022 | | | | 7,815,000 | | | | 7,815,000 | |
| | | | | | | | | | | | | | | | |
| | | | |
| Texas: 0.87% | | | | | | | | | | | | | | | | |
San Antonio TX Retama Development Corporation (Miscellaneous Revenue) | | | 10.00 | | | | 12-15-2020 | | | | 5,405,000 | | | | 6,597,181 | |
| | | | | | | | | | | | | | | | |
| |
Total Municipal Obligations (Cost $13,875,118) | | | | 14,412,181 | |
| | | | | | | | | | | | | | | | |
| | | | |
Non-Agency Mortgage-Backed Securities: 4.22% | | | | | | | | | | | | | | | | |
CD Commercial Mortgage Trust Series 2017-6 Class A5 | | | 3.46 | | | | 11-13-2050 | | | | 2,340,000 | | | | 2,319,025 | |
CGBAM Commercial Mortgage Trust Series 2015-SMRT Class A 144A | | | 2.81 | | | | 4-10-2028 | | | | 5,000,000 | | | | 4,989,591 | |
GAHR Commercial Mortgage Trust Series 2015-NRF Class AFX 144A | | | 3.23 | | | | 12-15-2034 | | | | 4,195,000 | | | | 4,213,534 | |
GS Mortgage Securities Trust Series 2013-G1 Class A2 144A ±± | | | 3.56 | | | | 4-10-2031 | | | | 5,349,842 | | | | 5,172,735 | |
JPMBB Commercial Mortgage Securities Corporation
Series 2015-C28 Class A4 | | | 3.23 | | | | 10-15-2048 | | | | 5,000,000 | | | | 4,929,457 | |
Morgan Stanley Capital I Trust Series 2011-C2 Class A4 144A | | | 4.66 | | | | 6-15-2044 | | | | 4,900,000 | | | | 5,106,727 | |
UBS Commercial Mortgage Trust Series 2017-C5 Class A5 | | | 3.47 | | | | 11-15-2050 | | | | 2,581,000 | | | | 2,556,530 | |
Vendee Mortgage Trust Series 1995-1 Class 4 ±± | | | 8.31 | | | | 2-15-2025 | | | | 177,620 | | | | 197,604 | |
Vendee Mortgage Trust Series 1995-2C Class 3A | | | 8.79 | | | | 6-15-2025 | | | | 256,049 | | | | 290,344 | |
Vendee Mortgage Trust Series 2011-1 Class DA | | | 3.75 | | | | 2-15-2035 | | | | 1,946,049 | | | | 1,977,021 | |
| |
Total Non-Agency Mortgage-Backed Securities (Cost $32,563,367) | | | | 31,752,568 | |
| | | | | | | | | | | | | | | | |
| | | | |
U.S. Treasury Securities: 9.97% | | | | | | | | | | | | | | | | |
U.S. Treasury Bond ## | | | 3.38 | | | | 5-15-2044 | | | | 3,295,000 | | | | 3,445,463 | |
U.S. Treasury Bond ## | | | 3.63 | | | | 8-15-2043 | | | | 5,170,000 | | | | 5,633,482 | |
U.S. Treasury Bond ## | | | 3.75 | | | | 11-15-2043 | | | | 24,730,000 | | | | 27,493,771 | |
U.S. Treasury Bond ## | | | 4.25 | | | | 11-15-2040 | | | | 1,590,000 | | | | 1,895,392 | |
U.S. Treasury Bond ## | | | 4.38 | | | | 2-15-2038 | | | | 3,500,000 | | | | 4,212,441 | |
U.S. Treasury Note ## | | | 1.75 | | | | 5-15-2023 | | | | 33,810,000 | | | | 32,288,550 | |
| | | | |
Total U.S. Treasury Securities (Cost $76,831,604) | | | | | | | | | | | | | | | 74,969,099 | |
| | | | | | | | | | | | | | | | |
| | | | |
Yankee Corporate Bonds and Notes: 1.47% | | | | | | | | | | | | | | | | |
| | | | |
Financials: 0.85% | | | | | | | | | | | | | | | | |
| | | | |
| Banks: 0.85% | | | | | | | | | | | | | | | | |
Royal Bank of Canada Incorporated | | | 2.00 | | | | 10-1-2018 | | | | 6,370,000 | | | | 6,360,714 | |
| | | | | | | | | | | | | | | | |
| | | | |
Industrials: 0.62% | | | | | | | | | | | | | | | | |
| | | | |
| Transportation Infrastructure: 0.62% | | | | | | | | | | | | | | | | |
Boldini Limited | | | 3.85 | | | | 1-19-2036 | | | | 4,875,000 | | | | 4,696,964 | |
| | | | | | | | | | | | | | | | |
| | | | |
Total Yankee Corporate Bonds and Notes (Cost $11,695,346) | | | | | | | | | | | | | | | 11,057,678 | |
| | | | | | | | | | | | | | | | |
The accompanying notes are an integral part of these financial statements.
| | | | |
| 16 | | Wells Fargo Government Securities Fund | | Portfolio of investments—February 28, 2018 (unaudited) |
| | | | | | | | | | | | | | | | |
| Security name | | Interest rate | | | Maturity date | | | Principal | | | Value | |
| | | | |
Yankee Government Bonds: 5.36% | | | | | | | | | | | | | | | | |
Hashemite Kingdom of Jordan | | | 3.00 | % | | | 6-30-2025 | | | $ | 9,800,000 | | | $ | 9,835,051 | |
State of Israel | | | 5.50 | | | | 12-4-2023 | | | | 9,030,000 | | | | 10,304,149 | |
State of Israel | | | 5.50 | | | | 9-18-2033 | | | | 7,390,000 | | | | 9,526,087 | |
Ukraine | | | 1.47 | | | | 9-29-2021 | | | | 11,090,000 | | | | 10,663,878 | |
| | | | |
Total Yankee Government Bonds (Cost $42,015,001) | | | | | | | | | | | | | | | 40,329,165 | |
| | | | | | | | | | | | | | | | |
| | | | |
| | | Yield | | | | | | Shares | | | | |
| Short-Term Investments: 2.31% | | | | | | | | | | | | | | | | |
| | | | |
| Investment Companies: 2.01% | | | | | | | | | | | | | | | | |
Wells Fargo Government Money Market Fund Select
Class (l)(u)## | | | 1.29 | | | | | | | | 15,145,655 | | | | 15,145,655 | |
| | | | | | | | | | | | | | | | |
| | | | |
| | | | | | | | | Principal | | | | |
| | | | |
| U.S. Treasury Securities: 0.30% | | | | | | | | | | | | | | | | |
U.S. Treasury Bill (z)# | | | 1.23 | | | | 3-15-2018 | | | $ | 2,225,000 | | | | 2,223,879 | |
| | | | | | | | | | | | | | | | |
| | | | |
Total Short-Term Investments (Cost $17,369,513) | | | | | | | | | | | | | | | 17,369,534 | |
| | | | | | | | | | | | | | | | |
| | | | | | | | |
| Total investments in securities (Cost $887,477,505) | | | 116.73 | % | | | 878,093,555 | |
Other assets and liabilities, net | | | (16.73 | ) | | | (125,850,831 | ) |
| | | | | | | | |
| Total net assets | | | 100.00 | % | | $ | 752,242,724 | |
| | | | | | | | |
| 144A | The security may be resold in transactions exempt from registration, normally to qualified institutional buyers, pursuant to Rule 144A under the Securities Act of 1933. |
| ± | Variable rate investment. The rate shown is the rate in effect at period end. |
| ±± | The coupon of the security is adjusted based on the principal and interest payments received from the underlying pool of mortgages as well as the credit quality and the actual prepayment speed of the underlying mortgages. |
| (c) | Investment in an interest-only security entitles holders to receive only the interest payments on the underlying mortgages. The principal amount shown is the notional amount of the underlying mortgages. The rate represents the coupon rate. |
| ¤ | The security is issued in zero coupon form with no periodic interest payments. |
| (a) | The security is fair valued in accordance with procedures approved by the Board of Trustees. |
| %% | The security is issued on a when-issued basis. |
| ## | All or a portion of this security is segregated for when-issued securities. |
| ø | Variable rate demand notes are subject to a demand feature which reduces the effective maturity. The maturity date shown represents the final maturity date of the security. The interest rate is determined and reset by the issuer daily, weekly, or monthly depending upon the terms of the security. The rate shown is the rate in effect at period end. |
| (l) | The issuer of the security is an affiliated person of the Fund as defined in the Investment Company Act of 1940. |
| (u) | The rate represents the 7-day annualized yield at period end. |
| (z) | Zero coupon security. The rate represents the current yield to maturity. |
| # | All or a portion of this security is segregated as collateral for investments in derivative instruments. |
Futures Contracts
| | | | | | | | | | | | | | | | | | | | | | | | |
| Description | | Number of
contracts | | | Expiration
date | | | Notional
cost | | | Notional
value | | | Unrealized
gains | | | Unrealized
losses | |
Long | | | | | | | | | | | | | | | | | | | | | | | | |
10-Year U.S. Treasury Notes | | | 68 | | | | 6-20-2018 | | | $ | 8,159,678 | | | $ | 8,163,188 | | | $ | 3,510 | | | $ | 0 | |
Ultra U.S. Treasury Bonds | | | 15 | | | | 6-20-2018 | | | | 2,306,543 | | | | 2,338,125 | | | | 31,582 | | | | 0 | |
Short | | | | | | | | | | | | | | | | | | | | | | | | |
U.S. Long Term Bonds | | | (29) | | | | 6-20-2018 | | | $ | (4,165,901 | ) | | $ | (4,159,688 | ) | | $ | 6,213 | | | $ | 0 | |
2-Year U.S. Treasury Notes | | | (216) | | | | 6-29-2018 | | | | (45,926,630 | ) | | | (45,893,250 | ) | | | 33,380 | | | | 0 | |
5-Year U.S. Treasury Notes | | | (36) | | | | 6-29-2018 | | | | (4,110,411 | ) | | | (4,101,469 | ) | | | 8,942 | | | | 0 | |
| | | | | | | | | | | | | | | | | | | | | | | | |
| | | | | | | | | | | | | | | | | | $ | 83,627 | | | $ | 0 | |
| | | | | | | | | | | | | | | | | | | | | | | | |
The accompanying notes are an integral part of these financial statements.
| | | | | | |
| Portfolio of investments—February 28, 2018 (unaudited) | | Wells Fargo Government Securities Fund | | | 17 | |
Investments in Affiliates
An affiliated investment is an investment in which the Fund owns at least 5% of the outstanding voting shares of the issuer or as a result of other relationships, such as the Fund and the issuer having the same investment manager. Transactions with issuers that were either affiliated persons of the Fund at the beginning of the period or the end of the period were as follows:
| | | | | | | | | | | | | | | | | | | | | | | | | | | | | | | | | | | | |
| | | Shares,
beginning of
period | | | Shares
purchased | | | Shares
sold | | | Shares,
end of
period | | | Net
realized
gains
(losses) | | | Net
change in
unrealized
gains
(losses) | | | Income
from
affiliated
securities | | | Value,
end
of period | | | % of
net
assets | |
Short-Term Investments | | | | | | | | | | | | | | | | | | | | | | | | | | | | | | | | | | | | |
Investment Companies | | | | | | | | | | | | | | | | | | | | | | | | | | | | | | | | | | | | |
Wells Fargo Government Money Market Fund Select Class | | | 7,067,691 | | | | 160,494,723 | | | | 152,416,759 | | | | 15,145,655 | | | $ | 0 | | | $ | 0 | | | $ | 83,212 | | | $ | 15,145,655 | | | | 2.01 | % |
The accompanying notes are an integral part of these financial statements.
| | | | |
| 18 | | Wells Fargo Government Securities Fund | | Statement of assets and liabilities—February 28, 2018 (unaudited) |
| | | | |
| | | | |
| |
Assets | | | | |
Investments in unaffiliated securities, at value (cost $872,331,850) | | $ | 862,947,900 | |
Investments in affiliated securities, at value (cost $15,145,655) | | | 15,145,655 | |
Segregated cash | | | 1,199,000 | |
Principal paydown receivable | | | 61,181 | |
Receivable for Fund shares sold | | | 590,239 | |
Receivable for interest | | | 3,387,511 | |
Receivable for daily variation margin on open futures contracts | | | 26,668 | |
Prepaid expenses and other assets | | | 61,311 | |
| | | | |
Total assets | | | 883,419,465 | |
| | | | |
| |
Liabilities | | | | |
Payable for investments purchased | | | 128,953,501 | |
Payable for Fund shares redeemed | | | 1,128,026 | |
Due to custodian bank | | | 490,000 | |
Management fee payable | | | 203,166 | |
Distributions payable | | | 142,743 | |
Administration fees payable | | | 73,145 | |
Payable for daily variation margin on open futures contracts | | | 28,750 | |
Distribution fee payable | | | 10,217 | |
Trustees’ fees and expenses payable | | | 2,289 | |
Accrued expenses and other liabilities | | | 144,904 | |
| | | | |
Total liabilities | | | 131,176,741 | |
| | | | |
Total net assets | | $ | 752,242,724 | |
| | | | |
| |
NET ASSETS CONSIST OF | | | | |
Paid-in capital | | $ | 791,075,629 | |
Overdistributed net investment income | | | (12,996,304 | ) |
Accumulated net realized losses on investments | | | (16,536,278 | ) |
Net unrealized losses on investments | | | (9,300,323 | ) |
| | | | |
Total net assets | | $ | 752,242,724 | |
| | | | |
| |
COMPUTATION OF NET ASSET VALUE AND OFFERING PRICE PER SHARE | | | | |
Net assets – Class A | | $ | 317,165,443 | |
Shares outstanding – Class A1 | | | 29,756,649 | |
Net asset value per share – Class A | | | $10.66 | |
Maximum offering price per share – Class A2 | | | $11.16 | |
Net assets – Class C | | $ | 17,527,607 | |
Shares outstanding – Class C1 | | | 1,644,692 | |
Net asset value per share – Class C | | | $10.66 | |
Net assets – Administrator Class | | $ | 220,897,719 | |
Shares outstanding – Administrator Class1 | | | 20,731,523 | |
Net asset value per share – Administrator Class | | | $10.66 | |
Net assets – Institutional Class | | $ | 196,651,955 | |
Shares outstanding – Institutional Class1 | | | 18,460,828 | |
Net asset value per share – Institutional Class | | | $10.65 | |
| 1 | The Fund has an unlimited number of authorized shares. |
| 2 | Maximum offering price is computed as 100/95.50 of net asset value. On investments of $50,000 or more, the offering price is reduced. |
The accompanying notes are an integral part of these financial statements.
| | | | | | |
| Statement of operations—six months ended February 28, 2018 (unaudited) | | Wells Fargo Government Securities Fund | | | 19 | |
| | | | |
| | | | |
| |
Investment income | | | | |
Interest | | $ | 11,463,874 | |
Income from affiliated securities | | | 83,212 | |
| | | | |
Total investment income | | | 11,547,086 | |
| | | | |
| |
Expenses | | | | |
Management fee | | | 1,942,398 | |
Administration fees | | | | |
Class A | | | 298,270 | |
Class C | | | 15,116 | |
Administrator Class | | | 105,472 | |
Institutional Class | | | 113,136 | |
Shareholder servicing fees | | | | |
Class A | | | 466,047 | |
Class C | | | 23,618 | |
Administrator Class | | | 263,681 | |
Distribution fee | | | | |
Class C | | | 70,854 | |
Custody and accounting fees | | | 37,813 | |
Professional fees | | | 38,405 | |
Registration fees | | | 53,084 | |
Shareholder report expenses | | | 33,054 | |
Trustees’ fees and expenses | | | 11,608 | |
Other fees and expenses | | | 4,501 | |
| | | | |
Total expenses | | | 3,477,057 | |
Less: Fee waivers and/or expense reimbursements | | | (387,501 | ) |
| | | | |
Net expenses | | | 3,089,556 | |
| | | | |
Net investment income | | | 8,457,530 | |
| | | | |
| |
REALIZED AND UNREALIZED GAINS (LOSSES) ON INVESTMENTS | | | | |
| |
Net realized gains (losses) on: | | | | |
Unaffiliated securities | | | (3,919,768 | ) |
Futures transactions | | | 543,137 | |
| | | | |
Net realized losses on investments | | | (3,376,631 | ) |
| | | | |
| |
Net change in unrealized gains (losses) on: | | | | |
Unaffiliated securities | | | (24,633,797 | ) |
Futures transactions | | | 8,817 | |
| | | | |
Net change in unrealized gains (losses) on investments | | | (24,624,980 | ) |
| | | | |
Net realized and unrealized gains (losses) on investments | | | (28,001,611 | ) |
| | | | |
Net decrease in net assets resulting from operations | | $ | (19,544,081 | ) |
| | | | |
The accompanying notes are an integral part of these financial statements.
| | | | |
| 20 | | Wells Fargo Government Securities Fund | | Statement of changes in net assets |
| | | | | | | | | | | | | | | | |
| | | Six months ended
February 28, 2018
(unaudited) | | | Year ended
August 31, 2017 | |
| | | | |
Operations | | | | | | | | | | | | | | | | |
Net investment income | | | | | | $ | 8,457,530 | | | | | | | $ | 17,271,849 | |
Net realized losses on investments | | | | | | | (3,376,631 | ) | | | | | | | (10,219,835 | ) |
Net change in unrealized gains (losses) on investments | | | | | | | (24,624,980 | ) | | | | | | | (14,516,843 | ) |
| | | | |
Net decrease in net assets resulting from operations | | | | | | | (19,544,081 | ) | | | | | | | (7,464,829 | ) |
| | | | |
| | | | |
Distributions to shareholders from | | | | | | | | | | | | | | | | |
Net investment income | | | | | | | | | | | | | | | | |
Class A | | | | | | | (3,309,386 | ) | | | | | | | (6,111,858 | ) |
Class B | | | | | | | N/A | | | | | | | | (161 | )1 |
Class C | | | | | | | (97,049 | ) | | | | | | | (153,118 | ) |
Administrator Class | | | | | | | (2,099,013 | ) | | | | | | | (3,440,050 | ) |
Institutional Class | | | | | | | (3,040,180 | ) | | | | | | | (7,854,351 | ) |
Net realized gains | | | | | | | | | | | | | | | | |
Class A | | | | | | | 0 | | | | | | | | (11,051,306 | ) |
Class C | | | | | | | 0 | | | | | | | | (620,183 | ) |
Administrator Class | | | | | | | 0 | | | | | | | | (5,318,345 | ) |
Institutional Class | | | | | | | 0 | | | | | | | | (11,260,803 | ) |
| | | | |
Total distributions to shareholders | | | | | | | (8,545,628 | ) | | | | | | | (45,810,175 | ) |
| | | | |
| | | | |
Capital share transactions | | | Shares | | | | | | | | Shares | | | | | |
Proceeds from shares sold | | | | | | | | | | | | | | | | |
Class A | | | 1,720,178 | | | | 18,677,105 | | | | 5,048,546 | | | | 55,448,268 | |
Class C | | | 34,788 | | | | 379,005 | | | | 136,498 | | | | 1,516,128 | |
Administrator Class | | | 4,845,898 | | | | 52,594,254 | | | | 4,525,225 | | | | 49,877,489 | |
Institutional Class | | | 4,614,446 | | | | 49,964,511 | | | | 7,840,553 | | | | 86,219,813 | |
| | | | |
| | | | | | | 121,614,875 | | | | | | | | 193,061,698 | |
| | | | |
Reinvestment of distributions | | | | | | | | | | | | | | | | |
Class A | | | 273,300 | | | | 2,962,373 | | | | 1,449,536 | | | | 15,775,799 | |
Class B | | | N/A | | | | N/A | | | | 13 | 1 | | | 140 | 1 |
Class C | | | 3,750 | | | | 40,622 | | | | 29,801 | | | | 323,374 | |
Administrator Class | | | 190,898 | | | | 2,066,815 | | | | 793,271 | | | | 8,634,028 | |
Institutional Class | | | 227,559 | | | | 2,469,632 | | | | 1,609,211 | | | | 17,516,581 | |
| | | | |
| | | | | | | 7,539,442 | | | | | | | | 42,249,922 | |
| | | | |
Payment for shares redeemed | | | | | | | | | | | | | | | | |
Class A | | | (8,079,146 | ) | | | (86,979,192 | ) | | | (12,626,464 | ) | | | (138,762,406 | ) |
Class B | | | N/A | | | | N/A | | | | (16,453 | )1 | | | (185,560 | )1 |
Class C | | | (222,505 | ) | | | (2,415,537 | ) | | | (691,050 | ) | | | (7,592,167 | ) |
Administrator Class | | | (2,341,059 | ) | | | (25,417,102 | ) | | | (7,198,458 | ) | | | (79,199,255 | ) |
Institutional Class | | | (24,272,896 | ) | | | (264,141,459 | ) | | | (13,914,348 | ) | | | (152,833,222 | ) |
| | | | |
| | | | | | | (378,953,290 | ) | | | | | | | (378,572,610 | ) |
| | | | |
Net decrease in net assets resulting from capital share transactions | | | | | | | (249,798,973 | ) | | | | | | | (143,260,990 | ) |
| | | | |
Total decrease in net assets | | | | | | | (277,888,682 | ) | | | | | | | (196,535,994 | ) |
| | | | |
| | | | |
Net assets | | | | | | | | | | | | | | | | |
Beginning of period | | | | | | | 1,030,131,406 | | | | | | | | 1,226,667,400 | |
| | | | |
End of period | | | | | | $ | 752,242,724 | | | | | | | $ | 1,030,131,406 | |
| | | | |
Overdistributed net investment income | | | | | | $ | (12,996,304 | ) | | | | | | $ | (12,908,206 | ) |
| | | | |
| 1 | For the period from September 1, 2016 to December 5, 2016. Effective at the close of business on December 5, 2016, Class B shares were converted to Class A shares and are no longer offered by the Fund. |
The accompanying notes are an integral part of these financial statements.
| | | | | | |
| Financial highlights | | Wells Fargo Government Securities Fund | | | 21 | |
(For a share outstanding throughout each period)
| | | | | | | | | | | | | | | | | | | | | | | | |
| | | Six months ended
February 28, 2018 (unaudited) | | | Year ended August 31 | |
| CLASS A | | | 2017 | | | 2016 | | | 2015 | | | 2014 | | | 2013 | |
Net asset value, beginning of period | | | $11.01 | | | | $11.51 | | | | $11.22 | | | | $11.11 | | | | $10.77 | | | | $11.48 | |
Net investment income | | | 0.10 | 1 | | | 0.15 | | | | 0.11 | 1 | | | 0.07 | 1 | | | 0.05 | | | | 0.07 | |
Net realized and unrealized gains (losses) on investments | | | (0.35 | ) | | | (0.22 | ) | | | 0.34 | | | | 0.13 | | | | 0.40 | | | | (0.42 | ) |
| | | | | | | | | | | | | | | | | | | | | | | | |
Total from investment operations | | | (0.25 | ) | | | (0.07 | ) | | | 0.45 | | | | 0.20 | | | | 0.45 | | | | (0.35 | ) |
Distributions to shareholders from | | | | | | | | | | | | | | | | | | | | | | | | |
Net investment income | | | (0.10 | ) | | | (0.16 | ) | | | (0.10 | ) | | | (0.09 | ) | | | (0.11 | ) | | | (0.09 | ) |
Net realized gains | | | 0.00 | | | | (0.27 | ) | | | (0.06 | ) | | | 0.00 | | | | 0.00 | | | | (0.27 | ) |
| | | | | | | | | | | | | | | | | | | | | | | | |
Total distributions to shareholders | | | (0.10 | ) | | | (0.43 | ) | | | (0.16 | ) | | | (0.09 | ) | | | (0.11 | ) | | | (0.36 | ) |
Net asset value, end of period | | | $10.66 | | | | $11.01 | | | | $11.51 | | | | $11.22 | | | | $11.11 | | | | $10.77 | |
Total return2 | | | (2.32 | )% | | | (0.52 | )% | | | 4.03 | % | | | 1.84 | % | | | 4.19 | % | | | (3.22 | )% |
Ratios to average net assets (annualized) | | | | | | | | | | | | | | | | | | | | | | | | |
Gross expenses | | | 0.89 | % | | | 0.88 | % | | | 0.87 | % | | | 0.87 | % | | | 0.88 | % | | | 0.85 | % |
Net expenses | | | 0.85 | % | | | 0.85 | % | | | 0.85 | % | | | 0.85 | % | | | 0.86 | % | | | 0.85 | % |
Net investment income | | | 1.77 | % | | | 1.38 | % | | | 0.94 | % | | | 0.59 | % | | | 0.56 | % | | | 0.67 | % |
Supplemental data | | | | | | | | | | | | | | | | | | | | | | | | |
Portfolio turnover rate | | | 104 | % | | | 299 | % | | | 397 | % | | | 349 | % | | | 349 | % | | | 341 | % |
Net assets, end of period (000s omitted) | | | $317,165 | | | | $394,645 | | | | $483,112 | | | | $232,545 | | | | $173,772 | | | | $202,955 | |
| 1 | Calculated based upon average shares outstanding |
| 2 | Total return calculations do not include any sales charges. Returns for periods of less than one year are not annualized. |
The accompanying notes are an integral part of these financial statements.
| | | | |
| 22 | | Wells Fargo Government Securities Fund | | Financial highlights |
(For a share outstanding throughout each period)
| | | | | | | | | | | | | | | | | | | | | | | | |
| | | Six months ended
February 28, 2018 (unaudited) | | | Year ended August 31 | |
| CLASS C | | | 2017 | | | 2016 | | | 2015 | | | 2014 | | | 2013 | |
Net asset value, beginning of period | | | $11.01 | | | | $11.51 | | | | $11.21 | | | | $11.11 | | | | $10.77 | | | | $11.48 | |
Net investment income (loss) | | | 0.05 | 1 | | | 0.07 | 1 | | | 0.02 | 1 | | | (0.01 | )1 | | | (0.02 | )1 | | | (0.02 | ) |
Net realized and unrealized gains (losses) on investments | | | (0.34 | ) | | | (0.23 | ) | | | 0.36 | | | | 0.12 | | | | 0.39 | | | | (0.42 | ) |
| | | | | | | | | | | | | | | | | | | | | | | | |
Total from investment operations | | | (0.29 | ) | | | (0.16 | ) | | | 0.38 | | | | 0.11 | | | | 0.37 | | | | (0.44 | ) |
Distributions to shareholders from | | | | | | | | | | | | | | | | | | | | | | | | |
Net investment income | | | (0.06 | ) | | | (0.07 | ) | | | (0.02 | ) | | | (0.01 | ) | | | (0.03 | ) | | | (0.00 | )2 |
Net realized gains | | | 0.00 | | | | (0.27 | ) | | | (0.06 | ) | | | 0.00 | | | | 0.00 | | | | (0.27 | ) |
| | | | | | | | | | | | | | | | | | | | | | | | |
Total distributions to shareholders | | | (0.06 | ) | | | (0.34 | ) | | | (0.08 | ) | | | (0.01 | ) | | | (0.03 | ) | | | (0.27 | ) |
Net asset value, end of period | | | $10.66 | | | | $11.01 | | | | $11.51 | | | | $11.21 | | | | $11.11 | | | | $10.77 | |
Total return3 | | | (2.68 | )% | | | (1.26 | )% | | | 3.25 | % | | | 1.08 | % | | | 3.42 | % | | | (3.94 | )% |
Ratios to average net assets (annualized) | | | | | | | | | | | | | | | | | | | | | | | | |
Gross expenses | | | 1.64 | % | | | 1.63 | % | | | 1.62 | % | | | 1.62 | % | | | 1.63 | % | | | 1.60 | % |
Net expenses | | | 1.60 | % | | | 1.60 | % | | | 1.60 | % | | | 1.60 | % | | | 1.61 | % | | | 1.60 | % |
Net investment income (loss) | | | 1.02 | % | | | 0.63 | % | | | 0.16 | % | | | (0.13 | )% | | | (0.20 | )% | | | (0.08 | )% |
Supplemental data | | | | | | | | | | | | | | | | | | | | | | | | |
Portfolio turnover rate | | | 104 | % | | | 299 | % | | | 397 | % | | | 349 | % | | | 349 | % | | | 341 | % |
Net assets, end of period (000s omitted) | | | $17,528 | | | | $20,132 | | | | $27,085 | | | | $26,981 | | | | $31,908 | | | | $44,647 | |
| 1 | Calculated based upon average shares outstanding |
| 2 | Amount is less than $0.005. |
| 3 | Total return calculations do not include any sales charges. Returns for periods of less than one year are not annualized. |
The accompanying notes are an integral part of these financial statements.
| | | | | | |
| Financial highlights | | Wells Fargo Government Securities Fund | | | 23 | |
(For a share outstanding throughout each period)
| | | | | | | | | | | | | | | | | | | | | | | | |
| | | Six months ended
February 28, 2018 (unaudited) | | | Year ended August 31 | |
| ADMINISTRATOR CLASS | | | 2017 | | | 2016 | | | 2015 | | | 2014 | | | 2013 | |
Net asset value, beginning of period | | | $11.01 | | | | $11.51 | | | | $11.21 | | | | $11.11 | | | | $10.76 | | | | $11.48 | |
Net investment income | | | 0.11 | 1 | | | 0.18 | 1 | | | 0.13 | | | | 0.10 | | | | 0.06 | | | | 0.09 | |
Net realized and unrealized gains (losses) on investments | | | (0.35 | ) | | | (0.23 | ) | | | 0.36 | | | | 0.12 | | | | 0.42 | | | | (0.43 | ) |
| | | | | | | | | | | | | | | | | | | | | | | | |
Total from investment operations | | | (0.24 | ) | | | (0.05 | ) | | | 0.49 | | | | 0.22 | | | | 0.48 | | | | (0.34 | ) |
Distributions to shareholders from | | | | | | | | | | | | | | | | | | | | | | | | |
Net investment income | | | (0.11 | ) | | | (0.18 | ) | | | (0.13 | ) | | | (0.12 | ) | | | (0.13 | ) | | | (0.11 | ) |
Net realized gains | | | 0.00 | | | | (0.27 | ) | | | (0.06 | ) | | | 0.00 | | | | 0.00 | | | | (0.27 | ) |
| | | | | | | | | | | | | | | | | | | | | | | | |
Total distributions to shareholders | | | (0.11 | ) | | | (0.45 | ) | | | (0.19 | ) | | | (0.12 | ) | | | (0.13 | ) | | | (0.38 | ) |
Net asset value, end of period | | | $10.66 | | | | $11.01 | | | | $11.51 | | | | $11.21 | | | | $11.11 | | | | $10.76 | |
Total return2 | | | (2.22 | )% | | | (0.31 | )% | | | 4.34 | % | | | 1.97 | % | | | 4.51 | % | | | (3.10 | )% |
Ratios to average net assets (annualized) | | | | | | | | | | | | | | | | | | | | | | | | |
Gross expenses | | | 0.83 | % | | | 0.82 | % | | | 0.81 | % | | | 0.80 | % | | | 0.81 | % | | | 0.79 | % |
Net expenses | | | 0.64 | % | | | 0.64 | % | | | 0.64 | % | | | 0.64 | % | | | 0.64 | % | | | 0.64 | % |
Net investment income | | | 1.98 | % | | | 1.60 | % | | | 1.13 | % | | | 0.82 | % | | | 0.79 | % | | | 0.88 | % |
Supplemental data | | | | | | | | | | | | | | | | | | | | | | | | |
Portfolio turnover rate | | | 104 | % | | | 299 | % | | | 397 | % | | | 349 | % | | | 349 | % | | | 341 | % |
Net assets, end of period (000s omitted) | | | $220,898 | | | | $198,520 | | | | $229,169 | | | | $216,428 | | | | $211,589 | | | | $339,446 | |
| 1 | Calculated based upon average shares outstanding |
| 2 | Returns for periods of less than one year are not annualized. |
The accompanying notes are an integral part of these financial statements.
| | | | |
| 24 | | Wells Fargo Government Securities Fund | | Financial highlights |
(For a share outstanding throughout each period)
| | | | | | | | | | | | | | | | | | | | | | | | |
| | | Six months ended
February 28, 2018 (unaudited) | | | Year ended August 31 | |
| INSTITUTIONAL CLASS | | | 2017 | | | 2016 | | | 2015 | | | 2014 | | | 2013 | |
Net asset value, beginning of period | | | $11.00 | | | | $11.50 | | | | $11.21 | | | | $11.10 | | | | $10.76 | | | | $11.47 | |
Net investment income | | | 0.11 | 1 | | | 0.19 | 1 | | | 0.15 | | | | 0.11 | 1 | | | 0.10 | | | | 0.11 | |
Net realized and unrealized gains (losses) on investments | | | (0.34 | ) | | | (0.22 | ) | | | 0.35 | | | | 0.14 | | | | 0.39 | | | | (0.42 | ) |
| | | | | | | | | | | | | | | | | | | | | | | | |
Total from investment operations | | | (0.23 | ) | | | (0.03 | ) | | | 0.50 | | | | 0.25 | | | | 0.49 | | | | (0.31 | ) |
Distributions to shareholders from | | | | | | | | | | | | | | | | | | | | | | | | |
Net investment income | | | (0.12 | ) | | | (0.20 | ) | | | (0.15 | ) | | | (0.14 | ) | | | (0.15 | ) | | | (0.13 | ) |
Net realized gains | | | 0.00 | | | | (0.27 | ) | | | (0.06 | ) | | | 0.00 | | | | 0.00 | | | | (0.27 | ) |
| | | | | | | | | | | | | | | | | | | | | | | | |
Total distributions to shareholders | | | (0.12 | ) | | | (0.47 | ) | | | (0.21 | ) | | | (0.14 | ) | | | (0.15 | ) | | | (0.40 | ) |
Net asset value, end of period | | | $10.65 | | | | $11.00 | | | | $11.50 | | | | $11.21 | | | | $11.10 | | | | $10.76 | |
Total return2 | | | (2.14 | )% | | | (0.15 | )% | | | 4.42 | % | | | 2.22 | % | | | 4.59 | % | | | (2.86 | )% |
Ratios to average net assets (annualized) | | | | | | | | | | | | | | | | | | | | | | | | |
Gross expenses | | | 0.56 | % | | | 0.55 | % | | | 0.54 | % | | | 0.54 | % | | | 0.55 | % | | | 0.52 | % |
Net expenses | | | 0.48 | % | | | 0.48 | % | | | 0.48 | % | | | 0.48 | % | | | 0.48 | % | | | 0.48 | % |
Net investment income | | | 2.10 | % | | | 1.75 | % | | | 1.28 | % | | | 0.99 | % | | | 0.94 | % | | | 1.05 | % |
Supplemental data | | | | | | | | | | | | | | | | | | | | | | | | |
Portfolio turnover rate | | | 104 | % | | | 299 | % | | | 397 | % | | | 349 | % | | | 349 | % | | | 341 | % |
Net assets, end of period (000s omitted) | | | $196,652 | | | | $416,834 | | | | $487,113 | | | | $468,859 | | | | $540,684 | | | | $565,573 | |
| 1 | Calculated based upon average shares outstanding |
| 2 | Returns for periods of less than one year are not annualized. |
The accompanying notes are an integral part of these financial statements.
| | | | | | |
| Notes to financial statements (unaudited) | | Wells Fargo Government Securities Fund | | | 25 | |
1. ORGANIZATION
Wells Fargo Funds Trust (the “Trust”), a Delaware statutory trust organized on March 10, 1999, is an open-end management investment company registered under the Investment Company Act of 1940, as amended (the “1940 Act”). As an investment company, the Trust follows the accounting and reporting guidance in Financial Accounting Standards Board Accounting Standards Codification Topic 946, Financial Services – Investment Companies. These financial statements report on the Wells Fargo Government Securities Fund (the “Fund”) which is a diversified series of the Trust.
Effective at the close of business on December 5, 2017, Class B shares were converted to Class A shares and are no longer offered by the Fund. Information for Class B shares reflected in the financial statements represents activity through February 28, 2018.
2. SIGNIFICANT ACCOUNTING POLICIES
The following significant accounting policies, which are consistently followed in the preparation of the financial statements of the Fund, are in conformity with U.S. generally accepted accounting principles which require management to make estimates and assumptions that affect the reported amounts of assets and liabilities, disclosure of contingent assets and liabilities at the date of the financial statements, and the reported amounts of revenues and expenses during the reporting period. Actual results could differ from those estimates.
Securities valuation
All investments are valued each business day as of the close of regular trading on the New York Stock Exchange (generally 4 p.m. Eastern Time), although the Fund may deviate from this calculation time under unusual or unexpected circumstances.
Debt securities are valued at the evaluated bid price provided by an independent pricing service or, if a reliable price is not available, the quoted bid price from an independent broker-dealer.
Futures that are listed on a foreign or domestic exchange or market are valued at the official closing price or, if none, the last sales price.
Investments in registered open-end investment companies are valued at net asset value.
Investments which are not valued using any of the methods discussed above are valued at their fair value, as determined in good faith by the Board of Trustees of the Fund. The Board of Trustees has established a Valuation Committee comprised of the Trustees and has delegated to it the authority to take any actions regarding the valuation of portfolio securities that the Valuation Committee deems necessary or appropriate, including determining the fair value of portfolio securities, unless the determination has been delegated to the Wells Fargo Asset Management Pricing Committee at Wells Fargo Funds Management, LLC (“Funds Management”). The Board of Trustees retains the authority to make or ratify any valuation decisions or approve any changes to the Valuation Procedures as it deems appropriate. On a quarterly basis, the Board of Trustees receives reports on any valuation actions taken by the Valuation Committee or the Wells Fargo Asset Management Pricing Committee which may include items for ratification.
Valuations of fair valued securities are compared to the next actual sales price when available, or other appropriate market values, to assess the continued appropriateness of the fair valuation methodologies used. These securities are fair valued on a day-to-day basis, taking into consideration changes to appropriate market information and any significant changes to the inputs considered in the valuation process until there is a readily available price provided on an exchange or by an independent pricing service. Valuations received from an independent pricing service or independent broker-dealer quotes are periodically validated by comparisons to most recent trades and valuations provided by other independent pricing services in addition to the review of prices by the manager and/or subadviser. Unobservable inputs used in determining fair valuations are identified based on the type of security, taking into consideration factors utilized by market participants in valuing the investment, knowledge about the issuer and the current market environment.
When-issued transactions
The Fund may purchase securities on a forward commitment or when-issued basis. The Fund records a when-issued transaction on the trade date and will segregate assets in an amount at least equal in value to the Fund’s commitment to purchase when-issued securities. Securities purchased on a when-issued basis are marked-to-market daily and the Fund begins earning interest on the settlement date. Losses may arise due to changes in the market value of the underlying securities or if the counterparty does not perform under the contract.
| | | | |
| 26 | | Wells Fargo Government Securities Fund | | Notes to financial statements (unaudited) |
Futures contracts
The Fund is subject to interest rate risk in the normal course of pursuing its investment objectives. The Fund may buy and sell futures contracts in order to gain exposure to, or protect against, changes in interest rates. The primary risks associated with the use of futures contracts are the imperfect correlation between changes in market values of securities held by the Fund and the prices of futures contracts, and the possibility of an illiquid market.
The aggregate principal amounts of the contracts are not recorded in the financial statements. Fluctuations in the value of the contracts are recorded in the Statement of Assets and Liabilities as an asset or liability and in the Statement of Operations as unrealized gains or losses until the contracts are closed, at which point they are recorded as net realized gains or losses on futures contracts. With futures contracts, there is minimal counterparty risk to the Fund since futures are exchange traded and the exchange’s clearinghouse, as counterparty to all exchange traded futures, guarantees the futures against default.
Security transactions and income recognition
Securities transactions are recorded on a trade date basis. Realized gains or losses are recorded on the basis of identified cost.
Interest income is accrued daily and bond discounts are accreted and premiums are amortized daily. To the extent debt obligations are placed on non-accrual status, any related interest income may be reduced by writing off interest receivables when the collection of all or a portion of interest has been determined to be doubtful based on consistently applied procedures and the fair value has decreased. If the issuer subsequently resumes interest payments or when the collectability of interest is reasonably assured, the debt obligation is removed from non-accrual status.
Distributions to shareholders
Distributions to shareholders from net investment income are accrued daily and paid monthly. Distributions from net realized gains, if any, are recorded on the ex-dividend date and paid at least annually. Such distributions are determined in accordance with income tax regulations and may differ from U.S. generally accepted accounting principles. Dividend sources are estimated at the time of declaration. The tax character of distributions is determined as of the Fund’s fiscal year end. Therefore, a portion of the Fund’s distributions made prior to the Fund’s fiscal year end may be categorized as a tax return of capital at year end.
Federal and other taxes
The Fund intends to continue to qualify as a regulated investment company by distributing substantially all of its investment company taxable income and any net realized capital gains (after reduction for capital loss carryforwards) sufficient to relieve it from all, or substantially all, federal income taxes. Accordingly, no provision for federal income taxes was required.
The Fund’s income and federal excise tax returns and all financial records supporting those returns for the prior three fiscal years are subject to examination by the federal and Delaware revenue authorities. Management has analyzed the Fund’s tax positions taken on federal, state, and foreign tax returns for all open tax years and does not believe that there are any uncertain tax positions that require recognition of a tax liability.
As of February 28, 2018, the aggregate cost of all investments for federal income tax purposes was $887,622,228 and the unrealized gains (losses) consisted of:
| | | | |
Gross unrealized gains | | $ | 8,242,972 | |
Gross unrealized losses | | | (17,688,018 | ) |
Net unrealized losses | | $ | (9,445,046 | ) |
As of August 31, 2017, the Fund had current year net deferred post-October capital losses consisting of $12,278,768 in short-term losses which was recognized on the first day of the current fiscal year.
Class allocations
The separate classes of shares offered by the Fund differ principally in applicable sales charges, distribution, shareholder servicing, and administration fees. Class specific expenses are charged directly to that share class. Investment income, common expenses, and realized and unrealized gains (losses) on investments are allocated daily to each class of shares based on the relative proportion of net assets of each class.
| | | | | | |
| Notes to financial statements (unaudited) | | Wells Fargo Government Securities Fund | | | 27 | |
3. FAIR VALUATION MEASUREMENTS
Fair value measurements of investments are determined within a framework that has established a fair value hierarchy based upon the various data inputs utilized in determining the value of the Fund’s investments. The three-level hierarchy gives the highest priority to unadjusted quoted prices in active markets for identical assets or liabilities (Level 1) and the lowest priority to unobservable inputs (Level 3). The Fund’s investments are classified within the fair value hierarchy based on the lowest level of input that is significant to the fair value measurement. The inputs are summarized into three broad levels as follows:
| ∎ | | Level 1 – quoted prices in active markets for identical securities |
| ∎ | | Level 2 – other significant observable inputs (including quoted prices for similar securities, interest rates, prepayment speeds, credit risk, etc.) |
| ∎ | | Level 3 – significant unobservable inputs (including the Fund’s own assumptions in determining the fair value of investments) |
The inputs or methodologies used for valuing investments in securities are not necessarily an indication of the risk associated with investing in those securities.
The following is a summary of the inputs used in valuing the Fund’s assets and liabilities as of February 28, 2018:
| | | | | | | | | | | | | | | | |
| | | Quoted prices
(Level 1) | | | Other significant
observable inputs
(Level 2) | | | Significant
unobservable inputs
(Level 3) | | | Total | |
Assets | | | | | | | | | | | | | | | | |
Investments in: | | | | | | | | | | | | | | | | |
| | | | |
Agency securities | | $ | 0 | | | $ | 668,964,212 | | | $ | 0 | | | $ | 668,964,212 | |
| | | | |
Asset-backed securities | | | 0 | | | | 11,212,150 | | | | 0 | | | | 11,212,150 | |
| | | | |
Corporate bonds and notes | | | 0 | | | | 8,026,968 | | | | 0 | | | | 8,026,968 | |
| | | | |
Municipal obligations | | | 0 | | | | 14,412,181 | | | | 0 | | | | 14,412,181 | |
| | | | |
Non-agency mortgage-backed securities | | | 0 | | | | 31,752,568 | | | | 0 | | | | 31,752,568 | |
| | | | |
U.S. Treasury securities | | | 74,969,099 | | | | 0 | | | | 0 | | | | 74,969,099 | |
| | | | |
Yankee corporate bonds and notes | | | 0 | | | | 11,057,678 | | | | 0 | | | | 11,057,678 | |
| | | | |
Yankee government bonds | | | 0 | | | | 40,329,165 | | | | 0 | | | | 40,329,165 | |
| | | | |
Short-term investments | | | | | | | | | | | | | | | | |
Investment companies | | | 15,145,655 | | | | 0 | | | | 0 | | | | 15,145,655 | |
U.S. Treasury securities | | | 2,223,879 | | | | 0 | | | | 0 | | | | 2,223,879 | |
| | | 92,338,633 | | | | 785,754,922 | | | | 0 | | | | 878,093,555 | |
Futures contracts | | | 83,627 | | | | 0 | | | | 0 | | | | 83,627 | |
Total assets | | $ | 92,422,260 | | | $ | 785,754,922 | | | $ | 0 | | | $ | 878,177,182 | |
Futures contracts are reported at the cumulative unrealized gains or losses at measurement date. The current day’s variation margin is reported on the Statement of assets and liabilities. All other assets and liabilities are reported at their market value at measurement date.
The Fund recognizes transfers between levels within the fair value hierarchy at the end of the reporting period. At February 28, 2018, the Fund did not have any transfers into/out of Level 1, Level 2, or Level 3.
4. TRANSACTIONS WITH AFFILIATES
Management fee
Funds Management, an indirect wholly owned subsidiary of Wells Fargo & Company (“Wells Fargo”), is the manager of the Fund and provides advisory and fund-level administrative services under an investment management agreement. Under the investment management agreement, Funds Management is responsible for, among other services, implementing the investment objectives and strategies of the Fund, supervising the subadviser, providing fund-level
| | | | |
| 28 | | Wells Fargo Government Securities Fund | | Notes to financial statements (unaudited) |
administrative services in connection with the Fund’s operations, and providing any other fund-level administrative services reasonably necessary for the operation of the Fund. As compensation for its services under the investment management agreement, Funds Management is entitled to receive an annual management fee starting at 0.45% and declining to 0.32% as the average daily net assets of the Fund increase. Prior to January 1, 2018, Funds Management received an annual management fee which started at 0.45% and declined to 0.33% as the average daily net assets of the Fund increased. For the six months ended February 28, 2018, the management fee was equivalent to an annual rate of 0.44% of the Fund’s average daily net assets.
Funds Management has retained the services of a subadviser to provide daily portfolio management to the Fund. The fee for subadvisory services is borne by Funds Management. Wells Capital Management Incorporated, an affiliate of Funds Management and an indirect wholly owned subsidiary of Wells Fargo, is the subadviser to the Fund and is entitled to receive a fee from Funds Management at an annual rate starting at 0.20% and declining to 0.10% as the average daily net assets of the Fund increase.
Administration fees
Under a class-level administration agreement, Funds Management provides class-level administrative services to the Fund, which includes paying fees and expenses for services provided by the transfer agent, sub-transfer agents, omnibus account servicers and record-keepers. As compensation for its services under the class-level administration agreement, Funds Management receives an annual fee which is calculated based on the average daily net assets of each class as follows:
| | | | |
| | | Class level
administration fee | |
Class A, Class C | | | 0.16 | % |
Administrator Class | | | 0.10 | |
Institutional Class | | | 0.08 | |
Funds Management has contractually waived and/or reimbursed management and administration fees to the extent necessary to maintain certain net operating expense ratios for the Fund. Waiver of fees and/or reimbursement of expenses by Funds Management were made first from fund level expenses on a proportionate basis and then from class specific expenses. Funds Management has committed through December 31, 2018 to waive fees and/or reimburse expenses to the extent necessary to cap the Fund’s expenses at 0.85% for Class A shares, 1.60% for Class C shares, 0.64% for Administrator Class shares, and 0.48% for Institutional Class shares. After this time, the cap may be increased or the commitment to maintain the cap may be terminated only with the approval of the Board of Trustees.
Distribution fee
The Trust has adopted a distribution plan for Class C shares of the Fund pursuant to Rule 12b-1 under the 1940 Act. A distribution fee is charged to Class C shares and paid to Wells Fargo Funds Distributor, LLC (“Funds Distributor”), the principal underwriter, at an annual rate of 0.75% of the average daily net assets of Class C shares.
In addition, Funds Distributor is entitled to receive the front-end sales charge from the purchase of Class A shares and a contingent deferred sales charge on the redemption of certain Class A shares. Funds Distributor is also entitled to receive the contingent deferred sales charges from redemptions of Class C shares. For the six months ended February 28, 2018, Funds Distributor received $870 from the sale of Class A shares and $20 in contingent deferred sales charges from redemptions of Class C shares. No contingent deferred sales charges were incurred by Class A shares for the six months ended February 28, 2018.
Shareholder servicing fees
The Trust has entered into contracts with one or more shareholder servicing agents, whereby Class A, Class C, and Administrator Class of the Fund are charged a fee at an annual rate of 0.25% of the average daily net assets of each respective class.
A portion of these total shareholder servicing fees were paid to affiliates of Wells Fargo.
Interfund transactions
The Fund may purchase or sell investment securities to other Wells Fargo affiliates pursuant to Rule 17a-7 of the 1940 Act and under procedures adopted by the Board of Trustees. The procedures have been designed to ensure that these interfund transactions, which do not incur broker commissions, are effected at current market prices. Pursuant to these procedures, the Fund had $43,447,421 in interfund sales during the six months ended February 28, 2018.
| | | | | | |
| Notes to financial statements (unaudited) | | Wells Fargo Government Securities Fund | | | 29 | |
5. INVESTMENT PORTFOLIO TRANSACTIONS
Purchases and sales of investments, excluding short-term securities, for the six months ended February 28, 2018 were as follows:
| | | | | | |
Purchases at cost | | Sales proceeds |
U.S.
government | | Non-U.S.
government | | U.S.
government | | Non-U.S.
government |
| $1,018,114,631 | | $13,752,911 | | $1,198,057,087 | | $75,158,008 |
6. DERIVATIVE TRANSACTIONS
During the six months ended February 28, 2018, the Fund entered into futures contracts to speculate on interest rates. The Fund had an average notional amount of $13,987,891 and $48,008,195 in long futures contracts and short futures contracts, respectively, during the six months ended February 28, 2018.
On February 28, 2018, the cumulative unrealized gains on futures contracts in the amount of $83,627 are reflected in net unrealized losses on investments on the Statement of Assets and Liabilities. The receivable and payable for daily variation margin on open futures contracts reflected in the Statement of Assets and Liabilities only represents the current day’s variation margin. The realized gains and change in unrealized gains (losses) on futures contracts are reflected in the Statement of Operations.
For certain types of derivative transactions, the Fund has entered into International Swaps and Derivatives Association, Inc. master agreements (“ISDA Master Agreements”) or similar agreements with approved counterparties. The ISDA Master Agreements or similar agreements may have requirements to deliver/deposit securities or cash to/with an exchange or broker-dealer as collateral and allows the Fund to offset, with each counterparty, certain derivative financial instrument’s assets and/or liabilities with collateral held or pledged. Collateral requirements differ by type of derivative. Collateral or margin requirements are set by the broker or exchange clearing house for exchange traded derivatives while collateral terms are contract specific for over-the-counter traded derivatives. Cash collateral that has been pledged to cover obligations of the Fund under ISDA Master Agreements or similar agreements, if any, are reported separately in the Statement of Assets and Liabilities. Securities pledged as collateral, if any, are noted in the Portfolio of Investments. With respect to balance sheet offsetting, absent an event of default by the counterparty or a termination of the agreement, the reported amounts of financial assets and financial liabilities in the Statement of Assets and Liabilities are not offset across transactions between the Fund and the applicable counterparty. A reconciliation of the gross amounts on the Statement of Assets and Liabilities to the net amounts by counterparty, including any collateral exposure, is as follows:
| | | | | | | | | | | | | | | | |
| Counterparty | | Gross amounts of assets in the
Statement of Assets and Liabilities | | | Amounts subject to
netting
agreements | | | Collateral
received | | | Net amount of assets | |
JPMorgan | | $ | 83,627 | * | | $ | 0 | | | $ | 0 | | | $ | 83,627 | |
| | * | Amount represents unrealized gains on futures contracts which are reported in Net unrealized losses on investments. Only the current day’s variation margin as of February 28, 2018 is reported separately on the Statement of Assets and Liabilities. | |
7. BANK BORROWINGS
The Trust (excluding the money market funds and certain other funds) and Wells Fargo Variable Trust are parties to a $280,000,000 revolving credit agreement whereby the Fund is permitted to use bank borrowings for temporary or emergency purposes, such as to fund shareholder redemption requests. Interest under the credit agreement is charged to the Fund based on a borrowing rate equal to the higher of the Federal Funds rate in effect on that day plus 1.25% or the overnight LIBOR rate in effect on that day plus 1.25%. In addition, an annual commitment fee equal to 0.25% of the unused balance is allocated to each participating fund.
For the six months ended February 28, 2018, there were no borrowings by the Fund under the agreement.
8. INDEMNIFICATION
Under the Trust’s organizational documents, the officers and Trustees have been granted certain indemnification rights against certain liabilities that may arise out of performance of their duties to the Trust. Additionally, in the normal course of business, the Trust may enter into contracts with service providers that contain a variety of indemnification clauses. The Trust’s maximum exposure under these arrangements is dependent on future claims that may be made against the Fund and, therefore, cannot be estimated.
| | | | |
| 30 | | Wells Fargo Government Securities Fund | | Other information (unaudited) |
PROXY VOTING INFORMATION
A description of the policies and procedures that the Fund uses to determine how to vote proxies relating to portfolio securities is available, upon request, by calling 1-800-222-8222, visiting our website at wellsfargofunds.com, or visiting the SEC website at sec.gov. Information regarding how the Fund voted proxies relating to portfolio securities during the most recent 12-month period ended June 30 is available on the Fund’s website at wellsfargofunds.com or by visiting the SEC website at sec.gov.
PORTFOLIO HOLDINGS INFORMATION
The complete portfolio holdings for the Fund are publicly available monthly on the Fund’s website (wellsfargofunds.com), on a one-month delayed basis. In addition, top ten holdings information (excluding derivative positions) for the Fund is publicly available on the Fund’s website on a monthly, seven-day or more delayed basis. The Fund files its complete schedule of portfolio holdings with the SEC for the first and third quarters of each fiscal year on Form N-Q, which is available by visiting the SEC website at sec.gov. In addition, the Fund’s Form N-Q may be reviewed and copied at the SEC’s Public Reference Room in Washington, DC, and at regional offices in New York City, at 233 Broadway, and in Chicago, at 175 West Jackson Boulevard, Suite 900. Information about the Public Reference Room may be obtained by calling 1-800-SEC-0330.
| | | | | | |
| Other information (unaudited) | | Wells Fargo Government Securities Fund | | | 31 | |
BOARD OF TRUSTEES AND OFFICERS
Each of the Trustees and Officers1 listed in the table below acts in identical capacities for each fund in the Wells Fargo family of funds, which consists of 153 mutual funds comprising the Wells Fargo Funds Trust, Wells Fargo Variable Trust, Wells Fargo Master Trust and four closed-end funds (collectively the “Fund Complex”). This table should be read in conjunction with the Prospectus and the Statement of Additional Information2. The mailing address of each Trustee and Officer is 525 Market Street, 12th Floor, San Francisco, CA 94105. Each Trustee and Officer serves an indefinite term, however, each Trustee serves such term until reaching the mandatory retirement age established by the Trustees.
Independent Trustees
| | | | | | |
Name and
year of birth | | Position held and
length of service* | | Principal occupations during past five years or longer | | Current other
public company or
investment company
directorships |
William R. Ebsworth (Born 1957) | | Trustee, since 2015 | | Retired. From 1984 to 2013, equities analyst, portfolio manager, research director and chief investment officer at Fidelity Management and Research Company in Boston, Tokyo, and Hong Kong, and retired in 2013 as Chief Investment Officer of Fidelity Strategic Advisers, Inc. where he led a team of investment professionals managing client assets. Prior thereto, Board member of Hong Kong Securities Clearing Co., Hong Kong Options Clearing Corp., the Thailand International Fund, Ltd., Fidelity Investments Life Insurance Company, and Empire Fidelity Investments Life Insurance Company. Board member of the Forté Foundation (non-profit organization) and the Vincent Memorial Hospital Endowment (non-profit organization), where he serves on the Investment Committee and as a Chair of the Audit Committee. Mr. Ebsworth is a CFA® charterholder. | | Asset Allocation Trust |
Jane A. Freeman** (Born 1953) | | Trustee, since 2015; Chair Liaison, since 2018 | | Retired. From 2012 to 2014 and 1999 to 2008, Chief Financial Officer of Scientific Learning Corporation. From 2008 to 2012, Ms. Freeman provided consulting services related to strategic business projects. Prior to 1999, Portfolio Manager at Rockefeller & Co. and Scudder, Stevens & Clark. Board member of the Harding Loevner Funds from 1996 to 2014, serving as both Lead Independent Director and chair of the Audit Committee. Board member of the Russell Exchange Traded Funds Trust from 2011 to 2012 and the chair of the Audit Committee. Ms. Freeman is a Board Member of Ruth Bancroft Garden (non-profit organization) and the Glimmerglass Festival. She is also an inactive Chartered Financial Analyst. | | Asset Allocation Trust |
Isaiah Harris, Jr. (Born 1952) | | Trustee, since 2009 | | Retired. Chairman of the Board of CIGNA Corporation since 2009, and Director since 2005. From 2003 to 2011, Director of Deluxe Corporation. Prior thereto, President and CEO of BellSouth Advertising and Publishing Corp. from 2005 to 2007, President and CEO of BellSouth Enterprises from 2004 to 2005 and President of BellSouth Consumer Services from 2000 to 2003. Emeritus member of the Iowa State University Foundation Board of Governors. Emeritus Member of the Advisory Board of Iowa State University School of Business. Advisory Board Member, Palm Harbor Academy (charter school). Advisory Board Member, Child Evangelism Fellowship (non-profit). Mr. Harris is a certified public accountant (inactive status). | | CIGNA Corporation; Asset Allocation Trust |
Judith M. Johnson (Born 1949) | | Trustee, since 2008; Audit Committee Chairman, since 2008 | | Retired. Prior thereto, Chief Executive Officer and Chief Investment Officer of Minneapolis Employees Retirement Fund from 1996 to 2008. Ms. Johnson is an attorney, certified public accountant and a certified managerial accountant. | | Asset Allocation Trust |
David F. Larcker (Born 1950) | | Trustee, since 2009 | | James Irvin Miller Professor of Accounting at the Graduate School of Business, Stanford University, Director of the Corporate Governance Research Initiative and Senior Faculty of The Rock Center for Corporate Governance since 2006. From 2005 to 2008, Professor of Accounting at the Graduate School of Business, Stanford University. Prior thereto, Ernst & Young Professor of Accounting at The Wharton School, University of Pennsylvania from 1985 to 2005. | | Asset Allocation Trust |
| | | | |
| 32 | | Wells Fargo Government Securities Fund | | Other information (unaudited) |
| | | | | | |
Name and
year of birth | | Position held and
length of service* | | Principal occupations during past five years or longer | | Current other
public company or
investment company
directorships |
Olivia S. Mitchell*** (Born 1953) | | Trustee, since 2006; Governance Committee Chairman, since 2018 | | International Foundation of Employee Benefit Plans Professor, Wharton School of the University of Pennsylvania since 1993. Director of Wharton’s Pension Research Council and Boettner Center on Pensions & Retirement Research, and Research Associate at the National Bureau of Economic Research. Previously, Cornell University Professor from 1978 to 1993. | | Asset Allocation Trust |
Timothy J. Penny**** (Born 1951) | | Trustee, since 1996; Chairman, since 2018; Vice Chairman, from 2017 to 2018 | | President and Chief Executive Officer of Southern Minnesota Initiative Foundation, a non-profit organization, since 2007. Member of the Board of Trustees of NorthStar Education Finance, Inc., a non-profit organization, since 2007. | | Asset Allocation Trust |
James G. Polisson***** (Born 1959) | | Trustee, since 2018; Advisory Board Member, from 2017 to 2018 | | Retired. Chief Marketing Officer, Source (ETF) UK Services, Ltd, from 2015 to 2017. From 2012 to 2015, Principal of The Polisson Group, LLC, a management consulting, corporate advisory and principal investing company. Chief Executive Officer and Managing Director at Russell Investments, Global Exchange Traded Funds from 2010 to 2012. Managing Director of Barclays Global Investors from 1998 to 2010 and Global Chief Marketing Officer for iShares and Barclays Global Investors from 2000 to 2010. Trustee of the San Francisco Mechanics’ Institute, a non-profit organization, from 2013 to 2015. Board member of the Russell Exchange Traded Fund Trust from 2011 to 2012. Director of Barclays Global Investors Holdings Deutschland GmbH from 2006 to 2009. Mr. Polisson is an attorney and has a retired status with the Massachusetts and District of Columbia Bar Associations. | | Asset Allocation Trust |
Michael S. Scofield (Born 1943) | | Trustee, since 2010 | | Served on the Investment Company Institute’s Board of Governors and Executive Committee from 2008-2011 as well the Governing Council of the Independent Directors Council from 2006-2011 and the Independent Directors Council Executive Committee from 2008-2011. Trustee of the Evergreen Fund complex (and its predecessors) from 1984 to 2010. Chairman of the Evergreen Funds from 2000-2010. Former Trustee of the Mentor Funds. Retired Attorney, Law Offices of Michael S. Scofield. | | Asset Allocation Trust |
Pamela Wheelock***** (Born 1959) | | Trustee, since 2018; Advisory Board Member, from 2017 to 2018 | | Chief Operating Officer, Twin Cities Habitat for Humanity, since January, 2017. Vice President of University Services, University of Minnesota from 2012 to 2017. Prior thereto, Interim President and Chief Executive Officer of Blue Cross Blue Shield of Minnesota from 2010 to 2011, Chairman of the Board from 2009 to 2011 and Board Director from 2003 to 2015. Vice President, Leadership and Community Engagement, Bush Foundation, Saint Paul, Minnesota (a private foundation) from 2009 to 2011. Executive Vice President and Chief Financial Officer, Minnesota Sports and Entertainment from 2004 to 2009 and Senior Vice President from 2002 to 2004. Commissioner of Finance, State of Minnesota, from 1999 to 2002. Currently on the Board of Directors, Governance Committee and Finance Committee, for the Minnesota Philanthropy Partners (Saint Paul Foundation) since 2012 and Board Chair of the Minnesota Wild Foundation since 2010. | | Asset Allocation Trust |
| * | Length of service dates reflect the Trustee’s commencement of service with the Trust’s predecessor entities, where applicable. |
| ** | Jane Freeman became Chair Liaison effective January 1, 2018. |
| *** | Olivia Mitchell became Chairman of the Governance Committee effective January 1, 2018. |
| **** | Timothy Penny became Chairman effective January 1, 2018. |
| ***** | James Polisson and Pamela Wheelock each became a Trustee effective January 1, 2018. |
| | | | | | |
| Other information (unaudited) | | Wells Fargo Government Securities Fund | | | 33 | |
Officers
| | | | | | |
Name and
year of birth | | Position held and
length of service | | Principal occupations during past five years or longer | | |
Andrew Owen (Born 1960) | | President, since 2017 | | Executive Vice President of Wells Fargo & Company and Head of Affiliated Managers, Wells Fargo Asset Management, since 2014. In addition, Mr. Owen is currently President, Chief Executive Officer and Director of Wells Fargo Funds Management, LLC since 2017. Prior thereto, Executive Vice President responsible for marketing, investments and product development for Wells Fargo Funds Management, LLC, from 2009 to 2014. | | |
Nancy Wiser1 (Born 1967) | | Treasurer, since 2012 | | Executive Vice President of Wells Fargo Funds Management, LLC since 2011. Chief Operating Officer and Chief Compliance Officer at LightBox Capital Management LLC, from 2008 to 2011. | | |
Alexander Kymn* (Born 1973) | | Secretary, since 2018; Chief Legal Officer, since 2018 | | Senior Company Counsel of Wells Fargo Bank, N.A. since 2018 (previously Senior Counsel from 2007 to 2018). Vice President of Wells Fargo Funds Management, LLC from 2008 to 2014. | | |
C. David Messman** (Born 1960) | | Secretary, since 2000; Chief Legal Officer, since 2003 | | Senior Vice President and Secretary of Wells Fargo Funds Management, LLC since 2001. Assistant General Counsel of Wells Fargo Bank, N.A. since 2013 and Vice President and Managing Counsel of Wells Fargo Bank, N.A. from 1996 to 2013. | | |
Michael H. Whitaker (Born 1967) | | Chief Compliance Officer, since 2016 | | Senior Vice President and Chief Compliance Officer since 2016. Senior Vice President and Chief Compliance Officer for Fidelity Investments from 2007 to 2016. | | |
David Berardi (Born 1975) | | Assistant Treasurer, since 2009 | | Vice President of Wells Fargo Funds Management, LLC since 2009. Vice President of Evergreen Investment Management Company, LLC from 2008 to 2010. Manager of Fund Reporting and Control for Evergreen Investment Management Company, LLC from 2004 to 2010. | | |
Jeremy DePalma1 (Born 1974) | | Assistant Treasurer, since 2009 | | Senior Vice President of Wells Fargo Funds Management, LLC since 2009. Senior Vice President of Evergreen Investment Management Company, LLC from 2008 to 2010 and head of the Fund Reporting and Control Team within Fund Administration from 2005 to 2010. | | |
| 1 | Nancy Wiser acts as Treasurer of 77 funds in the Fund Complex. Jeremy DePalma acts as Treasurer of 76 funds and Assistant Treasurer of 77 funds in the Fund Complex. |
| 2 | The Statement of Additional Information includes additional information about the Trustees and is available, without charge, upon request, by calling 1-800-222-8222 or by visiting the website at wellsfargofunds.com. |
| * | Alexander Kymn became the Secretary and Chief Legal Officer effective April 17, 2018. |
| ** | David Messman was the Secretary and Chief Legal Officer until April 16, 2018. |
| | | | |
| 34 | | Wells Fargo Government Securities Fund | | List of abbreviations |
The following is a list of common abbreviations for terms and entities that may have appeared in this report.
| ACA | — ACA Financial Guaranty Corporation |
| ADR | — American depositary receipt |
| ADS | — American depositary shares |
| AGC | — Assured Guaranty Corporation |
| AGM | — Assured Guaranty Municipal |
| Ambac | — Ambac Financial Group Incorporated |
| AMT | — Alternative minimum tax |
| BAN | — Bond anticipation notes |
| BHAC | — Berkshire Hathaway Assurance Corporation |
| CAB | — Capital appreciation bond |
| CCAB | — Convertible capital appreciation bond |
| CDA | — Community Development Authority |
| CDO | — Collateralized debt obligation |
| CLO | — Collateralized loan obligation |
| DRIVER | — Derivative inverse tax-exempt receipts |
| DW&P | — Department of Water & Power |
| DWR | — Department of Water Resources |
| ECFA | — Educational & Cultural Facilities Authority |
| EDA | — Economic Development Authority |
| EDFA | — Economic Development Finance Authority |
| ETF | — Exchange-traded fund |
| FDIC | — Federal Deposit Insurance Corporation |
| FFCB | — Federal Farm Credit Banks |
| FGIC | — Financial Guaranty Insurance Corporation |
| FHA | — Federal Housing Administration |
| FHLB | — Federal Home Loan Bank |
| FHLMC | — Federal Home Loan Mortgage Corporation |
| FICO | — The Financing Corporation |
| FNMA | — Federal National Mortgage Association |
| GDR | — Global depositary receipt |
| GNMA | — Government National Mortgage Association |
| HCFR | — Healthcare facilities revenue |
| HEFA | — Health & Educational Facilities Authority |
| HEFAR | — Higher education facilities authority revenue |
| HFA | — Housing Finance Authority |
| HFFA | — Health Facilities Financing Authority |
| HUD | — Department of Housing and Urban Development |
| IDA | — Industrial Development Authority |
| IDAG | — Industrial Development Agency |
| KRW | — Republic of Korea won |
| LIBOR | — London Interbank Offered Rate |
| LIFER | — Long Inverse Floating Exempt Receipts |
| LLC | — Limited liability company |
| LLLP | — Limited liability limited partnership |
| LLP | — Limited liability partnership |
| MBIA | — Municipal Bond Insurance Association |
| MFHR | — Multifamily housing revenue |
| MSTR | — Municipal securities trust receipts |
| MUD | — Municipal Utility District |
| National | — National Public Finance Guarantee Corporation |
| PCFA | — Pollution Control Financing Authority |
| PCL | — Public Company Limited |
| PCR | — Pollution control revenue |
| PFA | — Public Finance Authority |
| PFFA | — Public Facilities Financing Authority |
| PFOTER | — Puttable floating option tax-exempt receipts |
| PJSC | — Public Joint Stock Company |
| plc | — Public limited company |
| PUTTER | — Puttable tax-exempt receipts |
| R&D | — Research & development |
| Radian | — Radian Asset Assurance |
| RAN | — Revenue anticipation notes |
| RDA | — Redevelopment Agency |
| RDFA | — Redevelopment Finance Authority |
| REIT | — Real estate investment trust |
| ROC | — Reset option certificates |
| SAVRS | — Select auction variable rate securities |
| SBA | — Small Business Authority |
| SDR | — Swedish depositary receipt |
| SFHR | — Single-family housing revenue |
| SFMR | — Single-family mortgage revenue |
| SIFMA | — Securities Industry and Financial Markets Association |
| SPA | — Standby purchase agreement |
| SPDR | — Standard & Poor’s Depositary Receipts |
| SPEAR | — Short Puttable Exempt Adjustable Receipts |
| STRIPS | — Separate trading of registered interest and |
| TAN | — Tax anticipation notes |
| TIPS | — Treasury inflation-protected securities |
| TRAN | — Tax revenue anticipation notes |
| TTFA | — Transportation Trust Fund Authority |
| TVA | — Tennessee Valley Authority |
This page is intentionally left blank.
This page is intentionally left blank.

For more information
More information about Wells Fargo Funds is available free upon request. To obtain literature, please write, email, visit the Fund’s website, or call:
Wells Fargo Funds
P.O. Box 8266
Boston, MA 02266-8266
Email: fundservice@wellsfargo.com
Website: wellsfargofunds.com
Individual investors: 1-800-222-8222
Retail investment professionals: 1-888-877-9275
Institutional investment professionals:
1-866-765-0778
This report and the financial statements contained herein are submitted for the general information of the shareholders of the Fund. If this report is used for promotional purposes, distribution of the report must be accompanied or preceded by a current prospectus. Before investing, please consider the investment objectives, risks, charges, and expenses of the investment. For a current prospectus and, if available, a summary prospectus, containing this information, call 1-800-222-8222 or visit the Fund’s website at wellsfargofunds.com. Read the prospectus carefully before you invest or send money.
Wells Fargo Asset Management (WFAM) is a trade name used by the asset management businesses of Wells Fargo & Company. Wells Fargo Funds Management, LLC, a wholly owned subsidiary of Wells Fargo & Company, provides investment advisory and administrative services for Wells Fargo Funds. Other affiliates of Wells Fargo & Company provide subadvisory and other services for the funds. The funds are distributed by Wells Fargo Funds Distributor, LLC, Member FINRA, an affiliate of Wells Fargo & Company. Neither Wells Fargo Funds Distributor nor Wells Fargo Funds Management holds fund shareholder accounts or assets. This material is for general informational and educational purposes only and is NOT intended to provide investment advice or a recommendation of any kind—including a recommendation for any specific investment, strategy, or plan.
NOT FDIC INSURED ◾ NO BANK GUARANTEE ◾ MAY LOSE VALUE
© 2018 Wells Fargo Funds Management, LLC. All rights reserved.
| | |
 | | 309368 04-18 SA216/SAR216 02-18 |
Semi-Annual Report
February 28, 2018

Wells Fargo High Yield Bond Fund


Reduce clutter. Save trees.
Sign up for electronic delivery of prospectuses and shareholder reports at wellsfargo.com/advantagedelivery
Contents
The views expressed and any forward-looking statements are as of February 28, 2018, unless otherwise noted, and are those of the Fund managers and/or Wells Fargo Funds Management, LLC. Discussions of individual securities, or the markets generally, or any Wells Fargo Fund are not intended as individual recommendations. Future events or results may vary significantly from those expressed in any forward-looking statements. The views expressed are subject to change at any time in response to changing circumstances in the market. Wells Fargo Funds Management, LLC and the Fund disclaim any obligation to publicly update or revise any views expressed or forward-looking statements.
NOT FDIC INSURED ◾ NO BANK GUARANTEE ◾ MAY LOSE VALUE
| | | | |
| 2 | | Wells Fargo High Yield Bond Fund | | Letter to shareholders (unaudited) |

Andrew Owen
President
Wells Fargo Funds
During the period, stocks globally delivered positive returns.
Dear Shareholder:
We are pleased to offer you this semi-annual report for the Wells Fargo High Yield Bond Fund for the six-month period that ended February 28, 2018. During the period, stocks globally delivered positive returns. For the period, U.S. stocks, as measured by the S&P 500 Index1, gained 10.84% and international stocks, as measured by the MSCI ACWI ex USA Index (Net)2, gained 7.59%. In bond markets, the Bloomberg Barclays U.S. Aggregate Bond Index3 declined 2.18% and the Bloomberg Barclays Municipal Bond Index4 lost 1.24% while fixed-income investments outside the U.S. gained 2.52%, according to the Bloomberg Barclays Global Aggregate ex-USD Index5. The ICE BofAML U.S. High Yield Index6 earned 1.01% during the period.
U.S. stocks advanced as business-friendly policies and regulations, newly implemented tax reform, increased hiring activity, and consistent corporate profits led to higher investor and consumer confidence. Internationally, stocks gained as unemployment fell and wages increased in the U.K.; the Bank of Japan continued its accommodative monetary policies; and industrial production, retail sales, and fixed asset investment increased in China. Stock returns in the emerging markets were strong, with the MSCI Emerging Markets (EM) Index (Net)7 gaining 10.58% for the period.
Reactions to U.S. interest-rate increases were uneven across the yield curve and globally.
The U.S. Federal Reserve (Fed) increased the federal funds rate twice during the six-month period. Following a federal funds rate increase in June to a range of 1.00% to 1.25%, 10-year U.S. Treasury yields declined, the yield curve flattened, and long-term bond prices benefited.
Internationally, central banks maintained low interest rates and accommodative monetary policies that supported business activity and stock values in foreign markets. A weaker U.S. dollar was generally supportive of business activity in regions around the globe.
Positive economic and market news continued as 2017 closed and 2018 began.
During the fourth quarter of 2017, stock markets continued the move higher. Third-quarter economic output in the U.S. grew at a 3.2% annual rate. The unemployment rate fell to a 17-year low of 4.1%. Tax reform and wage growth encouraged increased business and consumer spending.
Fed officials announced in October 2017 plans to begin unwinding its $4.5 trillion portfolio of bonds and other assets accumulated during rounds of quantitative easing conducted since the 2008–2009 recession. Still, restrained inflation kept long-term bond rates steady and the flattening of the yield curve persisted.
| 1 | The S&P 500 Index consists of 500 stocks chosen for market size, liquidity, and industry group representation. It is a market-value-weighted index with each stock’s weight in the index proportionate to its market value. You cannot invest directly in an index. |
| 2 | The Morgan Stanley Capital International (MSCI) All Country World Index (ACWI) ex USA Index (Net) is a free-float-adjusted market-capitalization-weighted index that is designed to measure the equity market performance of developed markets, excluding the United States and Canada. Source: MSCI. MSCI makes no express or implied warranties or representations and shall have no liability whatsoever with respect to any MSCI data contained herein. The MSCI data may not be further redistributed or used as a basis for other indices or any securities or financial products. This report is not approved, reviewed, or produced by MSCI. You cannot invest directly in an index. |
| 3 | The Bloomberg Barclays U.S. Aggregate Bond Index is a broad-based benchmark that measures the investment-grade, U.S. dollar-denominated, fixed-rate taxable bond market, including Treasuries, government-related and corporate securities, mortgage-backed securities (agency fixed-rate and hybrid adjustable-rate mortgage pass-throughs), asset-backed securities, and commercial mortgage-backed securities. You cannot invest directly in an index. |
| 4 | The Bloomberg Barclays Municipal Bond Index is an unmanaged index composed of long-term tax-exempt bonds with a minimum credit rating of Baa. You cannot invest directly in an index. |
| 5 | The Bloomberg Barclays Global Aggregate ex-USD Index is an unmanaged index that provides a broad-based measure of the global investment-grade fixed-income markets excluding the U.S. dollar-denominated debt market. You cannot invest directly in an index. |
| 6 | The ICE BofAML U.S. High Yield Index is a market-capitalization-weighted index of domestic and Yankee high-yield bonds. The index tracks the performance of high-yield securities traded in the U.S. bond market. You cannot invest directly in an index. Copyright 2018. ICE Data Indices, LLC. All rights reserved. |
| 7 | The MSCI Emerging Markets (EM) Index (Net) is a free-float-adjusted market-capitalization-weighted index that is designed to measure large- and mid-cap equity market performance of emerging markets. The MSCI EM Index (Net) consists of the following 24 emerging markets country indices: Brazil, Chile, China, Colombia, Czech Republic, Egypt, Greece, Hungary, India, Indonesia, Korea, Malaysia, Mexico, Pakistan, Peru, the Philippines, Poland, Qatar, Russia, South Africa, Taiwan, Thailand, Turkey, and the United Arab Emirates. You cannot invest directly in an index. |
| | | | | | |
| Letter to shareholders (unaudited) | | Wells Fargo High Yield Bond Fund | | | 3 | |
October 2017 also marked one year since the regulatory reform of money market investing in the U.S. By December 2017, money market fund asset levels exceeded their December 2016 levels, reflecting continued investor demand for short-term investment opportunities offered in money market funds.
In December, the Organisation for Economic Co-operation and Development (OECD) reported that the global economy was expanding at its fastest rate since 2010; all 35 countries the OECD follows were on track to expand for 2017. International economies benefited from economic stimulus, which accelerated trade growth; improving employment; increased investment; and firming commodity prices.
The Fed raised the federal funds rate target to a range of 1.25% to 1.50% in December 2017 and began reducing its bond portfolio.
2018 opened with continued stock advances, then volatility.
Improving business and economic data globally continued to support stock advances through January 2018. Even political wrangling in the U.S. over budget resolutions could not dissuade investors from buying stocks as payrolls and factory orders increased. Long-term interest rates in the U.S. trended higher as the yield curve steepened—the 10-year Treasury rate moved from 2.46% to 2.84% and the 30-year rate moved from 2.81% to 3.08% during January 2018.
Investor sentiment shifted in February. Concerns about inflation began to emerge in the U.S. as readings from the Producer Price Index in January rose 2.5% year over year. During February 2018, the U.S. market endured a loss of more than 10% before recovering much of that loss, but volatility affected stocks globally throughout the month.
During January 2018, purchasing managers’ indexes in China, the eurozone, India, and Japan reported data for December that indicated continued growth. International stock values fell during February 2018, swept up in the selling momentum in U.S. markets.
Don’t let short-term uncertainty derail long-term investment goals.
Periods of investment uncertainty can present challenges, but experience has taught us that maintaining long-term investment goals can be an effective way to plan for the future. To help you create a sound strategy based on your personal goals and risk tolerance, Wells Fargo Funds offers more than 100 mutual funds spanning a wide range of asset classes and investment styles. Although diversification cannot guarantee an investment profit or prevent losses, we believe it can be an effective way to manage investment risk and potentially smooth out overall portfolio performance. We encourage investors to know their investments and to understand that appropriate levels of risk-taking may unlock opportunities.
Thank you for choosing to invest with Wells Fargo Funds. We appreciate your confidence in us and remain committed to helping you meet your financial needs.
Sincerely,

Andrew Owen
President
Wells Fargo Funds
During February 2018, the U.S. market endured a loss of more than 10% before recovering much of that loss, but volatility affected stocks globally throughout the month.
For further information about your Fund, contact your investment professional, visit our website at wellsfargofunds.com, or call us directly at 1-800-222-8222.
| | | | |
| 4 | | Wells Fargo High Yield Bond Fund | | Performance highlights (unaudited) |
Investment objective
The Fund seeks total return, consisting of a high level of current income and capital appreciation.
Manager
Wells Fargo Funds Management, LLC
Subadviser
Wells Capital Management Incorporated
Portfolio manager
Margaret D. Patel
Average annual total returns (%) as of February 28, 20181
| | | | | | | | | | | | | | | | | | | | | | | | | | | | | | | | | | |
| | | | | Including sales charge | | | Excluding sales charge | | | Expense ratios2 (%) | |
| | | Inception date | | 1 year | | | 5 year | | | 10 year | | | 1 year | | | 5 year | | | 10 year | | | Gross | | | Net3 | |
| Class A (EKHAX) | | 1-20-1998 | | | (1.29 | ) | | | 3.73 | | | | 6.61 | | | | 3.41 | | | | 4.66 | | | | 7.09 | | | | 1.02 | | | | 0.93 | |
| Class C (EKHCX) | | 1-21-1998 | | | 1.64 | | | | 3.88 | | | | 6.29 | | | | 2.64 | | | | 3.88 | | | | 6.29 | | | | 1.77 | | | | 1.68 | |
| Administrator Class (EKHYX) | | 4-14-1998 | | | – | | | | – | | | | – | | | | 3.55 | | | | 4.87 | | | | 7.32 | | | | 0.96 | | | | 0.80 | |
| Institutional Class (EKHIX) | | 10-31-2014 | | | – | | | | – | | | | – | | | | 3.82 | | | | 4.99 | | | | 7.38 | | | | 0.69 | | | | 0.53 | |
| ICE BofAML U.S. High Yield Constrained Index4 | | – | | | – | | | | – | | | | – | | | | 4.12 | | | | 5.36 | | | | 8.21 | | | | – | | | | – | |
Figures quoted represent past performance, which is no guarantee of future results, and do not reflect taxes that a shareholder may pay on fund distributions or the redemption of fund shares. Investment return and principal value of an investment will fluctuate so that an investor’s shares, when redeemed, may be worth more or less than their original cost. Performance shown without sales charges would be lower if sales charges were reflected. Current performance may be lower or higher than the performance data quoted, which assumes the reinvestment of dividends and capital gains. Current month-end performance is available on the Fund’s website, wellsfargofunds.com.
Index returns do not include transaction costs associated with buying and selling securities, any mutual fund fees or expenses, or any taxes. It is not possible to invest directly in an index.
For Class A shares, the maximum front-end sales charge is 4.50%. For Class C shares, the maximum contingent deferred sales charge is 1.00%. Performance including a contingent deferred sales charge assumes the sales charge for the corresponding time period. Administrator Class and Institutional Class shares are sold without a front-end sales charge or contingent deferred sales charge.
Bond values fluctuate in response to the financial condition of individual issuers, general market and economic conditions, and changes in interest rates. Changes in market conditions and government policies may lead to periods of heightened volatility in the bond market and reduced liquidity for certain bonds held by the Fund. In general, when interest rates rise, bond values fall and investors may lose principal value. Interest-rate changes and their impact on the Fund and its share price can be sudden and unpredictable. The use of derivatives may reduce returns and/or increase volatility. High-yield securities have a greater risk of default and tend to be more volatile than higher-rated debt securities. Loans are subject to risks similar to those associated with other below investment-grade bond investments, such as credit risk (for example, risk of issuer default), below investment-grade bond risk (for example, risk of greater volatility in value), and risk that the loan may become illiquid or difficult to price. The Fund is exposed to foreign investment risk. Consult the Fund’s prospectus for additional information on these and other risks.
Please see footnotes on page 5.
| | | | | | |
| Performance highlights (unaudited) | | Wells Fargo High Yield Bond Fund | | | 5 | |
| | | | |
| Ten largest holdings (%) as of February 28, 20185 | |
Wesco Distribution Incorporated, 5.38%, 6-15-2024 | | | 2.87 | |
Cheniere Corpus Christi Holdings LLC, 5.13%, 6-30-2027 | | | 2.75 | |
Mallinckrodt plc, 5.50%, 4-15-2025 | | | 2.66 | |
TransDigm Group Incorporated, 6.38%, 6-15-2026 | | | 2.61 | |
SPX FLOW Incorporated, 5.88%, 8-15-2016 | | | 2.58 | |
Iron Mountain Incorporated, 5.38%, 6-1-2026 | | | 2.53 | |
AMN Healthcare Incorporated, 5.13%, 10-1-2024 | | | 2.50 | |
Diebold Incorporated, 8.50%, 4-15-2024 | | | 2.27 | |
Post Holdings Incorporated, 5.00%, 8-15-2026 | | | 1.91 | |
Teleflex Incorporated, 4.88%, 6-1-2026 | | | 1.87 | |
|
| Credit quality as of February 28, 20186 |
|
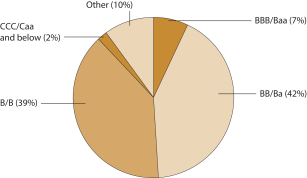
|
| 1 | Historical performance shown for the Institutional Class shares prior to their inception reflects the performance of the Administrator Class shares, and is not adjusted to reflect the Institutional Class expenses. If these expenses had been included, returns for the Institutional Class shares would be higher. Historical performance shown for all classes of the Fund prior to July 12, 2010 is based on the performance of the Fund’s predecessor, Evergreen High Income Fund. |
| 2 | Reflects the expense ratios as stated in the most recent prospectuses. The expense ratios shown are subject to change and may differ from the annualized expense ratios shown in the financial highlights of this report. |
| 3 | The manager has contractually committed through December 31, 2018, to waive fees and/or reimburse expenses to the extent necessary to cap the Fund’s Total Annual Fund Operating Expenses After Fee Waivers at the amounts shown. After this time, the cap may be increased or the commitment to maintain the cap may be terminated only with the approval of the Board of Trustees. Brokerage commissions, stamp duty fees, interest, taxes, acquired fund fees and expenses, and extraordinary expenses are excluded from the expense cap. Without this cap, the Fund’s returns would have been lower. The expense ratio paid by an investor is the net expense ratio (the total annual fund operating expenses after fee waivers) as stated in the prospectuses. |
| 4 | The ICE BofAML U.S. High Yield Constrained Index is a market value-weighted index of all domestic and Yankee high-yield bonds, including deferred interest bonds and payment-in kind securities. Issues included in the index have maturities of one year or more and have a credit rating lower than BBB–/Baa3, but are not in default. The ICE BofAML U.S. High Yield Constrained Index limits any individual issuer to a maximum of 2% benchmark exposure. You cannot invest directly in an index. Copyright 2018. ICE Data Indices, LLC. All rights reserved. |
| 5 | The ten largest holdings, excluding cash and cash equivalents, are calculated based on the value of the investments divided by total net assets of the Fund. Holdings are subject to change and may have changed since the date specified. |
| 6 | The credit quality distribution of portfolio holdings reflected in the chart is based on ratings from Standard & Poor’s, Moody’s Investors Service, and/or Fitch Ratings Ltd. Credit quality ratings apply to the underlying holdings of the Fund and not to the Fund itself. The percentages of the Fund’s portfolio with the ratings depicted in the chart are calculated based on the total market value of fixed income securities held by the Fund. If a security was rated by all three rating agencies, the middle rating was utilized. If rated by two of three rating agencies, the lower rating was utilized, and if rated by one of the rating agencies, that rating was utilized. Standard & Poor’s rates the creditworthiness of bonds, ranging from AAA (highest) to D (lowest). Ratings from A to CCC may be modified by the addition of a plus (+) or minus (-) sign to show relative standing within the rating categories. Standard & Poor’s rates the creditworthiness of short-term notes from SP-1 (highest) to SP-3 (lowest). Moody’s rates the creditworthiness of bonds, ranging from Aaa (highest) to C (lowest). Ratings Aa to B may be modified by the addition of a number 1 (highest) to 3 (lowest) to show relative standing within the ratings categories. Moody’s rates the creditworthiness of short-term U.S. tax-exempt municipal securities from MIG 1/VMIG 1 (highest) to SG (lowest). Fitch rates the creditworthiness of bonds, ranging from AAA (highest) to D (lowest). Credit quality distribution is subject to change and may have changed since the date specified. |
| | | | |
| 6 | | Wells Fargo High Yield Bond Fund | | Fund expenses (unaudited) |
As a shareholder of the Fund, you incur two types of costs: (1) transaction costs, including sales charges (loads) on purchase payments and contingent deferred sales charges (if any) on redemptions and (2) ongoing costs, including management fees, distribution (12b-1) and/or shareholder servicing fees, and other Fund expenses. This example is intended to help you understand your ongoing costs (in dollars) of investing in the Fund and to compare these costs with the ongoing costs of investing in other mutual funds.
The example is based on an investment of $1,000 invested at the beginning of the six-month period and held for the entire period from September 1, 2017 to February 28, 2018.
Actual expenses
The “Actual” line of the table below provides information about actual account values and actual expenses. You may use the information in this line, together with the amount you invested, to estimate the expenses that you paid over the period. Simply divide your account value by $1,000 (for example, an $8,600 account value divided by $1,000 = 8.6), then multiply the result by the number in the “Actual” line under the heading entitled “Expenses paid during period” for your applicable class of shares to estimate the expenses you paid on your account during this period.
Hypothetical example for comparison purposes
The “Hypothetical” line of the table below provides information about hypothetical account values and hypothetical expenses based on the Fund’s actual expense ratio and an assumed rate of return of 5% per year before expenses, which is not the Fund’s actual return. The hypothetical account values and expenses may not be used to estimate the actual ending account balance or expenses you paid for the period. You may use this information to compare the ongoing costs of investing in the Fund and other funds. To do so, compare this 5% hypothetical example with the 5% hypothetical examples that appear in the shareholder reports of the other funds.
Please note that the expenses shown in the table are meant to highlight your ongoing costs only and do not reflect any transactional costs, such as sales charges (loads) and contingent deferred sales charges. Therefore, the “Hypothetical” line of the table is useful in comparing ongoing costs only and will not help you determine the relative total costs of owning different funds. In addition, if these transactional costs were included, your costs would have been higher.
| | | | | | | | | | | | | | | | |
| | | Beginning
account value
9-1-2017 | | | Ending
account value
2-28-2018 | | | Expenses
paid during
the period¹ | | | Annualized net
expense ratio | |
Class A | | | | | | | | | | | | | | | | |
Actual | | $ | 1,000.00 | | | $ | 989.09 | | | $ | 4.59 | | | | 0.93 | % |
Hypothetical (5% return before expenses) | | $ | 1,000.00 | | | $ | 1,020.18 | | | $ | 4.66 | | | | 0.93 | % |
Class C | | | | | | | | | | | | | | | | |
Actual | | $ | 1,000.00 | | | $ | 985.42 | | | $ | 8.27 | | | | 1.68 | % |
Hypothetical (5% return before expenses) | | $ | 1,000.00 | | | $ | 1,016.46 | | | $ | 8.40 | | | | 1.68 | % |
Administrator Class | | | | | | | | | | | | | | | | |
Actual | | $ | 1,000.00 | | | $ | 993.42 | | | $ | 3.95 | | | | 0.80 | % |
Hypothetical (5% return before expenses) | | $ | 1,000.00 | | | $ | 1,020.83 | | | $ | 4.01 | | | | 0.80 | % |
Institutional Class | | | | | | | | | | | | | | | | |
Actual | | $ | 1,000.00 | | | $ | 987.57 | | | $ | 2.61 | | | | 0.53 | % |
Hypothetical (5% return before expenses) | | $ | 1,000.00 | | | $ | 1,022.17 | | | $ | 2.66 | | | | 0.53 | % |
| 1 | Expenses paid is equal to the annualized net expense ratio of each class multiplied by the average account value over the period, multiplied by the number of days in the most recent fiscal half-year divided by the number of days in the fiscal year (to reflect the one-half-year period). |
| | | | | | |
| Portfolio of investments—February 28, 2018 (unaudited) | | Wells Fargo High Yield Bond Fund | | | 7 | |
| | | | | | | | | | | | | | | | |
| Security name | | | | | | | | Shares | | | Value | |
| | | | |
Common Stocks: 8.92% | | | | | | | | | | | | | | | | |
| | | | |
Consumer Staples: 0.11% | | | | | | | | | | | | | | | | |
| | | | |
| Food Products: 0.11% | | | | | | | | | | | | | | | | |
Lamb Weston Holdings Incorporated | | | | | | | | | | | 10,000 | | | $ | 540,900 | |
| | | | | | | | | | | | | | | | |
| | | | |
Energy: 2.63% | | | | | | | | | | | | | | | | |
| | | | |
| Oil, Gas & Consumable Fuels: 2.63% | | | | | | | | | | | | | | | | |
Andeavor Logistics LP | | | | | | | | | | | 85,000 | | | | 3,950,800 | |
Enterprise Products Partners | | | | | | | | | | | 50,000 | | | | 1,271,000 | |
Kinder Morgan Incorporated | | | | | | | | | | | 225,000 | | | | 3,645,000 | |
Plains All American Pipeline LP | | | | | | | | | | | 200,000 | | | | 4,220,000 | |
| | | | |
| | | | | | | | | | | | | | | 13,086,800 | |
| | | | | | | | | | | | | | | | |
| | | | |
Financials: 0.16% | | | | | | | | | | | | | | | | |
| | | | |
| Banks: 0.16% | | | | | | | | | | | | | | | | |
PNC Financial Services Group Incorporated | | | | | | | | | | | 5,000 | | | | 788,300 | |
| | | | | | | | | | | | | | | | |
| | | | |
Health Care: 0.57% | | | | | | | | | | | | | | | | |
| | | | |
| Health Care Equipment & Supplies: 0.57% | | | | | | | | | | | | | | | | |
Abbott Laboratories | | | | | | | | | | | 35,000 | | | | 2,111,550 | |
Becton Dickinson & Company | | | | | | | | | | | 2,000 | | | | 444,040 | |
West Pharmaceutical Services Incorporated | | | | | | | | | | | 3,000 | | | | 261,660 | |
| | | | |
| | | | | | | | | | | | | | | 2,817,250 | |
| | | | | | | | | | | | | | | | |
| | | | |
Industrials: 1.26% | | | | | | | | | | | | | | | | |
| | | | |
| Aerospace & Defense: 0.70% | | | | | | | | | | | | | | | | |
Huntington Ingalls Industries Incorporated | | | | | | | | | | | 5,000 | | | | 1,310,050 | |
Raytheon Company | | | | | | | | | | | 10,000 | | | | 2,175,100 | |
| | | | |
| | | | | | | | | | | | | | | 3,485,150 | |
| | | | | | | | | | | | | | | | |
| | | | |
| Industrial Conglomerates: 0.33% | | | | | | | | | | | | | | | | |
Roper Industries Incorporated | | | | | | | | | | | 6,000 | | | | 1,650,540 | |
| | | | | | | | | | | | | | | | |
| | | | |
| Machinery: 0.23% | | | | | | | | | | | | | | | | |
John Bean Technologies Corporation | | | | | | | | | | | 10,000 | | | | 1,107,500 | |
| | | | | | | | | | | | | | | | |
| | | | |
Information Technology: 3.06% | | | | | | | | | | | | | | | | |
| | | | |
| Electronic Equipment, Instruments & Components: 0.18% | | | | | | | | | | | | | | | | |
Amphenol Corporation Class A | | | | | | | | | | | 10,000 | | | | 913,900 | |
| | | | | | | | | | | | | | | | |
| | | | |
| Internet Software & Services: 0.22% | | | | | | | | | | | | | | | | |
Alphabet Incorporated Class A † | | | | | | | | | | | 1,000 | | | | 1,103,920 | |
| | | | | | | | | | | | | | | | |
| | | | |
| IT Services: 0.26% | | | | | | | | | | | | | | | | |
Leidos Holdings Incorporated | | | | | | | | | | | 20,000 | | | | 1,266,200 | |
| | | | | | | | | | | | | | | | |
| | | | |
| Semiconductors & Semiconductor Equipment: 2.40% | | | | | | | | | | | | | | | | |
Applied Materials Incorporated | | | | | | | | | | | 10,000 | | | | 575,900 | |
Broadcom Limited | | | | | | | | | | | 30,000 | | | | 7,393,800 | |
The accompanying notes are an integral part of these financial statements.
| | | | |
| 8 | | Wells Fargo High Yield Bond Fund | | Portfolio of investments—February 28, 2018 (unaudited) |
| | | | | | | | | | | | | | | | |
| Security name | | | | | | | | Shares | | | Value | |
| | | | |
| Semiconductors & Semiconductor Equipment (continued) | | | | | | | | | | | | | | | | |
Microsemi Corporation † | | | | | | | | | | | 15,000 | | | $ | 973,500 | |
QUALCOMM Incorporated | | | | | | | | | | | 5,000 | | | | 325,000 | |
Texas Instruments Incorporated | | | | | | | | | | | 5,000 | | | | 541,750 | |
Xilinx Incorporated | | | | | | | | | | | 30,000 | | | | 2,137,500 | |
| | | | |
| | | | | | | | | | | | | | | 11,947,450 | |
| | | | | | | | | | | | | | | | |
| | | | |
Materials: 0.74% | | | | | | | | | | | | | | | | |
| | | | |
| Chemicals: 0.74% | | | | | | | | | | | | | | | | |
Celanese Corporation Series A | | | | | | | | | | | 15,000 | | | | 1,512,900 | |
LyondellBasell Industries NV Class A | | | | | | | | | | | 20,000 | | | | 2,164,400 | |
| | | | |
| | | | | | | | | | | | | | | 3,677,300 | |
| | | | | | | | | | | | | | | | |
| | | | |
Real Estate: 0.15% | | | | | | | | | | | | | | | | |
| | | | |
| Equity REITs: 0.15% | | | | | | | | | | | | | | | | |
Saul Centers Incorporated | | | | | | | | | | | 15,000 | | | | 733,950 | |
| | | | | | | | | | | | | | | | |
| | | | |
Utilities: 0.24% | | | | | | | | | | | | | | | | |
| | | | |
| Gas Utilities: 0.24% | | | | | | | | | | | | | | | | |
Atmos Energy Corporation | | | | | | | | | | | 15,000 | | | | 1,207,350 | |
| | | | | | | | | | | | | | | | |
| | | | |
Total Common Stocks (Cost $38,890,636) | | | | | | | | | | | | | | | 44,326,510 | |
| | | | | | | | | | | | | | | | |
| | | | |
| | | Interest rate | | | Maturity date | | | Principal | | | | |
| Corporate Bonds and Notes: 75.59% | | | | | | | | | | | | | | | | |
| | | | |
Consumer Discretionary: 7.70% | | | | | | | | | | | | | | | | |
| | | | |
| Auto Components: 2.21% | | | | | | | | | | | | | | | | |
Allison Transmission Incorporated 144A | | | 5.00 | % | | | 10-1-2024 | | | $ | 1,000,000 | | | | 1,013,748 | |
Dana Holding Corporation | | | 5.50 | | | | 12-15-2024 | | | | 1,500,000 | | | | 1,530,000 | |
Goodyear Tire & Rubber Company | | | 5.13 | | | | 11-15-2023 | | | | 2,500,000 | | | | 2,559,375 | |
Tenneco Incorporated | | | 5.00 | | | | 7-15-2026 | | | | 6,000,000 | | | | 5,895,000 | |
| | | | |
| | | | | | | | | | | | | | | 10,998,123 | |
| | | | | | | | | | | | | | | | |
| | | | |
| Hotels, Restaurants & Leisure: 0.63% | | | | | | | | | | | | | | | | |
Speedway Motorsports Incorporated | | | 5.13 | | | | 2-1-2023 | | | | 3,115,000 | | | | 3,115,000 | |
| | | | | | | | | | | | | | | | |
| | | | |
| Household Durables: 0.93% | | | | | | | | | | | | | | | | |
KB Home | | | 7.50 | | | | 9-15-2022 | | | | 3,000,000 | | | | 3,341,250 | |
Lennar Corporation | | | 4.75 | | | | 5-30-2025 | | | | 1,300,000 | | | | 1,293,500 | |
| | | | |
| | | | | | | | | | | | | | | 4,634,750 | |
| | | | | | | | | | | | | | | | |
| | | | |
| Media: 2.92% | | | | | | | | | | | | | | | | |
CCO Holdings LLC 144A | | | 5.75 | | | | 2-15-2026 | | | | 3,000,000 | | | | 3,041,250 | |
Clear Channel Worldwide Holdings Incorporated | | | 6.50 | | | | 11-15-2022 | | | | 3,000,000 | | | | 3,076,500 | |
McGraw-Hill Global Education Holdings LLC 144A« | | | 7.88 | | | | 5-15-2024 | | | | 5,500,000 | | | | 5,321,250 | |
Sinclair Television Group Incorporated 144A | | | 5.63 | | | | 8-1-2024 | | | | 3,000,000 | | | | 3,045,000 | |
| | | | |
| | | | | | | | | | | | | | | 14,484,000 | |
| | | | | | | | | | | | | | | | |
The accompanying notes are an integral part of these financial statements.
| | | | | | |
| Portfolio of investments—February 28, 2018 (unaudited) | | Wells Fargo High Yield Bond Fund | | | 9 | |
| | | | | | | | | | | | | | | | |
| Security name | | Interest rate | | | Maturity date | | | Principal | | | Value | |
| | | | |
| Specialty Retail: 1.01% | | | | | | | | | | | | | | | | |
Sally Holdings LLC « | | | 5.63 | % | | | 12-1-2025 | | | $ | 5,000,000 | | | $ | 5,025,000 | |
| | | | | | | | | | | | | | | | |
| | | | |
Consumer Staples: 3.51% | | | | | | | | | | | | | | | | |
| | | | |
| Food Products: 3.10% | | | | | | | | | | | | | | | | |
Dean Foods Company 144A« | | | 6.50 | | | | 3-15-2023 | | | | 5,000,000 | | | | 4,887,500 | |
Lamb Weston Holdings Incorporated 144A | | | 4.63 | | | | 11-1-2024 | | | | 1,000,000 | | | | 1,005,000 | |
Post Holdings Incorporated 144A | | | 5.00 | | | | 8-15-2026 | | | | 10,000,000 | | | | 9,500,000 | |
| | | | |
| | | | | | | | | | | | | | | 15,392,500 | |
| | | | | | | | | | | | | | | | |
| | | | |
| Household Products: 0.41% | | | | | | | | | | | | | | | | |
Spectrum Brands Incorporated | | | 5.75 | | | | 7-15-2025 | | | | 2,000,000 | | | | 2,060,000 | |
| | | | | | | | | | | | | | | | |
| | | | |
Energy: 4.01% | | | | | | | | | | | | | | | | |
| | | | |
| Energy Equipment & Services: 0.20% | | | | | | | | | | | | | | | | |
NGPL PipeCo LLC 144A | | | 4.88 | | | | 8-15-2027 | | | | 1,000,000 | | | | 1,008,750 | |
| | | | | | | | | | | | | | | | |
| | | | |
| Oil, Gas & Consumable Fuels: 3.81% | | | | | | | | | | | | | | | | |
Cheniere Corpus Christi Holdings LLC | | | 5.13 | | | | 6-30-2027 | | | | 13,500,000 | | | | 13,651,875 | |
Tennessee Gas Pipeline Company | | | 7.00 | | | | 3-15-2027 | | | | 4,534,000 | | | | 5,296,731 | |
| | | | |
| | | | | | | | | | | | | | | 18,948,606 | |
| | | | | | | | | | | | | | | | |
| | | | |
Financials: 2.03% | | | | | | | | | | | | | | | | |
| | | | |
| Banks: 0.64% | | | | | | | | | | | | | | | | |
Bank of America Corporation (3 Month LIBOR +3.90%) ± | | | 6.10 | | | | 12-29-2049 | | | | 3,000,000 | | | | 3,180,000 | |
| | | | | | | | | | | | | | | | |
| | | | |
| Consumer Finance: 0.70% | | | | | | | | | | | | | | | | |
Navient Corporation | | | 5.88 | | | | 10-25-2024 | | | | 1,000,000 | | | | 990,000 | |
SLM Corporation | | | 5.50 | | | | 1-25-2023 | | | | 2,500,000 | | | | 2,475,000 | |
| | | | |
| | | | | | | | | | | | | | | 3,465,000 | |
| | | | | | | | | | | | | | | | |
| | | | |
| Insurance: 0.69% | | | | | | | | | | | | | | | | |
Genworth Holdings Incorporated | | | 4.80 | | | | 2-15-2024 | | | | 4,000,000 | | | | 3,420,000 | |
| | | | | | | | | | | | | | | | |
| | | | |
Health Care: 15.51% | | | | | | | | | | | | | | | | |
| | | | |
| Health Care Equipment & Supplies: 2.08% | | | | | | | | | | | | | | | | |
Halyard Health Incorporated | | | 6.25 | | | | 10-15-2022 | | | | 1,000,000 | | | | 1,028,750 | |
Teleflex Incorporated | | | 4.88 | | | | 6-1-2026 | | | | 9,415,000 | | | | 9,320,850 | |
| | | | |
| | | | | | | | | | | | | | | 10,349,600 | |
| | | | | | | | | | | | | | | | |
| | | | |
| Health Care Providers & Services: 10.81% | | | | | | | | | | | | | | | | |
AMN Healthcare Incorporated 144A | | | 5.13 | | | | 10-1-2024 | | | | 12,298,000 | | | | 12,420,980 | |
DaVita HealthCare Partners Incorporated | | | 5.00 | | | | 5-1-2025 | | | | 9,000,000 | | | | 8,820,000 | |
DaVita HealthCare Partners Incorporated | | | 5.13 | | | | 7-15-2024 | | | | 2,000,000 | | | | 1,986,250 | |
Encompass Health Corporation | | | 5.75 | | | | 11-1-2024 | | | | 4,000,000 | | | | 4,055,000 | |
HCA Incorporated | | | 5.38 | | | | 2-1-2025 | | | | 9,000,000 | | | | 9,149,130 | |
HealthSouth Corporation | | | 5.13 | | | | 3-15-2023 | | | | 5,000,000 | | | | 5,087,500 | |
Kindred Healthcare Incorporated « | | | 8.75 | | | | 1-15-2023 | | | | 4,000,000 | | | | 4,280,000 | |
The accompanying notes are an integral part of these financial statements.
| | | | |
| 10 | | Wells Fargo High Yield Bond Fund | | Portfolio of investments—February 28, 2018 (unaudited) |
| | | | | | | | | | | | | | | | |
| Security name | | Interest rate | | | Maturity date | | | Principal | | | Value | |
| | | | |
| Health Care Providers & Services (continued) | | | | | | | | | | | | | | | | |
Select Medical Corporation | | | 6.38 | % | | | 6-1-2021 | | | $ | 3,500,000 | | | $ | 3,568,145 | |
West Street Merger Sub Incorporated 144A | | | 6.38 | | | | 9-1-2025 | | | | 4,400,000 | | | | 4,378,000 | |
| | | | |
| | | | | | | | | | | | | | | 53,745,005 | |
| | | | | | | | | | | | | | | | |
| | | | |
| Health Care Technology: 1.03% | | | | | | | | | | | | | | | | |
Quintiles IMS Holdings Incorporated 144A | | | 4.88 | | | | 5-15-2023 | | | | 3,000,000 | | | | 3,082,500 | |
Quintiles IMS Holdings Incorporated 144A | | | 5.00 | | | | 10-15-2026 | | | | 2,000,000 | | | | 2,006,000 | |
| | | | |
| | | | | | | | | | | | | | | 5,088,500 | |
| | | | | | | | | | | | | | | | |
| | | | |
| Pharmaceuticals: 1.59% | | | | | | | | | | | | | | | | |
Catalent Pharma Solutions Incorporated 144A | | | 4.88 | | | | 1-15-2026 | | | | 8,000,000 | | | | 7,920,000 | |
| | | | | | | | | | | | | | | | |
| | | | |
Industrials: 15.08% | | | | | | | | | | | | | | | | |
| | | | |
| Aerospace & Defense: 4.61% | | | | | | | | | | | | | | | | |
Huntington Ingalls Industries Incorporated 144A | | | 5.00 | | | | 11-15-2025 | | | | 4,500,000 | | | | 4,772,790 | |
Moog Incorporated 144A | | | 5.25 | | | | 12-1-2022 | | | | 5,000,000 | | | | 5,150,000 | |
TransDigm Group Incorporated | | | 6.38 | | | | 6-15-2026 | | | | 12,700,000 | | | | 12,985,750 | |
| | | | |
| | | | | | | | | | | | | | | 22,908,540 | |
| | | | | | | | | | | | | | | | |
| | | | |
| Commercial Services & Supplies: 1.50% | | | | | | | | | | | | | | | | |
Acco Brands Corporation 144A | | | 5.25 | | | | 12-15-2024 | | | | 7,417,000 | | | | 7,454,085 | |
| | | | | | | | | | | | | | | | |
| | | | |
| Construction & Engineering: 0.58% | | | | | | | | | | | | | | | | |
Aecom Company | | | 5.13 | | | | 3-15-2027 | | | | 3,000,000 | | | | 2,905,350 | |
| | | | | | | | | | | | | | | | |
| | | | |
| Machinery: 4.89% | | | | | | | | | | | | | | | | |
Oshkosh Corporation | | | 5.38 | | | | 3-1-2025 | | | | 4,163,000 | | | | 4,341,176 | |
SPX FLOW Incorporated 144A | | | 5.63 | | | | 8-15-2024 | | | | 7,000,000 | | | | 7,122,500 | |
SPX FLOW Incorporated 144A | | | 5.88 | | | | 8-15-2026 | | | | 12,500,000 | | | | 12,843,750 | |
| | | | |
| | | | | | | | | | | | | | | 24,307,426 | |
| | | | | | | | | | | | | | | | |
| | | | |
| Trading Companies & Distributors: 3.50% | | | | | | | | | | | | | | | | |
United Rentals North America Incorporated | | | 5.75 | | | | 11-15-2024 | | | | 3,000,000 | | | | 3,105,000 | |
Wesco Distribution Incorporated | | | 5.38 | | | | 6-15-2024 | | | | 14,245,000 | | | | 14,280,613 | |
| | | | |
| | | | | | | | | | | | | | | 17,385,613 | |
| | | | | | | | | | | | | | | | |
| | | | |
Information Technology: 12.27% | | | | | | | | | | | | | | | | |
| | | | |
| Communications Equipment: 2.51% | | | | | | | | | | | | | | | | |
CommScope Incorporated 144A | | | 5.50 | | | | 6-15-2024 | | | | 8,200,000 | | | | 8,353,750 | |
CommScope Technologies Finance LLC 144A | | | 6.00 | | | | 6-15-2025 | | | | 4,000,000 | | | | 4,131,200 | |
| | | | |
| | | | | | | | | | | | | | | 12,484,950 | |
| | | | | | | | | | | | | | | | |
| | | | |
| Electronic Equipment, Instruments & Components: 1.80% | | | | | | | | | | | | | | | | |
TTM Technologies Incorporated 144A | | | 5.63 | | | | 10-1-2025 | | | | 9,000,000 | | | | 8,955,000 | |
| | | | | | | | | | | | | | | | |
| | | | |
| IT Services: 0.41% | | | | | | | | | | | | | | | | |
Gartner Incorporated 144A | | | 5.13 | | | | 4-1-2025 | | | | 2,000,000 | | | | 2,050,000 | |
| | | | | | | | | | | | | | | | |
The accompanying notes are an integral part of these financial statements.
| | | | | | |
| Portfolio of investments—February 28, 2018 (unaudited) | | Wells Fargo High Yield Bond Fund | | | 11 | |
| | | | | | | | | | | | | | | | |
| Security name | | Interest rate | | | Maturity date | | | Principal | | | Value | |
| | | | |
| Semiconductors & Semiconductor Equipment: 3.65% | | | | | | | | | | | | | | | | |
Micron Technology Incorporated | | | 5.50 | % | | | 2-1-2025 | | | $ | 7,900,000 | | | $ | 8,196,250 | |
Micron Technology Incorporated 144A | | | 5.63 | | | | 1-15-2026 | | | | 6,750,000 | | | | 6,986,250 | |
Versum Materials Incorporated 144A | | | 5.50 | | | | 9-30-2024 | | | | 2,810,000 | | | | 2,936,450 | |
| | | | |
| | | | | | | | | | | | | | | 18,118,950 | |
| | | | | | | | | | | | | | | | |
| | | | |
| Software: 1.63% | | | | | | | | | | | | | | | | |
Nuance Communications Company | | | 6.00 | | | | 7-1-2024 | | | | 6,760,000 | | | | 7,074,678 | |
Symantec Corporation 144A | | | 5.00 | | | | 4-15-2025 | | | | 1,000,000 | | | | 1,020,103 | |
| | | | |
| | | | | | | | | | | | | | | 8,094,781 | |
| | | | | | | | | | | | | | | | |
| | | | |
| Technology Hardware, Storage & Peripherals: 2.27% | | | | | | | | | | | | | | | | |
Diebold Incorporated | | | 8.50 | | | | 4-15-2024 | | | | 10,700,000 | | | | 11,288,500 | |
| | | | | | | | | | | | | | | | |
| | | | |
Materials: 8.81% | | | | | | | | | | | | | | | | |
| | | | |
| Chemicals: 6.32% | | | | | | | | | | | | | | | | |
Koppers Incorporated 144A | | | 6.00 | | | | 2-15-2025 | | | | 3,363,000 | | | | 3,480,705 | |
Olin Corporation | | | 5.50 | | | | 8-15-2022 | | | | 8,275,000 | | | | 8,606,000 | |
Rayonier Advanced Materials Products Incorporated 144A | | | 5.50 | | | | 6-1-2024 | | | | 7,775,000 | | | | 7,736,125 | |
Scotts Miracle-Gro Company | | | 6.00 | | | | 10-15-2023 | | | | 1,000,000 | | | | 1,045,000 | |
Valvoline Incorporated | | | 4.38 | | | | 8-15-2025 | | | | 8,000,000 | | | | 7,820,000 | |
Valvoline Incorporated | | | 5.50 | | | | 7-15-2024 | | | | 2,630,000 | | | | 2,712,188 | |
| | | | |
| | | | | | | | | | | | | | | 31,400,018 | |
| | | | | | | | | | | | | | | | |
| | | | |
| Containers & Packaging: 1.84% | | | | | | | | | | | | | | | | |
Ball Corporation | | | 4.00 | | | | 11-15-2023 | | | | 1,500,000 | | | | 1,485,000 | |
Berry Plastics Corporation | | | 5.13 | | | | 7-15-2023 | | | | 2,000,000 | | | | 2,042,500 | |
Crown Americas Capital Corporation IV | | | 4.50 | | | | 1-15-2023 | | | | 2,000,000 | | | | 2,020,000 | |
Owens-Brockway Glass Container Incorporated 144A | | | 5.88 | | | | 8-15-2023 | | | | 2,000,000 | | | | 2,085,000 | |
Sealed Air Corporation 144A | | | 5.25 | | | | 4-1-2023 | | | | 1,500,000 | | | | 1,533,750 | |
| | | | |
| | | | | | | | | | | | | | | 9,166,250 | |
| | | | | | | | | | | | | | | | |
| | | | |
| Metals & Mining: 0.53% | | | | | | | | | | | | | | | | |
Steel Dynamics Incorporated | | | 5.50 | | | | 10-1-2024 | | | | 2,550,000 | | | | 2,639,250 | |
| | | | | | | | | | | | | | | | |
| | | | |
| Paper & Forest Products: 0.12% | | | | | | | | | | | | | | | | |
P.H. Glatfelter Company | | | 5.38 | | | | 10-15-2020 | | | | 600,000 | | | | 607,920 | |
| | | | | | | | | | | | | | | | |
| | | | |
Real Estate: 6.24% | | | | | | | | | | | | | | | | |
| | | | |
| Equity REITs: 6.24% | | | | | | | | | | | | | | | | |
Equinix Incorporated | | | 5.38 | | | | 5-15-2027 | | | | 6,430,000 | | | | 6,558,600 | |
Equinix Incorporated | | | 5.75 | | | | 1-1-2025 | | | | 5,193,000 | | | | 5,426,685 | |
Iron Mountain Incorporated 144A | | | 4.88 | | | | 9-15-2027 | | | | 500,000 | | | | 471,250 | |
Iron Mountain Incorporated 144A | | | 5.38 | | | | 6-1-2026 | | | | 12,750,000 | | | | 12,558,750 | |
Iron Mountain Incorporated | | | 5.75 | | | | 8-15-2024 | | | | 2,000,000 | | | | 1,990,000 | |
Sabra Health Care REIT Incorporated | | | 5.38 | | | | 6-1-2023 | | | | 4,000,000 | | | | 4,020,000 | |
| | | | |
| | | | | | | | | | | | | | | 31,025,285 | |
| | | | | | | | | | | | | | | | |
The accompanying notes are an integral part of these financial statements.
| | | | |
| 12 | | Wells Fargo High Yield Bond Fund | | Portfolio of investments—February 28, 2018 (unaudited) |
| | | | | | | | | | | | | | | | |
| Security name | | Interest rate | | | Maturity date | | | Principal | | | Value | |
| | | | |
Telecommunication Services: 0.43% | | | | | | | | | | | | | | | | |
| | | | |
| Wireless Telecommunication Services: 0.43% | | | | | | | | | | | | | | | | |
T-Mobile USA Incorporated | | | 6.50 | % | | | 1-15-2026 | | | $ | 2,000,000 | | | $ | 2,145,000 | |
| | | | | | | | | | | | | | | | |
| | | | |
Total Corporate Bonds and Notes (Cost $375,071,529) | | | | | | | | | | | | | | | 375,771,752 | |
| | | | | | | | | | | | | | | | |
| | | | |
Yankee Corporate Bonds and Notes: 12.29% | | | | | | | | | | | | | | | | |
| | | | |
Consumer Discretionary: 3.49% | | | | | | | | | | | | | | | | |
| | | | |
| Auto Components: 1.80% | | | | | | | | | | | | | | | | |
Adient Global Holdings Company 144A | | | 4.88 | | | | 8-15-2026 | | | | 9,210,000 | | | | 8,979,750 | |
| | | | | | | | | | | | | | | | |
| | | | |
| Automobiles: 0.62% | | | | | | | | | | | | | | | | |
Fiat Chrysler Automobiles NV « | | | 5.25 | | | | 4-15-2023 | | | | 3,000,000 | | | | 3,090,000 | |
| | | | | | | | | | | | | | | | |
| | | | |
| Hotels, Restaurants & Leisure: 0.65% | | | | | | | | | | | | | | | | |
International Game Technology plc 144A | | | 6.50 | | | | 2-15-2025 | | | | 3,000,000 | | | | 3,217,500 | |
| | | | | | | | | | | | | | | | |
| | | | |
| Media: 0.42% | | | | | | | | | | | | | | | | |
Quebecor Media Incorporated | | | 5.75 | | | | 1-15-2023 | | | | 2,000,000 | | | | 2,075,000 | |
| | | | | | | | | | | | | | | | |
| | | | |
Financials: 1.40% | | | | | | | | | | | | | | | | |
| | | | |
| Diversified Financial Services: 1.40% | | | | | | | | | | | | | | | | |
Tronox Finance plc 144A | | | 5.75 | | | | 10-1-2025 | | | | 7,000,000 | | | | 6,947,500 | |
| | | | | | | | | | | | | | | | |
| | | | |
Health Care: 2.65% | | | | | | | | | | | | | | | | |
| | | | |
| Pharmaceuticals: 2.65% | | | | | | | | | | | | | | | | |
Mallinckrodt plc 144A | | | 5.50 | | | | 4-15-2025 | | | | 16,500,000 | | | | 13,200,000 | |
| | | | | | | | | | | | | | | | |
| | | | |
Industrials: 1.69% | | | | | | | | | | | | | | | | |
| | | | |
| Electrical Equipment: 1.69% | | | | | | | | | | | | | | | | |
Sensata Technologies BV 144A | | | 4.88 | | | | 10-15-2023 | | | | 3,000,000 | | | | 3,045,000 | |
Sensata Technologies BV 144A | | | 5.63 | | | | 11-1-2024 | | | | 5,000,000 | | | | 5,345,250 | |
| | | | |
| | | | | | | | | | | | | | | 8,390,250 | |
| | | | | | | | | | | | | | | | |
| | | | |
Information Technology: 2.67% | | | | | | | | | | | | | | | | |
| | | | |
| Technology Hardware, Storage & Peripherals: 2.67% | | | | | | | | | | | | | | | | |
Seagate HDD | | | 4.75 | | | | 6-1-2023 | | | | 4,140,000 | | | | 4,182,953 | |
Seagate HDD | | | 4.88 | | | | 6-1-2027 | | | | 9,500,000 | | | | 9,080,272 | |
| | | | |
| | | | | | | | | | | | | | | 13,263,225 | |
| | | | | | | | | | | | | | | | |
| | | | |
Telecommunication Services: 0.39% | | | | | | | | | | | | | | | | |
| | | | |
| Diversified Telecommunication Services: 0.39% | | | | | | | | | | | | | | | | |
Virgin Media Finance plc 144A | | | 5.75 | | | | 1-15-2025 | | | | 2,000,000 | | | | 1,965,000 | |
| | | | | | | | | | | | | | | | |
| | | | |
Total Yankee Corporate Bonds and Notes (Cost $63,740,228) | | | | | | | | | | | | | | | 61,128,225 | |
| | | | | | | | | | | | | | | | |
The accompanying notes are an integral part of these financial statements.
| | | | | | |
| Portfolio of investments—February 28, 2018 (unaudited) | | Wells Fargo High Yield Bond Fund | | | 13 | |
| | | | | | | | | | | | | | | | |
| Security name | | Yield | | | | | | Shares | | | Value | |
| | | | |
Short-Term Investments: 4.83% | | | | | | | | | | | | | | | | |
| | | | |
| Investment Companies: 4.83% | | | | | | | | | | | | | | | | |
Securities Lending Cash Investment LLC (l)(r)(u) | | | 1.62 | % | | | | | | | 12,567,489 | | | $ | 12,568,746 | |
Wells Fargo Government Money Market Fund Select Class (l)(u) | | | 1.29 | | | | | | | | 11,457,654 | | | | 11,457,654 | |
| | | | |
Total Short-Term Investments (Cost $24,026,400) | | | | | | | | | | | | | | | 24,026,400 | |
| | | | | | | | | | | | | | | | |
| | | | | | | | |
| Total investments in securities (Cost $501,728,793) | | | 101.63 | % | | | 505,252,887 | |
Other assets and liabilities, net | | | (1.63 | ) | | | (8,107,630 | ) |
| | | | | | | | |
| Total net assets | | | 100.00 | % | | $ | 497,145,257 | |
| | | | | | | | |
| † | Non-income-earning security |
| 144A | The security may be resold in transactions exempt from registration, normally to qualified institutional buyers, pursuant to Rule 144A under the Securities Act of 1933. |
| « | All or a portion of this security is on loan. |
| ± | Variable rate investment. The rate shown is the rate in effect at period end. |
| (l) | The issuer of the security is an affiliated person of the Fund as defined in the Investment Company Act of 1940. |
| (r) | The investment is a non-registered investment company purchased with cash collateral received from securities on loan. |
| (u) | The rate represents the 7-day annualized yield at period end. |
Investments in Affiliates
An affiliated investment is an investment in which the Fund owns at least 5% of the outstanding voting shares of the issuer or as a result of other relationships, such as the Fund and the issuer having the same investment manager. Transactions with issuers that were either affiliated persons of the Fund at the beginning of the period or the end of the period were as follows:
| | | | | | | | | | | | | | | | | | | | | | | | | | | | | | | | | | | | |
| | | Shares,
beginning of
period | | | Shares
purchased | | | Shares
sold | | | Shares,
end of
period | | | Net
realized
gains
(losses) | | | Net
change in
unrealized
gains
(losses) | | | Income
from
affiliated
securities | | | Value,
end
of period | | | % of
net
assets | |
Short-Term Investments | | | | | | | | | | | | | | | | | | | | | | | | | | | | | | | | | | | | |
Investment Companies | | | | | | | | | | | | | | | | | | | | | | | | | | | | | | | | | | | | |
Securities Lending Cash Investment LLC | | | 13,052,787 | | | | 18,742,677 | | | | 19,227,975 | | | | 12,567,489 | | | $ | 615 | | | $ | (615 | ) | | $ | 35,142 | | | $ | 12,568,746 | | | | | |
Wells Fargo Government Money Market Fund Select Class | | | 8,238,288 | | | | 105,975,775 | | | | 102,756,409 | | | | 11,457,654 | | | | 0 | | | | 0 | | | | 26,915 | | | | 11,457,654 | | | | | |
| | | | | | | | | | | | | | | | | | | | | | | | | | | | | | | | | | | | |
| | | | | | | | | | | | | | | | | | $ | 615 | | | $ | (615 | ) | | $ | 62,057 | | | $ | 24,026,400 | | | | 4.83 | % |
| | | | | | | | | | | | | | | | | | | | | | | | | | | | | | | | | | | | |
The accompanying notes are an integral part of these financial statements.
| | | | |
| 14 | | Wells Fargo High Yield Bond Fund | | Statement of assets and liabilities—February 28, 2018 (unaudited) |
| | | | |
| | | | |
| |
Assets | | | | |
Investments in unaffiliated securities (including $12,315,170 of securities on loan), at value (cost $477,702,393) | | $ | 481,226,487 | |
Investments in affiliated securities, at value (cost $24,026,400) | | | 24,026,400 | |
Receivable for Fund shares sold | | | 204,426 | |
Receivable for dividends and interest | | | 5,913,308 | |
Receivable for securities lending income | | | 5,319 | |
Prepaid expenses and other assets | | | 194,655 | |
| | | | |
Total assets | | | 511,570,595 | |
| | | | |
| |
Liabilities | | | | |
Payable upon receipt of securities loaned | | | 12,567,678 | |
Payable for Fund shares redeemed | | | 1,289,311 | |
Management fee payable | | | 169,909 | |
Dividends payable | | | 159,608 | |
Administration fees payable | | | 53,097 | |
Distribution fee payable | | | 32,944 | |
Trustees’ fees and expenses payable | | | 2,142 | |
Accrued expenses and other liabilities | | | 150,649 | |
| | | | |
Total liabilities | | | 14,425,338 | |
| | | | |
Total net assets | | $ | 497,145,257 | |
| | | | |
| |
NET ASSETS CONSIST OF | | | | |
Paid-in capital | | $ | 537,651,865 | |
Overdistributed net investment income | | | (162,655 | ) |
Accumulated net realized losses on investments | | | (43,868,047 | ) |
Net unrealized gains on investments | | | 3,524,094 | |
| | | | |
Total net assets | | $ | 497,145,257 | |
| | | | |
| |
COMPUTATION OF NET ASSET VALUE AND OFFERING PRICE PER SHARE | | | | |
Net assets – Class A | | $ | 291,142,321 | |
Shares outstanding – Class A1 | | | 87,537,909 | |
Net asset value per share – Class A | | | $3.33 | |
Maximum offering price per share – Class A2 | | | $3.49 | |
Net assets – Class C | | $ | 56,980,524 | |
Shares outstanding – Class C1 | | | 17,129,076 | |
Net asset value per share – Class C | | | $3.33 | |
Net assets – Administrator Class | | $ | 27,009,329 | |
Shares outstanding – Administrator Class1 | | | 8,114,144 | |
Net asset value per share – Administrator Class | | | $3.33 | |
Net assets – Institutional Class | | $ | 122,013,083 | |
Shares outstanding – Institutional Class1 | | | 36,668,104 | |
Net asset value per share – Institutional Class | | | $3.33 | |
| 1 | The Fund has an unlimited number of authorized shares. |
| 2 | Maximum offering price is computed as 100/95.50 of net asset value. On investments of $50,000 or more, the offering price is reduced. |
The accompanying notes are an integral part of these financial statements.
| | | | | | |
| Statement of operations—six months ended February 28, 2018 (unaudited) | | Wells Fargo High Yield Bond Fund | | | 15 | |
| | | | |
| | | | |
| |
Investment income | | | | |
Interest | | $ | 13,009,494 | |
Dividends | | | 569,770 | |
Income from affiliated securities | | | 62,057 | |
| | | | |
Total investment income | | | 13,641,321 | |
| | | | |
| |
Expenses | | | | |
Management fee | | | 1,440,912 | |
Administration fees | | | | |
Class A | | | 242,249 | |
Class C | | | 47,238 | |
Administrator Class | | | 14,607 | |
Institutional Class | | | 53,696 | |
Shareholder servicing fees | | | | |
Class A | | | 378,514 | |
Class C | | | 73,810 | |
Administrator Class | | | 36,517 | |
Distribution fee | | | | |
Class C | | | 221,429 | |
Custody and accounting fees | | | 16,076 | |
Professional fees | | | 30,345 | |
Registration fees | | | 40,493 | |
Shareholder report expenses | | | 22,891 | |
Trustees’ fees and expenses | | | 31,804 | |
Other fees and expenses | | | 14,873 | |
| | | | |
Total expenses | | | 2,665,454 | |
Less: Fee waivers and/or expense reimbursements | | | (288,793 | ) |
| | | | |
Net expenses | | | 2,376,661 | |
| | | | |
Net investment income | | | 11,264,660 | |
| | | | |
| |
REALIZED AND UNREALIZED GAINS (LOSSES) ON INVESTMENTS | | | | |
| |
Net realized gains on: | | | | |
Unaffiliated securities | | | 3,462,983 | |
Affiliated securities | | | 615 | |
| | | | |
Net realized gains on investments | | | 3,463,598 | |
| | | | |
| |
Net change in unrealized gains (losses) on: | | | | |
Unaffiliated securities | | | (15,709,075 | ) |
Affiliated securities | | | (615 | ) |
| | | | |
Net change in unrealized gains (losses) on investments | | | (15,709,690 | ) |
| | | | |
Net realized and unrealized gains (losses) on investments | | | (12,246,092 | ) |
| | | | |
Net decrease in net assets resulting from operations | | $ | (981,432 | ) |
| | | | |
The accompanying notes are an integral part of these financial statements.
| | | | |
| 16 | | Wells Fargo High Yield Bond Fund | | Statement of changes in net assets |
| | | | | | | | | | | | | | | | |
| | | Six months ended February 28, 2018 (unaudited) | | | Year ended August 31, 2017 | |
| | | | |
Operations | | | | | | | | | | | | | | | | |
Net investment income | | | | | | $ | 11,264,660 | | | | | | | $ | 24,919,734 | |
Net realized gains on investments | | | | | | | 3,463,598 | | | | | | | | 6,347,524 | |
Net change in unrealized gains (losses) on investments | | | | | | | (15,709,690 | ) | | | | | | | 7,886,932 | |
| | | | |
Net increase (decrease) in net assets resulting from operations | | | | | | | (981,432 | ) | | | | | | | 39,154,190 | |
| | | | |
| | | | |
Distributions to shareholders from | | | | | | | | | | | | | | | | |
Net investment income | | | | | | | | | | | | | | | | |
Class A | | | | | | | (6,449,073 | ) | | | | | | | (14,210,998 | ) |
Class B | | | | | | | N/A | | | | | | | | (14,959 | )1 |
Class C | | | | | | | (1,036,428 | ) | | | | | | | (2,374,586 | ) |
Administrator Class | | | | | | | (640,552 | ) | | | | | | | (1,969,904 | ) |
Institutional Class | | | | | | | (3,124,106 | ) | | | | | | | (5,524,870 | ) |
Tax basis return of capital | | | | | | | | | | | | | | | | |
Class A | | | | | | | 0 | | | | | | | | (410,144 | ) |
Class B | | | | | | | N/A | | | | | | | | (432 | )1 |
Class C | | | | | | | 0 | | | | | | | | (68,533 | ) |
Administrator Class | | | | | | | 0 | | | | | | | | (56,853 | ) |
Institutional Class | | | | | | | 0 | | | | | | | | (159,453 | ) |
| | | | |
Total distributions to shareholders | | | | | | | (11,250,159 | ) | | | | | | | (24,790,732 | ) |
| | | | |
| | | | |
Capital share transactions | | | Shares | | | | | | | | Shares | | | | | |
Proceeds from shares sold | | | | | | | | | | | | | | | | |
Class A | | | 2,147,199 | | | | 7,282,978 | | | | 8,416,164 | | | | 28,003,186 | |
Class B | | | N/A | | | | N/A | | | | 12 | 1 | | | 39 | 1 |
Class C | | | 519,775 | | | | 1,750,698 | | | | 946,458 | | | | 3,143,229 | |
Administrator Class | | | 609,422 | | | | 2,067,428 | | | | 6,750,591 | | | | 22,463,004 | |
Institutional Class | | | 15,946,357 | | | | 54,291,338 | | | | 26,266,703 | | | | 87,446,183 | |
| | | | |
| | | | | | | 65,392,442 | | | | | | | | 141,055,641 | |
| | | | |
Reinvestment of distributions | | | | | | | | | | | | | | | | |
Class A | | | 1,709,652 | | | | 5,786,689 | | | | 3,942,159 | | | | 13,168,904 | |
Class B | | | N/A | | | | N/A | | | | 4,383 | 1 | | | 14,450 | 1 |
Class C | | | 297,982 | | | | 1,008,491 | | | | 693,090 | | | | 2,315,974 | |
Administrator Class | | | 180,208 | | | | 610,345 | | | | 589,815 | | | | 1,965,669 | |
Institutional Class | | | 896,186 | | | | 3,034,838 | | | | 1,653,998 | | | | 5,539,894 | |
| | | | |
| | | | | | | 10,440,363 | | | | | | | | 23,004,891 | |
| | | | |
Payment for shares redeemed | | | | | | | | | | | | | | | | |
Class A | | | (8,620,798 | ) | | | (29,209,398 | ) | | | (32,018,320 | ) | | | (106,244,993 | ) |
Class B | | | N/A | | | | N/A | | | | (268,372 | )1 | | | (896,622 | )1 |
Class C | | | (1,823,050 | ) | | | (6,182,937 | ) | | | (5,530,431 | ) | | | (18,463,311 | ) |
Administrator Class | | | (1,949,767 | ) | | | (6,605,878 | ) | | | (21,206,310 | ) | | | (69,867,066 | ) |
Institutional Class | | | (17,172,790 | ) | | | (57,930,784 | ) | | | (21,129,365 | ) | | | (70,531,940 | ) |
| | | | |
| | | | | | | (99,928,997 | ) | | | | | | | (266,003,932 | ) |
| | | | |
Net decrease in net assets resulting from capital share transactions | | | | | | | (24,096,192 | ) | | | | | | | (101,943,400 | ) |
| | | | |
Total decrease in net assets | | | | | | | (36,327,783 | ) | | | | | | | (87,579,942 | ) |
| | | | |
| | | | |
Net assets | | | | | | | | | | | | | | | | |
Beginning of period | | | | | | | 533,473,040 | | | | | | | | 621,052,982 | |
| | | | |
End of period | | | | | | $ | 497,145,257 | | | | | | | $ | 533,473,040 | |
| | | | |
Overdistributed net investment income | | | | | | $ | (162,655 | ) | | | | | | $ | (177,156 | ) |
| | | | |
| 1 | For the period from September 1, 2016 to May 5, 2017. Effective at the close of business on May 5, 2017, Class B shares were converted to Class A shares and are no longer offered by the Fund. |
The accompanying notes are an integral part of these financial statements.
| | | | | | |
| Financial highlights | | Wells Fargo High Yield Bond Fund | | | 17 | |
(For a share outstanding throughout each period)
| | | | | | | | | | | | | | | | | | | | | | | | |
| | | Six months ended February 28, 2018 (unaudited) | | | Year ended August 31 | |
| CLASS A | | | 2017 | | | 2016 | | | 2015 | | | 2014 | | | 2013 | |
Net asset value, beginning of period | | | $3.40 | | | | $3.31 | | | | $3.16 | | | | $3.35 | | | | $3.15 | | | | $3.18 | |
Net investment income | | | 0.07 | | | | 0.14 | | | | 0.13 | | | | 0.13 | | | | 0.14 | | | | 0.15 | |
Net realized and unrealized gains (losses) on investments | | | (0.07 | ) | | | 0.10 | | | | 0.15 | | | | (0.19 | ) | | | 0.20 | | | | (0.03 | ) |
| | | | | | | | | | | | | | | | | | | | | | | | |
Total from investment operations | | | 0.00 | 1 | | | 0.24 | | | | 0.28 | | | | (0.06 | ) | | | 0.34 | | | | 0.12 | |
Distributions to shareholders from | | | | | | | | | | | | | | | | | | | | | | | | |
Net investment income | | | (0.07 | ) | | | (0.15 | ) | | | (0.13 | ) | | | (0.13 | ) | | | (0.14 | ) | | | (0.15 | ) |
Tax basis return of capital | | | 0.00 | | | | (0.00 | )1 | | | 0.00 | | | | 0.00 | | | | 0.00 | | | | 0.00 | |
| | | | | | | | | | | | | | | | | | | | | | | | |
Total distributions to shareholders | | | (0.07 | ) | | | (0.15 | ) | | | (0.13 | ) | | | (0.13 | ) | | | (0.14 | ) | | | (0.15 | ) |
Net asset value, end of period | | | $3.33 | | | | $3.40 | | | | $3.31 | | | | $3.16 | | | | $3.35 | | | | $3.15 | |
Total return2 | | | 0.03 | % | | | 7.28 | % | | | 9.25 | % | | | (1.79 | )% | | | 11.02 | % | | | 3.78 | % |
Ratios to average net assets (annualized) | | | | | | | | | | | | | | | | | | | | | | | | |
Gross expenses | | | 1.02 | % | | | 1.01 | % | | | 1.04 | % | | | 1.04 | % | | | 1.03 | % | | | 1.04 | % |
Net expenses | | | 0.93 | % | | | 0.93 | % | | | 1.01 | % | | | 1.03 | % | | | 1.03 | % | | | 1.03 | % |
Net investment income | | | 4.26 | % | | | 4.39 | % | | | 4.24 | % | | | 4.04 | % | | | 4.35 | % | | | 4.65 | % |
Supplemental data | | | | | | | | | | | | | | | | | | | | | | | | |
Portfolio turnover rate2 | | | 11 | % | | | 20 | % | | | 75 | % | | | 55 | % | | | 40 | % | | | 95 | % |
Net assets, end of period (000s omitted) | | | $291,142 | | | | $314,156 | | | | $370,560 | | | | $179,357 | | | | $210,005 | | | | $225,743 | |
| 1 | Amount is less than $0.005. |
| 2 | Total return calculations do not include any sales charges. Returns for periods of less than one year are not annualized. |
The accompanying notes are an integral part of these financial statements.
| | | | |
| 18 | | Wells Fargo High Yield Bond Fund | | Financial highlights |
(For a share outstanding throughout each period)
| | | | | | | | | | | | | | | | | | | | | | | | |
| | | Six months ended February 28, 2018 (unaudited) | | | Year ended August 31 | |
| CLASS C | | | 2017 | | | 2016 | | | 2015 | | | 2014 | | | 2013 | |
Net asset value, beginning of period | | | $3.40 | | | | $3.31 | | | | $3.16 | | | | $3.35 | | | | $3.15 | | | | $3.18 | |
Net investment income | | | 0.06 | | | | 0.12 | | | | 0.11 | | | | 0.11 | | | | 0.12 | | | | 0.13 | |
Net realized and unrealized gains (losses) on investments | | | (0.07 | ) | | | 0.09 | | | | 0.15 | | | | (0.19 | ) | | | 0.20 | | | | (0.03 | ) |
| | | | | | | | | | | | | | | | | | | | | | | | |
Total from investment operations | | | (0.01 | ) | | | 0.21 | | | | 0.26 | | | | (0.08 | ) | | | 0.32 | | | | 0.10 | |
Distributions to shareholders from | | | | | | | | | | | | | | | | | | | | | | | | |
Net investment income | | | (0.06 | ) | | | (0.12 | ) | | | (0.11 | ) | | | (0.11 | ) | | | (0.12 | ) | | | (0.13 | ) |
Tax basis return of capital | | | 0.00 | | | | (0.00 | )1 | | | 0.00 | | | | 0.00 | | | | 0.00 | | | | 0.00 | |
| | | | | | | | | | | | | | | | | | | | | | | | |
Total distributions to shareholders | | | (0.06 | ) | | | (0.12 | ) | | | (0.11 | ) | | | (0.11 | ) | | | (0.12 | ) | | | (0.13 | ) |
Net asset value, end of period | | | $3.33 | | | | $3.40 | | | | $3.31 | | | | $3.16 | | | | $3.35 | | | | $3.15 | |
Total return2 | | | (0.34 | )% | | | 6.49 | % | | | 8.44 | % | | | (2.52 | )% | | | 10.20 | % | | | 3.01 | % |
Ratios to average net assets (annualized) | | | | | | | | | | | | | | | | | | | | | | | | |
Gross expenses | | | 1.77 | % | | | 1.76 | % | | | 1.80 | % | | | 1.79 | % | | | 1.78 | % | | | 1.79 | % |
Net expenses | | | 1.68 | % | | | 1.68 | % | | | 1.77 | % | | | 1.78 | % | | | 1.78 | % | | | 1.78 | % |
Net investment income | | | 3.51 | % | | | 3.65 | % | | | 3.48 | % | | | 3.29 | % | | | 3.60 | % | | | 3.90 | % |
Supplemental data | | | | | | | | | | | | | | | | | | | | | | | | |
Portfolio turnover rate | | | 11 | % | | | 20 | % | | | 75 | % | | | 55 | % | | | 40 | % | | | 95 | % |
Net assets, end of period (000s omitted) | | | $56,981 | | | | $61,734 | | | | $72,908 | | | | $60,753 | | | | $72,728 | | | | $83,548 | |
| 1 | Amount is less than $0.005. |
| 2 | Total return calculations do not include any sales charges. Returns for periods of less than one year are not annualized. |
The accompanying notes are an integral part of these financial statements.
| | | | | | |
| Financial highlights | | Wells Fargo High Yield Bond Fund | | | 19 | |
(For a share outstanding throughout each period)
| | | | | | | | | | | | | | | | | | | | | | | | |
| | | Six months ended February 28, 2018 (unaudited) | | | Year ended August 31 | |
| ADMINISTRATOR CLASS | | | 2017 | | | 2016 | | | 2015 | | | 2014 | | | 2013 | |
Net asset value, beginning of period | | | $3.41 | | | | $3.31 | | | | $3.16 | | | | $3.36 | | | | $3.15 | | | | $3.18 | |
Net investment income | | | 0.07 | | | | 0.15 | | | | 0.14 | 1 | | | 0.14 | | | | 0.15 | | | | 0.16 | |
Net realized and unrealized gains (losses) on investments | | | (0.08 | ) | | | 0.10 | | | | 0.15 | | | | (0.20 | ) | | | 0.21 | | | | (0.03 | ) |
| | | | | | | | | | | | | | | | | | | | | | | | |
Total from investment operations | | | (0.01 | ) | | | 0.25 | | | | 0.29 | | | | (0.06 | ) | | | 0.36 | | | | 0.13 | |
Distributions to shareholders from | | | | | | | | | | | | | | | | | | | | | | | | |
Net investment income | | | (0.07 | ) | | | (0.15 | ) | | | (0.14 | ) | | | (0.14 | ) | | | (0.15 | ) | | | (0.16 | ) |
Tax basis return of capital | | | 0.00 | | | | (0.00 | )2 | | | 0.00 | | | | 0.00 | | | | 0.00 | | | | 0.00 | |
| | | | | | | | | | | | | | | | | | | | | | | | |
Total distributions to shareholders | | | (0.07 | ) | | | (0.15 | ) | | | (0.14 | ) | | | (0.14 | ) | | | (0.15 | ) | | | (0.16 | ) |
Net asset value, end of period | | | $3.33 | | | | $3.41 | | | | $3.31 | | | | $3.16 | | | | $3.36 | | | | $3.15 | |
Total return3 | | | (0.20 | )% | | | 7.74 | % | | | 9.48 | % | | | (1.86 | )% | | | 11.61 | % | | | 4.02 | % |
Ratios to average net assets (annualized) | | | | | | | | | | | | | | | | | | | | | | | | |
Gross expenses | | | 0.96 | % | | | 0.95 | % | | | 0.98 | % | | | 0.98 | % | | | 0.96 | % | | | 0.96 | % |
Net expenses | | | 0.80 | % | | | 0.80 | % | | | 0.80 | % | | | 0.80 | % | | | 0.80 | % | | | 0.80 | % |
Net investment income | | | 4.39 | % | | | 4.55 | % | | | 4.43 | % | | | 4.27 | % | | | 4.57 | % | | | 4.91 | % |
Supplemental data | | | | | | | | | | | | | | | | | | | | | | | | |
Portfolio turnover rate | | | 11 | % | | | 20 | % | | | 75 | % | | | 55 | % | | | 40 | % | | | 95 | % |
Net assets, end of period (000s omitted) | | | $27,009 | | | | $31,592 | | | | $76,688 | | | | $13,129 | | | | $20,177 | | | | $21,376 | |
| 1 | Calculated based upon average shares outstanding. |
| 2 | Amount is less than $0.005. |
| 3 | Returns for periods of less than one year are not annualized. |
The accompanying notes are an integral part of these financial statements.
| | | | |
| 20 | | Wells Fargo High Yield Bond Fund | | Financial highlights |
(For a share outstanding throughout each period)
| | | | | | | | | | | | | | | | |
| | | Six months ended February 28, 2018 (unaudited) | | | Year ended August 31 | |
| INSTITUTIONAL CLASS | | | 2017 | | | 2016 | | | 20151 | |
Net asset value, beginning of period | | | $3.41 | | | | $3.31 | | | | $3.17 | | | | $3.33 | |
Net investment income | | | 0.08 | | | | 0.16 | | | | 0.14 | | | | 0.12 | |
Net realized and unrealized gains (losses) on investments | | | (0.08 | ) | | | 0.10 | | | | 0.14 | | | | (0.16 | ) |
| | | | | | | | | | | | | | | | |
Total from investment operations | | | 0.00 | 2 | | | 0.26 | | | | 0.28 | | | | (0.04 | ) |
Distributions to shareholders from | | | | | | | | | | | | | | | | |
Net investment income | | | (0.08 | ) | | | (0.16 | ) | | | (0.14 | ) | | | (0.12 | ) |
Tax basis return of capital | | | 0.00 | | | | (0.00 | )2 | | | 0.00 | | | | 0.00 | |
| | | | | | | | | | | | | | | | |
Total distributions to shareholders | | | (0.08 | ) | | | (0.16 | ) | | | (0.14 | ) | | | (0.12 | ) |
Net asset value, end of period | | | $3.33 | | | | $3.41 | | | | $3.31 | | | | $3.17 | |
Total return3 | | | (0.06 | )% | | | 8.03 | % | | | 9.27 | % | | | (1.31 | )% |
Ratios to average net assets (annualized) | | | | | | | | | | | | | | | | |
Gross expenses | | | 0.69 | % | | | 0.68 | % | | | 0.70 | % | | | 0.71 | % |
Net expenses | | | 0.53 | % | | | 0.53 | % | | | 0.61 | % | | | 0.70 | % |
Net investment income | | | 4.67 | % | | | 4.79 | % | | | 4.65 | % | | | 4.33 | % |
Supplemental data | | | | | | | | | | | | | | | | |
Portfolio turnover rate | | | 11 | % | | | 20 | % | | | 75 | % | | | 55 | % |
Net assets, end of period (000s omitted) | | | $122,013 | | | | $125,991 | | | | $100,023 | | | | $4,847 | |
| 1 | For the period from October 31, 2014 (commencement of class operations) to August 31, 2015. |
| 2 | Amount is less than $0.005. |
| 3 | Returns for periods of less than one year are not annualized. |
The accompanying notes are an integral part of these financial statements.
| | | | | | |
| Notes to financial statements (unaudited) | | Wells Fargo High Yield Bond Fund | | | 21 | |
1. ORGANIZATION
Wells Fargo Funds Trust (the “Trust”), a Delaware statutory trust organized on March 10, 1999, is an open-end management investment company registered under the Investment Company Act of 1940, as amended (the “1940 Act”). As an investment company, the Trust follows the accounting and reporting guidance in Financial Accounting Standards Board Accounting Standards Codification Topic 946, Financial Services – Investment Companies. These financial statements report on the Wells Fargo High Yield Bond Fund (the “Fund”) which is a diversified series of the Trust.
Effective at the close of business on May 5, 2017, Class B shares were converted to Class A shares and are no longer offered by the Fund. Information for Class B shares reflected in the financial statements represents activity through May 5, 2017.
2. SIGNIFICANT ACCOUNTING POLICIES
The following significant accounting policies, which are consistently followed in the preparation of the financial statements of the Fund, are in conformity with U.S. generally accepted accounting principles which require management to make estimates and assumptions that affect the reported amounts of assets and liabilities, disclosure of contingent assets and liabilities at the date of the financial statements, and the reported amounts of revenues and expenses during the reporting period. Actual results could differ from those estimates.
Securities valuation
All investments are valued each business day as of the close of regular trading on the New York Stock Exchange (generally 4 p.m. Eastern Time), although the Fund may deviate from this calculation time under unusual or unexpected circumstances.
Debt securities are valued at the evaluated bid price provided by an independent pricing service or, if a reliable price is not available, the quoted bid price from an independent broker-dealer.
Equity securities that are listed on a foreign or domestic exchange or market are valued at the official closing price or, if none, the last sales price. If no sale occurs on the principal exchange or market that day, a fair value price will be determined in accordance with the Fund’s Valuation Procedures.
Investments in registered open-end investment companies are valued at net asset value. Interests in non-registered investment companies that are redeemable at net asset value are fair valued normally at net asset value.
Investments which are not valued using any of the methods discussed above are valued at their fair value, as determined in good faith by the Board of Trustees of the Fund. The Board of Trustees has established a Valuation Committee comprised of the Trustees and has delegated to it the authority to take any actions regarding the valuation of portfolio securities that the Valuation Committee deems necessary or appropriate, including determining the fair value of portfolio securities, unless the determination has been delegated to the Wells Fargo Asset Management Pricing Committee at Wells Fargo Funds Management, LLC (“Funds Management”). The Board of Trustees retains the authority to make or ratify any valuation decisions or approve any changes to the Valuation Procedures as it deems appropriate. On a quarterly basis, the Board of Trustees receives reports on any valuation actions taken by the Valuation Committee or the Wells Fargo Asset Management Pricing Committee which may include items for ratification.
Valuations of fair valued securities are compared to the next actual sales price when available, or other appropriate market values, to assess the continued appropriateness of the fair valuation methodologies used. These securities are fair valued on a day-to-day basis, taking into consideration changes to appropriate market information and any significant changes to the inputs considered in the valuation process until there is a readily available price provided on an exchange or by an independent pricing service. Valuations received from an independent pricing service or independent broker-dealer quotes are periodically validated by comparisons to most recent trades and valuations provided by other independent pricing services in addition to the review of prices by the manager and/or subadviser. Unobservable inputs used in determining fair valuations are identified based on the type of security, taking into consideration factors utilized by market participants in valuing the investment, knowledge about the issuer and the current market environment.
Securities lending
The Fund may lend its securities from time to time in order to earn additional income in the form of fees or interest on securities received as collateral or the investment of any cash received as collateral. The Fund continues to receive interest or dividends on the securities loaned. The Fund receives collateral in the form of cash or securities with a value at least equal to the value of the securities on loan. The value of the loaned securities is determined at the close of each business day and any additional required collateral is delivered to the Fund on the next business day. In a securities lending transaction, the net asset value of the Fund will be affected by an increase or decrease in the value of the
| | | | |
| 22 | | Wells Fargo High Yield Bond Fund | | Notes to financial statements (unaudited) |
securities loaned and by an increase or decrease in the value of the instrument in which collateral is invested. The amount of securities lending activity undertaken by the Fund fluctuates from time to time. In the event of default or bankruptcy by the borrower, the Fund may be prevented from recovering the loaned securities or gaining access to the collateral or may experience delays or costs in doing so. In addition, the investment of any cash collateral received may lose all or part of its value. The Fund has the right under the lending agreement to recover the securities from the borrower on demand.
The Fund lends its securities through an unaffiliated securities lending agent. Cash collateral received in connection with its securities lending transactions is invested in Securities Lending Cash Investments, LLC (the “Securities Lending Fund”). The Securities Lending Fund is exempt from registration under Section 3(c)(7) of the 1940 Act and is managed by Funds Management and is subadvised by Wells Capital Management Incorporated (“WellsCap”), an affiliate of Funds Management and an indirect wholly owned subsidiary of Wells Fargo & Company (“Wells Fargo”). Funds Management receives an advisory fee starting at 0.05% and declining to 0.01% as the average daily net assets of the Securities Lending Fund increase. All of the fees received by Funds Management are paid to WellsCap for its services as subadviser. The Securities Lending Fund seeks to provide a positive return compared to the daily Fed Funds Open Rate by investing in high-quality, U.S. dollar-denominated short-term money market instruments. Securities Lending Fund investments are valued at the evaluated bid price provided by an independent pricing service. Income earned from investment in the Securities Lending Fund, if any, is included in income from affiliated securities on the Statement of Operations.
Security transactions and income recognition
Securities transactions are recorded on a trade date basis. Realized gains or losses are recorded on the basis of identified cost.
Interest income is accrued daily and bond discounts are accreted and premiums are amortized daily. To the extent debt obligations are placed on non-accrual status, any related interest income may be reduced by writing off interest receivables when the collection of all or a portion of interest has been determined to be doubtful based on consistently applied procedures and the fair value has decreased. If the issuer subsequently resumes interest payments or when the collectability of interest is reasonably assured, the debt obligation is removed from non-accrual status.
Dividend income is recognized on the ex-dividend date.
Distributions to shareholders
Distributions to shareholders from net investment income are accrued daily and paid monthly. Distributions from net realized gains, if any, are recorded on the ex-dividend date and paid at least annually. Such distributions are determined in accordance with income tax regulations and may differ from U.S. generally accepted accounting principles. Dividend sources are estimated at the time of declaration. The tax character of distributions is determined as of the Fund’s fiscal year end. Therefore, a portion of the Fund’s distributions made prior to the Fund’s fiscal year end may be categorized as a tax return of capital at year end.
Federal and other taxes
The Fund intends to continue to qualify as a regulated investment company by distributing substantially all of its investment company taxable income and any net realized capital gains (after reduction for capital loss carryforwards) sufficient to relieve it from all, or substantially all, federal income taxes. Accordingly, no provision for federal income taxes was required.
The Fund’s income and federal excise tax returns and all financial records supporting those returns for the prior three fiscal years are subject to examination by the federal and Delaware revenue authorities. Management has analyzed the Fund’s tax positions taken on federal, state, and foreign tax returns for all open tax years and does not believe that there are any uncertain tax positions that require recognition of a tax liability.
As of February 28, 2018, the aggregate cost of all investments for federal income tax purposes was $501,694,603 and the unrealized gains (losses) consisted of:
| | | | |
Gross unrealized gains | | $ | 14,403,014 | |
Gross unrealized losses | | | (10,844,730 | ) |
Net unrealized gains | | $ | 3,558,284 | |
Class allocations
The separate classes of shares offered by the Fund differ principally in applicable sales charges, distribution, shareholder servicing, and administration fees. Class specific expenses are charged directly to that share class. Investment income, common expenses, and realized and unrealized gains (losses) on investments are allocated daily to each class of shares based on the relative proportion of net assets of each class.
| | | | | | |
| Notes to financial statements (unaudited) | | Wells Fargo High Yield Bond Fund | | | 23 | |
3. FAIR VALUATION MEASUREMENTS
Fair value measurements of investments are determined within a framework that has established a fair value hierarchy based upon the various data inputs utilized in determining the value of the Fund’s investments. The three-level hierarchy gives the highest priority to unadjusted quoted prices in active markets for identical assets or liabilities (Level 1) and the lowest priority to unobservable inputs (Level 3). The Fund’s investments are classified within the fair value hierarchy based on the lowest level of input that is significant to the fair value measurement. The inputs are summarized into three broad levels as follows:
| ∎ | | Level 1 – quoted prices in active markets for identical securities |
| ∎ | | Level 2 – other significant observable inputs (including quoted prices for similar securities, interest rates, prepayment speeds, credit risk, etc.) |
| ∎ | | Level 3 – significant unobservable inputs (including the Fund’s own assumptions in determining the fair value of investments) |
The inputs or methodologies used for valuing investments in securities are not necessarily an indication of the risk associated with investing in those securities.
The following is a summary of the inputs used in valuing the Fund’s assets and liabilities as of February 28, 2018:
| | | | | | | | | | | | | | | | |
| | | Quoted prices
(Level 1) | | | Other significant
observable inputs
(Level 2) | | | Significant
unobservable inputs (Level 3) | | | Total | |
Assets | | | | | | | | | | | | | | | | |
Investments in: | | | | | | | | | | | | | | | | |
| | | | |
Common Stocks | | | | | | | | | | | | | | | | |
Consumer staples | | $ | 540,900 | | | $ | 0 | | | $ | 0 | | | $ | 540,900 | |
Energy | | | 13,086,800 | | | | 0 | | | | 0 | | | | 13,086,800 | |
Financials | | | 788,300 | | | | 0 | | | | 0 | | | | 788,300 | |
Health care | | | 2,817,250 | | | | 0 | | | | 0 | | | | 2,817,250 | |
Industrials | | | 6,243,190 | | | | 0 | | | | 0 | | | | 6,243,190 | |
Information technology | | | 15,231,470 | | | | 0 | | | | 0 | | | | 15,231,470 | |
Materials | | | 3,677,300 | | | | 0 | | | | 0 | | | | 3,677,300 | |
Real estate | | | 733,950 | | | | 0 | | | | 0 | | | | 733,950 | |
Utilities | | | 1,207,350 | | | | 0 | | | | 0 | | | | 1,207,350 | |
| | | | |
Corporate bonds and notes | | | 0 | | | | 375,771,752 | | | | 0 | | | | 375,771,752 | |
| | | | |
Yankee corporate bonds and notes | | | 0 | | | | 61,128,225 | | | | 0 | | | | 61,128,225 | |
| | | | |
Short-term investments | | | | | | | | | | | | | | | | |
Investment companies | | | 11,457,654 | | | | 0 | | | | 0 | | | | 11,457,654 | |
Investments measured at net asset value* | | | | | | | | | | | | | | | 12,568,746 | |
Total assets | | $ | 55,784,164 | | | $ | 436,899,977 | | | $ | 0 | | | $ | 505,252,887 | |
| * | Investments that are measured at fair value using the net asset value per share (or its equivalent) as a practical expedient have not been categorized in the fair value hierarchy. The fair value amount presented in the table is intended to permit reconciliation of the fair value hierarchy to the amounts presented in the Statement of Assets and Liabilities. The Fund’s investment in Securities Lending Cash Investments, LLC valued at $12,568,746 does not have a redemption period notice, can be redeemed daily and does not have any unfunded commitments. |
The Fund recognizes transfers between levels within the fair value hierarchy at the end of the reporting period. At February 28, 2018, the Fund did not have any transfers into/out of Level 1, Level 2, or Level 3.
4. TRANSACTIONS WITH AFFILIATES
Management fee
Funds Management, an indirect wholly owned subsidiary of Wells Fargo, is the manager of the Fund and provides advisory and fund-level administrative services under an investment management agreement. Under the investment management agreement, Funds Management is responsible for, among other services, implementing the investment objectives and strategies of the Fund, supervising the subadviser, providing fund-level administrative services in connection with the
| | | | |
| 24 | | Wells Fargo High Yield Bond Fund | | Notes to financial statements (unaudited) |
Fund’s operations, and providing any other fund-level administrative services reasonably necessary for the operation of the Fund. As compensation for its services under the investment management agreement, Funds Management is entitled to receive an annual management fee starting at 0.55% and declining to 0.43% as the average daily net assets of the Fund increase. For the six months ended February 28, 2018, the management fee was equivalent to an annual rate of 0.55% of the Fund’s average daily net assets.
Funds Management has retained the services of a subadviser to provide daily portfolio management to the Fund. The fee for subadvisory services is borne by Funds Management. WellsCap is the subadviser to the Fund and is entitled to receive a fee from Funds Management at an annual rate starting at 0.35% and declining to 0.20% as the average daily net assets of the Fund increase.
Administration fees
Under a class-level administration agreement, Funds Management provides class-level administrative services to the Fund, which includes paying fees and expenses for services provided by the transfer agent, sub-transfer agents, omnibus account servicers and record-keepers. As compensation for its services under the class-level administration agreement, Funds Management receives an annual fee which is calculated based on the average daily net assets of each class as follows:
| | | | |
| | | Class-level
administration fee | |
Class A, Class C | | | 0.16 | % |
Administrator Class | | | 0.10 | |
Institutional Class | | | 0.08 | |
Funds Management has contractually waived and/or reimbursed management and administration fees to the extent necessary to maintain certain net operating expense ratios for the Fund. Waiver of fees and/or reimbursement of expenses by Funds Management were made first from fund level expenses on a proportionate basis and then from class specific expenses. Funds Management has committed through December 31, 2018 to waive fees and/or reimburse expenses to the extent necessary to cap the Fund’s expenses at 0.93% for Class A shares, 1.68% for Class C shares, 0.80% for Administrator Class shares and 0.53% for Institutional Class shares. After this time, the cap may be increased or the commitment to maintain the cap may be terminated only with the approval of the Board of Trustees.
Distribution fee
The Trust has adopted a distribution plan for Class C shares of the Fund pursuant to Rule 12b-1 under the 1940 Act. A distribution fee is charged to Class C shares and paid to Wells Fargo Funds Distributor, LLC (“Funds Distributor”), the principal underwriter, at an annual rate of 0.75% of the average daily net assets of Class C shares.
In addition, Funds Distributor is entitled to receive the front-end sales charge from the purchase of Class A shares and a contingent deferred sales charge on the redemption of certain Class A shares. Funds Distributor is also entitled to receive the contingent deferred sales charges from redemptions of Class C shares. For the six months ended February 28, 2018, Funds Distributor received $7,408 from the sale of Class A shares and $14 in contingent deferred sales charges from redemptions of Class C shares No contingent deferred sales charges were incurred by Class A shares for the six months ended February 28, 2018.
Shareholder servicing fees
The Trust has entered into contracts with one or more shareholder servicing agents, whereby Class A, Class C and Administrator Class of the Fund are charged a fee at an annual rate of 0.25% of the average daily net assets of each respective class.
A portion of these total shareholder servicing fees were paid to affiliates of Wells Fargo.
Interfund transactions
The Fund may purchase or sell investment securities to other Wells Fargo affiliates pursuant to Rule 17a-7 under the 1940 Act and under procedures adopted by the Board of Trustees. The procedures have been designed to ensure that these interfund transactions, which do not incur broker commissions, are effected at current market prices. Pursuant to these procedures, the Fund had $5,552,900 in interfund sales during the six months ended February 28, 2018.
| | | | | | |
| Notes to financial statements (unaudited) | | Wells Fargo High Yield Bond Fund | | | 25 | |
5. INVESTMENT PORTFOLIO TRANSACTIONS
Purchases and sales of investments, excluding U.S. government obligations (if any) and short-term securities, for the six months ended February 28, 2018 were $59,119,481 and $82,893,118, respectively.
6. BANK BORROWINGS
The Trust (excluding the money market funds and certain other funds) and Wells Fargo Variable Trust are parties to a $280,000,000 revolving credit agreement whereby the Fund is permitted to use bank borrowings for temporary or emergency purposes, such as to fund shareholder redemption requests. Interest under the credit agreement is charged to the Fund based on a borrowing rate equal to the higher of the Federal Funds rate in effect on that day plus 1.25% or the overnight LIBOR rate in effect on that day plus 1.25%. In addition, an annual commitment fee equal to 0.25% of the unused balance is allocated to each participating fund.
For the six months ended February 28, 2018, there were no borrowings by the Fund under the agreement.
7. INDEMNIFICATION
Under the Trust’s organizational documents, the officers and Trustees have been granted certain indemnification rights against certain liabilities that may arise out of performance of their duties to the Trust. Additionally, in the normal course of business, the Trust may enter into contracts with service providers that contain a variety of indemnification clauses. The Trust’s maximum exposure under these arrangements is dependent on future claims that may be made against the Fund and, therefore, cannot be estimated.
| | | | |
| 26 | | Wells Fargo High Yield Bond Fund | | Other information (unaudited) |
PROXY VOTING INFORMATION
A description of the policies and procedures that the Fund uses to determine how to vote proxies relating to portfolio securities is available, upon request, by calling 1-800-222-8222, visiting our website at wellsfargofunds.com, or visiting the SEC website at sec.gov. Information regarding how the Fund voted proxies relating to portfolio securities during the most recent 12-month period ended June 30 is available on the Fund’s website at wellsfargofunds.com or by visiting the SEC website at sec.gov.
PORTFOLIO HOLDINGS INFORMATION
The complete portfolio holdings for the Fund are publicly available monthly on the Fund’s website (wellsfargofunds.com), on a one-month delayed basis. In addition, top ten holdings information (excluding derivative positions) for the Fund is publicly available on the Fund’s website on a monthly, seven-day or more delayed basis. The Fund files its complete schedule of portfolio holdings with the SEC for the first and third quarters of each fiscal year on Form N-Q, which is available by visiting the SEC website at sec.gov. In addition, the Fund’s Form N-Q may be reviewed and copied at the SEC’s Public Reference Room in Washington, DC, and at regional offices in New York City, at 233 Broadway, and in Chicago, at 175 West Jackson Boulevard, Suite 900. Information about the Public Reference Room may be obtained by calling 1-800-SEC-0330.
| | | | | | |
| Other information (unaudited) | | Wells Fargo High Yield Bond Fund | | | 27 | |
BOARD OF TRUSTEES AND OFFICERS
Each of the Trustees and Officers1 listed in the table below acts in identical capacities for each fund in the Wells Fargo family of funds, which consists of 153 mutual funds comprising the Wells Fargo Funds Trust, Wells Fargo Variable Trust, Wells Fargo Master Trust and four closed-end funds (collectively the “Fund Complex”). This table should be read in conjunction with the Prospectus and the Statement of Additional Information2. The mailing address of each Trustee and Officer is 525 Market Street, 12th Floor, San Francisco, CA 94105. Each Trustee and Officer serves an indefinite term, however, each Trustee serves such term until reaching the mandatory retirement age established by the Trustees.
Independent Trustees
| | | | | | |
Name and year of birth | | Position held and length of service* | | Principal occupations during past five years or longer | | Current other public company or
investment company
directorships |
William R. Ebsworth (Born 1957) | | Trustee, since 2015 | | Retired. From 1984 to 2013, equities analyst, portfolio manager, research director and chief investment officer at Fidelity Management and Research Company in Boston, Tokyo, and Hong Kong, and retired in 2013 as Chief Investment Officer of Fidelity Strategic Advisers, Inc. where he led a team of investment professionals managing client assets. Prior thereto, Board member of Hong Kong Securities Clearing Co., Hong Kong Options Clearing Corp., the Thailand International Fund, Ltd., Fidelity Investments Life Insurance Company, and Empire Fidelity Investments Life Insurance Company. Board member of the Forté Foundation (non-profit organization) and the Vincent Memorial Hospital Endowment (non-profit organization), where he serves on the Investment Committee and as a Chair of the Audit Committee. Mr. Ebsworth is a CFA® charterholder. | | Asset Allocation Trust |
Jane A. Freeman** (Born 1953) | | Trustee, since 2015; Chair Liaison, since 2018 | | Retired. From 2012 to 2014 and 1999 to 2008, Chief Financial Officer of Scientific Learning Corporation. From 2008 to 2012, Ms. Freeman provided consulting services related to strategic business projects. Prior to 1999, Portfolio Manager at Rockefeller & Co. and Scudder, Stevens & Clark. Board member of the Harding Loevner Funds from 1996 to 2014, serving as both Lead Independent Director and chair of the Audit Committee. Board member of the Russell Exchange Traded Funds Trust from 2011 to 2012 and the chair of the Audit Committee. Ms. Freeman is a Board Member of Ruth Bancroft Garden (non-profit organization) and the Glimmerglass Festival. She is also an inactive Chartered Financial Analyst. | | Asset Allocation Trust |
Isaiah Harris, Jr. (Born 1952) | | Trustee, since 2009 | | Retired. Chairman of the Board of CIGNA Corporation since 2009, and Director since 2005. From 2003 to 2011, Director of Deluxe Corporation. Prior thereto, President and CEO of BellSouth Advertising and Publishing Corp. from 2005 to 2007, President and CEO of BellSouth Enterprises from 2004 to 2005 and President of BellSouth Consumer Services from 2000 to 2003. Emeritus member of the Iowa State University Foundation Board of Governors. Emeritus Member of the Advisory Board of Iowa State University School of Business. Advisory Board Member, Palm Harbor Academy (charter school). Advisory Board Member, Child Evangelism Fellowship (non-profit). Mr. Harris is a certified public accountant (inactive status). | | CIGNA Corporation; Asset Allocation Trust |
Judith M. Johnson (Born 1949) | | Trustee, since 2008; Audit Committee Chairman, since 2008 | | Retired. Prior thereto, Chief Executive Officer and Chief Investment Officer of Minneapolis Employees Retirement Fund from 1996 to 2008. Ms. Johnson is an attorney, certified public accountant and a certified managerial accountant. | | Asset Allocation Trust |
David F. Larcker (Born 1950) | | Trustee, since 2009 | | James Irvin Miller Professor of Accounting at the Graduate School of Business, Stanford University, Director of the Corporate Governance Research Initiative and Senior Faculty of The Rock Center for Corporate Governance since 2006. From 2005 to 2008, Professor of Accounting at the Graduate School of Business, Stanford University. Prior thereto, Ernst & Young Professor of Accounting at The Wharton School, University of Pennsylvania from 1985 to 2005. | | Asset Allocation Trust |
| | | | |
| 28 | | Wells Fargo High Yield Bond Fund | | Other information (unaudited) |
| | | | | | |
Name and year of birth | | Position held and length of service* | | Principal occupations during past five years or longer | | Current other public company or
investment company
directorships |
Olivia S. Mitchell*** (Born 1953) | | Trustee, since 2006; Governance Committee Chairman, since 2018 | | International Foundation of Employee Benefit Plans Professor, Wharton School of the University of Pennsylvania since 1993. Director of Wharton’s Pension Research Council and Boettner Center on Pensions & Retirement Research, and Research Associate at the National Bureau of Economic Research. Previously, Cornell University Professor from 1978 to 1993. | | Asset Allocation Trust |
Timothy J. Penny**** (Born 1951) | | Trustee, since 1996; Chairman, since 2018; Vice Chairman, from 2017 to 2018 | | President and Chief Executive Officer of Southern Minnesota Initiative Foundation, a non-profit organization, since 2007. Member of the Board of Trustees of NorthStar Education Finance, Inc., a non-profit organization, since 2007. | | Asset Allocation Trust |
James G. Polisson***** (Born 1959) | | Trustee, since 2018; Advisory Board Member, from 2017 to 2018 | | Retired. Chief Marketing Officer, Source (ETF) UK Services, Ltd, from 2015 to 2017. From 2012 to 2015, Principal of The Polisson Group, LLC, a management consulting, corporate advisory and principal investing company. Chief Executive Officer and Managing Director at Russell Investments, Global Exchange Traded Funds from 2010 to 2012. Managing Director of Barclays Global Investors from 1998 to 2010 and Global Chief Marketing Officer for iShares and Barclays Global Investors from 2000 to 2010. Trustee of the San Francisco Mechanics’ Institute, a non-profit organization, from 2013 to 2015. Board member of the Russell Exchange Traded Fund Trust from 2011 to 2012. Director of Barclays Global Investors Holdings Deutschland GmbH from 2006 to 2009. Mr. Polisson is an attorney and has a retired status with the Massachusetts and District of Columbia Bar Associations. | | Asset Allocation Trust |
Michael S. Scofield (Born 1943) | | Trustee, since 2010 | | Served on the Investment Company Institute’s Board of Governors and Executive Committee from 2008-2011 as well the Governing Council of the Independent Directors Council from 2006-2011 and the Independent Directors Council Executive Committee from 2008-2011. Trustee of the Evergreen Fund complex (and its predecessors) from 1984 to 2010. Chairman of the Evergreen Funds from 2000-2010. Former Trustee of the Mentor Funds. Retired Attorney, Law Offices of Michael S. Scofield. | | Asset Allocation Trust |
Pamela Wheelock***** (Born 1959) | | Trustee, since 2018; Advisory Board Member, from 2017 to 2018 | | Chief Operating Officer, Twin Cities Habitat for Humanity, since January, 2017. Vice President of University Services, University of Minnesota from 2012 to 2017. Prior thereto, Interim President and Chief Executive Officer of Blue Cross Blue Shield of Minnesota from 2010 to 2011, Chairman of the Board from 2009 to 2011 and Board Director from 2003 to 2015. Vice President, Leadership and Community Engagement, Bush Foundation, Saint Paul, Minnesota (a private foundation) from 2009 to 2011. Executive Vice President and Chief Financial Officer, Minnesota Sports and Entertainment from 2004 to 2009 and Senior Vice President from 2002 to 2004. Commissioner of Finance, State of Minnesota, from 1999 to 2002. Currently on the Board of Directors, Governance Committee and Finance Committee, for the Minnesota Philanthropy Partners (Saint Paul Foundation) since 2012 and Board Chair of the Minnesota Wild Foundation since 2010. | | Asset Allocation Trust |
| * | Length of service dates reflect the Trustee’s commencement of service with the Trust’s predecessor entities, where applicable. |
| ** | Jane Freeman became Chair Liaison effective January 1, 2018. |
| *** | Olivia Mitchell became Chairman of the Governance Committee effective January 1, 2018. |
| **** | Timothy Penny became Chairman effective January 1, 2018. |
| ***** | James Polisson and Pamela Wheelock each became a Trustee effective January 1, 2018. |
| | | | | | |
| Other information (unaudited) | | Wells Fargo High Yield Bond Fund | | | 29 | |
Officers
| | | | | | |
Name and year of birth | | Position held and
length of service | | Principal occupations during past five years or longer | | |
Andrew Owen (Born 1960) | | President, since 2017 | | Executive Vice President of Wells Fargo & Company and Head of Affiliated Managers, Wells Fargo Asset Management, since 2014. In addition, Mr. Owen is currently President, Chief Executive Officer and Director of Wells Fargo Funds Management, LLC since 2017. Prior thereto, Executive Vice President responsible for marketing, investments and product development for Wells Fargo Funds Management, LLC, from 2009 to 2014. | | |
Nancy Wiser1 (Born 1967) | | Treasurer, since 2012 | | Executive Vice President of Wells Fargo Funds Management, LLC since 2011. Chief Operating Officer and Chief Compliance Officer at LightBox Capital Management LLC, from 2008 to 2011. | | |
Alexander Kymn*
(Born 1973) | | Secretary, since 2018;
Chief Legal Officer,
since 2018 | | Senior Company Counsel of Wells Fargo Bank, N.A. since 2018 (previously Senior Counsel from 2007 to 2018). Vice President of Wells Fargo Funds Management, LLC from 2008 to 2014. | | |
C. David Messman** (Born 1960) | | Secretary, since 2000; Chief Legal Officer, since 2003 | | Senior Vice President and Secretary of Wells Fargo Funds Management, LLC since 2001. Assistant General Counsel of Wells Fargo Bank, N.A. since 2013 and Vice President and Managing Counsel of Wells Fargo Bank, N.A. from 1996 to 2013. | | |
Michael H. Whitaker (Born 1967) | | Chief Compliance Officer, since 2016 | | Senior Vice President and Chief Compliance Officer since 2016. Senior Vice President and Chief Compliance Officer for Fidelity Investments from 2007 to 2016. | | |
David Berardi (Born 1975) | | Assistant Treasurer, since 2009 | | Vice President of Wells Fargo Funds Management, LLC since 2009. Vice President of Evergreen Investment Management Company, LLC from 2008 to 2010. Manager of Fund Reporting and Control for Evergreen Investment Management Company, LLC from 2004 to 2010. | | |
Jeremy DePalma1 (Born 1974) | | Assistant Treasurer, since 2009 | | Senior Vice President of Wells Fargo Funds Management, LLC since 2009. Senior Vice President of Evergreen Investment Management Company, LLC from 2008 to 2010 and head of the Fund Reporting and Control Team within Fund Administration from 2005 to 2010. | | |
| 1 | Nancy Wiser acts as Treasurer of 77 funds in the Fund Complex. Jeremy DePalma acts as Treasurer of 76 funds and Assistant Treasurer of 77 funds in the Fund Complex. |
| 2 | The Statement of Additional Information includes additional information about the Trustees and is available, without charge, upon request, by calling 1-800-222-8222 or by visiting the website at wellsfargofunds.com. |
| * | Alexander Kymn became the Secretary and Chief Legal Officer effective April 17, 2018. |
| ** | David Messman was the Secretary and Chief Legal Officer until April 16, 2018. |
| | | | |
| 30 | | Wells Fargo High Yield Bond Fund | | List of abbreviations |
The following is a list of common abbreviations for terms and entities that may have appeared in this report.
| ACA | — ACA Financial Guaranty Corporation |
| ADR | — American depositary receipt |
| ADS | — American depositary shares |
| AGC | — Assured Guaranty Corporation |
| AGM | — Assured Guaranty Municipal |
| Ambac | — Ambac Financial Group Incorporated |
| AMT | — Alternative minimum tax |
| BAN | — Bond anticipation notes |
| BHAC | — Berkshire Hathaway Assurance Corporation |
| CAB | — Capital appreciation bond |
| CCAB | — Convertible capital appreciation bond |
| CDA | — Community Development Authority |
| CDO | — Collateralized debt obligation |
| CLO | — Collateralized loan obligation |
| DRIVER | — Derivative inverse tax-exempt receipts |
| DW&P | — Department of Water & Power |
| DWR | — Department of Water Resources |
| ECFA | — Educational & Cultural Facilities Authority |
| EDA | — Economic Development Authority |
| EDFA | — Economic Development Finance Authority |
| ETF | — Exchange-traded fund |
| FDIC | — Federal Deposit Insurance Corporation |
| FFCB | — Federal Farm Credit Banks |
| FGIC | — Financial Guaranty Insurance Corporation |
| FHA | — Federal Housing Administration |
| FHLB | — Federal Home Loan Bank |
| FHLMC | — Federal Home Loan Mortgage Corporation |
| FICO | — The Financing Corporation |
| FNMA | — Federal National Mortgage Association |
| GDR | — Global depositary receipt |
| GNMA | — Government National Mortgage Association |
| HCFR | — Healthcare facilities revenue |
| HEFA | — Health & Educational Facilities Authority |
| HEFAR | — Higher education facilities authority revenue |
| HFA | — Housing Finance Authority |
| HFFA | — Health Facilities Financing Authority |
| HUD | — Department of Housing and Urban Development |
| IDA | — Industrial Development Authority |
| IDAG | — Industrial Development Agency |
| KRW | — Republic of Korea won |
| LIBOR | — London Interbank Offered Rate |
| LIFER | — Long Inverse Floating Exempt Receipts |
| LLC | — Limited liability company |
| LLLP | — Limited liability limited partnership |
| LLP | — Limited liability partnership |
| MBIA | — Municipal Bond Insurance Association |
| MFHR | — Multifamily housing revenue |
| MSTR | — Municipal securities trust receipts |
| MUD | — Municipal Utility District |
| National | — National Public Finance Guarantee Corporation |
| PCFA | — Pollution Control Financing Authority |
| PCL | — Public Company Limited |
| PCR | — Pollution control revenue |
| PFA | — Public Finance Authority |
| PFFA | — Public Facilities Financing Authority |
| PFOTER | — Puttable floating option tax-exempt receipts |
| PJSC | — Public Joint Stock Company |
| plc | — Public limited company |
| PUTTER | — Puttable tax-exempt receipts |
| R&D | — Research & development |
| Radian | — Radian Asset Assurance |
| RAN | — Revenue anticipation notes |
| RDA | — Redevelopment Agency |
| RDFA | — Redevelopment Finance Authority |
| REIT | — Real estate investment trust |
| ROC | — Reset option certificates |
| SAVRS | — Select auction variable rate securities |
| SBA | — Small Business Authority |
| SDR | — Swedish depositary receipt |
| SFHR | — Single-family housing revenue |
| SFMR | — Single-family mortgage revenue |
| SIFMA | — Securities Industry and Financial Markets Association |
| SPA | — Standby purchase agreement |
| SPDR | — Standard & Poor’s Depositary Receipts |
| SPEAR | — Short Puttable Exempt Adjustable Receipts |
| STRIPS | — Separate trading of registered interest and |
| TAN | — Tax anticipation notes |
| TIPS | — Treasury inflation-protected securities |
| TRAN | — Tax revenue anticipation notes |
| TTFA | — Transportation Trust Fund Authority |
| TVA | — Tennessee Valley Authority |
This page is intentionally left blank.
This page is intentionally left blank.

For more information
More information about Wells Fargo Funds is available free upon request. To obtain literature, please write, email, visit the Fund’s website, or call:
Wells Fargo Funds
P.O. Box 8266
Boston, MA 02266-8266
Email: fundservice@wellsfargo.com
Website: wellsfargofunds.com
Individual investors: 1-800-222-8222
Retail investment professionals: 1-888-877-9275
Institutional investment professionals:
1-866-765-0778
This report and the financial statements contained herein are submitted for the general information of the shareholders of the Fund. If this report is used for promotional purposes, distribution of the report must be accompanied or preceded by a current prospectus. Before investing, please consider the investment objectives, risks, charges, and expenses of the investment. For a current prospectus and, if available, a summary prospectus, containing this information, call 1-800-222-8222 or visit the Fund’s website at wellsfargofunds.com. Read the prospectus carefully before you invest or send money.
Wells Fargo Asset Management (WFAM) is a trade name used by the asset management businesses of Wells Fargo & Company. Wells Fargo Funds Management, LLC, a wholly owned subsidiary of Wells Fargo & Company, provides investment advisory and administrative services for Wells Fargo Funds. Other affiliates of Wells Fargo & Company provide subadvisory and other services for the funds. The funds are distributed by Wells Fargo Funds Distributor, LLC, Member FINRA, an affiliate of Wells Fargo & Company. Neither Wells Fargo Funds Distributor nor Wells Fargo Funds Management holds fund shareholder accounts or assets. This material is for general informational and educational purposes only and is NOT intended to provide investment advice or a recommendation of any kind—including a recommendation for any specific investment, strategy, or plan.
NOT FDIC INSURED ◾ NO BANK GUARANTEE ◾ MAY LOSE VALUE
© 2018 Wells Fargo Funds Management, LLC. All rights reserved.
| | |
 | | 309369 04-18 SA218/SAR218 02-18 |
Semi-Annual Report
February 28, 2018

Wells Fargo Core Plus Bond Fund


Reduce clutter. Save trees.
Sign up for electronic delivery of prospectuses and shareholder reports at wellsfargo.com/advantagedelivery
Contents
The views expressed and any forward-looking statements are as of February 28, 2018, unless otherwise noted, and are those of the Fund managers and/or Wells Fargo Funds Management, LLC. Discussions of individual securities, or the markets generally, or any Wells Fargo Fund are not intended as individual recommendations. Future events or results may vary significantly from those expressed in any forward-looking statements. The views expressed are subject to change at any time in response to changing circumstances in the market. Wells Fargo Funds Management, LLC and the Fund disclaim any obligation to publicly update or revise any views expressed or forward-looking statements.
NOT FDIC INSURED ◾ NO BANK GUARANTEE ◾ MAY LOSE VALUE
| | | | |
| 2 | | Wells Fargo Core Plus Bond Fund | | Letter to shareholders (unaudited) |

Andrew Owen
President
Wells Fargo Funds
During the period, stocks globally delivered positive returns.
Dear Shareholder:
We are pleased to offer you this semi-annual report for the Wells Fargo Core Plus Bond Fund for the six-month period that ended February 28, 2018. During the period, stocks globally delivered positive returns. For the period, U.S. stocks, as measured by the S&P 500 Index1, gained 10.84% and international stocks, as measured by the MSCI ACWI ex USA Index (Net)2, gained 7.59%. In bond markets, the Bloomberg Barclays U.S. Aggregate Bond Index3 declined 2.18% and the Bloomberg Barclays Municipal Bond Index4 lost 1.24% while fixed-income investments outside the U.S. gained 2.52%, according to the Bloomberg Barclays Global Aggregate ex-USD Index5. The ICE BofAML U.S. High Yield Index6 earned 1.01% during the period.
U.S. stocks advanced as business-friendly policies and regulations, newly implemented tax reform, increased hiring activity, and consistent corporate profits led to higher investor and consumer confidence. Internationally, stocks gained as unemployment fell and wages increased in the U.K.; the Bank of Japan continued its accommodative monetary policies; and industrial production, retail sales, and fixed asset investment increased in China. Stock returns in the emerging markets were strong, with the MSCI EM Index (Net)7 gaining 10.58% for the period.
Reactions to U.S. interest-rate increases were uneven across the yield curve and globally.
The U.S. Federal Reserve (Fed) increased the federal funds rate twice during the six-month period. Following a federal funds rate increase in June to a range of 1.00% to 1.25%, 10-year U.S. Treasury yields declined, the yield curve flattened, and long-term bond prices benefited.
Internationally, central banks maintained low interest rates and accommodative monetary policies that supported business activity and stock values in foreign markets. A weaker U.S. dollar was generally supportive of business activity in regions around the globe.
Positive economic and market news continued as 2017 closed and 2018 began.
During the fourth quarter of 2017, stock markets continued the move higher. Third-quarter economic output in the U.S. grew at a 3.2% annual rate. The unemployment rate fell to a 17-year low of 4.1%. Tax reform and wage growth encouraged increased business and consumer spending.
Fed officials announced in October 2017 plans to begin unwinding its $4.5 trillion portfolio of bonds and other assets accumulated during rounds of quantitative easing conducted since the 2008–2009 recession. Still, restrained inflation kept long-term bond rates steady and the flattening of the yield curve persisted.
| 1 | The S&P 500 Index consists of 500 stocks chosen for market size, liquidity, and industry group representation. It is a market-value-weighted index with each stock’s weight in the index proportionate to its market value. You cannot invest directly in an index. |
| 2 | The Morgan Stanley Capital International (MSCI) All Country World Index (ACWI) ex USA Index (Net) is a free-float-adjusted market-capitalization-weighted index that is designed to measure the equity market performance of developed markets, excluding the United States and Canada. Source: MSCI. MSCI makes no express or implied warranties or representations and shall have no liability whatsoever with respect to any MSCI data contained herein. The MSCI data may not be further redistributed or used as a basis for other indices or any securities or financial products. This report is not approved, reviewed, or produced by MSCI. You cannot invest directly in an index. |
| 3 | The Bloomberg Barclays U.S. Aggregate Bond Index is a broad-based benchmark that measures the investment-grade, U.S. dollar-denominated, fixed-rate taxable bond market, including Treasuries, government-related and corporate securities, mortgage-backed securities (agency fixed-rate and hybrid adjustable-rate mortgage pass-throughs), asset-backed securities, and commercial mortgage-backed securities. You cannot invest directly in an index. |
| 4 | The Bloomberg Barclays Municipal Bond Index is an unmanaged index composed of long-term tax-exempt bonds with a minimum credit rating of Baa. You cannot invest directly in an index. |
| 5 | The Bloomberg Barclays Global Aggregate ex-USD Index is an unmanaged index that provides a broad-based measure of the global investment-grade fixed-income markets excluding the U.S. dollar-denominated debt market. You cannot invest directly in an index. |
| 6 | The ICE BofAML U.S. High Yield Index is a market-capitalization-weighted index of domestic and Yankee high-yield bonds. The index tracks the performance of high-yield securities traded in the U.S. bond market. You cannot invest directly in an index. Copyright 2018. ICE Data Indices, LLC. All rights reserved. |
| 7 | The MSCI Emerging Markets (EM) Index (Net) is a free-float-adjusted market-capitalization-weighted index that is designed to measure large- and mid-cap equity market performance of emerging markets. The MSCI EM Index (Net) consists of the following 24 emerging markets country indices: Brazil, Chile, China, Colombia, Czech Republic, Egypt, Greece, Hungary, India, Indonesia, Korea, Malaysia, Mexico, Pakistan, Peru, the Philippines, Poland, Qatar, Russia, South Africa, Taiwan, Thailand, Turkey, and the United Arab Emirates. You cannot invest directly in an index. |
| | | | | | |
| Letter to shareholders (unaudited) | | Wells Fargo Core Plus Bond Fund | | | 3 | |
October 2017 also marked one year since the regulatory reform of money market investing in the U.S. By December 2017, money market fund asset levels exceeded their December 2016 levels, reflecting continued investor demand for short-term investment opportunities offered in money market funds.
In December, the Organisation for Economic Co-operation and Development (OECD) reported that the global economy was expanding at its fastest rate since 2010; all 35 countries the OECD follows were on track to expand for 2017. International economies benefited from economic stimulus, which accelerated trade growth; improving employment; increased investment; and firming commodity prices.
The Fed raised the federal funds rate target to a range of 1.25% to 1.50% in December 2017 and began reducing its bond portfolio.
2018 opened with continued stock advances, then volatility.
Improving business and economic data globally continued to support stock advances through January 2018. Even political wrangling in the U.S. over budget resolutions could not dissuade investors from buying stocks as payrolls and factory orders increased. Long-term interest rates in the U.S. trended higher as the yield curve steepened—the 10-year Treasury rate moved from 2.46% to 2.84% and the 30-year rate moved from 2.81% to 3.08% during January 2018.
Investor sentiment shifted in February. Concerns about inflation began to emerge in the U.S. as readings from the Producer Price Index in January rose 2.5% year over year. During February 2018, the U.S. market endured a loss of more than 10% before recovering much of that loss, but volatility affected stocks globally throughout the month.
During January 2018, purchasing managers’ indexes in China, the eurozone, India, and Japan reported data for December that indicated continued growth. International stock values fell during February 2018, swept up in the selling momentum in U.S. markets.
Don’t let short-term uncertainty derail long-term investment goals.
Periods of investment uncertainty can present challenges, but experience has taught us that maintaining long-term investment goals can be an effective way to plan for the future. To help you create a sound strategy based on your personal goals and risk tolerance, Wells Fargo Funds offers more than 100 mutual funds spanning a wide range of asset classes and investment styles. Although diversification cannot guarantee an investment profit or prevent losses, we believe it can be an effective way to manage investment risk and potentially smooth out overall portfolio performance. We encourage investors to know their investments and to understand that appropriate levels of risk-taking may unlock opportunities.
Thank you for choosing to invest with Wells Fargo Funds. We appreciate your confidence in us and remain committed to helping you meet your financial needs.
Sincerely,

Andrew Owen
President
Wells Fargo Funds
During February 2018, the U.S. market endured a loss of more than 10% before recovering much of that loss, but volatility affected stocks globally throughout the month.
For further information about your Fund, contact your investment professional, visit our website at wellsfargofunds.com, or call us directly at 1-800-222-8222.
| | | | |
| 4 | | Wells Fargo Core Plus Bond Fund | | Performance highlights (unaudited) |
Investment objective
The Fund seeks total return, consisting of current income and capital appreciation.
Manager
Wells Fargo Funds Management, LLC
Subadviser
Wells Capital Management Incorporated
Portfolio managers
Christopher Y. Kauffman, CFA®
Jay N. Mueller, CFA®‡
Thomas M. Price, CFA®
Janet S. Rilling, CFA®, CPA
Michael J. Schueller, CFA®
Noah M. Wise, CFA®
Average annual total returns (%) as of February 28, 20181
| | | | | | | | | | | | | | | | | | | | | | | | | | | | | | | | | | |
| | | | | Including sales charge | | | Excluding sales charge | | | Expense ratios2 (%) | |
| | | Inception date | | 1 year | | | 5 year | | | 10 year | | | 1 year | | | 5 year | | | 10 year | | | Gross | | | Net3 | |
| Class A (STYAX) | | 7-13-1998 | | | (2.63 | ) | | | 1.87 | | | | 4.26 | | | | 1.99 | | | | 2.81 | | | | 4.74 | | | | 0.94 | | | | 0.74 | |
| Class C (WFIPX) | | 7-13-1998 | | | 0.24 | | | | 2.06 | | | | 3.96 | | | | 1.24 | | | | 2.06 | | | | 3.96 | | | | 1.69 | | | | 1.49 | |
| Class R6 (STYJX) | | 10-31-2016 | | | – | | | | – | | | | – | | | | 2.43 | | | | 3.12 | | | | 5.05 | | | | 0.56 | | | | 0.36 | |
| Administrator Class (WIPDX) | | 7-30-2010 | | | – | | | | – | | | | – | | | | 2.10 | | | | 2.94 | | | | 4.86 | | | | 0.88 | | | | 0.63 | |
| Institutional Class (WIPIX) | | 7-18-2008 | | | – | | | | – | | | | – | | | | 2.40 | | | | 3.11 | | | | 5.05 | | | | 0.61 | | | | 0.41 | |
| Bloomberg Barclays U.S. Aggregate Bond Index4 | | – | | | – | | | | – | | | | – | | | | 0.51 | | | | 1.71 | | | | 3.60 | | | | – | | | | – | |
Figures quoted represent past performance, which is no guarantee of future results, and do not reflect taxes that a shareholder may pay on fund distributions or the redemption of fund shares. Investment return and principal value of an investment will fluctuate so that an investor’s shares, when redeemed, may be worth more or less than their original cost. Performance shown without sales charges would be lower if sales charges were reflected. Current performance may be lower or higher than the performance data quoted, which assumes the reinvestment of dividends and capital gains. Current month-end performance is available on the Fund’s website, wellsfargofunds.com.
Index returns do not include transaction costs associated with buying and selling securities, any mutual fund fees or expenses, or any taxes. It is not possible to invest directly in an index.
For Class A shares, the maximum front-end sales charge is 4.50%. For Class C shares, the maximum contingent deferred sales charge is 1.00%. Performance including a contingent deferred sales charge assumes the sales charge for the corresponding time period. Class R6, Administrator Class, and Institutional Class shares are sold without a front-end sales charge or contingent deferred sales charge.
Bond values fluctuate in response to the financial condition of individual issuers, general market and economic conditions, and changes in interest rates. Changes in market conditions and government policies may lead to periods of heightened volatility in the bond market and reduced liquidity for certain bonds held by the Fund. In general, when interest rates rise, bond values fall and investors may lose principal value. Interest-rate changes and their impact on the Fund and its share price can be sudden and unpredictable. Loans are subject to risks similar to those associated with other below-investment-grade bond investments, such as risk of greater volatility in value, credit risk (for example, risk of issuer default), and risk that the loan may become illiquid or difficult to price. The use of derivatives may reduce returns and/or increase volatility. Certain investment strategies tend to increase the total risk of an investment (relative to the broader market). The Fund is exposed to foreign investment risk, high-yield securities risk, and mortgage and asset-backed securities risk. High-yield securities have a greater risk of default and tend to be more volatile than higher rated debt securities. Consult the Fund’s prospectus for additional information on these and other risks.
Please see footnotes on page 5.
| | | | | | |
| Performance highlights (unaudited) | | Wells Fargo Core Plus Bond Fund | | | 5 | |
| | | | |
| Ten largest holdings (%) as of February 28, 20185 | |
FNMA, 0.01%, 4-2-2018 | | | 4.14 | |
U.S. Treasury Note, 2.25%, 11-15-2027 | | | 3.35 | |
FNMA, 3.00%, 3-13-2048 | | | 2.41 | |
FNMA, 3.50%, 3-13-2048 | | | 2.39 | |
iShares 1-3 Year Credit Bond ETF | | | 1.98 | |
GNMA, 3.50%, 3-20-2048 | | | 1.94 | |
U.S. Treasury Note, 2.00%, 10-31-2022 | | | 1.32 | |
U.S. Treasury Note, 2.75%, 2-15-2028 | | | 1.25 | |
FNMA, 3.50%, 8-1-2045 | | | 1.13 | |
U.S. Treasury Bond, 2.75%, 8-15-2047 | | | 1.01 | |
|
| Portfolio allocation as of February 28, 20186 |
|
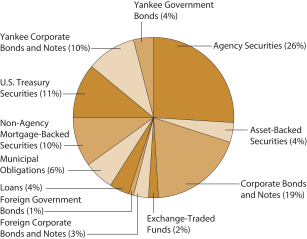 |
| ‡ | Mr. Mueller became a portfolio manager of the Fund on January 1, 2018. |
| 1 | Historical performance shown for Class R6 shares prior to their inception reflects the performance of the Institutional Class shares, and includes the higher expenses applicable to the Institutional Class shares. If these expenses had not been included, returns for Class R6 shares would be higher. Historical performance shown for Administrator Class shares prior to their inception reflects the performance of Institutional Class shares and has been adjusted to include the higher expenses applicable to Administrator Class shares. Historical performance shown for Institutional Class shares prior to their inception reflects the performance of Class A shares and includes the higher expenses applicable to Class A shares. If these expenses had not been included, returns for Institutional Class shares would have been higher. |
| 2 | Reflects the expense ratios as stated in the most recent prospectuses, which include the impact of 0.01% in acquired fund fees and expenses. The expense ratios shown are subject to change and may differ from the annualized expense ratios shown in the financial highlights of this report, which do not include acquired fund fees and expenses. |
| 3 | The manager has contractually committed through December 31, 2018, to waive fees and/or reimburse expenses to the extent necessary to cap the Fund’s Total Annual Fund Operating Expenses After Fee Waivers at 0.73% for Class A, 1.48% for Class C, 0.35% for Class R6, 0.62% for Administrator Class, and 0.40% for Institutional Class. After this time, the cap may be increased or the commitment to maintain the cap may be terminated only with the approval of the Board of Trustees. Brokerage commissions, stamp duty fees, interest, taxes, acquired fund fees and expenses, and extraordinary expenses are excluded from the expense cap. Without this cap, the Fund’s returns would have been lower. The expense ratio paid by an investor is the net expense ratio (the total annual fund operating expenses after fee waivers) as stated in the prospectuses. |
| 4 | The Bloomberg Barclays U.S. Aggregate Bond Index is a broad-based benchmark that measures the investment-grade, U.S. dollar–denominated, fixed-rate taxable bond market, including Treasuries, government-related and corporate securities, mortgage-backed securities (agency fixed-rate and hybrid adjustable-rate mortgage pass-throughs), asset-backed securities, and commercial mortgage-backed securities. You cannot invest directly in an index. |
| 5 | The ten largest holdings, excluding cash and cash equivalents, are calculated based on the value of the investments divided by total net assets of the Fund. Holdings are subject to change and may have changed since the date specified. |
| 6 | Amounts are calculated based on the total long-term investments of the Fund. These amounts are subject to change and may have changed since the date specified. |
| | | | |
| 6 | | Wells Fargo Core Plus Bond Fund | | Fund expenses (unaudited) |
As a shareholder of the Fund, you incur two types of costs: (1) transaction costs, including sales charges (loads) on purchase payments and contingent deferred sales charges (if any) on redemptions and (2) ongoing costs, including management fees, distribution (12b-1) and/or shareholder servicing fees, and other Fund expenses. This example is intended to help you understand your ongoing costs (in dollars) of investing in the Fund and to compare these costs with the ongoing costs of investing in other mutual funds.
The example is based on an investment of $1,000 invested at the beginning of the six-month period and held for the entire period from September 1, 2017 to February 28, 2018.
Actual expenses
The “Actual” line of the table below provides information about actual account values and actual expenses. You may use the information in this line, together with the amount you invested, to estimate the expenses that you paid over the period. Simply divide your account value by $1,000 (for example, an $8,600 account value divided by $1,000 = 8.6), then multiply the result by the number in the “Actual” line under the heading entitled “Expenses paid during period” for your applicable class of shares to estimate the expenses you paid on your account during this period.
Hypothetical example for comparison purposes
The “Hypothetical” line of the table below provides information about hypothetical account values and hypothetical expenses based on the Fund’s actual expense ratio and an assumed rate of return of 5% per year before expenses, which is not the Fund’s actual return. The hypothetical account values and expenses may not be used to estimate the actual ending account balance or expenses you paid for the period. You may use this information to compare the ongoing costs of investing in the Fund and other funds. To do so, compare this 5% hypothetical example with the 5% hypothetical examples that appear in the shareholder reports of the other funds.
Please note that the expenses shown in the table are meant to highlight your ongoing costs only and do not reflect any transactional costs, such as sales charges (loads) and contingent deferred sales charges. Therefore, the “Hypothetical” line of the table is useful in comparing ongoing costs only and will not help you determine the relative total costs of owning different funds. In addition, if these transactional costs were included, your costs would have been higher.
| | | | | | | | | | | | | | | | |
| | | Beginning
account value
9-1-2017 | | | Ending
account value
2-28-2018 | | | Expenses
paid during
the period¹ | | | Annualized net
expense ratio | |
Class A | | | | | | | | | | | | | | | | |
Actual | | $ | 1,000.00 | | | $ | 985.94 | | | $ | 3.59 | | | | 0.73 | % |
Hypothetical (5% return before expenses) | | $ | 1,000.00 | | | $ | 1,021.17 | | | $ | 3.66 | | | | 0.73 | % |
Class C | | | | | | | | | | | | | | | | |
Actual | | $ | 1,000.00 | | | $ | 983.09 | | | $ | 7.28 | | | | 1.48 | % |
Hypothetical (5% return before expenses) | | $ | 1,000.00 | | | $ | 1,017.46 | | | $ | 7.40 | | | | 1.48 | % |
Class R6 | | | | | | | | | | | | | | | | |
Actual | | $ | 1,000.00 | | | $ | 987.71 | | | $ | 1.72 | | | | 0.35 | % |
Hypothetical (5% return before expenses) | | $ | 1,000.00 | | | $ | 1,023.06 | | | $ | 1.76 | | | | 0.35 | % |
Administrator Class | | | | | | | | | | | | | | | | |
Actual | | $ | 1,000.00 | | | $ | 986.36 | | | $ | 3.05 | | | | 0.62 | % |
Hypothetical (5% return before expenses) | | $ | 1,000.00 | | | $ | 1,021.72 | | | $ | 3.11 | | | | 0.62 | % |
Institutional Class | | | | | | | | | | | | | | | | |
Actual | | $ | 1,000.00 | | | $ | 988.24 | | | $ | 1.97 | | | | 0.40 | % |
Hypothetical (5% return before expenses) | | $ | 1,000.00 | | | $ | 1,022.81 | | | $ | 2.01 | | | | 0.40 | % |
| 1 | Expenses paid is equal to the annualized net expense ratio of each class multiplied by the average account value over the period, multiplied by the number of days in the most recent fiscal half-year divided by the number of days in the fiscal year (to reflect the one-half-year period). |
| | | | | | |
| Portfolio of investments—February 28, 2018 (unaudited) | | Wells Fargo Core Plus Bond Fund | | | 7 | |
| | | | | | | | | | | | | | | | |
| Security name | | Interest rate | | | Maturity date | | | Principal | | | Value | |
| | | | |
Agency Securities: 25.37% | | | | | | | | | | | | | | | | |
FHLMC (12 Month LIBOR +1.33%) ± | | | 3.06 | % | | | 1-1-2036 | | | $ | 25,653 | | | $ | 26,341 | |
FHLMC | | | 3.50 | | | | 12-1-2045 | | | | 3,925,326 | | | | 3,929,336 | |
FHLMC | | | 3.50 | | | | 12-1-2045 | | | | 1,425,218 | | | | 1,426,670 | |
FHLMC | | | 4.00 | | | | 6-1-2044 | | | | 2,999,868 | | | | 3,086,684 | |
FHLMC | | | 5.00 | | | | 6-1-2036 | | | | 308,471 | | | | 333,451 | |
FHLMC | | | 5.00 | | | | 8-1-2040 | | | | 287,680 | | | | 310,852 | |
FHLMC | | | 5.50 | | | | 8-1-2038 | | | | 64,592 | | | | 70,672 | |
FHLMC | | | 5.50 | | | | 12-1-2038 | | | | 588,968 | | | | 645,752 | |
FHLMC | | | 5.50 | | | | 6-1-2040 | | | | 930,718 | | | | 1,017,889 | |
FHLMC | | | 7.50 | | | | 5-1-2038 | | | | 3,712 | | | | 3,812 | |
FHLMC | | | 8.00 | | | | 2-1-2030 | | | | 268 | | | | 313 | |
FHLMC Series 2015-SC01 Class 1A | | | 3.50 | | | | 5-25-2045 | | | | 993,304 | | | | 974,735 | |
FHLMC Series 2640 Class G | | | 4.50 | | | | 7-15-2018 | | | | 30,882 | | | | 30,957 | |
FHLMC Series 3774 Class AB | | | 3.50 | | | | 12-15-2020 | | | | 121,332 | | | | 123,025 | |
FHLMC Series K020 Class X1 ±±(c) | | | 1.42 | | | | 5-25-2022 | | | | 13,548,572 | | | | 663,918 | |
FHLMC Series T-42 Class A5 | | | 7.50 | | | | 2-25-2042 | | | | 1,607,957 | | | | 1,822,090 | |
FHLMC Series T-57 Class 2A1 ±± | | | 3.70 | | | | 7-25-2043 | | | | 49,157 | | | | 51,969 | |
FHLMC Series T-59 Class 2A1 ±± | | | 3.48 | | | | 10-25-2043 | | | | 251,673 | | | | 253,473 | |
FNMA ¤ | | | 0.00 | | | | 10-9-2019 | | | | 5,000,000 | | | | 4,812,071 | |
FNMA ¤(a) | | | 0.00 | | | | 4-2-2018 | | | | 25,092,000 | | | | 25,068,889 | |
FNMA | | | 2.13 | | | | 4-24-2026 | | | | 2,855,000 | | | | 2,676,440 | |
FNMA | | | 2.27 | | | | 3-1-2019 | | | | 2,459,366 | | | | 2,450,767 | |
FNMA %% | | | 2.51 | | | | 3-15-2033 | | | | 1,645,000 | | | | 1,604,582 | |
FNMA (12 Month LIBOR +1.61%) ± | | | 2.50 | | | | 5-1-2046 | | | | 1,455,035 | | | | 1,446,664 | |
FNMA (12 Month LIBOR +1.61%) ± | | | 2.55 | | | | 3-1-2046 | | | | 1,503,057 | | | | 1,496,622 | |
FNMA | | | 3.00 | | | | 11-1-2045 | | | | 2,259,611 | | | | 2,193,466 | |
FNMA | | | 3.00 | | | | 12-1-2045 | | | | 5,726,870 | | | | 5,555,530 | |
FNMA | | | 3.00 | | | | 12-1-2046 | | | | 2,576,212 | | | | 2,499,135 | |
FNMA %% | | | 3.00 | | | | 3-13-2048 | | | | 15,040,000 | | | | 14,575,288 | |
FNMA | | | 3.02 | | | | 2-1-2026 | | | | 3,223,269 | | | | 3,185,894 | |
FNMA | | | 3.27 | | | | 7-1-2022 | | | | 1,225,645 | | | | 1,242,697 | |
FNMA (1 Year Treasury Constant Maturity +2.26%) ± | | | 3.35 | | | | 8-1-2036 | | | | 1,082,621 | | | | 1,143,152 | |
FNMA (12 Month LIBOR +1.73%) ± | | | 3.48 | | | | 9-1-2036 | | | | 25,712 | | | | 26,949 | |
FNMA | | | 3.50 | | | | 10-1-2043 | | | | 1,113,645 | | | | 1,117,645 | |
FNMA | | | 3.50 | | | | 4-1-2045 | | | | 314,648 | | | | 314,401 | |
FNMA | | | 3.50 | | | | 8-1-2045 | | | | 6,877,790 | | | | 6,874,488 | |
FNMA %% | | | 3.50 | | | | 3-13-2048 | | | | 14,500,000 | | | | 14,475,077 | |
FNMA (12 Month LIBOR +1.82%) ± | | | 3.57 | | | | 8-1-2036 | | | | 38,395 | | | | 40,371 | |
FNMA (1 Year Treasury Constant Maturity +2.27%) ± | | | 3.66 | | | | 1-1-2036 | | | | 98,715 | | | | 103,648 | |
FNMA | | | 3.95 | | | | 9-1-2021 | | | | 410,442 | | | | 423,882 | |
FNMA | | | 4.00 | | | | 9-1-2024 | | | | 141,866 | | | | 145,311 | |
FNMA | | | 4.00 | | | | 2-1-2046 | | | | 692,020 | | | | 709,592 | |
FNMA | | | 4.00 | | | | 4-1-2046 | | | | 3,215,361 | | | | 3,297,167 | |
FNMA %% | | | 4.00 | | | | 3-13-2048 | | | | 5,040,000 | | | | 5,162,948 | |
FNMA | | | 4.26 | | | | 4-1-2021 | | | | 2,698,469 | | | | 2,802,604 | |
FNMA | | | 5.00 | | | | 1-1-2024 | | | | 93,061 | | | | 96,275 | |
FNMA | | | 5.00 | | | | 2-1-2036 | | | | 30,874 | | | | 33,324 | |
FNMA | | | 5.00 | | | | 6-1-2040 | | | | 110,942 | | | | 119,914 | |
FNMA | | | 5.00 | | | | 8-1-2040 | | | | 1,851,362 | | | | 2,010,208 | |
FNMA | | | 5.50 | | | | 11-1-2023 | | | | 57,670 | | | | 60,454 | |
The accompanying notes are an integral part of these financial statements.
| | | | |
| 8 | | Wells Fargo Core Plus Bond Fund | | Portfolio of investments—February 28, 2018 (unaudited) |
| | | | | | | | | | | | | | | | |
| Security name | | Interest rate | | | Maturity date | | | Principal | | | Value | |
| | | | |
Agency Securities (continued) | | | | | | | | | | | | | | | | |
FNMA | | | 5.50 | % | | | 8-1-2034 | | | $ | 105,846 | | | $ | 116,334 | |
FNMA | | | 5.50 | | | | 2-1-2035 | | | | 32,677 | | | | 35,965 | |
FNMA | | | 5.50 | | | | 8-1-2038 | | | | 107,837 | | | | 117,069 | |
FNMA | | | 5.50 | | | | 8-1-2038 | | | | 414,015 | | | | 449,853 | |
FNMA | | | 6.00 | | | | 10-1-2037 | | | | 516,262 | | | | 574,453 | |
FNMA | | | 6.00 | | | | 11-1-2037 | | | | 38,618 | | | | 43,053 | |
FNMA | | | 6.50 | | | | 7-1-2036 | | | | 27,559 | | | | 30,813 | |
FNMA | | | 6.50 | | | | 7-1-2036 | | | | 13,602 | | | | 15,262 | |
FNMA | | | 6.50 | | | | 11-1-2036 | | | | 6,085 | | | | 6,777 | |
FNMA | | | 7.00 | | | | 12-1-2022 | | | | 180,030 | | | | 187,418 | |
FNMA | | | 7.00 | | | | 7-1-2036 | | | | 11,011 | | | | 11,722 | |
FNMA | | | 7.00 | | | | 11-1-2037 | | | | 8,731 | | | | 9,562 | |
FNMA | | | 7.50 | | | | 5-1-2038 | | | | 1,962 | | | | 1,982 | |
FNMA Series 2002-T12 Class A3 | | | 7.50 | | | | 5-25-2042 | | | | 6,876 | | | | 7,989 | |
FNMA Series 2003-W08 Class 4A ±± | | | 3.87 | | | | 11-25-2042 | | | | 161,523 | | | | 166,895 | |
FNMA Series 2003-W14 Class 2A ±± | | | 3.30 | | | | 6-25-2045 | | | | 125,577 | | | | 132,929 | |
FNMA Series 2003-W14 Class 2A ±± | | | 4.07 | | | | 1-25-2043 | | | | 303,403 | | | | 318,892 | |
FNMA Series 2004-W11 Class 1A3 | | | 7.00 | | | | 5-25-2044 | | | | 1,368,555 | | | | 1,560,194 | |
FNMA Series 2004-W15 Class 1A3 | | | 7.00 | | | | 8-25-2044 | | | | 659,134 | | | | 748,654 | |
GNMA | | | 3.00 | | | | 11-20-2045 | | | | 4,986,036 | | | | 4,881,080 | |
GNMA %% | | | 3.50 | | | | 3-20-2048 | | | | 11,685,000 | | | | 11,750,271 | |
GNMA | | | 4.00 | | | | 12-20-2047 | | | | 5,098,759 | | | | 5,239,234 | |
GNMA | | | 5.00 | | | | 7-20-2040 | | | | 736,909 | | | | 790,571 | |
GNMA | | | 7.50 | | | | 12-15-2029 | | | | 696 | | | | 765 | |
GNMA Series 2008-22 Class XM ±±(c) | | | 0.90 | | | | 2-16-2050 | | | | 1,333,862 | | | | 31,104 | |
STRIPS ¤ | | | 0.00 | | | | 5-15-2044 | | | | 9,125,000 | | | | 3,964,819 | |
| | | | |
Total Agency Securities (Cost $155,093,277) | | | | | | | | | | | | | | | 153,731,054 | |
| | | | | | | | | | | | | | | | |
| | | | |
Asset-Backed Securities: 5.94% | | | | | | | | | | | | | | | | |
Ally Auto Receivables Trust Series 2015-2 Class A3 | | | 1.49 | | | | 11-15-2019 | | | | 1,132,205 | | | | 1,130,393 | |
CarMax Auto Owner Trust Series 2015-3 Class A3 | | | 1.63 | | | | 5-15-2020 | | | | 1,125,687 | | | | 1,122,251 | |
CCG Receivables Trust Series 2016-1 Class A2 144A | | | 1.69 | | | | 9-14-2022 | | | | 1,240,348 | | | | 1,233,786 | |
Citibank Credit Card Issuance Trust Series 2014-A6 Class A6 | | | 2.15 | | | | 7-15-2021 | | | | 2,650,000 | | | | 2,638,417 | |
Citibank Credit Card Issuance Trust Series 2016-A1 Class A1 | | | 1.75 | | | | 11-19-2021 | | | | 370,000 | | | | 365,140 | |
CNH Equipment Trust Series 2014-C Class A3 | | | 1.05 | | | | 11-15-2019 | | | | 171,548 | | | | 171,289 | |
CNH Equipment Trust Series 2016-B Class A2A | | | 1.31 | | | | 10-15-2019 | | | | 148,800 | | | | 148,720 | |
Discover Card Execution Note Trust Series 2014 Class A4 | | | 2.12 | | | | 12-15-2021 | | | | 1,015,000 | | | | 1,009,826 | |
Educational Services of America Series 2015-1 Class A (1 Month LIBOR +0.80%) 144A± | | | 2.42 | | | | 10-25-2056 | | | | 1,301,875 | | | | 1,305,187 | |
Five Guys Funding LLC Series 17-1A Class A2 144A | | | 4.60 | | | | 7-25-2047 | | | | 1,605,975 | | | | 1,626,602 | |
GMF Floorplan Owner Revolving Trust Series 2015-1 Class A1 144A | | | 1.65 | | | | 5-15-2020 | | | | 1,600,000 | | | | 1,598,734 | |
GMF Floorplan Owner Revolving Trust Series 2015-1 Class A2 (1 Month LIBOR +0.50%) 144A± | | | 2.09 | | | | 5-15-2020 | | | | 4,000,000 | | | | 4,003,216 | |
Hyundai Auto Receivables Trust Series 2015-A Class A4 | | | 1.37 | | | | 7-15-2020 | | | | 1,162,780 | | | | 1,159,520 | |
Hyundai Auto Receivables Trust Series 2016-A Class A4 144A | | | 1.80 | | | | 12-16-2019 | | | | 3,685,000 | | | | 3,677,954 | |
Kubota Credit Owner Trust Series 2016-1A Class A2 144A | | | 1.25 | | | | 4-15-2019 | | | | 441,642 | | | | 441,016 | |
MMAF Equipment Finance LLC Series 2017-AA Class A4 144A | | | 2.41 | | | | 8-16-2024 | | | | 1,975,000 | | | | 1,941,327 | |
Nissan Auto Lease Trust Series 2017-B Class A3 | | | 2.05 | | | | 9-15-2020 | | | | 1,625,000 | | | | 1,611,483 | |
OCP Collateralized Loan Obligation Limited Trust Series 2012-2A Class A1R (3 Month LIBOR +1.40%) 144A± | | | 3.30 | | | | 11-22-2025 | | | | 2,000,000 | | | | 2,011,740 | |
Octagon Investment Partners Series 2015-1A Class A1R (3 Month LIBOR +0.90%) 144A± | | | 2.79 | | | | 5-21-2027 | | | | 3,000,000 | | | | 3,001,281 | |
The accompanying notes are an integral part of these financial statements.
| | | | | | |
| Portfolio of investments—February 28, 2018 (unaudited) | | Wells Fargo Core Plus Bond Fund | | | 9 | |
| | | | | | | | | | | | | | | | |
| Security name | | Interest rate | | | Maturity date | | | Principal | | | Value | |
| | | | |
Asset-Backed Securities (continued) | | | | | | | | | | | | | | | | |
South Carolina Student Loan Corporation Series 2014-1 Class A1 (1 Month LIBOR +0.75%) ± | | | 2.32 | % | | | 5-1-2030 | | | $ | 2,600,000 | | | $ | 2,612,832 | |
Student Loan Consolidation Center Series 2011-1 Class A (1 Month LIBOR +1.22%) 144A± | | | 2.84 | | | | 10-25-2027 | | | | 2,482,202 | | | | 2,516,604 | |
SunTrust Auto Receivables Trust Series 2015-1A Class A3 144A | | | 1.42 | | | | 9-16-2019 | | | | 12,867 | | | | 12,864 | |
World Omni Auto Receivables Trust Series 2015-A Series A3 | | | 1.34 | | | | 5-15-2020 | | | | 648,864 | | | | 647,603 | |
| | | | |
Total Asset-Backed Securities (Cost $36,067,659) | | | | | | | | | | | | | | | 35,987,785 | |
| | | | | | | | | | | | | | | | |
| | | | |
Corporate Bonds and Notes: 18.07% | | | | | | | | | | | | | | | | |
| | | | |
Consumer Discretionary: 2.32% | | | | | | | | | | | | | | | | |
| | | | |
| Auto Components: 0.02% | | | | | | | | | | | | | | | | |
Allison Transmission Incorporated 144A | | | 4.75 | | | | 10-1-2027 | | | | 135,000 | | | | 132,300 | |
| | | | | | | | | | | | | | | | |
| | | | |
| Hotels, Restaurants & Leisure: 0.34% | | | | | | | | | | | | | | | | |
GLP Capital LP/GLP Financing II Incorporated | | | 4.88 | | | | 11-1-2020 | | | | 1,010,000 | | | | 1,035,250 | |
MGM Resorts International | | | 5.25 | | | | 3-31-2020 | | | | 1,010,000 | | | | 1,041,563 | |
| | | | |
| | | | | | | | | | | | | | | 2,076,813 | |
| | | | | | | | | | | | | | | | |
| | | | |
| Internet & Direct Marketing Retail: 0.15% | | | | | | | | | | | | | | | | |
Amazon.com Incorporated | | | 4.95 | | | | 12-5-2044 | | | | 815,000 | | | | 923,146 | |
| | | | | | | | | | | | | | | | |
| | | | |
| Media: 1.31% | | | | | | | | | | | | | | | | |
Charter Communications Operating LLC | | | 4.46 | | | | 7-23-2022 | | | | 2,155,000 | | | | 2,206,271 | |
Charter Communications Operating LLC | | | 6.48 | | | | 10-23-2045 | | | | 655,000 | | | | 737,864 | |
Discovery Communications LLC | | | 3.95 | | | | 3-20-2028 | | | | 1,695,000 | | | | 1,627,169 | |
Discovery Communications LLC | | | 6.35 | | | | 6-1-2040 | | | | 550,000 | | | | 619,296 | |
Neptune Finco Corporation 144A | | | 10.88 | | | | 10-15-2025 | | | | 800,000 | | | | 944,000 | |
SES Global Americas Holding Company 144A | | | 5.30 | | | | 3-25-2044 | | | | 880,000 | | | | 760,912 | |
TEGNA Incorporated | | | 5.13 | | | | 7-15-2020 | | | | 1,010,000 | | | | 1,022,625 | |
| | | | |
| | | | | | | | | | | | | | | 7,918,137 | |
| | | | | | | | | | | | | | | | |
| | | | |
| Multiline Retail: 0.16% | | | | | | | | | | | | | | | | |
Macy’s Retail Holdings Incorporated | | | 3.45 | | | | 1-15-2021 | | | | 940,000 | | | | 939,503 | |
| | | | | | | | | | | | | | | | |
| | | | |
| Specialty Retail: 0.34% | | | | | | | | | | | | | | | | |
Asbury Automotive Group Incorporated | | | 6.00 | | | | 12-15-2024 | | | | 1,000,000 | | | | 1,037,500 | |
Group 1 Automotive Incorporated | | | 5.00 | | | | 6-1-2022 | | | | 1,010,000 | | | | 1,030,200 | |
| | | | |
| | | | | | | | | | | | | | | 2,067,700 | |
| | | | | | | | | | | | | | | | |
| | | | |
Consumer Staples: 0.39% | | | | | | | | | | | | | | | | |
| | | | |
| Tobacco: 0.39% | | | | | | | | | | | | | | | | |
Philip Morris International Incorporated | | | 1.38 | | | | 2-25-2019 | | | | 2,400,000 | | | | 2,371,172 | |
| | | | | | | | | | | | | | | | |
| | | | |
Energy: 0.52% | | | | | | | | | | | | | | | | |
| | | | |
| Energy Equipment & Services: 0.14% | | | | | | | | | | | | | | | | |
Bristow Group Incorporated 144A%% | | | 8.75 | | | | 3-1-2023 | | | | 175,000 | | | | 177,953 | |
Oceaneering International Incorporated | | | 6.00 | | | | 2-1-2028 | | | | 680,000 | | | | 670,251 | |
| | | | |
| | | | | | | | | | | | | | | 848,204 | |
| | | | | | | | | | | | | | | | |
The accompanying notes are an integral part of these financial statements.
| | | | |
| 10 | | Wells Fargo Core Plus Bond Fund | | Portfolio of investments—February 28, 2018 (unaudited) |
| | | | | | | | | | | | | | | | |
| Security name | | Interest rate | | | Maturity date | | | Principal | | | Value | |
| | | | |
| Oil, Gas & Consumable Fuels: 0.38% | | | | | | | | | | | | | | | | |
Energy Transfer Partners LP | | | 6.13 | % | | | 12-15-2045 | | | $ | 1,330,000 | | | $ | 1,418,801 | |
Semgroup Corporation | | | 7.25 | | | | 3-15-2026 | | | | 875,000 | | | | 894,688 | |
| | | | |
| | | | | | | | | | | | | | | 2,313,489 | |
| | | | | | | | | | | | | | | | |
| | | | |
Financials: 8.55% | | | | | | | | | | | | | | | | |
| | | | |
| Banks: 2.38% | | | | | | | | | | | | | | | | |
Bank of America Corporation | | | 3.95 | | | | 4-21-2025 | | | | 1,170,000 | | | | 1,168,216 | |
Bank of America Corporation (3 Month LIBOR +3.90%) ± | | | 6.10 | | | | 12-29-2049 | | | | 1,290,000 | | | | 1,367,400 | |
BBVA Bancomer SA 144A | | | 7.25 | | | | 4-22-2020 | | | | 1,000,000 | | | | 1,063,500 | |
Citizens Financial Group (3 Month LIBOR +3.56%) ± | | | 5.16 | | | | 6-29-2023 | | | | 1,340,000 | | | | 1,353,171 | |
Fifth Third Bank | | | 2.15 | | | | 8-20-2018 | | | | 1,885,000 | | | | 1,882,992 | |
Huntington National Bank | | | 2.20 | | | | 11-6-2018 | | | | 1,985,000 | | | | 1,980,389 | |
JPMorgan Chase & Company | | | 2.97 | | | | 1-15-2023 | | | | 2,550,000 | | | | 2,508,628 | |
JPMorgan Chase & Company (3 Month LIBOR +3.25%) ± | | | 5.15 | | | | 12-29-2049 | | | | 1,370,000 | | | | 1,379,179 | |
PNC Financial Services (3 Month LIBOR +3.30%) ± | | | 5.00 | | | | 12-29-2049 | | | | 565,000 | | | | 573,475 | |
Santander Holdings USA 144A | | | 3.70 | | | | 3-28-2022 | | | | 1,125,000 | | | | 1,126,972 | |
| | | | |
| | | | | | | | | | | | | | | 14,403,922 | |
| | | | | | | | | | | | | | | | |
| | | | |
| Capital Markets: 1.83% | | | | | | | | | | | | | | | | |
Blackstone Holdings Finance Company LLC 144A | | | 5.00 | | | | 6-15-2044 | | | | 1,015,000 | | | | 1,098,973 | |
Goldman Sachs Group Incorporated | | | 2.35 | | | | 11-15-2021 | | | | 1,980,000 | | | | 1,915,092 | |
Goldman Sachs Group Incorporated | | | 5.15 | | | | 5-22-2045 | | | | 1,100,000 | | | | 1,187,718 | |
Goldman Sachs Group Incorporated (3 Month LIBOR +3.83%) ± | | | 5.30 | | | | 12-29-2049 | | | | 1,100,000 | | | | 1,124,750 | |
Legg Mason Incorporated | | | 5.63 | | | | 1-15-2044 | | | | 815,000 | | | | 876,090 | |
Morgan Stanley | | | 2.63 | | | | 11-17-2021 | | | | 2,980,000 | | | | 2,917,828 | |
Morgan Stanley | | | 2.75 | | | | 5-19-2022 | | | | 2,000,000 | | | | 1,954,905 | |
| | | | |
| | | | | | | | | | | | | | | 11,075,356 | |
| | | | | | | | | | | | | | | | |
| | | | |
| Consumer Finance: 0.92% | | | | | | | | | | | | | | | | |
ERAC USA Finance LLC 144A | | | 4.50 | | | | 2-15-2045 | | | | 1,695,000 | | | | 1,676,202 | |
Navient Corporation | | | 4.88 | | | | 6-17-2019 | | | | 1,010,000 | | | | 1,021,363 | |
PACCAR Financial Corporation | | | 2.30 | | | | 8-10-2022 | | | | 3,000,000 | | | | 2,901,681 | |
| | | | |
| | | | | | | | | | | | | | | 5,599,246 | |
| | | | | | | | | | | | | | | | |
| | | | |
| Diversified Financial Services: 0.79% | | | | | | | | | | | | | | | | |
Brookfield Finance LLC | | | 4.00 | | | | 4-1-2024 | | | | 2,005,000 | | | | 2,028,294 | |
Daimler Finance NA LLC 144A | | | 1.75 | | | | 10-30-2019 | | | | 2,215,000 | | | | 2,176,985 | |
LPL Holdings Incorporated 144A | | | 5.75 | | | | 9-15-2025 | | | | 600,000 | | | | 607,500 | |
| | | | |
| | | | | | | | | | | | | | | 4,812,779 | |
| | | | | | | | | | | | | | | | |
| | | | |
| Insurance: 2.63% | | | | | | | | | | | | | | | | |
Chubb Corporation (3 Month LIBOR +2.25%) ± | | | 3.97 | | | | 3-29-2067 | | | | 1,100,000 | | | | 1,100,000 | |
Endurance Specialty Holdings Limited | | | 7.00 | | | | 7-15-2034 | | | | 1,330,000 | | | | 1,644,936 | |
Guardian Life Insurance Company 144A | | | 4.85 | | | | 1-24-2077 | | | | 1,045,000 | | | | 1,069,382 | |
Hartford Financial Services Group (3 Month LIBOR +4.60%) ± | | | 8.13 | | | | 6-15-2068 | | | | 1,905,000 | | | | 1,924,050 | |
National Life Insurance Company 144A | | | 10.50 | | | | 9-15-2039 | | | | 1,315,000 | | | | 2,124,492 | |
PartnerRe Finance II Incorporated (3 Month LIBOR +2.33%) ± | | | 4.33 | | | | 12-1-2066 | | | | 1,345,000 | | | | 1,197,050 | |
Protective Life Corporation | | | 8.45 | | | | 10-15-2039 | | | | 1,855,000 | | | | 2,653,169 | |
Prudential Financial Incorporated (3 Month LIBOR +5.00%) ± | | | 8.88 | | | | 6-15-2068 | | | | 1,645,000 | | | | 1,661,450 | |
The accompanying notes are an integral part of these financial statements.
| | | | | | |
| Portfolio of investments—February 28, 2018 (unaudited) | | Wells Fargo Core Plus Bond Fund | | | 11 | |
| | | | | | | | | | | | | | | | |
| Security name | | Interest rate | | | Maturity date | | | Principal | | | Value | |
| | | | |
| Insurance (continued) | | | | | | | | | | | | | | | | |
RenaissanceRe Finance Incorporated | | | 3.70 | % | | | 4-1-2025 | | | $ | 1,105,000 | | | $ | 1,086,218 | |
Transatlantic Holdings Incorporated | | | 8.00 | | | | 11-30-2039 | | | | 1,100,000 | | | | 1,508,619 | |
| | | | |
| | | | | | | | | | | | | | | 15,969,366 | |
| | | | | | | | | | | | | | | | |
| | | | |
Health Care: 0.54% | | | | | | | | | | | | | | | | |
| | | | |
| Health Care Providers & Services: 0.48% | | | | | | | | | | | | | | | | |
CHS Incorporated « | | | 5.13 | | | | 8-1-2021 | | | | 1,000,000 | | | | 922,500 | |
Highmark Incorporated 144A | | | 6.13 | | | | 5-15-2041 | | | | 710,000 | | | | 771,504 | |
Polaris Intermediate Corporation 144A | | | 8.50 | | | | 12-1-2022 | | | | 130,000 | | | | 132,356 | |
Tenet Healthcare Corporation | | | 6.00 | | | | 10-1-2020 | | | | 1,010,000 | | | | 1,050,400 | |
| | | | |
| | | | | | | | | | | | | | | 2,876,760 | |
| | | | | | | | | | | | | | | | |
| | | | |
| Pharmaceuticals: 0.06% | | | | | | | | | | | | | | | | |
Endo Finance LLC 144A | | | 6.00 | | | | 7-15-2023 | | | | 500,000 | | | | 375,000 | |
| | | | | | | | | | | | | | | | |
| | | | |
Industrials: 0.78% | | | | | | | | | | | | | | | | |
| | | | |
| Transportation Infrastructure: 0.78% | | | | | | | | | | | | | | | | |
Toll Road Investors Partnership II LP 144A¤ | | | 0.00 | | | | 2-15-2026 | | | | 5,630,000 | | | | 3,454,868 | |
Toll Road Investors Partnership II LP 144A¤ | | | 0.00 | | | | 2-15-2027 | | | | 1,050,000 | | | | 616,091 | |
Toll Road Investors Partnership II LP 144A¤ | | | 0.00 | | | | 2-15-2028 | | | | 1,150,000 | | | | 632,479 | |
| | | | |
| | | | | | | | | | | | | | | 4,703,438 | |
| | | | | | | | | | | | | | | | |
| | | | |
Information Technology: 0.90% | | | | | | | | | | | | | | | | |
| | | | |
| Semiconductors & Semiconductor Equipment: 0.17% | | | | | | | | | | | | | | | | |
Broadcom Corporation | | | 2.65 | | | | 1-15-2023 | | | | 1,115,000 | | | | 1,055,997 | |
| | | | | | | | | | | | | | | | |
| | | | |
| Software: 0.32% | | | | | | | | | | | | | | | | |
Citrix Systems Incorporated | | | 4.50 | | | | 12-1-2027 | | | | 1,920,000 | | | | 1,906,078 | |
| | | | | | | | | | | | | | | | |
| | | | |
| Technology Hardware, Storage & Peripherals: 0.41% | | | | | | | | | | | | | | | | |
Diamond 1 Finance Corporation 144A | | | 8.35 | | | | 7-15-2046 | | | | 1,175,000 | | | | 1,486,599 | |
EMC Corporation | | | 2.65 | | | | 6-1-2020 | | | | 1,010,000 | | | | 982,566 | |
| | | | |
| | | | | | | | | | | | | | | 2,469,165 | |
| | | | | | | | | | | | | | | | |
| | | | |
Materials: 0.37% | | | | | | | | | | | | | | | | |
| | | | |
| Containers & Packaging: 0.37% | | | | | | | | | | | | | | | | |
Silgan Holdings Incorporated | | | 3.25 | | | | 3-15-2025 | | | | 1,800,000 | | | | 2,239,481 | |
| | | | | | | | | | | | | | | | |
| | | | |
Real Estate: 1.46% | | | | | | | | | | | | | | | | |
| | | | |
| Equity REITs: 1.30% | | | | | | | | | | | | | | | | |
Federal Realty Investment Trust | | | 3.63 | | | | 8-1-2046 | | | | 915,000 | | | | 803,052 | |
Iron Mountain Incorporated 144A | | | 3.00 | | | | 1-15-2025 | | | | 2,000,000 | | | | 2,428,288 | |
Omega Healthcare Investors Incorporated | | | 4.95 | | | | 4-1-2024 | | | | 2,185,000 | | | | 2,230,268 | |
Simon Property Group LP | | | 2.20 | | | | 2-1-2019 | | | | 2,400,000 | | | | 2,392,743 | |
| | | | |
| | | | | | | | | | | | | | | 7,854,351 | |
| | | | | | | | | | | | | | | | |
| | | | |
| Real Estate Management & Development: 0.16% | | | | | | | | | | | | | | | | |
CBRE Services Incorporated | | | 5.00 | | | | 3-15-2023 | | | | 940,000 | | | | 964,113 | |
| | | | | | | | | | | | | | | | |
The accompanying notes are an integral part of these financial statements.
| | | | |
| 12 | | Wells Fargo Core Plus Bond Fund | | Portfolio of investments—February 28, 2018 (unaudited) |
| | | | | | | | | | | | | | | | |
| Security name | | Interest rate | | | Maturity date | | | Principal | | | Value | |
| | | | |
Telecommunication Services: 1.65% | | | | | | | | | | | | | | | | |
| | | | |
| Diversified Telecommunication Services: 0.90% | | | | | | | | | | | | | | | | |
AT&T Incorporated | | | 4.75 | % | | | 5-15-2046 | | | $ | 1,075,000 | | | $ | 1,018,518 | |
AT&T Incorporated | | | 5.15 | | | | 2-14-2050 | | | | 610,000 | | | | 608,807 | �� |
AT&T Incorporated | | | 5.25 | | | | 3-1-2037 | | | | 1,070,000 | | | | 1,109,026 | |
AT&T Incorporated | | | 5.65 | | | | 2-15-2047 | | | | 1,050,000 | | | | 1,126,564 | |
Verizon Communications Incorporated | | | 5.01 | | | | 4-15-2049 | | | | 882,000 | | | | 895,023 | |
Verizon Communications Incorporated | | | 5.50 | | | | 3-16-2047 | | | | 675,000 | | | | 737,423 | |
| | | | |
| | | | | | | | | | | | | | | 5,495,361 | |
| | | | | | | | | | | | | | | | |
| | | | |
| Wireless Telecommunication Services: 0.75% | | | | | | | | | | | | | | | | |
Crown Castle Towers LLC 144A | | | 3.22 | | | | 5-15-2042 | | | | 2,600,000 | | | | 2,588,300 | |
SBA Tower Trust 144A | | | 3.72 | | | | 4-9-2048 | | | | 1,968,000 | | | | 1,944,095 | |
| | | | |
| | | | | | | | | | | | | | | 4,532,395 | |
| | | | | | | | | | | | | | | | |
| | | | |
Utilities: 0.59% | | | | | | | | | | | | | | | | |
| | | | |
| Electric Utilities: 0.23% | | | | | | | | | | | | | | | | |
Basin Electric Power Cooperative 144A | | | 4.75 | | | | 4-26-2047 | | | | 1,315,000 | | | | 1,373,681 | |
| | | | | | | | | | | | | | | | |
| | | | |
| Independent Power & Renewable Electricity Producers: 0.36% | | | | | | | | | | | | | | | | |
Harper Lake Solar Funding Corporation 144A | | | 7.65 | | | | 12-31-2018 | | | | 310,724 | | | | 316,938 | |
NRG Energy Incorporated | | | 6.25 | | | | 7-15-2022 | | | | 1,010,000 | | | | 1,042,825 | |
Tri-State Generation and Transmission Association Incorporated | | | 4.25 | | | | 6-1-2046 | | | | 850,000 | | | | 823,230 | |
| | | | |
| | | | | | | | | | | | | | | 2,182,993 | |
| | | | | | | | | | | | | | | | |
| | | | |
Total Corporate Bonds and Notes (Cost $108,758,484) | | | | | | | | | | | | | | | 109,479,946 | |
| | | | | | | | | | | | | | | | |
| | | | |
| | | | | | | | | Shares | | | | |
| Exchange-Traded Funds: 1.98% | | | | | | | | | | | | | | | | |
iShares 1-3 Year Credit Bond ETF « | | | | | | | | | | | 115,320 | | | | 11,977,135 | |
| | | | | | | | | | | | | | | | |
| | | | |
Total Exchange-Traded Funds (Cost $12,090,714) | | | | | | | | | | | | | | | 11,977,135 | |
| | | | | | | | | | | | | | | | |
| | | | |
| | | | | | | | | Principal | | | | |
| Foreign Corporate Bonds and Notes @: 2.81% | | | | | | | | | | | | | | | | |
| | | | |
Consumer Discretionary: 0.89% | | | | | | | | | | | | | | | | |
| | | | |
| Hotels, Restaurants & Leisure: 0.21% | | | | | | | | | | | | | | | | |
William Hill plc (GBP) | | | 4.88 | | | | 9-7-2023 | | | | 875,000 | | | | 1,258,819 | |
| | | | | | | | | | | | | | | | |
| | | | |
| Internet & Direct Marketing Retail: 0.33% | | | | | | | | | | | | | | | | |
Selecta Group BV (EUR) 144A | | | 5.88 | | | | 2-1-2024 | | | | 1,650,000 | | | | 2,012,396 | |
| | | | | | | | | | | | | | | | |
| | | | |
| Media: 0.35% | | | | | | | | | | | | | | | | |
Altice SA (EUR) 144A | | | 7.25 | | | | 5-15-2022 | | | | 1,800,000 | | | | 2,117,406 | |
| | | | | | | | | | | | | | | | |
| | | | |
Consumer Staples: 0.53% | | | | | | | | | | | | | | | | |
| | | | |
| Food & Staples Retailing: 0.53% | | | | | | | | | | | | | | | | |
Distribuidora Internacional de Alimentacion SA (EUR) | | | 0.88 | | | | 4-6-2023 | | | | 2,700,000 | | | | 3,229,807 | |
| | | | | | | | | | | | | | | | |
The accompanying notes are an integral part of these financial statements.
| | | | | | |
| Portfolio of investments—February 28, 2018 (unaudited) | | Wells Fargo Core Plus Bond Fund | | | 13 | |
| | | | | | | | | | | | | | | | |
| Security name | | Interest rate | | | Maturity date | | | Principal | | | Value | |
| | | | |
Energy: 0.66% | | | | | | | | | | | | | | | | |
| | | | |
| Oil, Gas & Consumable Fuels: 0.66% | | | | | | | | | | | | | | | | |
Petroleos Mexicanos (EUR) | | | 3.75 | % | | | 2-21-2024 | | | | 1,000,000 | | | $ | 1,301,887 | |
TOTAL SA (5 Year Euro Swap Rate +3.78%) (EUR) ± | | | 3.88 | | | | 12-29-2049 | | | | 2,000,000 | | | | 2,697,420 | |
| | | | |
| | | | | | | | | | | | | | | 3,999,307 | |
| | | | | | | | | | | | | | | | |
| | | | |
Financials: 0.36% | | | | | | | | | | | | | | | | |
| | | | |
| Banks: 0.36% | | | | | | | | | | | | | | | | |
ATF Netherlands BV (EUR) | | | 1.50 | | | | 7-15-2024 | | | | 500,000 | | | | 610,664 | |
Banque Centrale de Tunisie (EUR) | | | 5.63 | | | | 2-17-2024 | | | | 1,000,000 | | | | 1,244,232 | |
BAWAG PSK (EUR) | | | 8.13 | | | | 10-30-2023 | | | | 200,000 | | | | 333,053 | |
| | | | |
| | | | | | | | | | | | | | | 2,187,949 | |
| | | | | | | | | | | | | | | | |
| | | | |
Industrials: 0.37% | | | | | | | | | | | | | | | | |
| | | | |
| Road & Rail: 0.37% | | | | | | | | | | | | | | | | |
Europcar Groupe SA (EUR) 144A | | | 4.13 | | | | 11-15-2024 | | | | 1,800,000 | | | | 2,202,588 | |
| | | | | | | | | | | | | | | | |
| | | | |
Total Foreign Corporate Bonds and Notes (Cost $16,659,415) | | | | | | | | | | | | | | | 17,008,272 | |
| | | | | | | | | | | | | | | | |
| | | | |
Foreign Government Bonds @: 1.18% | | | | | | | | | | | | | | | | |
Brazil (BRL) | | | 10.00 | | | | 1-1-2025 | | | | 8,600,000 | | | | 2,727,366 | |
Indonesia (IDR) | | | 7.88 | | | | 4-15-2019 | | | | 25,000,000,000 | | | | 1,874,750 | |
Mexico (MXN) | | | 6.50 | | | | 6-9-2022 | | | | 20,000,000 | | | | 1,019,944 | |
Poland (PLN) | | | 2.50 | | | | 7-25-2027 | | | | 5,500,000 | | | | 1,508,326 | |
| | | | |
Total Foreign Government Bonds (Cost $7,122,913) | | | | | | | | | | | | | | | 7,130,386 | |
| | | | | | | | | | | | | | | | |
| | | | |
Loans: 4.23% | | | | | | | | | | | | | | | | |
| | | | |
Consumer Discretionary: 0.10% | | | | | | | | | | | | | | | | |
| | | | |
| Media: 0.10% | | | | | | | | | | | | | | | | |
CSC Holdings LLC (1 Month LIBOR +2.50%) ± | | | 4.14 | | | | 1-25-2026 | | | $ | 628,000 | | | | 628,521 | |
| | | | | | | | | | | | | | | | |
| | | | |
Consumer Staples: 0.38% | | | | | | | | | | | | | | | | |
| | | | |
| Food Products: 0.38% | | | | | | | | | | | | | | | | |
Pinnacle Foods Incorporated (1 Month LIBOR +2.00%) ± | | | 3.58 | | | | 2-2-2024 | | | | 1,237,500 | | | | 1,244,529 | |
Prestige Brands Incorporated (1 Month LIBOR +2.75%) ± | | | 4.40 | | | | 1-26-2024 | | | | 1,070,427 | | | | 1,076,358 | |
| | | | |
| | | | | | | | | | | | | | | 2,320,887 | |
| | | | | | | | | | | | | | | | |
| | | | |
Energy: 0.36% | | | | | | | | | | | | | | | | |
| | | | |
| Oil, Gas & Consumable Fuels: 0.36% | | | | | | | | | | | | | | | | |
Lucid Energy Group II LLC %%‡< | | | 4.59 | | | | 2-17-2025 | | | | 1,250,000 | | | | 1,250,788 | |
Traverse Midstream Partners LLC (6 Month LIBOR +4.00%) ± | | | 5.85 | | | | 9-27-2024 | | | | 935,000 | | | | 941,236 | |
| | | | |
| | | | | | | | | | | | | | | 2,192,024 | |
| | | | | | | | | | | | | | | | |
| | | | |
Financials: 0.17% | | | | | | | | | | | | | | | | |
| | | | |
| Insurance: 0.17% | | | | | | | | | | | | | | | | |
Hub International Limited (1 Month LIBOR +3.00%) ± | | | 4.84 | | | | 10-2-2020 | | | | 989,729 | | | | 993,441 | |
| | | | | | | | | | | | | | | | |
The accompanying notes are an integral part of these financial statements.
| | | | |
| 14 | | Wells Fargo Core Plus Bond Fund | | Portfolio of investments—February 28, 2018 (unaudited) |
| | | | | | | | | | | | | | | | |
| Security name | | Interest rate | | | Maturity date | | | Principal | | | Value | |
| | | | |
Health Care: 0.43% | | | | | | | | | | | | | | | | |
| | | | |
| Health Care Providers & Services: 0.22% | | | | | | | | | | | | | | | | |
Air Methods Corporation (3 Month LIBOR +3.50%) ± | | | 5.19 | % | | | 4-21-2024 | | | $ | 118,013 | | | $ | 118,426 | |
Surgery Center Holdings Incorporated (1 Month LIBOR +3.25%) ± | | | 4.90 | | | | 9-2-2024 | | | | 1,246,875 | | | | 1,246,563 | |
| | | | |
| | | | | | | | | | | | | | | 1,364,989 | |
| | | | | | | | | | | | | | | | |
| | | | |
| Health Care Technology: 0.21% | | | | | | | | | | | | | | | | |
Emerald Bidco Incorporated (1 Month LIBOR +3.00%) ± | | | 4.65 | | | | 10-21-2023 | | | | 1,237,500 | | | | 1,245,234 | |
| | | | | | | | | | | | | | | | |
| | | | |
Industrials: 0.79% | | | | | | | | | | | | | | | | |
| | | | |
| Aerospace & Defense: 0.20% | | | | | | | | | | | | | | | | |
TransDigm Incorporated (1 Month LIBOR +2.75%) ± | | | 4.40 | | | | 5-14-2022 | | | | 1,231,860 | | | | 1,239,325 | |
| | | | | | | | | | | | | | | | |
| | | | |
| Commercial Services & Supplies: 0.38% | | | | | | | | | | | | | | | | |
Aramark Services Incorporated (1 Month LIBOR +2.00%) ± | | | 3.65 | | | | 3-28-2024 | | | | 415,127 | | | | 417,464 | |
KAR Auction Services Incorporated (3 Month LIBOR +2.25%) ± | | | 4.00 | | | | 3-11-2021 | | | | 1,235,594 | | | | 1,242,933 | |
Wrangler Buyer Corporation (1 Month LIBOR +3.00%) ± | | | 4.65 | | | | 9-27-2024 | | | | 625,000 | | | | 627,994 | |
| | | | |
| | | | | | | | | | | | | | | 2,288,391 | |
| | | | | | | | | | | | | | | | |
| | | | |
| Communications Equipment: 0.21% | | | | | | | | | | | | | | | | |
Virgin Media Bristol LLC (1 Month LIBOR +2.50%) ± | | | 4.09 | | | | 1-15-2026 | | | | 1,250,000 | | | | 1,253,988 | |
| | | | | | | | | | | | | | | | |
| | | | |
Information Technology: 0.80% | | | | | | | | | | | | | | | | |
| | | | |
| Internet Software & Services: 0.61% | | | | | | | | | | | | | | | | |
Ancestry.com Incorporated (1 Month LIBOR +3.25%) ± | | | 4.90 | | | | 10-19-2023 | | | | 1,228,125 | | | | 1,233,345 | |
Match Group Incorporated (2 Month LIBOR +2.50%) ± | | | 4.09 | | | | 11-16-2022 | | | | 880,000 | | | | 884,400 | |
Zayo Group LLC (1 Month LIBOR +2.25%) ±%% | | | 3.87 | | | | 1-19-2024 | | | | 1,591,179 | | | | 1,597,862 | |
| | | | |
| | | | | | | | | | | | | | | 3,715,607 | |
| | | | | | | | | | | | | | | | |
| | | | |
| IT Services: 0.19% | | | | | | | | | | | | | | | | |
First Data Corporation (1 Month LIBOR +2.25%) ± | | | 3.87 | | | | 7-8-2022 | | | | 1,145,240 | | | | 1,147,061 | |
| | | | | | | | | | | | | | | | |
| | | | |
Materials: 0.42% | | | | | | | | | | | | | | | | |
| | | | |
| Containers & Packaging: 0.42% | | | | | | | | | | | | | | | | |
Berry Plastics Corporation (1 Month LIBOR +2.00%) ± | | | 3.58 | | | | 2-8-2020 | | | | 980,392 | | | | 984,069 | |
Consolidated Container Company LLC (1 Month LIBOR +3.50%) ± | | | 4.65 | | | | 5-22-2024 | | | | 299,250 | | | | 300,746 | |
Reynolds Group Holdings Incorporated (1 Month LIBOR +2.75%) ± | | | 4.40 | | | | 2-5-2023 | | | | 1,234,406 | | | | 1,239,813 | |
| | | | |
| | | | | | | | | | | | | | | 2,524,628 | |
| | | | | | | | | | | | | | | | |
| | | | |
Real Estate: 0.38% | | | | | | | | | | | | | | | | |
| | | | |
| Equity REITs: 0.38% | | | | | | | | | | | | | | | | |
MGM Growth Properties LLC (1 Month LIBOR +2.25%) ± | | | 3.90 | | | | 4-25-2023 | | | | 1,231,203 | | | | 1,236,202 | |
The Geo Group Incorporated (3 Month LIBOR +2.25%) ± | | | 3.95 | | | | 3-22-2024 | | | | 1,034,652 | | | | 1,037,756 | |
| | | | |
| | | | | | | | | | | | | | | 2,273,958 | |
| | | | | | | | | | | | | | | | |
| | | | |
Telecommunication Services: 0.40% | | | | | | | | | | | | | | | | |
| | | | |
| Diversified Telecommunication Services: 0.20% | | | | | | | | | | | | | | | | |
Level 3 Financing Incorporated (1 Month LIBOR +2.25%) ± | | | 3.85 | | | | 2-22-2024 | | | | 1,198,840 | | | | 1,200,674 | |
| | | | | | | | | | | | | | | | |
The accompanying notes are an integral part of these financial statements.
| | | | | | |
| Portfolio of investments—February 28, 2018 (unaudited) | | Wells Fargo Core Plus Bond Fund | | | 15 | |
| | | | | | | | | | | | | | | | |
| Security name | | Interest rate | | | Maturity date | | | Principal | | | Value | |
| | | | |
| Wireless Telecommunication Services: 0.20% | | | | | | | | | | | | | | | | |
Sprint Communications Incorporated (1 Month LIBOR +2.50%) ± | | | 4.19 | % | | | 2-2-2024 | | | $ | 1,240,625 | | | $ | 1,241,010 | |
| | | | | | | | | | | | | | | | |
| | | | |
Total Loans (Cost $25,579,970) | | | | | | | | | | | | | | | 25,629,738 | |
| | | | | | | | | | | | | | | | |
| | | | |
Municipal Obligations: 5.30% | | | | | | | | | | | | | | | | |
| | | | |
| California: 0.57% | | | | | | | | | | | | | | | | |
Alameda CA Corridor Transportation Authority CAB Refunding Bond Subordinated Series B (Transportation Revenue, Ambac Insured) ¤ | | | 0.00 | | | | 10-1-2028 | | | | 2,115,000 | | | | 1,255,104 | |
San Jose CA Series B (Airport Revenue, AGM Insured) | | | 6.60 | | | | 3-1-2041 | | | | 2,000,000 | | | | 2,183,880 | |
| | | | |
| | | | | | | | | | | | | | | 3,438,984 | |
| | | | | | | | | | | | | | | | |
| | | | |
| District of Columbia: 0.33% | | | | | | | | | | | | | | | | |
Metropolitan Washington DC Airports Authority Build America Bonds (Transportation Revenue) | | | 7.46 | | | | 10-1-2046 | | | | 1,375,000 | | | | 1,993,393 | |
| | | | | | | | | | | | | | | | |
| | | | |
| Illinois: 1.73% | | | | | | | | | | | | | | | | |
Chicago IL (GO Revenue) | | | 5.43 | | | | 1-1-2042 | | | | 1,000,000 | | | | 921,210 | |
Chicago IL Series B (GO Revenue) | | | 7.38 | | | | 1-1-2033 | | | | 1,125,000 | | | | 1,242,641 | |
Chicago IL Transit Authority Taxable Pension Funding Series A (Tax Revenue) | | | 6.90 | | | | 12-1-2040 | | | | 1,075,000 | | | | 1,409,411 | |
Cook County IL Series B (GO Revenue, Build America Mutual Assurance Company Insured) | | | 6.36 | | | | 11-15-2033 | | | | 1,745,000 | | | | 2,181,948 | |
Illinois Taxable Pension (GO Revenue) | | | 5.10 | | | | 6-1-2033 | | | | 1,870,000 | | | | 1,763,092 | |
Metropolitan Pier & Exposition Authority Illinois CAB McCormick Place Expansion Project Series 2010-B1 (Tax Revenue, AGM Insured) ¤ | | | 0.00 | | | | 6-15-2026 | | | | 1,975,000 | | | | 1,454,035 | |
Metropolitan Pier & Exposition Authority Illinois CAB McCormick Place Expansion Project Series 2012-B (Tax Revenue) ¤ | | | 0.00 | | | | 12-15-2051 | | | | 765,000 | | | | 136,201 | |
Will County IL Community High School District (GO Revenue, AGM Insured) ¤ | | | 0.00 | | | | 1-1-2025 | | | | 1,820,000 | | | | 1,407,351 | |
| | | | |
| | | | | | | | | | | | | | | 10,515,889 | |
| | | | | | | | | | | | | | | | |
| | | | |
| Maryland: 0.16% | | | | | | | | | | | | | | | | |
Maryland Health & HEFAR Green Street Academy Series B (Education Revenue) 144A | | | 6.75 | | | | 7-1-2023 | | | | 975,000 | | | | 955,120 | |
| | | | | | | | | | | | | | | | |
| | | | |
| Michigan: 0.34% | | | | | | | | | | | | | | | | |
Michigan Finance Authority Local Government Loan Program Project Series E (Miscellaneous Revenue) | | | 7.19 | | | | 11-1-2022 | | | | 1,915,000 | | | | 2,058,759 | |
| | | | | | | | | | | | | | | | |
| | | | |
| New Jersey: 0.85% | | | | | | | | | | | | | | | | |
New Jersey EDA Series B (Miscellaneous Revenue, AGM Insured) ¤ | | | 0.00 | | | | 2-15-2019 | | | | 4,250,000 | | | | 4,136,610 | |
New Jersey EDA Series B (Miscellaneous Revenue, AGM Insured) | | | 3.29 | | | | 7-1-2019 | | | | 1,000,000 | | | | 996,290 | |
| | | | |
| | | | | | | | | | | | | | | 5,132,900 | |
| | | | | | | | | | | | | | | | |
| | | | |
| New York: 0.18% | | | | | | | | | | | | | | | | |
Oyster Bay NY (GO Revenue) | | | 3.55 | | | | 2-1-2019 | | | | 1,085,000 | | | | 1,083,145 | |
| | | | | | | | | | | | | | | | |
| | | | |
| Ohio: 0.37% | | | | | | | | | | | | | | | | |
American Municipal Power Incorporated Combined Hydroelectric Projects Series 2010-B (Utilities Revenue) | | | 8.08 | | | | 2-15-2050 | | | | 1,365,000 | | | | 2,226,998 | |
| | | | | | | | | | | | | | | | |
| | | | |
| Pennsylvania: 0.48% | | | | | | | | | | | | | | | | |
Commonwealth of Pennsylvania Financing Authority Series A (Miscellaneous Revenue) | | | 4.14 | | | | 6-1-2038 | | | | 1,995,000 | | | | 2,031,808 | |
The accompanying notes are an integral part of these financial statements.
| | | | |
| 16 | | Wells Fargo Core Plus Bond Fund | | Portfolio of investments—February 28, 2018 (unaudited) |
| | | | | | | | | | | | | | | | |
| Security name | | Interest rate | | | Maturity date | | | Principal | | | Value | |
| | | | |
| Pennsylvania (continued) | | | | | | | | | | | | | | | | |
Quakertown PA General Authority USDA Loan Anticipation Notes Series 2017-B (Health Revenue) | | | 3.80 | % | | | 7-1-2021 | | | $ | 900,000 | | | $ | 887,535 | |
| | | | |
| | | | | | | | | | | | | | | 2,919,343 | |
| | | | | | | | | | | | | | | | |
| | | | |
| Texas: 0.29% | | | | | | | | | | | | | | | | |
North Texas Tollway Authority Build America Bonds Subordinate Lien Series B-2 (Transportation Revenue) | | | 8.91 | | | | 2-1-2030 | | | | 1,595,000 | | | | 1,761,534 | |
| | | | | | | | | | | | | | | | |
| | | | |
Total Municipal Obligations (Cost $30,772,718) | | | | | | | | | | | | | | | 32,086,065 | |
| | | | | | | | | | | | | | | | |
| | | | |
Non-Agency Mortgage-Backed Securities: 7.23% | | | | | | | | | | | | | | | | |
Arbor Realty Collateralized Series 2016-FL Class A (1 Month LIBOR +1.70%) 144A± | | | 3.29 | | | | 9-15-2026 | | | | 1,000,000 | | | | 1,007,627 | |
Banc of America Commercial Mortgage Securities Incorporated Series 2007-1 Class AMFX ±± | | | 5.48 | | | | 1-15-2049 | | | | 896,944 | | | | 908,696 | |
Banc of America Funding Corporation Series 2016-R1 Class A1 144A±± | | | 2.50 | | | | 3-25-2040 | | | | 1,072,418 | | | | 1,047,623 | |
Barclays Commercial Mortgage Series 2018-A (1 Month LIBOR +0.70%) 144A± | | | 2.29 | | | | 2-15-2033 | | | | 2,600,000 | | | | 2,600,000 | |
BSPRT Commercial Mortgage Backed Series 2017-FL1 (1 Month LIBOR +1.35%) 144A± | | | 2.94 | | | | 6-15-2027 | | | | 1,610,000 | | | | 1,616,490 | |
BX Trust 2017 Series A (1 Month LIBOR +1.05%) 144A± | | | 2.64 | | | | 10-15-2032 | | | | 2,860,000 | | | | 2,865,334 | |
CD Commercial Mortgage Trust Series 2017-6 Class A5 | | | 3.46 | | | | 11-13-2050 | | | | 1,035,000 | | | | 1,025,722 | |
CIFC Funding Limited Series 2012-2RA Class A1 (3 Month LIBOR +0.80%) 144A± | | | 2.20 | | | | 1-20-2028 | | | | 2,525,000 | | | | 2,525,283 | |
Credit Suisse First Boston Commercial Mortgage Trust Series 1998-C2 Class AX ±±(c) | | | 0.22 | | | | 11-15-2030 | | | | 123,366 | | | | 82 | |
Crown Point Limited Series 2013-2A Class A1LR (3 Month LIBOR +0.59%) 144A± | | | 2.31 | | | | 12-31-2023 | | | | 950,230 | | | | 950,341 | |
Crown Point Limited Series 2015-3A Class A1AR (3 Month LIBOR +0.91%) 144A± | | | 2.63 | | | | 12-31-2027 | | | | 2,500,000 | | | | 2,500,543 | |
CSAIL Commercial Mortgage Trust Series 2015-C4 Class A1 | | | 2.01 | | | | 11-15-2048 | | | | 2,476,460 | | | | 2,454,319 | |
Financial Asset Securitization Incorporated Series 1997-NAM2 Class B2 † | | | 7.88 | | | | 7-25-2027 | | | | 25,274 | | | | 18,800 | |
FirstKey Mortgage Trust Series 2014-1 Class A2 144A±± | | | 3.00 | | | | 11-25-2044 | | | | 1,911,277 | | | | 1,858,269 | |
GAHR Commercial Mortgage Trust Series 2015-NRF Class AFX 144A | | | 3.23 | | | | 12-15-2034 | | | | 1,600,000 | | | | 1,607,069 | |
Great Wolf Trust Series 2017-A (1 Month LIBOR +0.85%) 144A± | | | 2.59 | | | | 9-15-2034 | | | | 2,350,000 | | | | 2,357,301 | |
GS Mortgage Securities Trust Series 2007 Class AM ±± | | | 5.79 | | | | 8-10-2045 | | | | 440,398 | | | | 447,447 | |
Hyatt Hotel Portfolio Trust Series 2017-HYTE Class A (1 Month LIBOR +0.66%) 144A± | | | 2.25 | | | | 8-9-2032 | | | | 765,000 | | | | 764,278 | |
JPMorgan Chase Commercial Mortgage Securities Trust Series 2007-CB18 Class AMFL (1 Month LIBOR +0.17%) ± | | | 1.72 | | | | 6-12-2047 | | | | 696,636 | | | | 685,221 | |
JPMorgan Chase Commercial Mortgage Securities Trust Series 2007-LDPX Class AM ±± | | | 5.46 | | | | 1-15-2049 | | | | 413,126 | | | | 414,406 | |
Mach One Trust Commercial Mortgage Backed Series 2004-1 Class X 144A±±(c)‡ | | | 0.51 | | | | 5-28-2040 | | | | 187,723 | | | | 131 | |
Morgan Stanley Capital I Series 2004-RR2 Class X 144A±±(c) | | | 0.27 | | | | 10-28-2033 | | | | 13,969 | | | | 247 | |
Neuberger Berman Limited Series 2015-20A Class AR (3 Month LIBOR +0.80%) 144A± | | | 2.52 | | | | 1-15-2028 | | | | 1,575,000 | | | | 1,575,104 | |
Rait Trust Series 2017-FL8 Class A (1 Month LIBOR +0.85%) 144A± | | | 2.44 | | | | 12-15-2037 | | | | 1,687,817 | | | | 1,689,702 | |
Stonemont Portfolio Trust Series 2017 Class A (1 Month LIBOR +0.85%) 144A± | | | 2.44 | | | | 8-20-2030 | | | | 2,560,000 | | | | 2,565,586 | |
Tharaldson Hotel Portfolio Trust Series 2018 -A1 (1 Month LIBOR +0.75%) 144A± | | | 2.33 | | | | 11-11-2034 | | | | 2,100,000 | | | | 2,102,614 | |
TICP Collateralized Loan Obligation Limited Trust Series 2014-2A Class A1AR (3 Month LIBOR +1.16%) 144A± | | | 2.90 | | | | 7-20-2026 | | | | 2,500,000 | | | | 2,505,270 | |
UBS Commercial Mortgage Trust Series 2017-C5 Class A5 | | | 3.47 | | | | 11-15-2050 | | | | 1,140,000 | | | | 1,129,192 | |
West CLO Limited Series 2014-2A Class A1 (3 Month LIBOR +0.87%) 144A± | | | 2.59 | | | | 1-16-2027 | | | | 3,000,000 | | | | 3,000,201 | |
Wind River Collateralized Loan Obligation Limited Trust Series 2014-3A Class AR (3 Month LIBOR +1.10%) 144A± | | | 2.84 | | | | 1-22-2027 | | | | 1,600,000 | | | | 1,604,138 | |
| | | | |
Total Non-Agency Mortgage-Backed Securities (Cost $44,104,091) | | | | | | | | | | | | | | | 43,827,036 | |
| | | | | | | | | | | | | | | | |
| | | | |
U.S. Treasury Securities: 10.85% | | | | | | | | | | | | | | | | |
U.S. Treasury Bond | | | 2.75 | | | | 8-15-2047 | | | | 6,625,000 | | | | 6,137,441 | |
U.S. Treasury Bond | | | 2.75 | | | | 11-15-2047 | | | | 1,350,000 | | | | 1,250,754 | |
U.S. Treasury Bond | | | 3.38 | | | | 5-15-2044 | | | | 2,410,000 | | | | 2,520,050 | |
The accompanying notes are an integral part of these financial statements.
| | | | | | |
| Portfolio of investments—February 28, 2018 (unaudited) | | Wells Fargo Core Plus Bond Fund | | | 17 | |
| | | | | | | | | | | | | | | | |
| Security name | | Interest rate | | | Maturity date | | | Principal | | | Value | |
| | | | |
U.S. Treasury Securities (continued) | | | | | | | | | | | | | | | | |
U.S. Treasury Bond | | | 3.75 | % | | | 11-15-2043 | | | $ | 5,500,000 | | | $ | 6,114,668 | |
U.S. Treasury Bond | | | 4.25 | | | | 11-15-2040 | | | | 1,385,000 | | | | 1,651,017 | |
U.S. Treasury Bond | | | 4.38 | | | | 2-15-2038 | | | | 4,195,000 | | | | 5,048,912 | |
U.S. Treasury Bond | | | 4.63 | | | | 2-15-2040 | | | | 1,655,000 | | | | 2,069,203 | |
U.S. Treasury Note | | | 1.63 | | | | 8-31-2022 | | | | 2,110,000 | | | | 2,021,149 | |
U.S. Treasury Note | | | 2.00 | | | | 10-31-2022 | | | | 8,210,000 | | | | 7,980,056 | |
U.S. Treasury Note « | | | 2.25 | | | | 11-15-2027 | | | | 21,465,000 | | | | 20,310,418 | |
U.S. Treasury Note | | | 2.38 | | | | 1-31-2023 | | | | 3,145,000 | | | | 3,105,319 | |
U.S. Treasury Note | | | 2.75 | | | | 2-15-2028 | | | | 7,650,000 | | | | 7,572,604 | |
| | | | |
Total U.S. Treasury Securities (Cost $67,328,079) | | | | | | | | | | | | | | | 65,781,591 | |
| | | | | | | | | | | | | | | | |
| | | | |
Yankee Corporate Bonds and Notes: 9.33% | | | | | | | | | | | | | | | | |
| | | | |
Consumer Discretionary: 0.08% | | | | | | | | | | | | | | | | |
| | | | |
| Auto Components: 0.08% | | | | | | | | | | | | | | | | |
IHO Verwaltungs GmbH 144A | | | 4.13 | | | | 9-15-2021 | | | | 505,000 | | | | 503,738 | |
| | | | | | | | | | | | | | | | |
| | | | |
Consumer Staples: 0.31% | | | | | | | | | | | | | | | | |
| | | | |
| Beverages: 0.31% | | | | | | | | | | | | | | | | |
Coca-Cola Femsa SAB de CV | | | 3.88 | | | | 11-26-2023 | | | | 1,810,000 | | | | 1,854,654 | |
| | | | | | | | | | | | | | | | |
| | | | |
Energy: 0.72% | | | | | | | | | | | | | | | | |
| | | | |
| Energy Equipment & Services: 0.17% | | | | | | | | | | | | | | | | |
Ensco plc | | | 5.75 | | | | 10-1-2044 | | | | 1,500,000 | | | | 1,036,875 | |
| | | | | | | | | | | | | | | | |
| | | | |
| Oil, Gas & Consumable Fuels: 0.55% | | | | | | | | | | | | | | | | |
BP Capital Markets plc | | | 3.22 | | | | 11-28-2023 | | | | 2,170,000 | | | | 2,153,478 | |
Comision Federal de Electricidad 144A | | | 4.75 | | | | 2-23-2027 | | | | 1,140,000 | | | | 1,152,825 | |
| | | | |
| | | | | | | | | | | | | | | 3,306,303 | |
| | | | | | | | | | | | | | | | |
| | | | |
Financials: 6.66% | | | | | | | | | | | | | | | | |
| | | | |
| Banks: 3.46% | | | | | | | | | | | | | | | | |
ABN AMRO Bank NV 144A | | | 4.75 | | | | 7-28-2025 | | | | 1,800,000 | | | | 1,852,425 | |
Banco de Bogota SA 144A | | | 4.38 | | | | 8-3-2027 | | | | 1,110,000 | | | | 1,080,863 | |
Banco de Costa Rica 144A | | | 5.25 | | | | 8-12-2018 | | | | 1,550,000 | | | | 1,557,208 | |
Banco do Brasil SA 144A | | | 4.63 | | | | 1-15-2025 | | | | 1,615,000 | | | | 1,576,644 | |
Banco General SA 144A | | | 4.13 | | | | 8-7-2027 | | | | 1,035,000 | | | | 1,001,880 | |
Banco Nacional de Costa Rica 144A | | | 5.88 | | | | 4-25-2021 | | | | 1,600,000 | | | | 1,640,800 | |
Banco Safra SA 144A | | | 4.13 | | | | 2-8-2023 | | | | 1,695,000 | | | | 1,674,660 | |
Bancolombia SA | | | 5.13 | | | | 9-11-2022 | | | | 486,000 | | | | 504,954 | |
Banistmo SA 144A | | | 3.65 | | | | 9-19-2022 | | | | 1,160,000 | | | | 1,136,800 | |
Banque Ouest Africaine de Developpement 144A« | | | 5.00 | | | | 7-27-2027 | | | | 2,520,000 | | | | 2,540,790 | |
BNP Paribas 144A | | | 3.80 | | | | 1-10-2024 | | | | 800,000 | | | | 802,014 | |
BPCE SA 144A | | | 5.15 | | | | 7-21-2024 | | | | 1,725,000 | | | | 1,812,916 | |
Credit Suisse Group Funding Limited (3 Month LIBOR +1.20%) 144A± | | | 3.00 | | | | 12-14-2023 | | | | 1,485,000 | | | | 1,444,273 | |
Nordea Bank AB (5 Year USD ICE Swap Rate 11:00am NY +3.56%) 144A± | | | 5.50 | | | | 12-31-2049 | | | | 1,800,000 | | | | 1,831,500 | |
Sumitomo Mitsui Financial Group Incorporated | | | 2.44 | | | | 10-19-2021 | | | | 500,000 | | | | 487,081 | |
| | | | |
| | | | | | | | | | | | | | | 20,944,808 | |
| | | | | | | | | | | | | | | | |
The accompanying notes are an integral part of these financial statements.
| | | | |
| 18 | | Wells Fargo Core Plus Bond Fund | | Portfolio of investments—February 28, 2018 (unaudited) |
| | | | | | | | | | | | | | | | |
| Security name | | Interest rate | | | Maturity date | | | Principal | | | Value | |
| | | | |
| Capital Markets: 0.70% | | | | | | | | | | | | | | | | |
Credit Suisse Group AG 144A | | | 3.57 | % | | | 1-9-2023 | | | $ | 1,770,000 | | | $ | 1,769,144 | |
Macquarie Group Limited 144A | | | 6.00 | | | | 1-14-2020 | | | | 2,365,000 | | | | 2,486,557 | |
| | | | |
| | | | | | | | | | | | | | | 4,255,701 | |
| | | | | | | | | | | | | | | | |
| | | | |
| Consumer Finance: 0.19% | | | | | | | | | | | | | | | | |
UBS Group Funding Switzerland 144A | | | 3.49 | | | | 5-23-2023 | | | | 1,165,000 | | | | 1,165,764 | |
| | | | | | | | | | | | | | | | |
| | | | |
| Diversified Financial Services: 1.24% | | | | | | | | | | | | | | | | |
Banco Nacional de Comercio Exterior SNC 144A | | | 4.38 | | | | 10-14-2025 | | | | 2,350,000 | | | | 2,376,438 | |
Corporacion Financiera de Desarrollo SA (3 Month LIBOR +5.61%) 144A± | | | 5.25 | | | | 7-15-2029 | | | | 1,185,000 | | | | 1,205,738 | |
Teva Pharmaceutical Finance Netherlands III BV | | | 4.10 | | | | 10-1-2046 | | | | 2,700,000 | | | | 1,992,185 | |
UBS Group Funding Switzerland AG (3 Month LIBOR +0.95%) 144A± | | | 2.86 | | | | 8-15-2023 | | | | 2,000,000 | | | | 1,943,980 | |
| | | | |
| | | | | | | | | | | | | | | 7,518,341 | |
| | | | | | | | | | | | | | | | |
| | | | |
| Insurance: 0.67% | | | | | | | | | | | | | | | | |
Axis Specialty Finance plc | | | 2.65 | | | | 4-1-2019 | | | | 1,970,000 | | | | 1,967,192 | |
Qatar Reinsurance Company Limited (5 Year USD Swap Rate +2.79%) ± | | | 4.95 | | | | 12-31-2099 | | | | 1,120,000 | | | | 1,110,010 | |
Validus Holdings Limited | | | 8.88 | | | | 1-26-2040 | | | | 660,000 | | | | 1,013,596 | |
| | | | |
| | | | | | | | | | | | | | | 4,090,798 | |
| | | | | | | | | | | | | | | | |
| | | | |
| Thrifts & Mortgage Finance: 0.40% | | | | | | | | | | | | | | | | |
Nationwide Building Society (5 Year USD Swap Rate +1.85%) 144A± | | | 4.13 | | | | 10-18-2032 | | | | 2,500,000 | | | | 2,408,735 | |
| | | | | | | | | | | | | | | | |
| | | | |
Health Care: 0.05% | | | | | | | | | | | | | | | | |
| | | | |
| Pharmaceuticals: 0.05% | | | | | | | | | | | | | | | | |
Valeant Pharmaceuticals International Incorporated 144A | | | 5.50 | | | | 11-1-2025 | | | | 255,000 | | | | 252,291 | |
Valeant Pharmaceuticals International Incorporated 144A | | | 9.00 | | | | 12-15-2025 | | | | 60,000 | | | | 60,113 | |
| | | | |
| | | | | | | | | | | | | | | 312,404 | |
| | | | | | | | | | | | | | | | |
| | | | |
Information Technology: 0.34% | | | | | | | | | | | | | | | | |
| | | | |
| Semiconductors & Semiconductor Equipment: 0.34% | | | | | | | | | | | | | | | | |
NXP Funding LLC 144A | | | 3.88 | | | | 9-1-2022 | | | | 2,050,000 | | | | 2,055,125 | |
| | | | | | | | | | | | | | | | |
| | | | |
Materials: 0.17% | | | | | | | | | | | | | | | | |
| | | | |
| Metals & Mining: 0.17% | | | | | | | | | | | | | | | | |
ArcelorMittal SA | | | 5.75 | | | | 3-1-2021 | | | | 1,010,000 | | | | 1,060,500 | |
| | | | | | | | | | | | | | | | |
| | | | |
Telecommunication Services: 0.33% | | | | | | | | | | | | | | | | |
| | | | |
| Diversified Telecommunication Services: 0.16% | | | | | | | | | | | | | | | | |
Telefonica Emisiones SAU | | | 5.21 | | | | 3-8-2047 | | | | 885,000 | | | | 930,210 | |
| | | | | | | | | | | | | | | | |
| | | | |
| Wireless Telecommunication Services: 0.17% | | | | | | | | | | | | | | | | |
Globo Communicacoes Participacoes SA 144A | | | 4.88 | | | | 4-11-2022 | | | | 1,025,000 | | | | 1,048,063 | |
| | | | | | | | | | | | | | | | |
| | | | |
Utilities: 0.67% | | | | | | | | | | | | | | | | |
| | | | |
| Electric Utilities: 0.67% | | | | | | | | | | | | | | | | |
ACWA Power Management and Investments One Limited 144A | | | 5.95 | | | | 12-15-2039 | | | | 520,000 | | | | 541,043 | |
Transelec SA 144A | | | 3.88 | | | | 1-12-2029 | | | | 860,000 | | | | 828,815 | |
The accompanying notes are an integral part of these financial statements.
| | | | | | |
| Portfolio of investments—February 28, 2018 (unaudited) | | Wells Fargo Core Plus Bond Fund | | | 19 | |
| | | | | | | | | | | | | | | | |
| Security name | | Interest rate | | | Maturity date | | | Principal | | | Value | |
| | | | |
| Electric Utilities (continued) | | | | | | | | | | | | | | | | |
Western Power Distributions Holdings Limited 144A | | | 7.38 | % | | | 12-15-2028 | | | $ | 2,265,000 | | | $ | 2,681,821 | |
| | | | |
| | | | | | | | | | | | | | | 4,051,679 | |
| | | | | | | | | | | | | | | | |
| | | | |
Total Yankee Corporate Bonds and Notes (Cost $56,121,947) | | | | | | | | | | | | | | | 56,543,698 | |
| | | | | | | | | | | | | | | | |
| | | | |
Yankee Government Bonds: 3.86% | | | | | | | | | | | | | | | | |
Banco Nacional de Desenvolvimento Econômico e Social 144A | | | 4.75 | | | | 5-9-2024 | | | | 905,000 | | | | 900,204 | |
Bermuda 144A | | | 3.72 | | | | 1-25-2027 | | | | 995,000 | | | | 970,125 | |
Bermuda 144A | | | 4.14 | | | | 1-3-2023 | | | | 1,210,000 | | | | 1,250,632 | |
Commonwealth of Bahamas 144A | | | 6.00 | | | | 11-21-2028 | | | | 1,770,000 | | | | 1,840,800 | |
Dominican Republic 144A | | | 5.95 | | | | 1-25-2027 | | | | 1,455,000 | | | | 1,540,118 | |
Oman 144A | | | 5.63 | | | | 1-17-2028 | | | | 1,520,000 | | | | 1,512,400 | |
Province of Santa Fe 144A | | | 7.00 | | | | 3-23-2023 | | | | 2,000,000 | | | | 2,068,420 | |
Republic of Argentina | | | 6.88 | | | | 4-22-2021 | | | | 1,280,000 | | | | 1,354,880 | |
Republic of Argentina | | | 6.88 | | | | 1-11-2048 | | | | 1,000,000 | | | | 915,500 | |
Republic of Argentina | | | 7.50 | | | | 4-22-2026 | | | | 1,350,000 | | | | 1,441,800 | |
Republic of Brazil | | | 4.63 | | | | 1-13-2028 | | | | 1,795,000 | | | | 1,765,383 | |
Republic of Chile | | | 3.86 | | | | 6-21-2047 | | | | 1,000,000 | | | | 950,000 | |
Republic of Colombia | | | 5.63 | | | | 2-26-2044 | | | | 755,000 | | | | 814,645 | |
Republic of Ecuador 144A | | | 7.88 | | | | 1-23-2028 | | | | 500,000 | | | | 500,000 | |
Republic of Kenya 144A | | | 8.25 | | | | 2-28-2048 | | | | 750,000 | | | | 769,440 | |
Republic of Senegal 144A | | | 6.25 | | | | 5-23-2033 | | | | 750,000 | | | | 743,438 | |
Ukraine | | | 1.47 | | | | 9-29-2021 | | | | 3,000,000 | | | | 2,884,728 | |
Ukraine 144A | | | 7.38 | | | | 9-25-2032 | | | | 1,200,000 | | | | 1,164,266 | |
| | | | |
Total Yankee Government Bonds (Cost $23,427,595) | | | | | | | | | | | | | | | 23,386,779 | |
| | | | | | | | | | | | | | | | |
| | | | |
Short-Term Investments: 13.11% | | | | | | | | | | | | | | | | |
| | | | |
| Commercial Paper: 0.69% | | | | | | | | | | | | | | | | |
Catholic Health Initiatives (p)(z) | | | 1.05 | | | | 3-2-2018 | | | | 4,200,000 | | | | 4,199,755 | |
| | | | | | | | | | | | | | | | |
| | | | |
| | | Yield | | | | | | Shares | | | | |
| Investment Companies: 12.08% | | | | | | | | | | | | | | | | |
Securities Lending Cash Investment LLC (l)(r)(u) | | | 1.62 | | | | | | | | 6,473,191 | | | | 6,473,838 | |
Wells Fargo Government Money Market Fund Select Class (l)(u)## | | | 1.29 | | | | | | | | 66,693,694 | | | | 66,693,694 | |
| | | | |
| | | | | | | | | | | | | | | 73,167,532 | |
| | | | | | | | | | | | | | | | |
| | | | |
| | | | | | | | | Principal | | | | |
| U.S. Treasury Securities: 0.34% | | | | | | | | | | | | | | | | |
U.S. Treasury Bill (z)# | | | 1.21 | | | | 3-15-2018 | | | $ | 1,900,000 | | | | 1,899,043 | |
U.S. Treasury Bill (z)# | | | 1.36 | | | | 3-29-2018 | | | | 180,000 | | | | 179,793 | |
| | | | |
| | | | | | | | | | | | | | | 2,078,836 | |
| | | | | | | | | | | | | | | | |
| | | | |
Total Short-Term Investments (Cost $79,446,047) | | | | | | | | | | | | | | | 79,446,123 | |
| | | | | | | | | | | | | | | | |
| | | | | | | | |
| Total investments in securities (Cost $662,572,909) | | | 109.26 | % | | | 662,015,608 | |
Other assets and liabilities, net | | | (9.26 | ) | | | (56,093,534 | ) |
| | | | | | | | |
| Total net assets | | | 100.00 | % | | $ | 605,922,074 | |
| | | | | | | | |
The accompanying notes are an integral part of these financial statements.
| | | | |
| 20 | | Wells Fargo Core Plus Bond Fund | | Portfolio of investments—February 28, 2018 (unaudited) |
| ± | Variable rate investment. The rate shown is the rate in effect at period end. |
| ±± | The coupon of the security is adjusted based on the principal and interest payments received from the underlying pool of mortgages as well as the credit quality and the actual prepayment speed of the underlying mortgages. |
| (c) | Investment in an interest-only security entitles holders to receive only the interest payments on the underlying mortgages. The principal amount shown is the notional amount of the underlying mortgages. The rate represents the coupon rate. |
| ¤ | The security is issued in zero coupon form with no periodic interest payments. |
| (a) | The security is fair valued in accordance with procedures approved by the Board of Trustees. |
| %% | The security is issued on a when-issued basis. |
| 144A | The security may be resold in transactions exempt from registration, normally to qualified institutional buyers, pursuant to Rule 144A under the Securities Act of 1933. |
| « | All or a portion of this security is on loan. |
| @ | Foreign bond principal is denominated in the local currency of the issuer. |
| † | Non-income-earning security |
| ‡ | Security is valued using significant unobservable inputs. |
| < | All or a portion of the position represents an unfunded loan commitment. |
| (p) | Asset-backed commercial paper |
| (z) | Zero coupon security. The rate represents the current yield to maturity. |
| (l) | The issuer of the security is an affiliated person of the Fund as defined in the Investment Company Act of 1940. |
| (r) | The investment is a non-registered investment company purchased with cash collateral received from securities on loan. |
| (u) | The rate represents the 7-day annualized yield at period end. |
| ## | All or a portion of this security is segregated for when-issued securities and unfunded loans. |
| # | All or a portion of this security is segregated as collateral for investments in derivative instruments. |
Futures Contracts
| | | | | | | | | | | | | | | | | | | | | | | | |
| Description | | Number of
contracts | | | Expiration
date | | | Notional
cost | | | Notional
value | | | Unrealized
gains | | | Unrealized
losses | |
Long | | | | | | | | | | | | | | | | | | | | | | | | |
U.S. Long Term Bond | | | 105 | | | | 6-20-2018 | | | $ | 15,015,184 | | | $ | 15,060,938 | | | $ | 45,754 | | | $ | 0 | |
U.S. Ultra Bond | | | 50 | | | | 6-20-2018 | | | | 7,734,909 | | | | 7,793,750 | | | | 58,841 | | | | 0 | |
10-Year U.S. Treasury Notes | | | 185 | | | | 6-20-2018 | | | | 22,203,199 | | | | 22,208,672 | | | | 5,473 | | | | 0 | |
10-Year Ultra Futures | | | 45 | | | | 6-20-2018 | | | | 5,736,827 | | | | 5,762,813 | | | | 25,986 | | | | 0 | |
5-Year U.S. Treasury Notes | | | 60 | | | | 6-29-2018 | | | | 6,833,533 | | | | 6,835,781 | | | | 2,248 | | | | 0 | |
2-Year U.S. Treasury Notes | | | 200 | | | | 6-29-2018 | | | | 42,522,175 | | | | 42,493,750 | | | | 0 | | | | (28,425 | ) |
Short | | | | | | | | | | | | | | | | | | | | | | | | |
Euro-BOBL Futures | | | (100) | | | | 3-8-2018 | | | $ | (16,180,824 | ) | | $ | (15,986,883 | ) | | $ | 193,941 | | | $ | 0 | |
Euro-Bund Futures | | | (35) | | | | 3-8-2018 | | | | (6,977,121 | ) | | | (6,808,089 | ) | | | 169,032 | | | | 0 | |
| | | | | | | | | | | | | | | | | | | | | | | | |
| | | | | | | | | | | | | | | | | | $ | 501,275 | | | $ | (28,425 | ) |
| | | | | | | | | | | | | | | | | | | | | | | | |
Forward Foreign Currency Contracts
| | | | | | | | | | | | | | |
Currency to be
received | | Currency to be
delivered | | Counterparty¤¤ | | Settlement date | | Unrealized
gains | | | Unrealized
losses | |
| 20,000,000 MXN | | 1,012,777 USD | | Citibank | | 3-28-2018 | | $ | 43,702 | | | $ | 0 | |
| 1,034,929 USD | | 20,000,000 MXN | | Citibank | | 3-28-2018 | | | 0 | | | | (21,550 | ) |
| 3,800,000 EUR | | 4,701,128 USD | | Citibank | | 3-29-2018 | | | 0 | | | | (55,456 | ) |
| 2,515,000 EUR | | 3,044,996 USD | | Citibank | | 3-29-2018 | | | 29,706 | | | | 0 | |
| 5,100,000 PLN | | 1,476,164 USD | | Citibank | | 3-29-2018 | | | 14,618 | | | | 0 | |
| 18,938,920 USD | | 15,400,000 EUR | | Citibank | | 3-29-2018 | | | 111,721 | | | | 0 | |
| 5,959,325 USD | | 5,015,000 EUR | | Citibank | | 3-29-2018 | | | 0 | | | | (171,740 | ) |
| 3,391,948 USD | | 2,800,000 EUR | | Citibank | | 3-29-2018 | | | 0 | | | | (31,179 | ) |
| 1,436,134 USD | | 5,100,000 PLN | | Citibank | | 3-29-2018 | | | 0 | | | | (54,648 | ) |
| 1,344,900 USD | | 1,000,000 GBP | | Citibank | | 3-29-2018 | | | 0 | | | | (33,553 | ) |
| | | | | | | | | | | | | | |
| | | | | | | | $ | 199,747 | | | $ | (368,126 | ) |
| | | | | | | | | | | | | | |
| | ¤¤ | Transaction can only be closed with the originating counterparty. |
The accompanying notes are an integral part of these financial statements.
| | | | | | |
| Portfolio of investments—February 28, 2018 (unaudited) | | Wells Fargo Core Plus Bond Fund | | | 21 | |
Credit Default Swaps
Sell protection
| | | | | | | | | | | | | | | | | | | | | | | | | | | | | | | | | | | | |
| Reference index | | Fixed rate
received | | | Payment
frequency | | | Counterparty | | | Maturity
date | | | Notional
amount | | | Value | | | Premiums
paid | | | Unrealized
gains | | | Unrealized
losses | |
Markit iTraxx Europe Index, 1.00%, 12-20-2022 | | | 1.00 | % | | | Quarterly | | | | JPMorgan | °° | | | 12-20-2022 | | | | 7,000,000 EUR | | | $ | 193,231 | | | $ | 177,535 | | | $ | 15,696 | | | $ | 0 | |
| | °° | Exchange traded or centrally cleared transaction with counterparty. |
Investments in Affiliates
An affiliated investment is an investment in which the Fund owns at least 5% of the outstanding voting shares of the issuer or as a result of other relationships, such as the Fund and the issuer having the same investment manager. Transactions with issuers that were either affiliated persons of the Fund at the beginning of the period or the end of the period were as follows:
| | | | | | | | | | | | | | | | | | | | | | | | | | | | | | | | | | | | |
| | | Shares,
beginning of
period | | | Shares
purchased | | | Shares
sold | | | Shares,
end of
period | | | Net
realized
gains
(losses) | | | Net
change in
unrealized
gains
(losses) | | | Income
from
affiliated
securities | | | Value,
end
of period | | | % of
net
assets | |
Short-Term Investments | | | | | | | | | | | | | | | | | | | | | | | | | | | | | | | | | | | | |
Investment companies | | | | | | | | | | | | | | | | | | | | | | | | | | | | | | | | | | | | |
Securities Lending Cash Investment LLC | | | 2,797,697 | | | | 92,497,839 | | | | 88,822,345 | | | | 6,473,191 | | | $ | 0 | | | $ | 0 | | | $ | 24,069 | | | $ | 6,473,838 | | | | | |
Wells Fargo Government Money Market Fund Select Class | | | 66,446,091 | | | | 160,021,034 | | | | 159,773,431 | | | | 66,693,694 | | | | 0 | | | | 0 | | | | 368,582 | | | | 66,693,694 | | | | | |
| | | | | | | | | | | | | | | | | | | | | | | | | | | | | | | | | | | | |
| | | | | | | | | | | | | | | | | | $ | 0 | | | $ | 0 | | | $ | 392,651 | | | $ | 73,167,532 | | | | 12.08 | % |
| | | | | | | | | | | | | | | | | | | | | | | | | | | | | | | | | | | | |
The accompanying notes are an integral part of these financial statements.
| | | | |
| 22 | | Wells Fargo Core Plus Bond Fund | | Statement of assets and liabilities—February 28, 2018 (unaudited) |
| | | | |
| | | | |
| |
Assets | | | | |
Investments in unaffiliated securities (including $6,341,640 of securities loaned), at value (cost $589,405,440) | | $ | 588,848,076 | |
Investments in affiliated securities, at value (cost $73,167,469) | | | 73,167,532 | |
Cash | | | 3,322 | |
Segregated cash for forward foreign currency contracts | | | 842,000 | |
Segregated cash for futures transactions | | | 550,566 | |
Foreign currency, at value (cost $158,636) | | | 158,550 | |
Receivable for investments sold | | | 88,514 | |
Principal paydown receivable | | | 2,696 | |
Receivable for Fund shares sold | | | 1,285,771 | |
Receivable for interest | | | 3,715,240 | |
Receivable for daily variation margin on open futures contracts | | | 202,860 | |
Receivable for securities lending income | | | 12,765 | |
Unrealized gains on forward foreign currency contracts | | | 199,747 | |
Prepaid expenses and other assets | | | 287,403 | |
| | | | |
Total assets | | | 669,365,042 | |
| | | | |
| |
Liabilities | | | | |
Payable for investments purchased | | | 54,654,547 | |
Payable upon receipt of securities loaned | | | 6,472,907 | |
Payable for Fund shares redeemed | | | 1,563,037 | |
Unrealized losses on forward foreign currency contracts | | | 368,126 | |
Management fee payable | | | 118,753 | |
Administration fees payable | | | 52,773 | |
Payable for daily variation margin on open futures contracts | | | 26,232 | |
Payable for variation margin on centrally cleared swaps | | | 13,187 | |
Distribution fee payable | | | 12,139 | |
Trustees’ fees and expenses payable | | | 1,953 | |
Accrued expenses and other liabilities | | | 159,314 | |
| | | | |
Total liabilities | | | 63,442,968 | |
| | | | |
Total net assets | | $ | 605,922,074 | |
| | | | |
| |
NET ASSETS CONSIST OF | | | | |
Paid-in capital | | $ | 607,030,626 | |
Undistributed net investment income | | | 2,370,321 | |
Accumulated net realized losses on investments | | | (3,232,744 | ) |
Net unrealized losses on investments | | | (246,129 | ) |
| | | | |
Total net assets | | $ | 605,922,074 | |
| | | | |
| |
COMPUTATION OF NET ASSET VALUE AND OFFERING PRICE PER SHARE | | | | |
Net assets – Class A | | $ | 252,177,292 | |
Shares outstanding – Class A1 | | | 20,362,355 | |
Net asset value per share – Class A | | | $12.38 | |
Maximum offering price per share – Class A2 | | | $12.96 | |
Net assets – Class C | | $ | 21,167,904 | |
Shares outstanding – Class C1 | | | 1,709,829 | |
Net asset value per share – Class C | | | $12.38 | |
Net assets – Class R6 | | $ | 42,566,367 | |
Shares outstanding – Class R61 | | | 3,431,931 | |
Net asset value per share – Class R6 | | | $12.40 | |
Net assets – Administrator Class | | $ | 40,027,958 | |
Shares outstanding – Administrator Class1 | | | 3,237,232 | |
Net asset value per share – Administrator Class | | | $12.36 | |
Net assets – Institutional Class | | $ | 249,982,553 | |
Shares outstanding – Institutional Class1 | | | 20,164,328 | |
Net asset value per share – Institutional Class | | | $12.40 | |
| 1 | The Fund has an unlimited number of authorized shares. |
| 2 | Maximum offering price is computed as 100/95.50 of net asset value. On investments of $50,000 or more, the offering price is reduced. |
The accompanying notes are an integral part of these financial statements.
| | | | | | |
| Statement of operations—six months ended February 28, 2018 (unaudited) | | Wells Fargo Core Plus Bond Fund | | | 23 | |
| | | | |
| | | | |
| |
Investment income | | | | |
Interest (net of foreign interest withholding taxes of $7,340) | | $ | 8,404,726 | |
Income from affiliated securities | | | 392,651 | |
Dividends | | | 64,087 | |
| | | | |
Total investment income | | | 8,861,464 | |
| | | | |
| |
Expenses | | | | |
Management fee | | | 1,230,371 | |
Administration fees | | | | |
Class A | | | 203,041 | |
Class C | | | 15,921 | |
Class R6 | | | 5,075 | |
Administrator Class | | | 19,968 | |
Institutional Class | | | 80,941 | |
Shareholder servicing fees | | | | |
Class A | | | 317,251 | |
Class C | | | 24,876 | |
Administrator Class | | | 49,921 | |
Distribution fee | | | | |
Class C | | | 74,629 | |
Custody and accounting fees | | | 20,225 | |
Professional fees | | | 31,409 | |
Registration fees | | | 45,505 | |
Shareholder report expenses | | | 52,662 | |
Trustees’ fees and expenses | | | 21,188 | |
Other fees and expenses | | | 4,668 | |
| | | | |
Total expenses | | | 2,197,651 | |
Less: Fee waivers and/or expense reimbursements | | | (536,283 | ) |
| | | | |
Net expenses | | | 1,661,368 | |
| | | | |
Net investment income | | | 7,200,096 | |
| | | | |
| |
REALIZED AND UNREALIZED GAINS (LOSSES) ON INVESTMENTS | | | | |
| |
Net realized gains (losses) on: | | | | |
Unaffiliated securities | | | 716,420 | |
Futures transactions | | | (2,350,187 | ) |
Forward foreign currency contract transactions | | | (1,383,476 | ) |
Credit default swap transactions | | | 61,193 | |
| | | | |
Net realized losses on investments | | | (2,956,050 | ) |
| | | | |
| |
Net change in unrealized gains (losses) on: | | | | |
Unaffiliated securities | | | (13,944,086 | ) |
Futures transactions | | | 431,628 | |
Forward foreign currency contract transactions | | | 1,416,256 | |
Credit default swap transactions | | | (2,222 | ) |
| | | | |
Net change in unrealized gains (losses) on investments | | | (12,098,424 | ) |
| | | | |
Net realized and unrealized gains (losses) on investments | | | (15,054,474 | ) |
| | | | |
Net decrease in net assets resulting from operations | | $ | (7,854,378 | ) |
| | | | |
The accompanying notes are an integral part of these financial statements.
| | | | |
| 24 | | Wells Fargo Core Plus Bond Fund | | Statement of changes in net assets |
| | | | | | | | | | | | | | | | |
| | | Six months ended
February 28, 2018
(unaudited) | | | Year ended
August 31, 2017 | |
| | | | |
Operations | | | | | | | | | | | | | | | | |
Net investment income | | | | | | $ | 7,200,096 | | | | | | | $ | 14,822,987 | |
Net realized gains (losses) on investments | | | | | | | (2,956,050 | ) | | | | | | | 4,956,568 | |
Net change in unrealized gains (losses) on investments | | | | | | | (12,098,424 | ) | | | | | | | (6,580,780 | ) |
| | | | |
Net increase (decrease) in net assets resulting from operations | | | | | | | (7,854,378 | ) | | | | | | | 13,198,775 | |
| | | | |
| | | | |
Distributions to shareholders from | | | | | | | | | | | | | | | | |
Net investment income | | | | | | | | | | | | | | | | |
Class A | | | | | | | (3,107,875 | ) | | | | | | | (8,298,601 | ) |
Class B | | | | | | | N/A | | | | | | | | (563 | )1 |
Class C | | | | | | | (170,709 | ) | | | | | | | (354,581 | ) |
Class R6 | | | | | | | (477,869 | ) | | | | | | | (337,520 | )2 |
Administrator Class | | | | | | | (505,541 | ) | | | | | | | (1,459,294 | ) |
Institutional Class | | | | | | | (2,838,818 | ) | | | | | | | (3,111,816 | ) |
Net realized gains | | | | | | | | | | | | | | | | |
Class A | | | | | | | 0 | | | | | | | | (174,322 | ) |
Class C | | | | | | | 0 | | | | | | | | (10,016 | ) |
Class R6 | | | | | | | 0 | | | | | | | | (12 | )2 |
Administrator Class | | | | | | | 0 | | | | | | | | (28,708 | ) |
Institutional Class | | | | | | | 0 | | | | | | | | (41,445 | ) |
| | | | |
Total distributions to shareholders | | | | | | | (7,100,812 | ) | | | | | | | (13,816,878 | ) |
| | | | |
| | | | |
Capital share transactions | | | Shares | | | | | | | | Shares | | | | | |
Proceeds from shares sold | | | | | | | | | | | | | | | | |
Class A | | | 2,178,243 | | | | 27,474,718 | | | | 6,027,974 | | | | 75,386,710 | |
Class C | | | 359,835 | | | | 4,534,954 | | | | 419,941 | | | | 5,278,093 | |
Class R6 | | | 941,279 | | | | 11,817,379 | | | | 2,444,368 | 2 | | | 30,444,742 | 2 |
Administrator Class | | | 580,259 | | | | 7,295,927 | | | | 2,382,823 | | | | 29,615,799 | |
Institutional Class | | | 9,219,197 | | | | 116,272,234 | | | | 10,894,809 | | | | 136,214,194 | |
| | | | |
| | | | | | | 167,395,212 | | | | | | | | 276,939,538 | |
| | | | |
Reinvestment of distributions | | | | | | | | | | | | | | | | |
Class A | | | 228,069 | | | | 2,868,272 | | | | 633,102 | | | | 7,894,693 | |
Class B | | | N/A | | | | N/A | | | | 44 | 1 | | | 550 | 1 |
Class C | | | 12,293 | | | | 154,513 | | | | 22,979 | | | | 286,809 | |
Class R6 | | | 36,098 | | | | 454,833 | | | | 26,775 | 2 | | | 337,532 | 2 |
Administrator Class | | | 40,097 | | | | 503,440 | | | | 119,039 | | | | 1,483,140 | |
Institutional Class | | | 207,267 | | | | 2,607,361 | | | | 232,681 | | | | 2,910,737 | |
| | | | |
| | | | | | | 6,588,419 | | | | | | | | 12,913,461 | |
| | | | |
Payment for shares redeemed | | | | | | | | | | | | | | | | |
Class A | | | (2,159,433 | ) | | | (27,222,759 | ) | | | (14,092,819 | ) | | | (175,455,886 | ) |
Class B | | | N/A | | | | N/A | | | | (10,056 | )1 | | | (124,139 | )1 |
Class C | | | (160,493 | ) | | | (2,018,555 | ) | | | (615,840 | ) | | | (7,673,788 | ) |
Class R6 | | | (16,587 | ) | | | (208,682 | ) | | | (2 | )2 | | | (22 | )2 |
Administrator Class | | | (677,790 | ) | | | (8,540,002 | ) | | | (4,817,096 | ) | | | (59,885,885 | ) |
Institutional Class | | | (2,106,092 | ) | | | (26,463,729 | ) | | | (4,552,266 | ) | | | (56,762,736 | ) |
| | | | |
| | | | | | | (64,453,727 | ) | | | | | | | (299,902,456 | ) |
| | | | |
Net increase (decrease) in net assets resulting from capital share transactions | | | | | | | 109,529,904 | | | | | | | | (10,049,457 | ) |
| | | | |
Total increase (decrease) in net assets | | | | | | | 94,574,714 | | | | | | | | (10,667,560 | ) |
| | | | |
| | | | |
Net assets | | | | | | | | | | | | | | | | |
Beginning of period | | | | | | | 511,347,360 | | | | | | | | 522,014,920 | |
| | | | |
End of period | | | | | | $ | 605,922,074 | | | | | | | $ | 511,347,360 | |
| | | | |
Undistributed net investment income | | | | | | $ | 2,370,321 | | | | | | | $ | 2,271,037 | |
| | | | |
| 1 | For the period from September 1, 2016 to December 5, 2016. Effective at the close of business on December 5, 2016, Class B shares were converted to Class A shares and are no longer offered by the Fund. |
| 2 | For the period from October 31, 2016 (commencement of class operations) to August 31, 2017 |
The accompanying notes are an integral part of these financial statements.
| | | | | | |
| Financial highlights | | Wells Fargo Core Plus Bond Fund | | | 25 | |
(For a share outstanding throughout each period)
| | | | | | | | | | | | | | | | | | | | | | | | |
| | | Six months ended February 28, 2018 (unaudited) | | | Year ended August 31 | |
| CLASS A | | | 2017 | | | 2016 | | | 2015 | | | 2014 | | | 2013 | |
Net asset value, beginning of period | | | $12.71 | | | | $12.70 | | | | $12.14 | | | | $12.24 | | | | $11.66 | | | | $12.57 | |
Net investment income | | | 0.15 | | | | 0.36 | 1 | | | 0.33 | | | | 0.21 | 1 | | | 0.26 | | | | 0.25 | |
Net realized and unrealized gains (losses) on investments | | | (0.33 | ) | | | (0.01 | ) | | | 0.60 | | | | (0.08 | ) | | | 0.57 | | | | (0.51 | ) |
| | | | | | | | | | | | | | | | | | | | | | | | |
Total from investment operations | | | (0.18 | ) | | | 0.35 | | | | 0.93 | | | | 0.13 | | | | 0.83 | | | | (0.26 | ) |
Distributions to shareholders from | | | | | | | | | | | | | | | | | | | | | | | | |
Net investment income | | | (0.15 | ) | | | (0.33 | ) | | | (0.33 | ) | | | (0.21 | ) | | | (0.25 | ) | | | (0.25 | ) |
Net realized gains | | | 0.00 | | | | (0.01 | ) | | | (0.04 | ) | | | (0.02 | ) | | | 0.00 | | | | (0.40 | ) |
| | | | | | | | | | | | | | | | | | | | | | | | |
Total distributions to shareholders | | | (0.15 | ) | | | (0.34 | ) | | | (0.37 | ) | | | (0.23 | ) | | | (0.25 | ) | | | (0.65 | ) |
Net asset value, end of period | | | $12.38 | | | | $12.71 | | | | $12.70 | | | | $12.14 | | | | $12.24 | | | | $11.66 | |
Total return2 | | | (1.41 | )% | | | 2.78 | % | | | 7.78 | % | | | 1.04 | % | | | 7.16 | % | | | (2.25 | )% |
Ratios to average net assets (annualized) | | | | | | | | | | | | | | | | | | | | | | | | |
Gross expenses | | | 0.92 | % | | | 0.93 | % | | | 0.93 | % | | | 0.91 | % | | | 0.93 | % | | | 0.91 | % |
Net expenses | | | 0.73 | % | | | 0.76 | % | | | 0.84 | % | | | 0.84 | % | | | 0.85 | % | | | 0.87 | % |
Net investment income | | | 2.49 | % | | | 2.88 | % | | | 2.76 | % | | | 1.69 | % | | | 2.10 | % | | | 2.00 | % |
Supplemental data | | | | | | | | | | | | | | | | | | | | | | | | |
Portfolio turnover rate | | | 85 | % | | | 199 | % | | | 288 | % | | | 322 | % | | | 267 | % | | | 256 | % |
Net assets, end of period (000s omitted) | | | $252,177 | | | | $255,668 | | | | $349,852 | | | | $223,755 | | | | $129,646 | | | | $146,836 | |
| 1 | Calculated based upon average shares outstanding |
| 2 | Total return calculations do not include any sales charges. Returns for periods of less than one year are not annualized. |
The accompanying notes are an integral part of these financial statements.
| | | | |
| 26 | | Wells Fargo Core Plus Bond Fund | | Financial highlights |
(For a share outstanding throughout each period)
| | | | | | | | | | | | | | | | | | | | | | | | |
| | | Six months ended February 28, 2018 (unaudited) | | | Year ended August 31 | |
| CLASS C | | | 2017 | | | 2016 | | | 2015 | | | 2014 | | | 2013 | |
Net asset value, beginning of period | | | $12.71 | | | | $12.70 | | | | $12.14 | | | | $12.23 | | | | $11.65 | | | | $12.56 | |
Net investment income | | | 0.10 | | | | 0.26 | | | | 0.24 | 1 | | | 0.12 | 1 | | | 0.16 | | | | 0.15 | |
Net realized and unrealized gains (losses) on investments | | | (0.32 | ) | | | (0.01 | ) | | | 0.59 | | | | (0.08 | ) | | | 0.58 | | | | (0.51 | ) |
| | | | | | | | | | | | | | | | | | | | | | | | |
Total from investment operations | | | (0.22 | ) | | | 0.25 | | | | 0.83 | | | | 0.04 | | | | 0.74 | | | | (0.36 | ) |
Distributions to shareholders from | | | | | | | | | | | | | | | | | | | | | | | | |
Net investment income | | | (0.11 | ) | | | (0.23 | ) | | | (0.23 | ) | | | (0.11 | ) | | | (0.16 | ) | | | (0.15 | ) |
Net realized gains | | | 0.00 | | | | (0.01 | ) | | | (0.04 | ) | | | (0.02 | ) | | | 0.00 | | | | (0.40 | ) |
| | | | | | | | | | | | | | | | | | | | | | | | |
Total distributions to shareholders | | | (0.11 | ) | | | (0.24 | ) | | | (0.27 | ) | | | (0.13 | ) | | | (0.16 | ) | | | (0.55 | ) |
Net asset value, end of period | | | $12.38 | | | | $12.71 | | | | $12.70 | | | | $12.14 | | | | $12.23 | | | | $11.65 | |
Total return2 | | | (1.69 | )% | | | 2.01 | % | | | 6.99 | % | | | 0.35 | % | | | 6.35 | % | | | (3.00 | )% |
Ratios to average net assets (annualized) | | | | | | | | | | | | | | | | | | | | | | | | |
Gross expenses | | | 1.67 | % | | | 1.68 | % | | | 1.68 | % | | | 1.66 | % | | | 1.68 | % | | | 1.66 | % |
Net expenses | | | 1.48 | % | | | 1.51 | % | | | 1.59 | % | | | 1.59 | % | | | 1.60 | % | | | 1.62 | % |
Net investment income | | | 1.74 | % | | | 2.12 | % | | | 2.00 | % | | | 0.95 | % | | | 1.35 | % | | | 1.24 | % |
Supplemental data | | | | | | | | | | | | | | | | | | | | | | | | |
Portfolio turnover rate | | | 85 | % | | | 199 | % | | | 288 | % | | | 322 | % | | | 267 | % | | | 256 | % |
Net assets, end of period (000s omitted) | | | $21,168 | | | | $19,036 | | | | $21,216 | | | | $20,381 | | | | $24,212 | | | | $29,692 | |
| 1 | Calculated based upon average shares outstanding |
| 2 | Total return calculations do not include any sales charges. Returns for periods of less than one year are not annualized. |
The accompanying notes are an integral part of these financial statements.
| | | | | | |
| Financial highlights | | Wells Fargo Core Plus Bond Fund | | | 27 | |
(For a share outstanding throughout the period)
| | | | | | | | |
| CLASS R6 | | Six months ended February 28, 2018
(unaudited) | | | Year ended
August 31, 20171 | |
Net asset value, beginning of period | | | $12.73 | | | | $12.59 | |
Net investment income | | | 0.19 | | | | 0.33 | 2 |
Net realized and unrealized gains (losses) on investments | | | (0.34 | ) | | | 0.12 | |
| | | | | | | | |
Total from investment operations | | | (0.15 | ) | | | 0.45 | |
Distributions to shareholders from | | | | | | | | |
Net investment income | | | (0.18 | ) | | | (0.30 | ) |
Net realized gains | | | 0.00 | | | | (0.01 | ) |
| | | | | | | | |
Total distributions to shareholders | | | (0.18 | ) | | | (0.31 | ) |
Net asset value, end of period | | | $12.40 | | | | $12.73 | |
Total return3 | | | (1.23 | )% | | | 3.64 | % |
Ratios to average net assets (annualized) | | | | | | | | |
Gross expenses | | | 0.54 | % | | | 0.55 | % |
Net expenses | | | 0.35 | % | | | 0.35 | % |
Net investment income | | | 2.88 | % | | | 3.12 | % |
Supplemental data | | | | | | | | |
Portfolio turnover rate | | | 85 | % | | | 199 | % |
Net assets, end of period (000s omitted) | | | $42,566 | | | | $31,451 | |
| 1 | For the period from October 31, 2016 (commencement of class operations) to August 31, 2017 |
| 2 | Calculated based upon average shares outstanding |
| 3 | Returns for periods of less than one year are not annualized. |
The accompanying notes are an integral part of these financial statements.
| | | | |
| 28 | | Wells Fargo Core Plus Bond Fund | | Financial highlights |
(For a share outstanding throughout each period)
| | | | | | | | | | | | | | | | | | | | | | | | |
| | | Six months ended February 28, 2018 (unaudited) | | | Year ended August 31 | |
| ADMINISTRATOR CLASS | | | 2017 | | | 2016 | | | 2015 | | | 2014 | | | 2013 | |
Net asset value, beginning of period | | | $12.69 | | | | $12.68 | | | | $12.12 | | | | $12.22 | | | | $11.64 | | | | $12.55 | |
Net investment income | | | 0.16 | | | | 0.37 | | | | 0.34 | | | | 0.22 | | | | 0.27 | 1 | | | 0.26 | 1 |
Net realized and unrealized gains (losses) on investments | | | (0.33 | ) | | | (0.01 | ) | | | 0.60 | | | | (0.08 | ) | | | 0.57 | | | | (0.51 | ) |
| | | | | | | | | | | | | | | | | | | | | | | | |
Total from investment operations | | | (0.17 | ) | | | 0.36 | | | | 0.94 | | | | 0.14 | | | | 0.84 | | | | (0.25 | ) |
Distributions to shareholders from | | | | | | | | | | | | | | | | | | | | | | | | |
Net investment income | | | (0.16 | ) | | | (0.34 | ) | | | (0.34 | ) | | | (0.22 | ) | | | (0.26 | ) | | | (0.26 | ) |
Net realized gains | | | 0.00 | | | | (0.01 | ) | | | (0.04 | ) | | | (0.02 | ) | | | 0.00 | | | | (0.40 | ) |
| | | | | | | | | | | | | | | | | | | | | | | | |
Total distributions to shareholders | | | (0.16 | ) | | | (0.35 | ) | | | (0.38 | ) | | | (0.24 | ) | | | (0.26 | ) | | | (0.66 | ) |
Net asset value, end of period | | | $12.36 | | | | $12.69 | | | | $12.68 | | | | $12.12 | | | | $12.22 | | | | $11.64 | |
Total return2 | | | (1.36 | )% | | | 2.90 | % | | | 7.92 | % | | | 1.15 | % | | | 7.31 | % | | | (2.11 | )% |
Ratios to average net assets (annualized) | | | | | | | | | | | | | | | | | | | | | | | | |
Gross expenses | | | 0.86 | % | | | 0.87 | % | | | 0.87 | % | | | 0.85 | % | | | 0.87 | % | | | 0.85 | % |
Net expenses | | | 0.62 | % | | | 0.66 | % | | | 0.72 | % | | | 0.72 | % | | | 0.72 | % | | | 0.72 | % |
Net investment income | | | 2.60 | % | | | 2.97 | % | | | 2.84 | % | | | 1.82 | % | | | 2.24 | % | | | 2.14 | % |
Supplemental data | | | | | | | | | | | | | | | | | | | | | | | | |
Portfolio turnover rate | | | 85 | % | | | 199 | % | | | 288 | % | | | 322 | % | | | 267 | % | | | 256 | % |
Net assets, end of period (000s omitted) | | | $40,028 | | | | $41,806 | | | | $71,133 | | | | $85,431 | | | | $101,653 | | | | $105,094 | |
| 1 | Calculated based upon average shares outstanding |
| 2 | Returns for periods of less than one year are not annualized. |
The accompanying notes are an integral part of these financial statements.
| | | | | | |
| Financial highlights | | Wells Fargo Core Plus Bond Fund | | | 29 | |
(For a share outstanding throughout each period)
| | | | | | | | | | | | | | | | | | | | | | | | |
| | | Six months ended February 28, 2018 (unaudited) | | | Year ended August 31 | |
| INSTITUTIONAL CLASS | | | 2017 | | | 2016 | | | 2015 | | | 2014 | | | 2013 | |
Net asset value, beginning of period | | | $12.72 | | | | $12.71 | | | | $12.15 | | | | $12.24 | | | | $11.67 | | | | $12.57 | |
Net investment income | | | 0.18 | 1 | | | 0.38 | | | | 0.36 | | | | 0.24 | 1 | | | 0.28 | | | | 0.27 | 1 |
Net realized and unrealized gains (losses) on investments | | | (0.33 | ) | | | 0.01 | | | | 0.60 | | | | (0.07 | ) | | | 0.57 | | | | (0.49 | ) |
| | | | | | | | | | | | | | | | | | | | | | | | |
Total from investment operations | | | (0.15 | ) | | | 0.39 | | | | 0.96 | | | | 0.17 | | | | 0.85 | | | | (0.22 | ) |
Distributions to shareholders from | | | | | | | | | | | | | | | | | | | | | | | | |
Net investment income | | | (0.17 | ) | | | (0.37 | ) | | | (0.36 | ) | | | (0.24 | ) | | | (0.28 | ) | | | (0.28 | ) |
Net realized gains | | | 0.00 | | | | (0.01 | ) | | | (0.04 | ) | | | (0.02 | ) | | | 0.00 | | | | (0.40 | ) |
| | | | | | | | | | | | | | | | | | | | | | | | |
Total distributions to shareholders | | | (0.17 | ) | | | (0.38 | ) | | | (0.40 | ) | | | (0.26 | ) | | | (0.28 | ) | | | (0.68 | ) |
Net asset value, end of period | | | $12.40 | | | | $12.72 | | | | $12.71 | | | | $12.15 | | | | $12.24 | | | | $11.67 | |
Total return2 | | | (1.18 | )% | | | 3.10 | % | | | 8.05 | % | | | 1.37 | % | | | 7.36 | % | | | (1.89 | )% |
Ratios to average net assets (annualized) | | | | | | | | | | | | | | | | | | | | | | | | |
Gross expenses | | | 0.59 | % | | | 0.60 | % | | | 0.60 | % | | | 0.58 | % | | | 0.60 | % | | | 0.56 | % |
Net expenses | | | 0.40 | % | | | 0.44 | % | | | 0.58 | % | | | 0.58 | % | | | 0.58 | % | | | 0.56 | % |
Net investment income | | | 2.83 | % | | | 3.17 | % | | | 3.04 | % | | | 1.95 | % | | | 2.38 | % | | | 2.26 | % |
Supplemental data | | | | | | | | | | | | | | | | | | | | | | | | |
Portfolio turnover rate | | | 85 | % | | | 199 | % | | | 288 | % | | | 322 | % | | | 267 | % | | | 256 | % |
Net assets, end of period (000s omitted) | | | $249,983 | | | | $163,387 | | | | $79,687 | | | | $54,419 | | | | $32,438 | | | | $31,221 | |
| 1 | Calculated based upon average shares outstanding |
| 2 | Returns for periods of less than one year are not annualized. |
The accompanying notes are an integral part of these financial statements.
| | | | |
| 30 | | Wells Fargo Core Plus Bond Fund | | Notes to financial statements (unaudited) |
1. ORGANIZATION
Wells Fargo Funds Trust (the “Trust”), a Delaware statutory trust organized on March 10, 1999, is an open-end management investment company registered under the Investment Company Act of 1940, as amended (the “1940 Act”). As an investment company, the Trust follows the accounting and reporting guidance in Financial Accounting Standards Board Accounting Standards Codification Topic 946, Financial Services – Investment Companies. These financial statements report on the Wells Fargo Core Plus Bond Fund (the “Fund”) which is a diversified series of the Trust.
Effective at the close of business on December 5, 2016, Class B shares were converted to Class A shares and are no longer offered by the Fund. Information for Class B shares reflected in the financial statements represents activity through December 5, 2016.
2. SIGNIFICANT ACCOUNTING POLICIES
The following significant accounting policies, which are consistently followed in the preparation of the financial statements of the Fund, are in conformity with U.S. generally accepted accounting principles which require management to make estimates and assumptions that affect the reported amounts of assets and liabilities, disclosure of contingent assets and liabilities at the date of the financial statements, and the reported amounts of revenues and expenses during the reporting period. Actual results could differ from those estimates.
Securities valuation
All investments are valued each business day as of the close of regular trading on the New York Stock Exchange (generally 4 p.m. Eastern Time), although the Fund may deviate from this calculation time under unusual or unexpected circumstances.
Debt securities are valued at the evaluated bid price provided by an independent pricing service or, if a reliable price is not available, the quoted bid price from an independent broker-dealer.
Equity securities and futures that are listed on a foreign or domestic exchange or market are valued at the official closing price or, if none, the last sales price. If no sale occurs on the principal exchange or market that day, a fair value price will be determined in accordance with the Fund’s Valuation Procedures.
Swaps are valued at the evaluated price provided by an independent pricing service or, if a reliable price is not available, the quoted bid price from an independent broker-dealer.
The values of securities denominated in foreign currencies are translated into U.S. dollars at rates provided by an independent foreign currency pricing source at a time each business day specified by the Wells Fargo Asset Management Pricing Committee at Wells Fargo Funds Management, LLC (“Funds Management”).
Investments in registered open-end investment companies are valued at net asset value. Interests in non-registered investment companies that are redeemable at net asset value are fair valued normally at net asset value.
Investments which are not valued using any of the methods discussed above are valued at their fair value, as determined in good faith by the Board of Trustees of the Fund. The Board of Trustees has established a Valuation Committee comprised of the Trustees and has delegated to it the authority to take any actions regarding the valuation of portfolio securities that the Valuation Committee deems necessary or appropriate, including determining the fair value of portfolio securities, unless the determination has been delegated to the Wells Fargo Asset Management Pricing Committee. The Board of Trustees retains the authority to make or ratify any valuation decisions or approve any changes to the Valuation Procedures as it deems appropriate. On a quarterly basis, the Board of Trustees receives reports on any valuation actions taken by the Valuation Committee or the Wells Fargo Asset Management Pricing Committee which may include items for ratification.
Valuations of fair valued securities are compared to the next actual sales price when available, or other appropriate market values, to assess the continued appropriateness of the fair valuation methodologies used. These securities are fair valued on a day-to-day basis, taking into consideration changes to appropriate market information and any significant changes to the inputs considered in the valuation process until there is a readily available price provided on an exchange or by an independent pricing service. Valuations received from an independent pricing service or independent broker-dealer quotes are periodically validated by comparisons to most recent trades and valuations provided by other independent pricing services in addition to the review of prices by the manager and/or subadviser. Unobservable inputs used in determining fair valuations are identified based on the type of security, taking into consideration factors utilized by market participants in valuing the investment, knowledge about the issuer and the current market environment.
| | | | | | |
| Notes to financial statements (unaudited) | | Wells Fargo Core Plus Bond Fund | | | 31 | |
Foreign currency translation
The accounting records of the Fund are maintained in U.S. dollars. The values of other assets and liabilities denominated in foreign currencies are translated into U.S. dollars at rates provided by an independent foreign currency pricing source at a time each business day specified by the Wells Fargo Asset Management Pricing Committee. Purchases and sales of securities, and income and expenses are converted at the rate of exchange on the respective dates of such transactions. Net realized foreign exchange gains or losses arise from sales of foreign currencies, currency gains or losses realized between the trade and settlement dates on securities transactions, and the difference between the amounts of dividends, interest and foreign withholding taxes recorded and the U.S. dollar equivalent of the amounts actually paid or received. Net unrealized foreign exchange gains and losses arise from changes in the fair value of assets and liabilities other than investments in securities resulting from changes in exchange rates. The changes in net assets arising from changes in exchange rates of securities and the changes in net assets resulting from changes in market prices of securities are not separately presented. Such changes are included in net realized and unrealized gains or losses on unaffiliated securities.
Forward foreign currency contracts
The Fund is subject to foreign currency risk in the normal course of pursuing its investment objectives. A forward foreign currency contract is an agreement between two parties to purchase or sell a specific currency for an agreed-upon price at a future date. The Fund enters into forward foreign currency contracts to facilitate transactions in foreign-denominated securities and to attempt to minimize the risk to the Fund from adverse changes in the relationship between currencies. Forward foreign currency contracts are recorded at the forward rate and marked-to-market daily. When the contracts are closed, realized gains and losses arising from such transactions are recorded as realized gains or losses on forward foreign currency contract transactions. The Fund could be exposed to risks if the counterparties to the contracts are unable to meet the terms of their contracts or if the value of the foreign currency changes unfavorably. The Fund’s maximum risk of loss from counterparty credit risk is the unrealized gains on the contracts. This risk may be mitigated if there is a master netting arrangement between the Fund and the counterparty.
Securities lending
The Fund may lend its securities from time to time in order to earn additional income in the form of fees or interest on securities received as collateral or the investment of any cash received as collateral. The Fund continues to receive interest or dividends on the securities loaned. The Fund receives collateral in the form of cash or securities with a value at least equal to the value of the securities on loan. The value of the loaned securities is determined at the close of each business day and any additional required collateral is delivered to the Fund on the next business day. In a securities lending transaction, the net asset value of the Fund will be affected by an increase or decrease in the value of the securities loaned and by an increase or decrease in the value of the instrument in which collateral is invested. The amount of securities lending activity undertaken by the Fund fluctuates from time to time. In the event of default or bankruptcy by the borrower, the Fund may be prevented from recovering the loaned securities or gaining access to the collateral or may experience delays or costs in doing so. In addition, the investment of any cash collateral received may lose all or part of its value. The Fund has the right under the lending agreement to recover the securities from the borrower on demand.
The Fund lends its securities through an unaffiliated securities lending agent. Cash collateral received in connection with its securities lending transactions is invested in Securities Lending Cash Investments, LLC (the “Securities Lending Fund”). The Securities Lending Fund is exempt from registration under Section 3(c)(7) of the 1940 Act and is managed by Funds Management and is subadvised by Wells Capital Management Incorporated (“WellsCap”), an affiliate of Funds Management and an indirect wholly owned subsidiary of Wells Fargo & Company (“Wells Fargo”). Funds Management receives an advisory fee starting at 0.05% and declining to 0.01% as the average daily net assets of the Securities Lending Fund increase. All of the fees received by Funds Management are paid to WellsCap for its services as subadviser. The Securities Lending Fund seeks to provide a positive return compared to the daily Fed Funds Open Rate by investing in high-quality, U.S. dollar-denominated short-term money market instruments. Securities Lending Fund investments are valued at the evaluated bid price provided by an independent pricing service. Income earned from investment in the Securities Lending Fund, if any, is included in income from affiliated securities on the Statement of Operations.
When-issued transactions
The Fund may purchase securities on a forward commitment or when-issued basis. The Fund records a when-issued transaction on the trade date and will segregate assets in an amount at least equal in value to the Fund’s commitment to purchase when-issued securities. Securities purchased on a when-issued basis are marked-to-market daily and the Fund begins earning interest on the settlement date. Losses may arise due to changes in the market value of the underlying securities or if the counterparty does not perform under the contract.
| | | | |
| 32 | | Wells Fargo Core Plus Bond Fund | | Notes to financial statements (unaudited) |
Loans
The Fund may invest in direct debt instruments which are interests in amounts owed to lenders by corporate or other borrowers. The loans pay interest at rates which are periodically reset by reference to a base lending rate plus a spread. Investments in loans may be in the form of participations in loans or assignments of all or a portion of loans from third parties. When the Fund purchases participations, it generally has no rights to enforce compliance with terms of the loan agreement with the borrower. As a result, the Fund assumes the credit risk of both the borrower and the lender that is selling the participation. When the Fund purchases assignments from lenders, it acquires direct rights against the borrower on the loan and may enforce compliance by the borrower with the terms of the loan agreement. Loans may include fully funded term loans or unfunded loan commitments, which are contractual obligations for future funding.
Futures contracts
The Fund is subject to interest rate risk and foreign currency risk in the normal course of pursuing its investment objectives. The Fund may buy and sell futures contracts in order to gain exposure to, or protect against, changes in interest rates and foreign exchange rates. The primary risks associated with the use of futures contracts are the imperfect correlation between changes in market values of securities held by the Fund and the prices of futures contracts, and the possibility of an illiquid market.
The aggregate principal amounts of the contracts are not recorded in the financial statements. Fluctuations in the value of the contracts are recorded in the Statement of Assets and Liabilities as an asset or liability and in the Statement of Operations as unrealized gains or losses until the contracts are closed, at which point they are recorded as net realized gains or losses on futures contracts. With futures contracts, there is minimal counterparty risk to the Fund since futures are exchange traded and the exchange’s clearinghouse, as counterparty to all exchange traded futures, guarantees the futures against default.
Credit default swaps
The Fund is subject to credit risk in the normal course of pursuing its investment objectives. The Fund may enter into credit default swap contracts for hedging or speculative purposes to provide or receive a measure of protection against default on a referenced entity, obligation or index or for investment gains. Credit default swaps involve an exchange of a stream of payments for protection against the loss in value of an underlying security or index. Under the terms of the swap, one party acts as a guarantor (referred to as the seller of protection) and receives a periodic stream of payments, provided that there is no credit event, from another party (referred to as the buyer of protection) that is a fixed percentage applied to a notional principal amount over the term of the swap. An index credit default swap references all the names in the index, and if a credit event is triggered, the credit event is settled based on that name’s weight in the index. A credit event includes bankruptcy, failure to pay, obligation default, obligation acceleration, repudiation/moratorium, and restructuring. The Fund may enter into credit default swaps as either the seller of protection or the buyer of protection. As the seller of protection, the Fund is subject to investment exposure on the notional amount of the swap and has assumed the risk of default of the underlying security or index. As the buyer of protection, the Fund could be exposed to risks if the seller of the protection defaults on its obligation to perform, or if there are unfavorable changes in the fluctuation of interest rates. The maximum potential amount of future payments (undiscounted) that the Fund as the seller of protection could be required to make under the credit default swap contract would be an amount equal to the notional amount of the swap contract. The Fund’s maximum risk of loss from counterparty risk, either as the protection seller or as the protection buyer, is the fair value of the contract. This risk is mitigated by having a master netting arrangement between the Fund and the counterparty and by having the counterparty post collateral to cover the Fund’s exposure to the counterparty.
If the Fund is the seller of protection and a credit event occurs, as defined under the terms of that particular swap agreement, the Fund will pay to the buyer of protection the notional amount of the swap and take delivery of the referenced obligation or underlying securities comprising the referenced index. If the Fund is the buyer of protection and a credit event occurs, as defined under the terms of that particular swap agreement, the Fund will receive from the seller of protection the notional amount of the swap and deliver the referenced obligation or underlying securities comprising the referenced index.
Any premiums paid or received on the transactions are recorded as an asset or liability on the Statement of Assets and Liabilities and amortized. The value of the swap contract is marked-to-market daily based on quotations from an independent pricing service or an independent broker-dealer and any change in value is recorded as an unrealized gain or loss. Periodic payments made or received are recorded as realized gains or losses. In addition, payments received or made as a result of a credit event or termination of the contract are recognized as realized gains or losses.
| | | | | | |
| Notes to financial statements (unaudited) | | Wells Fargo Core Plus Bond Fund | | | 33 | |
Certain credit default swap contracts entered into by the Fund provide for conditions that result in events of default or termination that enable the counterparty to the agreement to cause an early termination of the transactions under those agreements.
Security transactions and income recognition
Securities transactions are recorded on a trade date basis. Realized gains or losses are recorded on the basis of identified cost.
Interest income is accrued daily and bond discounts are accreted and premiums are amortized daily. To the extent debt obligations are placed on non-accrual status, any related interest income may be reduced by writing off interest receivables when the collection of all or a portion of interest has been determined to be doubtful based on consistently applied procedures and the fair value has decreased. If the issuer subsequently resumes interest payments or when the collectability of interest is reasonably assured, the debt obligation is removed from non-accrual status. Income from foreign securities is recorded net of foreign taxes withheld where recovery of such taxes is not assured.
Dividend income is recognized on the ex-dividend date.
Distributions to shareholders
Distributions to shareholders are recorded on the ex-dividend date and paid from net investment income monthly and any net realized gains are paid at least annually. Such distributions are determined in accordance with income tax regulations and may differ from U.S. generally accepted accounting principles. Dividend sources are estimated at the time of declaration. The tax character of distributions is determined as of the Fund’s fiscal year end. Therefore, a portion of the Fund’s distributions made prior to the Fund’s fiscal year end may be categorized as a tax return of capital at year end.
Federal and other taxes
Distributions to shareholders are recorded on the ex-dividend date and paid from net investment income monthly and any net realized gains are paid at least annually. Such distributions are determined in accordance with income tax regulations and may differ from U.S. generally accepted accounting principles. Dividend sources are estimated at the time of declaration. The tax character of distributions is determined as of the Fund’s fiscal year end. Therefore, a portion of the Fund’s distributions made prior to the Fund’s fiscal year end may be categorized as a tax return of capital at year end.
The Fund’s income and federal excise tax returns and all financial records supporting those returns for the prior three fiscal years are subject to examination by the federal and Delaware revenue authorities. Management has analyzed the Fund’s tax positions taken on federal, state, and foreign tax returns for all open tax years and does not believe that there are any uncertain tax positions that require recognition of a tax liability.
As of February 28, 2018, the aggregate cost of all investments for federal income tax purposes was $661,091,073 and the unrealized gains (losses) consisted of:
| | | | |
Gross unrealized gains | | $ | 9,673,620 | |
Gross unrealized losses | | | (8,428,918 | ) |
Net unrealized gains | | $ | 1,244,702 | |
Class allocations
The separate classes of shares offered by the Fund differ principally in applicable sales charges, distribution, shareholder servicing, and administration fees. Class specific expenses are charged directly to that share class. Investment income, common expenses, and realized and unrealized gains (losses) on investments are allocated daily to each class of shares based on the relative proportion of net assets of each class.
3. FAIR VALUATION MEASUREMENTS
Fair value measurements of investments are determined within a framework that has established a fair value hierarchy based upon the various data inputs utilized in determining the value of the Fund’s investments. The three-level hierarchy gives the highest priority to unadjusted quoted prices in active markets for identical assets or liabilities (Level 1) and the lowest priority to unobservable inputs (Level 3). The Fund’s investments are classified within the fair value hierarchy based on the lowest level of input that is significant to the fair value measurement. The inputs are summarized into three broad levels as follows:
| | | | |
| 34 | | Wells Fargo Core Plus Bond Fund | | Notes to financial statements (unaudited) |
| ∎ | | Level 1 – quoted prices in active markets for identical securities |
| ∎ | | Level 2 – other significant observable inputs (including quoted prices for similar securities, interest rates, prepayment speeds, credit risk, etc.) |
| ∎ | | Level 3 – significant unobservable inputs (including the Fund’s own assumptions in determining the fair value of investments) |
The inputs or methodologies used for valuing investments in securities are not necessarily an indication of the risk associated with investing in those securities.
The following is a summary of the inputs used in valuing the Fund’s assets and liabilities as of February 28, 2018:
| | | | | | | | | | | | | | | | |
| | | Quoted prices
(Level 1) | | | Other significant
observable inputs
(Level 2) | | | Significant
unobservable inputs (Level 3) | | | Total | |
Assets | | | | | | | | | | | | | | | | |
Investments in: | | | | | | | | | | | | | | | | |
| | | | |
Agency securities | | $ | 0 | | | $ | 153,731,054 | | | $ | 0 | | | $ | 153,731,054 | |
| | | | |
Asset-backed securities | | | 0 | | | | 35,987,785 | | | | 0 | | | | 35,987,785 | |
| | | | |
Corporate bonds and notes | | | 0 | | | | 109,479,946 | | | | 0 | | | | 109,479,946 | |
| | | | |
Exchange-traded funds | | | 11,977,135 | | | | 0 | | | | 0 | | | | 11,977,135 | |
| | | | |
Foreign corporate bonds and notes | | | 0 | | | | 17,008,272 | | | | 0 | | | | 17,008,272 | |
| | | | |
Foreign government bonds | | | 0 | | | | 7,130,386 | | | | 0 | | | | 7,130,386 | |
| | | | |
Loans | | | 0 | | | | 23,494,550 | | | | 2,135,188 | | | | 25,629,738 | |
| | | | |
Municipal obligations | | | 0 | | | | 32,086,065 | | | | 0 | | | | 32,086,065 | |
| | | | |
Non-agency mortgage-backed securities | | | 0 | | | | 43,827,036 | | | | 0 | | | | 43,827,036 | |
| | | | |
U.S. Treasury securities | | | 65,781,591 | | | | 0 | | | | 0 | | | | 65,781,591 | |
| | | | |
Yankee corporate bonds and notes | | | 0 | | | | 56,543,698 | | | | 0 | | | | 56,543,698 | |
| | | | |
Yankee government bonds | | | | | | | 23,386,779 | | | | | | | | 23,386,779 | |
| | | | |
Short-term investments | | | | | | | | | | | | | | | | |
Commercial paper | | | 0 | | | | 4,199,755 | | | | 0 | | | | 4,199,755 | |
Investment companies | | | 66,693,694 | | | | 0 | | | | 0 | | | | 66,693,694 | |
U.S. Treasury securities | | | 2,078,836 | | | | 0 | | | | 0 | | | | 2,078,836 | |
Investments measured at net asset value* | | | | | | | | | | | | | | | 6,473,838 | |
| | | 146,531,256 | | | | 506,875,326 | | | | 2,135,188 | | | | 662,015,608 | |
Credit default swap contracts | | | 0 | | | | 15,696 | | | | 0 | | | | 15,696 | |
Forward foreign currency contracts | | | 0 | | | | 199,747 | | | | 0 | | | | 199,747 | |
Futures contracts | | | 501,275 | | | | 0 | | | | 0 | | | | 501,275 | |
Total assets | | $ | 147,032,531 | | | $ | 507,090,769 | | | $ | 2,135,188 | | | $ | 662,732,326 | |
Liabilities | | | | | | | | | | | | | | | | |
Forward foreign currency contracts | | $ | 0 | | | $ | 368,126 | | | $ | 0 | | | $ | 368,126 | |
Futures contracts | | | 28,425 | | | | 0 | | | | 0 | | | | 28,425 | |
Total liabilities | | $ | 28,425 | | | $ | 368,126 | | | $ | 0 | | | $ | 396,551 | |
| * | Investments that are measured at fair value using the net asset value per share (or its equivalent) as a practical expedient have not been categorized in the fair value hierarchy. The fair value amount presented in the table is intended to permit reconciliation of the fair value hierarchy to the amounts presented in the Statement of Assets and Liabilities. The Fund’s investment in Securities Lending Cash Investments, LLC valued at $6,473,838 does not have a redemption period notice, can be redeemed daily and does not have any unfunded commitments. |
Forward foreign currency contracts, futures contracts and swap contracts are reported at their cumulative unrealized gains (losses) at measurement date. For futures contracts and centrally cleared swaps, the current day’s variation margin are reported on the Statement of assets and liabilities. All other assets and liabilities are reported at their market value at measurement date.
| | | | | | |
| Notes to financial statements (unaudited) | | Wells Fargo Core Plus Bond Fund | | | 35 | |
The Fund recognizes transfers between levels within the fair value hierarchy at the end of the reporting period. At February 28, 2018, the Fund did not have any transfers into/out of Level 1. The Fund had no material transfers between Level 2 and Level 3.
4. TRANSACTIONS WITH AFFILIATES
Management fee
Funds Management, an indirect wholly owned subsidiary of Wells Fargo, is the manager of the Fund and provides advisory and fund-level administrative services under an investment management agreement. Under the investment management agreement, Funds Management is responsible for, among other services, implementing the investment objectives and strategies of the Fund, supervising the subadviser, providing fund-level administrative services in connection with the Fund’s operations, and providing any other fund-level administrative services reasonably necessary for the operation of the Fund. As compensation for its services under the investment management agreement, Funds Management is entitled to receive an annual management fee starting at 0.45% and declining to 0.32% as the average daily net assets of the Fund increase. Prior to January 1, 2018, Funds Management was entitled to receive an annual management fee which started at 0.45% and declined to 0.33% as the average daily net assets of the Fund increased. For the six months ended February 28, 2018, the management fee was equivalent to an annual rate of 0.45% of the Fund’s average daily net assets.
Funds Management has retained the services of a subadviser to provide daily portfolio management to the Fund. The fee for subadvisory services is borne by Funds Management. WellsCap is the subadviser to the Fund and is entitled to receive a fee from Funds Management at an annual rate starting at 0.20% and declining to 0.10% as the average daily net assets of the Fund increase.
Administration fees
Under a class-level administration agreement, Funds Management provides class-level administrative services to the Fund, which includes paying fees and expenses for services provided by the transfer agent, sub-transfer agents, omnibus account servicers and record-keepers. As compensation for its services under the class-level administration agreement, Funds Management receives an annual fee which is calculated based on the average daily net assets of each class as follows:
| | | | |
| | | Class-level
administration fee | |
Class A, Class C | | | 0.16 | % |
Class R6 | | | 0.03 | |
Administrator Class | | | 0.10 | |
Institutional Class | | | 0.08 | |
Funds Management has contractually waived and/or reimbursed management and administration fees to the extent necessary to maintain certain net operating expense ratios for the Fund. Waiver of fees and/or reimbursement of expenses by Funds Management were made first from fund level expenses on a proportionate basis and then from class specific expenses. Funds Management has committed through December 31, 2018 to waive fees and/or reimburse expenses to the extent necessary to cap the Fund’s expenses at 0.73% for Class A shares, 1.48% for Class C shares, 0.35% for Class R6 shares, 0.62% for Administrator Class shares, and 0.40% for Institutional Class shares. After this time, the cap may be increased or the commitment to maintain the cap may be terminated only with the approval of the Board of Trustees.
Distribution fee
The Trust has adopted a distribution plan for Class C shares of the Fund pursuant to Rule 12b-1 under the 1940 Act. A distribution fee is charged to Class C shares and paid to Wells Fargo Funds Distributor, LLC (“Funds Distributor”), the principal underwriter, at an annual rate of 0.75% of the average daily net assets of Class C shares.
In addition, Funds Distributor is entitled to receive the front-end sales charge from the purchase of Class A shares and a contingent deferred sales charge on the redemption of certain Class A shares. Funds Distributor is also entitled to receive the contingent deferred sales charges from redemptions of Class C shares. For the six months ended February 28, 2018, Funds Distributor received $870 from the sale of Class A shares and $11 in contingent deferred sales charges from redemptions of Class C shares. No contingent deferred sales charges were incurred by Class A shares for the six months ended February 28, 2018.
| | | | |
| 36 | | Wells Fargo Core Plus Bond Fund | | Notes to financial statements (unaudited) |
Shareholder servicing fees
The Trust has entered into contracts with one or more shareholder servicing agents, whereby Class A, Class C, and Administrator Class of the Fund are charged a fee at an annual rate of 0.25% of the average daily net assets of each respective class.
A portion of these total shareholder servicing fees were paid to affiliates of Wells Fargo.
Interfund transactions
The Fund may purchase or sell investment securities to other Wells Fargo affiliates pursuant to Rule 17a-7 of the 1940 Act and under procedures adopted by the Board of Trustees. The procedures have been designed to ensure that these interfund transactions, which do not incur broker commissions, are effected at current market prices.
5. INVESTMENT PORTFOLIO TRANSACTIONS
Purchases and sales of investments, excluding short-term securities, for the six months ended February 28, 2018 were as follows:
| | | | | | |
Purchases at cost | | Sales proceeds |
U.S.
government | | Non-U.S.
government | | U.S.
government | | Non-U.S.
government |
| $407,889,890 | | $185,337,072 | | $321,096,042 | | $119,279,979 |
As of February 28, 2018, the Fund had unfunded term loan commitments of $752,813.
6. DERIVATIVE TRANSACTIONS
During the six months ended February 28, 2018, the Fund entered into futures contracts to speculate on interest rates and to help manage the duration of the portfolio; forward foreign currency contracts for economic hedging purposes; and credit default swap contracts as a substitute for taking a position in the underlying security or basket of securities or to potentially enhance the Fund’s total return, respectively.
The table below discloses the volume of the Fund’s derivative activity during the six months ended February 28, 2018.
| | | | |
Futures contracts | | | | |
Average notional balance on long futures | | $ | 70,440,227 | |
Average notional balance on short futures | | | 28,001,655 | |
| |
Forward foreign currency contracts | | | | |
Average contract amounts to buy | | | 11,337,752 | |
Average contract amounts to sell | | | 25,421,245 | |
| |
Credit default swap contracts | | | | |
Average notional balance | | | 11,060,440 | |
The Fund’s credit default swap may contain provisions for early termination in the event the net assets of the Fund declines below specific levels identified by the counterparty. If these levels are triggered, the counterparty may terminate the transaction and seek payment or request full collateralization of the derivative transactions in net liability positions.
| | | | | | |
| Notes to financial statements (unaudited) | | Wells Fargo Core Plus Bond Fund | | | 37 | |
A summary of the location of derivative instruments on the financial statements by primary risk exposure is outlined following tables.
The fair value of derivative instruments as of February 28, 2018 was as follows for the Fund:
| | | | | | | | | | | | |
| | | Asset derivatives | | | Liability derivatives | |
| | | Statement of Assets and
Liabilities location | | Fair value | | | Statement of Assets and
Liabilities location | | Fair value | |
Interest rate risk | | Net unrealized losses on investments | | $ | 138,302 | * | | Net unrealized losses on investments | | $ | 28,425 | * |
Foreign currency risk | | Net unrealized losses on investments | | | 362,973 | * | | Net unrealized losses on investments | | | 0 | * |
Foreign currency risk | | Unrealized gains on forward foreign currency contracts | | | 199,747 | | | Unrealized losses on forward foreign currency contracts | | | 368,126 | |
Credit risk | | Net unrealized losses on investments | | | 15,696 | ** | | Net unrealized losses on investments | | | 0 | ** |
| | | | | $ | 716,718 | | | | | $ | 396,551 | |
| * | Amount includes cumulative unrealized gains (losses) on futures contracts as reported in the table following the Portfolio of Investments. Only the current day’s variation margin as of February 28, 2018 is reported separately on the Statement of Assets and Liabilities. |
| ** | Amount includes cumulative unrealized gains (losses) on centrally cleared swaps as reported in the table following the Portfolio of Investments. Only the current day’s variation margin as of February 28, 2018 is reported separately on the Statement of Assets and Liabilities. |
The effect of derivative instruments on the Statement of Operations for the six months ended February 28, 2018 was as follows for the Fund:
| | | | | | | | | | | | | | | | |
| | | Amount of realized gains (losses) on derivatives | |
| | | Futures
contracts | | | Forward
foreign
currency
contracts | | | Credit
default
swaps | | | Total | |
Interest rate risk | | $ | (2,154,789 | ) | | $ | 0 | | | $ | 0 | | | $ | (2,154,789 | ) |
Foreign currency risk | | | (195,398 | ) | | | (1,383,476 | ) | | | 0 | | | | (1,578,874 | ) |
Credit risk | | | 0 | | | | 0 | | | | 61,193 | | | | 61,193 | |
| | | $ | (2,350,187 | ) | | $ | (1,383,476 | ) | | $ | 61,193 | | | $ | (3,672,470 | ) |
| |
| | | Change in unrealized gains (losses) on derivatives | |
| | | Futures
contracts | | | Forward
foreign
currency
contracts | | | Credit
default
swaps | | | Total | |
Interest rate risk | | $ | (4,961 | ) | | $ | 0 | | | $ | 0 | | | $ | (4,961 | ) |
Foreign currency risk | | | 436,589 | | | | 1,416,256 | | | | 0 | | | | 1,852,845 | |
Credit risk | | | 0 | | | | 0 | | | | (2,222 | ) | | | (2,222 | ) |
| | | $ | 431,628 | | | $ | 1,416,256 | | | $ | (2,222 | ) | | $ | 1,845,662 | |
For certain types of derivative transactions, the Fund has entered into International Swaps and Derivatives Association, Inc. master agreements (“ISDA Master Agreements”) or similar agreements with approved counterparties. The ISDA Master Agreements or similar agreements may have requirements to deliver/deposit securities or cash to/with an exchange or broker-dealer as collateral and allows the Fund to offset, with each counterparty, certain derivative financial instrument’s assets and/or liabilities with collateral held or pledged. Collateral requirements differ by type of derivative. Collateral or margin requirements are set by the broker or exchange clearing house for exchange traded derivatives while collateral terms are contract specific for over-the-counter traded derivatives. Cash collateral that has been pledged to cover obligations of the Fund under ISDA Master Agreements or similar agreements, if any, are reported separately in the Statement of Assets and Liabilities. Securities pledged as collateral, if any, are noted in the Portfolio of Investments. With respect to balance sheet offsetting, absent an event of default by the counterparty or a termination of the agreement, the
| | | | |
| 38 | | Wells Fargo Core Plus Bond Fund | | Notes to financial statements (unaudited) |
reported amounts of financial assets and financial liabilities in the Statement of Assets and Liabilities are not offset across transactions between the Fund and the applicable counterparty. A reconciliation of the gross amounts on the Statement of Assets and Liabilities to the net amounts by counterparty, including any collateral exposure, is as follows:
| | | | | | | | | | | | | | | | |
| Counterparty | | Gross amounts
of assets in the
Statement of
Assets and
Liabilities | | | Amounts
subject to
netting
agreements | | | Collateral
received | | | Net amount
of assets | |
JPMorgan | | $ | 516,971 | * | | $ | (28,425 | ) | | $ | 0 | | | | $488,546 | |
Citibank | | | 199,747 | | | | (199,747 | ) | | | 0 | | | | 0 | |
| | | | | | | | | | | | | | | | |
| | | | |
| Counterparty | | Gross amounts
of liabilities in the
Statement of
Assets and
Liabilities | | | Amounts
subject to
netting
agreements | | | Collateral
pledged1 | | | Net
amount
of
liabilities | |
JPMorgan | | $ | 28,425 | * | | $ | (28,425 | ) | | $ | 0 | | | $ | 0 | |
Citibank | | | 368,126 | | | | (199,747 | ) | | | (168,379 | ) | | | 0 | |
| | * | Amount represents cumulative unrealized gains (losses) on futures contracts and centrally cleared swaps which are reported in Net unrealized losses on investments. Only the current day’s variation margin as of February 28, 2018 is reported separately on the Statement of Assets and Liabilities. | |
| | 1 | Collateral pledged within this table is limited to the collateral for the net transaction with the counterparty. | |
7. BANK BORROWINGS
The Trust (excluding the money market funds and certain other funds) and Wells Fargo Variable Trust are parties to a $280,000,000 revolving credit agreement whereby the Fund is permitted to use bank borrowings for temporary or emergency purposes, such as to fund shareholder redemption requests. Interest under the credit agreement is charged to the Fund based on a borrowing rate equal to the higher of the Federal Funds rate in effect on that day plus 1.25% or the overnight LIBOR rate in effect on that day plus 1.25%. In addition, an annual commitment fee equal to 0.25% of the unused balance is allocated to each participating fund.
For the six months ended February 28, 2018, there were no borrowings by the Fund under the agreement.
8. INDEMNIFICATION
Under the Trust’s organizational documents, the officers and Trustees have been granted certain indemnification rights against certain liabilities that may arise out of performance of their duties to the Trust. Additionally, in the normal course of business, the Trust may enter into contracts with service providers that contain a variety of indemnification clauses. The Trust’s maximum exposure under these arrangements is dependent on future claims that may be made against the Fund and, therefore, cannot be estimated.
9. SUBSEQUENT DISTRIBUTIONS
On March 23, 2018, the Fund declared distributions from net investment income to shareholders of record on March 22, 2018. The per share amounts payable on March 26, 2018 were as follows:
| | | | |
| | | Net investment
income | |
Class A | | $ | 0.03161 | |
Class C | | | 0.02427 | |
Class R6 | | | 0.03535 | |
Administrator Class | | | 0.03272 | |
Institutional Class | | | 0.03487 | |
| | | | | | |
| Notes to financial statements (unaudited) | | Wells Fargo Core Plus Bond Fund | | | 39 | |
On April 24, 2018, the Fund declared distributions from net investment income to shareholders of record on April 23, 2018. The per share amounts payable on April 25, 2018 were as follows:
| | | | |
| | | Net investment income | |
Class A | | $ | 0.02958 | |
Class C | | | 0.02163 | |
Class R6 | | | 0.03378 | |
Administrator Class | | | 0.03079 | |
Institutional Class | | | 0.03325 | |
These distributions are not reflected in the accompanying financial statements.
| | | | |
| 40 | | Wells Fargo Core Plus Bond Fund | | Other information (unaudited) |
PROXY VOTING INFORMATION
A description of the policies and procedures that the Fund uses to determine how to vote proxies relating to portfolio securities is available, upon request, by calling 1-800-222-8222, visiting our website at wellsfargofunds.com, or visiting the SEC website at sec.gov. Information regarding how the Fund voted proxies relating to portfolio securities during the most recent 12-month period ended June 30 is available on the Fund’s website at wellsfargofunds.com or by visiting the SEC website at sec.gov.
PORTFOLIO HOLDINGS INFORMATION
The complete portfolio holdings for the Fund are publicly available monthly on the Fund’s website (wellsfargofunds.com), on a one-month delayed basis. In addition, top ten holdings information (excluding derivative positions) for the Fund is publicly available on the Fund’s website on a monthly, seven-day or more delayed basis. The Fund files its complete schedule of portfolio holdings with the SEC for the first and third quarters of each fiscal year on Form N-Q, which is available by visiting the SEC website at sec.gov. In addition, the Fund’s Form N-Q may be reviewed and copied at the SEC’s Public Reference Room in Washington, DC, and at regional offices in New York City, at 233 Broadway, and in Chicago, at 175 West Jackson Boulevard, Suite 900. Information about the Public Reference Room may be obtained by calling 1-800-SEC-0330.
| | | | | | |
| Other information (unaudited) | | Wells Fargo Core Plus Bond Fund | | | 41 | |
BOARD OF TRUSTEES AND OFFICERS
Each of the Trustees and Officers1 listed in the table below acts in identical capacities for each fund in the Wells Fargo family of funds, which consists of 153 mutual funds comprising the Wells Fargo Funds Trust, Wells Fargo Variable Trust, Wells Fargo Master Trust and four closed-end funds (collectively the “Fund Complex”). This table should be read in conjunction with the Prospectus and the Statement of Additional Information2. The mailing address of each Trustee and Officer is 525 Market Street, 12th Floor, San Francisco, CA 94105. Each Trustee and Officer serves an indefinite term, however, each Trustee serves such term until reaching the mandatory retirement age established by the Trustees.
Independent Trustees
| | | | | | |
Name and year of birth | | Position held and
length of service* | | Principal occupations during past five years or longer | | Current other public company or investment company
directorships |
William R. Ebsworth (Born 1957) | | Trustee, since 2015 | | Retired. From 1984 to 2013, equities analyst, portfolio manager, research director and chief investment officer at Fidelity Management and Research Company in Boston, Tokyo, and Hong Kong, and retired in 2013 as Chief Investment Officer of Fidelity Strategic Advisers, Inc. where he led a team of investment professionals managing client assets. Prior thereto, Board member of Hong Kong Securities Clearing Co., Hong Kong Options Clearing Corp., the Thailand International Fund, Ltd., Fidelity Investments Life Insurance Company, and Empire Fidelity Investments Life Insurance Company. Board member of the Forté Foundation (non-profit organization) and the Vincent Memorial Hospital Endowment (non-profit organization), where he serves on the Investment Committee and as a Chair of the Audit Committee. Mr. Ebsworth is a CFA® charterholder. | | Asset Allocation Trust |
Jane A. Freeman** (Born 1953) | | Trustee, since 2015; Chair Liaison, since 2018 | | Retired. From 2012 to 2014 and 1999 to 2008, Chief Financial Officer of Scientific Learning Corporation. From 2008 to 2012, Ms. Freeman provided consulting services related to strategic business projects. Prior to 1999, Portfolio Manager at Rockefeller & Co. and Scudder, Stevens & Clark. Board member of the Harding Loevner Funds from 1996 to 2014, serving as both Lead Independent Director and chair of the Audit Committee. Board member of the Russell Exchange Traded Funds Trust from 2011 to 2012 and the chair of the Audit Committee. Ms. Freeman is a Board Member of Ruth Bancroft Garden (non-profit organization) and the Glimmerglass Festival. She is also an inactive Chartered Financial Analyst. | | Asset Allocation Trust |
Isaiah Harris, Jr. (Born 1952) | | Trustee, since 2009 | | Retired. Chairman of the Board of CIGNA Corporation since 2009, and Director since 2005. From 2003 to 2011, Director of Deluxe Corporation. Prior thereto, President and CEO of BellSouth Advertising and Publishing Corp. from 2005 to 2007, President and CEO of BellSouth Enterprises from 2004 to 2005 and President of BellSouth Consumer Services from 2000 to 2003. Emeritus member of the Iowa State University Foundation Board of Governors. Emeritus Member of the Advisory Board of Iowa State University School of Business. Advisory Board Member, Palm Harbor Academy (charter school). Advisory Board Member, Child Evangelism Fellowship (non-profit). Mr. Harris is a certified public accountant (inactive status). | | CIGNA Corporation; Asset Allocation Trust |
Judith M. Johnson (Born 1949) | | Trustee, since 2008; Audit Committee Chairman, since 2008 | | Retired. Prior thereto, Chief Executive Officer and Chief Investment Officer of Minneapolis Employees Retirement Fund from 1996 to 2008. Ms. Johnson is an attorney, certified public accountant and a certified managerial accountant. | | Asset Allocation Trust |
David F. Larcker (Born 1950) | | Trustee, since 2009 | | James Irvin Miller Professor of Accounting at the Graduate School of Business, Stanford University, Director of the Corporate Governance Research Initiative and Senior Faculty of The Rock Center for Corporate Governance since 2006. From 2005 to 2008, Professor of Accounting at the Graduate School of Business, Stanford University. Prior thereto, Ernst & Young Professor of Accounting at The Wharton School, University of Pennsylvania from 1985 to 2005. | | Asset Allocation Trust |
| | | | |
| 42 | | Wells Fargo Core Plus Bond Fund | | Other information (unaudited) |
| | | | | | |
Name and year of birth | | Position held and
length of service* | | Principal occupations during past five years or longer | | Current other public company or
investment company
directorships |
Olivia S. Mitchell*** (Born 1953) | | Trustee, since 2006; Governance Committee Chairman, since 2018 | | International Foundation of Employee Benefit Plans Professor, Wharton School of the University of Pennsylvania since 1993. Director of Wharton’s Pension Research Council and Boettner Center on Pensions & Retirement Research, and Research Associate at the National Bureau of Economic Research. Previously, Cornell University Professor from 1978 to 1993. | | Asset Allocation Trust |
Timothy J. Penny**** (Born 1951) | | Trustee, since 1996; Chairman, since 2018; Vice Chairman, from 2017 to 2018 | | President and Chief Executive Officer of Southern Minnesota Initiative Foundation, a non-profit organization, since 2007. Member of the Board of Trustees of NorthStar Education Finance, Inc., a non-profit organization, since 2007. | | Asset Allocation Trust |
James G. Polisson***** (Born 1959) | | Trustee, since 2018; Advisory Board Member, from 2017 to 2018 | | Retired. Chief Marketing Officer, Source (ETF) UK Services, Ltd, from 2015 to 2017. From 2012 to 2015, Principal of The Polisson Group, LLC, a management consulting, corporate advisory and principal investing company. Chief Executive Officer and Managing Director at Russell Investments, Global Exchange Traded Funds from 2010 to 2012. Managing Director of Barclays Global Investors from 1998 to 2010 and Global Chief Marketing Officer for iShares and Barclays Global Investors from 2000 to 2010. Trustee of the San Francisco Mechanics’ Institute, a non-profit organization, from 2013 to 2015. Board member of the Russell Exchange Traded Fund Trust from 2011 to 2012. Director of Barclays Global Investors Holdings Deutschland GmbH from 2006 to 2009. Mr. Polisson is an attorney and has a retired status with the Massachusetts and District of Columbia Bar Associations. | | Asset Allocation Trust |
Michael S. Scofield (Born 1943) | | Trustee, since 2010 | | Served on the Investment Company Institute’s Board of Governors and Executive Committee from 2008-2011 as well the Governing Council of the Independent Directors Council from 2006-2011 and the Independent Directors Council Executive Committee from 2008-2011. Trustee of the Evergreen Fund complex (and its predecessors) from 1984 to 2010. Chairman of the Evergreen Funds from 2000-2010. Former Trustee of the Mentor Funds. Retired Attorney, Law Offices of Michael S. Scofield. | | Asset Allocation Trust |
Pamela Wheelock***** (Born 1959) | | Trustee, since 2018; Advisory Board Member, from 2017 to 2018 | | Chief Operating Officer, Twin Cities Habitat for Humanity, since January, 2017. Vice President of University Services, University of Minnesota from 2012 to 2017. Prior thereto, Interim President and Chief Executive Officer of Blue Cross Blue Shield of Minnesota from 2010 to 2011, Chairman of the Board from 2009 to 2011 and Board Director from 2003 to 2015. Vice President, Leadership and Community Engagement, Bush Foundation, Saint Paul, Minnesota (a private foundation) from 2009 to 2011. Executive Vice President and Chief Financial Officer, Minnesota Sports and Entertainment from 2004 to 2009 and Senior Vice President from 2002 to 2004. Commissioner of Finance, State of Minnesota, from 1999 to 2002. Currently on the Board of Directors, Governance Committee and Finance Committee, for the Minnesota Philanthropy Partners (Saint Paul Foundation) since 2012 and Board Chair of the Minnesota Wild Foundation since 2010. | | Asset Allocation Trust |
| * | Length of service dates reflect the Trustee’s commencement of service with the Trust’s predecessor entities, where applicable. |
| ** | Jane Freeman became Chair Liaison effective January 1, 2018. |
| *** | Olivia Mitchell became Chairman of the Governance Committee effective January 1, 2018. |
| **** | Timothy Penny became Chairman effective January 1, 2018. |
| ***** | James Polisson and Pamela Wheelock each became a Trustee effective January 1, 2018. |
| | | | | | |
| Other information (unaudited) | | Wells Fargo Core Plus Bond Fund | | | 43 | |
Officers
| | | | | | |
Name and year of birth | | Position held and length of service | | Principal occupations during past five years or longer | | |
Andrew Owen (Born 1960) | | President, since 2017 | | Executive Vice President of Wells Fargo & Company and Head of Affiliated Managers, Wells Fargo Asset Management, since 2014. In addition, Mr. Owen is currently President, Chief Executive Officer and Director of Wells Fargo Funds Management, LLC since 2017. Prior thereto, Executive Vice President responsible for marketing, investments and product development for Wells Fargo Funds Management, LLC, from 2009 to 2014. | | |
Nancy Wiser1 (Born 1967) | | Treasurer, since 2012 | | Executive Vice President of Wells Fargo Funds Management, LLC since 2011. Chief Operating Officer and Chief Compliance Officer at LightBox Capital Management LLC, from 2008 to 2011. | | |
Alexander Kymn* (Born 1973) | | Secretary, since 2018; Chief Legal Officer, since 2018 | | Senior Company Counsel of Wells Fargo Bank, N.A. since 2018 (previously Senior Counsel from 2007 to 2018). Vice President of Wells Fargo Funds Management, LLC from 2008 to 2014. | | |
C. David Messman** (Born 1960) | | Secretary, since 2000; Chief Legal Officer, since 2003 | | Senior Vice President and Secretary of Wells Fargo Funds Management, LLC since 2001. Assistant General Counsel of Wells Fargo Bank, N.A. since 2013 and Vice President and Managing Counsel of Wells Fargo Bank, N.A. from 1996 to 2013. | | |
Michael H. Whitaker (Born 1967) | | Chief Compliance Officer, since 2016 | | Senior Vice President and Chief Compliance Officer since 2016. Senior Vice President and Chief Compliance Officer for Fidelity Investments from 2007 to 2016. | | |
David Berardi (Born 1975) | | Assistant Treasurer, since 2009 | | Vice President of Wells Fargo Funds Management, LLC since 2009. Vice President of Evergreen Investment Management Company, LLC from 2008 to 2010. Manager of Fund Reporting and Control for Evergreen Investment Management Company, LLC from 2004 to 2010. | | |
Jeremy DePalma1 (Born 1974) | | Assistant Treasurer, since 2009 | | Senior Vice President of Wells Fargo Funds Management, LLC since 2009. Senior Vice President of Evergreen Investment Management Company, LLC from 2008 to 2010 and head of the Fund Reporting and Control Team within Fund Administration from 2005 to 2010. | | |
| 1 | Nancy Wiser acts as Treasurer of 77 funds in the Fund Complex. Jeremy DePalma acts as Treasurer of 76 funds and Assistant Treasurer of 77 funds in the Fund Complex. |
| 2 | The Statement of Additional Information includes additional information about the Trustees and is available, without charge, upon request, by calling 1-800-222-8222 or by visiting the website at wellsfargofunds.com. |
| * | Alexander Kymn became the Secretary and Chief Legal Officer effective April 17, 2018. |
| ** | David Messman was the Secretary and Chief Legal Officer until April 16, 2018. |
| | | | |
| 44 | | Wells Fargo Core Plus Bond Fund | | List of abbreviations |
The following is a list of common abbreviations for terms and entities that may have appeared in this report.
| ACA | — ACA Financial Guaranty Corporation |
| ADR | — American depositary receipt |
| ADS | — American depositary shares |
| AGC | — Assured Guaranty Corporation |
| AGM | — Assured Guaranty Municipal |
| Ambac | — Ambac Financial Group Incorporated |
| AMT | — Alternative minimum tax |
| BAN | — Bond anticipation notes |
| BHAC | — Berkshire Hathaway Assurance Corporation |
| CAB | — Capital appreciation bond |
| CCAB | — Convertible capital appreciation bond |
| CDA | — Community Development Authority |
| CDO | — Collateralized debt obligation |
| CLO | — Collateralized loan obligation |
| DRIVER | — Derivative inverse tax-exempt receipts |
| DW&P | — Department of Water & Power |
| DWR | — Department of Water Resources |
| ECFA | — Educational & Cultural Facilities Authority |
| EDA | — Economic Development Authority |
| EDFA | — Economic Development Finance Authority |
| ETF | — Exchange-traded fund |
| FDIC | — Federal Deposit Insurance Corporation |
| FFCB | — Federal Farm Credit Banks |
| FGIC | — Financial Guaranty Insurance Corporation |
| FHA | — Federal Housing Administration |
| FHLB | — Federal Home Loan Bank |
| FHLMC | — Federal Home Loan Mortgage Corporation |
| FICO | — The Financing Corporation |
| FNMA | — Federal National Mortgage Association |
| GDR | — Global depositary receipt |
| GNMA | — Government National Mortgage Association |
| HCFR | — Healthcare facilities revenue |
| HEFA | — Health & Educational Facilities Authority |
| HEFAR | — Higher education facilities authority revenue |
| HFA | — Housing Finance Authority |
| HFFA | — Health Facilities Financing Authority |
| HUD | — Department of Housing and Urban Development |
| IDA | — Industrial Development Authority |
| IDAG | — Industrial Development Agency |
| KRW | — Republic of Korea won |
| LIBOR | — London Interbank Offered Rate |
| LIFER | — Long Inverse Floating Exempt Receipts |
| LLC | — Limited liability company |
| LLLP | — Limited liability limited partnership |
| LLP | — Limited liability partnership |
| MBIA | — Municipal Bond Insurance Association |
| MFHR | — Multifamily housing revenue |
| MSTR | — Municipal securities trust receipts |
| MUD | — Municipal Utility District |
| National | — National Public Finance Guarantee Corporation |
| PCFA | — Pollution Control Financing Authority |
| PCL | — Public Company Limited |
| PCR | — Pollution control revenue |
| PFA | — Public Finance Authority |
| PFFA | — Public Facilities Financing Authority |
| PFOTER | — Puttable floating option tax-exempt receipts |
| PJSC | — Public Joint Stock Company |
| plc | — Public limited company |
| PUTTER | — Puttable tax-exempt receipts |
| R&D | — Research & development |
| Radian | — Radian Asset Assurance |
| RAN | — Revenue anticipation notes |
| RDA | — Redevelopment Agency |
| RDFA | — Redevelopment Finance Authority |
| REIT | — Real estate investment trust |
| ROC | — Reset option certificates |
| SAVRS | — Select auction variable rate securities |
| SBA | — Small Business Authority |
| SDR | — Swedish depositary receipt |
| SFHR | — Single-family housing revenue |
| SFMR | — Single-family mortgage revenue |
| SIFMA | — Securities Industry and Financial Markets Association |
| SPA | — Standby purchase agreement |
| SPDR | — Standard & Poor’s Depositary Receipts |
| SPEAR | — Short Puttable Exempt Adjustable Receipts |
| STRIPS | — Separate trading of registered interest and |
| TAN | — Tax anticipation notes |
| TIPS | — Treasury inflation-protected securities |
| TRAN | — Tax revenue anticipation notes |
| TTFA | — Transportation Trust Fund Authority |
| TVA | — Tennessee Valley Authority |

For more information
More information about Wells Fargo Funds is available free upon request. To obtain literature, please write, email, visit the Fund’s website, or call:
Wells Fargo Funds
P.O. Box 8266
Boston, MA 02266-8266
Email: fundservice@wellsfargo.com
Website: wellsfargofunds.com
Individual investors: 1-800-222-8222
Retail investment professionals: 1-888-877-9275
Institutional investment professionals: 1-866-765-0778
This report and the financial statements contained herein are submitted for the general information of the shareholders of the Fund. If this report is used for promotional purposes, distribution of the report must be accompanied or preceded by a current prospectus. Before investing, please consider the investment objectives, risks, charges, and expenses of the investment. For a current prospectus and, if available, a summary prospectus, containing this information, call 1-800-222-8222 or visit the Fund’s website at wellsfargofunds.com. Read the prospectus carefully before you invest or send money.
Wells Fargo Asset Management (WFAM) is a trade name used by the asset management businesses of Wells Fargo & Company. Wells Fargo Funds Management, LLC, a wholly owned subsidiary of Wells Fargo & Company, provides investment advisory and administrative services for Wells Fargo Funds. Other affiliates of Wells Fargo & Company provide subadvisory and other services for the funds. The funds are distributed by Wells Fargo Funds Distributor, LLC, Member FINRA, an affiliate of Wells Fargo & Company. Neither Wells Fargo Funds Distributor nor Wells Fargo Funds Management holds fund shareholder accounts or assets. This material is for general informational and educational purposes only and is NOT intended to provide investment advice or a recommendation of any kind—including a recommendation for any specific investment, strategy, or plan.
NOT FDIC INSURED ◾ NO BANK GUARANTEE ◾ MAY LOSE VALUE
© 2018 Wells Fargo Funds Management, LLC. All rights reserved.
| | |
 | | 309370 04-18 SA219/SAR219 02-18 |
Semi-Annual Report
February 28, 2018

Wells Fargo
Short Duration Government Bond Fund


Reduce clutter. Save trees.
Sign up for electronic delivery of prospectuses and shareholder reports at wellsfargo.com/advantagedelivery
Contents
The views expressed and any forward-looking statements are as of February 28, 2018, unless otherwise noted, and are those of the Fund managers and/or Wells Fargo Funds Management, LLC. Discussions of individual securities, or the markets generally, or any Wells Fargo Fund are not intended as individual recommendations. Future events or results may vary significantly from those expressed in any forward-looking statements. The views expressed are subject to change at any time in response to changing circumstances in the market. Wells Fargo Funds Management, LLC and the Fund disclaim any obligation to publicly update or revise any views expressed or forward-looking statements.
NOT FDIC INSURED ◾ NO BANK GUARANTEE ◾ MAY LOSE VALUE
| | | | |
| 2 | | Wells Fargo Short Duration Government Bond Fund | | Letter to shareholders (unaudited) |

Andrew Owen
President
Wells Fargo Funds
During the period, stocks globally delivered positive returns.
Dear Shareholder:
We are pleased to offer you this semi-annual report for the Wells Fargo Short Duration Government Bond Fund for the six-month period that ended February 28, 2018. During the period, stocks globally delivered positive returns. For the period, U.S. stocks, as measured by the S&P 500 Index1, gained 10.84% and international stocks, as measured by the MSCI ACWI ex USA Index (Net)2, gained 7.59%. In bond markets, the Bloomberg Barclays U.S. Aggregate Bond Index3 declined 2.18% and the Bloomberg Barclays Municipal Bond Index4 lost 1.24% while fixed-income investments outside the U.S. gained 2.52%, according to the Bloomberg Barclays Global Aggregate ex-USD Index5. The ICE BofAML U.S. High Yield Index6 earned 1.01% during the period.
U.S. stocks advanced as business-friendly policies and regulations, newly implemented tax reform, increased hiring activity, and consistent corporate profits led to higher investor and consumer confidence. Internationally, stocks gained as unemployment fell and wages increased in the U.K.; the Bank of Japan continued its accommodative monetary policies; and industrial production, retail sales, and fixed asset investment increased in China. Stock returns in the emerging markets were strong, with the MSCI EM Index (Net)7 gaining 10.58% for the period.
Reactions to U.S. interest-rate increases were uneven across the yield curve and globally.
The U.S. Federal Reserve (Fed) increased the federal funds rate twice during the six-month period. Following a federal funds rate increase in June to a range of 1.00% to 1.25%, 10-year U.S. Treasury yields declined, the yield curve flattened, and long-term bond prices benefited.
Internationally, central banks maintained low interest rates and accommodative monetary policies that supported business activity and stock values in foreign markets. A weaker U.S. dollar was generally supportive of business activity in regions around the globe.
Positive economic and market news continued as 2017 closed and 2018 began.
During the fourth quarter of 2017, stock markets continued the move higher. Third-quarter economic output in the U.S. grew at a 3.2% annual rate. The unemployment rate fell to a 17-year low of 4.1%. Tax reform and wage growth encouraged increased business and consumer spending.
Fed officials announced in October 2017 plans to begin unwinding its $4.5 trillion portfolio of bonds and other assets accumulated during rounds of quantitative easing conducted since the 2008–2009 recession. Still, restrained inflation kept long-term bond rates steady and the flattening of the yield curve persisted.
| 1 | The S&P 500 Index consists of 500 stocks chosen for market size, liquidity, and industry group representation. It is a market-value-weighted index with each stock’s weight in the index proportionate to its market value. You cannot invest directly in an index. |
| 2 | The Morgan Stanley Capital International (MSCI) All Country World Index (ACWI) ex USA Index (Net) is a free-float-adjusted market-capitalization-weighted index that is designed to measure the equity market performance of developed markets, excluding the United States and Canada. Source: MSCI. MSCI makes no express or implied warranties or representations and shall have no liability whatsoever with respect to any MSCI data contained herein. The MSCI data may not be further redistributed or used as a basis for other indices or any securities or financial products. This report is not approved, reviewed, or produced by MSCI. You cannot invest directly in an index. |
| 3 | The Bloomberg Barclays U.S. Aggregate Bond Index is a broad-based benchmark that measures the investment-grade, U.S. dollar-denominated, fixed-rate taxable bond market, including Treasuries, government-related and corporate securities, mortgage-backed securities (agency fixed-rate and hybrid adjustable-rate mortgage pass-throughs), asset-backed securities, and commercial mortgage-backed securities. You cannot invest directly in an index. |
| 4 | The Bloomberg Barclays Municipal Bond Index is an unmanaged index composed of long-term tax-exempt bonds with a minimum credit rating of Baa. You cannot invest directly in an index. |
| 5 | The Bloomberg Barclays Global Aggregate ex-USD Index is an unmanaged index that provides a broad-based measure of the global investment-grade fixed-income markets excluding the U.S. dollar-denominated debt market. You cannot invest directly in an index. |
| 6 | The ICE BofAML U.S. High Yield Index is a market-capitalization-weighted index of domestic and Yankee high-yield bonds. The index tracks the performance of high-yield securities traded in the U.S. bond market. You cannot invest directly in an index. Copyright 2018. ICE Data Indices, LLC. All rights reserved. |
| 7 | The MSCI Emerging Markets (EM) Index (Net) is a free-float-adjusted market-capitalization-weighted index that is designed to measure large- and mid-cap equity market performance of emerging markets. The MSCI EM Index (Net) consists of the following 24 emerging markets country indices: Brazil, Chile, China, Colombia, Czech Republic, Egypt, Greece, Hungary, India, Indonesia, Korea, Malaysia, Mexico, Pakistan, Peru, the Philippines, Poland, Qatar, Russia, South Africa, Taiwan, Thailand, Turkey, and the United Arab Emirates. You cannot invest directly in an index. |
| | | | | | |
| Letter to shareholders (unaudited) | | Wells Fargo Short Duration Government Bond Fund | | | 3 | |
October 2017 also marked one year since the regulatory reform of money market investing in the U.S. By December 2017, money market fund asset levels exceeded their December 2016 levels, reflecting continued investor demand for short-term investment opportunities offered in money market funds.
In December, the Organisation for Economic Co-operation and Development (OECD) reported that the global economy was expanding at its fastest rate since 2010; all 35 countries the OECD follows were on track to expand for 2017. International economies benefited from economic stimulus, which accelerated trade growth; improving employment; increased investment; and firming commodity prices.
The Fed raised the federal funds rate target to a range of 1.25% to 1.50% in December 2017 and began reducing its bond portfolio.
2018 opened with continued stock advances, then volatility.
Improving business and economic data globally continued to support stock advances through January 2018. Even political wrangling in the U.S. over budget resolutions could not dissuade investors from buying stocks as payrolls and factory orders increased. Long-term interest rates in the U.S. trended higher as the yield curve steepened—the 10-year Treasury rate moved from 2.46% to 2.84% and the 30-year rate moved from 2.81% to 3.08% during January 2018.
Investor sentiment shifted in February. Concerns about inflation began to emerge in the U.S. as readings from the Producer Price Index in January rose 2.5% year over year. During February 2018, the U.S. market endured a loss of more than 10% before recovering much of that loss, but volatility affected stocks globally throughout the month.
During January 2018, purchasing managers’ indexes in China, the eurozone, India, and Japan reported data for December that indicated continued growth. International stock values fell during February 2018, swept up in the selling momentum in U.S. markets.
Don’t let short-term uncertainty derail long-term investment goals.
Periods of investment uncertainty can present challenges, but experience has taught us that maintaining long-term investment goals can be an effective way to plan for the future. To help you create a sound strategy based on your personal goals and risk tolerance, Wells Fargo Funds offers more than 100 mutual funds spanning a wide range of asset classes and investment styles. Although diversification cannot guarantee an investment profit or prevent losses, we believe it can be an effective way to manage investment risk and potentially smooth out overall portfolio performance. We encourage investors to know their investments and to understand that appropriate levels of risk-taking may unlock opportunities.
Thank you for choosing to invest with Wells Fargo Funds. We appreciate your confidence in us and remain committed to helping you meet your financial needs.
Sincerely,

Andrew Owen
President
Wells Fargo Funds
During February 2018, the U.S. market endured a loss of more than 10% before recovering much of that loss, but volatility affected stocks globally throughout the month.
For further information about your Fund, contact your investment professional, visit our website at wellsfargofunds.com, or call us directly at 1-800-222-8222.
| | | | |
| 4 | | Wells Fargo Short Duration Government Bond Fund | | Performance highlights (unaudited) |
Investment objective
The Fund seeks to provide current income consistent with capital preservation.
Manager
Wells Fargo Funds Management, LLC
Subadviser
Wells Capital Management Incorporated
Portfolio managers
Maulik Bhansali, CFA®‡
Thomas O’Connor, CFA®
Jarad Vasquez, CFA®‡
Average annual total returns (%) as of February 28, 20181
| | | | | | | | | | | | | | | | | | | | | | | | | | | | | | | | | | |
| | | | | Including sales charge | | | Excluding sales charge | | | Expense ratios2 (%) | |
| | | Inception date | | 1 year | | | 5 year | | | 10 year | | | 1 year | | | 5 year | | | 10 year | | | Gross | | | Net3 | |
| Class A (MSDAX) | | 3-11-1996 | | | (2.34 | ) | | | (0.16 | ) | | | 1.51 | | | | (0.34 | ) | | | 0.24 | | | | 1.71 | | | | 0.79 | | | | 0.78 | |
| Class C (MSDCX) | | 5-31-2002 | | | (1.98 | ) | | | (0.50 | ) | | | 0.96 | | | | (0.98 | ) | | | (0.50 | ) | | | 0.96 | | | | 1.54 | | | | 1.53 | |
| Class R6 (MSDRX) | | 11-30-2012 | | | – | | | | – | | | | – | | | | 0.18 | | | | 0.66 | | | | 2.17 | | | | 0.41 | | | | 0.37 | |
| Administrator Class (MNSGX) | | 12-18-1992 | | | – | | | | – | | | | – | | | | (0.06 | ) | | | 0.43 | | | | 1.94 | | | | 0.73 | | | | 0.60 | |
| Institutional Class (WSGIX) | | 4-8-2005 | | | – | | | | – | | | | – | | | | 0.12 | | | | 0.61 | | | | 2.12 | | | | 0.46 | | | | 0.42 | |
| Bloomberg Barclays U.S. 1-3 Year Government Bond Index4 | | – | | | – | | | | – | | | | – | | | | (0.14 | ) | | | 0.49 | | | | 1.23 | | | | – | | | | – | |
Figures quoted represent past performance, which is no guarantee of future results, and do not reflect taxes that a shareholder may pay on fund distributions or the redemption of fund shares. Investment return and principal value of an investment will fluctuate so that an investor’s shares, when redeemed, may be worth more or less than their original cost. Performance shown without sales charges would be lower if sales charges were reflected. Current performance may be lower or higher than the performance data quoted, which assumes the reinvestment of dividends and capital gains. Current month-end performance is available on the Fund’s website, wellsfargofunds.com.
Index returns do not include transaction costs associated with buying and selling securities, any mutual fund fees or expenses, or any taxes. It is not possible to invest directly in an index.
For Class A shares, the maximum front-end sales charge is 2.00%. For Class C shares, the maximum contingent deferred sales charge is 1.00%. Performance including a contingent deferred sales charge assumes the sales charge for the corresponding time period. Class R6, Administrator Class, and Institutional Class shares are sold without a front-end sales charge or contingent deferred sales charge.
Bond values fluctuate in response to the financial condition of individual issuers, general market and economic conditions, and changes in interest rates. Changes in market conditions and government policies may lead to periods of heightened volatility in the bond market and reduced liquidity for certain bonds held by the Fund. In general, when interest rates rise, bond values fall and investors may lose principal value. Interest-rate changes and their impact on the Fund and its share price can be sudden and unpredictable. Securities issued by U.S. government agencies or government sponsored entities may not be guaranteed by the U.S. Treasury. Certain investment strategies tend to increase the total risk of an investment (relative to the broader market). The Fund is exposed to mortgage- and asset-backed securities risk. The U.S. government guarantee applies to certain underlying securities and not to shares of the Fund. Consult the Fund’s prospectus for additional information on these and other risks.
Please see footnotes on page 5.
| | | | | | |
| Performance highlights (unaudited) | | Wells Fargo Short Duration Government Bond Fund | | | 5 | |
| | | | |
| Ten largest holdings (%) as of February 28, 20185 | |
FNMA, 3.00%, 7-1-2026 | | | 8.61 | |
U.S. Treasury Note, 2.25%, 2-15-2021 | | | 5.79 | |
U.S. Treasury Note, 1.63%, 10-15-2020 | | | 5.49 | |
U.S. Treasury Note, 2.25%, 2-29-2020 | | | 3.38 | |
U.S. Treasury Note, 0.75%, 9-30-2018 | | | 3.38 | |
U.S. Treasury Note, 1.13%, 6-15-2018 | | | 3.25 | |
FNMA, 3.50%, 7-1-2027 | | | 2.21 | |
U.S. Treasury Note, 1.13%, 1-31-2019 | | | 2.08 | |
U.S. Treasury Note, 1.38%, 2-15-2020 | | | 2.06 | |
FNMA, 4.00%, 11-1-2046 | | | 2.01 | |
|
| Portfolio allocation as of February 28, 20186 |
|
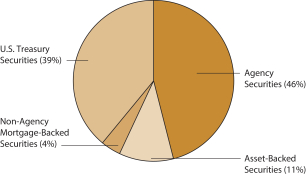
|
| ‡ | Mr. Bhansali and Mr. Vasquez became portfolio managers of the Fund on October 16, 2017. |
| 1 | Historical performance shown for Class R6 shares prior to their inception reflects the performance of Institutional Class shares and includes the higher expenses applicable to Institutional Class shares. If these expenses had not been included, returns for class R6 shares would be higher. |
| 2 | Reflects the expense ratios as stated in the most recent prospectuses. The expense ratios shown are subject to change and may differ from the annualized expense ratios shown in the financial highlights of this report. |
| 3 | The manager has contractually committed through December 31, 2018, to waive fees and/or reimburse expenses to the extent necessary to cap the Fund’s Total Annual Fund Operating Expenses After Fee Waivers at the amounts shown. After this time, the cap may be increased or the commitment to maintain the cap may be terminated only with the approval of the Board of Trustees. Brokerage commissions, stamp duty fees, interest, taxes, acquired fund fees and expenses, and extraordinary expenses are excluded from the expense cap. Without this cap, the Fund’s returns would have been lower. The expense ratio paid by an investor is the net expense ratio (the total annual fund operating expenses after fee waivers) as stated in the prospectuses. |
| 4 | The Bloomberg Barclays U.S. 1–3 Year Government Bond Index is composed of all publicly issued, nonconvertible domestic debt of the U.S. government and its agencies. The index also includes corporate debt guaranteed by the U.S. government. Only notes and bonds with a minimum maturity of one year up to a maximum maturity of 2.9 years are included. You cannot invest directly in an index. |
| 5 | The ten largest holdings, excluding cash and cash equivalents, are calculated based on the value of the investments divided by total net assets of the Fund. Holdings are subject to change and may have changed since the date specified. |
| 6 | Amounts are calculated based on the total long-term investments of the Fund. These amounts are subject to change and may have changed since the date specified. |
| | | | |
| 6 | | Wells Fargo Short Duration Government Bond Fund | | Fund expenses (unaudited) |
As a shareholder of the Fund, you incur two types of costs: (1) transaction costs, including sales charges (loads) on purchase payments and contingent deferred sales charges (if any) on redemptions and (2) ongoing costs, including management fees, distribution (12b-1) and/or shareholder servicing fees, and other Fund expenses. This example is intended to help you understand your ongoing costs (in dollars) of investing in the Fund and to compare these costs with the ongoing costs of investing in other mutual funds.
The example is based on an investment of $1,000 invested at the beginning of the six-month period and held for the entire period from September 1, 2017 to February 28, 2018.
Actual expenses
The “Actual” line of the table below provides information about actual account values and actual expenses. You may use the information in this line, together with the amount you invested, to estimate the expenses that you paid over the period. Simply divide your account value by $1,000 (for example, an $8,600 account value divided by $1,000 = 8.6), then multiply the result by the number in the “Actual” line under the heading entitled “Expenses paid during period” for your applicable class of shares to estimate the expenses you paid on your account during this period.
Hypothetical example for comparison purposes
The “Hypothetical” line of the table below provides information about hypothetical account values and hypothetical expenses based on the Fund’s actual expense ratio and an assumed rate of return of 5% per year before expenses, which is not the Fund’s actual return. The hypothetical account values and expenses may not be used to estimate the actual ending account balance or expenses you paid for the period. You may use this information to compare the ongoing costs of investing in the Fund and other funds. To do so, compare this 5% hypothetical example with the 5% hypothetical examples that appear in the shareholder reports of the other funds.
Please note that the expenses shown in the table are meant to highlight your ongoing costs only and do not reflect any transactional costs, such as sales charges (loads) and contingent deferred sales charges. Therefore, the “Hypothetical” line of the table is useful in comparing ongoing costs only and will not help you determine the relative total costs of owning different funds. In addition, if these transactional costs were included, your costs would have been higher.
| | | | | | | | | | | | | | | | |
| | | Beginning
account value
9-1-2017 | | | Ending
account value
2-28-2018 | | | Expenses
paid during
the period¹ | | | Annualized net
expense ratio | |
Class A | | | | | | | | | | | | | | | | |
Actual | | $ | 1,000.00 | | | $ | 991.94 | | | $ | 3.85 | | | | 0.78 | % |
Hypothetical (5% return before expenses) | | $ | 1,000.00 | | | $ | 1,020.93 | | | $ | 3.91 | | | | 0.78 | % |
Class C | | | | | | | | | | | | | | | | |
Actual | | $ | 1,000.00 | | | $ | 988.29 | | | $ | 7.54 | | | | 1.53 | % |
Hypothetical (5% return before expenses) | | $ | 1,000.00 | | | $ | 1,017.21 | | | $ | 7.65 | | | | 1.53 | % |
Clas R6 | | | | | | | | | | | | | | | | |
Actual | | $ | 1,000.00 | | | $ | 994.03 | | | $ | 1.83 | | | | 0.37 | % |
Hypothetical (5% return before expenses) | | $ | 1,000.00 | | | $ | 1,022.96 | | | $ | 1.86 | | | | 0.37 | % |
Administrator Class | | | | | | | | | | | | | | | | |
Actual | | $ | 1,000.00 | | | $ | 992.86 | | | $ | 2.96 | | | | 0.60 | % |
Hypothetical (5% return before expenses) | | $ | 1,000.00 | | | $ | 1,021.82 | | | $ | 3.01 | | | | 0.60 | % |
Institutional Class | | | | | | | | | | | | | | | | |
Actual | | $ | 1,000.00 | | | $ | 993.75 | | | $ | 2.08 | | | | 0.42 | % |
Hypothetical (5% return before expenses) | | $ | 1,000.00 | | | $ | 1,022.71 | | | $ | 2.11 | | | | 0.42 | % |
| 1 | Expenses paid is equal to the annualized net expense ratio of each class multiplied by the average account value over the period, multiplied by the number of days in the most recent fiscal half-year divided by the number of days in the fiscal year (to reflect the one-half-year period). |
| | | | | | |
| Portfolio of investments—February 28, 2018 (unaudited) | | Wells Fargo Short Duration Government Bond Fund | | | 7 | |
| | | | | | | | | | | | | | | | |
| Security name | | Interest rate | | | Maturity date | | | Principal | | | Value | |
| | | | |
Agency Securities: 48.64% | | | | | | | | | | | | | | | | |
FHLMC (12 Month LIBOR +1.84%) ± | | | 3.44 | % | | | 5-1-2042 | | | $ | 2,809,565 | | | $ | 2,860,762 | |
FHLMC | | | 3.50 | | | | 8-1-2030 | | | | 1,380,872 | | | | 1,408,250 | |
FHLMC | | | 3.50 | | | | 6-1-2032 | | | | 1,594,664 | | | | 1,626,398 | |
FHLMC | | | 3.50 | | | | 5-1-2033 | | | | 1,873,677 | | | | 1,910,952 | |
FHLMC | | | 4.00 | | | | 6-1-2025 | | | | 1,399,428 | | | | 1,455,903 | |
FHLMC | | | 4.00 | | | | 5-1-2026 | | | | 2,425,294 | | | | 2,518,443 | |
FHLMC | | | 4.00 | | | | 9-1-2030 | | | | 284,455 | | | | 299,306 | |
FHLMC | | | 4.00 | | | | 3-1-2031 | | | | 953,657 | | | | 1,003,330 | |
FHLMC | | | 4.00 | | | | 6-1-2031 | | | | 1,843,819 | | | | 1,910,242 | |
FHLMC | | | 4.00 | | | | 3-1-2032 | | | | 3,009,749 | | | | 3,169,575 | |
FHLMC | | | 4.00 | | | | 3-1-2032 | | | | 1,271,449 | | | | 1,338,928 | |
FHLMC | | | 4.00 | | | | 3-1-2032 | | | | 1,841,655 | | | | 1,934,919 | |
FHLMC | | | 4.00 | | | | 4-1-2032 | | | | 1,225,682 | | | | 1,290,217 | |
FHLMC | | | 4.00 | | | | 4-1-2032 | | | | 792,700 | | | | 818,368 | |
FHLMC | | | 4.00 | | | | 5-1-2032 | | | | 908,111 | | | | 952,339 | |
FHLMC | | | 4.00 | | | | 6-1-2032 | | | | 1,848,894 | | | | 1,946,198 | |
FHLMC | | | 4.00 | | | | 9-1-2032 | | | | 1,243,776 | | | | 1,285,640 | |
FHLMC | | | 4.00 | | | | 10-1-2033 | | | | 793,878 | | | | 831,552 | |
FHLMC | | | 4.00 | | | | 1-1-2034 | | | | 4,198,171 | | | | 4,352,795 | |
FHLMC | | | 4.00 | | | | 1-1-2034 | | | | 811,674 | | | | 850,192 | |
FHLMC | | | 4.00 | | | | 8-1-2035 | | | | 525,891 | | | | 545,044 | |
FHLMC | | | 4.50 | | | | 10-1-2018 | | | | 212,689 | | | | 214,633 | |
FHLMC | | | 4.50 | | | | 8-1-2020 | | | | 207,970 | | | | 209,870 | |
FHLMC | | | 4.50 | | | | 4-1-2031 | | | | 1,837,342 | | | | 1,932,461 | |
FHLMC Multifamily Structured Pass-Through Certificates Series K017 Class A1 | | | 1.89 | | | | 12-25-2020 | | | | 1,467,532 | | | | 1,460,675 | |
FHLMC Series 3632 Class PK | | | 5.00 | | | | 2-15-2040 | | | | 5,324,373 | | | | 5,689,013 | |
FHLMC Series 3653 Class AU | | | 4.00 | | | | 4-15-2040 | | | | 1,750,275 | | | | 1,797,017 | |
FNMA ¤ | | | 0.00 | | | | 10-9-2019 | | | | 12,410,000 | | | | 11,943,561 | |
FNMA (12 Month LIBOR +1.61%) ± | | | 2.74 | | | | 11-1-2047 | | | | 2,619,963 | | | | 2,604,014 | |
FNMA (12 Month LIBOR +1.61%) ± | | | 2.94 | | | | 11-1-2047 | | | | 3,765,042 | | | | 3,768,846 | |
FNMA (12 Month LIBOR +1.61%) ± | | | 2.95 | | | | 10-1-2047 | | | | 798,502 | | | | 800,943 | |
FNMA (12 Month LIBOR +1.62%) ± | | | 2.98 | | | | 9-1-2047 | | | | 8,298,303 | | | | 8,339,847 | |
FNMA | | | 3.00 | | | | 7-1-2026 | | | | 60,000,000 | | | | 60,241,758 | |
FNMA | | | 3.50 | | | | 7-1-2027 | | | | 15,013,471 | | | | 15,479,970 | |
FNMA | | | 3.50 | | | | 5-1-2028 | | | | 2,864,672 | | | | 2,916,704 | |
FNMA | | | 3.50 | | | | 2-1-2031 | | | | 1,124,988 | | | | 1,147,257 | |
FNMA | | | 3.50 | | | | 7-1-2031 | | | | 288,700 | | | | 294,298 | |
FNMA | | | 3.50 | | | | 10-1-2032 | �� | | | 808,748 | | | | 810,815 | |
FNMA | | | 3.50 | | | | 3-1-2033 | | | | 1,526,458 | | | | 1,554,417 | |
FNMA | | | 4.00 | | | | 12-1-2025 | | | | 2,993,164 | | | | 3,078,983 | |
FNMA | | | 4.00 | | | | 1-1-2026 | | | | 1,969,057 | | | | 2,025,316 | |
FNMA | | | 4.00 | | | | 3-1-2026 | | | | 2,635,577 | | | | 2,741,191 | |
FNMA | | | 4.00 | | | | 3-1-2026 | | | | 1,568,957 | | | | 1,630,307 | |
FNMA | | | 4.00 | | | | 5-1-2026 | | | | 539,198 | | | | 560,885 | |
FNMA | | | 4.00 | | | | 3-1-2029 | | | | 3,245,224 | | | | 3,372,287 | |
FNMA | | | 4.00 | | | | 5-1-2029 | | | | 3,469,012 | | | | 3,568,081 | |
FNMA | | | 4.00 | | | | 6-1-2029 | | | | 1,884,237 | | | | 1,966,732 | |
FNMA | | | 4.00 | | | | 12-1-2029 | | | | 1,251,158 | | | | 1,299,399 | |
FNMA | | | 4.00 | | | | 9-1-2030 | | | | 355,641 | | | | 373,448 | |
FNMA | | | 4.00 | | | | 10-1-2030 | | | | 733,289 | | | | 757,084 | |
The accompanying notes are an integral part of these financial statements.
| | | | |
| 8 | | Wells Fargo Short Duration Government Bond Fund | | Portfolio of investments—February 28, 2018 (unaudited) |
| | | | | | | | | | | | | | | | |
| Security name | | Interest rate | | | Maturity date | | | Principal | | | Value | |
| | | | |
Agency Securities (continued) | | | | | | | | | | | | | | | | |
FNMA | | | 4.00 | % | | | 4-1-2031 | | | $ | 743,040 | | | $ | 767,124 | |
FNMA | | | 4.00 | | | | 12-1-2031 | | | | 9,219,865 | | | | 9,570,712 | |
FNMA | | | 4.00 | | | | 1-1-2032 | | | | 3,784,033 | | | | 3,928,205 | |
FNMA | | | 4.00 | | | | 2-1-2032 | | | | 4,112,766 | | | | 4,269,393 | |
FNMA | | | 4.00 | | | | 3-1-2032 | | | | 1,152,591 | | | | 1,206,780 | |
FNMA | | | 4.00 | | | | 3-1-2032 | | | | 1,925,512 | | | | 2,022,006 | |
FNMA | | | 4.00 | | | | 4-1-2032 | | | | 1,917,158 | | | | 2,005,677 | |
FNMA | | | 4.00 | | | | 4-1-2032 | | | | 2,599,987 | | | | 2,717,114 | |
FNMA | | | 4.00 | | | | 4-1-2032 | | | | 871,235 | | | | 908,159 | |
FNMA | | | 4.00 | | | | 5-1-2032 | | | | 1,156,785 | | | | 1,212,611 | |
FNMA | | | 4.00 | | | | 5-1-2032 | | | | 2,267,300 | | | | 2,374,335 | |
FNMA | | | 4.00 | | | | 5-1-2032 | | | | 680,220 | | | | 710,718 | |
FNMA | | | 4.00 | | | | 5-1-2032 | | | | 2,961,072 | | | | 3,097,419 | |
FNMA | | | 4.00 | | | | 5-1-2032 | | | | 3,354,719 | | | | 3,506,188 | |
FNMA | | | 4.00 | | | | 6-1-2032 | | | | 2,824,861 | | | | 2,961,287 | |
FNMA | | | 4.00 | | | | 6-1-2032 | | | | 4,360,709 | | | | 4,568,555 | |
FNMA | | | 4.00 | | | | 6-1-2032 | | | | 3,115,592 | | | | 3,216,524 | |
FNMA | | | 4.00 | | | | 9-1-2032 | | | | 556,337 | | | | 581,319 | |
FNMA | | | 4.00 | | | | 10-1-2032 | | | | 1,017,240 | | | | 1,068,095 | |
FNMA | | | 4.00 | | | | 2-1-2033 | | | | 128,000 | | | | 134,429 | |
FNMA | | | 4.00 | | | | 3-1-2033 | | | | 13,264,432 | | | | 13,769,565 | |
FNMA | | | 4.00 | | | | 10-1-2033 | | | | 1,203,629 | | | | 1,248,764 | |
FNMA | | | 4.00 | | | | 12-1-2033 | | | | 3,744,460 | | | | 3,903,444 | |
FNMA | | | 4.00 | | | | 2-1-2034 | | | | 7,084,771 | | | | 7,356,838 | |
FNMA | | | 4.00 | | | | 7-1-2034 | | | | 1,617,288 | | | | 1,676,881 | |
FNMA | | | 4.00 | | | | 11-1-2046 | | | | 13,551,556 | | | | 14,082,777 | |
FNMA | | | 4.50 | | | | 1-1-2020 | | | | 2,177,754 | | | | 2,191,936 | |
FNMA | | | 4.50 | | | | 5-1-2020 | | | | 1,782,302 | | | | 1,798,335 | |
FNMA | | | 4.50 | | | | 10-1-2020 | | | | 447,588 | | | | 450,503 | |
FNMA | | | 4.50 | | | | 4-1-2024 | | | | 2,830,740 | | | | 2,949,347 | |
FNMA | | | 4.50 | | | | 6-1-2025 | | | | 1,093,311 | | | | 1,138,815 | |
FNMA | | | 4.50 | | | | 10-1-2026 | | | | 3,278,534 | | | | 3,415,790 | |
FNMA | | | 4.50 | | | | 10-1-2026 | | | | 3,533,512 | | | | 3,686,182 | |
FNMA | | | 4.50 | | | | 3-1-2027 | | | | 5,209,950 | | | | 5,426,928 | |
FNMA | | | 4.50 | | | | 4-1-2031 | | | | 508,329 | | | | 539,077 | |
FNMA | | | 4.50 | | | | 4-1-2031 | | | | 595,071 | | | | 630,928 | |
FNMA | | | 4.50 | | | | 4-1-2031 | | | | 363,160 | | | | 385,347 | |
FNMA | | | 4.50 | | | | 4-1-2031 | | | | 284,440 | | | | 301,593 | |
FNMA | | | 4.50 | | | | 1-1-2034 | | | | 347,435 | | | | 368,495 | |
FNMA | | | 4.50 | | | | 1-1-2034 | | | | 312,941 | | | | 331,858 | |
FNMA | | | 4.50 | | | | 9-1-2037 | | | | 713,966 | | | | 762,301 | |
FNMA | | | 5.00 | | | | 2-1-2023 | | | | 1,016,977 | | | | 1,031,157 | |
FNMA | | | 5.00 | | | | 5-1-2023 | | | | 315,153 | | | | 327,855 | |
FNMA | | | 5.00 | | | | 8-1-2030 | | | | 550,672 | | | | 587,888 | |
FNMA | | | 5.00 | | | | 10-1-2040 | | | | 1,992,602 | | | | 2,154,271 | |
FNMA | | | 5.00 | | | | 5-1-2046 | | | | 754,223 | | | | 815,617 | |
FNMA Series 2009-20 Class DT | | | 4.50 | | | | 4-25-2039 | | | | 3,443,698 | | | | 3,637,326 | |
FNMA Series 2013-103 Class H | | | 4.50 | | | | 3-25-2038 | | | | 3,419,014 | | | | 3,562,452 | |
FNMA Series 2013-90 Class A | | | 4.00 | | | | 11-25-2038 | | | | 5,034,730 | | | | 5,151,234 | |
FNMA Series 2015-18 Class HE | | | 4.00 | | | | 9-25-2041 | | | | 11,000,891 | | | �� | 11,406,546 | |
The accompanying notes are an integral part of these financial statements.
| | | | | | |
| Portfolio of investments—February 28, 2018 (unaudited) | | Wells Fargo Short Duration Government Bond Fund | | | 9 | |
| | | | | | | | | | | | | | | | |
| Security name | | Interest rate | | | Maturity date | | | Principal | | | Value | |
| | | | |
Agency Securities (continued) | | | | | | | | | | | | | | | | |
FNMA Series 2015-M10 Class FA (1 Month LIBOR +0.25%) ± | | | 1.81 | % | | | 3-25-2019 | | | $ | 2,861,065 | | | $ | 2,859,587 | |
FNMA Series 2015-M4 Class FA (1 Month LIBOR +0.21%) ± | | | 1.77 | | | | 9-25-2018 | | | | 2,437,994 | | | | 2,435,681 | |
FNMA Series 2015-M8 Class FA (1 Month LIBOR +0.17%) ± | | | 1.73 | | | | 11-25-2018 | | | | 3,660,697 | | | | 3,657,921 | |
GNMA | | | 5.00 | | | | 10-15-2039 | | | | 1,468,013 | | | | 1,586,106 | |
GNMA Series 2011-137 Class WA ±± | | | 5.55 | | | | 7-20-2040 | | | | 3,334,976 | | | | 3,646,758 | |
GNMA Series 2016-112 Class AW ±± | | | 7.16 | | | | 12-20-2040 | | | | 2,822,732 | | | | 3,230,949 | |
| | | | |
Total Agency Securities (Cost $346,190,399) | | | | | | | | | | | | | | | 340,222,867 | |
| | | | | | | | | | | | | | | | |
| | | | |
Asset-Backed Securities: 11.32% | | | | | | | | | | | | | | | | |
Capital Auto Receivables Asset Trust Series 2017-1 Class A4 144A | | | 2.22 | | | | 3-21-2022 | | | | 3,674,000 | | | | 3,615,201 | |
Hertz Vehicle Financing LLC Series 2015-1A Class A 144A | | | 2.73 | | | | 3-25-2021 | | | | 7,968,000 | | | | 7,904,619 | |
Hertz Vehicle Financing LLC Series 2015-3A Class A 144A | | | 2.67 | | | | 9-25-2021 | | | | 10,196,000 | | | | 10,066,324 | |
Navient Student Loan Trust Series 2014-CTA Class A (1 Month LIBOR +0.70%) 144A± | | | 2.29 | | | | 9-16-2024 | | | | 4,453,205 | | | | 4,464,293 | |
Navient Student Loan Trust Series 2017-4A Class A2 (1 Month LIBOR +0.50%) 144A± | | | 2.12 | | | | 9-27-2066 | | | | 7,650,000 | | | | 7,701,400 | |
Navient Student Loan Trust Series 2018-1A Class A2 (1 Month LIBOR +0.35%) 144A± | | | 1.91 | | | | 3-25-2067 | | | | 3,883,000 | | | | 3,879,321 | |
Nelnet Student Loan Trust Series 2004-4 Class A5 (3 Month LIBOR +0.16%) ± | | | 1.91 | | | | 1-25-2037 | | | | 2,735,579 | | | | 2,729,890 | |
Nelnet Student Loan Trust Series 2006-1 Class A5 (3 Month LIBOR +0.11%) ± | | | 1.56 | | | | 8-23-2027 | | | | 1,403,229 | | | | 1,400,623 | |
Nelnet Student Loan Trust Series 2016-1A Class A (1 Month LIBOR +0.80%) 144A± | | | 2.42 | | | | 9-25-2065 | | | | 7,087,918 | | | | 7,160,798 | |
SLC Student Loan Trust Series 2010-1 Class A (3 Month LIBOR +0.88%) ± | | | 2.34 | | | | 11-25-2042 | | | | 1,632,728 | | | | 1,653,104 | |
SLM Student Loan Trust Series 2005-6 Class A5B (3 Month LIBOR +1.20%) ± | | | 2.95 | | | | 7-27-2026 | | | | 309,347 | | | | 309,961 | |
SLM Student Loan Trust Series 2005-6 Class A6 (3 Month LIBOR +0.14%) ± | | | 1.89 | | | | 10-27-2031 | | | | 3,656,800 | | | | 3,628,405 | |
SLM Student Loan Trust Series 2010-A Class 1A (Prime rate -0.05%) 144A± | | | 4.45 | | | | 5-16-2044 | | | | 1,072,889 | | | | 1,093,449 | |
SLM Student Loan Trust Series 2012-3 Class A (1 Month LIBOR +0.65%) ± | | | 2.27 | | | | 12-27-2038 | | | | 7,044,216 | | | | 7,120,946 | |
SLM Student Loan Trust Series 2014-A Class A2A 144A | | | 2.59 | | | | 1-15-2026 | | | | 1,859,466 | | | | 1,859,594 | |
SLM Student Loan Trust Series 2014-A Class A2B (1 Month LIBOR +1.15%) 144A± | | | 2.74 | | | | 1-15-2026 | | | | 2,712,003 | | | | 2,728,456 | |
SMB Private Education Loan Trust Series 2015-A Class A2A 144A | | | 2.49 | | | | 6-15-2027 | | | | 4,323,734 | | | | 4,272,050 | |
SMB Private Education Loan Trust Series 2015-C Class A2A 144A | | | 2.75 | | | | 7-15-2027 | | | | 4,586,414 | | | | 4,560,350 | |
SMB Private Education Loan Trust Series 2016-B Class A2B (1 Month LIBOR +1.45%) 144A± | | | 3.04 | | | | 2-17-2032 | | | | 2,970,000 | | | | 3,053,045 | |
| | | | |
Total Asset-Backed Securities (Cost $79,311,817) | | | | | | | | | | | | | | | 79,201,829 | |
| | | | | | | | | | | | | | | | |
| | | | |
Non-Agency Mortgage-Backed Securities: 4.96% | | | | | | | | | | | | | | | | |
Colt Funding LLC Series 2017-2 Class A1A 144A±± | | | 2.42 | | | | 10-25-2047 | | | | 5,432,679 | | | | 5,441,994 | |
DBUBS Mortgage Trust Series 2011-LC2A Class A1 144A | | | 3.53 | | | | 7-10-2044 | | | | 403,063 | | | | 407,856 | |
GS Mortgage Securities Trust Series 2010-C1 Class A1 144A | | | 3.68 | | | | 8-10-2043 | | | | 1,009,322 | | | | 1,018,131 | |
GS Mortgage Securities Trust Series 2010-C2 Class A1 144A | | | 3.85 | | | | 12-10-2043 | | | | 676,096 | | | | 686,854 | |
GS Mortgage Securities Trust Series 2012-GCJ7 Class AAB | | | 2.94 | | | | 5-10-2045 | | | | 2,275,316 | | | | 2,284,580 | |
JPMorgan Chase Commercial Mortgage Securities Trust Series 2010-C1 Class A2 144A | | | 4.61 | | | | 6-15-2043 | | | | 1,417,538 | | | | 1,454,694 | |
JPMorgan Chase Commercial Mortgage Securities Trust Series 2011-C4 Class A3 144A | | | 4.11 | | | | 7-15-2046 | | | | 691,829 | | | | 693,371 | |
JPMorgan Chase Commercial Mortgage Securities Trust Series 2012-CBX Class A3 | | | 3.14 | | | | 6-15-2045 | | | | 1,059,627 | | | | 1,062,288 | |
JPMorgan Mortgage Trust Series 2017-5 Class A1 144A±± | | | 3.19 | | | | 10-26-2048 | | | | 3,653,328 | | | | 3,636,158 | |
Morgan Stanley Capital I Trust Series 2011-C2 Class A3 144A | | | 4.21 | | | | 6-15-2044 | | | | 498,347 | | | | 506,212 | |
SoFi Professional Loan Program LLC Series 2016-C Class A1 (1 Month LIBOR +1.10%) 144A± | | | 2.72 | | | | 10-27-2036 | | | | 2,404,212 | | | | 2,440,136 | |
SoFi Professional Loan Program LLC Series 2016-D Class A1 (1 Month LIBOR +0.95%) 144A± | | | 2.57 | | | | 1-25-2039 | | | | 5,658,671 | | | | 5,713,312 | |
SoFi Professional Loan Program LLC Series 2016-E Class A1 (1 Month LIBOR +0.85%) 144A± | | | 2.47 | | | | 7-25-2039 | | | | 2,712,865 | | | | 2,737,402 | |
SoFi Professional Loan Program LLC Series 2017-A Class A1 (1 Month LIBOR +0.70%) 144A± | | | 2.32 | | | | 3-26-2040 | | | | 3,439,841 | | | | 3,468,270 | |
The accompanying notes are an integral part of these financial statements.
| | | | |
| 10 | | Wells Fargo Short Duration Government Bond Fund | | Portfolio of investments—February 28, 2018 (unaudited) |
| | | | | | | | | | | | | | | | |
| Security name | | Interest rate | | | Maturity date | | | Principal | | | Value | |
| | | | |
Non-Agency Mortgage-Backed Securities (continued) | | | | | | | | | | | | | | | | |
SoFi Professional Loan Program LLC Series 2017-C Class A1 (1 Month LIBOR +0.60%) 144A± | | | 2.16 | % | | | 7-25-2040 | | | $ | 3,099,648 | | | $ | 3,119,486 | |
| | | | |
Total Non-Agency Mortgage-Backed Securities (Cost $34,935,362) | | | | | | | | | | | | | | | 34,670,744 | |
| | | | | | | | | | | | | | | | |
| | | | |
U.S. Treasury Securities: 41.11% | | | | | | | | | | | | | | | | |
U.S. Treasury Note | | | 0.75 | | | | 8-31-2018 | | | | 8,947,000 | | | | 8,895,275 | |
U.S. Treasury Note | | | 0.75 | | | | 9-30-2018 | | | | 23,793,000 | | | | 23,628,494 | |
U.S. Treasury Note | | | 0.88 | | | | 6-15-2019 | | | | 6,579,000 | | | | 6,472,348 | |
U.S. Treasury Note | | | 0.88 | | | | 9-15-2019 | | | | 8,977,000 | | | | 8,796,057 | |
U.S. Treasury Note | | | 1.00 | | | | 11-30-2018 | | | | 292,000 | | | | 289,833 | |
U.S. Treasury Note | | | 1.13 | | | | 6-15-2018 | | | | 22,800,000 | | | | 22,759,103 | |
U.S. Treasury Note | | | 1.13 | | | | 1-31-2019 | | | | 14,689,000 | | | | 14,562,193 | |
U.S. Treasury Note | | | 1.25 | | | | 12-31-2018 | | | | 9,514,000 | | | | 9,450,821 | |
U.S. Treasury Note | | | 1.25 | | | | 3-31-2019 | | | | 4,532,000 | | | | 4,490,044 | |
U.S. Treasury Note | | | 1.25 | | | | 6-30-2019 | | | | 9,555,000 | | | | 9,441,161 | |
U.S. Treasury Note | | | 1.38 | | | | 7-31-2019 | | | | 1,383,000 | | | | 1,367,549 | |
U.S. Treasury Note | | | 1.38 | | | | 9-30-2019 | | | | 7,304,000 | | | | 7,208,420 | |
U.S. Treasury Note | | | 1.38 | | | | 2-15-2020 | | | | 14,686,000 | | | | 14,433,011 | |
U.S. Treasury Note | | | 1.38 | | | | 9-30-2020 | | | | 6,039,000 | | | | 5,889,912 | |
U.S. Treasury Note | | | 1.50 | | | | 10-31-2019 | | | | 1,724,000 | | | | 1,703,662 | |
U.S. Treasury Note | | | 1.50 | | | | 4-15-2020 | | | | 2,742,000 | | | | 2,696,586 | |
U.S. Treasury Note | | | 1.50 | | | | 5-15-2020 | | | | 400,000 | | | | 393,016 | |
U.S. Treasury Note | | | 1.50 | | | | 8-15-2020 | | | | 495,000 | | | | 485,100 | |
U.S. Treasury Note | | | 1.63 | | | | 3-31-2019 | | | | 4,011,000 | | | | 3,989,535 | |
U.S. Treasury Note | | | 1.63 | | | | 10-15-2020 | | | | 39,105,000 | | | | 38,365,671 | |
U.S. Treasury Note | | | 1.75 | | | | 11-30-2019 | | | | 6,390,000 | | | | 6,336,584 | |
U.S. Treasury Note | | | 1.75 | | | | 11-15-2020 | | | | 8,740,000 | | | | 8,594,902 | |
U.S. Treasury Note | | | 1.88 | | | | 12-15-2020 | | | | 13,577,000 | | | | 13,387,665 | |
U.S. Treasury Note | | | 2.00 | | | | 1-15-2021 | | | | 9,881,000 | | | | 9,769,453 | |
U.S. Treasury Note | | | 2.25 | | | | 2-29-2020 | | | | 23,648,000 | | | | 23,643,381 | |
U.S. Treasury Note | | | 2.25 | | | | 2-15-2021 | | | | 40,676,000 | | | | 40,486,920 | |
| | | | |
Total U.S. Treasury Securities (Cost $289,140,286) | | | | | | | | | | | | | | | 287,536,696 | |
| | | | | | | | | | | | | | | | |
| | | | |
| | | Yield | | | | | | Shares | | | | |
| Short-Term Investments: 5.57% | | | | | | | | | | | | | | | | |
| | | | |
| Investment Companies: 5.57% | | | | | | | | | | | | | | | | |
Wells Fargo Government Money Market Fund Select Class (l)(u) | | | 1.29 | | | | | | | | 38,925,457 | | | | 38,925,457 | |
| | | | | | | | | | | | | | | | |
| | | | |
Total Short-Term Investments (Cost $38,925,457) | | | | | | | | | | | | | | | 38,925,457 | |
| | | | | | | | | | | | | | | | |
| | | | | | | | |
| Total investments in securities (Cost $788,503,321) | | | 111.60 | % | | | 780,557,593 | |
Other assets and liabilities, net | | | (11.60 | ) | | | (81,130,089 | ) |
| | | | | | | | |
| Total net assets | | | 100.00 | % | | $ | 699,427,504 | |
| | | | | | | | |
| ± | Variable rate investment. The rate shown is the rate in effect at period end. |
| ¤ | The security is issued in zero coupon form with no periodic interest payments. |
| ±± | The coupon of the security is adjusted based on the principal and interest payments received from the underlying pool of mortgages as well as the credit quality and the actual prepayment speed of the underlying mortgages. |
| 144A | The security may be resold in transactions exempt from registration, normally to qualified institutional buyers, pursuant to Rule 144A under the Securities Act of 1933. |
| (l) | The issuer of the security is an affiliated person of the Fund as defined in the Investment Company Act of 1940. |
| (u) | The rate represents the 7-day annualized yield at period end. |
The accompanying notes are an integral part of these financial statements.
| | | | | | |
| Portfolio of investments—February 28, 2018 (unaudited) | | Wells Fargo Short Duration Government Bond Fund | | | 11 | |
Futures Contracts
| | | | | | | | | | | | | | | | | | | | | | | | |
| Description | | Number of
contracts | | | Expiration
date | | | Notional
cost | | | Notional
value | | | Unrealized
gains | | | Unrealized
losses | |
Long | | | | | | | | | | | | | | | | | | | | | | | | |
2-Year U.S. Treasury Notes | | | 624 | | | | 6-29-2018 | | | $ | 132,581,686 | | | $ | 132,580,500 | | | $ | 0 | | | $ | (1,186 | ) |
Short | | | | | | | | | | | | | | | | | | | | | | | | |
5-Year U.S. Treasury Notes | | | (473) | | | | 6-29-2018 | | | $ | (53,851,081 | ) | | $ | (53,888,742 | ) | | $ | 0 | | | $ | (37,661 | ) |
10-Year Ultra Futures | | | (132) | | | | 6-20-2018 | | | | (16,858,335 | ) | | | (16,904,250 | ) | | | 0 | | | | (45,915 | ) |
| | | | | | | | | | | | | | | | | | | | | | | | |
| | | | | | | | | | | | | | | | | | $ | 0 | | | $ | (84,762 | ) |
| | | | | | | | | | | | | | | | | | | | | | | | |
Investments in Affiliates
An affiliated investment is an investment in which the Fund owns at least 5% of the outstanding voting shares of the issuer or as a result of other relationships, such as the Fund and the issuer having the same investment manager. Transactions with issuers that were either affiliated persons of the Fund at the beginning of the period or the end of the period were as follows:
| | | | | | | | | | | | | | | | | | | | | | | | | | | | | | | | | | | | |
| | | Shares,
beginning of
period | | | Shares
purchased | | | Shares
sold | | | Shares,
end of
period | | | Net
realized
gains
(losses) | | | Net
change in
unrealized
gains
(losses) | | | Income
from
affiliated
securities | | | Value,
end
of period | | | % of
net
assets | |
Short-Term Investments | | | | | | | | | | | | | | | | | | | | | | | | | | | | | | | | | | | | |
Investment Companies | | | | | | | | | | | | | | | | | | | | | | | | | | | | | | | | | | | | |
Wells Fargo Government Money Market Fund Select Class | | | 12,155,202 | | | | 495,799,841 | | | | 469,029,586 | | | | 38,925,457 | | | $ | 0 | | | $ | 0 | | | $ | 95,527 | | | $ | 38,925,457 | | | | 5.57 | % |
The accompanying notes are an integral part of these financial statements.
| | | | |
| 12 | | Wells Fargo Short Duration Government Bond Fund | | Statement of assets and liabilities—February 28, 2018 (unaudited) |
| | | | |
| | | | |
| |
Assets | | | | |
Investments in unaffiliated securities, at value (cost $749,577,864) | | $ | 741,632,136 | |
Investments in affiliated securities, at value (cost $38,925,457) | | | 38,925,457 | |
Segregated cash for future contracts | | | 525,000 | |
Principal paydown receivable | | | 26,618 | |
Receivable for Fund shares sold | | | 174,905 | |
Receivable for interest | | | 1,873,343 | |
Prepaid expenses and other assets | | | 110,241 | |
| | | | |
Total assets | | | 783,267,700 | |
| | | | |
| |
Liabilities | | | | |
Payable for investments purchased | | | 82,125,273 | |
Payable for Fund shares redeemed | | | 1,254,516 | |
Management fee payable | | | 155,739 | |
Payable for daily variation margin on open futures contracts | | | 104,156 | |
Dividends payable | | | 50,547 | |
Administration fees payable | | | 45,823 | |
Distribution fee payable | | | 9,996 | |
Trustees’ fees and expenses payable | | | 1,629 | |
Accrued expenses and other liabilities | | | 92,517 | |
| | | | |
Total liabilities | | | 83,840,196 | |
| | | | |
Total net assets | | $ | 699,427,504 | |
| | | | |
| |
NET ASSETS CONSIST OF | | | | |
Paid-in capital | | $ | 774,697,298 | |
Overdistributed net investment income | | | (1,919,236 | ) |
Accumulated net realized losses on investments | | | (65,320,068 | ) |
Net unrealized losses on investments | | | (8,030,490 | ) |
| | | | |
Total net assets | | $ | 699,427,504 | |
| | | | |
| |
COMPUTATION OF NET ASSET VALUE AND OFFERING PRICE PER SHARE | | | | |
Net assets – Class A | | $ | 35,995,672 | |
Shares outstanding – Class A1 | | | 3,719,007 | |
Net asset value per share – Class A | | | $9.68 | |
Maximum offering price per share – Class A2 | | | $9.88 | |
Net assets – Class C | | $ | 17,209,416 | |
Shares outstanding – Class C1 | | | 1,775,031 | |
Net asset value per share – Class C | | | $9.70 | |
Net assets – Class R6 | | $ | 29,413,633 | |
Shares outstanding – Class R61 | | | 3,027,946 | |
Net asset value per share – Class R6 | | | $9.71 | |
Net assets – Administrator Class | | $ | 77,328,146 | |
Shares outstanding – Administrator Class1 | | | 7,974,751 | |
Net asset value per share – Administrator Class | | | $9.70 | |
Net assets – Institutional Class | | $ | 539,480,637 | |
Shares outstanding – Institutional Class1 | | | 55,649,777 | |
Net asset value per share – Institutional Class | | | $9.69 | |
| 1 | The Fund has an unlimited number of authorized shares. |
| 2 | Maximum offering price is computed as 100/98 of net asset value. On investments of $50,000 or more, the offering price is reduced. |
The accompanying notes are an integral part of these financial statements.
| | | | | | |
| Statement of operations—six months ended February 28, 2018 (unaudited) | | Wells Fargo Short Duration Government Bond Fund | | | 13 | |
| | | | |
| | | | |
| |
Investment income | | | | |
Interest | | $ | 7,638,134 | |
Income from affiliated securities | | | 95,527 | |
| | | | |
Total investment income | | | 7,733,661 | |
| | | | |
| |
Expenses | | | | |
Management fee | | | 1,361,408 | |
Administration fees | | | | |
Class A | | | 33,843 | |
Class C | | | 14,903 | |
Class R6 | | | 13,303 | |
Administrator Class | | | 41,970 | |
Institutional Class | | | 217,754 | |
Shareholder servicing fees | | | | |
Class A | | | 52,879 | |
Class C | | | 23,285 | |
Administrator Class | | | 104,926 | |
Distribution fee | | | | |
Class C | | | 69,855 | |
Custody and accounting fees | | | 33,704 | |
Professional fees | | | 24,973 | |
Registration fees | | | 33,340 | |
Shareholder report expenses | | | 22,357 | |
Trustees’ fees and expenses | | | 11,390 | |
Other fees and expenses | | | 7,220 | |
| | | | |
Total expenses | | | 2,067,110 | |
Less: Fee waivers and/or expense reimbursements | | | (200,514 | ) |
| | | | |
Net expenses | | | 1,866,596 | |
| | | | |
Net investment income | | | 5,867,065 | |
| | | | |
| |
REALIZED AND UNREALIZED GAINS (LOSSES) ON INVESTMENTS | | | | |
| |
Net realized gains (losses) on: | | | | |
Unaffiliated securities | | | (4,840,668 | ) |
Futures transactions | | | 727,364 | |
| | | | |
Net realized losses on investments | | | (4,113,304 | ) |
| | | | |
| |
Net change in unrealized gains (losses) on: | | | | |
Unaffiliated securities | | | (7,111,542 | ) |
Futures transactions | | | (17,583 | ) |
| | | | |
Net change in unrealized gains (losses) on investments | | | (7,129,125 | ) |
| | | | |
Net realized and unrealized gains (losses) on investments | | | (11,242,429 | ) |
| | | | |
Net decrease in net assets resulting from operations | | $ | (5,375,364 | ) |
| | | | |
The accompanying notes are an integral part of these financial statements.
| | | | |
| 14 | | Wells Fargo Short Duration Government Bond Fund | | Statement of changes in net assets |
| | | | | | | | | | | | | | | | |
| | | Six months ended
February 28, 2018
(unaudited) | | | Year ended
August 31, 2017 | |
| | | | |
Operations | | | | | | | | | | | | | | | | |
Net investment income | | | | | | $ | 5,867,065 | | | | | | | $ | 11,107,728 | |
Net realized losses on investments | | | | | | | (4,113,304 | ) | | | | | | | (5,488,498 | ) |
Net change in unrealized gains (losses) on investments | | | | | | | (7,129,125 | ) | | | | | | | 1,993,374 | |
| | | | |
Net increase (decrease) in net assets resulting from operations | | | | | | | (5,375,364 | ) | | | | | | | 7,612,604 | |
| | | | |
| | | | |
Distributions to shareholders from | | | | | | | | | | | | | | | | |
Net investment income | | | | | | | | | | | | | | | | |
Class A | | | | | | | (393,469 | ) | | | | | | | (887,555 | ) |
Class B | | | | | | | N/A | | | | | | | | (73 | )1 |
Class C | | | | | | | (104,424 | ) | | | | | | | (194,088 | ) |
Class R6 | | | | | | | (969,343 | ) | | | | | | | (4,107,221 | ) |
Administrator Class | | | | | | | (859,926 | ) | | | | | | | (1,874,754 | ) |
Institutional Class | | | | | | | (6,082,212 | ) | | | | | | | (11,823,677 | ) |
| | | | |
Total distributions to shareholders | | | | | | | (8,409,374 | ) | | | | | | | (18,887,368 | ) |
| | | | |
| | | | |
Capital share transactions | | | Shares | | | | | | | | Shares | | | | | |
Proceeds from shares sold | | | | | | | | | | | | | | | | |
Class A | | | 54,500 | | | | 533,116 | | | | 2,522,578 | | | | 25,119,924 | |
Class C | | | 16,317 | | | | 160,410 | | | | 152,650 | | | | 1,513,522 | |
Class R6 | | | 1,062,810 | | | | 10,468,994 | | | | 2,382,978 | | | | 23,634,167 | |
Administrator Class | | | 205,678 | | | | 2,016,935 | | | | 884,562 | | | | 8,769,727 | |
Institutional Class | | | 9,787,754 | | | | 95,884,569 | | | | 21,525,925 | | | | 213,452,302 | |
| | | | |
| | | | | | | 109,064,024 | | | | | | | | 272,489,642 | |
| | | | |
Reinvestment of distributions | | | | | | | | | | | | | | | | |
Class A | | | 37,442 | | | | 365,468 | | | | 82,087 | | | | 811,706 | |
Class B | | | N/A | | | | N/A | | | | 7 | 1 | | | 68 | 1 |
Class C | | | 9,747 | | | | 95,284 | | | | 17,877 | | | | 177,097 | |
Class R6 | | | 86,196 | | | | 847,250 | | | | 414,035 | | | | 4,107,221 | |
Administrator Class | | | 87,262 | | | | 853,239 | | | | 185,942 | | | | 1,841,783 | |
Institutional Class | | | 593,960 | | | | 5,806,117 | | | | 1,135,203 | | | | 11,238,682 | |
| | | | |
| | | | | | | 7,967,358 | | | | | | | | 18,176,557 | |
| | | | |
Payment for shares redeemed | | | | | | | | | | | | | | | | |
Class A | | | (1,638,295 | ) | | | (16,048,684 | ) | | | (3,159,388 | ) | | | (31,338,166 | ) |
Class B | | | N/A | | | | N/A | | | | (4,044 | )1 | | | (40,138 | )1 |
Class C | | | (279,768 | ) | | | (2,737,791 | ) | | | (893,469 | ) | | | (8,848,973 | ) |
Class R6 | | | (15,526,999 | ) | | | (152,631,053 | ) | | | (8,804,898 | ) | | | (87,286,298 | ) |
Administrator Class | | | (1,408,430 | ) | | | (13,777,121 | ) | | | (4,164,783 | ) | | | (41,236,752 | ) |
Institutional Class | | | (13,466,776 | ) | | | (132,078,518 | ) | | | (30,492,116 | ) | | | (302,273,975 | ) |
| | | | |
| | | | | | | (317,273,167 | ) | | | | | | | (471,024,302 | ) |
| | | | |
Net decrease in net assets resulting from capital share transactions | | | | | | | (200,241,785 | ) | | | | | | | (180,358,103 | ) |
| | | | |
Total decrease in net assets | | | | | | | (214,026,523 | ) | | | | | | | (191,632,867 | ) |
| | | | |
| | | | |
Net assets | | | | | | | | | | | | | | | | |
Beginning of period | | | | | | | 913,454,027 | | | | | | | | 1,105,086,894 | |
| | | | |
End of period | | | | | | $ | 699,427,504 | | | | | | | $ | 913,454,027 | |
| | | | |
Undistributed (overdistributed) net investment income | | | | | | $ | (1,919,236 | ) | | | | | | $ | 623,073 | |
| | | | |
| 1 | For the period from September 1, 2016 to December 5, 2016. Effective at the close of business on December 5, 2016, Class B shares were converted to Class A shares and are no longer offered by the Fund. |
The accompanying notes are an integral part of these financial statements.
| | | | | | |
| Financial highlights | | Wells Fargo Short Duration Government Bond Fund | | | 15 | |
(For a share outstanding throughout each period)
| | | | | | | | | | | | | | | | | | | | | | | | |
| | | Six months ended
February 28, 2018 (unaudited) | | | Year ended August 31 | |
| CLASS A | | | 2017 | | | 2016 | | | 2015 | | | 2014 | | | 2013 | |
Net asset value, beginning of period | | | $9.85 | | | | $9.96 | | | | $10.02 | | | | $10.08 | | | | $10.09 | | | | $10.35 | |
Net investment income | | | 0.06 | | | | 0.07 | | | | 0.07 | | | | 0.04 | | | | 0.03 | | | | 0.08 | 1 |
Net realized and unrealized gains (losses) on investments | | | (0.14 | ) | | | (0.03 | ) | | | 0.02 | | | | 0.02 | | | | 0.07 | | | | (0.14 | ) |
| | | | | | | | | | | | | | | | | | | | | | | | |
Total from investment operations | | | (0.08 | ) | | | 0.04 | | | | 0.09 | | | | 0.06 | | | | 0.10 | | | | (0.06 | ) |
Distributions to shareholders from | | | | | | | | | | | | | | | | | | | | | | | | |
Net investment income | | | (0.09 | ) | | | (0.15 | ) | | | (0.15 | ) | | | (0.12 | ) | | | (0.11 | ) | | | (0.20 | ) |
Net asset value, end of period | | | $9.68 | | | | $9.85 | | | | $9.96 | | | | $10.02 | | | | $10.08 | | | | $10.09 | |
Total return2 | | | (0.81 | )% | | | 0.45 | % | | | 0.90 | % | | | 0.55 | % | | | 1.03 | % | | | (0.63 | )% |
Ratios to average net assets (annualized) | | | | | | | | | | | | | | | | | | | | | | | | |
Gross expenses | | | 0.79 | % | | | 0.79 | % | | | 0.78 | % | | | 0.78 | % | | | 0.80 | % | | | 0.82 | % |
Net expenses | | | 0.78 | % | | | 0.78 | % | | | 0.78 | % | | | 0.78 | % | | | 0.78 | % | | | 0.79 | % |
Net investment income | | | 1.21 | % | | | 0.79 | % | | | 0.70 | % | | | 0.55 | % | | | 0.38 | % | | | 0.80 | % |
Supplemental data | | | | | | | | | | | | | | | | | | | | | | | | |
Portfolio turnover rate | | | 157 | % | | | 348 | % | | | 284 | % | | | 500 | % | | | 408 | % | | | 324 | % |
Net assets, end of period (000s omitted) | | | $35,996 | | | | $51,890 | | | | $57,976 | | | | $62,504 | | | | $107,005 | | | | $126,316 | |
| 1 | Calculated based upon average shares outstanding |
| 2 | Total return calculations do not include any sales charges. Returns for periods of less than one year are not annualized. |
The accompanying notes are an integral part of these financial statements.
| | | | |
| 16 | | Wells Fargo Short Duration Government Bond Fund | | Financial highlights |
(For a share outstanding throughout each period)
| | | | | | | | | | | | | | | | | | | | | | | | |
| | | Six months ended
February 28, 2018 (unaudited) | | | Year ended August 31 | |
| CLASS C | | | 2017 | | | 2016 | | | 2015 | | | 2014 | | | 2013 | |
Net asset value, beginning of period | | | $9.87 | | | | $9.98 | | | | $10.03 | | | | $10.10 | | | | $10.11 | | | | $10.37 | |
Net investment income (loss) | | | 0.02 | | | | 0.00 | 1,2 | | | (0.01 | ) | | | (0.03 | ) | | | (0.05 | ) | | | 0.01 | 1 |
Net realized and unrealized gains (losses) on investments | | | (0.14 | ) | | | (0.03 | ) | | | 0.03 | | | | 0.00 | 2 | | | 0.08 | | | | (0.15 | ) |
| | | | | | | | | | | | | | | | | | | | | | | | |
Total from investment operations | | | (0.12 | ) | | | (0.03 | ) | | | 0.02 | | | | (0.03 | ) | | | 0.03 | | | | (0.14 | ) |
Distributions to shareholders from | | | | | | | | | | | | | | | | | | | | | | | | |
Net investment income | | | (0.05 | ) | | | (0.08 | ) | | | (0.07 | ) | | | (0.04 | ) | | | (0.04 | ) | | | (0.12 | ) |
Net asset value, end of period | | | $9.70 | | | | $9.87 | | | | $9.98 | | | | $10.03 | | | | $10.10 | | | | $10.11 | |
Total return3 | | | (1.17 | )% | | | (0.30 | )% | | | 0.25 | % | | | (0.30 | )% | | | 0.28 | % | | | (1.37 | )% |
Ratios to average net assets (annualized) | | | | | | | | | | | | | | | | | | | | | | | | |
Gross expenses | | | 1.54 | % | | | 1.54 | % | | | 1.53 | % | | | 1.53 | % | | | 1.55 | % | | | 1.57 | % |
Net expenses | | | 1.53 | % | | | 1.53 | % | | | 1.53 | % | | | 1.53 | % | | | 1.53 | % | | | 1.54 | % |
Net investment income (loss) | | | 0.47 | % | | | 0.04 | % | | | (0.05 | )% | | | (0.20 | )% | | | (0.37 | )% | | | 0.05 | % |
Supplemental data | | | | | | | | | | | | | | | | | | | | | | | | |
Portfolio turnover rate | | | 157 | % | | | 348 | % | | | 284 | % | | | 500 | % | | | 408 | % | | | 324 | % |
Net assets, end of period (000s omitted) | | | $17,209 | | | | $20,026 | | | | $27,454 | | | | $31,910 | | | | $44,423 | | | | $63,126 | |
| 1 | Calculated based upon average shares outstanding |
| 2 | Amount is less than $0.005. |
| 3 | Total return calculations do not include any sales charges. Returns for periods of less than one year are not annualized. |
The accompanying notes are an integral part of these financial statements.
| | | | | | |
| Financial highlights | | Wells Fargo Short Duration Government Bond Fund | | | 17 | |
(For a share outstanding throughout each period)
| | | | | | | | | | | | | | | | | | | | | | | | |
| | | Six months ended
February 28, 2018 (unaudited) | | | Year ended August 31 | |
| CLASS R6 | | | 2017 | | | 2016 | | | 2015 | | | 2014 | | | 20131 | |
Net asset value, beginning of period | | | $9.89 | | | | $9.99 | | | | $10.05 | | | | $10.11 | | | | $10.13 | | | | $10.33 | |
Net investment income | | | 0.07 | 2 | | | 0.12 | 2 | | | 0.12 | | | | 0.09 | 2 | | | 0.08 | 2 | | | 0.13 | 2 |
Net realized and unrealized gains (losses) on investments | | | (0.14 | ) | | | (0.02 | ) | | | 0.01 | | | | 0.01 | | | | 0.05 | | | | (0.15 | ) |
| | | | | | | | | | | | | | | | | | | | | | | | |
Total from investment operations | | | (0.07 | ) | | | 0.10 | | | | 0.13 | | | | 0.10 | | | | 0.13 | | | | (0.02 | ) |
Distributions to shareholders from | | | | | | | | | | | | | | | | | | | | | | | | |
Net investment income | | | (0.11 | ) | | | (0.20 | ) | | | (0.19 | ) | | | (0.16 | ) | | | (0.15 | ) | | | (0.18 | ) |
Net asset value, end of period | | | $9.71 | | | | $9.89 | | | | $9.99 | | | | $10.05 | | | | $10.11 | | | | $10.13 | |
Total return3 | | | (0.60 | )% | | | 0.96 | % | | | 1.32 | % | | | 0.96 | % | | | 1.35 | % | | | (0.17 | )% |
Ratios to average net assets (annualized) | | | | | | | | | | | | | | | | | | | | | | | | |
Gross expenses | | | 0.41 | % | | | 0.41 | % | | | 0.40 | % | | | 0.40 | % | | | 0.41 | % | | | 0.43 | % |
Net expenses | | | 0.37 | % | | | 0.37 | % | | | 0.37 | % | | | 0.37 | % | | | 0.37 | % | | | 0.37 | % |
Net investment income | | | 1.49 | % | | | 1.19 | % | | | 1.11 | % | | | 0.88 | % | | | 0.76 | % | | | 0.81 | % |
Supplemental data | | | | | | | | | | | | | | | | | | | | | | | | |
Portfolio turnover rate | | | 157 | % | | | 348 | % | | | 284 | % | | | 500 | % | | | 408 | % | | | 324 | % |
Net assets, end of period (000s omitted) | | | $29,414 | | | | $172,106 | | | | $233,993 | | | | $231,878 | | | | $48,446 | | | | $2,983 | |
| 1 | For the period from November 30, 2012 (commencement of class operations) to August 31, 2013 |
| 2 | Calculated based upon average shares outstanding |
| 3 | Returns for periods of less than one year are not annualized. |
The accompanying notes are an integral part of these financial statements.
| | | | |
| 18 | | Wells Fargo Short Duration Government Bond Fund | | Financial highlights |
(For a share outstanding throughout each period)
| | | | | | | | | | | | | | | | | | | | | | | | |
| | | Six months ended
February 28, 2018 (unaudited) | | | Year ended August 31 | |
| ADMINISTRATOR CLASS | | | 2017 | | | 2016 | | | 2015 | | | 2014 | | | 2013 | |
Net asset value, beginning of period | | | $9.87 | | | | $9.98 | | | | $10.03 | | | | $10.10 | | | | $10.11 | | | | $10.36 | |
Net investment income | | | 0.06 | | | | 0.08 | | | | 0.08 | | | | 0.06 | | | | 0.06 | 1 | | | 0.10 | 1 |
Net realized and unrealized gains (losses) on investments | | | (0.13 | ) | | | (0.02 | ) | | | 0.04 | | | | 0.00 | 2 | | | 0.06 | | | | (0.13 | ) |
| | | | | | | | | | | | | | | | | | | | | | | | |
Total from investment operations | | | (0.07 | ) | | | 0.06 | | | | 0.12 | | | | 0.06 | | | | 0.12 | | | | (0.03 | ) |
Distributions to shareholders from | | | | | | | | | | | | | | | | | | | | | | | | |
Net investment income | | | (0.10 | ) | | | (0.17 | ) | | | (0.17 | ) | | | (0.13 | ) | | | (0.13 | ) | | | (0.22 | ) |
Net asset value, end of period | | | $9.70 | | | | $9.87 | | | | $9.98 | | | | $10.03 | | | | $10.10 | | | | $10.11 | |
Total return3 | | | (0.71 | )% | | | 0.63 | % | | | 1.18 | % | | | 0.63 | % | | | 1.21 | % | | | (0.34 | )% |
Ratios to average net assets (annualized) | | | | | | | | | | | | | | | | | | | | | | | | |
Gross expenses | | | 0.73 | % | | | 0.73 | % | | | 0.72 | % | | | 0.72 | % | | | 0.74 | % | | | 0.76 | % |
Net expenses | | | 0.60 | % | | | 0.60 | % | | | 0.60 | % | | | 0.60 | % | | | 0.60 | % | | | 0.60 | % |
Net investment income | | | 1.40 | % | | | 0.96 | % | | | 0.87 | % | | | 0.73 | % | | | 0.56 | % | | | 0.99 | % |
Supplemental data | | | | | | | | | | | | | | | | | | | | | | | | |
Portfolio turnover rate | | | 157 | % | | | 348 | % | | | 284 | % | | | 500 | % | | | 408 | % | | | 324 | % |
Net assets, end of period (000s omitted) | | | $77,328 | | | | $89,743 | | | | $121,576 | | | | $156,669 | | | | $191,469 | | | | $234,808 | |
| 1 | Calculated based upon average shares outstanding |
| 2 | Amount is less than $0.005. |
| 3 | Returns for periods of less than one year are not annualized. |
The accompanying notes are an integral part of these financial statements.
| | | | | | |
| Financial highlights | | Wells Fargo Short Duration Government Bond Fund | | | 19 | |
(For a share outstanding throughout each period)
| | | | | | | | | | | | | | | | | | | | | | | | |
| | | Six months ended
February 28, 2018 (unaudited) | | | Year ended August 31 | |
| INSTITUTIONAL CLASS | | | 2017 | | | 2016 | | | 2015 | | | 2014 | | | 2013 | |
Net asset value, beginning of period | | | $9.87 | | | | $9.98 | | | | $10.03 | | | | $10.10 | | | | $10.10 | | | | $10.36 | |
Net investment income | | | 0.08 | | | | 0.11 | | | | 0.11 | | | | 0.09 | 1 | | | 0.07 | | | | 0.12 | |
Net realized and unrealized gains (losses) on investments | | | (0.15 | ) | | | (0.03 | ) | | | 0.03 | | | | (0.01 | ) | | | 0.08 | | | | (0.15 | ) |
| | | | | | | | | | | | | | | | | | | | | | | | |
Total from investment operations | | | (0.07 | ) | | | 0.08 | | | | 0.14 | | | | 0.09 | | | | 0.15 | | | | (0.03 | ) |
Distributions to shareholders from | | | | | | | | | | | | | | | | | | | | | | | | |
Net investment income | | | (0.11 | ) | | | (0.19 | ) | | | (0.19 | ) | | | (0.15 | ) | | | (0.15 | ) | | | (0.23 | ) |
Net asset value, end of period | | | $9.69 | | | | $9.87 | | | | $9.98 | | | | $10.03 | | | | $10.10 | | | | $10.10 | |
Total return2 | | | (0.63 | )% | | | 0.81 | % | | | 1.37 | % | | | 0.81 | % | | | 1.50 | % | | | (0.26 | )% |
Ratios to average net assets (annualized) | | | | | | | | | | | | | | | | | | | | | | | | |
Gross expenses | | | 0.46 | % | | | 0.46 | % | | | 0.45 | % | | | 0.45 | % | | | 0.47 | % | | | 0.49 | % |
Net expenses | | | 0.42 | % | | | 0.42 | % | | | 0.42 | % | | | 0.42 | % | | | 0.42 | % | | | 0.42 | % |
Net investment income | | | 1.59 | % | | | 1.15 | % | | | 1.06 | % | | | 0.92 | % | | | 0.74 | % | | | 1.16 | % |
Supplemental data | | | | | | | | | | | | | | | | | | | | | | | | |
Portfolio turnover rate | | | 157 | % | | | 348 | % | | | 284 | % | | | 500 | % | | | 408 | % | | | 324 | % |
Net assets, end of period (000s omitted) | | | $539,481 | | | | $579,690 | | | | $664,047 | | | | $587,835 | | | | $903,096 | | | | $1,051,693 | |
| 1 | Calculated based upon average shares outstanding |
| 2 | Returns for periods of less than one year are not annualized. |
The accompanying notes are an integral part of these financial statements.
| | | | |
| 20 | | Wells Fargo Short Duration Government Bond Fund | | Notes to financial statements (unaudited) |
1. ORGANIZATION
Wells Fargo Funds Trust (the “Trust”), a Delaware statutory trust organized on March 10, 1999, is an open-end management investment company registered under the Investment Company Act of 1940, as amended (the “1940 Act”). As an investment company, the Trust follows the accounting and reporting guidance in Financial Accounting Standards Board Accounting Standards Codification Topic 946, Financial Services – Investment Companies. These financial statements report on the Wells Fargo Short Duration Government Bond Fund (the “Fund”) which is a diversified series of the Trust.
Effective at the close of business on December 5, 2016, Class B shares were converted to Class A shares and are no longer offered by the Fund. Information for Class B shares reflected in the financial statements represents activity through December 5, 2016.
2. SIGNIFICANT ACCOUNTING POLICIES
The following significant accounting policies, which are consistently followed in the preparation of the financial statements of the Fund, are in conformity with U.S. generally accepted accounting principles which require management to make estimates and assumptions that affect the reported amounts of assets and liabilities, disclosure of contingent assets and liabilities at the date of the financial statements, and the reported amounts of revenues and expenses during the reporting period. Actual results could differ from those estimates.
Securities valuation
All investments are valued each business day as of the close of regular trading on the New York Stock Exchange (generally 4 p.m. Eastern Time), although the Fund may deviate from this calculation time under unusual or unexpected circumstances.
Debt securities are valued at the evaluated bid price provided by an independent pricing service or, if a reliable price is not available, the quoted bid price from an independent broker-dealer.
Futures that are listed on a foreign or domestic exchange or market are valued at the official closing price or, if none, the last sales price.
Investments in registered open-end investment companies are valued at net asset value.
Investments which are not valued using any of the methods discussed above are valued at their fair value, as determined in good faith by the Board of Trustees of the Fund. The Board of Trustees has established a Valuation Committee comprised of the Trustees and has delegated to it the authority to take any actions regarding the valuation of portfolio securities that the Valuation Committee deems necessary or appropriate, including determining the fair value of portfolio securities, unless the determination has been delegated to the Wells Fargo Asset Management Pricing Committee at Wells Fargo Funds Management, LLC (“Funds Management”). The Board of Trustees retains the authority to make or ratify any valuation decisions or approve any changes to the Valuation Procedures as it deems appropriate. On a quarterly basis, the Board of Trustees receives reports on any valuation actions taken by the Valuation Committee or the Wells Fargo Asset Management Pricing Committee which may include items for ratification.
Valuations of fair valued securities are compared to the next actual sales price when available, or other appropriate market values, to assess the continued appropriateness of the fair valuation methodologies used. These securities are fair valued on a day-to-day basis, taking into consideration changes to appropriate market information and any significant changes to the inputs considered in the valuation process until there is a readily available price provided on an exchange or by an independent pricing service. Valuations received from an independent pricing service or independent broker-dealer quotes are periodically validated by comparisons to most recent trades and valuations provided by other independent pricing services in addition to the review of prices by the manager and/or subadviser. Unobservable inputs used in determining fair valuations are identified based on the type of security, taking into consideration factors utilized by market participants in valuing the investment, knowledge about the issuer and the current market environment.
Futures contracts
The Fund is subject to interest rate risk in the normal course of pursuing its investment objectives. The Fund may buy and sell futures contracts in order to gain exposure to, or protect against, changes in interest rates. The primary risks associated with the use of futures contracts are the imperfect correlation between changes in market values of securities held by the Fund and the prices of futures contracts, and the possibility of an illiquid market.
The aggregate principal amounts of the contracts are not recorded in the financial statements. Fluctuations in the value of the contracts are recorded in the Statement of Assets and Liabilities as an asset or liability and in the Statement of Operations as unrealized gains or losses until the contracts are closed, at which point they are recorded as net realized gains or losses on futures contracts. With futures contracts, there is minimal counterparty risk to the Fund since futures are exchange traded and the exchange’s clearinghouse, as counterparty to all exchange traded futures, guarantees the futures against default.
| | | | | | |
| Notes to financial statements (unaudited) | | Wells Fargo Short Duration Government Bond Fund | | | 21 | |
Security transactions and income recognition
Securities transactions are recorded on a trade date basis. Realized gains or losses are recorded on the basis of identified cost.
Interest income is accrued daily and bond discounts are accreted and premiums are amortized daily. To the extent debt obligations are placed on non-accrual status, any related interest income may be reduced by writing off interest receivables when the collection of all or a portion of interest has been determined to be doubtful based on consistently applied procedures and the fair value has decreased. If the issuer subsequently resumes interest payments or when the collectability of interest is reasonably assured, the debt obligation is removed from non-accrual status.
Distributions to shareholders
Distributions to shareholders from net investment income are accrued daily and paid monthly. Distributions from net realized gains, if any, are recorded on the ex-dividend date and paid at least annually. Such distributions are determined in accordance with income tax regulations and may differ from U.S. generally accepted accounting principles. Dividend sources are estimated at the time of declaration. The tax character of distributions is determined as of the Fund’s fiscal year end. Therefore, a portion of the Fund’s distributions made prior to the Fund’s fiscal year end may be categorized as a tax return of capital at year end.
Federal and other taxes
The Fund intends to continue to qualify as a regulated investment company by distributing substantially all of its investment company taxable income and any net realized capital gains (after reduction for capital loss carryforwards) sufficient to relieve it from all, or substantially all, federal income taxes. Accordingly, no provision for federal income taxes was required.
The Fund’s income and federal excise tax returns and all financial records supporting those returns for the prior three fiscal years are subject to examination by the federal and Delaware revenue authorities. Management has analyzed the Fund’s tax positions taken on federal, state, and foreign tax returns for all open tax years and does not believe that there are any uncertain tax positions that require recognition of a tax liability.
As of February 28, 2018, the aggregate cost of all investments for federal income tax purposes was $788,901,130 and the unrealized gains (losses) consisted of:
| | | | |
Gross unrealized gains | | $ | 3,072,513 | |
Gross unrealized losses | | | (11,500,812 | ) |
Net unrealized losses | | $ | (8,428,299 | ) |
As of August 31, 2017, the Fund had capital loss carryforwards which consist of $30,467,116 in short-term capital losses and $18,431,801 in long-term capital losses.
As of August 31, 2017, the Fund had current year deferred post-October capital losses consisting of $7,197,100 in short term losses and $4,920,342 in long-term losses which were recognized on the first day of the current fiscal year.
Class allocations
The separate classes of shares offered by the Fund differ principally in applicable sales charges, distribution, shareholder servicing, and administration fees. Class specific expenses are charged directly to that share class. Investment income, common expenses, and realized and unrealized gains (losses) on investments are allocated daily to each class of shares based on the relative proportion of net assets of each class.
3. FAIR VALUATION MEASUREMENTS
Fair value measurements of investments are determined within a framework that has established a fair value hierarchy based upon the various data inputs utilized in determining the value of the Fund’s investments. The three-level hierarchy gives the highest priority to unadjusted quoted prices in active markets for identical assets or liabilities (Level 1) and the lowest priority to unobservable inputs (Level 3). The Fund’s investments are classified within the fair value hierarchy based on the lowest level of input that is significant to the fair value measurement. The inputs are summarized into three broad levels as follows:
| ∎ | | Level 1 – quoted prices in active markets for identical securities |
| ∎ | | Level 2 – other significant observable inputs (including quoted prices for similar securities, interest rates, prepayment speeds, credit risk, etc.) |
| ∎ | | Level 3 – significant unobservable inputs (including the Fund’s own assumptions in determining the fair value of investments) |
| | | | |
| 22 | | Wells Fargo Short Duration Government Bond Fund | | Notes to financial statements (unaudited) |
The inputs or methodologies used for valuing investments in securities are not necessarily an indication of the risk associated with investing in those securities.
The following is a summary of the inputs used in valuing the Fund’s assets and liabilities as of February 28, 2018:
| | | | | | | | | | | | | | | | |
| | | Quoted prices
(Level 1) | | | Other significant
observable inputs (Level 2) | | | Significant
unobservable inputs (Level 3) | | | Total | |
Assets | | | | | | | | | | | | | | | | |
Investments in: | | | | | | | | | | | | | | | | |
| | | | |
Agency securities | | $ | 0 | | | $ | 340,222,867 | | | $ | 0 | | | $ | 340,222,867 | |
| | | | |
Asset-backed securities | | | 0 | | | | 79,201,829 | | | | 0 | | | | 79,201,829 | |
| | | | |
Non-agency mortgage-backed securities | | | 0 | | | | 34,670,744 | | | | 0 | | | | 34,670,744 | |
| | | | |
U.S. Treasury securities | | | 287,536,696 | | | | 0 | | | | 0 | | | | 287,536,696 | |
| | | | |
Short-term investments | | | | | | | | | | | | | | | | |
Investment companies | | | 38,925,457 | | | | 0 | | | | 0 | | | | 38,925,457 | |
Total assets | | $ | 326,462,153 | | | $ | 454,095,440 | | | $ | 0 | | | $ | 780,557,593 | |
Liabilities | | | | | | | | | | | | | | | | |
Futures contracts | | $ | 84,762 | | | $ | 0 | | | $ | 0 | | | $ | 84,762 | |
Total liabilities | | $ | 84,762 | | | $ | 0 | | | $ | 0 | | | $ | 84,762 | |
Futures contracts are reported at the cumulative unrealized gains or losses at measurement date. The current day’s variation margin is reported on the Statement of assets and liabilities. All other assets and liabilities are reported at their market value at measurement date.
The Fund recognizes transfers between levels within the fair value hierarchy at the end of the reporting period. At February 28, 2018, the Fund did not have any transfers into/out of Level 1, Level 2, or Level 3.
4. TRANSACTIONS WITH AFFILIATES
Management fee
Funds Management, an indirect wholly owned subsidiary of Wells Fargo & Company (“Wells Fargo”), is the manager of the Fund and provides advisory and fund-level administrative services under an investment management agreement. Under the investment management agreement, Funds Management is responsible for, among other services, implementing the investment objectives and strategies of the Fund, supervising the subadviser, providing fund-level administrative services in connection with the Fund’s operations, and providing any other fund-level administrative services reasonably necessary for the operation of the Fund. As compensation for its services under the investment management agreement, Funds Management is entitled to receive an annual management fee starting at 0.35% and declining to 0.255% as the average daily net assets of the Fund increase. For the six months ended February 28, 2018, the management fee was equivalent to an annual rate of 0.35% of the Fund’s average daily net assets.
Funds Management has retained the services of a subadviser to provide daily portfolio management to the Fund. The fee for subadvisory services is borne by Funds Management. Wells Capital Management Incorporated, an affiliate of Funds Management and an indirect wholly owned subsidiary of Wells Fargo, is the subadviser to the Fund and is entitled to receive a fee from Funds Management at an annual rate starting at 0.15% and declining to 0.05% as the average daily net assets of the Fund increase.
Administration fees
Under a class-level administration agreement, Funds Management provides class-level administrative services to the Fund, which includes paying fees and expenses for services provided by the transfer agent, sub-transfer agents, omnibus account servicers and record-keepers. As compensation for its services under the class-level administration agreement, Funds Management receives an annual fee which is calculated based on the average daily net assets of each class as follows:
| | | | |
| | | Class-level
administration fee | |
Class A, Class C | | | 0.16 | % |
Class R6 | | | 0.03 | |
Administrator Class | | | 0.10 | |
Institutional Class | | | 0.08 | |
| | | | | | |
| Notes to financial statements (unaudited) | | Wells Fargo Short Duration Government Bond Fund | | | 23 | |
Funds Management has contractually waived and/or reimbursed management and administration fees to the extent necessary to maintain certain net operating expense ratios for the Fund. Waiver of fees and/or reimbursement of expenses by Funds Management were made first from fund level expenses on a proportionate basis and then from class specific expenses. Funds Management has committed through December 31, 2018 to waive fees and/or reimburse expenses to the extent necessary to cap the Fund’s expenses at 0.78% for Class A shares, 1.53% for Class C shares, 0.37% for Class R6 shares, 0.60% for Administrator Class shares, and 0.42% for Institutional Class shares. After this time, the cap may be increased or the commitment to maintain the cap may be terminated only with the approval of the Board of Trustees.
Distribution fee
The Trust has adopted a distribution plan for Class C shares of the Fund pursuant to Rule 12b-1 under the 1940 Act. A distribution fee is charged to Class C shares and paid to Wells Fargo Funds Distributor, LLC (“Funds Distributor”), the principal underwriter, at an annual rate of 0.75% of the average daily net assets of Class C shares.
In addition, Funds Distributor is entitled to receive the front-end sales charge from the purchase of Class A shares and a contingent deferred sales charge on the redemption of certain Class A shares. Funds Distributor is also entitled to receive the contingent deferred sales charges from redemptions of Class C shares. For the six months ended February 28, 2018, Funds Distributor received $136 from the sale of Class A shares. No contingent deferred sales charges were incurred by Class A and Class C shares for the six months ended February 28, 2018.
Shareholder servicing fees
The Trust has entered into contracts with one or more shareholder servicing agents, whereby Class A, Class C, and Administrator Class of the Fund are charged a fee at an annual rate of 0.25% of the average daily net assets of each respective class.
A portion of these total shareholder servicing fees were paid to affiliates of Wells Fargo.
Interfund transactions
The Fund may purchase or sell investment securities to other Wells Fargo affiliates pursuant to Rule 17a-7 under the 1940 Act and under procedures adopted by the Board of Trustees. The procedures have been designed to ensure that these interfund transactions, which do not incur broker commissions, are effected at current market prices.
5. INVESTMENT PORTFOLIO TRANSACTIONS
Purchases and sales of investments, excluding short-term securities, for the six months ended February 28, 2018 were as follows:
| | | | | | |
Purchases at cost | | Sales proceeds |
U.S.
government | | Non-U.S.
government | | U.S.
government | | Non-U.S.
government |
| $1,199,899,651 | | $41,661,761 | | $1,240,171,270 | | $84,786,234 |
6. DERIVATIVE TRANSACTIONS
During the six months ended February 28, 2018, the Fund entered into futures contracts to speculate on interest rates and to help manage the duration of the portfolio. The Fund had an average notional amount of $183,405,384 in long futures contracts and $82,400,457 in short futures contracts during the six months ended February 28, 2018.
On February 28, 2018, the cumulative unrealized losses on futures contracts in the amount of $84,762 are reflected in net unrealized losses on investments on the Statement of Assets and Liabilities. The payable for daily variation margin on open futures contracts reflected in the Statement of Assets and Liabilities only represents the current day’s variation margin. The realized gains and change in unrealized gains (losses) on futures contracts are reflected in the Statement of Operations.
For certain types of derivative transactions, the Fund has entered into International Swaps and Derivatives Association, Inc. master agreements (“ISDA Master Agreements”) or similar agreements with approved counterparties. The ISDA Master Agreements or similar agreements may have requirements to deliver/deposit securities or cash to/with an
| | | | |
| 24 | | Wells Fargo Short Duration Government Bond Fund | | Notes to financial statements (unaudited) |
exchange or broker-dealer as collateral and allows the Fund to offset, with each counterparty, certain derivative financial instrument’s assets and/or liabilities with collateral held or pledged. Collateral requirements differ by type of derivative. Collateral or margin requirements are set by the broker or exchange clearinghouse for exchange traded derivatives while collateral terms are contract specific for over-the-counter traded derivatives. Cash collateral that has been pledged to cover obligations of the Fund under ISDA Master Agreements or similar agreements, if any, are reported separately in the Statement of Assets and Liabilities. Securities pledged as collateral, if any, are noted in the Portfolio of Investments. With respect to balance sheet offsetting, absent an event of default by the counterparty or a termination of the agreement, the reported amounts of financial assets and financial liabilities in the Statement of Assets and Liabilities are not offset across transactions between the Fund and the applicable counterparty. A reconciliation of the gross amounts on the Statement of Assets and Liabilities to the net amounts by counterparty, including any collateral exposure, is as follows:
| | | | | | | | | | | | | | | | |
| Counterparty | | Gross amounts
of liabilities in the
Statement of
Assets and
Liabilities | | | Amounts
subject to
netting
agreements | | | Collateral
pledged1 | | | Net amount
of liabilities | |
JPMorgan | | $ | 84,762 | * | | $ | 0 | | | $ | (84,762 | ) | | $ | 0 | |
| | 1 | Collateral pledged within this table is limited to the collateral for the net transaction with the counterparty. | |
| | * | Amount represents unrealized losses on futures contracts which are reported in Net unrealized losses on investments. Only the current day’s variation margin as of February 28, 2018 is reported separately on the Statement of Assets and Liabilities. | |
7. BANK BORROWINGS
The Trust (excluding the money market funds and certain other funds) and Wells Fargo Variable Trust are parties to a $280,000,000 revolving credit agreement whereby the Fund is permitted to use bank borrowings for temporary or emergency purposes, such as to fund shareholder redemption requests. Interest under the credit agreement is charged to the Fund based on a borrowing rate equal to the higher of the Federal Funds rate in effect on that day plus 1.25% or the overnight LIBOR rate in effect on that day plus 1.25%. In addition, an annual commitment fee equal to 0.25% of the unused balance is allocated to each participating fund.
For the six months ended February 28, 2018, there were no borrowings by the Fund under the agreement.
8. INDEMNIFICATION
Under the Trust’s organizational documents, the officers and Trustees have been granted certain indemnification rights against certain liabilities that may arise out of performance of their duties to the Trust. Additionally, in the normal course of business, the Trust may enter into contracts with service providers that contain a variety of indemnification clauses. The Trust’s maximum exposure under these arrangements is dependent on future claims that may be made against the Fund and, therefore, cannot be estimated.
| | | | | | |
| Other information (unaudited) | | Wells Fargo Short Duration Government Bond Fund | | | 25 | |
PROXY VOTING INFORMATION
A description of the policies and procedures that the Fund uses to determine how to vote proxies relating to portfolio securities is available, upon request, by calling 1-800-222-8222, visiting our website at wellsfargofunds.com, or visiting the SEC website at sec.gov. Information regarding how the Fund voted proxies relating to portfolio securities during the most recent 12-month period ended June 30 is available on the Fund’s website at wellsfargofunds.com or by visiting the SEC website at sec.gov.
PORTFOLIO HOLDINGS INFORMATION
The complete portfolio holdings for the Fund are publicly available monthly on the Fund’s website (wellsfargofunds.com), on a one-month delayed basis. In addition, top ten holdings information (excluding derivative positions) for the Fund is publicly available on the Fund’s website on a monthly, seven-day or more delayed basis. The Fund files its complete schedule of portfolio holdings with the SEC for the first and third quarters of each fiscal year on Form N-Q, which is available by visiting the SEC website at sec.gov. In addition, the Fund’s Form N-Q may be reviewed and copied at the SEC’s Public Reference Room in Washington, DC, and at regional offices in New York City, at 233 Broadway, and in Chicago, at 175 West Jackson Boulevard, Suite 900. Information about the Public Reference Room may be obtained by calling 1-800-SEC-0330.
| | | | |
| 26 | | Wells Fargo Short Duration Government Bond Fund | | Other information (unaudited) |
BOARD OF TRUSTEES AND OFFICERS
Each of the Trustees and Officers1 listed in the table below acts in identical capacities for each fund in the Wells Fargo family of funds, which consists of 153 mutual funds comprising the Wells Fargo Funds Trust, Wells Fargo Variable Trust, Wells Fargo Master Trust and four closed-end funds (collectively the “Fund Complex”). This table should be read in conjunction with the Prospectus and the Statement of Additional Information2. The mailing address of each Trustee and Officer is 525 Market Street, 12th Floor, San Francisco, CA 94105. Each Trustee and Officer serves an indefinite term, however, each Trustee serves such term until reaching the mandatory retirement age established by the Trustees.
Independent Trustees
| | | | | | |
Name and
year of birth | | Position held and
length of service* | | Principal occupations during past five years or longer | | Current other
public company or
investment company
directorships |
William R. Ebsworth (Born 1957) | | Trustee, since 2015 | | Retired. From 1984 to 2013, equities analyst, portfolio manager, research director and chief investment officer at Fidelity Management and Research Company in Boston, Tokyo, and Hong Kong, and retired in 2013 as Chief Investment Officer of Fidelity Strategic Advisers, Inc. where he led a team of investment professionals managing client assets. Prior thereto, Board member of Hong Kong Securities Clearing Co., Hong Kong Options Clearing Corp., the Thailand International Fund, Ltd., Fidelity Investments Life Insurance Company, and Empire Fidelity Investments Life Insurance Company. Board member of the Forté Foundation (non-profit organization) and the Vincent Memorial Hospital Endowment (non-profit organization), where he serves on the Investment Committee and as a Chair of the Audit Committee. Mr. Ebsworth is a CFA® charterholder. | | Asset Allocation Trust |
Jane A. Freeman** (Born 1953) | | Trustee, since 2015; Chair Liaison, since 2018 | | Retired. From 2012 to 2014 and 1999 to 2008, Chief Financial Officer of Scientific Learning Corporation. From 2008 to 2012, Ms. Freeman provided consulting services related to strategic business projects. Prior to 1999, Portfolio Manager at Rockefeller & Co. and Scudder, Stevens & Clark. Board member of the Harding Loevner Funds from 1996 to 2014, serving as both Lead Independent Director and chair of the Audit Committee. Board member of the Russell Exchange Traded Funds Trust from 2011 to 2012 and the chair of the Audit Committee. Ms. Freeman is a Board Member of Ruth Bancroft Garden (non-profit organization) and the Glimmerglass Festival. She is also an inactive Chartered Financial Analyst. | | Asset Allocation Trust |
Isaiah Harris, Jr. (Born 1952) | | Trustee, since 2009 | | Retired. Chairman of the Board of CIGNA Corporation since 2009, and Director since 2005. From 2003 to 2011, Director of Deluxe Corporation. Prior thereto, President and CEO of BellSouth Advertising and Publishing Corp. from 2005 to 2007, President and CEO of BellSouth Enterprises from 2004 to 2005 and President of BellSouth Consumer Services from 2000 to 2003. Emeritus member of the Iowa State University Foundation Board of Governors. Emeritus Member of the Advisory Board of Iowa State University School of Business. Advisory Board Member, Palm Harbor Academy (charter school). Advisory Board Member, Child Evangelism Fellowship (non-profit). Mr. Harris is a certified public accountant (inactive status). | | CIGNA Corporation; Asset Allocation Trust |
Judith M. Johnson (Born 1949) | | Trustee, since 2008; Audit Committee Chairman, since 2008 | | Retired. Prior thereto, Chief Executive Officer and Chief Investment Officer of Minneapolis Employees Retirement Fund from 1996 to 2008. Ms. Johnson is an attorney, certified public accountant and a certified managerial accountant. | | Asset Allocation Trust |
David F. Larcker (Born 1950) | | Trustee, since 2009 | | James Irvin Miller Professor of Accounting at the Graduate School of Business, Stanford University, Director of the Corporate Governance Research Initiative and Senior Faculty of The Rock Center for Corporate Governance since 2006. From 2005 to 2008, Professor of Accounting at the Graduate School of Business, Stanford University. Prior thereto, Ernst & Young Professor of Accounting at The Wharton School, University of Pennsylvania from 1985 to 2005. | | Asset Allocation Trust |
| | | | | | |
| Other information (unaudited) | | Wells Fargo Short Duration Government Bond Fund | | | 27 | |
| | | | | | |
Name and
year of birth | | Position held and
length of service* | | Principal occupations during past five years or longer | | Current other
public company or
investment company
directorships |
Olivia S. Mitchell*** (Born 1953) | | Trustee, since 2006; Governance Committee Chairman, since 2018 | | International Foundation of Employee Benefit Plans Professor, Wharton School of the University of Pennsylvania since 1993. Director of Wharton’s Pension Research Council and Boettner Center on Pensions & Retirement Research, and Research Associate at the National Bureau of Economic Research. Previously, Cornell University Professor from 1978 to 1993. | | Asset Allocation Trust |
Timothy J. Penny**** (Born 1951) | | Trustee, since 1996; Chairman, since 2018; Vice Chairman, from 2017 to 2018 | | President and Chief Executive Officer of Southern Minnesota Initiative Foundation, a non-profit organization, since 2007. Member of the Board of Trustees of NorthStar Education Finance, Inc., a non-profit organization, since 2007. | | Asset Allocation Trust |
James G. Polisson***** (Born 1959) | | Trustee, since 2018; Advisory Board Member, from 2017 to 2018 | | Retired. Chief Marketing Officer, Source (ETF) UK Services, Ltd, from 2015 to 2017. From 2012 to 2015, Principal of The Polisson Group, LLC, a management consulting, corporate advisory and principal investing company. Chief Executive Officer and Managing Director at Russell Investments, Global Exchange Traded Funds from 2010 to 2012. Managing Director of Barclays Global Investors from 1998 to 2010 and Global Chief Marketing Officer for iShares and Barclays Global Investors from 2000 to 2010. Trustee of the San Francisco Mechanics’ Institute, a non-profit organization, from 2013 to 2015. Board member of the Russell Exchange Traded Fund Trust from 2011 to 2012. Director of Barclays Global Investors Holdings Deutschland GmbH from 2006 to 2009. Mr. Polisson is an attorney and has a retired status with the Massachusetts and District of Columbia Bar Associations. | | Asset Allocation Trust |
Michael S. Scofield (Born 1943) | | Trustee, since 2010 | | Served on the Investment Company Institute’s Board of Governors and Executive Committee from 2008-2011 as well the Governing Council of the Independent Directors Council from 2006-2011 and the Independent Directors Council Executive Committee from 2008-2011. Trustee of the Evergreen Fund complex (and its predecessors) from 1984 to 2010. Chairman of the Evergreen Funds from 2000-2010. Former Trustee of the Mentor Funds. Retired Attorney, Law Offices of Michael S. Scofield. | | Asset Allocation Trust |
Pamela Wheelock***** (Born 1959) | | Trustee, since 2018; Advisory Board Member, from 2017 to 2018 | | Chief Operating Officer, Twin Cities Habitat for Humanity, since January, 2017. Vice President of University Services, University of Minnesota from 2012 to 2017. Prior thereto, Interim President and Chief Executive Officer of Blue Cross Blue Shield of Minnesota from 2010 to 2011, Chairman of the Board from 2009 to 2011 and Board Director from 2003 to 2015. Vice President, Leadership and Community Engagement, Bush Foundation, Saint Paul, Minnesota (a private foundation) from 2009 to 2011. Executive Vice President and Chief Financial Officer, Minnesota Sports and Entertainment from 2004 to 2009 and Senior Vice President from 2002 to 2004. Commissioner of Finance, State of Minnesota, from 1999 to 2002. Currently on the Board of Directors, Governance Committee and Finance Committee, for the Minnesota Philanthropy Partners (Saint Paul Foundation) since 2012 and Board Chair of the Minnesota Wild Foundation since 2010. | | Asset Allocation Trust |
| * | Length of service dates reflect the Trustee’s commencement of service with the Trust’s predecessor entities, where applicable. |
| ** | Jane Freeman became Chair Liaison effective January 1, 2018. |
| *** | Olivia Mitchell became Chairman of the Governance Committee effective January 1, 2018. |
| **** | Timothy Penny became Chairman effective January 1, 2018. |
| ***** | James Polisson and Pamela Wheelock each became a Trustee effective January 1, 2018. |
| | | | |
| 28 | | Wells Fargo Short Duration Government Bond Fund | | Other information (unaudited) |
Officers
| | | | | | |
Name and
year of birth | | Position held and
length of service | | Principal occupations during past five years or longer | | |
Andrew Owen (Born 1960) | | President, since 2017 | | Executive Vice President of Wells Fargo & Company and Head of Affiliated Managers, Wells Fargo Asset Management, since 2014. In addition, Mr. Owen is currently President, Chief Executive Officer and Director of Wells Fargo Funds Management, LLC since 2017. Prior thereto, Executive Vice President responsible for marketing, investments and product development for Wells Fargo Funds Management, LLC, from 2009 to 2014. | | |
Nancy Wiser1 (Born 1967) | | Treasurer, since 2012 | | Executive Vice President of Wells Fargo Funds Management, LLC since 2011. Chief Operating Officer and Chief Compliance Officer at LightBox Capital Management LLC, from 2008 to 2011. | | |
Alexander Kymn* (Born 1973) | | Secretary, since 2018; Chief Legal Officer, since 2018 | | Senior Company Counsel of Wells Fargo Bank, N.A. since 2018 (previously Senior Counsel from 2007 to 2018). Vice President of Wells Fargo Funds Management, LLC from 2008 to 2014. | | |
C. David Messman** (Born 1960) | | Secretary, since 2000; Chief Legal Officer, since 2003 | | Senior Vice President and Secretary of Wells Fargo Funds Management, LLC since 2001. Assistant General Counsel of Wells Fargo Bank, N.A. since 2013 and Vice President and Managing Counsel of Wells Fargo Bank, N.A. from 1996 to 2013. | | |
Michael H. Whitaker (Born 1967) | | Chief Compliance Officer, since 2016 | | Senior Vice President and Chief Compliance Officer since 2016. Senior Vice President and Chief Compliance Officer for Fidelity Investments from 2007 to 2016. | | |
David Berardi (Born 1975) | | Assistant Treasurer, since 2009 | | Vice President of Wells Fargo Funds Management, LLC since 2009. Vice President of Evergreen Investment Management Company, LLC from 2008 to 2010. Manager of Fund Reporting and Control for Evergreen Investment Management Company, LLC from 2004 to 2010. | | |
Jeremy DePalma1 (Born 1974) | | Assistant Treasurer, since 2009 | | Senior Vice President of Wells Fargo Funds Management, LLC since 2009. Senior Vice President of Evergreen Investment Management Company, LLC from 2008 to 2010 and head of the Fund Reporting and Control Team within Fund Administration from 2005 to 2010. | | |
| 1 | Nancy Wiser acts as Treasurer of 77 funds in the Fund Complex. Jeremy DePalma acts as Treasurer of 76 funds and Assistant Treasurer of 77 funds in the Fund Complex. |
| 2 | The Statement of Additional Information includes additional information about the Trustees and is available, without charge, upon request, by calling 1-800-222-8222 or by visiting the website at wellsfargofunds.com. |
| * | Alexander Kymn became the Secretary and Chief Legal Officer effective April 17, 2018. |
| ** | David Messman was the Secretary and Chief Legal Officer until April 16, 2018. |
| | | | | | |
| List of abbreviations | | Wells Fargo Short Duration Government Bond Fund | | | 29 | |
The following is a list of common abbreviations for terms and entities that may have appeared in this report.
| ACA | — ACA Financial Guaranty Corporation |
| ADR | — American depositary receipt |
| ADS | — American depositary shares |
| AGC | — Assured Guaranty Corporation |
| AGM | — Assured Guaranty Municipal |
| Ambac | — Ambac Financial Group Incorporated |
| AMT | — Alternative minimum tax |
| BAN | — Bond anticipation notes |
| BHAC | — Berkshire Hathaway Assurance Corporation |
| CAB | — Capital appreciation bond |
| CCAB | — Convertible capital appreciation bond |
| CDA | — Community Development Authority |
| CDO | — Collateralized debt obligation |
| CLO | — Collateralized loan obligation |
| DRIVER | — Derivative inverse tax-exempt receipts |
| DW&P | — Department of Water & Power |
| DWR | — Department of Water Resources |
| ECFA | — Educational & Cultural Facilities Authority |
| EDA | — Economic Development Authority |
| EDFA | — Economic Development Finance Authority |
| ETF | — Exchange-traded fund |
| FDIC | — Federal Deposit Insurance Corporation |
| FFCB | — Federal Farm Credit Banks |
| FGIC | — Financial Guaranty Insurance Corporation |
| FHA | — Federal Housing Administration |
| FHLB | — Federal Home Loan Bank |
| FHLMC | — Federal Home Loan Mortgage Corporation |
| FICO | — The Financing Corporation |
| FNMA | — Federal National Mortgage Association |
| GDR | — Global depositary receipt |
| GNMA | — Government National Mortgage Association |
| HCFR | — Healthcare facilities revenue |
| HEFA | — Health & Educational Facilities Authority |
| HEFAR | — Higher education facilities authority revenue |
| HFA | — Housing Finance Authority |
| HFFA | — Health Facilities Financing Authority |
| HUD | — Department of Housing and Urban Development |
| IDA | — Industrial Development Authority |
| IDAG | — Industrial Development Agency |
| KRW | — Republic of Korea won |
| LIBOR | — London Interbank Offered Rate |
| LIFER | — Long Inverse Floating Exempt Receipts |
| LLC | — Limited liability company |
| LLLP | — Limited liability limited partnership |
| LLP | — Limited liability partnership |
| MBIA | — Municipal Bond Insurance Association |
| MFHR | — Multifamily housing revenue |
| MSTR | — Municipal securities trust receipts |
| MUD | — Municipal Utility District |
| National | — National Public Finance Guarantee Corporation |
| PCFA | — Pollution Control Financing Authority |
| PCL | — Public Company Limited |
| PCR | — Pollution control revenue |
| PFA | — Public Finance Authority |
| PFFA | — Public Facilities Financing Authority |
| PFOTER | — Puttable floating option tax-exempt receipts |
| PJSC | — Public Joint Stock Company |
| plc | — Public limited company |
| PUTTER | — Puttable tax-exempt receipts |
| R&D | — Research & development |
| Radian | — Radian Asset Assurance |
| RAN | — Revenue anticipation notes |
| RDA | — Redevelopment Agency |
| RDFA | — Redevelopment Finance Authority |
| REIT | — Real estate investment trust |
| ROC | — Reset option certificates |
| SAVRS | — Select auction variable rate securities |
| SBA | — Small Business Authority |
| SDR | — Swedish depositary receipt |
| SFHR | — Single-family housing revenue |
| SFMR | — Single-family mortgage revenue |
| SIFMA | — Securities Industry and Financial Markets Association |
| SPA | — Standby purchase agreement |
| SPDR | — Standard & Poor’s Depositary Receipts |
| SPEAR | — Short Puttable Exempt Adjustable Receipts |
| STRIPS | — Separate trading of registered interest and |
| TAN | — Tax anticipation notes |
| TIPS | — Treasury inflation-protected securities |
| TRAN | — Tax revenue anticipation notes |
| TTFA | — Transportation Trust Fund Authority |
| TVA | — Tennessee Valley Authority |
This page is intentionally left blank.
This page is intentionally left blank.
This page is intentionally left blank.

For more information
More information about Wells Fargo Funds is available free upon request. To obtain literature, please write, email, visit the Fund’s website, or call:
Wells Fargo Funds
P.O. Box 8266
Boston, MA 02266-8266
Email: fundservice@wellsfargo.com
Website: wellsfargofunds.com
Individual investors: 1-800-222-8222
Retail investment professionals: 1-888-877-9275
Institutional investment professionals:
1-866-765-0778
This report and the financial statements contained herein are submitted for the general information of the shareholders of the Fund. If this report is used for promotional purposes, distribution of the report must be accompanied or preceded by a current prospectus. Before investing, please consider the investment objectives, risks, charges, and expenses of the investment. For a current prospectus and, if available, a summary prospectus, containing this information, call 1-800-222-8222 or visit the Fund’s website at wellsfargofunds.com. Read the prospectus carefully before you invest or send money.
Wells Fargo Asset Management (WFAM) is a trade name used by the asset management businesses of Wells Fargo & Company. Wells Fargo Funds Management, LLC, a wholly owned subsidiary of Wells Fargo & Company, provides investment advisory and administrative services for Wells Fargo Funds. Other affiliates of Wells Fargo & Company provide subadvisory and other services for the funds. The funds are distributed by Wells Fargo Funds Distributor, LLC, Member FINRA, an affiliate of Wells Fargo & Company. Neither Wells Fargo Funds Distributor nor Wells Fargo Funds Management holds fund shareholder accounts or assets. This material is for general informational and educational purposes only and is NOT intended to provide investment advice or a recommendation of any kind—including a recommendation for any specific investment, strategy, or plan.
NOT FDIC INSURED ◾ NO BANK GUARANTEE ◾ MAY LOSE VALUE
© 2018 Wells Fargo Funds Management, LLC. All rights reserved.
| | |
 | | 309371 04-18 SA220/SAR220 02-18 |
Semi-Annual Report
February 28, 2018

Wells Fargo Short-Term Bond Fund


Reduce clutter. Save trees.
Sign up for electronic delivery of prospectuses and shareholder reports at wellsfargo.com/advantagedelivery
Contents
The views expressed and any forward-looking statements are as of February 28, 2018, unless otherwise noted, and are those of the Fund managers and/or Wells Fargo Funds Management, LLC. Discussions of individual securities, or the markets generally, or any Wells Fargo Fund are not intended as individual recommendations. Future events or results may vary significantly from those expressed in any forward-looking statements. The views expressed are subject to change at any time in response to changing circumstances in the market. Wells Fargo Funds Management, LLC and the Fund disclaim any obligation to publicly update or revise any views expressed or forward-looking statements.
NOT FDIC INSURED ◾ NO BANK GUARANTEE ◾ MAY LOSE VALUE
| | | | |
| 2 | | Wells Fargo Short-Term Bond Fund | | Letter to shareholders (unaudited) |

Andrew Owen
President
Wells Fargo Funds
During the period, stocks globally delivered positive returns.
Dear Shareholder:
We are pleased to offer you this semi-annual report for the Wells Fargo Short-Term Bond Fund for the six-month period that ended February 28, 2018. During the period, stocks globally delivered positive returns. For the period, U.S. stocks, as measured by the S&P 500 Index1, gained 10.84% and international stocks, as measured by the MSCI ACWI ex USA Index (Net)2, gained 7.59%. In bond markets, the Bloomberg Barclays U.S. Aggregate Bond Index3 declined 2.18% and the Bloomberg Barclays Municipal Bond Index4 lost 1.24% while fixed-income investments outside the U.S. gained 2.52%, according to the Bloomberg Barclays Global Aggregate ex-USD Index5. The ICE BofAML U.S. High Yield Index6 earned 1.01% during the period.
U.S. stocks advanced as business-friendly policies and regulations, newly implemented tax reform, increased hiring activity, and consistent corporate profits led to higher investor and consumer confidence. Internationally, stocks gained as unemployment fell and wages increased in the U.K.; the Bank of Japan continued its accommodative monetary policies; and industrial production, retail sales, and fixed asset investment increased in China. Stock returns in the emerging markets were strong, with the MSCI EM Index (Net)7 gaining 10.58% for the period.
Reactions to U.S. interest-rate increases were uneven across the yield curve and globally.
The U.S. Federal Reserve (Fed) increased the federal funds rate twice during the six-month period. Following a federal funds rate increase in June to a range of 1.00% to 1.25%, 10-year U.S. Treasury yields declined, the yield curve flattened, and long-term bond prices benefited.
Internationally, central banks maintained low interest rates and accommodative monetary policies that supported business activity and stock values in foreign markets. A weaker U.S. dollar was generally supportive of business activity in regions around the globe.
Positive economic and market news continued as 2017 closed and 2018 began.
During the fourth quarter of 2017, stock markets continued the move higher. Third-quarter economic output in the U.S. grew at a 3.2% annual rate. The unemployment rate fell to a 17-year low of 4.1%. Tax reform and wage growth encouraged increased business and consumer spending.
Fed officials announced in October 2017 plans to begin unwinding its $4.5 trillion portfolio of bonds and other assets accumulated during rounds of quantitative easing conducted since the 2008–2009 recession. Still, restrained inflation kept long-term bond rates steady and the flattening of the yield curve persisted.
| 1 | The S&P 500 Index consists of 500 stocks chosen for market size, liquidity, and industry group representation. It is a market-value-weighted index with each stock’s weight in the index proportionate to its market value. You cannot invest directly in an index. |
| 2 | The Morgan Stanley Capital International (MSCI) All Country World Index (ACWI) ex USA Index (Net) is a free-float-adjusted market-capitalization-weighted index that is designed to measure the equity market performance of developed markets, excluding the United States and Canada. Source: MSCI. MSCI makes no express or implied warranties or representations and shall have no liability whatsoever with respect to any MSCI data contained herein. The MSCI data may not be further redistributed or used as a basis for other indices or any securities or financial products. This report is not approved, reviewed, or produced by MSCI. You cannot invest directly in an index. |
| 3 | The Bloomberg Barclays U.S. Aggregate Bond Index is a broad-based benchmark that measures the investment-grade, U.S. dollar-denominated, fixed-rate taxable bond market, including Treasuries, government-related and corporate securities, mortgage-backed securities (agency fixed-rate and hybrid adjustable-rate mortgage pass-throughs), asset-backed securities, and commercial mortgage-backed securities. You cannot invest directly in an index. |
| 4 | The Bloomberg Barclays Municipal Bond Index is an unmanaged index composed of long-term tax-exempt bonds with a minimum credit rating of Baa. You cannot invest directly in an index. |
| 5 | The Bloomberg Barclays Global Aggregate ex-USD Index is an unmanaged index that provides a broad-based measure of the global investment-grade fixed-income markets excluding the U.S. dollar-denominated debt market. You cannot invest directly in an index. |
| 6 | The ICE BofAML U.S. High Yield Index is a market-capitalization-weighted index of domestic and Yankee high-yield bonds. The index tracks the performance of high-yield securities traded in the U.S. bond market. You cannot invest directly in an index. Copyright 2018. ICE Data Indices, LLC. All rights reserved. |
| 7 | The MSCI Emerging Markets (EM) Index (Net) is a free-float-adjusted market-capitalization-weighted index that is designed to measure large- and mid-cap equity market performance of emerging markets. The MSCI EM Index (Net) consists of the following 24 emerging markets country indices: Brazil, Chile, China, Colombia, Czech Republic, Egypt, Greece, Hungary, India, Indonesia, Korea, Malaysia, Mexico, Pakistan, Peru, the Philippines, Poland, Qatar, Russia, South Africa, Taiwan, Thailand, Turkey, and the United Arab Emirates. You cannot invest directly in an index. |
| | | | | | |
| Letter to shareholders (unaudited) | | Wells Fargo Short-Term Bond Fund | | | 3 | |
October 2017 also marked one year since the regulatory reform of money market investing in the U.S. By December 2017, money market fund asset levels exceeded their December 2016 levels, reflecting continued investor demand for short-term investment opportunities offered in money market funds.
In December, the Organisation for Economic Co-operation and Development (OECD) reported that the global economy was expanding at its fastest rate since 2010; all 35 countries the OECD follows were on track to expand for 2017. International economies benefited from economic stimulus, which accelerated trade growth; improving employment; increased investment; and firming commodity prices.
The Fed raised the federal funds rate target to a range of 1.25% to 1.50% in December 2017 and began reducing its bond portfolio.
2018 opened with continued stock advances, then volatility.
Improving business and economic data globally continued to support stock advances through January 2018. Even political wrangling in the U.S. over budget resolutions could not dissuade investors from buying stocks as payrolls and factory orders increased. Long-term interest rates in the U.S. trended higher as the yield curve steepened—the 10-year Treasury rate moved from 2.46% to 2.84% and the 30-year rate moved from 2.81% to 3.08% during January 2018.
Investor sentiment shifted in February. Concerns about inflation began to emerge in the U.S. as readings from the Producer Price Index in January rose 2.5% year over year. During February 2018, the U.S. market endured a loss of more than 10% before recovering much of that loss, but volatility affected stocks globally throughout the month.
During January 2018, purchasing managers’ indexes in China, the eurozone, India, and Japan reported data for December that indicated continued growth. International stock values fell during February 2018, swept up in the selling momentum in U.S. markets.
Don’t let short-term uncertainty derail long-term investment goals.
Periods of investment uncertainty can present challenges, but experience has taught us that maintaining long-term investment goals can be an effective way to plan for the future. To help you create a sound strategy based on your personal goals and risk tolerance, Wells Fargo Funds offers more than 100 mutual funds spanning a wide range of asset classes and investment styles. Although diversification cannot guarantee an investment profit or prevent losses, we believe it can be an effective way to manage investment risk and potentially smooth out overall portfolio performance. We encourage investors to know their investments and to understand that appropriate levels of risk-taking may unlock opportunities.
Thank you for choosing to invest with Wells Fargo Funds. We appreciate your confidence in us and remain committed to helping you meet your financial needs.
Sincerely,

Andrew Owen
President
Wells Fargo Funds
During February 2018, the U.S. market endured a loss of more than 10% before recovering much of that loss, but volatility affected stocks globally throughout the month.
For further information about your Fund, contact your investment professional, visit our website at wellsfargofunds.com, or call us directly at 1-800-222-8222.
| | | | |
| 4 | | Wells Fargo Short-Term Bond Fund | | Performance highlights (unaudited) |
Investment objective
The Fund seeks current income consistent with capital preservation.
Manager
Wells Fargo Funds Management, LLC
Subadviser
Wells Capital Management Incorporated
Portfolio managers
Christopher Y. Kauffman, CFA®
Jay N. Mueller, CFA®
Noah M. Wise, CFA®
Average annual total returns (%) as of February 28, 20181
| | | | | | | | | | | | | | | | | | | | | | | | | | | | | | | | | | |
| | | | | Including sales charge | | | Excluding sales charge | | | Expense ratios2 (%) | |
| | | Inception date | | 1 year | | | 5 year | | | 10 year | | | 1 year | | | 5 year | | | 10 year | | | Gross | | | Net3 | |
| Class A (SSTVX) | | 8-31-1999 | | | (1.61 | ) | | | 0.56 | | | | 1.86 | | | | 0.39 | | | | 0.96 | | | | 2.07 | | | | 0.82 | | | | 0.73 | |
| Class C (WFSHX) | | 3-31-2008 | | | (1.36 | ) | | | 0.21 | | | | 1.29 | | | | (0.36 | ) | | | 0.21 | | | | 1.29 | | | | 1.57 | | | | 1.48 | |
| Institutional Class (SSHIX) | | 8-31-1999 | | | – | | | | – | | | | – | | | | 0.64 | | | | 1.26 | | | | 2.37 | | | | 0.49 | | | | 0.46 | |
| Bloomberg Barclays U.S. 1-3 Year Government/Credit Bond Index4 | | – | | | – | | | | – | | | | – | | | | 0.13 | | | | 0.74 | | | | 1.55 | | | | – | | | | – | |
Figures quoted represent past performance, which is no guarantee of future results, and do not reflect taxes that a shareholder may pay on fund distributions or the redemption of fund shares. Investment return and principal value of an investment will fluctuate so that an investor’s shares, when redeemed, may be worth more or less than their original cost. Performance shown without sales charges would be lower if sales charges were reflected. Current performance may be lower or higher than the performance data quoted, which assumes the reinvestment of dividends and capital gains. Current month-end performance is available on the Fund’s website, wellsfargofunds.com.
Index returns do not include transaction costs associated with buying and selling securities, any mutual fund fees or expenses, or any taxes. It is not possible to invest directly in an index.
For Class A shares, the maximum front-end sales charge is 2.00%. For Class C shares, the maximum contingent deferred sales charge is 1.00%. Performance including a contingent deferred sales charge assumes the sales charge for the corresponding time period. Institutional Class shares are sold without a front-end sales charge or contingent deferred sales charge.
Bond values fluctuate in response to the financial condition of individual issuers, general market and economic conditions, and changes in interest rates. Changes in market conditions and government policies may lead to periods of heightened volatility in the bond market and reduced liquidity for certain bonds held by the Fund. In general, when interest rates rise, bond values fall and investors may lose principal value. Interest-rate changes and their impact on the Fund and its share price can be sudden and unpredictable. Loans are subject to risks similar to those associated with other below-investment-grade bond investments, such as credit risk (for example, risk of issuer default), below investment- grade bond risk (for example, risk of greater volatility in value), and risk that the loan may become illiquid or difficult to price. The use of derivatives may reduce returns and/or increase volatility. Certain investment strategies tend to increase the total risk of an investment (relative to the broader market). Foreign investments are especially volatile and can rise or fall dramatically due to differences in the political and economic conditions of the host country. These risks are generally intensified in emerging markets. The Fund is exposed to high-yield securities risk and mortgage- and asset backed securities risk. Consult the Fund’s prospectus for additional information on these and other risks.
Please see footnotes on page 5.
| | | | | | |
| Performance highlights (unaudited) | | Wells Fargo Short-Term Bond Fund | | | 5 | |
| | | | |
| Ten largest holdings (%) as of February 28, 20185 | |
Baptist Memorial Health Care Facilities & Services, 2.15%, 3-22-2018 | | | 1.11 | |
Jackson National Life Insurance Company, 2.50%, 6-27-2020 | | | 1.07 | |
CCG Receivables Trust Series 2015-1 Class A3, 1.92%, 1-17-2023 | | | 1.00 | |
EMC Corporation, 2.65%, 6-1-2020 | | | 0.93 | |
Catholic Health Initiatives, 1.05%, 3-2-2018 | | | 0.93 | |
GM Financial Securitized Term Auto Receivables Trust Series 2018-1 Class A2A, 2.08%, 1-19-2021 | | | 0.92 | |
Hyundai Auto Receivables Trust Series 2016-A Class A4, 1.80%, 12-1-2019 | | | 0.88 | |
Citibank Credit Card Issuance Trust Series 2017-A2 Class A2, 1.74%, 1-19-2021 | | | 0.88 | |
Enterprise Fleet Financing Trust Series 2017-1 Class A2, 2.13%, 7-2-2022 | | | 0.88 | |
Ford Credit Auto Lease Trust Series 2017-C Class A2A, 1.80%, 9-15-2020 | | | 0.78 | |
|
| Portfolio allocation as of February 28, 20186 |
|
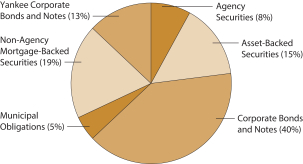
|
| 1 | Effective June 20, 2008, Advisor Class was renamed Class A and modified to assume the features and attributes of Class A. Historical performance shown for Class A shares through June 19, 2008, includes Advisor Class expenses. Historical performance shown prior to the inception of Class C reflects the performance of the former Investor Class, adjusted to reflect the higher expenses applicable to Class C. |
| 2 | Reflects the expense ratios as stated in the most recent prospectuses, which include the impact of 0.01% in acquired fund fees and expenses. The expense ratios shown are subject to change and may differ from the annualized expense ratios shown in the financial highlights of this report, which do not include acquired fund fees and expenses. |
| 3 | The manager has contractually committed through December 31, 2018, to waive fees and/or reimburse expenses to the extent necessary to cap the Fund’s Total Annual Fund Operating Expenses After Fee Waivers at 0.72% for Class A, 1.47% for Class C, and 0.45% for Institutional Class. After this time, the cap may be increased or the commitment to maintain the cap may be terminated only with the approval of the Board of Trustees. Brokerage commissions, stamp duty fees, interest, taxes, acquired fund fees and expenses, and extraordinary expenses are excluded from the expense cap. Without this cap, the Fund’s returns would have been lower. The expense ratio paid by an investor is the net expense ratio (the total annual fund operating expenses after fee waivers) as stated in the prospectuses. |
| 4 | The Bloomberg Barclays U.S. 1-3 Year Government/Credit Bond Index is the one- to three-year component of the Bloomberg Barclays U.S. Government/Credit Bond Index that includes securities in the Government and Credit Indexes. The Government Index includes Treasuries (that is, public obligations of the U.S. Treasury that have remaining maturities of more than one year) and agencies (that is, publicly issued debt of U.S. government agencies, quasi-federal corporations, and corporate or foreign debt guaranteed by the U.S. government). The Credit Index includes publicly issued U.S. corporate and foreign debentures and secured notes that meet specified maturity, liquidity, and quality requirements. You cannot invest directly in an index. |
| 5 | The ten largest holdings, excluding cash and cash equivalents, are calculated based on the value of the investments divided by total net assets of the Fund. Holdings are subject to change and may have changed since the date specified. |
| 6 | Amounts are calculated based on the total long-term investments of the Fund. These amounts are subject to change and may have changed since the date specified. |
| | | | |
| 6 | | Wells Fargo Short-Term Bond Fund | | Fund expenses (unaudited) |
As a shareholder of the Fund, you incur two types of costs: (1) transaction costs, including sales charges (loads) on purchase payments and contingent deferred sales charges (if any) on redemptions and (2) ongoing costs, including management fees, distribution (12b-1) and/or shareholder servicing fees, and other Fund expenses. This example is intended to help you understand your ongoing costs (in dollars) of investing in the Fund and to compare these costs with the ongoing costs of investing in other mutual funds.
The example is based on an investment of $1,000 invested at the beginning of the six-month period and held for the entire period from September 1, 2017 to February 28, 2018.
Actual expenses
The “Actual” line of the table below provides information about actual account values and actual expenses. You may use the information in this line, together with the amount you invested, to estimate the expenses that you paid over the period. Simply divide your account value by $1,000 (for example, an $8,600 account value divided by $1,000 = 8.6), then multiply the result by the number in the “Actual” line under the heading entitled “Expenses paid during period” for your applicable class of shares to estimate the expenses you paid on your account during this period.
Hypothetical example for comparison purposes
The “Hypothetical” line of the table below provides information about hypothetical account values and hypothetical expenses based on the Fund’s actual expense ratio and an assumed rate of return of 5% per year before expenses, which is not the Fund’s actual return. The hypothetical account values and expenses may not be used to estimate the actual ending account balance or expenses you paid for the period. You may use this information to compare the ongoing costs of investing in the Fund and other funds. To do so, compare this 5% hypothetical example with the 5% hypothetical examples that appear in the shareholder reports of the other funds.
Please note that the expenses shown in the table are meant to highlight your ongoing costs only and do not reflect any transactional costs, such as sales charges (loads) and contingent deferred sales charges. Therefore, the “Hypothetical” line of the table is useful in comparing ongoing costs only and will not help you determine the relative total costs of owning different funds. In addition, if these transactional costs were included, your costs would have been higher.
| | | | | | | | | | | | | | | | |
| | | Beginning
account value
9-1-2017 | | | Ending
account value
2-28-2018 | | | Expenses
paid during
the period¹ | | | Annualized net
expense ratio | |
Class A | | | | | | | | | | | | | | | | |
Actual | | $ | 1,000.00 | | | $ | 994.94 | | | $ | 3.56 | | | | 0.72 | % |
Hypothetical (5% return before expenses) | | $ | 1,000.00 | | | $ | 1,021.22 | | | $ | 3.61 | | | | 0.72 | % |
Class C | | | | | | | | | | | | | | | | |
Actual | | $ | 1,000.00 | | | $ | 991.23 | | | $ | 7.26 | | | | 1.47 | % |
Hypothetical (5% return before expenses) | | $ | 1,000.00 | | | $ | 1,017.50 | | | $ | 7.35 | | | | 1.47 | % |
Institutional Class | | | | | | | | | | | | | | | | |
Actual | | $ | 1,000.00 | | | $ | 996.19 | | | $ | 2.33 | | | | 0.47 | % |
Hypothetical (5% return before expenses) | | $ | 1,000.00 | | | $ | 1,022.46 | | | $ | 2.36 | | | | 0.47 | % |
| 1 | Expenses paid is equal to the annualized net expense ratio of each class multiplied by the average account value over the period, multiplied by the number of days in the most recent fiscal half-year divided by the number of days in the fiscal year (to reflect the one-half-year period). |
| | | | | | |
| Portfolio of investments—February 28, 2018 (unaudited) | | Wells Fargo Short-Term Bond Fund | | | 7 | |
| | | | | | | | | | | | | | | | |
| Security name | | Interest rate | | | Maturity date | | | Principal | | | Value | |
| | | | |
Agency Securities: 7.12% | | | | | | | | | | | | | | | | |
FDIC Series 2010-R1 Class A 144A | | | 2.18 | % | | | 5-25-2050 | | | $ | 846,971 | | | $ | 848,400 | |
FDIC Series 2013-R1 Class A 144A | | | 1.15 | | | | 3-25-2033 | | | | 628,476 | | | | 618,898 | |
FHLMC | | | 3.00 | | | | 2-15-2024 | | | | 97,951 | | | | 98,071 | |
FHLMC (1 Year Treasury Constant Maturity +2.25%) ± | | | 3.01 | | | | 4-1-2032 | | | | 41,987 | | | | 43,912 | |
FHLMC (1 Year Treasury Constant Maturity +2.40%) ± | | | 3.35 | | | | 7-1-2029 | | | | 2,416 | | | | 2,496 | |
FHLMC (3 Year Treasury Constant Maturity +2.25%) ± | | | 3.49 | | | | 5-1-2026 | | | | 38,693 | | | | 38,488 | |
FHLMC | | | 3.50 | | | | 10-15-2025 | | | | 614,379 | | | | 631,106 | |
FHLMC | | | 3.50 | | | | 6-15-2038 | | | | 385,772 | | | | 388,283 | |
FHLMC (1 Year Treasury Constant Maturity +2.25%) ± | | | 3.53 | | | | 4-1-2038 | | | | 311,597 | | | | 327,363 | |
FHLMC (12 Month LIBOR +1.91%) ± | | | 3.66 | | | | 9-1-2031 | | | | 2,624 | | | | 2,647 | |
FHLMC | | | 4.00 | | | | 5-1-2025 | | | | 1,193,911 | | | | 1,230,860 | |
FHLMC | | | 4.50 | | | | 5-15-2018 | | | | 4,784 | | | | 4,793 | |
FHLMC | | | 6.00 | | | | 10-1-2021 | | | | 178,934 | | | | 185,941 | |
FHLMC | | | 9.00 | | | | 8-1-2018 | | | | 1 | | | | 1 | |
FHLMC | | | 9.00 | | | | 6-1-2019 | | | | 6,102 | | | | 6,134 | |
FHLMC | | | 9.00 | | | | 10-1-2019 | | | | 30,528 | | | | 31,414 | |
FHLMC | | | 9.50 | | | | 12-1-2022 | | | | 10,895 | | | | 11,030 | |
FHLMC | | | 10.50 | | | | 8-1-2018 | | | | 3,856 | | | | 3,860 | |
FHLMC | | | 10.50 | | | | 2-1-2019 | | | | 179 | | | | 180 | |
FHLMC | | | 10.50 | | | | 4-1-2019 | | | | 128 | | | | 129 | |
FHLMC | | | 10.50 | | | | 5-1-2019 | | | | 102 | | | | 105 | |
FHLMC | | | 10.50 | | | | 6-1-2019 | | | | 613 | | | | 618 | |
FHLMC | | | 10.50 | | | | 7-1-2019 | | | | 240 | | | | 242 | |
FHLMC Series 2597 Series AE | | | 5.50 | | | | 4-15-2033 | | | | 90,879 | | | | 96,333 | |
FHLMC Series 2631 Class LC | | | 4.50 | | | | 6-15-2018 | | | | 13,106 | | | | 13,133 | |
FHLMC Series 2642 Class AR | | | 4.50 | | | | 7-15-2023 | | | | 294,914 | | | | 305,195 | |
FHLMC Series 2958 Class QD | | | 4.50 | | | | 4-15-2020 | | | | 68,624 | | | | 68,737 | |
FHLMC Series 3266 Class D | | | 5.00 | | | | 1-15-2022 | | | | 130,497 | | | | 131,064 | |
FHLMC Series 3609 Class LA | | | 4.00 | | | | 12-15-2024 | | | | 74,462 | | | | 74,904 | |
FHLMC Series 3855 Class HL | | | 3.50 | | | | 2-15-2026 | | | | 122,302 | | | | 123,345 | |
FHLMC Series 3920 Class AB | | | 3.00 | | | | 9-15-2025 | | �� | | 435,577 | | | | 438,540 | |
FHLMC Series KI01 Class A (1 Month LIBOR +0.16%) ± | | | 1.74 | | | | 9-25-2022 | | | | 300,000 | | | | 300,000 | |
FHLMC Series KP04 Class AG1 (1 Month LIBOR +0.22%) ± | | | 1.80 | | | | 7-25-2020 | | | | 1,485,000 | | | | 1,486,404 | |
FHLMC Series QO04 Class AFL (12 Month Treasury Average +0.74%) ± | | | 1.94 | | | | 10-25-2021 | | | | 1,466,992 | | | | 1,468,632 | |
FHLMC Series T-42 Class A6 | | | 9.50 | | | | 2-25-2042 | | | | 347,779 | | | | 418,239 | |
FHLMC Series T-57 Class 2A1 ±± | | | 3.70 | | | | 7-25-2043 | | | | 35,639 | | | | 37,678 | |
FHLMC Series T-59 Class 2A1 ±± | | | 3.48 | | | | 10-25-2043 | | | | 989,681 | | | | 996,762 | |
FNMA (1 Year Treasury Constant Maturity +1.27%) ± | | | 2.50 | | | | 8-1-2034 | | | | 301,612 | | | | 305,494 | |
FNMA | | | 3.02 | | | | 11-1-2020 | | | | 256,181 | | | | 257,313 | |
FNMA (1 Year Treasury Constant Maturity +2.26%) ± | | | 3.35 | | | | 8-1-2036 | | | | 1,623,931 | | | | 1,714,728 | |
FNMA (1 Year Treasury Constant Maturity +2.19%) ± | | | 3.43 | | | | 11-1-2031 | | | | 44,322 | | | | 46,378 | |
FNMA (12 Month Treasury Average +2.36%) ± | | | 3.53 | | | | 10-1-2036 | | | | 1,319,106 | | | | 1,399,275 | |
FNMA (12 Month Treasury Average +2.41%) ± | | | 3.53 | | | | 7-1-2036 | | | | 1,199,038 | | | | 1,274,023 | |
FNMA (12 Month LIBOR +1.82%) ± | | | 3.59 | | | | 9-1-2040 | | | | 1,051,512 | | | | 1,101,624 | |
FNMA | | | 4.00 | | | | 6-25-2026 | | | | 631,594 | | | | 661,205 | |
FNMA | | | 4.00 | | | | 9-1-2026 | | | | 1,776,621 | | | | 1,827,054 | |
FNMA | | | 4.00 | | | | 8-25-2037 | | | | 473,094 | | | | 482,850 | |
FNMA | | | 5.50 | | | | 3-1-2023 | | | | 594,919 | | | | 621,901 | |
FNMA | | | 5.50 | | | | 8-25-2034 | | | | 348,037 | | | | 349,469 | |
FNMA | | | 6.00 | | | | 4-1-2021 | | | | 86,999 | | | | 89,393 | |
The accompanying notes are an integral part of these financial statements.
| | | | |
| 8 | | Wells Fargo Short-Term Bond Fund | | Portfolio of investments—February 28, 2018 (unaudited) |
| | | | | | | | | | | | | | | | |
| Security name | | Interest rate | | | Maturity date | | | Principal | | | Value | |
| | | | |
Agency Securities (continued) | | | | | | | | | | | | | | | | |
FNMA | | | 6.00 | % | | | 3-1-2033 | | | $ | 542,922 | | | $ | 608,088 | |
FNMA | | | 6.28 | | | | 11-1-2018 | | | | 75,700 | | | | 75,598 | |
FNMA | | | 6.50 | | | | 8-1-2031 | | | | 260,359 | | | | 293,751 | |
FNMA | | | 7.60 | | | | 8-1-2018 | | | | 178,912 | | | | 178,946 | |
FNMA | | | 8.00 | | | | 9-1-2023 | | | | 1,245 | | | | 1,255 | |
FNMA | | | 8.33 | | | | 7-15-2020 | | | | 5,116 | | | | 5,272 | |
FNMA | | | 9.00 | | | | 2-15-2020 | | | | 259 | | | | 270 | |
FNMA | | | 9.00 | | | | 11-1-2024 | | | | 53,091 | | | | 57,186 | |
FNMA | | | 11.00 | | | | 10-15-2020 | | | | 3,343 | | | | 3,398 | |
FNMA Grantor Trust Series 2002-T12 Class A4 | | | 9.50 | | | | 5-25-2042 | | | | 572,408 | | | | 673,534 | |
FNMA Series 1989-29 Class Z | | | 10.00 | | | | 6-25-2019 | | | | 19,669 | | | | 20,370 | |
FNMA Series 1989-63 Class Z | | | 9.40 | | | | 10-25-2019 | | | | 3,945 | | | | 4,071 | |
FNMA Series 2002-T1 Class A4 | | | 9.50 | | | | 11-25-2031 | | | | 39,892 | | | | 46,121 | |
FNMA Series 2003-15 Class CB | | | 5.00 | | | | 3-25-2018 | | | | 141 | | | | 140 | |
FNMA Series 2003-41 Class PE | | | 5.50 | | | | 5-25-2023 | | | | 390,265 | | | | 405,061 | |
FNMA Series 2003-W11 Class A1 ±± | | | 4.55 | | | | 6-25-2033 | | | | 12,401 | | | | 12,936 | |
FNMA Series 2003-W6 Class 6A ±± | | | 3.85 | | | | 8-25-2042 | | | | 789,044 | | | | 810,168 | |
FNMA Series 2003-W6 Class PT4 ±± | | | 8.32 | | | | 10-25-2042 | | | | 74,741 | | | | 90,601 | |
FNMA Series 2004-32 Class AY | | | 4.00 | | | | 5-25-2019 | | | | 36,245 | | | | 36,432 | |
FNMA Series 2004-90 Class XY | | | 4.00 | | | | 9-25-2034 | | | | 135,134 | | | | 135,701 | |
FNMA Series 2008-53 Class CA | | | 5.00 | | | | 7-25-2023 | | | | 143,023 | | | | 145,071 | |
FNMA Series 2009-M01 Class A2 | | | 4.29 | | | | 7-25-2019 | | | | 1,038,628 | | | | 1,050,550 | |
FNMA Series 2010-37 Class A1 | | | 5.41 | | | | 5-25-2035 | | | | 2,173,926 | | | | 2,254,206 | |
FNMA Series 2011-133 Class A | | | 3.50 | | | | 6-25-2029 | | | | 407,168 | | | | 411,801 | |
FNMA Series 2011-17 Class ED | | | 3.50 | | | | 7-25-2025 | | | | 52,287 | | | | 52,350 | |
FNMA Series 2011-39 Class CA | | | 3.00 | | | | 5-25-2024 | | | | 89,929 | | | | 89,960 | |
FNMA Series 2011-66 Class BE | | | 3.00 | | | | 3-25-2025 | | | | 43,811 | | | | 43,800 | |
FNMA Series 2011-71 Class DJ | | | 3.00 | | | | 3-25-2025 | | | | 24,822 | | | | 24,798 | |
GNMA | | | 4.00 | | | | 8-16-2023 | | | | 26,959 | | | | 27,007 | |
GNMA | | | 4.50 | | | | 4-20-2035 | | | | 142,536 | | | | 146,738 | |
GNMA | | | 8.00 | | | | 12-15-2023 | | | | 16,954 | | | | 18,462 | |
GNMA | | | 9.00 | | | | 11-15-2024 | | | | 7,033 | | | | 7,407 | |
GNMA Series 2012-19 Class A | | | 1.83 | | | | 3-16-2039 | | | | 925,907 | | | | 919,608 | |
GNMA Series 2017-H13 Class FJ (1 Month LIBOR +0.20%) ± | | | 1.76 | | | | 5-20-2067 | | | | 1,377,230 | | | | 1,377,601 | |
GNMA Series 2017-H16 Class FD (1 Month LIBOR +0.20%) ± | | | 1.76 | | | | 8-20-2067 | | | | 1,602,594 | | | | 1,600,337 | |
| |
Total Agency Securities (Cost $32,046,439) | | | | 32,193,239 | |
| | | | | | | | | | | | | | | | |
| | | | |
Asset-Backed Securities: 14.62% | | | | | | | | | | | | | | | | |
Ascentium Equipment Receivables LLC Series 2017-2A Class A2 144A | | | 2.00 | | | | 5-11-2020 | | | | 2,000,000 | | | | 1,987,466 | |
Avis Budget Rental Car Funding LLC Series 2013-1A Class A 144A | | | 1.92 | | | | 9-20-2019 | | | | 1,420,000 | | | | 1,417,713 | |
BMW Vehicle Owner Trust Series 2017-1 Class A2 | | | 1.64 | | | | 7-22-2019 | | | | 1,443,576 | | | | 1,440,449 | |
CCG Receivables Trust Series 2015-1 Class A3 144A | | | 1.92 | | | | 1-17-2023 | | | | 4,534,124 | | | | 4,526,045 | |
Chesapeake Funding LLC Series 2017-3A Class A 144A | | | 1.91 | | | | 8-15-2029 | | | | 3,080,000 | | | | 3,054,528 | |
Citibank Credit Card Issuance Trust Series 2017-A2 Class A2 | | | 1.74 | | | | 1-19-2021 | | | | 4,000,000 | | | | 3,979,230 | |
CNH Equipment Trust Series 2015-A Class A3 | | | 1.30 | | | | 4-15-2020 | | | | 259,932 | | | | 259,338 | |
Dell Equipment Finance Trust Series 2016-1 Class A2 144A | | | 1.43 | | | | 9-24-2018 | | | | 54,974 | | | | 54,955 | |
Education Loan Asset-Backed Trust Series 2013-1 Class A1 (1 Month LIBOR +0.80%) 144A± | | | 2.36 | | | | 6-25-2026 | | | | 1,488,344 | | | | 1,495,596 | |
Enterprise Fleet Financing Trust Series 2017-1 Class A2 144A | | | 2.13 | | | | 7-20-2022 | | | | 3,991,469 | | | | 3,977,339 | |
Ford Credit Auto Lease Trust Series 2017-B Class A2A | | | 1.80 | | | | 6-15-2020 | | | | 1,490,000 | | | | 1,483,648 | |
The accompanying notes are an integral part of these financial statements.
| | | | | | |
| Portfolio of investments—February 28, 2018 (unaudited) | | Wells Fargo Short-Term Bond Fund | | | 9 | |
| | | | | | | | | | | | | | | | |
| Security name | | Interest rate | | | Maturity date | | | Principal | | | Value | |
| | | | |
Asset-Backed Securities (continued) | | | | | | | | | | | | | | | | |
Ford Credit Auto Lease Trust Series 2017-C Class A2A | | | 1.80 | % | | | 9-15-2020 | | | $ | 3,530,000 | | | $ | 3,518,323 | |
GM Financial Automobile Leasing Trust Series 2016-1 Class A3 | | | 1.64 | | | | 7-20-2019 | | | | 2,566,738 | | | | 2,561,931 | |
GM Financial Securitized Term Auto Receivables Trust Series 2018-1 Class A2A | | | 2.08 | | | | 1-19-2021 | | | | 4,155,000 | | | | 4,143,982 | |
GMF Floorplan Owner Revolving Trust Series 2015-1 Class A1 144A | | | 1.65 | | | | 5-15-2020 | | | | 2,050,000 | | | | 2,048,377 | |
Home Equity Asset Trust Series 2003-6 Class M1 (1 Month LIBOR +1.05%) ± | | | 3.06 | | | | 2-25-2034 | | | | 1,025,831 | | | | 1,004,260 | |
Hyundai Auto Receivables Trust Series 2016-A Class A3 144A | | | 1.60 | | | | 7-15-2019 | | | | 586,877 | | | | 586,379 | |
Hyundai Auto Receivables Trust Series 2016-A Class A4 144A | | | 1.80 | | | | 12-16-2019 | | | | 4,000,000 | | | | 3,992,352 | |
Jimmy John’s Funding LLC Series 2017-1A Class A2I 144A | | | 3.61 | | | | 7-30-2047 | | | | 1,243,750 | | | | 1,238,613 | |
John Deere Owner Trust Series 2016-A Class A3 | | | 1.36 | | | | 4-15-2020 | | | | 1,494,513 | | | | 1,486,692 | |
Kubota Credit Owner Trust Series 2016-1A Class A2 144A | | | 1.25 | | | | 4-15-2019 | | | | 480,951 | | | | 480,269 | |
MMAF Equipment Finance LLC Series 2015-AA Class A3 144A | | | 1.39 | | | | 10-16-2019 | | | | 301,995 | | | | 301,885 | |
MMAF Equipment Finance LLC Series 2016-AA Class A2 144A | | | 1.39 | | | | 12-17-2018 | | | | 875,293 | | | | 874,802 | |
MMAF Equipment Finance LLC Series 2017-B Class A2 144A | | | 1.93 | | | | 10-15-2020 | | | | 2,500,000 | | | | 2,485,916 | |
Navistar Financial Dealer Note Master Trust Series 2017-1 Class A (1 Month LIBOR +0.78%) 144A± | | | 2.34 | | | | 6-27-2022 | | | | 2,000,000 | | | | 2,004,268 | |
Nissan Auto Lease Trust Series 2017-B Class A3 | | | 2.05 | | | | 9-15-2020 | | | | 1,775,000 | | | | 1,760,235 | |
Santander Retail Auto Lease Trust Series 2017-A Class A2A 144A | | | 2.02 | | | | 3-20-2020 | | | | 3,500,000 | | | | 3,485,894 | |
SLC Student Loan Trust Series 2006-2 Class A5 (3 Month LIBOR +0.10%) ± | | | 1.69 | | | | 9-15-2026 | | | | 2,114,296 | | | | 2,109,793 | |
SLM Student Loan Trust Series 2011-1 Class A1 (1 Month LIBOR +0.52%) ± | | | 2.14 | | | | 3-25-2026 | | | | 576,930 | | | | 578,963 | |
SLM Student Loan Trust Series 2011-2 Class A1 (1 Month LIBOR +0.60%) ± | | | 2.22 | | | | 11-25-2027 | | | | 444,883 | | | | 447,759 | |
Student Loan Consolidation Center Series 2011-1 Class A (1 Month LIBOR +1.22%) 144A± | | | 2.78 | | | | 10-25-2027 | | | | 2,486,661 | | | | 2,521,125 | |
Verizon Owner Trust Series 2017-1A Class A 144A | | | 2.06 | | | | 9-20-2021 | | | | 1,800,000 | | | | 1,783,408 | |
Volvo Financial Equipment LLC Series 2016-1A Class A3 144A | | | 1.67 | | | | 2-18-2020 | | | | 1,364,347 | | | | 1,360,397 | |
World Omni Auto Receivables Trust Series 2016-B Class A2 | | | 1.10 | | | | 1-15-2020 | | | | 691,831 | | | | 690,839 | |
World Omni Auto Receivables Trust Series 2017-A Class A2 | | | 1.68 | | | | 12-16-2019 | | | | 938,116 | | | | 934,171 | |
| |
Total Asset-Backed Securities (Cost $66,301,418) | | | | 66,076,940 | |
| | | | | | | | | | | | | | | | |
| | | | |
Corporate Bonds and Notes: 38.29% | | | | | | | | | | | | | | | | |
| | | | |
Consumer Discretionary: 3.91% | | | | | | | | | | | | | | | | |
| | | | |
| Hotels, Restaurants & Leisure: 0.61% | | | | | | | | | | | | | | | | |
GLP Capital LP | | | 4.88 | | | | 11-1-2020 | | | | 1,340,000 | | | | 1,373,500 | |
MGM Resorts International | | | 5.25 | | | | 3-31-2020 | | | | 1,340,000 | | | | 1,381,875 | |
| |
| | | | 2,755,375 | |
| | | | | | | | | | | | | | | | |
| | | | |
| Household Durables: 0.10% | | | | | | | | | | | | | | | | |
Lennar Corporation | | | 4.50 | | | | 11-15-2019 | | | | 445,000 | | | | 452,231 | |
| | | | | | | | | | | | | | | | |
| | | | |
| Internet & Direct Marketing Retail: 0.17% | | | | | | | | | | | | | | | | |
Amazon.com Incorporated 144A | | | 1.90 | | | | 8-21-2020 | | | | 765,000 | | | | 749,238 | |
| | | | | | | | | | | | | | | | |
| | | | |
| Media: 2.47% | | | | | | | | | | | | | | | | |
Charter Communications Operating LLC | | | 3.58 | | | | 7-23-2020 | | | | 3,000,000 | | | | 3,022,034 | |
DIRECTV Holdings LLC | | | 5.88 | | | | 10-1-2019 | | | | 1,680,000 | | | | 1,756,894 | |
Discovery Communications LLC | | | 2.20 | | | | 9-20-2019 | | | | 1,275,000 | | | | 1,261,383 | |
NBCUniversal Enterprise Incorporated 144A | | | 5.25 | | | | 12-31-2049 | | | | 1,655,000 | | | | 1,704,650 | |
TEGNA Incorporated | | | 5.13 | | | | 7-15-2020 | | | | 1,340,000 | | | | 1,356,750 | |
Time Warner Cable Incorporated | | | 4.88 | | | | 3-15-2020 | | | | 2,010,000 | | | | 2,083,888 | |
| |
| | | | 11,185,599 | |
| | | | | | | | | | | | | | | | |
The accompanying notes are an integral part of these financial statements.
| | | | |
| 10 | | Wells Fargo Short-Term Bond Fund | | Portfolio of investments—February 28, 2018 (unaudited) |
| | | | | | | | | | | | | | | | |
| Security name | | Interest rate | | | Maturity date | | | Principal | | | Value | |
| | | | |
| Multiline Retail: 0.27% | | | | | | | | | | | | | | | | |
Macy’s Retail Holdings Incorporated | | | 3.45 | % | | | 1-15-2021 | | | $ | 1,205,000 | | | $ | 1,204,362 | |
| | | | | | | | | | | | | | | | |
| | | | |
| Specialty Retail: 0.29% | | | | | | | | | | | | | | | | |
Group 1 Automotive Incorporated | | | 5.00 | | | | 6-1-2022 | | | | 1,300,000 | | | | 1,326,000 | |
| | | | | | | | | | | | | | | | |
| | | | |
Consumer Staples: 2.18% | | | | | | | | | | | | | | | | |
| | | | |
| Beverages: 0.66% | | | | | | | | | | | | | | | | |
Anheuser-Busch InBev Finance Company | | | 2.65 | | | | 2-1-2021 | | | | 3,000,000 | | | | 2,972,154 | |
| | | | | | | | | | | | | | | | |
| | | | |
| Food Products: 0.66% | | | | | | | | | | | | | | | | |
Kraft Heinz Foods Company | | | 2.00 | | | | 7-2-2018 | | | | 3,000,000 | | | | 2,997,618 | |
| | | | | | | | | | | | | | | | |
| | | | |
| Tobacco: 0.86% | | | | | | | | | | | | | | | | |
B.A.T. Capital Corporation 144A | | | 2.30 | | | | 8-14-2020 | | | | 1,785,000 | | | | 1,752,620 | |
Philip Morris International Incorporated | | | 1.38 | | | | 2-25-2019 | | | | 2,165,000 | | | | 2,138,995 | |
| |
| | | | 3,891,615 | |
| | | | | | | | | | | | | | | | |
| | | | |
Energy: 1.92% | | | | | | | | | | | | | | | | |
| | | | |
| Oil, Gas & Consumable Fuels: 1.92% | | | | | | | | | | | | | | | | |
BP AMI Leasing Incorporated 144A | | | 5.52 | | | | 5-8-2019 | | | | 825,000 | | | | 853,266 | |
Enable Midstream Partner LP | | | 2.40 | | | | 5-15-2019 | | | | 3,000,000 | | | | 2,971,901 | |
Energy Transfer Partners LP | | | 2.50 | | | | 6-15-2018 | | | | 2,000,000 | | | | 1,999,244 | |
Rockies Express Pipeline 144A | | | 6.85 | | | | 7-15-2018 | | | | 1,500,000 | | | | 1,518,750 | |
Sabine Pass Liquefaction LLC | | | 6.25 | | | | 3-15-2022 | | | | 1,210,000 | | | | 1,320,040 | |
| |
| | | | 8,663,201 | |
| | | | | | | | | | | | | | | | |
| | | | |
Financials: 15.10% | | | | | | | | | | | | | | | | |
| | | | |
| Banks: 4.25% | | | | | | | | | | | | | | | | |
Bank of America Corporation | | | 2.15 | | | | 11-9-2020 | | | | 2,000,000 | | | | 1,958,070 | |
Citigroup Incorporated | | | 2.50 | | | | 7-29-2019 | | | | 2,235,000 | | | | 2,226,713 | |
Citizens Bank | | | 2.20 | | | | 5-26-2020 | | | | 2,000,000 | | | | 1,968,887 | |
Fifth Third Bank | | | 2.30 | | | | 3-15-2019 | | | | 1,845,000 | | | | 1,840,700 | |
JPMorgan Chase | | | 1.65 | | | | 9-23-2019 | | | | 2,000,000 | | | | 1,971,402 | |
JPMorgan Chase | | | 2.75 | | | | 6-23-2020 | | | | 1,000,000 | | | | 997,075 | |
KeyBank Corporation | | | 4.63 | | | | 6-15-2018 | | | | 3,180,000 | | | | 3,197,953 | |
Regions Bank | | | 2.25 | | | | 9-14-2018 | | | | 2,000,000 | | | | 1,998,185 | |
Santander Bank | | | 2.70 | | | | 5-24-2019 | | | | 541,000 | | | | 540,131 | |
US Bank | | | 2.05 | | | | 10-23-2020 | | | | 2,540,000 | | | | 2,491,603 | |
| |
| | | | 19,190,719 | |
| | | | | | | | | | | | | | | | |
| | | | |
| Capital Markets: 1.64% | | | | | | | | | | | | | | | | |
Goldman Sachs Group Incorporated | | | 2.30 | | | | 12-13-2019 | | | | 1,000,000 | | | | 991,679 | |
Goldman Sachs Group Incorporated | | | 2.60 | | | | 12-27-2020 | | | | 3,085,000 | | | | 3,047,945 | |
Morgan Stanley | | | 2.20 | | | | 12-7-2018 | | | | 2,000,000 | | | | 1,994,397 | |
Morgan Stanley | | | 2.45 | | | | 2-1-2019 | | | | 840,000 | | | | 838,032 | |
S&P Global Incorporated | | | 2.50 | | | | 8-15-2018 | | | | 550,000 | | | | 550,515 | |
| |
| | | | 7,422,568 | |
| | | | | | | | | | | | | | | | |
The accompanying notes are an integral part of these financial statements.
| | | | | | |
| Portfolio of investments—February 28, 2018 (unaudited) | | Wells Fargo Short-Term Bond Fund | | | 11 | |
| | | | | | | | | | | | | | | | |
| Security name | | Interest rate | | | Maturity date | | | Principal | | | Value | |
| | | | |
| Consumer Finance: 5.07% | | | | | | | | | | | | | | | | |
Ally Financial Incorporated | | | 3.25 | % | | | 11-5-2018 | | | $ | 2,930,000 | | | $ | 2,932,197 | |
Capital One Financial Corporation | | | 2.50 | | | | 5-12-2020 | | | | 3,000,000 | | | | 2,964,536 | |
Daimler Finance North America LLC 144A | | | 1.65 | | | | 3-2-2018 | | | | 3,000,000 | | | | 3,000,000 | |
Daimler Finance North America LLC 144A | | | 2.20 | | | | 5-5-2020 | | | | 520,000 | | | | 511,491 | |
Daimler Finance North America LLC 144A | | | 3.00 | | | | 2-22-2021 | | | | 2,850,000 | | | | 2,847,787 | |
Ford Motor Credit Company LLC | | | 2.94 | | | | 1-8-2019 | | | | 1,335,000 | | | | 1,338,082 | |
Ford Motor Credit Company LLC | | | 5.00 | | | | 5-15-2018 | | | | 3,000,000 | | | | 3,015,687 | |
General Motors Financial Company | | | 3.15 | | | | 1-15-2020 | | | | 3,000,000 | | | | 3,004,617 | |
Nissan Motor Acceptance Corporation 144A | | | 2.00 | | | | 3-8-2019 | | | | 2,000,000 | | | | 1,988,513 | |
Synchrony Financial | | | 2.60 | | | | 1-15-2019 | | | | 1,335,000 | | | | 1,332,799 | |
| |
| | | | 22,935,709 | |
| | | | | | | | | | | | | | | | |
| | | | |
| Insurance: 4.14% | | | | | | | | | | | | | | | | |
Axis Specialty Finance LLC | | | 5.88 | | | | 6-1-2020 | | | | 1,794,000 | | | | 1,902,256 | |
Jackson National Life Insurance Company 144A | | | 2.50 | | | | 6-27-2022 | | | | 5,000,000 | | | | 4,857,735 | |
Lincoln National Corporation | | | 8.75 | | | | 7-1-2019 | | | | 744,000 | | | | 802,799 | |
Metropolitan Life Global Funding Incorporated 144A | | | 1.55 | | | | 9-13-2019 | | | | 1,820,000 | | | | 1,792,341 | |
Metropolitan Life Global Funding Incorporated 144A | | | 1.75 | | | | 12-19-2018 | | | | 2,000,000 | | | | 1,990,002 | |
Protective Life Global Funding 144A | | | 2.26 | | | | 4-8-2020 | | | | 1,450,000 | | | | 1,434,254 | |
Provident Companies Incorporated | | | 7.00 | | | | 7-15-2018 | | | | 2,525,000 | | | | 2,568,291 | |
Reliance Standard Life Insurance 144A | | | 2.15 | | | | 10-15-2018 | | | | 1,390,000 | | | | 1,388,562 | |
Reliance Standard Life Insurance 144A | | | 2.38 | | | | 5-4-2020 | | | | 2,000,000 | | | | 1,972,623 | |
| |
| | | | 18,708,863 | |
| | | | | | | | | | | | | | | | |
| | | | |
Health Care: 2.27% | | | | | | | | | | | | | | | | |
| | | | |
| Health Care Providers & Services: 0.88% | | | | | | | | | | | | | | | | |
Anthem Incorporated | | | 2.50 | | | | 11-21-2020 | | | | 1,235,000 | | | | 1,221,349 | |
HCA Incorporated | | | 6.50 | | | | 2-15-2020 | | | | 1,315,000 | | | | 1,384,038 | |
Tenet Healthcare Corporation | | | 6.00 | | | | 10-1-2020 | | | | 1,340,000 | | | | 1,393,600 | |
| |
| | | | 3,998,987 | |
| | | | | | | | | | | | | | | | |
| | | | |
| Pharmaceuticals: 1.39% | | | | | | | | | | | | | | | | |
Eli Lilly and Company | | | 2.35 | | | | 5-15-2022 | | | | 3,000,000 | | | | 2,921,378 | |
EMD Finance LLC 144A | | | 2.40 | | | | 3-19-2020 | | | | 1,925,000 | | | | 1,903,598 | |
Teva Pharmaceutical Finance LLC | | | 2.25 | | | | 3-18-2020 | | | | 1,500,000 | | | | 1,448,259 | |
| |
| | | | 6,273,235 | |
| | | | | | | | | | | | | | | | |
| | | | |
Industrials: 2.13% | | | | | | | | | | | | | | | | |
| | | | |
| Aerospace & Defense: 1.02% | | | | | | | | | | | | | | | | |
L-3 Communications Corporation | | | 5.20 | | | | 10-15-2019 | | | | 3,000,000 | | | | 3,106,994 | |
Rockwell Collins Incorporated | | | 1.95 | | | | 7-15-2019 | | | | 1,530,000 | | | | 1,514,669 | |
| |
| | | | 4,621,663 | |
| | | | | | | | | | | | | | | | |
| | | | |
| Airlines: 0.38% | | | | | | | | | | | | | | | | |
Delta Air Lines Incorporated | | | 4.75 | | | | 11-7-2021 | | | | 1,652,378 | | | | 1,696,661 | |
| | | | | | | | | | | | | | | | |
| | | | |
| Commercial Services & Supplies: 0.49% | | | | | | | | | | | | | | | | |
Boardwalk Pipelines LLC | | | 5.20 | | | | 6-1-2018 | | | | 2,179,000 | | | | 2,190,631 | |
| | | | | | | | | | | | | | | | |
The accompanying notes are an integral part of these financial statements.
| | | | |
| 12 | | Wells Fargo Short-Term Bond Fund | | Portfolio of investments—February 28, 2018 (unaudited) |
| | | | | | | | | | | | | | | | |
| Security name | | Interest rate | | | Maturity date | | | Principal | | | Value | |
| | | | |
| Transportation Infrastructure: 0.24% | | | | | | | | | | | | | | | | |
TTX Company 144A | | | 2.25 | % | | | 2-1-2019 | | | $ | 1,095,000 | | | $ | 1,092,249 | |
| | | | | | | | | | | | | | | | |
| | | | |
Information Technology: 5.09% | | | | | | | | | | | | | | | | |
| | | | |
| IT Services: 0.97% | | | | | | | | | | | | | | | | |
Fidelity National Information Services Incorporated | | | 2.00 | | | | 4-15-2018 | | | | 2,000,000 | | | | 1,999,705 | |
IBM Corporation | | | 1.80 | | | | 5-17-2019 | | | | 2,405,000 | | | | 2,384,280 | |
| |
| | | | 4,383,985 | |
| | | | | | | | | | | | | | | | |
| | | | |
| Semiconductors & Semiconductor Equipment: 1.76% | | | | | | | | | | | | | | | | |
Broadcom Corporation | | | 2.65 | | | | 1-15-2023 | | | | 3,000,000 | | | | 2,841,249 | |
KLA-Tencor Corporation | | | 3.38 | | | | 11-1-2019 | | | | 2,000,000 | | | | 2,018,633 | |
Maxim Integrated Product Incorporated | | | 2.50 | | | | 11-15-2018 | | | | 570,000 | | | | 569,413 | |
Qualcomm Incorporated | | | 1.85 | | | | 5-20-2019 | | | | 1,280,000 | | | | 1,268,495 | |
Qualcomm Incorporated | | | 2.10 | | | | 5-20-2020 | | | | 1,280,000 | | | | 1,254,886 | |
| |
| | | | 7,952,676 | |
| | | | | | | | | | | | | | | | |
| | | | |
| Software: 0.33% | | | | | | | | | | | | | | | | |
Microsoft Corporation | | | 2.40 | | | | 2-6-2022 | | | | 1,500,000 | | | | 1,473,557 | |
| | | | | | | | | | | | | | | | |
| | | | |
| Technology Hardware, Storage & Peripherals: 2.03% | | | | | | | | | | | | | | | | |
Apple Incorporated | | | 2.00 | | | | 11-13-2020 | | | | 3,000,000 | | | | 2,951,047 | |
EMC Corporation | | | 2.65 | | | | 6-1-2020 | | | | 4,340,000 | | | | 4,222,114 | |
Hewlett Packard Enterprise Company | | | 3.60 | | | | 10-15-2020 | | | | 2,000,000 | | | | 2,021,618 | |
| |
| | | | 9,194,779 | |
| | | | | | | | | | | | | | | | |
| | | | |
Materials: 0.55% | | | | | | | | | | | | | | | | |
| | | | |
| Paper & Forest Products: 0.55% | | | | | | | | | | | | | | | | |
Georgia Pacific LLC 144A | | | 2.54 | | | | 11-15-2019 | | | | 2,495,000 | | | | 2,484,572 | |
| | | | | | | | | | | | | | | | |
|
Real Estate: 1.02% | |
| | | | |
| Equity REITs: 1.02% | | | | | | | | | | | | | | | | |
DDR Corporation | | | 4.63 | | | | 7-15-2022 | | | | 2,355,000 | | | | 2,450,998 | |
Simon Property Group LP | | | 2.20 | | | | 2-1-2019 | | | | 2,165,000 | | | | 2,158,453 | |
| |
| | | | 4,609,451 | |
| | | | | | | | | | | | | | | | |
| | | | |
Telecommunication Services: 1.82% | | | | | | | | | | | | | | | | |
| | | | |
| Diversified Telecommunication Services: 1.82% | | | | | | | | | | | | | | | | |
AT&T Incorporated | | | 2.80 | | | | 2-17-2021 | | | | 1,910,000 | | | | 1,895,571 | |
AT&T Incorporated | | | 5.00 | | | | 3-1-2021 | | | | 1,085,000 | | | | 1,141,618 | |
AT&T Incorporated | | | 5.80 | | | | 2-15-2019 | | | | 783,000 | | | | 805,787 | |
Broadcom International Limited | | | 2.38 | | | | 1-15-2020 | | | | 1,280,000 | | | | 1,264,374 | |
Verizon Communications Incorporated | | | 4.60 | | | | 4-1-2021 | | | | 3,000,000 | | | | 3,137,382 | |
| |
| | | | 8,244,732 | |
| | | | | | | | | | | | | | | | |
| | | | |
Utilities: 2.30% | | | | | | | | | | | | | | | | |
| | | | |
| Electric Utilities: 1.70% | | | | | | | | | | | | | | | | |
Edison International | | | 2.13 | | | | 4-15-2020 | | | | 1,200,000 | | | | 1,180,390 | |
The accompanying notes are an integral part of these financial statements.
| | | | | | |
| Portfolio of investments—February 28, 2018 (unaudited) | | Wells Fargo Short-Term Bond Fund | | | 13 | |
| | | | | | | | | | | | | | | | |
| Security name | | Interest rate | | | Maturity date | | | Principal | | | Value | |
| | | | |
| Electric Utilities (continued) | | | | | | | | | | | | | | | | |
Exelon Corporation | | | 3.50 | % | | | 6-1-2022 | | | $ | 1,895,000 | | | $ | 1,892,625 | |
Interstate Power & Light Company | | | 5.88 | | | | 9-15-2018 | | | | 580,000 | | | | 590,342 | |
NV Energy Incorporated | | | 6.25 | | | | 11-15-2020 | | | | 2,000,000 | | | | 2,170,280 | |
Oklahoma Gas & Electric Company | | | 6.35 | | | | 9-1-2018 | | | | 1,792,000 | | | | 1,825,233 | |
| |
| | | | 7,658,870 | |
| | | | | | | | | | | | | | | | |
| | | | |
| Multi-Utilities: 0.60% | | | | | | | | | | | | | | | | |
Black Hills Corporation | | | 2.50 | | | | 1-11-2019 | | | | 1,355,000 | | | | 1,354,833 | |
Dominion Resources Incorporated | | | 2.96 | | | | 7-1-2019 | | | | 1,365,000 | | | | 1,366,766 | |
| |
| | | | 2,721,599 | |
| | | | | | | | | | | | | | | | |
| |
Total Corporate Bonds and Notes (Cost $174,423,338) | | | | 173,052,899 | |
| | | | | | | | | | | | | | | | |
| | | | |
Municipal Obligations: 4.88% | | | | | | | | | | | | | | | | |
| | | | |
| California: 0.68% | | | | | | | | | | | | | | | | |
Los Angeles CA Municipal Improvement Refunding Bond Convention Center Series A (Miscellaneous Revenue) | | | 2.34 | | | | 11-1-2018 | | | | 1,380,000 | | | | 1,382,029 | |
Roman Catholic Diocese of Oakland CA (Miscellaneous Revenue) | | | 6.04 | | | | 11-1-2019 | | | | 1,635,000 | | | | 1,664,717 | |
| |
| | | | 3,046,746 | |
| | | | | | | | | | | | | | | | |
| | | | |
| Connecticut: 0.66% | | | | | | | | | | | | | | | | |
Connecticut Series A (GO Revenue) | | | 2.30 | | | | 1-15-2019 | | | | 3,000,000 | | | | 2,998,320 | |
| | | | | | | | | | | | | | | | |
| | | | |
| Illinois: 0.96% | | | | | | | | | | | | | | | | |
Chicago IL (Tax Revenue) | | | 6.30 | | | | 12-1-2021 | | | | 1,125,000 | | | | 1,193,434 | |
State of Illinois (Miscellaneous Revenue) | | | 5.00 | | | | 5-1-2019 | | | | 3,070,000 | | | | 3,153,473 | |
| |
| | | | 4,346,907 | |
| | | | | | | | | | | | | | | | |
| | | | |
| Michigan: 0.43% | | | | | | | | | | | | | | | | |
Michigan Finance Authority Series D5 (Water & Sewer Revenue) | | | 2.85 | | | | 7-1-2019 | | | | 2,000,000 | | | | 1,961,900 | |
| | | | | | | | | | | | | | | | |
| | | | |
| New Jersey: 0.75% | | | | | | | | | | | | | | | | |
New Jersey EDA Series B (Miscellaneous Revenue, AGM Insured) ¤ | | | 0.00 | | | | 2-15-2019 | | | | 3,500,000 | | | | 3,406,620 | |
| | | | | | | | | | | | | | | | |
|
| Oregon: 0.41% | |
Portland OR Taxable Pension (GO Revenue) (m)(n) | | | 1.80 | | | | 6-1-2019 | | | | 1,875,000 | | | | 1,859,981 | |
| | | | | | | | | | | | | | | | |
| | | | |
| Pennsylvania: 0.19% | | | | | | | | | | | | | | | | |
Philadelphia PA IDA Pension Funding Series B (Miscellaneous Revenue, Ambac Insured) ¤ | | | 0.00 | | | | 4-15-2021 | | | | 970,000 | | | | 859,449 | |
| | | | | | | | | | | | | | | | |
| | | | |
| Rhode Island: 0.28% | | | | | | | | | | | | | | | | |
Rhode Island EDA (Industrial Development Revenue, AGM Insured) | | | 7.75 | | | | 11-1-2020 | | | | 1,200,000 | | | | 1,266,780 | |
| | | | | | | | | | | | | | | | |
| | | | |
| Wisconsin: 0.52% | | | | | | | | | | | | | | | | |
Wisconsin Healthcare PFA (Housing Revenue, Citizens Bank LOC) | | | 2.63 | | | | 11-1-2019 | | | | 2,365,000 | | | | 2,329,123 | |
| | | | | | | | | | | | | | | | |
| |
Total Municipal Obligations (Cost $22,149,951) | | | | 22,075,826 | |
| | | | | | | | | | | | | | | | |
The accompanying notes are an integral part of these financial statements.
| | | | |
| 14 | | Wells Fargo Short-Term Bond Fund | | Portfolio of investments—February 28, 2018 (unaudited) |
| | | | | | | | | | | | | | | | |
| Security name | | Interest rate | | | Maturity date | | | Principal | | | Value | |
| | | | |
Non-Agency Mortgage-Backed Securities: 18.21% | | | | | | | | | | | | | | | | |
ALM Loan Funding Series 2015-12A Class A1R (3 Month LIBOR +1.05%) 144A± | | | 2.77 | % | | | 4-16-2027 | | | $ | 1,275,000 | | | $ | 1,275,993 | |
Barclays Commercial Mortgage Series 2018-A (1 Month LIBOR +0.70%) 144A± | | | 2.29 | | | | 2-15-2033 | | | | 2,400,000 | | | | 2,400,000 | |
BlueMountain CLO Limited Series 2014-2A Class AR (3 Month LIBOR +0.93%) 144A± | | | 2.67 | | | | 7-20-2026 | | | | 2,030,000 | | | | 2,031,011 | |
BX Trust 2017 Series A (1 Month LIBOR +1.05%) 144A± | | | 2.64 | | | | 10-15-2032 | | | | 2,640,000 | | | | 2,644,924 | |
CD Commercial Mortgage Trust Series 2017-CD3 Class A1 | | | 1.97 | | | | 2-10-2050 | | | | 1,434,457 | | | | 1,413,537 | |
CGBAM Commercial Mortgage Trust Series 2015-SMRT Class A 144A | | | 2.81 | | | | 4-10-2028 | | | | 1,365,000 | | | | 1,362,158 | |
CGDBB Commercial Mortgage Trust Series 2017-BIOC Class A (1 Month LIBOR +0.79%) 144A± | | | 2.38 | | | | 7-15-2032 | | | | 2,850,000 | | | | 2,855,871 | |
Chicago Skyscraper Trust Series 2017-SKY Class A (1 Month LIBOR +0.80%) 144A± | | | 2.39 | | | | 2-15-2030 | | | | 1,600,000 | | | | 1,602,376 | |
CIFC Funding Limited Series 2012-2RA Class A1 (3 Month LIBOR +0.80%) 144A± | | | 2.20 | | | | 1-20-2028 | | | | 2,440,000 | | | | 2,440,273 | |
Citigroup Commercial Mortgage Trust Series 2016-P5 Class A2 | | | 2.40 | | | | 10-10-2049 | | | | 128,000 | | | | 125,385 | |
Citigroup Commercial Mortgage Trust Series 2017-1500 Class A (1 Month LIBOR +0.85%) 144A± | | | 2.44 | | | | 7-15-2032 | | | | 2,100,000 | | | | 2,099,998 | |
Citigroup Commercial Mortgage Trust Series 2017-MDRB Class A (1 Month LIBOR +1.10%) 144A± | | | 2.69 | | | | 7-15-2030 | | | | 2,040,000 | | | | 2,034,167 | |
Commercial Mortgage Trust Series 2012-CR1 Class ASB | | | 3.05 | | | | 5-15-2045 | | | | 2,544,289 | | | | 2,553,555 | |
Commercial Mortgage Trust Series 2014-LC17 Class A2 | | | 3.16 | | | | 10-10-2047 | | | | 2,300,000 | | | | 2,317,387 | |
Commercial Mortgage Trust Series 2014-UBS3 Class A2 | | | 2.84 | | | | 6-10-2047 | | | | 800,000 | | | | 802,337 | |
Commercial Mortgage Trust Series 2015-CR27 Class A1 | | | 1.58 | | | | 10-10-2048 | | | | 1,972,061 | | | | 1,947,117 | |
ContiMortgage Home Equity Trust Series 1996-2 Class IO ¤ | | | 0.00 | | | | 7-15-2027 | | | | 650,930 | | | | 11,664 | |
Countrywide Home Loans Mortgage Pass-Through Trust Series 2001-HYB1 Class 2A1 ±± | | | 3.21 | | | | 6-19-2031 | | | | 111,460 | | | | 109,821 | |
Crown Point Limited Series 2015-3A Class A1BR (3 Month LIBOR +0.91%) 144A± | | | 2.63 | | | | 12-31-2027 | | | | 2,000,000 | | | | 2,000,814 | |
Crown Point Limited Series 2013-2A Class A1LR (3 Month LIBOR +0.59%) 144A± | | | 2.31 | | | | 12-31-2023 | | | | 515,500 | | | | 515,560 | |
Deutsche Bank UBS Securities Mortgage Trust Series 2011-LC2A Class A4 144A | | | 4.54 | | | | 7-10-2044 | | | | 704,946 | | | | 730,827 | |
EquiFirst Mortgage Loan Trust Series 2003-2 Class 3A3 (1 Month LIBOR +1.13%) ± | | | 2.71 | | | | 9-25-2033 | | | | 297,107 | | | | 293,164 | |
Golden National Mortgage Asset-Backed Certificates Series 1998-GN1 Class M2 | | | 1.00 | | | | 2-25-2027 | | | | 34,322 | | | | 34,230 | |
Great Wolf Trust Series 2017-A (1 Month LIBOR +0.85%) 144A± | | | 2.59 | | | | 9-15-2034 | | | | 2,150,000 | | | | 2,156,680 | |
GS Mortgage Securities Trust Series 2010-C1 Class A2 144A | | | 4.59 | | | | 8-10-2043 | | | | 2,710,000 | | | | 2,799,359 | |
GS Mortgage Securities Trust Series 2013-GC16 Class A2 | | | 3.03 | | | | 11-10-2046 | | | | 2,024,582 | | | | 2,030,000 | |
GS Mortgage Securities Trust Series 2016-GS3 Class A1 | | | 1.43 | | | | 10-10-2049 | | | | 2,155,111 | | | | 2,108,167 | |
GSMPS Mortgage Loan Trust Series 1998-1 Class A 144A | | | 8.00 | | | | 9-19-2027 | | | | 195,789 | | | | 195,524 | |
Hospitality Mortgage Trust Series 2017-HIT Class A (1 Month LIBOR +0.85%) 144A± | | | 2.41 | | | | 5-8-2030 | | | | 650,000 | | | | 651,622 | |
Hyatt Hotel Portfolio Trust Series 2017-HYTE Class A (1 Month LIBOR +0.66%) 144A± | | | 2.25 | | | | 8-9-2032 | | | | 2,986,000 | | | | 2,983,182 | |
JPMorgan Chase Commercial Mortgage Securities Trust Series 2007-CB18 Class AMFL (1 Month LIBOR +0.17%) ± | | | 1.72 | | | | 6-12-2047 | | | | 999,588 | | | | 983,209 | |
JPMorgan Chase Commercial Mortgage Securities Trust Series 2007-LDPX Class AM ±± | | | 5.46 | | | | 1-15-2049 | | | | 688,544 | | | | 690,677 | |
JPMorgan Chase Commercial Mortgage Securities Trust Series 2014-PHH Class A (1 Month LIBOR +1.45%) 144A± | | | 3.04 | | | | 8-15-2027 | | | | 3,465,000 | | | | 3,465,003 | |
JPMorgan Chase Commercial Mortgage Securities Trust Series 2016-JP3 Class A1 | | | 1.46 | | | | 8-15-2049 | | | | 1,939,333 | | | | 1,892,824 | |
LStar Commercial Mortgage Trust Series 2017-5 Class A1 144A | | | 2.42 | | | | 3-10-2050 | | | | 1,230,886 | | | | 1,215,451 | |
Master Mortgages Trust Series 2002-3 Class 4A1 ±± | | | 3.30 | | | | 10-25-2032 | | | | 3,942 | | | | 3,932 | |
Morgan Stanley Bank of America Merrill Lynch Trust Series 2014-C15 Class A2 | | | 2.98 | | | | 4-15-2047 | | | | 2,840,000 | | | | 2,847,668 | |
Morgan Stanley Capital I Trust Series 2016-C30 Class A1 | | | 1.39 | | | | 9-15-2049 | | | | 1,637,435 | | | | 1,596,913 | |
Neuberger Berman Limited Series 2015-20A Class AR (3 Month LIBOR +0.80%) 144A± | | | 2.52 | | | | 1-15-2028 | | | | 1,340,000 | | | | 1,340,088 | |
Oaktree CLO Limited Series 15-1A Class A1R (3 Month LIBOR +0.87%) 144A± | | | 2.61 | | | | 10-20-2027 | | | | 1,500,000 | | | | 1,500,254 | |
Octagon Investment Partners Series 2015-1A Class A1R (3 Month LIBOR +0.90%) 144A± | | | 2.79 | | | | 5-21-2027 | | | | 2,000,000 | | | | 2,000,854 | |
Palmer Square Loan Funding Series 2017-1A Class A1 (3 Month LIBOR +0.74%) 144A± | | | 2.46 | | | | 10-15-2025 | | | | 2,062,331 | | | | 2,062,774 | |
The accompanying notes are an integral part of these financial statements.
| | | | | | |
| Portfolio of investments—February 28, 2018 (unaudited) | | Wells Fargo Short-Term Bond Fund | | | 15 | |
| | | | | | | | | | | | | | | | |
| Security name | | Interest rate | | | Maturity date | | | Principal | | | Value | |
| | | | |
Non-Agency Mortgage-Backed Securities (continued) | | | | | | | | | | | | | | | | |
RAIT Financial Trust Series 2017-FL7 Class A (1 Month LIBOR +0.95%) 144A± | | | 2.54 | % | | | 6-15-2037 | | | $ | 1,014,812 | | | $ | 1,015,743 | |
RAIT Financial Trust Series 2017-FL8 Class A (1 Month LIBOR +0.85%) 144A± | | | 2.44 | | | | 12-15-2037 | | | | 1,642,077 | | | | 1,643,911 | |
ReadyCap Commercial Mortgage Trust Series 2017-FL1 Class A (1 Month LIBOR +0.85%) 144A± | | | 2.47 | | | | 5-25-2034 | | | | 1,795,555 | | | | 1,795,555 | |
Regatta IV Funding Limited Series 2014-1A Class A2R (3 Month LIBOR +1.02%) 144A± | | | 2.77 | | | | 7-25-2026 | | | | 1,755,000 | | | | 1,757,424 | |
SBA Tower Trust Series 2014-1A Class C 144A | | | 2.90 | | | | 10-15-2044 | | | | 3,000,000 | | | | 3,008,760 | |
Stonemont Portfolio Trust Series 2017 Class A (1 Month LIBOR +0.85%) 144A± | | | 2.44 | | | | 8-20-2030 | | | | 1,775,000 | | | | 1,778,873 | |
TICP Collateralized Loan Obligation Limited Trust Series 2014-2A Class A1AR (3 Month LIBOR +1.16%) 144A± | | | 2.90 | | | | 7-20-2026 | | | | 2,000,000 | | | | 2,004,216 | |
Vendee Mortgage Trust Series 2011-1 Class DA | | | 3.75 | | | | 2-15-2035 | | | | 902,480 | | | | 916,844 | |
Wilshire Funding Corporation Series 1996-3 Class M2 ±± | | | 7.13 | | | | 8-25-2032 | | | | 81,560 | | | | 79,271 | |
Wilshire Funding Corporation Series 1996-3 Class M3 ±± | | | 7.13 | | | | 8-25-2032 | | | | 86,727 | | | | 82,770 | |
Wilshire Funding Corporation Series 1998-2 Class M1 ±± | | | 2.00 | | | | 12-28-2037 | | | | 15,568 | | | | 15,530 | |
Wind River Collateralized Loan Obligation Limited Trust Series 2014-3A Class AR (3 Month LIBOR +1.10%) 144A± | | | 2.84 | | | | 1-22-2027 | | | | 2,100,000 | | | | 2,105,431 | |
| |
Total Non-Agency Mortgage-Backed Securities (Cost $82,775,582) | | | | 82,330,678 | |
| | | | | | | | | | | | | | | | |
| | | | |
Yankee Corporate Bonds and Notes: 12.12% | | | | | | | | | | | | | | | | |
| | | | |
Consumer Discretionary: 0.24% | | | | | | | | | | | | | | | | |
| | | | |
| Auto Components: 0.14% | | | | | | | | | | | | | | | | |
IHO Verwaltungs GmbH 144A | | | 4.13 | | | | 9-15-2021 | | | | 650,000 | | | | 648,375 | |
| | | | | | | | | | | | | | | | |
| | | | |
| Automobiles: 0.10% | | | | | | | | | | | | | | | | |
Jaguar Land Rover Limited 144A | | | 4.25 | | | | 11-15-2019 | | | | 445,000 | | | | 447,225 | |
| | | | | | | | | | | | | | | | |
| | | | |
Consumer Staples: 0.64% | | | | | | | | | | | | | | | | |
| | | | |
| Beverages: 0.64% | | | | | | | | | | | | | | | | |
Suntory Holdings Limited 144A | | | 2.55 | | | | 6-28-2022 | | | | 2,975,000 | | | | 2,883,200 | |
| | | | | | | | | | | | | | | | |
| | | | |
Financials: 8.96% | | | | | | | | | | | | | | | | |
| | | | |
| Banks: 8.40% | | | | | | | | | | | | | | | | |
Banco de Credito del Peru 144A | | | 2.25 | | | | 10-25-2019 | | | | 1,500,000 | | | | 1,480,500 | |
Banque Federative du Credit Mutuel SA 144A | | | 2.20 | | | | 7-20-2020 | | | | 2,530,000 | | | | 2,481,448 | |
BPCE SA | | | 2.50 | | | | 7-15-2019 | | | | 755,000 | | | | 751,417 | |
Commonwealth Bank of Australia 144A | | | 1.75 | | | | 11-7-2019 | | | | 1,750,000 | | | | 1,721,371 | |
Cooperatieve Rabobank U.A. | | | 2.75 | | | | 1-10-2022 | | | | 3,000,000 | | | | 2,952,989 | |
Corporacion Andina de Fomento | | | 2.13 | | | | 9-27-2021 | | | | 3,000,000 | | | | 2,905,980 | |
Credit Suisse Group Funding Limited | | | 3.13 | | | | 12-10-2020 | | | | 2,110,000 | | | | 2,103,722 | |
Danske Bank 144A | | | 1.65 | | | | 9-6-2019 | | | | 3,000,000 | | | | 2,956,968 | |
ING Bank NV 144A | | | 1.80 | | | | 3-16-2018 | | | | 3,000,000 | | | | 2,999,541 | |
Lloyds Bank plc | | | 2.00 | | | | 8-17-2018 | | | | 1,000,000 | | | | 998,943 | |
Macquarie Bank Limited 144A | | | 2.85 | | | | 7-29-2020 | | | | 3,000,000 | | | | 2,986,271 | |
Mitsubishi UFJ Trust and Banking Corporation 144A | | | 2.45 | | | | 10-16-2019 | | | | 3,000,000 | | | | 2,983,059 | |
Santander UK plc | | | 2.50 | | | | 3-14-2019 | | | | 2,750,000 | | | | 2,746,837 | |
Sumitomo Mitsui Banking Corporation | | | 2.09 | | | | 10-18-2019 | | | | 2,000,000 | | | | 1,975,520 | |
Svenska Handelsbanken AB | | | 1.50 | | | | 9-6-2019 | | | | 2,605,000 | | | | 2,562,192 | |
Toronto Dominion Bank | | | 1.45 | | | | 9-6-2018 | | | | 3,385,000 | | | | 3,370,395 | |
| |
| | | | 37,977,153 | |
| | | | | | | | | | | | | | | | |
The accompanying notes are an integral part of these financial statements.
| | | | |
| 16 | | Wells Fargo Short-Term Bond Fund | | Portfolio of investments—February 28, 2018 (unaudited) |
| | | | | | | | | | | | | | | | |
| Security name | | Interest rate | | | Maturity date | | | Principal | | | Value | |
| | | | |
| Diversified Financial Services: 0.56% | | | | | | | | | | | | | | | | |
UBS AG 144A | | | 2.20 | % | | | 6-8-2020 | | | $ | 1,275,000 | | | $ | 1,255,070 | |
UBS AG | | | 2.38 | | | | 8-14-2019 | | | | 1,270,000 | | | | 1,262,306 | |
| |
| | | | 2,517,376 | |
| | | | | | | | | | | | | | | | |
| | | | |
Health Care: 0.88% | | | | | | | | | | | | | | | | |
| | | | |
| Pharmaceuticals: 0.88% | | | | | | | | | | | | | | | | |
Actavis Funding SCS | | | 2.35 | | | | 3-12-2018 | | | | 3,000,000 | | | | 3,000,620 | |
Shire plc ADR | | | 1.90 | | | | 9-23-2019 | | | | 1,010,000 | | | | 994,376 | |
| |
| | | | 3,994,996 | |
| | | | | | | | | | | | | | | | |
| | | | |
Industrials: 0.42% | | | | | | | | | | | | | | | | |
| | | | |
| Transportation Infrastructure: 0.42% | | | | | | | | | | | | | | | | |
Asciano Finance Limited 144A | | | 4.63 | | | | 9-23-2020 | | | | 1,821,000 | | | | 1,870,818 | |
| | | | | | | | | | | | | | | | |
| | | | |
Information Technology: 0.67% | | | | | | | | | | | | | | | | |
| | | | |
| Semiconductors & Semiconductor Equipment: 0.67% | | | | | | | | | | | | | | | | |
TSMC Global Limited 144A | | | 1.63 | | | | 4-3-2018 | | | | 3,035,000 | | | | 3,032,123 | |
| | | | | | | | | | | | | | | | |
| | | | |
Materials: 0.31% | | | | | | | | | | | | | | | | |
| | | | |
| Metals & Mining: 0.31% | | | | | | | | | | | | | | | | |
ArcelorMittal SA | | | 5.75 | | | | 3-1-2021 | | | | 1,340,000 | | | | 1,407,000 | |
| | | | | | | | | | | | | | | | |
| |
Total Yankee Corporate Bonds and Notes (Cost $55,359,327) | | | | 54,778,266 | |
| | | | | | | | | | | | | | | | |
| | | | |
Short-Term Investments: 5.71% | | | | | | | | | | | | | | | | |
| | | | |
| Commercial Paper: 2.03% | | | | | | | | | | | | | | | | |
Baptist Memorial Health Care Facilities & Services | | | 2.15 | | | | 3-22-2018 | | | | 5,000,000 | | | | 5,000,000 | |
Catholic Health Initiatives (p)(z) | | | 1.05 | | | | 3-2-2018 | | | | 4,200,000 | | | | 4,199,755 | |
| |
| | | | 9,199,755 | |
| | | | | | | | | | | | | | | | |
| | | | |
| | | Yield | | | | | | Shares | | | | |
| Investment Companies: 3.54% | | | | | | | | | | | | | | | | |
Wells Fargo Government Money Market Fund Select Class (l)(u) | | | 1.29 | | | | | | | | 15,980,904 | | | | 15,980,904 | |
| | | | | | | | | | | | | | | | |
| | | | |
| | | | | | | | | Principal | | | | |
| U.S. Treasury Securities: 0.14% | | | | | | | | | | | | | | | | |
U.S. Treasury Bill (z)# | | | 1.23 | | | | 3-15-2018 | | | $ | 625,000 | | | | 624,685 | |
| | | | | | | | | | | | | | | | |
| |
Total Short-Term Investments (Cost $25,805,338) | | | | 25,805,344 | |
| | | | | | | | | | | | | | | | |
| | | | | | | | |
| Total investments in securities (Cost $458,861,393) | | | 100.95 | % | | | 456,313,192 | |
Other assets and liabilities, net | | | (0.95 | ) | | | (4,306,718 | ) |
| | | | | | | | |
| Total net assets | | | 100.00 | % | | $ | 452,006,474 | |
| | | | | | | | |
The accompanying notes are an integral part of these financial statements.
| | | | | | |
| Portfolio of investments—February 28, 2018 (unaudited) | | Wells Fargo Short-Term Bond Fund | | | 17 | |
| 144A | The security may be resold in transactions exempt from registration, normally to qualified institutional buyers, pursuant to Rule 144A under the Securities Act of 1933. |
| ± | Variable rate investment. The rate shown is the rate in effect at period end. |
| ±± | The coupon of the security is adjusted based on the principal and interest payments received from the underlying pool of mortgages as well as the credit quality and the actual prepayment speed of the underlying mortgages. |
| ¤ | The security is issued in zero coupon form with no periodic interest payments. |
| (m) | The security is an auction-rate security which has an interest rate that resets at predetermined short-term intervals through a Dutch auction. The rate shown is the rate in effect at period end. |
| (n) | The auction to set the interest rate on the security failed at period end due to insufficient investor interest. A failed auction does not itself cause a default. |
| (p) | Asset-backed commercial paper |
| (l) | The issuer of the security is an affiliated person of the Fund as defined in the Investment Company Act of 1940. |
| (u) | The rate represents the 7-day annualized yield at period end. |
| (z) | Zero coupon security. The rate represents the current yield to maturity. |
| # | All or a portion of this security is segregated as collateral for investments in derivative instruments |
Futures Contracts
| | | | | | | | | | | | | | | | | | | | | | | | |
| Description | | Number of
contracts | | | Expiration
date | | | Notional
cost | | | Notional
value | | | Unrealized
gains | | | Unrealized
losses | |
Long | | | | | | | | | | | | | | | | | | | | | | | | |
2-Year U.S. Treasury Notes | | | 892 | | | | 6-29-2018 | | | $ | 189,635,939 | | | $ | 189,522,125 | | | $ | 0 | | | $ | (113,814 | ) |
Short | | | | | | | | | | | | | | | | | | | | | | | | |
5-Year U.S. Treasury Notes | | | (225) | | | | 6-29-2018 | | | $ | (25,690,070 | ) | | $ | (25,634,180 | ) | | $ | 55,890 | | | $ | 0 | |
| | | | | | | | | | | | | | | | | | | | | | | | |
| | | | | | | | | | | | | | | | | | $ | 55,890 | | | $ | (113,814 | ) |
| | | | | | | | | | | | | | | | | | | | | | | | |
Investments in Affiliates
An affiliated investment is an investment in which the Fund owns at least 5% of the outstanding voting shares of the issuer or as a result of other relationships, such as the Fund and the issuer having the same investment manager. Transactions with issuers that were either affiliated persons of the Fund at the beginning of the period or the end of the period were as follows:
| | | | | | | | | | | | | | | | | | | | | | | | | | | | | | | | | | | | |
| | | Shares,
beginning of
period | | | Shares
purchased | | | Shares sold | | | Shares, end of
period | | | Net
realized
gains
(losses) | | | Net
change in
unrealized
gains
(losses) | | | Income
from
affiliated
securities | | | Value, end of period | | | % of
net
assets | |
Short-Term Investments | | | | | | | | | | | | | | | | | | | | | | | | | | | | | | | | | | | | |
Investment Companies | | | | | | | | | | | | | | | | | | | | | | | | | | | | | | | | | | | | |
Security Lending Cash Investment LLC * | | | 1,127,387 | | | | 118,238 | | | | 1,245,625 | | | | 0 | | | $ | 0 | | | $ | 0 | | | $ | 0 | | | | | | | | | |
Wells Fargo Government Money Market Fund Select Class | | | 30,383,096 | | | | 103,581,276 | | | | 117,983,468 | | | | 15,980,904 | | | | 0 | | | | 0 | | | | 123,594 | | | $ | 15,980,904 | | | | | |
| | | | | | | | | | | | | | | | | | | | | | | | | | | | | | | | | | | | |
| | | | | | | | | | | | | | | | | | $ | 0 | | | $ | 0 | | | $ | 123,594 | | | $ | 15,980,904 | | | | 3.54 | % |
| | | | | | | | | | | | | | | | | | | | | | | | | | | | | | | | | | | | |
| | * | No longer held at the end of the period. |
The accompanying notes are an integral part of these financial statements.
| | | | |
| 18 | | Wells Fargo Short-Term Bond Fund | | Statement of assets and liabilities—February 28, 2018 (unaudited) |
| | | | |
| | | | |
| |
Assets | | | | |
Investments in unaffiliated securities, at value (cost $442,880,489) | | $ | 440,332,288 | |
Investments in affiliated securities, at value (cost $15,980,904) | | | 15,980,904 | |
Principal paydown receivable | | | 9,323 | |
Receivable for Fund shares sold | | | 772,289 | |
Receivable for interest | | | 2,422,358 | |
Receivable for daily variation margin on open futures contracts | | | 1,164 | |
Prepaid expenses and other assets | | | 21,551 | |
| | | | |
Total assets | | | 459,539,877 | |
| | | | |
| |
Liabilities | | | | |
Payable for investments purchased | | | 6,704,572 | |
Payable for Fund shares redeemed | | | 444,148 | |
Dividends payable | | | 138,008 | |
Management fee payable | | | 98,121 | |
Administration fees payable | | | 41,146 | |
Payable for daily variation margin on open futures contracts | | | 21,094 | |
Distribution fee payable | | | 5,517 | |
Trustees’ fees and expenses payable | | | 1,678 | |
Accrued expenses and other liabilities | | | 79,119 | |
| | | | |
Total liabilities | | | 7,533,403 | |
| | | | |
Total net assets | | $ | 452,006,474 | |
| | | | |
| |
NET ASSETS CONSIST OF | | | | |
Paid-in capital | | $ | 457,058,737 | |
Undistributed net investment income | | | 37,881 | |
Accumulated net realized losses on investments | | | (2,484,019 | ) |
Net unrealized losses on investments | | | (2,606,125 | ) |
| | | | |
Total net assets | | $ | 452,006,474 | |
| | | | |
| |
COMPUTATION OF NET ASSET VALUE AND OFFERING PRICE PER SHARE | | | | |
Net assets – Class A | | $ | 208,482,307 | |
Shares outstanding – Class A1 | | | 24,068,160 | |
Net asset value per share – Class A | | | $8.66 | |
Maximum offering price per share – Class A2 | | | $8.84 | |
Net assets – Class C | | $ | 9,299,337 | |
Shares outstanding – Class C1 | | | 1,074,823 | |
Net asset value per share – Class C | | | $8.65 | |
Net assets – Institutional Class | | $ | 234,224,830 | |
Shares outstanding – Institutional Class1 | | | 27,028,443 | |
Net asset value per share – Institutional Class | | | $8.67 | |
| 1 | The Fund has an unlimited number of authorized shares. |
| 2 | Maximum offering price is computed as 100/98 of net asset value. On investments of $50,000 or more, the offering price is reduced. |
The accompanying notes are an integral part of these financial statements.
| | | | | | |
| Statement of operations—six months ended February 28, 2018 (unaudited) | | Wells Fargo Short-Term Bond Fund | | | 19 | |
| | | | |
| | | | |
| |
Investment income | | | | |
Interest | | $ | 4,971,759 | |
Income from affiliated securities | | | 123,594 | |
| | | | |
Total investment income | | | 5,095,353 | |
| | | | |
| |
Expenses | | | | |
Management fee | | | 796,033 | |
Administration fees | | | | |
Class A | | | 173,453 | |
Class C | | | 8,299 | |
Institutional Class | | | 91,074 | |
Shareholder servicing fees | | | | |
Class A | | | 271,020 | |
Class C | | | 12,968 | |
Distribution fee | | | | |
Class C | | | 38,904 | |
Custody and accounting fees | | | 20,779 | |
Professional fees | | | 25,027 | |
Registration fees | | | 39,192 | |
Shareholder report expenses | | | 23,150 | |
Trustees’ fees and expenses | | | 8,125 | |
Other fees and expenses | | | 10,936 | |
| | | | |
Total expenses | | | 1,518,960 | |
Less: Fee waivers and/or expense reimbursements | | | (126,665 | ) |
| | | | |
Net expenses | | | 1,392,295 | |
| | | | |
Net investment income | | | 3,703,058 | |
| | | | |
| |
REALIZED AND UNREALIZED GAINS (LOSSES) ON INVESTMENTS | | | | |
| |
Net realized losses on: | | | | |
Unaffiliated securities | | | (3,000 | ) |
Futures transactions | | | (1,394,348 | ) |
| | | | |
Net realized losses on investments | | | (1,397,348 | ) |
| | | | |
| |
Net change in unrealized gains (losses) on: | | | | |
Unaffiliated securities | | | (4,184,501 | ) |
Futures transactions | | | (159,224 | ) |
| | | | |
Net change in unrealized gains (losses) on investments | | | (4,343,725 | ) |
| | | | |
Net realized and unrealized gains (losses) on investments | | | (5,741,073 | ) |
| | | | |
Net decrease in net assets resulting from operations | | $ | (2,038,015 | ) |
| | | | |
The accompanying notes are an integral part of these financial statements.
| | | | |
| 20 | | Wells Fargo Short-Term Bond Fund | | Statement of changes in net assets |
| | | | | | | | | | | | | | | | |
| | | Six months ended
February 28, 2018
(unaudited) | | | Year ended
August 31, 2017 | |
| | | | |
Operations | | | | | | | | | | | | | | | | |
Net investment income | | | | | | $ | 3,703,058 | | | | | | | $ | 7,341,144 | |
Net realized losses on investments | | | | | | | (1,397,348 | ) | | | | | | | (292,973 | ) |
Net change in unrealized gains (losses) on investments | | | | | | | (4,343,725 | ) | | | | | | | (686,076 | ) |
| | | | |
Net increase (decrease) in net assets resulting from operations | | | | | | | (2,038,015 | ) | | | | | | | 6,362,095 | |
| | | | |
| | | | |
Distributions to shareholders from | | | | | | | | | | | | | | | | |
Net investment income | | | | | | | | | | | | | | | | |
Class A | | | | | | | (1,647,166 | ) | | | | | | | (3,318,768 | ) |
Class C | | | | | | | (39,768 | ) | | | | | | | (75,709 | ) |
Institutional Class | | | | | | | (2,017,864 | ) | | | | | | | (3,946,663 | ) |
| | | | |
Total distributions to shareholders | | | | | | | (3,704,798 | ) | | | | | | | (7,341,140 | ) |
| | | | |
| | | | |
Capital share transactions | | | Shares | | | | | | | | Shares | | | | | |
Proceeds from shares sold | | | | | | | | | | | | | | | | |
Class A | | | 2,046,352 | | | | 17,865,471 | | | | 3,840,470 | | | | 33,642,098 | |
Class C | | | 83,133 | | | | 724,692 | | | | 300,680 | | | | 2,631,368 | |
Institutional Class | | | 5,622,552 | | | | 49,018,295 | | | | 11,826,160 | | | | 103,614,345 | |
| | | | |
| | | | | | | 67,608,458 | | | | | | | | 139,887,811 | |
| | | | |
Reinvestment of distributions | | | | | | | | | | | | | | | | |
Class A | | | 177,907 | | | | 1,550,041 | | | | 357,529 | | | | 3,130,762 | |
Class C | | | 3,861 | | | | 33,596 | | | | 7,137 | | | | 62,415 | |
Institutional Class | | | 157,983 | | | | 1,376,880 | | | | 314,369 | | | | 2,754,565 | |
| | | | |
| | | | | | | 2,960,517 | | | | | | | | 5,947,742 | |
| | | | |
Payment for shares redeemed | | | | | | | | | | | | | | | | |
Class A | | | (3,897,788 | ) | | | (34,001,784 | ) | | | (10,195,238 | ) | | | (89,264,300 | ) |
Class C | | | (308,869 | ) | | | (2,690,353 | ) | | | (630,122 | ) | | | (5,509,876 | ) |
Institutional Class | | | (5,024,451 | ) | | | (43,835,070 | ) | | | (14,653,735 | ) | | | (128,341,544 | ) |
| | | | |
| | | | | | | (80,527,207 | ) | | | | | | | (223,115,720 | ) |
| | | | |
Net decrease in net assets resulting from capital share transactions | | | | | | | (9,958,232 | ) | | | | | | | (77,280,167 | ) |
| | | | |
Total decrease in net assets | | | | | | | (15,701,045 | ) | | | | | | | (78,259,212 | ) |
| | | | |
| | | | |
Net assets | | | | | | | | | | | | | | | | |
Beginning of period | | | | | | | 467,707,519 | | | | | | | | 545,966,731 | |
| | | | |
End of period | | | | | | $ | 452,006,474 | | | | | | | $ | 467,707,519 | |
| | | | |
Undistributed net investment income | | | | | | $ | 37,881 | | | | | | | $ | 39,621 | |
| | | | |
The accompanying notes are an integral part of these financial statements.
| | | | | | |
| Financial highlights | | Wells Fargo Short-Term Bond Fund | | | 21 | |
(For a share outstanding throughout each period)
| | | | | | | | | | | | | | | | | | | | | | | | |
| | | Six months ended
February 28, 2018 (unaudited) | | | Year ended August 31 | |
| CLASS A | | | 2017 | | | 2016 | | | 2015 | | | 2014 | | | 2013 | |
Net asset value, beginning of period | | | $8.77 | | | | $8.78 | | | | $8.77 | | | | $8.82 | | | | $8.77 | | | | $8.81 | |
Net investment income | | | 0.07 | | | | 0.12 | | | | 0.11 | | | | 0.09 | | | | 0.10 | | | | 0.10 | |
Net realized and unrealized gains (losses) on investments | | | (0.11 | ) | | | (0.01 | ) | | | 0.04 | | | | (0.03 | ) | | | 0.05 | | | | (0.04 | ) |
| | | | | | | | | | | | | | | | | | | | | | | | |
Total from investment operations | | | (0.04 | ) | | | 0.11 | | | | 0.15 | | | | 0.06 | | | | 0.15 | | | | 0.06 | |
Distributions to shareholders from | | | | | | | | | | | | | | | | | | | | | | | | |
Net investment income | | | (0.07 | ) | | | (0.12 | ) | | | (0.11 | ) | | | (0.09 | ) | | | (0.10 | ) | | | (0.10 | ) |
Net realized gains | | | 0.00 | | | | 0.00 | | | | (0.03 | ) | | | (0.02 | ) | | | 0.00 | | | | 0.00 | |
| | | | | | | | | | | | | | | | | | | | | | | | |
Total distributions to shareholders | | | (0.07 | ) | | | (0.12 | ) | | | (0.14 | ) | | | (0.11 | ) | | | (0.10 | ) | | | (0.10 | ) |
Net asset value, end of period | | | $8.66 | | | | $8.77 | | | | $8.78 | | | | $8.77 | | | | $8.82 | | | | $8.77 | |
Total return1 | | | (0.51 | )% | | | 1.25 | % | | | 1.77 | % | | | 0.66 | % | | | 1.72 | % | | | 0.72 | % |
Ratios to average net assets (annualized) | | | | | | | | | | | | | | | | | | | | | | | | |
Gross expenses | | | 0.82 | % | | | 0.81 | % | | | 0.81 | % | | | 0.80 | % | | | 0.82 | % | | | 0.87 | % |
Net expenses | | | 0.72 | % | | | 0.72 | % | | | 0.72 | % | | | 0.74 | % | | | 0.78 | % | | | 0.80 | % |
Net investment income | | | 1.52 | % | | | 1.36 | % | | | 1.29 | % | | | 1.00 | % | | | 1.12 | % | | | 1.17 | % |
Supplemental data | | | | | | | | | | | | | | | | | | | | | | | | |
Portfolio turnover rate | | | 20 | % | | | 50 | % | | | 59 | % | | | 57 | % | | | 70 | % | | | 75 | % |
Net assets, end of period (000s omitted) | | | $208,482 | | | | $225,797 | | | | $278,802 | | | | $65,454 | | | | $59,962 | | | | $65,812 | |
| 1 | Total return calculations do not include any sales charges. Returns for periods of less than one year are not annualized. |
The accompanying notes are an integral part of these financial statements.
| | | | |
| 22 | | Wells Fargo Short-Term Bond Fund | | Financial highlights |
(For a share outstanding throughout each period)
| | | | | | | | | | | | | | | | | | | | | | | | |
| | | Six months ended
February 28, 2018 (unaudited) | | | Year ended August 31 | |
| CLASS C | | | 2017 | | | 2016 | | | 2015 | | | 2014 | | | 2013 | |
Net asset value, beginning of period | | | $8.76 | | | | $8.77 | | | | $8.76 | | | | $8.81 | | | | $8.76 | | | | $8.80 | |
Net investment income | | | 0.03 | | | | 0.05 | | | | 0.05 | | | | 0.02 | | | | 0.03 | | | | 0.04 | |
Net realized and unrealized gains (losses) on investments | | | (0.11 | ) | | | (0.01 | ) | | | 0.04 | | | | (0.03 | ) | | | 0.05 | | | | (0.04 | ) |
| | | | | | | | | | | | | | | | | | | | | | | | |
Total from investment operations | | | (0.08 | ) | | | 0.04 | | | | 0.09 | | | | (0.01 | ) | | | 0.08 | | | | 0.00 | |
Distributions to shareholders from | | | | | | | | | | | | | | | | | | | | | | | | |
Net investment income | | | (0.03 | ) | | | (0.05 | ) | | | (0.05 | ) | | | (0.02 | ) | | | (0.03 | ) | | | (0.04 | ) |
Net realized gains | | | 0.00 | | | | 0.00 | | | | (0.03 | ) | | | (0.02 | ) | | | 0.00 | | | | 0.00 | |
| | | | | | | | | | | | | | | | | | | | | | | | |
Total distributions to shareholders | | | (0.03 | ) | | | (0.05 | ) | | | (0.08 | ) | | | (0.04 | ) | | | (0.03 | ) | | | (0.04 | ) |
Net asset value, end of period | | | $8.65 | | | | $8.76 | | | | $8.77 | | | | $8.76 | | | | $8.81 | | | | $8.76 | |
Total return1 | | | (0.88 | )% | | | 0.49 | % | | | 1.01 | % | | | (0.09 | )% | | | 0.97 | % | | | (0.03 | )% |
Ratios to average net assets (annualized) | | | | | | | | | | | | | | | | | | | | | | | | |
Gross expenses | | | 1.57 | % | | | 1.56 | % | | | 1.56 | % | | | 1.55 | % | | | 1.57 | % | | | 1.62 | % |
Net expenses | | | 1.47 | % | | | 1.47 | % | | | 1.47 | % | | | 1.49 | % | | | 1.53 | % | | | 1.55 | % |
Net investment income | | | 0.77 | % | | | 0.61 | % | | | 0.53 | % | | | 0.25 | % | | | 0.37 | % | | | 0.42 | % |
Supplemental data | | | | | | | | | | | | | | | | | | | | | | | | |
Portfolio turnover rate | | | 20 | % | | | 50 | % | | | 59 | % | | | 57 | % | | | 70 | % | | | 75 | % |
Net assets, end of period (000s omitted) | | | $9,299 | | | | $11,361 | | | | $14,204 | | | | $11,508 | �� | | | $14,852 | | | | $16,686 | |
| 1 | Total return calculations do not include any sales charges. Returns for periods of less than one year are not annualized. |
The accompanying notes are an integral part of these financial statements.
| | | | | | |
| Financial highlights | | Wells Fargo Short-Term Bond Fund | | | 23 | |
(For a share outstanding throughout each period)
| | | | | | | | | | | | | | | | | | | | | | | | |
| | | Six months ended
February 28, 2018 (unaudited) | | | Year ended August 31 | |
| INSTITUTIONAL CLASS | | | 2017 | | | 2016 | | | 2015 | | | 2014 | | | 2013 | |
Net asset value, beginning of period | | | $8.78 | | | | $8.79 | | | | $8.77 | | | | $8.83 | | | | $8.77 | | | | $8.81 | |
Net investment income | | | 0.08 | | | | 0.14 | | | | 0.13 | | | | 0.11 | | | | 0.12 | | | | 0.13 | |
Net realized and unrealized gains (losses) on investments | | | (0.11 | ) | | | (0.01 | ) | | | 0.05 | | | | (0.04 | ) | | | 0.07 | | | | (0.04 | ) |
| | | | | | | | | | | | | | | | | | | | | | | | |
Total from investment operations | | | (0.03 | ) | | | 0.13 | | | | 0.18 | | | | 0.07 | | | | 0.19 | | | | 0.09 | |
Distributions to shareholders from | | | | | | | | | | | | | | | | | | | | | | | | |
Net investment income | | | (0.08 | ) | | | (0.14 | ) | | | (0.13 | ) | | | (0.11 | ) | | | (0.13 | ) | | | (0.13 | ) |
Net realized gains | | | 0.00 | | | | 0.00 | | | | (0.03 | ) | | | (0.02 | ) | | | 0.00 | | | | 0.00 | |
| | | | | | | | | | | | | | | | | | | | | | | | |
Total distributions to shareholders | | | (0.08 | ) | | | (0.14 | ) | | | (0.16 | ) | | | (0.13 | ) | | | (0.13 | ) | | | (0.13 | ) |
Net asset value, end of period | | | $8.67 | | | | $8.78 | | | | $8.79 | | | | $8.77 | | | | $8.83 | | | | $8.77 | |
Total return1 | | | (0.38 | )% | | | 1.49 | % | | | 2.14 | % | | | 0.82 | % | | | 2.15 | % | | | 1.04 | % |
Ratios to average net assets (annualized) | | | | | | | | | | | | | | | | | | | | | | | | |
Gross expenses | | | 0.49 | % | | | 0.48 | % | | | 0.48 | % | | | 0.47 | % | | | 0.49 | % | | | 0.53 | % |
Net expenses | | | 0.47 | % | | | 0.48 | % | | | 0.48 | % | | | 0.47 | % | | | 0.47 | % | | | 0.48 | % |
Net investment income | | | 1.77 | % | | | 1.60 | % | | | 1.51 | % | | | 1.26 | % | | | 1.42 | % | | | 1.47 | % |
Supplemental data | | | | | | | | | | | | | | | | | | | | | | | | |
Portfolio turnover rate | | | 20 | % | | | 50 | % | | | 59 | % | | | 57 | % | | | 70 | % | | | 75 | % |
Net assets, end of period (000s omitted) | | | $234,225 | | | | $230,549 | | | | $252,961 | | | | $306,832 | | | | $330,613 | | | | $269,123 | |
| 1 | Returns for periods of less than one year are not annualized. |
The accompanying notes are an integral part of these financial statements.
| | | | |
| 24 | | Wells Fargo Short-Term Bond Fund | | Notes to financial statements (unaudited) |
1. ORGANIZATION
Wells Fargo Funds Trust (the “Trust”), a Delaware statutory trust organized on March 10, 1999, is an open-end management investment company registered under the Investment Company Act of 1940, as amended (the “1940 Act”). As an investment company, the Trust follows the accounting and reporting guidance in Financial Accounting Standards Board Accounting Standards Codification Topic 946, Financial Services – Investment Companies. These financial statements report on the Wells Fargo Short-Term Bond Fund (the “Fund”) which is a diversified series of the Trust.
2. SIGNIFICANT ACCOUNTING POLICIES
The following significant accounting policies, which are consistently followed in the preparation of the financial statements of the Fund, are in conformity with U.S. generally accepted accounting principles which require management to make estimates and assumptions that affect the reported amounts of assets and liabilities, disclosure of contingent assets and liabilities at the date of the financial statements, and the reported amounts of revenues and expenses during the reporting period. Actual results could differ from those estimates.
Securities valuation
All investments are valued each business day as of the close of regular trading on the New York Stock Exchange (generally 4 p.m. Eastern Time), although the Fund may deviate from this calculation time under unusual or unexpected circumstances.
Debt securities are valued at the evaluated bid price provided by an independent pricing service or, if a reliable price is not available, the quoted bid price from an independent broker-dealer.
Equity securities and futures that are listed on a foreign or domestic exchange or market are valued at the official closing price or, if none, the last sales price. If no sale occurs on the principal exchange or market that day, a fair value price will be determined in accordance with the Fund’s Valuation Procedures.
Investments in registered open-end investment companies are valued at net asset value. Interests in non-registered investment companies that are redeemable at net asset value are fair valued normally at net asset value.
Investments which are not valued using any of the methods discussed above are valued at their fair value, as determined in good faith by the Board of Trustees of the Fund. The Board of Trustees has established a Valuation Committee comprised of the Trustees and has delegated to it the authority to take any actions regarding the valuation of portfolio securities that the Valuation Committee deems necessary or appropriate, including determining the fair value of portfolio securities, unless the determination has been delegated to the Wells Fargo Asset Management Pricing Committee at Wells Fargo Funds Management, LLC (“Funds Management”). The Board of Trustees retains the authority to make or ratify any valuation decisions or approve any changes to the Valuation Procedures as it deems appropriate. On a quarterly basis, the Board of Trustees receives reports on any valuation actions taken by the Valuation Committee or the Wells Fargo Asset Management Pricing Committee which may include items for ratification.
Valuations of fair valued securities are compared to the next actual sales price when available, or other appropriate market values, to assess the continued appropriateness of the fair valuation methodologies used. These securities are fair valued on a day-to-day basis, taking into consideration changes to appropriate market information and any significant changes to the inputs considered in the valuation process until there is a readily available price provided on an exchange or by an independent pricing service. Valuations received from an independent pricing service or independent broker-dealer quotes are periodically validated by comparisons to most recent trades and valuations provided by other independent pricing services in addition to the review of prices by the manager and/or subadviser. Unobservable inputs used in determining fair valuations are identified based on the type of security, taking into consideration factors utilized by market participants in valuing the investment, knowledge about the issuer and the current market environment.
Securities lending
The Fund may lend its securities from time to time in order to earn additional income in the form of fees or interest on securities received as collateral or the investment of any cash received as collateral. The Fund continues to receive interest or dividends on the securities loaned. The Fund receives collateral in the form of cash or securities with a value at least equal to the value of the securities on loan. The value of the loaned securities is determined at the close of each business day and any additional required collateral is delivered to the Fund on the next business day. In a securities lending transaction, the net asset value of the Fund will be affected by an increase or decrease in the value of the securities loaned and by an increase or decrease in the value of the instrument in which collateral is invested. The amount of securities lending activity undertaken by the Fund fluctuates from time to time. In the event of default or bankruptcy by the borrower, the Fund may be prevented from recovering the loaned securities or gaining access to the collateral or may experience delays or costs in doing so. In addition, the investment of any cash collateral received may lose all or part of its value. The Fund has the right under the lending agreement to recover the securities from the borrower on demand.
| | | | | | |
| Notes to financial statements (unaudited) | | Wells Fargo Short-Term Bond Fund | | | 25 | |
The Fund lends its securities through an unaffiliated securities lending agent. Cash collateral received in connection with its securities lending transactions is invested in Securities Lending Cash Investments, LLC (the “Securities Lending Fund”). The Securities Lending Fund is exempt from registration under Section 3(c)(7) of the 1940 Act and is managed by Funds Management and is subadvised by Wells Capital Management Incorporated (“WellsCap”), an affiliate of Funds Management and an indirect wholly owned subsidiary of Wells Fargo & Company (“Wells Fargo”). Funds Management receives an advisory fee starting at 0.05% and declining to 0.01% as the average daily net assets of the Securities Lending Fund increase. All of the fees received by Funds Management are paid to WellsCap for its services as subadviser. The Securities Lending Fund seeks to provide a positive return compared to the daily Fed Funds Open Rate by investing in high-quality, U.S. dollar-denominated short-term money market instruments. Securities Lending Fund investments are valued at the evaluated bid price provided by an independent pricing service. Income earned from investment in the Securities Lending Fund, if any, is included in income from affiliated securities on the Statement of Operations.
When-issued transactions
The Fund may purchase securities on a forward commitment or when-issued basis. The Fund records a when-issued transaction on the trade date and will segregate assets in an amount at least equal in value to the Fund’s commitment to purchase when-issued securities. Securities purchased on a when-issued basis are marked-to-market daily and the Fund begins earning interest on the settlement date. Losses may arise due to changes in the market value of the underlying securities or if the counterparty does not perform under the contract.
Futures contracts
The Fund is subject to interest rate risk in the normal course of pursuing its investment objectives. The Fund may buy and sell futures contracts in order to gain exposure to, or protect against, changes in interest rates. The primary risks associated with the use of futures contracts are the imperfect correlation between changes in market values of securities held by the Fund and the prices of futures contracts, and the possibility of an illiquid market.
The aggregate principal amounts of the contracts are not recorded in the financial statements. Fluctuations in the value of the contracts are recorded in the Statement of Assets and Liabilities as an asset or liability and in the Statement of Operations as unrealized gains or losses until the contracts are closed, at which point they are recorded as net realized gains or losses on futures contracts. With futures contracts, there is minimal counterparty risk to the Fund since futures are exchange traded and the exchange’s clearinghouse, as counterparty to all exchange traded futures, guarantees the futures against default.
Security transactions and income recognition
Securities transactions are recorded on a trade date basis. Realized gains or losses are recorded on the basis of identified cost.
Interest income is accrued daily and bond discounts are accreted and premiums are amortized daily. To the extent debt obligations are placed on non-accrual status, any related interest income may be reduced by writing off interest receivables when the collection of all or a portion of interest has been determined to be doubtful based on consistently applied procedures and the fair value has decreased. If the issuer subsequently resumes interest payments or when the collectability of interest is reasonably assured, the debt obligation is removed from non-accrual status.
Distributions to shareholders
Distributions to shareholders from net investment income are accrued daily and paid monthly. Distributions from net realized gains, if any, are recorded on the ex-dividend date and paid at least annually. Such distributions are determined in accordance with income tax regulations and may differ from U.S. generally accepted accounting principles. Dividend sources are estimated at the time of declaration. The tax character of distributions is determined as of the Fund’s fiscal year end. Therefore, a portion of the Fund’s distributions made prior to the Fund’s fiscal year end may be categorized as a tax return of capital at year end.
Federal and other taxes
The Fund intends to continue to qualify as a regulated investment company by distributing substantially all of its investment company taxable income and any net realized capital gains (after reduction for capital loss carryforwards) sufficient to relieve it from all, or substantially all, federal income taxes. Accordingly, no provision for federal income taxes was required.
The Fund’s income and federal excise tax returns and all financial records supporting those returns for the prior three fiscal years are subject to examination by the federal and Delaware revenue authorities. Management has analyzed the Fund’s tax positions taken on federal, state, and foreign tax returns for all open tax years and does not believe that there are any uncertain tax positions that require recognition of a tax liability.
| | | | |
| 26 | | Wells Fargo Short-Term Bond Fund | | Notes to financial statements (unaudited) |
As of February 28, 2018, the aggregate cost of all investments for federal income tax purposes was $458,771,387 and the unrealized gains (losses) consisted of:
| | | | |
Gross unrealized gains | | $ | 703,991 | |
Gross unrealized losses | | | (3,220,110 | ) |
Net unrealized losses | | $ | (2,516,119 | ) |
As of August 31, 2017, the Fund had capital loss carryforwards which consist of $985,371 in long-term capital losses.
Class allocations
The separate classes of shares offered by the Fund differ principally in applicable sales charges, distribution, shareholder servicing, and administration fees. Class specific expenses are charged directly to that share class. Investment income, common expenses, and realized and unrealized gains (losses) on investments are allocated daily to each class of shares based on the relative proportion of net assets of each class.
3. FAIR VALUATION MEASUREMENTS
Fair value measurements of investments are determined within a framework that has established a fair value hierarchy based upon the various data inputs utilized in determining the value of the Fund’s investments. The three-level hierarchy gives the highest priority to unadjusted quoted prices in active markets for identical assets or liabilities (Level 1) and the lowest priority to unobservable inputs (Level 3). The Fund’s investments are classified within the fair value hierarchy based on the lowest level of input that is significant to the fair value measurement. The inputs are summarized into three broad levels as follows:
| ∎ | | Level 1 – quoted prices in active markets for identical securities |
| ∎ | | Level 2 – other significant observable inputs (including quoted prices for similar securities, interest rates, prepayment speeds, credit risk, etc.) |
| ∎ | | Level 3 – significant unobservable inputs (including the Fund’s own assumptions in determining the fair value of investments) |
The inputs or methodologies used for valuing investments in securities are not necessarily an indication of the risk associated with investing in those securities.
The following is a summary of the inputs used in valuing the Fund’s assets and liabilities as of February 28, 2018:
| | | | | | | | | | | | | | | | |
| | | Quoted prices
(Level 1) | | | Other significant
observable inputs
(Level 2) | | | Significant
unobservable inputs (Level 3) | | | Total | |
Assets | | | | | | | | | | | | | | | | |
Investments in: | | | | | | | | | | | | | | | | |
| | | | |
Agency securities | | $ | 0 | | | $ | 32,193,239 | | | $ | 0 | | | $ | 32,193,239 | |
| | | | |
Asset-backed securities | | | 0 | | | | 66,076,940 | | | | 0 | | | | 66,076,940 | |
| | | | |
Corporate bonds and notes | | | 0 | | | | 173,052,899 | | | | 0 | | | | 173,052,899 | |
| | | | |
Municipal obligations | | | 0 | | | | 22,075,826 | | | | 0 | | | | 22,075,826 | |
| | | | |
Non-agency mortgage-backed securities | | | 0 | | | | 82,330,678 | | | | 0 | | | | 82,330,678 | |
| | | | |
Yankee corporate bonds and notes | | | 0 | | | | 54,778,266 | | | | 0 | | | | 54,778,266 | |
| | | | |
Short-term investments | | | | | | | | | | | | | | | | |
Commercial paper | | | 0 | | | | 9,199,755 | | | | 0 | | | | 9,199,755 | |
Investment companies | | | 15,980,904 | | | | 0 | | | | 0 | | | | 15,980,904 | |
U.S. Treasury securities | | | 624,685 | | | | 0 | | | | 0 | | | | 624,685 | |
| | | 16,605,589 | | | | 439,707,603 | | | | 0 | | | | 456,313,192 | |
Futures contracts | | | 55,890 | | | | 0 | | | | 0 | | | | 55,890 | |
Total assets | | $ | 16,661,479 | | | $ | 439,707,603 | | | $ | 0 | | | $ | 456,369,082 | |
Liabilities | | | | | | | | | | | | | | | | |
Futures contracts | | $ | 113,814 | | | $ | 0 | | | $ | 0 | | | $ | 113,814 | |
Total liabilities | | $ | 113,814 | | | $ | 0 | | | $ | 0 | | | $ | 113,814 | |
| | | | | | |
| Notes to financial statements (unaudited) | | Wells Fargo Short-Term Bond Fund | | | 27 | |
Futures contracts are reported at the cumulative unrealized gains or losses at measurement date. The current day’s variation margin is reported on the Statement of assets and liabilities. All other assets and liabilities are reported at their market value at measurement date.
The Fund recognizes transfers between levels within the fair value hierarchy at the end of the reporting period. At February 28, 2018, the Fund did not have any transfers into/out of Level 1, Level 2, or Level 3.
4. TRANSACTIONS WITH AFFILIATES
Management fee
Funds Management, an indirect wholly owned subsidiary of Wells Fargo, is the manager of the Fund and provides advisory and fund-level administrative services under an investment management agreement. Under the investment management agreement, Funds Management is responsible for, among other services, implementing the investment objectives and strategies of the Fund, supervising the subadviser, providing fund-level administrative services in connection with the Fund’s operations, and providing any other fund-level administrative services reasonably necessary for the operation of the Fund. As compensation for its services under the investment management agreement, Funds Management is entitled to receive an annual management fee starting at 0.35% and declining to 0.255% as the average daily net assets of the Fund increase. For the six months ended February 28, 2018, the management fee was equivalent to an annual rate of 0.35% of the Fund’s average daily net assets.
Funds Management has retained the services of a subadviser to provide daily portfolio management to the Fund. The fee for subadvisory services is borne by Funds Management. WellsCap is the subadviser to the Fund and is entitled to receive a fee from Funds Management at an annual rate starting at 0.15% and declining to 0.05% as the average daily net assets of the Fund increase.
Administration fees
Under a class-level administration agreement, Funds Management provides class-level administrative services to the Fund, which includes paying fees and expenses for services provided by the transfer agent, sub-transfer agents, omnibus account servicers and record-keepers. As compensation for its services under the class-level administration agreement, Funds Management receives an annual fee which is calculated based on the average daily net assets of each class as follows:
| | | | |
| | | Class-level
administration fee | |
Class A, Class C, | | | 0.16 | % |
Institutional Class | | | 0.08 | |
Funds Management has contractually waived and/or reimbursed management and administration fees to the extent necessary to maintain certain net operating expense ratios for the Fund. Waiver of fees and/or reimbursement of expenses by Funds Management were made first from fund level expenses on a proportionate basis and then from class specific expenses. Funds Management has committed through December 31, 2018 to waive fees and/or reimburse expenses to the extent necessary to cap the Fund’s expenses at 0.72% for Class A shares, 1.47% for Class C shares, and 0.45% for Institutional Class shares. Prior to February 28, 2018, the Fund’s expense was capped at 0.48% for Institutional Class shares. After this time, the cap may be increased or the commitment to maintain the cap may be terminated only with the approval of the Board of Trustees.
Distribution fee
The Trust has adopted a distribution plan for Class C of the Fund pursuant to Rule 12b-1 under the 1940 Act. A distribution fee is charged to Class C shares and paid to Wells Fargo Funds Distributor, LLC (“Funds Distributor”), the principal underwriter, at an annual rate of 0.75% of the average daily net assets of Class C shares.
In addition, Funds Distributor is entitled to receive the front-end sales charge from the purchase of Class A shares and a contingent deferred sales charge on the redemption of certain Class A shares. Funds Distributor is also entitled to receive the contingent deferred sales charges from redemptions of Class C shares. For the six months ended February 28, 2018, Funds Distributor received $266 from the sale of Class A shares. No contingent deferred sales charges were incurred by Class A and Class C shares for the six months ended February 28, 2018.
Shareholder servicing fees
The Trust has entered into contracts with one or more shareholder servicing agents, whereby Class A and Class C of the Fund are charged a fee at an annual rate of 0.25% of the average daily net assets of each respective class.
| | | | |
| 28 | | Wells Fargo Short-Term Bond Fund | | Notes to financial statements (unaudited) |
A portion of these total shareholder servicing fees were paid to affiliates of Wells Fargo.
Interfund transactions
The Fund may purchase or sell investment securities to other Wells Fargo affiliates pursuant to Rule 17a-7 under the 1940 Act and under procedures adopted by the Board of Trustees. The procedures have been designed to ensure that these interfund transactions, which do not incur broker commissions, are effected at current market prices.
5. INVESTMENT PORTFOLIO TRANSACTIONS
Purchases and sales of investments, excluding short-term securities, for the six months ended February 28, 2018 were as follows:
| | | | | | |
Purchases at cost | | Sales proceeds |
U.S.
government | | Non-U.S.
government | | U.S.
government | | Non-U.S.
government |
| $8,826,061 | | $116,497,727 | | $9 | | $85,878,663 |
6. DERIVATIVE TRANSACTIONS
During the six months ended February 28, 2018, the Fund entered into futures contracts to speculate on interest rates and to help manage the duration of the portfolio. The Fund had an average notional amount of $189,702,790 in long futures contracts and $30,766,885 in short future contracts during the six months ended February 28, 2018.
On February 28, 2018, the cumulative unrealized losses on futures contracts in the amount of $57,924 are reflected in net unrealized losses on investments on the Statement of Assets and Liabilities. The payable for daily variation margin on open futures contracts reflected in the Statement of Assets and Liabilities only represents the current day’s variation margin. The realized losses and change in unrealized gains (losses) on futures contracts are reflected in the Statement of Operations.
For certain types of derivative transactions, the Fund has entered into International Swaps and Derivatives Association, Inc. master agreements (“ISDA Master Agreements”) or similar agreements with approved counterparties. The ISDA Master Agreements or similar agreements may have requirements to deliver/deposit securities or cash to/with an exchange or broker-dealer as collateral and allows the Fund to offset, with each counterparty, certain derivative financial instrument’s assets and/or liabilities with collateral held or pledged. Collateral requirements differ by type of derivative. Collateral or margin requirements are set by the broker or exchange clearinghouse for exchange traded derivatives while collateral terms are contract specific for over-the-counter traded derivatives. Cash collateral that has been pledged to cover obligations of the Fund under ISDA Master Agreements or similar agreements, if any, are reported separately in the Statement of Assets and Liabilities. Securities pledged as collateral, if any, are noted in the Portfolio of Investments. With respect to balance sheet offsetting, absent an event of default by the counterparty or a termination of the agreement, the reported amounts of financial assets and financial liabilities in the Statement of Assets and Liabilities are not offset across transactions between the Fund and the applicable counterparty. A reconciliation of the gross amounts on the Statement of Assets and Liabilities to the net amounts by counterparty, including any collateral exposure, is as follows:
| | | | | | | | | | | | | | | | |
| Counterparty | | Gross amounts
of assets in the
Statement of
Assets and
Liabilities | | | Amounts
subject to
netting
agreements | | | Collateral
received | | | Net amount
of assets | |
JP Morgan | | $ | 55,890 | * | | $ | (55,890 | ) | | $ | 0 | | | $ | 0 | |
| | | | | | | | | | | | |
| Counterparty | | Gross amounts of liabilities in the Statement of Assets and Liabilities | | Amounts subject to netting agreements | | Collateral pledged1 | | | Net amount of liabilities | |
JP Morgan | | $113,814* | | $(55,890) | | $ | (57,924 | ) | | $ | 0 | |
| | * | Amount represents cumulative unrealized gains (losses) on futures contracts which are reported in Net unrealized losses on investments. Only the current day’s variation margin as of February 28, 2018 is reported separately on the Statement of Assets and Liabilities. | |
| | 1 | Collateral pledged within this table is limited to the collateral for the net transaction with the counterparty. | |
| | | | | | |
| Notes to financial statements (unaudited) | | Wells Fargo Short-Term Bond Fund | | | 29 | |
7. BANK BORROWINGS
The Trust (excluding the money market funds and certain other funds) and Wells Fargo Variable Trust are parties to a $280,000,000 revolving credit agreement whereby the Fund is permitted to use bank borrowings for temporary or emergency purposes, such as to fund shareholder redemption requests. Interest under the credit agreement is charged to the Fund based on a borrowing rate equal to the higher of the Federal Funds rate in effect on that day plus 1.25% or the overnight LIBOR rate in effect on that day plus 1.25%. In addition, an annual commitment fee equal to 0.25% of the unused balance is allocated to each participating fund.
For the six months ended February 28, 2018, there were no borrowings by the Fund under the agreement.
9. INDEMNIFICATION
Under the Trust’s organizational documents, the officers and Trustees have been granted certain indemnification rights against certain liabilities that may arise out of performance of their duties to the Trust. Additionally, in the normal course of business, the Trust may enter into contracts with service providers that contain a variety of indemnification clauses. The Trust’s maximum exposure under these arrangements is dependent on future claims that may be made against the Fund and, therefore, cannot be estimated.
| | | | |
| 30 | | Wells Fargo Short-Term Bond Fund | | Other information (unaudited) |
PROXY VOTING INFORMATION
A description of the policies and procedures that the Fund uses to determine how to vote proxies relating to portfolio securities is available, upon request, by calling 1-800-222-8222, visiting our website at wellsfargofunds.com, or visiting the SEC website at sec.gov. Information regarding how the Fund voted proxies relating to portfolio securities during the most recent 12-month period ended June 30 is available on the Fund’s website at wellsfargofunds.com or by visiting the SEC website at sec.gov.
PORTFOLIO HOLDINGS INFORMATION
The complete portfolio holdings for the Fund are publicly available monthly on the Fund’s website (wellsfargofunds.com), on a one-month delayed basis. In addition, top ten holdings information (excluding derivative positions) for the Fund is publicly available on the Fund’s website on a monthly, seven-day or more delayed basis. The Fund files its complete schedule of portfolio holdings with the SEC for the first and third quarters of each fiscal year on Form N-Q, which is available by visiting the SEC website at sec.gov. In addition, the Fund’s Form N-Q may be reviewed and copied at the SEC’s Public Reference Room in Washington, DC, and at regional offices in New York City, at 233 Broadway, and in Chicago, at 175 West Jackson Boulevard, Suite 900. Information about the Public Reference Room may be obtained by calling 1-800-SEC-0330.
| | | | | | |
| Other information (unaudited) | | Wells Fargo Short-Term Bond Fund | | | 31 | |
BOARD OF TRUSTEES AND OFFICERS
Each of the Trustees and Officers1 listed in the table below acts in identical capacities for each fund in the Wells Fargo family of funds, which consists of 153 mutual funds comprising the Wells Fargo Funds Trust, Wells Fargo Variable Trust, Wells Fargo Master Trust and four closed-end funds (collectively the “Fund Complex”). This table should be read in conjunction with the Prospectus and the Statement of Additional Information2. The mailing address of each Trustee and Officer is 525 Market Street, 12th Floor, San Francisco, CA 94105. Each Trustee and Officer serves an indefinite term, however, each Trustee serves such term until reaching the mandatory retirement age established by the Trustees.
Independent Trustees
| | | | | | |
Name and year of birth | | Position held and length of service* | | Principal occupations during past five years or longer | | Current other public company or investment company directorships |
William R. Ebsworth (Born 1957) | | Trustee, since 2015 | | Retired. From 1984 to 2013, equities analyst, portfolio manager, research director and chief investment officer at Fidelity Management and Research Company in Boston, Tokyo, and Hong Kong, and retired in 2013 as Chief Investment Officer of Fidelity Strategic Advisers, Inc. where he led a team of investment professionals managing client assets. Prior thereto, Board member of Hong Kong Securities Clearing Co., Hong Kong Options Clearing Corp., the Thailand International Fund, Ltd., Fidelity Investments Life Insurance Company, and Empire Fidelity Investments Life Insurance Company. Board member of the Forté Foundation (non-profit organization) and the Vincent Memorial Hospital Endowment (non-profit organization), where he serves on the Investment Committee and as a Chair of the Audit Committee. Mr. Ebsworth is a CFA® charterholder. | | Asset Allocation Trust |
Jane A. Freeman** (Born 1953) | | Trustee, since 2015; Chair Liaison, since 2018 | | Retired. From 2012 to 2014 and 1999 to 2008, Chief Financial Officer of Scientific Learning Corporation. From 2008 to 2012, Ms. Freeman provided consulting services related to strategic business projects. Prior to 1999, Portfolio Manager at Rockefeller & Co. and Scudder, Stevens & Clark. Board member of the Harding Loevner Funds from 1996 to 2014, serving as both Lead Independent Director and chair of the Audit Committee. Board member of the Russell Exchange Traded Funds Trust from 2011 to 2012 and the chair of the Audit Committee. Ms. Freeman is a Board Member of Ruth Bancroft Garden (non-profit organization) and the Glimmerglass Festival. She is also an inactive Chartered Financial Analyst. | | Asset Allocation Trust |
Isaiah Harris, Jr. (Born 1952) | | Trustee, since 2009 | | Retired. Chairman of the Board of CIGNA Corporation since 2009, and Director since 2005. From 2003 to 2011, Director of Deluxe Corporation. Prior thereto, President and CEO of BellSouth Advertising and Publishing Corp. from 2005 to 2007, President and CEO of BellSouth Enterprises from 2004 to 2005 and President of BellSouth Consumer Services from 2000 to 2003. Emeritus member of the Iowa State University Foundation Board of Governors. Emeritus Member of the Advisory Board of Iowa State University School of Business. Advisory Board Member, Palm Harbor Academy (charter school). Advisory Board Member, Child Evangelism Fellowship (non-profit). Mr. Harris is a certified public accountant (inactive status). | | CIGNA Corporation; Asset Allocation Trust |
Judith M. Johnson (Born 1949) | | Trustee, since 2008; Audit Committee Chairman, since 2008 | | Retired. Prior thereto, Chief Executive Officer and Chief Investment Officer of Minneapolis Employees Retirement Fund from 1996 to 2008. Ms. Johnson is an attorney, certified public accountant and a certified managerial accountant. | | Asset Allocation Trust |
David F. Larcker (Born 1950) | | Trustee, since 2009 | | James Irvin Miller Professor of Accounting at the Graduate School of Business, Stanford University, Director of the Corporate Governance Research Initiative and Senior Faculty of The Rock Center for Corporate Governance since 2006. From 2005 to 2008, Professor of Accounting at the Graduate School of Business, Stanford University. Prior thereto, Ernst & Young Professor of Accounting at The Wharton School, University of Pennsylvania from 1985 to 2005. | | Asset Allocation Trust |
| | | | |
| 32 | | Wells Fargo Short-Term Bond Fund | | Other information (unaudited) |
| | | | | | |
Name and year of birth | | Position held and length of service* | | Principal occupations during past five years or longer | | Current other public company or investment company directorships |
Olivia S. Mitchell*** (Born 1953) | | Trustee, since 2006; Governance Committee Chairman, since 2018 | | International Foundation of Employee Benefit Plans Professor, Wharton School of the University of Pennsylvania since 1993. Director of Wharton’s Pension Research Council and Boettner Center on Pensions & Retirement Research, and Research Associate at the National Bureau of Economic Research. Previously, Cornell University Professor from 1978 to 1993. | | Asset Allocation Trust |
Timothy J. Penny**** (Born 1951) | | Trustee, since 1996; Chairman, since 2018; Vice Chairman, from 2017 to 2018 | | President and Chief Executive Officer of Southern Minnesota Initiative Foundation, a non-profit organization, since 2007. Member of the Board of Trustees of NorthStar Education Finance, Inc., a non-profit organization, since 2007. | | Asset Allocation Trust |
James G. Polisson***** (Born 1959) | | Trustee, since 2018; Advisory Board Member, from 2017 to 2018 | | Retired. Chief Marketing Officer, Source (ETF) UK Services, Ltd, from 2015 to 2017. From 2012 to 2015, Principal of The Polisson Group, LLC, a management consulting, corporate advisory and principal investing company. Chief Executive Officer and Managing Director at Russell Investments, Global Exchange Traded Funds from 2010 to 2012. Managing Director of Barclays Global Investors from 1998 to 2010 and Global Chief Marketing Officer for iShares and Barclays Global Investors from 2000 to 2010. Trustee of the San Francisco Mechanics’ Institute, a non-profit organization, from 2013 to 2015. Board member of the Russell Exchange Traded Fund Trust from 2011 to 2012. Director of Barclays Global Investors Holdings Deutschland GmbH from 2006 to 2009. Mr. Polisson is an attorney and has a retired status with the Massachusetts and District of Columbia Bar Associations. | | Asset Allocation Trust |
Michael S. Scofield (Born 1943) | | Trustee, since 2010 | | Served on the Investment Company Institute’s Board of Governors and Executive Committee from 2008-2011 as well the Governing Council of the Independent Directors Council from 2006-2011 and the Independent Directors Council Executive Committee from 2008-2011. Trustee of the Evergreen Fund complex (and its predecessors) from 1984 to 2010. Chairman of the Evergreen Funds from 2000-2010. Former Trustee of the Mentor Funds. Retired Attorney, Law Offices of Michael S. Scofield. | | Asset Allocation Trust |
Pamela Wheelock***** (Born 1959) | | Trustee, since 2018; Advisory Board Member, from 2017 to 2018 | | Chief Operating Officer, Twin Cities Habitat for Humanity, since January, 2017. Vice President of University Services, University of Minnesota from 2012 to 2017. Prior thereto, Interim President and Chief Executive Officer of Blue Cross Blue Shield of Minnesota from 2010 to 2011, Chairman of the Board from 2009 to 2011 and Board Director from 2003 to 2015. Vice President, Leadership and Community Engagement, Bush Foundation, Saint Paul, Minnesota (a private foundation) from 2009 to 2011. Executive Vice President and Chief Financial Officer, Minnesota Sports and Entertainment from 2004 to 2009 and Senior Vice President from 2002 to 2004. Commissioner of Finance, State of Minnesota, from 1999 to 2002. Currently on the Board of Directors, Governance Committee and Finance Committee, for the Minnesota Philanthropy Partners (Saint Paul Foundation) since 2012 and Board Chair of the Minnesota Wild Foundation since 2010. | | Asset Allocation Trust |
| * | Length of service dates reflect the Trustee’s commencement of service with the Trust’s predecessor entities, where applicable. |
| ** | Jane Freeman became Chair Liaison effective January 1, 2018. |
| *** | Olivia Mitchell became Chairman of the Governance Committee effective January 1, 2018. |
| **** | Timothy Penny became Chairman effective January 1, 2018. |
| ***** | James Polisson and Pamela Wheelock each became a Trustee effective January 1, 2018. |
| | | | | | |
| Other information (unaudited) | | Wells Fargo Short-Term Bond Fund | | | 33 | |
Officers
| | | | | | |
Name and year of birth | | Position held and
length of service | | Principal occupations during past five years or longer | | |
Andrew Owen (Born 1960) | | President, since 2017 | | Executive Vice President of Wells Fargo & Company and Head of Affiliated Managers, Wells Fargo Asset Management, since 2014. In addition, Mr. Owen is currently President, Chief Executive Officer and Director of Wells Fargo Funds Management, LLC since 2017. Prior thereto, Executive Vice President responsible for marketing, investments and product development for Wells Fargo Funds Management, LLC, from 2009 to 2014. | | |
Nancy Wiser1 (Born 1967) | | Treasurer, since 2012 | | Executive Vice President of Wells Fargo Funds Management, LLC since 2011. Chief Operating Officer and Chief Compliance Officer at LightBox Capital Management LLC, from 2008 to 2011. | | |
Alexander Kymn* (Born 1973) | | Secretary, since 2018; Chief Legal Officer, since 2018 | | Senior Company Counsel of Wells Fargo Bank, N.A. since 2018 (previously Senior Counsel from 2007 to 2018). Vice President of Wells Fargo Funds Management, LLC from 2008 to 2014. | | |
C. David Messman** (Born 1960) | | Secretary, since 2000; Chief Legal Officer, since 2003 | | Senior Vice President and Secretary of Wells Fargo Funds Management, LLC since 2001. Assistant General Counsel of Wells Fargo Bank, N.A. since 2013 and Vice President and Managing Counsel of Wells Fargo Bank, N.A. from 1996 to 2013. | | |
Michael H. Whitaker (Born 1967) | | Chief Compliance Officer, since 2016 | | Senior Vice President and Chief Compliance Officer since 2016. Senior Vice President and Chief Compliance Officer for Fidelity Investments from 2007 to 2016. | | |
David Berardi (Born 1975) | | Assistant Treasurer, since 2009 | | Vice President of Wells Fargo Funds Management, LLC since 2009. Vice President of Evergreen Investment Management Company, LLC from 2008 to 2010. Manager of Fund Reporting and Control for Evergreen Investment Management Company, LLC from 2004 to 2010. | | |
Jeremy DePalma1 (Born 1974) | | Assistant Treasurer, since 2009 | | Senior Vice President of Wells Fargo Funds Management, LLC since 2009. Senior Vice President of Evergreen Investment Management Company, LLC from 2008 to 2010 and head of the Fund Reporting and Control Team within Fund Administration from 2005 to 2010. | | |
| 1 | Nancy Wiser acts as Treasurer of 77 funds in the Fund Complex. Jeremy DePalma acts as Treasurer of 76 funds and Assistant Treasurer of 77 funds in the Fund Complex. |
| 2 | The Statement of Additional Information includes additional information about the Trustees and is available, without charge, upon request, by calling 1-800-222-8222 or by visiting the website at wellsfargofunds.com. |
| * | Alexander Kymn became the Secretary and Chief Legal Officer effective April 17, 2018. |
| ** | David Messman was the Secretary and Chief Legal Officer until April 16, 2018. |
| | | | |
| 34 | | Wells Fargo Short-Term Bond Fund | | List of abbreviations |
The following is a list of common abbreviations for terms and entities that may have appeared in this report.
| ACA | — ACA Financial Guaranty Corporation |
| ADR | — American depositary receipt |
| ADS | — American depositary shares |
| AGC | — Assured Guaranty Corporation |
| AGM | — Assured Guaranty Municipal |
| Ambac | — Ambac Financial Group Incorporated |
| AMT | — Alternative minimum tax |
| BAN | — Bond anticipation notes |
| BHAC | — Berkshire Hathaway Assurance Corporation |
| CAB | — Capital appreciation bond |
| CCAB | — Convertible capital appreciation bond |
| CDA | — Community Development Authority |
| CDO | — Collateralized debt obligation |
| CLO | — Collateralized loan obligation |
| DRIVER | — Derivative inverse tax-exempt receipts |
| DW&P | — Department of Water & Power |
| DWR | — Department of Water Resources |
| ECFA | — Educational & Cultural Facilities Authority |
| EDA | — Economic Development Authority |
| EDFA | — Economic Development Finance Authority |
| ETF | — Exchange-traded fund |
| FDIC | — Federal Deposit Insurance Corporation |
| FFCB | — Federal Farm Credit Banks |
| FGIC | — Financial Guaranty Insurance Corporation |
| FHA | — Federal Housing Administration |
| FHLB | — Federal Home Loan Bank |
| FHLMC | — Federal Home Loan Mortgage Corporation |
| FICO | — The Financing Corporation |
| FNMA | — Federal National Mortgage Association |
| GDR | — Global depositary receipt |
| GNMA | — Government National Mortgage Association |
| HCFR | — Healthcare facilities revenue |
| HEFA | — Health & Educational Facilities Authority |
| HEFAR | — Higher education facilities authority revenue |
| HFA | — Housing Finance Authority |
| HFFA | — Health Facilities Financing Authority |
| HUD | — Department of Housing and Urban Development |
| IDA | — Industrial Development Authority |
| IDAG | — Industrial Development Agency |
| KRW | — Republic of Korea won |
| LIBOR | — London Interbank Offered Rate |
| LIFER | — Long Inverse Floating Exempt Receipts |
| LLC | — Limited liability company |
| LLLP | — Limited liability limited partnership |
| LLP | — Limited liability partnership |
| MBIA | — Municipal Bond Insurance Association |
| MFHR | — Multifamily housing revenue |
| MSTR | — Municipal securities trust receipts |
| MUD | — Municipal Utility District |
| National | — National Public Finance Guarantee Corporation |
| PCFA | — Pollution Control Financing Authority |
| PCL | — Public Company Limited |
| PCR | — Pollution control revenue |
| PFA | — Public Finance Authority |
| PFFA | — Public Facilities Financing Authority |
| PFOTER | — Puttable floating option tax-exempt receipts |
| PJSC | — Public Joint Stock Company |
| plc | — Public limited company |
| PUTTER | — Puttable tax-exempt receipts |
| R&D | — Research & development |
| Radian | — Radian Asset Assurance |
| RAN | — Revenue anticipation notes |
| RDA | — Redevelopment Agency |
| RDFA | — Redevelopment Finance Authority |
| REIT | — Real estate investment trust |
| ROC | — Reset option certificates |
| SAVRS | — Select auction variable rate securities |
| SBA | — Small Business Authority |
| SDR | — Swedish depositary receipt |
| SFHR | — Single-family housing revenue |
| SFMR | — Single-family mortgage revenue |
| SIFMA | — Securities Industry and Financial Markets Association |
| SPA | — Standby purchase agreement |
| SPDR | — Standard & Poor’s Depositary Receipts |
| SPEAR | — Short Puttable Exempt Adjustable Receipts |
| STRIPS | — Separate trading of registered interest and |
| TAN | — Tax anticipation notes |
| TIPS | — Treasury inflation-protected securities |
| TRAN | — Tax revenue anticipation notes |
| TTFA | — Transportation Trust Fund Authority |
| TVA | — Tennessee Valley Authority |
This page is intentionally left blank.
This page is intentionally left blank.

For more information
More information about Wells Fargo Funds is available free upon request. To obtain literature, please write, email, visit the Fund’s website, or call:
Wells Fargo Funds
P.O. Box 8266
Boston, MA 02266-8266
Email: fundservice@wellsfargo.com
Website: wellsfargofunds.com
Individual investors: 1-800-222-8222
Retail investment professionals: 1-888-877-9275
Institutional investment professionals:
1-866-765-0778
This report and the financial statements contained herein are submitted for the general information of the shareholders of the Fund. If this report is used for promotional purposes, distribution of the report must be accompanied or preceded by a current prospectus. Before investing, please consider the investment objectives, risks, charges, and expenses of the investment. For a current prospectus and, if available, a summary prospectus, containing this information, call 1-800-222-8222 or visit the Fund’s website at wellsfargofunds.com. Read the prospectus carefully before you invest or send money.
Wells Fargo Asset Management (WFAM) is a trade name used by the asset management businesses of Wells Fargo & Company. Wells Fargo Funds Management, LLC, a wholly owned subsidiary of Wells Fargo & Company, provides investment advisory and administrative services for Wells Fargo Funds. Other affiliates of Wells Fargo & Company provide subadvisory and other services for the funds. The funds are distributed by Wells Fargo Funds Distributor, LLC, Member FINRA, an affiliate of Wells Fargo & Company. Neither Wells Fargo Funds Distributor nor Wells Fargo Funds Management holds fund shareholder accounts or assets. This material is for general informational and educational purposes only and is NOT intended to provide investment advice or a recommendation of any kind—including a recommendation for any specific investment, strategy, or plan.
NOT FDIC INSURED ◾ NO BANK GUARANTEE ◾ MAY LOSE VALUE
© 2018 Wells Fargo Funds Management, LLC. All rights reserved.
| | |
 | | 309372 04-18 SA221/SAR221 02-18 |
Semi-Annual Report
February 28, 2018

Wells Fargo
Short-Term High Yield Bond Fund


Reduce clutter. Save trees.
Sign up for electronic delivery of prospectuses and shareholder reports at wellsfargo.com/advantagedelivery
Contents
The views expressed and any forward-looking statements are as of February 28, 2018, unless otherwise noted, and are those of the Fund managers and/or Wells Fargo Funds Management, LLC. Discussions of individual securities, or the markets generally, or any Wells Fargo Fund are not intended as individual recommendations. Future events or results may vary significantly from those expressed in any forward-looking statements. The views expressed are subject to change at any time in response to changing circumstances in the market. Wells Fargo Funds Management, LLC and the Fund disclaim any obligation to publicly update or revise any views expressed or forward-looking statements.
NOT FDIC INSURED ◾ NO BANK GUARANTEE ◾ MAY LOSE VALUE
| | | | |
| 2 | | Wells Fargo Short-Term High Yield Bond Fund | | Letter to shareholders (unaudited) |

Andrew Owen
President
Wells Fargo Funds
During the period, stocks globally delivered positive returns.
Dear Shareholder:
We are pleased to offer you this semi-annual report for the Wells Fargo Short-Term High Yield Bond Fund for the six-month period that ended February 28, 2018. During the period, stocks globally delivered positive returns. For the period, U.S. stocks, as measured by the S&P 500 Index1, gained 10.84% and international stocks, as measured by the MSCI ACWI ex USA Index (Net)2, gained 7.59%. In bond markets, the Bloomberg Barclays U.S. Aggregate Bond Index3 declined 2.18% and the Bloomberg Barclays Municipal Bond Index4 lost 1.24% while fixed-income investments outside the U.S. gained 2.52%, according to the Bloomberg Barclays Global Aggregate ex-USD Index5. The ICE BofAML U.S. High Yield Index6 earned 1.01% during the period.
U.S. stocks advanced as business-friendly policies and regulations, newly implemented tax reform, increased hiring activity, and consistent corporate profits led to higher investor and consumer confidence. Internationally, stocks gained as unemployment fell and wages increased in the U.K.; the Bank of Japan continued its accommodative monetary policies; and industrial production, retail sales, and fixed asset investment increased in China. Stock returns in the emerging markets were strong, with the MSCI EM Index (Net)7 gaining 10.58% for the period.
Reactions to U.S. interest-rate increases were uneven across the yield curve and globally.
The U.S. Federal Reserve (Fed) increased the federal funds rate twice during the six-month period. Following a federal funds rate increase in June to a range of 1.00% to 1.25%, 10-year U.S. Treasury yields declined, the yield curve flattened, and long-term bond prices benefited.
Internationally, central banks maintained low interest rates and accommodative monetary policies that supported business activity and stock values in foreign markets. A weaker U.S. dollar was generally supportive of business activity in regions around the globe.
Positive economic and market news continued as 2017 closed and 2018 began.
During the fourth quarter of 2017, stock markets continued the move higher. Third-quarter economic output in the U.S. grew at a 3.2% annual rate. The unemployment rate fell to a 17-year low of 4.1%. Tax reform and wage growth encouraged increased business and consumer spending.
Fed officials announced in October 2017 plans to begin unwinding its $4.5 trillion portfolio of bonds and other assets accumulated during rounds of quantitative easing conducted since the 2008–2009 recession. Still, restrained inflation kept long-term bond rates steady and the flattening of the yield curve persisted.
| 1 | The S&P 500 Index consists of 500 stocks chosen for market size, liquidity, and industry group representation. It is a market-value-weighted index with each stock’s weight in the index proportionate to its market value. You cannot invest directly in an index. |
| 2 | The Morgan Stanley Capital International (MSCI) All Country World Index (ACWI) ex USA Index (Net) is a free-float-adjusted market-capitalization-weighted index that is designed to measure the equity market performance of developed markets, excluding the United States and Canada. Source: MSCI. MSCI makes no express or implied warranties or representations and shall have no liability whatsoever with respect to any MSCI data contained herein. The MSCI data may not be further redistributed or used as a basis for other indices or any securities or financial products. This report is not approved, reviewed, or produced by MSCI. You cannot invest directly in an index. |
| 3 | The Bloomberg Barclays U.S. Aggregate Bond Index is a broad-based benchmark that measures the investment-grade, U.S. dollar-denominated, fixed-rate taxable bond market, including Treasuries, government-related and corporate securities, mortgage-backed securities (agency fixed-rate and hybrid adjustable-rate mortgage pass-throughs), asset-backed securities, and commercial mortgage-backed securities. You cannot invest directly in an index. |
| 4 | The Bloomberg Barclays Municipal Bond Index is an unmanaged index composed of long-term tax-exempt bonds with a minimum credit rating of Baa. You cannot invest directly in an index. |
| 5 | The Bloomberg Barclays Global Aggregate ex-USD Index is an unmanaged index that provides a broad-based measure of the global investment-grade fixed-income markets excluding the U.S. dollar-denominated debt market. You cannot invest directly in an index. |
| 6 | The ICE BofAML U.S. High Yield Index is a market-capitalization-weighted index of domestic and Yankee high-yield bonds. The index tracks the performance of high-yield securities traded in the U.S. bond market. You cannot invest directly in an index. Copyright 2018. ICE Data Indices, LLC. All rights reserved. |
| 7 | The MSCI Emerging Markets (EM) Index (Net) is a free-float-adjusted market-capitalization-weighted index that is designed to measure large- and mid-cap equity market performance of emerging markets. The MSCI EM Index (Net) consists of the following 24 emerging markets country indices: Brazil, Chile, China, Colombia, Czech Republic, Egypt, Greece, Hungary, India, Indonesia, Korea, Malaysia, Mexico, Pakistan, Peru, the Philippines, Poland, Qatar, Russia, South Africa, Taiwan, Thailand, Turkey, and the United Arab Emirates. You cannot invest directly in an index. |
| | | | | | |
| Letter to shareholders (unaudited) | | Wells Fargo Short-Term High Yield Bond Fund | | | 3 | |
October 2017 also marked one year since the regulatory reform of money market investing in the U.S. By December 2017, money market fund asset levels exceeded their December 2016 levels, reflecting continued investor demand for short-term investment opportunities offered in money market funds.
In December, the Organisation for Economic Co-operation and Development (OECD) reported that the global economy was expanding at its fastest rate since 2010; all 35 countries the OECD follows were on track to expand for 2017. International economies benefited from economic stimulus, which accelerated trade growth; improving employment; increased investment; and firming commodity prices.
The Fed raised the federal funds rate target to a range of 1.25% to 1.50% in December 2017 and began reducing its bond portfolio.
2018 opened with continued stock advances, then volatility.
Improving business and economic data globally continued to support stock advances through January 2018. Even political wrangling in the U.S. over budget resolutions could not dissuade investors from buying stocks as payrolls and factory orders increased. Long-term interest rates in the U.S. trended higher as the yield curve steepened—the 10-year Treasury rate moved from 2.46% to 2.84% and the 30-year rate moved from 2.81% to 3.08% during January 2018.
Investor sentiment shifted in February. Concerns about inflation began to emerge in the U.S. as readings from the Producer Price Index in January rose 2.5% year over year. During February 2018, the U.S. market endured a loss of more than 10% before recovering much of that loss, but volatility affected stocks globally throughout the month.
During January 2018, purchasing managers’ indexes in China, the eurozone, India, and Japan reported data for December that indicated continued growth. International stock values fell during February 2018, swept up in the selling momentum in U.S. markets.
Don’t let short-term uncertainty derail long-term investment goals.
Periods of investment uncertainty can present challenges, but experience has taught us that maintaining long-term investment goals can be an effective way to plan for the future. To help you create a sound strategy based on your personal goals and risk tolerance, Wells Fargo Funds offers more than 100 mutual funds spanning a wide range of asset classes and investment styles. Although diversification cannot guarantee an investment profit or prevent losses, we believe it can be an effective way to manage investment risk and potentially smooth out overall portfolio performance. We encourage investors to know their investments and to understand that appropriate levels of risk-taking may unlock opportunities.
Thank you for choosing to invest with Wells Fargo Funds. We appreciate your confidence in us and remain committed to helping you meet your financial needs.
Sincerely,

Andrew Owen
President
Wells Fargo Funds
During February 2018, the U.S. market endured a loss of more than 10% before recovering much of that loss, but volatility affected stocks globally throughout the month.
For further information about your Fund, contact your investment professional, visit our website at wellsfargofunds.com, or call us directly at 1-800-222-8222.
| | | | |
| 4 | | Wells Fargo Short-Term High Yield Bond Fund | | Performance highlights (unaudited) |
Investment objective
The Fund seeks total return, consisting of a high level of current income and capital appreciation.
Manager
Wells Fargo Funds Management, LLC
Subadviser
Wells Capital Management Incorporated
Portfolio managers
Kevin J. Maas, CFA®
Thomas M. Price, CFA®
Michael J. Schueller, CFA®
Average annual total returns (%) as of February 28, 20181
| | | | | | | | | | | | | | | | | | | | | | | | | | | | | | | | | | |
| | | | | Including sales charge | | | Excluding sales charge | | | Expense ratios2 (%) | |
| | | Inception date | | 1 year | | | 5 year | | | 10 year | | | 1 year | | | 5 year | | | 10 year | | | Gross | | | Net3 | |
| Class A (SSTHX) | | 2-29-2000 | | | (1.22 | ) | | | 1.84 | | | | 3.55 | | | | 1.83 | | | | 2.46 | | | | 3.86 | | | | 0.93 | | | | 0.82 | |
| Class C (WFHYX) | | 3-31-2008 | | | 0.08 | | | | 1.69 | | | | 3.08 | | | | 1.08 | | | | 1.69 | | | | 3.08 | | | | 1.68 | | | | 1.57 | |
| Administrator Class (WDHYX) | | 7-30-2010 | | | – | | | | – | | | | – | | | | 2.00 | | | | 2.62 | | | | 3.98 | | | | 0.87 | | | | 0.66 | |
| Institutional Class (STYIX) | | 11-30-2012 | | | – | | | | – | | | | – | | | | 2.15 | | | | 2.78 | | | | 4.05 | | | | 0.60 | | | | 0.51 | |
| ICE BofAML High Yield U.S. Corporates, Cash Pay, BB Rated, 1-5 Year Index4 | | – | | | – | | | | – | | | | – | | | | 2.67 | | | | 4.47 | | | | 6.81 | | | | – | | | | – | |
Figures quoted represent past performance, which is no guarantee of future results, and do not reflect taxes that a shareholder may pay on fund distributions or the redemption of fund shares. Investment return and principal value of an investment will fluctuate so that an investor’s shares, when redeemed, may be worth more or less than their original cost. Performance shown without sales charges would be lower if sales charges were reflected. Current performance may be lower or higher than the performance data quoted, which assumes the reinvestment of dividends and capital gains. Current month-end performance is available on the Fund’s website, wellsfargofunds.com.
Index returns do not include transaction costs associated with buying and selling securities, any mutual fund fees or expenses, or any taxes. It is not possible to invest directly in an index.
For Class A shares, the maximum front-end sales charge is 3.00%. For Class C shares, the maximum contingent deferred sales charge is 1.00%. Performance including a contingent deferred sales charge assumes the sales charge for the corresponding time period. Administrator Class and Institutional Class shares are sold without a front-end sales charge or contingent deferred sales charge.
Bond values fluctuate in response to the financial condition of individual issuers, general market and economic conditions, and changes in interest rates. Changes in market conditions and government policies may lead to periods of heightened volatility in the bond market and reduced liquidity for certain bonds held by the Fund. In general, when interest rates rise, bond values fall and investors may lose principal value. Interest-rate changes and their impact on the Fund and its share price can be sudden and unpredictable. High-yield securities have a greater risk of default and tend to be more volatile than higher-rated debt securities. Loans are subject to risks similar to those associated with other below-investment- grade bond investments, such as credit risk (for example, risk of issuer default), below-investment-grade bond risk (for example, risk of greater volatility in value), and risk that the loan may become illiquid or difficult to price. The use of derivatives may reduce returns and/or increase volatility. Certain investment strategies tend to increase the total risk of an investment (relative to the broader market). The Fund is exposed to foreign investment risk. Consult the Fund’s prospectus for additional information on these and other risks.
Please see footnotes on page 5.
| | | | | | |
| Performance highlights (unaudited) | | Wells Fargo Short-Term High Yield Bond Fund | | | 5 | |
| | | | |
| Ten largest holdings (%) as of February 28, 20185 | |
Sabine Pass Liquefaction LLC, 5.63%, 2-1-2021 | | | 1.64 | |
Sprint Communications Incorporated, 9.00%, 11-15-2018 | | | 1.59 | |
Charter Communications Operating LLC, 3.65%, 4-30-2025 | | | 1.55 | |
Michaels Stores Incorporated, 4.38%, 1-30-2023 | | | 1.49 | |
Ally Financial Incorporated, 3.75%, 11-18-2019 | | | 1.40 | |
Nielsen Holding and Finance BV, 5.50%, 10-1-2021 | | | 1.38 | |
Virgin Media Bristol LLC, 4.09%, 1-15-2026 | | | 1.34 | |
Ineos US Finance LLC, 3.65%, 3-31-2024 | | | 1.32 | |
MGM Growth Properties LLC, 3.90%, 4-25-2023 | | | 1.28 | |
Level 3 Financing Incorporated, 3.85%, 2-22-2024 | | | 1.24 | |
|
| Credit quality as of February 28, 20186 |
|
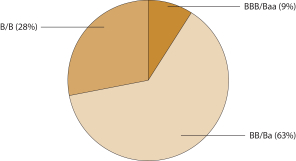
|
| 1 | Effective June 20, 2008, Advisor Class was renamed Class A and modified to assume the features and attributes of Class A. Historical performance shown for Class A shares through June 19, 2008, includes Advisor Class expenses. Historical performance shown for Class C shares prior to their inception reflects the performance of the former Investor Class shares, adjusted to include the higher expenses applicable to Class C shares. Historical performance shown for Administrator Class shares prior to their inception reflects the performance of Class A shares and includes the higher expenses applicable to Class A shares. If these expenses had not been included, returns for Administrator Class shares would be higher. Historical performance shown for Institutional Class shares prior to their inception reflects the performance of Administrator Class shares and includes the higher expenses applicable to Administrator Class shares. If these expenses had not been included, returns for Institutional Class shares would be higher. |
| 2 | Reflects the expense ratios as stated in the most recent prospectuses, which include the impact of 0.01% in acquired fund fees and expenses. The expense ratios shown are subject to change and may differ from the annualized expense ratios shown in the financial highlights of this report, which do not include acquired fund fees and expenses. |
| 3 | The manager has contractually committed through December 31, 2018, to waive fees and/or reimburse expenses to the extent necessary to cap the Fund’s Total Annual Fund Operating Expenses After Fee Waivers at 0.81% for Class A, 1.56% for Class C, 0.65% for Administrator Class, and 0.50% for Institutional Class. After this time, the cap may be increased or the commitment to maintain the cap may be terminated only with the approval of the Board of Trustees. Brokerage commissions, stamp duty fees, interest, taxes, acquired fund fees and expenses, and extraordinary expenses are excluded from the expense cap. Without this cap, the Fund’s returns would have been lower. The expense ratio paid by an investor is the net expense ratio (the total annual fund operating expenses after fee waivers) as stated in the prospectuses. |
| 4 | The ICE BofAML High Yield U.S. Corporates, Cash Pay, BB Rated, 1-5 Year Index is an unmanaged index that generally tracks the performance of BB rated U.S. dollar-denominated corporate bonds publicly issued in the U.S. domestic market with maturities of one to five years. You cannot invest directly in an index. |
| 5 | The ten largest holdings, excluding cash and cash equivalents, are calculated based on the value of the investments divided by total net assets of the Fund. Holdings are subject to change and may have changed since the date specified. |
| 6 | The credit quality distribution of portfolio holdings reflected in the chart is based on ratings from Standard & Poor’s, Moody��s Investors Service, and/or Fitch Ratings Ltd. Credit quality ratings apply to the underlying holdings of the Fund and not to the Fund itself. The percentages of the Fund’s portfolio with the ratings depicted in the chart are calculated based on the total market value of fixed income securities held by the Fund. If a security was rated by all three rating agencies, the middle rating was utilized. If rated by two of three rating agencies, the lower rating was utilized, and if rated by one of the rating agencies, that rating was utilized. Standard & Poor’s rates the creditworthiness of bonds, ranging from AAA (highest) to D (lowest). Ratings from A to CCC may be modified by the addition of a plus (+) or minus (-) sign to show relative standing within the rating categories. Standard & Poor’s rates the creditworthiness of short-term notes from SP-1 (highest) to SP-3 (lowest). Moody’s rates the creditworthiness of bonds, ranging from Aaa (highest) to C (lowest). Ratings Aa to B may be modified by the addition of a number 1 (highest) to 3 (lowest) to show relative standing within the ratings categories. Moody’s rates the creditworthiness of short-term U.S. tax-exempt municipal securities from MIG 1/VMIG 1 (highest) to SG (lowest). Fitch rates the creditworthiness of bonds, ranging from AAA (highest) to D (lowest). Credit quality distribution is subject to change and may have changed since the date specified. |
| | | | |
| 6 | | Wells Fargo Short-Term High Yield Bond Fund | | Fund expenses (unaudited) |
As a shareholder of the Fund, you incur two types of costs: (1) transaction costs, including sales charges (loads) on purchase payments and contingent deferred sales charges (if any) on redemptions and (2) ongoing costs, including management fees, distribution (12b-1) and/or shareholder servicing fees, and other Fund expenses. This example is intended to help you understand your ongoing costs (in dollars) of investing in the Fund and to compare these costs with the ongoing costs of investing in other mutual funds.
The example is based on an investment of $1,000 invested at the beginning of the six-month period and held for the entire period from September 1, 2017 to February 28, 2018.
Actual expenses
The “Actual” line of the table below provides information about actual account values and actual expenses. You may use the information in this line, together with the amount you invested, to estimate the expenses that you paid over the period. Simply divide your account value by $1,000 (for example, an $8,600 account value divided by $1,000 = 8.6), then multiply the result by the number in the “Actual” line under the heading entitled “Expenses paid during period” for your applicable class of shares to estimate the expenses you paid on your account during this period.
Hypothetical example for comparison purposes
The “Hypothetical” line of the table below provides information about hypothetical account values and hypothetical expenses based on the Fund’s actual expense ratio and an assumed rate of return of 5% per year before expenses, which is not the Fund’s actual return. The hypothetical account values and expenses may not be used to estimate the actual ending account balance or expenses you paid for the period. You may use this information to compare the ongoing costs of investing in the Fund and other funds. To do so, compare this 5% hypothetical example with the 5% hypothetical examples that appear in the shareholder reports of the other funds.
Please note that the expenses shown in the table are meant to highlight your ongoing costs only and do not reflect any transactional costs, such as sales charges (loads) and contingent deferred sales charges. Therefore, the “Hypothetical” line of the table is useful in comparing ongoing costs only and will not help you determine the relative total costs of owning different funds. In addition, if these transactional costs were included, your costs would have been higher.
| | | | | | | | | | | | | | | | |
| | | Beginning
account value
9-1-2017 | | | Ending
account value
2-28-2018 | | | Expenses
paid during
the period¹ | | | Annualized net
expense ratio | |
Class A | | | | | | | | | | | | | | | | |
Actual | | $ | 1,000.00 | | | $ | 1,006.89 | | | $ | 4.03 | | | | 0.81 | % |
Hypothetical (5% return before expenses) | | $ | 1,000.00 | | | $ | 1,020.78 | | | $ | 4.06 | | | | 0.81 | % |
Class C | | | | | | | | | | | | | | | | |
Actual | | $ | 1,000.00 | | | $ | 1,003.16 | | | $ | 7.75 | | | | 1.56 | % |
Hypothetical (5% return before expenses) | | $ | 1,000.00 | | | $ | 1,017.06 | | | $ | 7.80 | | | | 1.56 | % |
Administrator Class | | | | | | | | | | | | | | | | |
Actual | | $ | 1,000.00 | | | $ | 1,007.69 | | | $ | 3.24 | | | | 0.65 | % |
Hypothetical (5% return before expenses) | | $ | 1,000.00 | | | $ | 1,021.57 | | | $ | 3.26 | | | | 0.65 | % |
Institutional Class | | | | | | | | | | | | | | | | |
Actual | | $ | 1,000.00 | | | $ | 1,008.43 | | | $ | 2.49 | | | | 0.50 | % |
Hypothetical (5% return before expenses) | | $ | 1,000.00 | | | $ | 1,022.32 | | | $ | 2.51 | | | | 0.50 | % |
| 1 | Expenses paid is equal to the annualized net expense ratio of each class multiplied by the average account value over the period, multiplied by the number of days in the most recent fiscal half-year divided by the number of days in the fiscal year (to reflect the one-half-year period). |
| | | | | | |
| Portfolio of investments—February 28, 2018 (unaudited) | | Wells Fargo Short-Term High Yield Bond Fund | | | 7 | |
| | | | | | | | | | | | | | | | |
| Security name | | Interest rate | | | Maturity date | | | Principal | | | Value | |
| | | |
Corporate Bonds and Notes: 56.47% | | | | | | | | | | | | | |
| | | | |
Consumer Discretionary: 23.68% | | | | | | | | | | | | | | | | |
| | | |
| Auto Components: 1.65% | | | | | | | | | | | | | |
American Axle & Manufacturing Incorporated | | | 6.25 | % | | | 3-15-2021 | | | $ | 13,000,000 | | | $ | 13,196,430 | |
American Axle & Manufacturing Incorporated | | | 7.75 | | | | 11-15-2019 | | | | 4,080,000 | | | | 4,335,000 | |
Cooper Tire & Rubber Company | | | 8.00 | | | | 12-15-2019 | | | | 2,568,000 | | | | 2,793,984 | |
| | | | |
| | | | | | | | | | | | | | | 20,325,414 | |
| | | | | | | | | | | | | | | | |
| | | |
| Diversified Consumer Services: 1.81% | | | | | | | | | | | | | |
Service Corporation International | | | 5.38 | | | | 1-15-2022 | | | | 13,800,000 | | | | 14,101,875 | |
TRI Pointe Group Incorporated | | | 4.38 | | | | 6-15-2019 | | | | 8,142,000 | | | | 8,162,355 | |
| | | | |
| | | | | | | | | | | | | | | 22,264,230 | |
| | | | | | | | | | | | | | | | |
| | | |
| Hotels, Restaurants & Leisure: 3.08% | | | | | | | | | | | | | |
GLP Capital LP/GLP Financing II Incorporated | | | 4.38 | | | | 11-1-2018 | | | | 3,370,000 | | | | 3,370,000 | |
GLP Capital LP/GLP Financing II Incorporated | | | 4.88 | | | | 11-1-2020 | | | | 11,929,000 | | | | 12,227,225 | |
MGM Resorts International | | | 5.25 | | | | 3-31-2020 | | | | 9,365,000 | | | | 9,657,656 | |
NCL Corporation Limited 144A | | | 4.75 | | | | 12-15-2021 | | | | 9,906,000 | | | | 10,116,503 | |
Scientific Games International Incorporated 144A | | | 7.00 | | | | 1-1-2022 | | | | 2,507,000 | | | | 2,638,618 | |
| | | | |
| | | | | | | | | | | | | | | 38,010,002 | |
| | | | | | | | | | | | | | | | |
| | | |
| Household Durables: 3.32% | | | | | | | | | | | | | |
KB Home | | | 4.75 | | | | 5-15-2019 | | | | 7,835,000 | | | | 7,932,938 | |
Lennar Corporation | | | 4.13 | | | | 12-1-2018 | | | | 3,764,000 | | | | 3,779,056 | |
Lennar Corporation | | | 4.50 | | | | 6-15-2019 | | | | 3,400,000 | | | | 3,442,500 | |
Lennar Corporation | | | 4.50 | | | | 11-15-2019 | | | | 11,056,000 | | | | 11,235,660 | |
Lennar Corporation 144A | | | 6.63 | | | | 5-1-2020 | | | | 2,485,000 | | | | 2,627,888 | |
Lennar Corporation 144A | | | 8.38 | | | | 5-15-2018 | | | | 500,000 | | | | 505,000 | |
Pulte Group Incorporated | | | 4.25 | | | | 3-1-2021 | | | | 11,145,000 | | | | 11,340,038 | |
| | | | |
| | | | | | | | | | | | | | | 40,863,080 | |
| | | | | | | | | | | | | | | | |
| | | |
| Internet & Direct Marketing Retail: 1.13% | | | | | | | | | | | | | |
Netflix Incorporated | | | 5.38 | | | | 2-1-2021 | | | | 13,445,000 | | | | 13,965,994 | |
| | | | | | | | | | | | | | | | |
| | | |
| Media: 7.93% | | | | | | | | | | | | | |
Cable One Incorporated 144A | | | 5.75 | | | | 6-15-2022 | | | | 10,268,000 | | | | 10,537,535 | |
CSC Holdings LLC | | | 7.63 | | | | 7-15-2018 | | | | 8,945,000 | | | | 9,056,813 | |
DISH DBS Corporation | | | 7.88 | | | | 9-1-2019 | | | | 11,065,000 | | | | 11,673,575 | |
LIN Television Corporation | | | 5.88 | �� | | | 11-15-2022 | | | | 2,870,000 | | | | 2,963,275 | |
National CineMedia LLC | | | 6.00 | | | | 4-15-2022 | | | | 13,525,000 | | | | 13,643,344 | |
Nexstar Broadcasting Group Incorporated 144A | | | 6.13 | | | | 2-15-2022 | | | | 11,535,000 | | | | 11,881,050 | |
Outfront Media Capital Corporation | | | 5.25 | | | | 2-15-2022 | | | | 10,515,000 | | | | 10,738,444 | |
Sinclair Television Group Incorporated | | | 6.13 | | | | 10-1-2022 | | | | 13,200,000 | | | | 13,612,500 | |
Sirius XM Radio Incorporated 144A | | | 3.88 | | | | 8-1-2022 | | | | 2,890,000 | | | | 2,832,200 | |
TEGNA Incorporated | | | 5.13 | | | | 10-15-2019 | | | | 6,174,000 | | | | 6,258,893 | |
TEGNA Incorporated | | | 5.13 | | | | 7-15-2020 | | | | 4,505,000 | | | | 4,561,313 | |
| | | | |
| | | | | | | | | | | | | | | 97,758,942 | |
| | | | | | | | | | | | | | | | |
The accompanying notes are an integral part of these financial statements.
| | | | |
| 8 | | Wells Fargo Short-Term High Yield Bond Fund | | Portfolio of investments—February 28, 2018 (unaudited) |
| | | | | | | | | | | | | | | | |
| Security name | | Interest rate | | | Maturity date | | | Principal | | | Value | |
| | | |
| Multiline Retail: 0.60% | | | | | | | | | | | | | |
Dollar Tree Incorporated | | | 5.25 | % | | | 3-1-2020 | | | $ | 7,305,000 | | | $ | 7,396,313 | |
| | | | | | | | | | | | | | | | |
| | | |
| Specialty Retail: 2.93% | | | | | | | | | | | | | |
Gap Incorporated | | | 5.95 | | | | 4-12-2021 | | | | 8,965,000 | | | | 9,506,975 | |
Group 1 Automotive Incorporated | | | 5.00 | | | | 6-1-2022 | | | | 7,855,000 | | | | 8,012,100 | |
L Brands Incorporated | | | 6.63 | | | | 4-1-2021 | | | | 5,075,000 | | | | 5,415,989 | |
Penske Auto Group Incorporated | | | 3.75 | | | | 8-15-2020 | | | | 1,905,000 | | | | 1,890,713 | |
Penske Auto Group Incorporated | | | 5.75 | | | | 10-1-2022 | | | | 10,920,000 | | | | 11,220,300 | |
| | | | |
| | | | | | | | | | | | | | | 36,046,077 | |
| | | | | | | | | | | | | | | | |
| | | | |
| Textiles, Apparel & Luxury Goods: 1.23% | | | | | | | | | | | | | | | | |
The William Carter Company | | | 5.25 | | | | 8-15-2021 | | | | 14,890,000 | | | | 15,206,413 | |
| | | | | | | | | | | | | | | | |
| | | |
Consumer Staples: 1.97% | | | | | | | | | | | | | |
| | | | |
| Food Products: 1.15% | | | | | | | | | | | | | | | | |
B&G Foods Incorporated | | | 4.63 | | | | 6-1-2021 | | | | 14,070,000 | | | | 14,122,763 | |
| | | | | | | | | | | | | | | | |
| | | | |
| Personal Products: 0.82% | | | | | | | | | | | | | | | | |
Edgewell Personal Care Company | | | 4.70 | | | | 5-19-2021 | | | | 10,124,000 | | | | 10,174,620 | |
| | | | | | | | | | | | | | | | |
| | | |
Energy: 5.50% | | | | | | | | | | | | | |
| | | | |
| Oil, Gas & Consumable Fuels: 5.50% | | | | | | | | | | | | | | | | |
DCP Midstream Operating LLC | | | 2.70 | | | | 4-1-2019 | | | | 9,700,000 | | | | 9,590,875 | |
DCP Midstream Operating LP 144A | | | 5.35 | | | | 3-15-2020 | | | | 5,668,000 | | | | 5,809,700 | |
Rockies Express Pipeline LLC 144A | | | 5.63 | | | | 4-15-2020 | | | | 3,190,000 | | | | 3,313,613 | |
Rockies Express Pipeline LLC 144A | | | 6.00 | | | | 1-15-2019 | | | | 12,620,000 | | | | 12,903,950 | |
Sabine Pass Liquefaction LLC | | | 5.63 | | | | 2-1-2021 | | | | 19,170,000 | | | | 20,247,124 | |
Southern Star Central Corporation 144A | | | 5.13 | | | | 7-15-2022 | | | | 8,995,000 | | | | 9,197,388 | |
Targa Resources Partners LP | | | 4.13 | | | | 11-15-2019 | | | | 6,720,000 | | | | 6,770,400 | |
| | | | |
| | | | | | | | | | | | | | | 67,833,050 | |
| | | | | | | | | | | | | | | | |
| | | |
Financials: 5.57% | | | | | | | | | | | | | |
| | | | |
| Banks: 0.85% | | | | | | | | | | | | | | | | |
CIT Group Incorporated | | | 3.88 | | | | 2-19-2019 | | | | 10,406,000 | | | | 10,458,030 | |
| | | | | | | | | | | | | | | | |
| | | | |
| Consumer Finance: 3.75% | | | | | | | | | | | | | | | | |
Ally Financial Incorporated | | | 3.75 | | | | 11-18-2019 | | | | 17,160,000 | | | | 17,254,380 | |
Navient Corporation | | | 5.50 | | | | 1-15-2019 | | | | 160,000 | | | | 162,352 | |
Navient Corporation | | | 8.45 | | | | 6-15-2018 | | | | 12,440,000 | | | | 12,595,500 | |
OneMain Financial Group LLC 144A | | | 7.25 | | | | 12-15-2021 | | | | 13,075,000 | | | | 13,583,291 | |
Toll Brothers Finance Corporation | | | 4.00 | | | | 12-31-2018 | | | | 2,650,000 | | | | 2,666,563 | |
| | | | |
| | | | | | | | | | | | | | | 46,262,086 | |
| | | | | | | | | | | | | | | | |
| | | | |
| Mortgage REITs: 0.18% | | | | | | | | | | | | | | | | |
Starwood Property Trust Incorporated 144A | | | 3.63 | | | | 2-1-2021 | | | | 2,210,000 | | | | 2,193,425 | |
| | | | | | | | | | | | | | | | |
| | | | |
| Real Estate Management & Development: 0.79% | | | | | | | | | | | | | | | | |
Realogy Group LLC 144A | | | 5.25 | | | | 12-1-2021 | | | | 9,645,000 | | | | 9,765,563 | |
| | | | | | | | | | | | | | | | |
The accompanying notes are an integral part of these financial statements.
| | | | | | |
| Portfolio of investments—February 28, 2018 (unaudited) | | Wells Fargo Short-Term High Yield Bond Fund | | | 9 | |
| | | | | | | | | | | | | | | | |
| Security name | | Interest rate | | | Maturity date | | | Principal | | | Value | |
| | | |
Health Care: 3.98% | | | | | | | | | | | | | |
| | | | |
| Health Care Providers & Services: 3.98% | | | | | | | | | | | | | | | | |
Acadia Healthcare Company Incorporated | | | 5.13 | % | | | 7-1-2022 | | | $ | 7,232,000 | | | $ | 7,319,507 | |
Acadia Healthcare Company Incorporated | | | 6.13 | | | | 3-15-2021 | | | | 1,618,000 | | | | 1,646,315 | |
DaVita HealthCare Partners Incorporated | | | 5.75 | | | | 8-15-2022 | | | | 7,755,000 | | | | 7,982,803 | |
Fresenius Medical Care Holdings Incorporated 144A | | | 5.63 | | | | 7-31-2019 | | | | 395,000 | | | | 409,007 | |
HCA Incorporated | | | 3.75 | | | | 3-15-2019 | | | | 4,030,000 | | | | 4,055,308 | |
HCA Incorporated | | | 6.50 | | | | 2-15-2020 | | | | 4,120,000 | | | | 4,336,300 | |
Lifepoint Health Incorporated | | | 5.50 | | | | 12-1-2021 | | | | 10,617,000 | | | | 10,696,628 | |
Select Medical Corporation | | | 6.38 | | | | 6-1-2021 | | | | 5,345,000 | | | | 5,449,067 | |
Tenet Healthcare Corporation | | | 6.00 | | | | 10-1-2020 | | | | 6,905,000 | | | | 7,181,200 | |
| | | | |
| | | | | | | | | | | | | | | 49,076,135 | |
| | | | | | | | | | | | | | | | |
| | | | |
Industrials: 4.49% | | | | | | | | | | | | | | | | |
| | | |
| Aerospace & Defense: 1.83% | | | | | | | | | | | | | |
Alcoa Incorporated | | | 6.15 | | | | 8-15-2020 | | | | 8,830,000 | | | | 9,347,261 | |
Moog Incorporated 144A | | | 5.25 | | | | 12-1-2022 | | | | 12,865,000 | | | | 13,250,950 | |
| | | | |
| | | | | | | | | | | | | | | 22,598,211 | |
| | | | | | | | | | | | | | | | |
| | | |
| Airlines: 0.90% | | | | | | | | | | | | | |
United Continental Holdings Incorporated | | | 6.38 | | | | 6-1-2018 | | | | 10,965,000 | | | | 11,033,531 | |
| | | | | | | | | | | | | | | | |
| | | |
| Commercial Services & Supplies: 0.91% | | | | | | | | | | | | | |
Clean Harbors Incorporated | | | 5.13 | | | | 6-1-2021 | | | | 11,195,000 | | | | 11,264,969 | |
| | | | | | | | | | | | | | | | |
| | | |
| Machinery: 0.64% | | | | | | | | | | | | | |
CNH Industrial Capital LLC | | | 3.63 | | | | 4-15-2018 | | | | 6,400,000 | | | | 6,400,000 | |
CNH Industrial Capital LLC | | | 4.38 | | | | 11-6-2020 | | | | 1,425,000 | | | | 1,453,500 | |
| | | | |
| | | | | | | | | | | | | | | 7,853,500 | |
| | | | | | | | | | | | | | | | |
| | | |
| Trading Companies & Distributors: 0.21% | | | | | | | | | | | | | |
International Lease Finance Corporation | | | 6.25 | | | | 5-15-2019 | | | | 2,500,000 | | | | 2,593,277 | |
| | | | | | | | | | | | | | | | |
| | | |
Information Technology: 3.29% | | | | | | | | | | | | | |
| | | |
| Electronic Equipment, Instruments & Components: 0.99% | | | | | | | | | | | | | |
Sanmina Corporation 144A | | | 4.38 | | | | 6-1-2019 | | | | 12,100,000 | | | | 12,221,000 | |
| | | | | | | | | | | | | | | | |
| | | |
| Software: 0.38% | | | | | | | | | | | | | |
Symantec Corporation | | | 4.20 | | | | 9-15-2020 | | | | 4,635,000 | | | | 4,723,228 | |
| | | | | | | | | | | | | | | | |
| | | |
| Technology Hardware, Storage & Peripherals: 1.92% | | | | | | | | | | | | | |
EMC Corporation | | | 2.65 | | | | 6-1-2020 | | | | 11,850,000 | | | | 11,528,121 | |
NCR Corporation | | | 4.63 | | | | 2-15-2021 | | | | 7,925,000 | | | | 7,865,563 | |
Western Digital Corporation 144A | | | 7.38 | | | | 4-1-2023 | | | | 3,880,000 | | | | 4,217,560 | |
| | | | |
| | | | | | | | | | | | | | | 23,611,244 | |
| | | | | | | | | | | | | | | | |
The accompanying notes are an integral part of these financial statements.
| | | | |
| 10 | | Wells Fargo Short-Term High Yield Bond Fund | | Portfolio of investments—February 28, 2018 (unaudited) |
| | | | | | | | | | | | | | | | |
| Security name | | Interest rate | | | Maturity date | | | Principal | | | Value | |
| | | |
Materials: 2.68% | | | | | | | | | | | | | |
| | | | |
| Chemicals: 0.26% | | | | | | | | | | | | | | | | |
Huntsman International LLC | | | 4.88 | % | | | 11-15-2020 | | | $ | 3,175,000 | | | $ | 3,247,327 | |
| | | | | | | | | | | | | | | | |
| | | |
| Containers & Packaging: 1.34% | | | | | | | | | | | | | |
Ball Corporation | | | 4.38 | | | | 12-15-2020 | | | | 10,425,000 | | | | 10,659,563 | |
Reynolds Group Holdings | | | 5.75 | | | | 10-15-2020 | | | | 5,737,118 | | | | 5,816,003 | |
| | | | |
| | | | | | | | | | | | | | | 16,475,566 | |
| | | | | | | | | | | | | | | | |
| | | |
| Metals & Mining: 1.08% | | | | | | | | | | | | | |
Freeport-McMoRan Incorporated | | | 3.10 | | | | 3-15-2020 | | | | 1,840,000 | | | | 1,821,600 | |
United States Steel Corporation 144A | | | 8.38 | | | | 7-1-2021 | | | | 10,710,000 | | | | 11,486,475 | |
| | | | |
| | | | | | | | | | | | | | | 13,308,075 | |
| | | | | | | | | | | | | | | | |
| | | |
Real Estate: 2.31% | | | | | | | | | | | | | |
| | | | |
| Equity REITs: 1.63% | | | | | | | | | | | | | | | | |
CoreCivic Incorporated | | | 4.13 | | | | 4-1-2020 | | | | 2,545,000 | | | | 2,545,000 | |
Equinix Incorporated | | | 5.38 | | | | 1-1-2022 | | | | 14,195,000 | | | | 14,709,569 | |
Sabra Health Care REIT Incorporated | | | 5.50 | | | | 2-1-2021 | | | | 210,000 | | | | 214,725 | |
VEREIT Operating Partnership LP | | | 3.00 | | | | 2-6-2019 | | | | 2,550,000 | | | | 2,556,515 | |
| | | | |
| | | | | | | | | | | | | | | 20,025,809 | |
| | | | | | | | | | | | | | | | |
| | | | |
| Real Estate Management & Development: 0.68% | | | | | | | | | | | | | | | | |
Taylor Morrison Communities Incorporated 144A | | | 5.25 | | | | 4-15-2021 | | | | 8,285,000 | | | | 8,367,850 | |
| | | | | | | | | | | | | | | | |
| | | |
Telecommunication Services: 2.17% | | | | | | | | | | | | | |
| | | | |
| Diversified Telecommunication Services: 0.09% | | | | | | | | | | | | | | | | |
Hughes Satellite Systems Corporation | | | 6.50 | | | | 6-15-2019 | | | | 1,100,000 | | | | 1,137,125 | |
| | | | | | | | | | | | | | | | |
| | | | |
| Wireless Telecommunication Services: 2.08% | | | | | | | | | | | | | | | | |
Sprint Communications Incorporated 144A | | | 9.00 | | | | 11-15-2018 | | | | 18,940,000 | | | | 19,650,250 | |
Sprint Spectrum LP 144A | | | 3.36 | | | | 3-20-2023 | | | | 1,659,375 | | | | 1,663,523 | |
T-Mobile USA Incorporated | | | 6.63 | | | | 4-1-2023 | | | | 4,095,000 | | | | 4,239,963 | |
| | | | |
| | | | | | | | | | | | | | | 25,553,736 | |
| | | | | | | | | | | | | | | | |
| | | |
Utilities: 0.83% | | | | | | | | | | | | | |
| | | | |
| Independent Power & Renewable Electricity Producers: 0.83% | | | | | | | | | | | | | | | | |
NRG Energy Incorporated | | | 6.25 | | | | 7-15-2022 | | | | 9,942,000 | | | | 10,265,115 | |
| | | | | | | | | | | | | | | | |
| | | |
Total Corporate Bonds and Notes (Cost $703,175,786) | | | | | | | | | | | | 696,001,700 | |
| | | | | | | | | | | | | | | | |
| | | |
Loans: 31.48% | | | | | | | | | | | | | |
| | | | |
Consumer Discretionary: 5.37% | | | | | | | | | | | | | | | | |
| | | | |
| Auto Components: 0.87% | | | | | | | | | | | | | | | | |
Allison Transmission Incorporated (1 Month LIBOR +2.00%) ± | | | 3.65 | | | | 9-23-2022 | | | | 7,698,219 | | | | 7,762,961 | |
Belron Finance US LLC (1 Month LIBOR +2.50%) ±‡ | | | 4.29 | | | | 11-7-2024 | | | | 3,000,000 | | | | 3,015,000 | |
| | | | |
| | | | | | | | | | | | | | | 10,777,961 | |
| | | | | | | | | | | | | | | | |
The accompanying notes are an integral part of these financial statements.
| | | | | | |
| Portfolio of investments—February 28, 2018 (unaudited) | | Wells Fargo Short-Term High Yield Bond Fund | | | 11 | |
| | | | | | | | | | | | | | | | |
| Security name | | Interest rate | | | Maturity date | | | Principal | | | Value | |
| | | | |
| Household Products: 2.49% | | | | | | | | | | | | | | | | |
Michaels Stores Incorporated (1 Month LIBOR +2.75%) ± | | | 4.38 | % | | | 1-30-2023 | | | $ | 18,271,903 | | | $ | 18,350,655 | |
The ServiceMaster Company LLC (1 Month LIBOR +2.50%) ± | | | 4.15 | | | | 11-8-2023 | | | | 12,261,150 | | | | 12,316,325 | |
| | | | |
| | | | | | | | | | | | | | | 30,666,980 | |
| | | | | | | | | | | | | | | | |
| | | | |
| Media: 1.82% | | | | | | | | | | | | | | | | |
Altice US Finance I Corporation (1 Month LIBOR +2.25%) ± | | | 3.90 | | | | 7-28-2025 | | | | 10,447,500 | | | | 10,430,053 | |
CSC Holdings LLC (1 Month LIBOR +2.50%) ± | | | 4.14 | | | | 1-25-2026 | | | | 11,932,000 | | | | 11,941,904 | |
| | | | |
| | | | | | | | | | | | | | | 22,371,957 | |
| | | | | | | | | | | | | | | | |
| | | | |
| Specialty Retail: 0.19% | | | | | | | | | | | | | | | | |
Sally Beauty Holdings Incorporated (1 Month LIBOR +2.50%) ± | | | 4.19 | | | | 7-5-2024 | | | | 2,359,088 | | | | 2,369,892 | |
| | | | | | | | | | | | | | | | |
| | | |
Consumer Staples: 1.97% | | | | | | | | | | | | | |
| | | | |
| Food Products: 1.97% | | | | | | | | | | | | | | | | |
Pinnacle Foods Incorporated (1 Month LIBOR +2.00%) ± | | | 3.58 | | | | 2-2-2024 | | | | 13,122,450 | | | | 13,196,986 | |
Post Holdings Incorporated (1 Month LIBOR +2.25%) ± | | | 3.90 | | | | 5-24-2024 | | | | 11,119,125 | | | | 11,130,689 | |
| | | | |
| | | | | | | | | | | | | | | 24,327,675 | |
| | | | | | | | | | | | | | | | |
| | | | |
Financials: 1.87% | | | | | | | | | | | | | | | | |
| | | |
| Diversified Financial Services: 1.87% | | | | | | | | | | | | | |
Delos Finance SARL (3 Month LIBOR +2.00%) ± | | | 3.69 | | | | 10-6-2023 | | | | 9,865,000 | | | | 9,886,111 | |
LPL Holdings Incorporated (3 Month LIBOR +2.25%) ± | | | 3.81 | | | | 9-23-2024 | | | | 13,130,154 | | | | 13,150,637 | |
| | | | |
| | | | | | | | | | | | | | | 23,036,748 | |
| | | | | | | | | | | | | | | | |
| | | | |
Health Care: 2.40% | | | | | | | | | | | | | | | | |
| | | |
| Health Care Providers & Services: 1.47% | | | | | | | | | | | | | |
HCA Incorporated (1 Month LIBOR +2.00%) ± | | | 3.65 | | | | 3-17-2023 | | | | 12,108,500 | | | | 12,170,738 | |
Select Medical Corporation (3 Month LIBOR +3.50%) ± | | | 5.21 | | | | 3-1-2021 | | | | 5,900,413 | | | | 5,922,539 | |
| | | | |
| | | | | | | | | | | | | | | 18,093,277 | |
| | | | | | | | | | | | | | | | |
| | | |
| Health Care Technology: 0.48% | | | | | | | | | | | | | |
Change Healthcare Holdings Incorporated (1 Month LIBOR +2.75%) ± | | | 4.40 | | | | 3-1-2024 | | | | 5,860,713 | | | | 5,870,969 | |
| | | | | | | | | | | | | | | | |
| | | |
| Pharmaceuticals: 0.45% | | | | | | | | | | | | | |
Endo Finance LLC (1 Month LIBOR +4.25%) ± | | | 5.94 | | | | 4-29-2024 | | | | 5,577,375 | | | | 5,562,037 | |
| | | | | | | | | | | | | | | | |
| | | | |
Industrials: 9.05% | | | | | | | | | | | | | | | | |
| | | |
| Airlines: 1.53% | | | | | | | | | | | | | |
Delta Air Lines Incorporated (1 Month LIBOR +2.50%) ± | | | 4.15 | | | | 8-24-2022 | | | | 10,879,575 | | | | 10,953,447 | |
United Airlines Incorporated (3 Month LIBOR +2.00%) ± | | | 3.77 | | | | 4-1-2024 | | | | 7,870,525 | | | | 7,901,692 | |
| | | | |
| | | | | | | | | | | | | | | 18,855,139 | |
| | | | | | | | | | | | | | | | |
| | | |
| Commercial Services & Supplies: 3.49% | | | | | | | | | | | | | |
Advanced Disposal Services Incorporated (1 Month LIBOR +2.25%) ± | | | 3.72 | | | | 11-10-2023 | | | | 12,633,275 | | | | 12,673,449 | |
Aramark Services Incorporated (1 Month LIBOR +2.00%) ± | | | 3.65 | | | | 3-28-2024 | | | | 6,327,661 | | | | 6,363,285 | |
Aramark Services Incorporated (1 Month LIBOR +2.00%) ± | | | 3.65 | | | | 3-11-2025 | | | | 6,360,000 | | | | 6,397,778 | |
The accompanying notes are an integral part of these financial statements.
| | | | |
| 12 | | Wells Fargo Short-Term High Yield Bond Fund | | Portfolio of investments—February 28, 2018 (unaudited) |
| | | | | | | | | | | | | | | | |
| Security name | | Interest rate | | | Maturity date | | | Principal | | | Value | |
| | | |
| Commercial Services & Supplies (continued) | | | | | | | | | | | | | |
KAR Auction Services Incorporated (3 Month LIBOR +2.25%) ± | | | 4.00 | % | | | 3-11-2021 | | | $ | 13,324,083 | | | $ | 13,403,228 | |
Sensata Technologies BV (1 Month LIBOR +1.75%) ± | | | 3.33 | | | | 10-14-2021 | | | | 4,187,303 | | | | 4,209,537 | |
| | | | |
| | | | | | | | | | | | | | | 43,047,277 | |
| | | | | | | | | | | | | | | | |
| | | |
| Communications Equipment: 2.89% | | | | | | | | | | | | | |
Charter Communications Operating LLC (1 Month LIBOR +2.00%) ± | | | 3.65 | | | | 4-30-2025 | | | | 19,115,000 | | | | 19,150,936 | |
Virgin Media Bristol LLC (1 Month LIBOR +2.50%) ± | | | 4.09 | | | | 1-15-2026 | | | | 16,465,000 | | | | 16,517,523 | |
| | | | |
| | | | | | | | | | | | | | | 35,668,459 | |
| | | | | | | | | | | | | | | | |
| | | |
| Machinery: 1.14% | | | | | | | | | | | | | |
Columbus Mckinnon Corporation (3 Month LIBOR +3.00%) ±‡ | | | 4.62 | | | | 1-31-2024 | | | | 6,514,143 | | | | 6,534,532 | |
RBS Global Incorporated (1 Month LIBOR +2.25%) ± | | | 3.85 | | | | 8-21-2024 | | | | 7,400,000 | | | | 7,443,512 | |
| | | | |
| | | | | | | | | | | | | | | 13,978,044 | |
| | | | | | | | | | | | | | | | |
| | | | |
Information Technology: 3.49% | | | | | | | | | | | | | | | | |
| | | |
| Communications Equipment: 0.50% | | | | | | | | | | | | | |
CommScope Incorporated (1 Month LIBOR +2.00%) ± | | | 3.65 | | | | 12-29-2022 | | | | 6,123,917 | | | | 6,154,536 | |
| | | | | | | | | | | | | | | | |
| | | |
| Electronic Equipment, Instruments & Components: 0.90% | | | | | | | | | | | | | |
Dell Incorporated (1 Month LIBOR +2.00%) ± | | | 3.65 | | | | 9-7-2023 | | | | 2,667,574 | | | | 2,667,014 | |
Zebra Technologies Corporation (3 Month LIBOR +2.00%) ± | | | 3.75 | | | | 10-27-2021 | | | | 8,318,816 | | | | 8,356,500 | |
| | | | |
| | | | | | | | | | | | | | | 11,023,514 | |
| | | | | | | | | | | | | | | | |
| | | | |
| Internet Software & Services: 0.80% | | | | | | | | | | | | | | | | |
Zayo Group LLC (1 Month LIBOR +2.25%) ± | | | 3.87 | | | | 1-19-2024 | | | | 9,837,884 | | | | 9,879,203 | |
| | | | | | | | | | | | | | | | |
| | | | |
| IT Services: 1.04% | | | | | | | | | | | | | | | | |
First Data Corporation (1 Month LIBOR +2.25%) ± | | | 3.87 | | | | 7-8-2022 | | | | 12,826,685 | | | | 12,847,079 | |
| | | | | | | | | | | | | | | | |
| | | | |
| Semiconductors & Semiconductor Equipment: 0.25% | | | | | | | | | | | | | | | | |
Micron Technology Incorporated (1 Month LIBOR +2.00%) ± | | | 3.65 | | | | 4-26-2022 | | | | 3,095,714 | | | | 3,112,307 | |
| | | | | | | | | | | | | | | | |
| | | |
Materials: 3.63% | | | | | | | | | | | | | |
| | | | |
| Chemicals: 1.78% | | | | | | | | | | | | | | | | |
Ashland LLC (3 Month LIBOR +2.00%) ± | | | 3.60 | | | | 5-24-2024 | | | | 5,716,275 | | | | 5,747,257 | |
Ineos US Finance LLC (1 Month LIBOR +2.00%) ± | | | 3.65 | | | | 3-31-2024 | | | | 16,219,074 | | | | 16,257,838 | |
| | | | |
| | | | | | | | | | | | | | | 22,005,095 | |
| | | | | | | | | | | | | | | | |
| | | | |
| Containers & Packaging: 1.85% | | | | | | | | | | | | | | | | |
Berry Plastics Corporation (1 Month LIBOR +2.00%) ± | | | 3.58 | | | | 2-8-2020 | | | | 12,407,843 | | | | 12,454,373 | |
Reynolds Group Holdings Incorporated (1 Month LIBOR +2.75%) ± | | | 4.40 | | | | 2-5-2023 | | | | 10,283,311 | | | | 10,328,351 | |
| | | | |
| | | | | | | | | | | | | | | 22,782,724 | |
| | | | | | | | | | | | | | | | |
| | | |
Real Estate: 1.28% | | | | | | | | | | | | | |
| | | | |
| Equity REITs: 1.28% | | | | | | | | | | | | | | | | |
MGM Growth Properties LLC (1 Month LIBOR +2.25%) ± | | | 3.90 | | | | 4-25-2023 | | | | 15,734,282 | | | | 15,798,163 | |
| | | | | | | | | | | | | | | | |
The accompanying notes are an integral part of these financial statements.
| | | | | | |
| Portfolio of investments—February 28, 2018 (unaudited) | | Wells Fargo Short-Term High Yield Bond Fund | | | 13 | |
| | | | | | | | | | | | | | | | |
| Security name | | Interest rate | | | Maturity date | | | Principal | | | Value | |
| | | |
Telecommunication Services: 2.42% | | | | | | | | | | | | | |
| | | | |
| Diversified Telecommunication Services: 1.24% | | | | | | | | | | | | | | | | |
Level 3 Financing Incorporated (1 Month LIBOR +2.25%) ± | | | 3.85 | % | | | 2-22-2024 | | | $ | 15,258,850 | | | $ | 15,282,196 | |
| | | | | | | | | | | | | | | | |
| | | | |
| Wireless Telecommunication Services: 1.18% | | | | | | | | | | | | | | | | |
SBA Communications Corporation (1 Month LIBOR +2.25%) ± | | | 3.90 | | | | 3-24-2021 | | | | 14,475,000 | | | | 14,529,281 | |
| | | | | | | | | | | | | | | | |
| | | |
Total Loans (Cost $387,926,622) | | | | | | | | | | | | 388,040,513 | |
| | | | | | | | | | | | | | | | |
| | | | |
Non-Agency Mortgage-Backed Securities: 0.00% | | | | | | | | | | | | | | | | |
Salomon Brothers Mortgage Securities VII Series 1994-5 Class B2 ±± | | | 3.85 | | | | 4-25-2024 | | | | 29,190 | | | | 25,878 | |
| | | | | | | | | | | | | | | | |
| | | |
Total Non-Agency Mortgage-Backed Securities (Cost $28,908) | | | | | | | | | | | | 25,878 | |
| | | | | | | | | | | | | | | | |
| | | | |
Yankee Corporate Bonds and Notes: 8.70% | | | | | | | | | | | | | | | | |
| | | |
Consumer Discretionary: 2.58% | | | | | | | | | | | | | |
| | | | |
| Auto Components: 0.40% | | | | | | | | | | | | | | | | |
IHO Verwaltungs GmbH 144A | | | 4.13 | | | | 9-15-2021 | | | | 4,960,000 | | | | 4,947,600 | |
| | | | | | | | | | | | | | | | |
| | | | |
| Automobiles: 1.08% | | | | | | | | | | | | | | | | |
Jaguar Land Rover Automotive plc 144A | | | 4.13 | | | | 12-15-2018 | | | | 13,235,000 | | | | 13,284,631 | |
| | | | | | | | | | | | | | | | |
| | | | |
| Hotels, Restaurants & Leisure: 1.10% | | | | | | | | | | | | | | | | |
International Game Technology plc 144A | | | 5.63 | | | | 2-15-2020 | | | | 13,120,000 | | | | 13,513,600 | |
| | | | | | | | | | | | | | | | |
| | | |
Financials: 1.98% | | | | | | | | | | | | | |
| | | | |
| Banks: 1.97% | | | | | | | | | | | | | | | | |
Nielsen Holding and Finance BV 144A | | | 5.50 | | | | 10-1-2021 | | | | 16,670,000 | | | | 17,045,075 | |
Royal Bank of Scotland Group plc | | | 4.70 | | | | 7-3-2018 | | | | 7,240,000 | | | | 7,284,295 | |
| | | | |
| | | | | | | | | | | | | | | 24,329,370 | |
| | | | | | | | | | | | | | | | |
| | | |
| Diversified Financial Services: 0.01% | | | | | | | | | | | | | |
Virgin Media Finance plc | | | 5.25 | | | | 1-15-2021 | | | | 75,000 | | | | 77,625 | |
| | | | | | | | | | | | | | | | |
| | | |
Health Care: 2.88% | | | | | | | | | | | | | |
| | | | |
| Pharmaceuticals: 2.88% | | | | | | | | | | | | | | | | |
Mallinckrodt International Finance SA | | | 3.50 | | | | 4-15-2018 | | | | 14,745,000 | | | | 14,634,413 | |
Teva Pharmaceuticals Industries Incorporated | | | 1.70 | | | | 7-19-2019 | | | | 13,458,000 | | | | 13,131,655 | |
Valeant Pharmaceuticals International Incorporated 144A | | | 6.50 | | | | 3-15-2022 | | | | 7,415,000 | | | | 7,711,600 | |
| | | | |
| | | | | | | | | | | | | | | 35,477,668 | |
| | | | | | | | | | | | | | | | |
| | | |
Information Technology: 0.41% | | | | | | | | | | | | | |
| | | | |
| Communications Equipment: 0.25% | | | | | | | | | | | | | | | | |
Nokia Corporation | | | 5.38 | | | | 5-15-2019 | | | | 3,094,000 | | | | 3,164,512 | |
| | | | | | | | | | | | | | | | |
| | | |
| Semiconductors & Semiconductor Equipment: 0.16% | | | | | | | | | | | | | |
NXP BV/NXP Funding LLC 144A | | | 4.13 | | | | 6-15-2020 | | | | 1,900,000 | | | | 1,933,250 | |
| | | | | | | | | | | | | | | | |
The accompanying notes are an integral part of these financial statements.
| | | | |
| 14 | | Wells Fargo Short-Term High Yield Bond Fund | | Portfolio of investments—February 28, 2018 (unaudited) |
| | | | | | | | | | | | | | | | |
| Security name | | Interest rate | | | Maturity date | | | Principal | | | Value | |
| | | |
Materials: 0.85% | | | | | | | | | | | | | |
| | | | |
| Metals & Mining: 0.85% | | | | | | | | | | | | | | | | |
ArcelorMittal SA | | | 6.00 | % | | | 3-1-2021 | | | $ | 9,970,000 | | | $ | 10,468,500 | |
| | | | | | | | | | | | | | | | |
| | | |
Total Yankee Corporate Bonds and Notes (Cost $108,406,170) | | | | | | | | | | | | 107,196,756 | |
| | | | | | | | | | | | | | | | |
| | | | |
| | | Yield | | | | | | Shares | | | | |
| Short-Term Investments: 3.97% | | | | | | | | | | | | | |
| | | | |
| Investment Companies: 3.97% | | | | | | | | | | | | | | | | |
Wells Fargo Government Money Market Fund Select Class (l)(u) | | | 1.29 | | | | | | | | 48,942,578 | | | | 48,942,578 | |
| | | | | | | | | | | | | | | | |
| | | |
Total Short-Term Investments (Cost $48,942,578) | | | | | | | | | | | | 48,942,578 | |
| | | | | | | | | | | | | | | | |
| | | | | | | | |
| Total investments in securities (Cost $1,248,480,064) | | | 100.62 | % | | | 1,240,207,425 | |
Other assets and liabilities, net | | | (0.62 | ) | | | (7,599,614 | ) |
| | | | | | | | |
| Total net assets | | | 100.00 | % | | $ | 1,232,607,811 | |
| | | | | | | | |
| 144A | The security may be resold in transactions exempt from registration, normally to qualified institutional buyers, pursuant to Rule 144A under the Securities Act of 1933. |
| ± | Variable rate investment. The rate shown is the rate in effect at period end. |
| ‡ | Security is valued using significant unobservable inputs. |
| ±± | The coupon of the security is adjusted based on the principal and interest payments received from the underlying pool of mortgages as well as the credit quality and the actual prepayment speed of the underlying mortgages. |
| (l) | The issuer of the security is an affiliated person of the Fundo as defined in the Investment Company Act of 1940. |
| (u) | The rate represents the 7-day annualized yield at period end. |
Investments In Affiliates
An affiliated investment is an investment in which the Fund owns at least 5% of the outstanding voting shares of the issuer or as a result of the Fund and the issuer having the same investment manager. Transactions with issuers that were either affiliates of the Fund at the beginning of the period or the end of the period were as follows:
| | | | | | | | | | | | | | | | | | | | | | | | | | | | | | | | | | | | |
| | | Shares, beginning of period | | | Shares purchased | | | Shares sold | | | Shares, end of period | | | Net realized gains
(losses) | | | Net change in unrealized gains (losses) | | | Income from affiliated securities | | | Value, end of period | | | % of net assets | |
Short-Term Investment | | | | | | | | | | | | | | | | | | | | | | | | | | | | | | | | | | | | |
Investment Companies | | | | | | | | | | | | | | | | | | | | | | | | | | | | | | | | | | | | |
Securities Lending Cash Investment LLC * | | | 25,070,746 | | | | 10,225,900 | | | | 35,296,646 | | | | 0 | | | $ | 513 | | | $ | (513 | ) | | $ | 38,115 | | | | | | | | | |
Wells Fargo Government Money Market Fund Select Class | | | 69,795,859 | | | | 417,055,674 | | | | 437,908,955 | | | | 48,942,578 | | | | 0 | | | | 0 | | | | 353,875 | | | $ | 48,942,578 | | | | | |
| | | | | | | | | | | | | | | | | | | | | | | | | | | | | | | | | | | | |
| | | | | | | | | | | | | | | | | | $ | 513 | | | $ | (513 | ) | | $ | 391,990 | | | $ | 48,942,578 | | | | 3.97 | % |
| | | | | | | | | | | | | | | | | | | | | | | | | | | | | | | | | | | | |
| | * | No longer held at the end of the period. |
The accompanying notes are an integral part of these financial statements.
| | | | | | |
| Statement of assets and liabilities—February 28, 2018 (unaudited) | | Wells Fargo Short-Term High Yield Bond Fund | | | 15 | |
| | | | |
| | | | |
|
Assets | |
Investments in unaffiliated securities, at value (cost $1,199,537,486) | | $ | 1,191,264,847 | |
Investment in affiliated securities, at value (cost $48,942,578) | | | 48,942,578 | |
Cash | | | 452 | |
Receivable for investments sold | | | 23,619,281 | |
Receivable for Fund shares sold | | | 1,182,528 | |
Receivable for interest | | | 11,873,030 | |
Receivable for securities lending income | | | 336 | |
Prepaid expenses and other assets | | | 58,446 | |
| | | | |
Total assets | | | 1,276,941,498 | |
| | | | |
|
Liabilities | |
Payable for Fund shares redeemed | | | 43,049,502 | |
Dividends payable | | | 522,765 | |
Management fee payable | | | 376,290 | |
Administration fees payable | | | 97,394 | |
Distribution fee payable | | | 53,100 | |
Trustees’ fees and expenses payable | | | 2,297 | |
Accrued expenses and other liabilities | | | 232,339 | |
| | | | |
Total liabilities | | | 44,333,687 | |
| | | | |
Total net assets | | $ | 1,232,607,811 | |
| | | | |
|
NET ASSETS CONSIST OF | |
Paid-in capital | | $ | 1,274,308,256 | |
Undistributed net investment income | | | 16 | |
Accumulated net realized losses on investments | | | (33,427,822 | ) |
Net unrealized losses on investments | | | (8,272,639 | ) |
| | | | |
Total net assets | | $ | 1,232,607,811 | |
| | | | |
|
COMPUTATION OF NET ASSET VALUE AND OFFERING PRICE PER SHARE | |
Net assets – Class A | | $ | 147,454,463 | |
Shares outstanding – Class A1 | | | 18,410,996 | |
Net asset value per share – Class A | | | $8.01 | |
Maximum offering price per share – Class A2 | | | $8.26 | |
Net assets – Class C | | $ | 91,009,621 | |
Shares outstanding – Class C1 | | | 11,359,569 | |
Net asset value per share – Class C | | | $8.01 | |
Net assets – Administrator Class | | $ | 109,092,596 | |
Shares outstanding – Administrator Class1 | | | 13,621,764 | |
Net asset value per share – Administrator Class | | | $8.01 | |
Net assets – Institutional Class | | $ | 885,051,131 | |
Shares outstanding – Institutional Class1 | | | 110,655,430 | |
Net asset value per share – Institutional Class | | | $8.00 | |
| 1 | The Fund has an unlimited number of authorized shares. |
| 2 | Maximum offering price is computed as 100/97 of net asset value. On investments of $50,000 or more, the offering price is reduced. |
The accompanying notes are an integral part of these financial statements.
| | | | |
| 16 | | Wells Fargo Short-Term High Yield Bond Fund | | Statement of operations—six months ended February 28, 2018 (unaudited) |
| | | | |
| | | | |
| |
Investment income | | | | |
Interest | | $ | 25,189,203 | |
Income from affiliated securities | | | 391,990 | |
| | | | |
Total investment income | | | 25,581,193 | |
| | | | |
| |
Expenses | | | | |
Management fee | | | 3,299,035 | |
Administration fees | |
Class A | | | 128,296 | |
Class C | | | 80,266 | |
Administrator Class | | | 57,546 | |
Institutional Class | | | 403,118 | |
Shareholder servicing fees | |
Class A | | | 200,463 | |
Class C | | | 125,416 | |
Administrator Class | | | 141,401 | |
Distribution fee | |
Class C | | | 376,249 | |
Custody and accounting fees | | | 49,384 | |
Professional fees | | | 25,583 | |
Registration fees | | | 68,016 | |
Shareholder report expenses | | | 56,458 | |
Trustees’ fees and expenses | | | 11,314 | |
Other fees and expenses | | | 12,411 | |
| | | | |
Total expenses | | | 5,034,956 | |
Less: Fee waivers and/or expense reimbursements | | | (709,323 | ) |
| | | | |
Net expenses | | | 4,325,633 | |
| | | | |
Net investment income | | | 21,255,560 | |
| | | | |
| |
REALIZED AND UNREALIZED GAINS (LOSSES) ON INVESTMENTS | | | | |
| |
Net realized gains (losses) on: | | | | |
Unaffiliated securities | | | (1,922,231 | ) |
Affiliated securities | | | 513 | |
| | | | |
Net realized losses on investments | | | (1,921,718 | ) |
| | | | |
|
Net change in unrealized gains (losses) on: | |
Unaffiliated securities | | | (8,453,152 | ) |
Affiliated securities | | | (513 | ) |
| | | | |
Net change in unrealized gains (losses) on investments | | | (8,453,665 | ) |
| | | | |
Net realized and unrealized gains (losses) on investments | | | (10,375,383 | ) |
| | | | |
Net increase in net assets resulting from operations | | $ | 10,880,177 | |
| | | | |
The accompanying notes are an integral part of these financial statements.
| | | | | | |
| Statement of changes in net assets | | Wells Fargo Short-Term High Yield Bond Fund | | | 17 | |
| | | | | | | | | | | | | | | | |
| | | Six months ended
February 28, 2018
(unaudited) | | | Year ended
August 31, 2017 | |
| |
Operations | | | | | |
Net investment income | | | | | | $ | 21,255,560 | | | | | | | $ | 43,836,738 | |
Net realized gains (losses) on investments | | | | | | | (1,921,718 | ) | | | | | | | 802,646 | |
Net change in unrealized gains (losses) on investments | | | | | | | (8,453,665 | ) | | | | | | | (6,629,131 | ) |
| | | | |
Net increase in net assets resulting from operations | | | | | | | 10,880,177 | | | | | | | | 38,010,253 | |
| | | | |
| |
Distributions to shareholders from | | | | | |
Net investment income | |
Class A | | | | | | | (2,314,358 | ) | | | | | | | (6,731,705 | ) |
Class C | | | | | | | (1,071,921 | ) | | | | | | | (2,509,379 | ) |
Administrator Class | | | | | | | (1,751,526 | ) | | | | | | | (6,042,398 | ) |
Institutional Class | | | | | | | (16,117,758 | ) | | | | | | | (28,553,188 | ) |
| | | | |
Total distributions to shareholders | | | | | | | (21,255,563 | ) | | | | | | | (43,836,670 | ) |
| | | | |
| | | | |
Capital share transactions | | | Shares | | | | | | | | Shares | | | | | |
Proceeds from shares sold | | | | | | | | | | | | | | | | |
Class A | | | 1,838,211 | | | | 14,796,625 | | | | 8,218,727 | | | | 66,450,237 | |
Class C | | | 503,799 | | | | 4,057,682 | | | | 2,295,200 | | | | 18,559,388 | |
Administrator Class | | | 1,706,665 | | | | 13,721,832 | | | | 10,857,614 | | | | 87,797,670 | |
Institutional Class | | | 24,592,916 | | | | 197,691,925 | | | | 70,215,763 | | | | 566,574,238 | |
| | | | |
| | | | | | | 230,268,064 | | | | | | | | 739,381,533 | |
| | | | |
Reinvestment of distributions | |
Class A | | | 276,665 | | | | 2,226,352 | | | | 809,709 | | | | 6,545,416 | |
Class C | | | 130,030 | | | | 1,046,593 | | | | 300,002 | | | | 2,425,528 | |
Administrator Class | | | 207,075 | | | | 1,666,380 | | | | 692,079 | | | | 5,593,836 | |
Institutional Class | | | 1,637,895 | | | | 13,162,998 | | | | 2,812,373 | | | | 22,702,333 | |
| | | | |
| | | | | | | 18,102,323 | | | | | | | | 37,267,113 | |
| | | | |
Payment for shares redeemed | |
Class A | | | (5,039,837 | ) | | | (40,539,564 | ) | | | (24,321,739 | ) | | | (196,820,631 | ) |
Class C | | | (3,059,920 | ) | | | (24,640,230 | ) | | | (4,080,018 | ) | | | (32,986,378 | ) |
Administrator Class | | | (4,909,142 | ) | | | (39,551,043 | ) | | | (28,866,091 | ) | | | (232,943,723 | ) |
Institutional Class | | | (41,008,909 | ) | | | (328,903,666 | ) | | | (38,479,828 | ) | | | (310,549,066 | ) |
| | | | |
| | | | | | | (433,634,503 | ) | | | | | | | (773,299,798 | ) |
| | | | |
Net increase (decrease) in net assets resulting from capital share transactions | | | | | | | (185,264,116 | ) | | | | | | | 3,348,848 | |
| | | | |
Total decrease in net assets | | | | | | | (195,639,502 | ) | | | | | | | (2,477,569 | ) |
| | | | |
| | |
Net assets | | | | | | | | |
Beginning of period | | | | | | | 1,428,247,313 | | | | | | | | 1,430,724,882 | |
| | | | |
End of period | | | | | | $ | 1,232,607,811 | | | | | | | $ | 1,428,247,313 | |
| | | | |
Undistributed net investment income | | | | | | $ | 16 | | | | | | | $ | 19 | |
| | | | |
The accompanying notes are an integral part of these financial statements.
| | | | |
| 18 | | Wells Fargo Short-Term High Yield Bond Fund | | Financial highlights |
(For a share outstanding throughout each period)
| | | | | | | | | | | | | | | | | | | | | | | | |
| | | Six months ended
February 28, 2018 (unaudited) | | | Year ended August 31 | |
| CLASS A | | | 2017 | | | 2016 | | | 2015 | | | 2014 | | | 2013 | |
Net asset value, beginning of period | | | $8.07 | | | | $8.10 | | | | $8.07 | | | | $8.20 | | | | $8.21 | | | | $8.26 | |
Net investment income | | | 0.12 | 1 | | | 0.23 | | | | 0.24 | | | | 0.25 | | | | 0.27 | | | | 0.31 | |
Net realized and unrealized gains (losses) on investments | | | (0.06 | ) | | | (0.03 | ) | | | 0.03 | | | | (0.13 | ) | | | 0.01 | | | | (0.05 | ) |
| | | | | | | | | | | | | | | | | | | | | | | | |
Total from investment operations | | | 0.06 | | | | 0.20 | | | | 0.27 | | | | 0.12 | | | | 0.28 | | | | 0.26 | |
Distributions to shareholders from | | | | | | | | | | | | | | | | | | | | | | | | |
Net investment income | | | (0.12 | ) | | | (0.23 | ) | | | (0.24 | ) | | | (0.25 | ) | | | (0.27 | ) | | | (0.31 | ) |
Net realized gains | | | 0.00 | | | �� | 0.00 | | | | 0.00 | | | | 0.00 | | | | (0.02 | ) | | | (0.00 | )2 |
| | | | | | | | | | | | | | | | | | | | | | | | |
Total distributions to shareholders | | | (0.12 | ) | | | (0.23 | ) | | | (0.24 | ) | | | (0.25 | ) | | | (0.29 | ) | | | (0.31 | ) |
Net asset value, end of period | | | $8.01 | | | | $8.07 | | | | $8.10 | | | | $8.07 | | | | $8.20 | | | | $8.21 | |
Total return3 | | | 0.69 | % | | | 2.51 | % | | | 3.37 | % | | | 1.46 | % | | | 3.40 | % | | | 3.17 | % |
Ratios to average net assets (annualized) | | | | | | | | | | | | | | | | | | | | | | | | |
Gross expenses | | | 0.92 | % | | | 0.92 | % | | | 0.92 | % | | | 0.92 | % | | | 0.91 | % | | | 0.94 | % |
Net expenses | | | 0.81 | % | | | 0.81 | % | | | 0.81 | % | | | 0.81 | % | | | 0.81 | % | | | 0.81 | % |
Net investment income | | | 2.89 | % | | | 2.88 | % | | | 2.95 | % | | | 3.11 | % | | | 3.27 | % | | | 3.73 | % |
Supplemental data | | | | | | | | | | | | | | | | | | | | | | | | |
Portfolio turnover rate | | | 25 | % | | | 35 | % | | | 32 | % | | | 40 | % | | | 28 | % | | | 33 | % |
Net assets, end of period (000s omitted) | | | $147,454 | | | | $172,151 | | | | $296,817 | | | | $203,856 | | | | $276,436 | | | | $285,726 | |
| 1 | Calculated based upon shares outstanding |
| 2 | Amount is less than $0.005. |
| 3 | Total return calculations do not include any sales charges. Returns for periods of less than one year are not annualized. |
The accompanying notes are an integral part of these financial statements.
| | | | | | |
| Financial highlights | | Wells Fargo Short-Term High Yield Bond Fund | | | 19 | |
(For a share outstanding throughout each period)
| | | | | | | | | | | | | | | | | | | | | | | | |
| | | Six months ended
February 28, 2018 (unaudited) | | | Year ended August 31 | |
| CLASS C | | | 2017 | | | 2016 | | | 2015 | | | 2014 | | | 2013 | |
Net asset value, beginning of period | | | $8.07 | | | | $8.10 | | | | $8.07 | | | | $8.20 | | | | $8.21 | | | | $8.26 | |
Net investment income | | | 0.09 | | | | 0.17 | | | | 0.18 | | | | 0.19 | | | | 0.21 | | | | 0.25 | |
Net realized and unrealized gains (losses) on investments | | | (0.06 | ) | | | (0.03 | ) | | | 0.03 | | | | (0.13 | ) | | | 0.01 | | | | (0.06 | ) |
| | | | | | | | | | | | | | | | | | | | | | | | |
Total from investment operations | | | 0.03 | | | | 0.14 | | | | 0.21 | | | | 0.06 | | | | 0.22 | | | | 0.19 | |
Distributions to shareholders from | | | | | | | | | | | | | | | | | | | | | | | | |
Net investment income | | | (0.09 | ) | | | (0.17 | ) | | | (0.18 | ) | | | (0.19 | ) | | | (0.21 | ) | | | (0.24 | ) |
Net realized gains | | | 0.00 | | | | 0.00 | | | | 0.00 | | | | 0.00 | | | | (0.02 | ) | | | (0.00 | )1 |
| | | | | | | | | | | | | | | | | | | | | | | | |
Total distributions to shareholders | | | (0.09 | ) | | | (0.17 | ) | | | (0.18 | ) | | | (0.19 | ) | | | (0.23 | ) | | | (0.24 | ) |
Net asset value, end of period | | | $8.01 | | | | $8.07 | | | | $8.10 | | | | $8.07 | | | | $8.20 | | | | $8.21 | |
Total return2 | | | 0.32 | % | | | 1.75 | % | | | 2.60 | % | | | 0.70 | % | | | 2.62 | % | | | 2.40 | % |
Ratios to average net assets (annualized) | | | | | | | | | | | | | | | | | | | | | | | | |
Gross expenses | | | 1.67 | % | | | 1.67 | % | | | 1.67 | % | | | 1.67 | % | | | 1.66 | % | | | 1.69 | % |
Net expenses | | | 1.56 | % | | | 1.56 | % | | | 1.56 | % | | | 1.56 | % | | | 1.56 | % | | | 1.56 | % |
Net investment income | | | 2.14 | % | | | 2.11 | % | | | 2.20 | % | | | 2.36 | % | | | 2.52 | % | | | 2.98 | % |
Supplemental data | | | | | | | | | | | | | | | | | | | | | | | | |
Portfolio turnover rate | | | 25 | % | | | 35 | % | | | 32 | % | | | 40 | % | | | 28 | % | | | 33 | % |
Net assets, end of period (000s omitted) | | | $91,010 | | | | $111,268 | | | | $123,745 | | | | $123,521 | | | | $143,444 | | | | $133,379 | |
| 1 | Amount is less than $0.005. |
| 2 | Total return calculations do not include any sales charges. Returns for periods of less than one year are not annualized. |
The accompanying notes are an integral part of these financial statements.
| | | | |
| 20 | | Wells Fargo Short-Term High Yield Bond Fund | | Financial highlights |
(For a share outstanding throughout each period)
| | | | | | | | | | | | | | | | | | | | | | | | |
| | | Six months ended
February 28, 2018 (unaudited) | | | Year ended August 31 | |
| ADMINISTRATOR CLASS | | | 2017 | | | 2016 | | | 2015 | | | 2014 | | | 2013 | |
Net asset value, beginning of period | | | $8.07 | | | | $8.10 | | | | $8.07 | | | | $8.20 | | | | $8.20 | | | | $8.26 | |
Net investment income | | | 0.12 | | | | 0.24 | | | | 0.25 | | | | 0.26 | | | | 0.28 | | | | 0.32 | |
Net realized and unrealized gains (losses) on investments | | | (0.06 | ) | | | (0.03 | ) | | | 0.03 | | | | (0.13 | ) | | | 0.02 | | | | (0.06 | ) |
| | | | | | | | | | | | | | | | | | | | | | | | |
Total from investment operations | | | 0.06 | | | | 0.21 | | | | 0.28 | | | | 0.13 | | | | 0.30 | | | | 0.26 | |
Distributions to shareholders from | | | | | | | | | | | | | | | | | | | | | | | | |
Net investment income | | | (0.12 | ) | | | (0.24 | ) | | | (0.25 | ) | | | (0.26 | ) | | | (0.28 | ) | | | (0.32 | ) |
Net realized gains | | | 0.00 | | | | 0.00 | | | | 0.00 | | | | 0.00 | | | | (0.02 | ) | | | (0.00 | )1 |
| | | | | | | | | | | | | | | | | | | | | | | | |
Total distributions to shareholders | | | (0.12 | ) | | | (0.24 | ) | | | (0.25 | ) | | | (0.26 | ) | | | (0.30 | ) | | | (0.32 | ) |
Net asset value, end of period | | | $8.01 | | | | $8.07 | | | | $8.10 | | | | $8.07 | | | | $8.20 | | | | $8.20 | |
Total return2 | | | 0.77 | % | | | 2.68 | % | | | 3.54 | % | | | 1.62 | % | | | 3.69 | % | | | 3.21 | % |
Ratios to average net assets (annualized) | | | | | | | | | | | | | | | | | | | | | | | | |
Gross expenses | | | 0.85 | % | | | 0.86 | % | | | 0.86 | % | | | 0.85 | % | | | 0.84 | % | | | 0.87 | % |
Net expenses | | | 0.65 | % | | | 0.65 | % | | | 0.65 | % | | | 0.65 | % | | | 0.65 | % | | | 0.65 | % |
Net investment income | | | 3.04 | % | | | 3.03 | % | | | 3.11 | % | | | 3.28 | % | | | 3.44 | % | | | 3.89 | % |
Supplemental data | | | | | | | | | | | | | | | | | | | | | | | | |
Portfolio turnover rate | | | 25 | % | | | 35 | % | | | 32 | % | | | 40 | % | | | 28 | % | | | 33 | % |
Net assets, end of period (000s omitted) | | | $109,093 | | | | $134,070 | | | | $274,878 | | | | $328,934 | | | | $509,059 | | | | $550,981 | |
| 1 | Amount is less than $0.005. |
| 2 | Returns for periods of less than one year are not annualized. |
The accompanying notes are an integral part of these financial statements.
| | | | | | |
| Financial highlights | | Wells Fargo Short-Term High Yield Bond Fund | | | 21 | |
(For a share outstanding throughout each period)
| | | | | | | | | | | | | | | | | | | | | | | | |
| | | Six months ended
February 28, 2018 (unaudited) | | | Year ended August 31 | |
| INSTITUTIONAL CLASS | | | 2017 | | | 2016 | | | 2015 | | | 2014 | | | 20131 | |
Net asset value, beginning of period | | | $8.06 | | | | $8.09 | | | | $8.06 | | | | $8.18 | | | | $8.19 | | | | $8.28 | |
Net investment income | | | 0.13 | | | | 0.25 | | | | 0.26 | | | | 0.28 | | | | 0.29 | | | | 0.25 | |
Net realized and unrealized gains (losses) on investments | | | (0.06 | ) | | | (0.02 | ) | | | 0.03 | | | | (0.13 | ) | | | 0.01 | | | | (0.09 | ) |
| | | | | | | | | | | | | | | | | | | | | | | | |
Total from investment operations | | | 0.07 | | | | 0.23 | | | | 0.29 | | | | 0.15 | | | | 0.30 | | | | 0.16 | |
Distributions to shareholders from | | | | | | | | | | | | | | | | | | | | | | | | |
Net investment income | | | (0.13 | ) | | | (0.26 | ) | | | (0.26 | ) | | | (0.27 | ) | | | (0.29 | ) | | | (0.25 | ) |
Net realized gains | | | 0.00 | | | | 0.00 | | | | 0.00 | | | | 0.00 | | | | (0.02 | ) | | | (0.00 | )2 |
| | | | | | | | | | | | | | | | | | | | | | | | |
Total distributions to shareholders | | | (0.13 | ) | | | (0.26 | ) | | | (0.26 | ) | | | (0.27 | ) | | | (0.31 | ) | | | (0.25 | ) |
Net asset value, end of period | | | $8.00 | | | | $8.06 | | | | $8.09 | | | | $8.06 | | | | $8.18 | | | | $8.19 | |
Total return3 | | | 0.84 | % | | | 2.83 | % | | | 3.69 | % | | | 1.90 | % | | | 3.72 | % | | | 1.92 | % |
Ratios to average net assets (annualized) | | | | | | | | | | | | | | | | | | | | | | | | |
Gross expenses | | | 0.59 | % | | | 0.59 | % | | | 0.59 | % | | | 0.59 | % | | | 0.58 | % | | | 0.60 | % |
Net expenses | | | 0.50 | % | | | 0.50 | % | | | 0.50 | % | | | 0.50 | % | | | 0.50 | % | | | 0.50 | % |
Net investment income | | | 3.20 | % | | | 3.16 | % | | | 3.26 | % | | | 3.40 | % | | | 3.58 | % | | | 4.05 | % |
Supplemental data | | | | | | | | | | | | | | | | | | | | | | | | |
Portfolio turnover rate | | | 25 | % | | | 35 | % | | | 32 | % | | | 40 | % | | | 28 | % | | | 33 | % |
Net assets, end of period (000s omitted) | | | $885,051 | | | | $1,010,757 | | | | $735,285 | | | | $608,704 | | | | $540,824 | | | | $211,642 | |
| 1 | For the period from November 30, 2012 (commencement of class operations) to August 31, 2013 |
| 2 | Amount is less than $0.005. |
| 3 | Returns for periods of less than one year are not annualized. |
The accompanying notes are an integral part of these financial statements.
| | | | |
| 22 | | Wells Fargo Short-Term High Yield Bond Fund | | Notes to financial statements (unaudited) |
1. ORGANIZATION
Wells Fargo Funds Trust (the “Trust”), a Delaware statutory trust organized on March 10, 1999, is an open-end management investment company registered under the Investment Company Act of 1940, as amended (the “1940 Act”). As an investment company, the Trust follows the accounting and reporting guidance in Financial Accounting Standards Board Accounting Standards Codification Topic 946, Financial Services – Investment Companies. These financial statements report on the Wells Fargo Short-Term High Yield Bond Fund (the “Fund”) which is a diversified series of the Trust.
2. SIGNIFICANT ACCOUNTING POLICIES
The following significant accounting policies, which are consistently followed in the preparation of the financial statements of the Fund, are in conformity with U.S. generally accepted accounting principles which require management to make estimates and assumptions that affect the reported amounts of assets and liabilities, disclosure of contingent assets and liabilities at the date of the financial statements, and the reported amounts of revenues and expenses during the reporting period. Actual results could differ from those estimates.
Securities valuation
All investments are valued each business day as of the close of regular trading on the New York Stock Exchange (generally 4 p.m. Eastern Time), although the Fund may deviate from this calculation time under unusual or unexpected circumstances.
Debt securities are valued at the evaluated bid price provided by an independent pricing service or, if a reliable price is not available, the quoted bid price from an independent broker-dealer.
Investments in registered open-end investment companies are valued at net asset value. Interests in non-registered investment companies that are redeemable at net asset value are fair valued normally at net asset value.
Investments which are not valued using any of the methods discussed above are valued at their fair value, as determined in good faith by the Board of Trustees of the Fund. The Board of Trustees has established a Valuation Committee comprised of the Trustees and has delegated to it the authority to take any actions regarding the valuation of portfolio securities that the Valuation Committee deems necessary or appropriate, including determining the fair value of portfolio securities, unless the determination has been delegated to the Wells Fargo Asset Management Pricing Committee at Wells Fargo Funds Management, LLC (“Funds Management”). The Board of Trustees retains the authority to make or ratify any valuation decisions or approve any changes to the Valuation Procedures as it deems appropriate. On a quarterly basis, the Board of Trustees receives reports on any valuation actions taken by the Valuation Committee or the Wells Fargo Asset Management Pricing Committee which may include items for ratification.
Valuations of fair valued securities are compared to the next actual sales price when available, or other appropriate market values, to assess the continued appropriateness of the fair valuation methodologies used. These securities are fair valued on a day-to-day basis, taking into consideration changes to appropriate market information and any significant changes to the inputs considered in the valuation process until there is a readily available price provided on an exchange or by an independent pricing service. Valuations received from an independent pricing service or independent broker-dealer quotes are periodically validated by comparisons to most recent trades and valuations provided by other independent pricing services in addition to the review of prices by the manager and/or subadviser. Unobservable inputs used in determining fair valuations are identified based on the type of security, taking into consideration factors utilized by market participants in valuing the investment, knowledge about the issuer and the current market environment.
Securities lending
The Fund may lend its securities from time to time in order to earn additional income in the form of fees or interest on securities received as collateral or the investment of any cash received as collateral. The Fund continues to receive interest or dividends on the securities loaned. The Fund receives collateral in the form of cash or securities with a value at least equal to the value of the securities on loan. The value of the loaned securities is determined at the close of each business day and any additional required collateral is delivered to the Fund on the next business day. In a securities lending transaction, the net asset value of the Fund will be affected by an increase or decrease in the value of the securities loaned and by an increase or decrease in the value of the instrument in which collateral is invested. The amount of securities lending activity undertaken by the Fund fluctuates from time to time. In the event of default or bankruptcy by the borrower, the Fund may be prevented from recovering the loaned securities or gaining access to the collateral or may experience delays or costs in doing so. In addition, the investment of any cash collateral received may lose all or part of its value. The Fund has the right under the lending agreement to recover the securities from the borrower on demand.
| | | | | | |
| Notes to financial statements (unaudited) | | Wells Fargo Short-Term High Yield Bond Fund | | | 23 | |
The Fund lends its securities through an unaffiliated securities lending agent. Cash collateral received in connection with its securities lending transactions is invested in Securities Lending Cash Investments, LLC (the “Securities Lending Fund”). The Securities Lending Fund is exempt from registration under Section 3(c)(7) of the 1940 Act and is managed by Funds Management and is subadvised by Wells Capital Management Incorporated (“WellsCap”), an affiliate of Funds Management and an indirect wholly owned subsidiary of Wells Fargo & Company (“Wells Fargo”). Funds Management receives an advisory fee starting at 0.05% and declining to 0.01% as the average daily net assets of the Securities Lending Fund increase. All of the fees received by Funds Management are paid to WellsCap for its services as subadviser. The Securities Lending Fund seeks to provide a positive return compared to the daily Fed Funds Open Rate by investing in high-quality, U.S. dollar-denominated short-term money market instruments. Securities Lending Fund investments are valued at the evaluated bid price provided by an independent pricing service. Income earned from investment in the Securities Lending Fund, if any, is included in income from affiliated securities on the Statement of Operations.
Loans
The Fund may invest in direct debt instruments which are interests in amounts owed to lenders by corporate or other borrowers. The loans pay interest at rates which are periodically reset by reference to a base lending rate plus a spread. Investments in loans may be in the form of participations in loans or assignments of all or a portion of loans from third parties. When the Fund purchases participations, it generally has no rights to enforce compliance with terms of the loan agreement with the borrower. As a result, the Fund assumes the credit risk of both the borrower and the lender that is selling the participation. When the Fund purchases assignments from lenders, it acquires direct rights against the borrower on the loan and may enforce compliance by the borrower with the terms of the loan agreement. Loans may include fully funded term loans or unfunded loan commitments, which are contractual obligations for future funding.
Security transactions and income recognition
Securities transactions are recorded on a trade date basis. Realized gains or losses are recorded on the basis of identified cost.
Interest income is accrued daily and bond discounts are accreted and premiums are amortized daily. To the extent debt obligations are placed on non-accrual status, any related interest income may be reduced by writing off interest receivables when the collection of all or a portion of interest has been determined to be doubtful based on consistently applied procedures and the fair value has decreased. If the issuer subsequently resumes interest payments or when the collectability of interest is reasonably assured, the debt obligation is removed from non-accrual status.
Distributions to shareholders
Distributions to shareholders from net investment income are declared daily and paid monthly. Distributions from net realized gains, if any, are recorded on the ex-dividend date and paid at least annually. Such distributions are determined in accordance with income tax regulations and may differ from U.S. generally accepted accounting principles. Dividend sources are estimated at the time of declaration. The tax character of distributions is determined as of the Fund’s fiscal year end. Therefore, a portion of the Fund’s distributions made prior to the Fund’s fiscal year end may be categorized as a tax return of capital at year end.
Federal and other taxes
The Fund intends to continue to qualify as a regulated investment company by distributing substantially all of its investment company taxable income and any net realized capital gains (after reduction for capital loss carryforwards) sufficient to relieve it from all, or substantially all, federal income taxes. Accordingly, no provision for federal income taxes was required.
The Fund’s income and federal excise tax returns and all financial records supporting those returns for the prior three fiscal years are subject to examination by the federal and Delaware revenue authorities. Management has analyzed the Fund’s tax positions taken on federal, state, and foreign tax returns for all open tax years and does not believe that there are any uncertain tax positions that require recognition of a tax liability.
As of February 28, 2018, the aggregate cost of all investments for federal income tax purposes was $1,248,481,644 and the unrealized gains (losses) consisted of:
| | | | |
Gross unrealized gains | | $ | 929,949 | |
Gross unrealized losses | | | (9,203,168 | ) |
Net unrealized losses | | $ | (8,274,219 | ) |
| | | | |
| 24 | | Wells Fargo Short-Term High Yield Bond Fund | | Notes to financial statements (unaudited) |
As of August 31, 2017, the Fund had capital loss carryforwards available to offset future net realized capital gains which consist of $8,436,157 in short-term capital losses and $22,303,148 in long-term capital losses.
As of August 31, 2017, the Fund had current year deferred post-October capital losses consisting of $752,729 in short-term losses which were recognized on the first day of the current fiscal year.
Class allocations
The separate classes of shares offered by the Fund differ principally in applicable sales charges, distribution, shareholder servicing, and administration fees. Class specific expenses are charged directly to that share class. Investment income, common expenses, and realized and unrealized gains (losses) on investments are allocated daily to each class of shares based on the relative proportion of net assets of each class.
3. FAIR VALUATION MEASUREMENTS
Fair value measurements of investments are determined within a framework that has established a fair value hierarchy based upon the various data inputs utilized in determining the value of the Fund’s investments. The three-level hierarchy gives the highest priority to unadjusted quoted prices in active markets for identical assets or liabilities (Level 1) and the lowest priority to unobservable inputs (Level 3). The Fund’s investments are classified within the fair value hierarchy based on the lowest level of input that is significant to the fair value measurement. The inputs are summarized into three broad levels as follows:
| ∎ | | Level 1 – quoted prices in active markets for identical securities |
| ∎ | | Level 2 – other significant observable inputs (including quoted prices for similar securities, interest rates, prepayment speeds, credit risk, etc.) |
| ∎ | | Level 3 – significant unobservable inputs (including the Fund’s own assumptions in determining the fair value of investments) |
The inputs or methodologies used for valuing investments in securities are not necessarily an indication of the risk associated with investing in those securities.
The following is a summary of the inputs used in valuing the Fund’s assets and liabilities as of February 28, 2018:
| | | | | | | | | | | | | | | | |
| | | Quoted prices
(Level 1) | | | Other significant
observable inputs (Level 2) | | | Significant
unobservable inputs (Level 3) | | | Total | |
Assets | | | | | | | | | | | | | | | | |
Investments in: | | | | | | | | | | | | | | | | |
| | | | |
Corporate bonds and notes | | $ | 0 | | | $ | 696,001,700 | | | $ | 0 | | | $ | 696,001,700 | |
| | | | |
Loans | | | 0 | | | | 378,490,981 | | | | 9,549,532 | | | | 388,040,513 | |
| | | | |
Non-agency mortgage-backed securities | | | 0 | | | | 25,878 | | | | 0 | | | | 25,878 | |
| | | | |
Yankee corporate bonds and notes | | | 0 | | | | 107,196,756 | | | | 0 | | | | 107,196,756 | |
| | | | |
Short-term investments | | | | | | | | | | | | | | | | |
Investment companies | | | 48,942,578 | | | | 0 | | | | 0 | | | | 48,942,578 | |
Total assets | | $ | 48,942,578 | | | $ | 1,181,715,315 | | | $ | 9,549,532 | | | $ | 1,240,207,425 | |
The Fund recognizes transfers between levels within the fair value hierarchy at the end of the reporting period. At February 28, 2018, the Fund did not have any transfers into/out of Level 1, Level 2, or Level 3.
4. TRANSACTIONS WITH AFFILIATES
Management fee
Funds Management, an indirect wholly owned subsidiary of Wells Fargo, is the manager of the Fund and provides advisory and fund-level administrative services under an investment management agreement. Under the investment management agreement, Funds Management is responsible for, among other services, implementing the investment objectives and strategies of the Fund, supervising the subadviser, providing fund-level administrative services in connection with the Fund’s operations, and providing any other fund-level administrative services reasonably necessary
| | | | | | |
| Notes to financial statements (unaudited) | | Wells Fargo Short-Term High Yield Bond Fund | | | 25 | |
for the operation of the Fund. As compensation for its services under the investment management agreement, Funds Management is entitled to receive an annual management fee starting at 0.50% and declining to 0.38% as the average daily net assets of the Fund increase. For the six months ended February 28, 2018, the management fee was equivalent to an annual rate of 0.48% of the Fund’s average daily net assets.
Funds Management has retained the services of a subadviser to provide daily portfolio management to the Fund. The fee for subadvisory services is borne by Funds Management. WellsCap is the subadviser to the Fund and is entitled to receive a fee from Funds Management at an annual rate starting at 0.35% and declining to 0.20% as the average daily net assets of the Fund increase.
Administration fees
Under a class-level administration agreement, Funds Management provides class-level administrative services to the Fund, which includes paying fees and expenses for services provided by the transfer agent, sub-transfer agents, omnibus account servicers and record-keepers. As compensation for its services under the class-level administration agreement, Funds Management receives an annual fee which is calculated based on the average daily net assets of each class as follows:
| | | | |
| | | Class-level
administration fee | |
Class A, Class C | | | 0.16 | % |
Administrator Class | | | 0.10 | |
Institutional Class | | | 0.08 | |
Funds Management has contractually waived and/or reimbursed management and administration fees to the extent necessary to maintain certain net operating expense ratios for the Fund. Waiver of fees and/or reimbursement of expenses by Funds Management were made first from fund level expenses on a proportionate basis and then from class specific expenses. Funds Management has committed through December 31, 2018 to waive fees and/or reimburse expenses to the extent necessary to cap the Fund’s expenses at 0.81% for Class A shares, 1.56% for Class C shares, 0.65% for Administrator Class shares, and 0.50% for Institutional Class shares. After this time, the cap may be increased or the commitment to maintain the cap may be terminated only with the approval of the Board of Trustees.
Distribution fee
The Trust has adopted a distribution plan for Class C shares of the Fund pursuant to Rule 12b-1 under the 1940 Act. A distribution fee is charged to Class C shares and paid to Wells Fargo Funds Distributor, LLC (“Funds Distributor”), the principal underwriter, at an annual rate of 0.75% of the average daily net assets of Class C shares.
In addition, Funds Distributor is entitled to receive the front-end sales charge from the purchase of Class A shares and a contingent deferred sales charge on the redemption of certain Class A shares. Funds Distributor is also entitled to receive the contingent deferred sales charges from redemptions of Class C shares. For the six months ended February 28, 2018, Funds Distributor received $894 from the sale of Class A shares and $150 in contingent deferred sales charges from redemptions of Class C shares. No contingent deferred sales charges were incurred by Class A shares for the six months ended February 28, 2018.
Shareholder servicing fees
The Trust has entered into contracts with one or more shareholder servicing agents, whereby Class A, Class C, and Administrator Class of the Fund are charged a fee at an annual rate of 0.25% of the average daily net assets of each respective class.
A portion of these total shareholder servicing fees were paid to affiliates of Wells Fargo.
Interfund transactions
The Fund may purchase or sell portfolio investment securities to certain other Wells Fargo affiliates pursuant to Rule 17a-7 under the 1940 Act and under procedures adopted by the Board of Trustees. The procedures have been designed to ensure that these interfund transactions, which do not incur broker commissions, are effected at current market prices. Pursuant to these procedures, the Fund had $436,469 in interfund purchases during the six months ended February 28, 2018.
| | | | |
| 26 | | Wells Fargo Short-Term High Yield Bond Fund | | Notes to financial statements (unaudited) |
5. INVESTMENT PORTFOLIO TRANSACTIONS
Purchases and sales of investments, excluding U.S. government obligations (if any) and short-term securities, for the six months ended February 28, 2018 were $326,688,216 and $368,604,789, respectively.
6. BANK BORROWINGS
The Trust (excluding the money market funds and certain other funds) and Wells Fargo Variable Trust are parties to a $280,000,000 revolving credit agreement whereby the Fund is permitted to use bank borrowings for temporary or emergency purposes, such as to fund shareholder redemption requests. Interest under the credit agreement is charged to the Fund based on a borrowing rate equal to the higher of the Federal Funds rate in effect on that day plus 1.25% or the overnight LIBOR rate in effect on that day plus 1.25%. In addition, an annual commitment fee equal to 0.25% of the unused balance is allocated to each participating fund.
For the six months ended February 28, 2018, there were no borrowings by the Fund under the agreement.
7. INDEMNIFICATION
Under the Trust’s organizational documents, the officers and Trustees have been granted certain indemnification rights against certain liabilities that may arise out of performance of their duties to the Trust. Additionally, in the normal course of business, the Trust may enter into contracts with service providers that contain a variety of indemnification clauses. The Trust’s maximum exposure under these arrangements is dependent on future claims that may be made against the Fund and, therefore, cannot be estimated.
| | | | | | |
| Other information (unaudited) | | Wells Fargo Short-Term High Yield Bond Fund | | | 27 | |
PROXY VOTING INFORMATION
A description of the policies and procedures that the Fund uses to determine how to vote proxies relating to portfolio securities is available, upon request, by calling 1-800-222-8222, visiting our website at wellsfargofunds.com, or visiting the SEC website at sec.gov. Information regarding how the Fund voted proxies relating to portfolio securities during the most recent 12-month period ended June 30 is available on the Fund’s website at wellsfargofunds.com or by visiting the SEC website at sec.gov.
PORTFOLIO HOLDINGS INFORMATION
The complete portfolio holdings for the Fund are publicly available monthly on the Fund’s website (wellsfargofunds.com), on a one-month delayed basis. In addition, top ten holdings information (excluding derivative positions) for the Fund is publicly available on the Fund’s website on a monthly, seven-day or more delayed basis. The Fund files its complete schedule of portfolio holdings with the SEC for the first and third quarters of each fiscal year on Form N-Q, which is available by visiting the SEC website at sec.gov. In addition, the Fund’s Form N-Q may be reviewed and copied at the SEC’s Public Reference Room in Washington, DC, and at regional offices in New York City, at 233 Broadway, and in Chicago, at 175 West Jackson Boulevard, Suite 900. Information about the Public Reference Room may be obtained by calling 1-800-SEC-0330.
| | | | |
| 28 | | Wells Fargo Short-Term High Yield Bond Fund | | Other information (unaudited) |
BOARD OF TRUSTEES AND OFFICERS
Each of the Trustees and Officers1 listed in the table below acts in identical capacities for each fund in the Wells Fargo family of funds, which consists of 153 mutual funds comprising the Wells Fargo Funds Trust, Wells Fargo Variable Trust, Wells Fargo Master Trust and four closed-end funds (collectively the “Fund Complex”). This table should be read in conjunction with the Prospectus and the Statement of Additional Information2. The mailing address of each Trustee and Officer is 525 Market Street, 12th Floor, San Francisco, CA 94105. Each Trustee and Officer serves an indefinite term, however, each Trustee serves such term until reaching the mandatory retirement age established by the Trustees.
Independent Trustees
| | | | | | |
Name and year of birth | | Position held and length of service* | | Principal occupations during past five years or longer | | Current other
public company or
investment company
directorships |
William R. Ebsworth (Born 1957) | | Trustee, since 2015 | | Retired. From 1984 to 2013, equities analyst, portfolio manager, research director and chief investment officer at Fidelity Management and Research Company in Boston, Tokyo, and Hong Kong, and retired in 2013 as Chief Investment Officer of Fidelity Strategic Advisers, Inc. where he led a team of investment professionals managing client assets. Prior thereto, Board member of Hong Kong Securities Clearing Co., Hong Kong Options Clearing Corp., the Thailand International Fund, Ltd., Fidelity Investments Life Insurance Company, and Empire Fidelity Investments Life Insurance Company. Board member of the Forté Foundation (non-profit organization) and the Vincent Memorial Hospital Endowment (non-profit organization), where he serves on the Investment Committee and as a Chair of the Audit Committee. Mr. Ebsworth is a CFA® charterholder. | | Asset Allocation Trust |
Jane A. Freeman** (Born 1953) | | Trustee, since 2015; Chair Liaison, since 2018 | | Retired. From 2012 to 2014 and 1999 to 2008, Chief Financial Officer of Scientific Learning Corporation. From 2008 to 2012, Ms. Freeman provided consulting services related to strategic business projects. Prior to 1999, Portfolio Manager at Rockefeller & Co. and Scudder, Stevens & Clark. Board member of the Harding Loevner Funds from 1996 to 2014, serving as both Lead Independent Director and chair of the Audit Committee. Board member of the Russell Exchange Traded Funds Trust from 2011 to 2012 and the chair of the Audit Committee. Ms. Freeman is a Board Member of Ruth Bancroft Garden (non-profit organization) and the Glimmerglass Festival. She is also an inactive Chartered Financial Analyst. | | Asset Allocation Trust |
Isaiah Harris, Jr. (Born 1952) | | Trustee, since 2009 | | Retired. Chairman of the Board of CIGNA Corporation since 2009, and Director since 2005. From 2003 to 2011, Director of Deluxe Corporation. Prior thereto, President and CEO of BellSouth Advertising and Publishing Corp. from 2005 to 2007, President and CEO of BellSouth Enterprises from 2004 to 2005 and President of BellSouth Consumer Services from 2000 to 2003. Emeritus member of the Iowa State University Foundation Board of Governors. Emeritus Member of the Advisory Board of Iowa State University School of Business. Advisory Board Member, Palm Harbor Academy (charter school). Advisory Board Member, Child Evangelism Fellowship (non-profit). Mr. Harris is a certified public accountant (inactive status). | | CIGNA Corporation; Asset Allocation Trust |
Judith M. Johnson (Born 1949) | | Trustee, since 2008; Audit Committee Chairman, since 2008 | | Retired. Prior thereto, Chief Executive Officer and Chief Investment Officer of Minneapolis Employees Retirement Fund from 1996 to 2008. Ms. Johnson is an attorney, certified public accountant and a certified managerial accountant. | | Asset Allocation Trust |
David F. Larcker (Born 1950) | | Trustee, since 2009 | | James Irvin Miller Professor of Accounting at the Graduate School of Business, Stanford University, Director of the Corporate Governance Research Initiative and Senior Faculty of The Rock Center for Corporate Governance since 2006. From 2005 to 2008, Professor of Accounting at the Graduate School of Business, Stanford University. Prior thereto, Ernst & Young Professor of Accounting at The Wharton School, University of Pennsylvania from 1985 to 2005. | | Asset Allocation Trust |
| | | | | | |
| Other information (unaudited) | | Wells Fargo Short-Term High Yield Bond Fund | | | 29 | |
| | | | | | |
Name and year of birth | | Position held and length of service* | | Principal occupations during past five years or longer | | Current other
public company or
investment company
directorships |
| Olivia S. Mitchell*** (Born 1953) | | Trustee, since 2006; Governance Committee Chairman, since 2018 | | International Foundation of Employee Benefit Plans Professor, Wharton School of the University of Pennsylvania since 1993. Director of Wharton’s Pension Research Council and Boettner Center on Pensions & Retirement Research, and Research Associate at the National Bureau of Economic Research. Previously, Cornell University Professor from 1978 to 1993. | | Asset Allocation Trust |
Timothy J. Penny**** (Born 1951) | | Trustee, since 1996; Chairman, since 2018; Vice Chairman, from 2017 to 2018 | | President and Chief Executive Officer of Southern Minnesota Initiative Foundation, a non-profit organization, since 2007. Member of the Board of Trustees of NorthStar Education Finance, Inc., a non-profit organization, since 2007. | | Asset Allocation Trust |
James G. Polisson***** (Born 1959) | | Trustee, since 2018; Advisory Board Member, from 2017 to 2018 | | Retired. Chief Marketing Officer, Source (ETF) UK Services, Ltd, from 2015 to 2017. From 2012 to 2015, Principal of The Polisson Group, LLC, a management consulting, corporate advisory and principal investing company. Chief Executive Officer and Managing Director at Russell Investments, Global Exchange Traded Funds from 2010 to 2012. Managing Director of Barclays Global Investors from 1998 to 2010 and Global Chief Marketing Officer for iShares and Barclays Global Investors from 2000 to 2010. Trustee of the San Francisco Mechanics’ Institute, a non-profit organization, from 2013 to 2015. Board member of the Russell Exchange Traded Fund Trust from 2011 to 2012. Director of Barclays Global Investors Holdings Deutschland GmbH from 2006 to 2009. Mr. Polisson is an attorney and has a retired status with the Massachusetts and District of Columbia Bar Associations. | | Asset Allocation Trust |
Michael S. Scofield (Born 1943) | | Trustee, since 2010 | | Served on the Investment Company Institute’s Board of Governors and Executive Committee from 2008-2011 as well the Governing Council of the Independent Directors Council from 2006-2011 and the Independent Directors Council Executive Committee from 2008-2011. Trustee of the Evergreen Fund complex (and its predecessors) from 1984 to 2010. Chairman of the Evergreen Funds from 2000-2010. Former Trustee of the Mentor Funds. Retired Attorney, Law Offices of Michael S. Scofield. | | Asset Allocation Trust |
Pamela Wheelock***** (Born 1959) | | Trustee, since 2018; Advisory Board Member, from 2017 to 2018 | | Chief Operating Officer, Twin Cities Habitat for Humanity, since January, 2017. Vice President of University Services, University of Minnesota from 2012 to 2017. Prior thereto, Interim President and Chief Executive Officer of Blue Cross Blue Shield of Minnesota from 2010 to 2011, Chairman of the Board from 2009 to 2011 and Board Director from 2003 to 2015. Vice President, Leadership and Community Engagement, Bush Foundation, Saint Paul, Minnesota (a private foundation) from 2009 to 2011. Executive Vice President and Chief Financial Officer, Minnesota Sports and Entertainment from 2004 to 2009 and Senior Vice President from 2002 to 2004. Commissioner of Finance, State of Minnesota, from 1999 to 2002. Currently on the Board of Directors, Governance Committee and Finance Committee, for the Minnesota Philanthropy Partners (Saint Paul Foundation) since 2012 and Board Chair of the Minnesota Wild Foundation since 2010. | | Asset Allocation Trust |
| * | Length of service dates reflect the Trustee’s commencement of service with the Trust’s predecessor entities, where applicable. |
| ** | Jane Freeman became Chair Liaison effective January 1, 2018. |
| *** | Olivia Mitchell became Chairman of the Governance Committee effective January 1, 2018. |
| **** | Timothy Penny became Chairman effective January 1, 2018. |
| ***** | James Polisson and Pamela Wheelock each became a Trustee effective January 1, 2018. |
| | | | |
| 30 | | Wells Fargo Short-Term High Yield Bond Fund | | Other information (unaudited) |
Officers
| | | | | | |
Name and
year of birth | | Position held and
length of service | | Principal occupations during past five years or longer | | |
Andrew Owen (Born 1960) | | President, since 2017 | | Executive Vice President of Wells Fargo & Company and Head of Affiliated Managers, Wells Fargo Asset Management, since 2014. In addition, Mr. Owen is currently President, Chief Executive Officer and Director of Wells Fargo Funds Management, LLC since 2017. Prior thereto, Executive Vice President responsible for marketing, investments and product development for Wells Fargo Funds Management, LLC, from 2009 to 2014. | | |
Nancy Wiser1 (Born 1967) | | Treasurer, since 2012 | | Executive Vice President of Wells Fargo Funds Management, LLC since 2011. Chief Operating Officer and Chief Compliance Officer at LightBox Capital Management LLC, from 2008 to 2011. | | |
Alexander Kymn* (Born 1973) | | Secretary, since 2018; Chief Legal Officer, since 2018 | | Senior Company Counsel of Wells Fargo Bank, N.A. since 2018 (previously Senior Counsel from 2007 to 2018). Vice President of Wells Fargo Funds Management, LLC from 2008 to 2014. | | |
C. David Messman** (Born 1960) | | Secretary, since 2000; Chief Legal Officer, since 2003 | | Senior Vice President and Secretary of Wells Fargo Funds Management, LLC since 2001. Assistant General Counsel of Wells Fargo Bank, N.A. since 2013 and Vice President and Managing Counsel of Wells Fargo Bank, N.A. from 1996 to 2013. | | |
Michael H. Whitaker (Born 1967) | | Chief Compliance Officer, since 2016 | | Senior Vice President and Chief Compliance Officer since 2016. Senior Vice President and Chief Compliance Officer for Fidelity Investments from 2007 to 2016. | | |
David Berardi (Born 1975) | | Assistant Treasurer, since 2009 | | Vice President of Wells Fargo Funds Management, LLC since 2009. Vice President of Evergreen Investment Management Company, LLC from 2008 to 2010. Manager of Fund Reporting and Control for Evergreen Investment Management Company, LLC from 2004 to 2010. | | |
Jeremy DePalma1 (Born 1974) | | Assistant Treasurer, since 2009 | | Senior Vice President of Wells Fargo Funds Management, LLC since 2009. Senior Vice President of Evergreen Investment Management Company, LLC from 2008 to 2010 and head of the Fund Reporting and Control Team within Fund Administration from 2005 to 2010. | | |
| 1 | Nancy Wiser acts as Treasurer of 77 funds in the Fund Complex. Jeremy DePalma acts as Treasurer of 76 funds and Assistant Treasurer of 77 funds in the Fund Complex. |
| 2 | The Statement of Additional Information includes additional information about the Trustees and is available, without charge, upon request, by calling 1-800-222-8222 or by visiting the website at wellsfargofunds.com. |
| * | Alexander Kymn became the Secretary and Chief Legal Officer effective April 17, 2018. |
| ** | David Messman was the Secretary and Chief Legal Officer until April 16, 2018. |
| | | | | | |
| List of abbreviations | | Wells Fargo Short-Term High Yield Bond Fund | | | 31 | |
The following is a list of common abbreviations for terms and entities that may have appeared in this report.
| ACA | — ACA Financial Guaranty Corporation |
| ADR | — American depositary receipt |
| ADS | — American depositary shares |
| AGC | — Assured Guaranty Corporation |
| AGM | — Assured Guaranty Municipal |
| Ambac | — Ambac Financial Group Incorporated |
| AMT | — Alternative minimum tax |
| BAN | — Bond anticipation notes |
| BHAC | — Berkshire Hathaway Assurance Corporation |
| CAB | — Capital appreciation bond |
| CCAB | — Convertible capital appreciation bond |
| CDA | — Community Development Authority |
| CDO | — Collateralized debt obligation |
| CLO | — Collateralized loan obligation |
| DRIVER | — Derivative inverse tax-exempt receipts |
| DW&P | — Department of Water & Power |
| DWR | — Department of Water Resources |
| ECFA | — Educational & Cultural Facilities Authority |
| EDA | — Economic Development Authority |
| EDFA | — Economic Development Finance Authority |
| ETF | — Exchange-traded fund |
| FDIC | — Federal Deposit Insurance Corporation |
| FFCB | — Federal Farm Credit Banks |
| FGIC | — Financial Guaranty Insurance Corporation |
| FHA | — Federal Housing Administration |
| FHLB | — Federal Home Loan Bank |
| FHLMC | — Federal Home Loan Mortgage Corporation |
| FICO | — The Financing Corporation |
| FNMA | — Federal National Mortgage Association |
| GDR | — Global depositary receipt |
| GNMA | — Government National Mortgage Association |
| HCFR | — Healthcare facilities revenue |
| HEFA | — Health & Educational Facilities Authority |
| HEFAR | — Higher education facilities authority revenue |
| HFA | — Housing Finance Authority |
| HFFA | — Health Facilities Financing Authority |
| HUD | — Department of Housing and Urban Development |
| IDA | — Industrial Development Authority |
| IDAG | — Industrial Development Agency |
| KRW | — Republic of Korea won |
| LIBOR | — London Interbank Offered Rate |
| LIFER | — Long Inverse Floating Exempt Receipts |
| LLC | — Limited liability company |
| LLLP | — Limited liability limited partnership |
| LLP | — Limited liability partnership |
| MBIA | — Municipal Bond Insurance Association |
| MFHR | — Multifamily housing revenue |
| MSTR | — Municipal securities trust receipts |
| MUD | — Municipal Utility District |
| National | — National Public Finance Guarantee Corporation |
| PCFA | — Pollution Control Financing Authority |
| PCL | — Public Company Limited |
| PCR | — Pollution control revenue |
| PFA | — Public Finance Authority |
| PFFA | — Public Facilities Financing Authority |
| PFOTER | — Puttable floating option tax-exempt receipts |
| PJSC | — Public Joint Stock Company |
| plc | — Public limited company |
| PUTTER | — Puttable tax-exempt receipts |
| R&D | — Research & development |
| Radian | — Radian Asset Assurance |
| RAN | — Revenue anticipation notes |
| RDA | — Redevelopment Agency |
| RDFA | — Redevelopment Finance Authority |
| REIT | — Real estate investment trust |
| ROC | — Reset option certificates |
| SAVRS | — Select auction variable rate securities |
| SBA | — Small Business Authority |
| SDR | — Swedish depositary receipt |
| SFHR | — Single-family housing revenue |
| SFMR | — Single-family mortgage revenue |
| SIFMA | — Securities Industry and Financial Markets Association |
| SPA | — Standby purchase agreement |
| SPDR | — Standard & Poor’s Depositary Receipts |
| SPEAR | — Short Puttable Exempt Adjustable Receipts |
| STRIPS | — Separate trading of registered interest and |
| TAN | — Tax anticipation notes |
| TIPS | — Treasury inflation-protected securities |
| TRAN | — Tax revenue anticipation notes |
| TTFA | — Transportation Trust Fund Authority |
| TVA | — Tennessee Valley Authority |
This page is intentionally left blank.

For more information
More information about Wells Fargo Funds is available free upon request. To obtain literature, please write, email, visit the Fund’s website, or call:
Wells Fargo Funds
P.O. Box 8266
Boston, MA 02266-8266
Email: fundservice@wellsfargo.com
Website: wellsfargofunds.com
Individual investors: 1-800-222-8222
Retail investment professionals: 1-888-877-9275
Institutional investment professionals: 1-866-765-0778
This report and the financial statements contained herein are submitted for the general information of the shareholders of the Fund. If this report is used for promotional purposes, distribution of the report must be accompanied or preceded by a current prospectus. Before investing, please consider the investment objectives, risks, charges, and expenses of the investment. For a current prospectus and, if available, a summary prospectus, containing this information, call 1-800-222-8222 or visit the Fund’s website at wellsfargofunds.com. Read the prospectus carefully before you invest or send money.
Wells Fargo Asset Management (WFAM) is a trade name used by the asset management businesses of Wells Fargo & Company. Wells Fargo Funds Management, LLC, a wholly owned subsidiary of Wells Fargo & Company, provides investment advisory and administrative services for Wells Fargo Funds. Other affiliates of Wells Fargo & Company provide subadvisory and other services for the funds. The funds are distributed by Wells Fargo Funds Distributor, LLC, Member FINRA, an affiliate of Wells Fargo & Company. Neither Wells Fargo Funds Distributor nor Wells Fargo Funds Management holds fund shareholder accounts or assets. This material is for general informational and educational purposes only and is NOT intended to provide investment advice or a recommendation of any kind—including a recommendation for any specific investment, strategy, or plan.
NOT FDIC INSURED ◾ NO BANK GUARANTEE ◾ MAY LOSE VALUE
© 2018 Wells Fargo Funds Management, LLC. All rights reserved.
| | |
 | | 309373 04-18 SA222/SAR222 02-18 |
Semi-Annual Report
February 28, 2018

Wells Fargo Ultra Short-Term Income Fund


Reduce clutter. Save trees.
Sign up for electronic delivery of prospectuses and shareholder reports at wellsfargo.com/advantagedelivery
Contents
The views expressed and any forward-looking statements are as of February 28, 2018, unless otherwise noted, and are those of the Fund managers and/or Wells Fargo Funds Management, LLC. Discussions of individual securities, or the markets generally, or any Wells Fargo Fund are not intended as individual recommendations. Future events or results may vary significantly from those expressed in any forward-looking statements. The views expressed are subject to change at any time in response to changing circumstances in the market. Wells Fargo Funds Management, LLC and the Fund disclaim any obligation to publicly update or revise any views expressed or forward-looking statements.
NOT FDIC INSURED ◾ NO BANK GUARANTEE ◾ MAY LOSE VALUE
| | | | |
| 2 | | Wells Fargo Ultra Short-Term Income Fund | | Letter to shareholders (unaudited) |

Andrew Owen
President
Wells Fargo Funds
During the period, stocks globally delivered positive returns.
Dear Shareholder:
We are pleased to offer you this semi-annual report for the Wells Fargo Ultra Short-Term Income Fund for the six-month period that ended February 28, 2018. During the period, stocks globally delivered positive returns. For the period, U.S. stocks, as measured by the S&P 500 Index1, gained 10.84% and international stocks, as measured by the MSCI ACWI ex USA Index (Net)2, gained 7.59%. In bond markets, the Bloomberg Barclays U.S. Aggregate Bond Index3 declined 2.18% and the Bloomberg Barclays Municipal Bond Index4 lost 1.24% while fixed-income investments outside the U.S. gained 2.52%, according to the Bloomberg Barclays Global Aggregate ex-USD Index5. The ICE BofAML U.S. High Yield Index6 earned 1.01% during the period.
U.S. stocks advanced as business-friendly policies and regulations, newly implemented tax reform, increased hiring activity, and consistent corporate profits led to higher investor and consumer confidence. Internationally, stocks gained as unemployment fell and wages increased in the U.K.; the Bank of Japan continued its accommodative monetary policies; and industrial production, retail sales, and fixed asset investment increased in China. Stock returns in the emerging markets were strong, with the MSCI EM Index (Net)7 gaining 10.58% for the period.
Reactions to U.S. interest-rate increases were uneven across the yield curve and globally.
The U.S. Federal Reserve (Fed) increased the federal funds rate twice during the six-month period. Following a federal funds rate increase in June to a range of 1.00% to 1.25%, 10-year U.S. Treasury yields declined, the yield curve flattened, and long-term bond prices benefited.
Internationally, central banks maintained low interest rates and accommodative monetary policies that supported business activity and stock values in foreign markets. A weaker U.S. dollar was generally supportive of business activity in regions around the globe.
Positive economic and market news continued as 2017 closed and 2018 began.
During the fourth quarter of 2017, stock markets continued the move higher. Third-quarter economic output in the U.S. grew at a 3.2% annual rate. The unemployment rate fell to a 17-year low of 4.1%. Tax reform and wage growth encouraged increased business and consumer spending.
Fed officials announced in October 2017 plans to begin unwinding its $4.5 trillion portfolio of bonds and other assets accumulated during rounds of quantitative easing conducted since the 2008–2009 recession. Still, restrained inflation kept long-term bond rates steady and the flattening of the yield curve persisted.
| 1 | The S&P 500 Index consists of 500 stocks chosen for market size, liquidity, and industry group representation. It is a market-value-weighted index with each stock’s weight in the index proportionate to its market value. You cannot invest directly in an index. |
| 2 | The Morgan Stanley Capital International (MSCI) All Country World Index (ACWI) ex USA Index (Net) is a free-float-adjusted market-capitalization-weighted index that is designed to measure the equity market performance of developed markets, excluding the United States and Canada. Source: MSCI. MSCI makes no express or implied warranties or representations and shall have no liability whatsoever with respect to any MSCI data contained herein. The MSCI data may not be further redistributed or used as a basis for other indices or any securities or financial products. This report is not approved, reviewed, or produced by MSCI. You cannot invest directly in an index. |
| 3 | The Bloomberg Barclays U.S. Aggregate Bond Index is a broad-based benchmark that measures the investment-grade, U.S. dollar-denominated, fixed-rate taxable bond market, including Treasuries, government-related and corporate securities, mortgage-backed securities (agency fixed-rate and hybrid adjustable-rate mortgage pass-throughs), asset-backed securities, and commercial mortgage-backed securities. You cannot invest directly in an index. |
| 4 | The Bloomberg Barclays Municipal Bond Index is an unmanaged index composed of long-term tax-exempt bonds with a minimum credit rating of Baa. You cannot invest directly in an index. |
| 5 | The Bloomberg Barclays Global Aggregate ex-USD Index is an unmanaged index that provides a broad-based measure of the global investment-grade fixed-income markets excluding the U.S. dollar-denominated debt market. You cannot invest directly in an index. |
| 6 | The ICE BofAML U.S. High Yield Index is a market-capitalization-weighted index of domestic and Yankee high-yield bonds. The index tracks the performance of high-yield securities traded in the U.S. bond market. You cannot invest directly in an index. Copyright 2018. ICE Data Indices, LLC. All rights reserved. |
| 7 | The MSCI Emerging Markets (EM) Index (Net) is a free-float-adjusted market-capitalization-weighted index that is designed to measure large- and mid-cap equity market performance of emerging markets. The MSCI EM Index (Net) consists of the following 24 emerging markets country indices: Brazil, Chile, China, Colombia, Czech Republic, Egypt, Greece, Hungary, India, Indonesia, Korea, Malaysia, Mexico, Pakistan, Peru, the Philippines, Poland, Qatar, Russia, South Africa, Taiwan, Thailand, Turkey, and the United Arab Emirates. You cannot invest directly in an index. |
| | | | | | |
| Letter to shareholders (unaudited) | | Wells Fargo Ultra Short-Term Income Fund | | | 3 | |
October 2017 also marked one year since the regulatory reform of money market investing in the U.S. By December 2017, money market fund asset levels exceeded their December 2016 levels, reflecting continued investor demand for short-term investment opportunities offered in money market funds.
In December, the Organisation for Economic Co-operation and Development (OECD) reported that the global economy was expanding at its fastest rate since 2010; all 35 countries the OECD follows were on track to expand for 2017. International economies benefited from economic stimulus, which accelerated trade growth; improving employment; increased investment; and firming commodity prices.
The Fed raised the federal funds rate target to a range of 1.25% to 1.50% in December 2017 and began reducing its bond portfolio.
2018 opened with continued stock advances, then volatility.
Improving business and economic data globally continued to support stock advances through January 2018. Even political wrangling in the U.S. over budget resolutions could not dissuade investors from buying stocks as payrolls and factory orders increased. Long-term interest rates in the U.S. trended higher as the yield curve steepened—the 10-year Treasury rate moved from 2.46% to 2.84% and the 30-year rate moved from 2.81% to 3.08% during January 2018.
Investor sentiment shifted in February. Concerns about inflation began to emerge in the U.S. as readings from the Producer Price Index in January rose 2.5% year over year. During February 2018, the U.S. market endured a loss of more than 10% before recovering much of that loss, but volatility affected stocks globally throughout the month.
During January 2018, purchasing managers’ indexes in China, the eurozone, India, and Japan reported data for December that indicated continued growth. International stock values fell during February 2018, swept up in the selling momentum in U.S. markets.
Don’t let short-term uncertainty derail long-term investment goals.
Periods of investment uncertainty can present challenges, but experience has taught us that maintaining long-term investment goals can be an effective way to plan for the future. To help you create a sound strategy based on your personal goals and risk tolerance, Wells Fargo Funds offers more than 100 mutual funds spanning a wide range of asset classes and investment styles. Although diversification cannot guarantee an investment profit or prevent losses, we believe it can be an effective way to manage investment risk and potentially smooth out overall portfolio performance. We encourage investors to know their investments and to understand that appropriate levels of risk-taking may unlock opportunities.
Thank you for choosing to invest with Wells Fargo Funds. We appreciate your confidence in us and remain committed to helping you meet your financial needs.
Sincerely,

Andrew Owen
President
Wells Fargo Funds
During February 2018, the U.S. market endured a loss of more than 10% before recovering much of that loss, but volatility affected stocks globally throughout the month.
For further information about your Fund, contact your investment professional, visit our website at wellsfargofunds.com, or call us directly at 1-800-222-8222.
| | | | |
| 4 | | Wells Fargo Ultra Short-Term Income Fund | | Performance highlights (unaudited) |
Investment objective
The Fund seeks current income consistent with capital preservation.
Manager
Wells Fargo Funds Management, LLC
Subadviser
Wells Capital Management Incorporated
Portfolio managers
Christopher Y. Kauffman, CFA®
Jay N. Mueller, CFA®
Noah M. Wise, CFA®
Average annual total returns (%) as of February 28, 20181
| | | | | | | | | | | | | | | | | | | | | | | | | | | | | | | | | | |
| | | | | Including sales charge | | | Excluding sales charge | | | Expense ratios2 (%) | |
| | | Inception date | | 1 year | | | 5 year | | | 10 year | | | 1 year | | | 5 year | | | 10 year | | | Gross | | | Net3 | |
| Class A (SADAX) | | 8-31-1999 | | | (1.16 | ) | | | 0.24 | | | | 0.81 | | | | 0.85 | | | | 0.64 | | | | 1.02 | | | | 0.80 | | | | 0.71 | |
| Class C (WUSTX) | | 7-18-2008 | | | (0.90 | ) | | | (0.09 | ) | | | 0.25 | | | | 0.10 | | | | (0.09 | ) | | | 0.25 | | | | 1.55 | | | | 1.46 | |
| Administrator Class (WUSDX) | | 4-8-2005 | | | – | | | | – | | | | – | | | | 1.00 | | | | 0.82 | | | | 1.16 | | | | 0.74 | | | | 0.56 | |
| Institutional Class (SADIX) | | 8-31-1999 | | | – | | | | – | | | | – | | | | 1.21 | | | | 1.02 | | | | 1.37 | | | | 0.47 | | | | 0.36 | |
| Bloomberg Barclays Short-Term U.S. Government/Credit Bond Index4 | | – | | | – | | | | – | | | | – | | | | 0.96 | | | | 0.52 | | | | 0.80 | | | | – | | | | – | |
Figures quoted represent past performance, which is no guarantee of future results, and do not reflect taxes that a shareholder may pay on fund distributions or the redemption of fund shares. Investment return and principal value of an investment will fluctuate so that an investor’s shares, when redeemed, may be worth more or less than their original cost. Performance shown without sales charges would be lower if sales charges were reflected. Current performance may be lower or higher than the performance data quoted, which assumes the reinvestment of dividends and capital gains. Current month-end performance is available on the Fund’s website, wellsfargofunds.com.
Index returns do not include transaction costs associated with buying and selling securities, any mutual fund fees or expenses, or any taxes. It is not possible to invest directly in an index.
For Class A shares, the maximum front-end sales charge is 2.00%. For Class C shares, the maximum contingent deferred sales charge is 1.00%. Performance including a contingent deferred sales charge assumes the sales charge for the corresponding time period. Administrator Class and Institutional Class shares are sold without a front-end sales charge or contingent deferred sales charge.
Bond values fluctuate in response to the financial condition of individual issuers, general market and economic conditions, and changes in interest rates. Changes in market conditions and government policies may lead to periods of heightened volatility in the bond market and reduced liquidity for certain bonds held by the Fund. In general, when interest rates rise, bond values fall and investors may lose principal value. Interest-rate changes and their impact on the Fund and its share price can be sudden and unpredictable. Loans are subject to risks similar to those associated with other below-investment-grade bond investments, such as credit risk (for example, risk of issuer default), below-investment-grade bond risk (for example, risk of greater volatility in value), and risk that the loan may become illiquid or difficult to price. The use of derivatives may reduce returns and/or increase volatility. Foreign investments are especially volatile and can rise or fall dramatically due to differences in the political and economic conditions of the host country. These risks are generally intensified in emerging markets. Certain investment strategies tend to increase the total risk of an investment (relative to the broader market). The Fund is exposed to high-yield securities risk and mortgage- and asset-backed securities risk. Consult the Fund’s prospectus for additional information on these and other risks.
Please see footnotes on page 5.
| | | | | | |
| Performance highlights (unaudited) | | Wells Fargo Ultra Short-Term Income Fund | | | 5 | |
| | | | |
| Ten largest holdings (%) as of February 28, 20185 | |
Avis Budget Rental Car Funding LLC Series 2013-1A Class A, 1.92%, 9/20/2019 | | | 0.92 | |
AT&T Incorporated, 5.00%, 3/1/2021 | | | 0.88 | |
General Motors Financial Company, 2.40%, 4/10/2018 | | | 0.84 | |
JPMorgan Chase Commercial Mortgage Securities Trust Series 2014-PHH Class A, 3.04%, 8/15/2027 | | | 0.84 | |
Deutsche Telekom International Finance BV, 2.23%, 1/17/2020 | | | 0.83 | |
Santander Retail Auto Lease Trust Series 2017-A Class A2A, 2.02%, 3/20/2020 | | | 0.82 | |
Dell Equipment Finance Trust Series 2017-1 Class A2, 1.86%, 6/24/2019 | | | 0.82 | |
CCG Receivables Trust Series 2015-1 Class A3, 1.92%, 1/17/2023 | | | 0.76 | |
Chesapeake Funding LLC Series 2017-3A Class A, 1.91%, 8/15/2029 | | | 0.75 | |
Ally Master Owner Trust Series 2017-1 Class A, 1.99%, 2/15/2021 | | | 0.70 | |
|
| Portfolio allocation as of February 28, 20186 |
|
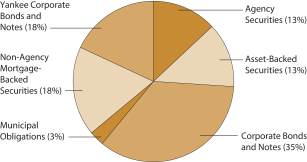 |
| 1 | Effective June 20, 2008, Advisor Class was renamed Class A and modified to assume the features and attributes of Class A. Historical performance shown for Class A shares through June 19, 2008, includes Advisor Class expenses. Historical performance shown for Class C shares prior to their inception reflects the performance of the former Investor Class shares, adjusted to include the higher expenses applicable to Class C shares. |
| 2 | Reflects the expense ratios as stated in the most recent prospectuses, which include the impact of 0.01% in acquired fund fees and expenses. The expense ratios shown are subject to change and may differ from the annualized expense ratios shown in the financial highlights of this report, which do not include acquired fund fees and expenses. |
| 3 | The manager has contractually committed through December 31, 2018, to waive fees and/or reimburse expenses to the extent necessary to cap the Fund’s Total Annual Fund Operating Expenses After Fee Waivers at 0.70% for Class A, 1.45% for Class C, 0.55% for Administrator Class, and 0.35% for Institutional Class. After this time, the cap may be increased or the commitment to maintain the cap may be terminated only with the approval of the Board of Trustees. Brokerage commissions, stamp duty fees, interest, taxes, acquired fund fees and expenses, and extraordinary expenses are excluded from the expense cap. Without this cap, the Fund’s returns would have been lower. The expense ratio paid by an investor is the net expense ratio (the total annual fund operating expenses after fee waivers) as stated in the prospectuses. |
| 4 | The Bloomberg Barclays Short-Term U.S. Government/Credit Bond Index contains securities that have fallen out of the Bloomberg Barclays U.S. Government/Credit Bond Index because of the standard minimum one-year-to-maturity constraint. Securities in the Bloomberg Barclays Short-Term U.S. Government/Credit Bond Index must have a maturity from 1 up to (but not including) 12 months. You cannot invest directly in an index. |
| 5 | The ten largest holdings, excluding cash and cash equivalents, are calculated based on the value of the investments divided by total net assets of the Fund. Holdings are subject to change and may have changed since the date specified. |
| 6 | Amounts are calculated based on the total long-term investments of the Fund. These amounts are subject to change and may have changed since the date specified. |
| | | | |
| 6 | | Wells Fargo Ultra Short-Term Income Fund | | Fund expenses (unaudited) |
As a shareholder of the Fund, you incur two types of costs: (1) transaction costs, including sales charges (loads) on purchase payments and contingent deferred sales charges (if any) on redemptions and (2) ongoing costs, including management fees, distribution (12b-1) and/or shareholder servicing fees, and other Fund expenses. This example is intended to help you understand your ongoing costs (in dollars) of investing in the Fund and to compare these costs with the ongoing costs of investing in other mutual funds.
The example is based on an investment of $1,000 invested at the beginning of the six-month period and held for the entire period from September 1, 2017 to February 28, 2018.
Actual expenses
The “Actual” line of the table below provides information about actual account values and actual expenses. You may use the information in this line, together with the amount you invested, to estimate the expenses that you paid over the period. Simply divide your account value by $1,000 (for example, an $8,600 account value divided by $1,000 = 8.6), then multiply the result by the number in the “Actual” line under the heading entitled “Expenses paid during period” for your applicable class of shares to estimate the expenses you paid on your account during this period.
Hypothetical example for comparison purposes
The “Hypothetical” line of the table below provides information about hypothetical account values and hypothetical expenses based on the Fund’s actual expense ratio and an assumed rate of return of 5% per year before expenses, which is not the Fund’s actual return. The hypothetical account values and expenses may not be used to estimate the actual ending account balance or expenses you paid for the period. You may use this information to compare the ongoing costs of investing in the Fund and other funds. To do so, compare this 5% hypothetical example with the 5% hypothetical examples that appear in the shareholder reports of the other funds.
Please note that the expenses shown in the table are meant to highlight your ongoing costs only and do not reflect any transactional costs, such as sales charges (loads) and contingent deferred sales charges. Therefore, the “Hypothetical” line of the table is useful in comparing ongoing costs only and will not help you determine the relative total costs of owning different funds. In addition, if these transactional costs were included, your costs would have been higher.
| | | | | | | | | | | | | | | | |
| | | Beginning
account value
9-1-2017 | | | Ending
account value
2-28-2018 | | | Expenses
paid during
the period¹ | | | Annualized net
expense ratio | |
Class A | | | | | | | | | | | | | | | | |
Actual | | $ | 1,000.00 | | | $ | 1,002.99 | | | $ | 3.48 | | | | 0.70 | % |
Hypothetical (5% return before expenses) | | $ | 1,000.00 | | | $ | 1,021.32 | | | $ | 3.51 | | | | 0.70 | % |
Class C | | | | | | | | | | | | | | | | |
Actual | | $ | 1,000.00 | | | $ | 999.26 | | | $ | 7.19 | | | | 1.45 | % |
Hypothetical (5% return before expenses) | | $ | 1,000.00 | | | $ | 1,017.60 | | | $ | 7.25 | | | | 1.45 | % |
Administrator Class | | | | | | | | | | | | | | | | |
Actual | | $ | 1,000.00 | | | $ | 1,003.71 | | | $ | 2.73 | | | | 0.55 | % |
Hypothetical (5% return before expenses) | | $ | 1,000.00 | | | $ | 1,022.07 | | | $ | 2.76 | | | | 0.55 | % |
Institutional Class | | | | | | | | | | | | | | | | |
Actual | | $ | 1,000.00 | | | $ | 1,004.72 | | | $ | 1.74 | | | | 0.35 | % |
Hypothetical (5% return before expenses) | | $ | 1,000.00 | | | $ | 1,023.06 | | | $ | 1.76 | | | | 0.35 | % |
| 1 | Expenses paid is equal to the annualized net expense ratio of each class multiplied by the average account value over the period, multiplied by the number of days in the most recent fiscal half-year divided by the number of days in the fiscal year (to reflect the one-half-year period). |
| | | | | | |
| Portfolio of investments—February 28, 2018 (unaudited) | | Wells Fargo Ultra Short-Term Income Fund | | | 7 | |
| | | | | | | | | | | | | | | | |
| Security name | | Interest rate | | | Maturity date | | | Principal | | | Value | |
| | | | |
Agency Securities: 12.59% | | | | | | | | | | | | | | | | |
FDIC Series 2013-R1 Class A 144A | | | 1.15 | % | | | 3-25-2033 | | | $ | 1,382,647 | | | $ | 1,361,576 | |
FHLMC (1 Year Treasury Constant Maturity +2.25%) ± | | | 3.01 | | | | 4-1-2032 | | | | 99,719 | | | | 104,290 | |
FHLMC (1 Year Treasury Constant Maturity +2.33%) ± | | | 3.08 | | | | 1-1-2029 | | | | 40,115 | | | | 40,264 | |
FHLMC (1 Year Treasury Constant Maturity +2.19%) ± | | | 3.10 | | | | 5-1-2035 | | | | 457,896 | | | | 483,101 | |
FHLMC (1 Year Treasury Constant Maturity +2.25%) ± | | | 3.25 | | | | 6-1-2032 | | | | 3,083 | | | | 3,203 | |
FHLMC (1 Year Treasury Constant Maturity +2.23%) ± | | | 3.30 | | | | 3-1-2035 | | | | 909,055 | | | | 959,513 | |
FHLMC (1 Year Treasury Constant Maturity +2.23%) ± | | | 3.33 | | | | 10-1-2038 | | | | 1,160,472 | | | | 1,224,355 | |
FHLMC (1 Year Treasury Constant Maturity +2.40%) ± | | | 3.35 | | | | 7-1-2029 | | | | 2,416 | | | | 2,496 | |
FHLMC (1 Year Treasury Constant Maturity +2.25%) ± | | | 3.35 | | | | 11-1-2035 | | | | 3,250,587 | | | | 3,423,659 | |
FHLMC (1 Year Treasury Constant Maturity +2.25%) ± | | | 3.43 | | | | 9-1-2038 | | | | 1,566,706 | | | | 1,635,548 | |
FHLMC (1 Year Treasury Constant Maturity +2.25%) ± | | | 3.53 | | | | 4-1-2038 | | | | 939,174 | | | | 986,693 | |
FHLMC | | | 4.50 | | | | 2-1-2020 | | | | 430,508 | | | | 436,850 | |
FHLMC | | | 4.50 | | | | 8-1-2020 | | | | 234,168 | | | | 236,557 | |
FHLMC | | | 4.50 | | | | 1-1-2022 | | | | 203,190 | | | | 206,352 | |
FHLMC | | | 4.50 | | | | 6-1-2024 | | | | 1,467,169 | | | | 1,530,662 | |
FHLMC | | | 4.50 | | | | 9-1-2026 | | | | 2,380,234 | | | | 2,482,208 | |
FHLMC | | | 5.00 | | | | 12-1-2019 | | | | 548,418 | | | | 559,682 | |
FHLMC | | | 5.50 | | | | 8-1-2018 | | | | 24,133 | | | | 24,192 | |
FHLMC | | | 5.50 | | | | 12-1-2022 | | | | 662,021 | | | | 691,488 | |
FHLMC | | | 5.50 | | | | 12-1-2023 | | | | 701,848 | | | | 735,125 | |
FHLMC | | | 6.00 | | | | 10-1-2021 | | | | 892,031 | | | | 926,654 | |
FHLMC | | | 6.00 | | | | 10-1-2021 | | | | 1,000,088 | | | | 1,039,251 | |
FHLMC | | | 6.00 | | | | 1-1-2024 | | | | 695,247 | | | | 727,454 | |
FHLMC | | | 7.00 | | | | 6-1-2031 | | | | 310,222 | | | | 344,546 | |
FHLMC | | | 9.00 | | | | 8-1-2018 | | | | 2 | | | | 2 | |
FHLMC | | | 9.00 | | | | 10-1-2019 | | | | 8,945 | | | | 9,205 | |
FHLMC | | | 9.50 | | | | 9-1-2020 | | | | 27,621 | | | | 27,877 | |
FHLMC | | | 9.50 | | | | 12-1-2022 | | | | 18,631 | | | | 18,861 | |
FHLMC | | | 10.00 | | | | 11-17-2021 | | | | 7,436 | | | | 7,477 | |
FHLMC | | | 10.50 | | | | 5-1-2020 | | | | 28,762 | | | | 29,734 | |
FHLMC Series 2611 Class HD | | | 5.00 | | | | 5-15-2023 | | | | 772,607 | | | | 806,831 | |
FHLMC Series 2617 Class GR | | | 4.50 | | | | 5-15-2018 | | | | 10,106 | | | | 10,117 | |
FHLMC Series 2649 Class WL | | | 4.00 | | | | 7-15-2023 | | | | 1,640,095 | | | | 1,680,155 | |
FHLMC Series 2704 Class BH | | | 4.50 | | | | 11-15-2023 | | | | 527,103 | | | | 542,818 | |
FHLMC Series 2707 Class QE | | | 4.50 | | | | 11-15-2018 | | | | 77,551 | | | | 77,814 | |
FHLMC Series 2843 Class BC | | | 5.00 | | | | 8-15-2019 | | | | 112,374 | | | | 113,135 | |
FHLMC Series 2849 Class B | | | 5.00 | | | | 8-15-2019 | | | | 210,852 | | | | 212,875 | |
FHLMC Series 2855 Class WN | | | 4.00 | | | | 9-15-2019 | | | | 39,199 | | | | 39,393 | |
FHLMC Series 2864 Class NB | | | 5.50 | | | | 7-15-2033 | | | | 147,354 | | | | 147,933 | |
FHLMC Series 2881 Class AE | | | 5.00 | | | | 8-15-2034 | | | | 282,736 | | | | 291,822 | |
FHLMC Series 2896 Class CB | | | 4.50 | | | | 11-15-2019 | | | | 183,558 | | | | 184,448 | |
FHLMC Series 2953 Class LD | | | 5.00 | | | | 12-15-2034 | | | | 227,682 | | | | 230,684 | |
FHLMC Series 3166 Class AC | | | 5.00 | | | | 6-15-2021 | | | | 2,755,641 | | | | 2,808,421 | |
FHLMC Series 3266 Class D | | | 5.00 | | | | 1-15-2022 | | | | 302,008 | | | | 303,320 | |
FHLMC Series 3346 Class FA (1 Month LIBOR +0.23%) ± | | | 1.82 | | | | 2-15-2019 | | | | 22,246 | | | | 22,247 | |
FHLMC Series 3609 Class LA | | | 4.00 | | | | 12-15-2024 | | | | 115,772 | | | | 116,459 | |
FHLMC Series 3619 Class EB | | | 3.50 | | | | 5-15-2024 | | | | 16,197 | | | | 16,200 | |
FHLMC Series 3772 Class HC | | | 3.00 | | | | 10-15-2018 | | | | 65,086 | | | | 65,119 | |
FHLMC Series 3780 Class GX | | | 3.50 | | | | 9-15-2028 | | | | 297,054 | | | | 297,453 | |
FHLMC Series 3784 Class DA | | | 4.00 | | | | 7-15-2025 | | | | 14,165 | | | | 14,170 | |
The accompanying notes are an integral part of these financial statements.
| | | | |
| 8 | | Wells Fargo Ultra Short-Term Income Fund | | Portfolio of investments—February 28, 2018 (unaudited) |
| | | | | | | | | | | | | | | | |
| Security name | | Interest rate | | | Maturity date | | | Principal | | | Value | |
| | | | |
Agency Securities (continued) | | | | | | | | | | | | | | | | |
FHLMC Series 3821 Class LA | | | 3.50 | % | | | 4-15-2025 | | | $ | 268,042 | | | $ | 270,488 | |
FHLMC Series 3834 Class EA | | | 3.50 | | | | 6-15-2029 | | | | 332,148 | | | | 337,907 | |
FHLMC Series 3842 Class CJ | | | 2.00 | | | | 9-15-2018 | | | | 24,094 | | | | 24,052 | |
FHLMC Series 3871 Class YV | | | 3.50 | | | | 7-15-2024 | | | | 228,067 | | | | 228,263 | |
FHLMC Series 3888 Class NA | | | 2.25 | | | | 1-15-2040 | | | | 2,135,472 | | | | 2,094,269 | |
FHLMC Series 3898 Class NE | | | 4.00 | | | | 7-15-2040 | | | | 278,162 | | | | 278,624 | |
FHLMC Series 4172 Class PB | | | 1.50 | | | | 7-15-2040 | | | | 419,041 | | | | 405,307 | |
FHLMC Series 4318 Class LC | | | 2.00 | | | | 6-15-2038 | | | | 646,656 | | | | 637,440 | |
FHLMC Series 4348 Class MH | | | 3.00 | | | | 6-15-2039 | | | | 2,759,448 | | | | 2,746,703 | |
FHLMC Series K005 Class A2 | | | 4.32 | | | | 11-25-2019 | | | | 500,000 | | | | 512,610 | |
FHLMC Series KJ13 Class A1 | | | 2.06 | | | | 9-25-2021 | | | | 2,515,717 | | | | 2,486,084 | |
FHLMC Series KP04 Class AG1 (1 Month LIBOR +0.22%) ± | | | 1.80 | | | | 7-25-2020 | | | | 4,515,000 | | | | 4,519,268 | |
FHLMC Series QO04 Class AFL (12 Month Treasury Average +0.74%) ± | | | 1.94 | | | | 10-25-2021 | | | | 4,598,102 | | | | 4,603,245 | |
FHLMC Series T-42 Class A6 | | | 9.50 | | | | 2-25-2042 | | | | 668,805 | | | | 804,306 | |
FNMA | | | 1.77 | | | | 9-1-2019 | | | | 1,090,074 | | | | 1,078,152 | |
FNMA | | | 2.00 | | | | 4-1-2023 | | | | 4,649,610 | | | | 4,576,275 | |
FNMA | | | 2.48 | | | | 7-1-2020 | | | | 3,412,948 | | | | 3,408,486 | |
FNMA (1 Year Treasury Constant Maturity +1.86%) ± | | | 2.86 | | | | 1-1-2023 | | | | 8,879 | | | | 8,861 | |
FNMA (6 Month LIBOR +1.39%) ± | | | 2.87 | | | | 10-1-2031 | | | | 125,879 | | | | 128,700 | |
FNMA (6 Month LIBOR +1.49%) ± | | | 3.02 | | | | 9-1-2037 | | | | 458,790 | | | | 474,584 | |
FNMA (1 Year Treasury Constant Maturity +2.22%) ± | | | 3.16 | | | | 6-1-2032 | | | | 101,358 | | | | 105,907 | |
FNMA (1 Year Treasury Constant Maturity +2.22%) ± | | | 3.22 | | | | 6-1-2034 | | | | 1,072,015 | | | | 1,135,875 | |
FNMA (1 Year Treasury Constant Maturity +2.02%) ± | | | 3.22 | | | | 12-1-2034 | | | | 556,587 | | | | 582,349 | |
FNMA (1 Year Treasury Constant Maturity +2.13%) ± | | | 3.24 | | | | 5-1-2032 | | | | 5,366 | | | | 5,542 | |
FNMA (1 Year Treasury Constant Maturity +2.19%) ± | | | 3.28 | | | | 2-1-2035 | | | | 1,235,125 | | | | 1,303,410 | |
FNMA (1 Year Treasury Constant Maturity +2.23%) ± | | | 3.29 | | | | 12-1-2040 | | | | 141,399 | | | | 148,506 | |
FNMA (1 Year Treasury Constant Maturity +2.19%) ± | | | 3.31 | | | | 4-1-2038 | | | | 2,392,689 | | | | 2,525,124 | |
FNMA (1 Year Treasury Constant Maturity +2.27%) ± | | | 3.32 | | | | 2-1-2033 | | | | 378,473 | | | | 394,316 | |
FNMA (1 Year Treasury Constant Maturity +2.26%) ± | | | 3.35 | | | | 8-1-2036 | | | | 2,760,682 | | | | 2,915,038 | |
FNMA (1 Year Treasury Constant Maturity +2.21%) ± | | | 3.35 | | | | 7-1-2038 | | | | 1,750,362 | | | | 1,845,281 | |
FNMA (12 Month Treasury Average +2.25%) ± | | | 3.37 | | | | 8-1-2045 | | | | 799,906 | | | | 846,105 | |
FNMA (1 Year Treasury Constant Maturity +2.25%) ± | | | 3.42 | | | | 11-1-2033 | | | | 2,310,477 | | | | 2,434,135 | |
FNMA (1 Year Treasury Constant Maturity +2.29%) ± | | | 3.43 | | | | 5-1-2036 | | | | 964,136 | | | | 1,019,353 | |
FNMA (1 Year Treasury Constant Maturity +2.19%) ± | | | 3.43 | | | | 11-1-2031 | | | | 63,704 | | | | 66,659 | |
FNMA (12 Month Treasury Average +2.32%) ± | | | 3.46 | | | | 5-1-2036 | | | | 1,004,270 | | | | 1,063,358 | |
FNMA (1 Year Treasury Constant Maturity +2.26%) ± | | | 3.49 | | | | 11-1-2035 | | | | 251,968 | | | | 264,769 | |
FNMA (1 Year Treasury Constant Maturity +2.28%) ± | | | 3.53 | | | | 11-1-2032 | | | | 803,789 | | | | 846,980 | |
FNMA (1 Year Treasury Constant Maturity +2.36%) ± | | | 3.55 | | | | 11-1-2034 | | | | 1,214,090 | | | | 1,287,211 | |
FNMA (12 Month LIBOR +1.82%) ± | | | 3.59 | | | | 9-1-2040 | | | | 3,154,536 | | | | 3,304,871 | |
FNMA (1 Year Treasury Constant Maturity +2.27%) ± | | | 3.74 | | | | 2-1-2036 | | | | 2,434,016 | | | | 2,540,459 | |
FNMA | | | 4.00 | | | | 3-1-2025 | | | | 1,335,368 | | | | 1,373,269 | |
FNMA | | | 4.00 | | | | 11-1-2025 | | | | 5,867,842 | | | | 6,035,065 | |
FNMA | | | 4.00 | | | | 9-1-2026 | | | | 5,230,912 | | | | 5,379,401 | |
FNMA | | | 4.50 | | | | 6-1-2019 | | | | 39,042 | | | | 39,297 | |
FNMA | | | 4.50 | | | | 1-1-2027 | | | | 2,654,188 | | | | 2,764,684 | |
FNMA | | | 5.00 | | | | 5-1-2022 | | | | 692,690 | | | | 713,218 | |
FNMA | | | 5.00 | | | | 6-1-2024 | | | | 2,838,672 | | | | 2,978,835 | |
FNMA (6 Month LIBOR +2.86%) ± | | | 5.00 | | | | 4-1-2033 | | | | 1,413 | | | | 1,464 | |
FNMA | | | 5.23 | | | | 7-1-2018 | | | | 708,022 | | | | 707,059 | |
FNMA | | | 5.29 | | | | 6-1-2018 | | | | 12,349 | | | | 12,357 | |
The accompanying notes are an integral part of these financial statements.
| | | | | | |
| Portfolio of investments—February 28, 2018 (unaudited) | | Wells Fargo Ultra Short-Term Income Fund | | | 9 | |
| | | | | | | | | | | | | | | | |
| Security name | | Interest rate | | | Maturity date | | | Principal | | | Value | |
| | | | |
Agency Securities (continued) | | | | | | | | | | | | | | | | |
FNMA | | | 6.00 | % | | | 4-1-2021 | | | $ | 161,569 | | | $ | 166,015 | |
FNMA | | | 6.00 | | | | 1-1-2023 | | | | 1,672,746 | | | | 1,755,159 | |
FNMA | | | 6.50 | | | | 8-1-2031 | | | | 418,887 | | | | 472,610 | |
FNMA | | | 8.33 | | | | 7-15-2020 | | | | 7,123 | | | | 7,340 | |
FNMA | | | 9.00 | | | | 2-15-2020 | | | | 29,316 | | | | 30,558 | |
FNMA | | | 9.00 | | | | 10-15-2021 | | | | 14,557 | | | | 15,258 | |
FNMA | | | 9.00 | | | | 6-1-2024 | | | | 23,217 | | | | 23,460 | |
FNMA | | | 9.50 | | | | 12-1-2020 | | | | 22,898 | | | | 23,891 | |
FNMA | | | 9.50 | | | | 3-1-2021 | | | | 348 | | | | 350 | |
FNMA | | | 10.25 | | | | 9-1-2021 | | | | 6,843 | | | | 6,907 | |
FNMA | | | 10.50 | | | | 8-1-2020 | | | | 527 | | | | 532 | |
FNMA | | | 10.50 | | | | 4-1-2022 | | | | 345 | | | | 348 | |
FNMA Series 1989-30 Class Z | | | 9.50 | | | | 6-25-2019 | | | | 11,156 | | | | 11,452 | |
FNMA Series 1989-49 Class E | | | 9.30 | | | | 8-25-2019 | | | | 556 | | | | 562 | |
FNMA Series 1990-111 Class Z | | | 8.75 | | | | 9-25-2020 | | | | 4,626 | | | | 4,871 | |
FNMA Series 1990-119 Class J | | | 9.00 | | | | 10-25-2020 | | | | 21,013 | | | | 22,276 | |
FNMA Series 1990-124 Class Z | | | 9.00 | | | | 10-25-2020 | | | | 8,633 | | | | 9,113 | |
FNMA Series 1990-21 Class Z | | | 9.00 | | | | 3-25-2020 | | | | 37,522 | | | | 39,292 | |
FNMA Series 1990-27 Class Z | | | 9.00 | | | | 3-25-2020 | | | | 19,198 | | | | 20,061 | |
FNMA Series 1990-30 Class D | | | 9.75 | | | | 3-25-2020 | | | | 5,333 | | | | 5,616 | |
FNMA Series 1990-77 Class D | | | 9.00 | | | | 6-25-2020 | | | | 15,237 | | | | 15,643 | |
FNMA Series 1991-132 Class Z | | | 8.00 | | | | 10-25-2021 | | | | 41,662 | | | | 44,526 | |
FNMA Series 1992-71 Class X | | | 8.25 | | | | 5-25-2022 | | | | 26,097 | | | | 28,355 | |
FNMA Series 2000-T6 Class A2 | | | 9.50 | | | | 11-25-2040 | | | | 377,915 | | | | 429,834 | |
FNMA Series 2001-T10 Class A3 | | | 9.50 | | | | 12-25-2041 | | | | 695,891 | | | | 800,812 | |
FNMA Series 2001-T12 Class A3 | | | 9.50 | | | | 8-25-2041 | | | | 608,920 | | | | 726,601 | |
FNMA Series 2002-T1 Class A4 | | | 9.50 | | | | 11-25-2031 | | | | 744,203 | | | | 860,405 | |
FNMA Series 2002-W04 Class A6 ±± | | | 3.99 | | | | 5-25-2042 | | | | 750,250 | | | | 772,691 | |
FNMA Series 2003-125 Class AY | | | 4.00 | | | | 12-25-2018 | | | | 134,589 | | | | 134,839 | |
FNMA Series 2003-129 Class AP | | | 4.00 | | | | 1-25-2019 | | | | 110 | | | | 111 | |
FNMA Series 2003-15 Class CN | | | 5.00 | | | | 3-25-2018 | | | | 61 | | | | 61 | |
FNMA Series 2003-35 Class BC | | | 5.00 | | | | 5-25-2018 | | | | 6,538 | | | | 6,542 | |
FNMA Series 2003-35 Class ME | | | 5.00 | | | | 5-25-2018 | | | | 3,814 | | | | 3,814 | |
FNMA Series 2003-92 Class PE | | | 4.50 | | | | 9-25-2018 | | | | 46,986 | | | | 47,027 | |
FNMA Series 2003-W11 Class A1 ±± | | | 4.55 | | | | 6-25-2033 | | | | 31,972 | | | | 33,352 | |
FNMA Series 2003-W3 Class 1A4 ±± | | | 3.74 | | | | 8-25-2042 | | | | 37,852 | | | | 39,673 | |
FNMA Series 2004-10 Class FA (1 Month LIBOR +0.35%) ± | | | 1.97 | | | | 2-25-2034 | | | | 419,471 | | | | 420,242 | |
FNMA Series 2004-17 Class HJ | | | 4.75 | | | | 4-25-2019 | | | | 191,512 | | | | 192,126 | |
FNMA Series 2004-32 Class AY | | | 4.00 | | | | 5-25-2019 | | | | 15,404 | | | | 15,483 | |
FNMA Series 2004-92 Class QY | | | 4.50 | | | | 8-25-2034 | | | | 193,145 | | | | 194,160 | |
FNMA Series 2007-W2 Class 1A1 (1 Month LIBOR +0.32%) ± | | | 1.94 | | | | 3-25-2037 | | | | 411,934 | | | | 411,959 | |
FNMA Series 2008-76 Class GF (1 Month LIBOR +0.65%) ± | | | 2.27 | | | | 9-25-2023 | | | | 44,816 | | | | 44,849 | |
FNMA Series 2008-81 Class LK | | | 5.00 | | | | 9-25-2023 | | | | 20,252 | | | | 20,318 | |
FNMA Series 2009-31 Class B | | | 4.00 | | | | 5-25-2024 | | | | 2,998,941 | | | | 3,017,385 | |
FNMA Series 2009-76 Class HA | | | 4.00 | | | | 1-25-2019 | | | | 588 | | | | 588 | |
FNMA Series 2010-115 Class NC | | | 2.75 | | | | 1-25-2039 | | | | 1,114,469 | | | | 1,109,352 | |
FNMA Series 2010-153 Class AB | | | 2.00 | | | | 11-25-2018 | | | | 84,091 | | | | 83,849 | |
FNMA Series 2010-153 Class BG | | | 2.50 | | | | 11-25-2018 | | | | 82,278 | | | | 82,100 | |
FNMA Series 2010-25 Class ND | | | 3.50 | | | | 3-25-2025 | | | | 74,157 | | | | 74,588 | |
FNMA Series 2010-37 Class A1 | | | 5.41 | | | | 5-25-2035 | | | | 6,548,890 | | | | 6,790,731 | |
The accompanying notes are an integral part of these financial statements.
| | | | |
| 10 | | Wells Fargo Ultra Short-Term Income Fund | | Portfolio of investments—February 28, 2018 (unaudited) |
| | | | | | | | | | | | | | | | |
| Security name | | Interest rate | | | Maturity date | | | Principal | | | Value | |
| | | | |
Agency Securities (continued) | | | | | | | | | | | | | | | | |
FNMA Series 2010-57 Class DQ | | | 3.00 | % | | | 6-25-2025 | | | $ | 333,226 | | | $ | 332,281 | |
FNMA Series 2010-89 Class DP | | | 3.00 | | | | 6-25-2038 | | | | 2,867,981 | | | | 2,883,410 | |
FNMA Series 2011-122 Class A | | | 3.00 | | | | 12-25-2025 | | | | 594,091 | | | | 595,707 | |
FNMA Series 2011-129 Class LG | | | 3.00 | | | | 3-25-2037 | | | | 6,594 | | | | 6,587 | |
FNMA Series 2011-33 Class GA | | | 3.50 | | | | 10-25-2028 | | | | 258,004 | | | | 258,433 | |
FNMA Series 2011-40 Class CA | | | 3.50 | | | | 12-25-2028 | | | | 960,477 | | | | 967,484 | |
FNMA Series 2011-42 Class A | | | 3.00 | | | | 2-25-2024 | | | | 477,962 | | | | 478,563 | |
FNMA Series 2011-56 Class AC | | | 2.00 | | | | 7-25-2018 | | | | 362 | | | | 362 | |
FNMA Series 2012-72 Class QE | | | 3.00 | | | | 1-25-2038 | | | | 580,844 | | | | 580,885 | |
FNMA Series 2012-94 Class E | | | 3.00 | | | | 6-25-2022 | | | | 36,957 | | | | 37,074 | |
FNMA Series 2013-26 Class AK | | | 2.50 | | | | 11-25-2038 | | | | 4,637,618 | | | | 4,553,562 | |
FNMA Series 2014-19 Class HA | | | 2.00 | | | | 6-25-2040 | | | | 1,073,232 | | | | 1,032,310 | |
GNMA | | | 7.00 | | | | 6-15-2033 | | | | 431,077 | | | | 500,787 | |
GNMA Series 2012-57 Class LG | | | 1.50 | | | | 3-16-2035 | | | | 336,551 | | | | 333,526 | |
GNMA Series 2016-H19 Class FE (1 Month LIBOR +0.37%) ± | | | 1.93 | | | | 6-20-2061 | | | | 3,048,926 | | | | 3,050,981 | |
GNMA Series 2017-H13 Class FJ (1 Month LIBOR +0.20%) ± | | | 1.76 | | | | 5-20-2067 | | | | 4,131,690 | | | | 4,132,804 | |
GNMA Series 2017-H16 Class FD (1 Month LIBOR +0.20%) ± | | | 1.76 | | | | 8-20-2067 | | | | 4,982,004 | | | | 4,974,986 | |
Vendee Mortgage Trust Series 2011-1 Class DA | | | 3.75 | | | | 2-15-2035 | | | | 2,707,441 | | | | 2,750,532 | |
| | | | |
Total Agency Securities (Cost $149,602,147) | | | | | | | | | | | | | | | 148,991,771 | |
| | | | | | | | | | | | | | | | |
| | | | |
Asset-Backed Securities: 12.31% | | | | | | | | | | | | | | | | |
Ally Master Owner Trust Series 2017-1 Class A (1 Month LIBOR +0.40%) ± | | | 1.99 | | | | 2-15-2021 | | | | 8,300,000 | | | | 8,320,571 | |
Avis Budget Rental Car Funding LLC Series 2013-1A Class A 144A | | | 1.92 | | | | 9-20-2019 | | | | 10,950,000 | | | | 10,932,363 | |
Avis Budget Rental Car Funding LLC Series 2014-1A Class A 144A | | | 2.46 | | | | 7-20-2020 | | | | 1,000,000 | | | | 996,854 | |
CCG Receivables Trust Series 2015-1 Class A3 144A | | | 1.92 | | | | 1-17-2023 | | | | 9,068,247 | | | | 9,052,090 | |
CCG Receivables Trust Series 2016-1 Class A2 144A | | | 1.69 | | | | 9-14-2022 | | | | 2,749,687 | | | | 2,735,140 | |
Chesapeake Funding LLC Series 2017-3A Class A 144A | | | 1.91 | | | | 8-15-2029 | | | | 8,985,000 | | | | 8,910,692 | |
Chrysler Capital Auto Receivables Trust Series 2015-BA Class A3 144A | | | 1.91 | | | | 3-16-2020 | | | | 2,305,537 | | | | 2,304,956 | |
CNH Equipment Trust Series 2016-B Class A2A | | | 1.31 | | | | 10-15-2019 | | | | 487,800 | | | | 487,538 | |
Dell Equipment Finance Trust Series 2016-1 Class A2 144A | | | 1.43 | | | | 9-24-2018 | | | | 95,066 | | | | 95,032 | |
Dell Equipment Finance Trust Series 2017-1 Class A2 144A | | | 1.86 | | | | 6-24-2019 | | | | 9,722,726 | | | | 9,704,614 | |
DLL Securitization Trust Series 2017-A Class A2 144A | | | 1.89 | | | | 7-15-2020 | | | | 4,500,000 | | | | 4,479,458 | |
Education Loan Asset-Backed Trust Series 2013-1 Class A1 (1 Month LIBOR +0.80%) 144A± | | | 2.36 | | | | 6-25-2026 | | | | 4,498,323 | | | | 4,520,243 | |
Educational Services of America Incorporated Series 2015-2 Class A (1 Month LIBOR +1.00%) 144A± | | | 2.62 | | | | 12-25-2056 | | | | 1,393,911 | | | | 1,407,810 | |
Enterprise Fleet Financing Trust Series 2017-1 Class A2 144A | | | 2.13 | | | | 7-20-2022 | | | | 5,180,801 | | | | 5,162,460 | |
Enterprise Fleet Financing Trust Series 2017-2 Class A2 144A | | | 1.97 | | | | 1-20-2023 | | | | 1,210,000 | | | | 1,202,380 | |
Finance of America Structured Series 2017-HB1 Class A 144A±± | | | 2.32 | | | | 11-25-2027 | | | | 4,222,164 | | | | 4,214,247 | |
GM Financial Automobile Leasing Trust Series 2016-1 Class A3 | | | 1.64 | | | | 7-20-2019 | | | | 731,520 | | | | 730,150 | |
GMF Floorplan Owner Revolving Trust Series 2015-1 Class A1 144A | | | 1.65 | | | | 5-15-2020 | | | | 2,670,000 | | | | 2,667,887 | |
Harley-Davidson Motorcycle Trust Series 2015-1 Class A3 | | | 1.41 | | | | 6-15-2020 | | | | 986,264 | | | | 983,765 | |
John Deere Owner Trust Series 2016-A Class A3 | | | 1.36 | | | | 4-15-2020 | | | | 1,494,513 | | | | 1,486,692 | |
Kubota Credit Owner Trust Series 2016-1A Class A2 144A | | | 1.25 | | | | 4-15-2019 | | | | 1,320,303 | | | | 1,318,431 | |
Mercedes-Benz Auto Lease Trust Series 2016-1 Class A2A | | | 1.11 | | | | 3-15-2019 | | | | 235,952 | | | | 235,902 | |
Mercedes-Benz Auto Lease Trust Series 2016-B Class A2 | | | 1.15 | | | | 1-15-2019 | | | | 1,179,898 | | | | 1,179,042 | |
MMAF Equipment Finance LLC Series 2016-AA Class A2 144A | | | 1.39 | | | | 12-17-2018 | | | | 2,378,608 | | | | 2,377,273 | |
MMAF Equipment Finance LLC Series 2017-B Class A2 144A | | | 1.93 | | | | 10-15-2020 | | | | 7,250,000 | | | | 7,209,156 | |
Navistar Financial Dealer Note Master Trust Series 2017-1 Class A (1 Month LIBOR +0.78%) 144A± | | | 2.34 | | | | 6-27-2022 | | | | 6,000,000 | | | | 6,012,803 | |
The accompanying notes are an integral part of these financial statements.
| | | | | | |
| Portfolio of investments—February 28, 2018 (unaudited) | | Wells Fargo Ultra Short-Term Income Fund | | | 11 | |
| | | | | | | | | | | | | | | | |
| Security name | | Interest rate | | | Maturity date | | | Principal | | | Value | |
| | | | |
Asset-Backed Securities (continued) | | | | | | | | | | | | | | | | |
Nissan Auto Lease Trust Series 2016-B Class A2A | | | 1.26 | % | | | 12-17-2018 | | | $ | 1,061,191 | | | $ | 1,060,226 | |
Santander Retail Auto Lease Trust Series 2017-A Class A2A 144A | | | 2.02 | | | | 3-20-2020 | | | | 9,790,000 | | | | 9,750,544 | |
SLC Student Loan Trust Series 2006-2 Class A5 (3 Month LIBOR +0.10%) ± | | | 1.69 | | | | 9-15-2026 | | | | 2,331,747 | | | | 2,326,781 | |
SLM Student Loan Trust Series 2004-1 Class A3 (3 Month LIBOR +0.21%) ± | | | 1.96 | | | | 4-25-2023 | | | | 440,020 | | | | 440,142 | |
SLM Student Loan Trust Series 2004-5A Class A5 (3 Month LIBOR +0.60%) 144A± | | | 2.35 | | | | 10-25-2023 | | | | 277,349 | | | | 277,576 | |
SLM Student Loan Trust Series 2004-8A Class A5 (3 Month LIBOR +0.50%) 144A± | | | 2.25 | | | | 4-25-2024 | | | | 881,821 | | | | 883,964 | |
SLM Student Loan Trust Series 2006-10 Class A5A (3 Month LIBOR +0.10%) ± | | | 1.85 | | | | 4-25-2027 | | | | 2,110,476 | | | | 2,106,531 | |
SLM Student Loan Trust Series 2006-2 Class A5 (3 Month LIBOR +0.11%) ± | | | 1.86 | | | | 7-25-2025 | | | | 736,240 | | | | 736,120 | |
SLM Student Loan Trust Series 2011-2 Class A1 (1 Month LIBOR +0.60%) ± | | | 2.22 | | | | 11-25-2027 | | | | 2,451,308 | | | | 2,467,153 | |
SLM Student Loan Trust Series 2013-1 Class A3 (1 Month LIBOR +0.55%) ± | | | 2.17 | | | | 5-26-2055 | | | | 4,769,685 | | | | 4,789,049 | |
South Texas Higher Education 2012-1 Class A2 (3 Month LIBOR +0.85%) ± | | | 2.54 | | | | 10-1-2024 | | | | 6,462,209 | | | | 6,486,249 | |
Student Loan Consolidation Center Series 2011-1 Class A (1 Month LIBOR +1.22%) 144A± | | | 2.78 | | | | 10-25-2027 | | | | 7,572,946 | | | | 7,677,904 | |
Verizon Owner Trust Series 2017-1A Class A 144A | | | 2.06 | | | | 9-20-2021 | | | | 5,175,000 | | | | 5,127,297 | |
Volvo Financial Equipment LLC Series 2016-1A Class A3 144A | | | 1.67 | | | | 2-18-2020 | | | | 280,641 | | | | 279,828 | |
World Omni Auto Receivables Trust Series 2016-A Class A2A | | | 1.20 | | | | 2-15-2019 | | | | 648,191 | | | | 646,809 | |
World Omni Auto Receivables Trust Series 2016-B Class A2 | | | 1.10 | | | | 1-15-2020 | | | | 2,008,426 | | | | 2,005,562 | |
| | | | |
Total Asset-Backed Securities (Cost $146,078,068) | | | | | | | | | | | | | | | 145,789,284 | |
| | | | | | | | | | | | | | | | |
| | | | |
Corporate Bonds and Notes: 34.38% | | | | | | | | | | | | | | | | |
| | | | |
Consumer Discretionary: 4.49% | | | | | | | | | | | | | | | | |
| | | | |
| Hotels, Restaurants & Leisure: 1.22% | | | | | | | | | | | | | | | | |
GLP Capital LP/GLP Financing II Incorporated | | | 4.88 | | | | 11-1-2020 | | | | 3,660,000 | | | | 3,751,500 | |
MGM Resorts International | | | 5.25 | | | | 3-31-2020 | | | | 3,660,000 | | | | 3,774,375 | |
Royal Caribbean Cruises Limited | | | 2.65 | | | | 11-28-2020 | | | | 2,000,000 | | | | 1,972,961 | |
Starbucks Corporation | | | 2.20 | | | | 11-22-2020 | | | | 5,000,000 | | | | 4,951,045 | |
| | | | |
| | | | | | | | | | | | | | | 14,449,881 | |
| | | | | | | | | | | | | | | | |
| | | | |
| Household Durables: 0.36% | | | | | | | | | | | | | | | | |
D.R. Horton Incorporated | | | 3.75 | | | | 3-1-2019 | | | | 2,990,000 | | | | 3,013,427 | |
Lennar Corporation | | | 4.50 | | | | 11-15-2019 | | | | 1,220,000 | | | | 1,239,825 | |
| | | | |
| | | | | | | | | | | | | | | 4,253,252 | |
| | | | | | | | | | | | | | | | |
| | | | |
| Internet & Direct Marketing Retail: 0.18% | | | | | | | | | | | | | | | | |
Amazon.com Incorporated 144A | | | 1.90 | | | | 8-21-2020 | | | | 2,235,000 | | | | 2,188,949 | |
| | | | | | | | | | | | | | | | |
| | | | |
| Media: 2.73% | | | | | | | | | | | | | | | | |
DIRECTV Holdings LLC | | | 5.88 | | | | 10-1-2019 | | | | 4,902,000 | | | | 5,126,365 | |
Discovery Communications LLC | | | 2.20 | | | | 9-20-2019 | | | | 3,725,000 | | | | 3,685,217 | |
NBCUniversal Enterprise Incorporated 144A | | | 5.25 | | | | 12-31-2049 | | | | 6,000,000 | | | | 6,180,000 | |
TEGNA Incorporated | | | 5.13 | | | | 7-15-2020 | | | | 3,660,000 | | | | 3,705,750 | |
Time Warner Cable Incorporated | | | 4.88 | | | | 3-15-2020 | | | | 6,010,000 | | | | 6,230,928 | |
Time Warner Cable Incorporated | | | 6.75 | | | | 7-1-2018 | | | | 7,245,000 | | | | 7,341,787 | |
| | | | |
| | | | | | | | | | | | | | | 32,270,047 | |
| | | | | | | | | | | | | | | | |
| | | | |
Consumer Staples: 1.43% | | | | | | | | | | | | | | | | |
| | | | |
| Beverages: 0.51% | | | | | | | | | | | | | | | | |
Anheuser-Busch InBev Worldwide Incorporated | | | 5.00 | | | | 4-15-2020 | | | | 5,767,000 | | | | 6,024,181 | |
| | | | | | | | | | | | | | | | |
The accompanying notes are an integral part of these financial statements.
| | | | |
| 12 | | Wells Fargo Ultra Short-Term Income Fund | | Portfolio of investments—February 28, 2018 (unaudited) |
| | | | | | | | | | | | | | | | |
| Security name | | Interest rate | | | Maturity date | | | Principal | | | Value | |
| | | | |
| Tobacco: 0.92% | | | | | | | | | | | | | | | | |
Altria Group Incorporated | | | 9.70 | % | | | 11-10-2018 | | | $ | 3,625,000 | | | $ | 3,805,697 | |
British American Tobacco Capital Corporation 144A | | | 2.30 | | | | 8-14-2020 | | | | 5,215,000 | | | | 5,120,400 | |
Reynolds American Incorporated | | | 8.13 | | | | 6-23-2019 | | | | 1,793,000 | | | | 1,914,073 | |
| | | | |
| | | | | | | | | | | | | | | 10,840,170 | |
| | | | | | | | | | | | | | | | |
| | | | |
Energy: 1.81% | | | | | | | | | | | | | | | | |
| | | | |
| Oil, Gas & Consumable Fuels: 1.81% | | | | | | | | | | | | | | | | |
Enable Midstream Partner LP | | | 2.40 | | | | 5-15-2019 | | | | 7,465,000 | | | | 7,395,080 | |
Energy Transfer Partners LP | | | 2.50 | | | | 6-15-2018 | | | | 5,000,000 | | | | 4,998,110 | |
Kinder Morgan Incorporated | | | 7.25 | | | | 6-1-2018 | | | | 2,000,000 | | | | 2,023,902 | |
Rockies Express Pipeline 144A | | | 6.85 | | | | 7-15-2018 | | | | 3,302,000 | | | | 3,343,275 | |
Sabine Pass Liquefaction LLC | | | 5.63 | | | | 2-1-2021 | | | | 3,500,000 | | | | 3,696,658 | |
| | | | |
| | | | | | | | | | | | | | | 21,457,025 | |
| | | | | | | | | | | | | | | | |
| | | | |
Financials: 17.59% | | | | | | | | | | | | | | | | |
| | | | |
| Banks: 7.52% | | | | | | | | | | | | | | | | |
Bank of America Corporation (3 Month LIBOR +0.63%) ± | | | 2.33 | | | | 10-1-2021 | | | | 5,000,000 | | | | 4,915,504 | |
BB&T Corporation | | | 2.15 | | | | 2-1-2021 | | | | 7,000,000 | | | | 6,855,124 | |
Citigroup Incorporated | | | 2.45 | | | | 1-10-2020 | | | | 4,000,000 | | | | 3,967,624 | |
Citigroup Incorporated | | | 2.50 | | | | 7-29-2019 | | | | 6,087,000 | | | | 6,064,431 | |
Discover Bank | | | 2.60 | | | | 11-13-2018 | | | | 5,000,000 | | | | 5,003,490 | |
Fifth Third Bank | | | 2.30 | | | | 3-15-2019 | | | | 4,470,000 | | | | 4,459,582 | |
Huntington National Bank | | | 2.20 | | | | 11-6-2018 | | | | 5,000,000 | | | | 4,988,384 | |
Huntington National Bank | | | 2.38 | | | | 3-10-2020 | | | | 8,000,000 | | | | 7,939,381 | |
JPMorgan Chase & Company | | | 2.75 | | | | 6-23-2020 | | | | 7,000,000 | | | | 6,979,528 | |
JPMorgan Chase Bank | | | 1.45 | | | | 9-21-2018 | | | | 2,000,000 | | | | 1,990,807 | |
KeyBank Corporation | | | 4.63 | | | | 6-15-2018 | | | | 7,730,000 | | | | 7,773,639 | |
PNC Bank | | | 2.45 | | | | 11-5-2020 | | | | 7,000,000 | | | | 6,907,457 | |
Rabobank Nederland NY | | | 1.38 | | | | 8-9-2019 | | | | 7,000,000 | | | | 6,861,500 | |
Regions Bank | | | 2.25 | | | | 9-14-2018 | | | | 7,000,000 | | | | 6,993,646 | |
US Bank | | | 2.05 | | | | 10-23-2020 | | | | 7,460,000 | | | | 7,317,858 | |
| | | | |
| | | | | | | | | | | | | | | 89,017,955 | |
| | | | | | | | | | | | | | | | |
| | | | |
| Capital Markets: 1.40% | | | | | | | | | | | | | | | | |
Goldman Sachs Group Incorporated | | | 2.00 | | | | 4-25-2019 | | | | 4,000,000 | | | | 3,972,860 | |
Goldman Sachs Group Incorporated | | | 2.60 | | | | 12-27-2020 | | | | 5,295,000 | | | | 5,231,399 | |
Morgan Stanley | | | 2.20 | | | | 12-7-2018 | | | | 4,000,000 | | | | 3,988,794 | |
Morgan Stanley | | | 2.45 | | | | 2-1-2019 | | | | 1,960,000 | | | | 1,955,407 | |
S&P Global Incorporated | | | 2.50 | | | | 8-15-2018 | | | | 1,450,000 | | | | 1,451,358 | |
| | | | |
| | | | | | | | | | | | | | | 16,599,818 | |
| | | | | | | | | | | | | | | | |
| | | | |
| Consumer Finance: 5.31% | | | | | | | | | | | | | | | | |
Ally Financial Incorporated | | | 3.25 | | | | 11-5-2018 | | | | 7,665,000 | | | | 7,670,749 | |
American Express Credit Corporation | | | 1.80 | | | | 7-31-2018 | | | | 8,000,000 | | | | 7,983,066 | |
BMW US Capital LLC 144A | | | 2.15 | | | | 4-6-2020 | | | | 1,000,000 | | | | 987,625 | |
Capital One Financial Corporation | | | 2.50 | | | | 5-12-2020 | | | | 7,000,000 | | | | 6,917,252 | |
Daimler Finance North America LLC 144A | | | 1.50 | | | | 7-5-2019 | | | | 3,000,000 | | | | 2,950,464 | |
Daimler Finance North America LLC 144A | | | 2.20 | | | | 5-5-2020 | | | | 1,480,000 | | | | 1,455,782 | |
The accompanying notes are an integral part of these financial statements.
| | | | | | |
| Portfolio of investments—February 28, 2018 (unaudited) | | Wells Fargo Ultra Short-Term Income Fund | | | 13 | |
| | | | | | | | | | | | | | | | |
| Security name | | Interest rate | | | Maturity date | | | Principal | | | Value | |
| | | | |
| Consumer Finance (continued) | | | | | | | | | | | | | | | | |
Daimler Finance North America LLC 144A | | | 2.30 | % | | | 2-12-2021 | | | $ | 4,000,000 | | | $ | 3,916,157 | |
Ford Motor Credit Company LLC | | | 2.24 | | | | 6-15-2018 | | | | 3,000,000 | | | | 2,998,495 | |
Ford Motor Credit Company LLC | | | 2.94 | | | | 1-8-2019 | | | | 3,665,000 | | | | 3,673,460 | |
General Motors Financial Company | | | 2.40 | | | | 4-10-2018 | | | | 10,000,000 | | | | 10,001,124 | |
Hyundai Capital America Incorporated 144A« | | | 2.75 | | | | 9-18-2020 | | | | 4,000,000 | | | | 3,949,199 | |
John Deere Capital Corporation | | | 1.95 | | | | 6-22-2020 | | | | 3,000,000 | | | | 2,949,207 | |
Nissan Motor Acceptance Corporation 144A | | | 2.00 | | | | 3-8-2019 | | | | 3,500,000 | | | | 3,479,897 | |
Nissan Motor Acceptance Corporation 144A | | | 2.25 | | | | 1-13-2020 | | | | 4,000,000 | | | | 3,968,250 | |
Synchrony Financial | | | 2.60 | | | | 1-15-2019 | | | | 3,815,000 | | | | 3,808,709 | |
| | | | |
| | | | | | | | | | | | | | | 66,709,436 | |
| | | | | | | | | | | | | | | | |
| | | | |
| Diversified Financial Services: 0.58% | | | | | | | | | | | | | | | | |
WEA Finance LLC 144A | | | 2.70 | | | | 9-17-2019 | | | | 2,975,000 | | | | 2,969,379 | |
| | | | | | | | | | | | | | | | |
| | | | |
| Insurance: 2.78% | | | | | | | | | | | | | | | | |
Axis Specialty Finance LLC | | | 5.88 | | | | 6-1-2020 | | | | 1,685,000 | | | | 1,786,679 | |
Jackson National Life Global Funding 144A | | | 2.30 | | | | 4-16-2019 | | | | 3,251,000 | | | | 3,246,055 | |
Metropolitan Life Global Funding Incorporated 144A | | | 1.55 | | | | 9-13-2019 | | | | 5,180,000 | | | | 5,101,278 | |
Metropolitan Life Global Funding Incorporated 144A | | | 1.75 | | | | 9-19-2019 | | | | 3,000,000 | | | | 2,960,527 | |
PartnerRe Finance B LLC | | | 5.50 | | | | 6-1-2020 | | | | 1,000,000 | | | | 1,044,739 | |
Protective Life Global Funding 144A | | | 2.26 | | | | 4-8-2020 | | | | 4,415,000 | | | | 4,367,057 | |
Provident Companies Incorporated | | | 7.00 | | | | 7-15-2018 | | | | 6,736,000 | | | | 6,851,488 | |
Reliance Standard Life Insurance 144A | | | 2.15 | | | | 10-15-2018 | | | | 7,610,000 | | | | 7,602,125 | |
| | | | |
| | | | | | | | | | | | | | | 32,959,948 | |
| | | | | | | | | | | | | | | | |
| | | | |
Health Care: 1.46% | | | | | | | | | | | | | | | | |
| | | | |
| Health Care Providers & Services: 0.96% | | | | | | | | | | | | | | | | |
Anthem Incorporated | | | 2.50 | | | | 11-21-2020 | | | | 3,765,000 | | | | 3,723,384 | |
HCA Incorporated | | | 6.50 | | | | 2-15-2020 | | | | 3,685,000 | | | | 3,878,463 | |
Tenet Healthcare Corporation | | | 6.00 | | | | 10-1-2020 | | | | 3,660,000 | | | | 3,806,400 | |
| | | | |
| | | | | | | | | | | | | | | 11,408,247 | |
| | | | | | | | | | | | | | | | |
| | | | |
| Pharmaceuticals: 0.50% | | | | | | | | | | | | | | | | |
EMD Finance LLC 144A | | | 2.40 | | | | 3-19-2020 | | | | 5,965,000 | | | | 5,898,683 | |
| | | | | | | | | | | | | | | | |
| | | | |
Industrials: 1.77% | | | | | | | | | | | | | | | | |
| | | | |
| Aerospace & Defense: 0.50% | | | | | | | | | | | | | | | | |
L-3 Communications Corporation | | | 5.20 | | | | 10-15-2019 | | | | 5,742,000 | | | | 5,946,787 | |
| | | | | | | | | | | | | | | | |
| | | | |
| Airlines: 0.25% | | | | | | | | | | | | | | | | |
Delta Air Lines Incorporated | | | 2.60 | | | | 12-4-2020 | | | | 3,000,000 | | | | 2,961,322 | |
| | | | | | | | | | | | | | | | |
| | | | |
| Construction & Engineering: 0.18% | | | | | | | | | | | | | | | | |
SBA Tower Trust 144A | | | 3.60 | | | | 4-9-2043 | | | | 2,080,000 | | | | 2,082,647 | |
| | | | | | | | | | | | | | | | |
| | | | |
| Machinery: 0.29% | | | | | | | | | | | | | | | | |
CNH Industrial Capital LLC | | | 4.38 | | | | 11-6-2020 | | | | 3,375,000 | | | | 3,442,500 | |
| | | | | | | | | | | | | | | | |
| | | | |
| Road & Rail: 0.30% | | | | | | | | | | | | | | | | |
ERAC USA Finance LLC 144A | | | 2.35 | | | | 10-15-2019 | | | | 3,605,000 | | | | 3,574,939 | |
| | | | | | | | | | | | | | | | |
The accompanying notes are an integral part of these financial statements.
| | | | |
| 14 | | Wells Fargo Ultra Short-Term Income Fund | | Portfolio of investments—February 28, 2018 (unaudited) |
| | | | | | | | | | | | | | | | |
| Security name | | Interest rate | | | Maturity date | | | Principal | | | Value | |
| | | | |
| Transportation Infrastructure: 0.25% | | | | | | | | | | | | | | | | |
TTX Company 144A | | | 2.25 | % | | | 2-1-2019 | | | $ | 2,905,000 | | | $ | 2,897,702 | |
| | | | | | | | | | | | | | | | |
| | | | |
Information Technology: 2.24% | | | | | | | | | | | | | | | | |
| | | | |
| Semiconductors & Semiconductor Equipment: 0.76% | | | | | | | | | | | | | | | | |
Maxim Integrated Product Incorporated | | | 2.50 | | | | 11-15-2018 | | | | 1,630,000 | | | | 1,628,321 | |
Qualcomm Incorporated | | | 1.85 | | | | 5-20-2019 | | | | 3,720,000 | | | | 3,686,563 | |
Qualcomm Incorporated | | | 2.10 | | | | 5-20-2020 | | | | 3,720,000 | | | | 3,647,014 | |
| | | | |
| | | | | | | | | | | | | | | 8,961,898 | |
| | | | | | | | | | | | | | | | |
| | | | |
| Technology Hardware, Storage & Peripherals: 1.48% | | | | | | | | | | | | | | | | |
Apple Incorporated | | | 1.80 | | | | 11-13-2019 | | | | 7,000,000 | | | | 6,921,528 | |
EMC Corporation | | | 2.65 | | | | 6-1-2020 | | | | 3,660,000 | | | | 3,560,584 | |
Hewlett Packard Enterprise Company | | | 3.60 | | | | 10-15-2020 | | | | 7,000,000 | | | | 7,075,663 | |
| | | | |
| | | | | | | | | | | | | | | 17,557,775 | |
| | | | | | | | | | | | | | | | |
| | | | |
Materials: 0.65% | | | | | | | | | | | | | | | | |
| | | | |
| Paper & Forest Products: 0.65% | | | | | | | | | | | | | | | | |
Georgia Pacific LLC 144A | | | 2.54 | | | | 11-15-2019 | | | | 7,740,000 | | | | 7,707,649 | |
| | | | | | | | | | | | | | | | |
| | | | |
Telecommunication Services: 1.76% | | | | | | | | | | | | | | | | |
| | | | |
| Diversified Telecommunication Services: 1.76% | | | | | | | | | | | | | | | | |
AT&T Incorporated | | | 5.00 | | | | 3-1-2021 | | | | 9,915,000 | | | | 10,432,389 | |
Broadcom International Limited | | | 2.20 | | | | 1-15-2021 | | | | 7,000,000 | | | | 6,778,416 | |
Broadcom International Limited | | | 2.38 | | | | 1-15-2020 | | | | 3,720,000 | | | | 3,674,587 | |
| | | | |
| | | | | | | | | | | | | | | 20,885,392 | |
| | | | | | | | | | | | | | | | |
| | | | |
Utilities: 1.18% | | | | | | | | | | | | | | | | |
| | | | |
| Electric Utilities: 0.56% | | | | | | | | | | | | | | | | |
Duke Energy Florida LLC | | | 2.10 | | | | 12-15-2019 | | | | 2,000,000 | | | | 1,990,186 | |
Interstate Power & Light Company | | | 5.88 | | | | 9-15-2018 | | | | 1,675,000 | | | | 1,704,866 | |
Pinnacle West Capital Corporation | | | 2.25 | | | | 11-30-2020 | | | | 3,000,000 | | | | 2,948,071 | |
| | | | |
| | | | | | | | | | | | | | | 6,643,123 | |
| | | | | | | | | | | | | | | | |
| | | | |
| Multi-Utilities: 0.62% | | | | | | | | | | | | | | | | |
Black Hills Corporation | | | 2.50 | | | | 1-11-2019 | | | | 3,645,000 | | | | 3,644,551 | |
Dominion Resources Incorporated | | | 2.96 | | | | 7-1-2019 | | | | 3,635,000 | | | | 3,639,704 | |
| | | | |
| | | | | | | | | | | | | | | 7,284,255 | |
| | | | | | | | | | | | | | | | |
| | | | |
Total Corporate Bonds and Notes (Cost $410,604,332) | | | | | | | | | | | | | | | 406,992,960 | |
| | | | | | | | | | | | | | | | |
| | | | |
Municipal Obligations: 2.65% | | | | | | | | | | | | | | | | |
| | | | |
| California: 0.31% | | | | | | | | | | | | | | | | |
Los Angeles CA Municipal Improvement Refunding Bond Convention Center Series A (Miscellaneous Revenue) | | | 2.34 | | | | 11-1-2018 | | | | 3,620,000 | | | | 3,625,321 | |
| | | | | | | | | | | | | | | | |
| | | | |
| Connecticut: 0.54% | | | | | | | | | | | | | | | | |
Connecticut Series A (GO Revenue) | | | 2.30 | | | | 1-15-2019 | | | | 5,000,000 | | | | 4,997,200 | |
Connecticut Series A (GO Revenue) | | | 5.46 | | | | 3-1-2019 | | | | 1,420,000 | | | | 1,439,809 | |
| | | | |
| | | | | | | | | | | | | | | 6,437,009 | |
| | | | | | | | | | | | | | | | |
The accompanying notes are an integral part of these financial statements.
| | | | | | |
| Portfolio of investments—February 28, 2018 (unaudited) | | Wells Fargo Ultra Short-Term Income Fund | | | 15 | |
| | | | | | | | | | | | | | | | |
| Security name | | Interest rate | | | Maturity date | | | Principal | | | Value | |
| | | | |
| Illinois: 0.62% | | | | | | | | | | | | | | | | |
Illinois Finance Authority (GO Revenue) | | | 5.67 | % | | | 3-1-2018 | | | $ | 1,735,000 | | | $ | 1,735,000 | |
State of Illinois (GO Revenue) | | | 4.35 | | | | 6-1-2018 | | | | 598,000 | | | | 600,248 | |
State of Illinois (Miscellaneous Revenue) | | | 5.00 | | | | 5-1-2019 | | | | 4,930,000 | | | | 5,064,047 | |
| | | | |
| | | | | | | | | | | | | | | 7,399,295 | |
| | | | | | | | | | | | | | | | |
| | | | |
| Michigan: 0.21% | | | | | | | | | | | | | | | | |
Michigan Finance Authority Subordinated Bond Series C-2 (Miscellaneous Revenue, Municipal Government Guaranty Insured) | | | 1.61 | | | | 11-1-2018 | | | | 1,000,000 | | | | 996,180 | |
Michigan Finance Authority Subordinated Bond Series C-4 (Miscellaneous Revenue, Municipal Government Guaranty Insured) | | | 2.06 | | | | 4-1-2018 | | | | 1,000,000 | | | | 999,170 | |
Michigan Finance Authority Subordinated Bond Series C-4 (Miscellaneous Revenue, Municipal Government Guaranty Insured) | | | 2.27 | | | | 4-1-2019 | | | | 500,000 | | | | 493,050 | |
| | | | |
| | | | | | | | | | | | | | | 2,488,400 | |
| | | | | | | | | | | | | | | | |
| | | | |
| New Jersey: 0.34% | | | | | | | | | | | | | | | | |
New Jersey TTFA Series B (Miscellaneous Revenue) | | | 1.76 | | | | 12-15-2018 | | | | 4,000,000 | | | | 3,969,080 | |
| | | | | | | | | | | | | | | | |
| | | | |
| Wisconsin: 0.63% | | | | | | | | | | | | | | | | |
Wisconsin Healthcare PFA (Housing Revenue, Citizens Bank LOC) | | | 2.63 | | | | 11-1-2019 | | | | 7,610,000 | | | | 7,494,556 | |
| | | | | | | | | | | | | | | | |
| | | | |
Total Municipal Obligations (Cost $31,524,340) | | | | | | | | | | | | | | | 31,413,661 | |
| | | | | | | | | | | | | | | | |
| | | | |
Non-Agency Mortgage-Backed Securities: 18.18% | | | | | | | | | | | | | | | | |
Acis CLO Limited Series 2013-1A Class A1 (3 Month LIBOR +0.87%) 144A± | | | 2.60 | | | | 4-18-2024 | | | | 291,403 | | | | 291,555 | |
ALM Loan Funding Series 2015-12A Class A1R (3 Month LIBOR +1.05%) 144A± | | | 2.77 | | | | 4-16-2027 | | | | 3,725,000 | | | | 3,727,902 | |
Banc of America Funding Corporation Series 2016-R1 Class A1 144A±± | | | 2.50 | | | | 3-25-2040 | | | | 2,278,888 | | | | 2,226,199 | |
BlueMountain CLO Limited Series 2014-2A Class AR (3 Month LIBOR +0.93%) 144A± | | | 2.67 | | | | 7-20-2026 | | | | 5,970,000 | | | | 5,972,973 | |
BX Trust 2017 Series A (1 Month LIBOR +1.05%) 144A± | | | 2.64 | | | | 10-15-2032 | | | | 1,615,000 | | | | 1,618,012 | |
CD Commercial Mortgage Trust Series 2017-CD3 Class A1 | | | 1.97 | | | | 2-10-2050 | | | | 4,454,810 | | | | 4,389,842 | |
CGDB Commercial Mortgage Trust Series 2017-BIOC Class A (1 Month LIBOR +0.75%) 144A± | | | 2.34 | | | | 5-15-2030 | | | | 5,500,000 | | | | 5,508,687 | |
CGDBB Commercial Mortgage Trust Series 2017-BIOC Class A (1 Month LIBOR +0.79%) 144A± | | | 2.38 | | | | 7-15-2032 | | | | 5,500,000 | | | | 5,511,331 | |
Chicago Skyscraper Trust Series 2017-SKY Class A (1 Month LIBOR +0.80%) 144A± | | | 2.39 | | | | 2-15-2030 | | | | 4,650,000 | | | | 4,656,904 | |
CIFC Funding Limited Series 2012-2RA Class A1 (3 Month LIBOR +0.80%) 144A± | | | 2.20 | | | | 1-20-2028 | | | | 7,550,000 | | | | 7,550,846 | |
CIFC Funding Limited Series 2015-2A Class AR (3 Month LIBOR +0.78%) 144A± | | | 2.50 | | | | 4-15-2027 | | | | 7,000,000 | | | | 6,999,937 | |
Citigroup Commercial Mortgage Trust Series 2008-C7 Class AMA ±± | | | 6.15 | | | | 12-10-2049 | | | | 1,000,000 | | | | 1,013,740 | |
Citigroup Commercial Mortgage Trust Series 2014-GC21 Class A2 | | | 2.90 | | | | 5-10-2047 | | | | 750,000 | | | | 752,200 | |
Citigroup Commercial Mortgage Trust Series 2014-GC25 Class A2 | | | 3.26 | | | | 10-10-2047 | | | | 3,563,000 | | | | 3,593,768 | |
Citigroup Commercial Mortgage Trust Series 2017-1500 Class A (1 Month LIBOR +0.85%) 144A± | | | 2.44 | | | | 7-15-2032 | | | | 6,150,000 | | | | 6,149,994 | |
Citigroup Commercial Mortgage Trust Series 2017-MDRB Class A (1 Month LIBOR +1.10%) 144A± | | | 2.69 | | | | 7-15-2030 | | | | 5,993,000 | | | | 5,975,864 | |
Collateralized Mortgage Obligation Trust Series 66 Class Z | | | 8.00 | | | | 9-20-2021 | | | | 15,410 | | | | 16,041 | |
Commercial Mortgage Trust Series 2010-C1 Class A3 144A | | | 4.21 | | | | 7-10-2046 | | | | 219,576 | | | | 224,142 | |
Commercial Mortgage Trust Series 2014-LC15 Class A2 | | | 2.84 | | | | 4-10-2047 | | | | 3,033,000 | | | | 3,042,481 | |
Commercial Mortgage Trust Series 2014-LC17 Class A2 | | | 3.16 | | | | 10-10-2047 | | | | 7,925,000 | | | | 7,984,909 | |
Commercial Mortgage Trust Series 2014-UBS3 Class A2 | | | 2.84 | | | | 6-10-2047 | | | | 2,900,000 | | | | 2,908,470 | |
Commercial Mortgage Trust Series 2014-UBS5 Class A2 | | | 3.03 | | | | 9-10-2047 | | | | 4,650,000 | | | | 4,670,035 | |
Commercial Mortgage Trust Series 2015-LC23 Class A1 | | | 1.81 | | | | 10-10-2048 | | | | 6,131,280 | | | | 6,065,782 | |
Countrywide Home Loans Mortgage Pass-Through Trust Series 2001-HYB1 Class 1A1 ±± | | | 2.75 | | | | 6-19-2031 | | | | 155,059 | | | | 154,704 | |
Countrywide Home Loans Mortgage Pass-Through Trust Series 2001-HYB1 Class 2A1 ±± | | | 3.21 | | | | 6-19-2031 | | | | 95,160 | | | | 93,760 | |
The accompanying notes are an integral part of these financial statements.
| | | | |
| 16 | | Wells Fargo Ultra Short-Term Income Fund | | Portfolio of investments—February 28, 2018 (unaudited) |
| | | | | | | | | | | | | | | | |
| Security name | | Interest rate | | | Maturity date | | | Principal | | | Value | |
| | | | |
Non-Agency Mortgage-Backed Securities (continued) | | | | | | | | | | | | | | | | |
Crown Point Limited Series 2013-2A Class A1LR (3 Month LIBOR +0.59%) 144A± | | | 2.31 | % | | | 12-31-2023 | | | $ | 1,479,983 | | | $ | 1,480,156 | |
Crown Point Limited Series 2015-3A Class A1AR (3 Month LIBOR +0.91%) 144A± | | | 2.63 | | | | 12-31-2027 | | | | 7,030,000 | | | | 7,031,526 | |
CSAIL Commercial Mortgage Trust Series 2015-C4 Class A1 | | | 2.01 | | | | 11-15-2048 | | | | 1,775,192 | | | | 1,759,320 | |
DLJ Mortgage Acceptance Corporation Series 1990-2 Class A ±± | | | 3.39 | | | | 1-25-2022 | | | | 21,687 | | | | 21,642 | |
EquiFirst Mortgage Loan Trust Series 2003-2 Class 3A3 (1 Month LIBOR +1.13%) ± | | | 2.71 | | | | 9-25-2033 | | | | 393,397 | | | | 388,176 | |
FirstKey Mortgage Trust Series 2014-1 Class A2 144A±± | | | 3.00 | | | | 11-25-2044 | | | | 4,242,272 | | | | 4,124,614 | |
GS Mortgage Securities Trust Series 2010-C1 Class A1 144A | | | 3.68 | | | | 8-10-2043 | | | | 2,396,068 | | | | 2,416,981 | |
GS Mortgage Securities Trust Series 2011-GC3 Class A4 144A | | | 4.75 | | | | 3-10-2044 | | | | 5,397,812 | | | | 5,617,925 | |
GS Mortgage Securities Trust Series 2013-GC12 Class A2 | | | 2.01 | | | | 6-10-2046 | | | | 784,932 | | | | 784,455 | |
GS Mortgage Securities Trust Series 2015-GS1 Class A1 | | | 1.94 | | | | 11-10-2048 | | | | 676,322 | | | | 669,872 | |
GS Mortgage Securities Trust Series 2016-GS3 Class A1 | | | 1.43 | | | | 10-10-2049 | | | | 1,763,273 | | | | 1,724,864 | |
GSMPS Mortgage Loan Trust Series 1998-1 Class A 144A±± | | | 8.00 | | | | 9-19-2027 | | | | 45,031 | | | | 44,971 | |
Halcyon Loan Advisors Funding Series 2014-3A Class AR (3 Month LIBOR +1.10%) 144A± | | | 2.84 | | | | 10-22-2025 | | | | 7,000,000 | | | | 7,013,965 | |
Housing Securities Incorporated Series 1992-8 Class E ±± | | | 4.95 | | | | 6-25-2024 | | | | 41,996 | | | | 42,648 | |
JPMorgan Chase Commercial Mortgage Securities Trust Series 2007-CB18 Class AMFL (1 Month LIBOR +0.17%) ± | | | 1.72 | | | | 6-12-2047 | | | | 2,405,163 | | | | 2,365,753 | |
JPMorgan Chase Commercial Mortgage Securities Trust Series 2012-LC9 Class A3 | | | 2.48 | | | | 12-15-2047 | | | | 1,692,524 | | | | 1,691,164 | |
JPMorgan Chase Commercial Mortgage Securities Trust Series 2014-PHH Class A (1 Month LIBOR +1.45%) 144A± | | | 3.04 | | | | 8-15-2027 | | | | 10,000,000 | | | | 10,000,010 | |
JPMorgan Chase Commercial Mortgage Securities Trust Series 2015-C28 Class A2 | | | 2.77 | | | | 10-15-2048 | | | | 115,000 | | | | 114,883 | |
JPMorgan Chase Commercial Mortgage Securities Trust Series 2015-C33 Class A1 | | | 1.90 | | | | 12-15-2048 | | | | 6,194,414 | | | | 6,133,990 | |
JPMorgan Chase Commercial Mortgage Securities Trust Series 2016-ASH Class A (1 Month LIBOR +1.50%) 144A± | | | 3.09 | | | | 10-15-2034 | | | | 4,700,000 | | | | 4,702,909 | |
JPMorgan Chase Commercial Mortgage Securities Trust Series 2016-JP3 Class A1 | | | 1.46 | | | | 8-15-2049 | | | | 3,864,122 | | | | 3,771,452 | |
JPMorgan Chase Commercial Mortgage Securities Trust Series 2017-JP5 Class A1 | | | 2.09 | | | | 3-15-2050 | | | | 4,036,278 | | | | 3,975,094 | |
Master Mortgages Trust Series 2002-3 Class 4A1 ±± | | | 3.30 | | | | 10-25-2032 | | | | 7,885 | | | | 7,864 | |
Morgan Stanley Bank of America Merrill Lynch Trust Series 2013-C10 Class A2 | | | 2.96 | | | | 7-15-2046 | | | | 1,193,658 | | | | 1,193,689 | |
Morgan Stanley Bank of America Merrill Lynch Trust Series 2013-C11 Class A2 | | | 3.09 | | | | 8-15-2046 | | | | 2,625,974 | | | | 2,631,662 | |
Morgan Stanley Bank of America Merrill Lynch Trust Series 2014-C15 Class A2 | | | 2.98 | | | | 4-15-2047 | | | | 2,940,000 | | | | 2,947,938 | |
Morgan Stanley Bank of America Merrill Lynch Trust Series 2016-C28 Class A1 | | | 1.53 | | | | 1-15-2049 | | �� | | 1,840,204 | | | | 1,806,043 | |
Morgan Stanley Capital I Trust Series 2007-IQ16 Class AMA ±± | | | 6.12 | | | | 12-12-2049 | | | | 27,680 | | | | 27,666 | |
Morgan Stanley Capital I Trust Series 2016-C30 Class A1 | | | 1.39 | | | | 9-15-2049 | | | | 6,140,381 | | | | 5,988,425 | |
Neuberger Berman Limited Series 2015-20A Class AR (3 Month LIBOR +0.80%) 144A± | | | 2.52 | | | | 1-15-2028 | | | | 4,085,000 | | | | 4,085,270 | |
Octagon Investment Partners Series 2015-1A Class A1R (3 Month LIBOR +0.90%) 144A± | | | 2.79 | | | | 5-21-2027 | | | | 6,300,000 | | | | 6,302,690 | |
Rait Trust Series 2017-FL7 Class A (1 Month LIBOR +0.95%) 144A± | | | 2.54 | | | | 6-15-2037 | | | | 2,984,448 | | | | 2,987,184 | |
Regatta IV Funding Limited Series 2014-1A Class A2R (3 Month LIBOR +1.02%) 144A± | | | 2.77 | | | | 7-25-2026 | | | | 5,245,000 | | | | 5,252,243 | |
Salomon Brothers Mortgage Securities VII Series 1990-2 Class A ±± | | | 3.09 | | | | 11-25-2020 | | | | 162,059 | | | | 163,029 | |
Stonemont Portfolio Trust Series 2017 Class A (1 Month LIBOR +0.85%) 144A± | | | 2.44 | | | | 8-20-2030 | | | | 5,200,000 | | | | 5,211,347 | |
Structured Asset Mortgage Investments Incorporated Series 2001-4 Class A2 ±± | | | 8.43 | | | | 10-25-2024 | | | | 10,820 | | | | 10,925 | |
Structured Asset Securities Corporation Series 1998-2 Class A (1 Month LIBOR +0.52%) ± | | | 2.14 | | | | 2-25-2028 | | | | 208,896 | | | | 206,956 | |
TICP Collateralized Loan Obligation Limited Trust Series 2014-2A Class A1AR (3 Month LIBOR +1.16%) 144A± | | | 2.90 | | | | 7-20-2026 | | | | 5,500,000 | | | | 5,511,594 | |
Venture CDO Limited Series 2015-20A Class AR (3 Month LIBOR +0.82%) 144A± | | | 2.54 | | | | 4-15-2027 | | | | 7,000,000 | | | | 6,999,923 | |
Wilshire Funding Corporation Series 1996-3 Class M2 ±± | | | 7.13 | | | | 8-25-2032 | | | | 134,807 | | | | 131,024 | |
Wilshire Funding Corporation Series 1996-3 Class M3 ±± | | | 7.13 | | | | 8-25-2032 | | | | 126,374 | | | | 120,608 | |
Wilshire Funding Corporation Series 1998-2 Class M1 ±± | | | 2.00 | | | | 12-28-2037 | | | | 297,343 | | | | 296,620 | |
Wind River Collateralized Loan Obligation Limited Trust Series 2014-3A Class AR (3 Month LIBOR +1.10%) 144A± | | | 2.84 | | | | 1-22-2027 | | | | 6,300,000 | | | | 6,316,292 | |
| | | | |
Total Non-Agency Mortgage-Backed Securities (Cost $216,487,469) | | | | | | | | | | | | | | | 215,175,440 | |
| | | | | | | | | | | | | | | | |
The accompanying notes are an integral part of these financial statements.
| | | | | | |
| Portfolio of investments—February 28, 2018 (unaudited) | | Wells Fargo Ultra Short-Term Income Fund | | | 17 | |
| | | | | | | | | | | | | | | | |
| Security name | | Interest rate | | | Maturity date | | | Principal | | | Value | |
| | | | |
Yankee Corporate Bonds and Notes: 17.88% | | | | | | | | | | | | | | | | |
| | | | |
Consumer Discretionary: 0.72% | | | | | | | | | | | | | | | | |
| | | | |
| Automobiles: 0.10% | | | | | | | | | | | | | | | | |
Jaguar Land Rover Limited 144A | | | 4.25 | % | | | 11-15-2019 | | | $ | 1,220,000 | | | $ | 1,226,100 | |
| | | | | | | | | | | | | | | | |
| | | | |
| Media: 0.62% | | | | | | | | | | | | | | | | |
British Sky Broadcasting Group plc 144A | | | 9.50 | | | | 11-15-2018 | | | | 7,000,000 | | | | 7,337,316 | |
| | | | | | | | | | | | | | | | |
| | | | |
Consumer Staples: 1.30% | | | | | | | | | | | | | | | | |
| | | | |
| Beverages: 0.07% | | | | | | | | | | | | | | | | |
Suntory Holdings Limited 144A | | | 2.55 | | | | 9-29-2019 | | | | 850,000 | | | | 846,164 | |
| | | | | | | | | | | | | | | | |
| | | | |
| Tobacco: 1.23% | | | | | | | | | | | | | | | | |
British American Tobacco International Finance plc 144A | | | 1.85 | | | | 6-15-2018 | | | | 7,025,000 | | | | 7,007,407 | |
Imperial Tobacco Finance plc 144A | | | 2.05 | | | | 7-20-2018 | | | | 7,500,000 | | | | 7,486,006 | |
| | | | |
| | | | | | | | | | | | | | | 14,493,413 | |
| | | | | | | | | | | | | | | | |
| | | | |
Financials: 12.61% | | | | | | | | | | | | | | | | |
| | | | |
| Banks: 9.25% | | | | | | | | | | | | | | | | |
ABN AMRO Bank NV 144A | | | 1.80 | | | | 9-20-2019 | | | | 7,000,000 | | | | 6,894,937 | |
ABN AMRO Bank NV 144A | | | 2.10 | | | | 1-18-2019 | | | | 4,000,000 | | | | 3,982,860 | |
ANZ New Zealand International Limited 144A | | | 2.60 | | | | 9-23-2019 | | | | 8,175,000 | | | | 8,152,413 | |
Banco de Credito del Peru 144A | | | 2.25 | | | | 10-25-2019 | | | | 4,500,000 | | | | 4,441,500 | |
Banco Santander Chile 144A | | | 2.50 | | | | 12-15-2020 | | | | 8,255,000 | | | | 8,131,175 | |
Bank of Tokyo-Mitsubishi UFJ Limited 144A | | | 2.15 | | | | 9-14-2018 | | | | 3,000,000 | | | | 2,994,728 | |
Banque Federative du Credit Mutuel SA 144A | | | 2.20 | | | | 7-20-2020 | | | | 7,470,000 | | | | 7,326,646 | |
BPCE SA | | | 2.50 | | | | 7-15-2019 | | | | 2,245,000 | | | | 2,234,345 | |
Commonwealth Bank of Australia 144A | | | 1.75 | | | | 11-7-2019 | | | | 5,250,000 | | | | 5,164,113 | |
DNB Bank ASA 144A | | | 2.13 | | | | 10-2-2020 | | | | 7,000,000 | | | | 6,855,182 | |
Federation des Caisses Desjardins du Quebec 144A | | | 2.25 | | | | 10-30-2020 | | | | 5,000,000 | | | | 4,916,487 | |
ING Bank NV 144A | | | 1.65 | | | | 8-15-2019 | | | | 7,000,000 | | | | 6,893,700 | |
Lloyds Bank plc | | | 2.00 | | | | 8-17-2018 | | | | 8,000,000 | | | | 7,991,547 | |
Santander UK plc | | | 2.50 | | | | 3-14-2019 | | | | 7,250,000 | | | | 7,241,660 | |
Sumitomo Mitsui Banking Corporation | | | 2.05 | | | | 1-18-2019 | | | | 3,250,000 | | | | 3,233,971 | |
Sumitomo Mitsui Banking Corporation | | | 2.09 | | | | 10-18-2019 | | | | 5,000,000 | | | | 4,938,800 | |
Sumitomo Mitsui Trust Bank Limited 144A | | | 1.95 | | | | 9-19-2019 | | | | 7,000,000 | | | | 6,910,932 | |
Suncorp-Metway Limited 144A | | | 2.38 | | | | 11-9-2020 | | | | 4,000,000 | | | | 3,923,776 | |
Svenska Handelsbanken AB | | | 1.50 | | | | 9-6-2019 | | | | 7,395,000 | | | | 7,273,479 | |
| | | | |
| | | | | | | | | | | | | | | 109,502,251 | |
| | | | | | | | | | | | | | | | |
| | | | |
| Capital Markets: 1.17% | | | | | | | | | | | | | | | | |
BP Capital Markets plc | | | 1.68 | | | | 5-3-2019 | | | | 7,000,000 | | | | 6,935,294 | |
Macquarie Group Limited 144A | | | 3.00 | | | | 12-3-2018 | | | | 4,000,000 | | | | 4,011,926 | |
Macquarie Group Limited 144A | | | 6.00 | | | | 1-14-2020 | | | | 2,750,000 | | | | 2,891,345 | |
| | | | |
| | | | | | | | | | | | | | | 13,838,565 | |
| | | | | | | | | | | | | | | | |
| | | | |
| Diversified Financial Services: 1.63% | | | | | | | | | | | | | | | | |
Corporacion Andina de Fomento | | | 2.00 | | | | 5-10-2019 | | | | 8,000,000 | | | | 7,943,742 | |
Shell International Finance BV | | | 1.38 | | | | 5-10-2019 | | | | 4,000,000 | | | | 3,944,931 | |
The accompanying notes are an integral part of these financial statements.
| | | | |
| 18 | | Wells Fargo Ultra Short-Term Income Fund | | Portfolio of investments—February 28, 2018 (unaudited) |
| | | | | | | | | | | | | | | | |
| Security name | | Interest rate | | | Maturity date | | | Principal | | | Value | |
| | | | |
| Diversified Financial Services (continued) | | | | | | | | | | | | | | | | |
UBS AG 144A | | | 2.20 | % | | | 6-8-2020 | | | $ | 3,725,000 | | | $ | 3,666,775 | |
UBS AG | | | 2.38 | | | | 8-14-2019 | | | | 3,730,000 | | | | 3,707,401 | |
| | | | |
| | | | | | | | | | | | | | | 19,262,849 | |
| | | | | | | | | | | | | | | | |
| | | | |
| Insurance: 0.56% | | | | | | | | | | | | | | | | |
Axis Specialty Finance plc | | | 2.65 | | | | 4-1-2019 | | | | 6,641,000 | | | | 6,631,536 | |
| | | | | | | | | | | | | | | | |
| | | | |
Health Care: 1.60% | | | | | | | | | | | | | | | | |
| | | | |
| Pharmaceuticals: 1.60% | | | | | | | | | | | | | | | | |
Actavis Funding SCS | | | 2.35 | | | | 3-12-2018 | | | | 8,265,000 | | | | 8,266,709 | |
Shire plc ADR | | | 1.90 | | | | 9-23-2019 | | | | 2,880,000 | | | | 2,835,448 | |
Teva Pharmaceuticals Industries Incorporated | | | 1.70 | | | | 7-19-2019 | | | | 8,000,000 | | | | 7,806,011 | |
| | | | |
| | | | | | | | | | | | | | | 18,908,168 | |
| | | | | | | | | | | | | | | | |
| | | | |
Industrials: 0.50% | | | | | | | | | | | | | | | | |
| | | | |
| Transportation Infrastructure: 0.50% | | | | | | | | | | | | | | | | |
Asciano Finance Limited 144A | | | 5.00 | | | | 4-7-2018 | | | | 5,903,000 | | | | 5,915,860 | |
| | | | | | | | | | | | | | | | |
| | | | |
Materials: 0.32% | | | | | | | | | | | | | | | | |
| | | | |
| Metals & Mining: 0.32% | | | | | | | | | | | | | | | | |
ArcelorMittal SA | | | 5.75 | | | | 3-1-2021 | | | | 3,660,000 | | | | 3,843,000 | |
| | | | | | | | | | | | | | | | |
| | | | |
Telecommunication Services: 0.83% | | | | | | | | | | | | | | | | |
| | | | |
| Diversified Telecommunication Services: 0.83% | | | | | | | | | | | | | | | | |
Deutsche Telekom International Finance BV 144A | | | 2.23 | | | | 1-17-2020 | | | | 10,000,000 | | | | 9,884,885 | |
| | | | | | | | | | | | | | | | |
| | | | |
Total Yankee Corporate Bonds and Notes (Cost $213,829,147) | | | | | | | | | | | | | | | 211,690,107 | |
| | | | | | | | | | | | | | | | |
| | | | |
| | | Yield | | | | | | Shares | | | | |
| Short-Term Investments: 1.60% | | | | | | | | | | | | | | | | |
| | | | |
| Commercial Paper: 1.06% | | | | | | | | | | | | | | | | |
Catholic Health Initiative (z) | | | 1.05 | | | | 3-2-2018 | | | | 12,600,000 | | | | 12,599,265 | |
| | | | | | | | | | | | | | | | |
| | | | |
| Investment Companies: 0.37% | | | | | | | | | | | | | | | | |
Securities Lending Cash Investment LLC (l)(r)(u) | | | 1.62 | | | | | | | | 1,019,898 | | | | 1,020,000 | |
Wells Fargo Government Money Market Fund Select
Class (l)(u) | | | 1.29 | | | | | | | | 3,322,313 | | | | 3,322,313 | |
| |
| | | | 4,342,313 | |
| | | | | | | | | | | | | | | | |
| | | | |
| | | | | | | | | Principal | | | | |
| U.S. Treasury Securities: 0.17% | | | | | | | | | | | | | | | | |
U.S. Treasury Bill (z)# | | | 1.23 | | | | 3-15-2018 | | | $ | 1,950,000 | | | | 1,949,018 | |
| | | | | | | | | | | | | | | | |
| |
Total Short-Term Investments (Cost $18,890,577) | | | | 18,890,596 | |
| | | | | | | | | | | | | | | | |
| | | | | | | | |
| Total investments in securities (Cost $1,187,016,080) | | | 99.59 | % | | | 1,178,943,819 | |
Other assets and liabilities, net | | | 0.41 | | | | 4,884,967 | |
| | | | | | | | |
| Total net assets | | | 100.00 | % | | $ | 1,183,828,786 | |
| | | | | | | | |
The accompanying notes are an integral part of these financial statements.
| | | | | | |
| Portfolio of investments—February 28, 2018 (unaudited) | | Wells Fargo Ultra Short-Term Income Fund | | | 19 | |
| 144A | The security may be resold in transactions exempt from registration, normally to qualified institutional buyers, pursuant to Rule 144A under the Securities Act of 1933. |
| ± | Variable rate investment. The rate shown is the rate in effect at period end. |
| ±± | The coupon of the security is adjusted based on the principal and interest payments received from the underlying pool of mortgages as well as the credit quality and the actual prepayment speed of the underlying mortgages. |
| « | All or a portion of this security is on loan. |
| (z) | Zero coupon security. The rate represents the current yield to maturity. |
| (l) | The issuer of the security is an affiliated person of the Fund as defined in the Investment Company Act of 1940. |
| (r) | The investment is a non-registered investment company purchased with cash collateral received from securities on loan. |
| (u) | The rate represents the 7-day annualized yield at period end. |
| # | All or a portion of this security is segregated as collateral for investments in derivative instruments. |
Futures Contracts
| | | | | | | | | | | | | | | | | | | | | | | | |
| Description | | Number of
contracts | | | Expiration
date | | | Notional
cost | | | Notional
value | | | Unrealized
gains | | | Unrealized
losses | |
Short | | | | | | | | | | | | | | | | | | | | | | | | |
2-Year U.S. Treasury Notes | | | (1,586) | | | | 6-29-2018 | | | $ | (337,220,532 | ) | | $ | (336,975,438 | ) | | $ | 245,094 | | | $ | 0 | |
5-Year U.S. Treasury Notes | | | (207) | | | | 6-29-2018 | | | | (23,634,864 | ) | | | (23,583,445 | ) | | | 51,419 | | | | 0 | |
| | | | | | | | | | | | | | | | | | | | | | | | |
| | | | | | | | | | | | | | | | | | $ | 296,513 | | | $ | 0 | |
| | | | | | | | | | | | | | | | | | | | | | | | |
Investments in Affiliates
An affiliated investment is an investment in which the Fund owns at least 5% of the outstanding voting shares of the issuer or as a result of other relationships, such as the Fund and the issuer having the same investment manager. Transactions with issuers that were either affiliated persons of the Fund at the beginning of the period or the end of the period were as follows:
| | | | | | | | | | | | | | | | | | | | | | | | | | | | | | | | | | | | |
| | | Shares,
beginning of
period | | | Shares
purchased | | | Shares
sold | | | Shares,
end of
period | | | Net
realized gains
(losses) | | | Net
change in
unrealized
gains
(losses) | | | Income
from
affiliated
securities | | | Value,
end
of period | | | % of
net
assets | |
Short-Term Investments | | | | | | | | | | | | | | | | | | | | | | | | | | | | | | | | | | | | |
Investment Companies | | | | | | | | | | | | | | | | | | | | | | | | | | | | | | | | | | | | |
Securities Lending Cash Investment LLC | | | 0 | | | | 5,189,981 | | | | 4,170,083 | | | | 1,019,898 | | | $ | 0 | | | $ | 0 | | | $ | 6,153 | | | $ | 1,020,000 | | | | | |
Wells Fargo Government Money Market Fund Select Class | | | 119,018,607 | | | | 442,715,593 | | | | 558,411,887 | | | | 3,322,313 | | | | 0 | | | | 0 | | | | 381,650 | | | | 3,322,313 | | | | | |
| | | | | | | | | | | | | | | | | | | | | | | | | | | | | | | | | | | | |
| | | | | | | | | | | | | | | | | | $ | 0 | | | $ | 0 | | | $ | 387,803 | | | $ | 4,342,313 | | | | 0.37 | % |
| | | | | | | | | | | | | | | | | | | | | | | | | | | | | | | | | | | | |
The accompanying notes are an integral part of these financial statements.
| | | | |
| 20 | | Wells Fargo Ultra Short-Term Income Fund | | Statement of assets and liabilities—February 28, 2018 (unaudited) |
| | | | |
| | | | |
| |
Assets | | | | |
Investments in unaffiliated securities (including $999,162 of securities loaned), at value (cost $1,182,673,767) | | $ | 1,174,601,506 | |
Investments in affiliated securities, at value (cost $4,342,313) | | | 4,342,313 | |
Cash | | | 104 | |
Receivable for investments sold | | | 1,420,000 | |
Principal paydown receivable | | | 80,795 | |
Receivable for Fund shares sold | | | 3,325,644 | |
Receivable for interest | | | 6,629,951 | |
Receivable for securities lending income | | | 316 | |
| | | | |
Total assets | | | 1,190,400,629 | |
| | | | |
| |
Liabilities | | | | |
Payable for Fund shares redeemed | | | 3,998,233 | |
Payable upon receipt of securities loaned | | | 1,020,000 | |
Dividends payable | | | 931,311 | |
Management fee payable | | | 208,470 | |
Administration fees payable | | | 91,991 | |
Payable for daily variation margin on open futures contracts | | | 19,406 | |
Distribution fee payable | | | 2,940 | |
Trustees’ fees and expenses payable | | | 2,170 | |
Accrued expenses and other liabilities | | | 297,322 | |
| | | | |
Total liabilities | | | 6,571,843 | |
| | | | |
Total net assets | | $ | 1,183,828,786 | |
| | | | |
| |
NET ASSETS CONSIST OF | | | | |
Paid-in capital | | $ | 1,232,304,144 | |
Overdistributed net investment income | | | (725,195 | ) |
Accumulated net realized losses on investments | | | (39,974,415 | ) |
Net unrealized losses on investments | | | (7,775,748 | ) |
| | | | |
Total net assets | | $ | 1,183,828,786 | |
| | | | |
| |
COMPUTATION OF NET ASSET VALUE AND OFFERING PRICE PER SHARE | | | | |
Net assets – Class A | | $ | 261,747,086 | |
Shares outstanding – Class A1 | | | 30,961,131 | |
Net asset value per share – Class A | | | $8.45 | |
Maximum offering price per share – Class A2 | | | $8.62 | |
Net assets – Class C | | $ | 5,197,820 | |
Shares outstanding – Class C1 | | | 615,536 | |
Net asset value per share – Class C | | | $8.44 | |
Net assets – Administrator Class | | $ | 18,141,356 | |
Shares outstanding – Administrator Class1 | | | 2,155,220 | |
Net asset value per share – Administrator Class | | | $8.42 | |
Net assets – Institutional Class | | $ | 898,742,524 | |
Shares outstanding – Institutional Class1 | | | 106,361,437 | |
Net asset value per share – Institutional Class | | | $8.45 | |
| 1 | The Fund has an unlimited number of authorized shares. |
| 2 | Maximum offering price is computed as 100/98 of net asset value. On investments of $50,000 or more, the offering price is reduced. |
The accompanying notes are an integral part of these financial statements.
| | | | | | |
| Statement of operations—six months ended February 28, 2018 (unaudited) | | Wells Fargo Ultra Short-Term Income Fund | | | 21 | |
| | | | |
| | | | |
| |
Investment income | | | | |
Interest | | $ | 12,903,806 | |
Income from affiliated securities | | | 387,803 | |
| | | | |
Total investment income | | | 13,291,609 | |
| | | | |
| |
Expenses | | | | |
Management fee | | | 2,280,386 | |
Administration fees | | | | |
Class A | | | 218,031 | |
Class C | | | 4,392 | |
Administrator Class | | | 17,333 | |
Institutional Class | | | 405,732 | |
Shareholder servicing fees | | | | |
Class A | | | 340,673 | |
Class C | | | 6,863 | |
Administrator Class | | | 43,332 | |
Distribution fee | | | | |
Class C | | | 20,588 | |
Custody and accounting fees | | | 45,107 | |
Professional fees | | | 32,399 | |
Registration fees | | | 159,933 | |
Shareholder report expenses | | | 41,936 | |
Trustees’ fees and expenses | | | 12,449 | |
Other fees and expenses | | | 20,261 | |
| | | | |
Total expenses | | | 3,649,415 | |
Less: Fee waivers and/or expense reimbursements | | | (785,320 | ) |
| | | | |
Net expenses | | | 2,864,095 | |
| | | | |
Net investment income | | | 10,427,514 | |
| | | | |
| |
REALIZED AND UNREALIZED GAINS (LOSSES) ON INVESTMENTS | | | | |
| |
Net realized gains (losses) on: | | | | |
Unaffiliated securities | | | (227,196 | ) |
Futures transactions | | | 5,412,648 | |
| | | | |
Net realized gains on investments | | | 5,185,452 | |
| | | | |
| |
Net change in unrealized gains (losses) on: | | | | |
Unaffiliated securities | | | (9,862,857 | ) |
Futures transactions | | | 199,809 | |
| | | | |
Net change in unrealized gains (losses) on investments | | | (9,663,048 | ) |
| | | | |
Net realized and unrealized gains (losses) on investments | | | (4,477,596 | ) |
| | | | |
Net increase in net assets resulting from operations | | $ | 5,949,918 | |
| | | | |
The accompanying notes are an integral part of these financial statements.
| | | | |
| 22 | | Wells Fargo Ultra Short-Term Income Fund | | Statement of changes in net assets |
| | | | | | | | | | | | | | | | |
| | | Six months ended
February 28, 2018 (unaudited) | | | Year ended
August 31, 2017 | |
| | | | |
Operations | | | | | | | | | | | | | | | | |
Net investment income | | | | | | $ | 10,427,514 | | | | | | | $ | 20,208,850 | |
Net realized gains on investments | | | | | | | 5,185,452 | | | | | | | | 782,603 | |
Net change in unrealized gains (losses) on investments | | | | | | | (9,663,048 | ) | | | | | | | (2,659,824 | ) |
| | | | |
Net increase in net assets resulting from operations | | | | | | | 5,949,918 | | | | | | | | 18,331,629 | |
| | | | |
| | | | |
Distributions to shareholders from | | | | | | | | | | | | | | | | |
Net investment income | | | | | | | | | | | | | | | | |
Class A | | | | | | | (1,787,120 | ) | | | | | | | (3,275,149 | ) |
Class C | | | | | | | (15,337 | ) | | | | | | | (21,988 | ) |
Administrator Class | | | | | | | (245,814 | ) | | | | | | | (314,568 | ) |
Institutional Class | | | | | | | (8,408,465 | ) | | | | | | | (16,612,992 | ) |
| | | | |
Total distributions to shareholders | | | | | | | (10,456,736 | ) | | | | | | | (20,224,697 | ) |
| | | | |
| | | | |
Capital share transactions | | | Shares | | | | | | | | Shares | | | | | |
Proceeds from shares sold | | | | | | | | | | | | | | | | |
Class A | | | 6,021,535 | | | | 51,037,682 | | | | 8,702,208 | | | | 73,793,334 | |
Class C | | | 76,658 | | | | 648,585 | | | | 156,489 | | | | 1,325,887 | |
Administrator Class | | | 5,042,710 | | | | 42,600,338 | | | | 1,447,554 | | | | 12,229,691 | |
Institutional Class | | | 57,933,957 | | | | 490,813,226 | | | | 131,295,470 | | | | 1,113,341,644 | |
| | | | |
| | | | | | | 585,099,831 | | | | | | | | 1,200,690,556 | |
| | | | |
Reinvestment of distributions | | | | | | | | | | | | | | | | |
Class A | | | 204,712 | | | | 1,733,776 | | | | 372,917 | | | | 3,162,637 | |
Class C | | | 1,795 | | | | 15,178 | | | | 2,557 | | | | 21,662 | |
Administrator Class | | | 28,666 | | | | 241,948 | | | | 36,668 | | | | 309,753 | |
Institutional Class | | | 377,959 | | | | 3,200,704 | | | | 844,776 | | | | 7,162,350 | |
| | | | |
| | | | | | | 5,191,606 | | | | | | | | 10,656,402 | |
| | | | |
Payment for shares redeemed | | | | | | | | | | | | | | | | |
Class A | | | (7,571,625 | ) | | | (64,153,216 | ) | | | (14,399,228 | ) | | | (122,123,201 | ) |
Class C | | | (142,603 | ) | | | (1,207,161 | ) | | | (359,267 | ) | | | (3,043,190 | ) |
Administrator Class | | | (6,140,632 | ) | | | (51,838,396 | ) | | | (1,414,056 | ) | | | (11,944,464 | ) |
Institutional Class | | | (77,181,618 | ) | | | (653,749,111 | ) | | | (147,978,477 | ) | | | (1,254,571,635 | ) |
| | | | |
| | | | | | | (770,947,884 | ) | | | | | | | (1,391,682,490 | ) |
| | | | |
Net decrease in net assets resulting from capital share transactions | | | | | | | (180,656,447 | ) | | | | | | | (180,335,532 | ) |
| | | | |
Total decrease in net assets | | | | | | | (185,163,265 | ) | | | | | | | (182,228,600 | ) |
| | | | |
| | | | |
Net assets | | | | | | | | | | | | | | | | |
Beginning of period | | | | | | | 1,368,992,051 | | | | | | | | 1,551,220,651 | |
| | | | |
End of period | | | | | | $ | 1,183,828,786 | | | | | | | $ | 1,368,992,051 | |
| | | | |
Overdistributed net investment income | | | | | | $ | (725,195 | ) | | | | | | $ | (695,973 | ) |
| | | | |
The accompanying notes are an integral part of these financial statements.
| | | | | | |
| Financial highlights | | Wells Fargo Ultra Short-Term Income Fund | | | 23 | |
(For a share outstanding throughout each period)
| | | | | | | | | | | | | | | | | | | | | | | | |
| | | Six months ended
February 28, 2018 (unaudited) | | | Year ended August 31 | |
| CLASS A | | | 2017 | | | 2016 | | | 2015 | | | 2014 | | | 2013 | |
Net asset value, beginning of period | | | $8.48 | | | | $8.49 | | | | $8.46 | | | | $8.53 | | | | $8.53 | | | | $8.55 | |
Net investment income | | | 0.06 | | | | 0.09 | | | | 0.08 | | | | 0.05 | | | | 0.06 | | | | 0.06 | |
Net realized and unrealized gains (losses) on investments | | | (0.03 | ) | | | (0.01 | ) | | | 0.03 | | | | (0.06 | ) | | | 0.00 | | | | (0.02 | ) |
| | | | | | | | | | | | | | | | | | | | | | | | |
Total from investment operations | | | 0.03 | | | | 0.08 | | | | 0.11 | | | | (0.01 | ) | | | 0.06 | | | | 0.04 | |
Distributions to shareholders from | | | | | | | | | | | | | | | | | | | | | | | | |
Net investment income | | | (0.06 | ) | | | (0.09 | ) | | | (0.08 | ) | | | (0.05 | ) | | | (0.06 | ) | | | (0.06 | ) |
Tax basis return of capital | | | 0.00 | | | | 0.00 | | | | 0.00 | | | | (0.01 | ) | | | 0.00 | | | | 0.00 | |
| | | | | | | | | | | | | | | | | | | | | | | | |
Total distributions to shareholders | | | (0.06 | ) | | | (0.09 | ) | | | (0.08 | ) | | | (0.06 | ) | | | (0.06 | ) | | | (0.06 | ) |
Net asset value, end of period | | | $8.45 | | | | $8.48 | | | | $8.49 | | | | $8.46 | | | | $8.53 | | | | $8.53 | |
Total return1 | | | 0.30 | % | | | 0.97 | % | | | 1.28 | % | | | (0.07 | )% | | | 0.74 | % | | | 0.52 | % |
Ratios to average net assets (annualized) | | | | | | | | | | | | | | | | | | | | | | | | |
Gross expenses | | | 0.80 | % | | | 0.79 | % | | | 0.79 | % | | | 0.77 | % | | | 0.78 | % | | | 0.83 | % |
Net expenses | | | 0.70 | % | | | 0.70 | % | | | 0.70 | % | | | 0.70 | % | | | 0.70 | % | | | 0.70 | % |
Net investment income | | | 1.31 | % | | | 1.09 | % | | | 0.93 | % | | | 0.64 | % | | | 0.70 | % | | | 0.72 | % |
Supplemental data | | | | | | | | | | | | | | | | | | | | | | | | |
Portfolio turnover rate | | | 30 | % | | | 56 | % | | | 51 | % | | | 70 | % | | | 47 | % | | | 56 | % |
Net assets, end of period (000s omitted) | | | $261,747 | | | | $274,079 | | | | $319,565 | | | | $151,561 | | | | $196,459 | | | | $158,363 | |
| 1 | Total return calculations do not include any sales charges. Returns for periods of less than one year are not annualized. |
The accompanying notes are an integral part of these financial statements.
| | | | |
| 24 | | Wells Fargo Ultra Short-Term Income Fund | | Financial highlights |
(For a share outstanding throughout each period)
| | | | | | | | | | | | | | | | | | | | | | | | |
| | | Six months ended
February 28, 2018 (unaudited) | | | Year ended August 31 | |
| CLASS C | | | 2017 | | | 2016 | | | 2015 | | | 2014 | | | 2013 | |
Net asset value, beginning of period | | | $8.47 | | | | $8.48 | | | | $8.45 | | | | $8.52 | | | | $8.52 | | | | $8.55 | |
Net investment income (loss) | | | 0.02 | | | | 0.02 | | | | 0.01 | | | | (0.01 | ) | | | (0.01 | ) | | | (0.00 | )1 |
Net realized and unrealized gains (losses) on investments | | | (0.03 | ) | | | 0.00 | | | | 0.03 | | | | (0.06 | ) | | | 0.01 | | | | (0.03 | ) |
| | | | | | | | | | | | | | | | | | | | | | | | |
Total from investment operations | | | (0.01 | ) | | | 0.02 | | | | 0.04 | | | | (0.07 | ) | | | 0.00 | | | | (0.03 | ) |
Distributions to shareholders from | | | | | | | | | | | | | | | | | | | | | | | | |
Net investment income | | | (0.02 | ) | | | (0.03 | ) | | | (0.01 | ) | | | (0.00 | )1 | | | (0.00 | )1 | | | (0.00 | )1 |
Tax basis return of capital | | | 0.00 | | | | 0.00 | | | | 0.00 | | | | (0.00 | )1 | | | 0.00 | | | | 0.00 | |
| | | | | | | | | | | | | | | | | | | | | | | | |
Total distributions to shareholders | | | (0.02 | ) | | | (0.03 | ) | | | (0.01 | ) | | | (0.00 | )1 | | | (0.00 | )1 | | | (0.00 | )1 |
Net asset value, end of period | | | $8.44 | | | | $8.47 | | | | $8.48 | | | | $8.45 | | | | $8.52 | | | | $8.52 | |
Total return2 | | | (0.07 | )% | | | 0.22 | % | | | 0.52 | % | | | (0.81 | )% | | | 0.05 | % | | | (0.31 | )% |
Ratios to average net assets (annualized) | | | | | | | | | | | | | | | | | | | | | | | | |
Gross expenses | | | 1.55 | % | | | 1.54 | % | | | 1.54 | % | | | 1.52 | % | | | 1.53 | % | | | 1.59 | % |
Net expenses | | | 1.45 | % | | | 1.45 | % | | | 1.45 | % | | | 1.45 | % | | | 1.45 | % | | | 1.45 | % |
Net investment income (loss) | | | 0.55 | % | | | 0.34 | % | | | 0.17 | % | | | (0.10 | )% | | | (0.05 | )% | | | (0.02 | )% |
Supplemental data | | | | | | | | | | | | | | | | | | | | | | | | |
Portfolio turnover rate | | | 30 | % | | | 56 | % | | | 51 | % | | | 70 | % | | | 47 | % | | | 56 | % |
Net assets, end of period (000s omitted) | | | $5,198 | | | | $5,760 | | | | $7,464 | | | | $7,642 | | | | $9,078 | | | | $11,859 | |
| 1 | Amount is less than $0.005. |
| 2 | Total return calculations do not include any sales charges. Returns for periods of less than one year are not annualized. |
The accompanying notes are an integral part of these financial statements.
| | | | | | |
| Financial highlights | | Wells Fargo Ultra Short-Term Income Fund | | | 25 | |
(For a share outstanding throughout each period)
| | | | | | | | | | | | | | | | | | | | | | | | |
| | | Six months ended
February 28, 2018 (unaudited) | | | Year ended August 31 | |
| ADMINISTRATOR CLASS | | | 2017 | | | 2016 | | | 2015 | | | 2014 | | | 2013 | |
Net asset value, beginning of period | | | $8.45 | | | | $8.46 | | | | $8.42 | | | | $8.50 | | | | $8.50 | | | | $8.52 | |
Net investment income | | | 0.06 | | | | 0.10 | | | | 0.09 | | | | 0.07 | 1 | | | 0.07 | | | | 0.07 | |
Net realized and unrealized gains (losses) on investments | | | (0.03 | ) | | | (0.01 | ) | | | 0.04 | | | | (0.07 | ) | | | 0.01 | | | | (0.01 | ) |
| | | | | | | | | | | | | | | | | | | | | | | | |
Total from investment operations | | | 0.03 | | | | 0.09 | | | | 0.13 | | | | 0.00 | | | | 0.08 | | | | 0.06 | |
Distributions to shareholders from | | | | | | | | | | | | | | | | | | | | | | | | |
Net investment income | | | (0.06 | ) | | | (0.10 | ) | | | (0.09 | ) | | | (0.07 | ) | | | (0.08 | ) | | | (0.08 | ) |
Tax basis return of capital | | | 0.00 | | | | 0.00 | | | | 0.00 | | | | (0.01 | ) | | | 0.00 | | | | 0.00 | |
| | | | | | | | | | | | | | | | | | | | | | | | |
Total distributions to shareholders | | | (0.06 | ) | | | (0.10 | ) | | | (0.09 | ) | | | (0.08 | ) | | | (0.08 | ) | | | (0.08 | ) |
Net asset value, end of period | | | $8.42 | | | | $8.45 | | | | $8.46 | | | | $8.42 | | | | $8.50 | | | | $8.50 | |
Total return2 | | | 0.37 | % | | | 1.12 | % | | | 1.55 | % | | | (0.04 | )% | | | 0.89 | % | | | 0.67 | % |
Ratios to average net assets (annualized) | | | | | | | | | | | | | | | | | | | | | | | | |
Gross expenses | | | 0.74 | % | | | 0.73 | % | | | 0.73 | % | | | 0.71 | % | | | 0.72 | % | | | 0.77 | % |
Net expenses | | | 0.55 | % | | | 0.55 | % | | | 0.55 | % | | | 0.55 | % | | | 0.55 | % | | | 0.55 | % |
Net investment income | | | 1.43 | % | | | 1.24 | % | | | 1.05 | % | | | 0.81 | % | | | 0.84 | % | | | 0.87 | % |
Supplemental data | | | | | | | | | | | | | | | | | | | | | | | | |
Portfolio turnover rate | | | 30 | % | | | 56 | % | | | 51 | % | | | 70 | % | | | 47 | % | | | 56 | % |
Net assets, end of period (000s omitted) | | | $18,141 | | | | $27,245 | | | | $26,679 | | | | $44,682 | | | | $119,884 | | | | $145,498 | |
| 1 | Calculated based upon average shares outstanding |
| 2 | Returns for periods of less than one year are not annualized. |
The accompanying notes are an integral part of these financial statements.
| | | | |
| 26 | | Wells Fargo Ultra Short-Term Income Fund | | Financial highlights |
(For a share outstanding throughout each period)
| | | | | | | | | | | | | | | | | | | | | | | | |
| | | Six months ended
February 28, 2018 (unaudited) | | | Year ended August 31 | |
| INSTITUTIONAL CLASS | | | 2017 | | | 2016 | | | 2015 | | | 2014 | | | 2013 | |
Net asset value, beginning of period | | | $8.48 | | | | $8.49 | | | | $8.45 | | | | $8.53 | | | | $8.52 | | | | $8.55 | |
Net investment income | | | 0.07 | | | | 0.12 | | | | 0.11 | | | | 0.08 | | | | 0.09 | | | | 0.09 | |
Net realized and unrealized gains (losses) on investments | | | (0.03 | ) | | | (0.01 | ) | | | 0.04 | | | | (0.07 | ) | | | 0.01 | | | | (0.03 | ) |
| | | | | | | | | | | | | | | | | | | | | | | | |
Total from investment operations | | | 0.04 | | | | 0.11 | | | | 0.15 | | | | 0.01 | | | | 0.10 | | | | 0.06 | |
Distributions to shareholders from | | | | | | | | | | | | | | | | | | | | | | | | |
Net investment income | | | (0.07 | ) | | | (0.12 | ) | | | (0.11 | ) | | | (0.08 | ) | | | (0.09 | ) | | | (0.09 | ) |
Tax basis return of capital | | | 0.00 | | | | 0.00 | | | | 0.00 | | | | (0.01 | ) | | | 0.00 | | | | 0.00 | |
| | | | | | | | | | | | | | | | | | | | | | | | |
Total distributions to shareholders | | | (0.07 | ) | | | (0.12 | ) | | | (0.11 | ) | | | (0.09 | ) | | | (0.09 | ) | | | (0.09 | ) |
Net asset value, end of period | | | $8.45 | | | | $8.48 | | | | $8.49 | | | | $8.45 | | | | $8.53 | | | | $8.52 | |
Total return1 | | | 0.47 | % | | | 1.33 | % | | | 1.75 | % | | | 0.16 | % | | | 1.21 | % | | | 0.75 | % |
Ratios to average net assets (annualized) | | | | | | | | | | | | | | | | | | | | | | | | |
Gross expenses | | | 0.47 | % | | | 0.46 | % | | | 0.46 | % | | | 0.44 | % | | | 0.45 | % | | | 0.50 | % |
Net expenses | | | 0.35 | % | | | 0.35 | % | | | 0.35 | % | | | 0.35 | % | | | 0.35 | % | | | 0.35 | % |
Net investment income | | | 1.65 | % | | | 1.43 | % | | | 1.27 | % | | | 0.99 | % | | | 1.05 | % | | | 1.07 | % |
Supplemental data | | | | | | | | | | | | | | | | | | | | | | | | |
Portfolio turnover rate | | | 30 | % | | | 56 | % | | | 51 | % | | | 70 | % | | | 47 | % | | | 56 | % |
Net assets, end of period (000s omitted) | | | $898,743 | | | | $1,061,908 | | | | $1,197,514 | | | | $1,137,808 | | | | $1,418,101 | | | | $996,437 | |
| 1 | Returns for periods of less than one year are not annualized. |
The accompanying notes are an integral part of these financial statements.
| | | | | | |
| Notes to financial statements (unaudited) | | Wells Fargo Ultra Short-Term Income Fund | | | 27 | |
1. ORGANIZATION
Wells Fargo Funds Trust (the “Trust”), a Delaware statutory trust organized on March 10, 1999, is an open-end management investment company registered under the Investment Company Act of 1940, as amended (the “1940 Act”). As an investment company, the Trust follows the accounting and reporting guidance in Financial Accounting Standards Board Accounting Standards Codification Topic 946, Financial Services – Investment Companies. These financial statements report on the Wells Fargo Ultra Short-Term Income Fund (the “Fund”) which is a diversified series of the Trust.
2. SIGNIFICANT ACCOUNTING POLICIES
The following significant accounting policies, which are consistently followed in the preparation of the financial statements of the Fund, are in conformity with U.S. generally accepted accounting principles which require management to make estimates and assumptions that affect the reported amounts of assets and liabilities, disclosure of contingent assets and liabilities at the date of the financial statements, and the reported amounts of revenues and expenses during the reporting period. Actual results could differ from those estimates.
Securities valuation
All investments are valued each business day as of the close of regular trading on the New York Stock Exchange (generally 4 p.m. Eastern Time), although the Fund may deviate from this calculation time under unusual or unexpected circumstances.
Debt securities are valued at the evaluated bid price provided by an independent pricing service or, if a reliable price is not available, the quoted bid price from an independent broker-dealer.
Futures that are listed on a foreign or domestic exchange or market are valued at the official closing price or, if none, the last sales price.
Investments in registered open-end investment companies are valued at net asset value. Interests in non-registered investment companies that are redeemable at net asset value are fair valued normally at net asset value.
Investments which are not valued using any of the methods discussed above are valued at their fair value, as determined in good faith by the Board of Trustees of the Fund. The Board of Trustees has established a Valuation Committee comprised of the Trustees and has delegated to it the authority to take any actions regarding the valuation of portfolio securities that the Valuation Committee deems necessary or appropriate, including determining the fair value of portfolio securities, unless the determination has been delegated to the Wells Fargo Asset Management Pricing Committee at Wells Fargo Funds Management, LLC (“Funds Management”). The Board of Trustees retains the authority to make or ratify any valuation decisions or approve any changes to the Valuation Procedures as it deems appropriate. On a quarterly basis, the Board of Trustees receives reports on any valuation actions taken by the Valuation Committee or the Wells Fargo Asset Management Pricing Committee which may include items for ratification.
Valuations of fair valued securities are compared to the next actual sales price when available, or other appropriate market values, to assess the continued appropriateness of the fair valuation methodologies used. These securities are fair valued on a day-to-day basis, taking into consideration changes to appropriate market information and any significant changes to the inputs considered in the valuation process until there is a readily available price provided on an exchange or by an independent pricing service. Valuations received from an independent pricing service or independent broker-dealer quotes are periodically validated by comparisons to most recent trades and valuations provided by other independent pricing services in addition to the review of prices by the manager and/or subadviser. Unobservable inputs used in determining fair valuations are identified based on the type of security, taking into consideration factors utilized by market participants in valuing the investment, knowledge about the issuer and the current market environment.
Securities lending
The Fund may lend its securities from time to time in order to earn additional income in the form of fees or interest on securities received as collateral or the investment of any cash received as collateral. The Fund continues to receive interest or dividends on the securities loaned. The Fund receives collateral in the form of cash or securities with a value at least equal to the value of the securities on loan. The value of the loaned securities is determined at the close of each business day and any additional required collateral is delivered to the Fund on the next business day. In a securities lending transaction, the net asset value of the Fund will be affected by an increase or decrease in the value of the securities loaned and by an increase or decrease in the value of the instrument in which collateral is invested. The amount of securities lending activity undertaken by the Fund fluctuates from time to time. In the event of default or bankruptcy by the borrower, the Fund may be prevented from recovering the loaned securities or gaining access to the collateral or may experience delays or costs in doing so. In addition, the investment of any cash collateral received may lose all or part of its value. The Fund has the right under the lending agreement to recover the securities from the borrower on demand.
| | | | |
| 28 | | Wells Fargo Ultra Short-Term Income Fund | | Notes to financial statements (unaudited) |
Fund is exempt from registration under Section 3(c)(7) of the 1940 Act and is managed by Funds Management and is subadvised by Wells Capital Management Incorporated (“WellsCap”), an affiliate of Funds Management and an indirect wholly owned subsidiary of Wells Fargo & Company (“Wells Fargo”). Funds Management receives an advisory fee starting at 0.05% and declining to 0.01% as the average daily net assets of the Securities Lending Fund increase. All of the fees received by Funds Management are paid to WellsCap for its services as subadviser. The Securities Lending Fund seeks to provide a positive return compared to the daily Fed Funds Open Rate by investing in high-quality, U.S. dollar-denominated short-term money market instruments. Securities Lending Fund investments are valued at the evaluated bid price provided by an independent pricing service. Income earned from investment in the Securities Lending Fund, if any, is included in income from affiliated securities on the Statement of Operations.
When-issued transactions
The Fund may purchase securities on a forward commitment or when-issued basis. The Fund records a when-issued transaction on the trade date and will segregate assets in an amount at least equal in value to the Fund’s commitment to purchase when-issued securities. Securities purchased on a when-issued basis are marked-to-market daily and the Fund begins earning interest on the settlement date. Losses may arise due to changes in the market value of the underlying securities or if the counterparty does not perform under the contract.
Futures contracts
The Fund is subject to interest rate risk in the normal course of pursuing its investment objectives. The Fund may buy and sell futures contracts in order to gain exposure to, or protect against, changes in interest rates. The primary risks associated with the use of futures contracts are the imperfect correlation between changes in market values of securities held by the Fund and the prices of futures contracts, and the possibility of an illiquid market.
The aggregate principal amounts of the contracts are not recorded in the financial statements. Fluctuations in the value of the contracts are recorded in the Statement of Assets and Liabilities as an asset or liability and in the Statement of Operations as unrealized gains or losses until the contracts are closed, at which point they are recorded as net realized gains or losses on futures contracts. With futures contracts, there is minimal counterparty risk to the Fund since futures are exchange traded and the exchange’s clearinghouse, as counterparty to all exchange traded futures, guarantees the futures against default.
Security transactions and income recognition
Securities transactions are recorded on a trade date basis. Realized gains or losses are recorded on the basis of identified cost.
Interest income is accrued daily and bond discounts are accreted and premiums are amortized daily. To the extent debt obligations are placed on non-accrual status, any related interest income may be reduced by writing off interest receivables when the collection of all or a portion of interest has been determined to be doubtful based on consistently applied procedures and the fair value has decreased. If the issuer subsequently resumes interest payments or when the collectability of interest is reasonably assured, the debt obligation is removed from non-accrual status at year end.
Distributions to shareholders
Distributions to shareholders from net investment income are declared daily and paid monthly. Distributions from net realized gains, if any, are recorded on the ex-dividend date and paid at least annually. Such distributions are determined in accordance with income tax regulations and may differ from U.S. generally accepted accounting principles. Dividend sources are estimated at the time of declaration. The tax character of distributions is determined as of the Fund’s fiscal year end. Therefore, a portion of the Fund’s distributions made prior to the Fund’s fiscal year end may be categorized as a tax return of capital at year end.
Federal and other taxes
The Fund intends to continue to qualify as a regulated investment company by distributing substantially all of its investment company taxable income and any net realized capital gains (after reduction for capital loss carryforwards) sufficient to relieve it from all, or substantially all, federal income taxes. Accordingly, no provision for federal income taxes was required.
The Fund’s income and federal excise tax returns and all financial records supporting those returns for the prior three fiscal years are subject to examination by the federal and Delaware revenue authorities. Management has analyzed the Fund’s tax positions taken on federal, state, and foreign tax returns for all open tax years and does not believe that there are any uncertain tax positions that require recognition of a tax liability.
| | | | | | |
| Notes to financial statements (unaudited) | | Wells Fargo Ultra Short-Term Income Fund | | | 29 | |
As of February 28, 2018, the aggregate cost of all investments for federal income tax purposes was $1,187,016,080 and the unrealized gains (losses) consisted of:
| | | | |
Gross unrealized gains | | $ | 1,513,393 | |
Gross unrealized losses | | | (9,289,141 | ) |
Net unrealized losses | | $ | (7,775,748 | ) |
Capital loss carryforwards that do not expire are required to be utilized prior to capital loss carryforwards that expire. As of August 31, 2017, capital loss carryforwards available to offset future net realized capital gains were as follows through the indicated expiration dates:
| | | | | | |
| | | | | No expiration |
| 2018 | | 2019 | | Short-term | | Long-term |
| $7,738,751 | | $7,448,920 | | $3,146,673 | | $26,445,663 |
As of August 31, 2017, the Fund had current year deferred post-October capital losses consisting of $135,479 in short-term losses and $147,677 in long-term losses which were recognized on the first day of the current fiscal year.
Class allocations
The separate classes of shares offered by the Fund differ principally in applicable sales charges, distribution, shareholder servicing, and administration fees. Class specific expenses are charged directly to that share class. Investment income, common expenses, and realized and unrealized gains (losses) on investments are allocated daily to each class of shares based on the relative proportion of net assets of each class.
3. FAIR VALUATION MEASUREMENTS
Fair value measurements of investments are determined within a framework that has established a fair value hierarchy based upon the various data inputs utilized in determining the value of the Fund’s investments. The three-level hierarchy gives the highest priority to unadjusted quoted prices in active markets for identical assets or liabilities (Level 1) and the lowest priority to unobservable inputs (Level 3). The Fund’s investments are classified within the fair value hierarchy based on the lowest level of input that is significant to the fair value measurement. The inputs are summarized into three broad levels as follows:
| ∎ | | Level 1 – quoted prices in active markets for identical securities |
| ∎ | | Level 2 – other significant observable inputs (including quoted prices for similar securities, interest rates, prepayment speeds, credit risk, etc.) |
| ∎ | | Level 3 – significant unobservable inputs (including the Fund’s own assumptions in determining the fair value of investments) |
The inputs or methodologies used for valuing investments in securities are not necessarily an indication of the risk associated with investing in those securities.
| | | | |
| 30 | | Wells Fargo Ultra Short-Term Income Fund | | Notes to financial statements (unaudited) |
The following is a summary of the inputs used in valuing the Fund’s assets and liabilities as of February 28, 2018:
| | | | | | | | | | | | | | | | |
| | | Quoted prices
(Level 1) | | | Other significant
observable inputs (Level 2) | | | Significant
unobservable inputs (Level 3) | | | Total | |
Assets | | | | | | | | | | | | | | | | |
Investments in: | | | | | | | | | | | | | | | | |
| | | | |
Agency securities | | $ | 0 | | | $ | 148,991,771 | | | $ | 0 | | | $ | 148,991,771 | |
| | | | |
Asset-backed securities | | | 0 | | | | 145,789,284 | | | | 0 | | | | 145,789,284 | |
| | | | |
Corporate bonds and notes | | | 0 | | | | 406,992,960 | | | | 0 | | | | 406,992,960 | |
| | | | |
Municipal obligations | | | 0 | | | | 31,413,661 | | | | 0 | | | | 31,413,661 | |
| | | | |
Non-agency mortgage-backed securities | | | 0 | | | | 215,175,440 | | | | 0 | | | | 215,175,440 | |
| | | | |
Yankee corporate bonds and notes | | | 0 | | | | 211,690,107 | | | | 0 | | | | 211,690,107 | |
| | | | |
Short-term investments | | | | | | | | | | | | | | | | |
Commercial paper | | | 0 | | | | 12,599,265 | | | | 0 | | | | 12,599,265 | |
Investment companies | | | 3,322,313 | | | | 0 | | | | 0 | | | | 3,322,313 | |
U.S. Treasury securities | | | 1,949,018 | | | | 0 | | | | 0 | | | | 1,949,018 | |
Investments measured at net asset value* | | | | | | | | | | | | | | | 1,020,000 | |
| | | 5,271,331 | | | | 1,172,652,488 | | | | 0 | | | | 1,178,943,819 | |
Futures contracts | | | 296,513 | | | | 0 | | | | 0 | | | | 296,513 | |
Total assets | | $ | 5,567,844 | | | $ | 1,172,652,488 | | | $ | 0 | | | $ | 1,179,240,332 | |
| * | Investments that are measured at fair value using the net asset value per share (or its equivalent) as a practical expedient have not been categorized in the fair value hierarchy. The fair value amount presented in the table is intended to permit reconciliation of the fair value hierarchy to the amounts presented in the Statement of Assets and Liabilities. The Fund’s investment in Securities Lending Cash Investments, LLC valued at $1,020,000 does not have a redemption period notice, can be redeemed daily and does not have any unfunded commitments. |
Futures contracts are reported at the cumulative unrealized gains or losses at measurement date. The current day’s variation margin is reported on the Statement of assets and liabilities. All other assets and liabilities are reported at their market value at measurement date.
The Fund recognizes transfers between levels within the fair value hierarchy at the end of the reporting period. At February 28, 2018, the Fund did not have any transfers into/out of Level 1, Level 2, or Level 3.
4. TRANSACTIONS WITH AFFILIATES
Management fee
Funds Management, an indirect wholly owned subsidiary of Wells Fargo, is the manager of the Fund and provides advisory and fund-level administrative services under an investment management agreement. Under the investment management agreement, Funds Management is responsible for, among other services, implementing the investment objectives and strategies of the Fund, supervising the subadviser, providing fund-level administrative services in connection with the Fund’s operations, and providing any other fund-level administrative services reasonably necessary for the operation of the Fund. As compensation for its services under the investment management agreement, Funds Management is entitled to receive an annual management fee starting at 0.35% and declining to 0.255% as the average daily net assets of the Fund increase. For the six months ended February 28, 2018, the management fee was equivalent to an annual rate of 0.34% of the Fund’s average daily net assets.
Funds Management has retained the services of a subadviser to provide daily portfolio management to the Fund. The fee for subadvisory services is borne by Funds Management. WellsCap is the subadviser to the Fund and is entitled to receive a fee from Funds Management at an annual rate starting at 0.15% and declining to 0.05% as the average daily net assets of the Fund increase.
Administration fees
Under a class-level administration agreement, Funds Management provides class-level administrative services to the Fund, which includes paying fees and expenses for services provided by the transfer agent, sub-transfer agents, omnibus account
| | | | | | |
| Notes to financial statements (unaudited) | | Wells Fargo Ultra Short-Term Income Fund | | | 31 | |
servicers and record-keepers. As compensation for its services under the class-level administration agreement, Funds Management receives an annual fee which is calculated based on the average daily net assets of each class as follows:
| | | | |
| | | Class-level
administration fee | |
Class A, Class C | | | 0.16 | % |
Administrator Class | | | 0.10 | |
Institutional Class | | | 0.08 | |
Funds Management has contractually waived and/or reimbursed management and administration fees to the extent necessary to maintain certain net operating expense ratios for the Fund. Waiver of fees and/or reimbursement of expenses by Funds Management were made first from fund level expenses on a proportionate basis and then from class specific expenses. Funds Management has committed through December 31, 2018 to waive fees and/or reimburse expenses to the extent necessary to cap the Fund’s expenses at 0.70% for Class A shares, 1.45% for Class C shares, 0.55% for Administrator Class shares, and 0.35% for Institutional Class shares. After this time, the cap may be increased or the commitment to maintain the cap may be terminated only with the approval of the Board of Trustees.
Distribution fee
The Trust has adopted a distribution plan for Class C shares of the Fund pursuant to Rule 12b-1 under the 1940 Act. A distribution fee is charged to Class C shares and paid to Wells Fargo Funds Distributor, LLC (“Funds Distributor”), the principal underwriter, at an annual rate of 0.75% of the average daily net assets of Class C shares.
In addition, Funds Distributor is entitled to receive the front-end sales charge from the purchase of Class A shares and a contingent deferred sales charge on the redemption of certain Class A shares. Funds Distributor is also entitled to receive the contingent deferred sales charges from redemptions of Class C shares. For the six months ended February 28, 2018, Funds Distributor received $989 from the sale of Class A shares. No contingent deferred sales charges were incurred by Class A and Class C shares for the six months ended February 28, 2018.
Shareholder servicing fees
The Trust has entered into contracts with one or more shareholder servicing agents, whereby Class A, Class C, and Administrator Class of the Fund are charged a fee at an annual rate of 0.25% of the average daily net assets of each respective class.
A portion of these total shareholder servicing fees were paid to affiliates of Wells Fargo.
Interfund transactions
The Fund may purchase or sell portfolio investment securities to certain other Wells Fargo affiliates pursuant to Rule 17a-7 under the 1940 Act and under procedures adopted by the Board of Trustees. The procedures have been designed to ensure that these interfund transactions, which do not incur broker commissions, are effected at current market prices.
5. INVESTMENT PORTFOLIO TRANSACTIONS
Purchases and sales of investments, excluding short-term securities, for the six months ended February 28, 2018 were as follows:
| | | | | | |
Purchases at cost | | Sales proceeds |
U.S.
government | | Non-U.S.
government | | U.S.
government | | Non-U.S.
government |
| $33,033,659 | | $406,328,331 | | $4,162,887 | | $359,152,173 |
6. DERIVATIVE TRANSACTIONS
During the six months ended February 28, 2018, the Fund entered into futures contracts to speculate on interest rates and to help manage the duration of the portfolio. The Fund had an average notional amount of $365,688,216 in short futures contracts during the six months ended February 28, 2018.
On February 28, 2018, the cumulative unrealized gains on futures contracts in the amount of $296,513 are reflected in net unrealized losses on investments on the Statement of Assets and Liabilities. The payable for daily variation margin on open futures contracts reflected in the Statement of Assets and Liabilities only represents the current day’s variation margin. The realized gains and change in unrealized gains (losses) on futures contracts are reflected in the Statement of Operations.
| | | | |
| 32 | | Wells Fargo Ultra Short-Term Income Fund | | Notes to financial statements (unaudited) |
For certain types of derivative transactions, the Fund has entered into International Swaps and Derivatives Association, Inc. master agreements (“ISDA Master Agreements”) or similar agreements with approved counterparties. The ISDA Master Agreements or similar agreements may have requirements to deliver/deposit securities or cash to/with an exchange or broker-dealer as collateral and allows the Fund to offset, with each counterparty, certain derivative financial instrument’s assets and/or liabilities with collateral held or pledged. Collateral requirements differ by type of derivative. Collateral or margin requirements are set by the broker or exchange clearinghouse for exchange traded derivatives while collateral terms are contract specific for over-the-counter traded derivatives. Cash collateral that has been pledged to cover obligations of the Fund under ISDA Master Agreements or similar agreements, if any, are reported separately in the Statement of Assets and Liabilities. Securities pledged as collateral, if any, are noted in the Portfolio of Investments. With respect to balance sheet offsetting, absent an event of default by the counterparty or a termination of the agreement, the reported amounts of financial assets and financial liabilities in the Statement of Assets and Liabilities are not offset across transactions between the Fund and the applicable counterparty. A reconciliation of the gross amounts on the Statement of Assets and Liabilities to the net amounts by counterparty, including any collateral exposure, is as follows:
| | | | | | | | | | | | |
| Counterparty | | Gross amounts of assets in the Statement of Assets and Liabilities | | Amounts subject to netting agreements | | Collateral
received | | | Net amount of liabilities | |
JP Morgan | | $296,513* | | $0 | | $ | 0 | | | $ | 296,513 | |
| | * | Amount represents unrealized gains on futures contracts which are reported in Net unrealized losses on investments. Only the current day’s variation margin as of February 28, 2018 is reported separately on the Statement of Assets and Liabilities. | |
7. BANK BORROWINGS
The Trust (excluding the money market funds and certain other funds) and Wells Fargo Variable Trust are parties to a $280,000,000 revolving credit agreement whereby the Fund is permitted to use bank borrowings for temporary or emergency purposes, such as to fund shareholder redemption requests. Interest under the credit agreement is charged to the Fund based on a borrowing rate equal to the higher of the Federal Funds rate in effect on that day plus 1.25% or the overnight LIBOR rate in effect on that day plus 1.25%. In addition, an annual commitment fee equal to 0.25% of the unused balance is allocated to each participating fund.
For the six months ended February 28, 2018, there were no borrowings by the Fund under the agreement.
8. INDEMNIFICATION
Under the Trust’s organizational documents, the officers and Trustees have been granted certain indemnification rights against certain liabilities that may arise out of performance of their duties to the Trust. Additionally, in the normal course of business, the Trust may enter into contracts with service providers that contain a variety of indemnification clauses. The Trust’s maximum exposure under these arrangements is dependent on future claims that may be made against the Fund and, therefore, cannot be estimated.
| | | | | | |
| Other information (unaudited) | | Wells Fargo Ultra Short-Term Income Fund | | | 33 | |
PROXY VOTING INFORMATION
A description of the policies and procedures that the Fund uses to determine how to vote proxies relating to portfolio securities is available, upon request, by calling 1-800-222-8222, visiting our website at wellsfargofunds.com, or visiting the SEC website at sec.gov. Information regarding how the Fund voted proxies relating to portfolio securities during the most recent 12-month period ended June 30 is available on the Fund’s website at wellsfargofunds.com or by visiting the SEC website at sec.gov.
PORTFOLIO HOLDINGS INFORMATION
The complete portfolio holdings for the Fund are publicly available monthly on the Fund’s website (wellsfargofunds.com), on a one-month delayed basis. In addition, top ten holdings information (excluding derivative positions) for the Fund is publicly available on the Fund’s website on a monthly, seven-day or more delayed basis. The Fund files its complete schedule of portfolio holdings with the SEC for the first and third quarters of each fiscal year on Form N-Q, which is available by visiting the SEC website at sec.gov. In addition, the Fund’s Form N-Q may be reviewed and copied at the SEC’s Public Reference Room in Washington, DC, and at regional offices in New York City, at 233 Broadway, and in Chicago, at 175 West Jackson Boulevard, Suite 900. Information about the Public Reference Room may be obtained by calling 1-800-SEC-0330.
| | | | |
| 34 | | Wells Fargo Ultra Short-Term Income Fund | | Other information (unaudited) |
BOARD OF TRUSTEES AND OFFICERS
Each of the Trustees and Officers1 listed in the table below acts in identical capacities for each fund in the Wells Fargo family of funds, which consists of 153 mutual funds comprising the Wells Fargo Funds Trust, Wells Fargo Variable Trust, Wells Fargo Master Trust and four closed-end funds (collectively the “Fund Complex”). This table should be read in conjunction with the Prospectus and the Statement of Additional Information2. The mailing address of each Trustee and Officer is 525 Market Street, 12th Floor, San Francisco, CA 94105. Each Trustee and Officer serves an indefinite term, however, each Trustee serves such term until reaching the mandatory retirement age established by the Trustees.
Independent Trustees
| | | | | | |
Name and year of birth | | Position held and length of service* | | Principal occupations during past five years or longer | | Current other
public company or
investment company
directorships |
William R. Ebsworth (Born 1957) | | Trustee, since 2015 | | Retired. From 1984 to 2013, equities analyst, portfolio manager, research director and chief investment officer at Fidelity Management and Research Company in Boston, Tokyo, and Hong Kong, and retired in 2013 as Chief Investment Officer of Fidelity Strategic Advisers, Inc. where he led a team of investment professionals managing client assets. Prior thereto, Board member of Hong Kong Securities Clearing Co., Hong Kong Options Clearing Corp., the Thailand International Fund, Ltd., Fidelity Investments Life Insurance Company, and Empire Fidelity Investments Life Insurance Company. Board member of the Forté Foundation (non-profit organization) and the Vincent Memorial Hospital Endowment (non-profit organization), where he serves on the Investment Committee and as a Chair of the Audit Committee. Mr. Ebsworth is a CFA® charterholder. | | Asset Allocation Trust |
Jane A. Freeman** (Born 1953) | | Trustee, since 2015; Chair Liaison, since 2018 | | Retired. From 2012 to 2014 and 1999 to 2008, Chief Financial Officer of Scientific Learning Corporation. From 2008 to 2012, Ms. Freeman provided consulting services related to strategic business projects. Prior to 1999, Portfolio Manager at Rockefeller & Co. and Scudder, Stevens & Clark. Board member of the Harding Loevner Funds from 1996 to 2014, serving as both Lead Independent Director and chair of the Audit Committee. Board member of the Russell Exchange Traded Funds Trust from 2011 to 2012 and the chair of the Audit Committee. Ms. Freeman is a Board Member of Ruth Bancroft Garden (non-profit organization) and the Glimmerglass Festival. She is also an inactive Chartered Financial Analyst. | | Asset Allocation Trust |
Isaiah Harris, Jr. (Born 1952) | | Trustee, since 2009 | | Retired. Chairman of the Board of CIGNA Corporation since 2009, and Director since 2005. From 2003 to 2011, Director of Deluxe Corporation. Prior thereto, President and CEO of BellSouth Advertising and Publishing Corp. from 2005 to 2007, President and CEO of BellSouth Enterprises from 2004 to 2005 and President of BellSouth Consumer Services from 2000 to 2003. Emeritus member of the Iowa State University Foundation Board of Governors. Emeritus Member of the Advisory Board of Iowa State University School of Business. Advisory Board Member, Palm Harbor Academy (charter school). Advisory Board Member, Child Evangelism Fellowship (non-profit). Mr. Harris is a certified public accountant (inactive status). | | CIGNA Corporation; Asset Allocation Trust |
Judith M. Johnson (Born 1949) | | Trustee, since 2008; Audit Committee Chairman, since 2008 | | Retired. Prior thereto, Chief Executive Officer and Chief Investment Officer of Minneapolis Employees Retirement Fund from 1996 to 2008. Ms. Johnson is an attorney, certified public accountant and a certified managerial accountant. | | Asset Allocation Trust |
David F. Larcker (Born 1950) | | Trustee, since 2009 | | James Irvin Miller Professor of Accounting at the Graduate School of Business, Stanford University, Director of the Corporate Governance Research Initiative and Senior Faculty of The Rock Center for Corporate Governance since 2006. From 2005 to 2008, Professor of Accounting at the Graduate School of Business, Stanford University. Prior thereto, Ernst & Young Professor of Accounting at The Wharton School, University of Pennsylvania from 1985 to 2005. | | Asset Allocation Trust |
| | | | | | |
| Other information (unaudited) | | Wells Fargo Ultra Short-Term Income Fund | | | 35 | |
| | | | | | |
Name and year of birth | | Position held and length of service* | | Principal occupations during past five years or longer | | Current other
public company or
investment company
directorships |
Olivia S. Mitchell*** (Born 1953) | | Trustee, since 2006; Governance Committee Chairman, since 2018 | | International Foundation of Employee Benefit Plans Professor, Wharton School of the University of Pennsylvania since 1993. Director of Wharton’s Pension Research Council and Boettner Center on Pensions & Retirement Research, and Research Associate at the National Bureau of Economic Research. Previously, Cornell University Professor from 1978 to 1993. | | Asset Allocation Trust |
Timothy J. Penny**** (Born 1951) | | Trustee, since 1996; Chairman, since 2018; Vice Chairman, from 2017 to 2018 | | President and Chief Executive Officer of Southern Minnesota Initiative Foundation, a non-profit organization, since 2007. Member of the Board of Trustees of NorthStar Education Finance, Inc., a non-profit organization, since 2007. | | Asset Allocation Trust |
James G. Polisson***** (Born 1959) | | Trustee, since 2018; Advisory Board Member, from 2017 to 2018 | | Retired. Chief Marketing Officer, Source (ETF) UK Services, Ltd, from 2015 to 2017. From 2012 to 2015, Principal of The Polisson Group, LLC, a management consulting, corporate advisory and principal investing company. Chief Executive Officer and Managing Director at Russell Investments, Global Exchange Traded Funds from 2010 to 2012. Managing Director of Barclays Global Investors from 1998 to 2010 and Global Chief Marketing Officer for iShares and Barclays Global Investors from 2000 to 2010. Trustee of the San Francisco Mechanics’ Institute, a non-profit organization, from 2013 to 2015. Board member of the Russell Exchange Traded Fund Trust from 2011 to 2012. Director of Barclays Global Investors Holdings Deutschland GmbH from 2006 to 2009. Mr. Polisson is an attorney and has a retired status with the Massachusetts and District of Columbia Bar Associations. | | Asset Allocation Trust |
Michael S. Scofield (Born 1943) | | Trustee, since 2010 | | Served on the Investment Company Institute’s Board of Governors and Executive Committee from 2008-2011 as well the Governing Council of the Independent Directors Council from 2006-2011 and the Independent Directors Council Executive Committee from 2008-2011. Trustee of the Evergreen Fund complex (and its predecessors) from 1984 to 2010. Chairman of the Evergreen Funds from 2000-2010. Former Trustee of the Mentor Funds. Retired Attorney, Law Offices of Michael S. Scofield. | | Asset Allocation Trust |
Pamela Wheelock***** (Born 1959) | | Trustee, since 2018; Advisory Board Member, from 2017 to 2018 | | Chief Operating Officer, Twin Cities Habitat for Humanity, since January, 2017. Vice President of University Services, University of Minnesota from 2012 to 2017. Prior thereto, Interim President and Chief Executive Officer of Blue Cross Blue Shield of Minnesota from 2010 to 2011, Chairman of the Board from 2009 to 2011 and Board Director from 2003 to 2015. Vice President, Leadership and Community Engagement, Bush Foundation, Saint Paul, Minnesota (a private foundation) from 2009 to 2011. Executive Vice President and Chief Financial Officer, Minnesota Sports and Entertainment from 2004 to 2009 and Senior Vice President from 2002 to 2004. Commissioner of Finance, State of Minnesota, from 1999 to 2002. Currently on the Board of Directors, Governance Committee and Finance Committee, for the Minnesota Philanthropy Partners (Saint Paul Foundation) since 2012 and Board Chair of the Minnesota Wild Foundation since 2010. | | Asset Allocation Trust |
| * | Length of service dates reflect the Trustee’s commencement of service with the Trust’s predecessor entities, where applicable. |
| ** | Jane Freeman became Chair Liaison effective January 1, 2018. |
| *** | Olivia Mitchell became Chairman of the Governance Committee effective January 1, 2018. |
| **** | Timothy Penny became Chairman effective January 1, 2018. |
| ***** | James Polisson and Pamela Wheelock each became a Trustee effective January 1, 2018. |
| | | | |
| 36 | | Wells Fargo Ultra Short-Term Income Fund | | Other information (unaudited) |
Officers
| | | | | | |
Name and year of birth | | Position held and
length of service | | Principal occupations during past five years or longer | | |
Andrew Owen (Born 1960) | | President, since 2017 | | Executive Vice President of Wells Fargo & Company and Head of Affiliated Managers, Wells Fargo Asset Management, since 2014. In addition, Mr. Owen is currently President, Chief Executive Officer and Director of Wells Fargo Funds Management, LLC since 2017. Prior thereto, Executive Vice President responsible for marketing, investments and product development for Wells Fargo Funds Management, LLC, from 2009 to 2014. | | |
Nancy Wiser1 (Born 1967) | | Treasurer, since 2012 | | Executive Vice President of Wells Fargo Funds Management, LLC since 2011. Chief Operating Officer and Chief Compliance Officer at LightBox Capital Management LLC, from 2008 to 2011. | | |
Alexander Kymn*
(Born 1973) | | Secretary, since 2018;
Chief Legal Officer,
since 2018 | | Senior Company Counsel of Wells Fargo Bank, N.A. since 2018 (previously Senior Counsel from 2007 to 2018). Vice President of Wells Fargo Funds Management, LLC from 2008 to 2014. | | |
C. David Messman** (Born 1960) | | Secretary, since 2000; Chief Legal Officer, since 2003 | | Senior Vice President and Secretary of Wells Fargo Funds Management, LLC since 2001. Assistant General Counsel of Wells Fargo Bank, N.A. since 2013 and Vice President and Managing Counsel of Wells Fargo Bank, N.A. from 1996 to 2013. | | |
Michael H. Whitaker (Born 1967) | | Chief Compliance Officer, since 2016 | | Senior Vice President and Chief Compliance Officer since 2016. Senior Vice President and Chief Compliance Officer for Fidelity Investments from 2007 to 2016. | | |
David Berardi (Born 1975) | | Assistant Treasurer, since 2009 | | Vice President of Wells Fargo Funds Management, LLC since 2009. Vice President of Evergreen Investment Management Company, LLC from 2008 to 2010. Manager of Fund Reporting and Control for Evergreen Investment Management Company, LLC from 2004 to 2010. | | |
Jeremy DePalma1 (Born 1974) | | Assistant Treasurer, since 2009 | | Senior Vice President of Wells Fargo Funds Management, LLC since 2009. Senior Vice President of Evergreen Investment Management Company, LLC from 2008 to 2010 and head of the Fund Reporting and Control Team within Fund Administration from 2005 to 2010. | | |
| 1 | Nancy Wiser acts as Treasurer of 77 funds in the Fund Complex. Jeremy DePalma acts as Treasurer of 76 funds and Assistant Treasurer of 77 funds in the Fund Complex. |
| 2 | The Statement of Additional Information includes additional information about the Trustees and is available, without charge, upon request, by calling 1-800-222-8222 or by visiting the website at wellsfargofunds.com. |
| * | Alexander Kymn became the Secretary and Chief Legal Officer effective April 17, 2018. |
| ** | David Messman was the Secretary and Chief Legal Officer until April 16, 2018. |
| | | | | | |
| List of abbreviations | | Wells Fargo Ultra Short-Term Income Fund | | | 37 | |
The following is a list of common abbreviations for terms and entities that may have appeared in this report.
| ACA | — ACA Financial Guaranty Corporation |
| ADR | — American depositary receipt |
| ADS | — American depositary shares |
| AGC | — Assured Guaranty Corporation |
| AGM | — Assured Guaranty Municipal |
| Ambac | — Ambac Financial Group Incorporated |
| AMT | — Alternative minimum tax |
| BAN | — Bond anticipation notes |
| BHAC | — Berkshire Hathaway Assurance Corporation |
| CAB | — Capital appreciation bond |
| CCAB | — Convertible capital appreciation bond |
| CDA | — Community Development Authority |
| CDO | — Collateralized debt obligation |
| CLO | — Collateralized loan obligation |
| DRIVER | — Derivative inverse tax-exempt receipts |
| DW&P | — Department of Water & Power |
| DWR | — Department of Water Resources |
| ECFA | — Educational & Cultural Facilities Authority |
| EDA | — Economic Development Authority |
| EDFA | — Economic Development Finance Authority |
| ETF | — Exchange-traded fund |
| FDIC | — Federal Deposit Insurance Corporation |
| FFCB | — Federal Farm Credit Banks |
| FGIC | — Financial Guaranty Insurance Corporation |
| FHA | — Federal Housing Administration |
| FHLB | — Federal Home Loan Bank |
| FHLMC | — Federal Home Loan Mortgage Corporation |
| FICO | — The Financing Corporation |
| FNMA | — Federal National Mortgage Association |
| GDR | — Global depositary receipt |
| GNMA | — Government National Mortgage Association |
| HCFR | — Healthcare facilities revenue |
| HEFA | — Health & Educational Facilities Authority |
| HEFAR | — Higher education facilities authority revenue |
| HFA | — Housing Finance Authority |
| HFFA | — Health Facilities Financing Authority |
| HUD | — Department of Housing and Urban Development |
| IDA | — Industrial Development Authority |
| IDAG | — Industrial Development Agency |
| KRW | — Republic of Korea won |
| LIBOR | — London Interbank Offered Rate |
| LIFER | — Long Inverse Floating Exempt Receipts |
| LLC | — Limited liability company |
| LLLP | — Limited liability limited partnership |
| LLP | — Limited liability partnership |
| MBIA | — Municipal Bond Insurance Association |
| MFHR | — Multifamily housing revenue |
| MSTR | — Municipal securities trust receipts |
| MUD | — Municipal Utility District |
| National | — National Public Finance Guarantee Corporation |
| PCFA | — Pollution Control Financing Authority |
| PCL | — Public Company Limited |
| PCR | — Pollution control revenue |
| PFA | — Public Finance Authority |
| PFFA | — Public Facilities Financing Authority |
| PFOTER | — Puttable floating option tax-exempt receipts |
| PJSC | — Public Joint Stock Company |
| plc | — Public limited company |
| PUTTER | — Puttable tax-exempt receipts |
| R&D | — Research & development |
| Radian | — Radian Asset Assurance |
| RAN | — Revenue anticipation notes |
| RDA | — Redevelopment Agency |
| RDFA | — Redevelopment Finance Authority |
| REIT | — Real estate investment trust |
| ROC | — Reset option certificates |
| SAVRS | — Select auction variable rate securities |
| SBA | — Small Business Authority |
| SDR | — Swedish depositary receipt |
| SFHR | — Single-family housing revenue |
| SFMR | — Single-family mortgage revenue |
| SIFMA | — Securities Industry and Financial Markets Association |
| SPA | — Standby purchase agreement |
| SPDR | — Standard & Poor’s Depositary Receipts |
| SPEAR | — Short Puttable Exempt Adjustable Receipts |
| STRIPS | — Separate trading of registered interest and |
| TAN | — Tax anticipation notes |
| TIPS | — Treasury inflation-protected securities |
| TRAN | — Tax revenue anticipation notes |
| TTFA | — Transportation Trust Fund Authority |
| TVA | — Tennessee Valley Authority |
This page is intentionally left blank.
This page is intentionally left blank.
This page is intentionally left blank.

For more information
More information about Wells Fargo Funds is available free upon request. To obtain literature, please write, email, visit the Fund’s website, or call:
Wells Fargo Funds
P.O. Box 8266
Boston, MA 02266-8266
Email: fundservice@wellsfargo.com
Website: wellsfargofunds.com
Individual investors: 1-800-222-8222
Retail investment professionals: 1-888-877-9275
Institutional investment professionals:
1-866-765-0778
This report and the financial statements contained herein are submitted for the general information of the shareholders of the Fund. If this report is used for promotional purposes, distribution of the report must be accompanied or preceded by a current prospectus. Before investing, please consider the investment objectives, risks, charges, and expenses of the investment. For a current prospectus and, if available, a summary prospectus, containing this information, call 1-800-222-8222 or visit the Fund’s website at wellsfargofunds.com. Read the prospectus carefully before you invest or send money.
Wells Fargo Asset Management (WFAM) is a trade name used by the asset management businesses of Wells Fargo & Company. Wells Fargo Funds Management, LLC, a wholly owned subsidiary of Wells Fargo & Company, provides investment advisory and administrative services for Wells Fargo Funds. Other affiliates of Wells Fargo & Company provide subadvisory and other services for the funds. The funds are distributed by Wells Fargo Funds Distributor, LLC, Member FINRA, an affiliate of Wells Fargo & Company. Neither Wells Fargo Funds Distributor nor Wells Fargo Funds Management holds fund shareholder accounts or assets. This material is for general informational and educational purposes only and is NOT intended to provide investment advice or a recommendation of any kind—including a recommendation for any specific investment, strategy, or plan.
NOT FDIC INSURED ◾ NO BANK GUARANTEE ◾ MAY LOSE VALUE
© 2018 Wells Fargo Funds Management, LLC. All rights reserved.
| | |
 | | 309374 04-18 SA223/SAR223 02-18 |
ITEM 2. CODE OF ETHICS
Not applicable.
ITEM 3. AUDIT COMMITTEE FINANCIAL EXPERT
Not applicable.
ITEM 4. PRINCIPAL ACCOUNTANT FEES AND SERVICES
Not applicable.
ITEM 5. AUDIT COMMITTEE OF LISTED REGISTRANTS
Not applicable.
ITEM 6. INVESTMENTS
A Portfolio of Investments for each series of Wells Fargo Funds Trust is included as part of the report to shareholders filed under Item 1 of this Form.
ITEM 7. DISCLOSURE OF PROXY VOTING POLICIES AND PROCEDURES FOR CLOSED-END MANAGEMENT INVESTMENT COMPANIES
Not applicable.
ITEM 8. PORTFOLIO MANAGERS OF CLOSED-END MANAGEMENT INVESTMENT COMPANIES
Not applicable.
ITEM 9. PURCHASES OF EQUITY SECURITIES BY CLOSED-END MANAGEMEENT INVESTMENT COMPANY AND AFFILIATED PURCHASERS
Not applicable.
ITEM 10. SUBMISSION OF MATTERS TO A VOTE OF SECURITY HOLDERS
There have been no material changes to the procedures by which shareholders may recommend nominees to the registrant’s Board of Trustees that have been implemented since the registrant’s last provided disclosure in response to the requirements of this Item.
ITEM 11. CONTROLS AND PROCEDURES
(a) The President and Treasurer have concluded that the Wells Fargo Funds Trust (the “Trust”) disclosure controls and procedures (as defined in Rule 30a-3(c) under the Investment Company Act of 1940) provide reasonable assurances that material information relating to the Trust is made known to them by the appropriate persons, based on their evaluation of these controls and procedures as of a date within 90 days of the filing of this report.
(b) There were no significant changes in the Trust’s internal controls over financial reporting (as defined in Rule 30a-3(d) under the Investment Company Act of 1940) that occurred during the second fiscal quarter of the period covered by this report that materially affected, or is reasonably likely to materially affect, the registrant’s internal control over financial reporting.
ITEM 12. EXHIBITS
(a)(1) Not applicable.
(a)(2) Certification pursuant to Rule 30a-2(a) under the Investment Company Act of 1940 (17 CFR 270.30a-2(a)) is filed and attached hereto as Exhibit 99.CERT.
(a)(3) Not applicable.
(b) Certification pursuant to Rule 30a-2(b) under the Investment Company Act of 1940 (17 CFR 270.30a-2(b)) is filed and attached hereto as Exhibit 99.906CERT.
SIGNATURES
Pursuant to the requirements of the Securities Exchange Act of 1934 and the Investment Company Act of 1940, the registrant has duly caused this report to be signed on its behalf by the undersigned, thereunto duly authorized.
| | |
| Wells Fargo Funds Trust |
| |
| By: | | /s/ Andrew Owen |
| |
| | Andrew Owen |
| | President |
| |
| Date: | | April 28, 2018 |
Pursuant to the requirements of the Securities Exchange Act of 1934 and the Investment Company Act of 1940, this report has been signed below by the following persons on behalf of the registrant and in the capacities and on the date indicated.
| | |
| Wells Fargo Funds Trust |
| |
| By: | | /s/ Andrew Owen |
| |
| | Andrew Owen |
| | President |
| |
| Date: | | April 28, 2018 |
| |
| By: | | /s/ Nancy Wiser |
| |
| | Nancy Wiser |
| | Treasurer |
| |
| Date: | | April 28, 2018 |