
UNITED STATES
SECURITIES AND EXCHANGE COMMISSION
Washington, D.C. 20549
FORM N-CSRS
CERTIFIED SHAREHOLDER REPORT OF REGISTERED
MANAGEMENT INVESTMENT COMPANIES
Investment Company Act file number: 811-09253
Wells Fargo Funds Trust
(Exact name of registrant as specified in charter)
525 Market St., San Francisco, CA 94105
(Address of principal executive offices) (Zip code)
C. David Messman
Wells Fargo Funds Management, LLC
525 Market St., San Francisco, CA 94105
(Name and address of agent for service)
Registrant’s telephone number, including area code: 800-222-8222
Date of fiscal year end: June 30
Registrant is making a filing for 14 of its series:
Wells Fargo Alternative Strategies Fund, Wells Fargo California Limited-Term Tax-Free Fund, Wells Fargo California Tax-Free Fund, Wells Fargo Colorado Tax-Free Fund, Wells Fargo High Yield Municipal Bond Fund, Wells Fargo Intermediate Tax/AMT-Free Fund, Wells Fargo Minnesota Tax-Free Fund, Wells Fargo Municipal Bond Fund, Wells Fargo North Carolina Tax-Free Fund, Wells Fargo Pennsylvania Tax-Free Fund, Wells Fargo Short-Term Municipal Bond Fund, Wells Fargo Strategic Municipal Bond Fund, Wells Fargo Ultra Short-Term Municipal Income Fund, and Wells Fargo Wisconsin Tax-Free Fund.
Date of reporting period: December 31, 2017
ITEM 1. REPORT TO STOCKHOLDERS
Semi-Annual Report
December 31, 2017
Wells Fargo Alternative Strategies Fund


Reduce clutter. Save trees.
Sign up for electronic delivery of prospectuses and shareholder reports at wellsfargo.com/advantagedelivery
Contents
The views expressed and any forward-looking statements are as of December 31, 2017, unless otherwise noted, and are those of the Fund managers and/or Wells Fargo Funds Management, LLC. Discussions of individual securities, or the markets generally, or any Wells Fargo Fund are not intended as individual recommendations. Future events or results may vary significantly from those expressed in any forward-looking statements. The views expressed are subject to change at any time in response to changing circumstances in the market. Wells Fargo Funds Management, LLC and the Fund disclaim any obligation to publicly update or revise any views expressed or forward-looking statements.
NOT FDIC INSURED ◾ NO BANK GUARANTEE ◾ MAY LOSE VALUE
| | | | |
| 2 | | Wells Fargo Alternative Strategies Fund | | Letter to shareholders (unaudited) |

Andrew Owen
President
Wells Fargo Funds
In a predominantly improving global economic environment, global stocks delivered strong results; bond markets had smaller but positive results as well.
Dear Shareholder:
We are pleased to offer you this semi-annual report for the Wells Fargo Alternative Strategies Fund for the six-month period that ended December 31, 2017. In a predominantly improving global economic environment, global stocks delivered strong results; bond markets had smaller but positive results as well. U.S. and international stocks delivered similar results, with returns of 11.42% and 11.48%, respectively, for the six-month period, as measured by the S&P 500 Index1 and the MSCI ACWI ex USA Index (Net)2, respectively; within fixed income, the Bloomberg Barclays U.S. Aggregate Bond Index3 returned 1.24% and the Bloomberg Barclays Municipal Bond Index4 returned 1.82%.
As global growth improved in the third quarter of 2017, investment markets generally advanced.
Most stock markets worldwide moved higher during the quarter and ended the period at or near all-time highs. Moderate acceleration in global economic growth was supported by improving corporate earnings, low inflation pressure, and still-low interest rates. Corporate earnings reports were favorable overall as companies continued to benefit from healthy operating leverage. While North Korea’s recent missile launches and nuclear testing raised serious concerns around the world, the heightened geopolitical risk had relatively minimal impact on the quarter’s stock returns. In the U.S., economic data released during the quarter reflected a generally healthy economy. Second-quarter economic output grew at a 3.1% annual rate, and consumers displayed more willingness to spend. Meanwhile, the U.S. Federal Reserve (Fed) maintained the target range for the federal funds rate at 1.00% to 1.25%, noting that inflation had remained below the Fed’s 2.00% objective. However, the Fed also stated the possibility of one more 0.25% increase in the federal funds rate by the end of 2017 and announced plans to begin the process of unwinding its $4.5 trillion portfolio of bonds and other assets in October. Outside the U.S., stocks in the Asia Pacific region benefited from solid earnings reports and investors’ willingness to take on risk despite the rising tensions between North Korea and the U.S. In Europe, markets were supported by better-than-expected economic growth, which led to narrowing of the gap between Europe’s growth rate and that of the U.S. In emerging markets, many countries benefited from stronger currencies versus the U.S. dollar.
Positive economic and market news continued through the fourth quarter.
During the fourth quarter of 2017, stock markets followed a steady, upward trajectory with no meaningful pullbacks, similar to their paths during the previous three quarters of the year. The extended rally was driven largely by reports of strong earnings and revenue surprises from many companies. Synchronous economic expansion worldwide with mild inflation provided a favorable environment for markets to rise with minimal volatility. Data released during the quarter reflected a
| 1 | The S&P 500 Index consists of 500 stocks chosen for market size, liquidity, and industry group representation. It is a market-value-weighted index with each stock’s weight in the index proportionate to its market value. You cannot invest directly in an index. |
| 2 | The Morgan Stanley Capital International (MSCI) All Country World Index (ACWI) ex USA Index (Net) is a free-float-adjusted market-capitalization-weighted index that is designed to measure the equity market performance of developed markets, excluding the United States and Canada. Source: MSCI. MSCI makes no express or implied warranties or representations and shall have no liability whatsoever with respect to any MSCI data contained herein. The MSCI data may not be further redistributed or used as a basis for other indices or any securities or financial products. This report is not approved, reviewed, or produced by MSCI. You cannot invest directly in an index. |
| 3 | The Bloomberg Barclays U.S. Aggregate Bond Index is a broad-based benchmark that measures the investment-grade, U.S. dollar-denominated, fixed-rate taxable bond market, including Treasuries, government-related and corporate securities, mortgage-backed securities (agency fixed-rate and hybrid adjustable-rate mortgage pass-throughs), asset-backed securities, and commercial mortgage-backed securities. You cannot invest directly in an index. |
| 4 | The Bloomberg Barclays Municipal Bond Index is an unmanaged index composed of long-term tax-exempt bonds with a minimum credit rating of Baa. You cannot invest directly in an index. |
| | | | | | |
| Letter to shareholders (unaudited) | | Wells Fargo Alternative Strategies Fund | | | 3 | |
healthy U.S. economy. Third-quarter economic output grew at a 3.2% annual rate, just ahead of the second quarter’s 3.1% pace. Hiring remained solid during the quarter; the hiring pace pushed the unemployment rate down to a 17-year low of 4.1% in October, and it remained at 4.1% for both November and December. Fed officials began unwinding the Fed’s $4.5 trillion portfolio of bonds and other assets in October as planned, and in December they raised the target for the federal funds rate to a range of 1.25% to 1.50%. As a result, long-term interest rates in the U.S. continued trending upward, although the 10-year rate remained below 2.5%. Outside the U.S., economies continued to strengthen. In December, the Organisation for Economic Co-operation and Development (OECD) reported that the global economy has been expanding at its fastest rate since 2010; all 45 countries the OECD follows were on track to expand for 2017. International economies have benefited from catalysts such as economic stimulus, improving employment, increased investment, and accelerated trade growth.
Don’t let short-term uncertainty derail long-term investment goals.
Periods of investment uncertainty can present challenges, but experience has taught us that maintaining long-term investment goals can be an effective way to plan for the future. To help you create a sound strategy based on your personal goals and risk tolerance, Wells Fargo Funds offers more than 100 mutual funds spanning a wide range of asset classes and investment styles. Although diversification cannot guarantee an investment profit or prevent losses, we believe it can be an effective way to manage investment risk and potentially smooth out overall portfolio performance. We encourage investors to know their investments and to understand that appropriate levels of risk-taking may unlock opportunities.
Thank you for choosing to invest with Wells Fargo Funds. We appreciate your confidence in us and remain committed to helping you meet your financial needs.
Sincerely,

Andrew Owen
President
Wells Fargo Funds
Although diversification cannot guarantee an investment profit or prevent losses, we believe it can be an effective way to manage investment risk and potentially smooth out overall portfolio performance.
For further information about your Fund, contact your investment professional, visit our website at wellsfargofunds.com, or call us directly at 1-800-222-8222. We are available 24 hours a day, 7 days a week.
| | | | |
| 4 | | Wells Fargo Alternative Strategies Fund | | Performance highlights (unaudited) |
Investment objective
The Fund seeks long-term capital appreciation.
Manager
Wells Fargo Funds Management, LLC
Subadvisers
The Rock Creek Group, LP
Chilton Investment Company, LLC
Ellington Global Asset Management, LLC
Mellon Capital Management Corporation
Sirios Capital Management, L.P.
Wellington Management Company LLP
Portfolio managers
John F. Brennan, Jr.
Richard L. Chilton, Jr.
Vassilis Dagioglu
Robert Kinderman
Sudhir Krisnamurthi
Kenneth LaPlace
Kent M. Stahl, CFA®
James Stavena
Gregg R. Thomas, CFA®
Ronald van der Wouden
Torrey Zaches
Average annual total returns (%) as of December 31, 2017
| | | | | | | | | | | | | | | | | | | | | | | | | | |
| | | | | Including sales charge | | | Excluding sales charge | | | Expense ratios1 (%) | |
| | | Inception date | | 1 year | | | Since inception | | | 1 year | | | Since inception | | | Gross | | | Net2 | |
| Class A (WALTX) | | 4-30-2014 | | | 0.66 | | | | 0.97 | | | | 6.83 | | | | 2.61 | | | | 3.35 | | | | 2.98 | |
| Class C (WACTX) | | 4-30-2014 | | | 5.05 | | | | 1.85 | | | | 6.05 | | | | 1.85 | | | | 4.10 | | | | 3.73 | |
| Administrator Class (WADTX) | | 4-30-2014 | | | – | | | | – | | | | 6.86 | | | | 2.90 | | | | 3.27 | | | | 2.83 | |
| Institutional Class (WAITX) | | 4-30-2014 | | | – | | | | – | | | | 7.08 | | | | 2.87 | | | | 3.02 | | | | 2.73 | |
| Bloomberg Barclays U.S. Aggregate Bond Index3 | | – | | | – | | | | – | | | | 3.54 | | | | 2.70 | | | | – | | | | – | |
| HFRI Fund of Funds Composite Index4 | | – | | | – | | | | – | | | | 7.74 | | | | 3.07 | | | | – | | | | – | |
Figures quoted represent past performance, which is no guarantee of future results, and do not reflect taxes that a shareholder may pay on fund distributions or the redemption of fund shares. Investment return and principal value of an investment will fluctuate so that an investor’s shares, when redeemed, may be worth more or less than their original cost. Performance shown without sales charges would be lower if sales charges were reflected. Current performance may be lower or higher than the performance data quoted, which assumes the reinvestment of dividends and capital gains. Current month-end performance is available on the Fund’s website, wellsfargofunds.com.
Index returns do not include transaction costs associated with buying and selling securities, any mutual fund fees or expenses, or any taxes. It is not possible to invest directly in an index.
For Class A shares, the maximum front-end sales charge is 5.75%. For Class C shares, the maximum contingent deferred sales charge is 1.00%. Performance including a contingent deferred sales charge assumes the sales charge for the corresponding time period. Administrator Class and Institutional Class shares are sold without a front-end sales charge or contingent deferred sales charge.
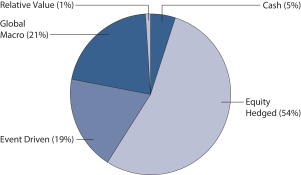
The Fund does not invest directly in hedge funds but pursues similar strategies to those typically used by hedge funds. The Fund invests using alternative investment strategies such as equity hedged, event driven, global macro, and relative value, which are speculative and entail a high degree of risk. Stock values fluctuate in response to the activities of individual companies and general market and economic conditions. Bond values fluctuate in response to the financial condition of individual issuers, general market and economic conditions, and changes in interest rates. Changes in market conditions and government policies may lead to periods of heightened volatility in the bond market and reduced liquidity for certain bonds held by the Fund. In general, when interest rates rise, bond values fall and investors may lose principal value. Interest-rate changes and their impact on the Fund and its share price can be sudden and unpredictable. Foreign investments are especially volatile and can rise or fall dramatically due to differences in the political and economic conditions of the host country. These risks are generally intensified in emerging markets. The use of derivatives may reduce returns and/or increase volatility. Borrowing money to purchase securities or cover short positions magnifies losses and incurs expenses. Short selling is generally considered speculative, has the potential for unlimited loss, and may involve leverage. Certain investment strategies tend to increase the total risk of an investment (relative to the broader market). Securities issued by U.S. government agencies or government-sponsored entities may not be guaranteed by the U.S. Treasury. The Fund is exposed to high-yield securities risk, mortgage- and asset-backed securities risk, convertible securities risk, loan risk, regulatory risk, and smaller-company securities risk. Consult the Fund’s prospectus for additional information on these and other risks.
Please see footnotes on page 5.
| | | | | | |
| Performance highlights (unaudited) | | Wells Fargo Alternative Strategies Fund | | | 5 | |
| | | | | | | | |
| Sector allocation as of December 31, 20175 | |
| | | Gross
exposure(%) | | | Net
exposure(%) | |
Consumer Discretionary | | | 12 | | | | 12 | |
Consumer Staples | | | 4 | | | | 5 | |
Energy | | | 4 | | | | 3 | |
Financials | | | 11 | | | | 13 | |
Health Care | | | 6 | | | | 7 | |
Industrials | | | 11 | | | | 11 | |
Information Technology | | | 7 | | | | 8 | |
Materials | | | 8 | | | | 9 | |
Real Estate | | | 1 | | | | 1 | |
Telecommunication Services | | | 1 | | | | 2 | |
Utilities | | | 1 | | | | 1 | |
Other | | | 34 | | | | 28 | |
| | | | 100 | | | | 100 | |
|
| Strategy allocation as of December 31, 20176 |
|
 |
| | | | |
| Ten largest long position holdings (%) as of December 31, 20177 | |
Western Asset Macro Opportunities Fund | | | 5.44 | |
AQR Managed Futures Strategy Fund Class I | | | 1.98 | |
The Sherwin-Williams Company | | | 1.90 | |
Becton Dickinson & Company | | | 1.07 | |
CSX Corporation | | | 0.97 | |
FedEx Corporation | | | 0.82 | |
Airbus SE | | | 0.77 | |
The Home Depot Incorporated | | | 0.77 | |
HSBC Bank plc (Alinma AB) | | | 0.76 | |
Berkshire Hathaway Incorporated Class B | | | 0.65 | |
| | | | |
| Ten largest short position holdings (%) as of December 31, 20177 | |
SPDR S&P 500 | | | (4.98) | |
Technology Select Sector SPDR Fund | | | (0.79) | |
W.W. Grainger Incorporated | | | (0.55) | |
Occidental Petroleum Corporation | | | (0.36) | |
The Swatch Group AG | | | (0.29) | |
Consumer Staples Select Sector SPDR Fund | | | (0.28) | |
Accenture plc Class A | | | (0.27) | |
Consumer Discretionary Select Sector SPDR Fund | | | (0.27) | |
Wal-Mart Stores Incorporated | | | (0.22) | |
Cabot Oil & Gas Corporation | | | (0.22) | |
| 1 | Reflects the expense ratios as stated in the most recent prospectuses, which include the impact of 0.10% in acquired fund fees and expenses and 0.73% in prime broker fees and dividend expenses on securities sold short. The expense ratios shown are subject to change and may differ from the annualized expense ratios shown in the financial highlights of this report which include prime broker fees and dividend expenses on securities sold short but do not include acquired fund fees and expenses incurred from investment made by The Rock Creek Group, LP. |
| 2 | The manager has contractually committed through October 31, 2018, to waive fees and/or reimburse expenses to the extent necessary to cap the Fund’s Total Annual Fund Operating Expenses After Fee Waivers at 2.22% for Class A, 2.97% for Class C, 2.07% for Administrator Class, and 1.97% for Institutional Class. After this time, the cap may be increased or the commitment to maintain the cap may be terminated only with the approval of the Board of Trustees. Brokerage commissions, stamp duty fees, interest, taxes, acquired fund fees and expenses, prime broker fees, dividend and interest expenses on securities sold short, and extraordinary expenses are excluded from the expense cap. The waiver of acquired fund fees and expenses incurred from investments made by The Rock Creek Group, LP, a subadviser of the Fund, are included in the expense cap. Without this cap, the Fund’s returns would have been lower. The expense ratio paid by an investor is the net expense ratio or the Fund’s Total Annual Fund Operating Expenses After Fee Waivers, as stated in the prospectuses. |
| 3 | The Bloomberg Barclays U.S. Aggregate Bond Index is a broad-based benchmark that measures the investment-grade, U.S. dollar–denominated, fixed-rate taxable bond market, including Treasuries, government-related and corporate securities, mortgage-based securities (agency fixed-rate and hybrid adjustable-rate mortgage pass-throughs), asset-backed securities, and commercial mortgage-backed securities. You cannot invest directly in an index. |
| 4 | The Hedge Fund Research Incorporated (HFRI) Fund of Funds Composite Index is a global, equally-weighted index of hedge funds that invest with multiple managers in a broad range of strategies. You cannot invest directly in an index. |
| 5 | The chart shows the percentage of Fund holdings within a particular sector that was held long (securities owned by the Fund) or sold short (sale of borrowed securities). Gross exposure is the absolute value of the long positions and short positions combined. Net exposure is the percentage of long positions minus the percentage of positions sold short. |
| 6 | Strategy allocation is calculated based on the market value of total investments. Cash shown is the sweep cash position of the Fund, and excludes any cash or cash equivalents that may be pledged as collateral for other investments of the Fund. Strategy allocation is subject to change and may have changed since the date specified. |
| 7 | The ten largest long and short position holdings, excluding cash and cash equivalents, are calculated based on the value of the investments divided by total net assets of the Fund. Holdings are subject to change and may have changed since the date specified. |
| | | | |
| 6 | | Wells Fargo Alternative Strategies Fund | | Fund expenses (unaudited) |
As a shareholder of the Fund, you incur two types of costs: (1) transaction costs, including sales charges (loads) on purchase payments and contingent deferred sales charges (if any) on redemptions and (2) ongoing costs, including management fees, distribution (12b-1) and/or shareholder servicing fees, and other Fund expenses. This example is intended to help you understand your ongoing costs (in dollars) of investing in the Fund and to compare these costs with the ongoing costs of investing in other mutual funds.
The example is based on an investment of $1,000 invested at the beginning of the six-month period and held for the entire period from July 1, 2017 to December 31, 2017.
Actual expenses
The “Actual” line of the table below provides information about actual account values and actual expenses. You may use the information in this line, together with the amount you invested, to estimate the expenses that you paid over the period. Simply divide your account value by $1,000 (for example, an $8,600 account value divided by $1,000 = 8.6), then multiply the result by the number in the “Actual” line under the heading entitled “Expenses paid during period” for your applicable class of shares to estimate the expenses you paid on your account during this period.
Hypothetical example for comparison purposes
The “Hypothetical” line of the table below provides information about hypothetical account values and hypothetical expenses based on the Fund’s actual expense ratio and an assumed rate of return of 5% per year before expenses, which is not the Fund’s actual return. The hypothetical account values and expenses may not be used to estimate the actual ending account balance or expenses you paid for the period. You may use this information to compare the ongoing costs of investing in the Fund and other funds. To do so, compare this 5% hypothetical example with the 5% hypothetical examples that appear in the shareholder reports of the other funds.
Please note that the expenses shown in the table are meant to highlight your ongoing costs only and do not reflect any transactional costs, such as sales charges (loads) and contingent deferred sales charges. Therefore, the “Hypothetical” line of the table is useful in comparing ongoing costs only and will not help you determine the relative total costs of owning different funds. In addition, if these transactional costs were included, your costs would have been higher.
| | | | | | | | | | | | | | | | |
| | | Beginning account value 7-1-2017 | | | Ending account value 12-31-2017 | | | Expenses paid during the period¹ | | | Annualized net expense ratio | |
Class A | | | | | | | | | | | | | | | | |
Actual | | $ | 1,000.00 | | | $ | 1,025.00 | | | $ | 14.60 | | | | 2.86 | % |
Hypothetical (5% return before expenses) | | $ | 1,000.00 | | | $ | 1,010.79 | | | $ | 14.50 | | | | 2.86 | % |
Class C | | | | | | | | | | | | | | | | |
Actual | | $ | 1,000.00 | | | $ | 1,026.70 | | | $ | 18.54 | | | | 3.63 | % |
Hypothetical (5% return before expenses) | | $ | 1,000.00 | | | $ | 1,006.91 | | | $ | 18.36 | | | | 3.63 | % |
Administrator Class | | | | | | | | | | | | | | | | |
Actual | | $ | 1,000.00 | | | $ | 1,021.40 | | | $ | 14.01 | | | | 2.75 | % |
Hypothetical (5% return before expenses) | | $ | 1,000.00 | | | $ | 1,011.34 | | | $ | 13.94 | | | | 2.75 | % |
Institutional Class | | | | | | | | | | | | | | | | |
Actual | | $ | 1,000.00 | | | $ | 1,020.40 | | | $ | 13.29 | | | | 2.61 | % |
Hypothetical (5% return before expenses) | | $ | 1,000.00 | | | $ | 1,012.05 | | | $ | 13.24 | | | | 2.61 | % |
| 1 | Expenses paid is equal to the annualized net expense ratio of each class multiplied by the average account value over the period, multiplied by the number of days in the most recent fiscal half-year divided by the number of days in the fiscal year (to reflect the one-half-year period). |
| | | | | | |
| Consolidated portfolio of investments—December 31, 2017 (unaudited) | | Wells Fargo Alternative Strategies Fund | | | 7 | |
| | | | | | | | | | | | | | | | |
| Security name | | | | | | | | Shares | | | Value | |
|
Common Stocks: 39.62% | |
|
Consumer Discretionary: 7.33% | |
|
| Auto Components: 0.43% | |
Adient plc | | | | | | | | | | | 5,802 | | | $ | 456,617 | |
Aptiv plc | | | | | | | | | | | 380 | | | | 32,235 | |
Bridgestone Corporation | | | | | | | | | | | 720 | | | | 33,471 | |
GKN plc | | | | | | | | | | | 18,548 | | | | 79,986 | |
NGK Spark Plug Company Limited | | | | | | | | | | | 922 | | | | 22,413 | |
Stanley Electric Company Limited | | | | | | | | | | | 630 | | | | 25,580 | |
Tokai Rika Company Limited | | | | | | | | | | | 1,277 | | | | 26,883 | |
Toyota Industries Corporation | | | | | | | | | | | 640 | | | | 41,124 | |
| |
| | | | 718,309 | |
| | | | | |
|
| Automobiles: 0.50% | |
Chongqing Changchun Automobile Class B | | | | | | | | | | | 30,600 | | | | 33,683 | |
Daimler AG | | | | | | | | | | | 344 | | | | 29,223 | |
General Motors Company | | | | | | | | | | | 771 | | | | 31,603 | |
Isuzu Motors Limited | | | | | | | | | | | 3,014 | | | | 50,476 | |
Mazda Motor Corporation | | | | | | | | | | | 1,160 | | | | 15,561 | |
Nissan Motor Company Limited | | | | | | | | | | | 3,364 | | | | 33,543 | |
Renault SA | | | | | | | | | | | 313 | | | | 31,513 | |
Suzuki Motor Corporation | | | | | | | | | | | 1,454 | | | | 84,317 | |
Thor Industries Incorporated | | | | | | | | | | | 3,500 | | | | 527,520 | |
| |
| | | | 837,439 | |
| | | | | |
|
| Distributors: 0.01% | |
Paltac Corporation | | | | | | | | | | | 373 | | | | 17,015 | |
| | | | | | | | | | | | | | | | |
|
| Diversified Consumer Services: 0.17% | |
Bright Horizons Family Solutions Incorporated † | | | | | | | | | | | 1,285 | | | | 120,790 | |
Kroton Educacional SA | | | | | | | | | | | 20,189 | | | | 111,989 | |
New Oriental Education & Technology Group Incorporated ADR | | | | | | | | | | | 575 | | | | 54,050 | |
| |
| | | | 286,829 | |
| | | | | |
|
| Hotels, Restaurants & Leisure: 0.66% | |
Chipotle Mexican Grill Incorporated † | | | | | | | | | | | 250 | | | | 72,258 | |
Compass Group plc | | | | | | | | | | | 2,696 | | | | 58,240 | |
Domino’s Pizza Incorporated | | | | | | | | | | | 1,814 | | | | 342,773 | |
H.I.S. Company Limited | | | | | | | | | | | 437 | | | | 15,843 | |
Hilton Worldwide Holdings Incorporated | | | | | | | | | | | 726 | | | | 57,978 | |
Kyoritsu Maintenance Company Limited | | | | | | | | | | | 275 | | | | 11,117 | |
Ladbrokes Coral Group plc | | | | | | | | | | | 14,710 | | | | 36,127 | |
Las Vegas Sands Corporation | | | | | | | | | | | 517 | | | | 35,926 | |
McDonald’s Corporation (b) | | | | | | | | | | | 1,442 | | | | 248,197 | |
Melco Crown Entertainment Limited ADR | | | | | | | | | | | 2,862 | | | | 83,112 | |
OPAP SA | | | | | | | | | | | 5,563 | | | | 70,085 | |
Parques Reunidos Servicios Centrales SA Class C | | | | | | | | | | | 1,970 | | | | 35,101 | |
Tosho Company Limited | | | | | | | | | | | 589 | | | | 19,028 | |
Wynn Resorts Limited | | | | | | | | | | | 185 | | | | 31,189 | |
| |
| | | | 1,116,974 | |
| | | | | |
The accompanying notes are an integral part of these financial statements.
| | | | |
| 8 | | Wells Fargo Alternative Strategies Fund | | Consolidated portfolio of investments—December 31, 2017 (unaudited) |
| | | | | | | | | | | | | | | | |
| Security name | | | | | | | | Shares | | | Value | |
|
| Household Durables: 0.56% | |
Alpine Electronics Incorporated | | | | | | | | | | | 1,656 | | | $ | 34,288 | |
Cairn Homes plc † | | | | | | | | | | | 32,458 | | | | 73,606 | |
Casio Computer Company Limited | | | | | | | | | | | 1,116 | | | | 16,055 | |
D.R. Horton Incorporated (b) | | | | | | | | | | | 10,988 | | | | 561,157 | |
Glenveagh Properties plc † | | | | | | | | | | | 27,441 | | | | 38,852 | |
Neinor Homes SA † | | | | | | | | | | | 5,958 | | | | 130,821 | |
Sekisui Chemical Company Limited | | | | | | | | | | | 1,755 | | | | 35,232 | |
Sony Corporation | | | | | | | | | | | 476 | | | | 21,473 | |
Token Corporation | | | | | | | | | | | 263 | | | | 31,091 | |
| |
| | | | 942,575 | |
| | | | | |
|
| Internet & Direct Marketing Retail: 0.92% | |
Expedia Incorporated | | | | | | | | | | | 231 | | | | 27,667 | |
JD.com Incorporated ADR † | | | | | | | | | | | 14,080 | | | | 583,194 | |
Liberty Interactive Corporation Class A †(b) | | | | | | | | | | | 18,610 | | | | 454,456 | |
Qliro Group AB † | | | | | | | | | | | 9,133 | | | | 20,152 | |
Start Today Company Limited | | | | | | | | | | | 664 | | | | 20,184 | |
The Priceline Group Incorporated † | | | | | | | | | | | 17 | | | | 29,542 | |
Wayfair Incorporated Class A † | | | | | | | | | | | 5,205 | | | | 417,805 | |
| |
| | | | 1,553,000 | |
| | | | | |
|
| Leisure Products: 0.10% | |
Hasbro Incorporated | | | | | | | | | | | 1,930 | | | | 175,418 | |
| | | | | | | | | | | | | | | | |
|
| Media: 1.94% | |
Charter Communications Incorporated Class A † | | | | | | | | | | | 1,415 | | | | 475,383 | |
CJ E&M Corporation | | | | | | | | | | | 813 | | | | 74,196 | |
Comcast Corporation Class A | | | | | | | | | | | 11,635 | | | | 465,982 | |
CyberAgent Incorporated | | | | | | | | | | | 342 | | | | 13,355 | |
DISH Network Corporation Class A †(b) | | | | | | | | | | | 9,227 | | | | 440,590 | |
Grupo Televisa SA | | | | | | | | | | | 7,740 | | | | 28,992 | |
Liberty Media Corporation Class C †(b) | | | | | | | | | | | 16,912 | | | | 670,730 | |
Lifull Company Limited | | | | | | | | | | | 1,560 | | | | 13,956 | |
M6 Metropole Television SA | | | | | | | | | | | 545 | | | | 14,082 | |
Nippon Television Network Corporation | | | | | | | | | | | 4,662 | | | | 79,938 | |
SES SA | | | | | | | | | | | 1,660 | | | | 25,913 | |
Societe Television Francaise 1 SA | | | | | | | | | | | 3,041 | | | | 44,825 | |
The Walt Disney Company | | | | | | | | | | | 3,900 | | | | 419,289 | |
Time Warner Incorporated | | | | | | | | | | | 2,663 | | | | 243,585 | |
TV Asahi Corporation | | | | | | | | | | | 1,089 | | | | 21,901 | |
Wolters Kluwer NV | | | | | | | | | | | 1,568 | | | | 81,802 | |
World Wrestling Entertainment Incorporated Class A | | | | | | | | | | | 5,438 | | | | 166,294 | |
| |
| | | | 3,280,813 | |
| | | | | |
|
| Multiline Retail: 0.11% | |
Dollar Tree Incorporated † | | | | | | | | | | | 807 | | | | 86,599 | |
Don Quijote Company Limited | | | | | | | | | | | 167 | | | | 8,730 | |
Marks & Spencer Group plc | | | | | | | | | | | 12,114 | | | | 51,488 | |
Ryohin Keikaku Company Limited | | | | | | | | | | | 42 | | | | 13,084 | |
Seria Company Limited | | | | | | | | | | | 331 | | | | 19,976 | |
| |
| | | | 179,877 | |
| | | | | |
The accompanying notes are an integral part of these financial statements.
| | | | | | |
| Consolidated portfolio of investments—December 31, 2017 (unaudited) | | Wells Fargo Alternative Strategies Fund | | | 9 | |
| | | | | | | | | | | | | | | | |
| Security name | | | | | | | | Shares | | | Value | |
|
| Specialty Retail: 1.70% | |
CarMax Incorporated †(b) | | | | | | | | | | | 11,071 | | | $ | 709,983 | |
Ceconomy AG | | | | | | | | | | | 2,808 | | | | 42,468 | |
Fast Retailing Company Limited | | | | | | | | | | | 32 | | | | 12,755 | |
Halfords Group plc | | | | | | | | | | | 8,500 | | | | 40,144 | |
Hikari Tsushin Incorporated | | | | | | | | | | | 154 | | | | 22,142 | |
Nishimatsuya Chain Company Limited | | | | | | | | | | | 1,958 | | | | 21,774 | |
Nitori Holdings Company Limited | | | | | | | | | | | 158 | | | | 22,527 | |
Shimamura Company Limited | | | | | | | | | | | 221 | | | | 24,321 | |
The Home Depot Incorporated (b) | | | | | | | | | | | 6,821 | | | | 1,292,784 | |
The TJX Companies Incorporated | | | | | | | | | | | 809 | | | | 61,856 | |
ULTA Beauty Incorporated † | | | | | | | | | | | 2,807 | | | | 627,814 | |
| |
| | | | 2,878,568 | |
| | | | | |
|
| Textiles, Apparel & Luxury Goods: 0.23% | |
Canada Goose Holdings Incorporated † | | | | | | | | | | | 1,660 | | | | 52,390 | |
Geox SpA | | | | | | | | | | | 6,894 | | | | 23,922 | |
Global Brands Group Holding Limited † | | | | | | | | | | | 172,550 | | | | 14,135 | |
Nike Incorporated Class B | | | | | | | | | | | 2,879 | | | | 180,081 | |
Seiren Company Limited | | | | | | | | | | | 918 | | | | 17,981 | |
Tapestry Incorporated | | | | | | | | | | | 725 | | | | 32,067 | |
Under Armour Incorporated Class C † | | | | | | | | | | | 5,258 | | | | 70,037 | |
| |
| | | | 390,613 | |
| | | | | |
|
Consumer Staples: 2.81% | |
|
| Beverages: 1.37% | |
Anheuser-Busch InBev NV ADR | | | | | | | | | | | 776 | | | | 86,571 | |
Asahi Breweries Limited | | | | | | | | | | | 764 | | | | 37,903 | |
Brown-Forman Corporation Class B | | | | | | | | | | | 978 | | | | 67,159 | |
C&C Group plc | | | | | | | | | | | 5,765 | | | | 19,714 | |
Constellation Brands Incorporated Class A (b) | | | | | | | | | | | 2,595 | | | | 593,139 | |
Davide Campari-Milano SpA | | | | | | | | | | | 73,219 | | | | 566,205 | |
Diageo plc | | | | | | | | | | | 2,975 | | | | 109,455 | |
Heineken NV | | | | | | | | | | | 1,268 | | | | 132,256 | |
Monster Beverage Corporation † | | | | | | | | | | | 7,776 | | | | 492,143 | |
PepsiCo Incorporated | | | | | | | | | | | 716 | | | | 85,863 | |
The Coca-Cola Company | | | | | | | | | | | 1,811 | | | | 83,089 | |
Vina Concha y Toro SA | | | | | | | | | | | 9,227 | | | | 17,467 | |
Yantai Changyu Pioneer Wine Company Limited Class B | | | | | | | | | | | 11,235 | | | | 28,645 | |
| |
| | | | 2,319,609 | |
| | | | | |
|
| Food & Staples Retailing: 0.49% | |
Costco Wholesale Corporation | | | | | | | | | | | 3,156 | | | | 587,395 | |
J Sainsbury plc | | | | | | | | | | | 21,739 | | | | 70,853 | |
Metro AG † | | | | | | | | | | | 2,441 | | | | 48,765 | |
The Kroger Company | | | | | | | | | | | 1,825 | | | | 50,096 | |
Walgreens Boots Alliance Incorporated | | | | | | | | | | | 861 | | | | 62,526 | |
| |
| | | | 819,635 | |
| | | | | |
The accompanying notes are an integral part of these financial statements.
| | | | |
| 10 | | Wells Fargo Alternative Strategies Fund | | Consolidated portfolio of investments—December 31, 2017 (unaudited) |
| | | | | | | | | | | | | | | | |
| Security name | | | | | | | | Shares | | | Value | |
|
| Food Products: 0.42% | |
Campbell Soup Company | | | | | | | | | | | 465 | | | $ | 22,371 | |
Chocoladefabriken Lindt & Sprungli AG | | | | | | | | | | | 6 | | | | 433,999 | |
CJ Cheiljedang Corporation | | | | | | | | | | | 337 | | | | 115,214 | |
Ezaki Glico Company Limited | | | | | | | | | | | 605 | | | | 30,176 | |
Nestle SA | | | | | | | | | | | 1,186 | | | | 101,993 | |
| |
| | | | 703,753 | |
| | | | | |
|
| Household Products: 0.12% | |
Colgate-Palmolive Company | | | | | | | | | | | 983 | | | | 74,167 | |
Reckitt Benckiser Group plc | | | | | | | | | | | 577 | | | | 53,902 | |
The Procter & Gamble Company | | | | | | | | | | | 773 | | | | 71,023 | |
| |
| | | | 199,092 | |
| | | | | |
|
| Personal Products: 0.33% | |
Beiersdorf AG | | | | | | | | | | | 1,075 | | | | 126,275 | |
Ci:Z Holdings Company Limited | | | | | | | | | | | 519 | | | | 26,485 | |
Coty Incorporated Class A | | | | | | | | | | | 4,339 | | | | 86,303 | |
KOSE Corporation | | | | | | | | | | | 97 | | | | 15,143 | |
Pola Orbis Holdings Incorporated | | | | | | | | | | | 1,049 | | | | 36,821 | |
The Estee Lauder Companies Incorporated Class A | | | | | | | | | | | 1,638 | | | | 208,419 | |
Unilever NV ADR | | | | | | | | | | | 1,106 | | | | 62,290 | |
| |
| | | | 561,736 | |
| | | | | |
|
| Tobacco: 0.08% | |
British American Tobacco plc | | | | | | | | | | | 1,326 | | | | 89,837 | |
Japan Tobacco Incorporated | | | | | | | | | | | 1,425 | | | | 45,921 | |
| |
| | | | 135,758 | |
| | | | | |
|
Energy: 2.36% | |
|
| Energy Equipment & Services: 0.49% | |
Fugro NV † | | | | | | | | | | | 2,050 | | | | 31,951 | |
Halliburton Company | | | | | | | | | | | 3,822 | | | | 186,781 | |
Hilong Holding Limited | | | | | | | | | | | 84,120 | | | | 12,167 | |
Saipem SpA † | | | | | | | | | | | 9,855 | | | | 45,004 | |
Schlumberger Limited | | | | | | | | | | | 3,733 | | | | 251,567 | |
TechnipFMC plc | | | | | | | | | | | 8,515 | | | | 266,605 | |
Tenaris SA ADR | | | | | | | | | | | 800 | | | | 25,488 | |
| |
| | | | 819,563 | |
| | | | | |
|
| Oil, Gas & Consumable Fuels: 1.87% | |
Anadarko Petroleum Corporation | | | | | | | | | | | 9,673 | | | | 518,860 | |
BP plc | | | | | | | | | | | 26,882 | | | | 189,713 | |
BP plc ADR | | | | | | | | | | | 4,440 | | | | 186,613 | |
Canadian Natural Resources Limited | | | | | | | | | | | 1,090 | | | | 38,935 | |
Cimarex Energy Company | | | | | | | | | | | 300 | | | | 36,603 | |
Concho Resources Incorporated † | | | | | | | | | | | 221 | | | | 33,199 | |
ConocoPhillips (b) | | | | | | | | | | | 5,523 | | | | 303,157 | |
Diamondback Energy Incorporated † | | | | | | | | | | | 355 | | | | 44,819 | |
The accompanying notes are an integral part of these financial statements.
| | | | | | |
| Consolidated portfolio of investments—December 31, 2017 (unaudited) | | Wells Fargo Alternative Strategies Fund | | | 11 | |
| | | | | | | | | | | | | | | | |
| Security name | | | | | | | | Shares | | | Value | |
| | | | |
| Oil, Gas & Consumable Fuels (continued) | | | | | | | | | | | | | | | | |
Eni SpA | | | | | | | | | | | 8,412 | | | $ | 139,285 | |
EOG Resources Incorporated | | | | | | | | | | | 1,085 | | | | 117,082 | |
Hess Corporation | | | | | | | | | | | 455 | | | | 21,599 | |
Imperial Oil Limited | | | | | | | | | | | 1,757 | | | | 54,835 | |
JXTG Holdings Incorporated | | | | | | | | | | | 1,767 | | | | 11,401 | |
Laredo Petroleum Incorporated † | | | | | | | | | | | 2,250 | | | | 23,873 | |
Parsley Energy Incorporated Class A † | | | | | | | | | | | 26,697 | | | | 785,960 | |
Pioneer Natural Resources Company | | | | | | | | | | | 298 | | | | 51,509 | |
Royal Dutch Shell plc Class A ADR | | | | | | | | | | | 3,673 | | | | 245,026 | |
Royal Dutch Shell plc Class B | | | | | | | | | | | 3,530 | | | | 119,556 | |
Southwestern Energy Company † | | | | | | | | | | | 1,305 | | | | 7,282 | |
Statoil ASA | | | | | | | | | | | 1,507 | | | | 32,157 | |
Total SA | | | | | | | | | | | 3,033 | | | | 167,564 | |
WPX Energy Incorporated † | | | | | | | | | | | 2,548 | | | | 35,850 | |
| |
| | | | 3,164,878 | |
| | | | | |
|
Financials: 5.51% | |
|
| Banks: 2.59% | |
Banco Santander Central Hispano SA | | | | | | | | | | | 11,847 | | | | 77,882 | |
Bank of America Corporation (b) | | | | | | | | | | | 25,099 | | | | 740,922 | |
Bank of Ireland Group plc † | | | | | | | | | | | 31,859 | | | | 271,213 | |
Bank of Nova Scotia | | | | | | | | | | | 936 | | | | 60,400 | |
BNP Paribas SA | | | | | | | | | | | 3,776 | | | | 282,032 | |
BPER Banca SpA | | | | | | | | | | | 8,601 | | | | 43,447 | |
CaixaBank SA | | | | | | | | | | | 14,699 | | | | 68,589 | |
China Construction Bank H Shares | | | | | | | | | | | 45,000 | | | | 41,470 | |
Citigroup Incorporated | | | | | | | | | | | 12,578 | | | | 935,929 | |
Citizens Financial Group Incorporated | | | | | | | | | | | 1,314 | | | | 55,162 | |
HDFC Bank Limited ADR | | | | | | | | | | | 497 | | | | 50,530 | |
HSBC Holdings plc | | | | | | | | | | | 21,457 | | | | 222,172 | |
ICICI Bank Limited ADR | | | | | | | | | | | 7,068 | | | | 68,772 | |
Independent Bank Group Incorporated | | | | | | | | | | | 90 | | | | 6,084 | |
ING Groep NV | | | | | | | | | | | 6,252 | | | | 114,960 | |
JPMorgan Chase & Company (b) | | | | | | | | | | | 2,712 | | | | 290,022 | |
Mitsubishi UFJ Financial Group Incorporated | | | | | | | | | | | 22,889 | | | | 167,876 | |
OTP Bank plc | | | | | | | | | | | 1,055 | | | | 43,674 | |
PNC Financial Services Group Incorporated | | | | | | | | | | | 993 | | | | 143,280 | |
Regions Financial Corporation | | | | | | | | | | | 12,247 | | | | 211,628 | |
Sberbank of Russia (a) | | | | | | | | | | | 12,448 | | | | 48,545 | |
Societe Generale SA | | | | | | | | | | | 1,562 | | | | 80,683 | |
Standard Chartered plc † | | | | | | | | | | | 7,262 | | | | 76,487 | |
State Bank of India | | | | | | | | | | | 831 | | | | 40,470 | |
Sumitomo Mitsui Trust Holdings Incorporated | | | | | | | | | | | 821 | | | | 32,592 | |
The San-in Godo Bank Limited | | | | | | | | | | | 2,592 | | | | 25,029 | |
Unicaja Banco SA † | | | | | | | | | | | 21,939 | | | | 34,589 | |
UniCredit SpA † | | | | | | | | | | | 4,620 | | | | 86,365 | |
Western Alliance Bancorp † | | | | | | | | | | | 849 | | | | 48,070 | |
| |
| | | | 4,368,874 | |
| | | | | |
The accompanying notes are an integral part of these financial statements.
| | | | |
| 12 | | Wells Fargo Alternative Strategies Fund | | Consolidated portfolio of investments—December 31, 2017 (unaudited) |
| | | | | | | | | | | | | | | | |
| Security name | | | | | | | | Shares | | | Value | |
|
| Capital Markets: 1.24% | |
Affiliated Managers Group Incorporated (b) | | | | | | | | | | | 3,712 | | | $ | 761,888 | |
ANIMA Holding SpA 144A | | | | | | | | | | | 11,398 | | | | 81,508 | |
GAM Holding AG | | | | | | | | | | | 3,291 | | | | 53,192 | |
Julius Baer Group Limited | | | | | | | | | | | 865 | | | | 52,906 | |
Moody’s Corporation | | | | | | | | | | | 2,281 | | | | 336,698 | |
OM Asset Management plc | | | | | | | | | | | 12,341 | | | | 206,712 | |
SBI Holdings Incorporated | | | | | | | | | | | 442 | | | | 9,242 | |
Schroders plc | | | | | | | | | | | 532 | | | | 25,255 | |
The Blackstone Group LP | | | | | | | | | | | 9,399 | | | | 300,956 | |
UBS Group AG | | | | | | | | | | | 14,667 | | | | 270,025 | |
| |
| | | | 2,098,382 | |
| | | | | |
|
| Consumer Finance: 0.22% | |
Discover Financial Services | | | | | | | | | | | 4,439 | | | | 341,448 | |
Synchrony Financial | | | | | | | | | | | 920 | | | | 35,521 | |
| |
| | | | 376,969 | |
| | | | | |
|
| Diversified Financial Services: 0.68% | |
Amundi SA | | | | | | | | | | | 697 | | | | 59,084 | |
Berkshire Hathaway Incorporated Class B †(b) | | | | | | | | | | | 5,498 | | | | 1,089,813 | |
| |
| | | | 1,148,897 | |
| | | | | |
|
| Insurance: 0.75% | |
Ageas NV | | | | | | | | | | | 1,587 | | | | 77,528 | |
American International Group Incorporated | | | | | | | | | | | 1,117 | | | | 66,551 | |
Assicurazioni Generali SpA | | | | | | | | | | | 4,554 | | | | 83,055 | |
Chubb Limited | | | | | | | | | | | 602 | | | | 87,970 | |
Coface SA | | | | | | | | | | | 3,105 | | | | 33,209 | |
Lancashire Holdings Limited | | | | | | | | | | | 5,448 | | | | 50,165 | |
MetLife Incorporated | | | | | | | | | | | 1,306 | | | | 66,031 | |
MS&AD Insurance Group Holdings Incorporated | | | | | | | | | | | 1,442 | | | | 48,811 | |
Ping An Insurance Company of China Limited H Shares | | | | | | | | | | | 4,400 | | | | 45,814 | |
QBE Insurance Group Limited | | | | | | | | | | | 5,567 | | | | 46,390 | |
RenaissanceRe Holdings Limited | | | | | | | | | | | 276 | | | | 34,663 | |
Sony Financial Holdings Incorporated | | | | | | | | | | | 2,505 | | | | 44,375 | |
Storebrand ASA | | | | | | | | | | | 4,910 | | | | 40,007 | |
T&D Holdings Incorporated | | | | | | | | | | | 4,606 | | | | 78,773 | |
Tokio Marine Holdings Incorporated | | | | | | | | | | | 1,841 | | | | 83,999 | |
W.R. Berkley Corporation | | | | | | | | | | | 3,062 | | | | 219,392 | |
Willis Towers Watson plc | | | | | | | | | | | 395 | | | | 59,523 | |
XL Group Limited | | | | | | | | | | | 1,340 | | | | 47,114 | |
Zurich Insurance Group AG | | | | | | | | | | | 186 | | | | 56,614 | |
| |
| | | | 1,269,984 | |
| | | | | |
|
| Thrifts & Mortgage Finance: 0.03% | |
LIC Housing Finance Limited GDR | | | | | | | | | | | 2,274 | | | | 40,152 | |
| | | | | | | | | | | | | | | | |
The accompanying notes are an integral part of these financial statements.
| | | | | | |
| Consolidated portfolio of investments—December 31, 2017 (unaudited) | | Wells Fargo Alternative Strategies Fund | | | 13 | |
| | | | | | | | | | | | | | | | |
| Security name | | | | | | | | Shares | | | Value | |
|
Health Care: 4.05% | |
|
| Biotechnology: 0.09% | |
Biogen Incorporated | | | | | | | | | | | 98 | | | $ | 31,220 | |
Exact Sciences Corporation † | | | | | | | | | | | 977 | | | | 51,332 | |
Ionis Pharmaceuticals Incorporated † | | | | | | | | | | | 382 | | | | 19,215 | |
Regeneron Pharmaceuticals Incorporated † | | | | | | | | | | | 55 | | | | 20,678 | |
Tesaro Incorporated † | | | | | | | | | | | 447 | | | | 37,043 | |
| |
| | | | 159,488 | |
| | | | | |
|
| Health Care Equipment & Supplies: 1.90% | |
Asahi Intecc Company Limited | | | | | | | | | | | 388 | | | | 13,361 | |
Baxter International Incorporated | | | | | | | | | | | 668 | | | | 43,180 | |
Becton Dickinson & Company | | | | | | | | | | | 8,412 | | | | 1,800,732 | |
Boston Scientific Corporation †(b) | | | | | | | | | | | 23,976 | | | | 594,365 | |
Haemonetics Corporation † | | | | | | | | | | | 2,408 | | | | 139,857 | |
Hologic Incorporated † | | | | | | | | | | | 1,402 | | | | 59,936 | |
IDEXX Laboratories Incorporated † | | | | | | | | | | | 1,932 | | | | 302,126 | |
Insulet Corporation † | | | | | | | | | | | 935 | | | | 64,515 | |
Medtronic plc | | | | | | | | | | | 1,134 | | | | 91,571 | |
Shandong Weigao Group Medical Polymer Company Limited H Shares | | | | | | | | | | | 38,900 | | | | 28,330 | |
Steris plc | | | | | | | | | | | 400 | | | | 34,988 | |
Straumann Holding AG | | | | | | | | | | | 38 | | | | 26,849 | |
Terumo Corporation | | | | | | | | | | | 273 | | | | 12,938 | |
| |
| | | | 3,212,748 | |
| | | | | |
|
| Health Care Providers & Services: 1.14% | |
BML incorporated | | | | | | | | | | | 1,698 | | | | 42,271 | |
Cardinal Health Incorporated | | | | | | | | | | | 861 | | | | 52,753 | |
Envision Healthcare Corporation † | | | | | | | | | | | 547 | | | | 18,904 | |
McKesson Corporation | | | | | | | | | | | 693 | | | | 108,073 | |
UnitedHealth Group Incorporated (b) | | | | | | | | | | | 4,477 | | | | 986,999 | |
Universal Health Services Incorporated Class B | | | | | | | | | | | 6,350 | | | | 719,773 | |
| |
| | | | 1,928,773 | |
| | | | | |
|
| Health Care Technology: 0.03% | |
Agfa-Gevaert NV † | | | | | | | | | | | 6,829 | | | | 31,849 | |
M3 Incorporated | | | | | | | | | | | 370 | | | | 13,020 | |
| |
| | | | 44,869 | |
| | | | | |
|
| Life Sciences Tools & Services: 0.19% | |
Mettler-Toledo International Incorporated † | | | | | | | | | | | 517 | | | | 320,292 | |
| | | | | | | | | | | | | | | | |
|
| Pharmaceuticals: 0.70% | |
Allergan plc | | | | | | | | | | | 161 | | | | 26,336 | |
Almirall SA | | | | | | | | | | | 2,038 | | | | 20,418 | |
AstraZeneca plc | | | | | | | | | | | 3,384 | | | | 233,974 | |
AstraZeneca plc ADR | | | | | | | | | | | 1,757 | | | | 60,968 | |
Bristol-Myers Squibb Company | | | | | | | | | | | 3,076 | | | | 188,497 | |
Daiichi Sankyo Company Limited | | | | | | | | | | | 500 | | | | 13,033 | |
The accompanying notes are an integral part of these financial statements.
| | | | |
| 14 | | Wells Fargo Alternative Strategies Fund | | Consolidated portfolio of investments—December 31, 2017 (unaudited) |
| | | | | | | | | | | | | | | | |
| Security name | | | | | | | | Shares | | | Value | |
| | | | |
| Pharmaceuticals (continued) | | | | | | | | | | | | | | | | |
Eisai Company Limited | | | | | | | | | | | 139 | | | $ | 7,915 | |
Hikma Pharmaceuticals plc | | | | | | | | | | | 1,767 | | | | 27,054 | |
Johnson & Johnson | | | | | | | | | | | 633 | | | | 88,443 | |
Merck & Company Incorporated | | | | | | | | | | | 1,353 | | | | 76,133 | |
Mylan NV † | | | | | | | | | | | 1,375 | | | | 58,176 | |
Novartis AG | | | | | | | | | | | 2,238 | | | | 189,246 | |
Ono Pharmaceutical Company Limited | | | | | | | | | | | 3,494 | | | | 81,431 | |
Roche Holding AG | | | | | | | | | | | 258 | | | | 65,265 | |
Takeda Pharmaceutical Company Limited | | | | | | | | | | | 830 | | | | 47,152 | |
| |
| | | | 1,184,041 | |
| | | | | |
|
Industrials: 6.85% | |
|
| Aerospace & Defense: 1.50% | |
Airbus SE | | | | | | | | | | | 12,996 | | | | 1,294,239 | |
Cobham plc † | | | | | | | | | | | 64,247 | | | | 109,557 | |
HEICO Corporation | | | | | | | | | | | 3,277 | | | | 309,185 | |
Leonardo-Finmeccanica SpA | | | | | | | | | | | 7,559 | | | | 89,971 | |
Lockheed Martin Corporation | | | | | | | | | | | 1,345 | | | | 431,812 | |
Qinetiq Group plc | | | | | | | | | | | 18,972 | | | | 59,196 | |
Safran SA | | | | | | | | | | | 559 | | | | 57,621 | |
Ultra Electronics Holdings plc | | | | | | | | | | | 6,730 | | | | 122,395 | |
United Technologies Corporation | | | | | | | | | | | 446 | | | | 56,896 | |
| |
| | | | 2,530,872 | |
| | | | | |
|
| Air Freight & Logistics: 0.94% | |
Correios de Portugal SA | | | | | | | | | | | 6,211 | | | | 26,135 | |
FedEx Corporation | | | | | | | | | | | 5,517 | | | | 1,376,712 | |
Konoike Transport Company Liminted | | | | | | | | | | | 779 | | | | 13,807 | |
PostNL NV | | | | | | | | | | | 14,853 | | | | 72,640 | |
United Parcel Service Incorporated Class B | | | | | | | | | | | 811 | | | | 96,631 | |
| |
| | | | 1,585,925 | |
| | | | | |
|
| Airlines: 0.13% | |
Delta Air Lines Incorporated | | | | | | | | | | | 635 | | | | 35,560 | |
Japan Airlines Company Limited | | | | | | | | | | | 2,169 | | | | 84,854 | |
JetBlue Airways Corporation † | | | | | | | | | | | 1,100 | | | | 24,694 | |
SAS AB † | | | | | | | | | | | 13,013 | | | | 33,789 | |
United Continental Holdings Incorporated † | | | | | | | | | | | 547 | | | | 36,868 | |
| |
| | | | 215,765 | |
| | | | | |
|
| Building Products: 0.56% | |
Assa Abloy AB Class B | | | | | | | | | | | 2,676 | | | | 55,588 | |
Compagnie de Saint-Gobain SA | | | | | | | | | | | 4,544 | | | | 250,688 | |
Fortune Brands Home & Security Incorporated | | | | | | | | | | | 7,317 | | | | 500,775 | |
LIXIL Group Corporation | | | | | | | | | | | 860 | | | | 23,279 | |
Noritz Corporation | | | | | | | | | | | 1,170 | | | | 22,948 | |
Sanwa Holdings Corporation | | | | | | | | | | | 6,105 | | | | 84,091 | |
| |
| | | | 937,369 | |
| | | | | |
The accompanying notes are an integral part of these financial statements.
| | | | | | |
| Consolidated portfolio of investments—December 31, 2017 (unaudited) | | Wells Fargo Alternative Strategies Fund | | | 15 | |
| | | | | | | | | | | | | | | | |
| Security name | | | | | | | | Shares | | | Value | |
|
| Commercial Services & Supplies: 0.40% | |
Aeon Delight Company Limited | | | | | | | | | | | 591 | | | $ | 22,135 | |
Atento SA | | | | | | | | | | | 3,390 | | | | 34,409 | |
KAR Auction Services Incorporated (b) | | | | | | | | | | | 7,978 | | | | 402,969 | |
Pitney Bowes Incorporated | | | | | | | | | | | 16,244 | | | | 181,608 | |
Steelcase Incorporated Class A | | | | | | | | | | | 2,790 | | | | 42,408 | |
| |
| | | | 683,529 | |
| | | | | |
|
| Construction & Engineering: 0.24% | |
Hazama Ando Corporation | | | | | | | | | | | 9,214 | | | | 72,126 | |
JGC Corporation | | | | | | | | | | | 1,937 | | | | 37,459 | |
Kinden Corporation | | | | | | | | | | | 1,074 | | | | 17,520 | |
Kumagai Gumi Company Limited | | | | | | | | | | | 821 | | | | 22,952 | |
Nippo Corporation | | | | | | | | | | | 1,322 | | | | 30,940 | |
Taisei Corporation | | | | | | | | | | | 663 | | | | 33,010 | |
Toshiba Plant Systems & Services Corporation | | | | | | | | | | | 1,329 | | | | 24,793 | |
Vinci SA | | | | | | | | | | | 1,565 | | | | 159,892 | |
| |
| | | | 398,692 | |
| | | | | |
|
| Electrical Equipment: 0.17% | |
Eaton Corporation plc | | | | | | | | | | | 229 | | | | 18,093 | |
Legrand SA | | | | | | | | | | | 1,446 | | | | 111,369 | |
Mitsubishi Electric Corporation | | | | | | | | | | | 1,174 | | | | 19,500 | |
Nidec Corporation | | | | | | | | | | | 92 | | | | 12,909 | |
Schneider Electric SE | | | | | | | | | | | 1,099 | | | | 93,438 | |
Zumtobel Group AG | | | | | | | | | | | 2,495 | | | | 29,996 | |
| |
| | | | 285,305 | |
| | | | | |
|
| Industrial Conglomerates: 0.07% | |
Koninklijke Philips NV | | | | | | | | | | | 201 | | | | 7,606 | |
Rheinmetall AG | | | | | | | | | | | 916 | | | | 116,336 | |
| |
| | | | 123,942 | |
| | | | | |
|
| Machinery: 0.53% | |
Alstom SA | | | | | | | | | | | 4,375 | | | | 181,653 | |
Amada Company Limited | | | | | | | | | | | 2,358 | | | | 32,103 | |
FANUC Corporation | | | | | | | | | | | 190 | | | | 45,630 | |
Harmonic Drive Systems Incorporated | | | | | | | | | | | 222 | | | | 12,984 | |
Komatsu Limited | | | | | | | | | | | 644 | | | | 23,308 | |
Minebea Company Limited | | | | | | | | | | | 404 | | | | 8,473 | |
SMC Corporation | | | | | | | | | | | 89 | | | | 36,635 | |
Tadano Limited | | | | | | | | | | | 1,051 | | | | 17,452 | |
Takuma Company Limited | | | | | | | | | | | 2,454 | | | | 34,368 | |
Xylem Incorporated | | | | | | | | | | | 7,442 | | | | 507,544 | |
| |
| | | | 900,150 | |
| | | | | |
|
| Marine: 0.04% | |
DS Norden AS † | | | | | | | | | | | 1,919 | | | | 36,031 | |
Kuehne & Nagel International AG | | | | | | | | | | | 194 | | | | 34,342 | |
| |
| | | | 70,373 | |
| | | | | |
The accompanying notes are an integral part of these financial statements.
| | | | |
| 16 | | Wells Fargo Alternative Strategies Fund | | Consolidated portfolio of investments—December 31, 2017 (unaudited) |
| | | | | | | | | | | | | | | | |
| Security name | | | | | | | | Shares | | | Value | |
|
| Professional Services: 0.19% | |
Adecco SA | | | | | | | | | | | 654 | | | $ | 50,034 | |
Benefit One Incorporated | | | | | | | | | | | 742 | | | | 15,535 | |
Bureau Veritas SA | | | | | | | | | | | 2,074 | | | | 56,713 | |
Experian Group Limited plc | | | | | | | | | | | 1,612 | | | | 35,607 | |
Hays plc | | | | | | | | | | | 21,984 | | | | 54,288 | |
Nomura Company Limited | | | | | | | | | | | 756 | | | | 17,270 | |
Persol Holdings Company Limited | | | | | | | | | | | 923 | | | | 23,133 | |
SThree plc | | | | | | | | | | | 2,239 | | | | 11,125 | |
TechnoPro Holdings Incorporated | | | | | | | | | | | 263 | | | | 14,285 | |
TransUnion † | | | | | | | | | | | 871 | | | | 47,870 | |
| |
| | | | 325,860 | |
| | | | | |
|
| Road & Rail: 1.78% | |
Canadian National Railway Company | | | | | | | | | | | 1,082 | | | | 89,220 | |
CSX Corporation (b) | | | | | | | | | | | 29,906 | | | | 1,645,129 | |
DSV AS | | | | | | | | | | | 597 | | | | 47,012 | |
Genesee & Wyoming Incorporated Class A † | | | | | | | | | | | 563 | | | | 44,325 | |
Go-Ahead Group plc | | | | | | | | | | | 2,036 | | | | 40,931 | |
Hitachi Transport System Limited | | | | | | | | | | | 745 | | | | 19,419 | |
J.B. Hunt Transport Services Incorporated | | | | | | | | | | | 463 | | | | 53,236 | |
Keisei Electric Railway Company Limited | | | | | | | | | | | 185 | | | | 5,944 | |
Knight-Swift Transportation Holdings Incorporated | | | | | | | | | | | 938 | | | | 41,009 | |
Localiza Rent a Car SA | | | | | | | | | | | 5,700 | | | | 37,907 | |
Old Dominion Freight Line Incorporated | | | | | | | | | | | 2,788 | | | | 366,762 | |
Sankyu Incorporated | | | | | | | | | | | 251 | | | | 10,838 | |
Union Pacific Corporation (b) | | | | | | | | | | | 4,500 | | | | 603,450 | |
| |
| | | | 3,005,182 | |
| | | | | |
|
| Trading Companies & Distributors: 0.29% | |
Brenntag AG | | | | | | | | | | | 709 | | | | 44,891 | |
Fastenal Company | | | | | | | | | | | 416 | | | | 22,751 | |
Ferguson plc | | | | | | | | | | | 3,653 | | | | 262,881 | |
Itochu Corporation | | | | | | | | | | | 3,676 | | | | 68,610 | |
Rexel SA | | | | | | | | | | | 3,274 | | | | 59,396 | |
SIG plc | | | | | | | | | | | 14,433 | | | | 34,336 | |
| |
| | | | 492,865 | |
| | | | | |
|
| Transportation Infrastructure: 0.01% | |
Hamburger Hafen und Logistik AG | | | | | | | | | | | 837 | | | | 23,771 | |
| | | | | | | | | | | | | | | | |
|
Information Technology: 4.46% | |
|
| Communications Equipment: 0.28% | |
Acacia Communications Incorporated † | | | | | | | | | | | 632 | | | | 22,897 | |
Juniper Networks Incorporated | | | | | | | | | | | 4,577 | | | | 130,445 | |
Nokia Oyj | | | | | | | | | | | 14,517 | | | | 67,827 | |
Palo Alto Networks Incorporated † | | | | | | | | | | | 1,284 | | | | 186,103 | |
Telefonaktiebolaget LM Ericsson Class B | | | | | | | | | | | 10,458 | | | | 68,653 | |
| |
| | | | 475,925 | |
| | | | | |
The accompanying notes are an integral part of these financial statements.
| | | | | | |
| Consolidated portfolio of investments—December 31, 2017 (unaudited) | | Wells Fargo Alternative Strategies Fund | | | 17 | |
| | | | | | | | | | | | | | | | |
| Security name | | | | | | | | Shares | | | Value | |
|
| Electronic Equipment, Instruments & Components: 0.14% | |
Amano Corporation | | | | | | | | | | | 660 | | | $ | 17,262 | |
Enplas Corporation | | | | | | | | | | | 528 | | | | 21,931 | |
Hitachi High Technologies Corporation | | | | | | | | | | | 1,020 | | | | 43,000 | |
Hosiden Corporation | | | | | | | | | | | 1,063 | | | | 15,699 | |
Keysight Technologies Incorporated † | | | | | | | | | | | 935 | | | | 38,896 | |
Shimadzu Corporation | | | | | | | | | | | 374 | | | | 8,504 | |
WPG Holdings Company Limited | | | | | | | | | | | 14,225 | | | | 18,834 | |
Yaskawa Electric Corporation | | | | | | | | | | | 290 | | | | 12,779 | |
Zebra Technologies Corporation Class A † | | | | | | | | | | | 569 | | | | 59,062 | |
| |
| | | | 235,967 | |
| | | | | |
|
| Internet Software & Services: 0.80% | |
Alibaba Group Holding Limited ADR † | | | | | | | | | | | 251 | | | | 43,280 | |
Alphabet Incorporated Class C † | | | | | | | | | | | 93 | | | | 97,315 | |
CoStar Group Incorporated † | | | | | | | | | | | 195 | | | | 57,905 | |
DeNA Company Limited | | | | | | | | | | | 4,339 | | | | 89,456 | |
Facebook Incorporated Class A † | | | | | | | | | | | 4,455 | | | | 786,129 | |
GoDaddy Incorporated Class A † | | | | | | | | | | | 1,087 | | | | 54,654 | |
Mimecast Limited † | | | | | | | | | | | 1,056 | | | | 30,276 | |
Tencent Holdings Limited | | | | | | | | | | | 843 | | | | 43,807 | |
Yandex NV Class A † | | | | | | | | | | | 4,429 | | | | 145,044 | |
| |
| | | | 1,347,866 | |
| | | | | |
|
| IT Services: 1.18% | |
Accenture plc Class A | | | | | | | | | | | 610 | | | | 93,385 | |
Alliance Data Systems Corporation | | | | | | | | | | | 228 | | | | 57,793 | |
Amdocs Limited | | | | | | | | | | | 410 | | | | 26,847 | |
Automatic Data Processing Incorporated | | | | | | | | | | | 472 | | | | 55,314 | |
Capgemini SA | | | | | | | | | | | 660 | | | | 78,311 | |
Cerved Information Solutions SpA | | | | | | | | | | | 6,504 | | | | 82,720 | |
Cognizant Technology Solutions Corporation Class A (b) | | | | | | | | | | | 3,993 | | | | 283,583 | |
DST Systems Incorporated | | | | | | | | | | | 1,736 | | | | 107,754 | |
DTS Corporation | | | | | | | | | | | 858 | | | | 27,946 | |
FleetCor Technologies Incorporated † | | | | | | | | | | | 153 | | | | 29,442 | |
Genpact Limited | | | | | | | | | | | 820 | | | | 26,027 | |
GMO Payment Gateway Incorporated | | | | | | | | | | | 446 | | | | 36,891 | |
International Business Machines Corporation | | | | | | | | | | | 1,595 | | | | 244,705 | |
MasterCard Incorporated Class A (b) | | | | | | | | | | | 4,851 | | | | 734,247 | |
Sopra Steria Group | | | | | | | | | | | 194 | | | | 36,277 | |
Visa Incorporated Class A | | | | | | | | | | | 684 | | | | 77,990 | |
| |
| | | | 1,999,232 | |
| | | | | |
|
| Semiconductors & Semiconductor Equipment: 0.67% | |
Broadcom Limited (b) | | | | | | | | | | | 1,831 | | | | 470,384 | |
Infineon Technologies AG | | | | | | | | | | | 6,569 | | | | 179,981 | |
KLA-Tencor Corporation | | | | | | | | | | | 585 | | | | 61,466 | |
Marvell Technology Group Limited | | | | | | | | | | | 1,300 | | | | 27,911 | |
Micron Technology Incorporated † | | | | | | | | | | | 2,940 | | | | 120,893 | |
NXP Semiconductors NV † | | | | | | | | | | | 319 | | | | 37,352 | |
The accompanying notes are an integral part of these financial statements.
| | | | |
| 18 | | Wells Fargo Alternative Strategies Fund | | Consolidated portfolio of investments—December 31, 2017 (unaudited) |
| | | | | | | | | | | | | | | | |
| Security name | | | | | | | | Shares | | | Value | |
| | | | |
| Semiconductors & Semiconductor Equipment (continued) | | | | | | | | | | | | | | | | |
QUALCOMM Incorporated | | | | | | | | | | | 2,441 | | | $ | 156,273 | |
Renesas Electronics Corporation † | | | | | | | | | | | 1,003 | | | | 11,688 | |
Silicon Motion Technology Corporation ADR | | | | | | | | | | | 526 | | | | 27,857 | |
Tokyo Electron Limited | | | | | | | | | | | 92 | | | | 16,657 | |
Tokyo Seimitsu Company Limited | | | | | | | | | | | 575 | | | | 22,760 | |
| |
| | | | 1,133,222 | |
| | | | | |
|
| Software: 1.04% | |
Konami Holdings Corporation | | | | | | | | | | | 189 | | | | 10,400 | |
Microsoft Corporation (b) | | | | | | | | | | | 12,591 | | | | 1,077,034 | |
Miroku Jyoho Service Company Limited | | | | | | | | | | | 653 | | | | 17,618 | |
Nexon Company Limited † | | | | | | | | | | | 2,137 | | | | 62,209 | |
Nintendo Company Limited | | | | | | | | | | | 164 | | | | 59,953 | |
Nippon System Development Company Limited | | | | | | | | | | | 1,211 | | | | 25,838 | |
Nuance Communications Incorporated † | | | | | | | | | | | 21,953 | | | | 358,932 | |
The Descartes Systems Group Incorporated † | | | | | | | | | | | 1,375 | | | | 39,095 | |
Trend Micro Incorporated | | | | | | | | | | | 146 | | | | 8,280 | |
Verint Systems Incorporated † | | | | | | | | | | | 1,318 | | | | 55,159 | |
Workday Incorporated Class A † | | | | | | | | | | | 399 | | | | 40,594 | |
| |
| | | | 1,755,112 | |
| | | | | |
|
| Technology Hardware, Storage & Peripherals: 0.35% | |
Catcher Technology Company Limited | | | | | | | | | | | 2,155 | | | | 23,753 | |
NetApp Incorporated (b) | | | | | | | | | | | 7,683 | | | | 425,024 | |
Samsung Electronics Company Limited | | | | | | | | | | | 37 | | | | 88,063 | |
Western Digital Corporation | | | | | | | | | | | 570 | | | | 45,332 | |
| |
| | | | 582,172 | |
| | | | | |
|
Materials: 4.49% | |
|
| Chemicals: 2.75% | |
Adeka Corporation | | | | | | | | | | | 1,440 | | | | 25,369 | |
Asahi Kasei Corporation | | | | | | | | | | | 603 | | | | 7,779 | |
Celanese Corporation Series A | | | | | | | | | | | 344 | | | | 36,836 | |
Daicel Corporation | | | | | | | | | | | 3,551 | | | | 40,403 | |
Denka Company Limited | | | | | | | | | | | 336 | | | | 13,464 | |
Fujimi Incorporated | | | | | | | | | | | 935 | | | | 19,692 | |
Fuso Chemical Company Limited | | | | | | | | | | | 565 | | | | 15,344 | |
Ingevity Corporation † | | | | | | | | | | | 7,557 | | | | 532,542 | |
JSR Corporation | | | | | | | | | | | 1,789 | | | | 35,216 | |
Nissan Chemical Industries Limited | | | | | | | | | | | 371 | | | | 14,800 | |
Nitto Denko Corporation | | | | | | | | | | | 131 | | | | 11,638 | |
PPG Industries Incorporated (b) | | | | | | | | | | | 2,476 | | | | 289,246 | |
Praxair Incorporated | | | | | | | | | | | 2,325 | | | | 359,631 | |
Sanyo Chemical Industries Limited | | | | | | | | | | | 509 | | | | 26,653 | |
The Sherwin-Williams Company (b) | | | | | | | | | | | 7,826 | | | | 3,208,973 | |
| |
| | | | 4,637,586 | |
| | | | | |
The accompanying notes are an integral part of these financial statements.
| | | | | | |
| Consolidated portfolio of investments—December 31, 2017 (unaudited) | | Wells Fargo Alternative Strategies Fund | | | 19 | |
| | | | | | | | | | | | | | | | |
| Security name | | | | | | | | Shares | | | Value | |
|
| Construction Materials: 0.81% | |
Anhui Conch Cement Company Limited H Shares | | | | | | | | | | | 19,511 | | | $ | 91,776 | |
CRH plc | | | | | | | | | | | 2,546 | | | | 91,507 | |
CRH plc - London Exchange | | | | | | | | | | | 3,001 | | | | 107,656 | |
LafargeHolcim Limited - BATS Exchange | | | | | | | | | | | 2,387 | | | | 134,605 | |
Martin Marietta Materials Incorporated | | | | | | | | | | | 3,446 | | | | 761,704 | |
Sumitomo Osaka Cement Company | | | | | | | | | | | 7,475 | | | | 36,023 | |
Taiheiyo Cement Corporation | | | | | | | | | | | 960 | | | | 41,450 | |
Vicat SA | | | | | | | | | | | 519 | | | | 40,969 | |
Wienerberger AG | | | | | | | | | | | 2,464 | | | | 59,631 | |
| |
| | | | 1,365,321 | |
| | | | | |
|
| Containers & Packaging: 0.66% | |
Ball Corporation | | | | | | | | | | | 19,489 | | | | 737,659 | |
BillerudKorsnas AB | | | | | | | | | | | 1,731 | | | | 29,648 | |
International Paper Company | | | | | | | | | | | 1,833 | | | | 106,204 | |
Packaging Corporation of America | | | | | | | | | | | 523 | | | | 63,048 | |
RPC Group plc | | | | | | | | | | | 3,982 | | | | 47,392 | |
Smurfit Kappa Group plc | | | | | | | | | | | 2,421 | | | | 81,887 | |
WestRock Company | | | | | | | | | | | 827 | | | | 52,275 | |
| |
| | | | 1,118,113 | |
| | | | | |
|
| Metals & Mining: 0.25% | |
Acacia Mining plc | | | | | | | | | | | 5,713 | | | | 15,311 | |
Anglo American plc | | | | | | | | | | | 3,149 | | | | 65,879 | |
First Quantum Minerals Limited | | | | | | | | | | | 6,085 | | | | 85,248 | |
Glencore International plc | | | | | | | | | | | 9,561 | | | | 50,344 | |
Klondex Mines Limited † | | | | | | | | | | | 3,796 | | | | 9,845 | |
Petra Diamonds Limited † | | | | | | | | | | | 20,678 | | | | 21,776 | |
Randgold Resources Limited ADR | | | | | | | | | | | 266 | | | | 26,305 | |
Reliance Steel & Aluminum Company | | | | | | | | | | | 731 | | | | 62,712 | |
Salzgitter AG | | | | | | | | | | | 1,134 | | | | 64,759 | |
Yamato Kogyo Company Limited | | | | | | | | | | | 976 | | | | 28,368 | |
| |
| | | | 430,547 | |
| | | | | |
|
| Paper & Forest Products: 0.02% | |
Kapstone Paper & Packaging Corporation | | | | | | | | | | | 1,209 | | | | 27,432 | |
| | | | | | | | | | | | | | | | |
|
Real Estate: 0.51% | |
|
| Equity REITs: 0.30% | |
American Tower Corporation | | | | | | | | | | | 520 | | | | 74,188 | |
Axiare Patrimonio SOCIMI SA | | | | | | | | | | | 881 | | | | 19,471 | |
Grivalia Properties Real Estate Investment Company | | | | | | | | | | | 6,304 | | | | 69,587 | |
Hibernia REIT plc | | | | | | | | | | | 45,454 | | | | 83,116 | |
Host Hotels & Resorts Incorporated | | | | | | | | | | | 1,701 | | | | 33,765 | |
LaSalle Logiport REIT | | | | | | | | | | | 41 | | | | 41,955 | |
National Storage REIT | | | | | | | | | | | 30,811 | | | | 36,902 | |
Public Storage Incorporated | | | | | | | | | | | 470 | | | | 98,230 | |
Simon Property Group Incorporated | | | | | | | | | | | 149 | | | | 25,589 | |
STORE Capital Corporation | | | | | | | | | | | 1,101 | | | | 28,670 | |
| |
| | | | 511,473 | |
| | | | | |
The accompanying notes are an integral part of these financial statements.
| | | | |
| 20 | | Wells Fargo Alternative Strategies Fund | | Consolidated portfolio of investments—December 31, 2017 (unaudited) |
| | | | | | | | | | | | | | | | |
| Security name | | | | | | | | Shares | | | Value | |
|
| Real Estate Management & Development: 0.21% | |
Aedas Homes S.A.U. † | | | | | | | | | | | 1,980 | | | $ | 72,696 | |
BR Malls Participacoes SA | | | | | | | | | | | 9,803 | | | | 37,621 | |
Corporacion Inmobiliaria Vesta SAB de CV | | | | | | | | | | | 25,050 | | | | 31,137 | |
Daito Trust Construction Company Limited | | | | | | | | | | | 134 | | | | 27,323 | |
Daiwa House Industry Company Limited | | | | | | | | | | | 1,455 | | | | 55,876 | |
Henderson Land Development Company Limited | | | | | | | | | | | 4,296 | | | | 28,318 | |
LEG Immobilien AG | | | | | | | | | | | 519 | | | | 59,339 | |
Realogy Holdings Corporation | | | | | | | | | | | 1,681 | | | | 44,547 | |
| |
| | | | 356,857 | |
| | | | | |
|
Telecommunication Services: 0.86% | |
|
| Diversified Telecommunication Services: 0.31% | |
BT Group plc | | | | | | | | | | | 20,383 | | | | 74,772 | |
Cellnex Telecom SA 144A | | | | | | | | | | | 5,720 | | | | 146,528 | |
Consolidated Communications Holdings Incorporated | | | | | | | | | | | 4,728 | | | | 57,634 | |
Hellenic Telecommunications Organization SA | | | | | | | | | | | 6,480 | | | | 89,413 | |
Nippon Telegraph & Telephone Corporation | | | | | | | | | | | 3,205 | | | | 150,785 | |
| |
| | | | 519,132 | |
| | | | | |
|
| Wireless Telecommunication Services: 0.55% | |
KDDI Corporation | | | | | | | | | | | 5,077 | | | | 126,367 | |
Orange Belgium SA | | | | | | | | | | | 1,444 | | | | 30,320 | |
Play Communications SA † | | | | | | | | | | | 17,945 | | | | 174,297 | |
SoftBank Group Corporation | | | | | | | | | | | 301 | | | | 23,829 | |
VEON Limited ADR | | | | | | | | | | | 148,732 | | | | 571,131 | |
| |
| | | | 925,944 | |
| | | | | |
|
Utilities: 0.39% | |
|
| Electric Utilities: 0.09% | |
Iberdrola SA | | | | | | | | | | | 10,062 | | | | 77,991 | |
Power Assets Holdings Limited | | | | | | | | | | | 8,335 | | | | 70,358 | |
| |
| | | | 148,349 | |
| | | | | |
| | | | |
| Gas Utilities: 0.01% | | | | | | | | | | | | | | | | |
Infraestructura Energetica Nova SAB de CV | | | | | | | | | | | 3,735 | | | | 18,274 | |
| | | | | | | | | | | | | | | | |
| | | | |
| Independent Power & Renewable Electricity Producers: 0.02% | | | | | | | | | | | | | | | | |
China Longyuan Power Group Corporation H Shares | | | | | | | | | | | 46,370 | | | | 32,999 | |
| | | | | | | | | | | | | | | | |
| | | | |
| Multi-Utilities: 0.24% | | | | | | | | | | | | | | | | |
Centrica plc | | | | | | | | | | | 31,995 | | | | 59,311 | |
E.ON SE | | | | | | | | | | | 11,726 | | | | 127,483 | |
Engie SA | | | | | | | | | | | 3,766 | | | | 64,775 | |
National Grid plc | | | | | | | | | | | 6,093 | | | | 71,990 | |
RWE AG † | | | | | | | | | | | 1,970 | | | | 40,183 | |
Veolia Environnement SA | | | | | | | | | | | 2,005 | | | | 51,181 | |
| | | | |
| | | | | | | | | | | | | | | 414,923 | |
| | | | | | | | | | | | | | | | |
The accompanying notes are an integral part of these financial statements.
| | | | | | |
| Consolidated portfolio of investments—December 31, 2017 (unaudited) | | Wells Fargo Alternative Strategies Fund | | | 21 | |
| | | | | | | | | | | | | | | | |
| Security name | | | | | | | | Shares | | | Value | |
| | | | |
| Water Utilities: 0.03% | | | | | | | | | | | | | | | | |
Compania de Saneamento do Parana | | | | | | | | | | | 2,695 | | | $ | 48,666 | |
| | | | | | | | | | | | | | | | |
| | | | |
Total Common Stocks (Cost $53,189,076) | | | | | | | | | | | | | | | 66,919,635 | |
| | | | | | | | | | | | | | | | |
| | | | |
Exchange-Traded Funds: 0.02% | | | | | | | | | | | | | | | | |
iShares Core MSCI Europe ETF | | | | | | | | | | | 361 | | | | 18,111 | |
TOPIX ETF | | | | | | | | | | | 1,140 | | | | 18,920 | |
| | | | |
Total Exchange-Traded Funds (Cost $35,672) | | | | | | | | | | | | | | | 37,031 | |
| | | | | | | | | | | | | | | | |
| | | | |
Investment Companies: 7.59% | | | | | | | | | | | | | | | | |
| | | | |
| Alternative Investment Funds: 7.59% | | | | | | | | | | | | | | | | |
AQR Alternative Risk Premia Fund Class R6 † | | | | | | | | | | | 29,762 | | | | 298,214 | |
AQR Managed Futures Strategy Fund Class I † | | | | | | | | | | | 362,010 | | | | 3,341,353 | |
Western Asset Macro Opportunities Fund | | | | | | | | | | | 799,717 | | | | 9,180,752 | |
| | | | |
Total Investment Companies (Cost $13,178,322) | | | | | | | | | | | | | | | 12,820,319 | |
| | | | | |
| | | | |
| | | Interest rate | | | Maturity date | | | Principal | | | | |
| Non-Agency Mortgage-Backed Securities: 15.37% | |
ACE Securities Corporation Series 2004-SD1 Class M3 (1 Month LIBOR +4.13%) ± | | | 5.45 | % | | | 11-25-2033 | | | $ | 475,000 | | | | 467,667 | |
ACE Securities Corporation Series 2006-ASP4 Class A2C (1 Month LIBOR +0.16%) ± | | | 1.71 | | | | 8-25-2036 | | | | 574,172 | | | | 553,822 | |
American Home Mortgage Investment Series 2005-1 Class 7A2 (6 Month LIBOR +2.00%) ± | | | 3.56 | | | | 6-25-2045 | | | | 376,898 | | | | 379,840 | |
Amortizing Residential Collateral Trust Series 2002-BC7 Class M1 (1 Month LIBOR +1.20%) ± | | | 2.53 | | | | 10-25-2032 | | | | 310,089 | | | | 267,215 | |
Banc of America Alternative Loan Trust Series 2006-3 Class 3A5 | | | 6.00 | | | | 4-25-2036 | | | | 316,139 | | | | 292,977 | |
Banc of America Alternative Loan Trust Series 2007-1 Class 3A11 (1 Month LIBOR +0.60%) ± | | | 1.93 | | | | 4-25-2037 | | | | 1,133,293 | | | | 860,191 | |
Banc of America Funding Corporation Series 2005-F Class 6A2 ±± | | | 3.64 | | | | 9-20-2035 | | | | 386,191 | | | | 372,796 | |
Bear Stearns Alt-A Trust Series 2004-12 Class 2A4 ±± | | | 3.50 | | | | 1-25-2035 | | | | 463,554 | | | | 434,687 | |
Bear Stearns Asset Backed Securities Trust Series 2001-3 Class A1 (1 Month LIBOR +0.90%) ± | | | 2.23 | | | | 10-27-2032 | | | | 731,349 | | | | 707,334 | |
Bear Stearns Mortgage Funding Trust Series 2006-AR3 Class 2A1 (1 Month LIBOR +0.20%) ± | | | 1.75 | | | | 11-25-2036 | | | | 234,990 | | | | 218,052 | |
Citicorp Mortgage Securities Incorporated Series 2005-7 Class 3A1 | | | 5.00 | | | | 10-25-2035 | | | | 42,003 | | | | 41,908 | |
Citigroup Mortgage Loan Trust Incorporated Series 2007-10 Class 2A3A ±± | | | 3.89 | | | | 9-25-2037 | | | | 1,024,401 | | | | 978,004 | |
Citigroup Mortgage Loan Trust Incorporated Series 2010-4 Class 3A6 144A±± | | | 6.25 | | | | 11-25-2037 | | | | 286,122 | | | | 231,078 | |
Citimortgage Alternative Loan Trust Series 2007-A5 Class 1A12 ¤ | | | 0.00 | | | | 5-25-2037 | | | | 1,019,826 | | | | 684,764 | |
Countrywide Alternative Loan Trust Series 2004-34T1 Class A1 | | | 5.50 | | | | 2-25-2035 | | | | 282,315 | | | | 282,385 | |
Countrywide Alternative Loan Trust Series 2007-8CB Class A1 | | | 5.50 | | | | 5-25-2037 | | | | 247,562 | | | | 206,456 | |
Countrywide Asset-Backed Certificates Series 2002-6 Class M1 (1 Month LIBOR +1.65%) ± | | | 2.98 | | | | 2-25-2033 | | | | 320,389 | | | | 303,804 | |
Countrywide Asset-Backed Certificates Series 2003-5 Class MF3 ±± | | | 5.25 | | | | 9-25-2033 | | | | 534,703 | | | | 520,575 | |
Countrywide Home Loans Series 2005-6 Class 2A1 | | | 5.50 | | | | 4-25-2035 | | | | 53,021 | | | | 51,259 | |
Countrywide Home Loans Series 2005-HYB1 Class 3A1 ±± | | | 3.41 | | | | 3-25-2035 | | | | 318,026 | | | | 312,392 | |
Countrywide Home Loans Series 2006-3 Class 2A1 (1 Month LIBOR +0.25%) ± | | | 1.58 | | | | 3-25-2036 | | | | 160,304 | | | | 146,502 | |
Credit Based Asset Servicing and Securitization Series 2004-RP1 Class M2 (1 Month LIBOR +1.65%) 144A± | | | 3.80 | | | | 5-25-2050 | | | | 697,368 | | | | 700,709 | |
Credit Suisse First Boston Mortgage Securities Series 2005-2 Class 5A7 | | | 6.00 | | | | 3-25-2035 | | | | 457,743 | | | | 453,564 | |
Deutsche Mortgage Securities Incorporated Series 2004-2 Class M1 | | | 5.59 | | | | 1-25-2034 | | | | 101,658 | | | | 94,823 | |
The accompanying notes are an integral part of these financial statements.
| | | | |
| 22 | | Wells Fargo Alternative Strategies Fund | | Consolidated portfolio of investments—December 31, 2017 (unaudited) |
| | | | | | | | | | | | | | | | |
| Security name | | Interest rate | | | Maturity date | | | Principal | | | Value | |
| | | | |
Non-Agency Mortgage-Backed Securities (continued) | | | | | | | | | | | | | | | | |
First Franklin Mortgage Loan Asset-Backed Certificates Series 2004-FF6 Class M2 (1 Month LIBOR +1.88%) ± | | | 3.20 | % | | | 7-25-2034 | | | $ | 361,462 | | | $ | 338,131 | |
First Horizon Mortgage Pass-Through Trust Series 2006-AR2 Class AM ±± | | | 3.46 | | | | 8-25-2036 | | | | 106,897 | | | | 102,245 | |
GSR Mortgage Loan Trust Series 2004-8F Class B1 ±± | | | 6.01 | | | | 9-25-2034 | | | | 970,535 | | | | 963,491 | |
GSR Mortgage Loan Trust Series 2005-AR4 Class 3A5 ±± | | | 3.42 | | | | 7-25-2035 | | | | 545,385 | | | | 526,348 | |
HarborView Mortgage Loan Trust Series 2004-1 Class 1A (1 Month LIBOR +0.60%) ± | | | 2.10 | | | | 4-19-2034 | | | | 951,369 | | | | 889,891 | |
HarborView Mortgage Loan Trust Series 2004-10 Class 3A1B ±± | | | 3.74 | | | | 1-19-2035 | | | | 732,815 | | | | 725,283 | |
Impac CMB Trust Series 2005-1 Class 2A2 (1 Month LIBOR +0.62%) ± | | | 1.95 | | | | 4-25-2035 | | | | 376,091 | | | | 354,096 | |
Impac CMB Trust Series 2005-4 Class 2M2 (1 Month LIBOR +1.13%) ± | | | 2.45 | | | | 5-25-2035 | | | | 67,344 | | | | 62,134 | |
IndyMac INDX Mortgage Loan Trust Series 2004-AR13 Class 2A3 ±± | | | 3.19 | | | | 1-25-2035 | | | | 289,434 | | | | 263,606 | |
MASTR Adjustable Rate Mortgages Trust Series 2003-6 Class 5A1 ±± | | | 2.99 | | | | 12-25-2033 | | | | 812,038 | | | | 798,294 | |
MASTR Adjustable Rate Mortgages Trust Series 2005-6 Class 5A1 ±± | | | 3.23 | | | | 7-25-2035 | | | | 455,255 | | | | 413,169 | |
Merrill Lynch Mortgage Investors Trust Series 2004-SL2 Class B2 (1 Month LIBOR +2.70%) ± | | | 4.03 | | | | 6-25-2035 | | | | 299,699 | | | | 301,921 | |
MLCC Mortgage Investors Incorporated Series 2003-E Class B1 (1 Month LIBOR +0.90%) ± | | | 2.23 | | | | 10-25-2028 | | | | 625,744 | | | | 570,000 | |
MLCC Mortgage Investors Incorporated Series 2004-C Class B1 (1 Month LIBOR +0.74%) ± | | | 2.06 | | | | 7-25-2029 | | | | 302,862 | | | | 278,964 | |
MLCC Mortgage Investors Incorporated Series 2004-F Class B1 ±± | | | 2.90 | | | | 12-25-2029 | | | | 649,589 | | | | 609,813 | |
Morgan Stanley Capital Incorporated Series 2004-HE1 Class M3 (1 Month LIBOR +2.18%) ± | | | 3.73 | | | | 1-25-2034 | | | | 1,031,250 | | | | 996,339 | |
Morgan Stanley Mortgage Loan Trust Series 2004-8AR Class 4A2 ±± | | | 3.43 | | | | 10-25-2034 | | | | 93,408 | | | | 93,294 | |
Morgan Stanley Re-REMIC Trust Series 2014-R4 Class 4B1 144A±± | | | 3.56 | | | | 11-21-2035 | | | | 921,643 | | | | 908,695 | |
MortgageIT Trust Series 2005-2 Class 1B1 (1 Month LIBOR +1.43%) ± | | | 2.75 | | | | 5-25-2035 | | | | 205,500 | | | | 198,329 | |
MortgageIT Trust Series 2005-2 Class 1M2 (1 Month LIBOR +0.81%) ± | | | 2.14 | | | | 5-25-2035 | | | | 171,250 | | | | 162,782 | |
Nomura Asset Acceptance Corporation Series 2005-AR5 Class 2A1 ±± | | | 3.25 | | | | 10-25-2035 | | | | 268,848 | | | | 265,041 | |
Opteum Mortgage Acceptance Corporation Series 2005-5 Class 2AD2 ±± | | | 5.85 | | | | 12-25-2035 | | | | 415,421 | | | | 423,459 | |
RBSSP Resecuritization Trust Series 2009-6 Class 17A3 144A±± | | | 6.00 | | | | 6-26-2037 | | | | 810,575 | | | | 674,713 | |
Residential Asset Mortgage Products Incorporated Series 2004-RS2 Class MI1 | | | 5.59 | | | | 2-25-2034 | | | | 392,373 | | | | 393,454 | |
Rockwall CDO Series 2007-1A Class B2L (3 Month LIBOR +4.25%) 144A± | | | 5.63 | | | | 8-1-2024 | | | | 971,444 | | | | 971,398 | |
Sequoia Mortgage Trust Series 2007-4 Class 4A1 ±± | | | 3.46 | | | | 7-20-2047 | | | | 716,829 | | | | 649,006 | |
Structured Adjustable Rate Mortgage Loan Trust Series 2004-20 Class 1A3 ±± | | | 3.38 | | | | 1-25-2035 | | | | 738,526 | | | | 732,625 | |
Structured Adjustable Rate Mortgage Loan Trust Series 2005-21 Class 3A1 ±± | | | 3.61 | | | | 11-25-2035 | | | | 122,920 | | | | 114,211 | |
Structured Asset Securities Corporation Series 2003-34A Class 6A ±± | | | 3.67 | | | | 11-25-2033 | | | | 272,433 | | | | 270,323 | |
Structured Asset Securities Corporation Series 2006-3H Class PO ¤ | | | 0.00 | | | | 12-25-2035 | | | | 485,352 | | | | 339,526 | |
SunTrust Adjustable Rate Mortgage Loan Trust Series 2007-1 Class 1A1 ±± | | | 3.60 | | | | 2-25-2037 | | | | 212,525 | | | | 179,598 | |
Washington Mutual Mortgage Pass-Through Trust Series 2006-5 Class 1A3 | | | 6.00 | | | | 7-25-2036 | | | | 121,561 | | | | 108,267 | |
Wells Fargo Home Equity Trust Series 2005-1 Class M10 (1 Month LIBOR +3.75%) ± | | | 5.30 | | | | 4-25-2035 | | | | 307,841 | | | | 314,104 | |
Wells Fargo Mortgage-Backed Securities Trust Series 2003-N Class 2A3 ±± | | | 3.55 | | | | 12-25-2033 | | | | 897,480 | | | | 893,776 | |
Wells Fargo Mortgage-Backed Securities Trust Series 2005-AR16 Class 6A2 ±± | | | 3.45 | | | | 10-25-2035 | | | | 440,512 | | | | 440,448 | |
Wells Fargo Mortgage-Backed Securities Trust Series 2006-AR11 Class A6 ±± | | | 3.48 | | | | 8-25-2036 | | | | 63,954 | | | | 61,073 | |
| |
Total Non-Agency Mortgage-Backed Securities (Cost $25,857,868) | | | | 25,950,651 | |
| | | | | |
| | | | |
| | | | | | Expiration date | | | Shares | | | | |
| Participation Notes: 1.89% | |
|
Financials: 1.45% | |
|
| Banks: 1.45% | |
HSBC Bank plc (Alinma AB) †(a) | | | | | | | 1-22-2018 | | | | 252,634 | | | | 1,289,946 | |
Morgan Stanley BV (Al-Rajhi Bank) †(a) | | | | | | | 7-2-2018 | | | | 47,749 | | | | 820,409 | |
Morgan Stanley BV (National Commercial Bank) †(a) | | | | | | | 10-30-2018 | | | | 23,615 | | | | 337,744 | |
| |
| | | | 2,448,099 | |
| | | | | |
The accompanying notes are an integral part of these financial statements.
| | | | | | |
| Consolidated portfolio of investments—December 31, 2017 (unaudited) | | Wells Fargo Alternative Strategies Fund | | | 23 | |
| | | | | | | | | | | | | | | | |
| Security name | | | | | Expiration date | | | Shares | | | Value | |
|
Materials: 0.44% | |
|
| Chemicals: 0.44% | |
Merrill Lynch International & Company CV (Saudi Basic Industries Corporation) †(a) | | | | | | | 2-20-2020 | | | | 27,132 | | | $ | 737,096 | |
| | | | | | | | | | | | | | | | |
| |
Total Participation Notes (Cost $2,751,096) | | | | 3,185,195 | |
| | | | | |
| | |
| | | Dividend yield | | | | |
| Preferred Stocks: 0.23% | |
|
Consumer Discretionary: 0.15% | |
|
| Automobiles: 0.15% | |
Volkswagen AG | | | 2.24 | % | | | | | | | 1,300 | | | | 259,629 | |
| | | | | | | | | | | | | | | | |
|
Financials: 0.05% | |
|
| Banks: 0.05% | |
Itau Unibanco Holding SA | | | 0.47 | | | | | | | | 7,050 | | | | 90,497 | |
| | | | | | | | | | | | | | | | |
|
Industrials: 0.03% | |
|
| Transportation Infrastructure: 0.03% | |
Uber Technologies Incorporated †(a)‡ | | | 0.00 | | | | | | | | 1,216 | | | | 42,682 | |
| | | | | | | | | | | | | | | | |
| |
Total Preferred Stocks (Cost $329,791) | | | | 392,808 | |
| | | | | |
| | | | | | | | | | | | | | | | | | | | |
| | | Counterparty¤¤ | | Number of
contracts | | Notional amount | | | Exercise price | | | Expiration date | | | | |
| Purchased Put Options: 0.15% | |
S&P 500 Index | | Morgan Stanley | | 6 | | $ | 51,438 | | | $ | 2,175 | | | | 03-16-2018 | | | | 1,920 | |
S&P 500 Index | | Morgan Stanley | | 14 | | | 66,669 | | | | 2,525 | | | | 06-15-2018 | | | | 59,808 | |
S&P 500 Index | | Morgan Stanley | | 12 | | | 99,912 | | | | 2,325 | | | | 09-21-2018 | | | | 47,040 | |
S&P 500 Index | | Morgan Stanley | | 23 | | | 198,675 | | | | 2,400 | | | | 12-21-2018 | | | | 148,350 | |
| |
Total Purchased Put Options (Cost $416,694) | | | | 257,118 | |
| | | | | |
| | | | | | | | | | | | | | | | |
| | | Yield | | | | | | Shares | | | | |
| Short-Term Investments: 27.78% | |
|
| Investment Companies: 26.40% | |
Wells Fargo Government Money Market Fund Select Class (l)(u) | | | 1.19 | % | | | | | | | 44,599,315 | | | | 44,599,315 | |
| | | | | | | | | | | | | | | | |
| | | | |
| | | | | | Maturity date | | | Principal | | | | |
| U.S. Treasury Securities: 1.38% | |
U.S. Treasury Bill #(z) | | | 1.24 | | | | 3-8-2018 | | | $ | 2,335,000 | | | | 2,329,546 | |
| | | | | | | | | | | | | | | | |
| |
Total Short-Term Investments (Cost $46,928,917) | | | | 46,928,861 | |
| | | | | | | | | | | | | | | | |
The accompanying notes are an integral part of these financial statements.
| | | | |
| 24 | | Wells Fargo Alternative Strategies Fund | | Consolidated portfolio of investments—December 31, 2017 (unaudited) |
| | | | | | | | | | | | | | | | |
| Security name | | | | | | | | Shares | | | Value | |
|
Securities Sold Short: (9.23%) | |
|
Common Stocks: (2.56%) | |
|
Consumer Discretionary: (0.71%) | |
|
| Multiline Retail: (0.27%) | |
Kohl’s Corporation | | | | | | | | | | | (4,380 | ) | | $ | (237,527 | ) |
Target Corporation | | | | | | | | | | | (3,285 | ) | | | (214,346 | ) |
| |
| | | | (451,873 | ) |
| | | | | |
|
| Specialty Retail: (0.15%) | |
The Gap Incorporated | | | | | | | | | | | (7,482 | ) | | | (254,837 | ) |
| | | | | | | | | | | | | | | | |
|
| Textiles, Apparel & Luxury Goods: (0.29%) | |
The Swatch Group AG | | | | | | | | | | | (1,205 | ) | | | (491,423 | ) |
| | | | | | | | | | | | | | | | |
|
Consumer Staples: (0.22%) | |
|
| Food & Staples Retailing: (0.22%) | |
Wal-Mart Stores Incorporated | | | | | | | | | | | (3,764 | ) | | | (371,695 | ) |
| | | | | | | | | | | | | | | | |
|
Energy: (0.57%) | |
|
| Oil, Gas & Consumable Fuels: (0.57%) | |
Cabot Oil & Gas Corporation | | | | | | | | | | | (12,714 | ) | | | (363,620 | ) |
Occidental Petroleum Corporation | | | | | | | | | | | (8,182 | ) | | | (602,686 | ) |
| |
| | | | (966,306 | ) |
| | | | | |
|
Industrials: (0.79%) | |
|
| Trading Companies & Distributors: (0.79%) | |
Fastenal Company | | | | | | | | | | | (3,849 | ) | | | (210,502 | ) |
HD Supply Holdings Incorporated † | | | | | | | | | | | (4,864 | ) | | | (194,706 | ) |
W.W. Grainger Incorporated | | | | | | | | | | | (3,904 | ) | | | (922,320 | ) |
| |
| | | | (1,327,528 | ) |
| | | | | |
|
Information Technology: (0.27%) | |
|
| IT Services: (0.27%) | |
Accenture plc Class A | | | | | | | | | | | (2,939 | ) | | | (449,932 | ) |
| | | | | | | | | | | | | | | | |
| |
Total Common Stocks - Securities Sold Short (Proceeds $(3,637,420)) | | | | (4,313,594 | ) |
| | | | | |
|
Exchange-Traded Funds: (6.67%) | |
Consumer Discretionary Select Sector SPDR Fund | | | | | | | | | | | (4,538 | ) | | | (447,855 | ) |
Consumer Staples Select Sector SPDR Fund | | | | | | | | | | | (8,177 | ) | | | (465,190 | ) |
Health Care Select Sector SPDR Fund | | | | | | | | | | | (3,259 | ) | | | (269,454 | ) |
Industrial Select Sector SPDR Fund | | | | | | | | | | | (4,458 | ) | | | (337,337 | ) |
SPDR S&P 500 | | | | | | | | | | | (31,542 | ) | | | (8,417,298 | ) |
Technology Select Sector SPDR Fund | | | | | | | | | | | (20,873 | ) | | | (1,334,828 | ) |
| |
Total Exchange-Traded Funds - Securities Sold Short (Proceeds $(10,346,187)) | | | | (11,271,962 | ) |
| | | | | |
| |
Total Securities Sold Short (Proceeds $(13,983,607)) | | | | (15,585,556 | ) |
| | | | | |
| | | | | | | | |
| Total investments in securities (excluding securities sold short) (Cost $142,687,436) | | | 92.65 | % | | | 156,491,618 | |
Total securities sold short (Proceeds $(13,983,607) | | | (9.23 | ) | | | (15,585,556 | ) |
Other assets and liabilities, net | | | 16.58 | | | | 28,006,062 | |
| | | | | | | | |
| Total net assets | | | 100.00 | % | | $ | 168,912,124 | |
| | | | | | | | |
The accompanying notes are an integral part of these financial statements.
| | | | | | |
| Consolidated portfolio of investments—December 31, 2017 (unaudited) | | Wells Fargo Alternative Strategies Fund | | | 25 | |
| † | Non-income-earning security |
| (b) | All or a portion of this security is segregated as collateral for securities sold short. |
| (a) | The security is fair valued in accordance with procedures approved by the Board of Trustees. |
| 144A | The security may be resold in transactions exempt from registration, normally to qualified institutional buyers, pursuant to Rule 144A under the Securities Act of 1933. |
| ± | Variable rate investment. The rate shown is the rate in effect at period end. |
| ±± | The coupon of the security is adjusted based on the principal and interest payments received from the underlying pool of mortgages as well as the credit quality and the actual prepayment speed of the underlying mortgages. |
| ¤ | The security is issued in zero coupon form with no periodic interest payments. |
| ¤¤ | Transactions can only be closed with the originating counterparty |
| ‡ | Security is valued using significant unobservable inputs. |
| (l) | The issuer of the security is an affiliated person of the Fund as defined in the Investment Company Act of 1940. |
| (u) | The rate represents the 7-day annualized yield at period end. |
| # | All or a portion of this security is segregated as collateral for investments in derivative instruments. |
| (z) | Zero coupon security. The rate represents the current yield to maturity. |
Written Options
| | | | | | | | | | | | | | | | | | | | | | | | |
| Description | | Counterparty¤¤ | | | Number of contracts | | | Notional amount | | | Exercise price | | | Expiration date | | | Value | |
Put | | | | | | | | | | | | | | | | | | | | | | | | |
S&P 500 Index | | | Morgan Stanley | | | | 6 | | | $ | 1,170,000 | | | $ | 1,950 | | | | 3-16-2018 | | | $ | (750 | ) |
S&P 500 Index | | | Morgan Stanley | | | | 14 | | | | 3,255,000 | | | | 2,325 | | | | 6-15-2018 | | | | (31,150 | ) |
S&P 500 Index | | | Morgan Stanley | | | | 12 | | | | 2,490,000 | | | | 2,075 | | | | 9-21-2018 | | | | (23,160 | ) |
S&P 500 Index | | | Morgan Stanley | | | | 23 | | | | 4,945,000 | | | | 2,150 | | | | 12-21-2018 | | | | (90,002 | ) |
| | | | | | | | | | | | | | | | | | | | | | | | |
| | | | | | | | | | | | | | | | | | | | | | $ | (145,062 | ) |
| | | | | | | | | | | | | | | | | | | | | | | | |
| | ¤¤ | Transactions can only be closed with the originating counterparty. |
Futures Contracts
| | | | | | | | | | | | | | | | | | | | | | | | |
| Description | | Number of contracts | | | Expiration date | | | Notional cost | | | Notional value | | | Unrealized gains | | | Unrealized losses | |
Long | | | | | | | | | | | | | | | | | | | | | | | | |
Amsterdam Index | | | 3 | | | | 1-19-2018 | | | $ | 396,555 | | | $ | 391,991 | | | $ | 0 | | | $ | (4,564 | ) |
CAC 40 Index | | | 14 | | | | 1-19-2018 | | | | 907,489 | | | | 892,052 | | | | 0 | | | | (15,437 | ) |
IBEX 35 Index | | | 18 | | | | 1-19-2018 | | | | 2,211,037 | | | | 2,164,221 | | | | 0 | | | | (46,816 | ) |
TOPIX Index | | | 34 | | | | 3-8-2018 | | | | 5,373,826 | | | | 5,482,849 | | | | 109,023 | | | | 0 | |
10-Year Australian Treasury Bonds | | | 86 | | | | 3-15-2018 | | | | 8,739,080 | | | | 8,666,694 | | | | 0 | | | | (72,386 | ) |
S&P/TSX 60 Index | | | 1 | | | | 3-15-2018 | | | | 152,496 | | | | 152,331 | | | | 0 | | | | (165 | ) |
DAX Index | | | 3 | | | | 3-16-2018 | | | | 1,177,576 | | | | 1,161,754 | | | | 0 | | | | (15,822 | ) |
FTSE 100 Index | | | 51 | | | | 3-16-2018 | | | | 5,096,417 | | | | 5,259,350 | | | | 162,933 | | | | 0 | |
FTSE MIB Index | | | 5 | | | | 3-16-2018 | | | | 665,635 | | | | 652,628 | | | | 0 | | | | (13,007 | ) |
10-Year Canadian Treasury Bonds | | | 48 | | | | 3-20-2018 | | | | 5,220,939 | | | | 5,146,730 | | | | 0 | | | | (74,209 | ) |
10-Year U.S. Treasury Notes | | | 60 | | | | 3-20-2018 | | | | 7,491,102 | | | | 7,442,813 | | | | 0 | | | | (48,289 | ) |
The accompanying notes are an integral part of these financial statements.
| | | | |
| 26 | | Wells Fargo Alternative Strategies Fund | | Consolidated portfolio of investments—December 31, 2017 (unaudited) |
Futures Contracts (continued)
| | | | | | | | | | | | | | | | | | | | | | | | |
| Description | | Number of contracts | | | Expiration date | | | Notional cost | | | Notional value | | | Unrealized gains | | | Unrealized losses | |
Short | | | | | | | | | | | | | | | | | | | | | | | | |
Hang Seng Index | | | (1) | | | | 1-30-2018 | | | $ | (186,987 | ) | | $ | (191,659 | ) | | $ | 0 | | | $ | (4,672 | ) |
Euro-Bund Futures | | | (50) | | | | 3-8-2018 | | | | (9,777,015 | ) | | | (9,699,582 | ) | | | 77,433 | | | | 0 | |
TOPIX Index | | | (3) | | | | 3-8-2018 | | | | (473,465 | ) | | | (483,781 | ) | | | 0 | | | | (10,316 | ) |
SPI 200 Index | | | (13) | | | | 3-15-2018 | | | | (1,527,019 | ) | | | (1,526,560 | ) | | | 459 | | | | 0 | |
Euro STOXX 50 Index | | | (78) | | | | 3-16-2018 | | | | (3,353,936 | ) | | | (3,269,037 | ) | | | 84,899 | | | | 0 | |
FTSE 100 Index | | | (11) | | | | 3-16-2018 | | | | (1,103,311 | ) | | | (1,134,370 | ) | | | 0 | | | | (31,059 | ) |
MSCI EAFE Index | | | (23) | | | | 3-16-2018 | | | | (2,320,481 | ) | | | (2,352,325 | ) | | | 0 | | | | (31,844 | ) |
MSCI Emerging Markets Index | | | (25) | | | | 3-16-2018 | | | | (1,403,390 | ) | | | (1,454,625 | ) | | | 0 | | | | (51,235 | ) |
Russell 2000 Index | | | (19) | | | | 3-16-2018 | | | | (1,443,243 | ) | | | (1,459,675 | ) | | | 0 | | | | (16,432 | ) |
S&P 500 E-Mini Index | | | (82) | | | | 3-16-2018 | | | | (10,903,480 | ) | | | (10,971,600 | ) | | | 0 | | | | (68,120 | ) |
British Pound Futures | | | (66) | | | | 3-19-2018 | | | | (5,555,831 | ) | | | (5,592,263 | ) | | | 0 | | | | (36,432 | ) |
Euro FX Futures | | | (11) | | | | 3-19-2018 | | | | (1,631,969 | ) | | | (1,660,381 | ) | | | 0 | | | | (28,412 | ) |
Japanese Yen Futures | | | (10) | | | | 3-19-2018 | | | | (1,116,269 | ) | | | (1,114,250 | ) | | | 2,019 | | | | 0 | |
New Zealand Dollar Futures | | | (25) | | | | 3-19-2018 | | | | (1,755,473 | ) | | | (1,771,750 | ) | | | 0 | | | | (16,277 | ) |
Norwegian Krone Futures | | | (7) | | | | 3-19-2018 | | | | (1,694,399 | ) | | | (1,713,880 | ) | | | 0 | | | | (19,481 | ) |
Swedish Krona Futures | | | (17) | | | | 3-19-2018 | | | | (4,059,888 | ) | | | (4,175,880 | ) | | | 0 | | | | (115,992 | ) |
Canadian Dollar Futures | | | (41) | | | | 3-20-2018 | | | | (3,197,963 | ) | | | (3,275,900 | ) | | | 0 | | | | (77,937 | ) |
Long Gilt Bonds | | | (59) | | | | 3-27-2018 | | | | (9,911,129 | ) | | | (9,970,108 | ) | | | 0 | | | | (58,979 | ) |
Forward Foreign Currency Contracts
| | | | | | | | | | | | | | |
Currency to be received | | Currency to be delivered | | Counterparty¤¤ | | Settlement
date | | Unrealized gains | | | Unrealized losses | |
| 1,580,663 USD | | 1,317,000 EUR | | Morgan Stanley | | 1-11-2018 | | $ | 0 | | | $ | (287 | ) |
| 166,097 USD | | 203,000 CAD | | Morgan Stanley | | 1-11-2018 | | | 4,568 | | | | 0 | |
| 170,721 USD | | 612,000 PLN | | Morgan Stanley | | 1-11-2018 | | | 0 | | | | (5,094 | ) |
| 54,011 USD | | 45,000 EUR | | Morgan Stanley | | 1-11-2018 | | | 0 | | | | (7 | ) |
| 16,216 USD | | 20,000 CAD | | Morgan Stanley | | 1-11-2018 | | | 302 | | | | 0 | |
| 40,210 USD | | 34,000 EUR | | Morgan Stanley | | 1-11-2018 | | | 0 | | | | (605 | ) |
| 93,000 CAD | | 74,393 USD | | Morgan Stanley | | 1-11-2018 | | | 0 | | | | (392 | ) |
| 17,000 EUR | | 20,254 USD | | Morgan Stanley | | 1-11-2018 | | | 154 | | | | 0 | |
| 15,000 CAD | | 12,027 USD | | Morgan Stanley | | 1-11-2018 | | | 0 | | | | (92 | ) |
| 57,019 USD | | 48,000 EUR | | Morgan Stanley | | 1-11-2018 | | | 0 | | | | (601 | ) |
| 40,140 USD | | 34,000 EUR | | Morgan Stanley | | 1-11-2018 | | | 0 | | | | (674 | ) |
| 92,000 EUR | | 109,374 USD | | Morgan Stanley | | 1-11-2018 | | | 1,065 | | | | 0 | |
| 43,000 EUR | | 50,776 USD | | Morgan Stanley | | 1-11-2018 | | | 842 | | | | 0 | |
| 115,000 CAD | | 89,772 USD | | Morgan Stanley | | 1-11-2018 | | | 1,735 | | | | 0 | |
| 17,000 EUR | | 19,896 USD | | Morgan Stanley | | 1-11-2018 | | | 511 | | | | 0 | |
| 58,000 EUR | | 67,580 USD | | Morgan Stanley | | 1-11-2018 | | | 2,044 | | | | 0 | |
| 44,000 EUR | | 51,502 USD | | Morgan Stanley | | 1-11-2018 | | | 1,317 | | | | 0 | |
| 22,491 USD | | 19,000 EUR | | Morgan Stanley | | 1-11-2018 | | | 0 | | | | (317 | ) |
| 52,080 USD | | 44,000 EUR | | Morgan Stanley | | 1-11-2018 | | | 0 | | | | (738 | ) |
| 32,000 PLN | | 8,990 USD | | Morgan Stanley | | 1-11-2018 | | | 203 | | | | 0 | |
The accompanying notes are an integral part of these financial statements.
| | | | | | |
| Consolidated portfolio of investments—December 31, 2017 (unaudited) | | Wells Fargo Alternative Strategies Fund | | | 27 | |
Forward Foreign Currency Contracts (continued)
| | | | | | | | | | | | | | |
Currency to be received | | Currency to be delivered | | Counterparty¤¤ | | Settlement
date | | Unrealized gains | | | Unrealized losses | |
| 4,000 EUR | | 4,720 USD | | Morgan Stanley | | 1-11-2018 | | $ | 82 | | | $ | 0 | |
| 32,000 EUR | | 37,758 USD | | Morgan Stanley | | 1-11-2018 | | | 655 | | | | 0 | |
| 247,000 EUR | | 296,903 USD | | Morgan Stanley | | 1-11-2018 | | | 0 | | | | (399 | ) |
| 2,165,476 USD | | 242,404,000 JPY | | Credit Suisse | | 3-20-2018 | | | 5,942 | | | | 0 | |
| 1,279,870 USD | | 951,000 GBP | | JPMorgan | | 3-21-2018 | | | 0 | | | | (7,403 | ) |
| 147,523 EUR | | 174,943 USD | | Morgan Stanley | | 3-21-2018 | | | 2,881 | | | | 0 | |
| 461,624 USD | | 451,780 CHF | | Morgan Stanley | | 3-21-2018 | | | 0 | | | | (4,563 | ) |
| 64,276 USD | | 47,817 GBP | | Morgan Stanley | | 3-21-2018 | | | 0 | | | | (450 | ) |
| 32,751 USD | | 24,375 GBP | | Morgan Stanley | | 3-21-2018 | | | 0 | | | | (243 | ) |
| 1,147,187 USD | | 965,421 EUR | | Morgan Stanley | | 3-21-2018 | | | 0 | | | | (16,545 | ) |
| 100,197 USD | | 74,458 GBP | | Morgan Stanley | | 3-21-2018 | | | 0 | | | | (589 | ) |
| 3,247,833 USD | | 2,747,000 EUR | | UBS AG | | 3-21-2018 | | | 0 | | | | (63,440 | ) |
| | | | | | | | | | | | | | |
| | | | | | | | $ | 22,301 | | | $ | (102,439 | ) |
| | | | | | | | | | | | | | |
| | ¤¤ | Transactions can only be closed with the originating counterparty. |
Interest Rate Swaps
| | | | | | | | | | | | | | | | | | | | | | | | | | | | | | | | | | | | | | | | | | |
| Floating rate index | | Pay/receive floating rate | | Fixed rate | | | Floating rate | | | Payment frequency | | | Counterparty¤¤°° | | | Maturity date | | | Notional amount | | | Value | | | Premiums paid (received) | | | Unrealized gains | | | Unrealized losses | |
3-Month USD LIBOR* | | Pay | | | 2.00 | % | | | 1.63 | % | | | Semi-annual | | | | Morgan Stanley | | | | 12-20-2019 | | | $ | 2,386,971 | | | $ | 2,804 | | | $ | (13,029 | ) | | $ | 15,833 | | | $ | 0 | |
3-Month USD LIBOR* | | Receive | | | 2.00 | | | | 1.63 | | | | Semi-annual | | | | Morgan Stanley | | | | 12-20-2019 | | | | 2,399,507 | | | | (2,804 | ) | | | (493 | ) | | | 0 | | | | (2,311 | ) |
3-Month USD LIBOR* | | Pay | | | 1.75 | | | | 1.63 | | | | Semi-annual | | | | Morgan Stanley | | | | 3-21-2020 | | | | 2,443,866 | | | | 18,758 | | | | 15,866 | | | | 2,892 | | | | 0 | |
3-Month USD LIBOR* | | Pay | | | 2.25 | | | | 1.63 | | | | Semi-annual | | | | Morgan Stanley | | | | 12-20-2022 | | | | 995,257 | | | | (495 | ) | | | (4,743 | ) | | | 4,248 | | | | 0 | |
3-Month USD LIBOR* | | Receive | | | 2.25 | | | | 1.63 | | | | Semi-annual | | | | Morgan Stanley | | | | 12-20-2022 | | | | 1,003,006 | | | | 496 | | | | 3,006 | | | | 0 | | | | (2,510 | ) |
3-Month USD LIBOR* | | Pay | | | 2.00 | | | | 1.63 | | | | Semi-annual | | | | Morgan Stanley | | | | 3-21-2023 | | | | 1,022,660 | | | | 13,189 | | | | 10,660 | | | | 2,529 | | | | 0 | |
3-Month USD LIBOR* | | Pay | | | 2.50 | | | | 1.63 | | | | Semi-annual | | | | Morgan Stanley | | | | 12-20-2027 | | | | 1,265,763 | | | | (12,517 | ) | | | (34,237 | ) | | | 21,720 | | | | 0 | |
3-Month USD LIBOR* | | Receive | | | 2.50 | | | | 1.63 | | | | Semi-annual | | | | Morgan Stanley | | | | 12-20-2027 | | | | 1,318,592 | | | | 12,517 | | | | 18,592 | | | | 0 | | | | (6,075 | ) |
3-Month USD LIBOR* | | Pay | | | 2.25 | | | | 1.63 | | | | Semi-annual | | | | Morgan Stanley | | | | 3-21-2028 | | | | 1,344,167 | | | | 20,103 | | | | 14,167 | | | | 5,936 | | | | 0 | |
| | | | | | | | | | | | | | | | | | | | | | | | | | | | | | | | | | | | | | | | | | |
| | | | | | | | | | | | | | | | | | | | | | | | | | | | | | | | $ | 9,789 | | | $ | 53,158 | | | $ | (10,896 | ) |
| | | | | | | | | | | | | | | | | | | | | | | | | | | | | | | | | | | | | | | | | | |
| | * | Represents an investments held in ASF Special Investments (Cayman), Ltd., the consolidated entity. |
| | ¤¤ | Transactions can only be closed with the originating counterparty. |
| | °° | Exchange traded or centrally cleared transaction with counterparty. |
Total Return Swaps
| | | | | | | | | | | | | | | | | | | | | | | | |
| Reference asset | | Counterparty | | Maturity date | | Notional amount | | | Value | | | Premiums paid (received) | | | Unrealized gains | | | Unrealized losses | |
| In an agreement dated 5-2-2017, the Fund makes monthly payments of 1 Month USD LIBOR +55 basis points. At expiration, the Fund will receive the positive return or pay the negative return of the referenced entity JBS SA (common stock). | | Morgan Stanley¤¤ | | 5-2-2018 | | $ | 360,488 | | | $ | 26,167 | | | $ | 0 | | | $ | 26,167 | | | $ | 0 | |
| | ¤¤ | Transaction can only be closed with the originating counterparty. |
The accompanying notes are an integral part of these financial statements.
| | | | |
| 28 | | Wells Fargo Alternative Strategies Fund | | Consolidated portfolio of investments—December 31, 2017 (unaudited) |
Investments in Affiliates
An affiliated investment is an investment in which the Fund owns at least 5% of the outstanding voting shares of the issuer or as a result of other relationships, such as the Fund and the issuer having the same investment manager. Transactions with issuers that were either affiliated persons of the Fund at the beginning of the period or the end of the period were as follows:
| | | | | | | | | | | | | | | | | | | | | | | | | | | | | | | | | | | | |
| | | Shares, beginning of period | | | Shares purchased | | | Shares sold | | | Shares, end of period | | | Net realized gains
(losses) | | | Net
change in unrealized
gain
(losses) | | | Income
from
affiliated
securities | | | Value, end of period | | | % of net assets | |
| | | | | | | | | |
Short-Term Investments | | | | | | | | | | | | | | | | | | | | | | | | | | | | | | | | | | | | |
Investment Companies | | | | | | | | | | | | | | | | | | | | | | | | | | | | | | | | | | | | |
Wells Fargo Government Money Market Fund Select Class | | | 44,279,060 | | | | 142,081,162 | | | | 141,760,907 | | | | 44,599,315 | | | $ | 0 | | | $ | 0 | | | $ | 191,593 | | | $ | 44,599,315 | | | | 26.40 | % |
The accompanying notes are an integral part of these financial statements.
| | | | | | |
| Consolidated statement of assets and liabilities—December 31, 2017 (unaudited) | | Wells Fargo Alternative Strategies Fund | | | 29 | |
| | | | |
| | | | |
| |
Assets | | | | |
Investments in unaffiliated securities, at value (cost $98,088,121) | | $ | 111,892,303 | |
Investments in affiliated securities, at value (cost $44,599,315) | | | 44,599,315 | |
Cash | | | 574,632 | |
Cash at prime broker segregated for securities sold short | | | 14,944,955 | |
Cash at prime broker segregated for written options | | | 133,127 | |
Cash at prime broker segregated for futures contracts | | | 554,601 | |
Cash at prime broker segregated for total return swaps | | | 155,083 | |
Cash at prime broker segregated for interest rate swaps | | | 132,771 | |
Foreign currency, at value (cost $8,494,049) | | | 8,552,450 | |
Receivable for investments sold | | | 2,924,689 | |
Receivable for Fund shares sold | | | 1,115,154 | |
Receivable for dividends and interest | | | 191,286 | |
Receivable for daily variation margin on open futures contracts | | | 167,547 | |
Premiums paid on interest rate swap transactions | | | 62,291 | |
Unrealized gains on forward foreign currency contracts | | | 22,301 | |
Unrealized gains on total return swap transactions | | | 26,167 | |
Unrealized gains on interest rate swap transactions | | | 53,158 | |
Prepaid expenses and other assets | | | 62,210 | |
| | | | |
Total assets | | | 186,164,040 | |
| | | | |
| |
Liabilities | | | | |
Payable for securities sold short, at value (proceeds $13,983,607) | | | 15,585,556 | |
Payable for investments purchased | | | 458,262 | |
Payable for Fund shares redeemed | | | 286,979 | |
Management fee payable | | | 232,863 | |
Payable for daily variation margin on open futures contracts | | | 171,039 | |
Written options, at value (premiums received $214,942) | | | 145,062 | |
Unrealized losses on forward foreign currency contracts | | | 102,439 | |
Premiums received on interest rate swap transactions | | | 52,502 | |
Dividends payable on securities sold short | | | 46,974 | |
Administration fees payable | | | 19,997 | |
Unrealized losses on interest rate swap transactions | | | 10,896 | |
Distribution fee payable | | | 3,235 | |
Trustees’ fees and expenses payable | | | 2,165 | |
Accrued expenses and other liabilities | | | 133,947 | |
| | | | |
Total liabilities | | | 17,251,916 | |
| | | | |
Total net assets | | $ | 168,912,124 | |
| | | | |
| |
NET ASSETS CONSIST OF | | | | |
Paid-in capital | | $ | 159,606,882 | |
Accumulated net investment loss | | | (859,720 | ) |
Accumulated net realized losses on investments | | | (1,735,836 | ) |
Net unrealized gains on investments | | | 11,900,798 | |
| | | | |
Total net assets | | $ | 168,912,124 | |
| | | | |
| |
COMPUTATION OF NET ASSET VALUE AND OFFERING PRICE PER SHARE | | | | |
Net assets – Class A | | $ | 9,255,613 | |
Shares outstanding – Class A1 | | | 870,030 | |
Net asset value per share – Class A | | | $10.64 | |
Maximum offering price per share – Class A2 | | | $11.29 | |
Net assets – Class C | | $ | 4,871,076 | |
Shares outstanding – Class C1 | | | 470,807 | |
Net asset value per share – Class C | | | $10.35 | |
Net assets – Administrator Class | | $ | 1,959,330 | |
Shares outstanding – Administrator Class1 | | | 182,227 | |
Net asset value per share – Administrator Class | | | $10.75 | |
Net assets – Institutional Class | | $ | 152,826,105 | |
Shares outstanding – Institutional Class1 | | | 14,233,313 | |
Net asset value per share – Institutional Class | | | $10.74 | |
| 1 | The Fund has an unlimited number of authorized shares. |
| 2 | Maximum offering price is computed as 100/94.25 of net asset value. On investments of $50,000 or more, the offering price is reduced. |
The accompanying notes are an integral part of these financial statements.
| | | | |
| 30 | | Wells Fargo Alternative Strategies Fund | | Consolidated statement of operations—six months ended December 31, 2017 (unaudited) |
| | | | |
| | | | |
| |
Investment income | | | | |
Dividends (net of foreign withholding taxes of $11,950) | | $ | 843,186 | |
Interest | | | 716,996 | |
Income from affiliated securities | | | 191,593 | |
| | | | |
Total investment income | | | 1,751,775 | |
| | | | |
| |
Expenses | | | | |
Management fee | | | 1,404,565 | |
Administration fees | |
Class A | | | 9,549 | |
Class C | | | 5,209 | |
Administrator Class | | | 1,324 | |
Institutional Class | | | 93,880 | |
Shareholder servicing fees | |
Class A | | | 11,367 | |
Class C | | | 6,201 | |
Administrator Class | | | 2,048 | |
Distribution fee | |
Class C | | | 18,604 | |
Custody and accounting fees | | | 53,447 | |
Professional fees | | | 40,829 | |
Registration fees | | | 17,242 | |
Shareholder report expenses | | | 41,241 | |
Trustees’ fees and expenses | | | 10,249 | |
Dividends on securities sold short | | | 409,007 | |
Prime broker fees | | | 129,073 | |
Other fees and expenses | | | 10,953 | |
| | | | |
Total expenses | | | 2,264,788 | |
Less: Fee waivers and/or expense reimbursements | | | (129,502 | ) |
| | | | |
Net expenses | | | 2,135,286 | |
| | | | |
Net investment loss | | | (383,511 | ) |
| | | | |
| |
REALIZED AND UNREALIZED GAINS (LOSSES) ON INVESTMENTS | | | | |
|
Net realized gains (losses) on: | |
Unaffiliated securities | | | 6,278,978 | |
Securities sold short | | | (369,104 | ) |
Futures transactions | | | (1,158,571 | ) |
Forward foreign currency contract transactions | | | (238,919 | ) |
Foreign currency and foreign currency translations | | | 25,955 | |
Written options | | | 190,546 | |
Interest rate swap transactions | | | 2,488 | |
Total return swap transactions | | | 233,847 | |
Capital gain distributions from investment companies | | | 172,843 | |
| | | | |
Net realized gains on investments | | | 5,138,063 | |
| | | | |
|
Net change in unrealized gains (losses) on: | |
Unaffiliated securities | | | 1,134,850 | |
Securities sold short | | | (1,852,028 | ) |
Futures transactions | | | (126,608 | ) |
Forward foreign currency contract transactions | | | 6,951 | |
Foreign currency and foreign currency translations | | | (113,354 | ) |
Written options | | | (79,531 | ) |
Interest rate swap transactions | | | 42,262 | |
Total return swap transactions | | | (43,807 | ) |
| | | | |
Net change in unrealized gains (losses) on investments | | | (1,031,265 | ) |
| | | | |
Net realized and unrealized gains (losses) on investments | | | 4,106,798 | |
| | | | |
Net increase in net assets resulting from operations | | $ | 3,723,287 | |
| | | | |
The accompanying notes are an integral part of these financial statements.
| | | | | | |
| Consolidated statement of changes in net assets | | Wells Fargo Alternative Strategies Fund | | | 31 | |
| | | | | | | | | | | | | | | | |
| | | Six months ended December 31, 2017 (unaudited) | | | Year ended June 30, 2017 | |
| |
Operations | | | | | |
Net investment loss | | | | | | $ | (383,511 | ) | | | | | | $ | (1,627,825 | ) |
Net realized gains on investments | | | | | | | 5,138,063 | | | | | | | | 3,835,174 | |
Net change in unrealized gains (losses) on investments | | | | | | | (1,031,265 | ) | | | | | | | 4,934,475 | |
| | | | |
Net increase in net assets resulting from operations | | | | | | | 3,723,287 | | | | | | | | 7,141,824 | |
| | | | |
| | | | |
Capital share transactions | | | Shares | | | | | | | | Shares | | | | | |
Proceeds from shares sold | |
Class A | | | 102,715 | | | | 1,075,256 | | | | 263,309 | | | | 2,659,939 | |
Class C | | | 34,478 | | | | 352,986 | | | | 77,833 | | | | 766,514 | |
Administrator Class | | | 2,727 | | | | 28,829 | | | | 915,847 | | | | 9,230,631 | |
Institutional Class | | | 1,711,430 | | | | 18,183,395 | | | | 6,381,324 | | | | 64,402,389 | |
| | | | |
| | | | | | | 19,640,466 | | | | | | | | 77,059,473 | |
| | | | |
Payment for shares redeemed | |
Class A | | | (67,003 | ) | | | (703,964 | ) | | | (1,189,039 | ) | | | (12,053,203 | ) |
Class C | | | (75,757 | ) | | | (774,081 | ) | | | (852,807 | ) | | | (8,408,646 | ) |
Administrator Class | | | (32,541 | ) | | | (344,073 | ) | | | (4,207,404 | ) | | | (42,130,566 | ) |
Institutional Class | | | (608,341 | ) | | | (6,453,883 | ) | | | (11,686,157 | ) | | | (118,794,112 | ) |
| | | | |
| | | | | | | (8,276,001 | ) | | | | | | | (181,386,527 | ) |
| | | | |
Net increase (decrease) in net assets resulting from capital share transactions | | | | | | | 11,364,465 | | | | | | | | (104,327,054 | ) |
| | | | |
Total increase (decrease) in net assets | | | | | | | 15,087,752 | | | | | | | | (97,185,230 | ) |
| | | | |
| | |
Net assets | | | | | | | | |
Beginning of period | | | | | | | 153,824,372 | | | | | | | | 251,009,602 | |
| | | | |
End of period | | | | | | $ | 168,912,124 | | | | | | | $ | 153,824,372 | |
| | | | |
Accumulated net investment loss | | | | | | $ | (859,720 | ) | | | | | | $ | (476,209 | ) |
| | | | |
The accompanying notes are an integral part of these financial statements.
| | | | |
| 32 | | Wells Fargo Alternative Strategies Fund | | Consolidated financial highlights |
(For a share outstanding throughout each period)
| | | | | | | | | | | | | | | | | | | | |
| | | Six months ended December 31, 2017 (unaudited) | | | Year ended June 30 | | | Year ended July 31, 20142 | |
| CLASS A | | | 2017 | | | 2016 | | | 20151 | | |
Net asset value, beginning of period | | | $10.41 | | | | $10.01 | | | | $10.58 | | | | $10.08 | | | | $10.00 | |
Net investment loss | | | (0.04 | )3 | | | (0.10 | )3 | | | (0.10 | )3 | | | (0.06 | )3 | | | (0.04 | ) |
Net realized and unrealized gains (losses) on investments | | | 0.27 | | | | 0.50 | | | | (0.28 | ) | | | 0.71 | | | | 0.12 | |
| | | | | | | | | | | | | | | | | | | | |
Total from investment operations | | | 0.23 | | | | 0.40 | | | | (0.38 | ) | | | 0.65 | | | | 0.08 | |
Distributions to shareholders from | | | | | | | | | | | | | | | | | | | | |
Net realized gains | | | 0.00 | | | | 0.00 | | | | (0.19 | ) | | | (0.15 | ) | | | 0.00 | |
Net asset value, end of period | | | $10.64 | | | | $10.41 | | | | $10.01 | | | | $10.58 | | | | $10.08 | |
Total return4 | | | 2.21 | % | | | 4.00 | % | | | (3.65 | )% | | | 6.49 | % | | | 0.80 | % |
Ratios to average net assets (annualized) | | | | | | | | | | | | | | | | | | | | |
Gross expenses5 | | | 3.10 | % | | | 3.25 | % | | | 3.36 | % | | | 3.40 | % | | | 3.77 | % |
Net expenses5 | | | 2.86 | % | | | 2.87 | % | | | 2.95 | % | | | 2.93 | % | | | 3.00 | % |
Net investment loss5 | | | (0.69 | )% | | | (0.96 | )% | | | (0.96 | )% | | | (0.64 | )% | | | (1.70 | )% |
Supplemental data | | | | | | | | | | | | | | | | | | | | |
Portfolio turnover rate | | | 79 | % | | | 237 | % | | | 284 | % | | | 237 | % | | | 92 | % |
Net assets, end of period (000s omitted) | | | $9,256 | | | | $8,681 | | | | $17,616 | | | | $4,133 | | | | $1,571 | |
| 1 | For the eleven months ended June 30, 2015. The Fund changed its fiscal year end from July 31 to June 30, effective June 30, 2015. |
| 2 | For the period from April 30, 2014 (commencement of class operations) to July 31, 2014 |
| 3 | Calculated based upon average shares outstanding |
| 4 | Total return calculations do not include any sales charges. Returns for periods of less than one year are not annualized. |
| 5 | Ratios include prime broker fees and dividend expense on securities sold short as follows: |
| | | | |
Six months ended December 31, 2017 (unaudited) | | | 0.67 | % |
Year ended June 30, 2017 | | | 0.72 | % |
Year ended June 30, 2016 | | | 0.83 | % |
Year ended June 30, 20151 | | | 0.64 | % |
Year ended July 31, 20142 | | | 0.58 | % |
The accompanying notes are an integral part of these financial statements.
| | | | | | |
| Consolidated financial highlights | | Wells Fargo Alternative Strategies Fund | | | 33 | |
(For a share outstanding throughout each period)
| | | | | | | | | | | | | | | | | | | | |
| | | Six months ended
December 31, 2017 (unaudited) | | | Year ended June 30 | | | Year ended July 31, 20142 | |
| CLASS C | | | 2017 | | | 2016 | | | 20151 | | |
Net asset value, beginning of period | | | $10.16 | | | | $9.84 | | | | $10.49 | | | | $10.06 | | | | $10.00 | |
Net investment loss | | | (0.08 | )3 | | | (0.17 | ) | | | (0.17 | )3 | | | (0.13 | )3 | | | (0.06 | ) |
Net realized and unrealized gains (losses) on investments | | | 0.27 | | | | 0.49 | | | | (0.29 | ) | | | 0.71 | | | | 0.12 | |
| | | | | | | | | | | | | | | | | | | | |
Total from investment operations | | | 0.19 | | | | 0.32 | | | | (0.46 | ) | | | 0.58 | | | | 0.06 | |
Distributions to shareholders from | | | | | | | | | | | | | | | | | | | | |
Net realized gains | | | 0.00 | | | | 0.00 | | | | (0.19 | ) | | | (0.15 | ) | | | 0.00 | |
Net asset value, end of period | | | $10.35 | | | | $10.16 | | | | $9.84 | | | | $10.49 | | | | $10.06 | |
Total return4 | | | 1.87 | % | | | 3.25 | % | | | (4.46 | )% | | | 5.80 | % | | | 0.60 | % |
Ratios to average net assets (annualized) | | | | | | | | | | | | | | | | | | | | |
Gross expenses5 | | | 3.86 | % | | | 4.00 | % | | | 4.10 | % | | | 4.14 | % | | | 4.49 | % |
Net expenses5 | | | 3.63 | % | | | 3.62 | % | | | 3.70 | % | | | 3.70 | % | | | 3.75 | % |
Net investment loss5 | | | (1.48 | )% | | | (1.74 | )% | | | (1.73 | )% | | | (1.35 | )% | | | (2.45 | )% |
Supplemental data | | | | | | | | | | | | | | | | | | | | |
Portfolio turnover rate | | | 79 | % | | | 237 | % | | | 284 | % | | | 237 | % | | | 92 | % |
Net assets, end of period (000s omitted) | | | $4,871 | | | | $5,201 | | | | $12,670 | | | | $2,396 | | | | $1,133 | |
| 1 | For the eleven months ended June 30, 2015. The Fund changed its fiscal year end from July 31 to June 30, effective June 30, 2015. |
| 2 | For the period from April 30, 2014 (commencement of class operations) to July 31, 2014 |
| 3 | Calculated based upon average shares outstanding |
| 4 | Total return calculations do not include any sales charges. Returns for periods of less than one year are not annualized. |
| 5 | Ratios include prime broker fees and dividend expense on securities sold short as follows: |
| | | | |
Six months ended December 31, 2017 (unaudited) | | | 0.69 | % |
Year ended June 30, 2017 | | | 0.72 | % |
Year ended June 30, 2016 | | | 0.83 | % |
Year ended June 30, 20151 | | | 0.64 | % |
Year ended July 31, 20142 | | | 0.58 | % |
The accompanying notes are an integral part of these financial statements.
| | | | |
| 34 | | Wells Fargo Alternative Strategies Fund | | Consolidated financial highlights |
(For a share outstanding throughout each period)
| | | | | | | | | | | | | | | | | | | | |
| | | Six months ended
December 31, 2017 (unaudited) | | | Year ended June 30 | | | Year ended July 31, 20142 | |
| ADMINISTRATOR CLASS | | | 2017 | | | 2016 | | | 20151 | | |
Net asset value, beginning of period | | | $10.51 | | | | $10.04 | | | | $10.60 | | | | $10.08 | | | | $10.00 | |
Net investment loss | | | (0.03 | )3 | | | (0.10 | )3 | | | (0.09 | )3 | | | (0.05 | )3 | | | (0.04 | ) |
Net realized and unrealized gains (losses) on investments | | | 0.27 | | | | 0.57 | | | | (0.28 | ) | | | 0.72 | | | | 0.12 | |
| | | | | | | | | | | | | | | | | | | | |
Total from investment operations | | | 0.24 | | | | 0.47 | | | | (0.37 | ) | | | 0.67 | | | | 0.08 | |
Distributions to shareholders from | | | | | | | | | | | | | | | | | | | | |
Net realized gains | | | 0.00 | | | | 0.00 | | | | (0.19 | ) | | | (0.15 | ) | | | 0.00 | |
Net asset value, end of period | | | $10.75 | | | | $10.51 | | | | $10.04 | | | | $10.60 | | | | $10.08 | |
Total return4 | | | 2.28 | % | | | 4.68 | % | | | (3.55 | )% | | | 6.58 | % | | | 0.90 | % |
Ratios to average net assets (annualized) | | | | | | | | | | | | | | | | | | | | |
Gross expenses5 | | | 3.00 | % | | | 3.61 | % | | | 3.28 | % | | | 3.25 | % | | | 3.57 | % |
Net expenses5 | | | 2.75 | % | | | 2.64 | % | | | 2.79 | % | | | 2.78 | % | | | 2.84 | % |
Net investment loss5 | | | (0.60 | )% | | | (0.96 | )% | | | (0.85 | )% | | | (0.51 | )% | | | (1.54 | )% |
Supplemental data | | | | | | | | | | | | | | | | | | | | |
Portfolio turnover rate | | | 79 | % | | | 237 | % | | | 284 | % | | | 237 | % | | | 92 | % |
Net assets, end of period (000s omitted) | | | $1,959 | | | | $2,228 | | | | $35,189 | | | | $6,326 | | | | $1,119 | |
| 1 | For the eleven months ended June 30, 2015. The Fund changed its fiscal year end from July 31 to June 30, effective June 30, 2015. |
| 2 | For the period from April 30, 2014 (commencement of class operations) to July 31, 2014 |
| 3 | Calculated based upon average shares outstanding |
| 4 | Returns for periods of less than one year are not annualized. |
| 5 | Ratios include prime broker fees and dividend expense on securities sold short as follows: |
| | | | |
Six months ended December 31, 2017 (unaudited) | | | 0.70 | % |
Year ended June 30, 2017 | | | 0.66 | % |
Year ended June 30, 2016 | | | 0.81 | % |
Year ended June 30, 20151 | | | 0.66 | % |
Year ended July 31, 20142 | | | 0.58 | % |
The accompanying notes are an integral part of these financial statements.
| | | | | | |
| Consolidated financial highlights | | Wells Fargo Alternative Strategies Fund | | | 35 | |
(For a share outstanding throughout each period)
| | | | | | | | | | | | | | | | | | | | |
| | | Six months ended
December 31, 2017 (unaudited) | | | Year ended June 30 | | | Year ended July 31, 20142 | |
| INSTITUTIONAL CLASS | | | 2017 | | | 2016 | | | 20151 | | |
Net asset value, beginning of period | | | $10.49 | | | | $10.06 | | | | $10.61 | | | | $10.09 | | | | $10.00 | |
Net investment loss | | | (0.02 | ) | | | (0.07 | )3 | | | (0.06 | ) | | | (0.03 | ) | | | (0.04 | ) |
Net realized and unrealized gains (losses) on investments | | | 0.27 | | | | 0.50 | | | | (0.30 | ) | | | 0.70 | | | | 0.13 | |
| | | | | | | | | | | | | | | | | | | | |
Total from investment operations | | | 0.25 | | | | 0.43 | | | | (0.36 | ) | | | 0.67 | | | | 0.09 | |
Distributions to shareholders from | | | | | | | | | | | | | | | | | | | | |
Net realized gains | | | 0.00 | | | | 0.00 | | | | (0.19 | ) | | | (0.15 | ) | | | 0.00 | |
Net asset value, end of period | | | $10.74 | | | | $10.49 | | | | $10.06 | | | | $10.61 | | | | $10.09 | |
Total return4 | | | 2.38 | % | | | 4.17 | % | | | (3.45 | )% | | | 6.68 | % | | | 0.90 | % |
Ratios to average net assets (annualized) | | | | | | | | | | | | | | | | | | | | |
Gross expenses5 | | | 2.77 | % | | | 2.93 | % | | | 3.00 | % | | | 2.95 | % | | | 3.29 | % |
Net expenses5 | | | 2.61 | % | | | 2.64 | % | | | 2.69 | % | | | 2.69 | % | | | 2.74 | % |
Net investment loss5 | | | (0.43 | )% | | | (0.71 | )% | | | (0.72 | )% | | | (0.36 | )% | | | (1.44 | )% |
Supplemental data | | | | | | | | | | | | | | | | | | | | |
Portfolio turnover rate | | | 79 | % | | | 237 | % | | | 284 | % | | | 237 | % | | | 92 | % |
Net assets, end of period (000s omitted) | | | $152,826 | | | | $137,714 | | | | $185,535 | | | | $126,459 | | | | $97,838 | |
| 1 | For the eleven months ended June 30, 2015. The Fund changed its fiscal year end from July 31 to June 30, effective June 30, 2015. |
| 2 | For the period from April 30, 2014 (commencement of class operations) to July 31, 2014 |
| 3 | Calculated based upon average shares outstanding |
| 4 | Returns for periods of less than one year are not annualized. |
| 5 | Ratios include prime broker fees and dividend expense on securities sold short as follows: |
| | | | |
Six months ended December 31, 2017 (unaudited) | | | 0.67 | % |
Year ended June 30, 2017 | | | 0.73 | % |
Year ended June 30, 2016 | | | 0.81 | % |
Year ended June 30, 20151 | | | 0.62 | % |
Year ended July 31, 20142 | | | 0.58 | % |
The accompanying notes are an integral part of these financial statements.
| | | | |
| 36 | | Wells Fargo Alternative Strategies Fund | | Notes to consolidated financial statements (unaudited) |
1. ORGANIZATION
Wells Fargo Funds Trust (the “Trust”), a Delaware statutory trust organized on March 10, 1999, is an open-end management investment company registered under the Investment Company Act of 1940, as amended (the “1940 Act”). As an investment company, the Trust follows the accounting and reporting guidance in Financial Accounting Standards Board Accounting Standards Codification Topic 946, Financial Services – Investment Companies. These financial statements report on the Wells Fargo Alternative Strategies Fund Fund (the “Fund”) which is a diversified series of the Trust.
2. INVESTMENT IN SUBSIDIARY
The Fund invests various derivatives, including commodity-linked derivatives, through ASF Special Investments (Cayman), Ltd. (the “Subsidiary”), a wholly owned subsidiary incorporated on June 6, 2016 under the laws of the Cayman Islands as an exempted company with limited liability. Through the Subsidiary, the Fund is exposed to the performance of the commodities markets. As of December 31, 2017, the Subsidiary invested $52,051 in interest rate swaps and had $242,699 in cash and segregated cash. The Fund is the sole shareholder of the Subsidiary. As of December 31, 2017, the Fund’s investment in the Subsidiary was valued at $294,750, representing 0.17% of the Fund’s net assets.
The consolidated financial statements of the Fund include the financial results of its wholly-owned subsidiary. The Consolidated Portfolio of Investments includes positions of the Fund and the Subsidiary and the consolidated financial statements include the accounts of the Fund and the Subsidiary. Accordingly, all interfund balances and transactions between the Fund and the Subsidiary have been eliminated in consolidation.
3. SIGNIFICANT ACCOUNTING POLICIES
The following significant accounting policies, which are consistently followed in the preparation of the financial statements of the Fund, are in conformity with U.S. generally accepted accounting principles which require management to make estimates and assumptions that affect the reported amounts of assets and liabilities, disclosure of contingent assets and liabilities at the date of the financial statements, and the reported amounts of revenues and expenses during the reporting period. Actual results could differ from those estimates.
Securities valuation
All investments are valued each business day as of the close of regular trading on the New York Stock Exchange (generally 4 p.m. Eastern Time), although the Fund may deviate from this calculation time under unusual or unexpected circumstances.
Equity securities, options and futures that are listed on a foreign or domestic exchange or market are valued at the official closing price or, if none, the last sales price. If no sale occurs on the principal exchange or market that day, a fair value price will be determined in accordance with the Fund’s Valuation Procedures.
Non-listed options and swaps are valued at the evaluated price provided by an independent pricing service or, if a reliable price is not available, the quoted bid price from an independent broker-dealer.
The values of securities denominated in foreign currencies are translated into U.S. dollars at rates provided by an independent foreign currency pricing source at a time each business day specified by the Management Valuation Team of Wells Fargo Funds Management, LLC (“Funds Management”).
Many securities markets and exchanges outside the U.S. close prior to the close of the New York Stock Exchange and therefore may not fully reflect trading or events that occur after the close of the principal exchange in which the foreign securities are traded, but before the close of the New York Stock Exchange. If such trading or events are expected to materially affect the value of such securities, then fair value pricing procedures approved by the Board of Trustees of the Fund are applied. These procedures take into account multiple factors including movements in U.S. securities markets after foreign exchanges close. Foreign securities that are fair valued under these procedures are categorized as Level 2 and the application of these procedures may result in transfers between Level 1 and Level 2. Depending on market activity, such fair valuations may be frequent. Such fair value pricing may result in net asset values that are higher or lower than net asset values based on the last reported sales price or latest quoted bid price. On December 31, 2017, such fair value pricing was not used in pricing foreign securities.
Debt securities are valued at the evaluated bid price provided by an independent pricing service or, if a reliable price is not available, the quoted bid price from an independent broker-dealer.
Investments in registered open-end investment companies are valued at net asset value.
Investments which are not valued using any of the methods discussed above are valued at their fair value, as determined in good faith by the Board of Trustees of the Fund. The Board of Trustees has established a Valuation Committee comprised of the Trustees and has delegated to it the authority to take any actions regarding the valuation of portfolio securities that the
| | | | | | |
| Notes to consolidated financial statements (unaudited) | | Wells Fargo Alternative Strategies Fund | | | 37 | |
Valuation Committee deems necessary or appropriate, including determining the fair value of portfolio securities, unless the determination has been delegated to the Management Valuation Team. The Board of Trustees retains the authority to make or ratify any valuation decisions or approve any changes to the Valuation Procedures as it deems appropriate. On a quarterly basis, the Board of Trustees receives reports on any valuation actions taken by the Valuation Committee or the Management Valuation Team which may include items for ratification.
Valuations of fair valued securities are compared to the next actual sales price when available, or other appropriate market values, to assess the continued appropriateness of the fair valuation methodologies used. These securities are fair valued on a day-to-day basis, taking into consideration changes to appropriate market information and any significant changes to the inputs considered in the valuation process until there is a readily available price provided on an exchange or by an independent pricing service. Valuations received from an independent pricing service or independent broker-dealer quotes are periodically validated by comparisons to most recent trades and valuations provided by other independent pricing services in addition to the review of prices by the manager and/or subadviser. Unobservable inputs used in determining fair valuations are identified based on the type of security, taking into consideration factors utilized by market participants in valuing the investment, knowledge about the issuer and the current market environment.
Foreign currency translation
The accounting records of the Fund are maintained in U.S. dollars. The values of other assets and liabilities denominated in foreign currencies are translated into U.S. dollars at rates provided by an independent foreign currency pricing source at a time each business day specified by the Management Valuation Team. Purchases and sales of securities, and income and expenses are converted at the rate of exchange on the respective dates of such transactions. Net realized foreign exchange gains or losses arise from sales of foreign currencies, currency gains or losses realized between the trade and settlement dates on securities transactions, and the difference between the amounts of dividends, interest and foreign withholding taxes recorded and the U.S. dollar equivalent of the amounts actually paid or received. Net unrealized foreign exchange gains and losses arise from changes in the fair value of assets and liabilities other than investments in securities resulting from changes in exchange rates. The changes in net assets arising from changes in exchange rates of securities and the changes in net assets resulting from changes in market prices of securities are not separately presented. Such changes are included in net realized and unrealized gains or losses from investments.
Participation notes
The Fund may invest in participation notes to gain exposure to securities in certain foreign markets. Participation notes are issued by banks or broker-dealers and are designed to offer a return linked to a particular underlying foreign security. Participation notes involve transaction costs, which may be higher than those applicable to the underlying foreign security. The holder of the participation note is entitled to receive from the bank or broker-dealer, an amount equal to the dividend paid by the issuer of the underlying foreign security; however, the holder is not entitled to the same rights (i.e. dividends, voting rights) as an owner of the underlying foreign security. Investments in participation notes involve risks beyond those normally associated with a direct investment in an underlying security. The Fund has no rights against the issuer of the underlying foreign security and participation notes expose the Fund to counterparty risk in the event the counterparty does not perform. There is also no assurance there will be a secondary trading market for the participation note or that the trading price of the participation note will equal the underlying value of the foreign security that it seeks to replicate.
Forward foreign currency contracts
The Fund is subject to foreign currency risk in the normal course of pursuing its investment objectives. A forward foreign currency contract is an agreement between two parties to purchase or sell a specific currency for an agreed-upon price at a future date. The Fund enters into forward foreign currency contracts to facilitate transactions in foreign-denominated securities and to attempt to minimize the risk to the Fund from adverse changes in the relationship between currencies. Forward foreign currency contracts are recorded at the forward rate and marked-to-market daily. When the contracts are closed, realized gains and losses arising from such transactions are recorded as realized gains or losses on forward foreign currency contract transactions. The Fund could be exposed to risks if the counterparties to the contracts are unable to meet the terms of their contracts or if the value of the foreign currency changes unfavorably. The Fund’s maximum risk of loss from counterparty credit risk is the unrealized gains on the contracts. This risk may be mitigated if there is a master netting arrangement between the Fund and the counterparty.
Futures contracts
The Fund is subject to interest rate risk, equity price risk and foreign currency risk in the normal course of pursuing its investment objectives. The Fund may buy and sell futures contracts in order to gain exposure to, or protect against, changes in interest rates, security values, and foreign exchange rates. The primary risks associated with the use of futures contracts are the imperfect correlation between changes in market values of securities held by the Fund and the prices of futures contracts, and the possibility of an illiquid market.
| | | | |
| 38 | | Wells Fargo Alternative Strategies Fund | | Notes to consolidated financial statements (unaudited) |
The aggregate principal amounts of the contracts are not recorded in the financial statements. Fluctuations in the value of the contracts are recorded in the Consolidated Statement of Assets and Liabilities as an asset or liability and in the Consolidated Statement of Operations as unrealized gains or losses until the contracts are closed, at which point they are recorded as net realized gains or losses on futures contracts. With futures contracts, there is minimal counterparty risk to the Fund since futures are exchange traded and the exchange’s clearing house, as counterparty to all exchange traded futures, guarantees the futures against default.
Options
The Fund is subject to equity price risk in the normal course of pursuing its investment objectives. The Fund may write covered call options or secured put options on individual securities and/or indexes. When the Fund writes an option, an amount equal to the premium received is recorded as a liability and is subsequently adjusted to the current market value of the written option. Premiums received from written options that expire unexercised are recognized as realized gains on the expiration date. For exercised options, the difference between the premium received and the amount paid on effecting a closing purchase transaction, including brokerage commissions, is treated as a realized gain or loss. If a call option is exercised, the premium is added to the proceeds from the sale of the underlying security in calculating the realized gain or loss on the sale. If a put option is exercised, the premium reduces the cost of the security purchased. The Fund, as a writer of an option, bears the market risk of an unfavorable change in the price of the security and/or index underlying the written option.
The Fund may also purchase call or put options. Premiums paid are included in the Consolidated Statement of Assets and Liabilities as investments, the values of which are subsequently adjusted based on the current market values of the options. Premiums paid for purchased options that expire are recognized as realized losses on the expiration date. Premiums paid for purchased options that are exercised or closed are added to the amount paid or offset against the proceeds received for the underlying security to determine the realized gain or loss. The risk of loss associated with purchased options is limited to the premium paid.
Options traded on an exchange are regulated and terms of the options are standardized. Purchased options traded over-the-counter expose the Fund to counterparty risk in the event the counterparty does not perform. This risk can be mitigated by having a master netting arrangement between the Fund and the counterparty and by having the counterparty post collateral to cover the Fund’s exposure to the counterparty.
Short sales
The Fund may sell a security it does not own in anticipation of a decline in the market value of that security (short sale). When the Fund makes a short sale, it must borrow the security sold short and deliver it to the buyer. The Fund is then obligated to replace the security borrowed by purchasing the security at the market price at the time of replacement.
The Fund records the proceeds as a liability which is marked-to-market daily based upon quotations from an independent pricing service or an independent broker-dealer and any change in value is recorded as an unrealized gain or loss. Any interest or dividends accrued on such borrowed securities during the period of the loan are recorded as an expense on the Consolidated Statement of Operations. To borrow the security, the Fund may be required to pay a premium, which would decrease the proceeds of the security sold. A gain, limited to the price at which the Fund sold the security short, or a loss, unlimited in size, will be recognized upon the closing of a short sale if the market price at the closing is less than or greater than, respectively, the proceeds originally received. Until the short sale is closed or the borrowed security is replaced, the Fund maintains a segregated account of cash or liquid securities, the dollar value of which is at least equal to the market value of the security at the time of the short sale.
Credit default swaps
The Fund is subject to credit risk in the normal course of pursuing its investment objectives. The Fund may enter into credit default swap contracts for hedging or speculative purposes to provide or receive a measure of protection against default on a referenced entity, obligation or index or for investment gains. Credit default swaps involve an exchange of a stream of payments for protection against the loss in value of an underlying security or index. Under the terms of the swap, one party acts as a guarantor (referred to as the seller of protection) and receives a periodic stream of payments, provided that there is no credit event, from another party (referred to as the buyer of protection) that is a fixed percentage applied to a notional principal amount over the term of the swap. An index credit default swap references all the names in the index, and if a credit event is triggered, the credit event is settled based on that name’s weight in the index. A credit event includes bankruptcy, failure to pay, obligation default, obligation acceleration, repudiation/moratorium, and restructuring. The Fund may enter into credit default swaps as either the seller of protection or the buyer of protection. As the seller of protection, the Fund is subject to investment exposure on the notional amount of the swap and has assumed the risk of default of the underlying security or index. As the buyer of protection, the Fund could be exposed to risks if the seller of the protection defaults on its obligation to perform, or if there are unfavorable changes in the fluctuation of interest rates. The maximum potential amount of future payments (undiscounted) that the Fund as the seller of protection could be required to make under the credit default swap contract would be an amount equal to the notional amount of the swap contract. The Fund’s maximum risk of loss from counterparty risk, either as the protection seller or as the protection buyer, is the fair value of the
| | | | | | |
| Notes to consolidated financial statements (unaudited) | | Wells Fargo Alternative Strategies Fund | | | 39 | |
contract. This risk is mitigated by having a master netting arrangement between the Fund and the counterparty and by having the counterparty post collateral to cover the Fund’s exposure to the counterparty.
If the Fund is the seller of protection and a credit event occurs, as defined under the terms of that particular swap agreement, the Fund will pay to the buyer of protection the notional amount of the swap and take delivery of the referenced obligation or underlying securities comprising the referenced index. If the Fund is the buyer of protection and a credit event occurs, as defined under the terms of that particular swap agreement, the Fund will receive from the seller of protection the notional amount of the swap and deliver the referenced obligation or underlying securities comprising the referenced index.
Any premiums paid or received on the transactions are recorded as an asset or liability on the Consolidated Statement of Assets and Liabilities and amortized. The value of the swap contract is marked-to-market daily based on quotations from an independent pricing service or an independent broker-dealer and any change in value is recorded as an unrealized gain or loss. Periodic payments made or received are recorded as realized gains or losses. In addition, payments received or made as a result of a credit event or termination of the contract are recognized as realized gains or losses.
Certain credit default swap contracts entered into by the Fund provide for conditions that result in events of default or termination that enable the counterparty to the agreement to cause an early termination of the transactions under those agreements.
Total return swaps
The Fund is subject to interest rate risk in the normal course of pursuing its investment objectives. The Fund may enter into total return swap contracts for hedging or speculative purposes. Total return swaps involve commitments to pay interest in exchange for a market-linked return, both based on notional amounts. To the extent the total return of the security or index underlying the transaction exceeds or falls short of the offsetting interest rate obligation, the Fund will receive a payment from, or make a payment to, the counterparty.
The value of the swap contract is marked-to-market daily based upon quotations from an independent pricing service or an independent broker-dealer and any change in value is recorded as an unrealized gain or loss. Periodic payments made or received are recorded as realized gains or losses. The Fund could be exposed to risks if the counterparty defaults on its obligation to perform, or if there are unfavorable changes in the fluctuation of interest rates or in the price of the underlying security or index. The Fund’s maximum risk of loss from counterparty risk is the fair value of the contract. This risk is mitigated by having a master netting arrangement between the Fund and the counterparty and by having the counterparty post collateral to cover the Fund’s exposure to the counterparty.
Certain total return swap contracts entered into by the Fund provide for conditions that result in events of default or termination that enable the counterparty to the agreement to cause an early termination of the transactions under those agreements. Any election by the counterparty to terminate early may impact the amounts reported on the financial statements.
Interest rate swaps
The Fund is subject to interest rate risk in the normal course of pursuing its investment objectives. The Fund may enter into interest rate swap contracts for hedging purposes to manage the Fund’s exposure to interest rates. Interest rate swaps involve the exchange between the Fund and another party of their commitments to pay or receive interest based on a notional principal amount.
The value of the swap contract is marked-to-market daily based upon quotations from an independent pricing service or an independent broker-dealer and any change in value is recorded as an unrealized gain or loss. Payments made or received are recorded as realized gains or losses. The Fund could be exposed to risks if the counterparty defaults on its obligation to perform or if there are unfavorable changes in the fluctuation of interest rates. The Fund’s maximum risk of loss from counterparty credit risk is the discounted net value of the cash flows to be received from the counterparty over the contract’s remaining life. This risk is mitigated by having a master netting arrangement between the Fund and the counterparty and by having the counterparty post collateral to cover the Fund’s exposure to the counterparty.
Certain interest rate swap contracts entered into by the Fund provide for conditions that result in events of default or termination that enable the counterparty to the agreement to cause an early termination of the transactions under those agreements. Any election by the counterparty to terminate early may impact the amounts reported on the financial statements.
Security transactions and income recognition
Securities transactions are recorded on a trade date basis. Realized gains or losses are recorded on the basis of identified cost.
Interest income is accrued daily and bond discounts are accreted and premiums are amortized daily based on the effective interest method. To the extent debt obligations are placed on non-accrual status, any related interest income may be reduced by writing off interest receivables when the collection of all or a portion of interest has been determined
| | | | |
| 40 | | Wells Fargo Alternative Strategies Fund | | Notes to consolidated financial statements (unaudited) |
to be doubtful based on consistently applied procedures and the fair value has decreased. If the issuer subsequently resumes interest payments or when the collectability of interest is reasonably assured, the debt obligation is removed from non-accrual status.
Dividend income is recognized on the ex-dividend date, except for certain dividends from foreign securities, which are recorded as soon as the custodian verifies the ex-dividend date. Dividend income from foreign securities is recorded net of foreign taxes withheld where recovery of such taxes is not assured.
Income dividends and capital gain distributions from investment companies are recorded on the ex-dividend date. Capital gain distributions from investment companies are treated as realized gains.
Distributions to shareholders
Distributions to shareholders from net investment income and net realized gains, if any, are recorded on the ex-dividend date. Such distributions are determined in accordance with income tax regulations and may differ from U.S. generally accepted accounting principles. Dividend sources are estimated at the time of declaration. The tax character of distributions is determined as of the Fund’s fiscal year end. Therefore, a portion of the Fund’s distributions made prior to the Fund’s fiscal year end may be categorized as a tax return of capital.
Federal and other taxes
The Fund intends to continue to qualify as a regulated investment company by distributing substantially all of its investment company taxable income and any net realized capital gains (after reduction for capital loss carryforwards) sufficient to relieve it from all, or substantially all, federal income taxes. Accordingly, no provision for federal income taxes was required.
The Fund’s income and federal excise tax returns and all financial records supporting those returns for the prior three fiscal years are subject to examination by the federal and Delaware revenue authorities. Management has analyzed the Fund’s tax positions taken on federal, state, and foreign tax returns for all open tax years and does not believe that there are any uncertain tax positions that require recognition of a tax liability.
As of December 31, 2017, the aggregate cost of all investments for federal income tax purposes was $130,891,975 and the unrealized gains (losses) were as follows:
| | | | |
Gross unrealized gains | | $ | 15,911,746 | |
Gross unrealized losses | | | (5,897,659 | ) |
Net unrealized gains | | $ | 10,014,087 | |
As of June 30, 2017, the Fund had a qualified late-year ordinary loss of $470,661 which was recognized on the first day of the current fiscal year.
Class allocations
The separate classes of shares offered by the Fund differ principally in applicable sales charges, distribution, shareholder servicing, and administration fees. Class specific expenses are charged directly to that share class. Investment income, common expenses, and realized gains (losses) on investments are allocated daily to each class of shares based on the relative proportion of net assets of each class.
4. FAIR VALUATION MEASUREMENTS
Fair value measurements of investments are determined within a framework that has established a fair value hierarchy based upon the various data inputs utilized in determining the value of the Fund’s investments. The three-level hierarchy gives the highest priority to unadjusted quoted prices in active markets for identical assets or liabilities (Level 1) and the lowest priority to unobservable inputs (Level 3). The Fund’s investments are classified within the fair value hierarchy based on the lowest level of input that is significant to the fair value measurement. The inputs are summarized into three broad levels as follows:
| ∎ | | Level 1 – quoted prices in active markets for identical securities |
| ∎ | | Level 2 – other significant observable inputs (including quoted prices for similar securities, interest rates, prepayment speeds, credit risk, etc.) |
| ∎ | | Level 3 – significant unobservable inputs (including the Fund’s own assumptions in determining the fair value of investments) |
The inputs or methodologies used for valuing investments in securities are not necessarily an indication of the risk associated with investing in those securities.
| | | | | | |
| Notes to consolidated financial statements (unaudited) | | Wells Fargo Alternative Strategies Fund | | | 41 | |
The following is a summary of the inputs used in valuing the Fund’s assets and liabilities as of December 31, 2017:
| | | | | | | | | | | | | | | | |
| | | Quoted prices (Level 1) | | | Other significant
observable inputs
(Level 2) | | | Significant
unobservable inputs (Level 3) | | | Total | |
Assets | | | | | | | | | | | | | | | | |
Investments in: | | | | | | | | | | | | | | | | |
| | | | |
Common stocks | | | | | | | | | | | | | | | | |
Consumer discretionary | | $ | 12,377,430 | | | $ | 0 | | | $ | 0 | | | $ | 12,377,430 | |
Consumer staples | | | 4,739,583 | | | | 0 | | | | 0 | | | | 4,739,583 | |
Energy | | | 3,984,441 | | | | 0 | | | | 0 | | | | 3,984,441 | |
Financials | | | 9,214,561 | | | | 88,697 | | | | 0 | | | | 9,303,258 | |
Health care | | | 6,850,211 | | | | 0 | | | | 0 | | | | 6,850,211 | |
Industrials | | | 11,579,600 | | | | 0 | | | | 0 | | | | 11,579,600 | |
Information technology | | | 7,529,496 | | | | 0 | | | | 0 | | | | 7,529,496 | |
Materials | | | 7,578,999 | | | | 0 | | | | 0 | | | | 7,578,999 | |
Real estate | | | 868,330 | | | | 0 | | | | 0 | | | | 868,330 | |
Telecommunication services | | | 1,445,076 | | | | 0 | | | | 0 | | | | 1,445,076 | |
Utilities | | | 663,211 | | | | 0 | | | | 0 | | | | 663,211 | |
| | | | |
Exchange-traded funds | | | 37,031 | | | | 0 | | | | 0 | | | | 37,031 | |
| | | | |
Investment companies | | | 12,820,319 | | | | 0 | | | | 0 | | | | 12,820,319 | |
| | | | |
Non-agency mortgage-backed securities | | | 0 | | | | 25,950,651 | | | | 0 | | | | 25,950,651 | |
| | | | |
Participation notes | | | | | | | | | | | | | | | | |
Financials | | | 0 | | | | 2,448,099 | | | | 0 | | | | 2,448,099 | |
Materials | | | 0 | | | | 737,096 | | | | 0 | | | | 737,096 | |
| | | | |
Preferred stocks | | | | | | | | | | | | | | | | |
Consumer discretionary | | | 259,629 | | | | 0 | | | | 0 | | | | 259,629 | |
Financials | | | 90,497 | | | | 0 | | | | 0 | | | | 90,497 | |
Materials | | | 0 | | | | 0 | | | | 42,682 | | | | 42,682 | |
| | | | |
Purchased put options | | | 0 | | | | 257,118 | | | | 0 | | | | 257,118 | |
| | | | |
Short-term investments | | | | | | | | | | | | | | | | |
Investment companies | | | 44,599,315 | | | | 0 | | | | 0 | | | | 44,599,315 | |
U.S. Treasury securities | | | 2,329,546 | | | | 0 | | | | 0 | | | | 2,329,546 | |
| | | 126,967,275 | | | | 29,481,661 | | | | 42,682 | | | | 156,491,618 | |
Forward foreign currency contracts | | | 0 | | | | 22,301 | | | | 0 | | | | 22,301 | |
Futures contracts | | | 167,547 | | | | 0 | | | | 0 | | | | 167,547 | |
Interest rate swap contracts | | | 0 | | | | 67,867 | | | | 0 | | | | 67,867 | |
Total return swap contracts | | | 0 | | | | 26,167 | | | | 0 | | | | 26,167 | |
Total assets | | $ | 127,134,822 | | | $ | 29,597,996 | | | $ | 42,682 | | | $ | 156,775,500 | |
Liabilities | | | | | | | | | | | | | | | | |
Securities sold short | | | | | | | | | | | | | | | | |
| | | | |
Common stocks | | | | | | | | | | | | | | | | |
Consumer discretionary | | $ | 1,198,133 | | | $ | 0 | | | $ | 0 | | | $ | 1,198,133 | |
Consumer staples | | | 371,695 | | | | 0 | | | | 0 | | | | 371,695 | |
Energy | | | 966,306 | | | | 0 | | | | 0 | | | | 966,306 | |
Industrials | | | 1,327,528 | | | | 0 | | | | 0 | | | | 1,327,528 | |
Information technology | | | 449,932 | | | | 0 | | | | 0 | | | | 449,932 | |
| | | | |
Exchange-traded funds | | | 11,271,962 | | | | 0 | | | | 0 | | | | 11,271,962 | |
Forward foreign currency contracts | | | 0 | | | | 102,439 | | | | 0 | | | | 102,439 | |
Futures contracts | | | 171,039 | | | | 0 | | | | 0 | | | | 171,039 | |
Interest rate swap contracts | | | 0 | | | | 15,816 | | | | 0 | | | | 15,816 | |
Written options | | | 0 | | | | 145,062 | | | | 0 | | | | 145,062 | |
Total liabilities | | $ | 15,756,595 | | | $ | 263,317 | | | $ | 0 | | | $ | 16,019,912 | |
| | | | |
| 42 | | Wells Fargo Alternative Strategies Fund | | Notes to consolidated financial statements (unaudited) |
Forward foreign currency contracts are reported at their unrealized gains (losses) at measurement date, which represents the change in the contract’s value from trade date. Futures contracts are reported at their variation margin at measurement date, which represents the amount due to/from the Fund at that date. Swap contracts consists of unrealized gains (losses) and premiums paid or received on swap contracts, which represents the change in the contract’s value from trade date. All other assets and liabilities are reported at their market value at measurement date.
The Fund recognizes transfers between levels within the fair value hierarchy at the end of the reporting period. At December 31, 2017, the Fund did not have any transfers into/out of Level 1, Level 2, or Level 3.
5. TRANSACTIONS WITH AFFILIATES AND OTHER EXPENSES
Management fee
Funds Management, an indirect wholly owned subsidiary of Wells Fargo & Company (“Wells Fargo”), is the manager of the Fund and provides advisory and fund-level administrative services under an investment management agreement. Under the investment management agreement, Funds Management is responsible for, among other services, implementing the investment objectives and strategies of the Fund, supervising the applicable subadvisers, providing fund-level administrative services in connection with the Fund’s operations, and providing any other fund-level administrative services reasonably necessary for the operation of the Fund. As compensation for its services under the investment management agreement, Funds Management is entitled to receive an annual management fee starting at 1.75% and declining to 1.63% as the average daily net assets of the Fund increase. For the six months ended December 31, 2017, the management fee was equivalent to an annual rate of 1.75% of the Fund’s average daily net assets.
Funds Management has engaged The Rock Creek Group, LP, Chilton Investment Company, LLC, Ellington Global Asset Management, LLC, Mellon Capital Management Corporation, Passport Capital, LLC, Sirios Capital Management, L.P., and Wellington Management Company LLP to serve as sub-advisers to the Fund. Effective January 19, 2018, Passport Capital, LLC was no longer a subadviser to the Fund. The subadvisers are each entitled to receive from Funds Management an annual subadvisory fee.
The Rock Creek Group, LP, an indirect majority owned subsidiary of Wells Fargo and an affiliate of Funds Management, is entitled to receive a fee at an annual rate starting at 0.60% and declining to 0.55% as the average daily net assets of the Fund increase. For the six months ended December 31, 2017, the subadvisory fees paid to the remaining unaffiliated subadvisers were equivalent to an annual rate of 0.95% of the Fund’s average daily net assets.
Administration fees
Under a class-level administration agreement, Funds Management provides class-level administrative services to the Fund, which includes paying fees and expenses for services provided by the transfer agent, sub-transfer agents, omnibus account servicers and record-keepers. As compensation for its services under the class-level administration agreement, Funds Management receives an annual fee which is calculated based on the average daily net assets of each class as follows:
| | | | |
| | | Class-level
administration fee | |
Class A, Class C | | | 0.21 | % |
Administrator Class, Institutional Class | | | 0.13 | |
Funds Management has contractually waived and/or reimbursed management and administration fees to the extent necessary to maintain certain net operating expense ratios for the Fund. Waiver of fees and/or reimbursement of expenses by Funds Management were made first from fund level expenses on a proportionate basis and then from class specific expenses. Funds Management has committed through October 31, 2018 to waive fees and/or reimburse expenses to the extent necessary to cap the Fund’s expenses at 2.22% for Class A shares, 2.97% for Class C shares, 2.07% for Administrator Class shares, and 1.97% for Institutional Class shares. After this time, the cap may be increased or the commitment to maintain the cap may be terminated only with the approval of the Board of Trustees. Prime broker fees and dividend expense on securities sold short are excluded from the expense caps.
Distribution fee
The Trust has adopted a distribution plan for Class C shares of the Fund pursuant to Rule 12b-1 under the 1940 Act. A distribution fee is charged to Class C shares and paid to Wells Fargo Funds Distributor, LLC (“Funds Distributor”), the principal underwriter, at an annual rate of 0.75% of the average daily net assets of Class C shares.
| | | | | | |
| Notes to consolidated financial statements (unaudited) | | Wells Fargo Alternative Strategies Fund | | | 43 | |
In addition, Funds Distributor is entitled to receive the front-end sales charge from the purchase of Class A shares and a contingent deferred sales charge on the redemption of certain Class A shares. Funds Distributor is also entitled to receive the contingent deferred sales charges from redemptions of Class C shares. For the six months ended December 31, 2017, Funds Distributor received $1,804 from the sale of Class A shares. No contingent deferred sales charges were incurred by Class A and Class C shares for the six months ended December 31, 2017.
Shareholder servicing fees
The Trust has entered into contracts with one or more shareholder servicing agents, whereby Class A, Class C, and Administrator Class of the Fund are charged a fee at an annual rate of 0.25% of the average daily net assets of each respective class.
A portion of these total shareholder servicing fees were paid to affiliates of Wells Fargo.
Interfund transactions
The Fund may purchase or sell portfolio investment securities to certain other Wells Fargo affiliates pursuant to Rule 17a-7 under the 1940 Act and under procedures adopted by the Board of Trustees. The procedures have been designed to ensure that these interfund transactions, which do not incur broker commissions, are effected at current market prices.
6. INVESTMENT PORTFOLIO TRANSACTIONS
Purchases and sales of investments, excluding U.S. government obligations (if any) and short-term securities, for the six months ended December 31, 2017 were $104,147,044 and $102,806,059, respectively.
7. DERIVATIVE TRANSACTIONS
During the six months ended December 31, 2017, the Fund entered into futures contracts, forward foreign currency contracts, written options, purchased options, interest rate swap contracts and total return swap contracts for speculative purposes.
The Fund’s derivative transactions activity during the six months ended December 31, 2017 was as follows:
| | | | |
Call Options | | | | |
Average number of contracts purchased | | | 153 | |
Average number of contracts written | | | 70 | |
| |
Put Options | | | | |
Average number of contracts purchased | | | 272 | |
Average number of contracts written | | | 47 | |
| |
Futures contracts | | | | |
Average notional balance on long futures | | $ | 36,018,939 | |
Average notional balance on short futures | | $ | 57,079,050 | |
| |
Forward foreign currency contracts | | | | |
Average contract amounts to buy | | $ | 1,213,402 | |
Average contract amounts to sell | | $ | 10,300,041 | |
| |
Interest rate swaps | | | | |
Average notional balance | | $ | 3,286,739 | |
| |
Total return swaps | | | | |
Average notional balance | | $ | 1,387,751 | |
The Fund’s total return swap transactions may contain provisions for early termination in the event the net assets of the Fund declines below specific levels identified by the counterparty. If these levels are triggered, the counterparty may terminate the transaction and seek payment or request full collateralization of the derivative transactions in net liability positions.
| | | | |
| 44 | | Wells Fargo Alternative Strategies Fund | | Notes to consolidated financial statements (unaudited) |
A summary of the location of derivative instruments on the financial statements by primary risk exposure is outlined following tables.
The fair value of derivative instruments as of December 31, 2017 was as follows for the Fund:
| | | | | | | | | | | | |
| | | Asset derivatives | | | Liability derivatives | |
| | | Consolidated Statement of
Assets and Liabilities location | | Fair value | | | Consolidated Statement of
Assets and Liabilities location | | Fair value | |
Equity risk | | Investments in unaffiliated securities, at value | | | 257,118 | * | | Payable for written options | | | 145,062 | |
| | Receivable for daily variation margin on open futures contracts | | | 124,665 | ** | | Payable for daily variation margin on open futures contracts | | | 55,652 | ** |
Foreign currency risk | | Unrealized gains on forward foreign currency contracts | | | 22,301 | | | Unrealized losses on forward foreign currency contracts | | | 102,439 | |
| | Receivable for daily variation margin on open futures contracts | | | 0 | ** | | Payable for daily variation margin on open futures contracts | | | 101,117 | ** |
Interest rate risk | | Receivable for daily variation margin on open futures contracts | | | 42,882 | ** | | Payable for daily variation margin on open futures contracts | | | 14,270 | ** |
| | Unrealized gains on Interest rate swaps transactions | | | 115,449 | *** | | Unrealized gains on Interest rate swaps transactions | | | 63,398 | *** |
| | | Unrealized gains on total return swap transactions | | | 26,167 | | | Unrealized losses on total return swap transactions | | | 0 | |
| | | | | $ | 588,582 | | | | | $ | 481,938 | |
| * | Amount relates to purchased options. |
| ** | Only the current day’s variation margin as of December 31, 2017 is reported separately on the Consolidated Statement of Assets and Liabilities. |
| *** | Amount includes premiums paid/received on swap contracts. |
The effect of derivative instruments on the Consolidated Statement of Operations for the six months ended December 31, 2017 was as follows for the Fund:
| | | | | | | | | | | | | | | | | | | | | | | | | | | | |
| | | Amount of realized gains (losses) on derivatives | |
| | | Unaffiliated
securities* | | | Futures
contracts | | | Forward
foreign
currency
contracts | | | Written
options | | | Interest
rate
swaps | | | Total
return
swaps | | | Total | |
Interest rate risk | | $ | 0 | | | $ | (121,980 | ) | | $ | 0 | | | $ | 0 | | | $ | 2,488 | | | $ | 233,847 | | | $ | 114,355 | |
Equity risk | | | (472,240 | ) | | | (757,014 | ) | | | 0 | | | | 190,546 | | | | 0 | | | | 0 | | | | (1,038,708 | ) |
Foreign currency risk | | | 0 | | | | (279,577 | ) | | | (238,919 | ) | | | 0 | | | | 0 | | | | 0 | | | | (518,496 | ) |
| | | $ | (472,240 | ) | | $ | (1,158,571 | ) | | $ | (238,919 | ) | | $ | 190,546 | | | $ | 2,488 | | | $ | 233,847 | | | $ | (1,442,849 | ) |
| |
| | | Change in unrealized gains (losses) on derivatives | |
| | | Unaffiliated
securities* | | | Futures
contracts | | | Forward
foreign
currency
contracts | | | Written
options | | | Interest
rate
swaps | | | Total
return
swaps | | | Total | |
Interest rate risk | | $ | 0 | | | $ | 122,945 | | | $ | 0 | | | $ | 0 | | | $ | 42,262 | | | $ | (43,807 | ) | | $ | 121,400 | |
Equity risk | | | 123,375 | | | | (47,345 | ) | | | 0 | | | | (79,531 | ) | | | 0 | | | | 0 | | | | (3,501 | ) |
Foreign currency risk | | | 0 | | | | (202,208 | ) | | | 6,951 | | | | 0 | | | | 0 | | | | 0 | | | | (195,257 | ) |
| | | $ | 123,375 | | | $ | (126,608 | ) | | $ | 6,951 | | | $ | (79,531 | ) | | $ | 42,262 | | | $ | (43,807 | ) | | $ | (77,358 | ) |
| * | Amount relates to purchased options |
| | | | | | |
| Notes to consolidated financial statements (unaudited) | | Wells Fargo Alternative Strategies Fund | | | 45 | |
For certain types of derivative transactions, the Fund has entered into International Swaps and Derivatives Association, Inc. master agreements (“ISDA Master Agreements”) or similar agreements with approved counterparties. The ISDA Master Agreements or similar agreements may have requirements to deliver/deposit securities or cash to/with an exchange or broker-dealer as collateral and allows the Fund to offset, with each counterparty, certain derivative financial instrument’s assets and/or liabilities with collateral held or pledged. Collateral requirements differ by type of derivative. Collateral or margin requirements are set by the broker or exchange clearinghouse for exchange traded derivatives while collateral terms are contract specific for over-the-counter traded derivatives. Cash collateral that has been pledged to cover obligations of the Fund under ISDA Master Agreements or similar agreements, if any, are reported separately in the Consolidated Statement of Assets and Liabilities. Securities pledged as collateral, if any, are noted in the Consolidated Portfolio of Investments. With respect to balance sheet offsetting, absent an event of default by the counterparty or a termination of the agreement, the reported amounts of financial assets and financial liabilities in the Consolidated Statement of Assets and Liabilities are not offset across transactions between the Fund and the applicable counterparty. A reconciliation of the gross amounts on the Consolidated Statement of Assets and Liabilities to the net amounts by derivative type, including any collateral exposure, is as follows:
| | | | | | | | | | | | | | | | |
| Counterparty | | Gross amounts of assets in the Consolidated
Statement of Assets and Liabilities | | | Amounts
subject to
netting
agreements | | | Collateral
received | | | Net amount
of assets | |
| Credit Suisse | | $ | 5,942 | | | $ | 0 | | | $ | 0 | | | $ | 5,942 | |
| Morgan Stanley | | | 263,231 | | | | (263,231 | ) | | | 0 | | | | 0 | |
| | | | |
| Counterparty | | Gross amounts of liabilities in the Consolidated
Statement of Assets and Liabilities | | | Amounts
subject to
netting
agreements | | | Collateral
pledged1 | | | Net amount
of liabilities | |
| JPMorgan | | $ | 7,403 | | | $ | 0 | | | $ | 0 | | | $ | 7,403 | |
| Morgan Stanley | | | 358,593 | | | | (263,231 | ) | | | (95,362 | ) | | | 0 | |
| UBS AG | | | 63,440 | | | | 0 | | | | 0 | | | | 63,440 | |
| | 1 | Collateral pledged within this table is limited to the collateral for the net transaction with the counterparty by derivative type. | |
8. BANK BORROWINGS
The Trust (excluding the money market funds and certain other funds) and Wells Fargo Variable Trust are parties to a $280,000,000 revolving credit agreement whereby the Fund is permitted to use bank borrowings for temporary or emergency purposes, such as to fund shareholder redemption requests. Interest under the credit agreement is charged to the Fund based on a borrowing rate equal to the higher of the Federal Funds rate in effect on that day plus 1.25% or the overnight LIBOR rate in effect on that day plus 1.25%. In addition, an annual commitment fee equal to 0.25% of the unused balance is allocated to each participating fund. Prior to August 29, 2017, the revolving credit agreement amount was $250,000,000.
For the six months ended December 31, 2017, there were no borrowings by the Fund under the agreement.
9. INDEMNIFICATION
Under the Trust’s organizational documents, the officers and Trustees have been granted certain indemnification rights against certain liabilities that may arise out of performance of their duties to the Trust. Additionally, in the normal course of business, the Trust may enter into contracts with service providers that contain a variety of indemnification clauses. The Trust’s maximum exposure under these arrangements is dependent on future claims that may be made against the Fund and, therefore, cannot be estimated.
| | | | |
| 46 | | Wells Fargo Alternative Strategies Fund | | Other information (unaudited) |
PROXY VOTING INFORMATION
A description of the policies and procedures that the Fund uses to determine how to vote proxies relating to portfolio securities is available, upon request, by calling 1-800-222-8222, visiting our website at wellsfargofunds.com, or visiting the SEC website at sec.gov. Information regarding how the Fund voted proxies relating to portfolio securities during the most recent 12-month period ended June 30 is available on the Fund’s website at wellsfargofunds.com or by visiting the SEC website at sec.gov.
PORTFOLIO HOLDINGS INFORMATION
The complete portfolio holdings for the Fund are publicly available at each fiscal quarter end on the Fund’s website (wellsfargofunds.com), on a one-month delayed basis. As of each month end other than a month end that coincides with a fiscal quarter end, the Fund makes publicly available on the Fund’s website, on a one-month delayed basis (i) all portfolio holdings held long other than any put options on equity securities; (ii) portfolio holdings held short other than short positions in equity securities of single issuers; and (iii) the aggregate dollar value of equity securities of single issuers held short, and any put options on equity securities held long. In addition, top ten holdings information (excluding derivative positions and short positions) for the Fund is publicly available on the Fund’s website on a monthly, seven-day or more delayed basis. The Fund files its complete schedule of portfolio holdings with the SEC for the first and third quarters of each fiscal year on Form N-Q, which is available by visiting the SEC website at sec.gov. In addition, the Fund’s Form N-Q may be reviewed and copied at the SEC’s Public Reference Room in Washington, DC, and at regional offices in New York City, at 233 Broadway, and in Chicago, at 175 West Jackson Boulevard, Suite 900. Information about the Public Reference Room may be obtained by calling 1-800-SEC-0330.
| | | | | | |
| Other information (unaudited) | | Wells Fargo Alternative Strategies Fund | | | 47 | |
BOARD OF TRUSTEES AND OFFICERS
Each of the Trustees and Officers1 listed in the table below acts in identical capacities for each fund in the Wells Fargo family of funds, which consists of 153 mutual funds comprising the Wells Fargo Funds Trust, Wells Fargo Variable Trust, Wells Fargo Master Trust and four closed-end funds (collectively the “Fund Complex”). This table should be read in conjunction with the Prospectus and the Statement of Additional Information2. The mailing address of each Trustee and Officer is 525 Market Street, 12th Floor, San Francisco, CA 94105. Each Trustee and Officer serves an indefinite term, however, each Trustee serves such term until reaching the mandatory retirement age established by the Trustees.
Independent Trustees
| | | | | | |
Name and year of birth | | Position held and
length of service* | | Principal occupations during past five years or longer | | Current other
public company or
investment company
directorships |
William R. Ebsworth (Born 1957) | | Trustee, since 2015 | | Retired. From 1984 to 2013, equities analyst, portfolio manager, research director and chief investment officer at Fidelity Management and Research Company in Boston, Tokyo, and Hong Kong, and retired in 2013 as Chief Investment Officer of Fidelity Strategic Advisers, Inc. where he led a team of investment professionals managing client assets. Prior thereto, Board member of Hong Kong Securities Clearing Co., Hong Kong Options Clearing Corp., the Thailand International Fund, Ltd., Fidelity Investments Life Insurance Company, and Empire Fidelity Investments Life Insurance Company. Board member of the Forté Foundation (non-profit organization) and the Vincent Memorial Hospital Endowment (non-profit organization), where he serves on the Investment Committee and as a Chair of the Audit Committee. Mr. Ebsworth is a CFA® charterholder. | | Asset Allocation Trust |
Jane A. Freeman** (Born 1953) | | Trustee, since 2015; Chair Liaison, since 2018 | | Retired. From 2012 to 2014 and 1999 to 2008, Chief Financial Officer of Scientific Learning Corporation. From 2008 to 2012, Ms. Freeman provided consulting services related to strategic business projects. Prior to 1999, Portfolio Manager at Rockefeller & Co. and Scudder, Stevens & Clark. Board member of the Harding Loevner Funds from 1996 to 2014, serving as both Lead Independent Director and chair of the Audit Committee. Board member of the Russell Exchange Traded Funds Trust from 2011 to 2012 and the chair of the Audit Committee. Ms. Freeman is a Board Member of Ruth Bancroft Garden (non-profit organization) and the Glimmerglass Festival. She is also an inactive Chartered Financial Analyst. | | Asset Allocation Trust |
Peter G. Gordon*** (Born 1942) | | Trustee, since 1998; Chairman, from 2005 to 2017 | | Co-Founder, Retired Chairman, President and CEO of Crystal Geyser Water Company. Trustee Emeritus, Colby College. | | Asset Allocation Trust |
Isaiah Harris, Jr. (Born 1952) | | Trustee, since 2009 | | Retired. Chairman of the Board of CIGNA Corporation since 2009, and Director since 2005. From 2003 to 2011, Director of Deluxe Corporation. Prior thereto, President and CEO of BellSouth Advertising and Publishing Corp. from 2005 to 2007, President and CEO of BellSouth Enterprises from 2004 to 2005 and President of BellSouth Consumer Services from 2000 to 2003. Emeritus member of the Iowa State University Foundation Board of Governors. Emeritus Member of the Advisory Board of Iowa State University School of Business. Advisory Board Member, Palm Harbor Academy (charter school). Advisory Board Member, Child Evangelism Fellowship (non-profit). Mr. Harris is a certified public accountant (inactive status). | | CIGNA Corporation; Asset Allocation Trust |
Judith M. Johnson (Born 1949) | | Trustee, since 2008; Audit Committee Chairman, since 2008 | | Retired. Prior thereto, Chief Executive Officer and Chief Investment Officer of Minneapolis Employees Retirement Fund from 1996 to 2008. Ms. Johnson is an attorney, certified public accountant and a certified managerial accountant. | | Asset Allocation Trust |
David F. Larcker (Born 1950) | | Trustee, since 2009 | | James Irvin Miller Professor of Accounting at the Graduate School of Business, Stanford University, Director of the Corporate Governance Research Initiative and Senior Faculty of The Rock Center for Corporate Governance since 2006. From 2005 to 2008, Professor of Accounting at the Graduate School of Business, Stanford University. Prior thereto, Ernst & Young Professor of Accounting at The Wharton School, University of Pennsylvania from 1985 to 2005. | | Asset Allocation Trust |
| | | | |
| 48 | | Wells Fargo Alternative Strategies Fund | | Other information (unaudited) |
| | | | | | |
Name and year of birth | | Position held and
length of service* | | Principal occupations during past five years or longer | | Current other
public company or
investment company
directorships |
Olivia S. Mitchell**** (Born 1953) | | Trustee, since 2006; Governance Committee Chairman, since 2018 | | International Foundation of Employee Benefit Plans Professor, Wharton School of the University of Pennsylvania since 1993. Director of Wharton’s Pension Research Council and Boettner Center on Pensions & Retirement Research, and Research Associate at the National Bureau of Economic Research. Previously, Cornell University Professor from 1978 to 1993. | | Asset Allocation Trust |
Timothy J. Penny***** (Born 1951) | | Trustee since 1996; Chairman, since 2018; Vice Chairman, from 2017 to 2018 | | President and Chief Executive Officer of Southern Minnesota Initiative Foundation, a non-profit organization, since 2007. Member of the Board of Trustees of NorthStar Education Finance, Inc., a non-profit organization, since 2007. | | Asset Allocation Trust |
James G. Polisson****** (Born 1959) | | Trustee, since 2018; Advisory Board Member, from 2017 to 2018 | | Retired. Chief Marketing Officer, Source (ETF) UK Services, Ltd, from 2015 to 2017. From 2012 to 2015, Principal of The Polisson Group, LLC, a management consulting, corporate advisory and principal investing company. Chief Executive Officer and Managing Director at Russell Investments, Global Exchange Traded Funds from 2010 to 2012. Managing Director of Barclays Global Investors from 1998 to 2010 and Global Chief Marketing Officer for iShares and Barclays Global Investors from 2000 to 2010. Trustee of the San Francisco Mechanics’ Institute, a non-profit organization, from 2013 to 2015. Board member of the Russell Exchange Traded Fund Trust from 2011 to 2012. Director of Barclays Global Investors Holdings Deutschland GmbH from 2006 to 2009. Mr. Polisson is an attorney and has a retired status with the Massachusetts and District of Columbia Bar Associations. | | Asset Allocation Trust |
Michael S. Scofield (Born 1943) | | Trustee, since 2010 | | Served on the Investment Company Institute’s Board of Governors and Executive Committee from 2008-2011 as well the Governing Council of the Independent Directors Council from 2006-2011 and the Independent Directors Council Executive Committee from 2008-2011. Trustee of the Evergreen Funds complex (and its predecessors) from 1984 to 2010. Chairman of the Evergreen Funds from 2000-2010. Former Trustee of the Mentor Funds. Retired Attorney, Law Offices of Michael S. Scofield. | | Asset Allocation Trust |
Pamela Wheelock****** (Born 1959) | | Trustee, since 2018; Advisory Board Member, from 2017 to 2018 | | Chief Operating Officer, Twin Cities Habitat for Humanity, since January, 2017. Vice President of University Services, University of Minnesota from 2012 to 2017. Prior thereto, Interim President and Chief Executive Officer of Blue Cross Blue Shield of Minnesota from 2010 to 2011, Chairman of the Board from 2009 to 2011 and Board Director from 2003 to 2015. Vice President, Leadership and Community Engagement, Bush Foundation, Saint Paul, Minnesota (a private foundation) from 2009 to 2011. Executive Vice President and Chief Financial Officer, Minnesota Sports and Entertainment from 2004 to 2009 and Senior Vice President from 2002 to 2004. Commissioner of Finance, State of Minnesota, from 1999 to 2002. Currently on the Board of Directors, Governance Committee and Finance Committee, for the Minnesota Philanthropy Partners (Saint Paul Foundation) since 2012 and Board Chair of the Minnesota Wild Foundation since 2010. | | Asset Allocation Trust |
| * | Length of service dates reflect the Trustee’s commencement of service with the Trust’s predecessor entities, where applicable. |
| ** | Jane Freeman became Chair Liaison effective January 1, 2018. |
| *** | Peter Gordon retired on December 31, 2017. |
| **** | Olivia Mitchell became Chairman of the Governance Committee effective January 1, 2018. |
| ***** | Timothy Penny became Chairman effective January 1, 2018. |
| ****** | James Polisson and Pamela Wheelock each became a Trustee effective January 1, 2018. |
| | | | | | |
| Other information (unaudited) | | Wells Fargo Alternative Strategies Fund | | | 49 | |
Officers
| | | | | | |
Name and year of birth | | Position held and
length of service | | Principal occupations during past five years or longer | | |
Andrew Owen (Born 1960) | | President, since 2017 | | Executive Vice President of Wells Fargo & Company and Head of Affiliated Managers, Wells Fargo Asset Management, since 2014. In addition, Mr. Owen is currently President, Chief Executive Officer and Director of Wells Fargo Funds Management, LLC since 2017. Prior thereto, Executive Vice President responsible for marketing, investments and product development for Wells Fargo Funds Management, LLC, from 2009 to 2014. | | |
Jeremy DePalma1 (Born 1974) | | Treasurer, since 2012 | | Senior Vice President of Wells Fargo Funds Management, LLC since 2009. Senior Vice President of Evergreen Investment Management Company, LLC from 2008 to 2010 and head of the Fund Reporting and Control Team within Fund Administration from 2005 to 2010. | | |
C. David Messman (Born 1960) | | Secretary, since 2000; Chief Legal Officer, since 2003 | | Senior Vice President and Secretary of Wells Fargo Funds Management, LLC since 2001. Assistant General Counsel of Wells Fargo Bank, N.A. since 2013 and Vice President and Managing Counsel of Wells Fargo Bank, N.A. from 1996 to 2013. | | |
Michael H. Whitaker (Born 1967) | | Chief Compliance Officer, since 2016 | | Senior Vice President and Chief Compliance Officer since 2016. Senior Vice President and Chief Compliance Officer for Fidelity Investments from 2007 to 2016. | | |
David Berardi (Born 1975) | | Assistant Treasurer, since 2009 | | Vice President of Wells Fargo Funds Management, LLC since 2009. Vice President of Evergreen Investment Management Company, LLC from 2008 to 2010. Manager of Fund Reporting and Control for Evergreen Investment Management Company, LLC from 2004 to 2010. | | |
| 1 | Jeremy DePalma acts as Treasurer of 76 funds and Assistant Treasurer of 77 funds in the Fund Complex. |
| 2 | The Statement of Additional Information includes additional information about the Trustees and is available, without charge, upon request, by calling 1-800-222-8222 or by visiting the website at wellsfargofunds.com. |
| | | | |
| 50 | | Wells Fargo Alternative Strategies Fund | | List of abbreviations |
The following is a list of common abbreviations for terms and entities that may have appeared in this report.
| ACA | — ACA Financial Guaranty Corporation |
| ADR | — American depositary receipt |
| ADS | — American depositary shares |
| AGC | — Assured Guaranty Corporation |
| AGM | — Assured Guaranty Municipal |
| Ambac | — Ambac Financial Group Incorporated |
| AMT | — Alternative minimum tax |
| BAN | — Bond anticipation notes |
| BHAC | — Berkshire Hathaway Assurance Corporation |
| CAB | — Capital appreciation bond |
| CCAB | — Convertible capital appreciation bond |
| CDA | — Community Development Authority |
| CDO | — Collateralized debt obligation |
| CLO | — Collateralized loan obligation |
| DRIVER | — Derivative inverse tax-exempt receipts |
| DW&P | — Department of Water & Power |
| DWR | — Department of Water Resources |
| ECFA | — Educational & Cultural Facilities Authority |
| EDA | — Economic Development Authority |
| EDFA | — Economic Development Finance Authority |
| ETF | — Exchange-traded fund |
| FDIC | — Federal Deposit Insurance Corporation |
| FFCB | — Federal Farm Credit Banks |
| FGIC | — Financial Guaranty Insurance Corporation |
| FHA | — Federal Housing Administration |
| FHLB | — Federal Home Loan Bank |
| FHLMC | — Federal Home Loan Mortgage Corporation |
| FICO | — The Financing Corporation |
| FNMA | — Federal National Mortgage Association |
| GDR | — Global depositary receipt |
| GNMA | — Government National Mortgage Association |
| HCFR | — Healthcare facilities revenue |
| HEFA | — Health & Educational Facilities Authority |
| HEFAR | — Higher education facilities authority revenue |
| HFA | — Housing Finance Authority |
| HFFA | — Health Facilities Financing Authority |
| HUD | — Department of Housing and Urban Development |
| IDA | — Industrial Development Authority |
| IDAG | — Industrial Development Agency |
| KRW | — Republic of Korea won |
| LIBOR | — London Interbank Offered Rate |
| LIFER | — Long Inverse Floating Exempt Receipts |
| LLC | — Limited liability company |
| LLLP | — Limited liability limited partnership |
| LLP | — Limited liability partnership |
| MBIA | — Municipal Bond Insurance Association |
| MFHR | — Multifamily housing revenue |
| MSTR | — Municipal securities trust receipts |
| MUD | — Municipal Utility District |
| National | — National Public Finance Guarantee Corporation |
| PCFA | — Pollution Control Financing Authority |
| PCL | — Public Company Limited |
| PCR | — Pollution control revenue |
| PFA | — Public Finance Authority |
| PFFA | — Public Facilities Financing Authority |
| PFOTER | — Puttable floating option tax-exempt receipts |
| PJSC | — Public Joint Stock Company |
| plc | — Public limited company |
| PUTTER | — Puttable tax-exempt receipts |
| R&D | — Research & development |
| Radian | — Radian Asset Assurance |
| RAN | — Revenue anticipation notes |
| RDA | — Redevelopment Agency |
| RDFA | — Redevelopment Finance Authority |
| REIT | — Real estate investment trust |
| ROC | — Reset option certificates |
| SAVRS | — Select auction variable rate securities |
| SBA | — Small Business Authority |
| SDR | — Swedish depositary receipt |
| SFHR | — Single-family housing revenue |
| SFMR | — Single-family mortgage revenue |
| SIFMA | — Securities Industry and Financial Markets Association |
| SPA | — Standby purchase agreement |
| SPDR | — Standard & Poor’s Depositary Receipts |
| SPEAR | — Short Puttable Exempt Adjustable Receipts |
| STRIPS | — Separate trading of registered interest and |
| TAN | — Tax anticipation notes |
| TIPS | — Treasury inflation-protected securities |
| TRAN | — Tax revenue anticipation notes |
| TTFA | — Transportation Trust Fund Authority |
| TVA | — Tennessee Valley Authority |
This page is intentionally left blank.
This page is intentionally left blank.

For more information
More information about Wells Fargo Funds is available free upon request. To obtain literature, please write, email, visit the Fund’s website, or call:
Wells Fargo Funds
P.O. Box 8266
Boston, MA 02266-8266
Email: fundservice@wellsfargo.com
Website: wellsfargofunds.com
Individual investors: 1-800-222-8222
Retail investment professionals: 1-888-877-9275
Institutional investment professionals:
1-866-765-0778
This report and the financial statements contained herein are submitted for the general information of the shareholders of the Fund. If this report is used for promotional purposes, distribution of the report must be accompanied or preceded by a current prospectus. Before investing, please consider the investment objectives, risks, charges, and expenses of the investment. For a current prospectus and, if available, a summary prospectus, containing this information, call 1-800-222-8222 or visit the Fund’s website at wellsfargofunds.com. Read the prospectus carefully before you invest or send money.
Wells Fargo Asset Management (WFAM) is a trade name used by the asset management businesses of Wells Fargo & Company. Wells Fargo Funds Management, LLC, a wholly owned subsidiary of Wells Fargo & Company, provides investment advisory and administrative services for Wells Fargo Funds. Other affiliates of Wells Fargo & Company provide subadvisory and other services for the funds. The funds are distributed by Wells Fargo Funds Distributor, LLC, Member FINRA, an affiliate of Wells Fargo & Company. Neither Wells Fargo Funds Distributor nor Wells Fargo Funds Management holds fund shareholder accounts or assets. This material is for general informational and educational purposes only and is NOT intended to provide investment advice or a recommendation of any kind—including a recommendation for any specific investment, strategy, or plan.
NOT FDIC INSURED ◾ NO BANK GUARANTEE ◾ MAY LOSE VALUE
© 2017 Wells Fargo Funds Management, LLC. All rights reserved.
| | |
 | | 308057 02-18 SA267/SAR267 12-17 |
Semi-Annual Report
December 31, 2017

Wells Fargo
California Limited-Term Tax-Free Fund


Reduce clutter. Save trees.
Sign up for electronic delivery of prospectuses and shareholder reports at wellsfargo.com/advantagedelivery
Contents
The views expressed and any forward-looking statements are as of December 31, 2017, unless otherwise noted, and are those of the Fund managers and/or Wells Fargo Funds Management, LLC. Discussions of individual securities, or the markets generally, or any Wells Fargo Fund are not intended as individual recommendations. Future events or results may vary significantly from those expressed in any forward-looking statements. The views expressed are subject to change at any time in response to changing circumstances in the market. Wells Fargo Funds Management, LLC and the Fund disclaim any obligation to publicly update or revise any views expressed or forward-looking statements.
NOT FDIC INSURED ◾ NO BANK GUARANTEE ◾ MAY LOSE VALUE
| | | | |
| 2 | | Wells Fargo California Limited-Term Tax-Free Fund | | Letter to shareholders (unaudited) |

Andrew Owen
President
Wells Fargo Funds
In a predominantly improving global economic environment, global stocks delivered strong results; bond markets had smaller but positive results as well.
Dear Shareholder:
We are pleased to offer you this semi-annual report for the Wells Fargo California Limited-Term Tax-Free Fund for the six-month period that ended December 31, 2017. In a predominantly improving global economic environment, global stocks delivered strong results; bond markets had smaller but positive results as well. U.S. and international stocks delivered similar results, with returns of 11.42% and 11.48%, respectively, for the six-month period, as measured by the S&P 500 Index1 and the MSCI ACWI ex USA Index (Net)2, respectively; within fixed income, the Bloomberg Barclays U.S. Aggregate Bond Index3 returned 1.24% and the Bloomberg Barclays Municipal Bond Index4 returned 1.82%.
As global growth improved in the third quarter of 2017, investment markets generally advanced.
Most stock markets worldwide moved higher during the quarter and ended the period at or near all-time highs. Moderate acceleration in global economic growth was supported by improving corporate earnings, low inflation pressure, and still-low interest rates. Corporate earnings reports were favorable overall as companies continued to benefit from healthy operating leverage. While North Korea’s recent missile launches and nuclear testing raised serious concerns around the world, the heightened geopolitical risk had relatively minimal impact on the quarter’s stock returns. In the U.S., economic data released during the quarter reflected a generally healthy economy. Second-quarter economic output grew at a 3.1% annual rate, and consumers displayed more willingness to spend. Meanwhile, the U.S. Federal Reserve (Fed) maintained the target range for the federal funds rate at 1.00% to 1.25%, noting that inflation had remained below the Fed’s 2.00% objective. However, the Fed also stated the possibility of one more 0.25% increase in the federal funds rate by the end of 2017 and announced plans to begin the process of unwinding its $4.5 trillion portfolio of bonds and other assets in October. Outside the U.S., stocks in the Asia Pacific region benefited from solid earnings reports and investors’ willingness to take on risk despite the rising tensions between North Korea and the U.S. In Europe, markets were supported by better-than-expected economic growth, which led to narrowing of the gap between Europe’s growth rate and that of the U.S. In emerging markets, many countries benefited from stronger currencies versus the U.S. dollar.
Positive economic and market news continued through the fourth quarter.
During the fourth quarter of 2017, stock markets followed a steady, upward trajectory with no meaningful pullbacks, similar to their paths during the previous three quarters of the year. The extended rally was driven largely by reports of strong earnings and revenue surprises from many companies. Synchronous economic expansion worldwide with mild inflation provided a favorable environment for markets to rise with minimal volatility. Data released during the quarter reflected a
| 1 | The S&P 500 Index consists of 500 stocks chosen for market size, liquidity, and industry group representation. It is a market-value-weighted index with each stock’s weight in the index proportionate to its market value. You cannot invest directly in an index. |
| 2 | The Morgan Stanley Capital International (MSCI) All Country World Index (ACWI) ex USA Index (Net) is a free-float-adjusted market-capitalization-weighted index that is designed to measure the equity market performance of developed markets, excluding the United States and Canada. Source: MSCI. MSCI makes no express or implied warranties or representations and shall have no liability whatsoever with respect to any MSCI data contained herein. The MSCI data may not be further redistributed or used as a basis for other indices or any securities or financial products. This report is not approved, reviewed, or produced by MSCI. You cannot invest directly in an index. |
| 3 | The Bloomberg Barclays U.S. Aggregate Bond Index is a broad-based benchmark that measures the investment-grade, U.S. dollar-denominated, fixed-rate taxable bond market, including Treasuries, government-related and corporate securities, mortgage-backed securities (agency fixed-rate and hybrid adjustable-rate mortgage pass-throughs), asset-backed securities, and commercial mortgage-backed securities. You cannot invest directly in an index. |
| 4 | The Bloomberg Barclays Municipal Bond Index is an unmanaged index composed of long-term tax-exempt bonds with a minimum credit rating of Baa. You cannot invest directly in an index. |
| | | | | | |
| Letter to shareholders (unaudited) | | Wells Fargo California Limited-Term Tax-Free Fund | | | 3 | |
healthy U.S. economy. Third-quarter economic output grew at a 3.2% annual rate, just ahead of the second quarter’s 3.1% pace. Hiring remained solid during the quarter; the hiring pace pushed the unemployment rate down to a 17-year low of 4.1% in October, and it remained at 4.1% for both November and December. Fed officials began unwinding the Fed’s $4.5 trillion portfolio of bonds and other assets in October as planned, and in December they raised the target for the federal funds rate to a range of 1.25% to 1.50%. As a result, long-term interest rates in the U.S. continued trending upward, although the 10-year rate remained below 2.5%. Outside the U.S., economies continued to strengthen. In December, the Organisation for Economic Co-operation and Development (OECD) reported that the global economy has been expanding at its fastest rate since 2010; all 45 countries the OECD follows were on track to expand for 2017. International economies have benefited from catalysts such as economic stimulus, improving employment, increased investment, and accelerated trade growth.
Don’t let short-term uncertainty derail long-term investment goals.
Periods of investment uncertainty can present challenges, but experience has taught us that maintaining long-term investment goals can be an effective way to plan for the future. To help you create a sound strategy based on your personal goals and risk tolerance, Wells Fargo Funds offers more than 100 mutual funds spanning a wide range of asset classes and investment styles. Although diversification cannot guarantee an investment profit or prevent losses, we believe it can be an effective way to manage investment risk and potentially smooth out overall portfolio performance. We encourage investors to know their investments and to understand that appropriate levels of risk-taking may unlock opportunities.
Thank you for choosing to invest with Wells Fargo Funds. We appreciate your confidence in us and remain committed to helping you meet your financial needs.
Sincerely,

Andrew Owen
President
Wells Fargo Funds
Although diversification cannot guarantee an investment profit or prevent losses, we believe it can be an effective way to manage investment risk and potentially smooth out overall portfolio performance.
For further information about your Fund, contact your investment professional, visit our website at wellsfargofunds.com, or call us directly at 1-800-222-8222. We are available 24 hours a day, 7 days a week.
| | | | |
| 4 | | Wells Fargo California Limited-Term Tax-Free Fund | | Performance highlights (unaudited) |
Investment objective
The Fund seeks current income exempt from federal income tax and California individual income tax, consistent with capital preservation.
Manager
Wells Fargo Funds Management, LLC
Subadviser
Wells Capital Management Incorporated
Portfolio managers
Terry J. Goode
Adrian Van Poppel
Average annual total returns (%) as of December 31, 20171
| | | | | | | | | | | | | | | | | | | | | | | | | | | | | | | | | | |
| | | | | Including sales charge | | | Excluding sales charge | | | Expense ratios2 (%) | |
| | | Inception date | | 1 year | | | 5 year | | | 10 year | | | 1 year | | | 5 year | | | 10 year | | | Gross | | | Net3 | |
| Class A (SFCIX) | | 11-18-1992 | | | 0.02 | | | | 1.18 | | | | 2.40 | | | | 2.08 | | | | 1.59 | | | | 2.61 | | | | 0.83 | | | | 0.80 | |
| Class C (SFCCX) | | 8-30-2002 | | | 0.41 | | | | 0.85 | | | | 1.84 | | | | 1.41 | | | | 0.85 | | | | 1.84 | | | | 1.58 | | | | 1.55 | |
| Administrator Class (SCTIX) | | 9-6-1996 | | | – | | | | – | | | | – | | | | 2.39 | | | | 1.81 | | | | 2.83 | | | | 0.77 | | | | 0.60 | |
| Institutional Class (SFCNX) | | 10-31-2014 | | | – | | | | – | | | | – | | | | 2.39 | | | | 1.86 | | | | 2.85 | | | | 0.50 | | | | 0.50 | |
| Bloomberg Barclays Municipal Bond 1-5 Year Blend Index4 | | – | | | – | | | | – | | | | – | | | | 1.90 | | | | 1.23 | | | | 2.56 | | | | – | | | | – | |
| Bloomberg Barclays California Municipal Bond 1-5 Year Blend Index5 | | – | | | – | | | | – | | | | – | | | | 1.66 | | | | 1.24 | | | | 2.58 | | | | – | | | | – | |
Figures quoted represent past performance, which is no guarantee of future results, and do not reflect taxes that a shareholder may pay on fund distributions or the redemption of fund shares. Investment return and principal value of an investment will fluctuate so that an investor’s shares, when redeemed, may be worth more or less than their original cost. Performance shown without sales charges would be lower if sales charges were reflected. Current performance may be lower or higher than the performance data quoted, which assumes the reinvestment of dividends and capital gains. Current month-end performance is available on the Fund’s website, wellsfargofunds.com.
Index returns do not include transaction costs associated with buying and selling securities, any mutual fund fees or expenses, or any taxes. It is not possible to invest directly in an index.
For Class A shares, the maximum front-end sales charge is 2.00%. For Class C shares, the maximum contingent deferred sales charge is 1.00%. Performance including a contingent deferred sales charge assumes the sales charge for the corresponding time period. Administrator Class and Institutional Class shares are sold without a front-end sales charge or contingent deferred sales charge.
Bond values fluctuate in response to the financial condition of individual issuers, general market and economic conditions, and changes in interest rates. Changes in market conditions and government policies may lead to periods of heightened volatility in the bond market and reduced liquidity for certain bonds held by the Fund. In general, when interest rates rise, bond values fall and investors may lose principal value. Interest-rate changes and their impact on the Fund and its share price can be sudden and unpredictable. The use of derivatives may reduce returns and/or increase volatility. Certain investment strategies tend to increase the total risk of an investment (relative to the broader market). The Fund is exposed to California municipal securities risk and high-yield securities risk. Consult the Fund’s prospectus for additional information on these and other risks. A portion of the Fund’s income may be subject to federal, state, and/or local income taxes or the Alternative Minimum Tax (AMT). Any capital gains distributions may be taxable.
Please see footnotes on page 5.
| | | | | | |
| Performance highlights (unaudited) | | Wells Fargo California Limited-Term Tax-Free Fund | | | 5 | |
|
| Effective maturity distribution as of December 31, 20176 |
|
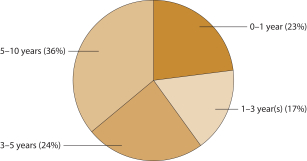
|
|
| Credit quality as of December 31, 20177 |
|
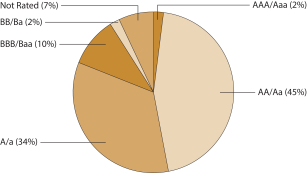 |
| 1 | Historical performance shown for the Institutional Class shares prior to their inception reflects the performance of the Administrator Class shares, and is not adjusted to reflect the Institutional Class share expenses. If these expenses had been included, returns for the Institutional Class shares would be higher. |
| 2 | Reflects the expense ratios as stated in the most recent prospectuses. The expense ratios shown are subject to change and may differ from the annualized expense ratios shown in the financial highlights of this report. |
| 3 | The manager has contractually committed through October 31, 2018, to waive fees and/or reimburse expenses to the extent necessary to cap the Fund’s Total Annual Fund Operating Expenses After Fee Waivers at the amounts shown. After this time, the cap may be increased or the commitment to maintain the cap may be terminated only with the approval of the Board of Trustees. Brokerage commissions, stamp duty fees, interest, taxes, acquired fund fees and expenses, and extraordinary expenses are excluded from the expense cap. Without this cap, the Fund’s returns would have been lower. The expense ratio paid by an investor is the net expense ratio or the Fund’s Total Annual Fund Operating Expenses After Fee Waivers, as stated in the prospectuses. |
| 4 | The Bloomberg Barclays Municipal Bond 1–5 Year Blend Index is the 1–5 Year Blend component of the Bloomberg Barclays Municipal Bond Index. The Bloomberg Barclays Municipal Bond Index is an unmanaged index composed of long-term tax-exempt bonds with a minimum credit rating of Baa. You cannot invest directly in an index. |
| 5 | The Bloomberg Barclays California Municipal Bond 1-5 Year Blend Index is the 1-5 Year Blend Component of the Bloomberg Barclays California Municipal Bond Index. You cannot invest directly in an index. |
| 6 | Amounts are calculated based on the total investments of the Fund. These amounts are subject to change and may have changed since the date specified. |
| 7 | The credit quality distribution of portfolio holdings reflected in the chart is based on ratings from Standard & Poor’s, Moody’s Investors Service, and/or Fitch Ratings Ltd. Credit quality ratings apply to the underlying holdings of the Fund and not to the Fund itself. The percentages of the Fund’s portfolio with the ratings depicted in the chart are calculated based on the total market value of fixed income securities held by the Fund. If a security was rated by all three rating agencies, the middle rating was utilized. If rated by two of three rating agencies, the lower rating was utilized, and if rated by one of the rating agencies, that rating was utilized. Standard & Poor’s rates the creditworthiness of bonds, ranging from AAA (highest) to D (lowest). Ratings from A to CCC may be modified by the addition of a plus (+) or minus (-) sign to show relative standing within the rating categories. Standard & Poor’s rates the creditworthiness of short-term notes from SP-1 (highest) to SP-3 (lowest). Moody’s rates the creditworthiness of bonds, ranging from Aaa (highest) to C (lowest). Ratings Aa to B may be modified by the addition of a number 1 (highest) to 3 (lowest) to show relative standing within the ratings categories. Moody’s rates the creditworthiness of short-term U.S. tax-exempt municipal securities from MIG 1/VMIG 1 (highest) to SG (lowest). Fitch rates the creditworthiness of bonds, ranging from AAA (highest) to D (lowest). Credit quality distribution is subject to change and may have changed since the date specified. |
| | | | |
| 6 | | Wells Fargo California Limited-Term Tax-Free Fund | | Fund expenses (unaudited) |
As a shareholder of the Fund, you incur two types of costs: (1) transaction costs, including sales charges (loads) on purchase payments and contingent deferred sales charges (if any) on redemptions and (2) ongoing costs, including management fees, distribution (12b-1) and/or shareholder servicing fees, and other Fund expenses. This example is intended to help you understand your ongoing costs (in dollars) of investing in the Fund and to compare these costs with the ongoing costs of investing in other mutual funds.
The example is based on an investment of $1,000 invested at the beginning of the six-month period and held for the entire period from July 1, 2017 to December 31, 2017.
Actual expenses
The “Actual” line of the table below provides information about actual account values and actual expenses. You may use the information in this line, together with the amount you invested, to estimate the expenses that you paid over the period. Simply divide your account value by $1,000 (for example, an $8,600 account value divided by $1,000 = 8.6), then multiply the result by the number in the “Actual” line under the heading entitled “Expenses paid during period” for your applicable class of shares to estimate the expenses you paid on your account during this period.
Hypothetical example for comparison purposes
The “Hypothetical” line of the table below provides information about hypothetical account values and hypothetical expenses based on the Fund’s actual expense ratio and an assumed rate of return of 5% per year before expenses, which is not the Fund’s actual return. The hypothetical account values and expenses may not be used to estimate the actual ending account balance or expenses you paid for the period. You may use this information to compare the ongoing costs of investing in the Fund and other funds. To do so, compare this 5% hypothetical example with the 5% hypothetical examples that appear in the shareholder reports of the other funds.
Please note that the expenses shown in the table are meant to highlight your ongoing costs only and do not reflect any transactional costs, such as sales charges (loads) and contingent deferred sales charges. Therefore, the “Hypothetical” line of the table is useful in comparing ongoing costs only and will not help you determine the relative total costs of owning different funds. In addition, if these transactional costs were included, your costs would have been higher.
| | | | | | | | | | | | | | | | |
| | | Beginning
account value
7-1-2017 | | | Ending
account value
12-31-2017 | | | Expenses
paid during
the period¹ | | | Annualized net
expense ratio | |
Class A | | | | | | | | | | | | | | | | |
Actual | | $ | 1,000.00 | | | $ | 1,001.87 | | | $ | 4.04 | | | | 0.80 | % |
Hypothetical (5% return before expenses) | | $ | 1,000.00 | | | $ | 1,021.17 | | | $ | 4.08 | | | | 0.80 | % |
Class C | | | | | | | | | | | | | | | | |
Actual | | $ | 1,000.00 | | | $ | 998.09 | | | $ | 7.81 | | | | 1.55 | % |
Hypothetical (5% return before expenses) | | $ | 1,000.00 | | | $ | 1,017.39 | | | $ | 7.88 | | | | 1.55 | % |
Administrator Class | | | | | | | | | | | | | | | | |
Actual | | $ | 1,000.00 | | | $ | 1,002.78 | | | $ | 3.03 | | | | 0.60 | % |
Hypothetical (5% return before expenses) | | $ | 1,000.00 | | | $ | 1,022.18 | | | $ | 3.06 | | | | 0.60 | % |
Institutional Class | | | | | | | | | | | | | | | | |
Actual | | $ | 1,000.00 | | | $ | 1,003.28 | | | $ | 2.52 | | | | 0.50 | % |
Hypothetical (5% return before expenses) | | $ | 1,000.00 | | | $ | 1,022.68 | | | $ | 2.55 | | | | 0.50 | % |
| 1 | Expenses paid is equal to the annualized net expense ratio of each class multiplied by the average account value over the period, multiplied by the number of days in the most recent fiscal half-year divided by the number of days in the fiscal year (to reflect the one-half-year period). |
| | | | | | |
| Portfolio of investments—December 31, 2017 (unaudited) | | Wells Fargo California Limited-Term Tax-Free Fund | | | 7 | |
| | | | | | | | | | | | | | | | |
| Security name | | Interest rate | | | Maturity date | | | Principal | | | Value | |
|
Municipal Obligations: 98.13% | |
|
| California: 94.40% | |
Adelanto CA School District CAB Series B (GO Revenue, National Insured) ¤ | | | 0.00 | % | | | 9-1-2018 | | | $ | 625,000 | | | $ | 616,560 | |
Alameda County CA Corridor Transportation Authority Prerefunded CAB Subordinate Lien Series A (Transportation Revenue, Ambac Insured) ¤ | | | 0.00 | | | | 10-1-2019 | | | | 2,780,000 | | | | 2,704,718 | |
Alameda County CA Corridor Transportation Authority Unrefunded CAB Subordinate Lien Series A (Transportation Revenue, Ambac Insured) ¤ | | | 0.00 | | | | 10-1-2019 | | | | 220,000 | | | | 210,995 | |
Alameda County CA Joint Powers Authority Multiple Capital Projects Series A (Miscellaneous Revenue) | | | 4.00 | | | | 12-1-2019 | | | | 1,000,000 | | | | 1,047,110 | |
Alameda County CA Joint Powers Authority Multiple Capital Projects Series A (Miscellaneous Revenue) | | | 5.00 | | | | 12-1-2021 | | | | 1,000,000 | | | | 1,129,200 | |
Albany CA Limited Obligation Improvement Bond Act of 1915 (Miscellaneous Revenue, Ambac Insured) | | | 4.75 | | | | 9-2-2019 | | | | 890,000 | | | | 895,322 | |
Alvord CA Unified School District Election of 2007 Series B (GO Revenue, AGM Insured) | | | 6.50 | | | | 8-1-2018 | | | | 475,000 | | | | 488,690 | |
Alvord CA Unified School District Election of 2007 Series B (GO Revenue, AGM Insured) | | | 6.50 | | | | 8-1-2020 | | | | 1,605,000 | | | | 1,802,367 | |
Anaheim CA PFA CAB Subordinate Lien Public Improvements Project Series C (Miscellaneous Revenue, AGM Insured) ¤ | | | 0.00 | | | | 9-1-2018 | | | | 3,245,000 | | | | 3,211,836 | |
Anaheim CA RDA Merged Project Area Series A (Tax Revenue, AGM Insured) | | | 4.50 | | | | 2-1-2018 | | | | 875,000 | | | | 877,126 | |
Association of Bay Area Governments California Finance Authority for Nonprofit Corporations Jackson Laboratory (Miscellaneous Revenue) | | | 5.00 | | | | 7-1-2019 | | | | 730,000 | | | | 767,172 | |
Association of Bay Area Governments California Finance Authority for Nonprofit Corporations O’Connor Woods (Health Revenue) | | | 4.00 | | | | 1-1-2019 | | | | 955,000 | | | | 979,629 | |
Association of Bay Area Governments California Finance Authority for Nonprofit Corporations Sharp Healthcare Series A (Health Revenue) | | | 5.00 | | | | 8-1-2019 | | | | 500,000 | | | | 526,295 | |
Bassett CA Unified School District Refunding Bond Series B (GO Revenue, Build America Mutual Assurance Company Insured) | | | 5.00 | | | | 8-1-2019 | | | | 420,000 | | | | 442,630 | |
Bassett CA Unified School District Refunding Bond Series B (GO Revenue, Build America Mutual Assurance Company Insured) | | | 5.00 | | | | 8-1-2021 | | | | 550,000 | | | | 612,733 | |
Bassett CA Unified School District Refunding Bond Series B (GO Revenue, Build America Mutual Assurance Company Insured) | | | 5.00 | | | | 8-1-2023 | | | | 725,000 | | | | 845,495 | |
Bay Area CA Toll Authority San Francisco Bay Area Toll (Transportation Revenue) | | | 2.13 | | | | 4-1-2053 | | | | 14,500,000 | | | | 14,522,475 | |
Brentwood CA Infrastructure Financing Authority Subordinate Series B (Miscellaneous Revenue) | | | 3.00 | | | | 9-2-2018 | | | | 1,030,000 | | | | 1,038,580 | |
Brentwood CA Infrastructure Financing Authority Subordinate Series B (Miscellaneous Revenue) | | | 4.00 | | | | 9-2-2021 | | | | 1,135,000 | | | | 1,189,752 | |
California (SIFMA Municipal Swap +0.38%) (GO Revenue) ± | | | 2.09 | | | | 12-1-2027 | | | | 5,000,000 | | | | 4,996,450 | |
California (GO Revenue) | | | 5.00 | | | | 10-1-2021 | | | | 6,795,000 | | | | 7,607,614 | |
California (Miscellaneous Revenue) | | | 5.00 | | | | 9-1-2022 | | | | 2,240,000 | | | | 2,561,194 | |
California (GO Revenue) | | | 5.00 | | | | 11-1-2022 | | | | 2,500,000 | | | | 2,869,525 | |
California (GO Revenue) | | | 5.00 | | | | 9-1-2023 | | | | 10,730,000 | | | | 12,557,319 | |
California (GO Revenue) | | | 5.00 | | | | 10-1-2023 | | | | 8,400,000 | | | | 9,850,512 | |
California (GO Revenue) | | | 5.25 | | | | 10-1-2022 | | | | 2,750,000 | | | | 3,182,218 | |
California Communities Transportation Total Road Improvement Certificate of Participation Series B (Tax Revenue) | | | 4.00 | | | | 6-1-2018 | | | | 390,000 | | | | 393,912 | |
California Department of Veterans Affairs Home Purchase Series A (Housing Revenue) | | | 3.50 | | | | 12-1-2021 | | | | 855,000 | | | | 906,779 | |
California Economic Recovery Refunding Bond Series A (Tax Revenue) | | | 5.00 | | | | 7-1-2018 | | | | 3,800,000 | | | | 3,868,895 | |
California Educational Facilities Authority Revenue Loma Linda University Series A (Education Revenue) | | | 5.00 | | | | 4-1-2024 | | | | 550,000 | | | | 643,572 | |
The accompanying notes are an integral part of these financial statements.
| | | | |
| 8 | | Wells Fargo California Limited-Term Tax-Free Fund | | Portfolio of investments—December 31, 2017 (unaudited) |
| | | | | | | | | | | | | | | | |
| Security name | | Interest rate | | | Maturity date | | | Principal | | | Value | |
|
| California (continued) | |
California Educational Facilities Authority Revenue Loma Linda University Series A (Education Revenue) | | | 5.00 | % | | | 4-1-2026 | | | $ | 325,000 | | | $ | 391,628 | |
California HFA Home Mortgage Series A (Housing Revenue, GNMA/FNMA/FHLMC Insured) | | | 3.75 | | | | 8-1-2020 | | | | 450,000 | | | | 458,411 | |
California HFFA Catholic Healthcare West Series A (Health Revenue) | | | 5.00 | | | | 3-1-2019 | | | | 700,000 | | | | 726,677 | |
California HFFA Catholic Healthcare West Series A (Health Revenue) | | | 5.25 | | | | 3-1-2023 | | | | 4,000,000 | | | | 4,413,000 | |
California HFFA Chinese Hospital Associates (Health Revenue) | | | 5.00 | | | | 6-1-2019 | | | | 200,000 | | | | 209,304 | |
California HFFA El Camino Hospital (Health Revenue) | | | 5.00 | | | | 2-1-2025 | | | | 1,000,000 | | | | 1,197,790 | |
California HFFA Fellowship Homes Incorporated (Health Revenue) | | | 5.00 | | | | 9-1-2019 | | | | 770,000 | | | | 797,181 | |
California HFFA Kaiser Permanente Series C (Health Revenue) | | | 5.00 | | | | 8-1-2031 | | | | 2,000,000 | | | | 2,301,620 | |
California HFFA Kasier Permanente Subordinate Series A1 (Health Revenue) | | | 5.00 | | | | 11-1-2027 | | | | 2,500,000 | | | | 3,150,825 | |
California HFFA Memorial Health Services Series A (Health Revenue) | | | 5.00 | | | | 10-1-2023 | | | | 2,475,000 | | | | 2,829,098 | |
California HFFA Refunding Bond Lucile Packard Stanford Hospital Series A (Health Revenue) | | | 5.00 | | | | 8-15-2027 | | | | 450,000 | | | | 554,661 | |
California HFFA Refunding Bond Stanford Health Care Series A (Health Revenue) | | | 5.00 | | | | 11-15-2028 | | | | 2,500,000 | | | | 3,095,225 | |
California HFFA Various Providence St Joseph (Health Revenue) | | | 1.25 | | | | 10-1-2036 | | | | 2,000,000 | | | | 1,972,780 | |
California HFFA Various Providence St Joseph Series B-3 (Health Revenue) | | | 2.00 | | | | 10-1-2036 | | | | 14,000,000 | | | | 13,860,560 | |
California Infrastructure & Economic Development Bank Goodwill Industries of Sacramento Valley & Northern Nevada Project Series A (Industrial Development Revenue) 144A | | | 4.13 | | | | 1-1-2027 | | | | 1,255,000 | | | | 1,227,767 | |
California Infrastructure & Refunding Bond Pacific Gas & Electric Company Series (Utilities Revenue) | | | 1.75 | | | | 11-1-2026 | | | | 1,000,000 | | | | 987,820 | |
California Municipal Finance Authority California Baptist University Series A (Education Revenue) 144A | | | 4.00 | | | | 11-1-2021 | | | | 850,000 | | | | 872,517 | |
California Municipal Finance Authority Charter School Albert Einstein Academies Project Series A (Education Revenue) | | | 6.00 | | | | 8-1-2023 | | | | 805,000 | | | | 860,255 | |
California Municipal Finance Authority Community Medical Centers Series A (Health Revenue) | | | 5.00 | | | | 2-1-2023 | | | | 735,000 | | | | 836,386 | |
California Municipal Finance Authority Community Medical Centers Series A (Health Revenue) | | | 5.00 | | | | 2-1-2024 | | | | 500,000 | | | | 580,155 | |
California Municipal Finance Authority Insured Revenue Refunding Bond Institute Aging Project (Health Revenue) | | | 5.00 | | | | 8-15-2024 | | | | 535,000 | | | | 636,554 | |
California Municipal Finance Authority Insured Revenue Refunding Bond Institute Aging Project (Health Revenue) | | | 5.00 | | | | 8-15-2025 | | | | 250,000 | | | | 302,540 | |
California Municipal Finance Authority Insured Revenue Refunding Bond Institute Aging Project (Health Revenue) | | | 5.00 | | | | 8-15-2026 | | | | 330,000 | | | | 405,356 | |
California Municipal Finance Authority Insured Revenue Refunding Bond Institute Aging Project (Health Revenue) | | | 5.00 | | | | 8-15-2027 | | | | 460,000 | | | | 570,630 | |
California Municipal Finance Authority Mobile Refunding Bond Windsor Mobile Country (Housing Revenue) | | | 5.00 | | | | 11-15-2024 | | | | 470,000 | | | | 554,121 | |
California Municipal Finance Authority Mobile Refunding Bond Windsor Mobile Country (Housing Revenue) | | | 5.00 | | | | 11-15-2025 | | | | 490,000 | | | | 583,384 | |
California Municipal Finance Authority Mobile Refunding Bond Windsor Mobile Country (Housing Revenue) | | | 5.00 | | | | 11-15-2026 | | | | 315,000 | | | | 375,083 | |
California Municipal Finance Authority Mobile Senior Caritas Affordable Housing Incorporated Projects Series A (Housing Revenue) | | | 5.00 | | | | 8-15-2019 | | | | 515,000 | | | | 543,165 | |
California Municipal Finance Authority Mobile Senior Caritas Projects Series A (Housing Revenue) | | | 5.00 | | | | 8-15-2023 | | | | 500,000 | | | | 569,605 | |
California Municipal Finance Authority Mobile Senior Caritas Projects Series A (Housing Revenue) | | | 5.00 | | | | 8-15-2025 | | | | 500,000 | | | | 583,925 | |
California Municipal Finance Authority Mobile Senior Caritas Projects Series A (Housing Revenue) | | | 5.00 | | | | 8-15-2027 | | | | 785,000 | | | | 934,072 | |
The accompanying notes are an integral part of these financial statements.
| | | | | | |
| Portfolio of investments—December 31, 2017 (unaudited) | | Wells Fargo California Limited-Term Tax-Free Fund | | | 9 | |
| | | | | | | | | | | | | | | | |
| Security name | | Interest rate | | | Maturity date | | | Principal | | | Value | |
|
| California (continued) | |
California Municipal Finance Authority Palmdale Aerospace Academy Project (Education Revenue) 144A | | | 4.00 | % | | | 7-1-2026 | | | $ | 2,000,000 | | | $ | 2,018,660 | |
California Municipal Finance Authority Peppertree Senior Apartments Series A (Housing Revenue, FHLMC Insured, FHLMC LIQ) | | | 2.80 | | | | 6-1-2023 | | | | 2,500,000 | | | | 2,635,775 | |
California Municipal Finance Authority Revenue Community Medical Centers Series A (Health Revenue) | | | 5.00 | | | | 2-1-2025 | | | | 1,000,000 | | | | 1,179,700 | |
California Municipal Finance Authority Revenue Emerson College Series B (Education Revenue) | | | 5.00 | | | | 1-1-2026 | | | | 475,000 | | | | 566,637 | |
California Municipal Finance Authority Revenue Insured Channing House Project Series A (Health Revenue) | | | 5.00 | | | | 5-15-2022 | | | | 475,000 | | | | 539,187 | |
California Municipal Finance Authority Revenue Insured Channing House Project Series A (Health Revenue) | | | 5.00 | | | | 5-15-2023 | | | | 925,000 | | | | 1,074,212 | |
California Municipal Finance Authority Revenue Refunding Bond Biola University (Education Revenue) | | | 5.00 | | | | 10-1-2026 | | | | 715,000 | | | | 857,078 | |
California Municipal Finance Authority Revenue Refunding Bond Biola University (Education Revenue) | | | 5.00 | | | | 10-1-2027 | | | | 790,000 | | | | 962,125 | |
California Municipal Finance Authority Revenue Refunding Bond Eisenhower Medical Center Series A (Health Revenue) | | | 5.00 | | | | 7-1-2027 | | | | 500,000 | | | | 606,005 | |
California Municipal Finance Authority Revenue Refunding Bond Eisenhower Medical Center Series A (Health Revenue) | | | 5.00 | | | | 7-1-2029 | | | | 400,000 | | | | 476,600 | |
California Municipal Finance Authority Revenue Refunding Bond Eisenhower Medical Center Series B (Health Revenue) | | | 5.00 | | | | 7-1-2026 | | | | 450,000 | | | | 540,576 | |
California Municipal Finance Authority Revenue Refunding Bond Eisenhower Medical Center Series B (Health Revenue) | | | 5.00 | | | | 7-1-2027 | | | | 600,000 | | | | 727,206 | |
California Municipal Finance Authority Revenue Retirement Housing Foundation Series A (Health Revenue) | | | 5.00 | | | | 11-15-2024 | | | | 300,000 | | | | 358,746 | |
California Municipal Finance Authority Revenue Retirement Housing Foundation Series A (Health Revenue) | | | 5.00 | | | | 11-15-2025 | | | | 400,000 | | | | 482,092 | |
California Municipal Finance Authority Revenue Retirement Housing Foundation Series A (Health Revenue) | | | 5.00 | | | | 11-15-2026 | | | | 950,000 | | | | 1,152,103 | |
California Municipal Finance Authority Revenue Retirement Housing Foundation Series A (Health Revenue) | | | 5.00 | | | | 11-15-2028 | | | | 705,000 | | | | 863,505 | |
California Municipal Finance Authority Revenue Retirement Housing Foundation Series A (Health Revenue) | | | 5.00 | | | | 11-15-2029 | | | | 390,000 | | | | 479,653 | |
California Municipal Finance Authority Revenue University Louisiana Verne Series A (Education Revenue) | | | 5.00 | | | | 6-1-2027 | | | | 2,565,000 | | | | 3,147,999 | |
California Municipal Finance Authority Village Grove Apartments Series A (Housing Revenue, FHLMC Insured, FHLMC LIQ) | | | 3.10 | | | | 12-1-2021 | | | | 1,000,000 | | | | 1,050,100 | |
California Municipal Financing Authority BAN Open Door Community Health Centers (Health Revenue) | | | 2.80 | | | | 9-15-2018 | | | | 3,000,000 | | | | 3,002,820 | |
California PCFA AMT Calplant I Project (Industrial Development Revenue) 144A | | | 7.00 | | | | 7-1-2022 | | | | 500,000 | | | | 531,075 | |
California PCFA AMT Calplant I Project (Industrial Development Revenue) 144A | | | 7.50 | | | | 7-1-2032 | | | | 1,500,000 | | | | 1,613,565 | |
California PFA NCCD-Claremont Properties LLC University Housing Project Series A (Housing Revenue) 144A | | | 5.00 | | | | 7-1-2027 | | | | 1,825,000 | | | | 2,084,114 | |
California PFA Revenue Various Sharp Healthcare Series C (Health Revenue, Barclays Bank plc LOC) ø | | | 1.71 | | | | 8-1-2052 | | | | 9,535,000 | | | | 9,535,000 | |
California PFOTER Series DCL-009 (GO Revenue, Dexia Credit Local LOC, AGM Insured) 144Aø | | | 1.97 | | | | 8-1-2027 | | | | 15,500,000 | | | | 15,500,000 | |
California PFOTER Series DCL-010 (GO Revenue, Dexia Credit Local LOC, AGM Insured) 144Aø | | | 1.97 | | | | 8-1-2027 | | | | 27,665,000 | | | | 27,665,000 | |
California Public Works Board Capital Project Series G (Miscellaneous Revenue) | | | 5.00 | | | | 11-1-2020 | | | | 3,000,000 | | | | 3,270,390 | |
California Public Works Board Department of Corrections & Rehabilitation Series C (Miscellaneous Revenue) | | | 4.00 | | | | 6-1-2018 | | | | 1,625,000 | | | | 1,642,778 | |
The accompanying notes are an integral part of these financial statements.
| | | | |
| 10 | | Wells Fargo California Limited-Term Tax-Free Fund | | Portfolio of investments—December 31, 2017 (unaudited) |
| | | | | | | | | | | | | | | | |
| Security name | | Interest rate | | | Maturity date | | | Principal | | | Value | |
|
| California (continued) | |
California Public Works Board Department of Corrections & Rehabilitation Series C (Miscellaneous Revenue) | | | 5.00 | % | | | 10-1-2022 | | | $ | 1,500,000 | | | $ | 1,714,365 | |
California Public Works Board Judicial Council Projects Series B (Miscellaneous Revenue) | | | 5.00 | | | | 10-1-2022 | | | | 500,000 | | | | 571,455 | |
California Public Works Board Judicial Council Projects Series D (Miscellaneous Revenue) | | | 5.00 | | | | 12-1-2019 | | | | 1,000,000 | | | | 1,064,310 | |
California Public Works Board Various Capital Projects Series I (Miscellaneous Revenue) | | | 5.00 | | | | 11-1-2020 | | | | 1,250,000 | | | | 1,362,663 | |
California Refunding Bond Various Purpose Bidding Group C (GO Revenue) | | | 5.00 | | | | 9-1-2027 | | | | 8,500,000 | | | | 10,533,710 | |
California School Finance Authority Bright Star School Obligation Group (Education Revenue) 144A | | | 5.00 | | | | 6-1-2027 | | | | 1,860,000 | | | | 2,036,700 | |
California School Finance Authority Coastal Academy Project Series A (Education Revenue) | | | 5.00 | | | | 10-1-2022 | | | | 300,000 | | | | 328,002 | |
California School Finance Authority Refunding Bond Aspire Public School (Education Revenue) 144A | | | 5.00 | | | | 8-1-2022 | | | | 1,545,000 | | | | 1,728,793 | |
California School Finance Authority Refunding Bond Aspire Public School (Education Revenue) 144A | | | 5.00 | | | | 8-1-2023 | | | | 800,000 | | | | 907,064 | |
California School Finance Authority Refunding Bond Aspire Public School (Education Revenue) 144A | | | 5.00 | | | | 8-1-2024 | | | | 350,000 | | | | 399,564 | |
California School Finance Authority Rocketship Education Series A (Education Revenue) 144A | | | 5.00 | | | | 6-1-2021 | | | | 400,000 | | | | 420,568 | |
California School Finance Authority Rocketship Education Series A (Education Revenue) 144A | | | 5.00 | | | | 6-1-2026 | | | | 500,000 | | | | 540,435 | |
California School Infrastructure Financing Agency Refunding Bond (Tax Revenue, AGM Insured) | | | 5.00 | | | | 9-1-2021 | | | | 1,300,000 | | | | 1,452,113 | |
California Statewide CDA Adventist Health Systems West Series A (Health Revenue) | | | 5.00 | | | | 3-1-2024 | | | | 800,000 | | | | 939,184 | |
California Statewide CDA California Baptist University Series A (Education Revenue) | | | 5.13 | | | | 11-1-2023 | | | | 715,000 | | | | 782,918 | |
California Statewide CDA California Baptist University Series B (Education Revenue) | | | 3.50 | | | | 11-1-2018 | | | | 270,000 | | | | 272,857 | |
California Statewide CDA Health Facilities Catholic Series F (Health Revenue, AGM Insured) (m) | | | 0.99 | | | | 7-1-2040 | | | | 1,000,000 | | | | 1,000,000 | |
California Statewide CDA Henry Mayo Newhall Memorial Hospital Series A (Health Revenue, AGM Insured) | | | 5.00 | | | | 10-1-2021 | | | | 500,000 | | | | 551,470 | |
California Statewide CDA Henry Mayo Newhall Memorial Hospital Series A (Health Revenue, AGM Insured) | | | 5.00 | | | | 10-1-2022 | | | | 395,000 | | | | 445,323 | |
California Statewide CDA Henry Mayo Newhall Memorial Hospital Series A (Health Revenue, AGM Insured) | | | 5.00 | | | | 10-1-2023 | | | | 500,000 | | | | 574,590 | |
California Statewide CDA Redwoods Project (Health Revenue) | | | 3.00 | | | | 11-15-2018 | | | | 400,000 | | | | 405,560 | |
California Statewide CDA Refunding Bond (Miscellaneous Revenue, AGM Insured) | | | 5.00 | | | | 11-15-2019 | | | | 250,000 | | | | 266,043 | |
California Statewide CDA Refunding Bond (Miscellaneous Revenue, AGM Insured) | | | 5.00 | | | | 11-15-2020 | | | | 210,000 | | | | 229,925 | |
California Statewide CDA Refunding Bond (Miscellaneous Revenue, AGM Insured) | | | 5.00 | | | | 11-15-2021 | | | | 200,000 | | | | 224,834 | |
California Statewide CDA Refunding Bond (Miscellaneous Revenue, AGM Insured) | | | 5.00 | | | | 11-15-2022 | | | | 200,000 | | | | 230,294 | |
California Statewide CDA School Facilities (Education Revenue) | | | 5.88 | | | | 7-1-2022 | | | | 1,485,000 | | | | 1,660,690 | |
California Statewide CDA Senior Living Health Facilities Los Angeles Jewish Home for the Aging Series B (Health Revenue) | | | 3.00 | | | | 8-1-2021 | | | | 240,000 | | | | 240,240 | |
California Statewide CDA St. Joseph Hospital (Health Revenue, AGM Insured) | | | 4.50 | | | | 7-1-2018 | | | | 205,000 | | | | 208,212 | |
California Statewide Communities Front Porch Communities & Services (Health Revenue) | | | 5.00 | | | | 4-1-2024 | | | | 300,000 | | | | 349,893 | |
California Statewide Communities Front Porch Communities & Services (Health Revenue) | | | 5.00 | | | | 4-1-2025 | | | | 300,000 | | | | 355,737 | |
California Statewide Communities Front Porch Communities & Services (Health Revenue) | | | 5.00 | | | | 4-1-2026 | | | | 100,000 | | | | 119,919 | |
The accompanying notes are an integral part of these financial statements.
| | | | | | |
| Portfolio of investments—December 31, 2017 (unaudited) | | Wells Fargo California Limited-Term Tax-Free Fund | | | 11 | |
| | | | | | | | | | | | | | | | |
| Security name | | Interest rate | | | Maturity date | | | Principal | | | Value | |
|
| California (continued) | |
California Statewide Community Facilities District #2015 01 (Tax Revenue) | | | 5.00 | % | | | 9-1-2027 | | | $ | 500,000 | | | $ | 569,470 | |
California Statewide Community Monterey County Savers Bond (Miscellaneous Revenue, Build America Mutual Assurance Company Insured) | | | 5.00 | | | | 8-1-2027 | | | | 2,185,000 | | | | 2,670,398 | |
California Statewide Community Refunding Bond California Baptist University Series A (Education Revenue) 144A | | | 3.00 | | | | 11-1-2022 | | | | 2,000,000 | | | | 2,003,900 | |
California Statewide Community University California Irvine East Campus (Education Revenue) | | | 5.00 | | | | 5-15-2026 | | | | 1,500,000 | | | | 1,823,115 | |
California Statewide Community University California Irvine East Campus (Education Revenue) | | | 5.00 | | | | 5-15-2028 | | | | 1,600,000 | | | | 1,948,560 | |
California Statewide HFFA Casa Colina Obligated Group (Health Revenue) | | | 5.00 | | | | 4-1-2018 | | | | 400,000 | | | | 402,984 | |
California Statewide Refunding Bond Various Purpose (GO Revenue) | | | 5.00 | | | | 8-1-2025 | | | | 3,500,000 | | | | 4,256,805 | |
California Statewide Series B (1 Month LIBOR +0.76%) (GO Revenue) ± | | | 1.71 | | | | 12-1-2031 | | | | 2,500,000 | | | | 2,528,850 | |
California Statewide Series E (1 Month LIBOR +0.83%) (GO Revenue) ± | | | 1.79 | | | | 12-1-2029 | | | | 5,000,000 | | | | 5,011,950 | |
Carlsbad CA Improvement Bond Act of 1915 (Miscellaneous Revenue) | | | 3.00 | | | | 9-2-2018 | | | | 300,000 | | | | 302,997 | |
Carlsbad CA Improvement Bond Act of 1915 (Miscellaneous Revenue) | | | 3.00 | | | | 9-2-2019 | | | | 540,000 | | | | 549,050 | |
Carson CA RDA Project Area #1 Series A (Tax Revenue, AGM Insured) | | | 5.00 | | | | 10-1-2020 | | | | 775,000 | | | | 844,804 | |
Carson CA RDA Project Area #1 Series A (Tax Revenue, AGM Insured) | | | 5.00 | | | | 10-1-2021 | | | | 855,000 | | | | 957,249 | |
Carson CA RDA Project Area #1 Series A (Tax Revenue, AGM Insured) | | | 5.00 | | | | 10-1-2022 | | | | 600,000 | | | | 688,098 | |
Cathedral City CA RDA Refunding Bond Merged Redevelopment Project Series A (Tax Revenue) | | | 5.00 | | | | 8-1-2020 | | | | 2,295,000 | | | | 2,474,331 | |
Cathedral City CA RDA Refunding Bond Merged Redevelopment Project Series A (Tax Revenue) | | | 5.00 | | | | 8-1-2021 | | | | 2,425,000 | | | | 2,684,693 | |
Cathedral City CA RDA Refunding Bond Merged Redevelopment Project Series A (Tax Revenue) | | | 5.00 | | | | 8-1-2022 | | | | 2,550,000 | | | | 2,878,262 | |
Cathedral City CA RDA Refunding Bond Merged Redevelopment Project Series A (Tax Revenue) | | | 5.00 | | | | 8-1-2023 | | | | 1,735,000 | | | | 1,997,523 | |
Cathedral City CA RDA Refunding Bond Merged Redevelopment Project Series A (Tax Revenue, AGM Insured) | | | 5.00 | | | | 8-1-2024 | | | | 1,770,000 | | | | 2,096,937 | |
Central California Unified School District Refunding Bond (GO Revenue, AGM Insured) | | | 4.00 | | | | 7-1-2020 | | | | 500,000 | | | | 529,860 | |
Central California Unified School District Refunding Bond (GO Revenue, AGM Insured) | | | 5.00 | | | | 7-1-2021 | | | | 400,000 | | | | 446,040 | |
Central California Unified School District Refunding Bond (GO Revenue, AGM Insured) | | | 5.00 | | | | 7-1-2022 | | | | 750,000 | | | | 858,405 | |
Centralia CA School District (GO Revenue, AGM Insured) | | | 4.00 | | | | 8-1-2018 | | | | 375,000 | | | | 380,434 | |
Chino CA PFA Local Agency Series A (Tax Revenue, AGM Insured) | | | 5.00 | | | | 9-1-2022 | | | | 1,830,000 | | | | 2,079,246 | |
Chino CA PFA Local Agency Series A (Tax Revenue, AGM Insured) | | | 5.00 | | | | 9-1-2024 | | | | 660,000 | | | | 779,731 | |
Chula Vista CA Certificate of Participation Refunding Bond Police Facility Project (Miscellaneous Revenue) | | | 5.00 | | | | 10-1-2021 | | | | 720,000 | | | | 808,330 | |
Coachella Valley CA Unified School District (GO Revenue, Build America Mutual Assurance Company Insured) | | | 4.00 | | | | 8-1-2020 | | | | 2,455,000 | | | | 2,602,546 | |
Coachella Valley CA Unified School District (GO Revenue, Build America Mutual Assurance Company Insured) | | | 4.00 | | | | 8-1-2021 | | | | 2,230,000 | | | | 2,409,693 | |
Coachella Valley CA Unified School District (GO Revenue, Build America Mutual Assurance Company Insured) | | | 4.00 | | | | 8-1-2022 | | | | 1,000,000 | | | | 1,099,480 | |
Colton CA PFA Series A (Utilities Revenue) | | | 4.00 | | | | 4-1-2019 | | | | 415,000 | | | | 427,529 | |
Commerce CA Community Development Commission Refunding Bond Series A (Tax Revenue, AGM Insured) | | | 5.00 | | | | 8-1-2026 | | | | 1,710,000 | | | | 2,097,383 | |
Commerce CA RDA CAB Project #1 (Tax Revenue) ¤ | | | 0.00 | | | | 8-1-2021 | | | | 1,300,000 | | | | 1,103,635 | |
Compton CA PFA Lease (Miscellaneous Revenue) 144A | | | 4.00 | | | | 9-1-2022 | | | | 2,000,000 | | | | 2,056,420 | |
Compton CA PFA Refunding Bond (Miscellaneous Revenue) 144A | | | 4.00 | | | | 9-1-2027 | | | | 2,000,000 | | | | 2,031,640 | |
Cotati Rohnert Park CA Unified School District Series B (GO Revenue, AGM Insured) | | | 5.00 | | | | 8-1-2020 | | | | 2,275,000 | | | | 2,470,741 | |
Culver City CA RDA CAB Tax Allocation Series A (Tax Revenue) ¤ | | | 0.00 | | | | 11-1-2019 | | | | 2,575,000 | | | | 2,441,229 | |
Cypress CA Elementary School District (Miscellaneous Revenue) | | | 2.25 | | | | 5-1-2018 | | | | 455,000 | | | | 456,192 | |
The accompanying notes are an integral part of these financial statements.
| | | | |
| 12 | | Wells Fargo California Limited-Term Tax-Free Fund | | Portfolio of investments—December 31, 2017 (unaudited) |
| | | | | | | | | | | | | | | | |
| Security name | | Interest rate | | | Maturity date | | | Principal | | | Value | |
|
| California (continued) | |
Desert Sands CA Unified School District Certificate of Participation (Miscellaneous Revenue, Build America Mutual Assurance Company Insured) | | | 5.00 | % | | | 3-1-2024 | | | $ | 1,500,000 | | | $ | 1,766,250 | |
Dinuba CA RDA Successor Agency to Merged City Project #2 (Tax Revenue, Build America Mutual Assurance Company Insured) | | | 4.00 | | | | 9-1-2019 | | | | 210,000 | | | | 217,980 | |
Dinuba CA RDA Successor Agency to Merged City Project #2 (Tax Revenue, Build America Mutual Assurance Company Insured) | | | 5.00 | | | | 9-1-2021 | | | | 250,000 | | | | 278,780 | |
Dinuba CA RDA Successor Agency to Merged City Project #2 (Tax Revenue, Build America Mutual Assurance Company Insured) | | | 5.00 | | | | 9-1-2022 | | | | 250,000 | | | | 285,368 | |
Dixon CA Unified School District (GO Revenue, AGM Insured) | | | 5.00 | | | | 8-1-2021 | | | | 1,210,000 | | | | 1,349,356 | |
Dixon CA Unified School District (GO Revenue, AGM Insured) | | | 5.00 | | | | 8-1-2022 | | | | 1,285,000 | | | | 1,468,549 | |
El Centro CA Financing Authority Series A (Water & Sewer Revenue, AGM Insured) | | | 2.50 | | | | 10-1-2018 | | | | 485,000 | | | | 489,147 | |
El Dorado CA Community Facilities District #19-1 (Tax Revenue) | | | 4.00 | | | | 9-1-2018 | | | | 1,000,000 | | | | 1,016,240 | |
El Monte CA Union High School Refunding Bond (GO Revenue) | | | 5.00 | | | | 6-1-2021 | | | | 1,315,000 | | | | 1,461,438 | |
Fairfield CA RDA Successor Agency to Tax Allocation Refunding Bond (Tax Revenue) | | | 5.00 | | | | 8-1-2020 | | | | 1,000,000 | | | | 1,084,980 | |
Fairfield CA RDA Successor Agency to Tax Allocation Refunding Bond (Tax Revenue) | | | 5.00 | | | | 8-1-2021 | | | | 3,170,000 | | | | 3,535,089 | |
Fairfield CA RDA Successor Agency to Tax Allocation Refunding Bond (Tax Revenue) | | | 5.00 | | | | 8-1-2022 | | | | 2,395,000 | | | | 2,739,353 | |
Fairfield CA RDA Successor Agency to Tax Allocation Refunding Bond (Tax Revenue) | | | 5.00 | | | | 8-1-2023 | | | | 1,025,000 | | | | 1,200,091 | |
Florin CA Resource Conservation District Series A (Water & Sewer Revenue, National Insured) | | | 5.00 | | | | 9-1-2019 | | | | 1,000,000 | | | | 1,053,630 | |
Florin CA Resource Conservation District Series A (Water & Sewer Revenue, National Insured) | | | 5.00 | | | | 9-1-2020 | | | | 1,000,000 | | | | 1,087,390 | |
Florin CA Resource Conservation District Series A (Water & Sewer Revenue, National Insured) | | | 5.00 | | | | 9-1-2021 | | | | 1,250,000 | | | | 1,393,900 | |
Florin CA Resource Conservation District Series A (Water & Sewer Revenue, National Insured) | | | 5.00 | | | | 9-1-2022 | | | | 1,250,000 | | | | 1,428,038 | |
Fowler CA Unified School District School Facilities Improvement District #1 (GO Revenue, National Insured) | | | 5.20 | | | | 7-1-2020 | | | | 865,000 | | | | 892,697 | |
Fremont CA Community Facilities District (Tax Revenue) | | | 5.00 | | | | 9-1-2024 | | | | 1,000,000 | | | | 1,157,810 | |
Fresno County CA Financing Authority Lease Series A (Miscellaneous Revenue, AGM Insured) | | | 3.00 | | | | 8-1-2019 | | | | 970,000 | | | | 993,057 | |
Fresno County CA Joint Powers Financing Authority Refunding Bond Master Lease Project Series A (Miscellaneous Revenue, AGM Insured) | | | 5.00 | | | | 4-1-2025 | | | | 750,000 | | | | 895,995 | |
Fullerton CA Community Facilities District (Tax Revenue) | | | 4.00 | | | | 9-1-2018 | | | | 610,000 | | | | 619,699 | |
Fullerton CA Community Facilities District (Tax Revenue) | | | 4.00 | | | | 9-1-2019 | | | | 665,000 | | | | 689,824 | |
Fullerton CA School District Financing Authority Series A (Tax Revenue, AGM Insured) | | | 4.00 | | | | 9-1-2018 | | | | 400,000 | | | | 406,600 | |
Garden Grove CA Agency Community Refunding Bond Garden Grove Community Project (Tax Revenue, Build America Mutual Assurance Company Insured) | | | 4.00 | | | | 10-1-2021 | | | | 770,000 | | | | 832,509 | |
Garden Grove CA Agency Community Refunding Bond Garden Grove Community Project (Tax Revenue, Build America Mutual Assurance Company Insured) | | | 5.00 | | | | 10-1-2022 | | | | 3,015,000 | | | | 3,448,828 | |
Golden CA Tobacco Securitization Asset Series A1 (Tobacco Revenue) | | | 5.00 | | | | 6-1-2026 | | | | 2,500,000 | | | | 2,930,000 | |
Goleta CA Water District Certificate of Participation Series A (Water & Sewer Revenue, AGM Insured) | | | 5.00 | | | | 12-1-2019 | | | | 125,000 | | | | 132,771 | |
Goleta CA Water District Certificate of Participation Series A (Water & Sewer Revenue, AGM Insured) | | | 5.00 | | | | 12-1-2020 | | | | 140,000 | | | | 153,108 | |
Hayward CA Unified School District Certificate of Participation (Miscellaneous Revenue, AGM Insured) | | | 3.00 | | | | 6-1-2018 | | | | 725,000 | | | | 729,669 | |
Hayward CA Unified School District Certificate of Participation (Miscellaneous Revenue, AGM Insured) | | | 3.00 | | | | 6-1-2019 | | | | 750,000 | | | | 764,588 | |
Hayward CA Unified School District Certificate of Participation (GO Revenue, AGM Insured) | | | 5.00 | | | | 8-1-2022 | | | | 500,000 | | | | 575,460 | |
Hayward CA Unified School District Certificate of Participation (GO Revenue, AGM Insured) | | | 5.00 | | | | 8-1-2023 | | | | 805,000 | | | | 949,071 | |
The accompanying notes are an integral part of these financial statements.
| | | | | | |
| Portfolio of investments—December 31, 2017 (unaudited) | | Wells Fargo California Limited-Term Tax-Free Fund | | | 13 | |
| | | | | | | | | | | | | | | | |
| Security name | | Interest rate | | | Maturity date | | | Principal | | | Value | |
|
| California (continued) | |
Huntington Beach CA City School District Election of 2002 (GO Revenue) | | | 4.00 | % | | | 8-1-2021 | | | $ | 505,000 | | | $ | 547,526 | |
Imperial Beach CA RDA Palm Avenue Commercial Redevelopment Project (Tax Revenue, Build America Mutual Assurance Company Insured) | | | 4.00 | | | | 6-1-2020 | | | | 775,000 | | | | 818,431 | |
Inglewood CA Redevelopment Refunding Bond Subordinate Lien Merged Redevelopment Project (Tax Revenue, Build America Mutual Assurance Company Insured) | | | 5.00 | | | | 5-1-2025 | | | | 1,000,000 | | | | 1,198,990 | |
Irvine CA Limited Obligation Improvement Bonds Reassessment District #12-1 (Miscellaneous Revenue) | | | 4.00 | | | | 9-2-2018 | | | | 1,325,000 | | | | 1,347,578 | |
Irvine CA Limited Obligation Improvement Bonds Reassessment District #15-2 (Miscellaneous Revenue) | | | 5.00 | | | | 9-2-2023 | | | | 800,000 | | | | 918,648 | |
Irvine CA Limited Obligation Improvement Bonds Reassessment District #15-2 (Miscellaneous Revenue) | | | 5.00 | | | | 9-2-2024 | | | | 850,000 | | | | 988,737 | |
Irvine CA Unified School District Special Community Facilities District #09-1 Series A (Tax Revenue) | | | 5.00 | | | | 9-1-2024 | | | | 1,500,000 | | | | 1,754,820 | |
Irvine CA Unified School District Special Community Facilities District #09-1 Series A (Tax Revenue) | | | 5.00 | | | | 9-1-2026 | | | | 1,300,000 | | | | 1,550,497 | |
Irvine CA Unified School District Special Community Facilities District #09-1 Series A (Tax Revenue) | | | 5.00 | | | | 9-1-2028 | | | | 540,000 | | | | 637,427 | |
Irwindale CA CDA City Industrial Development Project (Tax Revenue, AGM Insured) | | | 5.00 | | | | 7-15-2020 | | | | 320,000 | | | | 346,822 | |
Irwindale CA CDA City Industrial Development Project (Tax Revenue, AGM Insured) | | | 5.00 | | | | 7-15-2021 | | | | 340,000 | | | | 378,937 | |
Irwindale CA CDA City Industrial Development Project (Tax Revenue, AGM Insured) | | | 5.00 | | | | 7-15-2022 | | | | 365,000 | | | | 417,166 | |
Irwindale CA CDA City Industrial Development Project (Tax Revenue, AGM Insured) | | | 5.00 | | | | 7-15-2023 | | | | 375,000 | | | | 439,223 | |
Jurupa CA PFA Series A (Tax Revenue) | | | 5.00 | | | | 9-1-2020 | | | | 550,000 | | | | 597,163 | |
La Habra CA School District Refunding Bond (GO Revenue) | | | 5.00 | | | | 8-1-2019 | | | | 950,000 | | | | 1,001,034 | |
La Habra CA School District Refunding Bond (GO Revenue) | | | 5.00 | | | | 8-1-2020 | | | | 1,045,000 | | | | 1,135,466 | |
La Habra CA School District Refunding Bond (GO Revenue) | | | 5.00 | | | | 8-1-2021 | | | | 805,000 | | | | 899,499 | |
La Quinta CA RDA Project Areas #1 & 2 Series A (Tax Revenue) | | | 5.00 | | | | 9-1-2019 | | | | 1,150,000 | | | | 1,215,573 | |
La Quinta CA RDA Project Areas #1 & 2 Series A (Tax Revenue) | | | 5.00 | | | | 9-1-2020 | | | | 1,045,000 | | | | 1,139,186 | |
La Quinta CA RDA Project Areas #1 & 2 Series A (Tax Revenue) | | | 5.00 | | | | 9-1-2021 | | | | 565,000 | | | | 633,032 | |
La Quinta CA RDA Project Areas #1 & 2 Series A (Tax Revenue) | | | 5.00 | | | | 9-1-2022 | | | | 615,000 | | | | 706,457 | |
Lancaster CA RDA Refunding Bond Combined Redevelopment Project Areas (Tax Revenue, AGM Insured) | | | 5.00 | | | | 8-1-2024 | | | | 870,000 | | | | 1,037,788 | |
Lancaster CA RDA Refunding Bond Combined Redevelopment Project Areas (Tax Revenue, AGM Insured) | | | 5.00 | | | | 8-1-2029 | | | | 400,000 | | | | 485,716 | |
Los Angeles CA Convention & Exhibit Center Authority Series A (Miscellaneous Revenue) | | | 5.00 | | | | 8-15-2020 | | | | 2,000,000 | | | | 2,045,020 | |
Los Angeles CA Department of Airports AMT Subordinate Series A (Airport Revenue) | | | 5.00 | | | | 5-15-2027 | | | | 375,000 | | | | 454,939 | |
Los Angeles CA Public Works Series D (Miscellaneous Revenue) | | | 5.00 | | | | 12-1-2027 | | | | 1,605,000 | | | | 1,954,360 | |
Los Angeles CA Unified School District Certificate of Participation Headquarters Building Projects Series B (Miscellaneous Revenue) | | | 5.00 | | | | 10-1-2025 | | | | 1,875,000 | | | | 2,148,469 | |
Los Angeles CA Unified School District Refunding Bond Series D (GO Revenue) | | | 5.00 | | | | 7-1-2023 | | | | 6,180,000 | | | | 7,263,230 | |
Los Angeles California Department of Water & Power Revenue Various Power System Subordinate Series A3 (Utilities Revenue, Bank of America NA SPA) ø | | | 1.75 | | | | 7-1-2035 | | | | 3,000,000 | | | | 3,000,000 | |
Los Angeles County CA Community Facilities District #5 Rowland Heights Area (Tax Revenue, AGM Insured) | | | 5.00 | | | | 9-1-2019 | | | | 325,000 | | | | 326,680 | |
Los Angeles County CA Public Works Multiple Capital Projects II (Miscellaneous Revenue) | | | 5.00 | | | | 8-1-2020 | | | | 500,000 | | | | 543,815 | |
Los Angeles County CA Redevelopment Refunding Bond Authority Hollywood Redevelopment Project (Tax Revenue) | | | 5.00 | | | | 7-1-2019 | | | | 1,780,000 | | | | 1,872,809 | |
Los Angeles County CA Redevelopment Refunding Bond Authority Series D (Tax Revenue) | | | 5.00 | | | | 9-1-2018 | | | | 2,570,000 | | | | 2,629,598 | |
The accompanying notes are an integral part of these financial statements.
| | | | |
| 14 | | Wells Fargo California Limited-Term Tax-Free Fund | | Portfolio of investments—December 31, 2017 (unaudited) |
| | | | | | | | | | | | | | | | |
| Security name | | Interest rate | | | Maturity date | | | Principal | | | Value | |
|
| California (continued) | |
Los Angeles County CA Redevelopment Refunding Bond Authority Series D (Tax Revenue) | | | 5.00 | % | | | 9-1-2019 | | | $ | 2,545,000 | | | $ | 2,685,357 | |
Mendocino County CA Certificate of Participation Series A (Miscellaneous Revenue, AGM Insured) | | | 3.25 | | | | 6-1-2018 | | | | 1,115,000 | | | | 1,123,229 | |
Menifee CA Union School District Public Series A (Tax Revenue) | | | 4.00 | | | | 9-1-2022 | | | | 540,000 | | | | 582,077 | |
Merced CA Union High School CAB Series A (GO Revenue, National Insured) ¤ | | | 0.00 | | | | 8-1-2019 | | | | 2,190,000 | | | | 2,130,279 | |
Modesto CA Community Facilities District #2004-1 Village One #2 (Tax Revenue) | | | 4.00 | | | | 9-1-2018 | | | | 595,000 | | | | 604,223 | |
Modesto CA Community Facilities District #2004-1 Village One #2 (Tax Revenue) | | | 4.50 | | | | 9-1-2019 | | | | 605,000 | | | | 629,073 | |
Modesto CA Irrigation District Electric Refunding Bond Series A (Utilities Revenue) | | | 5.00 | | | | 7-1-2020 | | | | 500,000 | | | | 541,025 | |
Monrovia CA RDA Subordinate Central Project #1 (Tax Revenue) | | | 4.00 | | | | 8-1-2018 | | | | 785,000 | | | | 794,828 | |
Monrovia CA RDA Subordinate Central Project #1 (Tax Revenue) | | | 4.00 | | | | 8-1-2019 | | | | 815,000 | | | | 837,486 | |
Mount Sanitary Antonio CA Community CAB College District (GO Revenue) ¤ | | | 0.00 | | | | 4-1-2022 | | | | 10,000,000 | | | | 9,197,700 | |
Natomas CA Unified School District (GO Revenue, AGM Insured) | | | 3.00 | | | | 9-1-2018 | | | | 1,025,000 | | | | 1,035,476 | |
Natomas CA Unified School District (GO Revenue, AGM Insured) | | | 3.00 | | | | 9-1-2019 | | | | 1,000,000 | | | | 1,022,510 | |
North City CA West School Facilities Financing Authority Series C (Tax Revenue, Ambac Insured) | | | 5.00 | | | | 9-1-2018 | | | | 1,125,000 | | | | 1,150,931 | |
Norwalk CA Community Facilities Financing Series A (Miscellaneous Revenue, AGM Insured) | | | 4.00 | | | | 6-1-2019 | | | | 280,000 | | | | 289,934 | |
Norwalk CA Community Facilities Financing Series A (Miscellaneous Revenue, AGM Insured) | | | 4.00 | | | | 6-1-2020 | | | �� | 350,000 | | | | 369,614 | |
Norwalk CA Community Facilities Financing Series B (Miscellaneous Revenue, AGM Insured) | | | 4.00 | | | | 6-1-2018 | | | | 610,000 | | | | 616,698 | |
Norwalk CA Community Facilities Financing Series B (Miscellaneous Revenue, AGM Insured) | | | 4.00 | | | | 6-1-2019 | | | | 625,000 | | | | 647,175 | |
Norwalk CA Community Facilities Financing Series B (Miscellaneous Revenue, AGM Insured) | | | 4.00 | | | | 6-1-2020 | | | | 650,000 | | | | 686,426 | |
Oak Valley CA Hospital District Refunding Bond Los Angeles County CA Redevelopment Refunding Authority (GO Revenue) | | | 4.00 | | | | 7-1-2020 | | | | 500,000 | | | | 526,000 | |
Oak Valley CA Hospital District Refunding Bond Los Angeles County CA Redevelopment Refunding Authority (GO Revenue) | | | 5.00 | | | | 7-1-2021 | | | | 950,000 | | | | 1,048,838 | |
Oak Valley CA Hospital District Refunding Bond Los Angeles County CA Redevelopment Refunding Authority (GO Revenue) | | | 5.00 | | | | 7-1-2022 | | | | 750,000 | | | | 847,778 | |
Oak Valley CA Hospital District Refunding Bond Los Angeles County CA Redevelopment Refunding Authority (GO Revenue) | | | 5.00 | | | | 7-1-2023 | | | | 755,000 | | | | 873,460 | |
Oakland CA Successor Agency to Central District Redevelopment Project Refunding Bond Subordinate Lien (Tax Revenue) | | | 4.00 | | | | 9-1-2018 | | | | 3,215,000 | | | | 3,269,334 | |
Oakland CA Unified School District Alameda County Election of 2012 Series A (GO Revenue) | | | 5.00 | | | | 8-1-2022 | | | | 750,000 | | | | 860,333 | |
Oakland CA Unified School District Alameda County Election of 2012 Series A (GO Revenue) | | | 5.00 | | | | 8-1-2024 | | | | 600,000 | | | | 719,418 | |
Orange County CA Community Facilities #2015-1 Esencia Village Series A (Tax Revenue) | | | 5.00 | | | | 8-15-2023 | | | | 375,000 | | | | 428,693 | |
Orange County CA Community Facilities #2015-1 Esencia Village Series A (Tax Revenue) | | | 5.00 | | | | 8-15-2025 | | | | 335,000 | | | | 391,987 | |
Orange County CA Development Agency Santa Ana Heights Project (Tax Revenue) | | | 5.00 | | | | 9-1-2018 | | | | 200,000 | | | | 204,426 | |
Orange County CA Development Agency Santa Ana Heights Project (Tax Revenue) | | | 5.00 | | | | 9-1-2019 | | | | 1,085,000 | | | | 1,137,384 | |
Orange County CA Development Agency Santa Ana Heights Project (Tax Revenue) | | | 5.00 | | | | 3-1-2020 | | | | 1,110,000 | | | | 1,178,654 | |
Orange County CA Development Agency Santa Ana Heights Project (Tax Revenue) | | | 5.00 | | | | 9-1-2020 | | | | 1,140,000 | | | | 1,223,015 | |
Orange Cove CA Irrigation District (Water & Sewer Revenue) | | | 3.15 | | | | 2-1-2019 | | | | 330,000 | | | | 330,446 | |
Oxnard CA Financing Authority Refunding Bond (Water & Sewer Revenue, AGM Insured) | | | 5.00 | | | | 6-1-2021 | | | | 735,000 | | | | 816,335 | |
The accompanying notes are an integral part of these financial statements.
| | | | | | |
| Portfolio of investments—December 31, 2017 (unaudited) | | Wells Fargo California Limited-Term Tax-Free Fund | | | 15 | |
| | | | | | | | | | | | | | | | |
| Security name | | Interest rate | | | Maturity date | | | Principal | | | Value | |
|
| California (continued) | |
Oxnard CA Harbor District Series A (Airport Revenue) | | | 5.00 | % | | | 8-1-2018 | | | $ | 2,275,000 | | | $ | 2,318,748 | |
Palo Alto CA Improvement Bond Act of 1915 University Area Off-Street Parking Assessment District (Miscellaneous Revenue) | | | 3.00 | | | | 9-2-2018 | | | | 415,000 | | | | 418,735 | |
Palo Alto CA Improvement Bond Act of 1915 University Area Off-Street Parking Assessment District (Miscellaneous Revenue) | | | 4.00 | | | | 9-2-2021 | | | | 450,000 | | | | 482,954 | |
Palo Verde CA Unified School District FlexFund Program (Education Revenue) | | | 4.80 | | | | 9-1-2027 | | | | 661,538 | | | | 665,163 | |
Palomar Health CA Certificate of Participation Health & Arch Health Partners Incorporated (Health Revenue) | | | 5.00 | | | | 11-1-2018 | | | | 335,000 | | | | 343,060 | |
Palomar Health CA Certificate of Participation Health & Arch Health Partners Incorporated (Health Revenue) | | | 5.00 | | | | 11-1-2019 | | | | 400,000 | | | | 419,576 | |
Palomar Health CA Certificate of Participation Health & Arch Health Partners Incorporated (Health Revenue) | | | 5.00 | | | | 11-1-2020 | | | | 250,000 | | | | 268,158 | |
Palomar Health CA Certificate of Participation Health & Arch Health Partners Incorporated (Health Revenue) | | | 5.00 | | | | 11-1-2021 | | | | 275,000 | | | | 300,781 | |
Palomar Health CA Certificate of Participation Health & Arch Health Partners Incorporated (Health Revenue) | | | 5.00 | | | | 11-1-2022 | | | | 375,000 | | | | 417,375 | |
Palomar Health CA Certificate of Participation Health & Arch Health Partners Incorporated (Health Revenue) | | | 5.00 | | | | 11-1-2023 | | | | 300,000 | | | | 338,865 | |
Palomar Health CA Certificate of Participation Health & Arch Health Partners Incorporated (Health Revenue) | | | 5.00 | | | | 11-1-2024 | | | | 300,000 | | | | 342,549 | |
Palomar Health CA Certificate of Participation Health & Arch Health Partners Incorporated (Health Revenue) | | | 5.00 | | | | 11-1-2025 | | | | 330,000 | | | | 380,454 | |
Pittsburg CA Successor Agency to Los Medanos Community Development (Tax Revenue, AGM Insured) | | | 5.00 | | | | 8-1-2021 | | | | 1,885,000 | | | | 2,099,325 | |
Pittsburg CA Successor Agency to Los Medanos Community Development (Tax Revenue, AGM Insured) | | | 5.00 | | | | 9-1-2021 | | | | 2,000,000 | | | | 2,227,980 | |
Pittsburg CA Successor Agency to Los Medanos Community Development (Tax Revenue, AGM Insured) | | | 5.00 | | | | 8-1-2022 | | | | 1,305,000 | | | | 1,488,927 | |
Pittsburg CA Successor Agency to Los Medanos Community Development (Tax Revenue, AGM Insured) | | | 5.00 | | | | 8-1-2023 | | | | 780,000 | | | | 909,636 | |
Pittsburg CA Successor Agency to Los Medanos Community Development (Tax Revenue, AGM Insured) | | | 5.00 | | | | 9-1-2025 | | | | 3,500,000 | | | | 4,198,285 | |
Placentia CA RDA Project (Tax Revenue, Build America Mutual Assurance Company Insured) | | | 4.00 | | | | 8-1-2019 | | | | 580,000 | | | | 602,800 | |
Placentia CA RDA Project (Tax Revenue, Build America Mutual Assurance Company Insured) | | | 5.00 | | | | 8-1-2020 | | | | 600,000 | | | | 650,040 | |
Pomona CA PFA Unrefunded Bond Balance Redevelopment Series AH (Tax Revenue, Ambac Insured) | | | 5.25 | | | | 2-1-2018 | | | | 725,000 | | | | 726,958 | |
Port Oakland CA Revenue Refunding Bond AMT Intermediate Lien Series D (Airport Revenue) | | | 5.00 | | | | 11-1-2026 | | | | 2,000,000 | | | | 2,439,860 | |
Poway CA Unified School District PFA (Tax Revenue) | | | 3.00 | | | | 9-15-2018 | | | | 755,000 | | | | 760,995 | |
Poway CA Unified School District PFA (Tax Revenue) | | | 4.00 | | | | 9-15-2020 | | | | 335,000 | | | | 350,983 | |
Poway CA Unified School District PFA (Tax Revenue, Build America Mutual Assurance Company Insured) | | | 4.00 | | | | 10-1-2020 | | | | 300,000 | | | | 318,501 | |
Poway CA Unified School District PFA (Tax Revenue, Build America Mutual Assurance Company Insured) | | | 4.00 | | | | 10-1-2021 | | | | 185,000 | | | | 199,880 | |
Poway CA Unified School District PFA Series B (Tax Revenue, Build America Mutual Assurance Company Insured) | | | 5.00 | | | | 9-1-2024 | | | | 1,115,000 | | | | 1,320,316 | |
Poway CA Unified School District PFA Series B (Tax Revenue, Build America Mutual Assurance Company Insured) | | | 5.00 | | | | 9-1-2025 | | | | 775,000 | | | | 929,620 | |
Poway CA Unified School District Special Community Facilities District #6-4S Ranch (Tax Revenue) | | | 4.00 | | | | 9-1-2018 | | | | 445,000 | | | | 452,374 | |
The accompanying notes are an integral part of these financial statements.
| | | | |
| 16 | | Wells Fargo California Limited-Term Tax-Free Fund | | Portfolio of investments—December 31, 2017 (unaudited) |
| | | | | | | | | | | | | | | | |
| Security name | | Interest rate | | | Maturity date | | | Principal | | | Value | |
|
| California (continued) | |
Redondo Beach CA Unified School District CAB Election of 2008 Series E (GO Revenue) ¤ | | | 0.00 | % | | | 8-1-2018 | | | $ | 345,000 | | | $ | 342,230 | |
Redondo Beach CA Unified School District CAB Election of 2008 Series E (GO Revenue) ¤ | | | 0.00 | | | | 8-1-2020 | | | | 460,000 | | | | 438,785 | |
Riverside CA Community College District Election of 2004 Series D (GO Revenue) ¤ | | | 0.00 | | | | 8-1-2020 | | | | 535,000 | | | | 510,979 | |
Riverside CA PFA Local Measure Certificate of Participation Riverside Pavement Rehabilitation Project (Tax Revenue, AGM Insured) | | | 5.00 | | | | 6-1-2023 | | | | 845,000 | | | | 984,755 | |
Riverside CA Unified School District Financing Authority Superior Lien Series A (Miscellaneous Revenue) | | | 4.00 | | | | 9-1-2018 | | | | 1,735,000 | | | | 1,761,893 | |
Riverside County CA Asset Leasing Corporation Riverside Hospital Project (Miscellaneous Revenue, National Insured) ¤ | | | 0.00 | | | | 6-1-2019 | | | | 1,000,000 | | | | 974,620 | |
Riverside County CA PFA Indian Wells Project Series A (Tax Revenue, AGM Insured) | | | 5.00 | | | | 9-1-2020 | | | | 1,610,000 | | | | 1,748,508 | |
Riverside County CA Public Financing County Facilities Projects (Miscellaneous Revenue) | | | 4.00 | | | | 5-1-2018 | | | | 810,000 | | | | 816,901 | |
Riverside County CA Public Financing County Facilities Projects (Miscellaneous Revenue) | | | 4.00 | | | | 5-1-2020 | | | | 795,000 | | | | 836,920 | |
Riverside County CA Public Financing County Facilities Projects (Miscellaneous Revenue) | | | 5.00 | | | | 5-1-2019 | | | | 840,000 | | | | 878,380 | |
Riverside County CA Public Financing Series A (Tax Revenue, Build America Mutual Assurance Company Insured) | | | 5.00 | | | | 10-1-2024 | | | | 400,000 | | | | 475,348 | |
Robla CA School District Series B (GO Revenue, National Insured) ¤ | | | 0.00 | | | | 8-1-2018 | | | | 80,000 | | | | 78,286 | |
Romoland CA School District Community Facilities District #2004-1 (Tax Revenue) | | | 4.00 | | | | 9-1-2019 | | | | 850,000 | | | | 879,172 | |
Roseville CA Finance Authority Special Refunding Bond Series A (Tax Revenue) | | | 5.00 | | | | 9-1-2023 | | | | 400,000 | | | | 458,380 | |
Roseville CA Finance Authority Special Refunding Bond Series A (Tax Revenue) | | | 5.00 | | | | 9-1-2024 | | | | 400,000 | | | | 464,992 | |
Roseville CA Finance Authority Special Refunding Bond Series A (Tax Revenue) | | | 5.00 | | | | 9-1-2025 | | | | 400,000 | | | | 471,760 | |
Roseville CA Finance Authority Special Refunding Bond Series A (Tax Revenue) | | | 5.00 | | | | 9-1-2026 | | | | 500,000 | | | | 596,785 | |
Roseville CA Finance Authority Special Refunding Bond Series A (Tax Revenue) | | | 5.00 | | | | 9-1-2027 | | | | 350,000 | | | | 422,342 | |
Roseville CA Finance Authority Special Refunding Bond Series A (Tax Revenue) | | | 5.00 | | | | 9-1-2028 | | | | 305,000 | | | | 366,881 | |
Roseville CA Finance Authority Special Refunding Bond Series A (Tax Revenue) | | | 5.00 | | | | 9-1-2029 | | | | 300,000 | | | | 356,076 | |
Roseville CA Special Tax Refunding Bond Community Facilities District (Tax Revenue) | | | 4.00 | | | | 9-1-2019 | | | | 875,000 | | | | 905,616 | |
Roseville CA Special Tax Refunding Bond Community Facilities District (Tax Revenue) | | | 5.00 | | | | 9-1-2020 | | | | 1,050,000 | | | | 1,133,769 | |
Roseville CA Special Tax Refunding Bond Community Facilities District (Tax Revenue) | | | 5.00 | | | | 9-1-2021 | | | | 500,000 | | | | 552,130 | |
Roseville CA Special Tax Refunding Bond Fiddyment Ranch Community (Tax Revenue) | | | 5.00 | | | | 9-1-2024 | | | | 1,905,000 | | | | 2,196,770 | |
Roseville CA Special Tax Refunding Bond Fiddyment Ranch Community (Tax Revenue) | | | 5.00 | | | | 9-1-2029 | | | | 1,595,000 | | | | 1,865,145 | |
Sacramento CA City Financing Refunding Bond Master Lease Program Facilities (Miscellaneous Revenue, Build America Mutual Assurance Company Insured) | | | 5.00 | | | | 12-1-2022 | | | | 800,000 | | | | 918,584 | |
Sacramento CA City Schools Joint Powers Financing Authority Series A (Miscellaneous Revenue, Build America Mutual Assurance Company Insured) | | | 5.00 | | | | 3-1-2019 | | | | 1,050,000 | | | | 1,092,746 | |
Sacramento CA City Schools Joint Powers Financing Authority Series A (Miscellaneous Revenue, Build America Mutual Assurance Company Insured) | | | 5.00 | | | | 3-1-2020 | | | | 1,185,000 | | | | 1,269,431 | |
Sacramento CA City Schools Joint Powers Financing Authority Series A (Miscellaneous Revenue, Build America Mutual Assurance Company Insured) | | | 5.00 | | | | 3-1-2021 | | | | 830,000 | | | | 914,204 | |
Sacramento CA City Schools Joint Powers Financing Authority Series A (Miscellaneous Revenue, Build America Mutual Assurance Company Insured) | | | 5.00 | | | | 3-1-2022 | | | | 775,000 | | | | 875,308 | |
Sacramento CA City Schools Joint Powers Financing Authority Series A (Miscellaneous Revenue, Build America Mutual Assurance Company Insured) | | | 5.00 | | | | 3-1-2023 | | | | 815,000 | | | | 943,403 | |
Sacramento CA Regional Transportation District Farebox (Transportation Revenue) | | | 5.00 | | | | 3-1-2019 | | | | 500,000 | | | | 520,470 | |
Salinas CA Union High School District CAB (GO Revenue) ¤ | | | 0.00 | | | | 8-1-2020 | | | | 5,000,000 | | | | 4,767,600 | |
San Bernardino County CA Certificate of Participation Arrowhead Project Series A (Miscellaneous Revenue) | | | 5.50 | | | | 8-1-2020 | | | | 1,000,000 | | | | 1,059,800 | |
San Buenaventura CA Community Mental Health System (Health Revenue) | | | 6.00 | | | | 12-1-2019 | | | | 2,000,000 | | | | 2,125,540 | |
The accompanying notes are an integral part of these financial statements.
| | | | | | |
| Portfolio of investments—December 31, 2017 (unaudited) | | Wells Fargo California Limited-Term Tax-Free Fund | | | 17 | |
| | | | | | | | | | | | | | | | |
| Security name | | Interest rate | | | Maturity date | | | Principal | | | Value | |
|
| California (continued) | |
San Buenaventura CA Community Mental Health System (Health Revenue) | | | 6.50 | % | | | 12-1-2021 | | | $ | 2,585,000 | | | $ | 2,952,354 | |
San Diego CA Association Goverments First Senior Lien Series A (Transportation Revenue) | | | 5.00 | | | | 7-1-2026 | | | | 750,000 | | | | 922,335 | |
San Diego CA Association Goverments First Senior Lien Series A (Transportation Revenue) | | | 5.00 | | | | 7-1-2027 | | | | 1,150,000 | | | | 1,432,360 | |
San Diego CA Association Goverments First Senior Lien Series A (Transportation Revenue) | | | 5.00 | | | | 7-1-2028 | | | | 600,000 | | | | 742,662 | |
San Diego CA RDA CAB Tax Allocation Center Series A (Tax Revenue, AGM Insured) ¤ | | | 0.00 | | | | 9-1-2018 | | | | 635,000 | | | | 628,383 | |
San Diego County CA Regional Airport AMT Subordinate Series B (Airport Revenue) | | | 5.00 | | | | 7-1-2025 | | | | 500,000 | | | | 597,005 | |
San Diego County CA Regional Airport AMT Subordinate Series B (Airport Revenue) | | | 5.00 | | | | 7-1-2026 | | | | 400,000 | | | | 484,620 | |
San Diego County CA Regional Airport AMT Subordinate Series B (Airport Revenue) | | | 5.00 | | | | 7-1-2027 | | | | 500,000 | | | | 612,165 | |
San Francisco CA City & County Refunding Bond Second Series Series D (Airport Revenue) | | | 5.00 | | | | 5-1-2025 | | | | 4,000,000 | | | | 4,801,960 | |
San Francisco CA City & County Refunding Bond Second Series Series D (Airport Revenue) | | | 5.00 | | | | 5-1-2026 | | | | 2,000,000 | | | | 2,440,960 | |
San Francisco CA City & County Refunding Bond Second Series Series D (Airport Revenue) | | | 5.00 | | | | 5-1-2027 | | | | 1,000,000 | | | | 1,237,780 | |
San Francisco CA City & County Refunding Bond #6 Mission Bay South Public (Tax Revenue) | | | 5.00 | | | | 8-1-2025 | | | | 1,600,000 | | | | 1,801,488 | |
San Francisco CA City & County RDA Successor Agency to Community Facilities District #6 Series A (Tax Revenue) | | | 5.00 | | | | 8-1-2018 | | | | 500,000 | | | | 509,525 | |
San Francisco CA City & County RDA Successor Agency to Community Facilities District #6 Series A (Tax Revenue) | | | 5.00 | | | | 8-1-2019 | | | | 555,000 | | | | 581,346 | |
San Francisco CA City & County RDFA Mission Bay South Redevelopment Project Subordinate Series D (Tax Revenue) 144A | | | 3.00 | | | | 8-1-2021 | | | | 4,000,000 | | | | 4,009,400 | |
San Francisco CA City & County RDFA Mission Bay South Redevelopment Series A (Tax Revenue) | | | 5.00 | | | | 8-1-2020 | | | | 500,000 | | | | 541,040 | |
San Francisco CA City & County RDFA Mission Bay South Redevelopment Series A (Tax Revenue) | | | 5.00 | | | | 8-1-2022 | | | | 375,000 | | | | 426,263 | |
San Francisco CA City & County RDFA San Francisco Redevelopment Project Series B (Tax Revenue, National Insured) | | | 5.25 | | | | 8-1-2018 | | | | 1,155,000 | | | | 1,156,351 | |
San Gorgonio CA Memorial Healthcare Refunding Bond (GO Revenue) | | | 5.00 | | | | 8-1-2021 | | | | 275,000 | | | | 303,344 | |
San Gorgonio CA Memorial Healthcare Refunding Bond (GO Revenue) | | | 5.00 | | | | 8-1-2022 | | | | 500,000 | | | | 564,130 | |
San Gorgonio CA Memorial Healthcare Refunding Bond (GO Revenue) | | | 5.00 | | | | 8-1-2023 | | | | 1,000,000 | | | | 1,151,870 | |
San Jose CA Airport Revenue Refunding Bond AMT Series A (Airport Revenue) | | | 5.00 | | | | 3-1-2022 | | | | 1,750,000 | | | | 1,966,773 | |
San Jose CA Airport Series A (Airport Revenue, Ambac Insured) | | | 5.50 | | | | 3-1-2018 | | | | 4,350,000 | | | | 4,378,058 | |
San Jose CA Convention Center Expansion & Renovation Project (Tax Revenue) | | | 5.25 | | | | 5-1-2023 | | | | 1,465,000 | | | | 1,621,491 | |
San Jose CA RDA Refunding Bond Subordinate Series B (Tax Revenue) | | | 5.00 | | | | 8-1-2027 | | | | 2,000,000 | | | | 2,518,600 | |
San Jose CA RDA Tax Refunding Bond Merged Area Redevelopment Project Series A (Tax Revenue, National Insured) | | | 4.54 | | | | 8-1-2018 | | | | 1,035,000 | | | | 1,035,466 | |
San Jose CA RDA Tax Refunding Bond Merged Area Redevelopment Project Series A (Tax Revenue, National Insured) | | | 5.25 | | | | 8-1-2019 | | | | 1,125,000 | | | | 1,125,608 | |
San Jose CA RDA Tax Refunding Bond Merged Area Redevelopment Project Series A-1 (Tax Revenue) | | | 5.00 | | | | 8-1-2022 | | | | 800,000 | | | | 868,272 | |
San Jose CA RDA Tax Refunding Bond Merged Area Redevelopment Project Series D (Tax Revenue, Ambac Insured) | | | 5.00 | | | | 8-1-2021 | | | | 2,635,000 | | | | 2,636,238 | |
San Leandro CA Unified School District Refunding Bond (GO Revenue, Build America Mutual Assurance Company Insured) | | | 5.00 | | | | 8-1-2025 | | | | 325,000 | | | | 396,045 | |
San Luis & Delta-Mendota CA Water Authority Delta Habitat Conservation & Conveyance Program Development Project Series A (Water & Sewer Revenue, Build America Mutual Assurance Company Insured) | | | 5.00 | | | | 3-1-2019 | | | | 100,000 | | | | 104,142 | |
The accompanying notes are an integral part of these financial statements.
| | | | |
| 18 | | Wells Fargo California Limited-Term Tax-Free Fund | | Portfolio of investments—December 31, 2017 (unaudited) |
| | | | | | | | | | | | | | | | |
| Security name | | Interest rate | | | Maturity date | | | Principal | | | Value | |
|
| California (continued) | |
San Luis & Delta-Mendota CA Water Authority Delta Habitat Conservation & Conveyance Program Development Project Series A (Water & Sewer Revenue, Build America Mutual Assurance Company Insured) | | | 5.00 | % | | | 3-1-2020 | | | $ | 100,000 | | | $ | 107,214 | |
San Marcos CA PFA Series B (Tax Revenue) | | | 4.00 | | | | 9-1-2018 | | | | 1,000,000 | | | | 1,015,900 | |
San Marcos CA Unified School District Community Facilities District #5 (Tax Revenue, Build America Mutual Assurance Company Insured) | | | 5.00 | | | | 9-1-2020 | | | | 220,000 | | | | 238,865 | |
San Marcos CA Unified School District Community Facilities District #5 (Tax Revenue, Build America Mutual Assurance Company Insured) | | | 5.00 | | | | 9-1-2021 | | | | 270,000 | | | | 300,983 | |
San Marcos CA Unified School District Community Facilities District #5 (Tax Revenue, Build America Mutual Assurance Company Insured) | | | 5.00 | | | | 9-1-2022 | | | | 250,000 | | | | 285,488 | |
San Mateo County CA Transportation Authority Series A (Tax Revenue, National Insured) ¤ | | | 0.00 | | | | 12-1-2018 | | | | 270,000 | | | | 265,723 | |
San Mateo Foster City CA School District (GO Revenue) | | | 5.00 | | | | 8-15-2020 | | | | 2,000,000 | | | | 2,178,380 | |
San Pablo CA RDA Series B (Tax Revenue, AGM Insured) | | | 5.00 | | | | 6-15-2021 | | | | 1,775,000 | | | | 1,968,564 | |
San Pablo CA RDA Series B (Tax Revenue, AGM Insured) | | | 5.00 | | | | 6-15-2022 | | | | 1,865,000 | | | | 2,118,248 | |
San Pablo CA RDA Series B (Tax Revenue, AGM Insured) | | | 5.00 | | | | 6-15-2023 | | | | 1,945,000 | | | | 2,257,931 | |
Santa Ana CA Community RDA Merged Project Area Series A (Tax Revenue) | | | 5.25 | | | | 9-1-2019 | | | | 1,000,000 | | | | 1,059,400 | |
Santa Ana CA Unified School District CAB Election of 2008 Series A (GO Revenue) ¤ | | | 0.00 | | | | 8-1-2020 | | | | 1,815,000 | | | | 1,723,796 | |
Santa Clara County CA Financing Authority Capital Projects Series A (Miscellaneous Revenue) | | | 4.00 | | | | 2-1-2024 | | | | 6,000,000 | | | | 6,524,100 | |
Santa Cruz County CA Capital Financing Public Facilities Project (Miscellaneous Revenue, AGM Insured) | | | 4.00 | | | | 8-1-2020 | | | | 150,000 | | | | 159,015 | |
Santa Cruz County CA Capital Financing Public Facilities Project (Miscellaneous Revenue, AGM Insured) | | | 5.00 | | | | 8-1-2021 | | | | 125,000 | | | | 139,443 | |
Santa Cruz County CA Capital Financing Public Facilities Project (Miscellaneous Revenue, AGM Insured) | | | 5.00 | | | | 8-1-2022 | | | | 165,000 | | | | 188,724 | |
Santa Cruz County CA Redevelopment Successor Agency to Tax Allocation Refunding Bond (Tax Revenue, Build America Mutual Assurance Company Insured) | | | 5.00 | | | | 9-1-2019 | | | | 625,000 | | | | 659,788 | |
Santa Cruz County CA Redevelopment Successor Agency to Tax Allocation Refunding Bond (Tax Revenue, Build America Mutual Assurance Company Insured) | | | 5.00 | | | | 9-1-2020 | | | | 1,000,000 | | | | 1,086,030 | |
Sierra Kings CA Health Care Refunding Bond (GO Revenue) | | | 4.00 | | | | 8-1-2018 | | | | 230,000 | | | | 233,441 | |
Sierra Kings CA Health Care Refunding Bond (GO Revenue) | | | 4.00 | | | | 8-1-2019 | | | | 225,000 | | | | 233,271 | |
Sierra Kings CA Health Care Refunding Bond (GO Revenue) | | | 4.00 | | | | 8-1-2021 | | | | 345,000 | | | | 369,816 | |
Sierra Kings CA Health Care Refunding Bond (GO Revenue) | | | 4.00 | | | | 8-1-2022 | | | | 425,000 | | | | 461,418 | |
Sierra Kings CA Health Care Refunding Bond (GO Revenue) | | | 4.00 | | | | 8-1-2023 | | | | 405,000 | | | | 445,075 | |
Sierra Kings CA Health Care Refunding Bond (GO Revenue) | | | 4.00 | | | | 8-1-2024 | | | | 420,000 | | | | 465,784 | |
Solana Beach CA School District Special Tax PFA (Tax Revenue) | | | 4.00 | | | | 9-1-2018 | | | | 330,000 | | | | 334,983 | |
Solana Beach CA School District Special Tax PFA (Tax Revenue) | | | 4.00 | | | | 9-1-2019 | | | | 735,000 | | | | 759,130 | |
Southern CA Mono Healthcare District (GO Revenue) | | | 4.00 | | | | 8-1-2019 | | | | 845,000 | | | | 874,854 | |
Southern California Public Power Authority Refunding Bond Canyon Power Project Series A (Utilities Revenue) | | | 5.00 | | | | 7-1-2026 | | | | 1,000,000 | | | | 1,112,580 | |
Southern California Public Power Authority Refunding Bond Canyon Power Project Series A (Utilities Revenue) | | | 5.00 | | | | 7-1-2027 | | | | 1,000,000 | | | | 1,112,220 | |
SouthWestern Community College District Refunding Bond (GO Revenue) | | | 5.00 | | | | 8-1-2020 | | | | 1,250,000 | | | | 1,358,875 | |
SouthWestern Community College District Refunding Bond (GO Revenue) | | | 5.00 | | | | 8-1-2021 | | | | 2,710,000 | | | | 3,029,130 | |
Stanton CA RDA Consolidated Project Series A (Tax Revenue, AGM Insured) | | | 4.00 | | | | 12-1-2018 | | | | 410,000 | | | | 419,762 | |
Successor Agency to the Morgan Hill CA RDA Series A (Tax Revenue) | | | 5.00 | | | | 9-1-2021 | | | | 1,055,000 | | | | 1,179,638 | |
Successor Agency to the Rancho Mirage CA RDA Refunding Bond Subordinate Lien Series A (Tax Revenue, Build America Mutual Assurance Company Insured) | | | 5.00 | | | | 4-1-2018 | | | | 400,000 | | | | 403,600 | |
The accompanying notes are an integral part of these financial statements.
| | | | | | |
| Portfolio of investments—December 31, 2017 (unaudited) | | Wells Fargo California Limited-Term Tax-Free Fund | | | 19 | |
| | | | | | | | | | | | | | | | |
| Security name | | Interest rate | | | Maturity date | | | Principal | | | Value | |
|
| California (continued) | |
Successor Agency to the Rancho Mirage CA RDA Refunding Bond Subordinate Lien Series A (Tax Revenue, Build America Mutual Assurance Company Insured) | | | 5.00 | % | | | 4-1-2019 | | | $ | 580,000 | | | $ | 605,584 | |
Successor Agency to the Rancho Mirage CA RDA Series A (Tax Revenue, Build America Mutual Assurance Company Insured) | | | 4.00 | | | | 4-1-2018 | | | | 750,000 | | | | 754,928 | |
Successor Agency to the Rancho Mirage CA RDA Series A (Tax Revenue, Build America Mutual Assurance Company Insured) | | | 5.00 | | | | 4-1-2018 | | | | 550,000 | | | | 554,950 | |
Successor Agency to the Rancho Mirage CA RDA Series A (Tax Revenue, Build America Mutual Assurance Company Insured) | | | 5.00 | | | | 4-1-2019 | | | | 1,450,000 | | | | 1,513,960 | |
Successor Agency to the Richmond CA Community RDA Series A (Tax Revenue, Build America Mutual Assurance Company Insured) | | | 4.50 | | | | 9-1-2025 | | | | 160,000 | | | | 182,256 | |
Successor Agency to the Richmond CA Community RDA Series A (Tax Revenue, Build America Mutual Assurance Company Insured) | | | 5.00 | | | | 9-1-2021 | | | | 310,000 | | | | 345,337 | |
Successor Agency to the Richmond CA Community RDA Series A (Tax Revenue, Build America Mutual Assurance Company Insured) | | | 5.00 | | | | 9-1-2022 | | | | 300,000 | | | | 342,009 | |
Successor Agency to the Richmond CA Community RDA Series A (Tax Revenue, Build America Mutual Assurance Company Insured) | | | 5.00 | | | | 9-1-2023 | | | | 265,000 | | | | 309,043 | |
Successor Agency to the Richmond CA Community RDA Series A (Tax Revenue, Build America Mutual Assurance Company Insured) | | | 5.00 | | | | 9-1-2025 | | | | 150,000 | | | | 175,482 | |
Successor Agency to the Riverside County CA RDA Desert Communities Project Area Series D (Tax Revenue) | | | 5.00 | | | | 10-1-2020 | | | | 405,000 | | | | 440,794 | |
Successor Agency to the Riverside County CA RDA Desert Communities Project Area Series D (Tax Revenue) | | | 5.00 | | | | 10-1-2022 | | | | 445,000 | | | | 509,249 | |
Successor Agency to the Riverside County CA RDA Desert Communities Project Area Series D (Tax Revenue) | | | 5.00 | | | | 10-1-2023 | | | | 470,000 | | | | 549,759 | |
Successor Agency to the Riverside County CA RDA Project Area #1 Series A (Tax Revenue) | | | 5.00 | | | | 10-1-2020 | | | | 365,000 | | | | 397,259 | |
Successor Agency to the Riverside County CA RDA Project Area #1 Series A (Tax Revenue) | | | 5.00 | | | | 10-1-2022 | | | | 240,000 | | | | 274,651 | |
Successor Agency to the Riverside County CA RDA Project Area #1 Series A (Tax Revenue) | | | 5.00 | | | | 10-1-2023 | | | | 460,000 | | | | 538,062 | |
Sulphur Springs CA Union School District Prerefunded Bond Community Facilities District #2002-1 Series A (Tax Revenue) | | | 3.00 | | | | 9-1-2018 | | | | 275,000 | | | | 277,827 | |
Sulphur Springs CA Union School District Prerefunded Bond Community Facilities District #2002-1 Series A (Tax Revenue) | | | 3.00 | | | | 9-1-2019 | | | | 295,000 | | | | 301,885 | |
Sulphur Springs CA Union School District Unrefunded Bond Community Facilities District #2002-1 Series A (Tax Revenue) | | | 3.00 | | | | 9-1-2018 | | | | 280,000 | | | | 282,713 | |
Sulphur Springs CA Union School District Unrefunded Bond Community Facilities District #2002-1 Series A (Tax Revenue) | | | 3.00 | | | | 9-1-2019 | | | | 300,000 | | | | 306,507 | |
Sutter Butte CA Flood Agency Assessment (Miscellaneous Revenue, Build America Mutual Assurance Company Insured) | | | 5.00 | | | | 10-1-2023 | | | | 1,280,000 | | | | 1,495,693 | |
Sutter Butte CA Flood Agency Assessment (Miscellaneous Revenue, Build America Mutual Assurance Company Insured) | | | 5.00 | | | | 10-1-2024 | | | | 715,000 | | | | 849,685 | |
Sutter Butte CA Flood Agency Assessment (Miscellaneous Revenue, Build America Mutual Assurance Company Insured) | | | 5.00 | | | | 10-1-2025 | | | | 1,575,000 | | | | 1,899,844 | |
Sweetwater CA Union High School District PFA Refunding Bond (Miscellaneous Revenue, Build America Mutual Assurance Company Insured) | | | 5.00 | | | | 9-1-2018 | | | | 2,500,000 | | | | 2,558,975 | |
Sweetwater CA Union High School District PFA Refunding Bond (Miscellaneous Revenue, Build America Mutual Assurance Company Insured) | | | 5.00 | | | | 9-1-2019 | | | | 1,000,000 | | | | 1,056,510 | |
Sweetwater CA Union High School District PFA Refunding Bond (GO Revenue, Build America Mutual Assurance Company Insured) | | | 5.00 | | | | 8-1-2021 | | | | 620,000 | | | | 692,323 | |
The accompanying notes are an integral part of these financial statements.
| | | | |
| 20 | | Wells Fargo California Limited-Term Tax-Free Fund | | Portfolio of investments—December 31, 2017 (unaudited) |
| | | | | | | | | | | | | | | | |
| Security name | | Interest rate | | | Maturity date | | | Principal | | | Value | |
|
| California (continued) | |
Temecula CA PFA Community Facilities District #3-1 (Tax Revenue) | | | 3.00 | % | | | 9-1-2018 | | | $ | 405,000 | | | $ | 408,823 | |
Temecula CA PFA Wolf Creek Community Facilities District #3-3 (Tax Revenue) | | | 3.00 | | | | 9-1-2018 | | | | 870,000 | | | | 877,795 | |
Torrance CA RDA Referendum Senior Lien Series C (Tax Revenue, National Insured) | | | 5.45 | | | | 9-1-2018 | | | | 295,000 | | | | 295,295 | |
Tustin CA Community Facilities District #6-1 Legacy Columbus Villages Series A (Tax Revenue) | | | 5.00 | | | | 9-1-2025 | | | | 1,000,000 | | | | 1,193,280 | |
Twin Rivers CA Unified School District Series A (GO Revenue, Build America Mutual Assurance Company Insured) | | | 4.00 | | | | 8-1-2019 | | | | 385,000 | | | | 399,276 | |
Twin Rivers CA Unified School District Series A (GO Revenue, Build America Mutual Assurance Company Insured) | | | 5.00 | | | | 8-1-2020 | | | | 510,000 | | | | 553,880 | |
Union Elementary School District California Election of 2014 Series D (GO Revenue) | | | 2.25 | | | | 9-1-2026 | | | | 2,000,000 | | | | 2,031,560 | |
University of California Series AK (Education Revenue) | | | 5.00 | | | | 5-15-2048 | | | | 10,000,000 | | | | 11,702,400 | |
Upland CA Successor Agency to Merged Project Tax Allocation Bond (Tax Revenue, AGM Insured) | | | 5.00 | | | | 9-1-2023 | | | | 1,000,000 | | | | 1,172,060 | |
Vacaville CA RDA Tax Allocation Refunding Bond Subordinate Redevelopment Projects (Tax Revenue) | | | 5.00 | | | | 9-1-2020 | | | | 600,000 | | | | 651,450 | |
Vacaville CA RDA Tax Allocation Refunding Bond Subordinate Redevelopment Projects (Tax Revenue) | | | 5.00 | | | | 9-1-2021 | | | | 600,000 | | | | 668,394 | |
Vacaville CA RDA Tax Allocation Refunding Bond Subordinate Redevelopment Projects (Tax Revenue) | | | 5.00 | | | | 9-1-2022 | | | | 1,050,000 | | | | 1,197,032 | |
Vacaville CA Unified School District Series C (GO Revenue, Build America Mutual Assurance Company Insured) | | | 5.00 | | | | 8-1-2022 | | | | 675,000 | | | | 773,975 | |
Val Verde CA Unified School District (Tax Revenue, Build America Mutual Assurance Company Insured) | | | 4.00 | | | | 10-1-2020 | | | | 350,000 | | | | 371,585 | |
Val Verde CA Unified School District (Tax Revenue, Build America Mutual Assurance Company Insured) | | | 4.00 | | | | 10-1-2021 | | | | 375,000 | | | | 405,161 | |
Val Verde CA Unified School District (Tax Revenue, Build America Mutual Assurance Company Insured) | | | 5.00 | | | | 10-1-2022 | | | | 665,000 | | | | 759,709 | |
Vallejo CA Refunding Bond (Water & Sewer Revenue, National Insured) | | | 5.00 | | | | 5-1-2019 | | | | 790,000 | | | | 792,022 | |
Vallejo CA Refunding Bond (Water & Sewer Revenue, National Insured) | | | 5.00 | | | | 5-1-2021 | | | | 1,500,000 | | | | 1,501,290 | |
Vallejo CA Unified School District Series A (GO Revenue, National Insured) | | | 5.90 | | | | 2-1-2018 | | | | 2,065,000 | | | | 2,072,062 | |
Vallejo CA Unified School Refunding Bond (GO Revenue) | | | 5.00 | | | | 8-1-2026 | | | | 5,475,000 | | | | 6,778,269 | |
Ventura County CA PFA Series B (Miscellaneous Revenue) | | | 5.00 | | | | 11-1-2019 | | | | 375,000 | | | | 398,708 | |
Ventura County CA PFA Series B (Miscellaneous Revenue) | | | 5.00 | | | | 11-1-2020 | | | | 250,000 | | | | 274,133 | |
Visalia CA Certificate of Participation (Miscellaneous Revenue, AGM Insured) | | | 4.00 | | | | 12-1-2020 | | | | 250,000 | | | | 266,115 | |
Visalia CA Certificate of Participation (Miscellaneous Revenue, AGM Insured) | | | 4.00 | | | | 12-1-2021 | | | | 250,000 | | | | 271,173 | |
Visalia CA Certificate of Participation (Miscellaneous Revenue, AGM Insured) | | | 5.00 | | | | 12-1-2022 | | | | 335,000 | | | | 384,657 | |
Walnut CA Energy Center Authority Refunding Bond Series A (Utilities Revenue) | | | 5.00 | | | | 1-1-2021 | | | | 500,000 | | | | 549,975 | |
Washington Township CA Health Refunding Bond Series A (Health Revenue) | | | 5.00 | | | | 7-1-2023 | | | | 600,000 | | | | 679,524 | |
West Covina CA Unified School District (GO Revenue, AGM Insured) | | | 4.00 | | | | 8-1-2018 | | | | 575,000 | | | | 583,602 | |
West Sacramento CA Flood Control Agency (Miscellaneous Revenue) | | | 2.50 | | | | 9-1-2018 | | | | 275,000 | | | | 276,854 | |
West Sacramento CA Flood Control Agency (Miscellaneous Revenue) | | | 2.75 | | | | 9-1-2019 | | | | 285,000 | | | | 290,301 | |
West Sacramento CA Flood Control Agency (Miscellaneous Revenue) | | | 5.00 | | | | 9-1-2020 | | | | 290,000 | | | | 316,297 | |
Western Riverside County CA Regional Wastewater Authority Series A-1 (Tax Revenue) | | | 4.00 | | | | 9-1-2019 | | | | 1,830,000 | | | | 1,896,173 | |
Yuba City CA RDA Refunding Bond (Tax Revenue, AGM Insured) | | | 5.00 | | | | 9-1-2025 | | | | 750,000 | | | | 903,743 | |
| | | | |
| | | | | | | | | | | | | | | 628,147,923 | |
| | | | | | | | | | | | | | | | |
|
| Guam: 0.26% | |
Guam Power Authority Series A (Utilities Revenue, AGM Insured) | | | 5.00 | | | | 10-1-2019 | | | | 1,640,000 | | | | 1,723,017 | |
| | | | | | | | | | | | | | | | |
The accompanying notes are an integral part of these financial statements.
| | | | | | |
| Portfolio of investments—December 31, 2017 (unaudited) | | Wells Fargo California Limited-Term Tax-Free Fund | | | 21 | |
| | | | | | | | | | | | | | | | |
| Security name | | Interest rate | | | Maturity date | | | Principal | | | Value | |
| | | | |
| Illinois: 1.99% | | | | | | | | | | | | | | | | |
Chicago IL Metropolitan Pier & Exposition Authority McCormick Place Expansion Project Series B (Tax Revenue) | | | 5.00 | % | | | 12-15-2025 | | | $ | 650,000 | | | $ | 734,461 | |
Illinois Sales Tax Securitization Corporation Series A (Tax Revenue) | | | 5.00 | | | | 1-1-2023 | | | | 1,400,000 | | | | 1,596,546 | |
Illinois State Series D (Miscellaneous Revenue) | | | 5.00 | | | | 11-1-2028 | | | | 10,000,000 | | | | 10,907,400 | |
| | | | |
| | | | | | | | | | | | | | | 13,238,407 | |
| | | | | | | | | | | | | | | | |
|
| New Jersey: 0.33% | |
New Jersey Transportation Trust Fund Authority Floaters Series DC8033 (Transportation Revenue, Dexia Credit Local LOC, AGM Insured, Dexia Credit Local LIQ) 144Aø | | | 1.99 | | | | 12-15-2022 | | | | 2,195,000 | | | | 2,195,000 | |
| | | | | | | | | | | | | | | | |
|
| Texas: 1.05% | |
Port Arthur TX Navigation District Motiva Enterprises LLC Project Series A (Resource Recovery Revenue) ø | | | 1.83 | | | | 4-1-2040 | | | | 7,000,000 | | | | 7,000,000 | |
| | | | | | | | | | | | | | | | |
|
| Virgin Islands: 0.10% | |
Virgin Islands PFA Matching Fund Loan Note Senior Lien Series A (Tax Revenue) | | | 5.00 | | | | 10-1-2025 | | | | 1,000,000 | | | | 625,000 | |
| | | | | | | | | | | | | | | | |
| |
Total Municipal Obligations (Cost $640,596,745) | | | | 652,929,347 | |
| | | | | | | | | | | | | | | | |
|
| Other: 0.75% | |
Nuveen California AMT-Free Quality Municipal Income Fund Preferred Shares Series A 144A§øø | | | 2.01 | | | | 10-1-2047 | | | | 5,000,000 | | | | 5,000,000 | |
| | | | | | | | | | | | | | | | |
| |
Total Other (Cost $5,000,000) | | | | 5,000,000 | |
| | | | | | | | | | | | | | | | |
| | | | |
| | | Yield | | | | | | Shares | | | | |
| Short-Term Investments: 0.28% | |
|
| Investment Companies: 0.28% | |
Wells Fargo Municipal Cash Management Money Market Fund Institutional Class (l)(u) | | | 1.49 | | | | | | | | 1,882,656 | | | | 1,884,727 | |
| | | | | | | | | | | | | | | | |
| |
Total Short-Term Investments (Cost $1,884,727) | | | | 1,884,727 | |
| | | | | | | | | | | | | | | | |
| | | | | | | | |
| Total investments in securities (Cost $647,481,472) | | | 99.16 | % | | | 659,814,074 | |
Other assets and liabilities, net | | | 0.84 | | | | 5,600,644 | |
| | | | | | | | |
| Total net assets | | | 100.00 | % | | $ | 665,414,718 | |
| | | | | | | | |
| ¤ | The security is issued in zero coupon form with no periodic interest payments. |
| ± | Variable rate investment. The rate shown is the rate in effect at period end. |
| 144A | The security may be resold in transactions exempt from registration, normally to qualified institutional buyers, pursuant to Rule 144A under the Securities Act of 1933. |
| ø | Variable rate demand notes are subject to a demand feature which reduces the effective maturity. The maturity date shown represents the final maturity date of the security. The interest rate is determined and reset by the issuer daily, weekly, or monthly depending upon the terms of the security. The rate shown is the rate in effect at period end. |
| (m) | The security is an auction-rate security which has an interest rate that resets at predetermined short-term intervals through a Dutch auction. The rate shown is the rate in effect at period end. |
| § | The security is subject to a demand feature which reduces the effective maturity. |
| øø | The interest rate is determined and reset by the issuer periodically depending upon the terms of the security. The rate shown is the rate in effect at period end. |
| (l) | The issuer of the security is an affiliated person of the Fund as defined in the Investment Company Act of 1940. |
| (u) | The rate represents the 7-day annualized yield at period end. |
The accompanying notes are an integral part of these financial statements.
| | | | |
| 22 | | Wells Fargo California Limited-Term Tax-Free Fund | | Portfolio of investments—December 31, 2017 (unaudited) |
Investments in Affiliates
An affiliated investment is an investment in which the Fund owns at least 5% of the outstanding voting shares of the issuer or as a result of other relationships, such as the Fund and the issuer having the same investment manager. Transactions with issuers that were either affiliated persons of the Fund at the beginning of the period or the end of the period were as follows:
| | | | | | | | | | | | | | | | | | | | | | | | | | | | | | | | | | | | |
| | | Shares,
beginning of
period | | | Shares
purchased | | | Shares
sold | | | Shares,
end of
period | | | Net
realized
gains
(losses) | | | Net
change in
unrealized
gains
(losses) | | | Income
from
affiliated
securities | | | Value,
end
of period | | | % of
net
assets | |
Short-Term Investments | | | | | | | | | | | | | | | | | | | | | | | | | | | | | | | | | | | | |
Investment Companies | | | | | | | | | | | | | | | | | | | | | | | | | | | | | | | | | | | | |
Wells Fargo Municipal Cash Management Money Market Fund Institutional Class | | | 642,989 | | | | 155,765,038 | | | | 154,525,371 | | | | 1,882,656 | | | $ | 1,772 | | | $ | 0 | | | $ | 18,884 | | | $ | 1,884,727 | | | | 0.28 | % |
The accompanying notes are an integral part of these financial statements.
| | | | | | |
| Statement of assets and liabilities—December 31, 2017 (unaudited) | | Wells Fargo California Limited-Term Tax-Free Fund | | | 23 | |
| | | | |
| | | | |
| |
Assets | | | | |
Investments in unaffiliated securities, at value (cost $645,596,745) | | $ | 657,929,347 | |
Investments in affiliated securities, at value (cost $1,884,727) | | | 1,884,727 | |
Receivable for investments sold | | | 1,315,794 | |
Receivable for Fund shares sold | | | 1,781,066 | |
Receivable for interest | | | 7,227,569 | |
Prepaid expenses and other assets | | | 58,713 | |
| | | | |
Total assets | | | 670,197,216 | |
| | | | |
| |
Liabilities | | | | |
Payable for Fund shares redeemed | | | 4,033,130 | |
Dividends payable | | | 352,916 | |
Management fee payable | | | 201,622 | |
Administration fees payable | | | 63,236 | |
Distribution fee payable | | | 20,213 | |
Trustees’ fees and expenses payable | | | 2,079 | |
Accrued expenses and other liabilities | | | 109,302 | |
| | | | |
Total liabilities | | | 4,782,498 | |
| | | | |
Total net assets | | $ | 665,414,718 | |
| | | | |
| |
NET ASSETS CONSIST OF | | | | |
Paid-in capital | | $ | 657,496,182 | |
Undistributed net investment income | | | 413,104 | |
Accumulated net realized losses on investments | | | (4,827,170 | ) |
Net unrealized gains on investments | | | 12,332,602 | |
| | | | |
Total net assets | | $ | 665,414,718 | |
| | | | |
| |
COMPUTATION OF NET ASSET VALUE AND OFFERING PRICE PER SHARE | | | | |
Net assets – Class A | | $ | 141,842,423 | |
Shares outstanding – Class A1 | | | 13,232,909 | |
Net asset value per share – Class A | | | $10.72 | |
Maximum offering price per share – Class A2 | | | $10.94 | |
Net assets – Class C | | $ | 30,524,235 | |
Shares outstanding – Class C1 | | | 2,848,200 | |
Net asset value per share – Class C | | | $10.72 | |
Net assets – Administrator Class | | $ | 158,592,745 | |
Shares outstanding – Administrator Class1 | | | 15,023,219 | |
Net asset value per share – Administrator Class | | | $10.56 | |
Net assets – Institutional Class | | $ | 334,455,315 | |
Shares outstanding – Institutional Class1 | | | 31,702,926 | |
Net asset value per share – Institutional Class | | | $10.55 | |
| 1 | The Fund has an unlimited number of authorized shares. |
| 2 | Maximum offering price is computed as 100/98 of net asset value. On investments of $50,000 or more, the offering price is reduced. |
The accompanying notes are an integral part of these financial statements.
| | | | |
| 24 | | Wells Fargo California Limited-Term Tax-Free Fund | | Statement of operations—six months ended December 31, 2017 (unaudited) |
| | | | |
| | | | |
| |
Investment income | | | | |
Interest | | $ | 8,634,512 | |
Income from affiliated securities | | | 18,884 | |
| | | | |
Total investment income | | | 8,653,396 | |
| | | | |
| |
Expenses | | | | |
Management fee | | | 1,381,765 | |
Administration fees | | | | |
Class A | | | 121,400 | |
Class C | | | 26,149 | |
Administrator Class | | | 82,371 | |
Institutional Class | | | 141,736 | |
Shareholder servicing fees | | | | |
Class A | | | 189,688 | |
Class C | | | 40,857 | |
Administrator Class | | | 205,927 | |
Distribution fee | | | | |
Class C | | | 122,572 | |
Custody and accounting fees | | | 11,053 | |
Professional fees | | | 28,435 | |
Registration fees | | | 44,742 | |
Shareholder report expenses | | | 9,984 | |
Trustees’ fees and expenses | | | 10,155 | |
Other fees and expenses | | | 13,960 | |
| | | | |
Total expenses | | | 2,430,794 | |
Less: Fee waivers and/or expense reimbursements | | | (190,404 | ) |
| | | | |
Net expenses | | | 2,240,390 | |
| | | | |
Net investment income | | | 6,413,006 | |
| | | | |
| |
REALIZED AND UNREALIZED GAINS (LOSSES) ON INVESTMENTS | | | | |
| |
Net realized gains (losses) on: | | | | |
Unaffiliated securities | | | (198,683 | ) |
Affiliated securities | | | 1,772 | |
| | | | |
Net realized losses on investments | | | (196,911 | ) |
Net change in unrealized gains (losses) on investments | | | (4,462,606 | ) |
| | | | |
Net realized and unrealized gains (losses) on investments | | | (4,659,517 | ) |
| | | | |
Net increase in net assets resulting from operations | | $ | 1,753,489 | |
| | | | |
The accompanying notes are an integral part of these financial statements.
| | | | | | |
| Statement of changes in net assets | | Wells Fargo California Limited-Term Tax-Free Fund | | | 25 | |
| | | | | | | | | | | | | | | | |
| | | Six months ended December 31, 2017 (unaudited) | | | Year ended June 30, 2017 | |
| | | | |
Operations | | | | | | | | | | | | | | | | |
Net investment income | | | | | | $ | 6,413,006 | | | | | | | $ | 13,370,750 | |
Net realized losses on investments | | | | | | | (196,911 | ) | | | | | | | (3,785,691 | ) |
Net change in unrealized gains (losses) on investments | | | | | | | (4,462,606 | ) | | | | | | | (14,832,071 | ) |
| | | | |
Net increase (decrease) in net assets resulting from operations | | | | | | | 1,753,489 | | | | | | | | (5,247,012 | ) |
| | | | |
| | | | |
Distributions to shareholders from | | | | | | | | | | | | | | | | |
Net investment income | | | | | | | | | | | | | | | | |
Class A | | | | | | | (1,259,105 | ) | | | | | | | (2,807,589 | ) |
Class C | | | | | | | (148,846 | ) | | | | | | | (349,303 | ) |
Administrator Class | | | | | | | (1,533,431 | ) | | | | | | | (3,163,432 | ) |
Institutional Class | | | | | | | (3,471,624 | ) | | | | | | | (7,050,426 | ) |
| | | | |
Total distributions to shareholders | | | | | | | (6,413,006 | ) | | | | | | | (13,370,750 | ) |
| | | | |
| | | | |
Capital share transactions | | | Shares | | | | | | | | Shares | | | | | |
Proceeds from shares sold | | | | | | | | | | | | | | | | |
Class A | | | 1,202,318 | | | | 13,018,914 | | | | 4,714,124 | | | | 51,146,750 | |
Class C | | | 111,502 | | | | 1,206,724 | | | | 667,901 | | | | 7,293,164 | |
Administrator Class | | | 896,103 | | | | 9,539,952 | | | | 6,197,011 | | | | 65,954,083 | |
Institutional Class | | | 8,274,352 | | | | 87,843,359 | | | | 26,268,793 | | | | 279,263,172 | |
| | | | |
| | | | | | | 111,608,949 | | | | | | | | 403,657,169 | |
| | | | |
Reinvestment of distributions | | | | | | | | | | | | | | | | |
Class A | | | 103,209 | | | | 1,112,864 | | | | 230,436 | | | | 2,495,332 | |
Class C | | | 12,594 | | | | 135,803 | | | | 29,629 | | | | 320,412 | |
Administrator Class | | | 142,720 | | | | 1,515,512 | | | | 293,256 | | | | 3,131,576 | |
Institutional Class | | | 150,701 | | | | 1,599,247 | | | | 171,415 | | | | 1,820,045 | |
| | | | |
| | | | | | | 4,363,426 | | | | | | | | 7,767,365 | |
| | | | |
Payment for shares redeemed | | | | | | | | | | | | | | | | |
Class A | | | (1,873,250 | ) | | | (20,146,125 | ) | | | (8,956,503 | ) | | | (96,601,492 | ) |
Class C | | | (437,523 | ) | | | (4,726,922 | ) | | | (1,169,021 | ) | | | (12,628,379 | ) |
Administrator Class | | | (1,328,366 | ) | | | (14,071,261 | ) | | | (12,021,903 | ) | | | (127,862,076 | ) |
Institutional Class | | | (11,635,749 | ) | | | (123,570,417 | ) | | | (23,842,546 | ) | | | (253,486,575 | ) |
| | | | |
| | | | | | | (162,514,725 | ) | | | | | | | (490,578,522 | ) |
| | | | |
Net decrease in net assets resulting from capital share transactions | | | | | | | (46,542,350 | ) | | | | | | | (79,153,988 | ) |
| | | | |
Total decrease in net assets | | | | | | | (51,201,867 | ) | | | | | | | (97,771,750 | ) |
| | | | |
| | | | |
Net assets | | | | | | | | | | | | | | | | |
Beginning of period | | | | | | | 716,616,585 | | | | | | | | 814,388,335 | |
| | | | |
End of period | | | | | | $ | 665,414,718 | | | | | | | $ | 716,616,585 | |
| | | | |
Undistributed net investment income | | | | | | $ | 413,104 | | | | | | | $ | 413,104 | |
| | | | |
The accompanying notes are an integral part of these financial statements.
| | | | |
| 26 | | Wells Fargo California Limited-Term Tax-Free Fund | | Financial highlights |
(For a share outstanding throughout each period)
| | | | | | | | | | | | | | | | | | | | | | | | |
| | | Six months ended
December 31, 2017 (unaudited) | | | Year ended June 30 | |
| CLASS A | | | 2017 | | | 2016 | | | 2015 | | | 2014 | | | 2013 | |
Net asset value, beginning of period | | | $10.79 | | | | $11.04 | | | | $10.83 | | | | $10.86 | | | | $10.66 | | | | $10.70 | |
Net investment income | | | 0.09 | | | | 0.18 | | | | 0.17 | | | | 0.16 | | | | 0.18 | | | | 0.21 | |
Net realized and unrealized gains (losses) on investments | | | (0.07 | ) | | | (0.25 | ) | | | 0.21 | | | | (0.03 | ) | | | 0.20 | | | | (0.04 | ) |
| | | | | | | | | | | | | | | | | | | | | | | | |
Total from investment operations | | | 0.02 | | | | (0.07 | ) | | | 0.38 | | | | 0.13 | | | | 0.38 | | | | 0.17 | |
Distributions to shareholders from | | | | | | | | | | | | | | | | | | | | | | | | |
Net investment income | | | (0.09 | ) | | | (0.18 | ) | | | (0.17 | ) | | | (0.16 | ) | | | (0.18 | ) | | | (0.21 | ) |
Net asset value, end of period | | | $10.72 | | | | $10.79 | | | | $11.04 | | | | $10.83 | | | | $10.86 | | | | $10.66 | |
Total return1 | | | 0.19 | % | | | (0.64 | )% | | | 3.54 | % | | | 1.22 | % | | | 3.61 | % | | | 1.59 | % |
Ratios to average net assets (annualized) | | | | | | | | | | | | | | | | | | | | | | | | |
Gross expenses | | | 0.84 | % | | | 0.83 | % | | | 0.83 | % | | | 0.82 | % | | | 0.83 | % | | | 0.83 | % |
Net expenses | | | 0.80 | % | | | 0.80 | % | | | 0.80 | % | | | 0.80 | % | | | 0.80 | % | | | 0.80 | % |
Net investment income | | | 1.66 | % | | | 1.65 | % | | | 1.56 | % | | | 1.49 | % | | | 1.70 | % | | | 1.95 | % |
Supplemental data | | | | | | | | | | | | | | | | | | | | | | | | |
Portfolio turnover rate | | | 20 | % | | | 21 | % | | | 21 | % | | | 31 | % | | | 31 | % | | | 32 | % |
Net assets, end of period (000s omitted) | | | $141,842 | | | | $148,933 | | | | $196,629 | | | | $198,402 | | | | $203,306 | | | | $156,366 | |
| 1 | Total return calculations do not include any sales charges. Returns for periods of less than one year are not annualized. |
The accompanying notes are an integral part of these financial statements.
| | | | | | |
| Financial highlights | | Wells Fargo California Limited-Term Tax-Free Fund | | | 27 | |
(For a share outstanding throughout each period)
| | | | | | | | | | | | | | | | | | | | | | | | |
| | | Six months ended
December 31, 2017 (unaudited) | | | Year ended June 30 | |
| CLASS C | | | 2017 | | | 2016 | | | 2015 | | | 2014 | | | 2013 | |
Net asset value, beginning of period | | | $10.79 | | | | $11.04 | | | | $10.83 | | | | $10.86 | | | | $10.65 | | | | $10.70 | |
Net investment income | | | 0.05 | | | | 0.10 | | | | 0.09 | | | | 0.08 | | | | 0.10 | | | | 0.13 | |
Net realized and unrealized gains (losses) on investments | | | (0.07 | ) | | | (0.25 | ) | | | 0.21 | | | | (0.03 | ) | | | 0.21 | | | | (0.05 | ) |
| | | | | | | | | | | | | | | | | | | | | | | | |
Total from investment operations | | | (0.02 | ) | | | (0.15 | ) | | | 0.30 | | | | 0.05 | | | | 0.31 | | | | 0.08 | |
Distributions to shareholders from | | | | | | | | | | | | | | | | | | | | | | | | |
Net investment income | | | (0.05 | ) | | | (0.10 | ) | | | (0.09 | ) | | | (0.08 | ) | | | (0.10 | ) | | | (0.13 | ) |
Net asset value, end of period | | | $10.72 | | | | $10.79 | | | | $11.04 | | | | $10.83 | | | | $10.86 | | | | $10.65 | |
Total return1 | | | (0.19 | )% | | | (1.38 | )% | | | 2.76 | % | | | 0.47 | % | | | 2.94 | % | | | 0.73 | % |
Ratios to average net assets (annualized) | | | | | | | | | | | | | | | | | | | | | | | | |
Gross expenses | | | 1.59 | % | | | 1.58 | % | | | 1.58 | % | | | 1.57 | % | | | 1.58 | % | | | 1.58 | % |
Net expenses | | | 1.55 | % | | | 1.55 | % | | | 1.55 | % | | | 1.55 | % | | | 1.55 | % | | | 1.55 | % |
Net investment income | | | 0.91 | % | | | 0.90 | % | | | 0.81 | % | | | 0.74 | % | | | 0.95 | % | | | 1.19 | % |
Supplemental data | | | | | | | | | | | | | | | | | | | | | | | | |
Portfolio turnover rate | | | 20 | % | | | 21 | % | | | 21 | % | | | 31 | % | | | 31 | % | | | 32 | % |
Net assets, end of period (000s omitted) | | | $30,524 | | | | $34,113 | | | | $40,098 | | | | $33,996 | | | | $34,920 | | | | $35,309 | |
| 1 | Total return calculations do not include any sales charges. Returns for periods of less than one year are not annualized. |
The accompanying notes are an integral part of these financial statements.
| | | | |
| 28 | | Wells Fargo California Limited-Term Tax-Free Fund | | Financial highlights |
(For a share outstanding throughout each period)
| | | | | | | | | | | | | | | | | | | | | | | | |
| | | Six months ended
December 31, 2017 (unaudited) | | | Year ended June 30 | |
| ADMINISTRATOR CLASS | | | 2017 | | | 2016 | | | 2015 | | | 2014 | | | 2013 | |
Net asset value, beginning of period | | | $10.63 | | | | $10.87 | | | | $10.66 | | | | $10.70 | | | | $10.49 | | | | $10.53 | |
Net investment income | | | 0.10 | | | | 0.20 | | | | 0.19 | | | | 0.18 | | | | 0.20 | | | | 0.23 | |
Net realized and unrealized gains (losses) on investments | | | (0.07 | ) | | | (0.24 | ) | | | 0.21 | | | | (0.04 | ) | | | 0.21 | | | | (0.04 | ) |
| | | | | | | | | | | | | | | | | | | | | | | | |
Total from investment operations | | | 0.03 | | | | (0.04 | ) | | | 0.40 | | | | 0.14 | | | | 0.41 | | | | 0.19 | |
Distributions to shareholders from | | | | | | | | | | | | | | | | | | | | | | | | |
Net investment income | | | (0.10 | ) | | | (0.20 | ) | | | (0.19 | ) | | | (0.18 | ) | | | (0.20 | ) | | | (0.23 | ) |
Net asset value, end of period | | | $10.56 | | | | $10.63 | | | | $10.87 | | | | $10.66 | | | | $10.70 | | | | $10.49 | |
Total return1 | | | 0.28 | % | | | (0.38 | )% | | | 3.78 | % | | | 1.33 | % | | | 3.95 | % | | | 1.79 | % |
Ratios to average net assets (annualized) | | | | | | | | | | | | | | | | | | | | | | | | |
Gross expenses | | | 0.78 | % | | | 0.77 | % | | | 0.77 | % | | | 0.76 | % | | | 0.77 | % | | | 0.77 | % |
Net expenses | | | 0.60 | % | | | 0.60 | % | | | 0.60 | % | | | 0.60 | % | | | 0.60 | % | | | 0.60 | % |
Net investment income | | | 1.86 | % | | | 1.84 | % | | | 1.75 | % | | | 1.69 | % | | | 1.90 | % | | | 2.14 | % |
Supplemental data | | | | | | | | | | | | | | | | | | | | | | | | |
Portfolio turnover rate | | | 20 | % | | | 21 | % | | | 21 | % | | | 31 | % | | | 31 | % | | | 32 | % |
Net assets, end of period (000s omitted) | | | $158,593 | | | | $162,747 | | | | $226,581 | | | | $309,120 | | | | $550,156 | | | | $388,872 | |
| 1 | Returns for periods of less than one year are not annualized. |
The accompanying notes are an integral part of these financial statements.
| | | | | | |
| Financial highlights | | Wells Fargo California Limited-Term Tax-Free Fund | | | 29 | |
(For a share outstanding throughout each period)
| | | | | | | | | | | | | | | | |
| | | Six months ended
December 31, 2017 (unaudited) | | | Year ended June 30 | |
| INSTITUTIONAL CLASS | | | 2017 | | | 2016 | | | 20151 | |
Net asset value, beginning of period | | | $10.62 | | | | $10.86 | | | | $10.66 | | | | $10.75 | |
Net investment income | | | 0.10 | | | | 0.21 | | | | 0.20 | | | | 0.13 | |
Net realized and unrealized gains (losses) on investments | | | (0.07 | ) | | | (0.24 | ) | | | 0.20 | | | | (0.09 | ) |
| | | | | | | | | | | | | | | | |
Total from investment operations | | | 0.03 | | | | (0.03 | ) | | | 0.40 | | | | 0.04 | |
Distributions to shareholders from | | | | | | | | | | | | | | | | |
Net investment income | | | (0.10 | ) | | | (0.21 | ) | | | (0.20 | ) | | | (0.13 | ) |
Net asset value, end of period | | | $10.55 | | | | $10.62 | | | | $10.86 | | | | $10.66 | |
Total return2 | | | 0.33 | % | | | (0.28 | )% | | | 3.79 | % | | | 0.35 | % |
Ratios to average net assets (annualized) | | | | | | | | | | | | | | | | |
Gross expenses | | | 0.51 | % | | | 0.50 | % | | | 0.50 | % | | | 0.50 | % |
Net expenses | | | 0.50 | % | | | 0.50 | % | | | 0.50 | % | | | 0.50 | % |
Net investment income | | | 1.96 | % | | | 1.95 | % | | | 1.86 | % | | | 1.82 | % |
Supplemental data | | | | | | | | | | | | | | | | |
Portfolio turnover rate | | | 20 | % | | | 21 | % | | | 21 | % | | | 31 | % |
Net assets, end of period (000s omitted) | | | $334,455 | | | | $370,824 | | | | $351,080 | | | | $280,061 | |
| 1 | For the period from October 31, 2014 (commencement of class operations) to June 30, 2015 |
| 2 | Returns for periods of less than one year are not annualized. |
The accompanying notes are an integral part of these financial statements.
| | | | |
| 30 | | Wells Fargo California Limited-Term Tax-Free Fund | | Notes to financial statements (unaudited) |
1. ORGANIZATION
Wells Fargo Funds Trust (the “Trust”), a Delaware statutory trust organized on March 10, 1999, is an open-end management investment company registered under the Investment Company Act of 1940, as amended (the “1940 Act”). As an investment company, the Trust follows the accounting and reporting guidance in Financial Accounting Standards Board Accounting Standards Codification Topic 946, Financial Services – Investment Companies. These financial statements report on the Wells Fargo California Limited-Term Tax-Free Fund (the “Fund”) which is a diversified series of the Trust.
2. SIGNIFICANT ACCOUNTING POLICIES
The following significant accounting policies, which are consistently followed in the preparation of the financial statements of the Fund, are in conformity with U.S. generally accepted accounting principles which require management to make estimates and assumptions that affect the reported amounts of assets and liabilities, disclosure of contingent assets and liabilities at the date of the financial statements, and the reported amounts of revenues and expenses during the reporting period. Actual results could differ from those estimates.
Securities valuation
All investments are valued each business day as of the close of regular trading on the New York Stock Exchange (generally 4 p.m. Eastern Time), although the Fund may deviate from this calculation time under unusual or unexpected circumstances.
Debt securities are valued at the evaluated bid price provided by an independent pricing service or, if a reliable price is not available, the quoted bid price from an independent broker-dealer.
Investments in registered open-end investment companies are valued at net asset value.
Investments which are not valued using any of the methods discussed above are valued at their fair value, as determined in good faith by the Board of Trustees of the Fund. The Board of Trustees has established a Valuation Committee comprised of the Trustees and has delegated to it the authority to take any actions regarding the valuation of portfolio securities that the Valuation Committee deems necessary or appropriate, including determining the fair value of portfolio securities, unless the determination has been delegated to the Management Valuation Team of Wells Fargo Funds Management, LLC (“Funds Management”). The Board of Trustees retains the authority to make or ratify any valuation decisions or approve any changes to the Valuation Procedures as it deems appropriate. On a quarterly basis, the Board of Trustees receives reports on any valuation actions taken by the Valuation Committee or the Management Valuation Team which may include items for ratification.
Valuations of fair valued securities are compared to the next actual sales price when available, or other appropriate market values, to assess the continued appropriateness of the fair valuation methodologies used. These securities are fair valued on a day-to-day basis, taking into consideration changes to appropriate market information and any significant changes to the inputs considered in the valuation process until there is a readily available price provided on an exchange or by an independent pricing service. Valuations received from an independent pricing service or independent broker-dealer quotes are periodically validated by comparisons to most recent trades and valuations provided by other independent pricing services in addition to the review of prices by the manager and/or subadviser. Unobservable inputs used in determining fair valuations are identified based on the type of security, taking into consideration factors utilized by market participants in valuing the investment, knowledge about the issuer and the current market environment.
When-issued transactions
The Fund may purchase securities on a forward commitment or when-issued basis. The Fund records a when-issued transaction on the trade date and will segregate assets in an amount at least equal in value to the Fund’s commitment to purchase when-issued securities. Securities purchased on a when-issued basis are marked-to-market daily and the Fund begins earning interest on the settlement date. Losses may arise due to changes in the market value of the underlying securities or if the counterparty does not perform under the contract.
Security transactions and income recognition
Securities transactions are recorded on a trade date basis. Realized gains or losses are recorded on the basis of identified cost.
Interest income is accrued daily and bond discounts are accreted and premiums are amortized daily based on the effective interest method. To the extent debt obligations are placed on non-accrual status, any related interest income may be reduced by writing off interest receivables when the collection of all or a portion of interest has been determined
| | | | | | |
| Notes to financial statements (unaudited) | | Wells Fargo California Limited-Term Tax-Free Fund | | | 31 | |
to be doubtful based on consistently applied procedures and the fair value has decreased. If the issuer subsequently resumes interest payments or when the collectability of interest is reasonably assured, the debt obligation is removed from non-accrual status.
Distributions to shareholders
Distributions to shareholders from net investment income are accrued daily and paid monthly. Distributions from net realized gains, if any, are recorded on the ex-dividend date. Such distributions are determined in accordance with income tax regulations and may differ from U.S. generally accepted accounting principles. Dividend sources are estimated at the time of declaration. The tax character of distributions is determined as of the Fund’s fiscal year end. Therefore, a portion of the Fund’s distributions made prior to the Fund’s fiscal year end may be categorized as a tax return of capital.
Federal and other taxes
The Fund intends to continue to qualify as a regulated investment company by distributing substantially all of its investment company taxable and tax-exempt income and any net realized capital gains (after reduction for capital loss carryforwards) sufficient to relieve it from all, or substantially all, federal income taxes. Accordingly, no provision for federal income taxes was required.
The Fund’s income and federal excise tax returns and all financial records supporting those returns for the prior three fiscal years are subject to examination by the federal and Delaware revenue authorities. Management has analyzed the Fund’s tax positions taken on federal, state, and foreign tax returns for all open tax years and does not believe that there are any uncertain tax positions that require recognition of a tax liability.
As of December 31, 2017, the aggregate cost of all investments for federal income tax purposes was $647,483,430 and the unrealized gains (losses) consisted of:
| | | | |
Gross unrealized gains | | $ | 12,916,608 | |
Gross unrealized losses | | | (585,964 | ) |
Net unrealized gains | | $ | 12,330,644 | |
Capital loss carryforwards that do not expire are required to be utilized prior to capital loss carryforwards that expire. As of June 30, 2017, capital loss carryforwards available to offset future net realized capital gains were as follows through the indicated expiration dates:
| | | | |
| 2018 | | 2019 | | No expiration |
| | | Long-term |
| $619,123 | | $110,356 | | $160,531 |
As of June 30, 2017, the Fund had current year deferred post-October capital losses consisting of $3,208,048 in short-term losses and $531,368 in long-term losses which were recognized on the first day of the current fiscal year.
Class allocations
The separate classes of shares offered by the Fund differ principally in applicable sales charges, distribution, shareholder servicing, and administration fees. Class specific expenses are charged directly to that share class. Investment income, common expenses, and realized and unrealized gains (losses) on investments are allocated daily to each class of shares based on the relative proportion of net assets of each class.
3. FAIR VALUATION MEASUREMENTS
Fair value measurements of investments are determined within a framework that has established a fair value hierarchy based upon the various data inputs utilized in determining the value of the Fund’s investments. The three-level hierarchy gives the highest priority to unadjusted quoted prices in active markets for identical assets or liabilities (Level 1) and the lowest priority to unobservable inputs (Level 3). The Fund’s investments are classified within the fair value hierarchy based on the lowest level of input that is significant to the fair value measurement. The inputs are summarized into three broad levels as follows:
| ∎ | | Level 1 – quoted prices in active markets for identical securities |
| ∎ | | Level 2 – other significant observable inputs (including quoted prices for similar securities, interest rates, prepayment speeds, credit risk, etc.) |
| ∎ | | Level 3 – significant unobservable inputs (including the Fund’s own assumptions in determining the fair value of investments) |
| | | | |
| 32 | | Wells Fargo California Limited-Term Tax-Free Fund | | Notes to financial statements (unaudited) |
The inputs or methodologies used for valuing investments in securities are not necessarily an indication of the risk associated with investing in those securities.
The following is a summary of the inputs used in valuing the Fund’s assets and liabilities as of December 31, 2017:
| | | | | | | | | | | | | | | | |
| | | Quoted prices
(Level 1) | | | Other significant
observable inputs
(Level 2) | | | Significant
unobservable inputs (Level 3) | | | Total | |
Assets | | | | | | | | | | | | | | | | |
Investments in: | | | | | | | | | | | | | | | | |
| | | | |
Municipal obligations | | $ | 0 | | | $ | 652,929,347 | | | $ | 0 | | | $ | 652,929,347 | |
| | | | |
Other | | | 0 | | | | 5,000,000 | | | | 0 | | | | 5,000,000 | |
| | | | |
Short-term investments | | | | | | | | | | | | | | | | |
Investment companies | | | 1,884,727 | | | | 0 | | | | 0 | | | | 1,884,727 | |
Total assets | | $ | 1,884,727 | | | $ | 657,929,347 | | | $ | 0 | | | $ | 659,814,074 | |
The Fund recognizes transfers between levels within the fair value hierarchy at the end of the reporting period. At December 31, 2017, the Fund did not have any transfers into/out of Level 1, Level 2, or Level 3.
4. TRANSACTIONS WITH AFFILIATES
Management fee
Funds Management, an indirect wholly owned subsidiary of Wells Fargo & Company (“Wells Fargo”), is the manager of the Fund and provides advisory and fund-level administrative services under an investment management agreement. Under the investment management agreement, Funds Management is responsible for, among other services, implementing the investment objectives and strategies of the Fund, supervising the subadviser, providing fund-level administrative services in connection with the Fund’s operations, and providing any other fund-level administrative services reasonably necessary for the operation of the Fund. As compensation for its services under the investment management agreement, Funds Management is entitled to receive an annual management fee starting at 0.40% and declining to 0.28% as the average daily net assets of the Fund increase. For the six months ended December 31, 2017, the management fee was equivalent to an annual rate of 0.39% of the Fund’s average daily net assets.
Funds Management has retained the services of a subadviser to provide daily portfolio management to the Fund. The fee for subadvisory services is borne by Funds Management. Wells Capital Management Incorporated, an affiliate of Funds Management and an indirect wholly owned subsidiary of Wells Fargo, is the subadviser to the Fund and is entitled to receive a fee from Funds Management at an annual rate starting at 0.15% and declining to 0.05% as the average daily net assets of the Fund increase.
Administration fees
Under a class-level administration agreement, Funds Management provides class-level administrative services to the Fund, which includes paying fees and expenses for services provided by the transfer agent, sub-transfer agents, omnibus account servicers and record-keepers. As compensation for its services under the class-level administration agreement, Funds Management receives an annual fee which is calculated based on the average daily net assets of each class as follows:
| | | | |
| | | Class level
administration fee | |
Class A, Class C | | | 0.16 | % |
Administrator Class | | | 0.10 | |
Institutional Class | | | 0.08 | |
Funds Management has contractually waived and/or reimbursed advisory and administration fees to the extent necessary to maintain certain net operating expense ratios for the Fund. Waiver of fees and/or reimbursement of expenses by Funds Management were made first from fund level expenses on a proportionate basis and then from class specific expenses. Funds Management has committed through October 31, 2018 to waive fees and/or reimburse expenses to the extent necessary to cap the Fund’s expenses at 0.80% for Class A shares, 1.55% for Class C shares, 0.60%
| | | | | | |
| Notes to financial statements (unaudited) | | Wells Fargo California Limited-Term Tax-Free Fund | | | 33 | |
for Administrator Class shares, and 0.50% for Institutional Class shares. After this time, the cap may be increased or the commitment to maintain the cap may be terminated only with the approval of the Board of Trustees.
Distribution fee
The Trust has adopted a Distribution Plan for Class C shares of the Fund pursuant to Rule 12b-1 under the 1940 Act. A distribution fee is charged to Class C shares and paid to Wells Fargo Funds Distributor, LLC (“Funds Distributor”), the principal underwriter, at an annual rate of 0.75% of the average daily net assets of Class C shares.
In addition, Funds Distributor is entitled to receive the front-end sales charges from purchases of Class A shares and the contingent deferred sales charges from redemptions of Class A and Class C shares. For the six months ended December 31, 2017, Funds Distributor received $204 from the sale of Class A shares. Funds Distributor is also entitled to receive the contingent deferred sales charges from redemptions of Class C shares. No contingent deferred sales charges were incurred by Class A and Class C for the six months ended December 31, 2017
Shareholder servicing fees
The Trust has entered into contracts with one or more shareholder servicing agents, whereby Class A, Class C, and Administrator Class of the Fund is charged a fee at an annual rate of 0.25% of the average daily net assets of each respective class.
A portion of these total shareholder servicing fees were paid to affiliates of Wells Fargo.
Interfund transactions
The Fund may purchase or sell portfolio investment securities to certain other Wells Fargo affiliates pursuant to Rule 17a-7 under the 1940 Act and under procedures adopted by the Board of Trustees. The procedures have been designed to ensure that these interfund transactions, which do not incur broker commissions, are effected at current market prices. Pursuant to these procedures, the Fund had $81,015,000 and $88,465,000 in interfund purchases and sales, respectively, during the six months ended December 31, 2017.
5. INVESTMENT PORTFOLIO TRANSACTIONS
Purchases and sales of investments, excluding U.S. government obligations (if any) and short-term securities, for the six months ended December 31, 2017 were $126,378,957 and $182,236,769, respectively.
6. BANK BORROWINGS
The Trust (excluding the money market funds and certain other funds) and Wells Fargo Variable Trust are parties to a $280,000,000 revolving credit agreement whereby the Fund is permitted to use bank borrowings for temporary or emergency purposes, such as to fund shareholder redemption requests. Interest under the credit agreement is charged to the Fund based on a borrowing rate equal to the higher of the Federal Funds rate in effect on that day plus 1.25% or the overnight LIBOR rate in effect on that day plus 1.25%. In addition, an annual commitment fee equal to 0.25% of the unused balance is allocated to each participating fund. Prior to August 29, 2017, the revolving credit agreement amount was $250,000,000.
For the six months ended December 31, 2017, there were no borrowings by the Fund under the agreement.
7. CONCENTRATION RISK
The Fund invests a substantial portion of its assets in issuers of municipal debt securities located in a single state or territories of the U.S. Therefore, it may be more affected by economic and political developments in that state or region than would be a comparable general tax-exempt fund.
8. INDEMNIFICATION
Under the Trust’s organizational documents, the officers and Trustees have been granted certain indemnification rights against certain liabilities that may arise out of performance of their duties to the Trust. Additionally, in the normal course of business, the Trust may enter into contracts with service providers that contain a variety of indemnification clauses. The Trust’s maximum exposure under these arrangements is dependent on future claims that may be made against the Fund and, therefore, cannot be estimated.
| | | | |
| 34 | | Wells Fargo California Limited-Term Tax-Free Fund | | Other information (unaudited) |
PROXY VOTING INFORMATION
A description of the policies and procedures that the Fund uses to determine how to vote proxies relating to portfolio securities is available, upon request, by calling 1-800-222-8222, visiting our website at wellsfargofunds.com, or visiting the SEC website at sec.gov. Information regarding how the Fund voted proxies relating to portfolio securities during the most recent 12-month period ended June 30 is available on the Fund’s website at wellsfargofunds.com or by visiting the SEC website at sec.gov.
PORTFOLIO HOLDINGS INFORMATION
The complete portfolio holdings for the Fund are publicly available monthly on the Fund’s website (wellsfargofunds.com), on a one-month delayed basis. In addition, top ten holdings information (excluding derivative positions) for the Fund is publicly available on the Fund’s website on a monthly, seven-day or more delayed basis. The Fund files its complete schedule of portfolio holdings with the SEC for the first and third quarters of each fiscal year on Form N-Q, which is available by visiting the SEC website at sec.gov. In addition, the Fund’s Form N-Q may be reviewed and copied at the SEC’s Public Reference Room in Washington, DC, and at regional offices in New York City, at 233 Broadway, and in Chicago, at 175 West Jackson Boulevard, Suite 900. Information about the Public Reference Room may be obtained by calling 1-800-SEC-0330.
| | | | | | |
| Other information (unaudited) | | Wells Fargo California Limited-Term Tax-Free Fund | | | 35 | |
BOARD OF TRUSTEES AND OFFICERS
Each of the Trustees and Officers1 listed in the table below acts in identical capacities for each fund in the Wells Fargo family of funds, which consists of 153 mutual funds comprising the Wells Fargo Funds Trust, Wells Fargo Variable Trust, Wells Fargo Master Trust and four closed-end funds (collectively the “Fund Complex”). This table should be read in conjunction with the Prospectus and the Statement of Additional Information2. The mailing address of each Trustee and Officer is 525 Market Street, 12th Floor, San Francisco, CA 94105. Each Trustee and Officer serves an indefinite term, however, each Trustee serves such term until reaching the mandatory retirement age established by the Trustees.
Independent Trustees
| | | | | | |
Name and year of birth | | Position held and
length of service* | | Principal occupations during past five years or longer | | Current other public company or
investment company
directorships |
William R. Ebsworth (Born 1957) | | Trustee, since 2015 | | Retired. From 1984 to 2013, equities analyst, portfolio manager, research director and chief investment officer at Fidelity Management and Research Company in Boston, Tokyo, and Hong Kong, and retired in 2013 as Chief Investment Officer of Fidelity Strategic Advisers, Inc. where he led a team of investment professionals managing client assets. Prior thereto, Board member of Hong Kong Securities Clearing Co., Hong Kong Options Clearing Corp., the Thailand International Fund, Ltd., Fidelity Investments Life Insurance Company, and Empire Fidelity Investments Life Insurance Company. Board member of the Forté Foundation (non-profit organization) and the Vincent Memorial Hospital Endowment (non-profit organization), where he serves on the Investment Committee and as a Chair of the Audit Committee. Mr. Ebsworth is a CFA® charterholder. | | Asset Allocation Trust |
Jane A. Freeman** (Born 1953) | | Trustee, since 2015; Chair Liaison, since 2018 | | Retired. From 2012 to 2014 and 1999 to 2008, Chief Financial Officer of Scientific Learning Corporation. From 2008 to 2012, Ms. Freeman provided consulting services related to strategic business projects. Prior to 1999, Portfolio Manager at Rockefeller & Co. and Scudder, Stevens & Clark. Board member of the Harding Loevner Funds from 1996 to 2014, serving as both Lead Independent Director and chair of the Audit Committee. Board member of the Russell Exchange Traded Funds Trust from 2011 to 2012 and the chair of the Audit Committee. Ms. Freeman is a Board Member of Ruth Bancroft Garden (non-profit organization) and the Glimmerglass Festival. She is also an inactive Chartered Financial Analyst. | | Asset Allocation Trust |
Peter G. Gordon*** (Born 1942) | | Trustee, since 1998; Chairman, from 2005 to 2017 | | Co-Founder, Retired Chairman, President and CEO of Crystal Geyser Water Company. Trustee Emeritus, Colby College. | | Asset Allocation Trust |
Isaiah Harris, Jr. (Born 1952) | | Trustee, since 2009 | | Retired. Chairman of the Board of CIGNA Corporation since 2009, and Director since 2005. From 2003 to 2011, Director of Deluxe Corporation. Prior thereto, President and CEO of BellSouth Advertising and Publishing Corp. from 2005 to 2007, President and CEO of BellSouth Enterprises from 2004 to 2005 and President of BellSouth Consumer Services from 2000 to 2003. Emeritus member of the Iowa State University Foundation Board of Governors. Emeritus Member of the Advisory Board of Iowa State University School of Business. Advisory Board Member, Palm Harbor Academy (charter school). Advisory Board Member, Child Evangelism Fellowship (non-profit). Mr. Harris is a certified public accountant (inactive status). | | CIGNA Corporation; Asset Allocation Trust |
Judith M. Johnson (Born 1949) | | Trustee, since 2008; Audit Committee Chairman, since 2008 | | Retired. Prior thereto, Chief Executive Officer and Chief Investment Officer of Minneapolis Employees Retirement Fund from 1996 to 2008. Ms. Johnson is an attorney, certified public accountant and a certified managerial accountant. | | Asset Allocation Trust |
David F. Larcker (Born 1950) | | Trustee, since 2009 | | James Irvin Miller Professor of Accounting at the Graduate School of Business, Stanford University, Director of the Corporate Governance Research Initiative and Senior Faculty of The Rock Center for Corporate Governance since 2006. From 2005 to 2008, Professor of Accounting at the Graduate School of Business, Stanford University. Prior thereto, Ernst & Young Professor of Accounting at The Wharton School, University of Pennsylvania from 1985 to 2005. | | Asset Allocation Trust |
| | | | |
| 36 | | Wells Fargo California Limited-Term Tax-Free Fund | | Other information (unaudited) |
| | | | | | |
Name and year of birth | | Position held and
length of service* | | Principal occupations during past five years or longer | | Current other public company or
investment company
directorships |
Olivia S. Mitchell**** (Born 1953) | | Trustee, since 2006; Governance Committee Chairman, since 2018 | | International Foundation of Employee Benefit Plans Professor, Wharton School of the University of Pennsylvania since 1993. Director of Wharton’s Pension Research Council and Boettner Center on Pensions & Retirement Research, and Research Associate at the National Bureau of Economic Research. Previously, Cornell University Professor from 1978 to 1993. | | Asset Allocation Trust |
Timothy J. Penny***** (Born 1951) | | Trustee, since 1996; Chairman, since 2018; Vice Chairman, from 2017 to 2018 | | President and Chief Executive Officer of Southern Minnesota Initiative Foundation, a non-profit organization, since 2007. Member of the Board of Trustees of NorthStar Education Finance, Inc., a non-profit organization, since 2007. | | Asset Allocation Trust |
James G. Polisson****** (Born 1959) | | Trustee, since 2018; Advisory Board Member, from 2017 to 2018 | | Retired. Chief Marketing Officer, Source (ETF) UK Services, Ltd, from 2015 to 2017. From 2012 to 2015, Principal of The Polisson Group, LLC, a management consulting, corporate advisory and principal investing company. Chief Executive Officer and Managing Director at Russell Investments, Global Exchange Traded Funds from 2010 to 2012. Managing Director of Barclays Global Investors from 1998 to 2010 and Global Chief Marketing Officer for iShares and Barclays Global Investors from 2000 to 2010. Trustee of the San Francisco Mechanics’ Institute, a non-profit organization, from 2013 to 2015. Board member of the Russell Exchange Traded Fund Trust from 2011 to 2012. Director of Barclays Global Investors Holdings Deutschland GmbH from 2006 to 2009. Mr. Polisson is an attorney and has a retired status with the Massachusetts and District of Columbia Bar Associations. | | Asset Allocation Trust |
Michael S. Scofield (Born 1943) | | Trustee, since 2010 | | Served on the Investment Company Institute’s Board of Governors and Executive Committee from 2008-2011 as well the Governing Council of the Independent Directors Council from 2006-2011 and the Independent Directors Council Executive Committee from 2008-2011. Trustee of the Evergreen Funds complex (and its predecessors) from 1984 to 2010. Chairman of the Evergreen Funds from 2000-2010. Former Trustee of the Mentor Funds. Retired Attorney, Law Offices of Michael S. Scofield. | | Asset Allocation Trust |
Pamela Wheelock****** (Born 1959) | | Trustee, since 2018; Advisory Board Member, from 2017 to 2018 | | Chief Operating Officer, Twin Cities Habitat for Humanity, since January, 2017. Vice President of University Services, University of Minnesota from 2012 to 2017. Prior thereto, Interim President and Chief Executive Officer of Blue Cross Blue Shield of Minnesota from 2010 to 2011, Chairman of the Board from 2009 to 2011 and Board Director from 2003 to 2015. Vice President, Leadership and Community Engagement, Bush Foundation, Saint Paul, Minnesota (a private foundation) from 2009 to 2011. Executive Vice President and Chief Financial Officer, Minnesota Sports and Entertainment from 2004 to 2009 and Senior Vice President from 2002 to 2004. Commissioner of Finance, State of Minnesota, from 1999 to 2002. Currently on the Board of Directors, Governance Committee and Finance Committee, for the Minnesota Philanthropy Partners (Saint Paul Foundation) since 2012 and Board Chair of the Minnesota Wild Foundation since 2010. | | Asset Allocation Trust |
| * | Length of service dates reflect the Trustee’s commencement of service with the Trust’s predecessor entities, where applicable. |
| ** | Jane Freeman became Chair Liaison effective January 1, 2018. |
| *** | Peter Gordon retired on December 31, 2017. |
| **** | Olivia Mitchell became Chairman of the Governance Committee effective January 1, 2018. |
| ***** | Timothy Penny became Chairman effective January 1, 2018. |
| ****** | James Polisson and Pamela Wheelock each became a Trustee effective January 1, 2018. |
| | | | | | |
| Other information (unaudited) | | Wells Fargo California Limited-Term Tax-Free Fund | | | 37 | |
Officers
| | | | | | |
Name and
year of birth | | Position held and
length of service | | Principal occupations during past five years or longer | | |
Andrew Owen (Born 1960) | | President, since 2017 | | Executive Vice President of Wells Fargo & Company and Head of Affiliated Managers, Wells Fargo Asset Management, since 2014. In addition, Mr. Owen is currently President, Chief Executive Officer and Director of Wells Fargo Funds Management, LLC since 2017. Prior thereto, Executive Vice President responsible for marketing, investments and product development for Wells Fargo Funds Management, LLC, from 2009 to 2014. | | |
Nancy Wiser1 (Born 1967) | | Treasurer, since 2012 | | Executive Vice President of Wells Fargo Funds Management, LLC since 2011. Chief Operating Officer and Chief Compliance Officer at LightBox Capital Management LLC, from 2008 to 2011. | | |
| C. David Messman (Born 1960) | | Secretary, since 2000; Chief Legal Officer, since 2003 | | Senior Vice President and Secretary of Wells Fargo Funds Management, LLC since 2001. Assistant General Counsel of Wells Fargo Bank, N.A. since 2013 and Vice President and Managing Counsel of Wells Fargo Bank, N.A. from 1996 to 2013. | | |
Michael H. Whitaker (Born 1967) | | Chief Compliance Officer, since 2016 | | Senior Vice President and Chief Compliance Officer since 2016. Senior Vice President and Chief Compliance Officer for Fidelity Investments from 2007 to 2016. | | |
David Berardi (Born 1975) | | Assistant Treasurer, since 2009 | | Vice President of Wells Fargo Funds Management, LLC since 2009. Vice President of Evergreen Investment Management Company, LLC from 2008 to 2010. Manager of Fund Reporting and Control for Evergreen Investment Management Company, LLC from 2004 to 2010. | | |
| Jeremy DePalma1 (Born 1974) | | Assistant Treasurer, since 2009 | | Senior Vice President of Wells Fargo Funds Management, LLC since 2009. Senior Vice President of Evergreen Investment Management Company, LLC from 2008 to 2010 and head of the Fund Reporting and Control Team within Fund Administration from 2005 to 2010. | | |
| 1 | Nancy Wiser acts as Treasurer of 77 funds in the Fund Complex. Jeremy DePalma acts as Treasurer of 76 funds and Assistant Treasurer of 77 funds in the Fund Complex. |
| 2 | The Statement of Additional Information includes additional information about the Trustees and is available, without charge, upon request, by calling 1-800-222-8222 or by visiting the website at wellsfargofunds.com. |
| | | | |
| 38 | | Wells Fargo California Limited-Term Tax-Free Fund | | List of abbreviations |
The following is a list of common abbreviations for terms and entities that may have appeared in this report.
| ACA | — ACA Financial Guaranty Corporation |
| ADR | — American depositary receipt |
| ADS | — American depositary shares |
| AGC | — Assured Guaranty Corporation |
| AGM | — Assured Guaranty Municipal |
| Ambac | — Ambac Financial Group Incorporated |
| AMT | — Alternative minimum tax |
| BAN | — Bond anticipation notes |
| BHAC | — Berkshire Hathaway Assurance Corporation |
| CAB | — Capital appreciation bond |
| CCAB | — Convertible capital appreciation bond |
| CDA | — Community Development Authority |
| CDO | — Collateralized debt obligation |
| CLO | — Collateralized loan obligation |
| DRIVER | — Derivative inverse tax-exempt receipts |
| DW&P | — Department of Water & Power |
| DWR | — Department of Water Resources |
| ECFA | — Educational & Cultural Facilities Authority |
| EDA | — Economic Development Authority |
| EDFA | — Economic Development Finance Authority |
| ETF | — Exchange-traded fund |
| FDIC | — Federal Deposit Insurance Corporation |
| FFCB | — Federal Farm Credit Banks |
| FGIC | — Financial Guaranty Insurance Corporation |
| FHA | — Federal Housing Administration |
| FHLB | — Federal Home Loan Bank |
| FHLMC | — Federal Home Loan Mortgage Corporation |
| FICO | — The Financing Corporation |
| FNMA | — Federal National Mortgage Association |
| GDR | — Global depositary receipt |
| GNMA | — Government National Mortgage Association |
| HCFR | — Healthcare facilities revenue |
| HEFA | — Health & Educational Facilities Authority |
| HEFAR | — Higher education facilities authority revenue |
| HFA | — Housing Finance Authority |
| HFFA | — Health Facilities Financing Authority |
| HUD | — Department of Housing and Urban Development |
| IDA | — Industrial Development Authority |
| IDAG | — Industrial Development Agency |
| KRW | — Republic of Korea won |
| LIBOR | — London Interbank Offered Rate |
| LIFER | — Long Inverse Floating Exempt Receipts |
| LLC | — Limited liability company |
| LLLP | — Limited liability limited partnership |
| LLP | — Limited liability partnership |
| MBIA | — Municipal Bond Insurance Association |
| MFHR | — Multifamily housing revenue |
| MSTR | — Municipal securities trust receipts |
| MUD | — Municipal Utility District |
| National | — National Public Finance Guarantee Corporation |
| PCFA | — Pollution Control Financing Authority |
| PCL | — Public Company Limited |
| PCR | — Pollution control revenue |
| PFA | — Public Finance Authority |
| PFFA | — Public Facilities Financing Authority |
| PFOTER | — Puttable floating option tax-exempt receipts |
| PJSC | — Public Joint Stock Company |
| plc | — Public limited company |
| PUTTER | — Puttable tax-exempt receipts |
| R&D | — Research & development |
| Radian | — Radian Asset Assurance |
| RAN | — Revenue anticipation notes |
| RDA | — Redevelopment Agency |
| RDFA | — Redevelopment Finance Authority |
| REIT | — Real estate investment trust |
| ROC | — Reset option certificates |
| SAVRS | — Select auction variable rate securities |
| SBA | — Small Business Authority |
| SDR | — Swedish depositary receipt |
| SFHR | — Single-family housing revenue |
| SFMR | — Single-family mortgage revenue |
| SIFMA | — Securities Industry and Financial Markets Association |
| SPA | — Standby purchase agreement |
| SPDR | — Standard & Poor’s Depositary Receipts |
| SPEAR | — Short Puttable Exempt Adjustable Receipts |
| STRIPS | — Separate trading of registered interest and |
| TAN | — Tax anticipation notes |
| TIPS | — Treasury inflation-protected securities |
| TRAN | — Tax revenue anticipation notes |
| TTFA | — Transportation Trust Fund Authority |
| TVA | — Tennessee Valley Authority |
This page is intentionally left blank.
This page is intentionally left blank.

For more information
More information about Wells Fargo Funds is available free upon request. To obtain literature, please write, email, visit the Fund’s website, or call:
Wells Fargo Funds
P.O. Box 8266
Boston, MA 02266-8266
Email: fundservice@wellsfargo.com
Website: wellsfargofunds.com
Individual investors: 1-800-222-8222
Retail investment professionals: 1-888-877-9275
Institutional investment professionals: 1-866-765-0778
This report and the financial statements contained herein are submitted for the general information of the shareholders of the Fund. If this report is used for promotional purposes, distribution of the report must be accompanied or preceded by a current prospectus. Before investing, please consider the investment objectives, risks, charges, and expenses of the investment. For a current prospectus and, if available, a summary prospectus, containing this information, call 1-800-222-8222 or visit the Fund’s website at wellsfargofunds.com. Read the prospectus carefully before you invest or send money.
Wells Fargo Asset Management (WFAM) is a trade name used by the asset management businesses of Wells Fargo & Company. Wells Fargo Funds Management, LLC, a wholly owned subsidiary of Wells Fargo & Company, provides investment advisory and administrative services for Wells Fargo Funds. Other affiliates of Wells Fargo & Company provide subadvisory and other services for the funds. The funds are distributed by Wells Fargo Funds Distributor, LLC, Member FINRA, an affiliate of Wells Fargo & Company. Neither Wells Fargo Funds Distributor nor Wells Fargo Funds Management holds fund shareholder accounts or assets. This material is for general informational and educational purposes only and is NOT intended to provide investment advice or a recommendation of any kind—including a recommendation for any specific investment, strategy, or plan.
NOT FDIC INSURED ◾ NO BANK GUARANTEE ◾ MAY LOSE VALUE
© 2017 Wells Fargo Funds Management, LLC. All rights reserved.
| | |
 | | 308058 02-18 SA248/SAR248 12-17 |
Semi-Annual Report
December 31, 2017

Wells Fargo California Tax-Free Fund


Reduce clutter. Save trees.
Sign up for electronic delivery of prospectuses and shareholder reports at wellsfargo.com/advantagedelivery
Contents
The views expressed and any forward-looking statements are as of December 31, 2017, unless otherwise noted, and are those of the Fund managers and/or Wells Fargo Funds Management, LLC. Discussions of individual securities, or the markets generally, or any Wells Fargo Fund are not intended as individual recommendations. Future events or results may vary significantly from those expressed in any forward-looking statements. The views expressed are subject to change at any time in response to changing circumstances in the market. Wells Fargo Funds Management, LLC and the Fund disclaim any obligation to publicly update or revise any views expressed or forward-looking statements.
NOT FDIC INSURED ◾ NO BANK GUARANTEE ◾ MAY LOSE VALUE
| | | | |
| 2 | | Wells Fargo California Tax-Free Fund | | Letter to shareholders (unaudited) |

Andrew Owen
President
Wells Fargo Funds
In a predominantly improving global economic environment, global stocks delivered strong results; bond markets had smaller but positive results as well.
Dear Shareholder:
We are pleased to offer you this semi-annual report for the Wells Fargo California Tax-Free Fund for the six-month period that ended December 31, 2017. In a predominantly improving global economic environment, global stocks delivered strong results; bond markets had smaller but positive results as well. U.S. and international stocks delivered similar results, with returns of 11.42% and 11.48%, respectively, for the six-month period, as measured by the S&P 500 Index1 and the MSCI ACWI ex USA Index (Net)2, respectively; within fixed income, the Bloomberg Barclays U.S. Aggregate Bond Index3 returned 1.24% and the Bloomberg Barclays Municipal Bond Index4 returned 1.82%.
As global growth improved in the third quarter of 2017, investment markets generally advanced.
Most stock markets worldwide moved higher during the quarter and ended the period at or near all-time highs. Moderate acceleration in global economic growth was supported by improving corporate earnings, low inflation pressure, and still-low interest rates. Corporate earnings reports were favorable overall as companies continued to benefit from healthy operating leverage. While North Korea’s recent missile launches and nuclear testing raised serious concerns around the world, the heightened geopolitical risk had relatively minimal impact on the quarter’s stock returns. In the U.S., economic data released during the quarter reflected a generally healthy economy. Second-quarter economic output grew at a 3.1% annual rate, and consumers displayed more willingness to spend. Meanwhile, the U.S. Federal Reserve (Fed) maintained the target range for the federal funds rate at 1.00% to 1.25%, noting that inflation had remained below the Fed’s 2.00% objective. However, the Fed also stated the possibility of one more 0.25% increase in the federal funds rate by the end of 2017 and announced plans to begin the process of unwinding its $4.5 trillion portfolio of bonds and other assets in October. Outside the U.S., stocks in the Asia Pacific region benefited from solid earnings reports and investors’ willingness to take on risk despite the rising tensions between North Korea and the U.S. In Europe, markets were supported by better-than-expected economic growth, which led to narrowing of the gap between Europe’s growth rate and that of the U.S. In emerging markets, many countries benefited from stronger currencies versus the U.S. dollar.
Positive economic and market news continued through the fourth quarter.
During the fourth quarter of 2017, stock markets followed a steady, upward trajectory with no meaningful pullbacks, similar to their paths during the previous three quarters of the year. The extended rally was driven largely by reports of strong earnings and revenue surprises from many companies. Synchronous economic expansion worldwide with mild inflation provided a favorable environment for markets to rise with minimal volatility. Data released during the quarter reflected a
| 1 | The S&P 500 Index consists of 500 stocks chosen for market size, liquidity, and industry group representation. It is a market-value-weighted index with each stock’s weight in the index proportionate to its market value. You cannot invest directly in an index. |
| 2 | The Morgan Stanley Capital International (MSCI) All Country World Index (ACWI) ex USA Index (Net) is a free-float-adjusted market-capitalization-weighted index that is designed to measure the equity market performance of developed markets, excluding the United States and Canada. Source: MSCI. MSCI makes no express or implied warranties or representations and shall have no liability whatsoever with respect to any MSCI data contained herein. The MSCI data may not be further redistributed or used as a basis for other indices or any securities or financial products. This report is not approved, reviewed, or produced by MSCI. You cannot invest directly in an index. |
| 3 | The Bloomberg Barclays U.S. Aggregate Bond Index is a broad-based benchmark that measures the investment-grade, U.S. dollar-denominated, fixed-rate taxable bond market, including Treasuries, government-related and corporate securities, mortgage-backed securities (agency fixed-rate and hybrid adjustable-rate mortgage pass-throughs), asset-backed securities, and commercial mortgage-backed securities. You cannot invest directly in an index. |
| 4 | The Bloomberg Barclays Municipal Bond Index is an unmanaged index composed of long-term tax-exempt bonds with a minimum credit rating of Baa. You cannot invest directly in an index. |
| | | | | | |
| Letter to shareholders (unaudited) | | Wells Fargo California Tax-Free Fund | | | 3 | |
healthy U.S. economy. Third-quarter economic output grew at a 3.2% annual rate, just ahead of the second quarter’s 3.1% pace. Hiring remained solid during the quarter; the hiring pace pushed the unemployment rate down to a 17-year low of 4.1% in October, and it remained at 4.1% for both November and December. Fed officials began unwinding the Fed’s $4.5 trillion portfolio of bonds and other assets in October as planned, and in December they raised the target for the federal funds rate to a range of 1.25% to 1.50%. As a result, long-term interest rates in the U.S. continued trending upward, although the 10-year rate remained below 2.5%. Outside the U.S., economies continued to strengthen. In December, the Organisation for Economic Co-operation and Development (OECD) reported that the global economy has been expanding at its fastest rate since 2010; all 45 countries the OECD follows were on track to expand for 2017. International economies have benefited from catalysts such as economic stimulus, improving employment, increased investment, and accelerated trade growth.
Don’t let short-term uncertainty derail long-term investment goals.
Periods of investment uncertainty can present challenges, but experience has taught us that maintaining long-term investment goals can be an effective way to plan for the future. To help you create a sound strategy based on your personal goals and risk tolerance, Wells Fargo Funds offers more than 100 mutual funds spanning a wide range of asset classes and investment styles. Although diversification cannot guarantee an investment profit or prevent losses, we believe it can be an effective way to manage investment risk and potentially smooth out overall portfolio performance. We encourage investors to know their investments and to understand that appropriate levels of risk-taking may unlock opportunities.
Thank you for choosing to invest with Wells Fargo Funds. We appreciate your confidence in us and remain committed to helping you meet your financial needs.
Sincerely,

Andrew Owen
President
Wells Fargo Funds
Although diversification cannot guarantee an investment profit or prevent losses, we believe it can be an effective way to manage investment risk and potentially smooth out overall portfolio performance.
For further information about your Fund, contact your investment professional, visit our website at wellsfargofunds.com, or call us directly at 1-800-222-8222. We are available 24 hours a day, 7 days a week.
| | | | |
| 4 | | Wells Fargo California Tax-Free Fund | | Performance highlights (unaudited) |
Investment objective
The Fund seeks current income exempt from federal income tax and California individual income tax.
Manager
Wells Fargo Funds Management, LLC
Subadviser
Wells Capital Management Incorporated
Portfolio managers
Terry J. Goode
Robert J. Miller
Adrian Van Poppel
Average annual total returns (%) as of December 31, 20171
| | | | | | | | | | | | | | | | | | | | | | | | | | | | | | | | | | |
| | | | | Including sales charge | | | Excluding sales charge | | | Expense ratios2 (%) | |
| | | Inception date | | 1 year | | | 5 year | | | 10 year | | | 1 year | | | 5 year | | | 10 year | | | Gross | | | Net3 | |
| Class A (SCTAX) | | 10-6-1988 | | | 0.31 | | | | 2.67 | | | | 4.18 | | | | 5.04 | | | | 3.62 | | | | 4.67 | | | | 0.82 | | | | 0.75 | |
| Class C (SCTCX) | | 7-1-1993 | | | 3.31 | | | | 2.86 | | | | 3.90 | | | | 4.31 | | | | 2.86 | | | | 3.90 | | | | 1.57 | | | | 1.50 | |
| Administrator Class (SGCAX) | | 12-15-1997 | | | – | | | | – | | | | – | | | | 5.25 | | | | 3.83 | | | | 4.89 | | | | 0.76 | | | | 0.55 | |
| Institutional Class (SGTIX) | | 10-31-2014 | | | – | | | | – | | | | – | | | | 5.32 | | | | 3.87 | | | | 4.91 | | | | 0.49 | | | | 0.48 | |
| Bloomberg Barclays Municipal Bond Index4 | | – | | | – | | | | – | | | | – | | | | 5.45 | | | | 3.02 | | | | 4.46 | | | | – | | | | – | |
| Bloomberg Barclays California Municipal Bond Index5 | | – | | | – | | | | – | | | | – | | | | 5.63 | | | | 3.36 | | | | 4.72 | | | | – | | | | – | |
Figures quoted represent past performance, which is no guarantee of future results, and do not reflect taxes that a shareholder may pay on fund distributions or the redemption of fund shares. Investment return and principal value of an investment will fluctuate so that an investor’s shares, when redeemed, may be worth more or less than their original cost. Performance shown without sales charges would be lower if sales charges were reflected. Current performance may be lower or higher than the performance data quoted, which assumes the reinvestment of dividends and capital gains. Current month-end performance is available on the Fund’s website, wellsfargofunds.com.
Index returns do not include transaction costs associated with buying and selling securities, any mutual fund fees or expenses, or any taxes. It is not possible to invest directly in an index.
For Class A shares, the maximum front-end sales charge is 4.50%. For Class C shares, the maximum contingent deferred sales charge is 1.00%. Performance including a contingent deferred sales charge assumes the sales charge for the corresponding time period. Administrator Class and Institutional Class shares are sold without a front-end sales charge or contingent deferred sales charge.
Bond values fluctuate in response to the financial condition of individual issuers, general market and economic conditions, and changes in interest rates. Changes in market conditions and government policies may lead to periods of heightened volatility in the bond market and reduced liquidity for certain bonds held by the Fund. In general, when interest rates rise, bond values fall and investors may lose principal value. Interest-rate changes and their impact on the Fund and its share price can be sudden and unpredictable. The use of derivatives may reduce returns and/or increase volatility. Certain investment strategies tend to increase the total risk of an investment (relative to the broader market). The Fund is exposed to California municipal securities risk, high-yield securities risk, and non-diversification risk. Consult the Fund’s prospectus for additional information on these and other risks. A portion of the Fund’s income may be subject to federal, state, and/or local income taxes or the Alternative Minimum Tax (AMT). Any capital gains distributions may be taxable.
Please see footnotes on page 5.
| | | | | | |
| Performance highlights (unaudited) | | Wells Fargo California Tax-Free Fund | | | 5 | |
|
| Effective maturity distribution as of December 31, 20176 |
|
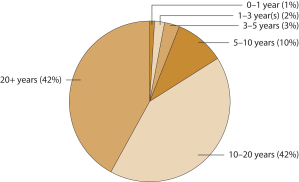 |
|
| Credit quality as of December 31, 20177 |
|
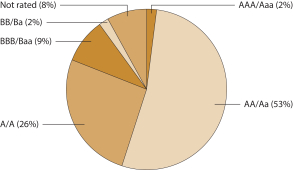
|
| 1 | Historical performance shown for the Institutional Class shares prior to their inception reflects the performance of the Administrator Class shares and includes the higher expenses applicable to Administrator Class shares. If these expenses had not been included, returns for Institutional Class shares would be higher. |
| 2 | Reflects the expense ratios as stated in the most recent prospectuses. The expense ratios shown are subject to change and may differ from the annualized expense ratios shown in the financial highlights of this report. |
| 3 | The manager has contractually committed through October 31, 2018, to waive fees and/or reimburse expenses to the extent necessary to cap the Fund’s Total Annual Fund Operating Expenses After Fee Waivers at the amounts shown. After this time, the cap may be increased or the commitment to maintain the cap may be terminated only with the approval of the Board of Trustees. Brokerage commissions, stamp duty fees, interest, taxes, acquired fund fees and expenses, and extraordinary expenses are excluded from the expense cap. Without this cap, the Fund’s returns would have been lower. The expense ratio paid by an investor is the net expense ratio or the Fund’s Total Annual Fund Operating Expenses After Fee Waivers, as stated in the prospectuses. |
| 4 | The Bloomberg Barclays Municipal Bond Index is an unmanaged index composed of long-term tax-exempt bonds with a minimum credit rating of Baa. You cannot invest directly in an index. |
| 5 | The Bloomberg Barclays California Municipal Bond Index is the California component of the Bloomberg Barclays Municipal Bond Index. You cannot invest directly in an index. |
| 6 | Amounts are calculated based on the total investments of the Fund. These amounts are subject to change and may have changed since the date specified. |
| 7 | The credit quality distribution of portfolio holdings reflected in the chart is based on ratings from Standard & Poor’s, Moody’s Investors Service, and/or Fitch Ratings Ltd. Credit quality ratings apply to the underlying holdings of the Fund and not to the Fund itself. The percentages of the Fund’s portfolio with the ratings depicted in the chart are calculated based on the total market value of fixed income securities held by the Fund. If a security was rated by all three rating agencies, the middle rating was utilized. If rated by two of three rating agencies, the lower rating was utilized, and if rated by one of the rating agencies, that rating was utilized. Standard & Poor’s rates the creditworthiness of bonds, ranging from AAA (highest) to D (lowest). Ratings from A to CCC may be modified by the addition of a plus (+) or minus (-) sign to show relative standing within the rating categories. Standard & Poor’s rates the creditworthiness of short-term notes from SP-1 (highest) to SP-3 (lowest). Moody’s rates the creditworthiness of bonds, ranging from Aaa (highest) to C (lowest). Ratings Aa to B may be modified by the addition of a number 1 (highest) to 3 (lowest) to show relative standing within the ratings categories. Moody’s rates the creditworthiness of short-term U.S. tax-exempt municipal securities from MIG 1/VMIG 1 (highest) to SG (lowest). Fitch rates the creditworthiness of bonds, ranging from AAA (highest) to D (lowest). Credit quality distribution is subject to change and may have changed since the date specified. |
| | | | |
| 6 | | Wells Fargo California Tax-Free Fund | | Fund expenses (unaudited) |
As a shareholder of the Fund, you incur two types of costs: (1) transaction costs, including sales charges (loads) on purchase payments and contingent deferred sales charges (if any) on redemptions and (2) ongoing costs, including management fees, distribution (12b-1) and/or shareholder servicing fees, and other Fund expenses. This example is intended to help you understand your ongoing costs (in dollars) of investing in the Fund and to compare these costs with the ongoing costs of investing in other mutual funds.
The example is based on an investment of $1,000 invested at the beginning of the six-month period and held for the entire period from July 1, 2017 to December 31, 2017.
Actual expenses
The “Actual” line of the table below provides information about actual account values and actual expenses. You may use the information in this line, together with the amount you invested, to estimate the expenses that you paid over the period. Simply divide your account value by $1,000 (for example, an $8,600 account value divided by $1,000 = 8.6), then multiply the result by the number in the “Actual” line under the heading entitled “Expenses paid during period” for your applicable class of shares to estimate the expenses you paid on your account during this period.
Hypothetical example for comparison purposes
The “Hypothetical” line of the table below provides information about hypothetical account values and hypothetical expenses based on the Fund’s actual expense ratio and an assumed rate of return of 5% per year before expenses, which is not the Fund’s actual return. The hypothetical account values and expenses may not be used to estimate the actual ending account balance or expenses you paid for the period. You may use this information to compare the ongoing costs of investing in the Fund and other funds. To do so, compare this 5% hypothetical example with the 5% hypothetical examples that appear in the shareholder reports of the other funds.
Please note that the expenses shown in the table are meant to highlight your ongoing costs only and do not reflect any transactional costs, such as sales charges (loads) and contingent deferred sales charges. Therefore, the “Hypothetical” line of the table is useful in comparing ongoing costs only and will not help you determine the relative total costs of owning different funds. In addition, if these transactional costs were included, your costs would have been higher.
| | | | | | | | | | | | | | | | |
| | | Beginning account value 7-1-2017 | | | Ending account value 12-31-2017 | | | Expenses paid during the period¹ | | | Annualized net expense ratio | |
Class A | | | | | | | | | | | | | | | | |
Actual | | $ | 1,000.00 | | | $ | 1,018.70 | | | $ | 3.82 | | | | 0.75 | % |
Hypothetical (5% return before expenses) | | $ | 1,000.00 | | | $ | 1,021.42 | | | $ | 3.82 | | | | 0.75 | % |
Class C | | | | | | | | | | | | | | | | |
Actual | | $ | 1,000.00 | | | $ | 1,014.78 | | | $ | 7.62 | | | | 1.50 | % |
Hypothetical (5% return before expenses) | | $ | 1,000.00 | | | $ | 1,017.64 | | | $ | 7.63 | | | | 1.50 | % |
Administrator Class | | | | | | | | | | | | | | | | |
Actual | | $ | 1,000.00 | | | $ | 1,018.86 | | | $ | 2.80 | | | | 0.55 | % |
Hypothetical (5% return before expenses) | | $ | 1,000.00 | | | $ | 1,022.43 | | | $ | 2.80 | | | | 0.55 | % |
Institutional Class | | | | | | | | | | | | | | | | |
Actual | | $ | 1,000.00 | | | $ | 1,019.21 | | | $ | 2.44 | | | | 0.48 | % |
Hypothetical (5% return before expenses) | | $ | 1,000.00 | | | $ | 1,022.79 | | | $ | 2.45 | | | | 0.48 | % |
| 1 | Expenses paid is equal to the annualized net expense ratio of each class multiplied by the average account value over the period, multiplied by the number of days in the most recent fiscal half-year divided by the number of days in the fiscal year (to reflect the one-half-year period). |
| | | | | | |
| Portfolio of investments—December 31, 2017 (unaudited) | | Wells Fargo California Tax-Free Fund | | | 7 | |
| | | | | | | | | | | | | | | | |
| Security name | | Interest rate | | | Maturity date | | | Principal | | | Value | |
|
Municipal Obligations: 98.42% | |
|
| California: 96.32% | |
ABC California Unified School District CAB Series B (GO Revenue, National Insured) ¤ | | | 0.00 | % | | | 8-1-2018 | | | $ | 1,500,000 | | | $ | 1,488,210 | |
Adelanto CA Public Utility Authority Refunding Bond (Water & Sewer Revenue, AGM Insured) | | | 5.00 | | | | 7-1-2039 | | | | 2,000,000 | | | | 2,254,340 | |
Alameda CA Joint Powers Authority Multiple Capital Projects Series A (Miscellaneous Revenue) | | | 5.00 | | | | 12-1-2034 | | | | 1,005,000 | | | | 1,152,353 | |
Alameda County CA Corridor Transportation Authority Prerefunded CAB Subordinate Lien Series A (Transportation Revenue, Ambac Insured) ¤ | | | 0.00 | | | | 10-1-2018 | | | | 2,955,000 | | | | 2,924,682 | |
Alameda County CA Corridor Transportation Authority Prerefunded CAB Subordinate Lien Series A (Transportation Revenue, Ambac Insured) ¤ | | | 0.00 | | | | 10-1-2019 | | | | 2,780,000 | | | | 2,704,718 | |
Alameda County CA Corridor Transportation Authority Unrefunded CAB Subordinate Lien Series A (Transportation Revenue, Ambac Insured) ¤ | | | 0.00 | | | | 10-1-2018 | | | | 940,000 | | | | 924,951 | |
Alameda County CA Corridor Transportation Authority Unrefunded CAB Subordinate Lien Series A (Transportation Revenue, Ambac Insured) ¤ | | | 0.00 | | | | 10-1-2019 | | | | 220,000 | | | | 210,995 | |
Alhambra CA Unified School District Election of 2008 Series B (GO Revenue, AGM Insured) | | | 6.00 | | | | 8-1-2029 | | | | 4,100,000 | | | | 4,714,016 | |
Alvord CA Unified School District Election of 2012 Series A (GO Revenue, AGM Insured) | | | 5.25 | | | | 8-1-2037 | | | | 1,620,000 | | | | 1,859,663 | |
Anaheim CA PFA CAB Subordinate Lien Public Improvements Project Series C (Miscellaneous Revenue, AGM Insured) ¤ | | | 0.00 | | | | 9-1-2025 | | | | 10,000,000 | | | | 8,130,400 | |
Anaheim CA PFA CAB Subordinate Lien Public Improvements Project Series C (Miscellaneous Revenue, AGM Insured) ¤ | | | 0.00 | | | | 9-1-2018 | | | | 1,210,000 | | | | 1,197,634 | |
Anaheim CA PFA Convention Center Expansion Project Series A (Miscellaneous Revenue) | | | 5.00 | | | | 5-1-2039 | | | | 3,000,000 | | | | 3,466,710 | |
Anaheim CA PFA Convention Center Expansion Project Series A (Miscellaneous Revenue) | | | 5.00 | | | | 5-1-2046 | | | | 3,000,000 | | | | 3,447,690 | |
Antelope Valley CA Healthcare District Refunding Bond Series A (Health Revenue) | | | 5.25 | | | | 3-1-2036 | | | | 3,000,000 | | | | 3,296,010 | |
Banning CA Financing Authority Refunding Bond Electric System Project (Utilities Revenue, AGM Insured) | | | 5.00 | | | | 6-1-2037 | | | | 5,000,000 | | | | 5,724,250 | |
Bassett CA Unified School District Refunding Bond Series B (GO Revenue, Build America Mutual Assurance Company Insured) | | | 5.00 | | | | 8-1-2027 | | | | 1,050,000 | | | | 1,253,354 | |
Bay Area CA Toll Authority Toll Bridge Series S-4 (Transportation Revenue) | | | 5.00 | | | | 4-1-2030 | | | | 2,000,000 | | | | 2,325,400 | |
Bay Area CA Water Supply & Conservation Agency Series A (Water & Sewer Revenue) | | | 5.00 | | | | 10-1-2034 | | | | 6,000,000 | | | | 6,895,020 | |
Beaumont CA Unified School District Election of 2008 Series D (GO Revenue, Build America Mutual Assurance Company Insured) | | | 5.25 | | | | 8-1-2044 | | | | 2,000,000 | | | | 2,422,460 | |
Belmont CA Community Facilities Special Tax District #2000-1 Library Project Series A (Tax Revenue, Ambac Insured) | | | 5.75 | | | | 8-1-2030 | | | | 3,190,000 | | | | 4,172,265 | |
Cabrillo CA Unified School District CAB Series A (GO Revenue, Ambac Insured) ¤ | | | 0.00 | | | | 8-1-2021 | | | | 1,500,000 | | | | 1,394,445 | |
California (GO Revenue) | | | 5.00 | | | | 8-1-2025 | | | | 15,000 | | | | 15,039 | |
California (GO Revenue) | | | 5.00 | | | | 8-1-2046 | | | | 10,000,000 | | | | 11,817,600 | |
California (GO Revenue) | | | 5.25 | | | | 11-1-2040 | | | | 3,000,000 | | | | 3,280,560 | |
California AMT Department of Veterans Affairs Series BZ (GO Revenue, National Insured) | | | 5.35 | | | | 12-1-2021 | | | | 5,000 | | | | 5,012 | |
California Association of Bay Area Governments Finance Authority for Nonprofit Corporations O’Connor Woods Project (Health Revenue) | | | 5.00 | | | | 1-1-2043 | | | | 5,000,000 | | | | 5,630,150 | |
California Association of Bay Area Governments Finance Authority for Nonprofit Corporations Odd Fellows Home Project Series A (Health Revenue) | | | 5.00 | | | | 4-1-2042 | | | | 1,100,000 | | | | 1,237,797 | |
California Educational Facilities Authority Loma Linda University Series A (Education Revenue) | | | 5.00 | | | | 4-1-2042 | | | | 2,645,000 | | | | 3,078,489 | |
California HFFA Catholic Healthcare West Series A (Health Revenue) | | | 5.25 | | | | 3-1-2023 | | | | 3,000,000 | | | | 3,309,750 | |
The accompanying notes are an integral part of these financial statements.
| | | | |
| 8 | | Wells Fargo California Tax-Free Fund | | Portfolio of investments—December 31, 2017 (unaudited) |
| | | | | | | | | | | | | | | | |
| Security name | | Interest rate | | | Maturity date | | | Principal | | | Value | |
|
| California (continued) | |
California HFFA Catholic Healthcare West Series A (Health Revenue) | | | 6.00 | % | | | 7-1-2029 | | | $ | 4,000,000 | | | $ | 4,261,960 | |
California HFFA El Camino Hospital (Health Revenue) | | | 5.00 | | | | 2-1-2035 | | | | 3,000,000 | | | | 3,534,330 | |
California HFFA Nevada Methodist Homes (Health Revenue, California Mortgage Insured) | | | 5.00 | | | | 7-1-2030 | | | | 1,830,000 | | | | 2,149,097 | |
California HFFA Nevada Methodist Homes (Health Revenue, California Mortgage Insured) | | | 5.00 | | | | 7-1-2035 | | | | 1,000,000 | | | | 1,155,110 | |
California HFFA Nevada Methodist Homes (Health Revenue, California Mortgage Insured) | | | 5.00 | | | | 7-1-2045 | | | | 4,500,000 | | | | 5,132,430 | |
California HFFA Prerefunded Bond Providence Health Services Series C (Health Revenue) | | | 6.50 | | | | 10-1-2038 | | | | 100,000 | | | | 103,769 | |
California HFFA Refunding Bond Cedars Sinai Medical Center Series B (Health Revenue) | | | 4.00 | | | | 8-15-2039 | | | | 10,500,000 | | | | 11,399,850 | |
California HFFA Refunding Bond Children’s Hospital Series A (Health Revenue) | | | 5.00 | | | | 8-15-2047 | | | | 5,000,000 | | | | 5,816,250 | |
California HFFA Refunding Bond Sutter Health Series A (Health Revenue) | | | 5.00 | | | | 11-15-2048 | | | | 5,000,000 | | | | 5,928,200 | |
California HFFA Sutter Health Series D (Health Revenue) | | | 5.25 | | | | 8-15-2031 | | | | 3,100,000 | | | | 3,479,750 | |
California Infrastructure & Economic Development King City Joint Union High School (Miscellaneous Revenue) | | | 5.75 | | | | 8-15-2029 | | | | 2,150,000 | | | | 2,330,235 | |
California Municipal Finance Authority California Baptist University Series A (Education Revenue) 144A | | | 4.00 | | | | 11-1-2021 | | | | 850,000 | | | | 872,517 | |
California Municipal Finance Authority California Baptist University Series A (Education Revenue) 144A | | | 5.00 | | | | 11-1-2025 | | | | 1,025,000 | | | | 1,139,431 | |
California Municipal Finance Authority Charter School Albert Einstein Academies Project Series A (Education Revenue) | | | 6.75 | | | | 8-1-2033 | | | | 1,525,000 | | | | 1,690,264 | |
California Municipal Finance Authority Charter School Albert Einstein Academies Project Series A (Miscellaneous Revenue) | | | 7.13 | | | | 8-1-2043 | | | | 1,000,000 | | | | 1,115,130 | |
California Municipal Finance Authority Mobile Senior Caritas Projects Series A (Housing Revenue) | | | 5.00 | | | | 8-15-2029 | | | | 500,000 | | | | 588,010 | |
California Municipal Finance Authority Refunding Bond Biola University Incorporated (Education Revenue) | | | 5.00 | | | | 10-1-2035 | | | | 600,000 | | | | 711,306 | |
California Municipal Finance Authority Refunding Bond Channing House Project Series A (Health Revenue) | | | 5.00 | | | | 5-15-2034 | | | | 1,000,000 | | | | 1,197,430 | |
California Municipal Finance Authority Refunding Bond Community Medical Centers Series A (Health Revenue) | | | 5.00 | | | | 2-1-2047 | | | | 4,000,000 | | | | 4,570,680 | |
California Municipal Finance Authority Refunding Bond Eisenhower Medical Center Series A (Health Revenue) | | | 5.00 | | | | 7-1-2047 | | | | 1,400,000 | | | | 1,596,308 | |
California Municipal Finance Authority Refunding Bond Institute on Aging Project (Health Revenue) | | | 5.00 | | | | 8-15-2036 | | | | 690,000 | | | | 822,314 | |
California Municipal Finance Authority Refunding Bond Institute on Aging Project (Health Revenue) | | | 5.00 | | | | 8-15-2037 | | | | 1,120,000 | | | | 1,331,635 | |
California Municipal Financing Authority BAN Open Door Community Health Centers (Health Revenue) | | | 2.80 | | | | 9-15-2018 | | | | 3,000,000 | | | | 3,002,820 | |
California Municipal Financing Authority Charter School Palmdale Aerospace Academy Project (Education Revenue) 144A | | | 5.00 | | | | 7-1-2041 | | | | 1,250,000 | | | | 1,290,150 | |
California Municipal Financing Authority University of the Pacific Program (Education Revenue) | | | 5.00 | | | | 11-1-2048 | | | | 1,750,000 | | | | 1,883,578 | |
California PCFA Solid Waste Disposal AMT Green Bond Calplant I Project (Industrial Development Revenue) 144A | | | 8.00 | | | | 7-1-2039 | | | | 2,000,000 | | | | 2,255,440 | |
California PFA NCCD-Claremont Properties LLC University Housing Project Series A (Housing Revenue) 144A | | | 5.00 | | | | 7-1-2047 | | | | 2,950,000 | | | | 3,239,808 | |
California PFA Refunding Bond Henry Mayo Newhall Hospital (Health Revenue) | | | 5.00 | | | | 10-15-2037 | | | | 500,000 | | | | 565,960 | |
California PFA Refunding Bond Henry Mayo Newhall Hospital (Health Revenue) | | | 5.00 | | | | 10-15-2047 | | | | 4,000,000 | | | | 4,491,920 | |
California PFA Sharp Healthcare Series A (Health Revenue) | | | 4.00 | | | | 8-1-2047 | | | | 5,000,000 | | | | 5,364,450 | |
The accompanying notes are an integral part of these financial statements.
| | | | | | |
| Portfolio of investments—December 31, 2017 (unaudited) | | Wells Fargo California Tax-Free Fund | | | 9 | |
| | | | | | | | | | | | | | | | |
| Security name | | Interest rate | | | Maturity date | | | Principal | | | Value | |
|
| California (continued) | |
California PFA Sharp Healthcare Series A (Health Revenue) | | | 5.00 | % | | | 8-1-2047 | | | $ | 4,000,000 | | | $ | 4,791,280 | |
California Prerefunded Bond (GO Revenue) | | | 5.25 | | | | 3-1-2038 | | | | 1,535,000 | | | | 1,544,763 | |
California Prerefunded Bond (GO Revenue) | | | 5.25 | | | | 8-1-2038 | | | | 985,000 | | | | 1,007,192 | |
California Public Works Board California State University Projects Series B-1 (Miscellaneous Revenue) | | | 5.70 | | | | 3-1-2035 | | | | 2,210,000 | | | | 2,388,877 | |
California Public Works Board Judicial Council Projects Series A (Miscellaneous Revenue) | | | 5.00 | | | | 3-1-2038 | | | | 7,000,000 | | | | 7,871,080 | |
California Public Works Board Judicial Council Projects Series D (Miscellaneous Revenue) | | | 5.25 | | | | 12-1-2025 | | | | 4,000,000 | | | | 4,523,720 | |
California Public Works Board Various Capital Projects Series A (Miscellaneous Revenue) | | | 5.00 | | | | 4-1-2037 | | | | 4,925,000 | | | | 5,478,619 | |
California Public Works Board Various Capital Projects Series G (Miscellaneous Revenue) | | | 5.00 | | | | 11-1-2037 | | | | 23,000,000 | | | | 25,933,650 | |
California Public Works Board Various Capital Projects Series I (Miscellaneous Revenue) | | | 5.50 | | | | 11-1-2033 | | | | 2,000,000 | | | | 2,354,300 | |
California Public Works University of California Board of Regents Series G (Miscellaneous Revenue) | | | 5.00 | | | | 12-1-2030 | | | | 9,850,000 | | | | 11,102,625 | |
California Refunded Bond (GO Revenue) | | | 5.13 | | | | 4-1-2033 | | | | 4,320,000 | | | | 4,360,306 | |
California School Finance Authority Bright Star Schools Obligation Group (Education Revenue) 144A | | | 5.00 | | | | 6-1-2047 | | | | 1,000,000 | | | | 1,044,220 | |
California School Finance Authority Bright Star Schools Obligation Group (Education Revenue) 144A | | | 5.00 | | | | 6-1-2054 | | | | 1,000,000 | | | | 1,036,420 | |
California School Finance Authority Classical Academies Project Series A (Education Revenue) 144A | | | 3.25 | | | | 10-1-2022 | | | | 2,995,000 | | | | 3,001,439 | |
California School Finance Authority Green Dot Public Schools Projects (Education Revenue) 144A | | | 4.00 | | | | 8-1-2025 | | | | 475,000 | | | | 505,647 | |
California School Finance Authority Green Dot Public Schools Projects (Education Revenue) 144A | | | 5.00 | | | | 8-1-2035 | | | | 2,525,000 | | | | 2,764,572 | |
California School Finance Authority KIPP Louisiana School Projects Series A (Education Revenue) 144A | | | 5.00 | | | | 7-1-2035 | | | | 1,000,000 | | | | 1,150,720 | |
California School Finance Authority Rocketship Education Series A (Education Revenue) 144A | | | 5.00 | | | | 6-1-2036 | | | | 945,000 | | | | 989,623 | |
California School Finance Authority Rocketship Education Series A (Education Revenue) 144A | | | 5.00 | | | | 6-1-2046 | | | | 2,100,000 | | | | 2,182,908 | |
California Special District Association Finance Corporation Program Series MM (Miscellaneous Revenue) | | | 5.50 | | | | 6-1-2021 | | | | 505,000 | | | | 506,636 | |
California Statewide CDA Adventist Health System Series A (Health Revenue) | | | 5.00 | | | | 3-1-2045 | | | | 2,500,000 | | | | 2,840,525 | |
California Statewide CDA Enloe Medical Center (Health Revenue, Ambac Insured) | | | 5.00 | | | | 8-15-2033 | | | | 1,650,000 | | | | 1,942,001 | |
California Statewide CDA Enloe Medical Center (Health Revenue, Ambac Insured) | | | 5.00 | | | | 8-15-2035 | | | | 1,000,000 | | | | 1,171,380 | |
California Statewide CDA Enloe Medical Center (Health Revenue, Ambac Insured) | | | 5.00 | | | | 8-15-2038 | | | | 2,000,000 | | | | 2,331,640 | |
California Statewide CDA Loma Linda University Medical Center Refunding Bond Series A (Health Revenue) | | | 5.25 | | | | 12-1-2044 | | | | 5,150,000 | | | | 5,685,549 | |
California Statewide CDA Poway Retirement Housing Foundation Housing Incorporated Series A (Housing Revenue) | | | 5.25 | | | | 11-15-2035 | | | | 1,500,000 | | | | 1,747,770 | |
California Statewide CDA Redwoods Projects (Health Revenue) | | | 5.13 | | | | 11-15-2035 | | | | 1,500,000 | | | | 1,731,270 | |
California Statewide CDA Refunding Bond California Baptist University Series A (Education Revenue) 144A | | | 5.00 | | | | 11-1-2032 | | | | 1,135,000 | | | | 1,270,485 | |
California Statewide CDA Refunding Bond California Baptist University Series A (Education Revenue) 144A | | | 5.00 | | | | 11-1-2041 | | | | 2,875,000 | | | | 3,158,073 | |
California Statewide CDA Refunding Bond Front Porch Communities & Services Series A (Health Revenue) | | | 5.00 | | | | 4-1-2047 | | | | 1,500,000 | | | | 1,727,490 | |
The accompanying notes are an integral part of these financial statements.
| | | | |
| 10 | | Wells Fargo California Tax-Free Fund | | Portfolio of investments—December 31, 2017 (unaudited) |
| | | | | | | | | | | | | | | | |
| Security name | | Interest rate | | | Maturity date | | | Principal | | | Value | |
|
| California (continued) | |
California Statewide CDA School Facility Alliance for College-Ready Public Schools (Education Revenue) | | | 6.75 | % | | | 7-1-2031 | | | $ | 1,625,000 | | | $ | 1,816,571 | |
California Statewide CDA School Facility Aspire Public Schools (Education Revenue) | | | 5.00 | | | | 7-1-2020 | | | | 980,000 | | | | 1,005,470 | |
California Statewide CDA School Facility Aspire Public Schools (Education Revenue) | | | 5.20 | | | | 7-1-2020 | | | | 200,000 | | | | 205,546 | |
California Statewide CDA St. Joseph Health System (Health Revenue, AGM Insured) | | | 5.25 | | | | 7-1-2021 | | | | 1,775,000 | | | | 1,808,459 | |
California Statewide CDA University of California Irvine Campus Apartments Phase IV Series A (Education Revenue) | | | 5.00 | | | | 5-15-2047 | | | | 5,000,000 | | | | 5,815,550 | |
California Statewide CDA Water & Wastewater Pooled Financing Program Series B (Water & Sewer Revenue, AGM Insured) | | | 5.25 | | | | 10-1-2027 | | | | 1,040,000 | | | | 1,043,016 | |
California Statewide Communities Development Authority Community Facilities District #2015-01 (Tax Revenue) | | | 5.00 | | | | 9-1-2047 | | | | 1,420,000 | | | | 1,574,823 | |
California Statewide Communities Development Authority Series C (Miscellaneous Revenue) | | | 5.00 | | | | 9-2-2047 | | | | 1,775,000 | | | | 1,959,440 | |
California Statewide Series B (1 Month LIBOR +0.76%) (GO Revenue) ± | | | 1.71 | | | | 12-1-2031 | | | | 2,500,000 | | | | 2,528,850 | |
California University Systemwide Refunding Bond Series A (Education Revenue) | | | 4.00 | | | | 11-1-2038 | | | | 8,000,000 | | | | 8,609,840 | |
California University Systemwide Refunding Bond Series A (Education Revenue) | | | 5.00 | | | | 11-1-2045 | | | | 6,400,000 | | | | 7,527,552 | |
California Unrefunded Bond (GO Revenue) | | | 5.25 | | | | 8-1-2038 | | | | 940,000 | | | | 960,464 | |
California Various Purpose Refunding Bond (GO Revenue) | | | 5.00 | | | | 9-1-2035 | | | | 35,000,000 | | | | 41,865,600 | |
California Various Purposes (GO Revenue) | | | 5.00 | | | | 9-1-2029 | | | | 1,475,000 | | | | 1,642,590 | |
California Various Purposes (GO Revenue) | | | 5.00 | | | | 10-1-2029 | | | | 7,000,000 | | | | 7,403,900 | |
California Various Purposes (GO Revenue) | | | 5.00 | | | | 9-1-2032 | | | | 5,100,000 | | | | 5,888,358 | |
California Various Purposes (GO Revenue) | | | 5.00 | | | | 2-1-2038 | | | | 5,000,000 | | | | 5,674,200 | |
California Various Purposes (GO Revenue) | | | 5.25 | | | | 9-1-2028 | | | | 5,000,000 | | | | 5,636,850 | |
California Various Purposes (GO Revenue) | | | 5.25 | | | | 10-1-2029 | | | | 800,000 | | | | 849,872 | |
California Various Purposes (GO Revenue) | | | 5.25 | | | | 4-1-2035 | | | | 12,640,000 | | | | 14,347,411 | |
California Various Purposes (GO Revenue) | | | 5.60 | | | | 3-1-2036 | | | | 8,715,000 | | | | 9,419,433 | |
California Various Purposes (GO Revenue) | | | 5.75 | | | | 4-1-2029 | | | | 1,600,000 | | | | 1,682,672 | |
California Various Purposes (GO Revenue) | | | 5.75 | | | | 4-1-2031 | | | | 3,380,000 | | | | 3,553,360 | |
California Various Purposes (GO Revenue) | | | 6.00 | | | | 4-1-2035 | | | | 2,140,000 | | | | 2,258,235 | |
California Various Purposes (GO Revenue) | | | 6.00 | | | | 4-1-2038 | | | | 23,465,000 | | | | 24,737,507 | |
California Various Purposes Prerefunded Bond Series 2017 (GO Revenue) | | | 5.25 | | | | 3-1-2038 | | | | 635,000 | | | | 639,039 | |
California Various Purposes Unrefunded Bond Series 2017 (GO Revenue) | | | 5.25 | | | | 3-1-2038 | | | | 130,000 | | | | 130,827 | |
Casitas CA Municipal Water District Community Facilities District #2013-1-OJAI Series B (Tax Revenue, Build America Mutual Assurance Company Insured) | | | 5.25 | | | | 9-1-2047 | | | | 5,000,000 | | | | 6,077,700 | |
Cathedral City CA RDA Successor Agency to Merged Redevelopment Project Tax Allocation Bond Series A (Tax Revenue, AGM Insured) | | | 5.00 | | | | 8-1-2032 | | | | 1,450,000 | | | | 1,648,795 | |
Cathedral City CA RDA Successor Agency to Merged Redevelopment Project Tax Allocation Bond Series A (Tax Revenue, AGM Insured) | | | 5.00 | | | | 8-1-2033 | | | | 880,000 | | | | 998,950 | |
Center Unified School District California CAB Series C (GO Revenue, National Insured) ¤ | | | 0.00 | | | | 9-1-2021 | | | | 5,000,000 | | | | 4,655,400 | |
Centinela Valley CA Union High School District Election of 2008 Series B (GO Revenue) | | | 6.00 | | | | 8-1-2036 | | | | 2,500,000 | | | | 3,050,350 | |
Centinela Valley CA Union High School District Election of 2008 Series C (GO Revenue) | | | 5.00 | | | | 8-1-2035 | | | | 2,000,000 | | | | 2,331,840 | |
Central Valley CA School District Financing Authority Series A (Miscellaneous Revenue, National Insured) | | | 6.45 | | | | 2-1-2018 | | | | 225,000 | | | | 225,794 | |
Cerritos CA Community College CAB Election of 2004 (GO Revenue) ¤ | | | 0.00 | | | | 8-1-2029 | | | | 1,750,000 | | | | 1,274,123 | |
Cerritos CA Community College CAB Election of 2004 (GO Revenue) ¤ | | | 0.00 | | | | 8-1-2033 | | | | 1,500,000 | | | | 927,495 | |
Chico CA PFA Redevelopment Project Area (Tax Revenue, National Insured) | | | 5.13 | | | | 4-1-2021 | | | | 3,000,000 | | | | 3,001,590 | |
College of the Sequoias Tulare Area Improvement District #3 California CAB Election of 2008 Series A (GO Revenue, AGC Insured) ¤ | | | 0.00 | | | | 8-1-2024 | | | | 1,000,000 | | | | 860,340 | |
The accompanying notes are an integral part of these financial statements.
| | | | | | |
| Portfolio of investments—December 31, 2017 (unaudited) | | Wells Fargo California Tax-Free Fund | | | 11 | |
| | | | | | | | | | | | | | | | |
| Security name | | Interest rate | | | Maturity date | | | Principal | | | Value | |
|
| California (continued) | |
Compton CA Community College CAB Election of 2002 Series C (GO Revenue) ¤ | | | 0.00 | % | | | 8-1-2035 | | | $ | 3,445,000 | | | $ | 1,780,617 | |
Compton CA Community College RDA Project 2nd Lien Series A (Tax Revenue) | | | 5.00 | | | | 8-1-2020 | | | | 1,140,000 | | | | 1,198,151 | |
Compton CA PFA Refunding Bond (Miscellaneous Revenue) 144A | | | 4.00 | | | | 9-1-2027 | | | | 3,800,000 | | | | 3,860,116 | |
Compton CA PFA Refunding Bond (Miscellaneous Revenue) 144A | | | 4.50 | | | | 9-1-2032 | | | | 2,000,000 | | | | 2,078,040 | |
Contra Costa County CA Community College District Election of 2006 (GO Revenue) | | | 5.00 | | | | 8-1-2038 | | | | 3,250,000 | | | | 3,706,853 | |
Contra Costa County CA Home Mortgage Revenue Bonds GNMA Mortgage-Backed Securities Program (Housing Revenue, GNMA Insured) | | | 7.75 | | | | 5-1-2022 | | | | 130,000 | | | | 146,857 | |
Delano CA Union High School Election of 2010 Series B (GO Revenue, AGM Insured) | | | 5.75 | | | | 8-1-2035 | | | | 4,510,000 | | | | 4,969,885 | |
Dinuba CA RDA Merged City Redevelopment Project (Tax Revenue, Build America Mutual Assurance Company Insured) | | | 5.00 | | | | 9-1-2033 | | | | 1,500,000 | | | | 1,724,760 | |
El Dorado CA Irrigation District Refunding Bond Series A (Water & Sewer Revenue, AGM Insured) | | | 5.25 | | | | 3-1-2039 | | | | 2,000,000 | | | | 2,325,820 | |
Elk Grove CA Financing Authority Special Tax Refunding Bond (Tax Revenue, Build America Mutual Assurance Company Insured) | | | 5.00 | | | | 9-1-2038 | | | | 1,500,000 | | | | 1,692,960 | |
Emeryville CA PFA Assessment District Refinancing (Miscellaneous Revenue) | | | 5.90 | | | | 9-2-2021 | | | | 1,115,000 | | | | 1,117,286 | |
Escondido CA Union High School CAB Election of 2008 Series A (GO Revenue, AGC Insured) ¤ | | | 0.00 | | | | 8-1-2027 | | | | 8,385,000 | | | | 6,578,200 | |
Florin CA Resource Conservation Refunding Bond Second Senior Lien Series A (Water & Sewer Revenue, National Insured) | | | 5.00 | | | | 9-1-2032 | | | | 2,000,000 | | | | 2,277,340 | |
Fontana CA RDA Jurupa Hills Redevelopment Project Series A (Tax Revenue) | | | 5.60 | | | | 10-1-2027 | | | | 4,785,000 | | | | 4,832,037 | |
Foothill-Eastern Corridor CA Transportation Agency Subordinate Series B-3 (Transportation Revenue) | | | 5.50 | | | | 1-15-2053 | | | | 8,000,000 | | | | 9,096,000 | |
Fremont CA Community Facilities District #1 Refunding Bond (Tax Revenue) | | | 5.00 | | | | 9-1-2040 | | | | 2,700,000 | | | | 3,041,442 | |
Fullerton CA Joint Union High School Project Certificate of Participation (Miscellaneous Revenue, Build America Mutual Assurance Company Insured) | | | 5.00 | | | | 9-1-2035 | | | | 1,385,000 | | | | 1,598,899 | |
Garden Grove CA Unified School District Election of 2010 Series C (GO Revenue) | | | 5.25 | | | | 8-1-2037 | | | | 2,000,000 | | | | 2,320,800 | |
Gilroy CA Unified School District Election of 2008 Series A (GO Revenue, AGC Insured) | | | 6.00 | | | | 8-1-2027 | | | | 1,000,000 | | | | 1,068,110 | |
Golden State Tobacco Securitization Corporation CA Tobacco Settlement Refunding Bond Series A-1 (Tobacco Revenue) | | | 5.00 | | | | 6-1-2029 | | | | 2,500,000 | | | | 2,918,425 | |
Hayward CA Unified School District Refunding Bond (GO Revenue) | | | 5.00 | | | | 8-1-2038 | | | | 6,000,000 | | | | 6,703,800 | |
Hollister CA Joint Powers Financing Authority Wastewater Refunding Bond (Water & Sewer Revenue, AGM Insured) | | | 5.00 | | | | 6-1-2037 | | | | 5,000,000 | | | | 5,631,550 | |
Imperial CA Irrigation District Electric System Refunding Bond Series A (Utilities Revenue) | | | 5.00 | | | | 11-1-2040 | | | | 3,715,000 | | | | 4,328,384 | |
Imperial CA Irrigation District Electric System Refunding Bond Series A (Utilities Revenue) | | | 5.00 | | | | 11-1-2045 | | | | 1,060,000 | | | | 1,230,946 | |
Imperial CA Irrigation District Electric System Refunding Bond Series C (Utilities Revenue) | | | 5.00 | | | | 11-1-2038 | | | | 2,500,000 | | | | 2,922,125 | |
Independent Cities California Finance Refunding Bond Sanitary Juan Mobile Estates (Housing Revenue) | | | 5.00 | | | | 8-15-2030 | | | | 1,000,000 | | | | 1,132,450 | |
Inglewood CA Redevelopment Successor Agency to Merged Redevelopment Project Tax Allocation Refunding Bond Subordinate Lien Series A (Tax Revenue, Build America Mutual Assurance Company Insured) | | | 5.00 | | | | 5-1-2034 | | | | 500,000 | | | | 590,180 | |
Inglewood CA Redevelopment Successor Agency to Merged Redevelopment Project Tax Allocation Refunding Bond Subordinate Lien Series A (Tax Revenue, Build America Mutual Assurance Company Insured) | | | 5.00 | | | | 5-1-2038 | | | | 305,000 | | | | 358,094 | |
Inland Valley CA Development Agency Series A (Tax Revenue) | | | 5.25 | | | | 9-1-2037 | | | | 4,000,000 | | | | 4,553,320 | |
Irvine CA Improvement Bond Act 1915 Limited Obligation Reassessment District #15-2 (Miscellaneous Revenue) | | | 5.00 | | | | 9-2-2025 | | | | 725,000 | | | | 856,218 | |
Irvine CA Improvement Bond Act 1915 Limited Obligation Reassessment District #15-2 (Miscellaneous Revenue) | | | 5.00 | | | | 9-2-2026 | | | | 400,000 | | | | 468,424 | |
The accompanying notes are an integral part of these financial statements.
| | | | |
| 12 | | Wells Fargo California Tax-Free Fund | | Portfolio of investments—December 31, 2017 (unaudited) |
| | | | | | | | | | | | | | | | |
| Security name | | Interest rate | | | Maturity date | | | Principal | | | Value | |
|
| California (continued) | |
Irvine CA Improvement Bond Act 1915 Limited Obligation Reassessment District #15-2 (Miscellaneous Revenue) | | | 5.00 | % | | | 9-2-2042 | | | $ | 1,500,000 | | | $ | 1,668,150 | |
Irvine CA Unified School District Community Facilities District #09-1 Series B (Tax Revenue) | | | 5.00 | | | | 9-1-2042 | | | | 1,000,000 | | | | 1,136,070 | |
Irvine CA Unified School District Community Facilities District #09-1 Series C (Tax Revenue) | | | 5.00 | | | | 9-1-2047 | | | | 1,000,000 | | | | 1,133,420 | |
Lafayette CA RDA Refunding Bond Lafayette Redevelopment Project (Tax Revenue, AGM Insured) | | | 5.00 | | | | 8-1-2033 | | | | 1,500,000 | | | | 1,702,755 | |
Lafayette CA RDA Refunding Bond Lafayette Redevelopment Project (Tax Revenue, AGM Insured) | | | 5.00 | | | | 8-1-2038 | | | | 1,635,000 | | | | 1,838,198 | |
Lancaster CA RDA Tax Allocation Combined Redevelopment Project Areas (Tax Revenue) | | | 6.50 | | | | 8-1-2029 | | | | 2,000,000 | | | | 2,153,360 | |
Lancaster CA RDA Tax Allocation Refunding Bond Combined Redevelopment Project Areas (Tax Revenue, AGM Insured) | | | 5.00 | | | | 8-1-2033 | | | | 1,200,000 | | | | 1,430,304 | |
Long Beach CA Unified School District CAB Election of 2008 Series B (GO Revenue) ¤ | | | 0.00 | | | | 8-1-2035 | | | | 2,000,000 | | | | 1,117,280 | |
Long Beach CA Unified School District Prerefunded Bond Election of 2008 Series A (GO Revenue) | | | 5.50 | | | | 8-1-2026 | | | | 1,435,000 | | | | 1,523,913 | |
Long Beach CA Unified School District Unrefunded Bond Election of 2008 Series A (GO Revenue) | | | 5.50 | | | | 8-1-2026 | | | | 95,000 | | | | 100,841 | |
Los Angeles CA Certificate of Participation Sonneblick del Rio Project (Miscellaneous Revenue, Ambac Insured) | | | 6.00 | | | | 11-1-2019 | | | | 1,055,000 | | | | 1,058,703 | |
Los Angeles CA Community College District Refunding Bond (GO Revenue) | | | 4.00 | | | | 8-1-2038 | | | | 10,000,000 | | | | 10,901,300 | |
Los Angeles CA Community Redevelopment Vermont Manchester Social Services Project (Miscellaneous Revenue, Ambac Insured) | | | 5.00 | | | | 9-1-2025 | | | | 2,310,000 | | | | 2,315,983 | |
Los Angeles CA Department of Airports AMT Subordinate Series A (Airport Revenue) | | | 5.00 | | | | 5-15-2047 | | | | 3,000,000 | | | | 3,534,960 | |
Los Angeles CA Department of Water and Power Series E (Utilities Revenue) | | | 5.00 | | | | 7-1-2044 | | | | 12,475,000 | | | | 14,374,194 | |
Los Angeles CA Harbor Department (Airport Revenue) | | | 7.60 | | | | 10-1-2018 | | | | 15,000 | | | | 15,687 | |
Los Angeles CA Public Works Financing Authority Series A (Miscellaneous Revenue) | | | 5.00 | | | | 12-1-2039 | | | | 2,860,000 | | | | 3,281,821 | |
Lynwood CA Unified School District Election of 2012 Series A (GO Revenue, AGM Insured) | | | 5.00 | | | | 8-1-2033 | | | | 5,000 | | | | 5,700 | |
M-S-R California Energy Authority Gas Series B (Utilities Revenue) | | | 7.00 | | | | 11-1-2034 | | | | 4,000,000 | | | | 5,840,000 | |
M-S-R California Energy Authority Gas Series C (Utilities Revenue) | | | 6.13 | | | | 11-1-2029 | | | | 1,060,000 | | | | 1,360,839 | |
Merced CA City School District Election of 2014 (GO Revenue) | | | 5.00 | | | | 8-1-2045 | | | | 1,000,000 | | | | 1,164,840 | |
Merced CA Irrigation District Financing Authority Electric System Series A (Utilities Revenue, AGM Insured) | | | 5.00 | | | | 10-1-2042 | | | | 1,000,000 | | | | 1,186,440 | |
Merced CA Irrigation District Water & Hydroelectric System Series A (Water & Sewer Revenue, AGM Insured) | | | 5.00 | | | | 10-1-2038 | | | | 4,000,000 | | | | 4,584,880 | |
Merced CA Union High School District CAB Series A (GO Revenue, National Insured) ¤ | | | 0.00 | | | | 8-1-2018 | | | | 2,135,000 | | | | 2,116,169 | |
Merced CA Union High School District CAB Series C (GO Revenue) ¤ | | | 0.00 | | | | 8-1-2032 | | | | 3,380,000 | | | | 2,161,645 | |
Modesto CA Irrigation District Financing Authority Series A (Utilities Revenue) | | | 5.00 | | | | 10-1-2040 | | | | 3,500,000 | | | | 3,975,195 | |
Montclair CA PFA Lease Refunding Bond (Miscellaneous Revenue, AGM Insured) | | | 5.00 | | | | 10-1-2035 | | | | 2,400,000 | | | | 2,719,200 | |
Morongo Band of Mission Indians California Enterprise Casino Series B (Miscellaneous Revenue) 144A | | | 6.50 | | | | 3-1-2028 | | | | 2,100,000 | | | | 2,115,141 | |
Mount San Antonio CA Community College District CAB Election of 2008 Series A (GO Revenue) ¤ | | | 0.00 | | | | 8-1-2024 | | | | 1,610,000 | | | | 1,397,818 | |
Natomas CA Unified School District Series 1999 (GO Revenue, National Insured) | | | 5.95 | | | | 9-1-2021 | | | | 460,000 | | | | 491,252 | |
Northern California Power Agency Public Power Prerefunded Bond (Utilities Revenue, Ambac Insured) | | | 7.50 | | | | 7-1-2023 | | | | 45,000 | | | | 50,944 | |
Norwalk-La Mirada CA Unified School District CAB Election of 2002 Series D (GO Revenue, AGM Insured) ¤ | | | 0.00 | | | | 8-1-2023 | | | | 1,500,000 | | | | 1,329,870 | |
The accompanying notes are an integral part of these financial statements.
| | | | | | |
| Portfolio of investments—December 31, 2017 (unaudited) | | Wells Fargo California Tax-Free Fund | | | 13 | |
| | | | | | | | | | | | | | | | |
| Security name | | Interest rate | | | Maturity date | | | Principal | | | Value | |
|
| California (continued) | |
Oakland CA Redevelopment Successor Agency Refunding Bond Subordinate Series TE (Tax Revenue, AGM Insured) | | | 5.00 | % | | | 9-1-2035 | | | $ | 2,545,000 | | | $ | 2,898,450 | |
Oakland CA Redevelopment Successor Agency Refunding Bond Subordinate Series TE (Tax Revenue, AGM Insured) | | | 5.00 | | | | 9-1-2036 | | | | 4,000,000 | | | | 4,546,720 | |
Oakland CA Unified School District Election of 2012 (GO Revenue) | | | 5.50 | | | | 8-1-2023 | | | | 500,000 | | | | 585,540 | |
Oakland CA Unified School District Election of 2012 (GO Revenue) | | | 6.63 | | | | 8-1-2038 | | | | 7,750,000 | | | | 9,092,920 | |
Oakland CA Unified School District Election of 2012 Series A (GO Revenue) | | | 5.00 | | | | 8-1-2040 | | | | 3,500,000 | | | | 4,035,290 | |
Orange County CA Community Facilities District #2015-1 Esencia Village Series A (Tax Revenue) | | | 5.25 | | | | 8-15-2045 | | | | 2,000,000 | | | | 2,275,120 | |
Oxnard CA School District Election of 2012 Series D (GO Revenue, AGM Insured) | | | 5.00 | | | | 8-1-2034 | | | | 1,695,000 | | | | 1,998,659 | |
Pajaro Valley CA Unified School District Election of 2012 Series A (GO Revenue) | | | 5.00 | | | | 8-1-2038 | | | | 1,700,000 | | | | 1,925,641 | |
Palm Springs CA Palm Springs International Airport (Airport Revenue) | | | 6.00 | | | | 7-1-2018 | | | | 65,000 | | | | 65,068 | |
Palm Springs CA Palm Springs International Airport (Airport Revenue) | | | 6.40 | | | | 7-1-2023 | | | | 500,000 | | | | 500,380 | |
Palo Verde CA Unified School District FlexFund Program (Education Revenue) | | | 4.80 | | | | 9-1-2027 | | | | 1,256,441 | | | | 1,263,326 | |
Palomar Health CA Refunding Bond (Health Revenue) | | | 5.00 | | | | 11-1-2042 | | | | 4,000,000 | | | | 4,452,880 | |
Paramount CA Unified School District CAB Election of 2006 (GO Revenue) ¤ | | | 0.00 | | | | 8-1-2033 | | | | 2,500,000 | | | | 1,480,875 | |
Pasadena CA Old Pasadena Parking Facilities Project (Miscellaneous Revenue) | | | 6.25 | | | | 1-1-2018 | | | | 195,000 | | | | 195,000 | |
Pico Rivera CA Water Authority Series A (Water & Sewer Revenue, National Insured) | | | 5.50 | | | | 5-1-2019 | | | | 865,000 | | | | 890,422 | |
Pico Rivera CA Water Authority Series A (Water & Sewer Revenue) | | | 6.25 | | | | 12-1-2032 | | | | 4,305,000 | | | | 4,363,161 | |
Pomona CA Unified School District Series A (GO Revenue, National Insured) | | | 6.55 | | | | 8-1-2029 | | | | 1,480,000 | | | | 1,942,618 | |
Poway CA Unified School District CAB Election of 2008 Improvement District 07-1-A (GO Revenue) ¤ | | | 0.00 | | | | 8-1-2024 | | | | 1,800,000 | | | | 1,548,612 | |
Rancho Cucamonga CA RDA Rancho Redevelopment Project Area (Tax Revenue, AGM Insured) | | | 5.00 | | | | 9-1-2032 | | | | 1,870,000 | | | | 2,158,878 | |
Redding CA Joint Powers Financing Authority Election System Series A (Utilities Revenue) | | | 5.00 | | | | 6-1-2032 | | | | 440,000 | | | | 511,645 | |
Redwood City CA RDA CAB Redevelopment Project Area Series 2-A (Tax Revenue, Ambac Insured) ¤ | | | 0.00 | | | | 7-15-2030 | | | | 3,505,000 | | | | 2,337,064 | |
Rialto CA Unified School District CAB Election of 2010 Series A (GO Revenue, AGM Insured) ¤ | | | 0.00 | | | | 8-1-2026 | | | | 3,320,000 | | | | 2,680,502 | |
Richmond CA Joint Powers Financing Authority Civic Center Project Series A (Miscellaneous Revenue, AGC Insured) | | | 5.88 | | | | 8-1-2037 | | | | 5,000,000 | | | | 5,300,950 | |
Richmond CA Joint Powers Financing Authority Point Potrero Series A (Miscellaneous Revenue) | | | 6.25 | | | | 7-1-2024 | | | | 7,500,000 | | | | 7,994,550 | |
Riverside County CA Asset Leasing Corporation Riverside County Hospital Project (Miscellaneous Revenue, National Insured) ¤ | | | 0.00 | | | | 6-1-2026 | | | | 10,000,000 | | | | 8,033,700 | |
Riverside County CA RDA CCAB (Tax Revenue, Build America Mutual Assurance Company Insured) | | | 5.00 | | | | 10-1-2037 | | | | 1,015,000 | | | | 956,049 | |
Riverside County CA RDA CCAB (Tax Revenue, Build America Mutual Assurance Company Insured) | | | 5.00 | | | | 10-1-2041 | | | | 2,000,000 | | | | 1,876,220 | |
Riverside County CA Southwest California Community Finance Authority (Miscellaneous Revenue) | | | 6.38 | | | | 5-1-2033 | | | | 3,065,000 | | | | 3,115,205 | |
Roseville CA Natural Gas Financing Authority (Utilities Revenue) | | | 5.00 | | | | 2-15-2025 | | | | 1,930,000 | | | | 2,249,569 | |
Roseville CA Refunding Bond Fiddyment Ranch Community Facilities District #1 Series A (Tax Revenue) | | | 5.00 | | | | 9-1-2035 | | | | 1,500,000 | | | | 1,697,475 | |
Sacramento CA Airport System AMT Senior Series B (Airport Revenue, AGM Insured) | | | 5.75 | | | | 7-1-2024 | | | | 2,000,000 | | | | 2,042,420 | |
Sacramento CA Certificate of Participation Animal Care & Youth Detention Facilities (Miscellaneous Revenue, Ambac Insured) | | | 5.00 | | | | 10-1-2025 | | | | 1,085,000 | | | | 1,087,582 | |
Sacramento CA City Financing Authority Refunding Bond Master Lease Program Facilities (Miscellaneous Revenue, Build America Mutual Assurance Company Insured) | | | 5.00 | | | | 12-1-2035 | | | | 1,300,000 | | | | 1,510,665 | |
The accompanying notes are an integral part of these financial statements.
| | | | |
| 14 | | Wells Fargo California Tax-Free Fund | | Portfolio of investments—December 31, 2017 (unaudited) |
| | | | | | | | | | | | | | | | |
| Security name | | Interest rate | | | Maturity date | | | Principal | | | Value | |
|
| California (continued) | |
Sacramento CA City Financing Authority Series A (Miscellaneous Revenue, Ambac Insured) | | | 5.40 | % | | | 11-1-2020 | | | $ | 1,345,000 | | | $ | 1,430,260 | |
Sacramento CA City School Joint Refunding Bond Series A (Miscellaneous Revenue, Build America Mutual Assurance Company Insured) | | | 5.00 | | | | 3-1-2040 | | | | 2,165,000 | | | | 2,413,282 | |
Sacramento CA Unified School District Election of 2012 Series A (GO Revenue, Build America Mutual Assurance Company Insured) | | | 5.25 | | | | 8-1-2033 | | | | 1,000,000 | | | | 1,156,980 | |
Sacramento CA Unified School District Election of 2012 Series C (GO Revenue, AGM Insured) | | | 5.00 | | | | 8-1-2033 | | | | 2,735,000 | | | | 3,173,585 | |
San Bernardino County CA Certificate of Participation Arrowhead Project Series A (Miscellaneous Revenue) | | | 5.50 | | | | 8-1-2020 | | | | 6,000,000 | | | | 6,358,800 | |
San Bernardino County CA Certificate of Participation Medical Center Financing Project (Miscellaneous Revenue, National Insured) | | | 5.00 | | | | 8-1-2028 | | | | 5,770,000 | | | | 5,776,116 | |
San Bernardino County CA Community Election of 2008 Series D (GO Revenue) | | | 5.00 | | | | 8-1-2045 | | | | 2,000,000 | | | | 2,307,360 | |
San Bernardino County CA Unified School District Election of 2012 Series C (GO Revenue, AGM Insured) | | | 5.00 | | | | 8-1-2040 | | | | 8,000,000 | | | | 9,135,360 | |
San Buenaventura CA PFFA Series B (Water & Sewer Revenue) | | | 5.00 | | | | 7-1-2042 | | | | 4,000,000 | | | | 4,464,080 | |
San Clemente CA Special Tax Community Facilities District #2006-1 (Tax Revenue) | | | 5.00 | | | | 9-1-2040 | | | | 990,000 | | | | 1,092,495 | |
San Clemente CA Special Tax Community Facilities District #2006-1 (Tax Revenue) | | | 5.00 | | | | 9-1-2046 | | | | 1,195,000 | | | | 1,312,803 | |
San Diego CA Community College Election of 2002 (GO Revenue) | | | 5.00 | | | | 8-1-2031 | | | | 4,000,000 | | | | 4,669,400 | |
San Diego CA RDA CAB Tax Allocation Centre (Tax Revenue, AGM Insured) ¤ | | | 0.00 | | | | 9-1-2023 | | | | 885,000 | | | | 784,526 | |
San Diego CA RDA Centre City Sub Parking Series B (Transportation Revenue) | | | 5.30 | | | | 9-1-2020 | | | | 1,060,000 | | | | 1,063,063 | |
San Diego CA RDA Naval Training Center Series A (Tax Revenue) | | | 5.00 | | | | 9-1-2025 | | | | 575,000 | | | | 626,353 | |
San Diego CA Regional Airport AMT Subordinate Series B (Airport Revenue) | | | 5.00 | | | | 7-1-2047 | | | | 4,500,000 | | | | 5,279,400 | |
San Francisco CA City & County Certificate of Participation Multiple Capital Improvement Projects Series A (Miscellaneous Revenue) | | | 5.20 | | | | 4-1-2026 | | | | 3,000,000 | | | | 3,134,370 | |
San Francisco CA City & County International Airport AMT Series A (Airport Revenue) | | | 5.00 | | | | 5-1-2047 | | | | 10,000,000 | | | | 11,687,300 | |
San Francisco CA City & County RDA CAB Mission Bay South Redevelopment Project Subordinate Series D (Tax Revenue) 144A¤ | | | 0.00 | | | | 8-1-2026 | | | | 4,000,000 | | | | 2,631,880 | |
San Francisco CA City & County RDA Mission Bay South Redevelopment Project Series A (Tax Revenue) | | | 5.00 | | | | 8-1-2043 | | | | 2,500,000 | | | | 2,867,075 | |
San Francisco CA City & County RDA Tax Transbay Infrastructure Project Third Lien Series B (Tax Revenue, AGM Insured) | | | 5.00 | | | | 8-1-2046 | | | | 1,500,000 | | | | 1,764,495 | |
San Francisco CA Municipal Transportation (Transportation Revenue) | | | 5.00 | | | | 3-1-2039 | | | | 3,000,000 | | | | 3,449,730 | |
San Gorgonio CA Memorial Healthcare Refunding Bond (GO Revenue) | | | 5.00 | | | | 8-1-2032 | | | | 1,750,000 | | | | 1,969,713 | |
San Gorgonio CA Memorial Healthcare Refunding Bond (GO Revenue) | | | 5.50 | | | | 8-1-2028 | | | | 2,525,000 | | | | 3,000,306 | |
San Joaquin CA Delta Community College District Election of 2004 Series C (GO Revenue) | | | 5.00 | | | | 8-1-2033 | | | | 3,195,000 | | | | 3,731,504 | |
San Joaquin CA Delta Community College District Election of 2004 Series C (GO Revenue) | | | 5.00 | | | | 8-1-2034 | | | | 3,315,000 | | | | 3,854,019 | |
San Jose CA Airport AMT Refunding Bond Series A (Airport Revenue) | | | 5.00 | | | | 3-1-2047 | | | | 6,985,000 | | | | 8,126,908 | |
San Jose CA Airport Refunding Bond Series B (Airport Revenue) | | | 5.00 | | | | 3-1-2042 | | | | 1,750,000 | | | | 2,074,678 | |
San Jose CA Libraries & Parks Project (GO Revenue) | | | 5.13 | | | | 9-1-2031 | | | | 2,040,000 | | | | 2,045,365 | |
San Jose CA RDA Tax Allocation Refunding Bond Merged Area Redevelopment Project Series C (Tax Revenue, National Insured) | | | 5.00 | | | | 8-1-2025 | | | | 1,845,000 | | | | 1,845,867 | |
San Jose CA RDA Tax Allocation Refunding Bond Merged Area Redevelopment Project Series C (Tax Revenue, National Insured) | | | 5.00 | | | | 8-1-2026 | | | | 950,000 | | | | 950,447 | |
San Jose CA RDA Refunding Bond Senior Series A (Tax Revenue) | | | 5.00 | | | | 8-1-2035 | | | | 8,000,000 | | | | 9,709,120 | |
San Jose CA Unified School District CAB (Miscellaneous Revenue, AGM Insured) ¤ | | | 0.00 | | | | 1-1-2021 | | | | 1,205,000 | | | | 1,139,340 | |
San Jose CA Unified School District CAB (Miscellaneous Revenue, AGM Insured) ¤ | | | 0.00 | | | | 1-1-2026 | | | | 3,175,000 | | | | 2,669,731 | |
San Marcos CA Unified School District Special Tax Community Facilities District #4 (Tax Revenue, Build America Mutual Assurance Company Insured) | | | 5.00 | | | | 9-1-2034 | | | | 1,710,000 | | | | 1,954,975 | |
The accompanying notes are an integral part of these financial statements.
| | | | | | |
| Portfolio of investments—December 31, 2017 (unaudited) | | Wells Fargo California Tax-Free Fund | | | 15 | |
| | | | | | | | | | | | | | | | |
| Security name | | Interest rate | | | Maturity date | | | Principal | | | Value | |
|
| California (continued) | |
San Marcos CA Unified School District Special Tax Community Facilities District #5 (Tax Revenue, Build America Mutual Assurance Company Insured) | | | 5.00 | % | | | 9-1-2028 | | | $ | 1,290,000 | | | $ | 1,501,328 | |
San Marcos CA Unified School District Special Tax Community Facilities District #5 (Tax Revenue, Build America Mutual Assurance Company Insured) | | | 5.00 | | | | 9-1-2029 | | | | 1,345,000 | | | | 1,559,043 | |
San Marino CA Unified School District Certificate of Participation Los Angeles County Schools Pooled Financing Program Series A (Miscellaneous Revenue) | | | 5.00 | | | | 12-1-2041 | | | | 500,000 | | | | 520,330 | |
San Mateo County CA Jefferson Union High School District CAB Election of 2006 Series D (GO Revenue) ¤ | | | 0.00 | | | | 8-1-2033 | | | | 7,000,000 | | | | 2,468,060 | |
San Mateo County CA Jefferson Union High School District CAB Election of 2006 Series D (GO Revenue) ¤ | | | 0.00 | | | | 8-1-2036 | | | | 11,130,000 | | | | 3,061,418 | |
San Mateo County CA Jefferson Union High School District Prerefunded CAB Election of 2006 Series D (GO Revenue) ¤ | | | 0.00 | | | | 8-1-2034 | | | | 6,915,000 | | | | 2,242,050 | |
San Mateo County CA Jefferson Union High School District Unrefunded CAB Election of 2006 Series D (GO Revenue) ¤ | | | 0.00 | | | | 8-1-2034 | | | | 2,990,000 | | | | 969,448 | |
San Rafael CA City High School District CAB Election of 2002 Series B (GO Revenue, National Insured) ¤ | | | 0.00 | | | | 8-1-2023 | | | | 1,260,000 | | | | 1,122,647 | |
San Ysidro CA School District Certificate of Participation School Facilities Bridge Funding Program (Miscellaneous Revenue, Build America Mutual Assurance Company Insured) | | | 5.00 | | | | 9-1-2037 | | | | 250,000 | | | | 281,078 | |
San Ysidro CA School District Certificate of Participation School Facilities Bridge Funding Program (Miscellaneous Revenue, Build America Mutual Assurance Company Insured) | | | 5.00 | | | | 9-1-2042 | | | | 625,000 | | | | 696,819 | |
San Ysidro CA School District Certificate of Participation School Facilities Bridge Funding Program (Miscellaneous Revenue, Build America Mutual Assurance Company Insured) | | | 5.00 | | | | 9-1-2047 | | | | 1,000,000 | | | | 1,104,680 | |
Sanger CA Unified School District Refunding Bond (GO Revenue, National Insured) | | | 5.60 | | | | 8-1-2023 | | | | 1,260,000 | | | | 1,339,607 | |
Santa Ana CA Community Redevelopment Merged Project Area Series A (Tax Revenue) | | | 6.00 | | | | 9-1-2022 | | | | 2,000,000 | | | | 2,247,080 | |
Santa Ana CA Unified School District CAB Election of 2008 Series B (GO Revenue, AGC Insured) ¤ | | | 0.00 | | | | 8-1-2038 | | | | 15,000,000 | | | | 7,375,050 | |
Santa Cruz County CA RDA Live Oak Soquel Community Improvement Project (Tax Revenue) | | | 6.63 | | | | 9-1-2029 | | | | 2,100,000 | | | | 2,273,334 | |
Santa Rosa CA High School District Prerefunded Bond (GO Revenue) | | | 5.00 | | | | 8-1-2024 | | | | 750,000 | | | | 855,000 | |
Santa Rosa CA High School District Unrefunded Bond (GO Revenue) | | | 5.00 | | | | 8-1-2024 | | | | 255,000 | | | | 290,820 | |
Sierra Kings CA Health Care District (GO Revenue) | | | 5.00 | | | | 8-1-2028 | | | | 1,000,000 | | | | 1,157,380 | |
Sierra Kings CA Health Care District (GO Revenue) | | | 5.00 | | | | 8-1-2032 | | | | 1,500,000 | | | | 1,703,055 | |
Sierra Kings CA Health Care District (GO Revenue) | | | 5.00 | | | | 8-1-2037 | | | | 1,750,000 | | | | 1,961,680 | |
Simi Valley CA Unified School District Capital Improvement Projects (Miscellaneous Revenue, Ambac Insured) | | | 5.25 | | | | 8-1-2022 | | | | 1,970,000 | | | | 2,158,529 | |
Sonoma CA CDA Successor Agency to Sonoma Redevelopment Project Tax Allocation Bond (Tax Revenue, National Insured) | | | 5.00 | | | | 6-1-2033 | | | | 1,325,000 | | | | 1,558,359 | |
Sonoma Valley CA Unified School District CAB Election of 2010 Series A (GO Revenue) ¤ | | | 0.00 | | | | 8-1-2027 | | | | 1,020,000 | | | | 777,107 | |
South Pasadena CA Unified School District Series A (GO Revenue, FGIC Insured) | | | 5.55 | | | | 11-1-2020 | | | | 320,000 | | | | 340,947 | |
Southern California Public Power Authority Natural Gas Project #1 Series A (Utilities Revenue) | | | 5.25 | | | | 11-1-2025 | | | | 1,000,000 | | | | 1,190,460 | |
Stockton CA Unified School District Election of 2012 Series A (GO Revenue, AGM Insured) | | | 5.00 | | | | 8-1-2038 | | | | 1,025,000 | | | | 1,161,571 | |
Sutter Butte CA Flood Control Agency (Miscellaneous Revenue, Build America Mutual Assurance Company Insured) | | | 5.00 | | | | 10-1-2040 | | | | 3,545,000 | | | | 4,057,926 | |
Torrance CA Certificate of Participation (Miscellaneous Revenue) | | | 5.25 | | | | 6-1-2039 | | | | 5,385,000 | | | | 6,354,946 | |
Tracy CA Operating Partnership Joint Powers Authority Capital Improvement Projects (Miscellaneous Revenue, AGC Insured) | | | 6.25 | | | | 10-1-2033 | | | | 1,000,000 | | | | 1,034,850 | |
Tulare CA PFFA Capital Facilities Project (Miscellaneous Revenue, AGC Insured) | | | 5.25 | | | | 4-1-2027 | | | | 3,000,000 | | | | 3,028,740 | |
Tulare CA Sewer Refunding Bond (Water & Sewer Revenue, AGM Insured) | | | 5.00 | | | | 11-15-2041 | | | | 1,500,000 | | | | 1,732,650 | |
The accompanying notes are an integral part of these financial statements.
| | | | |
| 16 | | Wells Fargo California Tax-Free Fund | | Portfolio of investments—December 31, 2017 (unaudited) |
| | | | | | | | | | | | | | | | |
| Security name | | Interest rate | | | Maturity date | | | Principal | | | Value | |
|
| California (continued) | |
Turlock CA Irrigation District Refunding Bond Subordinate First Priority (Utilities Revenue) | | | 5.50 | % | | | 1-1-2041 | | | $ | 2,000,000 | | | $ | 2,213,540 | |
Tustin CA Community Facilities District Special Tax #2014-1 Legacy/Standard Pacific Series A (Tax Revenue) | | | 5.00 | | | | 9-1-2040 | | | | 750,000 | | | | 840,510 | |
Tustin CA Community Facilities District Special Tax #2014-1 Legacy/Standard Pacific Series A (Tax Revenue) | | | 5.00 | | | | 9-1-2045 | | | | 1,000,000 | | | | 1,116,360 | |
Union City CA Community RDA Successor Agency to Community Redevelopment Project Tax Allocation Refunding Bond Series A (Tax Revenue) | | | 5.00 | | | | 10-1-2036 | | | | 1,000,000 | | | | 1,163,520 | |
Union City CA Community RDA Successor Agency to Union City Community Redevelopment Project (Tax Revenue, AGC Insured) | | | 5.25 | | | | 10-1-2033 | | | | 8,000,000 | | | | 8,778,480 | |
University of California CA Regents Medical Center Prerefunded Bond Series J (Health Revenue) | | | 5.25 | | | | 5-15-2038 | | | | 7,790,000 | | | | 9,137,047 | |
University of California CA Regents Medical Center Unrefunded Bond Series J (Health Revenue) | | | 5.25 | | | | 5-15-2038 | | | | 2,210,000 | | | | 2,563,954 | |
University of California Regents Medical Center Series J (Health Revenue) | | | 5.00 | | | | 5-15-2033 | | | | 2,265,000 | | | | 2,634,150 | |
University of California Series AI (Education Revenue) | | | 5.00 | | | | 5-15-2038 | | | | 2,000,000 | | | | 2,279,780 | |
Vacaville CA Unified School District (Miscellaneous Revenue, AGC Insured) | | | 6.50 | | | | 12-1-2034 | | | | 1,260,000 | | | | 1,317,368 | |
Vallejo CA Refunding Bond (Water & Sewer Revenue) | | | 5.25 | | | | 5-1-2031 | | | | 1,000,000 | | | | 1,146,550 | |
Ventura County CA PFA Series A (Miscellaneous Revenue) | | | 5.00 | | | | 11-1-2038 | | | | 4,250,000 | | | | 4,825,493 | |
Walnut CA Energy Center Authority Series A (Utilities Revenue) | | | 5.00 | | | | 1-1-2034 | | | | 3,115,000 | | | | 3,627,854 | |
Washington Township CA Health Care District Election of 2004 Series B (GO Revenue) | | | 5.50 | | | | 8-1-2038 | | | | 1,500,000 | | | | 1,799,535 | |
Washington Township CA Health Care District Series A (Health Revenue) | | | 5.00 | | | | 7-1-2026 | | | | 1,190,000 | | | | 1,374,581 | |
Washington Township CA Health Care District Series A (Health Revenue) | | | 5.00 | | | | 7-1-2042 | | | | 1,000,000 | | | | 1,132,370 | |
West Contra Costa CA Unified School District (GO Revenue, AGM Insured) | | | 5.25 | | | | 8-1-2024 | | | | 1,350,000 | | | | 1,515,659 | |
West Contra Costa CA Unified School District CAB Election of 2005 Series B (GO Revenue) | | | 6.00 | | | | 8-1-2027 | | | | 1,080,000 | | | | 1,455,936 | |
West Contra Costa CA Unified School District CAB Election of 2005 Series C-1 (GO Revenue, AGC Insured) ¤ | | | 0.00 | | | | 8-1-2021 | | | | 6,000,000 | | | | 5,548,200 | |
Wiseburn CA School District CAB (GO Revenue, AGC Insured) ¤ | | | 0.00 | | | | 8-1-2027 | | | | 1,525,000 | | | | 1,182,882 | |
Yorba Linda CA RDA CAB Series A (Tax Revenue, National Insured) ¤ | | | 0.00 | | | | 9-1-2019 | | | | 1,295,000 | | | | 1,225,860 | |
| | | | |
| | | | | | | | | | | | | | | 956,301,111 | |
| | | | | | | | | | | | | | | | |
|
| Colorado: 0.20% | |
Park Creek CO Metropolitan District Senior Limited Property Series A (Tax Revenue) | | | 5.00 | | | | 12-1-2041 | | | | 1,750,000 | | | | 1,996,138 | |
| | | | | | | | | | | | | | | | |
|
| Guam: 0.63% | |
Guam Government Business Privilege Tax Series A (Tax Revenue) | | | 5.00 | | | | 1-1-2031 | | | | 1,000,000 | | | | 1,064,670 | |
Guam Government Waterworks Authority (Water & Sewer Revenue) | | | 5.25 | | | | 7-1-2033 | | | | 1,500,000 | | | | 1,646,580 | |
Guam Government Waterworks Authority (Water & Sewer Revenue) | | | 5.50 | | | | 7-1-2043 | | | | 3,125,000 | | | | 3,514,469 | |
| | | | |
| | | | | | | | | | | | | | | 6,225,719 | |
| | | | | | | | | | | | | | | | |
|
| Illinois: 1.21% | |
Chicago IL Metropolitan Pier & Exposition Authority McCormick Place Expansion Project Series A (Tax Revenue) | | | 5.00 | | | | 6-15-2057 | | | | 1,000,000 | | | | 1,086,540 | |
llinois State Series D (Miscellaneous Revenue) | | | 5.00 | | | | 11-1-2028 | | | | 10,000,000 | | | | 10,907,400 | |
| | | | |
| | | | | | | | | | | | | | | 11,993,940 | |
| | | | | | | | | | | | | | | | |
|
| Virgin Islands: 0.06% | |
Virgin Islands PFA Matching Fund Loan Note Senior Lien Series A (Tax Revenue) | | | 5.00 | | | | 10-1-2025 | | | | 1,000,000 | | | | 625,000 | |
| |
Total Municipal Obligations (Cost $898,960,831) | | | | 977,141,908 | |
| | | | | | | | | | | | | | | | |
The accompanying notes are an integral part of these financial statements.
| | | | | | |
| Portfolio of investments—December 31, 2017 (unaudited) | | Wells Fargo California Tax-Free Fund | | | 17 | |
| | | | | | | | | | | | | | | | |
| Security name | | Interest rate | | | Maturity date | | | Principal | | | Value | |
|
Other: 0.50% | |
Nuveen California AMT-Free Quality Municipal Income Fund Preferred Shares Series A 144A§øø | | | 2.01 | % | | | 10-1-2047 | | | $ | 5,000,000 | | | $ | 5,000,000 | |
| | | | | | | | | | | | | | | | |
| |
Total Other (Cost $5,000,000) | | | | 5,000,000 | |
| | | | | | | | | | | | | | | | |
| | | | |
| | | Yield | | | | | | Shares | | | | |
| Short-Term Investments: 0.04% | |
|
| Investment Companies: 0.04% | |
Wells Fargo Municipal Cash Management Money Market Fund Institutional Class (l)(u) | | | 1.49 | | | | | | | | 357,181 | | | | 357,574 | |
| | | | | | | | | | | | | | | | |
| |
Total Short-Term Investments (Cost $357,574) | | | | 357,574 | |
| | | | | | | | | | | | | | | | |
| | | | | | | | |
| Total investments in securities (Cost $904,318,405) | | | 98.96 | % | | | 982,499,482 | |
Other assets and liabilities, net | | | 1.04 | | | | 10,349,586 | |
| | | | | | | | |
| Total net assets | | | 100.00 | % | | $ | 992,849,068 | |
| | | | | | | | |
| ¤ | The security is issued in zero coupon form with no periodic interest payments. |
| 144A | The security may be resold in transactions exempt from registration, normally to qualified institutional buyers, pursuant to Rule 144A under the Securities Act of 1933. |
| ± | Variable rate investment. The rate shown is the rate in effect at period end. |
| § | The security is subject to a demand feature which reduces the effective maturity. |
| øø | The interest rate is determined and reset by the issuer periodically depending upon the terms of the security. The rate shown is the rate in effect at period end. |
| (l) | The issuer of the security is an affiliated person of the Fund as defined in the Investment Company Act of 1940. |
| (u) | The rate represents the 7-day annualized yield at period end. |
Investments in Affiliates
An affiliated investment is an investment in which the Fund owns at least 5% of the outstanding voting shares of the issuer or as a result of other relationships, such as the Fund and the issuer having the same investment manager. Transactions with issuers that were either affiliated persons of the Fund at the beginning of the period or the end of the period were as follows:
| | | | | | | | | | | | | | | | | | | | | | | | | | | | | | | | | | | | |
| | | Shares,
beginning of
period | | | Shares
purchased | | | Shares sold | | | Shares,
end of
period | | | Net
realized
gains
(losses) | | | Net
change in
unrealized
gains
(losses) | | | Income
from
affiliated
securities | | | Value,
end
of period | | | % of
net
assets | |
Short-Term Investments | | | | | | | | | | | | | | | | | | | | | | | | | | | | | | | | | | | | |
Investment Companies | | | | | | | | | | | | | | | | | | | | | | | | | | | | | | | | | | | | |
Wells Fargo Municipal Cash Management Money Market Fund Institutional Class | | | 10,159,983 | | | | 186,968,138 | | | | 196,770,940 | | | | 357,181 | | | $ | 15,898 | | | $ | 0 | | | $ | 31,251 | | | $ | 357,574 | | | | 0.04 | % |
The accompanying notes are an integral part of these financial statements.
| | | | |
| 18 | | Wells Fargo California Tax-Free Fund | | Statement of assets and liabilities—December 31, 2017 (unaudited) |
| | | | |
| | | | |
| |
Assets | | | | |
Investments in unaffiliated securities, at value (cost $903,960,831) | | $ | 982,141,908 | |
Investments in affiliated securities, at value (cost $357,574) | | | 357,574 | |
Receivable for Fund shares sold | | | 645,757 | |
Receivable for interest | | | 12,285,283 | |
Prepaid expenses and other assets | | | 53,885 | |
| | | | |
Total assets | | | 995,484,407 | |
| | | | |
| |
Liabilities | | | | |
Payable for Fund shares redeemed | | | 1,334,230 | |
Dividends payable | | | 671,257 | |
Management fee payable | | | 266,785 | |
Administration fees payable | | | 111,683 | |
Distribution fee payable | | | 34,909 | |
Trustees’ fees and expenses payable | | | 2,174 | |
Shareholder servicing fees payable | | | 160,015 | |
Accrued expenses and other liabilities | | | 54,286 | |
| | | | |
Total liabilities | | | 2,635,339 | |
| | | | |
Total net assets | | $ | 992,849,068 | |
| | | | |
| |
NET ASSETS CONSIST OF | | | | |
Paid-in capital | | $ | 939,512,171 | |
Undistributed net investment income | | | 60,623 | |
Accumulated net realized losses on investments | | | (24,904,803 | ) |
Net unrealized gains on investments | | | 78,181,077 | |
| | | | |
Total net assets | | $ | 992,849,068 | |
| | | | |
| |
COMPUTATION OF NET ASSET VALUE AND OFFERING PRICE PER SHARE | | | | |
Net assets – Class A | | $ | 453,339,306 | |
Shares outstanding – Class A1 | | | 38,190,510 | |
Net asset value per share – Class A | | | $11.87 | |
Maximum offering price per share – Class A2 | | | $12.43 | |
Net assets – Class C | | $ | 53,056,581 | |
Shares outstanding – Class C1 | | | 4,382,772 | |
Net asset value per share – Class C | | | $12.11 | |
Net assets – Administrator Class | | $ | 191,578,044 | |
Shares outstanding – Administrator Class1 | | | 16,107,563 | |
Net asset value per share – Administrator Class | | | $11.89 | |
Net assets – Institutional Class | | $ | 294,875,137 | |
Shares outstanding – Institutional Class1 | | | 24,791,809 | |
Net asset value per share – Institutional Class | | | $11.89 | |
| 1 | The Fund has an unlimited number of authorized shares. |
| 2 | Maximum offering price is computed as 100/95.50 of net asset value. On investments of $50,000 or more, the offering price is reduced. |
The accompanying notes are an integral part of these financial statements.
| | | | | | |
| Statement of operations—six months ended December 31, 2017 (unaudited) | | Wells Fargo California Tax-Free Fund | | | 19 | |
| | | | |
| | | | |
| |
Investment income | | | | |
Interest | | $ | 19,952,817 | |
Income from affiliated securities | | | 31,251 | |
| | | | |
Total investment income | | | 19,984,068 | |
| | | | |
| |
Expenses | | | | |
Management fee | | | 2,050,269 | |
Administration fees | | | | |
Class A | | | 370,898 | |
Class C | | | 44,588 | |
Administrator Class | | | 116,817 | |
Institutional Class | | | 124,476 | |
Shareholder servicing fees | | | | |
Class A | | | 579,528 | |
Class C | | | 69,668 | |
Administrator Class | | | 291,084 | |
Distribution fee | | | | |
Class C | | | 209,005 | |
Custody and accounting fees | | | 13,135 | |
Professional fees | | | 35,453 | |
Registration fees | | | 52,137 | |
Shareholder report expenses | | | 37,548 | |
Trustees’ fees and expenses | | | 10,247 | |
Other fees and expenses | | | 15,288 | |
| | | | |
Total expenses | | | 4,020,141 | |
Less: Fee waivers and/or expense reimbursements | | | (474,200 | ) |
| | | | |
Net expenses | | | 3,545,941 | |
| | | | |
Net investment income | | | 16,438,127 | |
| | | | |
| |
REALIZED AND UNREALIZED GAINS (LOSSES) ON INVESTMENTS | | | | |
| |
Net realized gains on: | | | | |
Unaffiliated securities | | | 843,845 | |
Affiliated securities | | | 15,898 | |
| | | | |
Net realized gains on investments | | | 859,743 | |
Net change in unrealized gains (losses) on investments | | | 2,160,735 | |
| | | | |
Net realized and unrealized gains (losses) on investments | | | 3,020,478 | |
| | | | |
Net increase in net assets resulting from operations | | $ | 19,458,605 | |
| | | | |
The accompanying notes are an integral part of these financial statements.
| | | | |
| 20 | | Wells Fargo California Tax-Free Fund | | Statement of changes in net assets |
| | | | | | | | | | | | | | | | |
| | | Six months ended December 31, 2017 (unaudited) | | | Year ended
June 30, 2017 | |
| | | | |
Operations | | | | | | | | | | | | | | | | |
Net investment income | | | | | | $ | 16,438,127 | | | | | | | $ | 33,575,073 | |
Net realized gains (losses) on investments | | | | | | | 859,743 | | | | | | | | (16,628,208 | ) |
Net change in unrealized gains (losses) on investments | | | | | | | 2,160,735 | | | | | | | | (45,030,288 | ) |
| | | | |
Net increase (decrease) in net assets resulting from operations | | | | | | | 19,458,605 | | | | | | | | (28,083,423 | ) |
| | | | |
| | | | |
Distributions to shareholders from | | | | | | | | | | | | | | | | |
Net investment income | | | | | | | | | | | | | | | | |
Class A | | | | | | | (6,964,488 | ) | | | | | | | (14,788,835 | ) |
Class B | | | | | | | N/A | | | | | | | | (1,071 | )1 |
Class C | | | | | | | (627,813 | ) | | | | | | | (1,430,934 | ) |
Administrator Class | | | | | | | (3,749,893 | ) | | | | | | | (8,412,626 | ) |
Institutional Class | | | | | | | (5,095,577 | ) | | | | | | | (8,941,597 | ) |
| | | | |
Total distributions to shareholders | | | | | | | (16,437,771 | ) | | | | | | | (33,575,063 | ) |
| | | | |
| | | | |
Capital share transactions | | | Shares | | | | | | | | Shares | | | | | |
Proceeds from shares sold | | | | | | | | | | | | | | | | |
Class A | | | 1,783,176 | | | | 21,140,697 | | | | 4,369,584 | | | | 52,343,840 | |
Class C | | | 115,818 | | | | 1,403,986 | | | | 961,273 | | | | 11,910,742 | |
Administrator Class | | | 2,814,241 | | | | 33,547,927 | | | | 6,264,433 | | | | 74,980,710 | |
Institutional Class | | | 3,398,477 | | | | 40,468,028 | | | | 27,788,903 | | | | 329,374,871 | |
| | | | |
| | | | | | | 96,560,638 | | | | | | | | 468,610,163 | |
| | | | |
Reinvestment of distributions | | | | | | | | | | | | | | | | |
Class A | | | 540,961 | | | | 6,421,057 | | | | 1,154,136 | | | | 13,729,015 | |
Class B | | | N/A | | | | N/A | | | | 84 | 1 | | | 1,036 | 1 |
Class C | | | 48,208 | | | | 583,696 | | | | 107,565 | | | | 1,304,294 | |
Administrator Class | | | 306,351 | | | | 3,644,054 | | | | 680,401 | | | | 8,137,919 | |
Institutional Class | | | 182,156 | | | | 2,166,770 | | | | 227,555 | | | | 2,685,260 | |
| | | | |
| | | | | | | 12,815,577 | | | | | | | | 25,857,524 | |
| | | | |
Payment for shares redeemed | | | | | | | | | | | | | | | | |
Class A | | | (4,070,149 | ) | | | (48,393,778 | ) | | | (7,999,743 | ) | | | (94,610,622 | ) |
Class B | | | N/A | | | | N/A | | | | (9,509 | )1 | | | (111,781 | )1 |
Class C | | | (564,845 | ) | | | (6,846,448 | ) | | | (1,515,076 | ) | | | (18,297,168 | ) |
Administrator Class | | | (4,741,655 | ) | | | (56,091,252 | ) | | | (16,786,063 | ) | | | (197,968,420 | ) |
Institutional Class | | | (4,871,452 | ) | | | (57,986,268 | ) | | | (17,411,489 | ) | | | (204,081,059 | ) |
| | | | |
| | | | | | | (169,317,746 | ) | | | | | | | (515,069,050 | ) |
| | | | |
Net decrease in net assets resulting from capital share transactions | | | | | | | (59,941,531 | ) | | | | | | | (20,601,363 | ) |
| | | | |
Total decrease in net assets | | | | | | | (56,920,697 | ) | | | | | | | (82,259,849 | ) |
| | | | |
| | | | |
Net assets | | | | | | | | | | | | | | | | |
Beginning of period | | | | | | | 1,049,769,765 | | | | | | | | 1,132,029,614 | |
| | | | |
End of period | | | | | | $ | 992,849,068 | | | | | | | $ | 1,049,769,765 | |
| | | | |
Undistributed net investment income | | | | | | $ | 60,623 | | | | | | | $ | 60,267 | |
| | | | |
| 1 | For the period from July 1, 2016 to December 5, 2016. Effective at the close of business on December 5, 2016, Class B shares were converted to Class A shares and are no longer offered by the Fund. |
The accompanying notes are an integral part of these financial statements.
| | | | | | |
| Financial highlights | | Wells Fargo California Tax-Free Fund | | | 21 | |
(For a share outstanding throughout each period)
| | | | | | | | | | | | | | | | | | | | | | | | |
| | | Six months ended December 31, 2017 (unaudited) | | | Year ended June 30 | |
| CLASS A | | | 2017 | | | 2016 | | | 2015 | | | 2014 | | | 2013 | |
Net asset value, beginning of period | | | $11.83 | | | | $12.45 | | | | $11.79 | | | | $11.73 | | | | $11.21 | | | | $11.37 | |
Net investment income | | | 0.18 | | | | 0.36 | | | | 0.36 | | | | 0.38 | | | | 0.42 | | | | 0.40 | |
Net realized and unrealized gains (losses) on investments | | | 0.04 | | | | (0.62 | ) | | | 0.66 | | | | 0.06 | | | | 0.52 | | | | (0.16 | ) |
| | | | | | | | | | | | | | | | | | | | | | | | |
Total from investment operations | | | 0.22 | | | | (0.26 | ) | | | 1.02 | | | | 0.44 | | | | 0.94 | | | | 0.24 | |
Distributions to shareholders from | | | | | | | | | | | | | | | | | | | | | | | | |
Net investment income | | | (0.18 | ) | | | (0.36 | ) | | | (0.36 | ) | | | (0.38 | ) | | | (0.42 | ) | | | (0.40 | ) |
Net asset value, end of period | | | $11.87 | | | | $11.83 | | | | $12.45 | | | | $11.79 | | | | $11.73 | | | | $11.21 | |
Total return1 | | | 1.87 | % | | | (2.09 | )% | | | 8.77 | % | | | 3.74 | % | | | 8.58 | % | | | 2.06 | % |
Ratios to average net assets (annualized) | | | | | | | | | | | | | | | | | | | | | | | | |
Gross expenses | | | 0.83 | % | | | 0.82 | % | | | 0.82 | % | | | 0.83 | % | | | 0.83 | % | | | 0.83 | % |
Net expenses | | | 0.75 | % | | | 0.75 | % | | | 0.75 | % | | | 0.75 | % | | | 0.75 | % | | | 0.75 | % |
Net investment income | | | 3.00 | % | | | 2.99 | % | | | 2.96 | % | | | 3.17 | % | | | 3.71 | % | | | 3.46 | % |
Supplemental data | | | | | | | | | | | | | | | | | | | | | | | | |
Portfolio turnover rate | | | 14 | % | | | 48 | % | | | 17 | % | | | 30 | % | | | 41 | % | | | 23 | % |
Net assets, end of period (000s omitted) | | | $453,339 | | | | $472,584 | | | | $528,238 | | | | $470,368 | | | | $466,411 | | | | $506,770 | |
| 1 | Total return calculations do not include any sales charges. Returns for periods of less than one year are not annualized. |
The accompanying notes are an integral part of these financial statements.
| | | | |
| 22 | | Wells Fargo California Tax-Free Fund | | Financial highlights |
(For a share outstanding throughout each period)
| | | | | | | | | | | | | | | | | | | | | | | | |
| | | Six months ended December 31, 2017 (unaudited) | | | Year ended June 30 | |
| CLASS C | | | 2017 | | | 2016 | | | 2015 | | | 2014 | | | 2013 | |
Net asset value, beginning of period | | | $12.07 | | | | $12.70 | | | | $12.02 | | | | $11.96 | | | | $11.43 | | | | $11.59 | |
Net investment income | | | 0.14 | | | | 0.27 | | | | 0.27 | | | | 0.29 | | | | 0.34 | | | | 0.32 | |
Net realized and unrealized gains (losses) on investments | | | 0.04 | | | | (0.63 | ) | | | 0.68 | | | | 0.06 | | | | 0.53 | | | | (0.16 | ) |
| | | | | | | | | | | | | | | | | | | | | | | | |
Total from investment operations | | | 0.18 | | | | (0.36 | ) | | | 0.95 | | | | 0.35 | | | | 0.87 | | | | 0.16 | |
Distributions to shareholders from | | | | | | | | | | | | | | | | | | | | | | | | |
Net investment income | | | (0.14 | ) | | | (0.27 | ) | | | (0.27 | ) | | | (0.29 | ) | | | (0.34 | ) | | | (0.32 | ) |
Net asset value, end of period | | | $12.11 | | | | $12.07 | | | | $12.70 | | | | $12.02 | | | | $11.96 | | | | $11.43 | |
Total return1 | | | 1.48 | % | | | (2.80 | )% | | | 8.02 | % | | | 2.96 | % | | | 7.77 | % | | | 1.33 | % |
Ratios to average net assets (annualized) | | | | | | | | | | | | | | | | | | | | | | | | |
Gross expenses | | | 1.58 | % | | | 1.57 | % | | | 1.57 | % | | | 1.58 | % | | | 1.58 | % | | | 1.58 | % |
Net expenses | | | 1.50 | % | | | 1.50 | % | | | 1.50 | % | | | 1.50 | % | | | 1.50 | % | | | 1.50 | % |
Net investment income | | | 2.25 | % | | | 2.24 | % | | | 2.21 | % | | | 2.42 | % | | | 2.96 | % | | | 2.70 | % |
Supplemental data | | | | | | | | | | | | | | | | | | | | | | | | |
Portfolio turnover rate | | | 14 | % | | | 48 | % | | | 17 | % | | | 30 | % | | | 41 | % | | | 23 | % |
Net assets, end of period (000s omitted) | | | $53,057 | | | | $57,727 | | | | $66,427 | | | | $50,787 | | | | $45,934 | | | | $46,050 | |
| 1 | Total return calculations do not include any sales charges. Returns for periods of less than one year are not annualized. |
The accompanying notes are an integral part of these financial statements.
| | | | | | |
| Financial highlights | | Wells Fargo California Tax-Free Fund | | | 23 | |
(For a share outstanding throughout each period)
| | | | | | | | | | | | | | | | | | | | | | | | |
| | | Six months ended December 31, 2017 (unaudited) | | | Year ended June 30 | |
| ADMINISTRATOR CLASS | | | 2017 | | | 2016 | | | 2015 | | | 2014 | | | 2013 | |
Net asset value, beginning of period | | | $11.86 | | | | $12.48 | | | | $11.81 | | | | $11.75 | | | | $11.23 | | | | $11.39 | |
Net investment income | | | 0.19 | | | | 0.38 | | | | 0.38 | | | | 0.40 | | | | 0.44 | | | | 0.43 | |
Net realized and unrealized gains (losses) on investments | | | 0.03 | | | | (0.62 | ) | | | 0.67 | | | | 0.06 | | | | 0.52 | | | | (0.16 | ) |
| | | | | | | | | | | | | | | | | | | | | | | | |
Total from investment operations | | | 0.22 | | | | (0.24 | ) | | | 1.05 | | | | 0.46 | | | | 0.96 | | | | 0.27 | |
Distributions to shareholders from | | | | | | | | | | | | | | | | | | | | | | | | |
Net investment income | | | (0.19 | ) | | | (0.38 | ) | | | (0.38 | ) | | | (0.40 | ) | | | (0.44 | ) | | | (0.43 | ) |
Net asset value, end of period | | | $11.89 | | | | $11.86 | | | | $12.48 | | | | $11.81 | | | | $11.75 | | | | $11.23 | |
Total return1 | | | 1.89 | % | | | (1.88 | )% | | | 9.06 | % | | | 3.95 | % | | | 8.79 | % | | | 2.27 | % |
Ratios to average net assets (annualized) | | | | | | | | | | | | | | | | | | | | | | | | |
Gross expenses | | | 0.77 | % | | | 0.76 | % | | | 0.76 | % | | | 0.77 | % | | | 0.77 | % | | | 0.77 | % |
Net expenses | | | 0.55 | % | | | 0.55 | % | | | 0.55 | % | | | 0.55 | % | | | 0.55 | % | | | 0.55 | % |
Net investment income | | | 3.21 | % | | | 3.16 | % | | | 3.16 | % | | | 3.39 | % | | | 3.91 | % | | | 3.65 | % |
Supplemental data | | | | | | | | | | | | | | | | | | | | | | | | |
Portfolio turnover rate | | | 14 | % | | | 48 | % | | | 17 | % | | | 30 | % | | | 41 | % | | | 23 | % |
Net assets, end of period (000s omitted) | | | $191,578 | | | | $210,209 | | | | $344,090 | | | | $210,265 | | | | $273,026 | | | | $231,383 | |
| 1 | Returns for periods of less than one year are not annualized. |
The accompanying notes are an integral part of these financial statements.
| | | | |
| 24 | | Wells Fargo California Tax-Free Fund | | Financial highlights |
(For a share outstanding throughout each period)
| | | | | | | | | | | | | | | | |
| | | Six months ended December 31, 2017 (unaudited) | | | Year ended June 30 | |
| INSTITUTIONAL CLASS | | | 2017 | | | 2016 | | | 20151 | |
Net asset value, beginning of period | | | $11.86 | | | | $12.48 | | | | $11.81 | | | | $11.99 | |
Net investment income | | | 0.20 | | | | 0.39 | | | | 0.39 | | | | 0.27 | |
Net realized and unrealized gains (losses) on investments | | | 0.03 | | | | (0.62 | ) | | | 0.67 | | | | (0.18 | ) |
| | | | | | | | | | | | | | | | |
Total from investment operations | | | 0.23 | | | | (0.23 | ) | | | 1.06 | | | | 0.09 | |
Distributions to shareholders from | | | | | | | | | | | | | | | | |
Net investment income | | | (0.20 | ) | | | (0.39 | ) | | | (0.39 | ) | | | (0.27 | ) |
Net asset value, end of period | | | $11.89 | | | | $11.86 | | | | $12.48 | | | | $11.81 | |
Total return2 | | | 1.92 | % | | | (1.81 | )% | | | 9.14 | % | | | 0.72 | % |
Ratios to average net assets (annualized) | | | | | | | | | | | | | | | | |
Gross expenses | | | 0.50 | % | | | 0.49 | % | | | 0.49 | % | | | 0.50 | % |
Net expenses | | | 0.48 | % | | | 0.48 | % | | | 0.48 | % | | | 0.48 | % |
Net investment income | | | 3.27 | % | | | 3.28 | % | | | 3.24 | % | | | 3.35 | % |
Supplemental data | | | | | | | | | | | | | | | | |
Portfolio turnover rate | | | 14 | % | | | 48 | % | | | 17 | % | | | 30 | % |
Net assets, end of period (000s omitted) | | | $294,875 | | | | $309,253 | | | | $193,154 | | | | $149,368 | |
| 1 | For the period from October 31, 2014 (commencement of class operations) to June 30, 2015 |
| 2 | Returns for periods of less than one year are not annualized. |
The accompanying notes are an integral part of these financial statements.
| | | | | | |
| Notes to financial statements (unaudited) | | Wells Fargo California Tax-Free Fund | | | 25 | |
1. ORGANIZATION
Wells Fargo Funds Trust (the “Trust”), a Delaware statutory trust organized on March 10, 1999, is an open-end management investment company registered under the Investment Company Act of 1940, as amended (the “1940 Act”). As an investment company, the Trust follows the accounting and reporting guidance in Financial Accounting Standards Board Accounting Standards Codification Topic 946, Financial Services – Investment Companies. These financial statements report on the Wells Fargo California Tax-Free Fund (the “Fund”) which is a non-diversified series of the Trust.
Effective at the close of business on December 5, 2016, Class B shares were converted to Class A shares and are no longer offered by the Fund. Information for Class B shares reflected in the financial statements represents activity through December 5, 2016.
2. SIGNIFICANT ACCOUNTING POLICIES
The following significant accounting policies, which are consistently followed in the preparation of the financial statements of the Fund, are in conformity with U.S. generally accepted accounting principles which require management to make estimates and assumptions that affect the reported amounts of assets and liabilities, disclosure of contingent assets and liabilities at the date of the financial statements, and the reported amounts of revenues and expenses during the reporting period. Actual results could differ from those estimates.
Securities valuation
All investments are valued each business day as of the close of regular trading on the New York Stock Exchange (generally 4 p.m. Eastern Time), although the Fund may deviate from this calculation time under unusual or unexpected circumstances.
Debt securities are valued at the evaluated bid price provided by an independent pricing service or, if a reliable price is not available, the quoted bid price from an independent broker-dealer.
Futures that are listed on a foreign or domestic exchange or market are valued at the official closing price or, if none, the last sales price.
Investments in registered open-end investment companies are valued at net asset value.
Investments which are not valued using any of the methods discussed above are valued at their fair value, as determined in good faith by the Board of Trustees of the Fund. The Board of Trustees has established a Valuation Committee comprised of the Trustees and has delegated to it the authority to take any actions regarding the valuation of portfolio securities that the Valuation Committee deems necessary or appropriate, including determining the fair value of portfolio securities, unless the determination has been delegated to the Management Valuation Team of Wells Fargo Funds Management, LLC (“Funds Management”). The Board of Trustees retains the authority to make or ratify any valuation decisions or approve any changes to the Valuation Procedures as it deems appropriate. On a quarterly basis, the Board of Trustees receives reports on any valuation actions taken by the Valuation Committee or the Management Valuation Team which may include items for ratification.
Valuations of fair valued securities are compared to the next actual sales price when available, or other appropriate market values, to assess the continued appropriateness of the fair valuation methodologies used. These securities are fair valued on a day-to-day basis, taking into consideration changes to appropriate market information and any significant changes to the inputs considered in the valuation process until there is a readily available price provided on an exchange or by an independent pricing service. Valuations received from an independent pricing service or independent broker-dealer quotes are periodically validated by comparisons to most recent trades and valuations provided by other independent pricing services in addition to the review of prices by the manager and/or subadviser. Unobservable inputs used in determining fair valuations are identified based on the type of security, taking into consideration factors utilized by market participants in valuing the investment, knowledge about the issuer and the current market environment.
When-issued transactions
The Fund may purchase securities on a forward commitment or when-issued basis. The Fund records a when-issued transaction on the trade date and will segregate assets in an amount at least equal in value to the Fund’s commitment to purchase when-issued securities. Securities purchased on a when-issued basis are marked-to-market daily and the Fund begins earning interest on the settlement date. Losses may arise due to changes in the market value of the underlying securities or if the counterparty does not perform under the contract.
| | | | |
| 26 | | Wells Fargo California Tax-Free Fund | | Notes to financial statements (unaudited) |
Futures contracts
The Fund is subject to interest rate risk in the normal course of pursuing its investment objectives. The Fund may buy and sell futures contracts in order to gain exposure to, or protect against, changes in interest rates. The primary risks associated with the use of futures contracts are the imperfect correlation between changes in market values of securities held by the Fund and the prices of futures contracts, and the possibility of an illiquid market.
The aggregate principal amounts of the contracts are not recorded in the financial statements. Fluctuations in the value of the contracts are recorded in the Statement of Assets and Liabilities as an asset or liability and in the Statement of Operations as unrealized gains or losses until the contracts are closed, at which point they are recorded as net realized gains or losses on futures contracts. With futures contracts, there is minimal counterparty risk to the Fund since futures are exchange traded and the exchange’s clearinghouse, as counterparty to all exchange traded futures, guarantees the futures against default.
Security transactions and income recognition
Securities transactions are recorded on a trade date basis. Realized gains or losses are recorded on the basis of identified cost.
Interest income is accrued daily and bond discounts are accreted and premiums are amortized daily based on the effective interest method. To the extent debt obligations are placed on non-accrual status, any related interest income may be reduced by writing off interest receivables when the collection of all or a portion of interest has been determined to be doubtful based on consistently applied procedures and the fair value has decreased. If the issuer subsequently resumes interest payments or when the collectability of interest is reasonably assured, the debt obligation is removed from non-accrual status.
Distributions to shareholders
Distributions to shareholders from net investment income are accrued daily and paid monthly. Distributions from net realized gains, if any, are recorded on the ex-dividend date. Such distributions are determined in accordance with income tax regulations and may differ from U.S. generally accepted accounting principles. Dividend sources are estimated at the time of declaration. The tax character of distributions is determined as of the Fund’s fiscal year end. Therefore, a portion of the Fund’s distributions made prior to the Fund’s fiscal year end may be categorized as a tax return of capital.
Federal and other taxes
The Fund intends to continue to qualify as a regulated investment company by distributing substantially all of its investment company taxable and tax-exempt income and any net realized capital gains (after reduction for capital loss carryforwards) sufficient to relieve it from all, or substantially all, federal income taxes. Accordingly, no provision for federal income taxes was required.
The Fund’s income and federal excise tax returns and all financial records supporting those returns for the prior three fiscal years are subject to examination by the federal and Delaware revenue authorities. Management has analyzed the Fund’s tax positions taken on federal, state, and foreign tax returns for all open tax years and does not believe that there are any uncertain tax positions that require recognition of a tax liability.
As of December 31, 2017, the aggregate cost of all investments for federal income tax purposes was $904,313,548 and the unrealized gains (losses) consisted of:
| | | | |
Gross unrealized gains | | $ | 78,787,218 | |
Gross unrealized losses | | | (601,284 | ) |
Net unrealized gains | | $ | 78,185,934 | |
Capital loss carryforwards that do not expire are required to be utilized prior to capital loss carryforwards that expire. As of June 30, 2017, capital loss carryforwards available to offset future net realized capital gains were as follows through the indicated expiration dates:
| | |
| | | No expiration |
| 2018 | | Short-term |
| $4,667,645* | | $6,831,769 |
| * | Losses may be subject to certain limitations under Sections 382-384 of the Internal Revenue Code. |
| | | | | | |
| Notes to financial statements (unaudited) | | Wells Fargo California Tax-Free Fund | | | 27 | |
As of June 30, 2017, the Fund had current year net deferred post-October capital losses consisting of $14,170,573 in short-term losses which was recognized on the first day of the current fiscal year.
Class allocations
The separate classes of shares offered by the Fund differ principally in applicable sales charges, distribution, shareholder servicing, and administration fees. Class specific expenses are charged directly to that share class. Investment income, common expenses, and realized and unrealized gains (losses) on investments are allocated daily to each class of shares based on the relative proportion of net assets of each class.
3. FAIR VALUATION MEASUREMENTS
Fair value measurements of investments are determined within a framework that has established a fair value hierarchy based upon the various data inputs utilized in determining the value of the Fund’s investments. The three-level hierarchy gives the highest priority to unadjusted quoted prices in active markets for identical assets or liabilities (Level 1) and the lowest priority to unobservable inputs (Level 3). The Fund’s investments are classified within the fair value hierarchy based on the lowest level of input that is significant to the fair value measurement. The inputs are summarized into three broad levels as follows:
| ∎ | | Level 1 – quoted prices in active markets for identical securities |
| ∎ | | Level 2 – other significant observable inputs (including quoted prices for similar securities, interest rates, prepayment speeds, credit risk, etc.) |
| ∎ | | Level 3 – significant unobservable inputs (including the Fund’s own assumptions in determining the fair value of investments) |
The inputs or methodologies used for valuing investments in securities are not necessarily an indication of the risk associated with investing in those securities.
The following is a summary of the inputs used in valuing the Fund’s assets and liabilities as of December 31, 2017:
| | | | | | | | | | | | | | | | |
| | | Quoted prices
(Level 1) | | | Other significant
observable inputs
(Level 2) | | | Significant
unobservable inputs (Level 3) | | | Total | |
Assets | | | | | | | | | | | | | | | | |
Investments in: | | | | | | | | | | | | | | | | |
| | | | |
Municipal obligations | | $ | 0 | | | $ | 977,141,908 | | | $ | 0 | | | $ | 977,141,908 | |
| | | | |
Other | | | 0 | | | | 5,000,000 | | | | 0 | | | | 5,000,000 | |
| | | | |
Short-term investments | | | | | | | | | | | | | | | | |
Investment companies | | | 357,574 | | | | 0 | | | | 0 | | | | 357,574 | |
Total assets | | $ | 357,574 | | | $ | 982,141,908 | | | $ | 0 | | | $ | 982,499,482 | |
The Fund recognizes transfers between levels within the fair value hierarchy at the end of the reporting period. At December 31, 2017, the Fund did not have any transfers into/out of Level 1, Level 2, or Level 3.
4. TRANSACTIONS WITH AFFILIATES
Management fee
Funds Management, an indirect wholly owned subsidiary of Wells Fargo & Company (“Wells Fargo”), is the manager of the Fund and provides advisory and fund-level administrative services under an investment management agreement. Under the investment management agreement, Funds Management is responsible for, among other services, implementing the investment objectives and strategies of the Fund, supervising the subadviser, providing fund-level administrative services in connection with the Fund’s operations, and providing any other fund-level administrative services reasonably necessary for the operation of the Fund. As compensation for its services under the investment management agreement, Funds Management is entitled to receive an annual management fee starting at 0.40% and declining to 0.28% as the average daily net assets of the Fund increase. For the six months ended December 31, 2017, the management fee was equivalent to an annual rate of 0.39% of the Fund’s average daily net assets.
| | | | |
| 28 | | Wells Fargo California Tax-Free Fund | | Notes to financial statements (unaudited) |
Funds Management has retained the services of a subadviser to provide daily portfolio management to the Fund. The fee for subadvisory services is borne by Funds Management. Wells Capital Management Incorporated, an affiliate of Funds Management and an indirect wholly owned subsidiary of Wells Fargo, is the subadviser to the Fund and is entitled to receive a fee from Funds Management at an annual rate starting at 0.20% and declining to 0.10% as the average daily net assets of the Fund increase.
Administration fees
Under a class-level administration agreement, Funds Management provides class-level administrative services to the Fund, which includes paying fees and expenses for services provided by the transfer agent, sub-transfer agents, omnibus account servicers and record-keepers. As compensation for its services under the class-level administration agreement, Funds Management receives an annual fee which is calculated based on the average daily net assets of each class as follows:
| | | | |
| | | Class-level
administration fee | |
Class A, Class C | | | 0.16 | % |
Administrator Class | | | 0.10 | |
Institutional Class | | | 0.08 | |
Funds Management has contractually waived and/or reimbursed management and administration fees to the extent necessary to maintain certain net operating expense ratios for the Fund. Waiver of fees and/or reimbursement of expenses by Funds Management were made first from fund level expenses on a proportionate basis and then from class specific expenses. Funds Management has committed through October 31, 2018 to waive fees and/or reimburse expenses to the extent necessary to cap the Fund’s expenses at 0.75% for Class A shares, 1.50% for Class C shares, 0.55% for Administrator Class shares, and 0.48% for Institutional Class shares. After this time, the cap may be increased or the commitment to maintain the cap may be terminated only with the approval of the Board of Trustees.
Distribution fee
The Trust has adopted a distribution plan for Class C shares of the Fund pursuant to Rule 12b-1 under the 1940 Act. A distribution fee is charged to Class C shares and paid to Wells Fargo Funds Distributor, LLC (“Funds Distributor”), the principal underwriter, at an annual rate of 0.75% of the average daily net assets of Class C shares.
In addition, Funds Distributor is entitled to receive the front-end sales charge from the purchase of Class A shares and a contingent deferred sales charge on the redemption of certain Class A shares. Funds Distributor is also entitled to receive the contingent deferred sales charges from redemptions of Class C shares. For the six months ended December 31, 2017, Funds Distributor received $5,628 from the sale of Class A shares and $173 in contingent deferred sales charges from redemptions of Class C shares. No contingent deferred sales charges were incurred by Class A shares for the six months ended December 31, 2017.
Shareholder servicing fees
The Trust has entered into contracts with one or more shareholder servicing agents, whereby Class A, Class C, and Administrator Class of the Fund are charged a fee at an annual rate of 0.25% of the average daily net assets of each respective class.
A portion of these total shareholder servicing fees were paid to affiliates of Wells Fargo.
Interfund transactions
The Fund may purchase or sell portfolio investment securities to certain other Wells Fargo affiliates pursuant to Rule 17a-7 under the 1940 Act and under procedures adopted by the Board of Trustees. The procedures have been designed to ensure that these interfund transactions, which do not incur broker commissions, are effected at current market prices. Pursuant to these procedures, the Fund had $72,765,000 and $86,415,000 in interfund purchases and sales, respectively, during the six months ended December 31, 2017.
5. INVESTMENT PORTFOLIO TRANSACTIONS
Purchases and sales of investments, excluding U.S. government obligations (if any) and short-term securities, for the six months ended December 31, 2017 were $187,925,940 and $135,277,703, respectively.
| | | | | | |
| Notes to financial statements (unaudited) | | Wells Fargo California Tax-Free Fund | | | 29 | |
6. BANK BORROWINGS
The Trust (excluding the money market funds and certain other funds) and Wells Fargo Variable Trust are parties to a $280,000,000 revolving credit agreement whereby the Fund is permitted to use bank borrowings for temporary or emergency purposes, such as to fund shareholder redemption requests. Interest under the credit agreement is charged to the Fund based on a borrowing rate equal to the higher of the Federal Funds rate in effect on that day plus 1.25% or the overnight LIBOR rate in effect on that day plus 1.25%. In addition, an annual commitment fee equal to 0.25% of the unused balance is allocated to each participating fund. Prior to August 29, 2017, the revolving credit agreement amount was $250,000,000.
For the six months ended December 31, 2017, there were no borrowings by the Fund under the agreement.
7. CONCENTRATION RISK
The Fund invests a substantial portion of its assets in issuers of municipal debt securities located in a single state or territories of the U.S. Therefore, it may be more affected by economic and political developments in that state or region than would be a comparable general tax-exempt fund.
8. INDEMNIFICATION
Under the Trust’s organizational documents, the officers and Trustees have been granted certain indemnification rights against certain liabilities that may arise out of performance of their duties to the Trust. Additionally, in the normal course of business, the Trust may enter into contracts with service providers that contain a variety of indemnification clauses. The Trust’s maximum exposure under these arrangements is dependent on future claims that may be made against the Fund and, therefore, cannot be estimated.
| | | | |
| 30 | | Wells Fargo California Tax-Free Fund | | Other information (unaudited) |
PROXY VOTING INFORMATION
A description of the policies and procedures that the Fund uses to determine how to vote proxies relating to portfolio securities is available, upon request, by calling 1-800-222-8222, visiting our website at wellsfargofunds.com, or visiting the SEC website at sec.gov. Information regarding how the Fund voted proxies relating to portfolio securities during the most recent 12-month period ended June 30 is available on the Fund’s website at wellsfargofunds.com or by visiting the SEC website at sec.gov.
PORTFOLIO HOLDINGS INFORMATION
The complete portfolio holdings for the Fund are publicly available monthly on the Fund’s website (wellsfargofunds.com), on a one-month delayed basis. In addition, top ten holdings information (excluding derivative positions) for the Fund is publicly available on the Fund’s website on a monthly, seven-day or more delayed basis. The Fund files its complete schedule of portfolio holdings with the SEC for the first and third quarters of each fiscal year on Form N-Q, which is available by visiting the SEC website at sec.gov. In addition, the Fund’s Form N-Q may be reviewed and copied at the SEC’s Public Reference Room in Washington, DC, and at regional offices in New York City, at 233 Broadway, and in Chicago, at 175 West Jackson Boulevard, Suite 900. Information about the Public Reference Room may be obtained by calling 1-800-SEC-0330.
| | | | | | |
| Other information (unaudited) | | Wells Fargo California Tax-Free Fund | | | 31 | |
BOARD OF TRUSTEES AND OFFICERS
Each of the Trustees and Officers1 listed in the table below acts in identical capacities for each fund in the Wells Fargo family of funds, which consists of 153 mutual funds comprising the Wells Fargo Funds Trust, Wells Fargo Variable Trust, Wells Fargo Master Trust and four closed-end funds (collectively the “Fund Complex”). This table should be read in conjunction with the Prospectus and the Statement of Additional Information2. The mailing address of each Trustee and Officer is 525 Market Street, 12th Floor, San Francisco, CA 94105. Each Trustee and Officer serves an indefinite term, however, each Trustee serves such term until reaching the mandatory retirement age established by the Trustees.
Independent Trustees
| | | | | | |
Name and year of birth | | Position held and
length of service* | | Principal occupations during past five years or longer | | Current other
public company or
investment company
directorships |
William R. Ebsworth (Born 1957) | | Trustee, since 2015 | | Retired. From 1984 to 2013, equities analyst, portfolio manager, research director and chief investment officer at Fidelity Management and Research Company in Boston, Tokyo, and Hong Kong, and retired in 2013 as Chief Investment Officer of Fidelity Strategic Advisers, Inc. where he led a team of investment professionals managing client assets. Prior thereto, Board member of Hong Kong Securities Clearing Co., Hong Kong Options Clearing Corp., the Thailand International Fund, Ltd., Fidelity Investments Life Insurance Company, and Empire Fidelity Investments Life Insurance Company. Board member of the Forté Foundation (non-profit organization) and the Vincent Memorial Hospital Endowment (non-profit organization), where he serves on the Investment Committee and as a Chair of the Audit Committee. Mr. Ebsworth is a CFA® charterholder. | | Asset Allocation Trust |
Jane A. Freeman** (Born 1953) | | Trustee, since 2015; Chair Liaison, since 2018 | | Retired. From 2012 to 2014 and 1999 to 2008, Chief Financial Officer of Scientific Learning Corporation. From 2008 to 2012, Ms. Freeman provided consulting services related to strategic business projects. Prior to 1999, Portfolio Manager at Rockefeller & Co. and Scudder, Stevens & Clark. Board member of the Harding Loevner Funds from 1996 to 2014, serving as both Lead Independent Director and chair of the Audit Committee. Board member of the Russell Exchange Traded Funds Trust from 2011 to 2012 and the chair of the Audit Committee. Ms. Freeman is a Board Member of Ruth Bancroft Garden (non-profit organization) and the Glimmerglass Festival. She is also an inactive Chartered Financial Analyst. | | Asset Allocation Trust |
Peter G. Gordon*** (Born 1942) | | Trustee, since 1998; Chairman, from 2005 to 2017 | | Co-Founder, Retired Chairman, President and CEO of Crystal Geyser Water Company. Trustee Emeritus, Colby College. | | Asset Allocation Trust |
| Isaiah Harris, Jr. (Born 1952) | | Trustee, since 2009 | | Retired. Chairman of the Board of CIGNA Corporation since 2009, and Director since 2005. From 2003 to 2011, Director of Deluxe Corporation. Prior thereto, President and CEO of BellSouth Advertising and Publishing Corp. from 2005 to 2007, President and CEO of BellSouth Enterprises from 2004 to 2005 and President of BellSouth Consumer Services from 2000 to 2003. Emeritus member of the Iowa State University Foundation Board of Governors. Emeritus Member of the Advisory Board of Iowa State University School of Business. Advisory Board Member, Palm Harbor Academy (charter school). Advisory Board Member, Child Evangelism Fellowship (non-profit). Mr. Harris is a certified public accountant (inactive status). | | CIGNA Corporation; Asset Allocation Trust |
Judith M. Johnson (Born 1949) | | Trustee, since 2008; Audit Committee Chairman, since 2008 | | Retired. Prior thereto, Chief Executive Officer and Chief Investment Officer of Minneapolis Employees Retirement Fund from 1996 to 2008. Ms. Johnson is an attorney, certified public accountant and a certified managerial accountant. | | Asset Allocation Trust |
| | | | |
| 32 | | Wells Fargo California Tax-Free Fund | | Other information (unaudited) |
| | | | | | |
Name and year of birth | | Position held and
length of service* | | Principal occupations during past five years or longer | | Current other
public company or
investment company
directorships |
David F. Larcker (Born 1950) | | Trustee, since 2009 | | James Irvin Miller Professor of Accounting at the Graduate School of Business, Stanford University, Director of the Corporate Governance Research Initiative and Senior Faculty of The Rock Center for Corporate Governance since 2006. From 2005 to 2008, Professor of Accounting at the Graduate School of Business, Stanford University. Prior thereto, Ernst & Young Professor of Accounting at The Wharton School, University of Pennsylvania from 1985 to 2005. | | Asset Allocation Trust |
Olivia S. Mitchell**** (Born 1953) | | Trustee, since 2006; Governance Committee Chairman, since 2018 | | International Foundation of Employee Benefit Plans Professor, Wharton School of the University of Pennsylvania since 1993. Director of Wharton’s Pension Research Council and Boettner Center on Pensions & Retirement Research, and Research Associate at the National Bureau of Economic Research. Previously, Cornell University Professor from 1978 to 1993. | | Asset Allocation Trust |
Timothy J. Penny***** (Born 1951) | | Trustee, since 1996; Chairman, since 2018; Vice Chairman, from 2017 to 2018 | | President and Chief Executive Officer of Southern Minnesota Initiative Foundation, a non-profit organization, since 2007. Member of the Board of Trustees of NorthStar Education Finance, Inc., a non-profit organization, since 2007. | | Asset Allocation Trust |
James G. Polisson****** (Born 1959) | | Trustee, since 2018; Advisory Board Member, from 2017 to 2018 | | Retired. Chief Marketing Officer, Source (ETF) UK Services, Ltd, from 2015 to 2017. From 2012 to 2015, Principal of The Polisson Group, LLC, a management consulting, corporate advisory and principal investing company. Chief Executive Officer and Managing Director at Russell Investments, Global Exchange Traded Funds from 2010 to 2012. Managing Director of Barclays Global Investors from 1998 to 2010 and Global Chief Marketing Officer for iShares and Barclays Global Investors from 2000 to 2010. Trustee of the San Francisco Mechanics’ Institute, a non-profit organization, from 2013 to 2015. Board member of the Russell Exchange Traded Fund Trust from 2011 to 2012. Director of Barclays Global Investors Holdings Deutschland GmbH from 2006 to 2009. Mr. Polisson is an attorney and has a retired status with the Massachusetts and District of Columbia Bar Associations. | | Asset Allocation Trust |
Michael S. Scofield (Born 1943) | | Trustee, since 2010 | | Served on the Investment Company Institute’s Board of Governors and Executive Committee from 2008-2011 as well the Governing Council of the Independent Directors Council from 2006-2011 and the Independent Directors Council Executive Committee from 2008-2011. Trustee of the Evergreen Funds complex (and its predecessors) from 1984 to 2010. Chairman of the Evergreen Funds from 2000-2010. Former Trustee of the Mentor Funds. Retired Attorney, Law Offices of Michael S. Scofield. | | Asset Allocation Trust |
Pamela Wheelock****** (Born 1959) | | Trustee, since 2018; Advisory Board Member, from 2017 to 2018 | | Chief Operating Officer, Twin Cities Habitat for Humanity, since January, 2017. Vice President of University Services, University of Minnesota from 2012 to 2017. Prior thereto, Interim President and Chief Executive Officer of Blue Cross Blue Shield of Minnesota from 2010 to 2011, Chairman of the Board from 2009 to 2011 and Board Director from 2003 to 2015. Vice President, Leadership and Community Engagement, Bush Foundation, Saint Paul, Minnesota (a private foundation) from 2009 to 2011. Executive Vice President and Chief Financial Officer, Minnesota Sports and Entertainment from 2004 to 2009 and Senior Vice President from 2002 to 2004. Commissioner of Finance, State of Minnesota, from 1999 to 2002. Currently on the Board of Directors, Governance Committee and Finance Committee, for the Minnesota Philanthropy Partners (Saint Paul Foundation) since 2012 and Board Chair of the Minnesota Wild Foundation since 2010. | | Asset Allocation Trust |
| * | Length of service dates reflect the Trustee’s commencement of service with the Trust’s predecessor entities, where applicable. |
| ** | Jane Freeman became Chair Liaison effective January 1, 2018. |
| *** | Peter Gordon retired on December 31, 2017. |
| **** | Olivia Mitchell became Chairman of the Governance Committee effective January 1, 2018. |
| ***** | Timothy Penny became Chairman effective January 1, 2018. |
| ****** | James Polisson and Pamela Wheelock each became a Trustee effective January 1, 2018. |
| | | | | | |
| Other information (unaudited) | | Wells Fargo California Tax-Free Fund | | | 33 | |
Officers
| | | | | | |
Name and
year of birth | | Position held and
length of service | | Principal occupations during past five years or longer | | |
Andrew Owen (Born 1960) | | President, since 2017 | | Executive Vice President of Wells Fargo & Company and Head of Affiliated Managers, Wells Fargo Asset Management, since 2014. In addition, Mr. Owen is currently President, Chief Executive Officer and Director of Wells Fargo Funds Management, LLC since 2017. Prior thereto, Executive Vice President responsible for marketing, investments and product development for Wells Fargo Funds Management, LLC, from 2009 to 2014. | | |
Nancy Wiser1 (Born 1967) | | Treasurer, since 2012 | | Executive Vice President of Wells Fargo Funds Management, LLC since 2011. Chief Operating Officer and Chief Compliance Officer at LightBox Capital Management LLC, from 2008 to 2011. | | |
C. David Messman (Born 1960) | | Secretary, since 2000; Chief Legal Officer, since 2003 | | Senior Vice President and Secretary of Wells Fargo Funds Management, LLC since 2001. Assistant General Counsel of Wells Fargo Bank, N.A. since 2013 and Vice President and Managing Counsel of Wells Fargo Bank, N.A. from 1996 to 2013. | | |
Michael H. Whitaker (Born 1967) | | Chief Compliance Officer, since 2016 | | Senior Vice President and Chief Compliance Officer since 2016. Senior Vice President and Chief Compliance Officer for Fidelity Investments from 2007 to 2016. | | |
David Berardi (Born 1975) | | Assistant Treasurer, since 2009 | | Vice President of Wells Fargo Funds Management, LLC since 2009. Vice President of Evergreen Investment Management Company, LLC from 2008 to 2010. Manager of Fund Reporting and Control for Evergreen Investment Management Company, LLC from 2004 to 2010. | | |
Jeremy DePalma1 (Born 1974) | | Assistant Treasurer, since 2009 | | Senior Vice President of Wells Fargo Funds Management, LLC since 2009. Senior Vice President of Evergreen Investment Management Company, LLC from 2008 to 2010 and head of the Fund Reporting and Control Team within Fund Administration from 2005 to 2010. | | |
| 1 | Nancy Wiser acts as Treasurer of 77 funds in the Fund Complex. Jeremy DePalma acts as Treasurer of 76 funds and Assistant Treasurer of 77 funds in the Fund Complex. |
| 2 | The Statement of Additional Information includes additional information about the Trustees and is available, without charge, upon request, by calling 1-800-222-8222 or by visiting the website at wellsfargofunds.com. |
| | | | |
| 34 | | Wells Fargo California Tax-Free Fund | | List of abbreviations |
The following is a list of common abbreviations for terms and entities that may have appeared in this report.
| ACA | — ACA Financial Guaranty Corporation |
| ADR | — American depositary receipt |
| ADS | — American depositary shares |
| AGC | — Assured Guaranty Corporation |
| AGM | — Assured Guaranty Municipal |
| Ambac | — Ambac Financial Group Incorporated |
| AMT | — Alternative minimum tax |
| BAN | — Bond anticipation notes |
| BHAC | — Berkshire Hathaway Assurance Corporation |
| CAB | — Capital appreciation bond |
| CCAB | — Convertible capital appreciation bond |
| CDA | — Community Development Authority |
| CDO | — Collateralized debt obligation |
| CLO | — Collateralized loan obligation |
| DRIVER | — Derivative inverse tax-exempt receipts |
| DW&P | — Department of Water & Power |
| DWR | — Department of Water Resources |
| ECFA | — Educational & Cultural Facilities Authority |
| EDA | — Economic Development Authority |
| EDFA | — Economic Development Finance Authority |
| ETF | — Exchange-traded fund |
| FDIC | — Federal Deposit Insurance Corporation |
| FFCB | — Federal Farm Credit Banks |
| FGIC | — Financial Guaranty Insurance Corporation |
| FHA | — Federal Housing Administration |
| FHLB | — Federal Home Loan Bank |
| FHLMC | — Federal Home Loan Mortgage Corporation |
| FICO | — The Financing Corporation |
| FNMA | — Federal National Mortgage Association |
| GDR | — Global depositary receipt |
| GNMA | — Government National Mortgage Association |
| HCFR | — Healthcare facilities revenue |
| HEFA | — Health & Educational Facilities Authority |
| HEFAR | — Higher education facilities authority revenue |
| HFA | — Housing Finance Authority |
| HFFA | — Health Facilities Financing Authority |
| HUD | — Department of Housing and Urban Development |
| IDA | — Industrial Development Authority |
| IDAG | — Industrial Development Agency |
| KRW | — Republic of Korea won |
| LIBOR | — London Interbank Offered Rate |
| LIFER | — Long Inverse Floating Exempt Receipts |
| LLC | — Limited liability company |
| LLLP | — Limited liability limited partnership |
| LLP | — Limited liability partnership |
| MBIA | — Municipal Bond Insurance Association |
| MFHR | — Multifamily housing revenue |
| MSTR | — Municipal securities trust receipts |
| MUD | — Municipal Utility District |
| National | — National Public Finance Guarantee Corporation |
| PCFA | — Pollution Control Financing Authority |
| PCL | — Public Company Limited |
| PCR | — Pollution control revenue |
| PFA | — Public Finance Authority |
| PFFA | — Public Facilities Financing Authority |
| PFOTER | — Puttable floating option tax-exempt receipts |
| PJSC | — Public Joint Stock Company |
| plc | — Public limited company |
| PUTTER | — Puttable tax-exempt receipts |
| R&D | — Research & development |
| Radian | — Radian Asset Assurance |
| RAN | — Revenue anticipation notes |
| RDA | — Redevelopment Agency |
| RDFA | — Redevelopment Finance Authority |
| REIT | — Real estate investment trust |
| ROC | — Reset option certificates |
| SAVRS | — Select auction variable rate securities |
| SBA | — Small Business Authority |
| SDR | — Swedish depositary receipt |
| SFHR | — Single-family housing revenue |
| SFMR | — Single-family mortgage revenue |
| SIFMA | — Securities Industry and Financial Markets Association |
| SPA | — Standby purchase agreement |
| SPDR | — Standard & Poor’s Depositary Receipts |
| SPEAR | — Short Puttable Exempt Adjustable Receipts |
| STRIPS | — Separate trading of registered interest and |
| TAN | — Tax anticipation notes |
| TIPS | — Treasury inflation-protected securities |
| TRAN | — Tax revenue anticipation notes |
| TTFA | — Transportation Trust Fund Authority |
| TVA | — Tennessee Valley Authority |
This page is intentionally left blank.
This page is intentionally left blank.

For more information
More information about Wells Fargo Funds is available free upon request. To obtain literature, please write, email, visit the Fund’s website, or call:
Wells Fargo Funds
P.O. Box 8266
Boston, MA 02266-8266
Email: fundservice@wellsfargo.com
Website: wellsfargofunds.com
Individual investors: 1-800-222-8222
Retail investment professionals: 1-888-877-9275
Institutional investment professionals: 1-866-765-0778
This report and the financial statements contained herein are submitted for the general information of the shareholders of the Fund. If this report is used for promotional purposes, distribution of the report must be accompanied or preceded by a current prospectus. Before investing, please consider the investment objectives, risks, charges, and expenses of the investment. For a current prospectus and, if available, a summary prospectus, containing this information, call 1-800-222-8222 or visit the Fund’s website at wellsfargofunds.com. Read the prospectus carefully before you invest or send money.
Wells Fargo Asset Management (WFAM) is a trade name used by the asset management businesses of Wells Fargo & Company. Wells Fargo Funds Management, LLC, a wholly owned subsidiary of Wells Fargo & Company, provides investment advisory and administrative services for Wells Fargo Funds. Other affiliates of Wells Fargo & Company provide subadvisory and other services for the funds. The funds are distributed by Wells Fargo Funds Distributor, LLC, Member FINRA, an affiliate of Wells Fargo & Company. Neither Wells Fargo Funds Distributor nor Wells Fargo Funds Management holds fund shareholder accounts or assets. This material is for general informational and educational purposes only and is NOT intended to provide investment advice or a recommendation of any kind—including a recommendation for any specific investment, strategy, or plan.
NOT FDIC INSURED ◾ NO BANK GUARANTEE ◾ MAY LOSE VALUE
© 2017 Wells Fargo Funds Management, LLC. All rights reserved.
| | |
 | | 308059 02-18 SA249/SAR249 12-17 |
Semi-Annual Report
December 31, 2017

Wells Fargo Colorado Tax-Free Fund


Reduce clutter. Save trees.
Sign up for electronic delivery of prospectuses and shareholder reports at wellsfargo.com/advantagedelivery
Contents
The views expressed and any forward-looking statements are as of December 31, 2017, unless otherwise noted, and are those of the Fund managers and/or Wells Fargo Funds Management, LLC. Discussions of individual securities, or the markets generally, or any Wells Fargo Fund are not intended as individual recommendations. Future events or results may vary significantly from those expressed in any forward-looking statements. The views expressed are subject to change at any time in response to changing circumstances in the market. Wells Fargo Funds Management, LLC and the Fund disclaim any obligation to publicly update or revise any views expressed or forward-looking statements.
NOT FDIC INSURED ◾ NO BANK GUARANTEE ◾ MAY LOSE VALUE
| | | | |
| 2 | | Wells Fargo Colorado Tax-Free Fund | | Letter to shareholders (unaudited) |

Andrew Owen
President
Wells Fargo Funds
In a predominantly improving global economic environment, global stocks delivered strong results; bond markets had smaller but positive results as well.
Dear Shareholder:
We are pleased to offer you this semi-annual report for the Wells Fargo Colorado Tax-Free Fund for the six-month period that ended December 31, 2017. In a predominantly improving global economic environment, global stocks delivered strong results; bond markets had smaller but positive results as well. U.S. and international stocks delivered similar results, with returns of 11.42% and 11.48%, respectively, for the six-month period, as measured by the S&P 500 Index1 and the MSCI ACWI ex USA Index (Net)2, respectively; within fixed income, the Bloomberg Barclays U.S. Aggregate Bond Index3 returned 1.24% and the Bloomberg Barclays Municipal Bond Index4 returned 1.82%.
As global growth improved in the third quarter of 2017, investment markets generally advanced.
Most stock markets worldwide moved higher during the quarter and ended the period at or near all-time highs. Moderate acceleration in global economic growth was supported by improving corporate earnings, low inflation pressure, and still-low interest rates. Corporate earnings reports were favorable overall as companies continued to benefit from healthy operating leverage. While North Korea’s recent missile launches and nuclear testing raised serious concerns around the world, the heightened geopolitical risk had relatively minimal impact on the quarter’s stock returns. In the U.S., economic data released during the quarter reflected a generally healthy economy. Second-quarter economic output grew at a 3.1% annual rate, and consumers displayed more willingness to spend. Meanwhile, the U.S. Federal Reserve (Fed) maintained the target range for the federal funds rate at 1.00% to 1.25%, noting that inflation had remained below the Fed’s 2.00% objective. However, the Fed also stated the possibility of one more 0.25% increase in the federal funds rate by the end of 2017 and announced plans to begin the process of unwinding its $4.5 trillion portfolio of bonds and other assets in October. Outside the U.S., stocks in the Asia Pacific region benefited from solid earnings reports and investors’ willingness to take on risk despite the rising tensions between North Korea and the U.S. In Europe, markets were supported by better-than-expected economic growth, which led to narrowing of the gap between Europe’s growth rate and that of the U.S. In emerging markets, many countries benefited from stronger currencies versus the U.S. dollar.
Positive economic and market news continued through the fourth quarter.
During the fourth quarter of 2017, stock markets followed a steady, upward trajectory with no meaningful pullbacks, similar to their paths during the previous three quarters of the year. The extended rally was driven largely by reports of strong earnings and revenue surprises from many companies. Synchronous economic expansion worldwide with mild inflation provided a favorable environment for markets to rise with minimal volatility. Data released during the quarter reflected a
| 1 | The S&P 500 Index consists of 500 stocks chosen for market size, liquidity, and industry group representation. It is a market-value-weighted index with each stock’s weight in the index proportionate to its market value. You cannot invest directly in an index. |
| 2 | The Morgan Stanley Capital International (MSCI) All Country World Index (ACWI) ex USA Index (Net) is a free-float-adjusted market-capitalization-weighted index that is designed to measure the equity market performance of developed markets, excluding the United States and Canada. Source: MSCI. MSCI makes no express or implied warranties or representations and shall have no liability whatsoever with respect to any MSCI data contained herein. The MSCI data may not be further redistributed or used as a basis for other indices or any securities or financial products. This report is not approved, reviewed, or produced by MSCI. You cannot invest directly in an index. |
| 3 | The Bloomberg Barclays U.S. Aggregate Bond Index is a broad-based benchmark that measures the investment-grade, U.S. dollar-denominated, fixed-rate taxable bond market, including Treasuries, government-related and corporate securities, mortgage-backed securities (agency fixed-rate and hybrid adjustable-rate mortgage pass-throughs), asset-backed securities, and commercial mortgage-backed securities. You cannot invest directly in an index. |
| 4 | The Bloomberg Barclays Municipal Bond Index is an unmanaged index composed of long-term tax-exempt bonds with a minimum credit rating of Baa. You cannot invest directly in an index. |
| | | | | | |
| Letter to shareholders (unaudited) | | Wells Fargo Colorado Tax-Free Fund | | | 3 | |
healthy U.S. economy. Third-quarter economic output grew at a 3.2% annual rate, just ahead of the second quarter’s 3.1% pace. Hiring remained solid during the quarter; the hiring pace pushed the unemployment rate down to a 17-year low of 4.1% in October, and it remained at 4.1% for both November and December. Fed officials began unwinding the Fed’s $4.5 trillion portfolio of bonds and other assets in October as planned, and in December they raised the target for the federal funds rate to a range of 1.25% to 1.50%. As a result, long-term interest rates in the U.S. continued trending upward, although the 10-year rate remained below 2.5%. Outside the U.S., economies continued to strengthen. In December, the Organisation for Economic Co-operation and Development (OECD) reported that the global economy has been expanding at its fastest rate since 2010; all 45 countries the OECD follows were on track to expand for 2017. International economies have benefited from catalysts such as economic stimulus, improving employment, increased investment, and accelerated trade growth.
Don’t let short-term uncertainty derail long-term investment goals.
Periods of investment uncertainty can present challenges, but experience has taught us that maintaining long-term investment goals can be an effective way to plan for the future. To help you create a sound strategy based on your personal goals and risk tolerance, Wells Fargo Funds offers more than 100 mutual funds spanning a wide range of asset classes and investment styles. Although diversification cannot guarantee an investment profit or prevent losses, we believe it can be an effective way to manage investment risk and potentially smooth out overall portfolio performance. We encourage investors to know their investments and to understand that appropriate levels of risk-taking may unlock opportunities.
Thank you for choosing to invest with Wells Fargo Funds. We appreciate your confidence in us and remain committed to helping you meet your financial needs.
Sincerely,

Andrew Owen
President
Wells Fargo Funds
Although diversification cannot guarantee an investment profit or prevent losses, we believe it can be an effective way to manage investment risk and potentially smooth out overall portfolio performance.
For further information about your Fund, contact your investment professional, visit our website at wellsfargofunds.com, or call us directly at 1-800-222-8222. We are available 24 hours a day, 7 days a week.
| | | | |
| 4 | | Wells Fargo Colorado Tax-Free Fund | | Performance highlights (unaudited) |
Investment objective
The Fund seeks current income exempt from federal income tax and Colorado individual income tax.
Manager
Wells Fargo Funds Management, LLC
Subadviser
Wells Capital Management Incorporated
Portfolio managers
Terry J. Goode
Adrian Van Poppel
Average annual total returns (%) as of December 31, 20171
| | | | | | | | | | | | | | | | | | | | | | | | | | | | | | | | | | |
| | | | | Including sales charge | | | Excluding sales charge | | | Expense ratios2 (%) | |
| | | Inception date | | 1 year | | | 5 year | | | 10 year | | | 1 year | | | 5 year | | | 10 year | | | Gross | | | Net3 | |
| Class A (NWCOX) | | 7-31-1995 | | | 0.40 | | | | 2.33 | | | | 3.59 | | | | 5.14 | | | | 3.27 | | | | 4.06 | | | | 0.94 | | | | 0.85 | |
| Class C (WCOTX) | | 3-31-2008 | | | 3.45 | | | | 2.52 | | | | 3.28 | | | | 4.45 | | | | 2.52 | | | | 3.28 | | | | 1.69 | | | | 1.60 | |
| Administrator Class (NCOTX) | | 8-23-1993 | | | – | | | | – | | | | – | | | | 5.39 | | | | 3.53 | | | | 4.32 | | | | 0.88 | | | | 0.60 | |
| Institutional Class (WCITX) | | 10-31-2016 | | | – | | | | – | | | | – | | | | 5.58 | | | | 3.57 | | | | 4.34 | | | | 0.61 | | | | 0.52 | |
| Bloomberg Barclays Municipal Bond Index4 | | – | | | – | | | | – | | | | – | | | | 5.45 | | | | 3.02 | | | | 4.46 | | | | – | | | | – | |
| Bloomberg Barclays Colorado Municipal Bond Index5 | | – | | | – | | | | – | | | | – | | | | 6.21 | | | | 3.66 | | | | 5.00 | | | | – | | | | – | |
Figures quoted represent past performance, which is no guarantee of future results, and do not reflect taxes that a shareholder may pay on fund distributions or the redemption of fund shares. Investment return and principal value of an investment will fluctuate so that an investor’s shares, when redeemed, may be worth more or less than their original cost. Performance shown without sales charges would be lower if sales charges were reflected. Current performance may be lower or higher than the performance data quoted, which assumes the reinvestment of dividends and capital gains. Current month-end performance is available on the Fund’s website, wellsfargofunds.com.
Index returns do not include transaction costs associated with buying and selling securities, any mutual fund fees or expenses, or any taxes. It is not possible to invest directly in an index.
For Class A shares, the maximum front-end sales charge is 4.50%. For Class C shares, the maximum contingent deferred sales charge is 1.00%. Performance including a contingent deferred sales charge assumes the sales charge for the corresponding time period. Administrator Class and Institutional Class shares are sold without a front-end sales charge or contingent deferred sales charge.
Bond values fluctuate in response to the financial condition of individual issuers, general market and economic conditions, and changes in interest rates. Changes in market conditions and government policies may lead to periods of heightened volatility in the bond market and reduced liquidity for certain bonds held by the Fund. In general, when interest rates rise, bond values fall and investors may lose principal value. Interest-rate changes and their impact on the Fund and its share price can be sudden and unpredictable. The use of derivatives may reduce returns and/or increase volatility. Certain investment strategies tend to increase the total risk of an investment (relative to the broader market). The Fund is exposed to Colorado municipal securities risk and high-yield securities risk. Consult the Fund’s prospectus for additional information on these and other risks. A portion of the Fund’s income may be subject to federal, state, and/or local income taxes or the Alternative Minimum Tax (AMT). Any capital gains distributions may be taxable.
Please see footnotes on page 5.
| | | | | | |
| Performance highlights (unaudited) | | Wells Fargo Colorado Tax-Free Fund | | | 5 | |
|
| Effective maturity distribution as of December 31, 20176 |
|
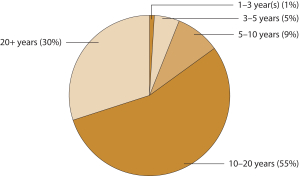 |
|
| Credit quality as of December 31, 20177 |
|
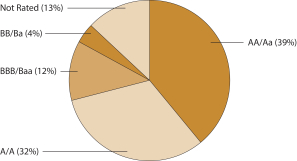
|
| 1 | Historical performance shown for Class C shares prior to their inception reflects the performance of Class A shares, adjusted to reflect the higher expenses applicable to Class C shares. Historical performance shown for the Institutional Class shares prior to their inception reflects the performance of the Administrator Class shares, and is not adjusted to reflect Institutional Class expenses. If these expenses had been included, returns for Institutional Class shares would be higher. |
| 2 | Reflects the expense ratios as stated in the most recent prospectuses. The expense ratios shown are subject to change and may differ from the annualized expense ratios shown in the financial highlights of this report. |
| 3 | The manager has contractually committed through October 31, 2018, to waive fees and/or reimburse expenses to the extent necessary to cap the Fund’s Total Annual Fund Operating Expenses After Fee Waivers at the amounts shown. After this time, the cap may be increased or the commitment to maintain the cap may be terminated only with the approval of the Board of Trustees. Brokerage commissions, stamp duty fees, interest, taxes, acquired fund fees and expenses, and extraordinary expenses are excluded from the expense cap. Without this cap, the Fund’s returns would have been lower. The expense ratio paid by an investor is the net expense ratio or the Fund’s Total Annual Fund Operating Expenses After Fee Waivers, as stated in the prospectuses. |
| 4 | The Bloomberg Barclays Municipal Bond Index is an unmanaged index composed of long-term tax-exempt bonds with a minimum credit rating of Baa. You cannot invest directly in an index. |
| 5 | The Bloomberg Barclays Colorado Municipal Bond Index is the Colorado component of the Bloomberg Barclays Municipal Bond Index. You cannot invest directly in an index. |
| 6 | Amounts are calculated based on the total investments of the Fund. These amounts are subject to change and may have changed since the date specified. |
| 7 | The credit quality distribution of portfolio holdings reflected in the chart is based on ratings from Standard & Poor’s, Moody’s Investors Service, and/ or Fitch Ratings Ltd. Credit quality ratings apply to the underlying holdings of the Fund and not to the Fund itself. The percentages of the Fund’s portfolio with the ratings depicted in the chart are calculated based on the total market value of fixed income securities held by the Fund. If a security was rated by all three rating agencies, the middle rating was utilized. If rated by two of three rating agencies, the lower rating was utilized, and if rated by one of the rating agencies, that rating was utilized. Standard & Poor’s rates the creditworthiness of bonds, ranging from AAA (highest) to D (lowest). Ratings from A to CCC may be modified by the addition of a plus (+) or minus (-) sign to show relative standing within the rating categories. Standard & Poor’s rates the creditworthiness of short-term notes from SP-1 (highest) to SP-3 (lowest). Moody’s rates the creditworthiness of bonds, ranging from Aaa (highest) to C (lowest). Ratings Aa to B may be modified by the addition of a number 1 (highest) to 3 (lowest) to show relative standing within the ratings categories. Moody’s rates the creditworthiness of short-term U.S. tax-exempt municipal securities from MIG 1/VMIG 1 (highest) to SG (lowest). Fitch rates the creditworthiness of bonds, ranging from AAA (highest) to D (lowest). Credit quality distribution is subject to change and may have changed since the date specified. |
| | | | |
| 6 | | Wells Fargo Colorado Tax-Free Fund | | Fund expenses (unaudited) |
As a shareholder of the Fund, you incur two types of costs: (1) transaction costs, including sales charges (loads) on purchase payments and contingent deferred sales charges (if any) on redemptions and (2) ongoing costs, including management fees, distribution (12b-1) and/or shareholder servicing fees, and other Fund expenses. This example is intended to help you understand your ongoing costs (in dollars) of investing in the Fund and to compare these costs with the ongoing costs of investing in other mutual funds.
The example is based on an investment of $1,000 invested at the beginning of the six-month period and held for the entire period from July 1, 2017 to December 31, 2017.
Actual expenses
The “Actual” line of the table below provides information about actual account values and actual expenses. You may use the information in this line, together with the amount you invested, to estimate the expenses that you paid over the period. Simply divide your account value by $1,000 (for example, an $8,600 account value divided by $1,000 = 8.6), then multiply the result by the number in the “Actual” line under the heading entitled “Expenses paid during period” for your applicable class of shares to estimate the expenses you paid on your account during this period.
Hypothetical example for comparison purposes
The “Hypothetical” line of the table below provides information about hypothetical account values and hypothetical expenses based on the Fund’s actual expense ratio and an assumed rate of return of 5% per year before expenses, which is not the Fund’s actual return. The hypothetical account values and expenses may not be used to estimate the actual ending account balance or expenses you paid for the period. You may use this information to compare the ongoing costs of investing in the Fund and other funds. To do so, compare this 5% hypothetical example with the 5% hypothetical examples that appear in the shareholder reports of the other funds.
Please note that the expenses shown in the table are meant to highlight your ongoing costs only and do not reflect any transactional costs, such as sales charges (loads) and contingent deferred sales charges. Therefore, the “Hypothetical” line of the table is useful in comparing ongoing costs only and will not help you determine the relative total costs of owning different funds. In addition, if these transactional costs were included, your costs would have been higher.
| | | | | | | | | | | | | | | | |
| | | Beginning
account value
7-1-2017 | | | Ending
account value
12-31-2017 | | | Expenses
paid during
the period¹ | | | Annualized net
expense ratio | |
Class A | | | | | | | | | | | | | | | | |
Actual | | $ | 1,000.00 | | | $ | 1,018.93 | | | $ | 4.27 | | | | 0.84 | % |
Hypothetical (5% return before expenses) | | $ | 1,000.00 | | | $ | 1,020.97 | | | $ | 4.28 | | | | 0.84 | % |
Class C | | | | | | | | | | | | | | | | |
Actual | | $ | 1,000.00 | | | $ | 1,015.08 | | | $ | 8.08 | | | | 1.59 | % |
Hypothetical (5% return before expenses) | | $ | 1,000.00 | | | $ | 1,017.19 | | | $ | 8.08 | | | | 1.59 | % |
Administrator Class | | | | | | | | | | | | | | | | |
Actual | | $ | 1,000.00 | | | $ | 1,020.17 | | | $ | 3.06 | | | | 0.60 | % |
Hypothetical (5% return before expenses) | | $ | 1,000.00 | | | $ | 1,022.18 | | | $ | 3.06 | | | | 0.60 | % |
Institutional Class | | | | | | | | | | | | | | | | |
Actual | | $ | 1,000.00 | | | $ | 1,020.62 | | | $ | 2.60 | | | | 0.51 | % |
Hypothetical (5% return before expenses) | | $ | 1,000.00 | | | $ | 1,022.63 | | | $ | 2.60 | | | | 0.51 | % |
| 1 | Expenses paid is equal to the annualized net expense ratio of each class multiplied by the average account value over the period, multiplied by the number of days in the most recent fiscal half-year divided by the number of days in the fiscal year (to reflect the one-half-year period). |
| | | | | | |
| Portfolio of investments—December 31, 2017 (unaudited) | | Wells Fargo Colorado Tax-Free Fund | | | 7 | |
| | | | | | | | | | | | | | | | |
| Security name | | Interest rate | | | Maturity date | | | Principal | | | Value | |
| | | | |
Municipal Obligations: 98.77% | | | | | | | | | | | | | | | | |
| | | | |
| Arizona: 1.31% | | | | | | | | | | | | | | | | |
Phoenix AZ IDA Rowan University Project (Education Revenue) | | | 5.25 | % | | | 6-1-2034 | | | $ | 1,000,000 | | | $ | 1,114,600 | |
| | | | | | | | | | | | | | | | |
| | | | |
| California: 2.74% | | | | | | | | | | | | | | | | |
Inglewood CA Unified School District (Tax Revenue, AGM Insured) | | | 5.25 | | | | 10-15-2021 | | | | 1,000,000 | | | | 1,097,910 | |
Norco CA RDA Project Area #1 (Tax Revenue) | | | 6.00 | | | | 3-1-2036 | | | | 1,120,000 | | | | 1,224,496 | |
| | | | |
| | | | | | | | | | | | | | | 2,322,406 | |
| | | | | | | | | | | | | | | | |
| | | | |
| Colorado: 89.11% | | | | | | | | | | | | | | | | |
Adams County CO Rangeview Library District Certificate of Participation Series 2015 (Miscellaneous Revenue, AGM Insured) | | | 5.00 | | | | 12-15-2029 | | | | 1,000,000 | | | | 1,176,070 | |
Arapahoe County CO Copperleaf Metropolitan District #2 (GO Revenue) | | | 5.75 | | | | 12-1-2045 | | | | 500,000 | | | | 528,475 | |
Aspen Valley Hospital District Refunding Bonds Series 2012 (Health Revenue) | | | 5.00 | | | | 10-15-2033 | | | | 600,000 | | | | 646,968 | |
Aurora CO Certificate of Participation Refunding Bonds Series 2009A (Miscellaneous Revenue) | | | 5.00 | | | | 12-1-2027 | | | | 2,000,000 | | | | 2,122,400 | |
Aurora CO Cornerstar Metropolitan District Refunding Bond Series A (GO Revenue) | | | 5.25 | | | | 12-1-2047 | | | | 1,000,000 | | | | 1,043,330 | |
Aurora CO E-470 Public Highway Authority CAB Series A (Miscellaneous Revenue, National Insured) ¤ | | | 0.00 | | | | 9-1-2034 | | | | 4,000,000 | | | | 2,284,640 | |
Aurora CO Park 70 Metropolitan District (GO Revenue) | | | 5.00 | | | | 12-1-2046 | | | | 1,000,000 | | | | 1,062,740 | |
Broomfield CO Great Western Park Metropolitan District #2 (GO Revenue) | | | 5.00 | | | | 12-1-2046 | | | | 825,000 | | | | 834,570 | |
Canon City CO Finance Authority Certificate of Participation Series 2008 (Miscellaneous Revenue, AGC Insured) | | | 5.00 | | | | 12-1-2032 | | | | 150,000 | | | | 154,760 | |
Colorado Board of Governors State University System Enterprise Bonds Series 2013C (Education Revenue) | | | 5.25 | | | | 3-1-2033 | | | | 725,000 | | | | 845,394 | |
Colorado Board of Governors State University System Enterprise Bonds Series E1 (Education Revenue) | | | 5.00 | | | | 3-1-2040 | | | | 2,000,000 | | | | 2,314,560 | |
Colorado Department of Transportation Certificate of Participation Series 2017 (Miscellaneous Revenue) | | | 5.00 | | | | 6-15-2032 | | | | 500,000 | | | | 593,420 | |
Colorado ECFA Alexander Dawson School LLC Project (Education Revenue) | | | 5.00 | | | | 2-15-2040 | | | | 1,000,000 | | | | 1,052,470 | |
Colorado ECFA Charter School American Academy Project (Education Revenue) | | | 7.25 | | | | 12-1-2028 | | | | 1,000,000 | | | | 1,071,260 | |
Colorado ECFA Charter School American Academy Project (Education Revenue) | | | 7.38 | | | | 12-1-2028 | | | | 1,000,000 | | | | 1,072,390 | |
Colorado ECFA Charter School Aspen Ridge School Project Series 2015A (Education Revenue) 144A | | | 4.13 | | | | 7-1-2026 | | | | 625,000 | | | | 637,731 | |
Colorado ECFA Charter School Banning Lewis Ranch Academy Project Series A (Education Revenue) | | | 6.00 | | | | 12-15-2037 | | | | 500,000 | | | | 497,680 | |
Colorado ECFA Charter School Ben Franklin Academy Project (Education Revenue) | | | 5.00 | | | | 7-1-2036 | | | | 750,000 | | | | 850,005 | |
Colorado ECFA Charter School Collegiate Project (Education Revenue, Syncora Guarantee Incorporated Insured) | | | 5.00 | | | | 6-15-2019 | | | | 450,000 | | | | 450,905 | |
Colorado ECFA Charter School Collegiate Project (Education Revenue, Syncora Guarantee Incorporated Insured) | | | 5.25 | | | | 6-15-2024 | | | | 1,140,000 | | | | 1,141,870 | |
Colorado ECFA Charter School District Montessori Charter School Project (Education Revenue) | | | 5.00 | | | | 7-15-2037 | | | | 1,150,000 | | | | 1,259,055 | |
Colorado ECFA Charter School Pinnacle High School Project (Education Revenue) | | | 5.13 | | | | 12-1-2039 | | | | 500,000 | | | | 509,585 | |
Colorado ECFA Charter School Refunding and Improvement Bonds Skyview Academy Project 2014 (Education Revenue) 144A | | | 4.13 | | | | 7-1-2024 | | | | 500,000 | | | | 511,010 | |
Colorado ECFA Charter School Refunding and Improvement Bonds University Laboratory School Project 2015 (Education Revenue) 144A | | | 5.00 | | | | 12-15-2028 | | | | 600,000 | | | | 659,790 | |
Colorado ECFA Refunding Bonds The University Corporation for Atmosphere Research Project Series 2010 (Education Revenue) | | | 5.00 | | | | 9-1-2032 | | | | 1,265,000 | | | | 1,373,474 | |
Colorado ECFA Refunding Bonds The University Corporation for Atmosphere Research Project Series B (Education Revenue) | | | 5.00 | | | | 9-1-2030 | | | | 1,770,000 | | | | 1,971,745 | |
The accompanying notes are an integral part of these financial statements.
| | | | |
| 8 | | Wells Fargo Colorado Tax-Free Fund | | Portfolio of investments—December 31, 2017 (unaudited) |
| | | | | | | | | | | | | | | | |
| Security name | | Interest rate | | | Maturity date | | | Principal | | | Value | |
| | | | |
| Colorado (continued) | | | | | | | | | | | | | | | | |
Colorado ECFA Student Housing Campus Village Apartment Project (Miscellaneous Revenue) | | | 5.50 | % | | | 6-1-2033 | | | $ | 1,735,000 | | | $ | 1,774,246 | |
Colorado ECFA Twin Peaks Charter Academy (Education Revenue) | | | 6.75 | | | | 11-15-2028 | | | | 750,000 | | | | 783,563 | |
Colorado Health Facilities Authority Catholic Health Initiatives Series D-1 (Health Revenue) | | | 6.25 | | | | 10-1-2033 | | | | 1,000,000 | | | | 1,029,400 | |
Colorado Health Facilities Authority Covenant Retirement Communities Series 2012C (Health Revenue) | | | 5.00 | | | | 12-1-2022 | | | | 1,000,000 | | | | 1,125,680 | |
Colorado Health Facilities Authority Evangelical Lutheran Good Samaritan Society Series 2015A (Health Revenue) | | | 5.00 | | | | 6-1-2040 | | | | 1,000,000 | | | | 1,104,010 | |
Colorado Health Facilities Authority Fraiser Meadows Retirement Community Project Series 2017A (Health Revenue) | | | 5.25 | | | | 5-15-2047 | | | | 1,000,000 | | | | 1,102,560 | |
Colorado Health Facilities Authority Sisters of Charity Leavenworth Health System Series 2013A (Health Revenue) | | | 5.50 | | | | 1-1-2035 | | | | 1,000,000 | | | | 1,169,400 | |
Colorado Health Facilities Authority Sunny Vista Living Center Series 2015A (Health Revenue) 144A | | | 5.00 | | | | 12-1-2025 | | | | 670,000 | | | | 694,080 | |
Colorado HFA Waste Management Incorporated Project (Miscellaneous Revenue) | | | 5.70 | | | | 7-1-2018 | | | | 500,000 | | | | 511,510 | |
Colorado High Performance Transportation Enterprise U.S. 36 & I-25 Managed Lanes (Transportation Revenue) | | | 5.75 | | | | 1-1-2044 | | | | 1,200,000 | | | | 1,343,148 | |
Colorado International Center Metropolitan District #3 Refunding Bonds (GO Revenue) | | | 4.63 | | | | 12-1-2031 | | | | 635,000 | | | | 613,778 | |
Colorado Park Creek Metropolitan District Refunding Bonds Series A (Tax Revenue) | | | 5.00 | | | | 12-1-2045 | | | | 500,000 | | | | 568,815 | |
Colorado Parker Homestead Metropolitan District Refunding and Improvement Bonds (GO Revenue) | | | 5.63 | | | | 12-1-2044 | | | | 1,000,000 | | | | 1,065,100 | |
Colorado Regional Transportation District Certificate of Participation Series 2010A (Miscellaneous Revenue) | | | 5.38 | | | | 6-1-2031 | | | | 2,500,000 | | | | 2,690,250 | |
Colorado Regional Transportation District Certificate of Participation Series 2014A (Miscellaneous Revenue) | | | 5.00 | | | | 6-1-2044 | | | | 2,000,000 | | | | 2,219,460 | |
Colorado Regional Transportation District Fastracks Project Revenue Bonds Series 2013A (Tax Revenue) | | | 5.00 | | | | 11-1-2031 | | | | 1,000,000 | | | | 1,132,940 | |
Colorado Springs CO Utilities System Improvement Bonds Series 2013 B-2 (Utilities Revenue) | | | 5.00 | | | | 11-15-2038 | | | | 3,000,000 | | | | 3,438,540 | |
Commerce City CO Sales & Use Tax Bonds Series 2014 (Tax Revenue, AGM Insured) | | | 5.00 | | | | 8-1-2044 | | | | 1,250,000 | | | | 1,408,538 | |
Denver CO City & County Department of Aviation Airport System Bonds Series 2012B (Airport Revenue) | | | 5.00 | | | | 11-15-2030 | | | | 2,000,000 | | | | 2,293,880 | |
Denver CO City & County Excise Tax Series A (Tax Revenue, AGC Insured) | | | 6.00 | | | | 9-1-2021 | | | | 2,000,000 | | | | 2,145,340 | |
Denver CO Health and Hospital Authority Refunding Bonds Series 2017A (Health Revenue) 144A | | | 5.00 | | | | 12-1-2034 | | | | 500,000 | | | | 570,435 | |
Denver CO School District #1 Certificate of Participation Series B (Miscellaneous Revenue) | | | 5.00 | | | | 12-15-2035 | | | | 1,000,000 | | | | 1,172,140 | |
Denver CO School District #1 Certificate of Participation Series B (Miscellaneous Revenue) | | | 5.00 | | | | 12-15-2045 | | | | 1,200,000 | | | | 1,393,476 | |
Douglas County CO Stonegate Village Metropolitan District (Water & Sewer Revenue, AGM Insured) | | | 5.00 | | | | 12-1-2045 | | | | 525,000 | | | | 578,655 | |
East Cherry Creek Valley CO Water and Sanitation District (Water & Sewer Revenue) | | | 5.00 | | | | 11-15-2032 | | | | 750,000 | | | | 888,420 | |
Fountain CO Urban Renewal Authority South Academy Highlands Project Series 2015-A (Tax Revenue) | | | 4.50 | | | | 11-1-2029 | | | | 1,305,000 | | | | 1,322,983 | |
Fremont County CO Finance Corporation Certificate of Participation Series 2013 (Miscellaneous Revenue) | | | 5.25 | | | | 12-15-2038 | | | | 1,265,000 | | | | 1,396,560 | |
Garfield County CO Public Library District Lease Purchase Financing Program (Miscellaneous Revenue) | | | 5.00 | | | | 12-1-2026 | | | | 715,000 | | | | 760,145 | |
Longmont CO Certificate of Participation Series 2014 (Miscellaneous Revenue) | | | 5.00 | | | | 12-1-2034 | | | | 1,000,000 | | | | 1,141,880 | |
Platte Valley CO Fire Protection District (Miscellaneous Revenue) | | | 5.00 | | | | 12-1-2036 | | | | 325,000 | | | | 347,818 | |
The accompanying notes are an integral part of these financial statements.
| | | | | | |
| Portfolio of investments—December 31, 2017 (unaudited) | | Wells Fargo Colorado Tax-Free Fund | | | 9 | |
| | | | | | | | | | | | | | | | |
| Security name | | Interest rate | | | Maturity date | | | Principal | | | Value | |
| | | | |
| Colorado (continued) | | | | | | | | | | | | | | | | |
Regents of the University of Colorado Certificate of Participation Series 2013A (Education Revenue) | | | 5.00 | % | | | 11-1-2028 | | | $ | 2,000,000 | | | $ | 2,282,340 | |
Thornton CO Development Authority East 144th Avenue and I-25 Project Series B (Tax Revenue) | | | 5.00 | | | | 12-1-2034 | | | | 1,375,000 | | | | 1,581,553 | |
University of Colorado Enterprise System Series A (Education Revenue) | | | 5.00 | | | | 6-1-2026 | | | | 1,000,000 | | | | 1,107,500 | |
University of Colorado Hospital Authority Series A (Health Revenue) | | | 6.00 | | | | 11-15-2029 | | | | 2,000,000 | | | | 2,154,320 | |
Weld County CO Eaton Area Park and Recreation District Series 2015 (GO Revenue) | | | 5.50 | | | | 12-1-2038 | | | | 1,075,000 | | | | 1,156,130 | |
Westminster CO Certificate of Participation Series 2015A (Miscellaneous Revenue) | | | 5.00 | | | | 12-1-2035 | | | | 2,000,000 | | | | 2,345,856 | |
Wheatlands CO (GO Revenue, Build America Mutual Assurance Company Insured) | | | 5.00 | | | | 12-1-2030 | | | | 500,000 | | | | 580,640 | |
| | | | |
| | | | | | | | | | | | | | | 75,661,386 | |
| | | | | | | | | | | | | | | | |
| | | | |
| Guam: 1.89% | | | | | | | | | | | | | | | | |
Guam Government Business Privilege Tax Series A (Tax Revenue) | | | 5.00 | | | | 1-1-2031 | | | | 1,000,000 | | | | 1,064,670 | |
Guam Government Limited Obligation Section 30 Series A (Miscellaneous Revenue) | | | 5.75 | | | | 12-1-2034 | | | | 500,000 | | | | 538,400 | |
| | | | |
| | | | | | | | | | | | | | | 1,603,070 | |
| | | | | | | | | | | | | | | | |
| | | | |
| Maryland: 0.55% | | | | | | | | | | | | | | | | |
Maryland Economic Development Corporation Salisbury University Project (Education Revenue) | | | 5.00 | | | | 6-1-2027 | | | | 235,000 | | | | 256,613 | |
Maryland Economic Development Corporation Salisbury University Project (Education Revenue) | | | 5.00 | | | | 6-1-2030 | | | | 200,000 | | | | 214,524 | |
| | | | |
| | | | | | | | | | | | | | | 471,137 | |
| | | | | | | | | | | | | | | | |
| | | | |
| Pennsylvania: 1.99% | | | | | | | | | | | | | | | | |
East Hempfield Township PA IDA Student Services Incorporated Student Housing Project of Millersville University (Education Revenue) | | | 5.00 | | | | 7-1-2029 | | | | 500,000 | | | | 552,400 | |
Pennsylvania Higher Education Facilities Authority Indiana University Student Housing Project Series A (Education Revenue) | | | 5.00 | | | | 7-1-2032 | | | | 1,000,000 | | | | 1,134,320 | |
| | | | |
| | | | | | | | | | | | | | | 1,686,720 | |
| | | | | | | | | | | | | | | | |
| | | | |
| Texas: 1.18% | | | | | | | | | | | | | | | | |
Port Arthur TX Navigation District Motiva Enterprises LLC Project Series A (Resource Recovery Revenue) ø | | | 1.83 | | | | 4-1-2040 | | | | 1,000,000 | | | | 1,000,000 | |
| | | | | | | | | | | | | | | | |
| | | | |
Total Municipal Obligations (Cost $78,444,455) | | | | | | | | | | | | | | | 83,859,319 | |
| | | | | | | | | | | | | | | | |
| | | | |
| | | Yield | | | | | | Shares | | | | |
| Short-Term Investments: 0.34% | | | | | | | | | | | | | | | | |
| | | | |
| Investment Companies: 0.34% | | | | | | | | | | | | | | | | |
Wells Fargo Municipal Cash Management Money Market Fund Institutional Class (l)(u) | | | 1.49 | | | | | | | | 290,466 | | | | 290,786 | |
| | | | | | | | | | | | | | | | |
| | | | |
Total Short-Term Investments (Cost $290,786) | | | | | | | | | | | | | | | 290,786 | |
| | | | | | | | | | | | | | | | |
| | | | | | | | |
| Total investments in securities (Cost $78,735,241) | | | 99.11 | % | | | 84,150,105 | |
Other assets and liabilities, net | | | 0.89 | | | | 753,073 | |
| | | | | | | | |
| Total net assets | | | 100.00 | % | | $ | 84,903,178 | |
| | | | | | | | |
The accompanying notes are an integral part of these financial statements.
| | | | |
| 10 | | Wells Fargo Colorado Tax-Free Fund | | Portfolio of investments—December 31, 2017 (unaudited) |
| ¤ | The security is issued in zero coupon form with no periodic interest payments. |
| 144A | The security may be resold in transactions exempt from registration, normally to qualified institutional buyers, pursuant to Rule 144A under the Securities Act of 1933. |
| ø | Variable rate demand notes are subject to a demand feature which reduces the effective maturity. The maturity date shown represents the final maturity date of the security. The interest rate is determined and reset by the issuer daily, weekly, or monthly depending upon the terms of the security. The rate shown is the rate in effect at period end. |
| (l) | The issuer of the security is an affiliated person of the Fund as defined in the Investment Company Act of 1940. |
| (u) | The rate represents the 7-day annualized yield at period end. |
Investments in Affiliates
An affiliated investment is an investment in which the Fund owns at least 5% of the outstanding voting shares of the issuer or as a result of other relationships, such as the Fund and the issuer having the same investment manager. Transactions with issuers that were either affiliates of the Fund at the beginning of the period or the end of the period were as follows:
| | | | | | | | | | | | | | | | | | | | | | | | | | | | | | | | | | | | |
| | | Shares,
beginning of
period | | | Shares
purchased | | | Shares
sold | | | Shares,
end of
period | | | Net
realized
gains
(losses) | | | Net
change in
unrealized
gains
(losses) | | | Income
from
affiliated
securities | | | Value,
end
of period | | | % of
net
assets | |
Short-Term Investments | | | | | | | | | | | | | | | | | | | | | | | | | | | | | | | | | | | | |
Investment Companies | | | | | | | | | | | | | | | | | | | | | | | | | | | | | | | | | | | | |
Wells Fargo Municipal Cash Management Money Market Fund Institutional Class | | | 187,524 | | | | 13,169,953 | | | | 13,067,011 | | | | 290,466 | | | $ | (49 | ) | | $ | 0 | | | $ | 2,704 | | | $ | 290,786 | | | | 0.34 | % |
The accompanying notes are an integral part of these financial statements.
| | | | | | |
| Statement of assets and liabilities—December 31, 2017 (unaudited) | | Wells Fargo Colorado Tax-Free Fund | | | 11 | |
| | | | |
| | | | |
| |
Assets | | | | |
Investments in unaffiliated securities, at value (cost $78,444,455) | | $ | 83,859,319 | |
Investments in affiliated securities, at value (cost $290,786) | | | 290,786 | |
Receivable for Fund shares sold | | | 178,831 | |
Receivable for interest | | | 706,129 | |
Prepaid expenses and other assets | | | 113,042 | |
| | | | |
Total assets | | | 85,148,107 | |
| | | | |
| |
Liabilities | | | | |
Payable for Fund shares redeemed | | | 109,613 | |
Dividends payable | | | 69,617 | |
Management fee payable | | | 25,518 | |
Administration fees payable | | | 9,733 | |
Distribution fee payable | | | 5,052 | |
Trustees’ fees and expenses payable | | | 2,035 | |
Shareholder servicing fees payable | | | 16,514 | |
Accrued expenses and other liabilities | | | 6,847 | |
| | | | |
Total liabilities | | | 244,929 | |
| | | | |
Total net assets | | $ | 84,903,178 | |
| | | | |
| |
NET ASSETS CONSIST OF | | | | |
Paid-in capital | | $ | 81,375,886 | |
Undistributed net investment income | | | 298,006 | |
Accumulated net realized losses on investments | | | (2,185,578 | ) |
Net unrealized gains on investments | | | 5,414,864 | |
| | | | |
Total net assets | | $ | 84,903,178 | |
| | | | |
| |
COMPUTATION OF NET ASSET VALUE AND OFFERING PRICE PER SHARE | | | | |
Net assets – Class A | | $ | 35,295,525 | |
Shares outstanding – Class A1 | | | 3,210,151 | |
Net asset value per share – Class A | | | $10.99 | |
Maximum offering price per share – Class A2 | | | $11.51 | |
Net assets – Class C | | $ | 7,775,551 | |
Shares outstanding – Class C1 | | | 706,515 | |
Net asset value per share – Class C | | | $11.01 | |
Net assets – Administrator Class | | $ | 29,421,025 | |
Shares outstanding – Administrator Class1 | | | 2,676,036 | |
Net asset value per share – Administrator Class | | | $10.99 | |
Net assets – Institutional Class | | $ | 12,411,077 | |
Shares outstanding – Institutional Class1 | | | 1,128,630 | |
Net asset value per share – Institutional Class | | | $11.00 | |
| 1 | The Fund has an unlimited number of authorized shares. |
| 2 | Maximum offering price is computed as 100/95.50 of net asset value. On investments of $50,000 or more, the offering price is reduced. |
The accompanying notes are an integral part of these financial statements.
| | | | |
| 12 | | Wells Fargo Colorado Tax-Free Fund | | Statement of operations—six months ended December 31, 2017 (unaudited) |
| | | | |
| | | | |
| |
Investment income | | | | |
Interest | | $ | 1,916,736 | |
Income from affiliated securities | | | 2,704 | |
| | | | |
Total investment income | | | 1,919,440 | |
| | | | |
| |
Expenses | | | | |
Management fee | | | 191,180 | |
Administration fees | | | | |
Class A | | | 28,405 | |
Class C | | | 6,327 | |
Administrator Class | | | 20,328 | |
Institutional Class | | | 4,608 | |
Shareholder servicing fees | | | | |
Class A | | | 44,383 | |
Class C | | | 9,886 | |
Administrator Class | | | 50,819 | |
Distribution fee | | | | |
Class C | | | 29,658 | |
Custody and accounting fees | | | 2,202 | |
Professional fees | | | 1,694 | |
Registration fees | | | 950 | |
Shareholder report expenses | | | 875 | |
Trustees’ fees and expenses | | | 9,386 | |
Other fees and expenses | | | 755 | |
| | | | |
Total expenses | | | 401,456 | |
Less: Fee waivers and/or expense reimbursements | | | (37,125 | ) |
| | | | |
Net expenses | | | 364,331 | |
| | | | |
Net investment income | | | 1,555,109 | |
| | | | |
| |
REALIZED AND UNREALIZED GAINS (LOSSES) ON INVESTMENTS | | | | |
| |
Net realized gains (losses) on: | | | | |
Unaffiliated securities | | | 142,671 | |
Affiliated securities | | | (49 | ) |
| | | | |
Net realized gains on investments | | | 142,622 | |
Net change in unrealized gains (losses) on investments | | | 131,094 | |
| | | | |
Net realized and unrealized gains (losses) on investments | | | 273,716 | |
| | | | |
Net increase in net assets resulting from operations | | $ | 1,828,825 | |
| | | | |
The accompanying notes are an integral part of these financial statements.
| | | | | | |
| Statement of changes in net assets | | Wells Fargo Colorado Tax-Free Fund | | | 13 | |
| | | | | | | | | | | | | | | | |
| | | Six months ended
December 31, 2017 (unaudited) | | | Year ended
June 30, 2017 | |
| | | | |
Operations | | | | | | | | | | | | | | | | |
Net investment income | | | | | | $ | 1,555,109 | | | | | | | $ | 3,534,695 | |
Net realized gains (losses) on investments | | | | | | | 142,622 | | | | | | | | (855,113 | ) |
Net change in unrealized gains (losses) on investments | | | | | | | 131,094 | | | | | | | | (4,966,062 | ) |
| | | | |
Net increase (decrease) in net assets resulting from operations | | | | | | | 1,828,825 | | | | | | | | (2,286,480 | ) |
| | | | |
| | | | |
Distributions to shareholders from | | | | | | | | | | | | | | | | |
Net investment income | | | | | | | | | | | | | | | | |
Class A | | | | | | | (564,334 | ) | | | | | | | (1,222,006 | ) |
Class C | | | | | | | (96,018 | ) | | | | | | | (208,016 | ) |
Administrator Class | | | | | | | (692,378 | ) | | | | | | | (1,900,560 | ) |
Institutional Class | | | | | | | (202,415 | ) | | | | | | | (204,143 | )1 |
| | | | |
Total distributions to shareholders | | | | | | | (1,555,145 | ) | | | | | | | (3,534,725 | ) |
| | | | |
| | | | |
Capital share transactions | | | Shares | | | | | | | | Shares | | | | | |
Proceeds from shares sold | | | | | | | | | | | | | | | | |
Class A | | | 190,004 | | | | 2,088,539 | | | | 569,078 | | | | 6,388,686 | |
Class C | | | 88,322 | | | | 972,923 | | | | 263,165 | | | | 2,933,638 | |
Administrator Class | | | 122,679 | | | | 1,349,162 | | | | 1,323,047 | | | | 14,665,474 | |
Institutional Class | | | 206,866 | | | | 2,278,524 | | | | 1,292,996 | 1 | | | 13,980,348 | 1 |
| | | | |
| | | | | | | 6,689,148 | | | | | | | | 37,968,146 | |
| | | | |
Reinvestment of distributions | | | | | | | | | | | | | | | | |
Class A | | | 49,997 | | | | 549,285 | | | | 108,060 | | | | 1,189,561 | |
Class C | | | 8,316 | | | | 91,462 | | | | 18,051 | | | | 198,712 | |
Administrator Class | | | 20,284 | | | | 222,852 | | | | 57,750 | | | | 637,800 | |
Institutional Class | | | 17,901 | | | | 196,694 | | | | 18,777 | 1 | | | 204,143 | 1 |
| | | | |
| | | | | | | 1,060,293 | | | | | | | | 2,230,216 | |
| | | | |
Payment for shares redeemed | | | | | | | | | | | | | | | | |
Class A | | | (286,243 | ) | | | (3,147,725 | ) | | | (1,016,415 | ) | | | (11,113,080 | ) |
Class C | | | (130,365 | ) | | | (1,434,051 | ) | | | (279,827 | ) | | | (3,064,373 | ) |
Administrator Class | | | (1,573,049 | ) | | | (17,298,833 | ) | | | (2,952,684 | ) | | | (32,143,214 | ) |
Institutional Class | | | (108,504 | ) | | | (1,193,505 | ) | | | (299,406 | )1 | | | (3,231,434 | )1 |
| | | | |
| | | | | | | (23,074,114 | ) | | | | | | | (49,552,101 | ) |
| | | | |
Net decrease in net assets resulting from capital share transactions | | | | | | | (15,324,673 | ) | | | | | | | (9,353,739 | ) |
| | | | |
Total decrease in net assets | | | | | | | (15,050,993 | ) | | | | | | | (15,174,944 | ) |
| | | | |
| | | | |
Net assets | | | | | | | | | | | | | | | | |
Beginning of period | | | | | | | 99,954,171 | | | | | | | | 115,129,115 | |
| | | | |
End of period | | | | | | $ | 84,903,178 | | | | | | | $ | 99,954,171 | |
| | | | |
Undistributed net investment income | | | | | | $ | 298,006 | | | | | | | $ | 298,042 | |
| | | | |
| 1 | For the period from October 31, 2016 (commencement of class operations) to June 30, 2017 |
The accompanying notes are an integral part of these financial statements.
| | | | |
| 14 | | Wells Fargo Colorado Tax-Free Fund | | Financial highlights |
(For a share outstanding throughout each period)
| | | | | | | | | | | | | | | | | | | | | | | | |
| | | Six months ended
December 31, 2017 (unaudited) | | | Year ended June 30 | |
| CLASS A | | | 2017 | | | 2016 | | | 2015 | | | 2014 | | | 2013 | |
Net asset value, beginning of period | | | $10.96 | | | | $11.50 | | | | $10.92 | | | | $10.85 | | | | $10.46 | | | | $10.72 | |
Net investment income | | | 0.18 | | | | 0.34 | | | | 0.34 | 1 | | | 0.34 | 1 | | | 0.35 | 1 | | | 0.34 | |
Net realized and unrealized gains (losses) on investments | | | 0.03 | | | | (0.54 | ) | | | 0.58 | | | | 0.07 | | | | 0.39 | | | | (0.26 | ) |
| | | | | | | | | | | | | | | | | | | | | | | | |
Total from investment operations | | | 0.21 | | | | (0.20 | ) | | | 0.92 | | | | 0.41 | | | | 0.74 | | | | 0.08 | |
Distributions to shareholders from | | | | | | | | | | | | | | | | | | | | | | | | |
Net investment income | | | (0.18 | ) | | | (0.34 | ) | | | (0.34 | ) | | | (0.34 | ) | | | (0.35 | ) | | | (0.34 | ) |
Net asset value, end of period | | | $10.99 | | | | $10.96 | | | | $11.50 | | | | $10.92 | | | | $10.85 | | | | $10.46 | |
Total return2 | | | 1.89 | % | | | (1.73 | )% | | | 8.53 | % | | | 3.82 | % | | | 7.26 | % | | | 0.65 | % |
Ratios to average net assets (annualized) | | | | | | | | | | | | | | | | | | | | | | | | |
Gross expenses | | | 0.84 | % | | | 0.94 | % | | | 0.93 | % | | | 0.93 | % | | | 0.94 | % | | | 0.91 | % |
Net expenses | | | 0.84 | % | | | 0.85 | % | | | 0.85 | % | | | 0.85 | % | | | 0.85 | % | | | 0.85 | % |
Net investment income | | | 3.18 | % | | | 3.05 | % | | | 3.02 | % | | | 3.12 | % | | | 3.35 | % | | | 3.10 | % |
Supplemental data | | | | | | | | | | | | | | | | | | | | | | | | |
Portfolio turnover rate | | | 5 | % | | | 25 | % | | | 13 | % | | | 23 | % | | | 33 | % | | | 36 | % |
Net assets, end of period (000s omitted) | | | $35,296 | | | | $35,706 | | | | $41,341 | | | | $33,722 | | | | $35,088 | | | | $46,069 | |
| 1 | Calculated based upon average shares outstanding |
| 2 | Total return calculations do not include any sales charges. Returns for periods of less than one year are not annualized. |
The accompanying notes are an integral part of these financial statements.
| | | | | | |
| Financial highlights | | Wells Fargo Colorado Tax-Free Fund | | | 15 | |
(For a share outstanding throughout each period)
| | | | | | | | | | | | | | | | | | | | | | | | |
| | | Six months ended
December 31, 2017 (unaudited) | | | Year ended June 30 | |
| CLASS C | | | 2017 | | | 2016 | | | 2015 | | | 2014 | | | 2013 | |
Net asset value, beginning of period | | | $10.98 | | | | $11.51 | | | | $10.93 | | | | $10.86 | | | | $10.47 | | | | $10.73 | |
Net investment income | | | 0.13 | | | | 0.26 | | | | 0.25 | | | | 0.26 | | | | 0.28 | | | | 0.26 | |
Net realized and unrealized gains (losses) on investments | | | 0.03 | | | | (0.53 | ) | | | 0.58 | | | | 0.07 | | | | 0.38 | | | | (0.26 | ) |
| | | | | | | | | | | | | | | | | | | | | | | | |
Total from investment operations | | | 0.16 | | | | (0.27 | ) | | | 0.83 | | | | 0.33 | | | | 0.66 | | | | 0.00 | |
Distributions to shareholders from | | | | | | | | | | | | | | | | | | | | | | | | |
Net investment income | | | (0.13 | ) | | | (0.26 | ) | | | (0.25 | ) | | | (0.26 | ) | | | (0.27 | ) | | | (0.26 | ) |
Net asset value, end of period | | | $11.01 | | | | $10.98 | | | | $11.51 | | | | $10.93 | | | | $10.86 | | | | $10.47 | |
Total return1 | | | 1.51 | % | | | (2.37 | )% | | | 7.71 | % | | | 3.05 | % | | | 6.46 | % | | | (0.10 | )% |
Ratios to average net assets (annualized) | | | | | | | | | | | | | | | | | | | | | | | | |
Gross expenses | | | 1.59 | % | | | 1.69 | % | | | 1.68 | % | | | 1.68 | % | | | 1.69 | % | | | 1.67 | % |
Net expenses | | | 1.59 | % | | | 1.60 | % | | | 1.60 | % | | | 1.60 | % | | | 1.60 | % | | | 1.60 | % |
Net investment income | | | 2.43 | % | | | 2.31 | % | | | 2.26 | % | | | 2.35 | % | | | 2.60 | % | | | 2.34 | % |
Supplemental data | | | | | | | | | | | | | | | | | | | | | | | | |
Portfolio turnover rate | | | 5 | % | | | 25 | % | | | 13 | % | | | 23 | % | | | 33 | % | | | 36 | % |
Net assets, end of period (000s omitted) | | | $7,776 | | | | $8,125 | | | | $8,503 | | | | $4,173 | | | | $3,689 | | | | $4,460 | |
| 1 | Total return calculations do not include any sales charges. Returns for periods of less than one year are not annualized. |
The accompanying notes are an integral part of these financial statements.
| | | | |
| 16 | | Wells Fargo Colorado Tax-Free Fund | | Financial highlights |
(For a share outstanding throughout each period)
| | | | | | | | | | | | | | | | | | | | | | | | |
| | | Six months ended
December 31, 2017 (unaudited) | | | Year ended June 30 | |
| ADMINISTRATOR CLASS | | | 2017 | | | 2016 | | | 2015 | | | 2014 | | | 2013 | |
Net asset value, beginning of period | | | $10.96 | | | | $11.50 | | | | $10.92 | | | | $10.85 | | | | $10.46 | | | | $10.72 | |
Net investment income | | | 0.20 | | | | 0.37 | 1 | | | 0.36 | | | | 0.37 | | | | 0.38 | | | | 0.36 | |
Net realized and unrealized gains (losses) on investments | | | 0.03 | | | | (0.54 | ) | | | 0.58 | | | | 0.07 | | | | 0.39 | | | | (0.26 | ) |
| | | | | | | | | | | | | | | | | | | | | | | | |
Total from investment operations | | | 0.23 | | | | (0.17 | ) | | | 0.94 | | | | 0.44 | | | | 0.77 | | | | 0.10 | |
Distributions to shareholders from | | | | | | | | | | | | | | | | | | | | | | | | |
Net investment income | | | (0.20 | ) | | | (0.37 | ) | | | (0.36 | ) | | | (0.37 | ) | | | (0.38 | ) | | | (0.36 | ) |
Net asset value, end of period | | | $10.99 | | | | $10.96 | | | | $11.50 | | | | $10.92 | | | | $10.85 | | | | $10.46 | |
Total return2 | | | 2.02 | % | | | (1.49 | )% | | | 8.80 | % | | | 4.08 | % | | | 7.53 | % | | | 0.90 | % |
Ratios to average net assets (annualized) | | | | | | | | | | | | | | | | | | | | | | | | |
Gross expenses | | | 0.78 | % | | | 0.88 | % | | | 0.87 | % | | | 0.87 | % | | | 0.88 | % | | | 0.86 | % |
Net expenses | | | 0.60 | % | | | 0.60 | % | | | 0.60 | % | | | 0.60 | % | | | 0.60 | % | | | 0.60 | % |
Net investment income | | | 3.41 | % | | | 3.29 | % | | | 3.27 | % | | | 3.36 | % | | | 3.60 | % | | | 3.34 | % |
Supplemental data | | | | | | | | | | | | | | | | | | | | | | | | |
Portfolio turnover rate | | | 5 | % | | | 25 | % | | | 13 | % | | | 23 | % | | | 33 | % | | | 36 | % |
Net assets, end of period (000s omitted) | | | $29,421 | | | | $45,022 | | | | $65,285 | | | | $52,294 | | | | $44,272 | | | | $49,549 | |
| 1 | Calculated based upon average shares outstanding |
| 2 | Returns for periods of less than one year are not annualized. |
The accompanying notes are an integral part of these financial statements.
| | | | | | |
| Financial highlights | | Wells Fargo Colorado Tax-Free Fund | | | 17 | |
(For a share outstanding throughout each period)
| | | | | | | | |
| | | Six months ended December 31, 2017 (unaudited) | | | Year ended June 30, 20171 | |
| INSTITUTIONAL CLASS | | |
Net asset value, beginning of period | | | $10.97 | | | | $11.19 | |
Net investment income | | | 0.19 | | | | 0.25 | |
Net realized and unrealized gains (losses) on investments | | | 0.03 | | | | (0.22 | ) |
| | | | | | | | |
Total from investment operations | | | 0.22 | | | | 0.03 | |
Distributions to shareholders from | | | | | | | | |
Net investment income | | | (0.19 | ) | | | (0.25 | ) |
Net asset value, end of period | | | $11.00 | | | | $10.97 | |
Total return2 | | | 2.06 | % | | | 0.33 | % |
Ratios to average net assets (annualized) | | | | | | | | |
Gross expenses | | | 0.51 | % | | | 0.55 | % |
Net expenses | | | 0.51 | % | | | 0.51 | % |
Net investment income | | | 3.51 | % | | | 3.49 | % |
Supplemental data | | | | | | | | |
Portfolio turnover rate | | | 5 | % | | | 25 | % |
Net assets, end of period (000s omitted) | | | $12,411 | | | | $11,102 | |
| 1 | For the period from October 31, 2016 (commencement of class operations) to June 30, 2017 |
| 2 | Returns for periods of less than one year are not annualized. |
The accompanying notes are an integral part of these financial statements.
| | | | |
| 18 | | Wells Fargo Colorado Tax-Free Fund | | Notes to financial statements (unaudited) |
1. ORGANIZATION
Wells Fargo Funds Trust (the “Trust”), a Delaware statutory trust organized on March 10, 1999, is an open-end management investment company registered under the Investment Company Act of 1940, as amended (the “1940 Act”). As an investment company, the Trust follows the accounting and reporting guidance in Financial Accounting Standards Board Accounting Standards Codification Topic 946, Financial Services – Investment Companies. These financial statements report on the Wells Fargo Colorado Tax-Free Fund (the “Fund”) which is a diversified series of the Trust.
2. SIGNIFICANT ACCOUNTING POLICIES
The following significant accounting policies, which are consistently followed in the preparation of the financial statements of the Fund, are in conformity with U.S. generally accepted accounting principles which require management to make estimates and assumptions that affect the reported amounts of assets and liabilities, disclosure of contingent assets and liabilities at the date of the financial statements, and the reported amounts of revenues and expenses during the reporting period. Actual results could differ from those estimates.
Securities valuation
All investments are valued each business day as of the close of regular trading on the New York Stock Exchange (generally 4 p.m. Eastern Time), although the Fund may deviate from this calculation time under unusual or unexpected circumstances.
Debt securities are valued at the evaluated bid price provided by an independent pricing service or, if a reliable price is not available, the quoted bid price from an independent broker-dealer.
Investments in registered open-end investment companies are valued at net asset value.
Investments which are not valued using any of the methods discussed above are valued at their fair value, as determined in good faith by the Board of Trustees of the Fund. The Board of Trustees has established a Valuation Committee comprised of the Trustees and has delegated to it the authority to take any actions regarding the valuation of portfolio securities that the Valuation Committee deems necessary or appropriate, including determining the fair value of portfolio securities, unless the determination has been delegated to the Management Valuation Team of Wells Fargo Funds Management, LLC (“Funds Management”). The Board of Trustees retains the authority to make or ratify any valuation decisions or approve any changes to the Valuation Procedures as it deems appropriate. On a quarterly basis, the Board of Trustees receives reports on any valuation actions taken by the Valuation Committee or the Management Valuation Team which may include items for ratification.
Valuations of fair valued securities are compared to the next actual sales price when available, or other appropriate market values, to assess the continued appropriateness of the fair valuation methodologies used. These securities are fair valued on a day-to-day basis, taking into consideration changes to appropriate market information and any significant changes to the inputs considered in the valuation process until there is a readily available price provided on an exchange or by an independent pricing service. Valuations received from an independent pricing service or independent broker-dealer quotes are periodically validated by comparisons to most recent trades and valuations provided by other independent pricing services in addition to the review of prices by the manager and/or subadviser. Unobservable inputs used in determining fair valuations are identified based on the type of security, taking into consideration factors utilized by market participants in valuing the investment, knowledge about the issuer and the current market environment.
Security transactions and income recognition
Securities transactions are recorded on a trade date basis. Realized gains or losses are recorded on the basis of identified cost.
Interest income is accrued daily and bond discounts are accreted and premiums are amortized daily based on the effective interest method. To the extent debt obligations are placed on non-accrual status, any related interest income may be reduced by writing off interest receivables when the collection of all or a portion of interest has been determined to be doubtful based on consistently applied procedures and the fair value has decreased. If the issuer subsequently resumes interest payments or when the collectability of interest is reasonably assured, the debt obligation is removed from non-accrual status.
Distributions to shareholders
Distributions to shareholders from net investment income are accrued daily and paid monthly. Distributions from net realized gains, if any, are recorded on the ex-dividend date. Such distributions are determined in accordance with income tax regulations and may differ from U.S. generally accepted accounting principles. Dividend sources are estimated at the
| | | | | | |
| Notes to financial statements (unaudited) | | Wells Fargo Colorado Tax-Free Fund | | | 19 | |
time of declaration. The tax character of distributions is determined as of the Fund’s fiscal year end. Therefore, a portion of the Fund’s distributions made prior to the Fund’s fiscal year end may be categorized as a tax return of capital.
Federal and other taxes
The Fund intends to continue to qualify as a regulated investment company by distributing substantially all of its investment company taxable and tax-exempt income and any net realized capital gains (after reduction for capital loss carryforwards) sufficient to relieve it from all, or substantially all, federal income taxes. Accordingly, no provision for federal income taxes was required.
The Fund’s income and federal excise tax returns and all financial records supporting those returns for the prior three fiscal years are subject to examination by the federal and Delaware revenue authorities. Management has analyzed the Fund’s tax positions taken on federal, state, and foreign tax returns for all open tax years and does not believe that there are any uncertain tax positions that require recognition of a tax liability.
As of December 31, 2017, the aggregate cost of all investments for federal income tax purposes was $78,735,039 and the unrealized gains (losses) consisted of:
| | | | |
Gross unrealized gains | | $ | 5,452,791 | |
Gross unrealized losses | | | (37,725 | ) |
Net unrealized gains | | $ | 5,415,066 | |
Capital loss carryforwards that do not expire are required to be utilized prior to capital loss carryforwards that expire. As of June 30, 2017, capital loss carryforwards available to offset future net realized capital gains were as follows through the indicated expiration dates:
| | | | | | |
| | | | | No expiration |
| 2018 | | 2019 | | Short-term | | Long-term |
| $548,785 | | $57,793 | | $865,247 | | $15,335 |
As of June 30, 2017, the Fund had current year net deferred post-October capital losses consisting of $841,243 in short-term losses which was recognized on the first day of the current fiscal year.
Class allocations
The separate classes of shares offered by the Fund differ principally in applicable sales charges, distribution, shareholder servicing, and administration fees. Class specific expenses are charged directly to that share class. Investment income, common expenses, and realized and unrealized gains (losses) on investments are allocated daily to each class of shares based on the relative proportion of net assets of each class.
3. FAIR VALUATION MEASUREMENTS
Fair value measurements of investments are determined within a framework that has established a fair value hierarchy based upon the various data inputs utilized in determining the value of the Fund’s investments. The three-level hierarchy gives the highest priority to unadjusted quoted prices in active markets for identical assets or liabilities (Level 1) and the lowest priority to unobservable inputs (Level 3). The Fund’s investments are classified within the fair value hierarchy based on the lowest level of input that is significant to the fair value measurement. The inputs are summarized into three broad levels as follows:
| ∎ | | Level 1 – quoted prices in active markets for identical securities |
| ∎ | | Level 2 – other significant observable inputs (including quoted prices for similar securities, interest rates, prepayment speeds, credit risk, etc.) |
| ∎ | | Level 3 – significant unobservable inputs (including the Fund’s own assumptions in determining the fair value of investments) |
The inputs or methodologies used for valuing investments in securities are not necessarily an indication of the risk associated with investing in those securities.
| | | | |
| 20 | | Wells Fargo Colorado Tax-Free Fund | | Notes to financial statements (unaudited) |
The following is a summary of the inputs used in valuing the Fund’s assets and liabilities as of December 31, 2017:
| | | | | | | | | | | | | | | | |
| | | Quoted prices
(Level 1) | | | Other significant
observable inputs
(Level 2) | | | Significant
unobservable inputs (Level 3) | | | Total | |
Assets | | | | | | | | | | | | | | | | |
Investments in: | | | | | | | | | | | | | | | | |
| | | | |
Municipal obligations | | $ | 0 | | | $ | 83,859,319 | | | $ | 0 | | | $ | 83,859,319 | |
| | | | |
Short-term investments | | | | | | | | | | | | | | | | |
Investment companies | | | 290,786 | | | | 0 | | | | 0 | | | | 290,786 | |
Total assets | | $ | 290,786 | | | $ | 83,859,319 | | | $ | 0 | | | $ | 84,150,105 | |
The Fund recognizes transfers between levels within the fair value hierarchy at the end of the reporting period. At December 31, 2017, the Fund did not have any transfers into/out of Level 1, Level 2, or Level 3.
4. TRANSACTIONS WITH AFFILIATES
Management fee
Funds Management, an indirect wholly owned subsidiary of Wells Fargo & Company (“Wells Fargo”), is the manager of the Fund and provides advisory and fund-level administrative services under an investment management agreement. Under the investment management agreement, Funds Management is responsible for, among other services, implementing the investment objectives and strategies of the Fund, supervising the subadviser, providing fund-level administrative services in connection with the Fund’s operations, and providing any other fund-level administrative services reasonably necessary for the operation of the Fund. As compensation for its services under the investment management agreement, Funds Management is entitled to receive an annual management fee starting at 0.40% and declining to 0.28% as the average daily net assets of the Fund increase. For the six months ended December 31, 2017, the management fee was equivalent to an annual rate of 0.40% of the Fund’s average daily net assets.
Funds Management has retained the services of a subadviser to provide daily portfolio management to the Fund. The fee for subadvisory services is borne by Funds Management. Wells Capital Management Incorporated, an affiliate of Funds Management and an indirect wholly owned subsidiary of Wells Fargo, is the subadviser to the Fund and is entitled to receive a fee from Funds Management at an annual rate starting at 0.20% and declining to 0.10% as the average daily net assets of the Fund increase.
Administration fees
Under a class-level administration agreement, Funds Management provides class-level administrative services to the Fund, which includes paying fees and expenses for services provided by the transfer agent, sub-transfer agents, omnibus account servicers and record-keepers. As compensation for its services under the class-level administration agreement, Funds Management receives an annual fee which is calculated based on the average daily net assets of each class as follows:
| | | | |
| | | Class level
administration fee | |
Class A, Class C | | | 0.16 | % |
Administrator Class | | | 0.10 | |
Institutional Class | | | 0.08 | |
Funds Management has contractually waived and/or reimbursed management and administration fees to the extent necessary to maintain certain net operating expense ratios for the Fund. Waiver of fees and/or reimbursement of expenses by Funds Management were made first from fund level expenses on a proportionate basis and then from class specific expenses. Funds Management has committed through October 31, 2018 to waive fees and/or reimburse expenses to the extent necessary to cap the Fund’s expenses at 0.85% for Class A shares, 1.60% for Class C shares, 0.60% for Administrator Class shares, and 0.52% for Institutional Class shares. After this time, the cap may be increased or the commitment to maintain the cap may be terminated only with the approval of the Board of Trustees.
| | | | | | |
| Notes to financial statements (unaudited) | | Wells Fargo Colorado Tax-Free Fund | | | 21 | |
Distribution fee
The Trust has adopted a Distribution Plan for Class C shares of the Fund pursuant to Rule 12b-1 under the 1940 Act. A distribution fee is charged to Class C shares and paid to Wells Fargo Funds Distributor, LLC (“Funds Distributor”), the principal underwriter, at an annual rate of 0.75% of the average daily net assets of Class C shares.
In addition, Funds Distributor is entitled to receive the front-end sales charge from the purchase of Class A shares and a contingent deferred sales charge on the redemption of certain Class A shares. Funds Distributor is also entitled to receive the contingent deferred sales charges from redemptions of Class C shares. For the six months ended December 31, 2017, Funds Distributor received $915 from the sale of Class A shares and $63 in contingent deferred sales charges from redemptions of Class C shares. No contingent deferred sales charges were incurred by Class A shares for the six months ended December 31, 2017.
Shareholder servicing fees
The Trust has entered into contracts with one or more shareholder servicing agents, whereby Class A, Class C, and Administrator Class of the Fund are charged a fee at an annual rate of 0.25% of the average daily net assets of each respective class.
A portion of these total shareholder servicing fees were paid to affiliates of Wells Fargo.
Interfund transactions
The Fund may purchase or sell portfolio investment securities to certain other Wells Fargo affiliates pursuant to Rule 17a-7 under the 1940 Act and under procedures adopted by the Board of Trustees. The procedures have been designed to ensure that these interfund transactions, which do not incur broker commissions, are effected at current market prices. Pursuant to these procedures, the Fund had $6,660,000 and $10,560,000 in interfund purchases and sales, respectively, during the six months ended December 31, 2017.
5. INVESTMENT PORTFOLIO TRANSACTIONS
Purchases and sales of investments, excluding U.S. government obligations (if any) and short-term securities, for the six months ended December 31, 2017 were $4,138,740 and $16,569,955 respectively.
6. BANK BORROWINGS
The Trust (excluding the money market funds and certain other funds) and Wells Fargo Variable Trust are parties to a $280,000,000 revolving credit agreement whereby the Fund is permitted to use bank borrowings for temporary or emergency purposes, such as to fund shareholder redemption requests. Interest under the credit agreement is charged to the Fund based on a borrowing rate equal to the higher of the Federal Funds rate in effect on that day plus 1.25% or the overnight LIBOR rate in effect on that day plus 1.25%. In addition, an annual commitment fee equal to 0.25% of the unused balance is allocated to each participating fund. Prior to August 29, 2017, the revolving credit agreement amount was $250,000,000.
For the six months ended December 31, 2017, there were no borrowings by the Fund under the agreement.
7. CONCENTRATION RISK
The Fund invests a substantial portion of its assets in issuers of municipal debt securities located in a single state or territories of the U.S. Therefore, it may be more affected by economic and political developments in that state or region than would be a comparable general tax-exempt fund.
8. INDEMNIFICATION
Under the Trust’s organizational documents, the officers and Trustees have been granted certain indemnification rights against certain liabilities that may arise out of performance of their duties to the Trust. Additionally, in the normal course of business, the Trust may enter into contracts with service providers that contain a variety of indemnification clauses. The Trust’s maximum exposure under these arrangements is dependent on future claims that may be made against the Fund and, therefore, cannot be estimated.
| | | | |
| 22 | | Wells Fargo Colorado Tax-Free Fund | | Other information (unaudited) |
PROXY VOTING INFORMATION
A description of the policies and procedures that the Fund uses to determine how to vote proxies relating to portfolio securities is available, upon request, by calling 1-800-222-8222, visiting our website at wellsfargofunds.com, or visiting the SEC website at sec.gov. Information regarding how the Fund voted proxies relating to portfolio securities during the most recent 12-month period ended June 30 is available on the Fund’s website at wellsfargofunds.com or by visiting the SEC website at sec.gov.
PORTFOLIO HOLDINGS INFORMATION
The complete portfolio holdings for the Fund are publicly available monthly on the Fund’s website (wellsfargofunds.com), on a one-month delayed basis. In addition, top ten holdings information (excluding derivative positions) for the Fund is publicly available on the Fund’s website on a monthly, seven-day or more delayed basis. The Fund files its complete schedule of portfolio holdings with the SEC for the first and third quarters of each fiscal year on Form N-Q, which is available by visiting the SEC website at sec.gov. In addition, the Fund’s Form N-Q may be reviewed and copied at the SEC’s Public Reference Room in Washington, DC, and at regional offices in New York City, at 233 Broadway, and in Chicago, at 175 West Jackson Boulevard, Suite 900. Information about the Public Reference Room may be obtained by calling 1-800-SEC-0330.
| | | | | | |
| Other information (unaudited) | | Wells Fargo Colorado Tax-Free Fund | | | 23 | |
BOARD OF TRUSTEES AND OFFICERS
Each of the Trustees and Officers1 listed in the table below acts in identical capacities for each fund in the Wells Fargo family of funds, which consists of 153 mutual funds comprising the Wells Fargo Funds Trust, Wells Fargo Variable Trust, Wells Fargo Master Trust and four closed-end funds (collectively the “Fund Complex”). This table should be read in conjunction with the Prospectus and the Statement of Additional Information2. The mailing address of each Trustee and Officer is 525 Market Street, 12th Floor, San Francisco, CA 94105. Each Trustee and Officer serves an indefinite term, however, each Trustee serves such term until reaching the mandatory retirement age established by the Trustees.
Independent Trustees
| | | | | | |
Name and year of birth | | Position held and length of service* | | Principal occupations during past five years or longer | | Current other public company or
investment company
directorships |
William R. Ebsworth (Born 1957) | | Trustee, since 2015 | | Retired. From 1984 to 2013, equities analyst, portfolio manager, research director and chief investment officer at Fidelity Management and Research Company in Boston, Tokyo, and Hong Kong, and retired in 2013 as Chief Investment Officer of Fidelity Strategic Advisers, Inc. where he led a team of investment professionals managing client assets. Prior thereto, Board member of Hong Kong Securities Clearing Co., Hong Kong Options Clearing Corp., the Thailand International Fund, Ltd., Fidelity Investments Life Insurance Company, and Empire Fidelity Investments Life Insurance Company. Board member of the Forté Foundation (non-profit organization) and the Vincent Memorial Hospital Endowment (non-profit organization), where he serves on the Investment Committee and as a Chair of the Audit Committee. Mr. Ebsworth is a CFA® charterholder. | | Asset Allocation Trust |
Jane A. Freeman** (Born 1953) | | Trustee, since 2015; Chair Liaison, since 2018 | | Retired. From 2012 to 2014 and 1999 to 2008, Chief Financial Officer of Scientific Learning Corporation. From 2008 to 2012, Ms. Freeman provided consulting services related to strategic business projects. Prior to 1999, Portfolio Manager at Rockefeller & Co. and Scudder, Stevens & Clark. Board member of the Harding Loevner Funds from 1996 to 2014, serving as both Lead Independent Director and chair of the Audit Committee. Board member of the Russell Exchange Traded Funds Trust from 2011 to 2012 and the chair of the Audit Committee. Ms. Freeman is a Board Member of Ruth Bancroft Garden (non-profit organization) and the Glimmerglass Festival. She is also an inactive Chartered Financial Analyst. | | Asset Allocation Trust |
Peter G. Gordon*** (Born 1942) | | Trustee, since 1998; Chairman, from 2005 to 2017 | | Co-Founder, Retired Chairman, President and CEO of Crystal Geyser Water Company. Trustee Emeritus, Colby College. | | Asset Allocation Trust |
Isaiah Harris, Jr. (Born 1952) | | Trustee, since 2009 | | Retired. Chairman of the Board of CIGNA Corporation since 2009, and Director since 2005. From 2003 to 2011, Director of Deluxe Corporation. Prior thereto, President and CEO of BellSouth Advertising and Publishing Corp. from 2005 to 2007, President and CEO of BellSouth Enterprises from 2004 to 2005 and President of BellSouth Consumer Services from 2000 to 2003. Emeritus member of the Iowa State University Foundation Board of Governors. Emeritus Member of the Advisory Board of Iowa State University School of Business. Advisory Board Member, Palm Harbor Academy (charter school). Advisory Board Member, Child Evangelism Fellowship (non-profit). Mr. Harris is a certified public accountant (inactive status). | | CIGNA Corporation; Asset Allocation Trust |
Judith M. Johnson (Born 1949) | | Trustee, since 2008; Audit Committee Chairman, since 2008 | | Retired. Prior thereto, Chief Executive Officer and Chief Investment Officer of Minneapolis Employees Retirement Fund from 1996 to 2008. Ms. Johnson is an attorney, certified public accountant and a certified managerial accountant. | | Asset Allocation Trust |
David F. Larcker (Born 1950) | | Trustee, since 2009 | | James Irvin Miller Professor of Accounting at the Graduate School of Business, Stanford University, Director of the Corporate Governance Research Initiative and Senior Faculty of The Rock Center for Corporate Governance since 2006. From 2005 to 2008, Professor of Accounting at the Graduate School of Business, Stanford University. Prior thereto, Ernst & Young Professor of Accounting at The Wharton School, University of Pennsylvania from 1985 to 2005. | | Asset Allocation Trust |
| | | | |
| 24 | | Wells Fargo Colorado Tax-Free Fund | | Other information (unaudited) |
| | | | | | |
Name and year of birth | | Position held and length of service* | | Principal occupations during past five years or longer | | Current other public company or
investment company
directorships |
Olivia S. Mitchell**** (Born 1953) | | Trustee, since 2006; Governance Committee Chairman, since 2018 | | International Foundation of Employee Benefit Plans Professor, Wharton School of the University of Pennsylvania since 1993. Director of Wharton’s Pension Research Council and Boettner Center on Pensions & Retirement Research, and Research Associate at the National Bureau of Economic Research. Previously, Cornell University Professor from 1978 to 1993. | | Asset Allocation Trust |
Timothy J. Penny***** (Born 1951) | | Trustee, since 1996; Chairman, since 2018; Vice Chairman, from 2017 to 2018 | | President and Chief Executive Officer of Southern Minnesota Initiative Foundation, a non-profit organization, since 2007. Member of the Board of Trustees of NorthStar Education Finance, Inc., a non-profit organization, since 2007. | | Asset Allocation Trust |
James G. Polisson****** (Born 1959) | | Trustee, since 2018; Advisory Board Member, from 2017 to 2018 | | Retired. Chief Marketing Officer, Source (ETF) UK Services, Ltd, from 2015 to 2017. From 2012 to 2015, Principal of The Polisson Group, LLC, a management consulting, corporate advisory and principal investing company. Chief Executive Officer and Managing Director at Russell Investments, Global Exchange Traded Funds from 2010 to 2012. Managing Director of Barclays Global Investors from 1998 to 2010 and Global Chief Marketing Officer for iShares and Barclays Global Investors from 2000 to 2010. Trustee of the San Francisco Mechanics’ Institute, a non-profit organization, from 2013 to 2015. Board member of the Russell Exchange Traded Fund Trust from 2011 to 2012. Director of Barclays Global Investors Holdings Deutschland GmbH from 2006 to 2009. Mr. Polisson is an attorney and has a retired status with the Massachusetts and District of Columbia Bar Associations. | | Asset Allocation Trust |
Michael S. Scofield (Born 1943) | | Trustee, since 2010 | | Served on the Investment Company Institute’s Board of Governors and Executive Committee from 2008-2011 as well the Governing Council of the Independent Directors Council from 2006-2011 and the Independent Directors Council Executive Committee from 2008-2011. Trustee of the Evergreen Funds complex (and its predecessors) from 1984 to 2010. Chairman of the Evergreen Funds from 2000-2010. Former Trustee of the Mentor Funds. Retired Attorney, Law Offices of Michael S. Scofield. | | Asset Allocation Trust |
Pamela Wheelock****** (Born 1959) | | Trustee, since 2018; Advisory Board Member, from 2017 to 2018 | | Chief Operating Officer, Twin Cities Habitat for Humanity, since January, 2017. Vice President of University Services, University of Minnesota from 2012 to 2017. Prior thereto, Interim President and Chief Executive Officer of Blue Cross Blue Shield of Minnesota from 2010 to 2011, Chairman of the Board from 2009 to 2011 and Board Director from 2003 to 2015. Vice President, Leadership and Community Engagement, Bush Foundation, Saint Paul, Minnesota (a private foundation) from 2009 to 2011. Executive Vice President and Chief Financial Officer, Minnesota Sports and Entertainment from 2004 to 2009 and Senior Vice President from 2002 to 2004. Commissioner of Finance, State of Minnesota, from 1999 to 2002. Currently on the Board of Directors, Governance Committee and Finance Committee, for the Minnesota Philanthropy Partners (Saint Paul Foundation) since 2012 and Board Chair of the Minnesota Wild Foundation since 2010. | | Asset Allocation Trust |
| * | Length of service dates reflect the Trustee’s commencement of service with the Trust’s predecessor entities, where applicable. |
| ** | Jane Freeman became Chair Liaison effective January 1, 2018. |
| *** | Peter Gordon retired on December 31, 2017. |
| **** | Olivia Mitchell became Chairman of the Governance Committee effective January 1, 2018. |
| ***** | Timothy Penny became Chairman effective January 1, 2018. |
| ****** | James Polisson and Pamela Wheelock each became a Trustee effective January 1, 2018. |
| | | | | | |
| Other information (unaudited) | | Wells Fargo Colorado Tax-Free Fund | | | 25 | |
Officers
| | | | | | |
Name and year of birth | | Position held and
length of service | | Principal occupations during past five years or longer | | |
Andrew Owen (Born 1960) | | President, since 2017 | | Executive Vice President of Wells Fargo & Company and Head of Affiliated Managers, Wells Fargo Asset Management, since 2014. In addition, Mr. Owen is currently President, Chief Executive Officer and Director of Wells Fargo Funds Management, LLC since 2017. Prior thereto, Executive Vice President responsible for marketing, investments and product development for Wells Fargo Funds Management, LLC, from 2009 to 2014. | | |
Nancy Wiser1 (Born 1967) | | Treasurer, since 2012 | | Executive Vice President of Wells Fargo Funds Management, LLC since 2011. Chief Operating Officer and Chief Compliance Officer at LightBox Capital Management LLC, from 2008 to 2011. | | |
C. David Messman (Born 1960) | | Secretary, since 2000; Chief Legal Officer, since 2003 | | Senior Vice President and Secretary of Wells Fargo Funds Management, LLC since 2001. Assistant General Counsel of Wells Fargo Bank, N.A. since 2013 and Vice President and Managing Counsel of Wells Fargo Bank, N.A. from 1996 to 2013. | | |
Michael H. Whitaker (Born 1967) | | Chief Compliance Officer, since 2016 | | Senior Vice President and Chief Compliance Officer since 2016. Senior Vice President and Chief Compliance Officer for Fidelity Investments from 2007 to 2016. | | |
David Berardi (Born 1975) | | Assistant Treasurer, since 2009 | | Vice President of Wells Fargo Funds Management, LLC since 2009. Vice President of Evergreen Investment Management Company, LLC from 2008 to 2010. Manager of Fund Reporting and Control for Evergreen Investment Management Company, LLC from 2004 to 2010. | | |
Jeremy DePalma1 (Born 1974) | | Assistant Treasurer, since 2009 | | Senior Vice President of Wells Fargo Funds Management, LLC since 2009. Senior Vice President of Evergreen Investment Management Company, LLC from 2008 to 2010 and head of the Fund Reporting and Control Team within Fund Administration from 2005 to 2010. | | |
| 1 | Nancy Wiser acts as Treasurer of 77 funds in the Fund Complex. Jeremy DePalma acts as Treasurer of 76 funds and Assistant Treasurer of 77 funds in the Fund Complex. |
| 2 | The Statement of Additional Information includes additional information about the Trustees and is available, without charge, upon request, by calling 1-800-222-8222 or by visiting the website at wellsfargofunds.com. |
| | | | |
| 26 | | Wells Fargo Colorado Tax-Free Fund | | List of abbreviations |
The following is a list of common abbreviations for terms and entities that may have appeared in this report.
| ACA | — ACA Financial Guaranty Corporation |
| ADR | — American depositary receipt |
| ADS | — American depositary shares |
| AGC | — Assured Guaranty Corporation |
| AGM | — Assured Guaranty Municipal |
| Ambac | — Ambac Financial Group Incorporated |
| AMT | — Alternative minimum tax |
| BAN | — Bond anticipation notes |
| BHAC | — Berkshire Hathaway Assurance Corporation |
| CAB | — Capital appreciation bond |
| CCAB | — Convertible capital appreciation bond |
| CDA | — Community Development Authority |
| CDO | — Collateralized debt obligation |
| CLO | — Collateralized loan obligation |
| DRIVER | — Derivative inverse tax-exempt receipts |
| DW&P | — Department of Water & Power |
| DWR | — Department of Water Resources |
| ECFA | — Educational & Cultural Facilities Authority |
| EDA | — Economic Development Authority |
| EDFA | — Economic Development Finance Authority |
| ETF | — Exchange-traded fund |
| FDIC | — Federal Deposit Insurance Corporation |
| FFCB | — Federal Farm Credit Banks |
| FGIC | — Financial Guaranty Insurance Corporation |
| FHA | — Federal Housing Administration |
| FHLB | — Federal Home Loan Bank |
| FHLMC | — Federal Home Loan Mortgage Corporation |
| FICO | — The Financing Corporation |
| FNMA | — Federal National Mortgage Association |
| GDR | — Global depositary receipt |
| GNMA | — Government National Mortgage Association |
| HCFR | — Healthcare facilities revenue |
| HEFA | — Health & Educational Facilities Authority |
| HEFAR | — Higher education facilities authority revenue |
| HFA | — Housing Finance Authority |
| HFFA | — Health Facilities Financing Authority |
| HUD | — Department of Housing and Urban Development |
| IDA | — Industrial Development Authority |
| IDAG | — Industrial Development Agency |
| KRW | — Republic of Korea won |
| LIBOR | — London Interbank Offered Rate |
| LIFER | — Long Inverse Floating Exempt Receipts |
| LLC | — Limited liability company |
| LLLP | — Limited liability limited partnership |
| LLP | — Limited liability partnership |
| MBIA | — Municipal Bond Insurance Association |
| MFHR | — Multifamily housing revenue |
| MSTR | — Municipal securities trust receipts |
| MUD | — Municipal Utility District |
| National | — National Public Finance Guarantee Corporation |
| PCFA | — Pollution Control Financing Authority |
| PCL | — Public Company Limited |
| PCR | — Pollution control revenue |
| PFA | — Public Finance Authority |
| PFFA | — Public Facilities Financing Authority |
| PFOTER | — Puttable floating option tax-exempt receipts |
| PJSC | — Public Joint Stock Company |
| plc | — Public limited company |
| PUTTER | — Puttable tax-exempt receipts |
| R&D | — Research & development |
| Radian | — Radian Asset Assurance |
| RAN | — Revenue anticipation notes |
| RDA | — Redevelopment Agency |
| RDFA | — Redevelopment Finance Authority |
| REIT | — Real estate investment trust |
| ROC | — Reset option certificates |
| SAVRS | — Select auction variable rate securities |
| SBA | — Small Business Authority |
| SDR | — Swedish depositary receipt |
| SFHR | — Single-family housing revenue |
| SFMR | — Single-family mortgage revenue |
| SIFMA | — Securities Industry and Financial Markets Association |
| SPA | — Standby purchase agreement |
| SPDR | — Standard & Poor’s Depositary Receipts |
| SPEAR | — Short Puttable Exempt Adjustable Receipts |
| STRIPS | — Separate trading of registered interest and |
| TAN | — Tax anticipation notes |
| TIPS | — Treasury inflation-protected securities |
| TRAN | — Tax revenue anticipation notes |
| TTFA | — Transportation Trust Fund Authority |
| TVA | — Tennessee Valley Authority |
This page is intentionally left blank.
This page is intentionally left blank.

For more information
More information about Wells Fargo Funds is available free upon request. To obtain literature, please write, email, visit the Fund’s website, or call:
Wells Fargo Funds
P.O. Box 8266
Boston, MA 02266-8266
Email: fundservice@wellsfargo.com
Website: wellsfargofunds.com
Individual investors: 1-800-222-8222
Retail investment professionals: 1-888-877-9275
Institutional investment professionals: 1-866-765-0778
This report and the financial statements contained herein are submitted for the general information of the shareholders of the Fund. If this report is used for promotional purposes, distribution of the report must be accompanied or preceded by a current prospectus. Before investing, please consider the investment objectives, risks, charges, and expenses of the investment. For a current prospectus and, if available, a summary prospectus, containing this information, call 1-800-222-8222 or visit the Fund’s website at wellsfargofunds.com. Read the prospectus carefully before you invest or send money.
Wells Fargo Asset Management (WFAM) is a trade name used by the asset management businesses of Wells Fargo & Company. Wells Fargo Funds Management, LLC, a wholly owned subsidiary of Wells Fargo & Company, provides investment advisory and administrative services for Wells Fargo Funds. Other affiliates of Wells Fargo & Company provide subadvisory and other services for the funds. The funds are distributed by Wells Fargo Funds Distributor, LLC, Member FINRA, an affiliate of Wells Fargo & Company. Neither Wells Fargo Funds Distributor nor Wells Fargo Funds Management holds fund shareholder accounts or assets. This material is for general informational and educational purposes only and is NOT intended to provide investment advice or a recommendation of any kind—including a recommendation for any specific investment, strategy, or plan.
NOT FDIC INSURED ◾ NO BANK GUARANTEE ◾ MAY LOSE VALUE
© 2017 Wells Fargo Funds Management, LLC. All rights reserved.
| | |
 | | 308060 02-18 SA250/SAR250 12-17 |
Semi-Annual Report
December 31, 2017

Wells Fargo High Yield Municipal Bond Fund


Reduce clutter. Save trees.
Sign up for electronic delivery of prospectuses and shareholder reports at wellsfargo.com/advantagedelivery
Contents
The views expressed and any forward-looking statements are as of December 31, 2017, unless otherwise noted, and are those of the Fund managers and/or Wells Fargo Funds Management, LLC. Discussions of individual securities, or the markets generally, or any Wells Fargo Fund are not intended as individual recommendations. Future events or results may vary significantly from those expressed in any forward-looking statements. The views expressed are subject to change at any time in response to changing circumstances in the market. Wells Fargo Funds Management, LLC and the Fund disclaim any obligation to publicly update or revise any views expressed or forward-looking statements.
NOT FDIC INSURED ◾ NO BANK GUARANTEE ◾ MAY LOSE VALUE
| | | | |
| 2 | | Wells Fargo High Yield Municipal Bond Fund | | Letter to shareholders (unaudited) |

Andrew Owen
President
Wells Fargo Funds
In a predominantly improving global economic environment, global stocks delivered strong results; bond markets had smaller but positive results as well.
Dear Shareholder:
We are pleased to offer you this semi-annual report for the Wells Fargo High Yield Municipal Bond Fund for the six-month period that ended December 31, 2017. In a predominantly improving global economic environment, global stocks delivered strong results; bond markets had smaller but positive results as well. U.S. and international stocks delivered similar results, with returns of 11.42% and 11.48%, respectively, for the six-month period, as measured by the S&P 500 Index1 and the MSCI ACWI ex USA Index (Net)2, respectively; within fixed income, the Bloomberg Barclays U.S. Aggregate Bond Index3 returned 1.24% and the Bloomberg Barclays Municipal Bond Index4 returned 1.82%.
As global growth improved in the third quarter of 2017, investment markets generally advanced.
Most stock markets worldwide moved higher during the quarter and ended the period at or near all-time highs. Moderate acceleration in global economic growth was supported by improving corporate earnings, low inflation pressure, and still-low interest rates. Corporate earnings reports were favorable overall as companies continued to benefit from healthy operating leverage. While North Korea’s recent missile launches and nuclear testing raised serious concerns around the world, the heightened geopolitical risk had relatively minimal impact on the quarter’s stock returns. In the U.S., economic data released during the quarter reflected a generally healthy economy. Second-quarter economic output grew at a 3.1% annual rate, and consumers displayed more willingness to spend. Meanwhile, the U.S. Federal Reserve (Fed) maintained the target range for the federal funds rate at 1.00% to 1.25%, noting that inflation had remained below the Fed’s 2.00% objective. However, the Fed also stated the possibility of one more 0.25% increase in the federal funds rate by the end of 2017 and announced plans to begin the process of unwinding its $4.5 trillion portfolio of bonds and other assets in October. Outside the U.S., stocks in the Asia Pacific region benefited from solid earnings reports and investors’ willingness to take on risk despite the rising tensions between North Korea and the U.S. In Europe, markets were supported by better-than-expected economic growth, which led to narrowing of the gap between Europe’s growth rate and that of the U.S. In emerging markets, many countries benefited from stronger currencies versus the U.S. dollar.
Positive economic and market news continued through the fourth quarter.
During the fourth quarter of 2017, stock markets followed a steady, upward trajectory with no meaningful pullbacks, similar to their paths during the previous three quarters of the year. The extended rally was driven largely by reports of strong earnings and revenue surprises from many companies. Synchronous economic expansion worldwide with mild inflation provided a favorable environment for markets to rise with minimal volatility. Data released during the quarter reflected a
| 1 | The S&P 500 Index consists of 500 stocks chosen for market size, liquidity, and industry group representation. It is a market-value-weighted index with each stock’s weight in the index proportionate to its market value. You cannot invest directly in an index. |
| 2 | The Morgan Stanley Capital International (MSCI) All Country World Index (ACWI) ex USA Index (Net) is a free-float-adjusted market-capitalization-weighted index that is designed to measure the equity market performance of developed markets, excluding the United States and Canada. Source: MSCI. MSCI makes no express or implied warranties or representations and shall have no liability whatsoever with respect to any MSCI data contained herein. The MSCI data may not be further redistributed or used as a basis for other indices or any securities or financial products. This report is not approved, reviewed, or produced by MSCI. You cannot invest directly in an index. |
| 3 | The Bloomberg Barclays U.S. Aggregate Bond Index is a broad-based benchmark that measures the investment-grade, U.S. dollar-denominated, fixed-rate taxable bond market, including Treasuries, government-related and corporate securities, mortgage-backed securities (agency fixed-rate and hybrid adjustable-rate mortgage pass-throughs), asset-backed securities, and commercial mortgage-backed securities. You cannot invest directly in an index. |
| 4 | The Bloomberg Barclays Municipal Bond Index is an unmanaged index composed of long-term tax-exempt bonds with a minimum credit rating of Baa. You cannot invest directly in an index. |
| | | | | | |
| Letter to shareholders (unaudited) | | Wells Fargo High Yield Municipal Bond Fund | | | 3 | |
healthy U.S. economy. Third-quarter economic output grew at a 3.2% annual rate, just ahead of the second quarter’s 3.1% pace. Hiring remained solid during the quarter; the hiring pace pushed the unemployment rate down to a 17-year low of 4.1% in October, and it remained at 4.1% for both November and December. Fed officials began unwinding the Fed’s $4.5 trillion portfolio of bonds and other assets in October as planned, and in December they raised the target for the federal funds rate to a range of 1.25% to 1.50%. As a result, long-term interest rates in the U.S. continued trending upward, although the 10-year rate remained below 2.5%. Outside the U.S., economies continued to strengthen. In December, the Organisation for Economic Co-operation and Development (OECD) reported that the global economy has been expanding at its fastest rate since 2010; all 45 countries the OECD follows were on track to expand for 2017. International economies have benefited from catalysts such as economic stimulus, improving employment, increased investment, and accelerated trade growth.
Don’t let short-term uncertainty derail long-term investment goals.
Periods of investment uncertainty can present challenges, but experience has taught us that maintaining long-term investment goals can be an effective way to plan for the future. To help you create a sound strategy based on your personal goals and risk tolerance, Wells Fargo Funds offers more than 100 mutual funds spanning a wide range of asset classes and investment styles. Although diversification cannot guarantee an investment profit or prevent losses, we believe it can be an effective way to manage investment risk and potentially smooth out overall portfolio performance. We encourage investors to know their investments and to understand that appropriate levels of risk-taking may unlock opportunities.
Thank you for choosing to invest with Wells Fargo Funds. We appreciate your confidence in us and remain committed to helping you meet your financial needs.
Sincerely,

Andrew Owen
President
Wells Fargo Funds
Although diversification cannot guarantee an investment profit or prevent losses, we believe it can be an effective way to manage investment risk and potentially smooth out overall portfolio performance.
For further information about your Fund, contact your investment professional, visit our website at wellsfargofunds.com, or call us directly at 1-800-222-8222. We are available 24 hours a day, 7 days a week.
| | | | |
| 4 | | Wells Fargo High Yield Municipal Bond Fund | | Performance highlights (unaudited) |
Investment objective
The Fund seeks current income exempt from federal income tax, and capital appreciation.
Manager
Wells Fargo Funds Management, LLC
Subadviser
Wells Capital Management Incorporated
Portfolio managers
Dennis Derby
Lyle J. Fitterer, CFA®, CPA
Terry J. Goode
Average annual total returns (%) as of December 31, 2017
| | | | | | | | | | | | | | | | | | | | | | | | | | |
| | | | | Including sales charge | | | Excluding sales charge | | | Expense ratios1 (%) | |
| | | Inception date | | 1 year | | | Since inception | | | 1 year | | | Since inception | | | Gross | | | Net2 | |
| Class A (WHYMX) | | 1-31-2013 | | | 3.79 | | | | 4.27 | | | | 8.72 | | | | 5.25 | | | | 1.06 | | | | 0.85 | |
| Class C (WHYCX) | | 1-31-2013 | | | 6.91 | | | | 4.47 | | | | 7.91 | | | | 4.47 | | | | 1.81 | | | | 1.60 | |
| Administrator Class (WHYDX) | | 1-31-2013 | | | – | | | | – | | | | 8.93 | | | | 5.37 | | | | 1.00 | | | | 0.75 | |
| Institutional Class (WHYIX) | | 1-31-2013 | | | – | | | | – | | | | 8.99 | | | | 5.51 | | | | 0.73 | | | | 0.60 | |
| Bloomberg Barclays Municipal Bond Index3 | | – | | | – | | | | – | | | | 5.45 | | | | 2.99 | | | | – | | | | – | |
| Bloomberg Barclays High Yield Municipal Bond Index4 | | – | | | – | | | | – | | | | 9.69 | | | | 4.19 | | | | – | | | | – | |
Figures quoted represent past performance, which is no guarantee of future results, and do not reflect taxes that a shareholder may pay on fund distributions or the redemption of fund shares. Investment return and principal value of an investment will fluctuate so that an investor’s shares, when redeemed, may be worth more or less than their original cost. Performance shown without sales charges would be lower if sales charges were reflected. Current performance may be lower or higher than the performance data quoted, which assumes the reinvestment of dividends and capital gains. Current month-end performance is available on the Fund’s website, wellsfargofunds.com.
Index returns do not include transaction costs associated with buying and selling securities, any mutual fund fees or expenses, or any taxes. It is not possible to invest directly in an index.
For Class A shares, the maximum front-end sales charge is 4.50%. For Class C shares, the maximum contingent deferred sales charge is 1.00%. Performance including a contingent deferred sales charge assumes the sales charge for the corresponding time period. Administrator Class and Institutional Class shares are sold without a front-end sales charge or contingent deferred sales charge.
Bond values fluctuate in response to the financial condition of individual issuers, general market and economic conditions, and changes in interest rates. Changes in market conditions and government policies may lead to periods of heightened volatility in the bond market and reduced liquidity for certain bonds held by the Fund. In general, when interest rates rise, bond values fall and investors may lose principal value. Interest-rate changes and their impact on the Fund and its share price can be sudden and unpredictable. High-yield securities have a greater risk of default and tend to be more volatile than higher-rated debt securities. The use of derivatives may reduce returns and/or increase volatility. Certain investment strategies tend to increase the total risk of an investment (relative to the broader market). The Fund is exposed to municipal securities risk. Consult the Fund’s prospectus for additional information on these and other risks. A portion of the Fund’s income may be subject to federal, state, and/or local income taxes or the Alternative Minimum Tax (AMT). Any capital gains distributions may be taxable.
Please see footnotes on page 5.
| | | | | | |
| Performance highlights (unaudited) | | Wells Fargo High Yield Municipal Bond Fund | | | 5 | |
|
| Effective maturity distribution as of December 31, 20175 |
|
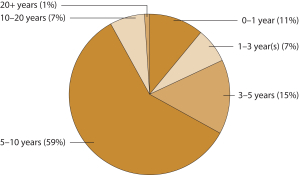 |
|
| Credit quality as of December 31, 20176 |
|
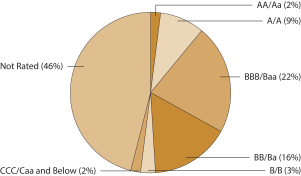 |
| 1 | Reflects the expense ratios as stated in the most recent prospectuses. The expense ratios shown are subject to change and may differ from the annualized expense ratios shown in the financial highlights of this report. |
| 2 | The manager has contractually committed through October 31, 2018, to waive fees and/or reimburse expenses to the extent necessary to cap the Fund’s Total Annual Fund Operating Expenses After Fee Waivers at the amounts shown. After this time, the cap may be increased or the commitment to maintain the cap may be terminated only with the approval of the Board of Trustees. Brokerage commissions, stamp duty fees, interest, taxes, acquired fund fees and expenses, and extraordinary expenses are excluded from the expense cap. Without this cap, the Fund’s returns would have been lower. The expense ratio paid by an investor is the net expense ratio or the Fund’s Total Annual Fund Operating Expenses After Fee Waivers, as stated in the prospectuses. |
| 3 | The Bloomberg Barclays Municipal Bond Index is an unmanaged index composed of long-term tax-exempt bonds with a minimum credit rating of Baa. You cannot invest directly in an index. |
| 4 | The Bloomberg Barclays High Yield Municipal Bond Index measures the non-investment-grade and nonrated U.S. dollar–denominated, fixed-rate, tax-exempt bond market within the 50 United States and four other qualifying regions (Washington, D.C.; Puerto Rico; Guam; and the Virgin Islands). The index allows state and local general obligation, revenue, insured, and prefunded bonds; however, historically the index has been composed of mostly revenue bonds. You cannot invest directly in an index. |
| 5 | Amounts are calculated based on the total investments of the Fund. These amounts are subject to change and may have changed since the date specified. |
| 6 | The credit quality distribution of portfolio holdings reflected in the chart is based on ratings from Standard & Poor’s, Moody’s Investors Service, and/ or Fitch Ratings Ltd. Credit quality ratings apply to the underlying holdings of the Fund and not to the Fund itself. The percentages of the Fund’s portfolio with the ratings depicted in the chart are calculated based on the total market value of fixed income securities held by the Fund. If a security was rated by all three rating agencies, the middle rating was utilized. If rated by two of three rating agencies, the lower rating was utilized, and if rated by one of the rating agencies, that rating was utilized. Standard & Poor’s rates the creditworthiness of bonds, ranging from AAA (highest) to D (lowest). Ratings from A to CCC may be modified by the addition of a plus (+) or minus (-) sign to show relative standing within the rating categories. Standard & Poor’s rates the creditworthiness of short-term notes from SP-1 (highest) to SP-3 (lowest). Moody’s rates the creditworthiness of bonds, ranging from Aaa (highest) to C (lowest). Ratings Aa to B may be modified by the addition of a number 1 (highest) to 3 (lowest) to show relative standing within the ratings categories. Moody’s rates the creditworthiness of short-term U.S. tax-exempt municipal securities from MIG 1/VMIG 1 (highest) to SG (lowest). Fitch rates the creditworthiness of bonds, ranging from AAA (highest) to D (lowest). Credit quality distribution is subject to change and may have changed since the date specified. |
| | | | |
| 6 | | Wells Fargo High Yield Municipal Bond Fund | | Fund expenses (unaudited) |
As a shareholder of the Fund, you incur two types of costs: (1) transaction costs, including sales charges (loads) on purchase payments and contingent deferred sales charges (if any) on redemptions and (2) ongoing costs, including management fees, distribution (12b-1) and/or shareholder servicing fees, and other Fund expenses. This example is intended to help you understand your ongoing costs (in dollars) of investing in the Fund and to compare these costs with the ongoing costs of investing in other mutual funds.
The example is based on an investment of $1,000 invested at the beginning of the six-month period and held for the entire period from July 1, 2017 to December 31, 2017.
Actual expenses
The “Actual” line of the table below provides information about actual account values and actual expenses. You may use the information in this line, together with the amount you invested, to estimate the expenses that you paid over the period. Simply divide your account value by $1,000 (for example, an $8,600 account value divided by $1,000 = 8.6), then multiply the result by the number in the “Actual” line under the heading entitled “Expenses paid during period” for your applicable class of shares to estimate the expenses you paid on your account during this period.
Hypothetical example for comparison purposes
The “Hypothetical” line of the table below provides information about hypothetical account values and hypothetical expenses based on the Fund’s actual expense ratio and an assumed rate of return of 5% per year before expenses, which is not the Fund’s actual return. The hypothetical account values and expenses may not be used to estimate the actual ending account balance or expenses you paid for the period. You may use this information to compare the ongoing costs of investing in the Fund and other funds. To do so, compare this 5% hypothetical example with the 5% hypothetical examples that appear in the shareholder reports of the other funds.
Please note that the expenses shown in the table are meant to highlight your ongoing costs only and do not reflect any transactional costs, such as sales charges (loads) and contingent deferred sales charges. Therefore, the “Hypothetical” line of the table is useful in comparing ongoing costs only and will not help you determine the relative total costs of owning different funds. In addition, if these transactional costs were included, your costs would have been higher.
| | | | | | | | | | | | | | | | |
| | | Beginning
account value
7-1-2017 | | | Ending
account value
12-31-2017 | | | Expenses
paid during
the period¹ | | | Annualized net
expense ratio | |
Class A | | | | | | | | | | | | | | | | |
Actual | | $ | 1,000.00 | | | $ | 1,040.12 | | | $ | 4.37 | | | | 0.85 | % |
Hypothetical (5% return before expenses) | | $ | 1,000.00 | | | $ | 1,020.92 | | | $ | 4.33 | | | | 0.85 | % |
Class C | | | | | | | | | | | | | | | | |
Actual | | $ | 1,000.00 | | | $ | 1,036.21 | | | $ | 8.21 | | | | 1.60 | % |
Hypothetical (5% return before expenses) | | $ | 1,000.00 | | | $ | 1,017.14 | | | $ | 8.13 | | | | 1.60 | % |
Administrator Class | | | | | | | | | | | | | | | | |
Actual | | $ | 1,000.00 | | | $ | 1,041.62 | | | $ | 3.86 | | | | 0.75 | % |
Hypothetical (5% return before expenses) | | $ | 1,000.00 | | | $ | 1,021.42 | | | $ | 3.82 | | | | 0.75 | % |
Institutional Class | | | | | | | | | | | | | | | | |
Actual | | $ | 1,000.00 | | | $ | 1,041.42 | | | $ | 3.09 | | | | 0.60 | % |
Hypothetical (5% return before expenses) | | $ | 1,000.00 | | | $ | 1,022.18 | | | $ | 3.06 | | | | 0.60 | % |
| 1 | Expenses paid is equal to the annualized net expense ratio of each class multiplied by the average account value over the period, multiplied by the number of days in the most recent fiscal half-year divided by the number of days in the fiscal year (to reflect the one-half-year period). |
| | | | | | |
| Portfolio of investments—December 31, 2017 (unaudited) | | Wells Fargo High Yield Municipal Bond Fund | | | 7 | |
| | | | | | | | | | | | | | | | |
| Security name | | Interest rate | | | Maturity date | | | Principal | | | Value | |
| | | | |
Municipal Obligations: 98.49% | | | | | | | | | | | | | | | | |
| | | | |
| Alabama: 1.29% | | | | | | | | | | | | | | | | |
Alabama State University General Tuition and Fee (Education Revenue, Syncora Guarantee Incorporated Insured) | | | 5.25 | % | | | 8-1-2032 | | | $ | 1,000,000 | | | $ | 976,090 | |
Jefferson County AL Warrants CAB Senior Lien Series B (Water & Sewer Revenue, AGM Insured) ¤ | | | 0.00 | | | | 10-1-2027 | | | | 920,000 | | | | 627,946 | |
| | | | |
| | | | | | | | | | | | | | | 1,604,036 | |
| | | | | | | | | | | | | | | | |
| | | | |
| Arizona: 3.63% | | | | | | | | | | | | | | | | |
Florence AZ IDA Legacy Traditional School Project Queen Creek & Casa Grande Campuses (Education Revenue) | | | 5.00 | | | | 7-1-2023 | | | | 250,000 | | | | 265,245 | |
Maricopa County AZ IDA Senior Living Facility Series 2016 (Health Revenue) 144A | | | 6.00 | | | | 1-1-2048 | | | | 1,000,000 | | | | 1,027,250 | |
Phoenix AZ IDA Great Hearts Academies Project (Education Revenue) | | | 5.20 | | | | 7-1-2022 | | | | 135,000 | | | | 144,308 | |
Phoenix AZ IDA Legacy Traditional Schools Project Series A (Education Revenue) 144A | | | 6.50 | | | | 7-1-2034 | | | | 500,000 | | | | 569,340 | |
Pima County AZ IDA New Plan Learning Project Series A (Education Revenue) | | | 8.13 | | | | 7-1-2041 | | | | 500,000 | | | | 508,835 | |
Pima County AZ IDA Refunding Bond Desert Heights Charter School Facility (Education Revenue) | | | 6.00 | | | | 5-1-2024 | | | | 525,000 | | | | 564,916 | |
Tempe AZ IDA Mirabella at ASU Incorporated Project Series A (Health Revenue) 144A | | | 6.13 | | | | 10-1-2052 | | | | 1,400,000 | | | | 1,436,498 | |
| | | | |
| | | | | | | | | | | | | | | 4,516,392 | |
| | | | | | | | | | | | | | | | |
| | | | |
| California: 5.88% | | | | | | | | | | | | | | | | |
Anaheim CA PFA Convention Center Expansion Project Series A (Miscellaneous Revenue) | | | 5.00 | | | | 5-1-2046 | | | | 500,000 | | | | 574,615 | |
California Municipal Finance Authority Charter School Albert Einstein Academies Project Series A (Education Revenue) | | | 7.13 | | | | 8-1-2043 | | | | 250,000 | | | | 278,783 | |
California PCFA Solid Waste Disposal AMT Green Bond Calplant I Project (Industrial Development Revenue) 144A | | | 8.00 | | | | 7-1-2039 | | | | 1,000,000 | | | | 1,127,720 | |
California School Finance Authority View Park Elementary & Middle Schools Series A (Education Revenue) | | | 5.88 | | | | 10-1-2044 | | | | 1,000,000 | | | | 1,093,120 | |
California Statewide CDA Loma Linda University Medical Center Refunding Bond Series A (Health Revenue) | | | 5.25 | | | | 12-1-2044 | | | | 1,000,000 | | | | 1,103,990 | |
California Student Education Loan Marketing Corporation Series IV-D1 (Education Revenue) | | | 5.88 | | | | 1-1-2018 | | | | 500,000 | | | | 500,000 | |
Compton CA Community College RDA Project 2nd Lien Series A (Tax Revenue) | | | 4.75 | | | | 8-1-2019 | | | | 225,000 | | | | 231,476 | |
Compton CA Community College RDA Project 2nd Lien Series A (Tax Revenue) | | | 5.00 | | | | 8-1-2020 | | | | 100,000 | | | | 105,101 | |
Compton CA PFA Refunding Bond (Miscellaneous Revenue) 144A | | | 4.50 | | | | 9-1-2032 | | | | 1,585,000 | | | | 1,646,847 | |
San Francisco City & County CA RDA CAB Mission Bay South Redevelopment Project Subordinate Series D (Tax Revenue) 144A¤ | | | 0.00 | | | | 8-1-2026 | | | | 1,000,000 | | | | 657,970 | |
| | | | |
| | | | | | | | | | | | | | | 7,319,622 | |
| | | | | | | | | | | | | | | | |
| | | | |
| Colorado: 10.77% | | | | | | | | | | | | | | | | |
Arapahoe County CO Copperleaf Metropolitan District #2 (GO Revenue) | | | 5.75 | | | | 12-1-2045 | | | | 500,000 | | | | 528,475 | |
Aurora CO Cornerstar Metropolitan District Refunding Bond Series A (GO Revenue) | | | 5.25 | | | | 12-1-2047 | | | | 1,000,000 | | | | 1,043,330 | |
Brighton CO Crossing Metropolitan District #4 Series A (GO Revenue) | | | 5.00 | | | | 12-1-2047 | | | | 1,220,000 | | | | 1,251,171 | |
Centerra Metropolitan District #1 Colorado Special Revenue Refunding & Improvement Bonds (Tax Revenue) 144A | | | 5.00 | | | | 12-1-2029 | | | | 1,000,000 | | | | 1,090,030 | |
Colorado Big Dry Creek Metropolitan District Refunding & Improvement Bonds Limited Tax Series A (GO Revenue) | | | 5.75 | | | | 12-1-2047 | | | | 1,000,000 | | | | 1,015,170 | |
Colorado Copperleaf Metropolitan District #3 Series A (GO Revenue) | | | 5.13 | | | | 12-1-2047 | | | | 1,200,000 | | | | 1,199,940 | |
Colorado High Performance Transportation Enterprise U.S. 36 & I-25 Managed Lanes (Transportation Revenue) | | | 5.75 | | | | 1-1-2044 | | | | 500,000 | | | | 559,645 | |
The accompanying notes are an integral part of these financial statements.
| | | | |
| 8 | | Wells Fargo High Yield Municipal Bond Fund | | Portfolio of investments—December 31, 2017 (unaudited) |
| | | | | | | | | | | | | | | | |
| Security name | | Interest rate | | | Maturity date | | | Principal | | | Value | |
| | | | |
| Colorado (continued) | | | | | | | | | | | | | | | | |
Colorado Whispering Pines Metropolitan District #1 Series A (GO Revenue) | | | 5.00 | % | | | 12-1-2047 | | | $ | 1,000,000 | | | $ | 1,012,990 | |
Eaton CO Area Park & Recreation District (GO Revenue) | | | 5.00 | | | | 12-1-2023 | | | | 810,000 | | | | 879,587 | |
Eaton CO Area Park & Recreation District (GO Revenue) | | | 5.50 | | | | 12-1-2030 | | | | 475,000 | | | | 517,508 | |
Fountain CO Urban Renewal Authority South Academy Highlands Project Series 2015-A (Tax Revenue) | | | 4.50 | | | | 11-1-2029 | | | | 1,695,000 | | | | 1,718,357 | |
Pueblo CO Urban Renewal Authority Regional Tourism Act Project (Tax Revenue) | | | 5.00 | | | | 6-1-2036 | | | | 1,000,000 | | | | 1,014,740 | |
Southlands CO Metropolitan District #1 Series A1 (GO Revenue) | | | 3.50 | | | | 12-1-2027 | | | | 500,000 | | | | 499,160 | |
Southlands CO Metropolitan District #1 Series A1 (GO Revenue) | | | 5.00 | | | | 12-1-2047 | | | | 1,000,000 | | | | 1,076,880 | |
| | | | |
| | | | | | | | | | | | | | | 13,406,983 | |
| | | | | | | | | | | | | | | | |
| | | | |
| Connecticut: 0.45% | | | | | | | | | | | | | | | | |
Hartford CT Series A (GO Revenue) | | | 4.00 | | | | 4-1-2032 | | | | 325,000 | | | | 291,746 | |
Hartford CT Series A (GO Revenue) | | | 5.00 | | | | 4-1-2024 | | | | 105,000 | | | | 103,067 | |
Hartford CT Series B (GO Revenue) | | | 5.00 | | | | 4-1-2033 | | | | 50,000 | | | | 49,292 | |
Hartford CT Unrefunded Bond Series A (GO Revenue) | | | 5.00 | | | | 4-1-2029 | | | | 45,000 | | | | 43,347 | |
Hartford CT Unrefunded Bond Series A (GO Revenue) | | | 5.00 | | | | 4-1-2030 | | | | 70,000 | | | | 66,728 | |
| | | | |
| | | | | | | | | | | | | | | 554,180 | |
| | | | | | | | | | | | | | | | |
| | | | |
| Delaware: 0.81% | | | | | | | | | | | | | | | | |
Delaware EDA Odyssey Charter School Incorporated Project Series A (Education Revenue) 144A | | | 7.00 | | | | 9-1-2045 | | | | 1,000,000 | | | | 1,013,320 | |
| | | | | | | | | | | | | | | | |
| | | | |
| District of Columbia: 0.37% | | | | | | | | | | | | | | | | |
District of Columbia Tobacco Settlement Financing Corporation (Tobacco Revenue) | | | 6.75 | | | | 5-15-2040 | | | | 435,000 | | | | 455,132 | |
| | | | | | | | | | | | | | | | |
| | | | |
| Florida: 2.77% | | | | | | | | | | | | | | | | |
Florida Development Finance Corporation Educational Facilities Renaissance Charter School Project Series A (Education Revenue) | | | 8.50 | | | | 6-15-2044 | | | | 250,000 | | | | 292,583 | |
Florida Development Finance Corporation Surface Brightline Passenger Rail Project (Transportation Revenue) 144A | | | 5.63 | | | | 1-1-2047 | | | | 1,000,000 | | | | 1,041,480 | |
Holmes County FL Hospital Corporation Doctors Memorial Hospital Project (Health Revenue) | | | 6.00 | | | | 11-1-2038 | | | | 250,000 | | | | 249,983 | |
Miami-Dade County FL IDA Youth Co-Op Charter Schools Project Series A (Education Revenue) 144A | | | 6.00 | | | | 9-15-2045 | | | | 1,000,000 | | | | 1,031,580 | |
Trout Creek Florida Community Development District (Miscellaneous Revenue) | | | 4.88 | | | | 5-1-2025 | | | | 830,000 | | | | 836,848 | |
| | | | |
| | | | | | | | | | | | | | | 3,452,474 | |
| | | | | | | | | | | | | | | | |
| | | | |
| Georgia: 2.09% | | | | | | | | | | | | | | | | |
Atlanta GA Development Authority Senior Health Georgia Proton Treatment Center Series A1 (Health Revenue) | | | 7.00 | | | | 1-1-2040 | | | | 1,000,000 | | | | 1,049,820 | |
Cobb County GA Development Authority Student Housing Refunding Bond Kennesaw State University Foundation Project Series C (Housing Revenue) | | | 5.00 | | | | 7-15-2028 | | | | 800,000 | | | | 888,264 | |
Georgia Road & Tollway Authority CCAB I-75 South Expressway Lanes Project Series B (Transportation Revenue) 144A | | | 7.00 | | | | 6-1-2049 | | | | 1,000,000 | | | | 667,090 | |
| | | | |
| | | | | | | | | | | | | | | 2,605,174 | |
| | | | | | | | | | | | | | | | |
| | | | |
| Guam: 0.25% | | | | | | | | | | | | | | | | |
Guam International Airport Authority Series C (Airport Revenue) | | | 6.38 | | | | 10-1-2043 | | �� | | 260,000 | | | | 307,429 | |
| | | | | | | | | | | | | | | | |
The accompanying notes are an integral part of these financial statements.
| | | | | | |
| Portfolio of investments—December 31, 2017 (unaudited) | | Wells Fargo High Yield Municipal Bond Fund | | | 9 | |
| | | | | | | | | | | | | | | | |
| Security name | | Interest rate | | | Maturity date | | | Principal | | | Value | |
| | | | |
| Idaho: 0.49% | | | | | | | | | | | | | | | | |
Idaho Housing & Finance Association Idaho Arts Charter School Incorporated Project Series A (Education Revenue) | | | 6.50 | % | | | 12-1-2038 | | | $ | 335,000 | | | $ | 350,249 | |
Idaho Housing & Finance Association Legacy Public Charter School Incorporated Project Series A (Education Revenue) | | | 6.25 | | | | 5-1-2043 | | | | 250,000 | | | | 257,605 | |
| | | | |
| | | | | | | | | | | | | | | 607,854 | |
| | | | | | | | | | | | | | | | |
| | | | |
| Illinois: 16.51% | | | | | | | | | | | | | | | | |
Chicago IL Board of Education CAB School Reform Series A (GO Revenue, National Insured) ¤ | | | 0.00 | | | | 12-1-2025 | | | | 500,000 | | | | 365,505 | |
Chicago IL Board of Education Series A (GO Revenue, National Insured) | | | 5.00 | | | | 12-1-2021 | | | | 250,000 | | | | 251,043 | |
Chicago IL Metropolitan Pier & Exposition Authority McCormick Place Expansion Project Series A (Tax Revenue) | | | 5.00 | | | | 6-15-2057 | | | | 1,000,000 | | | | 1,086,540 | |
Chicago IL Midway Airport Refunding Bond Second Lien Series A (Airport Revenue) | | | 5.00 | | | | 1-1-2031 | | | | 1,000,000 | | | | 1,137,180 | |
Chicago IL O’Hare International Airport Revenue Bond Series B (Airport Revenue) | | | 6.00 | | | | 1-1-2041 | | | | 150,000 | | | | 168,941 | |
Chicago IL Sales Tax (Tax Revenue) | | | 5.00 | | | | 1-1-2032 | | | | 1,500,000 | | | | 1,794,519 | |
Chicago IL Sales Tax Series A (Tax Revenue) | | | 5.00 | | | | 1-1-2041 | | | | 1,000,000 | | | | 1,113,810 | |
Chicago IL Series A (GO Revenue) | | | 5.00 | | | | 1-1-2033 | | | | 310,000 | | | | 322,152 | |
Chicago IL Series A (GO Revenue) | | | 5.25 | | | | 1-1-2023 | | | | 475,000 | | | | 475,922 | |
Chicago IL Series A (GO Revenue) | | | 6.00 | | | | 1-1-2038 | | | | 1,500,000 | | | | 1,733,340 | |
Chicago IL Series B (GO Revenue) | | | 5.50 | | | | 1-1-2032 | | | | 700,000 | | | | 766,192 | |
Chicago IL Transit Authority Sales Tax Receipts Bonds (Tax Revenue, AGM Insured) | | | 5.00 | | | | 12-1-2044 | | | | 1,000,000 | | | | 1,106,870 | |
Cook County IL School District #144 Prairie Hills CAB Refunding Bond Series C (GO Revenue, AGM Insured) ¤ | | | 0.00 | | | | 12-1-2025 | | | | 730,000 | | | | 565,224 | |
Cook County IL School District #148 Dolton Series E (GO Revenue, AGM Insured) | | | 4.75 | | | | 12-1-2025 | | | | 450,000 | | | | 462,020 | |
Illinois (GO Revenue) | | | 5.00 | | | | 3-1-2033 | | | | 2,000,000 | | | | 2,079,740 | |
Illinois (Miscellaneous Revenue) | | | 5.50 | | | | 7-1-2025 | | | | 250,000 | | | | 275,848 | |
Illinois Finance Authority Charter School Aid Intrinsic Schools Belmont School Project Series A (Education Revenue) 144A | | | 5.25 | | | | 12-1-2025 | | | | 800,000 | | | | 829,280 | |
Illinois Finance Authority Charter Schools Refunding & Improvement Bonds Series A (Education Revenue) | | | 6.88 | | | | 10-1-2031 | | | | 670,000 | | | | 723,345 | |
Illinois Finance Authority Educational Facility Senior Rogers Park Montessori School (Miscellaneous Revenue) | | | 6.00 | | | | 2-1-2034 | | | | 680,000 | | | | 714,870 | |
Illinois Series A (GO Revenue, AGM Insured) | | | 5.00 | | | | 4-1-2024 | | | | 500,000 | | | | 559,760 | |
Illinois Sports Facilities Authority State Tax Supported CAB (Tax Revenue, Ambac Insured) ¤ | | | 0.00 | | | | 6-15-2025 | | | | 1,000,000 | | | | 753,790 | |
Lake County IL Community Unit School District #187 North Chicago Series A (GO Revenue, AGM Insured) ¤ | | | 0.00 | | | | 1-1-2023 | | | | 590,000 | | | | 479,865 | |
Will County IL Lincoln-Way Community High School District #210 (GO Revenue) | | | 4.00 | | | | 1-1-2022 | | | | 525,000 | | | | 519,656 | |
Will County IL Lincoln-Way Community High School District #210 CAB Series B (GO Revenue) ¤ | | | 0.00 | | | | 1-1-2033 | | | | 1,000,000 | | | | 452,980 | |
Will County IL Lincoln-Way Community High School District #210 Series A (GO Revenue) | | | 3.25 | | | | 1-1-2030 | | | | 450,000 | | | | 370,643 | |
Will County IL Lincoln-Way Community High School District #210 Series A (GO Revenue) | | | 5.00 | | | | 1-1-2030 | | | | 1,000,000 | | | | 992,880 | |
Will County IL Lincoln-Way Communty High School District #210 CAB Series B (GO Revenue) ¤ | | | 0.00 | | | | 1-1-2027 | | | | 685,000 | | | | 448,278 | |
| | | | |
| | | | | | | | | | | | | | | 20,550,193 | |
| | | | | | | | | | | | | | | | |
| | | | |
| Indiana: 2.29% | | | | | | | | | | | | | | | | |
Brookhaven County IN EDA Line Senior Apartments Project Series A (Housing Revenue) | | | 6.25 | | | | 7-1-2043 | | | | 1,560,000 | | | | 1,650,152 | |
Indiana Business Finance Authority Refunding Bond Marquette Project Series A (Health Revenue) | | | 5.00 | | | | 3-1-2030 | | | | 1,100,000 | | | | 1,195,678 | |
| | | | |
| | | | | | | | | | | | | | | 2,845,830 | |
| | | | | | | | | | | | | | | | |
The accompanying notes are an integral part of these financial statements.
| | | | |
| 10 | | Wells Fargo High Yield Municipal Bond Fund | | Portfolio of investments—December 31, 2017 (unaudited) |
| | | | | | | | | | | | | | | | |
| Security name | | Interest rate | | | Maturity date | | | Principal | | | Value | |
| | | | |
| Kansas: 1.61% | | | | | | | | | | | | | | | | |
Wyandotte County & Kansas City KS Special Obligation Refunding & Improvement Bonds Plaza Redevelopment Project (Tax Revenue) | | | 4.00 | % | | | 12-1-2028 | | | $ | 905,000 | | | $ | 918,638 | |
Wyandotte County & Kansas City KS Special Obligation Vacation Village Project Area 4 Major Multi-Sport Athletic Complex Project CAB Series 2015 (Tax Revenue) 144A¤ | | | 0.00 | | | | 9-1-2034 | | | | 3,000,000 | | | | 1,089,990 | |
| | | | |
| | | | | | | | | | | | | | | 2,008,628 | |
| | | | | | | | | | | | | | | | |
| | | | |
| Kentucky: 0.81% | | | | | | | | | | | | | | | | |
Kentucky EDFA Refunding Bond Rosedale Green Project (Health Revenue) | | | 5.50 | | | | 11-15-2035 | | | | 1,000,000 | | | | 1,013,300 | |
| | | | | | | | | | | | | | | | |
| | | | |
| Maine: 1.23% | | | | | | | | | | | | | | | | |
Maine Finance Authority Solid Waste Disposal AMT Green Bond Coastal Resources of Maine LLC Project (Resource Recovery Revenue) 144A | | | 5.38 | | | | 12-15-2033 | | | | 1,500,000 | | | | 1,531,470 | |
| | | | | | | | | | | | | | | | |
| | | | |
| Maryland: 0.86% | | | | | | | | | | | | | | | | |
Prince George’s County MD Chesapeake Lighthouse Charter School Project Series 2016-A (Education Revenue) 144A | | | 6.90 | | | | 8-1-2041 | | | | 1,000,000 | | | | 1,070,880 | |
| | | | | | | | | | | | | | | | |
| | | | |
| Michigan: 7.74% | | | | | | | | | | | | | | | | |
Charyl Stockwell Academy Michigan Public School Refunding Bond (Miscellaneous Revenue) | | | 4.88 | | | | 10-1-2023 | | | | 390,000 | | | | 392,594 | |
Detroit MI Downtown Development Authority CAB (Tax Revenue) ¤ | | | 0.00 | | | | 7-1-2020 | | | | 285,000 | | | | 255,930 | |
Detroit MI Downtown Development Authority CAB (Tax Revenue) ¤ | | | 0.00 | | | | 7-1-2021 | | | | 170,000 | | | | 145,914 | |
Detroit MI Downtown Development Authority CAB (Tax Revenue) ¤ | | | 0.00 | | | | 7-1-2024 | | | | 20,000 | | | | 14,476 | |
Detroit MI Downtown Development Authority CAB (Tax Revenue) ¤ | | | 0.00 | | | | 7-1-2025 | | | | 580,000 | | | | 399,997 | |
Detroit MI Wayne County Stadium Authority (Miscellaneous Revenue) | | | 5.00 | | | | 10-1-2018 | | | | 1,000,000 | | | | 998,550 | |
Michigan Finance Authority Limited Obligation Public School Academy Cesar Chavez Academy Project (Education Revenue) | | | 5.00 | | | | 2-1-2022 | | | | 205,000 | | | | 209,088 | |
Michigan Finance Authority Refunding Bond Local Government Loan Program City of Detroit Financial Recovery Series F (Tax Revenue) | | | 4.50 | | | | 10-1-2029 | | | | 1,000,000 | | | | 1,044,280 | |
Michigan Finance Authority Refunding Bond Local Government Loan Program Detroit Series D-4 (Water & Sewer Revenue) | | | 5.00 | | | | 7-1-2031 | | | | 1,015,000 | | | | 1,144,189 | |
Michigan Finance Authority Refunding Bond Local Government Loan Program Detroit Series D-6 (Water & Sewer Revenue, National Insured) | | | 5.00 | | | | 7-1-2036 | | | | 1,000,000 | | | | 1,108,080 | |
Michigan Finance Authority Refunding Bond Local Government Loan Program Public Lighting Authority Series B (Tax Revenue) | | | 5.00 | | | | 7-1-2044 | | | | 1,000,000 | | | | 1,094,970 | |
Michigan Municipal Bond Authority Local Government Loan Program Series C (Miscellaneous Revenue, Ambac Insured) | | | 4.75 | | | | 5-1-2027 | | | | 950,000 | | | | 950,295 | |
Michigan Public Educational Facilities Authority Chandler Park Academy (Miscellaneous Revenue) | | | 6.35 | | | | 11-1-2028 | | | | 225,000 | | | | 225,295 | |
Michigan Public Educational Facilities Authority Limited Obligation Bradford Academy Project (Education Revenue) 144A | | | 6.50 | | | | 9-1-2037 | | | | 195,000 | | | | 151,944 | |
Michigan Public Educational Facilities Authority Limited Obligation Crescent Academy (Education Revenue) | | | 7.00 | | | | 10-1-2036 | | | | 302,500 | | | | 304,984 | |
Oakland County MI Economic Development Corporation The Academy of The Sacred Heart Project Series A (Education Revenue) | | | 6.50 | | | | 12-15-2036 | | | | 240,000 | | | | 245,887 | |
Wayne County MI Building Improvement Series A (GO Revenue) | | | 6.75 | | | | 11-1-2039 | | | | 920,000 | | | | 942,043 | |
| | | | |
| | | | | | | | | | | | | | | 9,628,516 | |
| | | | | | | | | | | | | | | | |
| | | | |
| Minnesota: 1.08% | | | | | | | | | | | | | | | | |
Deephaven MN Charter School Eagle Ridge Academy Project Series A (Education Revenue) | | | 4.40 | | | | 7-1-2025 | | | | 160,000 | | | | 169,312 | |
Deephaven MN Charter School Eagle Ridge Academy Project Series A (Education Revenue) | | | 5.00 | | | | 7-1-2030 | | | | 195,000 | | | | 209,609 | |
Deephaven MN Charter School Eagle Ridge Academy Project Series A (Education Revenue) | | | 5.25 | | | | 7-1-2037 | | | | 190,000 | | | | 204,104 | |
The accompanying notes are an integral part of these financial statements.
| | | | | | |
| Portfolio of investments—December 31, 2017 (unaudited) | | Wells Fargo High Yield Municipal Bond Fund | | | 11 | |
| | | | | | | | | | | | | | | | |
| Security name | | Interest rate | | | Maturity date | | | Principal | | | Value | |
| | | | |
| Minnesota (continued) | | | | | | | | | | | | | | | | |
Minneapolis MN Student Housing Refunding Bond Riverton Community Housing Project (Housing Revenue) | | | 4.70 | % | | | 8-1-2026 | | | $ | 335,000 | | | $ | 346,671 | |
Minneapolis MN Student Housing Refunding Bond Riverton Community Housing Project (Housing Revenue) | | | 4.80 | | | | 8-1-2027 | | | | 400,000 | | | | 413,888 | |
| | | | |
| | | | | | | | | | | | | | | 1,343,584 | |
| | | | | | | | | | | | | | | | |
| | | | |
| Mississippi: 1.24% | | | | | | | | | | | | | | | | |
Mississippi Business Finance Corporation AMT Waste Pro USA Incorporated Project (Resource Recovery Revenue) 144A | | | 5.00 | | | | 2-1-2036 | | | | 1,500,000 | | | | 1,537,515 | |
| | | | | | | | | | | | | | | | |
| | | | |
| Missouri: 1.40% | | | | | | | | | | | | | | | | |
Blue Springs MO Special Obligation Tax Refunding & Improvement Bonds Adams Farm Project Series A (Tax Revenue) | | | 4.00 | | | | 6-1-2026 | | | | 730,000 | | | | 738,220 | |
Richmond Heights MO Francis Place Redevelopment Project (Tax Revenue) | | | 5.63 | | | | 11-1-2025 | | | | 1,000,000 | | | | 1,000,060 | |
| | | | |
| | | | | | | | | | | | | | | 1,738,280 | |
| | | | | | | | | | | | | | | | |
| | | | |
| Nevada: 1.32% | | | | | | | | | | | | | | | | |
Director of the State of Nevada Department of Business & Industry AMT Fulcrum Sierra Biofuels LLC Project (Industrial Development Revenue) 144A | | | 6.25 | | | | 12-15-2037 | | | | 1,500,000 | | | | 1,644,300 | |
| | | | | | | | | | | | | | | | |
| | | | |
| New Jersey: 4.36% | | | | | | | | | | | | | | | | |
Essex County NJ Improvement Authority Lease Newark Project Series A (Miscellaneous Revenue) | | | 6.25 | | | | 11-1-2030 | | | | 200,000 | | | | 212,786 | |
New Jersey EDA Continental Airlines Incorporated Project (Industrial Development Revenue) | | | 5.25 | | | | 9-15-2029 | | | | 250,000 | | | | 275,293 | |
New Jersey EDA School Facilities Construction Project Series NN (Miscellaneous Revenue, National Insured) | | | 5.00 | | | | 3-1-2030 | | | | 1,000,000 | | | | 1,080,020 | |
New Jersey TTFA CAB Series A (Transportation Revenue) ¤ | | | 0.00 | | | | 12-15-2031 | | | | 1,000,000 | | | | 559,990 | |
New Jersey TTFA Series C (Transportation Revenue) | | | 5.25 | | | | 6-15-2032 | | | | 2,000,000 | | | | 2,211,640 | |
Newark NJ Qualified General Improvement Series A (GO Revenue) | | | 5.00 | | | | 7-15-2027 | | | | 1,000,000 | | | | 1,091,650 | |
| | | | |
| | | | | | | | | | | | | | | 5,431,379 | |
| | | | | | | | | | | | | | | | |
| | | | |
| New York: 4.75% | | | | | | | | | | | | | | | | |
Green Island NY Power Authority Power System (Utilities Revenue) | | | 6.00 | | | | 12-15-2020 | | | | 560,000 | | | | 562,632 | |
Hempstead Town NY Local Development Corporation The Academy Charter School Project Series A (Education Revenue) | | | 7.65 | | | | 2-1-2044 | | | | 1,000,000 | | | | 1,080,000 | |
New York NY IDA Brooklyn Navy Yard Cogeneration Partners LP (Utilities Revenue) | | | 5.65 | | | | 10-1-2028 | | | | 1,500,000 | | | | 1,493,880 | |
New York NY Transitional Finance Authority Recovery Subordinate Series 3C (Tax Revenue, Dexia Credit Local SPA) ø | | | 1.80 | | | | 8-1-2031 | | | | 2,000,000 | | | | 2,000,000 | |
Oyster Bay NY Public Improvement Bonds (GO Revenue) | | | 3.00 | | | | 8-15-2020 | | | | 500,000 | | | | 495,020 | |
Westchester County NY Local Development Pace University Series A (Education Revenue) | | | 5.00 | | | | 5-1-2034 | | | | 250,000 | | | | 277,740 | |
| | | | |
| | | | | | | | | | | | | | | 5,909,272 | |
| | | | | | | | | | | | | | | | |
| | | | |
| Ohio: 2.04% | | | | | | | | | | | | | | | | |
Maple Heights OH City School District Certificate of Participation (Miscellaneous Revenue) | | | 6.00 | | | | 11-1-2028 | | | | 500,000 | | | | 518,300 | |
Ohio Air Quality Development Authority AMT Refunding Bond Pollution Control 1st Energy Series C (Industrial Development Revenue) | | | 3.95 | | | | 11-1-2032 | | | | 1,000,000 | | | | 442,190 | |
The accompanying notes are an integral part of these financial statements.
| | | | |
| 12 | | Wells Fargo High Yield Municipal Bond Fund | | Portfolio of investments—December 31, 2017 (unaudited) |
| | | | | | | | | | | | | | | | |
| Security name | | Interest rate | | | Maturity date | | | Principal | | | Value | |
| | | | |
| Ohio (continued) | | | | | | | | | | | | | | | | |
Ohio Air Quality Development Authority FirstEnergy Generation Series A (Utilities Revenue) | | | 3.75 | % | | | 12-1-2023 | | | $ | 1,000,000 | | | $ | 442,350 | |
Ohio Private Activity Bond AMT Portsmouth Bypass Project (Miscellaneous Revenue, AGM Insured) | | | 5.00 | | | | 12-31-2039 | | | | 1,000,000 | | | | 1,132,580 | |
| | | | |
| | | | | | | | | | | | | | | 2,535,420 | |
| | | | | | | | | | | | | | | | |
| | | | |
| Oregon: 0.68% | | | | | | | | | | | | | | | | |
Multnomah County OR Hospital Facilities Authority Refunding Bond Mirabella South Waterfront Project Series A (Health Revenue) | | | 5.00 | | | | 10-1-2019 | | | | 240,000 | | | | 248,438 | |
Polk County OR Hospital Facility Authority Revenue Bond Dallas Retirement Village Project Series 2015-A (Health Revenue) | | | 5.00 | | | | 7-1-2025 | | | | 550,000 | | | | 600,182 | |
| | | | |
| | | | | | | | | | | | | | | 848,620 | |
| | | | | | | | | | | | | | | | |
| | | | |
| Pennsylvania: 6.20% | | | | | | | | | | | | | | | | |
Allegheny County PA IDA Propel Charter School Sunrise Project (Education Revenue) | | | 5.25 | | | | 7-15-2023 | | | | 135,000 | | | | 142,684 | |
Chester PA Upland School District (GO Revenue) | | | 4.75 | | | | 9-15-2027 | | | | 1,725,000 | | | | 1,611,357 | |
East Hempfield Township PA IDA Student Services Incorporated Student Housing Project of Millersville University (Education Revenue) | | | 5.00 | | | | 7-1-2029 | | | | 500,000 | | | | 552,400 | |
Montgomery County PA Higher Education & Health Authority Arcadia University (Education Revenue) | | | 5.00 | | | | 4-1-2026 | | | | 1,655,000 | | | | 1,887,312 | |
Philadelphia PA IDA Tacony Academy Charter School Project (Education Revenue) | | | 6.88 | | | | 6-15-2033 | | | | 375,000 | | | | 418,568 | |
Philadelphia PA State Public School Building Authority School District Project (Miscellaneous Revenue) | | | 5.00 | | | | 4-1-2031 | | | | 1,000,000 | | | | 1,065,130 | |
Quakertown PA General Authority Refunding Bond Health LifeQuest Obligated Group Series C (Health Revenue) | | | 5.30 | | | | 7-1-2042 | | | | 1,000,000 | | | | 1,003,960 | |
Scranton PA RDA Series A (Miscellaneous Revenue, Municipal Government Guaranty Insured) | | | 5.00 | | | | 11-15-2021 | | | | 1,000,000 | | | | 1,036,170 | |
| | | | |
| | | | | | | | | | | | | | | 7,717,581 | |
| | | | | | | | | | | | | | | | |
| | | | |
| South Carolina: 1.36% | | | | | | | | | | | | | | | | |
South Carolina Jobs EDA Solid Waste Disposal AMT Green Bond RePower South Berkeley LLC (Resource Recovery Revenue) 144A | | | 6.25 | | | | 2-1-2045 | | | | 1,000,000 | | | | 994,770 | |
South Carolina Jobs EDA York Preparatory Academy Project Series A (Education Revenue) | | | 5.75 | | | | 11-1-2023 | | | | 155,000 | | | | 161,756 | |
South Carolina Jobs EDA York Preparatory Academy Project Series A (Education Revenue) | | | 7.25 | | | | 11-1-2045 | | | | 500,000 | | | | 541,805 | |
| | | | |
| | | | | | | | | | | | | | | 1,698,331 | |
| | | | | | | | | | | | | | | | |
| | | | |
| Tennessee: 1.47% | | | | | | | | | | | | | | | | |
Bristol TN Industrial Development Board Sales Tax CAB Series B (Tax Revenue) 144A¤ | | | 0.00 | | | | 12-1-2031 | | | | 4,000,000 | | | | 1,831,920 | |
| | | | | | | | | | | | | | | | |
| | | | |
| Texas: 5.43% | | | | | | | | | | | | | | | | |
Arlington TX Higher Education Finance Corporation Universal Academy Series A (Education Revenue) | | | 7.00 | | | | 3-1-2034 | | | | 320,000 | | | | 336,413 | |
Hackberry TX Special Assessment Public Improvement District #3 Phase #13 (Miscellaneous Revenue) | | | 6.00 | | | | 9-1-2026 | | | | 200,000 | | | | 218,590 | |
Lewisville TX Combination Contract Castle Hills Public Improvement Bonds Project #5 (Miscellaneous Revenue) 144A | | | 6.50 | | | | 9-1-2034 | | | | 940,000 | | | | 964,525 | |
Port Arthur TX Navigation District Motiva Enterprises LLC Project Series A (Resource Recovery Revenue) ø | | | 1.83 | | | | 4-1-2040 | | | | 2,000,000 | | | | 2,000,000 | |
The accompanying notes are an integral part of these financial statements.
| | | | | | |
| Portfolio of investments—December 31, 2017 (unaudited) | | Wells Fargo High Yield Municipal Bond Fund | | | 13 | |
| | | | | | | | | | | | | | | | |
| Security name | | Interest rate | | | Maturity date | | | Principal | | | Value | |
| | | | |
| Texas (continued) | | | | | | | | | | | | | | | | |
Pottsboro TX Higher Education Finance Corporation Imagine International Academy of North Texas Series A (Education Revenue) | | | 3.88 | % | | | 8-15-2026 | | | $ | 1,015,000 | | | $ | 1,012,391 | |
Pottsboro TX Higher Education Finance Corporation Imagine International Academy of North Texas Series A (Education Revenue) | | | 5.00 | | | | 8-15-2036 | | | | 655,000 | | | | 677,918 | |
Tarrant County TX Cultural Education Facilities Finance Corporation Series B (Health Revenue) | | | 5.00 | | | | 11-15-2030 | | | | 1,000,000 | | | | 1,075,260 | |
Texas Gas Supply SA Energy Acquisition Public Facilities Corporation (Utilities Revenue) | | | 5.50 | | | | 8-1-2027 | | | | 190,000 | | | | 233,729 | |
Texas Private Activity Bond Surface Transportation Corporation Project NTE Mobility Partners Segments LLC (Transportation Revenue) | | | 7.00 | | | | 12-31-2038 | | | | 200,000 | | | | 238,144 | |
| | | | |
| | | | | | | | | | | | | | | 6,756,970 | |
| | | | | | | | | | | | | | | | |
| | | | |
| Utah: 0.81% | | | | | | | | | | | | | | | | |
Utah Finance Authority Charter School Revenue Spectrum Academy Project (Education Revenue) 144A | | | 5.00 | | | | 4-15-2030 | | | | 1,000,000 | | | | 1,010,450 | |
| | | | | | | | | | | | | | | | |
| | | | |
| Virgin Islands: 1.33% | | | | | | | | | | | | | | | | |
Virgin Islands PFA Matching Funding Loan Series A (Tax Revenue) | | | 6.75 | | | | 10-1-2019 | | | | 1,065,000 | | | | 782,775 | |
Virgin Islands PFA Series C (Miscellaneous Revenue) | | | 5.00 | | | | 10-1-2039 | | | | 2,000,000 | | | | 875,000 | |
| | | | |
| | | | | | | | | | | | | | | 1,657,775 | |
| | | | | | | | | | | | | | | | |
| | | | |
| Virginia: 1.19% | | | | | | | | | | | | | | | | |
Stafford County & Staunton VA IDA Community Services Boards League/Central Series B (Miscellaneous Revenue) | | | 6.50 | | | | 8-1-2028 | | | | 1,465,000 | | | | 1,478,375 | |
| | | | | | | | | | | | | | | | |
| | | | |
| Washington: 1.05% | | | | | | | | | | | | | | | | |
Skagit County WA Public Hospital District #1 Skagit Valley Hospital Project (Health Revenue) | | | 5.25 | | | | 12-1-2025 | | | | 250,000 | | | | 267,293 | |
Washington Housing Finance Commission Bayview Manor Homes Series A (Health Revenue) 144A | | | 4.00 | | | | 7-1-2026 | | | | 920,000 | | | | 932,825 | |
Washington Housing Finance Commission Nonprofit Housing Bonds Heron’s Key Senior Living Series B-3 (Health Revenue) 144A | | | 4.38 | | | | 1-1-2021 | | | | 100,000 | | | | 100,000 | |
| | | | |
| | | | | | | | | | | | | | | 1,300,118 | |
| | | | | | | | | | | | | | | | |
| | | | |
| West Virginia: 1.48% | | | | | | | | | | | | | | | | |
Monongalia County WV Commission Refunding & Improvement Bonds University Town Center Series A (Tax Revenue) 144A | | | 5.75 | | | | 6-1-2043 | | | | 1,500,000 | | | | 1,570,935 | |
West Virginia Hospital Finance Authority Thomas Health system (Health Revenue) | | | 6.25 | | | | 10-1-2023 | | | | 270,000 | | | | 274,571 | |
| | | | |
| | | | | | | | | | | | | | | 1,845,506 | |
| | | | | | | | | | | | | | | | |
| | | | |
| Wisconsin: 1.45% | | | | | | | | | | | | | | | | |
Wisconsin PFA Charter School Voyager Funding Incorporated Project Series A (Education Revenue) | | | 4.13 | | | | 10-1-2024 | | | | 270,000 | | | | 276,356 | |
Wisconsin PFA Coral Academy Science Las Vegas Series A (Education Revenue) | | | 5.00 | | | | 7-1-2024 | | | | 465,000 | | | | 502,953 | |
Wisconsin PFA Research Triangle High School Project Series 2015-A (Education Revenue) 144A | | | 5.63 | | | | 7-1-2045 | | | | 1,000,000 | | | | 1,023,860 | |
| | | | |
| | | | | | | | | | | | | | | 1,803,169 | |
| | | | | | | | | | | | | | | | |
| | | | |
Total Municipal Obligations (Cost $119,891,444) | | | | | | | | | | | | | | | 122,579,978 | |
| | | | | | | | | | | | | | | | |
The accompanying notes are an integral part of these financial statements.
| | | | |
| 14 | | Wells Fargo High Yield Municipal Bond Fund | | Portfolio of investments—December 31, 2017 (unaudited) |
| | | | | | | | | | | | | | | | |
| Security name | | Yield | | | | | | Shares | | | Value | |
| | | | |
Short-Term Investments: 0.35% | | | | | | | | | | | | | | | | |
| | | | |
| Investment Companies: 0.35% | | | | | | | | | | | | | | | | |
Wells Fargo Municipal Cash Management Money Market Fund Institutional Class (l)(u) | | | 1.49 | % | | | | | | | 439,663 | | | $ | 440,146 | |
| | | | | | | | | | | | | | | | |
| | | | |
Total Short-Term Investments (Cost $440,146) | | | | | | | | | | | | | | | 440,146 | |
| | | | | | | | | | | | | | | | |
| | | | | | | | |
| Total investments in securities (Cost $120,331,590) | | | 98.84 | % | | | 123,020,124 | |
Other assets and liabilities, net | | | 1.16 | | | | 1,441,671 | |
| | | | | | | | |
| Total net assets | | | 100.00 | % | | $ | 124,461,795 | |
| | | | | | | | |
| ¤ | The security is issued in zero coupon form with no periodic interest payments. |
| 144A | The security may be resold in transactions exempt from registration, normally to qualified institutional buyers, pursuant to Rule 144A under the Securities Act of 1933. |
| ø | Variable rate demand notes are subject to a demand feature which reduces the effective maturity. The maturity date shown represents the final maturity date of the security. The interest rate is determined and reset by the issuer daily, weekly, or monthly depending upon the terms of the security. The rate shown is the rate in effect at period end. |
| (l) | The issuer of the security is an affiliated person of the Fund as defined in the Investment Company Act of 1940. |
| (u) | The rate represents the 7-day annualized yield at period end. |
Investments in Affiliates
An affiliated investment is an investment in which the Fund owns at least 5% of the outstanding voting shares of the issuer or as a result of other relationships, such as the Fund and the issuer having the same investment manager. Transactions with issuers that were either affiliated persons of the Fund at the beginning of the period or the end of the period were as follows:
| | | | | | | | | | | | | | | | | | | | | | | | | | | | | | | | | | | | |
| | | Shares,
beginning of
period | | | Shares
purchased | | | Shares
sold | | | Shares,
end of
period | | | Net
realized
gains
(losses) | | | Net
change in
unrealized
gains
(losses) | | | Income
from
affiliated
securities | | | Value,
end
of period | | | % of
net
assets | |
Short-Term Investments | | | | | | | | | | | | | | | | | | | | | | | | | | | | | | | | | | | | |
Investment Companies | | | | | | | | | | | | | | | | | | | | | | | | | | | | | | | | | | | | |
Wells Fargo Municipal Cash Management Money Market Fund Institutional Class | | | 737,461 | | | | 29,591,314 | | | | 29,889,112 | | | | 439,663 | | | $ | 649 | | | $ | 0 | | | $ | 5,011 | | | $ | 440,146 | | | | 0.35 | % |
The accompanying notes are an integral part of these financial statements.
| | | | | | |
| Statement of assets and liabilities—December 31, 2017 (unaudited) | | Wells Fargo High Yield Municipal Bond Fund | | | 15 | |
| | | | |
| | | | |
| |
Assets | | | | |
Investments in unaffiliated securities, at value (cost $119,891,444) | | $ | 122,579,978 | |
Investments in affiliated securities, at value (cost $440,146) | | | 440,146 | |
Receivable for investments sold | | | 70,055 | |
Receivable for Fund shares sold | | | 74,607 | |
Receivable for interest | | | 1,589,198 | |
Prepaid expenses and other assets | | | 70,590 | |
| | | | |
Total assets | | | 124,824,574 | |
| | | | |
| |
Liabilities | | | | |
Payable for Fund shares redeemed | | | 214,195 | |
Dividends payable | | | 52,628 | |
Management fee payable | | | 34,191 | |
Professional fees payable | | | 22,583 | |
Administration fees payable | | | 10,777 | |
Distribution fee payable | | | 5,640 | |
Trustees’ fees and expenses payable | | | 2,051 | |
Accrued expenses and other liabilities | | | 20,714 | |
| | | | |
Total liabilities | | | 362,779 | |
| | | | |
Total net assets | | $ | 124,461,795 | |
| | | | |
| |
NET ASSETS CONSIST OF | | | | |
Paid-in capital | | $ | 121,994,508 | |
Overdistributed net investment income | | | (5,710 | ) |
Accumulated net realized losses on investments | | | (215,537 | ) |
Net unrealized gains on investments | | | 2,688,534 | |
| | | | |
Total net assets | | $ | 124,461,795 | |
| | | | |
| |
COMPUTATION OF NET ASSET VALUE AND OFFERING PRICE PER SHARE | | | | |
Net assets – Class A | | $ | 17,258,818 | |
Shares outstanding – Class A1 | | | 1,629,574 | |
Net asset value per share – Class A | | | $10.59 | |
Maximum offering price per share – Class A2 | | | $11.09 | |
Net assets – Class C | | $ | 8,590,814 | |
Shares outstanding – Class C1 | | | 811,003 | |
Net asset value per share – Class C | | | $10.59 | |
Net assets – Administrator Class | | $ | 22,711,530 | |
Shares outstanding – Administrator Class1 | | | 2,143,511 | |
Net asset value per share – Administrator Class | | | $10.60 | |
Net assets – Institutional Class | | $ | 75,900,633 | |
Shares outstanding – Institutional Class1 | | | 7,166,475 | |
Net asset value per share – Institutional Class | | | $10.59 | |
| 1 | The Fund has an unlimited number of authorized shares. |
| 2 | Maximum offering price is computed as 100/95.50 of net asset value. On investments of $50,000 or more, the offering price is reduced. |
The accompanying notes are an integral part of these financial statements.
| | | | |
| 16 | | Wells Fargo High Yield Municipal Bond Fund | | Statement of operations—six months ended December 31, 2017 (unaudited) |
| | | | |
| | | | |
| |
Investment income | | | | |
Interest | | $ | 2,808,346 | |
Income from affiliated securities | | | 5,011 | |
| | | | |
Total investment income | | | 2,813,357 | |
| | | | |
| |
Expenses | | | | |
Management fee | | | 312,838 | |
Administration fees | | | | |
Class A | | | 15,282 | |
Class C | | | 6,885 | |
Administrator Class | | | 11,458 | |
Institutional Class | | | 29,805 | |
Shareholder servicing fees | | | | |
Class A | | | 23,877 | |
Class C | | | 10,758 | |
Administrator Class | | | 28,405 | |
Distribution fee | | | | |
Class C | | | 32,274 | |
Custody and accounting fees | | | 8,800 | |
Professional fees | | | 31,923 | |
Registration fees | | | 27,494 | |
Shareholder report expenses | | | 16,164 | |
Trustees’ fees and expenses | | | 10,561 | |
Other fees and expenses | | | 6,355 | |
| | | | |
Total expenses | | | 572,879 | |
Less: Fee waivers and/or expense reimbursements | | | (113,378 | ) |
| | | | |
Net expenses | | | 459,501 | |
| | | | |
Net investment income | | | 2,353,856 | |
| | | | |
| |
REALIZED AND UNREALIZED GAINS (LOSSES) ON INVESTMENTS | | | | |
| |
Net realized gains on: | | | | |
Unaffiliated securities | | | 921,826 | |
Affiliated securities | | | 649 | |
| | | | |
Net realized gains on investments | | | 922,475 | |
Net change in unrealized gains (losses) on investments | | | 1,777,158 | |
| | | | |
Net realized and unrealized gains (losses) on investments | | | 2,699,633 | |
| | | | |
Net increase in net assets resulting from operations | | $ | 5,053,489 | |
| | | | |
The accompanying notes are an integral part of these financial statements.
| | | | | | |
| Statement of changes in net assets | | Wells Fargo High Yield Municipal Bond Fund | | | 17 | |
| | | | | | | | | | | | | | | | |
| | | Six months ended
December 31, 2017
(unaudited) | | | Year ended
June 30, 2017 | |
| | | | |
Operations | | | | | | | | | | | | | | | | |
Net investment income | | | | | | $ | 2,353,856 | | | | | | | $ | 4,900,398 | |
Net realized gains (losses) on investments | | | | | | | 922,475 | | | | | | | | (1,102,224 | ) |
Net change in unrealized gains (losses) on investments | | | | | | | 1,777,158 | | | | | | | | (5,792,411 | ) |
| | | | |
Net increase (decrease) in net assets resulting from operations | | | | | | | 5,053,489 | | | | | | | | (1,994,237 | ) |
| | | | |
| | | | |
Distributions to shareholders from | | | | | | | | | | | | | | | | |
Net investment income | | | | | | | | | | | | | | | | |
Class A | | | | | | | (347,983 | ) | | | | | | | (1,131,933 | ) |
Class C | | | | | | | (124,684 | ) | | | | | | | (282,299 | ) |
Administrator Class | | | | | | | (428,876 | ) | | | | | | | (873,363 | ) |
Institutional Class | | | | | | | (1,452,608 | ) | | | | | | | (2,612,623 | ) |
Net realized gains | | | | | | | | | | | | | | | | |
Class A | | | | | | | 0 | | | | | | | | (272,085 | ) |
Class C | | | | | | | 0 | | | | | | | | (74,086 | ) |
Administrator Class | | | | | | | 0 | | | | | | | | (130,075 | ) |
Institutional Class | | | | | | | 0 | | | | | | | | (522,236 | ) |
| | | | |
Total distributions to shareholders | | | | | | | (2,354,151 | ) | | | | | | | (5,898,700 | ) |
| | | | |
| | | | |
Capital share transactions | | | Shares | | | | | | | | Shares | | | | | |
Proceeds from shares sold | | | | | | | | | | | | | | | | |
Class A | | | 176,927 | | | | 1,860,342 | | | | 1,255,838 | | | | 13,306,898 | |
Class C | | | 98,797 | | | | 1,040,820 | | | | 247,552 | | | | 2,611,650 | |
Administrator Class | | | 446,648 | | | | 4,695,334 | | | | 1,905,479 | | | | 20,247,486 | |
Institutional Class | | | 1,498,693 | | | | 15,754,654 | | | | 5,266,613 | | | | 54,671,624 | |
| | | | |
| | | | | | | 23,351,150 | | | | | | | | 90,837,658 | |
| | | | |
Reinvestment of distributions | | | | | | | | | | | | | | | | |
Class A | | | 31,062 | | | | 326,496 | | | | 130,283 | | | | 1,349,468 | |
Class C | | | 10,790 | | | | 113,439 | | | | 30,649 | | | | 316,848 | |
Administrator Class | | | 34,228 | | | | 359,871 | | | | 82,046 | | | | 854,343 | |
Institutional Class | | | 124,543 | | | | 1,309,386 | | | | 261,299 | | | | 2,698,585 | |
| | | | |
| | | | | | | 2,109,192 | | | | | | | | 5,219,244 | |
| | | | |
Payment for shares redeemed | | | | | | | | | | | | | | | | |
Class A | | | (536,851 | ) | | | (5,647,781 | ) | | | (2,911,071 | ) | | | (29,839,907 | ) |
Class C | | | (138,403 | ) | | | (1,455,815 | ) | | | (407,014 | ) | | | (4,205,319 | ) |
Administrator Class | | | (539,350 | ) | | | (5,682,662 | ) | | | (2,091,981 | ) | | | (21,713,531 | ) |
Institutional Class | | | (1,592,936 | ) | | | (16,754,083 | ) | | | (4,611,104 | ) | | | (48,199,227 | ) |
| | | | |
| | | | | | | (29,540,341 | ) | | | | | | | (103,957,984 | ) |
| | | | |
Net decrease in net assets resulting from capital share transactions | | | | | | | (4,079,999 | ) | | | | | | | (7,901,082 | ) |
| | | | |
Total decrease in net assets | | | | | | | (1,380,661 | ) | | | | | | | (15,794,019 | ) |
| | | | |
| | | | |
Net assets | | | | | | | | | | | | | | | | |
Beginning of period | | | | | | | 125,842,456 | | | | | | | | 141,636,475 | |
| | | | |
End of period | | | | | | $ | 124,461,795 | | | | | | | $ | 125,842,456 | |
| | | | |
Overdistributed net investment income | | | | | | $ | (5,710 | ) | | | | | | $ | (5,415 | ) |
| | | | |
The accompanying notes are an integral part of these financial statements.
| | | | |
| 18 | | Wells Fargo High Yield Municipal Bond Fund | | Financial highlights |
(For a share outstanding throughout each period)
| | | | | | | | | | | | | | | | | | | | | | | | |
| | | Six months ended
December 31, 2017 (unaudited) | | | Year ended June 30 | |
| CLASS A | | | 2017 | | | 2016 | | | 2015 | | | 2014 | | | 20131 | |
Net asset value, beginning of period | | | $10.37 | | | | $10.91 | | | | $10.34 | | | | $10.25 | | | | $9.52 | | | | $10.00 | |
Net investment income | | | 0.19 | | | | 0.37 | | | | 0.35 | | | | 0.34 | | | | 0.40 | | | | 0.13 | |
Net realized and unrealized gains (losses) on investments | | | 0.22 | | | | (0.46 | ) | | | 0.60 | | | | 0.18 | | | | 0.75 | | | | (0.49 | ) |
| | | | | | | | | | | | | | | | | | | | | | | | |
Total from investment operations | | | 0.41 | | | | (0.09 | ) | | | 0.95 | | | | 0.52 | | | | 1.15 | | | | (0.36 | ) |
Distributions to shareholders from | | | | | | | | | | | | | | | | | | | | | | | | |
Net investment income | | | (0.19 | ) | | | (0.37 | ) | | | (0.35 | ) | | | (0.34 | ) | | | (0.40 | ) | | | (0.12 | ) |
Net realized gains | | | 0.00 | | | | (0.08 | ) | | | (0.03 | ) | | | (0.09 | ) | | | (0.02 | ) | | | 0.00 | |
| | | | | | | | | | | | | | | | | | | | | | | | |
Total distributions to shareholders | | | (0.19 | ) | | | (0.45 | ) | | | (0.38 | ) | | | (0.43 | ) | | | (0.42 | ) | | | (0.12 | ) |
Net asset value, end of period | | | $10.59 | | | | $10.37 | | | | $10.91 | | | | $10.34 | | | | $10.25 | | | | $9.52 | |
Total return2 | | | 4.01 | % | | | (0.76 | )% | | | 9.44 | % | | | 5.06 | % | | | 12.41 | % | | | (3.61 | )% |
Ratios to average net assets (annualized) | | | | | | | | | | | | | | | | | | | | | | | | |
Gross expenses | | | 1.07 | % | | | 1.06 | % | | | 1.07 | % | | | 1.07 | % | | | 1.90 | % | | | 3.45 | % |
Net expenses | | | 0.85 | % | | | 0.85 | % | | | 0.85 | % | | | 0.85 | % | | | 0.85 | % | | | 0.85 | % |
Net investment income | | | 3.64 | % | | | 3.51 | % | | | 3.28 | % | | | 3.26 | % | | | 3.98 | % | | | 3.21 | % |
Supplemental data | | | | | | | | | | | | | | | | | | | | | | | | |
Portfolio turnover rate | | | 38 | % | | | 82 | % | | | 61 | % | | | 62 | % | | | 65 | % | | | 69 | % |
Net assets, end of period (000s omitted) | | | $17,259 | | | | $20,305 | | | | $38,018 | | | | $21,100 | | | | $4,022 | | | | $998 | |
| 1 | For the period from January 31, 2013 (commencement of operations) to June 30, 2013 |
| 2 | Total return calculations do not include any sales charges. Returns for periods of less than one year are not annualized. |
The accompanying notes are an integral part of these financial statements.
| | | | | | |
| Financial highlights | | Wells Fargo High Yield Municipal Bond Fund | | | 19 | |
(For a share outstanding throughout each period)
| | | | | | | | | | | | | | | | | | | | | | | | |
| | | Six months ended
December 31, 2017 (unaudited) | | | Year ended June 30 | |
| CLASS C | | | 2017 | | | 2016 | | | 2015 | | | 2014 | | | 20131 | |
Net asset value, beginning of period | | | $10.37 | | | | $10.91 | | | | $10.34 | | | | $10.25 | | | | $9.52 | | | | $10.00 | |
Net investment income | | | 0.15 | | | | 0.29 | | | | 0.27 | | | | 0.26 | | | | 0.33 | | | | 0.09 | |
Net realized and unrealized gains (losses) on investments | | | 0.22 | | | | (0.46 | ) | | | 0.60 | | | | 0.18 | | | | 0.75 | | | | (0.48 | ) |
| | | | | | | | | | | | | | | | | | | | | | | | |
Total from investment operations | | | 0.37 | | | | (0.17 | ) | | | 0.87 | | | | 0.44 | | | | 1.08 | | | | (0.39 | ) |
Distributions to shareholders from | | | | | | | | | | | | | | | | | | | | | | | | |
Net investment income | | | (0.15 | ) | | | (0.29 | ) | | | (0.27 | ) | | | (0.26 | ) | | | (0.33 | ) | | | (0.09 | ) |
Net realized gains | | | 0.00 | | | | (0.08 | ) | | | (0.03 | ) | | | (0.09 | ) | | | (0.02 | ) | | | 0.00 | |
| | | | | | | | | | | | | | | | | | | | | | | | |
Total distributions to shareholders | | | (0.15 | ) | | | (0.37 | ) | | | (0.30 | ) | | | (0.35 | ) | | | (0.35 | ) | | | (0.09 | ) |
Net asset value, end of period | | | $10.59 | | | | $10.37 | | | | $10.91 | | | | $10.34 | | | | $10.25 | | | | $9.52 | |
Total return2 | | | 3.62 | % | | | (1.50 | )% | | | 8.62 | % | | | 4.28 | % | | | 11.58 | % | | | (3.89 | )% |
Ratios to average net assets (annualized) | | | | | | | | | | | | | | | | | | | | | | | | |
Gross expenses | | | 1.82 | % | | | 1.81 | % | | | 1.82 | % | | | 1.82 | % | | | 2.58 | % | | | 4.05 | % |
Net expenses | | | 1.60 | % | | | 1.60 | % | | | 1.60 | % | | | 1.60 | % | | | 1.60 | % | | | 1.60 | % |
Net investment income | | | 2.90 | % | | | 2.79 | % | | | 2.49 | % | | | 2.50 | % | | | 3.15 | % | | | 2.25 | % |
Supplemental data | | | | | | | | | | | | | | | | | | | | | | | | |
Portfolio turnover rate | | | 38 | % | | | 82 | % | | | 61 | % | | | 62 | % | | | 65 | % | | | 69 | % |
Net assets, end of period (000s omitted) | | | $8,591 | | | | $8,709 | | | | $10,573 | | | | $4,522 | | | | $2,323 | | | | $481 | |
| 1 | For the period from January 31, 2013 (commencement of operations) to June 30, 2013 |
| 2 | Total return calculations do not include any sales charges. Returns for periods of less than one year are not annualized. |
The accompanying notes are an integral part of these financial statements.
| | | | |
| 20 | | Wells Fargo High Yield Municipal Bond Fund | | Financial highlights |
(For a share outstanding throughout each period)
| | | | | | | | | | | | | | | | | | | | | | | | |
| | | Six months ended
December 31, 2017 (unaudited) | | | Year ended June 30 | |
| ADMINISTRATOR CLASS | | | 2017 | | | 2016 | | | 2015 | | | 2014 | | | 20131 | |
Net asset value, beginning of period | | | $10.37 | | | | $10.92 | | | | $10.34 | | | | $10.26 | | | | $9.52 | | | | $10.00 | |
Net investment income | | | 0.20 | | | | 0.38 | | | | 0.36 | | | | 0.35 | | | | 0.41 | | | | 0.13 | |
Net realized and unrealized gains (losses) on investments | | | 0.23 | | | | (0.47 | ) | | | 0.61 | | | | 0.17 | | | | 0.76 | | | | (0.48 | ) |
| | | | | | | | | | | | | | | | | | | | | | | | |
Total from investment operations | | | 0.43 | | | | (0.09 | ) | | | 0.97 | | | | 0.52 | | | | 1.17 | | | | (0.35 | ) |
Distributions to shareholders from | | | | | | | | | | | | | | | | | | | | | | | | |
Net investment income | | | (0.20 | ) | | | (0.38 | ) | | | (0.36 | ) | | | (0.35 | ) | | | (0.41 | ) | | | (0.13 | ) |
Net realized gains | | | 0.00 | | | | (0.08 | ) | | | (0.03 | ) | | | (0.09 | ) | | | (0.02 | ) | | | 0.00 | |
| | | | | | | | | | | | | | | | | | | | | | | | |
Total distributions to shareholders | | | (0.20 | ) | | | (0.46 | ) | | | (0.39 | ) | | | (0.44 | ) | | | (0.43 | ) | | | (0.13 | ) |
Net asset value, end of period | | | $10.60 | | | | $10.37 | | | | $10.92 | | | | $10.34 | | | | $10.26 | | | | $9.52 | |
Total return2 | | | 4.16 | % | | | (0.75 | )% | | | 9.65 | % | | | 5.07 | % | | | 12.63 | % | | | (3.57 | )% |
Ratios to average net assets (annualized) | | | | | | | | | | | | | | | | | | | | | | | | |
Gross expenses | | | 1.01 | % | | | 1.00 | % | | | 1.00 | % | | | 1.00 | % | | | 1.80 | % | | | 3.24 | % |
Net expenses | | | 0.75 | % | | | 0.75 | % | | | 0.75 | % | | | 0.75 | % | | | 0.75 | % | | | 0.75 | % |
Net investment income | | | 3.74 | % | | | 3.60 | % | | | 3.39 | % | | | 3.35 | % | | | 4.14 | % | | | 3.10 | % |
Supplemental data | | | | | | | | | | | | | | | | | | | | | | | | |
Portfolio turnover rate | | | 38 | % | | | 82 | % | | | 61 | % | | | 62 | % | | | 65 | % | | | 69 | % |
Net assets, end of period (000s omitted) | | | $22,712 | | | | $22,839 | | | | $25,179 | | | | $13,768 | | | | $3,282 | | | | $482 | |
| 1 | For the period from January 31, 2013 (commencement of operations) to June 30, 2013 |
| 2 | Returns for periods of less than one year are not annualized. |
The accompanying notes are an integral part of these financial statements.
| | | | | | |
| Financial highlights | | Wells Fargo High Yield Municipal Bond Fund | | | 21 | |
(For a share outstanding throughout each period)
| | | | | | | | | | | | | | | | | | | | | | | | |
| | | Six months ended
December 31, 2017 (unaudited) | | | Year ended June 30 | |
| INSTITUTIONAL CLASS | | | 2017 | | | 2016 | | | 2015 | | | 2014 | | | 20131 | |
Net asset value, beginning of period | | | $10.37 | | | | $10.91 | | | | $10.34 | | | | $10.25 | | | | $9.52 | | | | $10.00 | |
Net investment income | | | 0.21 | | | | 0.40 | | | | 0.38 | | | | 0.37 | | | | 0.42 | | | | 0.13 | |
Net realized and unrealized gains (losses) on investments | | | 0.22 | | | | (0.46 | ) | | | 0.60 | | | | 0.18 | | | | 0.75 | | | | (0.48 | ) |
| | | | | | | | | | | | | | | | | | | | | | | | |
Total from investment operations | | | 0.43 | | | | (0.06 | ) | | | 0.98 | | | | 0.55 | | | | 1.17 | | | | (0.35 | ) |
Distributions to shareholders from | | | | | | | | | | | | | | | | | | | | | | | | |
Net investment income | | | (0.21 | ) | | | (0.40 | ) | | | (0.38 | ) | | | (0.37 | ) | | | (0.42 | ) | | | (0.13 | ) |
Net realized gains | | | 0.00 | | | | (0.08 | ) | | | (0.03 | ) | | | (0.09 | ) | | | (0.02 | ) | | | 0.00 | |
| | | | | | | | | | | | | | | | | | | | | | | | |
Total distributions to shareholders | | | (0.21 | ) | | | (0.48 | ) | | | (0.41 | ) | | | (0.46 | ) | | | (0.44 | ) | | | (0.13 | ) |
Net asset value, end of period | | | $10.59 | | | | $10.37 | | | | $10.91 | | | | $10.34 | | | | $10.25 | | | | $9.52 | |
Total return2 | | | 4.14 | % | | | (0.51 | )% | | | 9.71 | % | | | 5.33 | % | | | 12.70 | % | | | (3.52 | )% |
Ratios to average net assets (annualized) | | | | | | | | | | | | | | | | | | | | | | | | |
Gross expenses | | | 0.74 | % | | | 0.73 | % | | | 0.74 | % | | | 0.74 | % | | | 1.53 | % | | | 2.97 | % |
Net expenses | | | 0.60 | % | | | 0.60 | % | | | 0.60 | % | | | 0.60 | % | | | 0.60 | % | | | 0.60 | % |
Net investment income | | | 3.90 | % | | | 3.82 | % | | | 3.58 | % | | | 3.51 | % | | | 4.26 | % | | | 3.25 | % |
Supplemental data | | | | | | | | | | | | | | | | | | | | | | | | |
Portfolio turnover rate | | | 38 | % | | | 82 | % | | | 61 | % | | | 62 | % | | | 65 | % | | | 69 | % |
Net assets, end of period (000s omitted) | | | $75,901 | | | | $73,989 | | | | $67,867 | | | | $76,118 | | | | $31,105 | | | | $8,204 | |
| 1 | For the period from January 31, 2013 (commencement of operations) to June 30, 2013 |
| 2 | Returns for periods of less than one year are not annualized. |
The accompanying notes are an integral part of these financial statements.
| | | | |
| 22 | | Wells Fargo High Yield Municipal Bond Fund | | Notes to financial statements (unaudited) |
1. ORGANIZATION
Wells Fargo Funds Trust (the “Trust”), a Delaware statutory trust organized on March 10, 1999, is an open-end management investment company registered under the Investment Company Act of 1940, as amended (the “1940 Act”). As an investment company, the Trust follows the accounting and reporting guidance in Financial Accounting Standards Board Accounting Standards Codification Topic 946, Financial Services – Investment Companies. These financial statements report on the Wells Fargo High Yield Municipal Bond Fund (the “Fund”) which is a diversified series of the Trust.
2. SIGNIFICANT ACCOUNTING POLICIES
The following significant accounting policies, which are consistently followed in the preparation of the financial statements of the Fund, are in conformity with U.S. generally accepted accounting principles which require management to make estimates and assumptions that affect the reported amounts of assets and liabilities, disclosure of contingent assets and liabilities at the date of the financial statements, and the reported amounts of revenues and expenses during the reporting period. Actual results could differ from those estimates.
Securities valuation
All investments are valued each business day as of the close of regular trading on the New York Stock Exchange (generally 4 p.m. Eastern Time), although the Fund may deviate from this calculation time under unusual or unexpected circumstances.
Debt securities are valued at the evaluated bid price provided by an independent pricing service or, if a reliable price is not available, the quoted bid price from an independent broker-dealer.
Futures that are listed on a foreign or domestic exchange or market are valued at the official closing price or, if none, the last sales price.
Investments in registered open-end investment companies are valued at net asset value. Interests in non-registered investment companies that are redeemable at net asset value are fair valued normally at net asset value.
Investments which are not valued using any of the methods discussed above are valued at their fair value, as determined in good faith by the Board of Trustees of the Fund. The Board of Trustees has established a Valuation Committee comprised of the Trustees and has delegated to it the authority to take any actions regarding the valuation of portfolio securities that the Valuation Committee deems necessary or appropriate, including determining the fair value of portfolio securities, unless the determination has been delegated to the Management Valuation Team of Wells Fargo Funds Management, LLC (“Funds Management”). The Board of Trustees retains the authority to make or ratify any valuation decisions or approve any changes to the Valuation Procedures as it deems appropriate. On a quarterly basis, the Board of Trustees receives reports on any valuation actions taken by the Valuation Committee or the Management Valuation Team which may include items for ratification.
Valuations of fair valued securities are compared to the next actual sales price when available, or other appropriate market values, to assess the continued appropriateness of the fair valuation methodologies used. These securities are fair valued on a day-to-day basis, taking into consideration changes to appropriate market information and any significant changes to the inputs considered in the valuation process until there is a readily available price provided on an exchange or by an independent pricing service. Valuations received from an independent pricing service or independent broker-dealer quotes are periodically validated by comparisons to most recent trades and valuations provided by other independent pricing services in addition to the review of prices by the manager and/or subadviser. Unobservable inputs used in determining fair valuations are identified based on the type of security, taking into consideration factors utilized by market participants in valuing the investment, knowledge about the issuer and the current market environment.
Security loans
The Fund may lend its securities from time to time in order to earn additional income in the form of fees or interest on securities received as collateral or the investment of any cash received as collateral. The Fund continues to receive interest or dividends on the securities loaned. The Fund receives collateral in the form of cash or securities with a value at least equal to the value of the securities on loan. The value of the loaned securities is determined at the close of each business day and any additional required collateral is delivered to the Fund on the next business day. In a securities lending transaction, the net asset value of the Fund will be affected by an increase or decrease in the value of the securities loaned and by an increase or decrease in the value of the instrument in which collateral is invested. The amount of securities lending activity undertaken by the Fund fluctuates from time to time. In the event of default or bankruptcy by the borrower, the Fund may be prevented from recovering the loaned securities or gaining access to the collateral or may experience delays or costs in doing so. In addition, the investment of any cash collateral received may lose all or part of its value. The Fund has the right under the lending agreement to recover the securities from the borrower on demand.
| | | | | | |
| Notes to financial statements (unaudited) | | Wells Fargo High Yield Municipal Bond Fund | | | 23 | |
The Fund lends its securities through an unaffiliated securities lending agent. Cash collateral received in connection with its securities lending transactions is invested in Securities Lending Cash Investments, LLC (the “Securities Lending Fund”). The Securities Lending Fund is exempt from registration under Section 3(c)(7) of the 1940 Act and is managed by Funds Management and is subadvised by Wells Capital Management Incorporated (“WellsCap”), an affiliate of Funds Management and an indirect wholly owned subsidiary of Wells Fargo & Company (“Wells Fargo”). Funds Management receives an advisory fee starting at 0.05% and declining to 0.01% as the average daily net assets of the Securities Lending Fund increase. All of the fees received by Funds Management are paid to WellsCap for its services as subadviser. The Securities Lending Fund seeks to provide a positive return compared to the daily Fed Funds Open Rate by investing in high-quality, U.S. dollar-denominated short-term money market instruments. Securities Lending Fund investments are valued at the evaluated bid price provided by an independent pricing service. Income earned from investment in the Securities Lending Fund is included in income from affiliated securities on the Statement of Operations.
When-issued transactions
The Fund may purchase securities on a forward commitment or when-issued basis. The Fund records a when-issued transaction on the trade date and will segregate assets in an amount at least equal in value to the Fund’s commitment to purchase when-issued securities. Securities purchased on a when-issued basis are marked-to-market daily and the Fund begins earning interest on the settlement date. Losses may arise due to changes in the market value of the underlying securities or if the counterparty does not perform under the contract.
Futures contracts
The Fund is subject to interest rate risk in the normal course of pursuing its investment objectives. The Fund may buy and sell futures contracts in order to gain exposure to, or protect against, changes in interest rates. The primary risks associated with the use of futures contracts are the imperfect correlation between changes in market values of securities held by the Fund and the prices of futures contracts, and the possibility of an illiquid market.
The aggregate principal amounts of the contracts are not recorded in the financial statements. Fluctuations in the value of the contracts are recorded in the Statement of Assets and Liabilities as an asset or liability and in the Statement of Operations as unrealized gains or losses until the contracts are closed, at which point they are recorded as net realized gains or losses on futures contracts. With futures contracts, there is minimal counterparty risk to the Fund since futures are exchange traded and the exchange’s clearinghouse, as counterparty to all exchange traded futures, guarantees the futures against default.
Security transactions and income recognition
Securities transactions are recorded on a trade date basis. Realized gains or losses are recorded on the basis of identified cost.
Interest income is accrued daily and bond discounts are accreted and premiums are amortized daily based on the effective interest method. To the extent debt obligations are placed on non-accrual status, any related interest income may be reduced by writing off interest receivables when the collection of all or a portion of interest has been determined to be doubtful based on consistently applied procedures and the fair value has decreased. If the issuer subsequently resumes interest payments or when the collectability of interest is reasonably assured, the debt obligation is removed from non-accrual status.
Distributions to shareholders
Distributions to shareholders from net investment income are accrued daily and paid monthly. Distributions from net realized gains, if any, are recorded on the ex-dividend date. Such distributions are determined in accordance with income tax regulations and may differ from U.S. generally accepted accounting principles. Dividend sources are estimated at the time of declaration. The tax character of distributions is determined as of the Fund’s fiscal year end. Therefore, a portion of the Fund’s distributions made prior to the Fund’s fiscal year end may be categorized as a tax return of capital.
Federal and other taxes
The Fund intends to continue to qualify as a regulated investment company by distributing substantially all of its investment company taxable and tax-exempt income and any net realized capital gains (after reduction for capital loss carryforwards) sufficient to relieve it from all, or substantially all, federal income taxes. Accordingly, no provision for federal income taxes was required.
The Fund’s income and federal excise tax returns and all financial records supporting those returns for the prior three fiscal years are subject to examination by the federal and Delaware revenue authorities. Management has analyzed the Fund’s tax positions taken on federal, state, and foreign tax returns for all open tax years and does not believe that there are any uncertain tax positions that require recognition of a tax liability.
| | | | |
| 24 | | Wells Fargo High Yield Municipal Bond Fund | | Notes to financial statements (unaudited) |
As of December 31, 2017, the aggregate cost of all investments for federal income tax purposes was $120,331,590 and the unrealized gains (losses) consisted of:
| | | | |
Gross unrealized gains | | $ | 5,010,127 | |
Gross unrealized losses | | | (2,321,593 | ) |
Net unrealized gains | | $ | 2,688,534 | |
As of June 30, 2017, the Fund had current year net deferred post-October capital losses consisting of $1,138,012 in short-term losses which were recognized on the first day of the current fiscal year.
Class allocations
The separate classes of shares offered by the Fund differ principally in applicable sales charges, distribution, shareholder servicing, and administration fees. Class specific expenses are charged directly to that share class. Investment income, common expenses, and realized and unrealized gains (losses) on investments are allocated daily to each class of shares based on the relative proportion of net assets of each class.
3. FAIR VALUATION MEASUREMENTS
Fair value measurements of investments are determined within a framework that has established a fair value hierarchy based upon the various data inputs utilized in determining the value of the Fund’s investments. The three-level hierarchy gives the highest priority to unadjusted quoted prices in active markets for identical assets or liabilities (Level 1) and the lowest priority to unobservable inputs (Level 3). The Fund’s investments are classified within the fair value hierarchy based on the lowest level of input that is significant to the fair value measurement. The inputs are summarized into three broad levels as follows:
| ∎ | | Level 1 – quoted prices in active markets for identical securities |
| ∎ | | Level 2 – other significant observable inputs (including quoted prices for similar securities, interest rates, prepayment speeds, credit risk, etc.) |
| ∎ | | Level 3 – significant unobservable inputs (including the Fund’s own assumptions in determining the fair value of investments) |
The inputs or methodologies used for valuing investments in securities are not necessarily an indication of the risk associated with investing in those securities.
The following is a summary of the inputs used in valuing the Fund’s assets and liabilities as of December 31, 2017:
| | | | | | | | | | | | | | | | |
| | | Quoted prices
(Level 1) | | | Other significant
observable
inputs (Level 2) | | | Significant
unobservable inputs
(Level 3) | | | Total | |
Assets | | | | | | | | | | | | | | | | |
Investments in: | | | | | | | | | | | | | | | | |
| | | | |
Municipal obligations | | $ | 0 | | | $ | 122,579,978 | | | $ | 0 | | | $ | 122,579,978 | |
| | | | |
Short-term investments | | | | | | | | | | | | | | | | |
Investment companies | | | 440,146 | | | | 0 | | | | 0 | | | | 440,146 | |
Total assets | | $ | 440,146 | | | $ | 122,579,978 | | | $ | 0 | | | $ | 123,020,124 | |
The Fund recognizes transfers between levels within the fair value hierarchy at the end of the reporting period. At December 31, 2017, the Fund did not have any transfers into/out of Level 1, Level 2, or Level 3.
4. TRANSACTIONS WITH AFFILIATES
Management fee
Funds Management, an indirect wholly owned subsidiary of Wells Fargo, is the manager of the Fund and provides advisory and fund-level administrative services under an investment management agreement. Under the investment management agreement, Funds Management is responsible for, among other services, implementing the investment objectives and strategies of the Fund, supervising the subadviser, providing fund-level administrative services in connection with the Fund’s operations, and providing any other fund-level administrative services reasonably necessary
| | | | | | |
| Notes to financial statements (unaudited) | | Wells Fargo High Yield Municipal Bond Fund | | | 25 | |
for the operation of the Fund. As compensation for its services under the investment management agreement, Funds Management is entitled to receive an annual management fee starting at 0.50% and declining to 0.38% as the average daily net assets of the Fund increase. For the six months ended December 31, 2017, the management fee was equivalent to an annual rate of 0.50% of the Fund’s average daily net assets.
Funds Management has retained the services of a subadviser to provide daily portfolio management to the Fund. The fee for subadvisory services is borne by Funds Management. WellsCap is the subadviser to the Fund and is entitled to receive a fee from Funds Management at an annual rate starting at 0.35% and declining to 0.20% as the average daily net assets of the Fund increase.
Administration fees
Under a class-level administration agreement, Funds Management provides class-level administrative services to the Fund, which includes paying fees and expenses for services provided by the transfer agent, sub-transfer agents, omnibus account servicers and record-keepers. As compensation for its services under the class-level administration agreement, Funds Management receives an annual fee which is calculated based on the average daily net assets of each class as follows:
| | | | |
| | | Class-level
administration fee | |
Class A, Class C | | | 0.16 | % |
Administrator Class | | | 0.10 | |
Institutional Class | | | 0.08 | |
Funds Management has contractually waived and/or reimbursed management and administration fees to the extent necessary to maintain certain net operating expense ratios for the Fund. Waiver of fees and/or reimbursement of expenses by Funds Management were made first from fund level expenses on a proportionate basis and then from class specific expenses. Funds Management has committed through October 31, 2018 to waive fees and/or reimburse expenses to the extent necessary to cap the Fund’s expenses at 0.85% for Class A shares, 1.60% for Class C shares, 0.75% for Administrator Class shares, and 0.60% for Institutional Class shares. After this time, the cap may be increased or the commitment to maintain the cap may be terminated only with the approval of the Board of Trustees.
Distribution fee
The Trust has adopted a distribution plan for Class C shares of the Fund pursuant to Rule 12b-1 under the 1940 Act. A distribution fee is charged to Class C shares and paid to Wells Fargo Funds Distributor, LLC (“Funds Distributor”), the principal underwriter, at an annual rate of 0.75% of the average daily net assets of Class C shares.
In addition, Funds Distributor is entitled to receive the front-end sales charge from the purchase of Class A shares and a contingent deferred sales charge on the redemption of certain Class A shares. Funds Distributor is also entitled to receive the contingent deferred sales charges from redemptions of Class C shares. For the six months ended December 31, 2017, Funds Distributor received $997 from the sale of Class A shares. No contingent deferred sales charges were incurred by Class A and Class C shares for the six months ended December 31, 2017.
Shareholder servicing fees
The Trust has entered into contracts with one or more shareholder servicing agents, whereby Class A, Class C, and Administrator Class of the Fund are charged a fee at an annual rate of 0.25% of the average daily net assets of each respective class.
A portion of these total shareholder servicing fees were paid to affiliates of Wells Fargo.
Interfund transactions
The Fund may purchase or sell portfolio investment securities to certain other Wells Fargo affiliates pursuant to Rule 17a-7 under the 1940 Act and under procedures adopted by the Board of Trustees. The procedures have been designed to ensure that these interfund transactions, which do not incur broker commissions, are effected at current market prices. Pursuant to these procedures, the Fund had $3,605,000 and $8,110,000 in interfund purchases and sales, respectively, during the six months ended December 31, 2017.
5. INVESTMENT PORTFOLIO TRANSACTIONS
Purchases and sales of investments, excluding U.S. government obligations (if any) and short-term securities, for the six months ended December 31, 2017 were $51,013,731 and $42,396,098, respectively.
| | | | |
| 26 | | Wells Fargo High Yield Municipal Bond Fund | | Notes to financial statements (unaudited) |
6. BANK BORROWINGS
The Trust (excluding the money market funds and certain other funds) and Wells Fargo Variable Trust are parties to a $280,000,000 revolving credit agreement whereby the Fund is permitted to use bank borrowings for temporary or emergency purposes, such as to fund shareholder redemption requests. Interest under the credit agreement is charged to the Fund based on a borrowing rate equal to the higher of the Federal Funds rate in effect on that day plus 1.25% or the overnight LIBOR rate in effect on that day plus 1.25%. In addition, an annual commitment fee equal to 0.25% of the unused balance is allocated to each participating fund. Prior to August 29, 2017, the revolving credit agreement amount was $250,000,000.
For the six months ended December 31, 2017, there were no borrowings by the Fund under the agreement.
7. INDEMNIFICATION
Under the Trust’s organizational documents, the officers and Trustees have been granted certain indemnification rights against certain liabilities that may arise out of performance of their duties to the Trust. Additionally, in the normal course of business, the Trust may enter into contracts with service providers that contain a variety of indemnification clauses. The Trust’s maximum exposure under these arrangements is dependent on future claims that may be made against the Fund and, therefore, cannot be estimated.
| | | | | | |
| Other information (unaudited) | | Wells Fargo High Yield Municipal Bond Fund | | | 27 | |
PROXY VOTING INFORMATION
A description of the policies and procedures that the Fund uses to determine how to vote proxies relating to portfolio securities is available, upon request, by calling 1-800-222-8222, visiting our website at wellsfargofunds.com, or visiting the SEC website at sec.gov. Information regarding how the Fund voted proxies relating to portfolio securities during the most recent 12-month period ended June 30 is available on the Fund’s website at wellsfargofunds.com or by visiting the SEC website at sec.gov.
PORTFOLIO HOLDINGS INFORMATION
The complete portfolio holdings for the Fund are publicly available monthly on the Fund’s website (wellsfargofunds.com), on a one-month delayed basis. In addition, top ten holdings information (excluding derivative positions) for the Fund is publicly available on the Fund’s website on a monthly, seven-day or more delayed basis. The Fund files its complete schedule of portfolio holdings with the SEC for the first and third quarters of each fiscal year on Form N-Q, which is available by visiting the SEC website at sec.gov. In addition, the Fund’s Form N-Q may be reviewed and copied at the SEC’s Public Reference Room in Washington, DC, and at regional offices in New York City, at 233 Broadway, and in Chicago, at 175 West Jackson Boulevard, Suite 900. Information about the Public Reference Room may be obtained by calling 1-800-SEC-0330.
| | | | |
| 28 | | Wells Fargo High Yield Municipal Bond Fund | | Other information (unaudited) |
BOARD OF TRUSTEES AND OFFICERS
Each of the Trustees and Officers1 listed in the table below acts in identical capacities for each fund in the Wells Fargo family of funds, which consists of 153 mutual funds comprising the Wells Fargo Funds Trust, Wells Fargo Variable Trust, Wells Fargo Master Trust and four closed-end funds (collectively the “Fund Complex”). This table should be read in conjunction with the Prospectus and the Statement of Additional Information2. The mailing address of each Trustee and Officer is 525 Market Street, 12th Floor, San Francisco, CA 94105. Each Trustee and Officer serves an indefinite term, however, each Trustee serves such term until reaching the mandatory retirement age established by the Trustees.
Independent Trustees
| | | | | | |
Name and
year of birth | | Position held and
length of service* | | Principal occupations during past five years or longer | | Current other
public company or
investment company
directorships |
William R. Ebsworth (Born 1957) | | Trustee, since 2015 | | Retired. From 1984 to 2013, equities analyst, portfolio manager, research director and chief investment officer at Fidelity Management and Research Company in Boston, Tokyo, and Hong Kong, and retired in 2013 as Chief Investment Officer of Fidelity Strategic Advisers, Inc. where he led a team of investment professionals managing client assets. Prior thereto, Board member of Hong Kong Securities Clearing Co., Hong Kong Options Clearing Corp., the Thailand International Fund, Ltd., Fidelity Investments Life Insurance Company, and Empire Fidelity Investments Life Insurance Company. Board member of the Forté Foundation (non-profit organization) and the Vincent Memorial Hospital Endowment (non-profit organization), where he serves on the Investment Committee and as a Chair of the Audit Committee. Mr. Ebsworth is a CFA® charterholder. | | Asset Allocation Trust |
Jane A. Freeman** (Born 1953) | | Trustee, since 2015; Chair Liaison, since 2018 | | Retired. From 2012 to 2014 and 1999 to 2008, Chief Financial Officer of Scientific Learning Corporation. From 2008 to 2012, Ms. Freeman provided consulting services related to strategic business projects. Prior to 1999, Portfolio Manager at Rockefeller & Co. and Scudder, Stevens & Clark. Board member of the Harding Loevner Funds from 1996 to 2014, serving as both Lead Independent Director and chair of the Audit Committee. Board member of the Russell Exchange Traded Funds Trust from 2011 to 2012 and the chair of the Audit Committee. Ms. Freeman is a Board Member of Ruth Bancroft Garden (non-profit organization) and the Glimmerglass Festival. She is also an inactive Chartered Financial Analyst. | | Asset Allocation Trust |
Peter G. Gordon*** (Born 1942) | | Trustee, since 1998; Chairman, from 2005 to 2017 | | Co-Founder, Retired Chairman, President and CEO of Crystal Geyser Water Company. Trustee Emeritus, Colby College. | | Asset Allocation Trust |
Isaiah Harris, Jr. (Born 1952) | | Trustee, since 2009 | | Retired. Chairman of the Board of CIGNA Corporation since 2009, and Director since 2005. From 2003 to 2011, Director of Deluxe Corporation. Prior thereto, President and CEO of BellSouth Advertising and Publishing Corp. from 2005 to 2007, President and CEO of BellSouth Enterprises from 2004 to 2005 and President of BellSouth Consumer Services from 2000 to 2003. Emeritus member of the Iowa State University Foundation Board of Governors. Emeritus Member of the Advisory Board of Iowa State University School of Business. Advisory Board Member, Palm Harbor Academy (charter school). Advisory Board Member, Child Evangelism Fellowship (non-profit). Mr. Harris is a certified public accountant (inactive status). | | CIGNA Corporation; Asset Allocation Trust |
Judith M. Johnson (Born 1949) | | Trustee, since 2008; Audit Committee Chairman, since 2008 | | Retired. Prior thereto, Chief Executive Officer and Chief Investment Officer of Minneapolis Employees Retirement Fund from 1996 to 2008. Ms. Johnson is an attorney, certified public accountant and a certified managerial accountant. | | Asset Allocation Trust |
David F. Larcker (Born 1950) | | Trustee, since 2009 | | James Irvin Miller Professor of Accounting at the Graduate School of Business, Stanford University, Director of the Corporate Governance Research Initiative and Senior Faculty of The Rock Center for Corporate Governance since 2006. From 2005 to 2008, Professor of Accounting at the Graduate School of Business, Stanford University. Prior thereto, Ernst & Young Professor of Accounting at The Wharton School, University of Pennsylvania from 1985 to 2005. | | Asset Allocation Trust |
| | | | | | |
| Other information (unaudited) | | Wells Fargo High Yield Municipal Bond Fund | | | 29 | |
| | | | | | |
Name and
year of birth | | Position held and
length of service* | | Principal occupations during past five years or longer | | Current other
public company or
investment company
directorships |
Olivia S. Mitchell**** (Born 1953) | | Trustee, since 2006; Governance Committee Chairman, since 2018 | | International Foundation of Employee Benefit Plans Professor, Wharton School of the University of Pennsylvania since 1993. Director of Wharton’s Pension Research Council and Boettner Center on Pensions & Retirement Research, and Research Associate at the National Bureau of Economic Research. Previously, Cornell University Professor from 1978 to 1993. | | Asset Allocation Trust |
Timothy J. Penny***** (Born 1951) | | Trustee, since 1996; Chairman, since 2018; Vice Chairman, from 2017 to 2018 | | President and Chief Executive Officer of Southern Minnesota Initiative Foundation, a non-profit organization, since 2007. Member of the Board of Trustees of NorthStar Education Finance, Inc., a non-profit organization, since 2007. | | Asset Allocation Trust |
James G. Polisson****** (Born 1959) | | Trustee, since 2018; Advisory Board Member, from 2017 to 2018 | | Retired. Chief Marketing Officer, Source (ETF) UK Services, Ltd, from 2015 to 2017. From 2012 to 2015, Principal of The Polisson Group, LLC, a management consulting, corporate advisory and principal investing company. Chief Executive Officer and Managing Director at Russell Investments, Global Exchange Traded Funds from 2010 to 2012. Managing Director of Barclays Global Investors from 1998 to 2010 and Global Chief Marketing Officer for iShares and Barclays Global Investors from 2000 to 2010. Trustee of the San Francisco Mechanics’ Institute, a non-profit organization, from 2013 to 2015. Board member of the Russell Exchange Traded Fund Trust from 2011 to 2012. Director of Barclays Global Investors Holdings Deutschland GmbH from 2006 to 2009. Mr. Polisson is an attorney and has a retired status with the Massachusetts and District of Columbia Bar Associations. | | Asset Allocation Trust |
Michael S. Scofield (Born 1943) | | Trustee, since 2010 | | Served on the Investment Company Institute’s Board of Governors and Executive Committee from 2008-2011 as well the Governing Council of the Independent Directors Council from 2006-2011 and the Independent Directors Council Executive Committee from 2008-2011. Trustee of the Evergreen Funds complex (and its predecessors) from 1984 to 2010. Chairman of the Evergreen Funds from 2000-2010. Former Trustee of the Mentor Funds. Retired Attorney, Law Offices of Michael S. Scofield. | | Asset Allocation Trust |
Pamela Wheelock****** (Born 1959) | | Trustee, since 2018; Advisory Board Member, from 2017 to 2018 | | Chief Operating Officer, Twin Cities Habitat for Humanity, since January, 2017. Vice President of University Services, University of Minnesota from 2012 to 2017. Prior thereto, Interim President and Chief Executive Officer of Blue Cross Blue Shield of Minnesota from 2010 to 2011, Chairman of the Board from 2009 to 2011 and Board Director from 2003 to 2015. Vice President, Leadership and Community Engagement, Bush Foundation, Saint Paul, Minnesota (a private foundation) from 2009 to 2011. Executive Vice President and Chief Financial Officer, Minnesota Sports and Entertainment from 2004 to 2009 and Senior Vice President from 2002 to 2004. Commissioner of Finance, State of Minnesota, from 1999 to 2002. Currently on the Board of Directors, Governance Committee and Finance Committee, for the Minnesota Philanthropy Partners (Saint Paul Foundation) since 2012 and Board Chair of the Minnesota Wild Foundation since 2010. | | Asset Allocation Trust |
| * | Length of service dates reflect the Trustee’s commencement of service with the Trust’s predecessor entities, where applicable. |
| ** | Jane Freeman became Chair Liaison effective January 1, 2018. |
| *** | Peter Gordon retired on December 31, 2017. |
| **** | Olivia Mitchell became Chairman of the Governance Committee effective January 1, 2018. |
| ***** | Timothy Penny became Chairman effective January 1, 2018. |
| ****** | James Polisson and Pamela Wheelock each became a Trustee effective January 1, 2018. |
| | | | |
| 30 | | Wells Fargo High Yield Municipal Bond Fund | | Other information (unaudited) |
Officers
| | | | | | |
Name and
year of birth | | Position held and
length of service | | Principal occupations during past five years or longer | | |
Andrew Owen (Born 1960) | | President, since 2017 | | Executive Vice President of Wells Fargo & Company and Head of Affiliated Managers, Wells Fargo Asset Management, since 2014. In addition, Mr. Owen is currently President, Chief Executive Officer and Director of Wells Fargo Funds Management, LLC since 2017. Prior thereto, Executive Vice President responsible for marketing, investments and product development for Wells Fargo Funds Management, LLC, from 2009 to 2014. | | |
Nancy Wiser1 (Born 1967) | | Treasurer, since 2012 | | Executive Vice President of Wells Fargo Funds Management, LLC since 2011. Chief Operating Officer and Chief Compliance Officer at LightBox Capital Management LLC, from 2008 to 2011. | | |
C. David Messman (Born 1960) | | Secretary, since 2000; Chief Legal Officer, since 2003 | | Senior Vice President and Secretary of Wells Fargo Funds Management, LLC since 2001. Assistant General Counsel of Wells Fargo Bank, N.A. since 2013 and Vice President and Managing Counsel of Wells Fargo Bank, N.A. from 1996 to 2013. | | |
Michael H. Whitaker (Born 1967) | | Chief Compliance Officer, since 2016 | | Senior Vice President and Chief Compliance Officer since 2016. Senior Vice President and Chief Compliance Officer for Fidelity Investments from 2007 to 2016. | | |
David Berardi (Born 1975) | | Assistant Treasurer, since 2009 | | Vice President of Wells Fargo Funds Management, LLC since 2009. Vice President of Evergreen Investment Management Company, LLC from 2008 to 2010. Manager of Fund Reporting and Control for Evergreen Investment Management Company, LLC from 2004 to 2010. | | |
Jeremy DePalma1 (Born 1974) | | Assistant Treasurer, since 2009 | | Senior Vice President of Wells Fargo Funds Management, LLC since 2009. Senior Vice President of Evergreen Investment Management Company, LLC from 2008 to 2010 and head of the Fund Reporting and Control Team within Fund Administration from 2005 to 2010. | | |
| 1 | Nancy Wiser acts as Treasurer of 77 funds in the Fund Complex. Jeremy DePalma acts as Treasurer of 76 funds and Assistant Treasurer of 77 funds in the Fund Complex. |
| 2 | The Statement of Additional Information includes additional information about the Trustees and is available, without charge, upon request, by calling 1-800-222-8222 or by visiting the website at wellsfargofunds.com. |
| | | | | | |
| List of abbreviations | | Wells Fargo High Yield Municipal Bond Fund | | | 31 | |
The following is a list of common abbreviations for terms and entities that may have appeared in this report.
| ACA | — ACA Financial Guaranty Corporation |
| ADR | — American depositary receipt |
| ADS | — American depositary shares |
| AGC | — Assured Guaranty Corporation |
| AGM | — Assured Guaranty Municipal |
| Ambac | — Ambac Financial Group Incorporated |
| AMT | — Alternative minimum tax |
| BAN | — Bond anticipation notes |
| BHAC | — Berkshire Hathaway Assurance Corporation |
| CAB | — Capital appreciation bond |
| CCAB | — Convertible capital appreciation bond |
| CDA | — Community Development Authority |
| CDO | — Collateralized debt obligation |
| CLO | — Collateralized loan obligation |
| DRIVER | — Derivative inverse tax-exempt receipts |
| DW&P | — Department of Water & Power |
| DWR | — Department of Water Resources |
| ECFA | — Educational & Cultural Facilities Authority |
| EDA | — Economic Development Authority |
| EDFA | — Economic Development Finance Authority |
| ETF | — Exchange-traded fund |
| FDIC | — Federal Deposit Insurance Corporation |
| FFCB | — Federal Farm Credit Banks |
| FGIC | — Financial Guaranty Insurance Corporation |
| FHA | — Federal Housing Administration |
| FHLB | — Federal Home Loan Bank |
| FHLMC | — Federal Home Loan Mortgage Corporation |
| FICO | — The Financing Corporation |
| FNMA | — Federal National Mortgage Association |
| GDR | — Global depositary receipt |
| GNMA | — Government National Mortgage Association |
| HCFR | — Healthcare facilities revenue |
| HEFA | — Health & Educational Facilities Authority |
| HEFAR | — Higher education facilities authority revenue |
| HFA | — Housing Finance Authority |
| HFFA | — Health Facilities Financing Authority |
| HUD | — Department of Housing and Urban Development |
| IDA | — Industrial Development Authority |
| IDAG | — Industrial Development Agency |
| KRW | — Republic of Korea won |
| LIBOR | — London Interbank Offered Rate |
| LIFER | — Long Inverse Floating Exempt Receipts |
| LLC | — Limited liability company |
| LLLP | — Limited liability limited partnership |
| LLP | — Limited liability partnership |
| MBIA | — Municipal Bond Insurance Association |
| MFHR | — Multifamily housing revenue |
| MSTR | — Municipal securities trust receipts |
| MUD | — Municipal Utility District |
| National | — National Public Finance Guarantee Corporation |
| PCFA | — Pollution Control Financing Authority |
| PCL | — Public Company Limited |
| PCR | — Pollution control revenue |
| PFA | — Public Finance Authority |
| PFFA | — Public Facilities Financing Authority |
| PFOTER | — Puttable floating option tax-exempt receipts |
| PJSC | — Public Joint Stock Company |
| plc | — Public limited company |
| PUTTER | — Puttable tax-exempt receipts |
| R&D | — Research & development |
| Radian | — Radian Asset Assurance |
| RAN | — Revenue anticipation notes |
| RDA | — Redevelopment Agency |
| RDFA | — Redevelopment Finance Authority |
| REIT | — Real estate investment trust |
| ROC | — Reset option certificates |
| SAVRS | — Select auction variable rate securities |
| SBA | — Small Business Authority |
| SDR | — Swedish depositary receipt |
| SFHR | — Single-family housing revenue |
| SFMR | — Single-family mortgage revenue |
| SIFMA | — Securities Industry and Financial Markets Association |
| SPA | — Standby purchase agreement |
| SPDR | — Standard & Poor’s Depositary Receipts |
| SPEAR | — Short Puttable Exempt Adjustable Receipts |
| STRIPS | — Separate trading of registered interest and |
| TAN | — Tax anticipation notes |
| TIPS | — Treasury inflation-protected securities |
| TRAN | — Tax revenue anticipation notes |
| TTFA | — Transportation Trust Fund Authority |
| TVA | — Tennessee Valley Authority |
This page is intentionally left blank.

For more information
More information about Wells Fargo Funds is available free upon request. To obtain literature, please write, email, visit the Fund’s website, or call:
Wells Fargo Funds
P.O. Box 8266
Boston, MA 02266-8266
Email: fundservice@wellsfargo.com
Website: wellsfargofunds.com
Individual investors: 1-800-222-8222
Retail investment professionals: 1-888-877-9275
Institutional investment professionals: 1-866-765-0778
This report and the financial statements contained herein are submitted for the general information of the shareholders of the Fund. If this report is used for promotional purposes, distribution of the report must be accompanied or preceded by a current prospectus. Before investing, please consider the investment objectives, risks, charges, and expenses of the investment. For a current prospectus and, if available, a summary prospectus, containing this information, call 1-800-222-8222 or visit the Fund’s website at wellsfargofunds.com. Read the prospectus carefully before you invest or send money.
Wells Fargo Asset Management (WFAM) is a trade name used by the asset management businesses of Wells Fargo & Company. Wells Fargo Funds Management, LLC, a wholly owned subsidiary of Wells Fargo & Company, provides investment advisory and administrative services for Wells Fargo Funds. Other affiliates of Wells Fargo & Company provide subadvisory and other services for the funds. The funds are distributed by Wells Fargo Funds Distributor, LLC, Member FINRA, an affiliate of Wells Fargo & Company. Neither Wells Fargo Funds Distributor nor Wells Fargo Funds Management holds fund shareholder accounts or assets. This material is for general informational and educational purposes only and is NOT intended to provide investment advice or a recommendation of any kind—including a recommendation for any specific investment, strategy, or plan.
NOT FDIC INSURED ◾ NO BANK GUARANTEE ◾ MAY LOSE VALUE
© 2017 Wells Fargo Funds Management, LLC. All rights reserved.
| | |
 | | 308061 02-18 SA264/SAR264 12-17 |
Semi-Annual Report
December 31, 2017

Wells Fargo Intermediate Tax/AMT-Free Fund


Reduce clutter. Save trees.
Sign up for electronic delivery of prospectuses and shareholder reports at wellsfargo.com/advantagedelivery
Contents
The views expressed and any forward-looking statements are as of December 31, 2017, unless otherwise noted, and are those of the Fund managers and/or Wells Fargo Funds Management, LLC. Discussions of individual securities, or the markets generally, or any Wells Fargo Fund are not intended as individual recommendations. Future events or results may vary significantly from those expressed in any forward-looking statements. The views expressed are subject to change at any time in response to changing circumstances in the market. Wells Fargo Funds Management, LLC and the Fund disclaim any obligation to publicly update or revise any views expressed or forward-looking statements.
NOT FDIC INSURED ◾ NO BANK GUARANTEE ◾ MAY LOSE VALUE
| | | | |
| 2 | | Wells Fargo Intermediate Tax/AMT-Free Fund | | Letter to shareholders (unaudited) |

Andrew Owen
President
Wells Fargo Funds
In a predominantly improving global economic environment, global stocks delivered strong results; bond markets had smaller but positive results as well.
Dear Shareholder:
We are pleased to offer you this semi-annual report for the Wells Fargo Intermediate Tax/AMT-Free Fund for the six-month period that ended December 31, 2017. In a predominantly improving global economic environment, global stocks delivered strong results; bond markets had smaller but positive results as well. U.S. and international stocks delivered similar results, with returns of 11.42% and 11.48%, respectively, for the six-month period, as measured by the S&P 500 Index1 and the MSCI ACWI ex USA Index (Net)2, respectively; within fixed income, the Bloomberg Barclays U.S. Aggregate Bond Index3 returned 1.24% and the Bloomberg Barclays Municipal Bond Index4 returned 1.82%.
As global growth improved in the third quarter of 2017, investment markets generally advanced.
Most stock markets worldwide moved higher during the quarter and ended the period at or near all-time highs. Moderate acceleration in global economic growth was supported by improving corporate earnings, low inflation pressure, and still-low interest rates. Corporate earnings reports were favorable overall as companies continued to benefit from healthy operating leverage. While North Korea’s recent missile launches and nuclear testing raised serious concerns around the world, the heightened geopolitical risk had relatively minimal impact on the quarter’s stock returns. In the U.S., economic data released during the quarter reflected a generally healthy economy. Second-quarter economic output grew at a 3.1% annual rate, and consumers displayed more willingness to spend. Meanwhile, the U.S. Federal Reserve (Fed) maintained the target range for the federal funds rate at 1.00% to 1.25%, noting that inflation had remained below the Fed’s 2.00% objective. However, the Fed also stated the possibility of one more 0.25% increase in the federal funds rate by the end of 2017 and announced plans to begin the process of unwinding its $4.5 trillion portfolio of bonds and other assets in October. Outside the U.S., stocks in the Asia Pacific region benefited from solid earnings reports and investors’ willingness to take on risk despite the rising tensions between North Korea and the U.S. In Europe, markets were supported by better-than-expected economic growth, which led to narrowing of the gap between Europe’s growth rate and that of the U.S. In emerging markets, many countries benefited from stronger currencies versus the U.S. dollar.
Positive economic and market news continued through the fourth quarter.
During the fourth quarter of 2017, stock markets followed a steady, upward trajectory with no meaningful pullbacks, similar to their paths during the previous three quarters of the year. The extended rally was driven largely by reports of strong earnings and revenue surprises from many companies. Synchronous economic expansion worldwide with mild inflation provided a favorable environment for markets to rise with minimal volatility. Data released during the quarter reflected a
| 1 | The S&P 500 Index consists of 500 stocks chosen for market size, liquidity, and industry group representation. It is a market-value-weighted index with each stock’s weight in the index proportionate to its market value. You cannot invest directly in an index. |
| 2 | The Morgan Stanley Capital International (MSCI) All Country World Index (ACWI) ex USA Index (Net) is a free-float-adjusted market-capitalization-weighted index that is designed to measure the equity market performance of developed markets, excluding the United States and Canada. Source: MSCI. MSCI makes no express or implied warranties or representations and shall have no liability whatsoever with respect to any MSCI data contained herein. The MSCI data may not be further redistributed or used as a basis for other indices or any securities or financial products. This report is not approved, reviewed, or produced by MSCI. You cannot invest directly in an index. |
| 3 | The Bloomberg Barclays U.S. Aggregate Bond Index is a broad-based benchmark that measures the investment-grade, U.S. dollar-denominated, fixed-rate taxable bond market, including Treasuries, government-related and corporate securities, mortgage-backed securities (agency fixed-rate and hybrid adjustable-rate mortgage pass-throughs), asset-backed securities, and commercial mortgage-backed securities. You cannot invest directly in an index. |
| 4 | The Bloomberg Barclays Municipal Bond Index is an unmanaged index composed of long-term tax-exempt bonds with a minimum credit rating of Baa. You cannot invest directly in an index. |
| | | | | | |
| Letter to shareholders (unaudited) | | Wells Fargo Intermediate Tax/AMT-Free Fund | | | 3 | |
healthy U.S. economy. Third-quarter economic output grew at a 3.2% annual rate, just ahead of the second quarter’s 3.1% pace. Hiring remained solid during the quarter; the hiring pace pushed the unemployment rate down to a 17-year low of 4.1% in October, and it remained at 4.1% for both November and December. Fed officials began unwinding the Fed’s $4.5 trillion portfolio of bonds and other assets in October as planned, and in December they raised the target for the federal funds rate to a range of 1.25% to 1.50%. As a result, long-term interest rates in the U.S. continued trending upward, although the 10-year rate remained below 2.5%. Outside the U.S., economies continued to strengthen. In December, the Organisation for Economic Co-operation and Development (OECD) reported that the global economy has been expanding at its fastest rate since 2010; all 45 countries the OECD follows were on track to expand for 2017. International economies have benefited from catalysts such as economic stimulus, improving employment, increased investment, and accelerated trade growth.
Don’t let short-term uncertainty derail long-term investment goals.
Periods of investment uncertainty can present challenges, but experience has taught us that maintaining long-term investment goals can be an effective way to plan for the future. To help you create a sound strategy based on your personal goals and risk tolerance, Wells Fargo Funds offers more than 100 mutual funds spanning a wide range of asset classes and investment styles. Although diversification cannot guarantee an investment profit or prevent losses, we believe it can be an effective way to manage investment risk and potentially smooth out overall portfolio performance. We encourage investors to know their investments and to understand that appropriate levels of risk-taking may unlock opportunities.
Thank you for choosing to invest with Wells Fargo Funds. We appreciate your confidence in us and remain committed to helping you meet your financial needs.
Sincerely,

Andrew Owen
President
Wells Fargo Funds
Although diversification cannot guarantee an investment profit or prevent losses, we believe it can be an effective way to manage investment risk and potentially smooth out overall portfolio performance.
For further information about your Fund, contact your investment professional, visit our website at wellsfargofunds.com, or call us directly at 1-800-222-8222. We are available 24 hours a day, 7 days a week.
| | | | |
| 4 | | Wells Fargo Intermediate Tax/AMT-Free Fund | | Performance highlights (unaudited) |
Investment objective
The Fund seeks current income exempt from federal income tax.
Manager
Wells Fargo Funds Management, LLC
Subadviser
Wells Capital Management Incorporated
Portfolio managers
Lyle J. Fitterer, CFA®, CPA
Robert J. Miller
Average annual total returns (%) as of December 31, 20171
| | | | | | | | | | | | | | | | | | | | | | | | | | | | | | | | | | |
| | | | | Including sales charge | | | Excluding sales charge | | | Expense ratios2 (%) | |
| | | Inception date | | 1 year | | | 5 year | | | 10 year | | | 1 year | | | 5 year | | | 10 year | | | Gross | | | Net3 | |
| Class A (WFTAX) | | 7-31-2007 | | | 1.27 | | | | 1.56 | | | | 3.51 | | | | 4.40 | | | | 2.18 | | | | 3.82 | | | | 0.79 | | | | 0.70 | |
| Class C (WFTFX) | | 7-31-2007 | | | 2.62 | | | | 1.42 | | | | 3.05 | | | | 3.62 | | | | 1.42 | | | | 3.05 | | | | 1.54 | | | | 1.45 | |
| Administrator Class (WFITX) | | 3-31-2008 | | | – | | | | – | | | | – | | | | 4.41 | | | | 2.26 | | | | 3.93 | | | | 0.73 | | | | 0.60 | |
| Institutional Class (WITIX) | | 3-31-2008 | | | – | | | | – | | | | – | | | | 4.66 | | | | 2.44 | | | | 4.11 | | | | 0.46 | | | | 0.45 | |
| Bloomberg Barclays Municipal Bond 1-15 Year Blend Index4 | | – | | | – | | | | – | | | | – | | | | 4.33 | | | | 2.46 | | | | 3.99 | | | | – | | | | – | |
Figures quoted represent past performance, which is no guarantee of future results, and do not reflect taxes that a shareholder may pay on fund distributions or the redemption of fund shares. Investment return and principal value of an investment will fluctuate so that an investor’s shares, when redeemed, may be worth more or less than their original cost. Performance shown without sales charges would be lower if sales charges were reflected. Current performance may be lower or higher than the performance data quoted, which assumes the reinvestment of dividends and capital gains. Current month-end performance is available on the Fund’s website, wellsfargofunds.com.
Index returns do not include transaction costs associated with buying and selling securities, any mutual fund fees or expenses, or any taxes. It is not possible to invest directly in an index.
For Class A shares, the maximum front-end sales charge is 3.00%. For Class C shares, the maximum contingent deferred sales charge is 1.00%. Performance including a contingent deferred sales charge assumes the sales charge for the corresponding time period. Administrator Class and Institutional Class shares are sold without a front-end sales charge or contingent deferred sales charge.
Bond values fluctuate in response to the financial condition of individual issuers, general market and economic conditions, and changes in interest rates. Changes in market conditions and government policies may lead to periods of heightened volatility in the bond market and reduced liquidity for certain bonds held by the Fund. In general, when interest rates rise, bond values fall and investors may lose principal value. Interest-rate changes and their impact on the Fund and its share price can be sudden and unpredictable. High-yield securities have a greater risk of default and tend to be more volatile than higher-rated debt securities. The use of derivatives may reduce returns and/or increase volatility. Certain investment strategies tend to increase the total risk of an investment (relative to the broader market). The Fund is exposed to municipal securities risk. Consult the Fund’s prospectus for additional information on these and other risks. A portion of the Fund’s income may be subject to federal, state, and/or local income taxes or the Alternative Minimum Tax (AMT). Any capital gains distributions may be taxable.
Please see footnotes on page 5.
| | | | | | |
| Performance highlights (unaudited) | | Wells Fargo Intermediate Tax/AMT-Free Fund | | | 5 | |
|
| Effective maturity distribution as of December 31, 20175 |
|
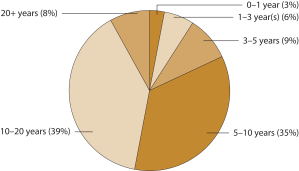
|
|
| Credit quality as of December 31, 20176 |
|
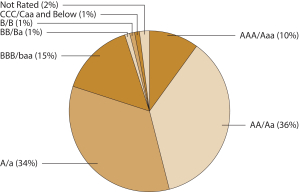 |
| 1 | Historical performance shown for Class A shares prior to their inception reflects the performance of the former Investor Class shares, and includes the higher expenses applicable to the former Investor Class shares (except during those periods in which expenses of Class A shares would have been higher than those of the former Investor Class shares). Historical performance shown for Class C shares prior to their inception reflects the performance of the former Investor Class shares, adjusted to reflect the higher expenses applicable to Class C shares. Historical performance shown for the Administrator Class shares prior to their inception reflects the performance of the former Investor Class shares, and includes the higher expenses applicable to the Investor Class shares. Historical performance shown for the Institutional Class shares prior to their inception reflects the performance of the former Investor Class shares, and includes the higher expenses applicable to the Investor Class shares. If these expenses had not been included, returns for Institutional Class shares would be higher. |
| 2 | Reflects the expense ratios as stated in the most recent prospectuses. The expense ratios shown are subject to change and may differ from the annualized expense ratios shown in the financial highlights of this report. |
| 3 | The manager has contractually committed through October 31, 2018, to waive fees and/or reimburse expenses to the extent necessary to cap the Fund’s Total Annual Fund Operating Expenses After Fee Waivers at the amount shown. After this time, the cap may be increased or the commitment to maintain the cap may be terminated only with the approval of the Board of Trustees. Brokerage commissions, stamp duty fees, interest, taxes, acquired fund fees and expenses, and extraordinary expenses are excluded from the expense cap. Without this cap, the Fund’s returns would have been lower. The expense ratio paid by an investor is the net expense ratio or the Fund’s Total Annual Fund Operating Expenses After Fee Waivers, as stated in the prospectuses. |
| 4 | The Bloomberg Barclays Municipal Bond 1–15 Year Blend Index is the 1–15 Year Blend component of the Bloomberg Barclays Municipal Bond Index. The Bloomberg Barclays Municipal Bond Index is an unmanaged index composed of tax-exempt bonds with maturities between six and eight years and a minimum credit rating of Baa. You cannot invest directly in an index. |
| 5 | Amounts are calculated based on the total investments of the Fund. These amounts are subject to change and may have changed since the date specified. |
| 6 | The credit quality distribution of portfolio holdings reflected in the chart is based on ratings from Standard & Poor’s, Moody’s Investors Service, and/or Fitch Ratings Ltd. Credit quality ratings apply to the underlying holdings of the Fund and not to the Fund itself. The percentages of the Fund’s portfolio with the ratings depicted in the chart are calculated based on the total market value of fixed income securities held by the Fund. If a security was rated by all three rating agencies, the middle rating was utilized. If rated by two of three rating agencies, the lower rating was utilized, and if rated by one of the rating agencies, that rating was utilized. Standard & Poor’s rates the creditworthiness of bonds, ranging from AAA (highest) to D (lowest). Ratings from A to CCC may be modified by the addition of a plus (+) or minus (-) sign to show relative standing within the rating categories. Standard & Poor’s rates the creditworthiness of short-term notes from SP-1 (highest) to SP-3 (lowest). Moody’s rates the creditworthiness of bonds, ranging from Aaa (highest) to C (lowest). Ratings Aa to B may be modified by the addition of a number 1 (highest) to 3 (lowest) to show relative standing within the ratings categories. Moody’s rates the creditworthiness of short-term U.S. tax-exempt municipal securities from MIG 1/VMIG 1 (highest) to SG (lowest). Fitch rates the creditworthiness of bonds, ranging from AAA (highest) to D (lowest). Credit quality distribution is subject to change and may have changed since the date specified. |
| | | | |
| 6 | | Wells Fargo Intermediate Tax/AMT-Free Fund | | Fund expenses (unaudited) |
As a shareholder of the Fund, you incur two types of costs: (1) transaction costs, including sales charges (loads) on purchase payments and contingent deferred sales charges (if any) on redemptions and (2) ongoing costs, including management fees, distribution (12b-1) and/or shareholder servicing fees, and other Fund expenses. This example is intended to help you understand your ongoing costs (in dollars) of investing in the Fund and to compare these costs with the ongoing costs of investing in other mutual funds.
The example is based on an investment of $1,000 invested at the beginning of the six-month period and held for the entire period from July 1, 2017 to December 31, 2017.
Actual expenses
The “Actual” line of the table below provides information about actual account values and actual expenses. You may use the information in this line, together with the amount you invested, to estimate the expenses that you paid over the period. Simply divide your account value by $1,000 (for example, an $8,600 account value divided by $1,000 = 8.6), then multiply the result by the number in the “Actual” line under the heading entitled “Expenses paid during period” for your applicable class of shares to estimate the expenses you paid on your account during this period.
Hypothetical example for comparison purposes
The “Hypothetical” line of the table below provides information about hypothetical account values and hypothetical expenses based on the Fund’s actual expense ratio and an assumed rate of return of 5% per year before expenses, which is not the Fund’s actual return. The hypothetical account values and expenses may not be used to estimate the actual ending account balance or expenses you paid for the period. You may use this information to compare the ongoing costs of investing in the Fund and other funds. To do so, compare this 5% hypothetical example with the 5% hypothetical examples that appear in the shareholder reports of the other funds.
Please note that the expenses shown in the table are meant to highlight your ongoing costs only and do not reflect any transactional costs, such as sales charges (loads) and contingent deferred sales charges. Therefore, the “Hypothetical” line of the table is useful in comparing ongoing costs only and will not help you determine the relative total costs of owning different funds. In addition, if these transactional costs were included, your costs would have been higher.
| | | | | | | | | | | | | | | | |
| | | Beginning
account value
7-1-2017 | | | Ending
account value
12-31-2017 | | | Expenses
paid during
the period¹ | | | Annualized net
expense ratio | |
Class A | | | | | | | | | | | | | | | | |
Actual | | $ | 1,000.00 | | | $ | 1,015.28 | | | $ | 3.56 | | | | 0.70 | % |
Hypothetical (5% return before expenses) | | $ | 1,000.00 | | | $ | 1,021.68 | | | $ | 3.57 | | | | 0.70 | % |
Class C | | | | | | | | | | | | | | | | |
Actual | | $ | 1,000.00 | | | $ | 1,011.45 | | | $ | 7.35 | | | | 1.45 | % |
Hypothetical (5% return before expenses) | | $ | 1,000.00 | | | $ | 1,017.90 | | | $ | 7.38 | | | | 1.45 | % |
Administrator Class | | | | | | | | | | | | | | | | |
Actual | | $ | 1,000.00 | | | $ | 1,014.90 | | | $ | 3.05 | | | | 0.60 | % |
Hypothetical (5% return before expenses) | | $ | 1,000.00 | | | $ | 1,022.18 | | | $ | 3.06 | | | | 0.60 | % |
Institutional Class | | | | | | | | | | | | | | | | |
Actual | | $ | 1,000.00 | | | $ | 1,016.56 | | | $ | 2.29 | | | | 0.45 | % |
Hypothetical (5% return before expenses) | | $ | 1,000.00 | | | $ | 1,022.94 | | | $ | 2.29 | | | | 0.45 | % |
| 1 | Expenses paid is equal to the annualized net expense ratio of each class multiplied by the average account value over the period, multiplied by the number of days in the most recent fiscal half-year divided by the number of days in the fiscal year (to reflect the one-half-year period). |
| | | | | | |
| Portfolio of investments—December 31, 2017 (unaudited) | | Wells Fargo Intermediate Tax/AMT-Free Fund | | | 7 | |
| | | | | | | | | | | | | | | | |
| Security name | | Interest rate | | | Maturity date | | | Principal | | | Value | |
|
Municipal Obligations: 98.60% | |
|
| Alabama: 0.11% | |
Jefferson County AL Series A (GO Revenue) | | | 4.90 | % | | | 4-1-2021 | | | $ | 2,715,000 | | | $ | 2,809,455 | |
| | | | | | | | | | | | | | | | |
|
| Alaska: 0.49% | |
Alaska Housing Finance Corporation Series A (Housing Revenue, FHLB SPA) ø | | | 1.71 | | | | 12-1-2041 | | | | 11,055,000 | | | | 11,055,000 | |
Valdez AK Marine Terminal BP Pipelines Project Series B (Industrial Development Revenue) | | | 5.00 | | | | 1-1-2021 | | | | 1,000,000 | | | | 1,087,990 | |
| | | | |
| | | | | | | | | | | | | | | 12,142,990 | |
| | | | | | | | | | | | | | | | |
|
| Arizona: 1.56% | |
Arizona Refunding Certificate of Participation (Miscellaneous Revenue) | | | 5.00 | | | | 9-1-2027 | | | | 3,040,000 | | | | 3,629,912 | |
Arizona Sports & Tourism Authority Series A (Tax Revenue) | | | 4.00 | | | | 7-1-2020 | | | | 1,365,000 | | | | 1,420,938 | |
Arizona Sports & Tourism Authority Series A (Tax Revenue) | | | 5.00 | | | | 7-1-2021 | | | | 795,000 | | | | 864,722 | |
Arizona Sports & Tourism Authority Series A (Tax Revenue) | | | 5.00 | | | | 7-1-2022 | | | | 1,000,000 | | | | 1,108,800 | |
Estrella Mountain Ranch AZ Community Facilities District Refunding Bond (GO Revenue, AGM Insured) | | | 5.00 | | | | 7-15-2025 | | | | 585,000 | | | | 683,099 | |
Maricopa County AZ Elementary School District #28 Kyrene Elementary School Project 2010 Series B (GO Revenue) | | | 4.50 | | | | 7-1-2024 | | | | 1,575,000 | | | | 1,787,688 | |
Maricopa County AZ Elementary School District #28 Kyrene Elementary School Project 2010 Series B (GO Revenue) | | | 4.50 | | | | 7-1-2025 | | | | 1,270,000 | | | | 1,441,501 | |
Maricopa County AZ Elementary School District #28 Kyrene Elementary School Project 2010 Series B (GO Revenue) | | | 5.00 | | | | 7-1-2027 | | | | 420,000 | | | | 487,624 | |
Maricopa County AZ Elementary School District #28 Kyrene Elementary School Project 2010 Series B (GO Revenue) | | | 5.50 | | | | 7-1-2029 | | | | 960,000 | | | | 1,139,501 | |
Maricopa County AZ IDA Bond (Health Revenue) | | | 5.00 | | | | 1-1-2048 | | | | 1,000,000 | | | | 1,178,480 | |
McAllister AZ Arizona State University Hassayampa Academic Village Project (Education Revenue) | | | 5.00 | | | | 7-1-2025 | | | | 750,000 | | | | 901,253 | |
Mohave County AZ Kingman Unified School District #20 (GO Revenue, Build America Mutual Assurance Company Insured) | | | 5.00 | | | | 7-1-2026 | | | | 2,475,000 | | | | 2,987,969 | |
Phoenix AZ (GO Revenue) | | | 5.00 | | | | 7-1-2026 | | | | 3,810,000 | | | | 4,698,835 | |
Phoenix AZ Civic Improvement Corporation Series A (Airport Revenue) | | | 5.00 | | | | 7-1-2029 | | | | 5,000,000 | | | | 5,402,600 | |
Pima County AZ IDA New Plan Learning Project Series A (Education Revenue) | | | 7.00 | | | | 7-1-2021 | | | | 685,000 | | | | 711,099 | |
Pima County AZ IDA New Plan Learning Project Series A (Education Revenue) | | | 7.75 | | | | 7-1-2035 | | | | 4,980,000 | | | | 5,069,391 | |
San Luis AZ Pledged Excise Tax Series A (Tax Revenue, Build America Mutual Assurance Company Insured) | | | 5.00 | | | | 7-1-2027 | | | | 450,000 | | | | 522,027 | |
San Luis AZ Pledged Excise Tax Series A (Tax Revenue, Build America Mutual Assurance Company Insured) | | | 5.00 | | | | 7-1-2028 | | | | 700,000 | | | | 808,388 | |
San Luis AZ Pledged Excise Tax Series A (Tax Revenue, Build America Mutual Assurance Company Insured) | | | 5.00 | | | | 7-1-2034 | | | | 3,680,000 | | | | 4,195,200 | |
| | | | |
| | | | | | | | | | | | | | | 39,039,027 | |
| | | | | | | | | | | | | | | | |
|
| California: 8.37% | |
Alameda County CA Corridor Transportation Authority CAB Subordinate Lien Prerefunded Bond Series A (Transportation Revenue, Ambac Insured) ¤ | | | 0.00 | | | | 10-1-2018 | | | | 4,220,000 | | | | 4,176,703 | |
Alameda County CA Corridor Transportation Authority CAB Subordinate Lien Unrefunded Bond Series A (Transportation Revenue, Ambac Insured) ¤ | | | 0.00 | | | | 10-1-2018 | | | | 1,350,000 | | | | 1,328,387 | |
Anaheim CA PFA Convention Center Expansion Project Series A (Miscellaneous Revenue) | | | 5.00 | | | | 5-1-2039 | | | | 2,500,000 | | | | 2,888,925 | |
Bay Area CA Toll Authority Toll Bridge Series A (SIFMA Municipal Swap +1.25%) (Transportation Revenue) ± | | | 2.96 | | | | 4-1-2036 | | | | 9,810,000 | | | | 10,091,449 | |
California (GO Revenue) | | | 5.25 | | | | 3-1-2024 | | | | 5,000,000 | | | | 5,386,050 | |
The accompanying notes are an integral part of these financial statements.
| | | | |
| 8 | | Wells Fargo Intermediate Tax/AMT-Free Fund | | Portfolio of investments—December 31, 2017 (unaudited) |
| | | | | | | | | | | | | | | | |
| Security name | | Interest rate | | | Maturity date | | | Principal | | | Value | |
|
| California (continued) | |
California (GO Revenue) | | | 5.25 | % | | | 3-1-2030 | | | $ | 1,440,000 | | | $ | 1,550,851 | |
California (GO Revenue) | | | 6.00 | | | | 3-1-2033 | | | | 2,510,000 | | | | 2,736,879 | |
California Department of Water Resources Central Valley Project Series AT (SIFMA Municipal Swap + 0.37%) (Water & Sewer Revenue) ± | | | 2.08 | | | | 12-1-2035 | | | | 10,000,000 | | | | 10,005,700 | |
California Municipal Finance Authority (Utilities Revenue) | | | 5.00 | | | | 10-1-2025 | | | | 1,500,000 | | | | 1,844,280 | |
California Municipal Finance Authority Institute of Aging Project (Health Revenue) | | | 5.00 | | | | 8-15-2032 | | | | 975,000 | | | | 1,172,945 | |
California Municipal Finance Authority Institute of Aging Project (Health Revenue) | | | 5.00 | | | | 8-15-2033 | | | | 1,150,000 | | | | 1,378,057 | |
California Public Works Board Department of Corrections Project Series A (Miscellaneous Revenue, Ambac Insured) | | | 5.00 | | | | 12-1-2019 | | | | 1,345,000 | | | | 1,406,238 | |
California Public Works Board Department of General Services Buildings 8 & 9A (Miscellaneous Revenue) | | | 6.25 | | | | 4-1-2034 | | | | 2,750,000 | | | | 2,912,140 | |
California Public Works Board Various Judicial Council Project Series D (Miscellaneous Revenue) | | | 5.25 | | | | 12-1-2026 | | | | 1,000,000 | | | | 1,130,520 | |
California Public Works University of California Board of Regents Series G (Miscellaneous Revenue) | | | 5.00 | | | | 12-1-2030 | | | | 12,110,000 | | | | 13,650,029 | |
California Statewide CDA Series A (Education Revenue) | | | 6.90 | | | | 8-1-2031 | | | | 1,915,000 | | | | 2,139,610 | |
California Statewide CDA Series C (Health Revenue) | | | 5.25 | | | | 8-15-2031 | | | | 3,000,000 | | | | 3,367,500 | |
California Various Purposes (GO Revenue) | | | 5.00 | | | | 8-1-2030 | | | | 1,500,000 | | | | 1,820,130 | |
California Various Purposes (GO Revenue) | | | 5.00 | | | | 8-1-2032 | | | | 6,700,000 | | | | 8,066,130 | |
California Various Purposes (GO Revenue) | | | 6.00 | | | | 4-1-2038 | | | | 8,055,000 | | | | 8,491,823 | |
Cerritos CA Community College District Series D (GO Revenue) ¤ | | | 0.00 | | | | 8-1-2025 | | | | 1,800,000 | | | | 1,512,468 | |
Compton CA Community College District Election of 2002 CAB Series C (GO Revenue) ¤ | | | 0.00 | | | | 8-1-2029 | | | | 1,565,000 | | | | 1,070,147 | |
Compton CA Community College District Election of 2002 CAB Series C (GO Revenue) ¤ | | | 0.00 | | | | 8-1-2031 | | | | 2,400,000 | | | | 1,486,392 | |
Emery CA Unified School District Election of 2010 Series A (GO Revenue, AGM Insured) | | | 6.25 | | | | 8-1-2031 | | | | 4,500,000 | | | | 5,212,800 | |
Foothill De Anza CA Community College District Certificate of Participation (Miscellaneous Revenue) | | | 5.00 | | | | 4-1-2033 | | | | 500,000 | | | | 578,130 | |
Gold Coast Transit District California Transit Finance Corporation Certificate of Participation (Miscellaneous Revenue) | | | 5.00 | | | | 7-1-2027 | | | | 520,000 | | | | 638,643 | |
M-S-R California Energy Authority Gas Series B (Utilities Revenue) | | | 7.00 | | | | 11-1-2034 | | | | 2,000,000 | | | | 2,920,000 | |
M-S-R California Energy Authority Gas Series C (Utilities Revenue) | | | 7.00 | | | | 11-1-2034 | | | | 3,000,000 | | | | 4,380,000 | |
Monterey County CA Alisal Union School District Series A (GO Revenue, Build America Mutual Assurance Company Insured) | | | 5.25 | | | | 8-1-2042 | | | | 1,500,000 | | | | 1,835,070 | |
New Haven CA Unified School District CAB Project (GO Revenue, AGC Insured) ¤ | | | 0.00 | | | | 8-1-2033 | | | | 5,590,000 | | | | 3,398,608 | |
Northern California Power Agency Series A (Utilities Revenue) | | | 5.25 | | | | 8-1-2023 | | | | 5,150,000 | | | | 5,523,787 | |
Northern Humboldt CA High School District Election of 2010 Series A (GO Revenue) | | | 6.50 | | | | 8-1-2034 | | | | 1,145,000 | | | | 1,336,272 | |
Oakland CA Unified School District Alameda County Election of 2006 Series A (GO Revenue) | | | 6.50 | | | | 8-1-2020 | | | | 1,730,000 | | | | 1,862,656 | |
Oakland CA Unified School District Alameda County Election of 2009 Series A (GO Revenue) | | | 6.25 | | | | 8-1-2019 | | | | 1,285,000 | | | | 1,379,807 | |
Oakland CA Unified School District Alameda County Election of 2012 (GO Revenue) | | | 6.25 | | | | 8-1-2028 | | | | 2,000,000 | | | | 2,320,600 | |
Oakland CA Unified School District Alameda County Election of 2012 (GO Revenue) | | | 6.25 | | | | 8-1-2030 | | | | 2,000,000 | | | | 2,320,600 | |
Oxnard CA School District Series A (GO Revenue, National Insured) | | | 5.75 | | | | 8-1-2030 | | | | 1,825,000 | | | | 2,177,116 | |
Patterson CA Unified School District CAB Election of 2008 Project Series B (GO Revenue, AGM Insured) ¤ | | | 0.00 | | | | 8-1-2033 | | | | 3,000,000 | | | | 1,787,970 | |
Peralta CA Community College District Alameda County (GO Revenue) | | | 5.00 | | | | 8-1-2023 | | | | 3,045,000 | | | | 3,491,488 | |
Peralta CA Community College District Alameda County (GO Revenue) | | | 5.00 | | | | 8-1-2024 | | | | 3,000,000 | | | | 3,434,190 | |
Richmond CA Joint Powers Financing Authority Point Potrero Series A (Miscellaneous Revenue) | | | 6.25 | | | | 7-1-2024 | | | | 2,700,000 | | | | 2,878,038 | |
The accompanying notes are an integral part of these financial statements.
| | | | | | |
| Portfolio of investments—December 31, 2017 (unaudited) | | Wells Fargo Intermediate Tax/AMT-Free Fund | | | 9 | |
| | | | | | | | | | | | | | | | |
| Security name | | Interest rate | | | Maturity date | | | Principal | | | Value | |
|
| California (continued) | |
Rio Hondo CA Community College District (GO Revenue) ¤ | | | 0.00 | % | | | 8-1-2030 | | | $ | 2,315,000 | | | $ | 1,605,684 | |
Sacramento CA Airport Systems (Airport Revenue) | | | 5.00 | | | | 7-1-2025 | | | | 2,000,000 | | | | 2,160,520 | |
Sacramento CA MUD Series B (Utilities Revenue) | | | 5.00 | | | | 8-15-2030 | | | | 1,075,000 | | | | 1,253,590 | |
San Diego CA Community College District Election of 2012 (GO Revenue) | | | 5.00 | | | | 8-1-2032 | | | | 3,095,000 | | | | 3,612,948 | |
San Diego CA PFFA Capital Improvement Projects Series B (Miscellaneous Revenue) | | | 5.00 | | | | 10-15-2027 | | | | 500,000 | | | | 602,805 | |
San Diego CA PFFA Capital Improvement Projects Series B (Miscellaneous Revenue) | | | 5.00 | | | | 10-15-2028 | | | | 1,000,000 | | | | 1,199,260 | |
San Diego CA Unified School District Election of 1998 Series E-2 (GO Revenue, AGM Insured) | | | 5.50 | | | | 7-1-2027 | | | | 5,000,000 | | | | 6,511,500 | |
San Jose CA Libraries & Parks Project (GO Revenue) | | | 5.13 | | | | 9-1-2031 | | | | 6,110,000 | | | | 6,126,069 | |
San Jose CA RDA Series A-1 (Tax Revenue) | | | 5.50 | | | | 8-1-2030 | | | | 1,355,000 | | | | 1,487,695 | |
Santa Ana CA Financing Authority Police Administration and Holding Facilities Prerefunded Balance Bond (Miscellaneous Revenue, National Insured) | | | 6.25 | | | | 7-1-2019 | | | | 500,000 | | | | 534,970 | |
Santa Ana CA Financing Authority Police Administration and Holding Facilities Unrefunded Balance Bond (Miscellaneous Revenue, National Insured) | | | 6.25 | | | | 7-1-2019 | | | | 500,000 | | | | 534,275 | |
Southern California Public Power Authority Milford Wind Corridor Project #1 (Utilities Revenue) | | | 5.00 | | | | 7-1-2024 | | | | 5,000,000 | | | | 5,330,350 | |
Southern California Public Power Authority Southern Transmission Project Series S (Utilities Revenue) | | | 5.75 | | | | 7-1-2024 | | | | 2,000,000 | | | | 2,043,620 | |
Sylvan CA Unified School District CAB Election of 2006 (GO Revenue, AGM Insured) ¤ | | | 0.00 | | | | 8-1-2031 | | | | 2,590,000 | | | | 1,669,618 | |
Sylvan CA Unified School District CAB Election of 2006 (GO Revenue, AGM Insured) ¤ | | | 0.00 | | | | 8-1-2032 | | | | 2,800,000 | | | | 1,735,076 | |
Tustin CA Unified School District #88-1 Election of 2008 Series B (GO Revenue) | | | 6.00 | | | | 8-1-2036 | | | | 1,500,000 | | | | 1,727,460 | |
University of California Limited Project Prerefunded Bond Series G (Education Revenue) | | | 5.00 | | | | 5-15-2037 | | | | 5,180,000 | | | | 5,879,973 | |
University of California Limited Project Unrefunded Bond Series G (Education Revenue) | | | 5.00 | | | | 5-15-2037 | | | | 5,210,000 | | | | 5,811,755 | |
University of California General Project Unrefunded Bond Series Q (Education Revenue) | | | 5.25 | | | | 5-15-2024 | | | | 65,000 | | | | 65,830 | |
University of California Medical Center Prerefunded Bond Series J (Health Revenue) | | | 5.25 | | | | 5-15-2030 | | | | 13,135,000 | | | | 15,406,304 | |
University of California Medical Center Unrefunded Bond Series J (Health Revenue) | | | 5.25 | | | | 5-15-2030 | | | | 1,865,000 | | | | 2,182,292 | |
Washington Township CA Health Care District Series A (Health Revenue) | | | 5.00 | | | | 7-1-2018 | | | | 445,000 | | | | 451,911 | |
Washington Township CA Health Care District Series A (Health Revenue) | | | 5.00 | | | | 7-1-2019 | | | | 905,000 | | | | 944,232 | |
West Contra Costa CA Unified School District Election of 2005 Series C-1 (GO Revenue, AGC Insured) ¤ | | | 0.00 | | | | 8-1-2026 | | | | 4,620,000 | | | | 3,730,096 | |
| | | | |
| | | | | | | | | | | | | | | 209,696,961 | |
| | | | | | | | | | | | | | | | |
|
| Colorado: 0.66% | |
Adams County CO 12 Five Star Schools Series B (GO Revenue) | | | 5.00 | | | | 12-15-2028 | | | | 3,800,000 | | | | 4,656,596 | |
Adams County CO Refunding & Improvement Certificate of Participation (Miscellaneous Revenue) | | | 4.00 | | | | 12-1-2018 | | | | 500,000 | | | | 511,310 | |
Adams County CO Refunding & Improvement Certificate of Participation (Miscellaneous Revenue) | | | 5.00 | | | | 12-1-2021 | | | | 830,000 | | | | 929,525 | |
Colorado ECFA University of Denver Project (Education Revenue, National Insured) | | | 5.25 | | | | 3-1-2025 | | | | 1,110,000 | | | | 1,318,192 | |
Denver CO Convention Center Hotel Authority Refunding Bond (Industrial Development Revenue) | | | 5.00 | | | | 12-1-2023 | | | | 3,000,000 | | | | 3,495,720 | |
Regents of the University of Colorado Certificate of Participation Series 2013A (Education Revenue) | | | 5.00 | | | | 11-1-2028 | | | | 5,000,000 | | | | 5,705,850 | |
| | | | |
| | | | | | | | | | | | | | | 16,617,193 | |
| | | | | | | | | | | | | | | | |
|
| Connecticut: 3.35% | |
Connecticut HEFAR Yale University Issue Series A (Education Revenue) | | | 1.00 | | | | 7-1-2042 | | | | 25,000,000 | | | | 24,750,250 | |
Connecticut HEFAR Yale University Issue Series A (Education Revenue) | | | 1.38 | | | | 7-1-2035 | | | | 10,000,000 | | | | 9,999,700 | |
Connecticut HEFAR Yale University Issue Series A-2 (Education Revenue) | | | 2.00 | | | | 7-1-2042 | | | | 3,395,000 | | | | 3,332,294 | |
Connecticut Series A (SIFMA Municipal Swap +0.85%) (Miscellaneous Revenue) ± | | | 2.56 | | | | 3-1-2022 | | | | 3,000,000 | | | | 2,996,100 | |
The accompanying notes are an integral part of these financial statements.
| | | | |
| 10 | | Wells Fargo Intermediate Tax/AMT-Free Fund | | Portfolio of investments—December 31, 2017 (unaudited) |
| | | | | | | | | | | | | | | | |
| Security name | | Interest rate | | | Maturity date | | | Principal | | | Value | |
|
| Connecticut (continued) | |
Connecticut Series A (SIFMA Municipal Swap +1.10%) (Miscellaneous Revenue) ± | | | 2.81 | % | | | 4-15-2019 | | | $ | 2,300,000 | | | $ | 2,319,389 | |
Connecticut Series A (SIFMA Municipal Swap +1.25%) (Miscellaneous Revenue) ± | | | 2.96 | | | | 4-15-2020 | | | | 3,300,000 | | | | 3,338,247 | |
Connecticut Series A (GO Revenue) | | | 5.00 | | | | 3-1-2029 | | | | 2,500,000 | | | | 2,798,650 | |
Connecticut Series B (GO Revenue) | | | 5.00 | | | | 6-15-2027 | | | | 3,000,000 | | | | 3,458,430 | |
Connecticut Series F (GO Revenue) | | | 5.00 | | | | 11-15-2032 | | | | 300,000 | | | | 338,841 | |
Connecticut Series G (Miscellaneous Revenue) | | | 4.00 | | | | 10-15-2026 | | | | 1,985,000 | | | | 2,105,509 | |
Connecticut Special Tax Obligation Bonds Transportation Infrastructure Purposes Series A (Tax Revenue) | | | 5.00 | | | | 8-1-2028 | | | | 2,000,000 | | | | 2,311,800 | |
Connecticut Special Tax Obligation Bonds Transportation Infrastructure Purposes Series A (Tax Revenue) | | | 5.00 | | | | 8-1-2030 | | | | 1,000,000 | | | | 1,146,310 | |
Hamden CT (GO Revenue) | | | 4.00 | | | | 8-15-2020 | | | | 1,235,000 | | | | 1,296,997 | |
Hamden CT (GO Revenue) | | | 4.00 | | | | 8-15-2021 | | | | 1,235,000 | | | | 1,314,065 | |
Hamden CT (GO Revenue, AGM Insured) | | | 5.00 | | | | 8-15-2021 | | | | 1,000,000 | | | | 1,105,250 | |
Hamden CT (GO Revenue, AGM Insured) | | | 5.00 | | | | 8-15-2022 | | | | 1,000,000 | | | | 1,122,720 | |
Hamden CT Series A (GO Revenue, Build America Mutual Assurance Company Insured) | | | 5.00 | | | | 8-15-2026 | | | | 2,000,000 | | | | 2,359,900 | |
Hamden CT Series A (GO Revenue, Build America Mutual Assurance Company Insured) | | | 5.00 | | | | 8-15-2027 | | | | 1,200,000 | | | | 1,430,112 | |
Hartford CT Series A (GO Revenue, AGM Insured) | | | 5.00 | | | | 4-1-2022 | | | | 3,010,000 | | | | 3,276,927 | |
Hartford CT Series A (GO Revenue, AGM Insured) | | | 5.00 | | | | 7-1-2026 | | | | 1,000,000 | | | | 1,163,210 | |
Hartford CT Series C (GO Revenue, AGM Insured) | | | 5.00 | | | | 7-15-2022 | | | | 2,320,000 | | | | 2,538,962 | |
University of Connecticut Series A (Education Revenue) | | | 5.00 | | | | 3-15-2027 | | | | 1,000,000 | | | | 1,179,410 | |
University of Connecticut Series A (Education Revenue) | | | 5.00 | | | | 3-15-2028 | | | | 2,000,000 | | | | 2,350,720 | |
University of Connecticut Series A (Education Revenue) | | | 5.00 | | | | 3-15-2031 | | | | 5,075,000 | | | | 5,875,683 | |
| | | | |
| | | | | | | | | | | | | | | 83,909,476 | |
| | | | | | | | | | | | | | | | |
|
| Delaware: 0.08% | |
Delaware EDA Odyssey Charter School Project Series B (Education Revenue) 144A | | | 6.75 | | | | 9-1-2035 | | | | 2,000,000 | | | | 2,028,040 | |
| | | | | | | | | | | | | | | | |
|
| District of Columbia: 0.68% | |
District of Columbia Federal Highway Grant Anticipation Bonds (Miscellaneous Revenue) | | | 5.00 | | | | 12-1-2023 | | | | 1,000,000 | | | | 1,132,140 | |
District of Columbia Federal Highway Grant Anticipation Bonds (Miscellaneous Revenue) | | | 5.00 | | | | 12-1-2025 | | | | 3,520,000 | | | | 3,981,613 | |
District of Columbia Federal Highway Grant Anticipation Bonds (Miscellaneous Revenue) | | | 5.25 | | | | 12-1-2025 | | | | 2,630,000 | | | | 2,879,903 | |
District of Columbia Howard University Series A (Education Revenue) | | | 5.75 | | | | 10-1-2026 | | | | 2,510,000 | | | | 2,644,862 | |
District of Columbia Medical Association of Colleges Series B (Miscellaneous Revenue) | | | 5.00 | | | | 10-1-2024 | | | | 3,095,000 | | | | 3,390,727 | |
District of Columbia Series A (GO Revenue) | | | 5.00 | | | | 6-1-2033 | | | | 2,400,000 | | | | 2,904,816 | |
| | | | |
| | | | | | | | | | | | | | | 16,934,061 | |
| | | | | | | | | | | | | | | | |
|
| Florida: 4.00% | |
Broward County FL School Board Certificate of Participation Series A (Miscellaneous Revenue) | | | 5.00 | | | | 7-1-2024 | | | | 5,000,000 | | | | 5,852,850 | |
Cityplace Florida Community Development District Special Assessment (Miscellaneous Revenue) | | | 5.00 | | | | 5-1-2021 | | | | 2,945,000 | | | | 3,209,108 | |
Daytona Beach FL Utility System (Water & Sewer Revenue, AGM Insured) | | | 5.00 | | | | 11-1-2022 | | | | 2,205,000 | | | | 2,511,186 | |
Duval County FL School Board Certificate of Participation Series B (Miscellaneous Revenue) | | | 5.00 | | | | 7-1-2028 | | | | 2,500,000 | | | | 2,966,025 | |
The accompanying notes are an integral part of these financial statements.
| | | | | | |
| Portfolio of investments—December 31, 2017 (unaudited) | | Wells Fargo Intermediate Tax/AMT-Free Fund | | | 11 | |
| | | | | | | | | | | | | | | | |
| Security name | | Interest rate | | | Maturity date | | | Principal | | | Value | |
|
| Florida (continued) | |
Duval County FL School Board Certificate of Participation Series B (Miscellaneous Revenue) | | | 5.00 | % | | | 7-1-2029 | | | $ | 5,000,000 | | | $ | 5,916,950 | |
Florida Department of Transportation Turnpike System Series A (Transportation Revenue) | | | 5.00 | | | | 7-1-2023 | | | | 3,910,000 | | | | 4,550,654 | |
Florida Department of Transportation Turnpike System Series A (Transportation Revenue) | | | 5.00 | | | | 7-1-2025 | | | | 4,950,000 | | | | 5,986,431 | |
Florida Development Finance Corporation Renaissance Charter School Series A (Education Revenue) | | | 5.00 | | | | 9-15-2020 | | | | 1,280,000 | | | | 1,308,608 | |
Florida HEFAR (Education Revenue) | | | 4.00 | | | | 4-1-2021 | | | | 1,000,000 | | | | 1,056,680 | |
Florida Mid-Bay Bridge Authority Series A (Transportation Revenue) | | | 5.00 | | | | 10-1-2025 | | | | 1,250,000 | | | | 1,497,925 | |
Hernando County FL School Board Florida Master Lease Program Certificate of Participation Series A (Miscellaneous Revenue, AGM Insured) | | | 5.00 | | | | 7-1-2025 | | | | 2,065,000 | | | | 2,473,519 | |
Miami-Dade County FL Health Facilities Authority Nicklaus Children’s Hospital Project (Health Revenue) | | | 5.00 | | | | 8-1-2031 | | | | 500,000 | | | | 590,110 | |
Miami-Dade County FL Health Facilities Authority Nicklaus Children’s Hospital Project (Health Revenue) | | | 5.00 | | | | 8-1-2033 | | | | 1,645,000 | | | | 1,927,891 | |
Miami-Dade County FL Public Services (Tax Revenue, AGM Insured) | | | 4.00 | | | | 10-1-2019 | | | | 3,440,000 | | | | 3,575,364 | |
Miami-Dade County FL Public Services (Tax Revenue, AGM Insured) | | | 4.00 | | | | 10-1-2020 | | | | 3,600,000 | | | | 3,810,096 | |
Miami-Dade County FL Public Services (Tax Revenue, AGM Insured) | | | 4.00 | | | | 4-1-2021 | | | | 2,485,000 | | | | 2,651,619 | |
Miami-Dade County FL School Board Certificate of Participation Series A (Miscellaneous Revenue) | | | 5.00 | | | | 5-1-2031 | | | | 3,000,000 | | | | 3,538,230 | |
Miami-Dade County FL School Board Certificate of Participation Series D (Miscellaneous Revenue) | | | 5.00 | | | | 11-1-2027 | | | | 6,600,000 | | | | 7,774,602 | |
Miami-Dade County FL Special Obligation Series A (Tax Revenue) | | | 5.00 | | | | 10-1-2023 | | | | 700,000 | | | | 798,329 | |
Miami-Dade County FL Water & Sewer Refunding Bond Series C (Water & Sewer Revenue, BHAC Insured) | | | 5.00 | | | | 10-1-2024 | | | | 2,950,000 | | | | 3,026,759 | |
Miami-Dade County FL Water & Sewer Refunding Bond Series C (Water & Sewer Revenue) | | | 5.25 | | | | 10-1-2022 | | | | 3,000,000 | | | | 3,083,580 | |
Orange County FL School Board Certificate of Participation Series C (Miscellaneous Revenue) | | | 5.00 | | | | 8-1-2029 | | | | 2,000,000 | | | | 2,373,520 | |
Orlando FL Senior Tourist Development 6th Cent Contract Payment Bond Series A (Miscellaneous Revenue, AGM Insured) | | | 5.00 | | | | 11-1-2032 | | | | 2,000,000 | | | | 2,379,460 | |
Orlando FL Senior Tourist Development 6th Cent Contract Payment Bond Series A (Miscellaneous Revenue, AGM Insured) | | | 5.00 | | | | 11-1-2033 | | | | 2,500,000 | | | | 2,964,875 | |
Orlando FL Senior Tourist Development 6th Cent Contract Payment Bond Series A (Miscellaneous Revenue, AGM Insured) | | | 5.00 | | | | 11-1-2034 | | | | 2,600,000 | | | | 3,073,668 | |
Palm Beach County FL Refunding Bond (Miscellaneous Revenue) | | | 5.00 | | | | 5-1-2029 | | | | 2,000,000 | | | | 2,417,180 | |
Plantation FL Ad Valorem Bond (GO Revenue) | | | 5.00 | | | | 7-1-2031 | | | | 1,155,000 | | | | 1,407,518 | |
Putnam County FL Development Authority PCR Seminole Project Series A (Utilities Revenue, Ambac Insured) | | | 5.35 | | | | 3-15-2042 | | | | 5,260,000 | | | | 5,326,171 | |
Tampa FL Sports Authority Stadium Project (Tax Revenue) | | | 5.00 | | | | 1-1-2025 | | | | 3,395,000 | | | | 4,056,719 | |
Tender Option Bond Trust Receipts/Floater Certificates for Seminole County FL Series ZF0444 (Tax Revenue, National Insured, JPMorgan Chase & Company LIQ) ø144A | | | 1.86 | | | | 4-1-2027 | | | | 5,250,000 | | | | 5,250,000 | |
University of South Florida Financing Corporation Certificate of Participation Master Lease Program Series A (Education Revenue) | | | 5.00 | | | | 7-1-2022 | | | | 1,730,000 | | | | 1,948,049 | |
University of South Florida Financing Corporation Certificate of Participation Master Lease Program Series A (Education Revenue) | | | 5.00 | | | | 7-1-2023 | | | | 815,000 | | | | 937,503 | |
| | | | |
| | | | | | | | | | | | | | | 100,241,179 | |
| | | | | | | | | | | | | | | | |
The accompanying notes are an integral part of these financial statements.
| | | | |
| 12 | | Wells Fargo Intermediate Tax/AMT-Free Fund | | Portfolio of investments—December 31, 2017 (unaudited) |
| | | | | | | | | | | | | | | | |
| Security name | | Interest rate | | | Maturity date | | | Principal | | | Value | |
| | | | |
| Georgia: 0.88% | | | | | | | | | | | | | | | | |
Atlanta GA Urban Residential Finance Authority MFHR Wheat Street Towers Project (Housing Revenue) | | | 1.40 | % | | | 5-1-2020 | | | $ | 3,000,000 | | | $ | 2,988,660 | |
Floyd County GA PCR Georgia Power Company Plant Hammond Project (Utilities Revenue) | | | 2.35 | | | | 7-1-2022 | | | | 1,000,000 | | | | 996,330 | |
Georgia Public Gas Partners Incorporated Series A (Utilities Revenue) | | | 5.00 | | | | 10-1-2019 | | | | 5,000,000 | | | | 5,276,100 | |
Main Street Natural Gas Incorporated Georgia Gas Project Series A (Utilities Revenue) | | | 5.50 | | | | 9-15-2022 | | | | 1,000,000 | | | | 1,144,630 | |
Monroe County GA PCR Georgia Power Company Plant Scherer Project (Industrial Development Revenue) | | | 2.35 | | | | 10-1-2048 | | | | 2,000,000 | | | | 1,993,780 | |
Private Colleges & Universities Authority of Georgia Series A (Education Revenue) | | | 5.00 | | | | 10-1-2021 | | | | 3,330,000 | | | | 3,638,158 | |
Savannah GA MFHR Wessels Blackshear Home Project (Housing Revenue) | | | 1.15 | | | | 7-1-2019 | | | | 6,000,000 | | | | 5,985,180 | |
| | | | |
| | | | | | | | | | | | | | | 22,022,838 | |
| | | | | | | | | | | | | | | | |
|
| Guam: 0.29% | |
Guam Government Business Privilege Tax Bond Series A (Tax Revenue) | | | 5.00 | | | | 1-1-2020 | | | | 1,345,000 | | | | 1,417,280 | |
Guam Government Waterworks Authority (Water & Sewer Revenue) | | | 5.25 | | | | 7-1-2020 | | | | 350,000 | | | | 374,892 | |
Guam Government Waterworks Authority (Water & Sewer Revenue) | | | 5.25 | | | | 7-1-2033 | | | | 2,500,000 | | | | 2,744,300 | |
Guam International Airport Authority (Airport Revenue) | | | 5.00 | | | | 10-1-2022 | | | | 1,000,000 | | | | 1,106,950 | |
Guam International Airport Authority (Airport Revenue) | | | 5.00 | | | | 10-1-2023 | | | | 1,500,000 | | | | 1,620,915 | |
| | | | |
| | | | | | | | | | | | | | | 7,264,337 | |
| | | | | | | | | | | | | | | | |
|
| Hawaii: 0.40% | |
Honolulu HI Rail Transit Project Series H (SIFMA Municipal Swap +0.30%) (GO Revenue) ± | | | 2.01 | | | | 9-1-2022 | | | | 2,500,000 | | | | 2,500,150 | |
Honolulu HI Rail Transit Project Series H (SIFMA Municipal Swap +0.32%) (GO Revenue) ± | | | 2.03 | | | | 9-1-2025 | | | | 2,500,000 | | | | 2,500,150 | |
Honolulu HI Rail Transit Project Series H (SIFMA Municipal Swap +0.32%) (GO Revenue) ± | | | 2.03 | | | | 9-1-2028 | | | | 5,000,000 | | | | 5,000,300 | |
| | | | |
| | | | | | | | | | | | | | | 10,000,600 | |
| | | | | | | | | | | | | | | | |
|
| Illinois: 16.15% | |
Bolingbrook, Will & DuPage Counties IL Series A (GO Revenue, AGM Insured) | | | 5.00 | | | | 1-1-2023 | | | | 650,000 | | | | 732,030 | |
Champaign & Coles Counties IL Community College District #505 Series A (GO Revenue) | | | 4.00 | | | | 12-1-2018 | | | | 1,015,000 | | | | 1,035,818 | |
Chicago IL Board of Education CAB School Reform Series B-1 (GO Revenue, National Insured) ¤ | | | 0.00 | | | | 12-1-2025 | | | | 3,380,000 | | | | 2,470,814 | |
Chicago IL Board of Education CAB School Reform Series B-1 (GO Revenue, National Insured) ¤ | | | 0.00 | | | | 12-1-2026 | | | | 4,030,000 | | | | 2,816,809 | |
Chicago IL Board of Education Series A (SIFMA Municipal Swap +0.83%) (GO Revenue) ± | | | 2.54 | | | | 3-1-2036 | | | | 10,000,000 | | | | 9,964,600 | |
Chicago IL Board of Education Series C (GO Revenue) | | | 5.00 | | | | 12-1-2021 | | | | 2,500,000 | | | | 2,530,800 | |
Chicago IL Board of Education Series C (GO Revenue) | | | 5.00 | | | | 12-1-2029 | | | | 3,000,000 | | | | 3,014,730 | |
Chicago IL Board of Education Series C (GO Revenue) | | | 5.25 | | | | 12-1-2025 | | | | 5,000,000 | | | | 5,047,500 | |
Chicago IL Board of Education Series F (GO Revenue) | | | 5.00 | | | | 12-1-2020 | | | | 2,375,000 | | | | 2,478,075 | |
Chicago IL Metropolitan Pier & Exposition Authority CAB McCormick Place Expansion Project Series A (Tax Revenue, National Insured) ¤ | | | 0.00 | | | | 6-15-2029 | | | | 10,000,000 | | | | 6,339,900 | |
Chicago IL Metropolitan Pier & Exposition Authority CAB McCormick Place Expansion Project Series A (Tax Revenue, National Insured) ¤ | | | 0.00 | | | | 12-15-2029 | | | | 35,200,000 | | | | 21,800,032 | |
Chicago IL Metropolitan Pier & Exposition Authority CAB McCormick Place Expansion Project Series A (Tax Revenue, National Insured) ¤ | | | 0.00 | | | | 12-15-2030 | | | | 12,800,000 | | | | 7,529,216 | |
The accompanying notes are an integral part of these financial statements.
| | | | | | |
| Portfolio of investments—December 31, 2017 (unaudited) | | Wells Fargo Intermediate Tax/AMT-Free Fund | | | 13 | |
| | | | | | | | | | | | | | | | |
| Security name | | Interest rate | | | Maturity date | | | Principal | | | Value | |
|
| Illinois (continued) | |
Chicago IL Metropolitan Pier & Exposition Authority McCormick Place Expansion Project Series B (Tax Revenue, National Insured) | | | 5.00 | % | | | 12-15-2028 | | | $ | 1,945,000 | | | $ | 2,094,960 | |
Chicago IL Metropolitan Reclamation Series B (GO Revenue) | | | 5.00 | | | | 12-1-2025 | | | | 2,500,000 | | | | 2,801,800 | |
Chicago IL O’Hare International Airport Senior Lien (Airport Revenue, AGM Insured) | | | 5.13 | | | | 1-1-2030 | | | | 2,610,000 | | | | 2,973,182 | |
Chicago IL O’Hare International Airport Senior Lien (Airport Revenue, AGM Insured) | | | 5.13 | | | | 1-1-2031 | | | | 3,335,000 | | | | 3,792,295 | |
Chicago IL O’Hare International Airport Senior Lien (Airport Revenue) | | | 5.25 | | | | 1-1-2032 | | | | 8,755,000 | | | | 9,975,885 | |
Chicago IL O’Hare International Airport Senior Lien Series B (Airport Revenue) | | | 5.00 | | | | 1-1-2030 | | | | 8,000,000 | | | | 9,298,400 | |
Chicago IL O’Hare International Airport Third Lien Series A (Airport Revenue, AGM Insured) | | | 5.00 | | | | 1-1-2033 | | | | 1,000,000 | | | | 1,000,000 | |
Chicago IL O’Hare International Airport Third Lien Series C (Airport Revenue, AGC Insured) | | | 5.25 | | | | 1-1-2025 | | | | 4,075,000 | | | | 4,336,819 | |
Chicago IL O’Hare International Airport Third Lien Series F (Airport Revenue) | | | 4.25 | | | | 1-1-2021 | | | | 735,000 | | | | 770,420 | |
Chicago IL Park District Series A (GO Revenue) | | | 5.00 | | | | 1-1-2036 | | | | 2,250,000 | | | | 2,396,385 | |
Chicago IL Park District Series B (GO Revenue) | | | 5.00 | | | | 1-1-2021 | | | | 3,765,000 | | | | 4,064,318 | |
Chicago IL Park District Series B (GO Revenue, Build America Mutual Assurance Company Insured) | | | 5.00 | | | | 1-1-2029 | | | | 2,000,000 | | | | 2,234,700 | |
Chicago IL Park District Series C (GO Revenue) | | | 5.00 | | | | 1-1-2022 | | | | 1,515,000 | | | | 1,671,484 | |
Chicago IL Sales Tax Refunding Bond (Tax Revenue) | | | 5.00 | | | | 1-1-2025 | | | | 615,000 | | | | 655,258 | |
Chicago IL Sales Tax Refunding Bond (Tax Revenue) | | | 5.00 | | | | 1-1-2026 | | | | 5,140,000 | | | | 6,149,239 | |
Chicago IL Sales Tax Refunding Bond (Tax Revenue) | | | 5.00 | | | | 1-1-2027 | | | | 3,000,000 | | | | 3,589,050 | |
Chicago IL Sales Tax Refunding Bond (Tax Revenue) | | | 5.00 | | | | 1-1-2030 | | | | 2,075,000 | | | | 2,482,426 | |
Chicago IL Second Lien (Water & Sewer Revenue) | | | 5.00 | | | | 11-1-2022 | | | | 1,730,000 | | | | 1,942,236 | |
Chicago IL Second Lien (Water & Sewer Revenue) | | | 5.00 | | | | 11-1-2023 | | | | 1,515,000 | | | | 1,703,072 | |
Chicago IL Second Lien (Water & Sewer Revenue) | | | 5.00 | | | | 11-1-2025 | | | | 620,000 | | | | 695,156 | |
Chicago IL Second Lien (Water & Sewer Revenue) | | | 5.00 | | | | 11-1-2026 | | | | 2,000,000 | | | | 2,235,640 | |
Chicago IL Second Lien (Water & Sewer Revenue) | | | 5.00 | | | | 11-1-2028 | | | | 3,000,000 | | | | 3,328,890 | |
Chicago IL Second Lien (Water & Sewer Revenue) | | | 5.00 | | | | 11-1-2029 | | | | 1,490,000 | | | | 1,648,357 | |
Chicago IL Second Lien (Water & Sewer Revenue) | | | 5.00 | | | | 11-1-2033 | | | | 1,000,000 | | | | 1,123,270 | |
Chicago IL Series A (GO Revenue) | | | 5.00 | | | | 1-1-2025 | | | | 750,000 | | | | 821,393 | |
Chicago IL Series A (GO Revenue) | | | 5.00 | | | | 1-1-2027 | | | | 1,000,000 | | | | 1,083,290 | |
Chicago IL Series A (GO Revenue) | | | 5.25 | | | | 1-1-2022 | | | | 3,820,000 | | | | 3,827,525 | |
Chicago IL Series A (GO Revenue) | | | 5.25 | | | | 1-1-2023 | | | | 4,250,000 | | | | 4,258,245 | |
Chicago IL Series A (GO Revenue) | | | 5.25 | | | | 1-1-2028 | | | | 1,660,000 | | | | 1,662,739 | |
Chicago IL Series A (GO Revenue, Build America Mutual Assurance Company Insured) | | | 5.25 | | | | 1-1-2037 | | | | 4,510,000 | | | | 4,522,493 | |
Chicago IL Series C (GO Revenue) ¤ | | | 0.00 | | | | 1-1-2023 | | | | 2,500,000 | | | | 2,052,325 | |
Chicago IL Series C (GO Revenue) | | | 4.00 | | | | 1-1-2020 | | | | 1,505,000 | | | | 1,550,722 | |
Chicago IL Series C (GO Revenue) | | | 5.00 | | | | 1-1-2024 | | | | 3,695,000 | | | | 3,773,814 | |
Chicago IL Series C (GO Revenue) | | | 5.00 | | | | 1-1-2026 | | | | 5,000,000 | | | | 5,541,150 | |
Chicago IL Series G (GO Revenue, Ambac Insured) | | | 5.00 | | | | 12-1-2024 | | | | 15,205,000 | | | | 15,256,545 | |
Chicago IL Series J (GO Revenue, Ambac Insured) | | | 5.00 | | | | 12-1-2023 | | | | 310,000 | | | | 311,051 | |
Chicago IL Transit Authority Capital Grant Federal Transit Administration Section 5307-A (Transportation Revenue, AGC Insured) | | | 5.25 | | | | 6-1-2022 | | | | 500,000 | | | | 507,895 | |
Chicago IL Transit Authority Capital Grant Federal Transit Administration Section 5309-A (Transportation Revenue, AGC Insured) | | | 6.00 | | | | 6-1-2024 | | | | 2,000,000 | | | | 2,082,420 | |
Chicago IL Transit Authority Sales Tax Receipts (Tax Revenue) | | | 5.25 | | | | 12-1-2027 | | | | 2,600,000 | | | | 2,857,634 | |
Chicago IL Unrefunded Balance Bond (GO Revenue, AGM Insured) | | | 5.00 | | | | 1-1-2024 | | | | 35,000 | | | | 35,046 | |
Chicago IL Waste Water Transmission Second Lien (Water & Sewer Revenue) | | | 5.00 | | | | 1-1-2022 | | | | 1,340,000 | | | | 1,479,481 | |
Chicago IL Waste Water Transmission Second Lien (Water & Sewer Revenue) | | | 5.00 | | | | 1-1-2023 | | | | 1,935,000 | | | | 2,140,323 | |
Chicago IL Waste Water Transmission Second Lien (Water & Sewer Revenue) | | | 5.00 | | | | 1-1-2024 | | | | 2,000,000 | | | | 2,211,400 | |
Chicago IL Waste Water Transmission Second Lien (Water & Sewer Revenue) | | | 5.00 | | | | 1-1-2032 | | | | 1,000,000 | | | | 1,102,060 | |
The accompanying notes are an integral part of these financial statements.
| | | | |
| 14 | | Wells Fargo Intermediate Tax/AMT-Free Fund | | Portfolio of investments—December 31, 2017 (unaudited) |
| | | | | | | | | | | | | | | | |
| Security name | | Interest rate | | | Maturity date | | | Principal | | | Value | |
|
| Illinois (continued) | |
Chicago IL Waste Water Transmission Second Lien (Water & Sewer Revenue) | | | 5.00 | % | | | 1-1-2033 | | | $ | 1,000,000 | | | $ | 1,098,050 | |
Chicago IL Waste Water Transmission Second Lien (Water & Sewer Revenue) | | | 5.00 | | | | 1-1-2034 | | | | 1,000,000 | | | | 1,095,760 | |
Cook County IL Community College District #508 (GO Revenue) | | | 5.25 | | | | 12-1-2025 | | | | 1,250,000 | | | | 1,385,563 | |
Cook County IL Community College District #508 (GO Revenue) | | | 5.25 | | | | 12-1-2027 | | | | 1,295,000 | | | | 1,417,196 | |
Cook County IL Community College District #508 (GO Revenue) | | | 5.25 | | | | 12-1-2028 | | | | 1,250,000 | | | | 1,363,063 | |
Cook County IL Community College District #508 (GO Revenue) | | | 5.25 | | | | 12-1-2030 | | | | 3,000,000 | | | | 3,244,770 | |
Cook County IL Community College District #508 (GO Revenue) | | | 5.25 | | | | 12-1-2031 | | | | 3,200,000 | | | | 3,450,496 | |
Cook County IL Sales Tax Bond (Tax Revenue) | | | 5.00 | | | | 11-15-2033 | | | | 4,000,000 | | | | 4,765,360 | |
Cook County IL Series A (GO Revenue) | | | 5.25 | | | | 11-15-2022 | | | | 7,240,000 | | | | 7,868,939 | |
Cook County IL Series A (GO Revenue) | | | 5.25 | | | | 11-15-2023 | | | | 7,680,000 | | | | 8,349,466 | |
Cook County IL Series A (GO Revenue) | | | 5.25 | | | | 11-15-2024 | | | | 2,200,000 | | | | 2,432,716 | |
Cook County IL Series B (GO Revenue) | | | 5.00 | | | | 11-15-2023 | | | | 600,000 | | | | 685,584 | |
Cook County IL Series C (GO Revenue) | | | 5.00 | | | | 11-15-2021 | | | | 1,460,000 | | | | 1,616,424 | |
Cook County IL Series C (GO Revenue) | | | 5.00 | | | | 11-15-2024 | | | | 2,175,000 | | | | 2,426,865 | |
Cook County IL Series C (GO Revenue) | | | 5.00 | | | | 11-15-2025 | | | | 2,450,000 | | | | 2,719,451 | |
DuPage, Cook & Will Counties IL Community College District #502 Series A (GO Revenue) | | | 5.00 | | | | 6-1-2022 | | | | 2,650,000 | | | | 2,972,108 | |
Homer, Glen, Will & Cook Village Counties IL Series A (GO Revenue) | | | 4.00 | | | | 12-1-2019 | | | | 1,000,000 | | | | 1,040,560 | |
Homer, Glen, Will & Cook Village Counties IL Series A (GO Revenue) | | | 5.00 | | | | 12-1-2021 | | | | 1,015,000 | | | | 1,072,195 | |
Illinois Finance Authority Ann & Robert H. Laurie Children’s Hospital Project of Chicago (Health Revenue) | | | 5.00 | | | | 8-15-2034 | | | | 1,000,000 | | | | 1,175,320 | |
Illinois Finance Authority Bradley University Project Series C (Education Revenue) | | | 5.00 | | | | 8-1-2032 | | | | 1,250,000 | | | | 1,441,000 | |
Illinois Finance Authority Edward Elmhurst Healthcare Series A (Health Revenue) | | | 5.00 | | | | 1-1-2026 | | | | 1,000,000 | | | | 1,149,090 | |
Illinois Finance Authority Student Housing Illinois State University Project (Education Revenue) | | | 5.50 | | | | 4-1-2021 | | | | 3,420,000 | | | | 3,556,458 | |
Illinois Finance Authority Wesleyan University (Education Revenue) | | | 5.00 | | | | 9-1-2026 | | | | 680,000 | | | | 798,320 | |
Illinois Housing Development Authority Multifamily Housing University Village Apartments Series B (Housing Revenue) | | | 1.33 | | | | 2-1-2020 | | | | 5,000,000 | | | | 4,994,300 | |
Illinois Junior Obligation (Tax Revenue) | | | 5.00 | | | | 6-15-2025 | | | | 6,000,000 | | | | 6,785,880 | |
Illinois Regional Transportation Authority (Tax Revenue, AGM Insured) | | | 5.75 | | | | 6-1-2018 | | | | 6,790,000 | | | | 6,906,856 | |
Illinois Regional Transportation Authority (Tax Revenue, National Insured) | | | 6.50 | | | | 7-1-2026 | | | | 7,815,000 | | | | 9,980,849 | |
Illinois Sales Tax Revenue Build Illinois Bond (Tax Revenue) | | | 5.00 | | | | 6-15-2029 | | | | 1,000,000 | | | | 1,087,660 | |
Illinois Sports Facilities Authority (Tax Revenue, AGM Insured) | | | 5.25 | | | | 6-15-2030 | | | | 4,000,000 | | | | 4,481,840 | |
Illinois Sports Facilities Authority State Tax Supported Refunding Bonds (Tax Revenue, AGM Insured) | | | 5.00 | | | | 6-15-2028 | | | | 2,500,000 | | | | 2,778,800 | |
Illinois Sports Facilities Authority State Tax Supported Refunding Bonds (Tax Revenue, AGM Insured) | | | 5.25 | | | | 6-15-2032 | | | | 3,000,000 | | | | 3,339,180 | |
Illinois State (GO Revenue) | | | 4.75 | | | | 4-1-2020 | | | | 2,650,000 | | | | 2,665,476 | |
Illinois State (GO Revenue, AGM Insured) | | | 5.00 | | | | 1-1-2023 | | | | 2,450,000 | | | | 2,588,058 | |
Illinois State (GO Revenue, AGM Insured) | | | 5.00 | | | | 4-1-2026 | | | | 5,000,000 | | | | 5,638,200 | |
Illinois State (Miscellaneous Revenue) | | | 5.00 | | | | 7-1-2023 | | | | 5,065,000 | | | | 5,439,152 | |
Illinois State (Miscellaneous Revenue) | | | 5.00 | | | | 8-1-2024 | | | | 1,000,000 | | | | 1,059,870 | |
Illinois State (Miscellaneous Revenue) | | | 5.50 | | | | 7-1-2026 | | | | 2,300,000 | | | | 2,534,163 | |
Illinois State (Tax Revenue) | | | 5.00 | | | | 6-15-2018 | | | | 825,000 | | | | 836,806 | |
Illinois State (Tax Revenue) | | | 5.00 | | | | 6-15-2023 | | | | 16,150,000 | | | | 18,487,067 | |
Illinois State Series A (GO Revenue) | | | 5.00 | | | | 4-1-2023 | | | | 4,500,000 | | | | 4,820,625 | |
Illinois State Series A (GO Revenue, AGM Insured) | | | 5.00 | | | | 4-1-2024 | | | | 2,500,000 | | | | 2,798,800 | |
Illinois State Series A (Tax Revenue) | | | 5.00 | | | | 1-1-2027 | | | | 10,625,000 | | | | 11,149,663 | |
Illinois State Series B (Tax Revenue) | | | 5.00 | | | | 6-15-2018 | | | | 175,000 | | | | 177,751 | |
Illinois Toll Highway Authority Series A-1 (Transportation Revenue) | | | 5.25 | | | | 1-1-2026 | | | | 3,500,000 | | | | 3,749,060 | |
Kane, Cook & DuPage Counties IL School District #46 Prerefunded Balance Bond Series B (GO Revenue) | | | 4.50 | | | | 1-1-2024 | | | | 1,170,000 | | | | 1,290,276 | |
Kane, Cook & DuPage Counties IL School District #46 Unrefunded Balance Bond Series B (GO Revenue) | | | 4.50 | | | | 1-1-2024 | | | | 3,100,000 | | | | 3,388,610 | |
The accompanying notes are an integral part of these financial statements.
| | | | | | |
| Portfolio of investments—December 31, 2017 (unaudited) | | Wells Fargo Intermediate Tax/AMT-Free Fund | | | 15 | |
| | | | | | | | | | | | | | | | |
| Security name | | Interest rate | | | Maturity date | | | Principal | | | Value | |
|
| Illinois (continued) | |
Kendall, Kane & Will Counties IL Unified School District Series A (GO Revenue) | | | 5.00 | % | | | 2-1-2023 | | | $ | 1,000,000 | | | $ | 1,087,850 | |
McHenry & Kane Counties IL Community Consolidated School District #158 (GO Revenue) | | | 5.63 | | | | 1-15-2031 | | | | 2,000,000 | | | | 2,222,120 | |
McHenry & Lake Counties IL Community Consolidated School District #26 (GO Revenue, AGM Insured) | | | 5.00 | | | | 2-1-2020 | | | | 1,455,000 | | | | 1,538,793 | |
Northern IIlinois Municipal Power Agency Prairie State Project Series A (Utilities Revenue, National Insured) | | | 5.00 | | | | 1-1-2021 | | | | 2,740,000 | | | | 2,740,000 | |
Northern Illinois University Board of Trustees Auxiliary Facilities (Education Revenue, AGM Insured) | | | 5.00 | | | | 4-1-2019 | | | | 1,000,000 | | | | 1,029,910 | |
Northern Illinois University Board of Trustees Certificate of Participation (Education Revenue, AGM Insured) | | | 5.00 | | | | 9-1-2022 | | | | 1,325,000 | | | | 1,440,620 | |
Northern Illinois University Board of Trustees Certificate of Participation (Education Revenue, AGM Insured) | | | 5.00 | | | | 9-1-2024 | | | | 1,000,000 | | | | 1,112,240 | |
Peoria IL Metropolitan Airport Authority Series D (Airport Revenue) | | | 5.00 | | | | 12-1-2027 | | | | 2,250,000 | | | | 2,730,848 | |
Peoria IL Public Building Commission Illinois School District Facilities Refunding Bond (Miscellaneous Revenue, Build America Mutual Assurance Company Insured) | | | 5.00 | | | | 12-1-2023 | | | | 4,040,000 | | | | 4,666,160 | |
Peoria IL Public Building Commission Illinois School District Facilities Refunding Bond (Miscellaneous Revenue, Build America Mutual Assurance Company Insured) | | | 5.00 | | | | 12-1-2024 | | | | 1,000,000 | | | | 1,173,690 | |
Railsplitter IL Tobacco Settlement Authority (Tobacco Revenue) | | | 5.00 | | | | 6-1-2024 | | | | 3,000,000 | | | | 3,411,210 | |
Southwestern Illinois Development Authority Local Government Program Collinsville Limited (Tax Revenue) | | | 5.00 | | | | 3-1-2025 | | | | 1,920,000 | | | | 1,331,482 | |
Springfield IL (GO Revenue) | | | 5.00 | | | | 12-1-2021 | | | | 850,000 | | | | 932,348 | |
Springfield IL (GO Revenue) | | | 5.00 | | | | 12-1-2023 | | | | 570,000 | | | | 647,172 | |
Tazewell County IL School District #51 (GO Revenue, National Insured) | | | 9.00 | | | | 12-1-2018 | | | | 535,000 | | | | 570,299 | |
University of Illinois Auxiliary Facilities Systems (Education Revenue) ¤ | | | 0.00 | | | | 4-1-2020 | | | | 8,270,000 | | | | 7,778,266 | |
University of Illinois Board of Trustees Unrefunded Bond Certificate of Participation Series B (Miscellaneous Revenue, AGM Insured) | | | 5.00 | | | | 10-1-2020 | | | | 955,000 | | | | 958,056 | |
Will County IL Community Unified School District CAB (GO Revenue, National Insured) ¤ | | | 0.00 | | | | 11-1-2018 | | | | 9,730,000 | | | | 9,575,780 | |
| | | | |
| | | | | | | | | | | | | | | 404,851,657 | |
| | | | | | | | | | | | | | | | |
|
| Indiana: 2.16% | |
Indiana Bond Bank Special Program Series A (Miscellaneous Revenue, AGM Insured) | | | 5.00 | | | | 9-1-2022 | | | | 1,545,000 | | | | 1,723,247 | |
Indiana Finance Authority Clean Water Act Project Series A (Water & Sewer Revenue) | | | 5.00 | | | | 10-1-2031 | | | | 1,035,000 | | | | 1,214,272 | |
Indiana Finance Authority Duke Energy Indiana Incorporated Series A-4 (Industrial Development Revenue, Sumitomo Mitsui Banking LOC) ø | | | 1.72 | | | | 12-1-2039 | | | | 13,900,000 | | | | 13,900,000 | |
Indiana Finance Authority Parkview Health Project Prerefunded Bond (Health Revenue) | | | 5.50 | | | | 5-1-2024 | | | | 3,690,000 | | | | 3,873,245 | |
Indiana Finance Authority Parkview Health Project Unrefunded Bond (Health Revenue) | | | 5.50 | | | | 5-1-2024 | | | | 810,000 | | | | 852,962 | |
Indiana Finance Authority Stadium Project Series A (Miscellaneous Revenue) | | | 5.25 | | | | 2-1-2028 | | | | 2,000,000 | | | | 2,417,380 | |
Indiana Finance Authority State Revolving Fund Program Series C (Miscellaneous Revenue) | | | 5.00 | | | | 2-1-2029 | | | | 7,275,000 | | | | 9,182,141 | |
Indiana Finance Authority Wastewater Utilities CWA Authority Project Series A (Water & Sewer Revenue) | | | 5.00 | | | | 10-1-2030 | | | | 2,315,000 | | | | 2,722,324 | |
Indiana HFFA Ascension Health Subordinated Credit Group Series A-3 (Health Revenue) | | | 1.35 | | | | 11-1-2027 | | | | 2,755,000 | | | | 2,715,548 | |
Indianapolis IN Local Public Improvement Bond Bank Series E (Miscellaneous Revenue) | | | 5.00 | | | | 1-1-2027 | | | | 760,000 | | | | 930,818 | |
The accompanying notes are an integral part of these financial statements.
| | | | |
| 16 | | Wells Fargo Intermediate Tax/AMT-Free Fund | | Portfolio of investments—December 31, 2017 (unaudited) |
| | | | | | | | | | | | | | | | |
| Security name | | Interest rate | | | Maturity date | | | Principal | | | Value | |
|
| Indiana (continued) | |
Indianapolis IN Local Public Improvement Bond Bank Series E (Miscellaneous Revenue) | | | 5.00 | % | | | 1-1-2028 | | | $ | 1,000,000 | | | $ | 1,218,970 | |
Indianapolis IN Local Public Improvement Bond Bank Series E (Miscellaneous Revenue) | | | 5.00 | | | | 1-1-2029 | | | | 735,000 | | | | 890,511 | |
Indianapolis IN Local Public Improvement Bond Bank Series E (Miscellaneous Revenue) | | | 5.00 | | | | 1-1-2030 | | | | 1,375,000 | | | | 1,658,058 | |
Indianapolis IN Local Public Improvement Bond Bank Series E (Miscellaneous Revenue) | | | 5.00 | | | | 1-1-2031 | | | | 1,000,000 | | | | 1,199,370 | |
Indianapolis IN Local Public Improvement Bond Bank Series E (Miscellaneous Revenue) | | | 5.00 | | | | 1-1-2033 | | | | 1,545,000 | | | | 1,840,574 | |
Indianapolis IN Local Public Improvement Bond Bank Series E (Miscellaneous Revenue) | | | 5.00 | | | | 1-1-2034 | | | | 2,000,000 | | | | 2,374,620 | |
Knox County IN EDA Series A (Health Revenue) | | | 5.00 | | | | 4-1-2022 | | | | 925,000 | | | | 1,000,859 | |
Knox County IN EDA Series A (Health Revenue) | | | 5.00 | | | | 4-1-2023 | | | | 665,000 | | | | 723,972 | |
Knox County IN EDA Series A (Health Revenue) | | | 5.00 | | | | 4-1-2026 | | | | 750,000 | | | | 810,263 | |
Mount Vernon IN School Building Corporation Prerefunded Balance Bond First Mortgage (Miscellaneous Revenue, AGM Insured) | | | 5.00 | | | | 7-15-2019 | | | | 265,000 | | | | 265,318 | |
Mount Vernon IN School Building Corporation Unrefunded Balance Bond First Mortgage (Miscellaneous Revenue, AGM Insured) | | | 5.00 | | | | 7-15-2019 | | | | 735,000 | | | | 735,882 | |
University of Southern Indiana Student Fee Series J (Education Revenue, AGC Insured) | | | 5.00 | | | | 10-1-2019 | | | | 1,000,000 | | | | 1,055,570 | |
Valparaiso IN Multi-Schools Building Corporation (Miscellaneous Revenue) | | | 5.00 | | | | 7-15-2024 | | | | 750,000 | | | | 878,633 | |
| | | | |
| | | | | | | | | | | | | | | 54,184,537 | |
| | | | | | | | | | | | | | | | |
|
| Iowa: 0.60% | |
Altoona IA Annual Appropriation Urban Renewal Refunding Bond (GO Revenue) | | | 5.00 | | | | 6-1-2027 | | | | 2,310,000 | | | | 2,724,460 | |
Iowa Higher Education Loan Authority Private College Facility RAN (Education Revenue) | | | 1.00 | | | | 9-1-2018 | | | | 7,000,000 | | | | 6,958,840 | |
Iowa Student Loan Liquidity Corporation Series 1 (Education Revenue) | | | 5.25 | | | | 12-1-2018 | | | | 5,285,000 | | | | 5,442,599 | |
| | | | |
| | | | | | | | | | | | | | | 15,125,899 | |
| | | | | | | | | | | | | | | | |
|
| Kansas: 0.24% | |
Kansas Development Finance Authority Agro-Defense Facility Series G (Miscellaneous Revenue) | | | 5.00 | | | | 4-1-2030 | | | | 2,650,000 | | | | 3,012,732 | |
Kansas Development Finance Authority Health Facilities Series F (Health Revenue) | | | 5.00 | | | | 11-15-2021 | | | | 1,300,000 | | | | 1,449,968 | |
Wyandotte County & Kansas City KS Special Obligation Vacation Village Project Area 4 Major Multi-Sport Athletic Complex Project CAB Series 2015 (Tax Revenue) 144A¤ | | | 0.00 | | | | 9-1-2034 | | | | 3,980,000 | | | | 1,446,053 | |
| | | | |
| | | | | | | | | | | | | | | 5,908,753 | |
| | | | | | | | | | | | | | | | |
|
| Kentucky: 0.45% | |
Kentucky EDFA Series B2 (1 Month LIBOR +0.90%) (Health Revenue) ± | | | 1.83 | | | | 2-1-2046 | | | | 1,250,000 | | | | 1,243,250 | |
Kentucky Public Transportation Infrastructure Authority Downtown Crossing Project CAB Series B (Transportation Revenue) ¤ | | | 0.00 | | | | 7-1-2020 | | | | 1,000,000 | | | | 936,670 | |
Kentucky Public Transportation Infrastructure Authority Downtown Crossing Project CAB Series B (Transportation Revenue) ¤ | | | 0.00 | | | | 7-1-2021 | | | | 2,750,000 | | | | 2,496,230 | |
Kentucky Public Transportation Infrastructure Authority Downtown Crossing Project CAB Series B (Transportation Revenue) ¤ | | | 0.00 | | | | 7-1-2022 | | | | 4,320,000 | | | | 3,790,584 | |
Kentucky Public Transportation Infrastructure Authority Downtown Crossing Project CAB Series B (Transportation Revenue) ¤ | | | 0.00 | | | | 7-1-2025 | | | | 1,020,000 | | | | 759,053 | |
Kentucky Public Transportation Infrastructure Authority Downtown Crossing Project CAB Series B (Transportation Revenue) ¤ | | | 0.00 | | | | 7-1-2029 | | | | 1,400,000 | | | | 879,382 | |
The accompanying notes are an integral part of these financial statements.
| | | | | | |
| Portfolio of investments—December 31, 2017 (unaudited) | | Wells Fargo Intermediate Tax/AMT-Free Fund | | | 17 | |
| | | | | | | | | | | | | | | | |
| Security name | | Interest rate | | | Maturity date | | | Principal | | | Value | |
|
| Kentucky (continued) | |
University of Kentucky Certificate of Participation Master Street Lease #4 (Miscellaneous Revenue) | | | 4.45 | % | | | 6-18-2018 | | | $ | 1,245,734 | | | $ | 1,259,175 | |
| | | | |
| | | | | | | | | | | | | | | 11,364,344 | |
| | | | | | | | | | | | | | | | |
|
| Louisiana: 1.53% | |
Greater New Orleans LA Expressway Commission Toll Subordinate Lien Bond (Transportation Revenue, AGM Insured) | | | 5.00 | | | | 11-1-2031 | | | | 1,000,000 | | | | 1,192,380 | |
Greater New Orleans LA Expressway Commission Toll Subordinate Lien Bond (Transportation Revenue, AGM Insured) | | | 5.00 | | | | 11-1-2032 | | | | 1,000,000 | | | | 1,188,440 | |
Greater New Orleans LA Expressway Commission Toll Subordinate Lien Bond (Transportation Revenue, AGM Insured) | | | 5.00 | | | | 11-1-2033 | | | | 1,000,000 | | | | 1,185,290 | |
Jefferson LA Sales Tax District Series B (Tax Revenue, AGM Insured) | | | 5.00 | | | | 12-1-2031 | | | | 1,000,000 | | | | 1,197,850 | |
Jefferson LA Sales Tax District Series B (Tax Revenue, AGM Insured) | | | 5.00 | | | | 12-1-2032 | | | | 1,000,000 | | | | 1,194,010 | |
Lafayette LA Communications System (Miscellaneous Revenue, AGM Insured) | | | 5.00 | | | | 11-1-2025 | | | | 1,500,000 | | | | 1,767,390 | |
Louisiana Correctional Facilities Corporation (Miscellaneous Revenue, Ambac Insured) | | | 5.00 | | | | 9-1-2019 | | | | 1,000,000 | | | | 1,053,130 | |
Louisiana Local Government Environmental Facilities & CDA East Baton Rouge Series A (Water & Sewer Revenue) | | | 5.00 | | | | 2-1-2030 | | | | 1,000,000 | | | | 1,154,150 | |
Louisiana Local Government Environmental Facilities and Community Development (Miscellaneous Revenue, Build America Mutual Assurance Company Insured) | | | 5.00 | | | | 10-1-2028 | | | | 1,500,000 | | | | 1,841,850 | |
Louisiana Public Facilities Authority Archdiocese of New Orleans Project (Miscellaneous Revenue) | | | 5.00 | | | | 7-1-2024 | | | | 1,000,000 | | | | 1,158,100 | |
Louisiana Public Facilities Authority Archdiocese of New Orleans Project (Miscellaneous Revenue) | | | 5.00 | | | | 7-1-2025 | | | | 600,000 | | | | 697,482 | |
Louisiana Public Facilities Authority Archdiocese of New Orleans Project (Miscellaneous Revenue) | | | 5.00 | | | | 7-1-2026 | | | | 500,000 | | | | 584,290 | |
Louisiana Public Facilities Authority Loyola University Project (Education Revenue) ¤ | | | 0.00 | | | | 10-1-2027 | | | | 3,380,000 | | | | 2,855,018 | |
Louisiana Public Facilities Authority Loyola University Project (Education Revenue) ¤ | | | 0.00 | | | | 10-1-2028 | | | | 2,500,000 | | | | 2,120,825 | |
Louisiana Unclaimed Property Special Bond 1-49 South Project (Miscellaneous Revenue) | | | 5.00 | | | | 9-1-2026 | | | | 2,000,000 | | | | 2,358,800 | |
Louisiana Unclaimed Property Special Bond 1-49 South Project (Miscellaneous Revenue) | | | 5.00 | | | | 9-1-2027 | | | | 2,700,000 | | | | 3,165,831 | |
Louisiana Unclaimed Property Special Bond 1-49 South Project (Miscellaneous Revenue) | | | 5.00 | | | | 9-1-2028 | | | | 2,405,000 | | | | 2,808,968 | |
Louisiana Unclaimed Property Special Bond 1-49 South Project (Miscellaneous Revenue) | | | 5.00 | | | | 9-1-2029 | | | | 2,695,000 | | | | 3,135,471 | |
Louisiana Unclaimed Property Special Bond 1-49 South Project (Miscellaneous Revenue) | | | 5.00 | | | | 9-1-2030 | | | | 2,700,000 | | | | 3,129,111 | |
New Orleans LA Aviation Board North Terminal Project Series A (Airport Revenue) | | | 5.00 | | | | 1-1-2033 | | | | 750,000 | | | | 888,908 | |
St. Bernard Parish LA Sales Tax Refunding Bond (Tax Revenue) | | | 4.00 | | | | 3-1-2023 | | | | 3,405,000 | | | | 3,676,481 | |
| | | | |
| | | | | | | | | | | | | | | 38,353,775 | |
| | | | | | | | | | | | | | | | |
|
| Maine: 0.24% | |
Maine Health and HEFAR University of New England Issue Series A (Education Revenue) | | | 5.00 | | | | 7-1-2029 | | | | 1,015,000 | | | | 1,209,373 | |
Maine Health and HEFAR University of New England Issue Series A (Education Revenue) | | | 5.00 | | | | 7-1-2030 | | | | 1,200,000 | | | | 1,423,164 | |
Maine Health and HEFAR University of New England Issue Series A (Education Revenue) | | | 5.00 | | | | 7-1-2032 | | | | 1,415,000 | | | | 1,666,502 | |
The accompanying notes are an integral part of these financial statements.
| | | | |
| 18 | | Wells Fargo Intermediate Tax/AMT-Free Fund | | Portfolio of investments—December 31, 2017 (unaudited) |
| | | | | | | | | | | | | | | | |
| Security name | | Interest rate | | | Maturity date | | | Principal | | | Value | |
|
| Maine (continued) | |
Maine Health and HEFAR University of New England Issue Series A (Education Revenue) | | | 5.00 | % | | | 7-1-2033 | | | $ | 1,485,000 | | | $ | 1,740,851 | |
| | | | |
| | | | | | | | | | | | | | | 6,039,890 | |
| | | | | | | | | | | | | | | | |
|
| Maryland: 1.65% | |
Howard County MD Downtown Columbia Project Series A (Tax Revenue) 144A | | | 4.00 | | | | 2-15-2028 | | | | 500,000 | | | | 519,310 | |
Howard County MD Downtown Columbia Project Series A (Tax Revenue) 144A | | | 4.13 | | | | 2-15-2034 | | | | 1,000,000 | | | | 1,017,580 | |
Maryland CDA Local Government Infrastructure Bond Series A-2 (Miscellaneous Revenue) | | | 2.00 | | | | 6-1-2022 | | | | 460,000 | | | | 458,648 | |
Maryland CDA Waverly View Apartments Series G (Housing Revenue) | | | 1.15 | | | | 2-1-2019 | | | | 5,000,000 | | | | 4,965,550 | |
Maryland Department of Housing & Community Development Calvin Mowbray & Stephen Camper Park Project Series E (Housing Revenue) 144A | | | 1.35 | | | | 1-1-2019 | | | | 5,000,000 | | | | 4,964,550 | |
Maryland Economic Development Corporation Salisbury University Project (Education Revenue) | | | 5.00 | | | | 6-1-2027 | | | | 500,000 | | | | 545,985 | |
Maryland Series B (GO Revenue) | | | 4.00 | | | | 8-1-2023 | | | | 5,000,000 | | | | 5,595,300 | |
Maryland Series B (GO Revenue) | | | 4.00 | | | | 8-1-2024 | | | | 15,000,000 | | | | 17,038,350 | |
Maryland Series C (GO Revenue) | | | 5.00 | | | | 8-1-2022 | | | | 2,975,000 | | | | 3,404,174 | |
Westminster MD Educational Facilities McDaniel College (Education Revenue) | | | 5.00 | | | | 11-1-2026 | | | | 2,450,000 | | | | 2,815,148 | |
| | | | |
| | | | | | | | | | | | | | | 41,324,595 | |
| | | | | | | | | | | | | | | | |
|
| Massachusetts: 1.61% | |
Boston MA Series A (GO Revenue) | | | 5.00 | | | | 4-1-2026 | | | | 5,790,000 | | | | 7,029,813 | |
Massachusetts Consolidated Loan Series D (Miscellaneous Revenue) | | | 1.05 | | | | 8-1-2043 | | | | 10,000,000 | | | | 9,819,600 | |
Massachusetts Consolidated Loan Series D (GO Revenue) | | | 5.00 | | | | 9-1-2028 | | | | 10,000,000 | | | | 12,049,900 | |
Massachusetts Consolidated Loan Series I (Miscellaneous Revenue) | | | 5.00 | | | | 12-1-2030 | | | | 2,570,000 | | | | 3,137,739 | |
Massachusetts Development Finance Agency Lasell College (Education Revenue) | | | 5.00 | | | | 7-1-2021 | | | | 2,315,000 | | | | 2,500,246 | |
Massachusetts Development Finance Agency Merrimack College Series A (Education Revenue) | | | 5.00 | | | | 7-1-2021 | | | | 1,035,000 | | | | 1,137,827 | |
Massachusetts Development Finance Agency Sabis International Charter Series A (Education Revenue) | | | 6.55 | | | | 4-15-2020 | | | | 615,000 | | | | 667,607 | |
Massachusetts Educational Financing Authority Issue I (Education Revenue) | | | 5.50 | | | | 1-1-2018 | | | | 2,000,000 | | | | 2,000,000 | |
Massachusetts HEFA Harvard University Series A (Education Revenue) | | | 5.00 | | | | 12-15-2029 | | | | 1,890,000 | | | | 2,013,625 | |
| | | | |
| | | | | | | | | | | | | | | 40,356,357 | |
| | | | | | | | | | | | | | | | |
|
| Michigan: 3.40% | |
Eaton Rapids MI Public Schools (GO Revenue, Qualified School Board Loan Fund Insured) | | | 5.00 | | | | 5-1-2022 | | | | 1,785,000 | | | | 2,015,390 | |
Flint MI International Academy (Education Revenue) | | | 5.38 | | | | 10-1-2022 | | | | 2,270,000 | | | | 2,271,090 | |
Flint MI International Academy (Education Revenue) | | | 5.50 | | | | 10-1-2027 | | | | 1,985,000 | | | | 1,985,457 | |
Great Lakes MI Water Authority Sewage Disposal System Series C (Water & Sewer Revenue) | | | 5.00 | | | | 7-1-2030 | | | | 3,350,000 | | | | 3,862,684 | |
Hazel Park MI School District (GO Revenue, AGM/Qualified School Board Loan Fund Insured) | | | 5.00 | | | | 5-1-2020 | | | | 1,160,000 | | | | 1,246,698 | |
Kent County MI (GO Revenue) | | | 5.00 | | | | 1-1-2025 | | | | 1,000,000 | | | | 1,033,610 | |
Kent County MI Limited Tax Capital Improvement Bond (GO Revenue) | | | 5.00 | | | | 6-1-2030 | | | | 1,040,000 | | | | 1,258,036 | |
Macomb MI Interceptor Drainage (Miscellaneous Revenue) | | | 5.00 | | | | 5-1-2024 | | | | 1,750,000 | | | | 1,874,163 | |
Macomb MI Interceptor Drainage (Miscellaneous Revenue) | | | 5.00 | | | | 5-1-2025 | | | | 1,750,000 | | | | 1,873,323 | |
Macomb MI Interceptor Drainage (Miscellaneous Revenue) | | | 5.00 | | | | 5-1-2026 | | | | 1,930,000 | | | | 2,065,563 | |
Michigan Finance Authority (Health Revenue) | | | 5.00 | | | | 11-15-2023 | | | | 400,000 | | | | 456,584 | |
The accompanying notes are an integral part of these financial statements.
| | | | | | |
| Portfolio of investments—December 31, 2017 (unaudited) | | Wells Fargo Intermediate Tax/AMT-Free Fund | | | 19 | |
| | | | | | | | | | | | | | | | |
| Security name | | Interest rate | | | Maturity date | | | Principal | | | Value | |
|
| Michigan (continued) | |
Michigan Finance Authority (Health Revenue) | | | 5.00 | % | | | 11-15-2026 | | | $ | 800,000 | | | $ | 905,568 | |
Michigan Finance Authority Limited Obligation Public School Academy Cesar Chavez Academy Project (Education Revenue) | | | 5.00 | | | | 2-1-2022 | | | | 2,080,000 | | | | 2,121,475 | |
Michigan Finance Authority Local Government Loan Program Series D (Water & Sewer Revenue, National Insured) | | | 5.00 | | | | 7-1-2025 | | | | 1,000,000 | | | | 1,160,700 | |
Michigan Finance Authority Local Government Loan Program Series D (Water & Sewer Revenue) | | | 5.00 | | | | 7-1-2030 | | | | 12,000,000 | | | | 13,580,520 | |
Michigan Finance Authority Local Government Loan Program Series D (Water & Sewer Revenue, AGM Insured) | | | 5.00 | | | | 7-1-2035 | | | | 2,750,000 | | | | 3,112,203 | |
Michigan Finance Authority Local Government Loan Program Series D (Water & Sewer Revenue, AGM Insured) | | | 5.00 | | | | 7-1-2037 | | | | 2,000,000 | | | | 2,257,080 | |
Michigan Finance Authority Local Government Loan Program Series F (Tax Revenue) | | | 4.00 | | | | 10-1-2024 | | | | 3,000,000 | | | | 3,125,940 | |
Michigan Grant Anticipation Refunding Bond (Miscellaneous Revenue) | | | 5.00 | | | | 3-15-2025 | | | | 3,000,000 | | | | 3,569,610 | |
Michigan Hospital Finance Authority Ascension Health Senior Credit Group Series F-2 (Health Revenue) | | | 1.90 | | | | 11-15-2047 | | | | 6,570,000 | | | | 6,549,370 | |
Michigan Municipal Bond Authority Local Government Loan Program Series B Group A (Miscellaneous Revenue, Ambac Insured) | | | 5.00 | | | | 12-1-2018 | | | | 1,075,000 | | | | 1,076,731 | |
Michigan Public Educational Facilities Authority Limited Obligation Chandler Park Academy (Miscellaneous Revenue) | | | 5.60 | | | | 11-1-2018 | | | | 215,000 | | | | 215,224 | |
Michigan Strategic Fund Limited Obligation Cadillac Place Office Building Project (Miscellaneous Revenue) | | | 5.25 | | | | 10-15-2025 | | | | 4,165,000 | | | | 4,683,251 | |
Michigan Strategic Fund Limited Obligation Events Center Project Series A (Tax Revenue) | | | 4.13 | | | | 7-1-2045 | | | | 11,500,000 | | | | 11,622,475 | |
Pinckney MI Community School District (GO Revenue, Qualified School Board Loan Fund Insured) | | | 5.00 | | | | 5-1-2025 | | | | 2,040,000 | | | | 2,370,398 | |
Pinckney MI Community School District (GO Revenue, Qualified School Board Loan Fund Insured) | | | 5.00 | | | | 5-1-2026 | | | | 2,505,000 | | | | 2,896,306 | |
Southfield MI 2015 Street Improvement (GO Revenue) | | | 4.00 | | | | 5-1-2025 | | | | 1,490,000 | | | | 1,665,209 | |
Wayne County MI Airport Authority Detroit Metropolitan Bond Series A (Airport Revenue) | | | 5.00 | | | | 12-1-2032 | | | | 800,000 | | | | 954,440 | |
Wayne County MI Airport Authority Detroit Metropolitan Bond Series A (Airport Revenue) | | | 5.00 | | | | 12-1-2034 | | | | 600,000 | | | | 716,982 | |
Western Michigan University Board of Trustees (Education Revenue) | | | 5.25 | | | | 11-15-2027 | | | | 600,000 | | | | 698,394 | |
Western Michigan University Board of Trustees (Education Revenue) | | | 5.25 | | | | 11-15-2029 | | | | 1,000,000 | | | | 1,161,600 | |
Western Michigan University Board of Trustees (Education Revenue, AGM Insured) | | | 5.25 | | | | 11-15-2033 | | | | 750,000 | | | | 871,650 | |
| | | | |
| | | | | | | | | | | | | | | 85,257,724 | |
| | | | | | | | | | | | | | | | |
|
| Minnesota: 0.45% | |
Minneapolis & St. Paul MN Housing & RDA Children’s Hospital Clinics Series A-I (Miscellaneous Revenue, AGM Insured, U.S. Bank NA SPA) ø | | | 1.65 | | | | 8-15-2037 | | | | 6,760,000 | | | | 6,760,000 | |
Minneapolis & St. Paul MN Housing & RDA Children’s Hospital Clinics Series A-II (Miscellaneous Revenue, AGM Insured, U.S. Bank NA SPA) ø | | | 1.65 | | | | 8-15-2037 | | | | 2,000,000 | | | | 2,000,000 | |
St. Louis Park MN Nicollett Health Services Series C (Health Revenue) | | | 5.50 | | | | 7-1-2023 | | | | 2,500,000 | | | | 2,550,450 | |
| | | | |
| | | | | | | | | | | | | | | 11,310,450 | |
| | | | | | | | | | | | | | | | |
|
| Mississippi: 0.78% | |
Mississippi Development Bank Special Obligation Jackson Public School District Project Series A (Miscellaneous Revenue) | | | 5.00 | | | | 4-1-2020 | | | | 1,000,000 | | | | 1,067,770 | |
Mississippi Development Bank Special Obligation Jackson Water & Sewer System Project (Water & Sewer Revenue, AGM Insured) | | | 6.00 | | | | 12-1-2023 | | | | 1,145,000 | | | | 1,378,569 | |
The accompanying notes are an integral part of these financial statements.
| | | | |
| 20 | | Wells Fargo Intermediate Tax/AMT-Free Fund | | Portfolio of investments—December 31, 2017 (unaudited) |
| | | | | | | | | | | | | | | | |
| Security name | | Interest rate | | | Maturity date | | | Principal | | | Value | |
|
| Mississippi (continued) | |
Mississippi Development Bank Special Obligation Jackson Water & Sewer System Project Series A (Miscellaneous Revenue, AGM Insured) | | | 5.00 | % | | | 9-1-2030 | | | $ | 10,000,000 | | | $ | 11,051,400 | |
Mississippi Development Bank Special Obligation Walnut Grove Correctional Facility Project (Miscellaneous Revenue) | | | 5.00 | | | | 8-1-2026 | | | | 5,000,000 | | | | 6,045,400 | |
| | | | |
| | | | | | | | | | | | | | | 19,543,139 | |
| | | | | | | | | | | | | | | | |
|
| Missouri: 0.43% | |
Belton MO School District #124 Missouri Direct Deposit Program Project (GO Revenue) | | | 5.00 | | | | 3-1-2026 | | | | 750,000 | | | | 913,583 | |
Belton MO School District #124 Missouri Direct Deposit Program Project (GO Revenue) | | | 5.50 | | | | 3-1-2029 | | | | 400,000 | | | | 514,716 | |
Kansas City MO Municipal Assistance Corporation Series B-1 (Miscellaneous Revenue, Ambac Insured) ¤ | | | 0.00 | | | | 4-15-2022 | | | | 3,640,000 | | | | 3,253,214 | |
Manchester MO Highway 141 Manchester Road Project (Tax Revenue) | | | 6.00 | | | | 11-1-2025 | | | | 280,000 | | | | 279,930 | |
Missouri HEFA Webster University Project (Education Revenue) | | | 5.00 | | | | 4-1-2027 | | | | 2,155,000 | | | | 2,552,210 | |
Poplar Bluff MO School District (Miscellaneous Revenue, AGM Insured) | | | 5.00 | | | | 3-1-2032 | | | | 1,500,000 | | | | 1,733,235 | |
Poplar Bluff MO School District (Miscellaneous Revenue, AGM Insured) | | | 5.00 | | | | 3-1-2034 | | | | 1,000,000 | | | | 1,149,910 | |
St. Louis MO Lambert St. Louis International Airport Series A-1 (Airport Revenue) | | | 6.00 | | | | 7-1-2019 | | | | 415,000 | | | | 441,348 | |
| | | | |
| | | | | | | | | | | | | | | 10,838,146 | |
| | | | | | | | | | | | | | | | |
|
| Nebraska: 0.12% | |
Lincoln County NE Hospital Authority Great Plains Regional Medical Center (Health Revenue) | | | 5.00 | | | | 11-1-2024 | | | | 1,000,000 | | | | 1,106,130 | |
Municipal Energy Agency of Nebraska Series A (Utilities Revenue, BHAC Insured) | | | 5.00 | | | | 4-1-2019 | | | | 500,000 | | | | 520,980 | |
Nebraska Central Plains Energy Project #3 (Utilities Revenue) | | | 5.00 | | | | 9-1-2027 | | | | 1,290,000 | | | | 1,451,585 | |
| | | | |
| | | | | | | | | | | | | | | 3,078,695 | |
| | | | | | | | | | | | | | | | |
|
| Nevada: 1.38% | |
Clark County NV Airport Series C (Airport Revenue, AGM Insured) | | | 5.00 | | | | 7-1-2023 | | | | 5,600,000 | | | | 5,878,376 | |
Clark County NV Airport Series D (Airport Revenue) | | | 5.00 | | | | 7-1-2024 | | | | 2,750,000 | | | | 2,924,433 | |
Clark County NV Refunding Bond (GO Revenue) | | | 5.00 | | | | 6-1-2030 | | | | 3,905,000 | | | | 4,770,387 | |
Clark County NV Refunding Bond Series B (GO Revenue) | | | 5.00 | | | | 11-1-2028 | | | | 5,000,000 | | | | 6,113,100 | |
Clark County NV Water Reclamation District (GO Revenue) | | | 5.00 | | | | 7-1-2027 | | | | 4,155,000 | | | | 4,989,740 | |
Clark County NV Water Reclamation District Series A (GO Revenue) | | | 5.25 | | | | 7-1-2038 | | | | 2,880,000 | | | | 3,037,680 | |
Las Vegas NV Series A (GO Revenue) | | | 5.00 | | | | 5-1-2031 | | | | 1,985,000 | | | | 2,301,409 | |
Las Vegas NV Special Improvement District #607 (Miscellaneous Revenue) | | | 4.00 | | | | 6-1-2019 | | | | 685,000 | | | | 696,186 | |
Las Vegas NV Special Improvement District #607 (Miscellaneous Revenue) | | | 4.00 | | | | 6-1-2020 | | | | 575,000 | | | | 590,289 | |
Las Vegas NV Special Improvement District #607 (Miscellaneous Revenue) | | | 4.00 | | | | 6-1-2021 | | | | 750,000 | | | | 774,870 | |
Las Vegas NV Special Improvement District #607 (Miscellaneous Revenue) | | | 4.25 | | | | 6-1-2024 | | | | 200,000 | | | | 207,146 | |
Las Vegas NV Valley Water District Series B (GO Revenue) | | | 5.00 | | | | 6-1-2030 | | | | 1,945,000 | | | | 2,357,748 | |
| | | | |
| | | | | | | | | | | | | | | 34,641,364 | |
| | | | | | | | | | | | | | | | |
|
| New Hampshire: 0.05% | |
New Hampshire HFA Single Family Mortgage Acquisition Series E & F (Housing Revenue) | | | 4.80 | | | | 7-1-2028 | | | | 1,310,000 | | | | 1,344,361 | |
| | | | | | | | | | | | | | | | |
|
| New Jersey: 3.97% | |
Essex County NJ Import Authority Series A (Miscellaneous Revenue) | | | 6.00 | | | | 11-1-2025 | | | | 5,000,000 | | | | 5,362,750 | |
Middlesex County NJ (GO Revenue) | | | 2.00 | | | | 6-1-2024 | | | | 1,845,000 | | | | 1,856,070 | |
Montclair NJ General Improvement Refunding Bond Series A (GO Revenue) | | | 4.00 | | | | 3-1-2024 | | | | 500,000 | | | | 560,765 | |
The accompanying notes are an integral part of these financial statements.
| | | | | | |
| Portfolio of investments—December 31, 2017 (unaudited) | | Wells Fargo Intermediate Tax/AMT-Free Fund | | | 21 | |
| | | | | | | | | | | | | | | | |
| Security name | | Interest rate | | | Maturity date | | | Principal | | | Value | |
|
| New Jersey (continued) | |
Montclair NJ School Refunding Bond Series B (GO Revenue) | | | 4.00 | % | | | 3-1-2026 | | | $ | 500,000 | | | $ | 574,130 | |
New Jersey EDA Cigarette Tax Refunding Bond (Tobacco Revenue) | | | 5.00 | | | | 6-15-2021 | | | | 2,500,000 | | | | 2,733,050 | |
New Jersey EDA Motor Vehicle Surcharges Series A (Miscellaneous Revenue) | | | 5.00 | | | | 7-1-2033 | | | | 2,500,000 | | | | 2,770,875 | |
New Jersey EDA Prerefunded Bond (Miscellaneous Revenue, National Insured) | | | 5.25 | | | | 7-1-2026 | | | | 540,000 | | | | 673,607 | |
New Jersey EDA School Facilities Construction Refunding Bond Series NN (Miscellaneous Revenue) | | | 5.00 | | | | 3-1-2021 | | | | 10,015,000 | | | | 10,704,933 | |
New Jersey EDA School Facilities Construction Refunding Bond Series NN (Miscellaneous Revenue) | | | 5.00 | | | | 3-1-2023 | | | | 3,000,000 | | | | 3,311,970 | |
New Jersey EDA School Facilities Construction Refunding Bond Series NN (Miscellaneous Revenue) | | | 5.00 | | | | 3-1-2026 | | | | 9,830,000 | | | | 10,718,927 | |
New Jersey EDA Series XX (Miscellaneous Revenue) | | | 5.00 | | | | 6-15-2022 | | | | 5,020,000 | | | | 5,481,187 | |
New Jersey EDA Unrefunded Bond (Miscellaneous Revenue, National Insured) | | | 5.25 | | | | 7-1-2026 | | | | 2,320,000 | | | | 2,727,879 | |
New Jersey Educational Facilities Authority (Miscellaneous Revenue) | | | 5.00 | | | | 6-15-2026 | | | | 3,015,000 | | | | 3,340,077 | |
New Jersey HEFAR Student Assistance Authority Series A (Education Revenue) | | | 5.00 | | | | 6-1-2019 | | | | 9,860,000 | | | | 10,253,907 | |
New Jersey Sports & Exposition Authority (Miscellaneous Revenue, National Insured) | | | 5.50 | | | | 3-1-2022 | | | | 1,755,000 | | | | 2,016,442 | |
New Jersey TTFA Series A (Miscellaneous Revenue) | | | 5.00 | | | | 6-15-2020 | | | | 4,000,000 | | | | 4,235,200 | |
New Jersey TTFA Series A (Transportation Revenue) | | | 5.25 | | | | 12-15-2020 | | | | 1,305,000 | | | | 1,407,978 | |
New Jersey TTFA Series A (Miscellaneous Revenue) | | | 5.25 | | | | 6-15-2024 | | | | 1,695,000 | | | | 1,848,126 | |
New Jersey TTFA Series A (Miscellaneous Revenue) | | | 5.25 | | | | 6-15-2025 | | | | 2,000,000 | | | | 2,180,000 | |
New Jersey TTFA Series A-1 and A-2 (Transportation Revenue) | | | 5.00 | | | | 6-15-2022 | | | | 4,750,000 | | | | 5,205,145 | |
New Jersey TTFA Series C (Transportation Revenue) | | | 5.25 | | | | 6-15-2032 | | | | 2,500,000 | | | | 2,764,550 | |
New Jersey TTFA Unrefunded Balance Bond (Transportation Revenue, National Insured) | | | 5.25 | | | | 12-15-2021 | | | | 6,000,000 | | | | 6,626,400 | |
South Jersey NJ Port Corporation Marine Terminal Refunding Bond Series S (Airport Revenue) | | | 5.00 | | | | 1-1-2028 | | | | 2,130,000 | | | | 2,387,389 | |
South Jersey NJ Port Corporation Marine Terminal Refunding Bond Series S (Airport Revenue) | | | 5.00 | | | | 1-1-2029 | | | | 2,200,000 | | | | 2,452,736 | |
Trenton City NJ (GO Revenue, Build America Mutual Assurance Company Insured) | | | 5.00 | | | | 12-1-2022 | | | | 1,630,000 | | | | 1,836,472 | |
Trenton City NJ (GO Revenue, Build America Mutual Assurance Company Insured) | | | 5.00 | | | | 12-1-2024 | | | | 1,775,000 | | | | 2,061,112 | |
Trenton City NJ (GO Revenue, Build America Mutual Assurance Company Insured) | | | 5.00 | | | | 12-1-2025 | | | | 1,860,000 | | | | 2,186,021 | |
Trenton City NJ (GO Revenue, Build America Mutual Assurance Company Insured) | | | 5.00 | | | | 12-1-2026 | | | | 1,000,000 | | | | 1,186,310 | |
| | | | |
| | | | | | | | | | | | | | | 99,464,008 | |
| | | | | | | | | | | | | | | | |
|
| New Mexico: 0.74% | |
Albuquerque, Bernalillo & Sandoval Counties NM Municipal School District #12 (GO Revenue) | | | 5.00 | | | | 8-1-2025 | | | | 400,000 | | | | 483,984 | |
Albuquerque, Bernalillo & Sandoval Counties NM Municipal School District #12 (GO Revenue) | | | 5.00 | | | | 8-1-2026 | | | | 1,205,000 | | | | 1,481,162 | |
Albuquerque, Bernalillo County NM Water Utility Authority Series B (Water & Sewer Revenue) | | | 5.00 | | | | 7-1-2024 | | | | 1,000,000 | | | | 1,186,550 | |
Clayton NM Jail Project Improvement & Refunding Bonds (Miscellaneous Revenue, National Insured) | | | 5.00 | | | | 11-1-2028 | | | | 9,265,000 | | | | 10,681,526 | |
Clayton NM Jail Project Improvement & Refunding Bonds (Miscellaneous Revenue, National Insured) | | | 5.00 | | | | 11-1-2029 | | | | 1,000,000 | | | | 1,148,340 | |
New Mexico Mortgage Finance Authority SFMR Class I Series A (Housing Revenue, GNMA/FNMA/FHLMC Insured) | | | 4.63 | | | | 9-1-2025 | | | | 930,000 | | | | 963,964 | |
New Mexico Mortgage Finance Authority SFMR Class I Series B (Housing Revenue, GNMA/FNMA/FHLMC Insured) | | | 5.00 | | | | 3-1-2028 | | | | 355,000 | | | | 379,310 | |
New Mexico Municipal Energy Acquisition Authority Gas Supply Subordinate Series B (1 Month LIBOR +0.75%) (Utilities Revenue, Royal Bank of Canada SPA) ± | | | 1.66 | | | | 11-1-2039 | | | | 2,250,000 | | | | 2,248,043 | |
| | | | |
| | | | | | | | | | | | | | | 18,572,879 | |
| | | | | | | | | | | | | | | | |
The accompanying notes are an integral part of these financial statements.
| | | | |
| 22 | | Wells Fargo Intermediate Tax/AMT-Free Fund | | Portfolio of investments—December 31, 2017 (unaudited) |
| | | | | | | | | | | | | | | | |
| Security name | | Interest rate | | | Maturity date | | | Principal | | | Value | |
| | | | |
| New York: 9.22% | | | | | | | | | | | | | | | | |
Dutchess County NY Local Development Corporation The Culinary Institute of America Project Series A-1 (Education Revenue) | | | 5.00 | % | | | 7-1-2027 | | | $ | 685,000 | | | $ | 802,745 | |
Dutchess County NY Local Development Corporation The Culinary Institute of America Project Series A-1 (Education Revenue) | | | 5.00 | | | | 7-1-2030 | | | | 365,000 | | | | 422,345 | |
Hempstead Town NY Local Development Corporation The Academy Charter School Project Series A (Education Revenue) | | | 5.89 | | | | 2-1-2032 | | | | 2,745,000 | | | | 2,769,815 | |
Hempstead Town NY Local Development Corporation The Academy Charter School Project Series A (Education Revenue) | | | 6.24 | | | | 2-1-2047 | | | | 1,750,000 | | | | 1,765,558 | |
Hempstead Town NY Local Development Corporation The Academy Charter School Project Series A (Education Revenue) | | | 7.65 | | | | 2-1-2044 | | | | 2,720,000 | | | | 2,937,600 | |
Monroe County NY Industrial Development Corporation Revenue Monroe Community College Project Series A (Education Revenue, AGM Insured) | | | 5.00 | | | | 1-15-2022 | | | | 790,000 | | | | 876,853 | |
Monroe County NY Industrial Development Corporation Revenue Monroe Community College Project Series A (Education Revenue, AGM Insured) | | | 5.00 | | | | 1-15-2023 | | | | 645,000 | | | | 731,256 | |
Monroe County NY Industrial Development Corporation Revenue Monroe Community College Project Series A (Education Revenue, AGM Insured) | | | 5.00 | | | | 1-15-2024 | | | | 905,000 | | | | 1,046,877 | |
Monroe County NY Industrial Development Corporation Revenue St. John Fisher College Project Series A (Education Revenue) | | | 5.00 | | | | 6-1-2020 | | | | 2,125,000 | | | | 2,286,798 | |
Nassau NY Water Authority Series A (Water & Sewer Revenue) | | | 5.00 | | | | 4-1-2027 | | | | 350,000 | | | | 414,771 | |
Nassau NY Water Authority Series A (Water & Sewer Revenue) | | | 5.00 | | | | 4-1-2028 | | | | 300,000 | | | | 353,100 | |
Nassau NY Water Authority Series B (Water & Sewer Revenue) | | | 5.00 | | | | 4-1-2024 | | | | 400,000 | | | | 468,564 | |
Nassau NY Water Authority Series B (Water & Sewer Revenue) | | | 5.00 | | | | 4-1-2026 | | | | 755,000 | | | | 898,609 | |
New York Convention Center Development Corporation (Tax Revenue) | | | 5.00 | | | | 11-15-2028 | | | | 8,000,000 | | | | 9,584,240 | |
New York Dormitory Authority Interagency Council Pooled Loan Series A-1 (Miscellaneous Revenue) | | | 4.00 | | | | 7-1-2019 | | | | 740,000 | | | | 766,795 | |
New York Dormitory Authority Mount Sinai School of Medicine (Education Revenue) | | | 5.50 | | | | 7-1-2022 | | | | 2,000,000 | | | | 2,114,720 | |
New York Dormitory Authority North Shore-Long Island Jewish Obligated Group Series B (3 Month LIBOR +0.73%) (Health Revenue) ± | | | 1.65 | | | | 5-1-2018 | | | | 405,000 | | | | 405,057 | |
New York Dormitory Authority Series 2016-A (Tax Revenue) | | | 5.00 | | | | 3-15-2028 | | | | 5,000,000 | | | | 6,004,750 | |
New York Dormitory Authority Series 2017-A (Tax Revenue) | | | 5.00 | | | | 2-15-2031 | | | | 10,000,000 | | | | 12,108,200 | |
New York Dormitory Authority Series A (Tax Revenue) | | | 5.00 | | | | 2-15-2031 | | | | 3,000,000 | | | | 3,611,580 | |
New York Dormitory Authority Series B (Tax Revenue, Ambac Insured) | | | 5.50 | | | | 3-15-2025 | | | | 3,885,000 | | | | 4,804,191 | |
New York Dormitory Authority Series D (Miscellaneous Revenue) | | | 5.00 | | | | 10-1-2031 | | | | 2,005,000 | | | | 2,428,316 | |
New York Dormitory Authority State University Educational Facilities Series A (Miscellaneous Revenue) | | | 5.50 | | | | 5-15-2019 | | | | 3,675,000 | | | | 3,769,411 | |
New York Dormitory Authority United Health Hospitals (Health Revenue, FHA Insured) | | | 4.50 | | | | 8-1-2018 | | | | 1,030,000 | | | | 1,041,897 | |
New York Metropolitan Transportation Authority Dedicated Tax Fund Series A (Tax Revenue) | | | 5.00 | | | | 11-15-2024 | | | | 6,010,000 | | | | 6,896,114 | |
New York Metropolitan Transportation Authority Series A (Transportation Revenue) | | | 5.00 | | | | 11-15-2030 | | | | 4,010,000 | | | | 4,559,129 | |
New York Metropolitan Transportation Authority Series C (Transportation Revenue) | | | 5.25 | | | | 11-15-2028 | | | | 5,000,000 | | | | 6,063,750 | |
New York Metropolitan Transportation Authority Series C (Transportation Revenue) | | | 5.25 | | | | 11-15-2029 | | | | 11,100,000 | | | | 13,434,885 | |
New York Metropolitan Transportation Authority Series C (Transportation Revenue) | | | 5.25 | | | | 11-15-2030 | | | | 8,350,000 | | | | 10,086,383 | |
New York Metropolitan Transportation Authority Series C (Transportation Revenue) | | | 5.25 | | | | 11-15-2031 | | | | 4,500,000 | | | | 5,417,865 | |
New York Metropolitan Transportation Authority Series C-1 (Transportation Revenue) | | | 5.00 | | | | 11-15-2031 | | | | 8,000,000 | | | | 9,767,200 | |
New York Metropolitan Transportation Authority Series D (Transportation Revenue) | | | 5.00 | | | | 11-15-2027 | | | | 2,000,000 | | | | 2,320,400 | |
New York Metropolitan Transportation Authority Series F (Transportation Revenue) | | | 5.00 | | | | 11-15-2025 | | | | 2,490,000 | | | | 3,007,024 | |
New York Metropolitan Transportation Authority Series F (Transportation Revenue) | | | 5.00 | | | | 11-15-2028 | | | | 2,450,000 | | | | 2,795,279 | |
New York Metropolitan Transportation Authority Subordinate Series D-2 (Transportation Revenue, Landesbank Hessen-Thüringen LOC) ø | | | 2.00 | | | | 11-1-2035 | | | | 3,000,000 | | | | 3,000,000 | |
The accompanying notes are an integral part of these financial statements.
| | | | | | |
| Portfolio of investments—December 31, 2017 (unaudited) | | Wells Fargo Intermediate Tax/AMT-Free Fund | | | 23 | |
| | | | | | | | | | | | | | | | |
| Security name | | Interest rate | | | Maturity date | | | Principal | | | Value | |
| | | | |
| New York (continued) | | | | | | | | | | | | | | | | |
New York NY Municipal Water Finance Authority Fiscal 2009 Subordinate Series BB-1 (Water & Sewer Revenue, Landesbank Hessen-Thüringen SPA) ø | | | 1.85 | % | | | 6-15-2039 | | | $ | 14,550,000 | | | $ | 14,550,000 | |
New York NY Municipal Water Finance Authority Fiscal 2015 Series GG (Water & Sewer Revenue) | | | 5.00 | | | | 6-15-2029 | | | | 1,645,000 | | | | 1,966,137 | |
New York NY Series B (GO Revenue) | | | 5.00 | | | | 12-1-2032 | | | | 2,000,000 | | | | 2,400,700 | |
New York NY Series C (GO Revenue) | | | 5.00 | | | | 8-1-2031 | | | | 5,000,000 | | | | 5,852,150 | |
New York NY Series C & D (GO Revenue) | | | 5.00 | | | | 8-1-2028 | | | | 3,000,000 | | | | 3,611,130 | |
New York NY Series J-4 (SIFMA Municipal Swap +0.55%) (GO Revenue) ± | | | 2.26 | | | | 8-1-2025 | | | | 10,000,000 | | | | 9,999,800 | |
New York NY Transitional Finance Authority Building Aid Bond Series S-1 (Miscellaneous Revenue) | | | 5.00 | | | | 7-15-2032 | | | | 2,500,000 | | | | 3,017,800 | |
New York NY Transitional Finance Authority Prerefunded Balance Bond Series A (Tax Revenue) | | | 5.00 | | | | 5-1-2023 | | | | 2,875,000 | | | | 3,005,956 | |
New York NY Transitional Finance Authority Series B (Tax Revenue) | | | 5.00 | | | | 8-1-2027 | | | | 1,115,000 | | | | 1,320,193 | |
New York NY Transitional Finance Authority Series C (Tax Revenue) | | | 5.00 | | | | 11-1-2027 | | | | 5,000,000 | | | | 5,991,200 | |
New York NY Transitional Finance Authority Subordinate Series A-2 (Tax Revenue, Dexia Credit Local LIQ) ø | | | 1.82 | | | | 11-1-2022 | | | | 5,810,000 | | | | 5,810,000 | |
New York NY Transitional Finance Authority Subordinate Series B-1 (Tax Revenue) | | | 5.00 | | | | 11-1-2028 | | | | 1,000,000 | | | | 1,203,490 | |
New York NY Transitional Finance Authority Subordinate Series B-3 (Tax Revenue, Barclays Bank plc SPA) ø | | | 1.78 | | | | 11-1-2042 | | | | 10,000,000 | | | | 10,000,000 | |
New York NY Trust for Cultural Resources Series A-1 (Miscellaneous Revenue) | | | 5.00 | | | | 7-1-2031 | | | | 2,475,000 | | | | 2,692,775 | |
New York NY Water Finance Authority Series DD (Water & Sewer Revenue) | | | 5.25 | | | | 6-15-2047 | | | | 1,750,000 | | | | 2,119,705 | |
New York Urban Development Corporation Personal Income Tax Series A (Tax Revenue) | | | 5.00 | | | | 3-15-2031 | | | | 3,815,000 | | | | 4,450,083 | |
New York Urban Development Corporation Personal income Tax Series A (Tax Revenue) | | | 5.00 | | | | 3-15-2032 | | | | 5,000,000 | | | | 5,958,150 | |
New York Urban Development Corporation Series D (Miscellaneous Revenue, AGC Insured) | | | 5.50 | | | | 1-1-2019 | | | | 3,000,000 | | | | 3,117,090 | |
New York Utility Debt Securitization Authority (Utilities Revenue) | | | 5.00 | | | | 12-15-2032 | | | | 1,250,000 | | | | 1,462,425 | |
Niagara NY Area Development Corporation (Education Revenue) | | | 5.00 | | | | 5-1-2020 | | | | 1,160,000 | | | | 1,241,200 | |
Niagara NY Area Development Corporation (Education Revenue) | | | 5.00 | | | | 5-1-2022 | | | | 1,350,000 | | | | 1,509,341 | |
Port Authority New York & New Jersey Special Obligation (Airport Revenue) | | | 5.00 | | | | 12-1-2020 | | | | 4,500,000 | | | | 4,816,485 | |
Suffolk NY Public Improvement Serial Bond Series A (GO Revenue, AGM Insured) | | | 3.00 | | | | 6-1-2019 | | | | 1,180,000 | | | | 1,199,305 | |
Suffolk NY Tobacco Asset Securitization Corporation Tobacco Settlement Series B (Tobacco Revenue) | | | 4.00 | | | | 6-1-2022 | | | | 420,000 | | | | 457,703 | |
Suffolk NY Tobacco Asset Securitization Corporation Tobacco Settlement Series B (Tobacco Revenue) | | | 5.00 | | | | 6-1-2023 | | | | 500,000 | | | | 563,925 | |
Troy NY Capital Resource Corporation Rensselaer Polytechnic Series B (Education Revenue) | | | 5.00 | | | | 9-1-2020 | | | | 1,430,000 | | | | 1,542,527 | |
Upper Mohawk Valley NY Regional Water Finance Authority Series A (Water & Sewer Revenue, AGC Insured) | | | 5.00 | | | | 4-1-2018 | | | | 225,000 | | | | 226,555 | |
Yonkers NY Series A (GO Revenue, AGM Insured) | | | 5.00 | | | | 10-1-2024 | | | | 1,000,000 | | | | 1,118,040 | |
| | | | |
| | | | | | | | | | | | | | | 230,965,942 | |
| | | | | | | | | | | | | | | | |
|
| North Carolina: 0.18% | |
New Hanover County NC Regional Medical Center (Health Revenue) | | | 5.00 | | | | 10-1-2022 | | | | 250,000 | | | | 283,535 | |
New Hanover County NC Regional Medical Center (Health Revenue) | | | 5.00 | | | | 10-1-2023 | | | | 1,000,000 | | | | 1,159,060 | |
North Carolina Grant Anticipation Vehicle Bond (Miscellaneous Revenue) | | | 5.00 | | | | 3-1-2029 | | | | 2,470,000 | | | | 2,922,232 | |
Onslow County NC Limited Obligation Series A (Miscellaneous Revenue) | | | 4.00 | | | | 6-1-2022 | | | | 90,000 | | | | 97,920 | |
| | | | |
| | | | | | | | | | | | | | | 4,462,747 | |
| | | | | | | | | | | | | | | | |
The accompanying notes are an integral part of these financial statements.
| | | | |
| 24 | | Wells Fargo Intermediate Tax/AMT-Free Fund | | Portfolio of investments—December 31, 2017 (unaudited) |
| | | | | | | | | | | | | | | | |
| Security name | | Interest rate | | | Maturity date | | | Principal | | | Value | |
| | | | |
| North Dakota: 0.01% | | | | | | | | | | | | | | | | |
North Dakota Housing Finance Agency Series D (Housing Revenue) | | | 4.50 | % | | | 1-1-2029 | | | $ | 350,000 | | | $ | 358,432 | |
| | | | | | | | | | | | | | | | |
|
| Ohio: 1.38% | |
Cincinnati OH City School District Improvement Project Certificate of Participation (Miscellaneous Revenue) | | | 5.00 | | | | 12-15-2024 | | | | 4,815,000 | | | | 5,635,428 | |
Cincinnati OH City School District Improvement Project Certificate of Participation (Miscellaneous Revenue) | | | 5.00 | | | | 12-15-2025 | | | | 2,095,000 | | | | 2,479,998 | |
Clermont County OH Port Authority West Clermont Local School District Project (Miscellaneous Revenue, Build America Mutual Assurance Company Insured) | | | 5.00 | | | | 12-1-2025 | | | | 500,000 | | | | 596,730 | |
Clermont County OH Port Authority West Clermont Local School District Project (Miscellaneous Revenue, Build America Mutual Assurance Company Insured) | | | 5.00 | | | | 12-1-2026 | | | | 600,000 | | | | 712,260 | |
Clermont County OH Port Authority West Clermont Local School District Project (Miscellaneous Revenue, Build America Mutual Assurance Company Insured) | | | 5.00 | | | | 12-1-2028 | | | | 1,250,000 | | | | 1,485,850 | |
Cleveland OH Subordinate Lien Income Tax Refunding Bond Series B-1 (Tax Revenue) | | | 5.00 | | | | 10-1-2030 | | | | 2,500,000 | | | | 2,999,125 | |
Columbus OH Various Purposes Series 2 (GO Revenue) | | | 5.00 | | | | 7-1-2026 | | | | 1,775,000 | | | | 2,185,984 | |
JobsOhio Beverage System Statewide Liquor Profits Senior Lien Series A (Miscellaneous Revenue) | | | 5.00 | | | | 1-1-2022 | | | | 2,500,000 | | | | 2,800,850 | |
Kent University OH General Receipts Series B (Education Revenue, AGC Insured) | | | 5.00 | | | | 5-1-2018 | | | | 1,165,000 | | | | 1,178,596 | |
Ohio Air Quality Development Authority Series B (Industrial Development Revenue) | | | 3.63 | | | | 10-1-2033 | | | | 1,750,000 | | | | 773,850 | |
Ohio Air Quality Development Authority Series B (Industrial Development Revenue) | | | 3.63 | | | | 12-1-2033 | | | | 2,500,000 | | | | 1,105,425 | |
Ohio Building Authority Series A (Miscellaneous Revenue) | | | 5.00 | | | | 10-1-2024 | | | | 1,000,000 | | | | 1,105,780 | |
Ohio Turnpike Commission Junior Lien Infrastructure Projects Series A-1 (Transportation Revenue) | | | 5.25 | | | | 2-15-2029 | | | | 1,000,000 | | | | 1,152,560 | |
Ohio Water Development Authority Pollution Control First Energy Nuclear Generation Project Series A (Water & Sewer Revenue) | | | 3.75 | | | | 6-1-2033 | | | | 10,000,000 | | | | 4,421,700 | |
Ohio Water Development Authority Pollution Control First Energy Nuclear Generation Project Series B (Industrial Development Revenue) | | | 3.63 | | | | 10-1-2033 | | | | 3,150,000 | | | | 1,392,930 | |
Ohio Water Development Authority Pollution Control FirstEnergy Nuclear Generation Project (Industrial Development Revenue) | | | 3.75 | | | | 7-1-2033 | | | | 3,000,000 | | | | 1,326,480 | |
Ohio Water Development Authority Pollution Control Series A (Water & Sewer Revenue) | | | 5.00 | | | | 12-1-2031 | | | | 1,000,000 | | | | 1,222,550 | |
RiverSouth Authority Ohio Lazarus Building Redevelopment Series A (Miscellaneous Revenue) | | | 5.75 | | | | 12-1-2027 | | | | 895,000 | | | | 896,897 | |
Summit County OH Port Authority University of Akron Student Housing Project Prerefunded Bond (Education Revenue) | | | 5.25 | | | | 1-1-2024 | | | | 685,000 | | | | 756,548 | |
Summit County OH Port Authority University of Akron Student Housing Project Unrefunded Bond (Education Revenue) | | | 5.25 | | | | 1-1-2024 | | | | 315,000 | | | | 344,037 | |
| | | | |
| | | | | | | | | | | | | | | 34,573,578 | |
| | | | | | | | | | | | | | | | |
|
| Oklahoma: 3.26% | |
Cache OK Educational Facilities Authority Cache Public Schools Project Series A (Miscellaneous Revenue) | | | 5.00 | | | | 9-1-2024 | | | | 2,905,000 | | | | 3,398,501 | |
Cache OK Educational Facilities Authority Cache Public Schools Project Series A (Miscellaneous Revenue) | | | 5.00 | | | | 9-1-2025 | | | | 3,055,000 | | | | 3,631,265 | |
Canadian County OK Education Facilities Authority Mustang Public Schools Project (Miscellaneous Revenue) | | | 4.00 | | | | 9-1-2024 | | | | 1,725,000 | | | | 1,915,233 | |
Canadian County OK Education Facilities Authority Mustang Public Schools Project (Miscellaneous Revenue) | | | 4.00 | | | | 9-1-2025 | | | | 1,110,000 | | | | 1,243,478 | |
Canadian County OK Education Facilities Authority Mustang Public Schools Project (Miscellaneous Revenue) | | | 5.00 | | | | 9-1-2028 | | | | 2,180,000 | | | | 2,603,857 | |
Carter County OK Public Facilities Authority Educational Facilities Plainview Public School Project (Miscellaneous Revenue) | | | 5.00 | | | | 12-1-2026 | | | | 1,000,000 | | | | 1,195,930 | |
The accompanying notes are an integral part of these financial statements.
| | | | | | |
| Portfolio of investments—December 31, 2017 (unaudited) | | Wells Fargo Intermediate Tax/AMT-Free Fund | | | 25 | |
| | | | | | | | | | | | | | | | |
| Security name | | Interest rate | | | Maturity date | | | Principal | | | Value | |
| | | | |
| Oklahoma (continued) | | | | | | | | | | | | | | | | |
Carter County OK Public Facilities Authority Educational Facilities Plainview Public School Project (Miscellaneous Revenue) | | | 5.00 | % | | | 12-1-2027 | | | $ | 1,000,000 | | | $ | 1,188,030 | |
Carter County OK Public Facilities Authority Educational Facilities Plainview Public School Project (Miscellaneous Revenue) | | | 5.00 | | | | 12-1-2028 | | | | 1,285,000 | | | | 1,521,016 | |
Claremore OK Public Works Authority (Utilities Revenue) | | | 4.00 | | | | 6-1-2022 | | | | 2,595,000 | | | | 2,807,349 | |
Claremore OK Public Works Authority (Utilities Revenue) | | | 4.00 | | | | 6-1-2023 | | | | 1,010,000 | | | | 1,088,659 | |
Cleveland County OK Educational Facilities Authority Noble Public Schools Project (Miscellaneous Revenue) | | | 5.00 | | | | 9-1-2027 | | | | 700,000 | | | | 849,352 | |
Cleveland County OK Educational Facilities Authority Noble Public Schools Project (Miscellaneous Revenue) | | | 5.00 | | | | 9-1-2028 | | | | 400,000 | | | | 482,296 | |
Cleveland County OK Educational Facilities Authority Noble Public Schools Project (Miscellaneous Revenue) | | | 5.00 | | | | 9-1-2029 | | | | 250,000 | | | | 300,015 | |
Cleveland County OK Educational Facilities Authority Noble Public Schools Project (Miscellaneous Revenue) | | | 5.00 | | | | 9-1-2030 | | | | 625,000 | | | | 746,506 | |
Cleveland County OK Educational Facilities Authority Noble Public Schools Project (Miscellaneous Revenue) | | | 5.00 | | | | 9-1-2031 | | | | 675,000 | | | | 802,433 | |
Comanche County OK Educational Facilities Authority Elgin Public Schools Project Series A (Miscellaneous Revenue) | | | 5.00 | | | | 12-1-2032 | | | | 1,600,000 | | | | 1,901,248 | |
Creek County OK Educational Facilities Sapulpa Public Schools Project (Miscellaneous Revenue) | | | 5.00 | | | | 9-1-2023 | | | | 3,000,000 | | | | 3,465,480 | |
Cushing OK Educational Facilities Authority (Miscellaneous Revenue) | | | 5.00 | | | | 9-1-2022 | | | | 2,210,000 | | | | 2,502,560 | |
Dewey County OK Educational Facilities Authority Seiling Public Schools Project (Miscellaneous Revenue) | | | 5.00 | | | | 9-1-2026 | | | | 1,230,000 | | | | 1,474,450 | |
Dewey County OK Educational Facilities Authority Seiling Public Schools Project (Miscellaneous Revenue) | | | 5.00 | | | | 9-1-2027 | | | | 1,240,000 | | | | 1,472,599 | |
Garvin County OK Educational Facilities Authority Lindsay Public Schools Project (Miscellaneous Revenue) | | | 5.00 | | | | 9-1-2018 | | | | 820,000 | | | | 838,245 | |
Garvin County OK Educational Facilities Authority Lindsay Public Schools Project (Miscellaneous Revenue) | | | 5.00 | | | | 9-1-2019 | | | | 860,000 | | | | 905,253 | |
Garvin County OK Educational Facilities Authority Lindsay Public Schools Project (Miscellaneous Revenue) | | | 5.00 | | | | 9-1-2020 | | | | 455,000 | | | | 488,106 | |
Garvin County OK Educational Facilities Authority Lindsay Public Schools Project (Miscellaneous Revenue) | | | 5.00 | | | | 9-1-2026 | | | | 1,000,000 | | | | 1,158,930 | |
Garvin County OK Educational Facilities Authority Lindsay Public Schools Project (Miscellaneous Revenue) | | | 5.00 | | | | 9-1-2027 | | | | 1,245,000 | | | | 1,436,344 | |
Grady County OK Educational Facilities Tuttle Public Schools Project (Miscellaneous Revenue) | | | 5.00 | | | | 9-1-2023 | | | | 1,000,000 | | | | 1,155,160 | |
Grady County OK Educational Facilities Tuttle Public Schools Project (Miscellaneous Revenue) | | | 5.00 | | | | 9-1-2024 | | | | 1,075,000 | | | | 1,262,706 | |
Grady County OK Educational Facilities Tuttle Public Schools Project (Miscellaneous Revenue) | | | 5.00 | | | | 9-1-2025 | | | | 500,000 | | | | 596,640 | |
Grady County OK Educational Facilities Tuttle Public Schools Project (Miscellaneous Revenue) | | | 5.00 | | | | 9-1-2028 | | | | 1,160,000 | | | | 1,380,609 | |
McGee Creek OK Authority (Water & Sewer Revenue, National Insured) | | | 6.00 | | | | 1-1-2023 | | | | 1,120,000 | | | | 1,214,741 | |
Muskogee OK Industrial Trust Educational Facilities (Miscellaneous Revenue) | | | 5.00 | | | | 9-1-2020 | | | | 1,000,000 | | | | 1,067,670 | |
Muskogee OK Industrial Trust Educational Facilities (Miscellaneous Revenue) | | | 5.00 | | | | 9-1-2021 | | | | 1,000,000 | | | | 1,088,010 | |
Muskogee OK Industrial Trust Educational Facilities (Miscellaneous Revenue) | | | 5.00 | | | | 9-1-2022 | | | | 1,000,000 | | | | 1,107,000 | |
Oklahoma City OK Public Property Authority (Tax Revenue) | | | 5.00 | | | | 10-1-2026 | | | | 1,495,000 | | | | 1,790,352 | |
Oklahoma City OK Public Property Authority (Tax Revenue) | | | 5.00 | | | | 10-1-2027 | | | | 1,140,000 | | | | 1,362,528 | |
Oklahoma City OK Public Property Authority (Tax Revenue) | | | 5.00 | | | | 10-1-2028 | | | | 1,265,000 | | | | 1,506,969 | |
Oklahoma Development Finance Authority (Miscellaneous Revenue) | | | 4.00 | | | | 6-1-2023 | | | | 1,270,000 | | | | 1,404,442 | |
Oklahoma Development Finance Authority (Miscellaneous Revenue) | | | 5.00 | | | | 6-1-2023 | | | | 1,230,000 | | | | 1,423,799 | |
The accompanying notes are an integral part of these financial statements.
| | | | |
| 26 | | Wells Fargo Intermediate Tax/AMT-Free Fund | | Portfolio of investments—December 31, 2017 (unaudited) |
| | | | | | | | | | | | | | | | |
| Security name | | Interest rate | | | Maturity date | | | Principal | | | Value | |
| | | | |
| Oklahoma (continued) | | | | | | | | | | | | | | | | |
Oklahoma Development Finance Authority Higher Education Master Real Property Series B (Miscellaneous Revenue) | | | 4.00 | % | | | 6-1-2024 | | | $ | 1,270,000 | | | $ | 1,419,670 | |
Oklahoma Turnpike Authority Second Senior Series B (Transportation Revenue, Royal Bank of Canada SPA) ø | | | 1.75 | | | | 1-1-2028 | | | | 11,765,000 | | | | 11,765,000 | |
Tulsa County OK Industrial Authority Educational Facilities Glenpool Public Schools Project Series A (Miscellaneous Revenue) | | | 5.00 | | | | 9-1-2025 | | | | 1,280,000 | | | | 1,527,398 | |
Tulsa County OK Industrial Authority MFHR Quail Creek Villa (Housing Revenue) | | | 1.30 | | | | 5-1-2020 | | | | 3,700,000 | | | | 3,691,157 | |
Tulsa OK Airports Improvement Trust Series D (Airport Revenue, Build America Mutual Assurance Company Insured) | | | 5.00 | | | | 6-1-2019 | | | | 1,500,000 | | | | 1,558,860 | |
Tulsa OK Airports Improvement Trust Series D (Airport Revenue, Build America Mutual Assurance Company Insured) | | | 5.00 | | | | 6-1-2021 | | | | 1,185,000 | | | | 1,267,381 | |
Tulsa OK Airports Improvement Trust Series D (Airport Revenue, Build America Mutual Assurance Company Insured) | | | 5.00 | | | | 6-1-2022 | | | | 520,000 | | | | 556,026 | |
Tulsa OK Airports Improvement Trust Series D (Airport Revenue, Build America Mutual Assurance Company Insured) | | | 5.00 | | | | 6-1-2025 | | | | 1,200,000 | | | | 1,282,260 | |
Tulsa OK Airports Improvement Trust Series D (Airport Revenue, Build America Mutual Assurance Company Insured) | | | 5.00 | | | | 6-1-2026 | | | | 1,250,000 | | | | 1,335,375 | |
Tulsa OK Airports Improvement Trust Series D (Airport Revenue, Build America Mutual Assurance Company Insured) | | | 5.00 | | | | 6-1-2027 | | | | 1,000,000 | | | | 1,068,060 | |
Tulsa OK Airports Improvement Trust Series D (Airport Revenue, Build America Mutual Assurance Company Insured) | | | 5.00 | | | | 6-1-2028 | | | | 500,000 | | | | 533,420 | |
| | | | |
| | | | | | | | | | | | | | | 81,782,368 | |
| | | | | | | | | | | | | | | | |
|
| Oregon: 0.36% | |
Medford OR Hospital Facilities Authority (Health Revenue) | | | 5.00 | | | | 10-1-2020 | | | | 1,155,000 | | | | 1,256,421 | |
Oregon Facilities Authority Samaritan Health Services Project Series A (Health Revenue) | | | 5.00 | | | | 10-1-2026 | | | | 1,500,000 | | | | 1,761,945 | |
Washington County OR Full Faith & Credit Obligations Series B (GO Revenue) | | | 5.00 | | | | 3-1-2022 | | | | 5,345,000 | | | | 6,045,997 | |
| | | | |
| | | | | | | | | | | | | | | 9,064,363 | |
| | | | | | | | | | | | | | | | |
|
| Pennsylvania: 9.63% | |
Adams County PA IDA Gettysburg College Project (Education Revenue) | | | 5.00 | | | | 8-15-2024 | | | | 1,500,000 | | | | 1,611,750 | |
Adams County PA IDA Gettysburg College Project (Education Revenue) | | | 5.00 | | | | 8-15-2025 | | | | 1,500,000 | | | | 1,608,570 | |
Allegheny County PA Hospital Development Authority Series B (Health Revenue, National Insured) | | | 6.00 | | | | 7-1-2025 | | | | 2,605,000 | | | | 3,273,209 | |
Allegheny County PA Moon Area School District Series A (GO Revenue) | | | 5.00 | | | | 11-15-2024 | | | | 3,400,000 | | | | 3,996,462 | |
Allegheny County PA Series 72 (GO Revenue) | | | 5.25 | | | | 12-1-2033 | | | | 4,000,000 | | | | 4,593,760 | |
Beaver County PA IDA Pollution Control FirstEnergy Nuclear Generation Corporation Project Series B (Industrial Development Revenue) | | | 3.50 | | | | 12-1-2035 | | | | 5,000,000 | | | | 2,210,850 | |
Berks County PA Municipal Authority Reading Hospital & Medical Center Project Series B (Health Revenue) | | | 3.21 | | | | 11-1-2039 | | | | 10,000,000 | | | | 10,176,900 | |
Bucks County PA Water & Sewer Authority Water System (Water & Sewer Revenue, AGM Insured) | | | 5.00 | | | | 12-1-2026 | | | | 2,400,000 | | | | 2,692,608 | |
Central Dauphin PA School District (GO Revenue) | | | 5.00 | | | | 2-1-2029 | | | | 825,000 | | | | 988,969 | |
Central Dauphin PA School District (GO Revenue) | | | 5.00 | | | | 2-1-2030 | | | | 1,110,000 | | | | 1,323,975 | |
Central Greene PA School District Series B (GO Revenue, Build America Mutual Assurance Company Insured) | | | 5.00 | | | | 2-15-2019 | | | | 865,000 | | | | 897,991 | |
Chester County PA IDA Collegium Charter School Project Series A (Education Revenue) | | | 5.00 | | | | 10-15-2027 | | | | 1,500,000 | | | | 1,595,445 | |
Cumberland County PA Diakon Lutheran Social Ministries Project (Health Revenue) | | | 5.00 | | | | 1-1-2025 | | | | 1,340,000 | | | | 1,529,744 | |
Cumberland County PA Diakon Lutheran Social Ministries Project (Health Revenue) | | | 5.00 | | | | 1-1-2026 | | | | 1,370,000 | | | | 1,561,184 | |
The accompanying notes are an integral part of these financial statements.
| | | | | | |
| Portfolio of investments—December 31, 2017 (unaudited) | | Wells Fargo Intermediate Tax/AMT-Free Fund | | | 27 | |
| | | | | | | | | | | | | | | | |
| Security name | | Interest rate | | | Maturity date | | | Principal | | | Value | |
|
| Pennsylvania (continued) | |
Cumberland County PA Diakon Lutheran Social Ministries Project (Health Revenue) | | | 5.00 | % | | | 1-1-2027 | | | $ | 1,225,000 | | | $ | 1,387,631 | |
Delaware County PA Vocational & Technical School Authority (Miscellaneous Revenue, Build America Mutual Assurance Company Insured) | | | 5.25 | | | | 11-1-2033 | | | | 2,000,000 | | | | 2,262,860 | |
Johnstown PA School District (GO Revenue, AGM Insured) | | | 5.00 | | | | 8-1-2024 | | | | 2,730,000 | | | | 3,006,413 | |
Lancaster County PA Solid Waste Management Authority Series A (Resource Recovery Revenue) | | | 5.25 | | | | 12-15-2028 | | | | 5,665,000 | | | | 6,477,474 | |
Lycoming County PA Authority Pennsylvania College of Technology (Education Revenue) | | | 5.50 | | | | 7-1-2026 | | | | 4,000,000 | | | | 4,473,120 | |
Northampton County PA General Purpose Authority College Refunding Bond (Education Revenue) | | | 5.00 | | | | 11-1-2027 | | | | 1,000,000 | | | | 1,232,300 | |
Northeastern Pennsylvania Hospital & Education Authority Series A (Education Revenue) | | | 5.00 | | | | 3-1-2026 | | | | 515,000 | | | | 603,688 | |
Northeastern Pennsylvania Hospital & Education Authority Series A (Education Revenue) | | | 5.00 | | | | 3-1-2028 | | | | 660,000 | | | | 762,128 | |
Pennsylvania Capital Region Water Sewer System (Water & Sewer Revenue) | | | 5.00 | | | | 7-15-2030 | | | | 1,180,000 | | | | 1,413,345 | |
Pennsylvania Certificate of Participation Retained Basic Lease Payment (Miscellaneous Revenue, AGM Insured) | | | 5.00 | | | | 11-1-2022 | | | | 3,015,000 | | | | 3,349,876 | |
Pennsylvania Certificate of Participation Retained Basic Lease Payment (Miscellaneous Revenue, AGM Insured) | | | 5.00 | | | | 11-1-2023 | | | | 1,900,000 | | | | 2,142,858 | |
Pennsylvania Certificate of Participation Retained Basic Lease Payment (Miscellaneous Revenue, AGM Insured) | | | 5.00 | | | | 11-1-2024 | | | | 1,660,000 | | | | 1,896,550 | |
Pennsylvania HEFAR Series AQ (Education Revenue) | | | 5.00 | | | | 6-15-2023 | | | | 6,090,000 | | | | 7,001,734 | |
Pennsylvania HEFAR Series AR (Education Revenue) | | | 5.00 | | | | 6-15-2025 | | | | 1,000,000 | | | | 1,189,150 | |
Pennsylvania HEFAR Series AS (Education Revenue) | | | 5.00 | | | | 6-15-2025 | | | | 1,575,000 | | | | 1,872,911 | |
Pennsylvania HEFAR Series AS (Education Revenue) | | | 5.00 | | | | 6-15-2027 | | | | 2,190,000 | | | | 2,636,125 | |
Pennsylvania HEFAR Series LL1 (Education Revenue) | | | 5.00 | | | | 11-1-2019 | | | | 880,000 | | | | 902,660 | |
Pennsylvania HEFAR Series LL1 (Education Revenue) | | | 5.00 | | | | 11-1-2020 | | | | 590,000 | | | | 610,225 | |
Pennsylvania HEFAR Series LL1 (Education Revenue) | | | 5.00 | | | | 11-1-2022 | | | | 1,310,000 | | | | 1,363,998 | |
Pennsylvania Hills PA School District (GO Revenue, Build America Mutual Assurance Company Insured) | | | 4.00 | | | | 10-1-2021 | | | | 1,460,000 | | | | 1,577,983 | |
Pennsylvania Public School Building Authority (Miscellaneous Revenue, Build America Mutual Assurance Company Insured) | | | 4.00 | | | | 5-15-2021 | | | | 500,000 | | | | 533,065 | |
Pennsylvania Public School Building Authority (Miscellaneous Revenue, Build America Mutual Assurance Company Insured) | | | 4.00 | | | | 5-15-2022 | | | | 1,000,000 | | | | 1,063,780 | |
Pennsylvania Public School Building Authority (Miscellaneous Revenue) | | | 5.00 | | | | 4-1-2020 | | | | 5,600,000 | | | | 5,929,952 | |
Pennsylvania Public School Building Authority (Education Revenue) | | | 5.00 | | | | 5-1-2023 | | | | 2,185,000 | | | | 2,505,124 | |
Pennsylvania Public School Building Authority (Education Revenue) | | | 5.00 | | | | 6-15-2025 | | | | 2,265,000 | | | | 2,635,984 | |
Pennsylvania Public School Building Authority (Miscellaneous Revenue) | | | 5.00 | | | | 4-1-2029 | | | | 1,000,000 | | | | 1,072,910 | |
Pennsylvania Public School Building Authority Series A (Miscellaneous Revenue, AGM Insured, Citibank NA LIQ) ø144A | | | 1.86 | | | | 12-1-2023 | | | | 5,000,000 | | | | 5,000,000 | |
Pennsylvania Public School Building Authority Series B (Miscellaneous Revenue, AGM Insured) | | | 5.00 | | | | 6-1-2029 | | | | 2,000,000 | | | | 2,362,820 | |
Pennsylvania Public School Building Authority Series B-2 (Miscellaneous Revenue, Build America Mutual Assurance Company Insured) | | | 5.00 | | | | 12-1-2024 | | | | 1,250,000 | | | | 1,464,500 | |
Pennsylvania Public School Building Authority Series B-2 (Miscellaneous Revenue, Build America Mutual Assurance Company Insured) | | | 5.00 | | | | 12-1-2025 | | | | 1,250,000 | | | | 1,458,413 | |
Pennsylvania Public School Building Authority Series B-2 (Miscellaneous Revenue, Build America Mutual Assurance Company Insured) | | | 5.00 | | | | 12-1-2026 | | | | 1,250,000 | | | | 1,454,088 | |
Pennsylvania Public School Building Authority Series B-2 (Miscellaneous Revenue, Build America Mutual Assurance Company Insured) | | | 5.00 | | | | 12-1-2027 | | | | 1,010,000 | | | | 1,172,105 | |
Pennsylvania Series 2 (GO Revenue) | | | 5.00 | | | | 4-15-2023 | | | | 2,000,000 | | | | 2,087,820 | |
The accompanying notes are an integral part of these financial statements.
| | | | |
| 28 | | Wells Fargo Intermediate Tax/AMT-Free Fund | | Portfolio of investments—December 31, 2017 (unaudited) |
| | | | | | | | | | | | | | | | |
| Security name | | Interest rate | | | Maturity date | | | Principal | | | Value | |
|
| Pennsylvania (continued) | |
Pennsylvania State Public School Building Authority City of Harrisburg Project Series A (Miscellaneous Revenue, AGM Insured) | | | 5.00 | % | | | 12-1-2028 | | | $ | 3,500,000 | | | $ | 4,170,355 | |
Pennsylvania State Public School Building Authority City of Harrisburg Project Series A (Miscellaneous Revenue, AGM Insured) | | | 5.00 | | | | 12-1-2033 | | | | 4,425,000 | | | | 5,168,931 | |
Pennsylvania State Public School Building Authority Chester Upland School District Project Series B (Miscellaneous Revenue) | | | 5.25 | | | | 9-15-2030 | | | | 2,000,000 | | | | 2,343,120 | |
Pennsylvania State Public School Building Authority Philadelphia School District Project (Miscellaneous Revenue) | | | 5.00 | | | | 4-1-2024 | | | | 2,000,000 | | | | 2,185,740 | |
Pennsylvania Turnpike Commission Motor License Fund-Enhanced Refunding Bond (Transportation Revenue) | | | 5.00 | | | | 6-1-2027 | | | | 1,000,000 | | | | 1,205,680 | |
Pennsylvania Turnpike Commission Motor License Fund-Enhanced Refunding Bond (Transportation Revenue) | | | 5.00 | | | | 6-1-2028 | | | | 1,500,000 | | | | 1,794,630 | |
Pennsylvania Turnpike Commission Refunding Bond (Transportation Revenue) | | | 5.00 | | | | 12-1-2033 | | | | 3,780,000 | | | | 4,386,690 | |
Pennsylvania Turnpike Commission Subordinate Series B (Transportation Revenue) | | | 5.00 | | | | 6-1-2029 | | | | 690,000 | | | | 806,424 | |
Pennsylvania Turnpike Commission Subordinate Series B (Transportation Revenue) | | | 5.00 | | | | 6-1-2032 | | | | 5,000,000 | | | | 5,792,300 | |
Pennsylvania Turnpike Commission Subordinate Series C (Transportation Revenue, AGM Insured) | | | 6.25 | | | | 6-1-2033 | | | | 1,350,000 | | | | 1,717,740 | |
Pennsylvania Turnpike Commission Subordinate Series E (Transportation Revenue) | | | 6.38 | | | | 12-1-2038 | | | | 2,000,000 | | | | 2,553,220 | |
Philadelphia PA (GO Revenue, AGM Insured) | | | 5.00 | | | | 8-1-2025 | | | | 7,000,000 | | | | 8,291,290 | |
Philadelphia PA IDA (Education Revenue) | | | 6.13 | | | | 6-15-2023 | | | | 1,135,000 | | | | 1,232,939 | |
Philadelphia PA IDA (Education Revenue) | | | 5.88 | | | | 6-15-2022 | | | | 850,000 | | | | 904,740 | |
Philadelphia PA IDA (Education Revenue) | | | 7.00 | | | | 5-1-2026 | | | | 740,000 | | | | 795,604 | |
Philadelphia PA IDA Master Charter School Aid (Education Revenue) | | | 5.00 | | | | 8-1-2020 | | | | 320,000 | | | | 334,410 | |
Philadelphia PA IDA West Philadelphia Achievement Charter Elementary School Project (Education Revenue) | | | 6.25 | | | | 5-1-2021 | | | | 235,000 | | | | 250,101 | |
Philadelphia PA Municipal Authority Juvenile Justice Services Center (Miscellaneous Revenue) | | | 5.00 | | | | 4-1-2031 | | | | 3,630,000 | | | | 4,215,338 | |
Philadelphia PA Municipal Authority Juvenile Justice Services Center (Miscellaneous Revenue) | | | 5.00 | | | | 4-1-2034 | | | | 1,800,000 | | | | 2,066,742 | |
Philadelphia PA School District Refunding Bond Series C (GO Revenue) | | | 5.00 | | | | 9-1-2018 | | | | 8,065,000 | | | | 8,221,864 | |
Philadelphia PA School District Refunding Bond Series C (GO Revenue) | | | 5.00 | | | | 9-1-2021 | | | | 2,200,000 | | | | 2,403,302 | |
Philadelphia PA School District Refunding Bond Series D (GO Revenue) | | | 5.00 | | | | 9-1-2022 | | | | 3,750,000 | | | | 4,161,675 | |
Philadelphia PA School District Refunding Bond Series E (GO Revenue) | | | 5.25 | | | | 9-1-2021 | | | | 1,490,000 | | | | 1,594,404 | |
Philadelphia PA School District Refunding Bond Series F (GO Revenue) | | | 5.00 | | | | 9-1-2028 | | | | 5,000,000 | | | | 5,716,550 | |
Philadelphia PA School District Refunding Bond Series F (GO Revenue) | | | 5.00 | | | | 9-1-2029 | | | | 5,000,000 | | | | 5,675,900 | |
Philadelphia PA School District Refunding Bond Series F (GO Revenue) | | | 5.00 | | | | 9-1-2031 | | | | 1,240,000 | | | | 1,392,656 | |
Philadelphia PA School District Refunding Bond Series F (GO Revenue) | | | 5.00 | | | | 9-1-2032 | | | | 1,000,000 | | | | 1,118,330 | |
Philadelphia PA Series A (GO Revenue) | | | 5.00 | | | | 8-1-2024 | | | | 1,000,000 | | | | 1,161,940 | |
Philadelphia PA Series A (GO Revenue) | | | 5.00 | | | | 7-15-2026 | | | | 3,000,000 | | | | 3,452,040 | |
Philadelphia PA Series A (GO Revenue) | | | 5.00 | | | | 8-1-2027 | | | | 1,500,000 | | | | 1,804,860 | |
Philadelphia PA Series A (GO Revenue) | | | 5.00 | | | | 8-1-2033 | | | | 2,000,000 | | | | 2,365,520 | |
Philadelphia PA Series A (GO Revenue) | | | 5.25 | | | | 7-15-2028 | | | | 2,590,000 | | | | 3,003,856 | |
Philadelphia PA Series A (GO Revenue) | | | 5.25 | | | | 7-15-2029 | | | | 4,410,000 | | | | 5,106,648 | |
Philadelphia PA Series A (GO Revenue) | | | 5.25 | | | | 7-15-2032 | | | | 4,380,000 | | | | 5,032,138 | |
Philadelphia PA Water and Wastewater Bond Series B (Water & Sewer Revenue) | | | 5.00 | | | | 11-1-2027 | | | | 1,535,000 | | | | 1,887,037 | |
Philadelphia PA Water and Wastewater Bond Series B (Water & Sewer Revenue) | | | 5.00 | | | | 11-1-2033 | | | | 1,760,000 | | | | 2,100,595 | |
Pittsburgh PA Moon Area School District Series A (GO Revenue) | | | 5.00 | | | | 11-15-2029 | | | | 1,000,000 | | | | 1,170,570 | |
Pittsburgh PA Series A (GO Revenue) | | | 4.00 | | | | 9-1-2022 | | | | 1,000,000 | | | | 1,090,430 | |
Pittsburgh PA Series A (GO Revenue) | | | 5.00 | | | | 9-1-2022 | | | | 2,060,000 | | | | 2,338,594 | |
Pittsburgh PA Series A (GO Revenue) | | | 5.00 | | | | 9-1-2023 | | | | 3,810,000 | | | | 4,301,681 | |
The accompanying notes are an integral part of these financial statements.
| | | | | | |
| Portfolio of investments—December 31, 2017 (unaudited) | | Wells Fargo Intermediate Tax/AMT-Free Fund | | | 29 | |
| | | | | | | | | | | | | | | | |
| Security name | | Interest rate | | | Maturity date | | | Principal | | | Value | |
| | | | |
| Pennsylvania (continued) | | | | | | | | | | | | | | | | |
Reading Berks PA Series A (GO Revenue, Build America Mutual Assurance Company Insured) | | | 5.00 | % | | | 11-1-2026 | | | $ | 1,000,000 | | | $ | 1,176,110 | |
Reading PA School District (GO Revenue) | | | 5.00 | | | | 4-1-2021 | | | | 3,120,000 | | | | 3,386,916 | |
Reading PA School District (GO Revenue, AGM Insured) | | | 5.00 | | | | 3-1-2037 | | | | 2,000,000 | | | | 2,314,780 | |
Reading PA School District (GO Revenue, AGM Insured) | | | 5.00 | | | | 3-1-2038 | | | | 1,735,000 | | | | 2,005,070 | |
Southeastern Pennsylvania Transportation Authority (Miscellaneous Revenue) | | | 5.00 | | | | 3-1-2028 | | | | 725,000 | | | | 895,817 | |
York County PA School of Technology Series A (Miscellaneous Revenue, Build America Mutual Assurance Company Insured) | | | 5.00 | | | | 2-15-2024 | | | | 1,590,000 | | | | 1,844,432 | |
York County PA School of Technology Series B (Miscellaneous Revenue, Build America Mutual Assurance Company Insured) | | | 5.00 | | | | 2-15-2027 | | | | 800,000 | | | | 940,440 | |
York County PA School of Technology Series B (Miscellaneous Revenue, Build America Mutual Assurance Company Insured) | | | 5.00 | | | | 2-15-2029 | | | | 500,000 | | | | 582,410 | |
| | | | |
| | | | | | | | | | | | | | | 241,427,566 | |
| | | | | | | | | | | | | | | | |
|
| Rhode Island: 0.09% | |
Providence RI Series A (GO Revenue, AGM Insured) | | | 4.00 | | | | 1-15-2018 | | | | 2,115,000 | | | | 2,116,755 | |
| | | | | | | | | | | | | | | | |
|
| South Carolina: 1.42% | |
Connector 2000 Association Incorporated CAB Series A (Transportation Revenue) ¤ | | | 0.00 | | | | 1-1-2018 | | | | 39,781 | | | | 39,781 | |
Laurens County SC Education Assistance for District #55 (Miscellaneous Revenue) | | | 5.00 | | | | 12-1-2021 | | | | 1,000,000 | | | | 1,101,990 | |
Laurens County SC Education Assistance for District #55 (Miscellaneous Revenue) | | | 5.00 | | | | 12-1-2022 | | | | 1,250,000 | | | | 1,403,388 | |
Laurens County SC Education Assistance for District #55 (Miscellaneous Revenue) | | | 5.00 | | | | 12-1-2025 | | | | 1,000,000 | | | | 1,172,930 | |
Piedmont SC Municipal Power Agency Prerefunded Bond Series A-3 (Utilities Revenue) | | | 5.25 | | | | 1-1-2019 | | | | 965,000 | | | | 965,000 | |
Piedmont SC Municipal Power Agency Unrefunded Bond Series A-3 (Utilities Revenue) | | | 5.25 | | | | 1-1-2019 | | | | 2,535,000 | | | | 2,535,000 | |
Scago SC Educational Facilities Corporation For Sumter County School District #17 (Miscellaneous Revenue) | | | 4.00 | | | | 12-1-2019 | | | | 1,000,000 | | | | 1,033,680 | |
Scago SC Educational Facilities Corporation For Sumter County School District #17 (Miscellaneous Revenue) | | | 5.00 | | | | 12-1-2022 | | | | 1,720,000 | | | | 1,925,127 | |
South Carolina Education Assistance Authority Student Loan Series I (Education Revenue) | | | 5.00 | | | | 10-1-2024 | | | | 2,170,000 | | | | 2,259,686 | |
South Carolina Jobs EDA East Point Academy Project Series A (Education Revenue) 144A | | | 2.25 | | | | 5-1-2019 | | | | 2,875,000 | | | | 2,858,181 | |
South Carolina Jobs EDA Furman University Project (Education Revenue) | | | 5.00 | | | | 10-1-2028 | | | | 700,000 | | | | 833,350 | |
South Carolina Jobs EDA Furman University Project (Education Revenue) | | | 5.00 | | | | 10-1-2030 | | | | 1,885,000 | | | | 2,230,879 | |
South Carolina Jobs EDA Furman University Project (Education Revenue) | | | 5.00 | | | | 10-1-2031 | | | | 2,155,000 | | | | 2,543,740 | |
South Carolina Jobs EDA York Preparatory Academy Project Series A (Education Revenue) | | | 7.00 | | | | 11-1-2033 | | | | 1,000,000 | | | | 1,078,430 | |
South Carolina Public Service Authority Series A (Miscellaneous Revenue) | | | 5.00 | | | | 12-1-2033 | | | | 10,800,000 | | | | 12,438,252 | |
University of South Carolina Athletic Facilities Series A (Education Revenue) | | | 5.00 | | | | 5-1-2027 | | | | 855,000 | | | | 1,037,688 | |
| | | | |
| | | | | | | | | | | | | | | 35,457,102 | |
| | | | | | | | | | | | | | | | |
|
| South Dakota: 0.04% | |
Rapid City SD Airport Project (Airport Revenue) | | | 6.25 | | | | 12-1-2026 | | | | 920,000 | | | | 999,092 | |
| | | | | | | | | | | | | | | | |
|
| Tennessee: 0.79% | |
Chattanooga TN Health Educational & Housing Facilities University of Tennessee at Chattanooga Project (Housing Revenue) | | | 5.00 | | | | 10-1-2023 | | | | 750,000 | | | | 858,360 | |
Franklin County TN HEFA (Education Revenue) | | | 4.00 | | | | 9-1-2024 | | | | 250,000 | | | | 268,448 | |
Franklin County TN HEFA (Education Revenue) | | | 5.00 | | | | 9-1-2030 | | | | 560,000 | | | | 624,092 | |
The accompanying notes are an integral part of these financial statements.
| | | | |
| 30 | | Wells Fargo Intermediate Tax/AMT-Free Fund | | Portfolio of investments—December 31, 2017 (unaudited) |
| | | | | | | | | | | | | | | | |
| Security name | | Interest rate | | | Maturity date | | | Principal | | | Value | |
|
| Tennessee (continued) | |
Shelby County TN Health Educational & Housing Facilities Board Le Bonheur Children’s Medical Center Series D (Health Revenue, National Insured) | | | 5.50 | % | | | 8-15-2019 | | | $ | 235,000 | | | $ | 244,116 | |
Tennessee Energy Acquisition Corporation Series A (Utilities Revenue) | | | 4.00 | | | | 5-1-2048 | | | | 14,000,000 | | | | 15,333,780 | |
Tennessee Energy Acquisition Corporation Series A (Utilities Revenue) | | | 5.25 | | | | 9-1-2018 | | | | 1,400,000 | | | | 1,432,508 | |
White County TN (GO Revenue) | | | 4.05 | | | | 6-1-2020 | | | | 1,010,000 | | | | 1,054,491 | |
| | | | |
| | | | | | | | | | | | | | | 19,815,795 | |
| | | | | | | | | | | | | | | | |
|
| Texas: 9.38% | |
Austin TX Airport System Travis, William and Hays Counties Series A (Airport Revenue) | | | 5.00 | | | | 11-15-2046 | | | | 1,000,000 | | | | 1,166,520 | |
Austin TX Independent School District Series B (GO Revenue) | | | 5.00 | | | | 8-1-2023 | | | | 3,805,000 | | | | 4,448,349 | |
Austin TX Independent School District Series B (GO Revenue) | | | 5.00 | | | | 8-1-2024 | | | | 3,970,000 | | | | 4,738,394 | |
Austin TX Independent School District Series B (GO Revenue) | | | 5.00 | | | | 8-1-2025 | | | | 2,050,000 | | | | 2,485,236 | |
Austin TX Independent School District Series B (GO Revenue) | | | 5.00 | | | | 8-1-2026 | | | | 1,450,000 | | | | 1,751,035 | |
Austin TX Refunding Bond (Utilities Revenue, National Insured) | | | 5.25 | | | | 5-15-2025 | | | | 1,400,000 | | | | 1,645,392 | |
Bexar County TX Combination Tax Certificate of Obligation (GO Revenue) | | | 5.00 | | | | 6-15-2024 | | | | 1,000,000 | | | | 1,190,010 | |
Bexar County TX Limited Tax Refunding Bond (GO Revenue) | | | 5.00 | | | | 6-15-2026 | | | | 2,140,000 | | | | 2,600,464 | |
Brownsville TX Utilities System Refunding Bond (Utilities Revenue) | | | 5.00 | | | | 9-1-2026 | | | | 2,190,000 | | | | 2,618,386 | |
Brownsville TX Utilities System Refunding Bond (Utilities Revenue) | | | 5.00 | | | | 9-1-2029 | | | | 1,500,000 | | | | 1,779,465 | |
Brownsville TX Utilities System Refunding Bond (Utilities Revenue) | | | 5.00 | | | | 9-1-2030 | | | | 2,500,000 | | | | 2,954,250 | |
Central Texas Regional Mobility Authority Prerefunded Bond Senior Lien (Transportation Revenue) | | | 5.75 | | | | 1-1-2019 | | | | 985,000 | | | | 1,025,966 | |
Central Texas Regional Mobility Authority Series B (Transportation Revenue) | | | 5.00 | | | | 1-1-2045 | | | | 8,000,000 | | | | 8,678,880 | |
Central Texas Regional Mobility Authority Unrefunded Bond Senior Lien (Transportation Revenue) | | | 5.75 | | | | 1-1-2019 | | | | 325,000 | | | | 337,792 | |
Collin County TX Unlimited Tax Road & Refunding Bond (GO Revenue) | | | 5.00 | | | | 2-15-2023 | | | | 1,350,000 | | | | 1,559,520 | |
Collin County TX Unlimited Tax Road & Refunding Bond (GO Revenue) | | | 5.00 | | | | 2-15-2026 | | | | 1,000,000 | | | | 1,207,640 | |
Collin County TX Unlimited Tax Road & Refunding Bond (GO Revenue) | | | 5.00 | | | | 2-15-2027 | | | | 1,300,000 | �� | | | 1,565,122 | |
Crane County TX Water District Unlimited Tax Bond (GO Revenue) | | | 5.00 | | | | 2-15-2023 | | | | 1,395,000 | | | | 1,597,554 | |
Crane County TX Water District Unlimited Tax Bond (GO Revenue) | | | 5.00 | | | | 2-15-2026 | | | | 1,000,000 | | | | 1,179,170 | |
Crane County TX Water District Unlimited Tax Bond (GO Revenue) | | | 5.00 | | | | 2-15-2030 | | | | 1,130,000 | | | | 1,309,907 | |
Crane County TX Water District Unlimited Tax Bond (GO Revenue) | | | 5.00 | | | | 2-15-2031 | | | | 1,000,000 | | | | 1,145,890 | |
Cypress-Fairbanks TX Independent School District Series B-2 (GO Revenue) | | | 3.00 | | | | 2-15-2040 | | | | 11,260,000 | | | | 11,357,624 | |
Dallas County TX Combination Tax and Parking Garage Certification of Obligation (GO Revenue) | | | 5.00 | | | | 8-15-2024 | | | | 5,600,000 | | | | 6,636,224 | |
Dallas County TX Combination Tax and Parking Garage Certification of Obligation (GO Revenue) | | | 5.00 | | | | 8-15-2025 | | | | 3,235,000 | | | | 3,907,265 | |
Del Rio TX Refunding Bond (GO Revenue, Build America Mutual Assurance Company Insured) | | | 4.00 | | | | 6-1-2023 | | | | 720,000 | | | | 790,394 | |
Del Rio TX Refunding Bond (GO Revenue, Build America Mutual Assurance Company Insured) | | | 4.00 | | | | 6-1-2024 | | | | 745,000 | | | | 826,645 | |
Denton County TX Permanent Improvement & Refunding Bond (GO Revenue) | | | 5.00 | | | | 7-15-2023 | | | | 1,990,000 | | | | 2,323,942 | |
Denton County TX Permanent Improvement & Refunding Bond (GO Revenue) | | | 5.00 | | | | 7-15-2024 | | | | 1,145,000 | | | | 1,365,206 | |
Denton County TX Permanent Improvement & Refunding Bond (GO Revenue) | | | 5.00 | | | | 7-15-2025 | | | | 1,000,000 | | | | 1,194,360 | |
Denton County TX Permanent Improvement & Refunding Bond (GO Revenue) | | | 5.00 | | | | 7-15-2030 | | | | 1,000,000 | | | | 1,185,560 | |
El Paso County TX Hospital District (GO Revenue) | | | 5.00 | | | | 8-15-2028 | | | | 2,045,000 | | | | 2,301,034 | |
El Paso County TX Refunding Bond Series A (GO Revenue) | | | 5.00 | | | | 2-15-2031 | | | | 2,000,000 | | | | 2,352,340 | |
El Paso County TX Refunding Bond Series A (GO Revenue) | | | 5.00 | | | | 2-15-2032 | | | | 2,120,000 | | | | 2,485,022 | |
Flower Mound, Denton & Tarrant Counties TX Refunding Bond (GO Revenue) | | | 4.00 | | | | 3-1-2026 | | | | 755,000 | | | | 849,360 | |
Flower Mound, Denton & Tarrant Counties TX Refunding Bond (GO Revenue) | | | 5.00 | | | | 3-1-2020 | | | | 650,000 | | | | 695,312 | |
The accompanying notes are an integral part of these financial statements.
| | | | | | |
| Portfolio of investments—December 31, 2017 (unaudited) | | Wells Fargo Intermediate Tax/AMT-Free Fund | | | 31 | |
| | | | | | | | | | | | | | | | |
| Security name | | Interest rate | | | Maturity date | | | Principal | | | Value | |
|
| Texas (continued) | |
Flower Mound, Denton & Tarrant Counties TX Refunding Bond (GO Revenue) | | | 5.00 | % | | | 3-1-2022 | | | $ | 1,000,000 | | | $ | 1,127,290 | |
Flower Mound, Denton & Tarrant Counties TX Refunding Bond (GO Revenue) | | | 5.00 | | | | 3-1-2023 | | | | 620,000 | | | | 713,719 | |
Flower Mound, Denton & Tarrant Counties TX Refunding Bond (GO Revenue) | | | 5.00 | | | | 3-1-2024 | | | | 1,660,000 | | | | 1,952,542 | |
Fort Worth TX Independent School District Unlimited Tax Refunding and School Building Bond (GO Revenue) | | | 5.00 | | | | 2-15-2026 | | | | 3,000,000 | | | | 3,656,070 | |
Galveston TX Wharves & Terminal (Airport Revenue) | | | 5.00 | | | | 2-1-2026 | | | | 2,000,000 | | | | 2,123,380 | |
Georgetown TX Independent School District (GO Revenue) | | | 2.00 | | | | 8-1-2034 | | | | 1,630,000 | | | | 1,633,162 | |
Harris County TX Flood Control District Series A (GO Revenue) | | | 5.00 | | | | 10-1-2025 | | | | 1,500,000 | | | | 1,803,525 | |
Harris County TX Tax Road Refunding Bond Series 2014-A (GO Revenue) | | | 5.00 | | | | 10-1-2025 | | | | 8,445,000 | | | | 10,153,846 | |
Harris County TX Tax Road Refunding Bond Series 2015-A (GO Revenue) | | | 5.00 | | | | 10-1-2025 | | | | 4,215,000 | | | | 5,084,344 | |
Harris County TX Toll Road Project Series C (GO Revenue, AGM Insured) | | | 5.25 | | | | 8-15-2027 | | | | 4,000,000 | | | | 5,024,520 | |
Hays County TX Limited Tax Bond (GO Revenue) | | | 5.00 | | | | 2-15-2026 | | | | 650,000 | | | | 793,234 | |
Hays County TX Limited Tax Bond (GO Revenue) | | | 5.00 | | | | 2-15-2027 | | | | 1,000,000 | | | | 1,232,920 | |
Hays County TX Limited Tax Refunding Bond (GO Revenue) | | | 5.00 | | | | 2-15-2023 | | | | 1,750,000 | | | | 2,018,835 | |
Houston TX Airport Senior Lien Series A (Airport Revenue) | | | 5.00 | | | | 7-1-2025 | | | | 1,000,000 | | | | 1,017,080 | |
Houston TX Higher Education Finance Corporation Series A (Education Revenue) | | | 4.00 | | | | 2-15-2022 | | | | 630,000 | | | | 652,252 | |
Houston TX Utilities Systems Series A (Water & Sewer Revenue) | | | 5.25 | | | | 11-15-2031 | | | | 3,000,000 | | | | 3,289,620 | |
Lower Colorado River TX Authority (Utilities Revenue) | | | 5.50 | | | | 5-15-2031 | | | | 2,500,000 | | | | 2,934,750 | |
Midland County TX PFFA Compass Pointe Apartments (Housing Revenue) | | | 1.25 | | | | 3-1-2018 | | | | 2,500,000 | | | | 2,499,500 | |
Midtown TX RDA (Tax Revenue, Build America Mutual Assurance Company Insured) | | | 5.25 | | | | 1-1-2027 | | | | 1,880,000 | | | | 2,117,557 | |
Midtown TX RDA (Tax Revenue, Build America Mutual Assurance Company Insured) | | | 5.25 | | | | 1-1-2029 | | | | 2,390,000 | | | | 2,684,854 | |
Midtown TX RDA (Tax Revenue, Build America Mutual Assurance Company Insured) | | | 5.25 | | | | 1-1-2030 | | | | 1,500,000 | | | | 1,683,555 | |
Midtown TX RDA (Tax Revenue, Build America Mutual Assurance Company Insured) | | | 5.25 | | | | 1-1-2031 | | | | 1,000,000 | | | | 1,121,380 | |
North Harris County TX Regional Water Authority Senior Lien (Water & Sewer Revenue, Build America Mutual Assurance Company Insured) | | | 5.00 | | | | 12-15-2029 | | | | 1,215,000 | | | | 1,367,033 | |
North Texas Higher Education Authority Incoming Student Loan Series A-2 (3 Month LIBOR +0.90%) (Education Revenue) ± | | | 2.24 | | | | 7-1-2030 | | | | 6,055,000 | | | | 6,059,541 | |
Northwest TX Independent School District Refunding Bond (GO Revenue) | | | 5.00 | | | | 2-15-2030 | | | | 4,000,000 | | | | 4,751,360 | |
Nueces River TX Water Supply Facility Corpus Christi Lake Texana Project (Water & Sewer Revenue) | | | 5.00 | | | | 7-15-2026 | | | | 1,000,000 | | | | 1,203,400 | |
Nueces River TX Water Supply Facility Corpus Christi Lake Texana Project (Water & Sewer Revenue) | | | 5.00 | | | | 7-15-2027 | | | | 1,250,000 | | | | 1,495,575 | |
Plano TX (GO Revenue) | | | 5.00 | | | | 9-1-2030 | | | | 2,155,000 | | | | 2,619,187 | |
Port Arthur TX Navigation District Jefferson County Environmental Facilities Motiva Enterprises LLC Project Series C (Resource Recovery Revenue) ø | | | 1.83 | | | | 4-1-2040 | | | | 10,000,000 | | | | 10,000,000 | |
Port Arthur TX Navigation District Motiva Enterprises LLC Project Series A (Resource Recovery Revenue) ø | | | 1.83 | | | | 4-1-2040 | | | | 12,000,000 | | | | 12,000,000 | |
San Antonio TX Junior Lien Series B (Utilities Revenue) | | | 1.75 | | | | 12-1-2027 | | | | 5,000,000 | | | | 5,000,400 | |
Texas Independent School District Refunding Bond (GO Revenue) | | | 5.00 | | | | 8-15-2025 | | | | 2,260,000 | | | | 2,751,008 | |
Texas Municipal Gas Acquisition & Supply Corporation III Gas Supply Series 2012 (Utilities Revenue) | | | 5.00 | | | | 12-15-2021 | | | | 3,945,000 | | | | 4,374,887 | |
Texas Municipal Gas Acquisition & Supply Corporation Series B (Utilities Revenue) | | | 5.00 | | | | 12-15-2022 | | | | 5,000,000 | | | | 5,640,650 | |
Texas Private Activity Bond Surface Transportation Corporation (Transportation Revenue) | | | 7.50 | | | | 6-30-2032 | | | | 2,000,000 | | | | 2,270,260 | |
Texas Private Activity Bond Surface Transportation Corporation (Transportation Revenue) | | | 7.50 | | | | 6-30-2033 | | | | 2,000,000 | | | | 2,265,020 | |
Texas Private Activity Bond Surface Transportation Corporation Senior Lien Note (Transportation Revenue) | | | 7.50 | | | | 12-31-2031 | | | | 3,745,000 | | | | 4,154,329 | |
The accompanying notes are an integral part of these financial statements.
| | | | |
| 32 | | Wells Fargo Intermediate Tax/AMT-Free Fund | | Portfolio of investments—December 31, 2017 (unaudited) |
| | | | | | | | | | | | | | | | |
| Security name | | Interest rate | | | Maturity date | | | Principal | | | Value | |
|
| Texas (continued) | |
Texas SA Energy Acquisition Public Facility Corporation Gas Supply (Utilities Revenue) | | | 5.50 | % | | | 8-1-2019 | | | $ | 1,465,000 | | | $ | 1,545,634 | |
Texas Transportation Commission Highway Fund Series A (Tax Revenue) | | | 5.00 | | | | 10-1-2025 | | | | 3,250,000 | | | | 3,951,415 | |
Texas Transportation Commission Refunding Bond Series B (Miscellaneous Revenue) | | | 5.00 | | | | 10-1-2031 | | | | 5,000,000 | | | | 6,138,000 | |
Texas Water Development Board Series A (Miscellaneous Revenue) | | | 5.00 | | | | 10-15-2031 | | | | 3,000,000 | | | | 3,691,140 | |
Texas Woman’s University Financing System (Education Revenue) | | | 4.00 | | | | 7-1-2020 | | | | 1,000,000 | | | | 1,055,440 | |
University of Houston Texas (Education Revenue) | | | 5.00 | | | | 2-15-2024 | | | | 2,700,000 | | | | 2,801,466 | |
University of Houston Texas Series B (Education Revenue) | | | 5.25 | | | | 7-1-2026 | | | | 4,225,000 | | | | 5,274,110 | |
University of Texas Board of Regents Series D (Education Revenue) | | | 5.00 | | | | 8-15-2026 | | | | 2,000,000 | | | | 2,470,920 | |
Weatherford TX Utility System Refunding & Improvement Bond (Utilities Revenue, AGM Insured) | | | 5.00 | | | | 9-1-2025 | | | | 1,000,000 | | | | 1,192,500 | |
Weatherford TX Utility System Refunding & Improvement Bond (Utilities Revenue, AGM Insured) | | | 5.00 | | | | 9-1-2026 | | | | 375,000 | | | | 448,354 | |
| | | | |
| | | | | | | | | | | | | | | 235,094,794 | |
| | | | | | | | | | | | | | | | |
|
| Utah: 0.36% | |
Canyons UT Board of Education Utah School Bond Guaranty Program (GO Revenue, AGM Insured) | | | 5.00 | | | | 6-15-2022 | | | | 1,860,000 | | | | 2,119,414 | |
Utah Charter School Finance Authority Refunding Bond (Education Revenue, CSCE Insured) | | | 4.00 | | | | 4-15-2020 | | | | 250,000 | | | | 261,215 | |
Utah Charter School Finance Authority Refunding Bond (Education Revenue, CSCE Insured) | | | 4.00 | | | | 4-15-2021 | | | | 400,000 | | | | 423,588 | |
Utah Charter School Finance Authority Refunding Bond (Education Revenue, CSCE Insured) | | | 4.00 | | | | 4-15-2022 | | | | 400,000 | | | | 428,420 | |
Utah Charter School Finance Authority Refunding Bond (Education Revenue, CSCE Insured) | | | 4.00 | | | | 4-15-2023 | | | | 400,000 | | | | 434,260 | |
Utah Charter School Finance Authority Refunding Bond (Education Revenue, CSCE Insured) | | | 4.00 | | | | 4-15-2024 | | | | 450,000 | | | | 492,849 | |
Utah Charter School Finance Authority Refunding Bond (Education Revenue, CSCE Insured) 144A | | | 4.50 | | | | 6-15-2027 | | | | 1,025,000 | | | | 1,027,327 | |
West Valley City UT Municipal Building Authority (Miscellaneous Revenue, AGM Insured) | | | 5.00 | | | | 2-1-2028 | | | | 1,000,000 | | | | 1,219,130 | |
West Valley City UT Municipal Building Authority (Miscellaneous Revenue, AGM Insured) | | | 5.00 | | | | 2-1-2032 | | | | 1,555,000 | | | | 1,857,790 | |
West Valley City UT Municipal Building Authority (Miscellaneous Revenue, AGM Insured) | | | 5.00 | | | | 2-1-2033 | | | | 645,000 | | | | 765,428 | |
| | | | |
| | | | | | | | | | | | | | | 9,029,421 | |
| | | | | | | | | | | | | | | | |
|
| Virgin Islands: 0.04% | |
Virgin Islands PFA Matching Funding Loan Series A (Tax Revenue) | | | 6.75 | | | | 10-1-2019 | | | | 1,320,000 | | | | 970,200 | |
| | | | | | | | | | | | | | | | |
|
| Virginia: 0.64% | |
Greater Richmond VA Convention Center (Tax Revenue) | | | 5.00 | | | | 6-15-2025 | | | | 1,000,000 | | | | 1,189,150 | |
Marquis VA CDA CAB (Tax Revenue) ¤144A | | | 0.00 | | | | 9-1-2045 | | | | 386,000 | | | | 272,354 | |
Marquis VA CDA CAB Series C (Tax Revenue) ¤ | | | 0.00 | | | | 9-1-2041 | | | | 1,772,000 | | | | 230,945 | |
Marquis VA CDA Series B (Tax Revenue) | | | 5.63 | | | | 9-1-2041 | | | | 1,274,000 | | | | 885,239 | |
Prince William County VA IDA Glen Arbor Apartments Project Series A (Housing Revenue) | | | 1.35 | | | | 7-1-2019 | | | | 5,000,000 | | | | 4,986,800 | |
Virginia Resources Authority Pooled Financing Program Series A (Miscellaneous Revenue) | | | 4.00 | | | | 11-1-2025 | | | | 2,370,000 | | | | 2,702,606 | |
Virginia Resources Authority Pooled Financing Program Series A (Miscellaneous Revenue) | | | 5.00 | | | | 11-1-2027 | | | | 1,320,000 | | | | 1,635,348 | |
The accompanying notes are an integral part of these financial statements.
| | | | | | |
| Portfolio of investments—December 31, 2017 (unaudited) | | Wells Fargo Intermediate Tax/AMT-Free Fund | | | 33 | |
| | | | | | | | | | | | | | | | |
| Security name | | Interest rate | | | Maturity date | | | Principal | | | Value | |
|
| Virginia (continued) | |
Virginia Small Business Financing Authority (Education Revenue) | | | 5.25 | % | | | 10-1-2029 | | | $ | 3,000,000 | | | $ | 3,519,150 | |
Watkins Centre VA CDA (Miscellaneous Revenue) | | | 5.40 | | | | 3-1-2020 | | | | 593,000 | | | | 593,652 | |
| | | | |
| | | | | | | | | | | | | | | 16,015,244 | |
| | | | | | | | | | | | | | | | |
|
| Washington: 3.98% | |
Energy Northwest Washington Wind Project (Utilities Revenue) | | | 5.00 | | | | 7-1-2022 | | | | 1,185,000 | | | | 1,332,734 | |
King County WA Federal Way School District #210 (GO Revenue, AGM Insured) | | | 4.00 | | | | 12-1-2023 | | | | 4,085,000 | | | | 4,591,622 | |
King County WA Public Hospital District #1 Valley Medical Center Refunding Bond (GO Revenue) | | | 5.00 | | | | 12-1-2029 | | | | 1,600,000 | | | | 1,878,624 | |
King County WA Public Hospital District #1 Valley Medical Center Refunding Bond (GO Revenue) | | | 5.00 | | | | 12-1-2031 | | | | 6,665,000 | | | | 7,762,726 | |
King County WA Public Hospital District #1 Valley Medical Center Refunding Bond (GO Revenue) | | | 5.00 | | | | 12-1-2032 | | | | 2,905,000 | | | | 3,371,078 | |
King County WA Public Hospital District #1 Valley Medical Center Refunding Bond (GO Revenue) | | | 5.00 | | | | 12-1-2033 | | | | 7,045,000 | | | | 8,151,347 | |
Lewis County WA Public Utility District Refunding Bond (Utilities Revenue) | | | 5.25 | | | | 4-1-2032 | | | | 6,115,000 | | | | 7,148,435 | |
Pierce County WA Puyallup School District #3 (GO Revenue, AGM Insured) | | | 5.00 | | | | 12-1-2032 | | | | 10,000,000 | | | | 12,159,600 | |
Seattle WA Refunding Bond Series A (GO Revenue) | | | 5.00 | | | | 6-1-2024 | | | | 6,345,000 | | | | 7,560,639 | |
Tacoma WA Solid Waste Refunding Bond Series B (Resource Recovery Revenue) | | | 5.00 | | | | 12-1-2027 | | | | 620,000 | | | | 747,342 | |
Tacoma WA Solid Waste Refunding Bond Series B (Resource Recovery Revenue) | | | 5.00 | | | | 12-1-2028 | | | | 1,455,000 | | | | 1,746,466 | |
Tacoma WA Solid Waste Refunding Bond Series B (Resource Recovery Revenue) | | | 5.00 | | | | 12-1-2029 | | | | 1,525,000 | | | | 1,822,772 | |
Washington EDFA (Education Revenue) | | | 5.00 | | | | 6-1-2028 | | | | 1,000,000 | | | | 1,175,710 | |
Washington HCFR Fred Hutchinson Cancer Research Center (SIFMA Municipal Swap +1.05%) (Health Revenue) ± | | | 2.76 | | | | 1-1-2042 | | | | 10,000,000 | | | | 10,021,800 | |
Washington HCFR Fred Hutchinson Cancer Research Center (Health Revenue) | | | 5.00 | | | | 1-1-2023 | | | | 4,000,000 | | | | 4,544,680 | |
Washington HCFR Fred Hutchinson Cancer Research Center (Health Revenue) | | | 5.00 | | | | 1-1-2026 | | | | 2,250,000 | | | | 2,670,075 | |
Washington HCFR Fred Hutchinson Cancer Research Center (Health Revenue) | | | 5.00 | | | | 1-1-2027 | | | | 1,050,000 | | | | 1,239,683 | |
Washington HCFR Fred Hutchinson Cancer Research Center (Health Revenue) | | | 5.00 | | | | 1-1-2028 | | | | 1,350,000 | | | | 1,581,714 | |
Washington Motor Vehicle Fuel Tax Refunding Bond Series D (Miscellaneous Revenue) | | | 5.00 | | | | 7-1-2031 | | | | 5,830,000 | | | | 6,882,898 | |
Washington Office Building Refunding Bond (Miscellaneous Revenue) | | | 5.00 | | | | 7-1-2026 | | | | 2,750,000 | | | | 3,219,068 | |
Washington TES Properties (Miscellaneous Revenue) | | | 5.50 | | | | 12-1-2029 | | | | 1,400,000 | | | | 1,475,460 | |
Washington Various Purposes Refunding Bond Series B (GO Revenue) | | | 5.00 | | | | 7-1-2028 | | | | 7,130,000 | | | | 8,597,782 | |
| | | | |
| | | | | | | | | | | | | | | 99,682,255 | |
| | | | | | | | | | | | | | | | |
|
| West Virginia: 0.34% | |
West Virginia Hospital Finance Authority West Virginia University Health System Series A (Health Revenue) | | | 5.00 | | | | 6-1-2031 | | | | 375,000 | | | | 435,829 | |
West Virginia Hospital Finance Authority West Virginia University Health System Series A (Health Revenue) | | | 5.00 | | | | 6-1-2032 | | | | 950,000 | | | | 1,099,872 | |
West Virginia School Building Authority (Miscellaneous Revenue) | | | 5.25 | | | | 7-1-2020 | | | | 1,100,000 | | | | 1,120,570 | |
West Virginia School Building Authority Capital Improvement Bond Series A (Miscellaneous Revenue) | | | 5.00 | | | | 7-1-2026 | | | | 1,520,000 | | | | 1,816,050 | |
West Virginia School Building Authority Capital Improvement Bond Series A (Miscellaneous Revenue) | | | 5.00 | | | | 7-1-2027 | | | | 1,595,000 | | | | 1,899,581 | |
West Virginia School Building Authority Capital Improvement Bond Series A (Miscellaneous Revenue) | | | 5.00 | | | | 7-1-2029 | | | | 1,755,000 | | | | 2,076,849 | |
| | | | |
| | | | | | | | | | | | | | | 8,448,751 | |
| | | | | | | | | | | | | | | | |
The accompanying notes are an integral part of these financial statements.
| | | | |
| 34 | | Wells Fargo Intermediate Tax/AMT-Free Fund | | Portfolio of investments—December 31, 2017 (unaudited) |
| | | | | | | | | | | | | | | | |
| Security name | | Interest rate | | | Maturity date | | | Principal | | | Value | |
| | | | |
| Wisconsin: 0.66% | | | | | | | | | | | | | | | | |
Milwaukee WI RDA Public Schools (Miscellaneous Revenue) | | | 5.00 | % | | | 11-15-2029 | | | $ | 420,000 | | | $ | 498,620 | |
Milwaukee WI RDA Public Schools (Miscellaneous Revenue) | | | 5.00 | | | | 11-15-2030 | | | | 635,000 | | | | 750,557 | |
Wisconsin HEFA Bellin Memorial Hospital Obligated Group (Health Revenue, Ambac Insured) | | | 5.50 | | | | 2-15-2019 | | | | 210,000 | | | | 214,845 | |
Wisconsin HEFA Mercy Alliance Incorporated Project Series A (Health Revenue) | | | 5.00 | | | | 6-1-2019 | | | | 500,000 | | | | 513,545 | |
Wisconsin HEFA Series A (Health Revenue) | | | 5.00 | | | | 7-15-2021 | | | | 3,500,000 | | | | 3,858,470 | |
Wisconsin HEFA Series A (Health Revenue) | | | 5.00 | | | | 11-15-2023 | | | | 3,500,000 | | | | 4,076,065 | |
Wisconsin PFA Charter School Voyager Foundation Incorporate Project Series A (Education Revenue) | | | 6.00 | | | | 10-1-2032 | | | | 1,475,000 | | | | 1,586,717 | |
Wisconsin PFA KU Campus Development Corporation Central District Development Project (Education Revenue) | | | 5.00 | | | | 3-1-2032 | | | | 4,315,000 | | | | 5,016,835 | |
| | | | |
| | | | | | | | | | | | | | | 16,515,654 | |
| | | | | | | | | | | | | | | | |
| |
Total Municipal Obligations (Cost $2,395,085,879) | | | | 2,471,046,789 | |
| | | | | | | | | | | | | | | | |
| | | | | | | | |
| Total investments in securities (Cost $2,395,085,879) | | | 98.60 | % | | | 2,471,046,789 | |
Other assets and liabilities, net | | | 1.40 | | | | 35,175,374 | |
| | | | | | | | |
| Total net assets | | | 100.00 | % | | $ | 2,506,222,163 | |
| | | | | | | | |
| ø | Variable rate demand notes are subject to a demand feature which reduces the effective maturity. The maturity date shown represents the final maturity date of the security. The interest rate is determined and reset by the issuer daily, weekly, or monthly depending upon the terms of the security. The rate shown is the rate in effect at period end. |
| ¤ | The security is issued in zero coupon form with no periodic interest payments. |
| ± | Variable rate investment. The rate shown is the rate in effect at period end. |
| 144A | The security may be resold in transactions exempt from registration, normally to qualified institutional buyers, pursuant to Rule 144A under the Securities Act of 1933. |
| øø | The interest rate is determined and reset by the issuer periodically depending upon the terms of the security. The rate shown is the rate in effect at period end. |
The accompanying notes are an integral part of these financial statements.
| | | | | | |
| Statement of assets and liabilities—December 31, 2017 (unaudited) | | Wells Fargo Intermediate Tax/AMT-Free Fund | | | 35 | |
| | | | |
| | | | |
| |
Assets | | | | |
Investments in unaffiliated securities, at value (cost $2,395,085,879) | | $ | 2,471,046,789 | |
Cash | | | 9,821,536 | |
Receivable for investments sold | | | 2,296,902 | |
Receivable for Fund shares sold | | | 3,916,376 | |
Receivable for interest | | | 27,172,801 | |
Prepaid expenses and other assets | | | 112,047 | |
| | | | |
Total assets | | | 2,514,366,451 | |
| | | | |
| |
Liabilities | | | | |
Payable for Fund shares redeemed | | | 5,173,894 | |
Dividends payable | | | 1,810,114 | |
Management fee payable | | | 725,190 | |
Administration fees payable | | | 206,295 | |
Distribution fee payable | | | 27,229 | |
Trustees’ fees and expenses payable | | | 2,120 | |
Accrued expenses and other liabilities | | | 199,446 | |
| | | | |
Total liabilities | | | 8,144,288 | |
| | | | |
Total net assets | | $ | 2,506,222,163 | |
| | | | |
| |
NET ASSETS CONSIST OF | | | | |
Paid-in capital | | $ | 2,443,478,920 | |
Overdistributed net investment income | | | (56,348 | ) |
Accumulated net realized losses on investments | | | (13,161,319 | ) |
Net unrealized gains on investments | | | 75,960,910 | |
| | | | |
Total net assets | | $ | 2,506,222,163 | |
| | | | |
| |
COMPUTATION OF NET ASSET VALUE AND OFFERING PRICE PER SHARE | | | | |
Net assets – Class A | | $ | 336,631,374 | |
Shares outstanding – Class A1 | | | 29,279,728 | |
Net asset value per share – Class A | | | $11.50 | |
Maximum offering price per share – Class A2 | | | $11.86 | |
Net assets – Class C | | $ | 41,043,197 | |
Shares outstanding – Class C1 | | | 3,570,072 | |
Net asset value per share – Class C | | | $11.50 | |
Net assets – Administrator Class | | $ | 178,815,415 | |
Shares outstanding – Administrator Class1 | | | 15,544,685 | |
Net asset value per share – Administrator Class | | | $11.50 | |
Net assets – Institutional Class | | $ | 1,949,732,177 | |
Shares outstanding – Institutional Class1 | | | 169,367,779 | |
Net asset value per share – Institutional Class | | | $11.51 | |
| 1 | The Fund has an unlimited number of authorized shares. |
| 2 | Maximum offering price is computed as 100/97 of net asset value. On investments of $50,000 or more, the offering price is reduced. |
The accompanying notes are an integral part of these financial statements.
| | | | |
| 36 | | Wells Fargo Intermediate Tax/AMT-Free Fund | | Statement of operations—six months ended December 31, 2017 (unaudited) |
| | | | |
| | | | |
| |
Investment income | | | | |
Interest | | $ | 38,861,466 | |
| | | | |
| |
Expenses | | | | |
Management fee | | | 4,696,030 | |
Administration fees | | | | |
Class A | | | 280,680 | |
Class C | | | 34,414 | |
Administrator Class | | | 109,060 | |
Institutional Class | | | 785,609 | |
Shareholder servicing fees | | | | |
Class A | | | 438,562 | |
Class C | | | 53,772 | |
Administrator Class | | | 271,721 | |
Distribution fee | | | | |
Class C | | | 161,315 | |
Custody and accounting fees | | | 20,222 | |
Professional fees | | | 38,913 | |
Registration fees | | | 76,355 | |
Shareholder report expenses | | | 76,704 | |
Trustees’ fees and expenses | | | 10,496 | |
Other fees and expenses | | | 34,758 | |
| | | | |
Total expenses | | | 7,088,611 | |
Less: Fee waivers and/or expense reimbursements | | | (475,351 | ) |
| | | | |
Net expenses | | | 6,613,260 | |
| | | | |
Net investment income | | | 32,248,206 | |
| | | | |
| |
REALIZED AND UNREALIZED GAINS (LOSSES) ON INVESTMENTS | | | | |
Net realized losses on investments | | | (5,048,255 | ) |
Net change in unrealized gains (losses) on investments | | | 13,637,318 | |
| | | | |
Net realized and unrealized gains (losses) on investments | | | 8,589,063 | |
| | | | |
Net increase in net assets resulting from operations | | $ | 40,837,269 | |
| | | | |
The accompanying notes are an integral part of these financial statements.
| | | | | | |
| Statement of changes in net assets | | Wells Fargo Intermediate Tax/AMT-Free Fund | | | 37 | |
| | | | | | | | | | | | | | | | |
| | | Six months ended December 31, 2017 (unaudited) | | | Year ended
June 30, 2017 | |
| | | | |
Operations | | | | | | | | | | | | | | | | |
Net investment income | | | | | | $ | 32,248,206 | | | | | | | $ | 64,062,319 | |
Net realized losses on investments | | | | | | | (5,048,255 | ) | | | | | | | (8,075,257 | ) |
Net change in unrealized gains (losses) on investments | | | | | | | 13,637,318 | | | | | | | | (89,693,324 | ) |
| | | | |
Net increase (decrease) in net assets resulting from operations | | | | | | | 40,837,269 | | | | | | | | (33,706,262 | ) |
| | | | |
| | | | |
Distributions to shareholders from | | | | | | | | | | | | | | | | |
Net investment income | | | | | | | | | | | | | | | | |
Class A | | | | | | | (4,062,924 | ) | | | | | | | (10,622,720 | ) |
Class C | | | | | | | (336,910 | ) | | | | | | | (802,651 | ) |
Administrator Class | | | | | | | (2,626,540 | ) | | | | | | | (10,163,943 | ) |
Institutional Class | | | | | | | (25,223,445 | ) | | | | | | | (42,473,839 | ) |
Net realized gains | | | | | | | | | | | | | | | | |
Class A | | | | | | | 0 | | | | | | | | (379,176 | ) |
Class C | | | | | | | 0 | | | | | | | | (40,611 | ) |
Administrator Class | | | | | | | 0 | | | | | | | | (307,288 | ) |
Institutional Class | | | | | | | 0 | | | | | | | | (1,290,263 | ) |
| | | | |
Total distributions to shareholders | | | | | | | (32,249,819 | ) | | | | | | | (66,080,491 | ) |
| | | | |
| | | | |
Capital share transactions | | | Shares | | | | | | | | Shares | | | | | |
Proceeds from shares sold | | | | | | | | | | | | | | | | |
Class A | | | 1,065,106 | | | | 12,263,971 | | | | 3,685,575 | | | | 42,594,614 | |
Class C | | | 108,205 | | | | 1,245,869 | | | | 355,843 | | | | 4,109,114 | |
Administrator Class | | | 2,260,306 | | | | 26,075,513 | | | | 13,127,746 | | | | 150,605,661 | |
Institutional Class | | | 37,070,175 | | | | 427,723,567 | | | | 115,786,751 | | | | 1,335,186,724 | |
| | | | |
| | | | | | | 467,308,920 | | | | | | | | 1,532,496,113 | |
| | | | |
Reinvestment of distributions | | | | | | | | | | | | | | | | |
Class A | | | 335,633 | | | | 3,864,343 | | | | 916,859 | | | | 10,543,676 | |
Class C | | | 26,884 | | | | 309,523 | | | | 65,777 | | | | 755,312 | |
Administrator Class | | | 219,961 | | | | 2,534,355 | | | | 878,060 | | | | 10,125,722 | |
Institutional Class | | | 1,395,138 | | | | 16,085,217 | | | | 2,366,863 | | | | 27,185,815 | |
| | | | |
| | | | | | | 22,793,438 | | | | | | | | 48,610,525 | |
| | | | |
Payment for shares redeemed | | | | | | | | | | | | | | | | |
Class A | | | (3,511,804 | ) | | | (40,463,091 | ) | | | (20,028,317 | ) | | | (228,790,831 | ) |
Class C | | | (445,883 | ) | | | (5,132,130 | ) | | | (1,300,959 | ) | | | (14,894,415 | ) |
Administrator Class | | | (13,954,813 | ) | | | (160,912,301 | ) | | | (54,437,650 | ) | | | (633,876,936 | ) |
Institutional Class | | | (27,296,019 | ) | | | (314,704,099 | ) | | | (65,836,999 | ) | | | (751,450,556 | ) |
| | | | |
| | | | | | | (521,211,621 | ) | | | | | | | (1,629,012,738 | ) |
| | | | |
Net decrease in net assets resulting from capital share transactions | | | | | | | (31,109,263 | ) | | | | | | | (47,906,100 | ) |
| | | | |
Total decrease in net assets | | | | | | | (22,521,813 | ) | | | | | | | (147,692,853 | ) |
| | | | |
| | | | |
Net assets | | | | | | | | | | | | | | | | |
Beginning of period | | | | | | | 2,528,743,976 | | | | | | | | 2,676,436,829 | |
| | | | |
End of period | | | | | | $ | 2,506,222,163 | | | | | | | $ | 2,528,743,976 | |
| | | | |
Overdistributed net investment income | | | | | | $ | (56,348 | ) | | | | | | $ | (54,735 | ) |
| | | | |
The accompanying notes are an integral part of these financial statements.
| | | | |
| 38 | | Wells Fargo Intermediate Tax/AMT-Free Fund | | Financial highlights |
(For a share outstanding throughout each period)
| | | | | | | | | | | | | | | | | | | | | | | | |
| | | Six months ended
December 31, 2017 (unaudited) | | | Year ended June 30 | |
| CLASS A | | | 2017 | | | 2016 | | | 2015 | | | 2014 | | | 2013 | |
Net asset value, beginning of period | | | $11.46 | | | | $11.89 | | | | $11.47 | | | | $11.53 | | | | $11.31 | | | | $11.53 | |
Net investment income | | | 0.13 | | | | 0.27 | | | | 0.26 | | | | 0.25 | | | | 0.30 | | | | 0.28 | |
Net realized and unrealized gains (losses) on investments | | | 0.04 | | | | (0.42 | ) | | | 0.42 | | | | (0.06 | ) | | | 0.29 | | | | (0.18 | ) |
| | | | | | | | | | | | | | | | | | | | | | | | |
Total from investment operations | | | 0.17 | | | | (0.15 | ) | | | 0.68 | | | | 0.19 | | | | 0.59 | | | | 0.10 | |
Distributions to shareholders from | | | | | | | | | | | | | | | | | | | | | | | | |
Net investment income | | | (0.13 | ) | | | (0.27 | ) | | | (0.26 | ) | | | (0.25 | ) | | | (0.30 | ) | | | (0.28 | ) |
Net realized gains | | | 0.00 | | | | (0.01 | ) | | | 0.00 | | | | 0.00 | | | | (0.07 | ) | | | (0.04 | ) |
| | | | | | | | | | | | | | | | | | | | | | | | |
Total distributions to shareholders | | | (0.13 | ) | | | (0.28 | ) | | | (0.26 | ) | | | (0.25 | ) | | | (0.37 | ) | | | (0.32 | ) |
Net asset value, end of period | | | $11.50 | | | | $11.46 | | | | $11.89 | | | | $11.47 | | | | $11.53 | | | | $11.31 | |
Total return1 | | | 1.53 | % | | | (1.27 | )% | | | 5.99 | % | | | 1.68 | % | | | 5.37 | % | | | 0.82 | % |
Ratios to average net assets (annualized) | | | | | | | | | | | | | | | | | | | | | | | | |
Gross expenses | | | 0.79 | % | | | 0.79 | % | | | 0.80 | % | | | 0.80 | % | | | 0.81 | % | | | 0.80 | % |
Net expenses | | | 0.70 | % | | | 0.70 | % | | | 0.70 | % | | | 0.70 | % | | | 0.70 | % | | | 0.70 | % |
Net investment income | | | 2.32 | % | | | 2.31 | % | | | 2.23 | % | | | 2.19 | % | | | 2.66 | % | | | 2.36 | % |
Supplemental data | | | | | | | | | | | | | | | | | | | | | | | | |
Portfolio turnover rate | | | 8 | % | | | 19 | % | | | 14 | % | | | 38 | % | | | 29 | % | | | 24 | % |
Net assets, end of period (000s omitted) | | | $336,631 | | | | $359,649 | | | | $556,673 | | | | $214,880 | | | | $264,796 | | | | $289,931 | |
| 1 | Total return calculations do not include any sales charges. Returns for periods of less than one year are not annualized. |
The accompanying notes are an integral part of these financial statements.
| | | | | | |
| Financial highlights | | Wells Fargo Intermediate Tax/AMT-Free Fund | | | 39 | |
(For a share outstanding throughout each period)
| | | | | | | | | | | | | | | | | | | | | | | | |
| | | Six months ended December 31, 2017 (unaudited) | | | Year ended June 30 | |
| CLASS C | | | 2017 | | | 2016 | | | 2015 | | | 2014 | | | 2013 | |
Net asset value, beginning of period | | | $11.46 | | | | $11.89 | | | | $11.47 | | | | $11.53 | | | | $11.31 | | | | $11.53 | |
Net investment income | | | 0.09 | | | | 0.18 | | | | 0.17 | | | | 0.17 | | | | 0.22 | | | | 0.19 | |
Net realized and unrealized gains (losses) on investments | | | 0.04 | | | | (0.42 | ) | | | 0.42 | | | | (0.06 | ) | | | 0.29 | | | | (0.18 | ) |
| | | | | | | | | | | | | | | | | | | | | | | | |
Total from investment operations | | | 0.13 | | | | (0.24 | ) | | | 0.59 | | | | 0.11 | | | | 0.51 | | | | 0.01 | |
Distributions to shareholders from | | | | | | | | | | | | | | | | | | | | | | | | |
Net investment income | | | (0.09 | ) | | | (0.18 | ) | | | (0.17 | ) | | | (0.17 | ) | | | (0.22 | ) | | | (0.19 | ) |
Net realized gains | | | 0.00 | | | | (0.01 | ) | | | 0.00 | | | | 0.00 | | | | (0.07 | ) | | | (0.04 | ) |
| | | | | | | | | | | | | | | | | | | | | | | | |
Total distributions to shareholders | | | (0.09 | ) | | | (0.19 | ) | | | (0.17 | ) | | | (0.17 | ) | | | (0.29 | ) | | | (0.23 | ) |
Net asset value, end of period | | | $11.50 | | | | $11.46 | | | | $11.89 | | | | $11.47 | | | | $11.53 | | | | $11.31 | |
Total return1 | | | 1.15 | % | | | (2.01 | )% | | | 5.20 | % | | | 0.92 | % | | | 4.59 | % | | | 0.07 | % |
Ratios to average net assets (annualized) | | | | | | | | | | | | | | | | | | | | | | | | |
Gross expenses | | | 1.54 | % | | | 1.54 | % | | | 1.55 | % | | | 1.55 | % | | | 1.56 | % | | | 1.55 | % |
Net expenses | | | 1.45 | % | | | 1.45 | % | | | 1.45 | % | | | 1.45 | % | | | 1.45 | % | | | 1.45 | % |
Net investment income | | | 1.57 | % | | | 1.56 | % | | | 1.48 | % | | | 1.44 | % | | | 1.92 | % | | | 1.61 | % |
Supplemental data | | | | | | | | | | | | | | | | | | | | | | | | |
Portfolio turnover rate | | | 8 | % | | | 19 | % | | | 14 | % | | | 38 | % | | | 29 | % | | | 24 | % |
Net assets, end of period (000s omitted) | | | $41,043 | | | | $44,462 | | | | $56,601 | | | | $56,703 | | | | $57,580 | | | | $72,106 | |
| 1 | Total return calculations do not include any sales charges. Returns for periods of less than one year are not annualized. |
The accompanying notes are an integral part of these financial statements.
| | | | |
| 40 | | Wells Fargo Intermediate Tax/AMT-Free Fund | | Financial highlights |
(For a share outstanding throughout each period)
| | | | | | | | | | | | | | | | | | | | | | | | |
| | | Six months ended December 31, 2017 (unaudited) | | | Year ended June 30 | |
| ADMINISTRATOR CLASS | | | 2017 | | | 2016 | | | 2015 | | | 2014 | | | 2013 | |
Net asset value, beginning of period | | | $11.47 | | | | $11.90 | | | | $11.48 | | | | $11.54 | | | | $11.32 | | | | $11.54 | |
Net investment income | | | 0.14 | | | | 0.28 | | | | 0.27 | | | | 0.27 | | | | 0.31 | | | | 0.29 | |
Net realized and unrealized gains (losses) on investments | | | 0.03 | | | | (0.42 | ) | | | 0.42 | | | | (0.06 | ) | | | 0.29 | | | | (0.18 | ) |
| | | | | | | | | | | | | | | | | | | | | | | | |
Total from investment operations | | | 0.17 | | | | (0.14 | ) | | | 0.69 | | | | 0.21 | | | | 0.60 | | | | 0.11 | |
Distributions to shareholders from | | | | | | | | | | | | | | | | | | | | | | | | |
Net investment income | | | (0.14 | ) | | | (0.28 | ) | | | (0.27 | ) | | | (0.27 | ) | | | (0.31 | ) | | | (0.29 | ) |
Net realized gains | | | 0.00 | | | | (0.01 | ) | | | 0.00 | | | | 0.00 | | | | (0.07 | ) | | | (0.04 | ) |
| | | | | | | | | | | | | | | | | | | | | | | | |
Total distributions to shareholders | | | (0.14 | ) | | | (0.29 | ) | | | (0.27 | ) | | | (0.27 | ) | | | (0.38 | ) | | | (0.33 | ) |
Net asset value, end of period | | | $11.50 | | | | $11.47 | | | | $11.90 | | | | $11.48 | | | | $11.54 | | | | $11.32 | |
Total return1 | | | 1.49 | % | | | (1.17 | )% | | | 6.09 | % | | | 1.78 | % | | | 5.47 | % | | | 0.92 | % |
Ratios to average net assets (annualized) | | | | | | | | | | | | | | | | | | | | | | | | |
Gross expenses | | | 0.73 | % | | | 0.73 | % | | | 0.74 | % | | | 0.74 | % | | | 0.75 | % | | | 0.74 | % |
Net expenses | | | 0.60 | % | | | 0.60 | % | | | 0.60 | % | | | 0.60 | % | | | 0.60 | % | | | 0.60 | % |
Net investment income | | | 2.41 | % | | | 2.39 | % | | | 2.33 | % | | | 2.29 | % | | | 2.76 | % | | | 2.46 | % |
Supplemental data | | | | | | | | | | | | | | | | | | | | | | | | |
Portfolio turnover rate | | | 8 | % | | | 19 | % | | | 14 | % | | | 38 | % | | | 29 | % | | | 24 | % |
Net assets, end of period (000s omitted) | | | $178,815 | | | | $309,793 | | | | $802,527 | | | | $773,770 | | | | $668,517 | | | | $621,627 | |
| 1 | Returns for periods of less than one year are not annualized. |
The accompanying notes are an integral part of these financial statements.
| | | | | | |
| Financial highlights | | Wells Fargo Intermediate Tax/AMT-Free Fund | | | 41 | |
(For a share outstanding throughout each period)
| | | | | | | | | | | | | | | | | | | | | | | | |
| | | Six months ended December 31, 2017 (unaudited) | | | Year ended June 30 | |
| INSTITUTIONAL CLASS | | | 2017 | | | 2016 | | | 2015 | | | 2014 | | | 2013 | |
Net asset value, beginning of period | | | $11.47 | | | | $11.91 | | | | $11.49 | | | | $11.55 | | | | $11.32 | | | | $11.54 | |
Net investment income | | | 0.15 | | | | 0.30 | | | | 0.29 | | | | 0.29 | | | | 0.33 | | | | 0.31 | |
Net realized and unrealized gains (losses) on investments | | | 0.04 | | | | (0.43 | ) | | | 0.42 | | | | (0.06 | ) | | | 0.30 | | | | (0.18 | ) |
| | | | | | | | | | | | | | | | | | | | | | | | |
Total from investment operations | | | 0.19 | | | | (0.13 | ) | | | 0.71 | | | | 0.23 | | | | 0.63 | | | | 0.13 | |
Distributions to shareholders from | | | | | | | | | | | | | | | | | | | | | | | | |
Net investment income | | | (0.15 | ) | | | (0.30 | ) | | | (0.29 | ) | | | (0.29 | ) | | | (0.33 | ) | | | (0.31 | ) |
Net realized gains | | | 0.00 | | | | (0.01 | ) | | | 0.00 | | | | 0.00 | | | | (0.07 | ) | | | (0.04 | ) |
| | | | | | | | | | | | | | | | | | | | | | | | |
Total distributions to shareholders | | | (0.15 | ) | | | (0.31 | ) | | | (0.29 | ) | | | (0.29 | ) | | | (0.40 | ) | | | (0.35 | ) |
Net asset value, end of period | | | $11.51 | | | | $11.47 | | | | $11.91 | | | | $11.49 | | | | $11.55 | | | | $11.32 | |
Total return1 | | | 1.66 | % | | | (1.10 | )% | | | 6.26 | % | | | 1.97 | % | | | 5.75 | % | | | 1.10 | % |
Ratios to average net assets (annualized) | | | | | | | | | | | | | | | | | | | | | | | | |
Gross expenses | | | 0.46 | % | | | 0.47 | % | | | 0.47 | % | | | 0.47 | % | | | 0.48 | % | | | 0.48 | % |
Net expenses | | | 0.45 | % | | | 0.45 | % | | | 0.44 | % | | | 0.42 | % | | | 0.42 | % | | | 0.42 | % |
Net investment income | | | 2.57 | % | | | 2.58 | % | | | 2.49 | % | | | 2.47 | % | | | 2.94 | % | | | 2.65 | % |
Supplemental data | | | | | | | | | | | | | | | | | | | | | | | | |
Portfolio turnover rate | | | 8 | % | | | 19 | % | | | 14 | % | | | 38 | % | | | 29 | % | | | 24 | % |
Net assets, end of period (000s omitted) | | | $1,949,732 | | | | $1,814,841 | | | | $1,260,636 | | | | $878,585 | | | | $599,686 | | | | $461,403 | |
| 1 | Returns for periods of less than one year are not annualized. |
The accompanying notes are an integral part of these financial statements.
| | | | |
| 42 | | Wells Fargo Intermediate Tax/AMT-Free Fund | | Notes to financial statements (unaudited) |
1. ORGANIZATION
Wells Fargo Funds Trust (the “Trust”), a Delaware statutory trust organized on March 10, 1999, is an open-end management investment company registered under the Investment Company Act of 1940, as amended (the “1940 Act”). As an investment company, the Trust follows the accounting and reporting guidance in Financial Accounting Standards Board Accounting Standards Codification Topic 946, Financial Services – Investment Companies. These financial statements report on the Wells Fargo Intermediate Tax/AMT-Free Fund (the “Fund”) which is a diversified series of the Trust.
2. SIGNIFICANT ACCOUNTING POLICIES
The following significant accounting policies, which are consistently followed in the preparation of the financial statements of the Fund, are in conformity with U.S. generally accepted accounting principles which require management to make estimates and assumptions that affect the reported amounts of assets and liabilities, disclosure of contingent assets and liabilities at the date of the financial statements, and the reported amounts of revenues and expenses during the reporting period. Actual results could differ from those estimates.
Securities valuation
All investments are valued each business day as of the close of regular trading on the New York Stock Exchange (generally 4 p.m. Eastern Time), although the Fund may deviate from this calculation time under unusual or unexpected circumstances.
Debt securities are valued at the evaluated bid price provided by an independent pricing service or, if a reliable price is not available, the quoted bid price from an independent broker-dealer.
Futures that are listed on a foreign or domestic exchange or market are valued at the official closing price or, if none, the last sales price.
Investments which are not valued using any of the methods discussed above are valued at their fair value, as determined in good faith by the Board of Trustees of the Fund. The Board of Trustees has established a Valuation Committee comprised of the Trustees and has delegated to it the authority to take any actions regarding the valuation of portfolio securities that the Valuation Committee deems necessary or appropriate, including determining the fair value of portfolio securities, unless the determination has been delegated to the Management Valuation Team of Wells Fargo Funds Management, LLC (“Funds Management”). The Board of Trustees retains the authority to make or ratify any valuation decisions or approve any changes to the Valuation Procedures as it deems appropriate. On a quarterly basis, the Board of Trustees receives reports on any valuation actions taken by the Valuation Committee or the Management Valuation Team which may include items for ratification.
Valuations of fair valued securities are compared to the next actual sales price when available, or other appropriate market values, to assess the continued appropriateness of the fair valuation methodologies used. These securities are fair valued on a day-to-day basis, taking into consideration changes to appropriate market information and any significant changes to the inputs considered in the valuation process until there is a readily available price provided on an exchange or by an independent pricing service. Valuations received from an independent pricing service or independent broker-dealer quotes are periodically validated by comparisons to most recent trades and valuations provided by other independent pricing services in addition to the review of prices by the manager and/or subadviser. Unobservable inputs used in determining fair valuations are identified based on the type of security, taking into consideration factors utilized by market participants in valuing the investment, knowledge about the issuer and the current market environment.
When-issued transactions
The Fund may purchase securities on a forward commitment or when-issued basis. The Fund records a when-issued transaction on the trade date and will segregate assets in an amount at least equal in value to the Fund’s commitment to purchase when-issued securities. Securities purchased on a when-issued basis are marked-to-market daily and the Fund begins earning interest on the settlement date. Losses may arise due to changes in the market value of the underlying securities or if the counterparty does not perform under the contract.
Futures contracts
The Fund is subject to interest rate risk in the normal course of pursuing its investment objectives. The Fund may buy and sell futures contracts in order to gain exposure to, or protect against, changes in interest rates. The primary risks associated with the use of futures contracts are the imperfect correlation between changes in market values of securities held by the Fund and the prices of futures contracts, and the possibility of an illiquid market.
| | | | | | |
| Notes to financial statements (unaudited) | | Wells Fargo Intermediate Tax/AMT-Free Fund | | | 43 | |
The aggregate principal amounts of the contracts are not recorded in the financial statements. Fluctuations in the value of the contracts are recorded in the Statement of Assets and Liabilities as an asset or liability and in the Statement of Operations as unrealized gains or losses until the contracts are closed, at which point they are recorded as net realized gains or losses on futures contracts. With futures contracts, there is minimal counterparty risk to the Fund since futures are exchange traded and the exchange’s clearing house, as counterparty to all exchange traded futures, guarantees the futures against default.
Security transactions and income recognition
Securities transactions are recorded on a trade date basis. Realized gains or losses are recorded on the basis of identified cost.
Interest income is accrued daily and bond discounts are accreted and premiums are amortized daily based on the effective interest method. To the extent debt obligations are placed on non-accrual status, any related interest income may be reduced by writing off interest receivables when the collection of all or a portion of interest has been determined to be doubtful based on consistently applied procedures and the fair value has decreased. If the issuer subsequently resumes interest payments or when the collectability of interest is reasonably assured, the debt obligation is removed from non-accrual status.
Distributions to shareholders
Distributions to shareholders from net investment income are accrued daily and paid monthly. Distributions from net realized gains, if any, are recorded on the ex-dividend date. Such distributions are determined in accordance with income tax regulations and may differ from U.S. generally accepted accounting principles. Dividend sources are estimated at the time of declaration. The tax character of distributions is determined as of the Fund’s fiscal year end. Therefore, a portion of the Fund’s distributions made prior to the Fund’s fiscal year end may be categorized as a tax return of capital.
Federal and other taxes
The Fund intends to continue to qualify as a regulated investment company by distributing substantially all of its investment company taxable and tax-exempt income and any net realized capital gains (after reduction for capital loss carryforwards) sufficient to relieve it from all, or substantially all, federal income taxes. Accordingly, no provision for federal income taxes was required.
The Fund’s income and federal excise tax returns and all financial records supporting those returns for the prior three fiscal years are subject to examination by the federal and Delaware revenue authorities. Management has analyzed the Fund’s tax positions taken on federal, state, and foreign tax returns for all open tax years and does not believe that there are any uncertain tax positions that require recognition of a tax liability.
As of December 31, 2017, the aggregate cost of all investments for federal income tax purposes was $2,395,084,909 and the unrealized gains (losses) consisted of:
| | | | |
Gross unrealized gains | | $ | 94,304,247 | |
Gross unrealized losses | | | (18,342,367 | ) |
Net unrealized gains | | $ | 75,961,880 | |
As of June 30, 2017, the Fund had current year deferred post-October capital losses consisting of $8,053,532 in short-term losses and $60,502 in long-term losses which were recognized on the first day of the current fiscal year.
Class allocations
The separate classes of shares offered by the Fund differ principally in applicable sales charges, distribution, shareholder servicing, and administration fees. Class specific expenses are charged directly to that share class. Investment income, common expenses, and realized and unrealized gains (losses) on investments are allocated daily to each class of shares based on the relative proportion of net assets of each class.
3. FAIR VALUATION MEASUREMENTS
Fair value measurements of investments are determined within a framework that has established a fair value hierarchy based upon the various data inputs utilized in determining the value of the Fund’s investments. The three-level hierarchy gives the highest priority to unadjusted quoted prices in active markets for identical assets or liabilities (Level 1) and the
| | | | |
| 44 | | Wells Fargo Intermediate Tax/AMT-Free Fund | | Notes to financial statements (unaudited) |
lowest priority to unobservable inputs (Level 3). The Fund’s investments are classified within the fair value hierarchy based on the lowest level of input that is significant to the fair value measurement. The inputs are summarized into three broad levels as follows:
| ∎ | | Level 1 – quoted prices in active markets for identical securities |
| ∎ | | Level 2 – other significant observable inputs (including quoted prices for similar securities, interest rates, prepayment speeds, credit risk, etc.) |
| ∎ | | Level 3 – significant unobservable inputs (including the Fund’s own assumptions in determining the fair value of investments) |
The inputs or methodologies used for valuing investments in securities are not necessarily an indication of the risk associated with investing in those securities.
The following is a summary of the inputs used in valuing the Fund’s assets and liabilities as of December 31, 2017:
| | | | | | | | | | | | | | | | |
| | | Quoted prices
(Level 1) | | | Other significant
observable inputs
(Level 2) | | | Significant
unobservable inputs (Level 3) | | | Total | |
Assets | | | | | | | | | | | | | | | | |
Investments in: | | | | | | | | | | | | | | | | |
| | | | |
Municipal obligations | | $ | 0 | | | $ | 2,471,046,789 | | | $ | 0 | | | $ | 2,471,046,789 | |
The Fund recognizes transfers between levels within the fair value hierarchy at the end of the reporting period. At December 31, 2017, the Fund did not have any transfers into/out of Level 1, Level 2, or Level 3.
4. TRANSACTIONS WITH AFFILIATES
Management fee
Funds Management, an indirect wholly owned subsidiary of Wells Fargo & Company (“Wells Fargo”), is the manager of the Fund and provides advisory and fund-level administrative services under an investment management agreement. Under the investment management agreement, Funds Management is responsible for, among other services, implementing the investment objectives and strategies of the Fund, supervising the subadviser, providing fund-level administrative services in connection with the Fund’s operations, and providing any other fund-level administrative services reasonably necessary for the operation of the Fund. As compensation for its services under the investment management agreement, Funds Management is entitled to receive an annual management fee starting at 0.40% and declining to 0.28% as the average daily net assets of the Fund increase. For the six months ended December 31, 2017, the management fee was equivalent to an annual rate of 0.36% of the Fund’s average daily net assets.
Funds Management has retained the services of a subadviser to provide daily portfolio management to the Fund. The fee for subadvisory services is borne by Funds Management. Wells Capital Management Incorporated, an affiliate of Funds Management and an indirect wholly owned subsidiary of Wells Fargo, is the subadviser to the Fund and is entitled to receive a fee from Funds Management at an annual rate starting at 0.20% and declining to 0.10% as the average daily net assets of the Fund increase.
Administration fees
Under a class-level administration agreement, Funds Management provides class-level administrative services to the Fund, which includes paying fees and expenses for services provided by the transfer agent, sub-transfer agents, omnibus account servicers and record-keepers. As compensation for its services under the class-level administration agreement, Funds Management receives an annual fee which is calculated based on the average daily net assets of each class as follows:
| | | | |
| | | Class-level
administration fee | |
Class A, Class C | | | 0.16 | % |
Administrator Class | | | 0.10 | |
Institutional Class | | | 0.08 | |
| | | | | | |
| Notes to financial statements (unaudited) | | Wells Fargo Intermediate Tax/AMT-Free Fund | | | 45 | |
Funds Management has contractually waived and/or reimbursed management and administration fees to the extent necessary to maintain certain net operating expense ratios for the Fund. Waiver of fees and/or reimbursement of expenses by Funds Management were made first from fund level expenses on a proportionate basis and then from class specific expenses. Funds Management has committed through October 31, 2018 to waive fees and/or reimburse expenses to the extent necessary to cap the Fund’s expenses at 0.70% for Class A shares, 1.45% for Class C shares, 0.60% for Administrator Class shares, and 0.45% for Institutional Class shares. After this time, the cap may be increased or the commitment to maintain the cap may be terminated only with the approval of the Board of Trustees.
Distribution fee
The Trust has adopted a distribution plan for Class C shares of the Fund pursuant to Rule 12b-1 under the 1940 Act. A distribution fee is charged to Class C shares and paid to Wells Fargo Funds Distributor, LLC (“Funds Distributor”), the principal underwriter, at an annual rate of 0.75% of the average daily net assets of Class C shares.
In addition, Funds Distributor is entitled to receive the front-end sales charge from the purchase of Class A shares and a contingent deferred sales charge on the redemption of certain Class A shares. Funds Distributor is also entitled to receive the contingent deferred sales charges from redemptions of Class C shares. For the six months ended December 31, 2017, Funds Distributor received $3,064 from the sale of Class A shares and $1,082 in contingent deferred sales charges from redemptions of Class C shares. No contingent deferred sales charges were incurred by Class A shares for the six months ended December 31, 2017.
Shareholder servicing fees
The Trust has entered into contracts with one or more shareholder servicing agents, whereby Class A, Class C, and Administrator Class of the Fund are charged a fee at an annual rate of 0.25% of the average daily net assets of each respective class.
A portion of these total shareholder servicing fees were paid to affiliates of Wells Fargo.
Interfund transactions
The Fund may purchase or sell portfolio investment securities to certain other Wells Fargo affiliates pursuant to Rule 17a-7 under the 1940 Act and under procedures adopted by the Board of Trustees. The procedures have been designed to ensure that these interfund transactions, which do not incur broker commissions, are effected at current market prices. Pursuant to these procedures, the Fund had $114,450,000 and $132,265,000 in interfund purchases and sales, respectively, during the six months ended December 31, 2017.
5. INVESTMENT PORTFOLIO TRANSACTIONS
Purchases and sales of investments, excluding U.S. government obligations (if any) and short-term securities, for the six months ended December 31, 2017 were $204,621,463 and $185,949,533, respectively.
6. BANK BORROWINGS
The Trust (excluding the money market funds and certain other funds) and Wells Fargo Variable Trust are parties to a $280,000,000 revolving credit agreement whereby the Fund is permitted to use bank borrowings for temporary or emergency purposes, such as to fund shareholder redemption requests. Interest under the credit agreement is charged to the Fund based on a borrowing rate equal to the higher of the Federal Funds rate in effect on that day plus 1.25% or the overnight LIBOR rate in effect on that day plus 1.25%. In addition, an annual commitment fee equal to 0.25% of the unused balance is allocated to each participating fund. Prior to August 29, 2017, the revolving credit agreement amount was $250,000,000.
For the six months ended December 31, 2017 there were no borrowings by the Fund under the agreement.
7. INDEMNIFICATION
Under the Trust’s organizational documents, the officers and Trustees have been granted certain indemnification rights against certain liabilities that may arise out of performance of their duties to the Trust. Additionally, in the normal course of business, the Trust may enter into contracts with service providers that contain a variety of indemnification clauses. The Trust’s maximum exposure under these arrangements is dependent on future claims that may be made against the Fund and, therefore, cannot be estimated.
| | | | |
| 46 | | Wells Fargo Intermediate Tax/AMT-Free Fund | | Other information (unaudited) |
PROXY VOTING INFORMATION
A description of the policies and procedures that the Fund uses to determine how to vote proxies relating to portfolio securities is available, upon request, by calling 1-800-222-8222, visiting our website at wellsfargofunds.com, or visiting the SEC website at sec.gov. Information regarding how the Fund voted proxies relating to portfolio securities during the most recent 12-month period ended June 30 is available on the Fund’s website at wellsfargofunds.com or by visiting the SEC website at sec.gov.
PORTFOLIO HOLDINGS INFORMATION
The complete portfolio holdings for the Fund are publicly available monthly on the Fund’s website (wellsfargofunds.com), on a one-month delayed basis. In addition, top ten holdings information (excluding derivative positions) for the Fund is publicly available on the Fund’s website on a monthly, seven-day or more delayed basis. The Fund files its complete schedule of portfolio holdings with the SEC for the first and third quarters of each fiscal year on Form N-Q, which is available by visiting the SEC website at sec.gov. In addition, the Fund’s Form N-Q may be reviewed and copied at the SEC’s Public Reference Room in Washington, DC, and at regional offices in New York City, at 233 Broadway, and in Chicago, at 175 West Jackson Boulevard, Suite 900. Information about the Public Reference Room may be obtained by calling 1-800-SEC-0330.
| | | | | | |
| Other information (unaudited) | | Wells Fargo Intermediate Tax/AMT-Free Fund | | | 47 | |
BOARD OF TRUSTEES AND OFFICERS
Each of the Trustees and Officers1 listed in the table below acts in identical capacities for each fund in the Wells Fargo family of funds, which consists of 153 mutual funds comprising the Wells Fargo Funds Trust, Wells Fargo Variable Trust, Wells Fargo Master Trust and four closed-end funds (collectively the “Fund Complex”). This table should be read in conjunction with the Prospectus and the Statement of Additional Information2. The mailing address of each Trustee and Officer is 525 Market Street, 12th Floor, San Francisco, CA 94105. Each Trustee and Officer serves an indefinite term, however, each Trustee serves such term until reaching the mandatory retirement age established by the Trustees.
Independent Trustees
| | | | | | |
Name and
year of birth | | Position held and
length of service* | | Principal occupations during past five years or longer | | Current other
public company or
investment company
directorships |
| William R. Ebsworth (Born 1957) | | Trustee, since 2015 | | Retired. From 1984 to 2013, equities analyst, portfolio manager, research director and chief investment officer at Fidelity Management and Research Company in Boston, Tokyo, and Hong Kong, and retired in 2013 as Chief Investment Officer of Fidelity Strategic Advisers, Inc. where he led a team of investment professionals managing client assets. Prior thereto, Board member of Hong Kong Securities Clearing Co., Hong Kong Options Clearing Corp., the Thailand International Fund, Ltd., Fidelity Investments Life Insurance Company, and Empire Fidelity Investments Life Insurance Company. Board member of the Forté Foundation (non-profit organization) and the Vincent Memorial Hospital Endowment (non-profit organization), where he serves on the Investment Committee and as a Chair of the Audit Committee. Mr. Ebsworth is a CFA® charterholder. | | Asset Allocation Trust |
| Jane A. Freeman** (Born 1953) | | Trustee, since 2015; Chair Liaison, since 2018 | | Retired. From 2012 to 2014 and 1999 to 2008, Chief Financial Officer of Scientific Learning Corporation. From 2008 to 2012, Ms. Freeman provided consulting services related to strategic business projects. Prior to 1999, Portfolio Manager at Rockefeller & Co. and Scudder, Stevens & Clark. Board member of the Harding Loevner Funds from 1996 to 2014, serving as both Lead Independent Director and chair of the Audit Committee. Board member of the Russell Exchange Traded Funds Trust from 2011 to 2012 and the chair of the Audit Committee. Ms. Freeman is a Board Member of Ruth Bancroft Garden (non-profit organization) and the Glimmerglass Festival. She is also an inactive Chartered Financial Analyst. | | Asset Allocation Trust |
| Peter G. Gordon*** (Born 1942) | | Trustee, since 1998; Chairman, from 2005 to 2017 | | Co-Founder, Retired Chairman, President and CEO of Crystal Geyser Water Company. Trustee Emeritus, Colby College. | | Asset Allocation Trust |
Isaiah Harris, Jr.
(Born 1952) | | Trustee, since 2009 | | Retired. Chairman of the Board of CIGNA Corporation since 2009, and Director since 2005. From 2003 to 2011, Director of Deluxe Corporation. Prior thereto, President and CEO of BellSouth Advertising and Publishing Corp. from 2005 to 2007, President and CEO of BellSouth Enterprises from 2004 to 2005 and President of BellSouth Consumer Services from 2000 to 2003. Emeritus member of the Iowa State University Foundation Board of Governors. Emeritus Member of the Advisory Board of Iowa State University School of Business. Advisory Board Member, Palm Harbor Academy (charter school). Advisory Board Member, Child Evangelism Fellowship (non-profit). Mr. Harris is a certified public accountant (inactive status). | | CIGNA Corporation; Asset Allocation Trust |
| Judith M. Johnson (Born 1949) | | Trustee, since 2008; Audit Committee Chairman, since 2008 | | Retired. Prior thereto, Chief Executive Officer and Chief Investment Officer of Minneapolis Employees Retirement Fund from 1996 to 2008. Ms. Johnson is an attorney, certified public accountant and a certified managerial accountant. | | Asset Allocation Trust |
| David F. Larcker (Born 1950) | | Trustee, since 2009 | | James Irvin Miller Professor of Accounting at the Graduate School of Business, Stanford University, Director of the Corporate Governance Research Initiative and Senior Faculty of The Rock Center for Corporate Governance since 2006. From 2005 to 2008, Professor of Accounting at the Graduate School of Business, Stanford University. Prior thereto, Ernst & Young Professor of Accounting at The Wharton School, University of Pennsylvania from 1985 to 2005. | | Asset Allocation Trust |
| | | | |
| 48 | | Wells Fargo Intermediate Tax/AMT-Free Fund | | Other information (unaudited) |
| | | | | | |
Name and
year of birth | | Position held and
length of service* | | Principal occupations during past five years or longer | | Current other
public company or
investment company
directorships |
| Olivia S. Mitchell**** (Born 1953) | | Trustee, since 2006; Governance Committee Chairman, since 2018 | | International Foundation of Employee Benefit Plans Professor, Wharton School of the University of Pennsylvania since 1993. Director of Wharton’s Pension Research Council and Boettner Center on Pensions & Retirement Research, and Research Associate at the National Bureau of Economic Research. Previously, Cornell University Professor from 1978 to 1993. | | Asset Allocation Trust |
| Timothy J. Penny***** (Born 1951) | | Trustee, since 1996; Chairman, since 2018; Vice Chairman, from 2017 to 2018 | | President and Chief Executive Officer of Southern Minnesota Initiative Foundation, a non-profit organization, since 2007. Member of the Board of Trustees of NorthStar Education Finance, Inc., a non-profit organization, since 2007. | | Asset Allocation Trust |
| James G. Polisson****** (Born 1959) | | Trustee, since 2018; Advisory Board Member, from 2017 to 2018 | | Retired. Chief Marketing Officer, Source (ETF) UK Services, Ltd, from 2015 to 2017. From 2012 to 2015, Principal of The Polisson Group, LLC, a management consulting, corporate advisory and principal investing company. Chief Executive Officer and Managing Director at Russell Investments, Global Exchange Traded Funds from 2010 to 2012. Managing Director of Barclays Global Investors from 1998 to 2010 and Global Chief Marketing Officer for iShares and Barclays Global Investors from 2000 to 2010. Trustee of the San Francisco Mechanics’ Institute, a non-profit organization, from 2013 to 2015. Board member of the Russell Exchange Traded Fund Trust from 2011 to 2012. Director of Barclays Global Investors Holdings Deutschland GmbH from 2006 to 2009. Mr. Polisson is an attorney and has a retired status with the Massachusetts and District of Columbia Bar Associations. | | Asset Allocation Trust |
| Michael S. Scofield (Born 1943) | | Trustee, since 2010 | | Served on the Investment Company Institute’s Board of Governors and Executive Committee from 2008-2011 as well the Governing Council of the Independent Directors Council from 2006-2011 and the Independent Directors Council Executive Committee from 2008-2011. Trustee of the Evergreen Funds complex (and its predecessors) from 1984 to 2010. Chairman of the Evergreen Funds from 2000-2010. Former Trustee of the Mentor Funds. Retired Attorney, Law Offices of Michael S. Scofield. | | Asset Allocation Trust |
Pamela Wheelock******
(Born 1959) | | Trustee, since 2018; Advisory Board Member, from 2017 to 2018 | | Chief Operating Officer, Twin Cities Habitat for Humanity, since January, 2017. Vice President of University Services, University of Minnesota from 2012 to 2017. Prior thereto, Interim President and Chief Executive Officer of Blue Cross Blue Shield of Minnesota from 2010 to 2011, Chairman of the Board from 2009 to 2011 and Board Director from 2003 to 2015. Vice President, Leadership and Community Engagement, Bush Foundation, Saint Paul, Minnesota (a private foundation) from 2009 to 2011. Executive Vice President and Chief Financial Officer, Minnesota Sports and Entertainment from 2004 to 2009 and Senior Vice President from 2002 to 2004. Commissioner of Finance, State of Minnesota, from 1999 to 2002. Currently on the Board of Directors, Governance Committee and Finance Committee, for the Minnesota Philanthropy Partners (Saint Paul Foundation) since 2012 and Board Chair of the Minnesota Wild Foundation since 2010. | | Asset Allocation Trust |
| * | Length of service dates reflect the Trustee’s commencement of service with the Trust’s predecessor entities, where applicable. |
| ** | Jane Freeman became Chair Liaison effective January 1, 2018. |
| *** | Peter Gordon retired on December 31, 2017. |
| **** | Olivia Mitchell became Chairman of the Governance Committee effective January 1, 2018. |
| ***** | Timothy Penny became Chairman effective January 1, 2018. |
| ****** | James Polisson and Pamela Wheelock each became a Trustee effective January 1, 2018. |
| | | | | | |
| Other information (unaudited) | | Wells Fargo Intermediate Tax/AMT-Free Fund | | | 49 | |
Officers
| | | | | | |
Name and
year of birth | | Position held and
length of service | | Principal occupations during past five years or longer | | |
| Andrew Owen (Born 1960) | | President, since 2017 | | Executive Vice President of Wells Fargo & Company and Head of Affiliated Managers, Wells Fargo Asset Management, since 2014. In addition, Mr. Owen is currently President, Chief Executive Officer and Director of Wells Fargo Funds Management, LLC since 2017. Prior thereto, Executive Vice President responsible for marketing, investments and product development for Wells Fargo Funds Management, LLC, from 2009 to 2014. | | |
| Nancy Wiser1 (Born 1967) | | Treasurer, since 2012 | | Executive Vice President of Wells Fargo Funds Management, LLC since 2011. Chief Operating Officer and Chief Compliance Officer at LightBox Capital Management LLC, from 2008 to 2011. | | |
| C. David Messman (Born 1960) | | Secretary, since 2000; Chief Legal Officer, since 2003 | | Senior Vice President and Secretary of Wells Fargo Funds Management, LLC since 2001. Assistant General Counsel of Wells Fargo Bank, N.A. since 2013 and Vice President and Managing Counsel of Wells Fargo Bank, N.A. from 1996 to 2013. | | |
| Michael H. Whitaker (Born 1967) | | Chief Compliance Officer, since 2016 | | Senior Vice President and Chief Compliance Officer since 2016. Senior Vice President and Chief Compliance Officer for Fidelity Investments from 2007 to 2016. | | |
| David Berardi (Born 1975) | | Assistant Treasurer, since 2009 | | Vice President of Wells Fargo Funds Management, LLC since 2009. Vice President of Evergreen Investment Management Company, LLC from 2008 to 2010. Manager of Fund Reporting and Control for Evergreen Investment Management Company, LLC from 2004 to 2010. | | |
| Jeremy DePalma1 (Born 1974) | | Assistant Treasurer, since 2009 | | Senior Vice President of Wells Fargo Funds Management, LLC since 2009. Senior Vice President of Evergreen Investment Management Company, LLC from 2008 to 2010 and head of the Fund Reporting and Control Team within Fund Administration from 2005 to 2010. | | |
| 1 | Nancy Wiser acts as Treasurer of 77 funds in the Fund Complex. Jeremy DePalma acts as Treasurer of 76 funds and Assistant Treasurer of 77 funds in the Fund Complex. |
| 2 | The Statement of Additional Information includes additional information about the Trustees and is available, without charge, upon request, by calling 1-800-222-8222 or by visiting the website at wellsfargofunds.com. |
| | | | |
| 50 | | Wells Fargo Intermediate Tax/AMT-Free Fund | | List of abbreviations |
The following is a list of common abbreviations for terms and entities that may have appeared in this report.
| ACA | — ACA Financial Guaranty Corporation |
| ADR | — American depositary receipt |
| ADS | — American depositary shares |
| AGC | — Assured Guaranty Corporation |
| AGM | — Assured Guaranty Municipal |
| Ambac | — Ambac Financial Group Incorporated |
| AMT | — Alternative minimum tax |
| BAN | — Bond anticipation notes |
| BHAC | — Berkshire Hathaway Assurance Corporation |
| CAB | — Capital appreciation bond |
| CCAB | — Convertible capital appreciation bond |
| CDA | — Community Development Authority |
| CDO | — Collateralized debt obligation |
| CLO | — Collateralized loan obligation |
| DRIVER | — Derivative inverse tax-exempt receipts |
| DW&P | — Department of Water & Power |
| DWR | — Department of Water Resources |
| ECFA | — Educational & Cultural Facilities Authority |
| EDA | — Economic Development Authority |
| EDFA | — Economic Development Finance Authority |
| ETF | — Exchange-traded fund |
| FDIC | — Federal Deposit Insurance Corporation |
| FFCB | — Federal Farm Credit Banks |
| FGIC | — Financial Guaranty Insurance Corporation |
| FHA | — Federal Housing Administration |
| FHLB | — Federal Home Loan Bank |
| FHLMC | — Federal Home Loan Mortgage Corporation |
| FICO | — The Financing Corporation |
| FNMA | — Federal National Mortgage Association |
| GDR | — Global depositary receipt |
| GNMA | — Government National Mortgage Association |
| HCFR | — Healthcare facilities revenue |
| HEFA | — Health & Educational Facilities Authority |
| HEFAR | — Higher education facilities authority revenue |
| HFA | — Housing Finance Authority |
| HFFA | — Health Facilities Financing Authority |
| HUD | — Department of Housing and Urban Development |
| IDA | — Industrial Development Authority |
| IDAG | — Industrial Development Agency |
| KRW | — Republic of Korea won |
| LIBOR | — London Interbank Offered Rate |
| LIFER | — Long Inverse Floating Exempt Receipts |
| LLC | — Limited liability company |
| LLLP | — Limited liability limited partnership |
| LLP | — Limited liability partnership |
| MBIA | — Municipal Bond Insurance Association |
| MFHR | — Multifamily housing revenue |
| MSTR | — Municipal securities trust receipts |
| MUD | — Municipal Utility District |
| National | — National Public Finance Guarantee Corporation |
| PCFA | — Pollution Control Financing Authority |
| PCL | — Public Company Limited |
| PCR | — Pollution control revenue |
| PFA | — Public Finance Authority |
| PFFA | — Public Facilities Financing Authority |
| PFOTER | — Puttable floating option tax-exempt receipts |
| PJSC | — Public Joint Stock Company |
| plc | — Public limited company |
| PUTTER | — Puttable tax-exempt receipts |
| R&D | — Research & development |
| Radian | — Radian Asset Assurance |
| RAN | — Revenue anticipation notes |
| RDA | — Redevelopment Agency |
| RDFA | — Redevelopment Finance Authority |
| REIT | — Real estate investment trust |
| ROC | — Reset option certificates |
| SAVRS | — Select auction variable rate securities |
| SBA | — Small Business Authority |
| SDR | — Swedish depositary receipt |
| SFHR | — Single-family housing revenue |
| SFMR | — Single-family mortgage revenue |
| SIFMA | — Securities Industry and Financial Markets Association |
| SPA | — Standby purchase agreement |
| SPDR | — Standard & Poor’s Depositary Receipts |
| SPEAR | — Short Puttable Exempt Adjustable Receipts |
| STRIPS | — Separate trading of registered interest and |
| TAN | — Tax anticipation notes |
| TIPS | — Treasury inflation-protected securities |
| TRAN | — Tax revenue anticipation notes |
| TTFA | — Transportation Trust Fund Authority |
| TVA | — Tennessee Valley Authority |
This page is intentionally left blank.
This page is intentionally left blank.

For more information
More information about Wells Fargo Funds is available free upon request. To obtain literature, please write, email, visit the Fund’s website, or call:
Wells Fargo Funds
P.O. Box 8266
Boston, MA 02266-8266
Email: fundservice@wellsfargo.com
Website: wellsfargofunds.com
Individual investors: 1-800-222-8222
Retail investment professionals: 1-888-877-9275
Institutional investment professionals: 1-866-765-0778
This report and the financial statements contained herein are submitted for the general information of the shareholders of the Fund. If this report is used for promotional purposes, distribution of the report must be accompanied or preceded by a current prospectus. Before investing, please consider the investment objectives, risks, charges, and expenses of the investment. For a current prospectus and, if available, a summary prospectus, containing this information, call 1-800-222-8222 or visit the Fund’s website at wellsfargofunds.com. Read the prospectus carefully before you invest or send money.
Wells Fargo Asset Management (WFAM) is a trade name used by the asset management businesses of Wells Fargo & Company. Wells Fargo Funds Management, LLC, a wholly owned subsidiary of Wells Fargo & Company, provides investment advisory and administrative services for Wells Fargo Funds. Other affiliates of Wells Fargo & Company provide subadvisory and other services for the funds. The funds are distributed by Wells Fargo Funds Distributor, LLC, Member FINRA, an affiliate of Wells Fargo & Company. Neither Wells Fargo Funds Distributor nor Wells Fargo Funds Management holds fund shareholder accounts or assets. This material is for general informational and educational purposes only and is NOT intended to provide investment advice or a recommendation of any kind—including a recommendation for any specific investment, strategy, or plan.
NOT FDIC INSURED ◾ NO BANK GUARANTEE ◾ MAY LOSE VALUE
© 2017 Wells Fargo Funds Management, LLC. All rights reserved.
| | |
 | | 308062 02-18 SA251/SAR251 12-17 |
Semi-Annual Report
December 31, 2017

Wells Fargo Minnesota Tax-Free Fund


Reduce clutter. Save trees.
Sign up for electronic delivery of prospectuses and shareholder reports at wellsfargo.com/advantagedelivery
Contents
The views expressed and any forward-looking statements are as of December 31, 2017, unless otherwise noted, and are those of the Fund managers and/or Wells Fargo Funds Management, LLC. Discussions of individual securities, or the markets generally, or any Wells Fargo Fund are not intended as individual recommendations. Future events or results may vary significantly from those expressed in any forward-looking statements. The views expressed are subject to change at any time in response to changing circumstances in the market. Wells Fargo Funds Management, LLC and the Fund disclaim any obligation to publicly update or revise any views expressed or forward-looking statements.
NOT FDIC INSURED ◾ NO BANK GUARANTEE ◾ MAY LOSE VALUE
| | | | |
| 2 | | Wells Fargo Minnesota Tax-Free Fund | | Letter to shareholders (unaudited) |

Andrew Owen
President
Wells Fargo Funds
In a predominantly improving global economic environment, global stocks delivered strong results; bond markets had smaller but positive results as well.
Dear Shareholder:
We are pleased to offer you this semi-annual report for the Wells Fargo Minnesota Tax -Free Fund for the six-month period that ended December 31, 2017. In a predominantly improving global economic environment, global stocks delivered strong results; bond markets had smaller but positive results as well. U.S. and international stocks delivered similar results, with returns of 11.42% and 11.48%, respectively, for the six-month period, as measured by the S&P 500 Index1 and the MSCI ACWI ex USA Index (Net)2, respectively; within fixed income, the Bloomberg Barclays U.S. Aggregate Bond Index3 returned 1.24% and the Bloomberg Barclays Municipal Bond Index4 returned 1.82%.
As global growth improved in the third quarter of 2017, investment markets generally advanced.
Most stock markets worldwide moved higher during the quarter and ended the period at or near all-time highs. Moderate acceleration in global economic growth was supported by improving corporate earnings, low inflation pressure, and still-low interest rates. Corporate earnings reports were favorable overall as companies continued to benefit from healthy operating leverage. While North Korea’s recent missile launches and nuclear testing raised serious concerns around the world, the heightened geopolitical risk had relatively minimal impact on the quarter’s stock returns. In the U.S., economic data released during the quarter reflected a generally healthy economy. Second-quarter economic output grew at a 3.1% annual rate, and consumers displayed more willingness to spend. Meanwhile, the U.S. Federal Reserve (Fed) maintained the target range for the federal funds rate at 1.00% to 1.25%, noting that inflation had remained below the Fed’s 2.00% objective. However, the Fed also stated the possibility of one more 0.25% increase in the federal funds rate by the end of 2017 and announced plans to begin the process of unwinding its $4.5 trillion portfolio of bonds and other assets in October. Outside the U.S., stocks in the Asia Pacific region benefited from solid earnings reports and investors’ willingness to take on risk despite the rising tensions between North Korea and the U.S. In Europe, markets were supported by better-than-expected economic growth, which led to narrowing of the gap between Europe’s growth rate and that of the U.S. In emerging markets, many countries benefited from stronger currencies versus the U.S. dollar.
Positive economic and market news continued through the fourth quarter.
During the fourth quarter of 2017, stock markets followed a steady, upward trajectory with no meaningful pullbacks, similar to their paths during the previous three quarters of the year. The extended rally was driven largely by reports of strong earnings and revenue surprises from many companies. Synchronous economic expansion worldwide with mild inflation provided a favorable environment for markets to rise with minimal volatility. Data released during the quarter reflected a
| 1 | The S&P 500 Index consists of 500 stocks chosen for market size, liquidity, and industry group representation. It is a market-value-weighted index with each stock’s weight in the index proportionate to its market value. You cannot invest directly in an index. |
| 2 | The Morgan Stanley Capital International (MSCI) All Country World Index (ACWI) ex USA Index (Net) is a free-float-adjusted market-capitalization-weighted index that is designed to measure the equity market performance of developed markets, excluding the United States and Canada. Source: MSCI. MSCI makes no express or implied warranties or representations and shall have no liability whatsoever with respect to any MSCI data contained herein. The MSCI data may not be further redistributed or used as a basis for other indices or any securities or financial products. This report is not approved, reviewed, or produced by MSCI. You cannot invest directly in an index. |
| 3 | The Bloomberg Barclays U.S. Aggregate Bond Index is a broad-based benchmark that measures the investment-grade, U.S. dollar-denominated, fixed-rate taxable bond market, including Treasuries, government-related and corporate securities, mortgage-backed securities (agency fixed-rate and hybrid adjustable-rate mortgage pass-throughs), asset-backed securities, and commercial mortgage-backed securities. You cannot invest directly in an index. |
| 4 | The Bloomberg Barclays Municipal Bond Index is an unmanaged index composed of long-term tax-exempt bonds with a minimum credit rating of Baa. You cannot invest directly in an index. |
| | | | | | |
| Letter to shareholders (unaudited) | | Wells Fargo Minnesota Tax-Free Fund | | | 3 | |
healthy U.S. economy. Third-quarter economic output grew at a 3.2% annual rate, just ahead of the second quarter’s 3.1% pace. Hiring remained solid during the quarter; the hiring pace pushed the unemployment rate down to a 17-year low of 4.1% in October, and it remained at 4.1% for both November and December. Fed officials began unwinding the Fed��s $4.5 trillion portfolio of bonds and other assets in October as planned, and in December they raised the target for the federal funds rate to a range of 1.25% to 1.50%. As a result, long-term interest rates in the U.S. continued trending upward, although the 10-year rate remained below 2.5%. Outside the U.S., economies continued to strengthen. In December, the Organisation for Economic Co-operation and Development (OECD) reported that the global economy has been expanding at its fastest rate since 2010; all 45 countries the OECD follows were on track to expand for 2017. International economies have benefited from catalysts such as economic stimulus, improving employment, increased investment, and accelerated trade growth.
Don’t let short-term uncertainty derail long-term investment goals.
Periods of investment uncertainty can present challenges, but experience has taught us that maintaining long-term investment goals can be an effective way to plan for the future. To help you create a sound strategy based on your personal goals and risk tolerance, Wells Fargo Funds offers more than 100 mutual funds spanning a wide range of asset classes and investment styles. Although diversification cannot guarantee an investment profit or prevent losses, we believe it can be an effective way to manage investment risk and potentially smooth out overall portfolio performance. We encourage investors to know their investments and to understand that appropriate levels of risk-taking may unlock opportunities.
Thank you for choosing to invest with Wells Fargo Funds. We appreciate your confidence in us and remain committed to helping you meet your financial needs.
Sincerely,

Andrew Owen
President
Wells Fargo Funds
Although diversification cannot guarantee an investment profit or prevent losses, we believe it can be an effective way to manage investment risk and potentially smooth out overall portfolio performance.
For further information about your Fund, contact your investment professional, visit our website at wellsfargofunds.com, or call us directly at 1-800-222-8222. We are available 24 hours a day, 7 days a week.
| | | | |
| 4 | | Wells Fargo Minnesota Tax-Free Fund | | Performance highlights (unaudited) |
Investment objective
The Fund seeks current income exempt from federal income tax and Minnesota individual income tax.
Manager
Wells Fargo Funds Management, LLC
Subadviser
Wells Capital Management Incorporated
Portfolio managers
Wendy Casetta
Bruce R. Johns
Average annual total returns (%) as of December 31, 20171
| | | | | | | | | | | | | | | | | | | | | | | | | | | | | | | | | | |
| | | | | Including sales charge | | | Excluding sales charge | | | Expense ratios2 (%) | |
| | | Inception date | | 1 year | | | 5 year | | | 10 year | | | 1 year | | | 5 year | | | 10 year | | | Gross | | | Net3 | |
| Class A (NMTFX) | | 1-12-1988 | | | (0.93 | ) | | | 1.48 | | | | 3.28 | | | | 3.74 | | | | 2.42 | | | | 3.75 | | | | 0.90 | | | | 0.85 | |
| Class C (WMTCX) | | 4-8-2005 | | | 1.96 | | | | 1.65 | | | | 2.98 | | | | 2.96 | | | | 1.65 | | | | 2.98 | | | | 1.65 | | | | 1.60 | |
| Administrator Class (NWMIX) | | 8-2-1993 | | | – | | | | – | | | | – | | | | 4.09 | | | | 2.69 | | | | 4.01 | | | | 0.84 | | | | 0.60 | |
| Institutional Class (WMTIX) | | 10-31-2016 | | | – | | | | – | | | | – | | | | 4.18 | | | | 2.73 | | | | 4.03 | | | | 0.57 | | | | 0.52 | |
| Bloomberg Barclays Municipal Bond Index4 | | – | | | – | | | | – | | | | – | | | | 5.45 | | | | 3.02 | | | | 4.46 | | | | – | | | | – | |
| Bloomberg Barclays Minnesota Municipal Bond Index5 | | – | | | – | | | | – | | | | – | | | | 4.53 | | | | 2.48 | | | | 4.14 | | | | – | | | | – | |
Figures quoted represent past performance, which is no guarantee of future results, and do not reflect taxes that a shareholder may pay on fund distributions or the redemption of fund shares. Investment return and principal value of an investment will fluctuate so that an investor’s shares, when redeemed, may be worth more or less than their original cost. Performance shown without sales charges would be lower if sales charges were reflected. Current performance may be lower or higher than the performance data quoted, which assumes the reinvestment of dividends and capital gains. Current month-end performance is available on the Fund’s website,wellsfargofunds.com.
Index returns do not include transaction costs associated with buying and selling securities, any mutual fund fees or expenses, or any taxes. It is not possible to invest directly in an index.
For Class A shares, the maximum front-end sales charge is 4.50%. For Class C shares, the maximum contingent deferred sales charge is 1.00%. Performance including a contingent deferred sales charge assumes the sales charge for the corresponding time period. Administrator Class and Institutional Class shares are sold without a front-end sales charge or contingent deferred sales charge.
Bond values fluctuate in response to the financial condition of individual issuers, general market and economic conditions, and changes in interest rates. Changes in market conditions and government policies may lead to periods of heightened volatility in the bond market and reduced liquidity for certain bonds held by the Fund. In general, when interest rates rise, bond values fall and investors may lose principal value. Interest-rate changes and their impact on the Fund and its share price can be sudden and unpredictable. The use of derivatives may reduce returns and/or increase volatility. Certain investment strategies tend to increase the total risk of an investment (relative to the broader market). The Fund is exposed to Minnesota municipal securities risk and high-yield securities risk. Consult the Fund’s prospectus for additional information on these and other risks. A portion of the Fund’s income may be subject to federal, state, and/ or local income taxes or the Alternative Minimum Tax (AMT). Any capital gains distributions may be taxable.
Please see footnotes on page 5.
| | | | | | |
| Performance highlights (unaudited) | | Wells Fargo Minnesota Tax-Free Fund | | | 5 | |
|
| Effective maturity distribution as of December 31, 20176 |
|
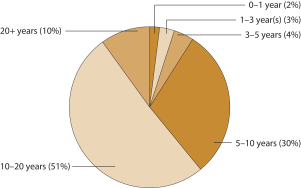
|
|
| Credit quality as of December 31, 20177 |
|
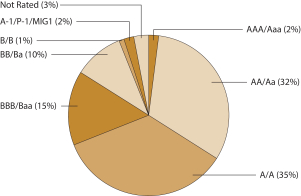 |
| 1 | Historical performance shown for the Institutional Class shares prior to their inception reflects the performance of the Administrator Class shares, and is not adjusted to reflect Institutional Class expenses. If these expenses had been included, returns for Institutional Class shares would be higher. |
| 2 | Reflects the expense ratios as stated in the most recent prospectuses. The expense ratios shown are subject to change and may differ from the annualized expense ratios shown in the financial highlights of this report. |
| 3 | The manager has contractually committed through October 31, 2018, to waive fees and/or reimburse expenses to the extent necessary to cap the Fund’s Total Annual Fund Operating Expenses After Fee Waivers at the amounts shown. After this time, the cap may be increased or the commitment to maintain the cap may be terminated only with the approval of the Board of Trustees. Brokerage commissions, stamp duty fees, interest, taxes, acquired fund fees and expenses, and extraordinary expenses are excluded from the expense cap. Without this cap, the Fund’s returns would have been lower. The expense ratio paid by an investor is the net expense ratio or the Fund’s Total Annual Fund Operating Expenses After Fee Waivers, as stated in the prospectuses. |
| 4 | The Bloomberg Barclays Municipal Bond Index is an unmanaged index composed of long-term tax-exempt bonds with a minimum credit rating of Baa. You cannot invest directly in an index. |
| 5 | The Bloomberg Barclays Minnesota Municipal Bond Index is the Minnesota component of the Bloomberg Barclays Municipal Bond Index. You cannot invest directly in an index. |
| 6 | Amounts are calculated based on the total investments of the Fund. These amounts are subject to change and may have changed since the date specified. |
| 7 | The credit quality distribution of portfolio holdings reflected in the chart is based on ratings from Standard & Poor’s, Moody’s Investors Service, and/or Fitch Ratings Ltd. Credit quality ratings apply to the underlying holdings of the Fund and not to the Fund itself. The percentages of the Fund’s portfolio with the ratings depicted in the chart are calculated based on the total market value of fixed income securities held by the Fund. If a security was rated by all three rating agencies, the middle rating was utilized. If rated by two of three rating agencies, the lower rating was utilized, and if rated by one of the rating agencies, that rating was utilized. Standard & Poor’s rates the creditworthiness of bonds, ranging from AAA (highest) to D (lowest). Ratings from A to CCC may be modified by the addition of a plus (+) or minus (-) sign to show relative standing within the rating categories. Standard & Poor’s rates the creditworthiness of short-term notes from SP-1 (highest) to SP-3 (lowest). Moody’s rates the creditworthiness of bonds, ranging from Aaa (highest) to C (lowest). Ratings Aa to B may be modified by the addition of a number 1 (highest) to 3 (lowest) to show relative standing within the ratings categories. Moody’s rates the creditworthiness of short-term U.S. tax-exempt municipal securities from MIG 1/VMIG 1 (highest) to SG (lowest). Fitch rates the creditworthiness of bonds, ranging from AAA (highest) to D (lowest). Credit quality distribution is subject to change and may have changed since the date specified. |
| | | | |
| 6 | | Wells Fargo Minnesota Tax-Free Fund | | Fund expenses (unaudited) |
As a shareholder of the Fund, you incur two types of costs: (1) transaction costs, including sales charges (loads) on purchase payments and contingent deferred sales charges (if any) on redemptions and (2) ongoing costs, including management fees, distribution (12b-1) and/or shareholder servicing fees, and other Fund expenses. This example is intended to help you understand your ongoing costs (in dollars) of investing in the Fund and to compare these costs with the ongoing costs of investing in other mutual funds.
The example is based on an investment of $1,000 invested at the beginning of the six-month period and held for the entire period from July 1, 2017 to December 31, 2017.
Actual expenses
The “Actual” line of the table below provides information about actual account values and actual expenses. You may use the information in this line, together with the amount you invested, to estimate the expenses that you paid over the period. Simply divide your account value by $1,000 (for example, an $8,600 account value divided by $1,000 = 8.6), then multiply the result by the number in the “Actual” line under the heading entitled “Expenses paid during period” for your applicable class of shares to estimate the expenses you paid on your account during this period.
Hypothetical example for comparison purposes
The “Hypothetical” line of the table below provides information about hypothetical account values and hypothetical expenses based on the Fund’s actual expense ratio and an assumed rate of return of 5% per year before expenses, which is not the Fund’s actual return. The hypothetical account values and expenses may not be used to estimate the actual ending account balance or expenses you paid for the period. You may use this information to compare the ongoing costs of investing in the Fund and other funds. To do so, compare this 5% hypothetical example with the 5% hypothetical examples that appear in the shareholder reports of the other funds.
Please note that the expenses shown in the table are meant to highlight your ongoing costs only and do not reflect any transactional costs, such as sales charges (loads) and contingent deferred sales charges. Therefore, the “Hypothetical” line of the table is useful in comparing ongoing costs only and will not help you determine the relative total costs of owning different funds. In addition, if these transactional costs were included, your costs would have been higher.
| | | | | | | | | | | | | | | | |
| | | Beginning account value 7-1-2017 | | | Ending account value 12-31-2017 | | | Expenses paid during the period¹ | | | Annualized net expense ratio | |
Class A | | | | | | | | | | | | | | | | |
Actual | | $ | 1,000.00 | | | $ | 1,013.54 | | | $ | 4.26 | | | | 0.84 | % |
Hypothetical (5% return before expenses) | | $ | 1,000.00 | | | $ | 1,020.97 | | | $ | 4.28 | | | | 0.84 | % |
Class C | | | | | | | | | | | | | | | | |
Actual | | $ | 1,000.00 | | | $ | 1,009.71 | | | $ | 8.05 | | | | 1.59 | % |
Hypothetical (5% return before expenses) | | $ | 1,000.00 | | | $ | 1,017.19 | | | $ | 8.08 | | | | 1.59 | % |
Administrator Class | | | | | | | | | | | | | | | | |
Actual | | $ | 1,000.00 | | | $ | 1,014.78 | | | $ | 3.05 | | | | 0.60 | % |
Hypothetical (5% return before expenses) | | $ | 1,000.00 | | | $ | 1,022.18 | | | $ | 3.06 | | | | 0.60 | % |
Institutional Class | | | | | | | | | | | | | | | | |
Actual | | $ | 1,000.00 | | | $ | 1,015.22 | | | $ | 2.59 | | | | 0.51 | % |
Hypothetical (5% return before expenses) | | $ | 1,000.00 | | | $ | 1,022.63 | | | $ | 2.60 | | | | 0.51 | % |
| 1 | Expenses paid is equal to the annualized net expense ratio of each class multiplied by the average account value over the period, multiplied by the number of days in the most recent fiscal half-year divided by the number of days in the fiscal year (to reflect the one-half-year period). |
| | | | | | |
| Portfolio of investments—December 31, 2017 (unaudited) | | Wells Fargo Minnesota Tax-Free Fund | | | 7 | |
| | | | | | | | | | | | | | | | |
| Security name | | Interest rate | | | Maturity date | | | Principal | | | Value | |
|
Municipal Obligations: 98.45% | |
|
| Guam: 0.64% | |
Guam Government Waterworks Authority Water & Wastewater System Project Series 2013 (Water & Sewer Revenue) | | | 5.25 | % | | | 7-1-2022 | | | $ | 865,000 | | | $ | 968,731 | |
Guam International Airport Authority Series 2013A (Airport Revenue) | | | 5.00 | | | | 10-1-2018 | | | | 100,000 | | | | 102,103 | |
| | | | |
| | | | | | | | | | | | | | | 1,070,834 | |
| | | | | | | | | | | | | | | | |
|
| Illinois: 0.67% | |
Kane, Cook and DuPage Counties IL School District #46 Series 2015 D (GO Revenue) | | | 5.00 | | | | 1-1-2027 | | | | 965,000 | | | | 1,117,142 | |
| | | | | | | | | | | | | | | | |
|
| Minnesota: 96.83% | |
Anoka County MN Capital Improvement Series A (GO Revenue) | | | 5.00 | | | | 2-1-2024 | | | | 500,000 | | | | 501,315 | |
Anoka County MN Charter School Series A (Education Revenue) | | | 3.40 | | | | 6-1-2019 | | | | 225,000 | | | | 230,562 | |
Anoka County MN Charter School Series A (Education Revenue) | | | 3.65 | | | | 6-1-2020 | | | | 185,000 | | | | 193,307 | |
Anoka County MN Charter School Series A (Education Revenue) | | | 3.75 | | | | 6-1-2021 | | | | 245,000 | | | | 261,275 | |
Anoka County MN Charter School Series A (Education Revenue) | | | 5.00 | | | | 6-1-2027 | | | | 510,000 | | | | 558,868 | |
Anoka County MN Charter School Series A (Education Revenue) | | | 5.00 | | | | 6-1-2032 | | | | 300,000 | | | | 328,746 | |
Anoka County MN Charter School Series A (Education Revenue) | | | 5.00 | | | | 6-1-2043 | | | | 1,100,000 | | | | 1,205,402 | |
Anoka Hennepin MN Independent School District #11 Certificate of Participation Series 2014A (Miscellaneous Revenue) | | | 5.00 | | | | 2-1-2034 | | | | 1,000,000 | | | | 1,148,640 | |
Austin MN Housing & RDA Courtyard Residence Project Series A (Housing Revenue) | | | 5.00 | | | | 1-1-2031 | | | | 1,500,000 | | | | 1,534,065 | |
Brooklyn Park MN Charter School Athlos Leadership Academy Project Series 2015A (Education Revenue) | | | 4.00 | | | | 7-1-2020 | | | | 245,000 | | | | 243,278 | |
Brooklyn Park MN Charter School Athlos Leadership Academy Project Series 2015A (Education Revenue) | | | 5.50 | | | | 7-1-2040 | | | | 750,000 | | | | 757,785 | |
Brooklyn Park MN Charter School Prairie Seeds Academy Project Series 2015A (Education Revenue) | | | 5.00 | | | | 3-1-2034 | | | | 1,500,000 | | | | 1,562,160 | |
Center City MN Health Care Facilities Hazelden Betty Ford Foundation Project Series 2011 (Miscellaneous Revenue) | | | 5.00 | | | | 11-1-2041 | | | | 3,000,000 | | | | 3,123,240 | |
Center City MN Health Care Facilities Hazelden Betty Ford Foundation Project Series 2014 (Health Revenue) | | | 5.00 | | | | 11-1-2026 | | | | 750,000 | | | | 868,523 | |
Center City MN Health Care Facilities Hazelden Betty Ford Foundation Project Series 2014 (Health Revenue) | | | 5.00 | | | | 11-1-2027 | | | | 500,000 | | | | 575,285 | |
Center City MN Health Care Facilities Hazelden Betty Ford Foundation Project Series 2014 (Health Revenue) | | | 5.00 | | | | 11-1-2029 | | | | 300,000 | | | | 341,949 | |
Central Minnesota Municipal Power Agency Brookings Southeast Twin Cities Transmission Project Series 2012 (Utilities Revenue) | | | 5.00 | | | | 1-1-2042 | | | | 1,500,000 | | | | 1,638,135 | |
Cologne MN Charter School Cologne Academy Project Series 2014A (Education Revenue) | | | 5.00 | | | | 7-1-2029 | | | | 590,000 | | | | 634,704 | |
Cologne MN Charter School Cologne Academy Project Series 2014A (Education Revenue) | | | 5.00 | | | | 7-1-2034 | | | | 500,000 | | | | 523,735 | |
Columbus MN Charter School New Millennium Academy Project Series 2015A (Education Revenue) | | | 5.50 | | | | 7-1-2030 | | | | 1,000,000 | | | | 904,270 | |
Dakota County MN Community Development Agency SFMR (Housing Revenue, GNMA/FNMA/FHLMC Insured) | | | 5.30 | | | | 12-1-2039 | | | | 22,367 | | | | 22,386 | |
Deephaven MN Charter School Eagle Ridge Academy Project Series 2015A (Education Revenue) | | | 5.25 | | | | 7-1-2037 | | | | 400,000 | | | | 429,692 | |
Deephaven MN Charter School Eagle Ridge Academy Project Series 2015A (Education Revenue) | | | 5.25 | | | | 7-1-2040 | | | | 500,000 | | | | 536,110 | |
Deephaven MN Charter School Eagle Ridge Academy Project Series 2016A (Education Revenue) | | | 4.00 | | | | 7-1-2025 | | | | 125,000 | | | | 131,021 | |
The accompanying notes are an integral part of these financial statements.
| | | | |
| 8 | | Wells Fargo Minnesota Tax-Free Fund | | Portfolio of investments—December 31, 2017 (unaudited) |
| | | | | | | | | | | | | | | | |
| Security name | | Interest rate | | | Maturity date | | | Principal | | | Value | |
|
| Minnesota (continued) | |
Deephaven MN Charter School Eagle Ridge Academy Project Series 2016A (Education Revenue) | | | 4.00 | % | | | 7-1-2026 | | | $ | 100,000 | | | $ | 103,739 | |
Deephaven MN Charter School Eagle Ridge Academy Project Series 2016A (Education Revenue) | | | 4.00 | | | | 7-1-2027 | | | | 100,000 | | | | 103,736 | |
Duluth MN Housing & RDA Public School Academy Series 2010A (Education Revenue) | | | 5.60 | | | | 11-1-2030 | | | | 2,000,000 | | | | 2,074,240 | |
Duluth MN Independent School District #709 St. Louis County Certificate of Participation Series 2016A (Miscellaneous Revenue, South Dakota Credit Program Insured) | | | 5.00 | | | | 2-1-2026 | | | | 1,000,000 | | | | 1,182,620 | |
Forest Lakes MN Charter School Lakes International Language Academy Project Series 2014A (Education Revenue) | | | 5.50 | | | | 8-1-2036 | | | | 500,000 | | | | 540,070 | |
Glencoe MN HCFR Glencoe Regional Health Services Project Series 2013 (Health Revenue) | | | 4.00 | | | | 4-1-2022 | | | | 735,000 | | | | 783,392 | |
Goodhue County MN Education District #6051 Red Wing Certificate of Participation Series 2014A (Miscellaneous Revenue) | | | 5.00 | | | | 2-1-2029 | | | | 750,000 | | | | 847,425 | |
Ham Lake MN Charter School Parnassus Preparatory School Project Series A (Education Revenue) | | | 4.00 | | | | 11-1-2026 | | | | 1,000,000 | | | | 993,340 | |
Ham Lake MN Charter School DaVinci Academy Project Series 2012A (Education Revenue) | | | 4.00 | | | | 7-1-2028 | | | | 370,000 | | | | 365,937 | |
Ham Lake MN Charter School DaVinci Academy Project Series 2016A (Education Revenue) | | | 5.00 | | | | 7-1-2031 | | | | 625,000 | | | | 650,438 | |
Hennepin County MN Series 2016B (GO Revenue) | | | 5.00 | | | | 12-1-2029 | | | | 450,000 | | | | 553,901 | |
Hennepin County MN Series 2017C (GO Revenue) | | | 5.00 | | | | 12-1-2031 | | | | 2,000,000 | | | | 2,441,820 | |
Hugo MN Charter School Lease Revenue Bonds Noble Academy Project Series 2014A (Education Revenue) | | | 5.00 | | | | 7-1-2029 | | | | 600,000 | | | | 645,024 | |
Hutchinson MN Public Utility Revenue Refunding Bonds Series 2012A (Utilities Revenue) | | | 5.00 | | | | 12-1-2026 | | | | 700,000 | | | | 789,362 | |
Maple Grove MN HCFR North Memorial Health Care Series 2015 (Health Revenue) | | | 5.00 | | | | 9-1-2023 | | | | 655,000 | | | | 746,484 | |
Maple Grove MN HCFR Series 2017 (Health Revenue) | | | 5.00 | | | | 5-1-2031 | | | | 500,000 | | | | 582,145 | |
Maple Grove MN HCFR Series 2017 (Health Revenue) | | | 5.00 | | | | 5-1-2032 | | | | 500,000 | | | | 579,935 | |
Minneapolis & St. Paul MN Housing & RDA Allina Health System Series 2017A (Health Revenue) | | | 5.00 | | | | 11-15-2029 | | | | 1,000,000 | | | | 1,209,450 | |
Minneapolis & St. Paul MN Housing & RDA Children’s Health Care Facilities Series A (Health Revenue) | | | 5.25 | | | | 8-15-2025 | | | | 1,000,000 | | | | 1,087,480 | |
Minneapolis & St. Paul MN Housing & RDA Children’s Health Care Facilities Series A (Health Revenue) | | | 5.25 | | | | 8-15-2035 | | | | 1,000,000 | | | | 1,085,760 | |
Minneapolis & St. Paul MN Housing & RDA Health Care Facilities Series A (Health Revenue, AGM Insured, U.S. Bank NA SPA) ø | | | 1.65 | | | | 8-15-2034 | | | | 3,000,000 | | | | 3,000,000 | |
Minneapolis & St. Paul MN Metropolitan Airports Commission Subordinate Series 2014A (Airport Revenue) | | | 5.00 | | | | 1-1-2029 | | | | 500,000 | | | | 582,190 | |
Minneapolis & St. Paul MN Metropolitan Airports Commission Subordinate Series 2014B (Airport Revenue) | | | 5.00 | | | | 1-1-2026 | | | | 500,000 | | | | 570,680 | |
Minneapolis MN Charter School Yinghua Academy Project Series 2013A (Education Revenue) | | | 5.00 | | | | 7-1-2023 | | | | 300,000 | | | | 312,792 | |
Minneapolis MN Development Limited Tax Supported Common Bond Series 2A (Miscellaneous Revenue) | | | 6.00 | | | | 12-1-2040 | | | | 1,000,000 | | | | 1,112,250 | |
Minneapolis MN Fairview Health Services Series A (Health Revenue, AGM Insured) | | | 6.63 | | | | 11-15-2028 | | | | 1,000,000 | | | | 1,044,120 | |
Minneapolis MN Health Care System Fairview Health Services Series 2015A (Health Revenue) | | | 5.00 | | | | 11-15-2033 | | | | 2,000,000 | | | | 2,330,160 | |
Minneapolis MN Health Care System Revenue Prerefunded Bond (Health Revenue, AGC Insured) | | | 6.50 | | | | 11-15-2038 | | | | 345,000 | | | | 359,852 | |
Minneapolis MN Health Care System Revenue Unrefunded Bond (Health Revenue, AGC Insured) | | | 6.50 | | | | 11-15-2038 | | | | 1,890,000 | | | | 1,974,218 | |
The accompanying notes are an integral part of these financial statements.
| | | | | | |
| Portfolio of investments—December 31, 2017 (unaudited) | | Wells Fargo Minnesota Tax-Free Fund | | | 9 | |
| | | | | | | | | | | | | | | | |
| Security name | | Interest rate | | | Maturity date | | | Principal | | | Value | |
|
| Minnesota (continued) | |
Minneapolis MN Student Housing Riverton Community Housing Project Series 2014 (Housing Revenue) | | | 5.00 | % | | | 8-1-2032 | | | $ | 860,000 | | | $ | 874,422 | |
Minneapolis St. Paul MN Metropolitan Airport Commission Series 2014A (Airport Revenue) | | | 5.00 | | | | 1-1-2032 | | | | 750,000 | | | | 866,423 | |
Minneapolis St. Paul MN Metropolitan Airport Commission Series 2016C (Airport Revenue) | | | 5.00 | | | | 1-1-2046 | | | | 1,000,000 | | | | 1,178,210 | |
Minneapolis St. Paul MN Metropolitan Airport Commission Series 2016D (Airport Revenue) | | | 5.00 | | | | 1-1-2041 | | | | 250,000 | | | | 290,230 | |
Minnesota Agricultural & Economic Development Board Health Care Essentia Health Series C1 (Health Revenue, AGC Insured) | | | 4.00 | | | | 2-15-2020 | | | | 50,000 | | | | 52,322 | |
Minnesota Agricultural & Economic Development Board Health Care Essentia Health Series C1 (Health Revenue, AGC Insured) | | | 5.00 | | | | 2-15-2030 | | | | 2,000,000 | | | | 2,135,400 | |
Minnesota Agricultural & Economic Development Board Health Care Essentia Health Series E (Health Revenue, AGC Insured) | | | 5.00 | | | | 2-15-2037 | | | | 4,030,000 | | | | 4,043,501 | |
Minnesota Certificate of Participation Legislative Office Facility Project Series 2014 (Miscellaneous Revenue) | | | 5.00 | | | | 6-1-2023 | | | | 435,000 | | | | 502,329 | |
Minnesota General Fund Appropriation Bonds Series 2012B (Miscellaneous Revenue) | | | 5.00 | | | | 3-1-2027 | | | | 2,000,000 | | | | 2,246,880 | |
Minnesota General Fund Appropriation Bonds Series 2012B (Miscellaneous Revenue) | | | 5.00 | | | | 3-1-2028 | | | | 2,000,000 | | | | 2,243,460 | |
Minnesota General Fund Appropriation Bonds Series 2012B (Miscellaneous Revenue) | | | 5.00 | | | | 3-1-2029 | | | | 2,000,000 | | | | 2,240,060 | |
Minnesota General Fund Appropriation Bonds Series 2014A (Miscellaneous Revenue) | | | 5.00 | | | | 6-1-2033 | | | | 1,000,000 | | | | 1,154,230 | |
Minnesota HEFAR Bethel University Series 2017 (Education Revenue) | | | 5.00 | | | | 5-1-2037 | | | | 1,250,000 | | | | 1,403,350 | |
Minnesota HEFAR Carleton College Series 7D (Education Revenue) | | | 5.00 | | | | 3-1-2030 | | | | 2,000,000 | | | | 2,080,000 | |
Minnesota HEFAR College of St. Scholastica Series 7R (Education Revenue) | | | 4.25 | | | | 12-1-2027 | | | | 400,000 | | | | 423,040 | |
Minnesota HEFAR Hamline University Series 2017B (Education Revenue) | | | 5.00 | | | | 10-1-2035 | | | | 1,000,000 | | | | 1,110,510 | |
Minnesota HEFAR Hamline University Series 7E (Education Revenue) | | | 4.50 | | | | 10-1-2021 | | | | 300,000 | | | | 322,089 | |
Minnesota HEFAR Hamline University Series 7E (Education Revenue) | | | 5.00 | | | | 10-1-2029 | | | | 500,000 | | | | 543,485 | |
Minnesota HEFAR St. Benedict College Series 2017 (Education Revenue) | | | 4.00 | | | | 3-1-2036 | | | | 410,000 | | | | 430,972 | |
Minnesota HEFAR St. Benedict College Series 7M (Education Revenue) | | | 5.13 | | | | 3-1-2036 | | | | 275,000 | | | | 294,775 | |
Minnesota HEFAR St. Benedict College Series 7V (Education Revenue) | | | 5.00 | | | | 3-1-2018 | | | | 635,000 | | | | 638,600 | |
Minnesota HEFAR St. Olaf College Series Eight-N (Education Revenue) | | | 4.00 | | | | 10-1-2025 | | | | 220,000 | | | | 249,055 | |
Minnesota HEFAR St. Olaf College Series Eight-N (Education Revenue) | | | 4.00 | | | | 10-1-2026 | | | | 100,000 | | | | 113,904 | |
Minnesota HEFAR St. Olaf College Series Eight-N (Education Revenue) | | | 4.00 | | | | 10-1-2027 | | | | 110,000 | | | | 124,546 | |
Minnesota HEFAR St. Olaf College Series Eight-N (Education Revenue) | | | 4.50 | | | | 10-1-2030 | | | | 500,000 | | | | 523,865 | |
Minnesota HEFAR St. Thomas University Series 7U (Education Revenue) | | | 5.00 | | | | 4-1-2023 | | | | 750,000 | | | | 859,860 | |
Minnesota HEFAR St. Thomas University Series 8-L (Education Revenue) | | | 5.00 | | | | 4-1-2024 | | | | 750,000 | | | | 877,118 | |
Minnesota HEFAR St. Thomas University Series 8-L (Education Revenue) | | | 5.00 | | | | 4-1-2028 | | | | 920,000 | | | | 1,095,646 | |
Minnesota HEFAR St. Thomas University Series 8-L (Education Revenue) | | | 5.00 | | | | 4-1-2029 | | | | 750,000 | | | | 889,500 | |
Minnesota HEFAR St. Thomas University Series 8-L (Education Revenue) | | | 5.00 | | | | 4-1-2035 | | | | 750,000 | | | | 872,490 | |
Minnesota Housing Finance Agency Residential Housing Series 2009E (Housing Revenue) | | | 4.20 | | | | 7-1-2021 | | | | 800,000 | | | | 810,704 | |
Minnesota Housing Finance Agency Residential Housing Series 2012D (Housing Revenue, GNMA/FNMA/FHLMC Insured) | | | 4.00 | | | | 7-1-2040 | | | | 455,000 | | | | 465,811 | |
Minnesota Housing Finance Agency Series 2015A (Housing Revenue) | | | 5.00 | | | | 8-1-2027 | | | | 1,665,000 | | | | 1,964,667 | |
Minnesota Housing Finance Agency State Appropriation Bonds Series 2015A (Housing Revenue) | | | 5.00 | | | | 8-1-2032 | | | | 500,000 | | | | 581,630 | |
Minnesota Municipal Power Agency Series 2010A & Series 2010B (Utilities Revenue) | | | 5.00 | | | | 10-1-2025 | | | | 2,335,000 | | | | 2,533,498 | |
Minnesota State Colleges & Universities Revenue Fund & Refunding Bonds Series 2017A (Education Revenue) | | | 5.00 | | | | 10-1-2027 | | | | 500,000 | | | | 614,170 | |
Minnesota Various Purpose Bonds Series 2010A (GO Revenue) | | | 4.00 | | | | 8-1-2029 | | | | 500,000 | | | | 529,010 | |
Minnesota Various Purpose Bonds Series 2015A (GO Revenue) | | | 5.00 | | | | 8-1-2028 | | | | 3,400,000 | | | | 4,119,168 | |
Minnetonka MN Independent School District #276 Series F (Miscellaneous Revenue) | | | 5.00 | | | | 2-1-2022 | | | | 175,000 | | | | 195,676 | |
The accompanying notes are an integral part of these financial statements.
| | | | |
| 10 | | Wells Fargo Minnesota Tax-Free Fund | | Portfolio of investments—December 31, 2017 (unaudited) |
| | | | | | | | | | | | | | | | |
| Security name | | Interest rate | | | Maturity date | | | Principal | | | Value | |
|
| Minnesota (continued) | |
Minnetonka MN Independent School District #276 Series F (Miscellaneous Revenue) | | | 5.00 | % | | | 2-1-2023 | | | $ | 185,000 | | | $ | 211,285 | |
Minnetonka MN Independent School District #276 Series F (Miscellaneous Revenue) | | | 5.00 | | | | 2-1-2024 | | | | 195,000 | | | | 222,604 | |
Minnetonka MN Independent School District #276 Series F (Miscellaneous Revenue) | | | 5.00 | | | | 2-1-2025 | | | | 205,000 | | | | 235,621 | |
Moorhead MN Educational Facilities Bond The Concordia College Corporation Project Series 2016 (Education Revenue) | | | 5.00 | | | | 12-1-2025 | | | | 2,000,000 | | | | 2,298,600 | |
Mounds View MN Independent School District #621 Series A (GO Revenue, South Dakota Credit Program Insured) | | | 4.00 | | | | 2-1-2022 | | | | 530,000 | | | | 543,473 | |
North Branch MN Independent School District #138 Series 2017A (GO Revenue, South Dakota Credit Program Insured) | | | 5.00 | | | | 2-1-2024 | | | | 2,070,000 | | | | 2,437,963 | |
Northeastern Minnesota Metropolitan Intermediate School District #916 Certificate of Participation Series 2013A (Miscellaneous Revenue) | | | 4.00 | | | | 2-1-2024 | | | | 1,100,000 | | | | 1,197,383 | |
Northeastern Minnesota Metropolitan Intermediate School District #916 Certificate of Participation Series 2015B (Miscellaneous Revenue) | | | 5.00 | | | | 2-1-2034 | | | | 1,000,000 | | | | 1,157,720 | |
Northern Minnesota Municipal Power Agency Series 2008A (Utilities Revenue, AGC Insured) | | | 5.00 | | | | 1-1-2018 | | | | 820,000 | | | | 820,000 | |
Northern Minnesota Municipal Power Agency Series 2008A (Utilities Revenue, AGC Insured) | | | 5.00 | | | | 1-1-2021 | | | | 50,000 | | | | 50,000 | |
Northern Minnesota Municipal Power Agency Series 2013A (Utilities Revenue) | | | 4.00 | | | | 1-1-2028 | | | | 450,000 | | | | 483,696 | |
Northern Minnesota Municipal Power Agency Series 2016 (Utilities Revenue) | | | 5.00 | | | | 1-1-2030 | | | | 520,000 | | | | 612,435 | |
Northern Minnesota Municipal Power Agency Series 2016 (Utilities Revenue) | | | 5.00 | | | | 1-1-2031 | | | | 350,000 | | | | 409,455 | |
Northern Minnesota Municipal Power Agency Series 2017 (Utilities Revenue) | | | 5.00 | | | | 1-1-2041 | | | | 400,000 | | | | 465,396 | |
Otsego MN Charter School Kaleidoscope Charter School Project Series 2014A (Education Revenue) | | | 4.15 | | | | 9-1-2024 | | | | 590,000 | | | | 603,771 | |
Otsego MN Charter School Kaleidoscope Charter School Project Series 2014A (Education Revenue) | | | 5.00 | | | | 9-1-2034 | | | | 1,100,000 | | | | 1,138,973 | |
Plato MN Health Care Facilities Bond Glencoe Regional Health Services Project Series 2017 (Health Revenue) | | | 5.00 | | | | 4-1-2041 | | | | 550,000 | | | | 616,033 | |
Plymouth MN Certificate of Participation Intermediate School District #287 Series A (Miscellaneous Revenue) | | | 5.00 | | | | 2-1-2024 | | | | 250,000 | | | | 259,153 | |
Plymouth MN Intermediate School District #287 Certificate of Participation Series 2016A (Miscellaneous Revenue) | | | 4.00 | | | | 5-1-2026 | | | | 500,000 | | | | 557,720 | |
Plymouth MN Intermediate School District #287 Certificate of Participation Series 2016A (Miscellaneous Revenue) | | | 4.00 | | | | 5-1-2027 | | | | 500,000 | | | | 553,450 | |
Red Wing MN Senior Housing Deer Crest Project Series A (Health Revenue) | | | 5.00 | | | | 11-1-2032 | | | | 660,000 | | | | 680,665 | |
Red Wing MN Senior Housing Deer Crest Project Series A (Health Revenue) | | | 5.00 | | | | 11-1-2042 | | | | 560,000 | | | | 572,858 | |
Rice County MN Educational Facilities Shattuck-St. Mary’s School Project (Education Revenue) 144A | | | 5.00 | | | | 8-1-2022 | | | | 975,000 | | | | 1,041,329 | |
Rochester MN Electric Utility Revenue Series 2017A (Utilities Revenue) | | | 5.00 | | | | 12-1-2037 | | | | 500,000 | | | | 592,705 | |
Rochester MN Electric Utility Revenue Series 2013B (Utilities Revenue) | | | 5.00 | | | | 12-1-2023 | | | | 815,000 | | | | 957,112 | |
Rochester MN Electric Utility Revenue Series 2013B (Utilities Revenue) | | | 5.00 | | | | 12-1-2025 | | | | 315,000 | | | | 369,734 | |
Rochester MN Electric Utility Revenue Series 2013B (Utilities Revenue) | | | 5.00 | | | | 12-1-2026 | | | | 250,000 | | | | 291,765 | |
Rochester MN HCFR Mayo Clinic Series 2011 (Health Revenue) | | | 4.50 | | | | 11-15-2038 | | | | 200,000 | | | | 220,314 | |
Rosemount MN Independent School District #196 School Building Series 2016A (GO Revenue, South Dakota Credit Program Insured) | | | 5.00 | | | | 2-1-2027 | | | | 1,500,000 | | | | 1,822,860 | |
Sartell MN Independent School District 748 St. Stephen Public Schools GO Series 2016A (GO Revenue, South Dakota Credit Program Insured) | | | 5.00 | | | | 2-1-2027 | | | | 1,250,000 | | | | 1,488,138 | |
Shakopee MN St. Francis Regional Medical Center Series 2014 (Health Revenue) | | | 5.00 | | | | 9-1-2027 | | | | 700,000 | | | | 803,040 | |
Shakopee MN St. Francis Regional Medical Center Series 2014 (Health Revenue) | | | 5.00 | | | | 9-1-2029 | | | | 725,000 | | | | 825,536 | |
Southern Minnesota Municipal Power Agency Series 1994A (Utilities Revenue, National Insured) ¤ | | | 0.00 | | | | 1-1-2020 | | | | 5,100,000 | | | | 4,904,466 | |
Southern Minnesota Municipal Power Agency Series 2009A (Utilities Revenue) | | | 5.25 | | | | 1-1-2030 | | | | 2,000,000 | | | | 2,074,360 | |
The accompanying notes are an integral part of these financial statements.
| | | | | | |
| Portfolio of investments—December 31, 2017 (unaudited) | | Wells Fargo Minnesota Tax-Free Fund | | | 11 | |
| | | | | | | | | | | | | | | | |
| Security name | | Interest rate | | | Maturity date | | | Principal | | | Value | |
|
| Minnesota (continued) | |
St. Cloud MN Charter School Lease Revenue Bonds Stride Academy Project Series 2016A (Education Revenue) | | | 5.00 | % | | | 4-1-2036 | | | $ | 750,000 | | | $ | 555,555 | |
St. Cloud MN Health Care Revenue Bonds Series 2016A (Health Revenue) | | | 5.00 | | | | 5-1-2030 | | | | 2,000,000 | | | | 2,369,840 | |
St. Cloud MN Health Care Revenue Bonds Series 2016A (Health Revenue) | | | 5.00 | | | | 5-1-2031 | | | | 2,000,000 | | | | 2,359,380 | |
St. Cloud MN Health Care Unrefunded Revenue Bonds CentraCare Health (Health Revenue) | | | 5.13 | | | | 5-1-2030 | | | | 125,000 | | | | 134,550 | |
St. Cloud MN Independent School District #742 Series 2017A (Miscellaneous Revenue) | | | 5.00 | | | | 2-1-2032 | | | | 500,000 | | | | 581,320 | |
St. Cloud MN Independent School District #742 Series 2017A (Miscellaneous Revenue) | | | 5.00 | | | | 2-1-2034 | | | | 350,000 | | | | 405,202 | |
St. Louis Park MN Nicollett Health Services Series 2009 (Health Revenue) | | | 5.50 | | | | 7-1-2029 | | | | 1,000,000 | | | | 1,057,670 | |
St. Paul MN Health Care System Bond Allina Health System Series 2009A-1 (Health Revenue) | | | 5.00 | | | | 11-15-2024 | | | | 1,195,000 | | | | 1,268,947 | |
St. Paul MN Health Care System Bond Allina Health System Series 2009A-1 (Health Revenue) | | | 5.00 | | | | 11-15-2024 | | | | 1,155,000 | | | | 1,228,897 | |
St. Paul MN Housing & RDA Charter School Hmong College Preparatory Academy Project Series 2016A (Education Revenue) | | | 5.25 | | | | 9-1-2031 | | | | 1,000,000 | | | | 1,046,440 | |
St. Paul MN Housing & RDA Charter School Lease Revenue German Immersion School Project Series 2013A (Education Revenue) | | | 4.00 | | | | 7-1-2023 | | | | 250,000 | | | | 257,585 | |
St. Paul MN Housing & RDA Charter School Lease Revenue Twin Cities Academy Project Series 2015A (Education Revenue) | | | 5.00 | | | | 7-1-2035 | | | | 925,000 | | | | 967,310 | |
St. Paul MN Housing & RDA Charter School Nova Classical Academy Project Series 2011A (Miscellaneous Revenue) | | | 6.63 | | | | 9-1-2042 | | | | 865,000 | | | | 1,011,868 | |
St. Paul MN Housing & RDA Conservatory for Performing Artists Series A (Education Revenue) | | | 4.00 | | | | 3-1-2028 | | | | 150,000 | | | | 148,634 | |
St. Paul MN Housing & RDA Fairview Health Services Series 2017A (Health Revenue) | | | 5.00 | | | | 11-15-2034 | | | | 565,000 | | | | 671,497 | |
St. Paul MN Housing & RDA Health Care Facilities Refunding Bonds Series 2015A (Health Revenue) | | | 5.00 | | | | 7-1-2025 | | | | 250,000 | | | | 298,208 | |
St. Paul MN Housing & RDA HealthEast Care System Project Series 2015A (Health Revenue) | | | 5.00 | | | | 11-15-2025 | | | | 1,000,000 | | | | 1,087,820 | |
St. Paul MN Housing & RDA HealthEast Care Systems Project Series 2015A (Health Revenue) | | | 5.00 | | | | 11-15-2027 | | | | 1,000,000 | | | | 1,210,060 | |
St. Paul MN Housing & RDA HealthPartners Obligated Group Series 2015A (Health Revenue) | | | 5.00 | | | | 7-1-2031 | | | | 2,010,000 | | | | 2,324,726 | |
St. Paul MN Housing & RDA Hope Community Academy Project Series 2015A (Education Revenue) | | | 5.00 | | | | 12-1-2034 | | | | 1,645,000 | | | | 1,699,252 | |
St. Paul MN Housing & RDA Parking Enterprise Refunding Bonds Series 2017A (Transportation Revenue) | | | 4.00 | | | | 8-1-2026 | | | | 525,000 | | | | 584,803 | |
St. Paul MN Housing & RDA Parking Enterprise Refunding Bonds Series 2017A (Transportation Revenue) | | | 4.00 | | | | 8-1-2027 | | | | 545,000 | | | | 603,092 | |
St. Paul MN Housing & RDA Parking Enterprise Refunding Bonds Series 2017A (Transportation Revenue) | | | 5.00 | | | | 8-1-2025 | | | | 500,000 | | | | 596,835 | |
St. Paul MN Housing & RDA Parking Facilities Project Series A (Transportation Revenue) | | | 5.00 | | | | 8-1-2035 | | | | 875,000 | | | | 910,149 | |
St. Paul MN Port Authority Lease Revenue Freeman Office Building Series 2 (Miscellaneous Revenue) | | | 5.00 | | | | 12-1-2024 | | | | 2,000,000 | | | | 2,334,120 | |
Todd County MN United Hospital District BAN Lakewood Health System Series A (Health Revenue) | | | 1.30 | | | | 12-1-2018 | | | | 1,000,000 | | | | 995,320 | |
University of Minnesota Series 2009A (Education Revenue) | | | 5.00 | | | | 4-1-2021 | | | | 1,180,000 | | | | 1,230,256 | |
University of Minnesota Series 2009A (Education Revenue) | | | 5.13 | | | | 4-1-2034 | | | | 1,000,000 | | | | 1,044,120 | |
University of Minnesota Series 2017A (Education Revenue) | | | 5.00 | | | | 9-1-2042 | | | | 770,000 | | | | 931,346 | |
University of Minnesota State Supported Biomedical Science Series 2011B (Education Revenue) | | | 5.00 | | | | 8-1-2036 | | | | 1,000,000 | | | | 1,099,070 | |
Virginia MN Housing & RDA HCFR Series 2005 (Miscellaneous Revenue) | | | 5.25 | | | | 10-1-2025 | | | | 2,085,000 | | | | 2,089,587 | |
Western Minnesota Municipal Power Agency Series A (Utilities Revenue) | | | 5.00 | | | | 1-1-2027 | | | | 1,565,000 | | | | 1,781,518 | |
The accompanying notes are an integral part of these financial statements.
| | | | |
| 12 | | Wells Fargo Minnesota Tax-Free Fund | | Portfolio of investments—December 31, 2017 (unaudited) |
| | | | | | | | | | | | | | | | |
| Security name | | Interest rate | | | Maturity date | | | Principal | | | Value | |
|
| Minnesota (continued) | |
Western Minnesota Municipal Power Agency Series A (Utilities Revenue) | | | 5.00 | % | | | 1-1-2030 | | | $ | 1,000,000 | | | $ | 1,130,740 | |
Western Minnesota Municipal Power Agency Series A (Utilities Revenue) | | | 5.00 | | | | 1-1-2031 | | | | 1,000,000 | | | | 1,180,930 | |
Western Minnesota Municipal Power Agency Series A (Utilities Revenue) | | | 5.00 | | | | 1-1-2032 | | | | 1,250,000 | | | | 1,448,600 | |
Willmar MN Rice Memorial Hospital Project Series 2012A (GO Revenue) | | | 5.00 | | | | 2-1-2026 | | | | 1,000,000 | | | | 1,093,810 | |
Winona MN Health Care Facilities Refunding Bond Series 2012 (Health Revenue) | | | 3.00 | | | | 7-1-2018 | | | | 295,000 | | | | 295,475 | |
Winona MN Health Care Facilities Refunding Bond Series 2012 (Health Revenue) | | | 5.00 | | | | 7-1-2034 | | | | 500,000 | | | | 523,630 | |
Woodbury MN Charter School Series A (Education Revenue) | | | 3.15 | | | | 12-1-2018 | | | | 190,000 | | | | 191,241 | |
Woodbury MN Charter School Series A (Education Revenue) | | | 3.90 | | | | 12-1-2022 | | | | 220,000 | | | | 231,917 | |
Woodbury MN Charter School Series A (Education Revenue) | | | 5.00 | | | | 12-1-2027 | | | | 215,000 | | | | 232,095 | |
Woodbury MN Charter School Series A (Education Revenue) | | | 5.00 | | | | 12-1-2032 | | | | 220,000 | | | | 235,050 | |
| | | | |
| | | | | | | | | | | | | | | 162,369,697 | |
| | | | | | | | | | | | | | | | |
| Virgin Islands: 0.31% | |
Virgin Islands PFA Matching Fund Loan Notes Senior Lien Series B (Tax Revenue, AGM Insured) | | | 5.00 | | | | 10-1-2025 | | | | 500,000 | | | | 522,500 | |
| | | | | | | | | | | | | | | | |
| | | | |
Total Municipal Obligations (Cost $160,487,629) | | | | | | | | | | | | | | | 165,080,173 | |
| | | | | | | | | | | | | | | | |
| | | | | | | | |
| Total investments in securities (Cost $160,487,629) | | | 98.45 | % | | | 165,080,173 | |
Other assets and liabilities, net | | | 1.55 | | | | 2,606,631 | |
| | | | | | | | |
| Total net assets | | | 100.00 | % | | $ | 167,686,804 | |
| | | | | | | | |
| ø | Variable rate demand notes are subject to a demand feature which reduces the effective maturity. The maturity date shown represents the final maturity date of the security. The interest rate is determined and reset by the issuer daily, weekly, or monthly depending upon the terms of the security. The rate shown is the rate in effect at period end. |
| 144A | The security may be resold in transactions exempt from registration, normally to qualified institutional buyers, pursuant to Rule 144A under the Securities Act of 1933. |
| ¤ | The security is issued in zero coupon form with no periodic interest payments. |
The accompanying notes are an integral part of these financial statements.
| | | | | | |
| Statement of assets and liabilities—December 31, 2017 (unaudited) | | Wells Fargo Minnesota Tax-Free Fund | | | 13 | |
| | | | |
| | | | |
| |
Assets | | | | |
Investments in unaffiliated securities, at value (cost $160,487,629) | | $ | 165,080,173 | |
Cash | | | 658,214 | |
Receivable for investments sold | | | 25,081 | |
Receivable for Fund shares sold | | | 614,579 | |
Receivable for interest | | | 2,178,493 | |
Prepaid expenses and other assets | | | 97,709 | |
| | | | |
Total assets | | | 168,654,249 | |
| | | | |
| |
Liabilities | | | | |
Payable for Fund shares redeemed | | | 767,636 | |
Dividends payable | | | 89,916 | |
Management fee payable | | | 42,688 | |
Administration fees payable | | | 16,376 | |
Distribution fee payable | | | 5,545 | |
Trustees’ fees and expenses payable | | | 2,049 | |
Accrued expenses and other liabilities | | | 43,235 | |
| | | | |
Total liabilities | | | 967,445 | |
| | | | |
Total net assets | | $ | 167,686,804 | |
| | | | |
| |
NET ASSETS CONSIST OF | | | | |
Paid-in capital | | $ | 162,269,022 | |
Undistributed net investment income | | | 691,460 | |
Accumulated net realized gains on investments | | | 133,778 | |
Net unrealized gains on investments | | | 4,592,544 | |
| | | | |
Total net assets | | $ | 167,686,804 | |
| | | | |
| |
COMPUTATION OF NET ASSET VALUE AND OFFERING PRICE PER SHARE | | | | |
Net assets – Class A | | $ | 33,978,086 | |
Shares outstanding – Class A1 | | | 3,181,126 | |
Net asset value per share – Class A2 | | | $10.68 | |
Maximum offering price per share – Class A | | | $11.18 | |
Net assets – Class C | | $ | 8,440,378 | |
Shares outstanding – Class C1 | | | 790,274 | |
Net asset value per share – Class C | | | $10.68 | |
Net assets – Administrator Class | | $ | 98,343,241 | |
Shares outstanding – Administrator Class1 | | | 9,211,011 | |
Net asset value per share – Administrator Class | | | $10.68 | |
Net assets – Institutional Class | | $ | 26,925,099 | |
Shares outstanding – Institutional Class1 | | | 2,519,256 | |
Net asset value per share – Institutional Class | | | $10.69 | |
| 1 | The Fund has an unlimited number of authorized shares. |
| 2 | Maximum offering price is computed as 100/95.50 of net asset value. On investments of $50,000 or more, the offering price is reduced. |
The accompanying notes are an integral part of these financial statements.
| | | | |
| 14 | | Wells Fargo Minnesota Tax-Free Fund | | Statement of operations—six months ended December 31, 2017 (unaudited) |
| | | | |
| | | | |
| |
Investment income | | | | |
Interest | | $ | 2,875,014 | |
| | | | |
| |
Expenses | | | | |
Management fee | | | 337,131 | |
Administration fees | | | | |
Class A | | | 27,472 | |
Class C | | | 7,153 | |
Administrator Class | | | 49,595 | |
Institutional Class | | | 10,437 | |
Shareholder servicing fees | | | | |
Class A | | | 42,926 | |
Class C | | | 11,177 | |
Administrator Class | | | 123,988 | |
Distribution fee | | | | |
Class C | | | 33,532 | |
Custody and accounting fees | | | 2,288 | |
Professional fees | | | 5,954 | |
Shareholder report expenses | | | 9,953 | |
Trustees’ fees and expenses | | | 9,250 | |
Other fees and expenses | | | 1,310 | |
| | | | |
Total expenses | | | 672,166 | |
Less: Fee waivers and/or expense reimbursements | | | (91,266 | ) |
| | | | |
Net expenses | | | 580,900 | |
| | | | |
Net investment income | | | 2,294,114 | |
| | | | |
| |
REALIZED AND UNREALIZED GAINS (LOSSES) ON INVESTMENTS | | | | |
Net realized gains on investments | | | 265,634 | |
Net change in unrealized gains (losses) on investments | | | (228,021 | ) |
| | | | |
Net realized and unrealized gains (losses) on investments | | | 37,613 | |
| | | | |
Net increase in net assets resulting from operations | | $ | 2,331,727 | |
| | | | |
The accompanying notes are an integral part of these financial statements.
| | | | | | |
| Statement of changes in net assets | | Wells Fargo Minnesota Tax-Free Fund | | | 15 | |
| | | | | | | | | | | | | | | | |
| | | Six months ended
December 31, 2017
(unaudited) | | | Year ended
June 30, 2017 | |
| | | | |
Operations | | | | | | | | | | | | | | | | |
Net investment income | | | | | | $ | 2,294,114 | | | | | | | $ | 4,880,235 | |
Net realized gains on investments | | | | | | | 265,634 | | | | | | | | 489,861 | |
Net change in unrealized gains (losses) on investments | | | | | | | (228,021 | ) | | | | | | | (6,446,195 | ) |
| | | | |
Net increase (decrease) in net assets resulting from operations | | | | | | | 2,331,727 | | | | | | | | (1,076,099 | ) |
| | | | |
| | | | |
Distributions to shareholders from | | | | | | | | | | | | | | | | |
Net investment income | | | | | | | | | | | | | | | | |
Class A | | | | | | | (440,945 | ) | | | | | | | (1,086,514 | ) |
Class C | | | | | | | (81,203 | ) | | | | | | | (188,496 | ) |
Administrator Class | | | | | | | (1,393,669 | ) | | | | | | | (3,397,164 | ) |
Institutional Class | | | | | | | (378,298 | ) | | | | | | | (208,060 | )1 |
Net realized gains | | | | | | | | | | | | | | | | |
Class A | | | | | | | (16,863 | ) | | | | | | | (181,495 | ) |
Class C | | | | | | | (4,226 | ) | | | | | | | (42,362 | ) |
Administrator Class | | | | | | | (48,921 | ) | | | | | | | (459,089 | ) |
Institutional Class | | | | | | | (13,482 | ) | | | | | | | (21,533 | )1 |
| | | | |
Total distributions to shareholders | | | | | | | (2,377,607 | ) | | | | | | | (5,584,713 | ) |
| | | | |
| | | | |
Capital share transactions | | | Shares | | | | | | | | Shares | | | | | |
Proceeds from shares sold | | | | | | | | | | | | | | | | |
Class A | | | 144,498 | | | | 1,541,789 | | | | 383,062 | | | | 4,171,243 | |
Class C | | | 16,360 | | | | 174,746 | | | | 91,703 | | | | 999,287 | |
Administrator Class | | | 799,367 | | | | 8,552,506 | | | | 4,832,418 | | | | 51,690,025 | |
Institutional Class | | | 682,759 | | | | 7,318,007 | | | | 2,396,879 | 1 | | | 25,479,423 | 1 |
| | | | |
| | | | | | | 17,587,048 | | | | | | | | 82,339,978 | |
| | | | |
Reinvestment of distributions | | | | | | | | | | | | | | | | |
Class A | | | 41,330 | | | | 442,130 | | | | 115,744 | | | | 1,240,727 | |
Class C | | | 7,944 | | | | 84,988 | | | | 21,560 | | | | 230,847 | |
Administrator Class | | | 90,325 | | | | 966,076 | | | | 258,723 | | | | 2,773,566 | |
Institutional Class | | | 36,376 | | | | 389,416 | | | | 21,568 | 1 | | | 229,581 | 1 |
| | | | |
| | | | | | | 1,882,610 | | | | | | | | 4,474,721 | |
| | | | |
Payment for shares redeemed | | | | | | | | | | | | | | | | |
Class A | | | (254,254 | ) | | | (2,720,797 | ) | | | (1,353,492 | ) | | | (14,441,455 | ) |
Class C | | | (125,616 | ) | | | (1,348,288 | ) | | | (157,354 | ) | | | (1,679,329 | ) |
Administrator Class | | | (1,501,256 | ) | | | (16,058,335 | ) | | | (6,516,596 | ) | | | (69,327,244 | ) |
Institutional Class | | | (331,247 | ) | | | (3,545,329 | ) | | | (287,079 | )1 | | | (3,050,214 | )1 |
| | | | |
| | | | | | | (23,672,749 | ) | | | | | | | (88,498,242 | ) |
| | | | |
Net decrease in net assets resulting from capital share transactions | | | | | | | (4,203,091 | ) | | | | | | | (1,683,543 | ) |
| | | | |
Total decrease in net assets | | | | | | | (4,248,971 | ) | | | | | | | (8,344,355 | ) |
| | | | |
| | | | |
Net assets | | | | | | | | | | | | | | | | |
Beginning of period | | | | | | | 171,935,775 | | | | | | | | 180,280,130 | |
| | | | |
End of period | | | | | | $ | 167,686,804 | | | | | | | $ | 171,935,775 | |
| | | | |
Undistributed net investment income | | | | | | $ | 691,460 | | | | | | | $ | 691,461 | |
| | | | |
| 1 | For the period from October 31, 2016 (commencement of class operations) to June 30, 2017 |
The accompanying notes are an integral part of these financial statements.
| | | | |
| 16 | | Wells Fargo Minnesota Tax-Free Fund | | Financial highlights |
(For a share outstanding throughout each period)
| | | | | | | | | | | | | | | | | | | | | | | | |
| | | Six months ended
December 31, 2017 (unaudited) | | | Year ended June 30 | |
| CLASS A | | | 2017 | | | 2016 | | | 2015 | | | 2014 | | | 2013 | |
Net asset value, beginning of period | | | $10.68 | | | | $11.07 | | | | $10.79 | | | | $10.86 | | | | $10.74 | | | | $11.08 | |
Net investment income | | | 0.14 | | | | 0.28 | 1 | | | 0.33 | | | | 0.33 | | | | 0.35 | | | | 0.32 | |
Net realized and unrealized gains (losses) on investments | | | 0.01 | | | | (0.34 | ) | | | 0.28 | | | | (0.04 | ) | | | 0.20 | | | | (0.31 | ) |
| | | | | | | | | | | | | | | | | | | | | | | | |
Total from investment operations | | | 0.15 | | | | (0.06 | ) | | | 0.61 | | | | 0.29 | | | | 0.55 | | | | 0.01 | |
Distributions to shareholders from | | | | | | | | | | | | | | | | | | | | | | | | |
Net investment income | | | (0.14 | ) | | | (0.28 | ) | | | (0.33 | ) | | | (0.33 | ) | | | (0.35 | ) | | | (0.32 | ) |
Net realized gains | | | (0.01 | ) | | | (0.05 | ) | | | (0.00 | )2 | | | (0.03 | ) | | | (0.08 | ) | | | (0.03 | ) |
| | | | | | | | | | | | | | | | | | | | | | | | |
Total distributions to shareholders | | | (0.15 | ) | | | (0.33 | ) | | | (0.33 | ) | | | (0.36 | ) | | | (0.43 | ) | | | (0.35 | ) |
Net asset value, end of period | | | $10.68 | | | | $10.68 | | | | $11.07 | | | | $10.79 | | | | $10.86 | | | | $10.74 | |
Total return3 | | | 1.35 | % | | | (0.53 | )% | | | 5.74 | % | | | 2.72 | % | | | 5.29 | % | | | (0.01 | )% |
Ratios to average net assets (annualized) | | | | | | | | | | | | | | | | | | | | | | | | |
Gross expenses | | | 0.84 | % | | | 0.91 | % | | | 0.89 | % | | | 0.89 | % | | | 0.89 | % | | | 0.88 | % |
Net expenses | | | 0.84 | % | | | 0.85 | % | | | 0.85 | % | | | 0.85 | % | | | 0.85 | % | | | 0.85 | % |
Net investment income | | | 2.57 | % | | | 2.63 | % | | | 2.99 | % | | | 3.03 | % | | | 3.28 | % | | | 2.87 | % |
Supplemental data | | | | | | | | | | | | | | | | | | | | | | | | |
Portfolio turnover rate | | | 7 | % | | | 22 | % | | | 16 | % | | | 20 | % | | | 15 | % | | | 14 | % |
Net assets, end of period (000s omitted) | | | $33,978 | | | | $34,720 | | | | $45,437 | | | | $45,437 | | | | $44,499 | | | | $49,535 | |
| 1 | Calculated based upon average shares outstanding. |
| 2 | Amount is less than $0.005. |
| 3 | Total return calculations do not include any sales charges. Returns for periods of less than one year are not annualized. |
The accompanying notes are an integral part of these financial statements.
| | | | | | |
| Financial highlights | | Wells Fargo Minnesota Tax-Free Fund | | | 17 | |
(For a share outstanding throughout each period)
| | | | | | | | | | | | | | | | | | | | | | | | |
| | | Six months ended
December 31, 2017 (unaudited) | | | Year ended June 30 | |
| CLASS C | | | 2017 | | | 2016 | | | 2015 | | | 2014 | | | 2013 | |
Net asset value, beginning of period | | | $10.68 | | | | $11.07 | | | | $10.79 | | | | $10.86 | | | | $10.74 | | | | $11.08 | |
Net investment income | | | 0.10 | | | | 0.20 | | | | 0.24 | | | | 0.25 | | | | 0.27 | | | | 0.24 | |
Net realized and unrealized gains (losses) on investments | | | 0.01 | | | | (0.34 | ) | | | 0.28 | | | | (0.04 | ) | | | 0.20 | | | | (0.31 | ) |
| | | | | | | | | | | | | | | | | | | | | | | | |
Total from investment operations | | | 0.11 | | | | (0.14 | ) | | | 0.52 | | | | 0.21 | | | | 0.47 | | | | (0.07 | ) |
Distributions to shareholders from | | | | | | | | | | | | | | | | | | | | | | | | |
Net investment income | | | (0.10 | ) | | | (0.20 | ) | | | (0.24 | ) | | | (0.25 | ) | | | (0.27 | ) | | | (0.24 | ) |
Net realized gains | | | (0.01 | ) | | | (0.05 | ) | | | (0.00 | )1 | | | (0.03 | ) | | | (0.08 | ) | | | (0.03 | ) |
| | | | | | | | | | | | | | | | | | | | | | | | |
Total distributions to shareholders | | | (0.11 | ) | | | (0.25 | ) | | | (0.24 | ) | | | (0.28 | ) | | | (0.35 | ) | | | (0.27 | ) |
Net asset value, end of period | | | $10.68 | | | | $10.68 | | | | $11.07 | | | | $10.79 | | | | $10.86 | | | | $10.74 | |
Total return2 | | | 0.97 | % | | | (1.27 | )% | | | 4.95 | % | | | 1.96 | % | | | 4.50 | % | | | (0.76 | )% |
Ratios to average net assets (annualized) | | | | | | | | | | | | | | | | | | | | | | | | |
Gross expenses | | | 1.59 | % | | | 1.65 | % | | | 1.64 | % | | | 1.64 | % | | | 1.64 | % | | | 1.63 | % |
Net expenses | | | 1.59 | % | | | 1.60 | % | | | 1.60 | % | | | 1.60 | % | | | 1.60 | % | | | 1.60 | % |
Net investment income | | | 1.82 | % | | | 1.88 | % | | | 2.24 | % | | | 2.28 | % | | | 2.53 | % | | | 2.12 | % |
Supplemental data | | | | | | | | | | | | | | | | | | | | | | | | |
Portfolio turnover rate | | | 7 | % | | | 22 | % | | | 16 | % | | | 20 | % | | | 15 | % | | | 14 | % |
Net assets, end of period (000s omitted) | | | $8,440 | | | | $9,525 | | | | $10,358 | | | | $10,061 | | | | $8,768 | | | | $8,972 | |
| 1 | Amount is less than $0.005. |
| 2 | Total return calculations do not include any sales charges. Returns for periods of less than one year are not annualized. |
The accompanying notes are an integral part of these financial statements.
| | | | |
| 18 | | Wells Fargo Minnesota Tax-Free Fund | | Financial highlights |
(For a share outstanding throughout each period)
| | | | | | | | | | | | | | | | | | | | | | | | |
| | | Six months ended
December 31, 2017 (unaudited) | | | Year ended June 30 | |
| ADMINISTRATOR CLASS | | | 2017 | | | 2016 | | | 2015 | | | 2014 | | | 2013 | |
Net asset value, beginning of period | | | $10.68 | | | | $11.07 | | | | $10.78 | | | | $10.86 | | | | $10.74 | | | | $11.07 | |
Net investment income | | | 0.15 | | | | 0.31 | 1 | | | 0.35 | | | | 0.36 | | | | 0.38 | | | | 0.35 | |
Net realized and unrealized gains (losses) on investments | | | 0.01 | | | | (0.34 | ) | | | 0.29 | | | | (0.05 | ) | | | 0.20 | | | | (0.30 | ) |
| | | | | | | | | | | | | | | | | | | | | | | | |
Total from investment operations | | | 0.16 | | | | (0.03 | ) | | | 0.64 | | | | 0.31 | | | | 0.58 | | | | 0.05 | |
Distributions to shareholders from | | | | | | | | | | | | | | | | | | | | | | | | |
Net investment income | | | (0.15 | ) | | | (0.31 | ) | | | (0.35 | ) | | | (0.36 | ) | | | (0.38 | ) | | | (0.35 | ) |
Net realized gains | | | (0.01 | ) | | | (0.05 | ) | | | (0.00 | )2 | | | (0.03 | ) | | | (0.08 | ) | | | (0.03 | ) |
| | | | | | | | | | | | | | | | | | | | | | | | |
Total distributions to shareholders | | | (0.16 | ) | | | (0.36 | ) | | | (0.35 | ) | | | (0.39 | ) | | | (0.46 | ) | | | (0.38 | ) |
Net asset value, end of period | | | $10.68 | | | | $10.68 | | | | $11.07 | | | | $10.78 | | | | $10.86 | | | | $10.74 | |
Total return3 | | | 1.48 | % | | | (0.28 | )% | | | 6.10 | % | | | 2.88 | % | | | 5.55 | % | | | 0.32 | % |
Ratios to average net assets (annualized) | | | | | | | | | | | | | | | | | | | | | | | | |
Gross expenses | | | 0.78 | % | | | 0.84 | % | | | 0.83 | % | | | 0.83 | % | | | 0.83 | % | | | 0.82 | % |
Net expenses | | | 0.60 | % | | | 0.60 | % | | | 0.60 | % | | | 0.60 | % | | | 0.60 | % | | | 0.60 | % |
Net investment income | | | 2.81 | % | | | 2.87 | % | | | 3.24 | % | | | 3.28 | % | | | 3.53 | % | | | 3.11 | % |
Supplemental data | | | | | | | | | | | | | | | | | | | | | | | | |
Portfolio turnover rate | | | 7 | % | | | 22 | % | | | 16 | % | | | 20 | % | | | 15 | % | | | 14 | % |
Net assets, end of period (000s omitted) | | | $98,343 | | | | $104,906 | | | | $124,485 | | | | $111,475 | | | | $98,483 | | | | $98,992 | |
| 1 | Calculated based upon average shares outstanding |
| 2 | Amount is less than $0.005. |
| 3 | Returns for periods of less than one year are not annualized. |
The accompanying notes are an integral part of these financial statements.
| | | | | | |
| Financial highlights | | Wells Fargo Minnesota Tax-Free Fund | | | 19 | |
(For a share outstanding throughout each period)
| | | | | | | | |
| | | Six months ended
December 31, 2017 (unaudited) | | | Year ended
June 30, 20171 | |
| INSTITUTIONAL CLASS | | |
Net asset value, beginning of period | | | $10.69 | | | | $10.88 | |
Net investment income | | | 0.16 | | | | 0.21 | |
Net realized and unrealized gains (losses) on investments | | | 0.01 | | | | (0.14 | ) |
| | | | | | | | |
Total from investment operations | | | 0.17 | | | | 0.07 | |
Distributions to shareholders from | | | | | | | | |
Net investment income | | | (0.16 | ) | | | (0.21 | ) |
Net realized gains | | | (0.01 | ) | | | (0.05 | ) |
| | | | | | | | |
Total distributions to shareholders | | | (0.17 | ) | | | (0.26 | ) |
Net asset value, end of period | | | $10.69 | | | | $10.69 | |
Total return2 | | | 1.52 | % | | | 0.62 | % |
Ratios to average net assets (annualized) | | | | | | | | |
Gross expenses | | | 0.51 | % | | | 0.52 | % |
Net expenses | | | 0.51 | % | | | 0.51 | % |
Net investment income | | | 2.90 | % | | | 2.91 | % |
Supplemental data | | | | | | | | |
Portfolio turnover rate | | | 7 | % | | | 22 | % |
Net assets, end of period (000s omitted) | | | $26,925 | | | | $22,785 | |
| 1 | For the period from October 31, 2016 (commencement of class operations) to June 30, 2017 |
| 2 | Returns for periods of less than one year are not annualized. |
The accompanying notes are an integral part of these financial statements.
| | | | |
| 20 | | Wells Fargo Minnesota Tax-Free Fund | | Notes to financial statements (unaudited) |
1. ORGANIZATION
Wells Fargo Funds Trust (the “Trust”), a Delaware statutory trust organized on March 10, 1999, is an open-end management investment company registered under the Investment Company Act of 1940, as amended (the “1940 Act”). As an investment company, the Trust follows the accounting and reporting guidance in Financial Accounting Standards Board Accounting Standards Codification Topic 946, Financial Services – Investment Companies. These financial statements report on the Wells Fargo Minnesota Tax-Free Fund (the “Fund”) which is a diversified series of the Trust.
2. SIGNIFICANT ACCOUNTING POLICIES
The following significant accounting policies, which are consistently followed in the preparation of the financial statements of the Fund, are in conformity with U.S. generally accepted accounting principles which require management to make estimates and assumptions that affect the reported amounts of assets and liabilities, disclosure of contingent assets and liabilities at the date of the financial statements, and the reported amounts of revenues and expenses during the reporting period. Actual results could differ from those estimates.
Securities valuation
All investments are valued each business day as of the close of regular trading on the New York Stock Exchange (generally 4 p.m. Eastern Time), although the Fund may deviate from this calculation time under unusual or unexpected circumstances.
Debt securities are valued at the evaluated bid price provided by an independent pricing service or, if a reliable price is not available, the quoted bid price from an independent broker-dealer.
Investments which are not valued using any of the methods discussed above are valued at their fair value, as determined in good faith by the Board of Trustees of the Fund. The Board of Trustees has established a Valuation Committee comprised of the Trustees and has delegated to it the authority to take any actions regarding the valuation of portfolio securities that the Valuation Committee deems necessary or appropriate, including determining the fair value of portfolio securities, unless the determination has been delegated to the Management Valuation Team of Wells Fargo Funds Management, LLC (“Funds Management”). The Board of Trustees retains the authority to make or ratify any valuation decisions or approve any changes to the Valuation Procedures as it deems appropriate. On a quarterly basis, the Board of Trustees receives reports on any valuation actions taken by the Valuation Committee or the Management Valuation Team which may include items for ratification.
Valuations of fair valued securities are compared to the next actual sales price when available, or other appropriate market values, to assess the continued appropriateness of the fair valuation methodologies used. These securities are fair valued on a day-to-day basis, taking into consideration changes to appropriate market information and any significant changes to the inputs considered in the valuation process until there is a readily available price provided on an exchange or by an independent pricing service. Valuations received from an independent pricing service or independent broker-dealer quotes are periodically validated by comparisons to most recent trades and valuations provided by other independent pricing services in addition to the review of prices by the manager and/or subadviser. Unobservable inputs used in determining fair valuations are identified based on the type of security, taking into consideration factors utilized by market participants in valuing the investment, knowledge about the issuer and the current market environment.
When-issued transactions
The Fund may purchase securities on a forward commitment or when-issued basis. The Fund records a when-issued transaction on the trade date and will segregate assets in an amount at least equal in value to the Fund’s commitment to purchase when-issued securities. Securities purchased on a when-issued basis are marked-to-market daily and the Fund begins earning interest on the settlement date. Losses may arise due to changes in the market value of the underlying securities or if the counterparty does not perform under the contract.
Security transactions and income recognition
Securities transactions are recorded on a trade date basis. Realized gains or losses are recorded on the basis of identified cost.
Interest income is accrued daily and bond discounts are accreted and premiums are amortized daily based on the effective interest method. To the extent debt obligations are placed on non-accrual status, any related interest income may be reduced by writing off interest receivables when the collection of all or a portion of interest has been determined to be doubtful based on consistently applied procedures and the fair value has decreased. If the issuer subsequently resumes interest payments or when the collectability of interest is reasonably assured, the debt obligation is removed from non-accrual status.
| | | | | | |
| Notes to financial statements (unaudited) | | Wells Fargo Minnesota Tax-Free Fund | | | 21 | |
Distributions to shareholders
Distributions to shareholders from net investment income are accrued daily and paid monthly. Distributions from net realized gains, if any, are recorded on the ex-dividend date. Such distributions are determined in accordance with income tax regulations and may differ from U.S. generally accepted accounting principles. Dividend sources are estimated at the time of declaration. The tax character of distributions is determined as of the Fund’s fiscal year end. Therefore, a portion of the Fund’s distributions made prior to the Fund’s fiscal year end may be categorized as a tax return of capital.
Federal and other taxes
The Fund intends to continue to qualify as a regulated investment company by distributing substantially all of its investment company taxable and tax-exempt income and any net realized capital gains (after reduction for capital loss carryforwards) sufficient to relieve it from all, or substantially all, federal income taxes. Accordingly, no provision for federal income taxes was required.
The Fund’s income and federal excise tax returns and all financial records supporting those returns for the prior three fiscal years are subject to examination by the federal and Delaware revenue authorities. Management has analyzed the Fund’s tax positions taken on federal, state, and foreign tax returns for all open tax years and does not believe that there are any uncertain tax positions that require recognition of a tax liability.
As of December 31, 2017, the aggregate cost of all investments for federal income tax purposes was $160,487,019 and the unrealized gains (losses) consisted of:
| | | | |
Gross unrealized gains | | $ | 5,162,570 | |
Gross unrealized losses | | | (569,416 | ) |
Net unrealized gains | | $ | 4,593,154 | |
As of June 30, 2017, the Fund had current year deferred post-October capital losses consisting of $48,970 in short-term losses which were recognized on the first day of the current fiscal year.
Class allocations
The separate classes of shares offered by the Fund differ principally in applicable sales charges, distribution, shareholder servicing, and administration fees. Class specific expenses are charged directly to that share class. Investment income, common expenses, and realized and unrealized gains (losses) on investments are allocated daily to each class of shares based on the relative proportion of net assets of each class.
3. FAIR VALUATION MEASUREMENTS
Fair value measurements of investments are determined within a framework that has established a fair value hierarchy based upon the various data inputs utilized in determining the value of the Fund’s investments. The three-level hierarchy gives the highest priority to unadjusted quoted prices in active markets for identical assets or liabilities (Level 1) and the lowest priority to unobservable inputs (Level 3). The Fund’s investments are classified within the fair value hierarchy based on the lowest level of input that is significant to the fair value measurement. The inputs are summarized into three broad levels as follows:
| ∎ | | Level 1 – quoted prices in active markets for identical securities |
| ∎ | | Level 2 – other significant observable inputs (including quoted prices for similar securities, interest rates, prepayment speeds, credit risk, etc.) |
| ∎ | | Level 3 – significant unobservable inputs (including the Fund’s own assumptions in determining the fair value of investments) |
The inputs or methodologies used for valuing investments in securities are not necessarily an indication of the risk associated with investing in those securities.
| | | | |
| 22 | | Wells Fargo Minnesota Tax-Free Fund | | Notes to financial statements (unaudited) |
The following is a summary of the inputs used in valuing the Fund’s assets and liabilities as of December 31, 2017:
| | | | | | | | | | | | | | | | |
| | | Quoted prices
(Level 1) | | | Other significant
observable inputs
(Level 2) | | | Significant
unobservable inputs (Level 3) | | | Total | |
Assets | | | | | | | | | | | | | | | | |
Investments in: | | | | | | | | | | | | | | | | |
| | | | |
Municipal obligations | | $ | 0 | | | $ | 165,080,173 | | | $ | 0 | | | $ | 165,080,173 | |
The Fund recognizes transfers between levels within the fair value hierarchy at the end of the reporting period. At December 31, 2017, the Fund did not have any transfers into/out of Level 1, Level 2, or Level 3.
4. TRANSACTIONS WITH AFFILIATES
Management fee
Funds Management, an indirect wholly owned subsidiary of Wells Fargo & Company (“Wells Fargo”), is the manager of the Fund and provides advisory and fund-level administrative services under an investment management agreement. Under the investment management agreement, Funds Management is responsible for, among other services, implementing the investment objectives and strategies of the Fund, supervising the subadviser, providing fund-level administrative services in connection with the Fund’s operations, and providing any other fund-level administrative services reasonably necessary for the operation of the Fund. As compensation for its services under the investment management agreement, Funds Management is entitled to receive an annual management fee starting at 0.40% and declining to 0.28% as the average daily net assets of the Fund increase. For the six months ended December 31, 2017, the management fee was equivalent to an annual rate of 0.40% of the Fund’s average daily net assets.
Funds Management has retained the services of a subadviser to provide daily portfolio management to the Fund. The fee for subadvisory services is borne by Funds Management. Wells Capital Management Incorporated, an affiliate of Funds Management and an indirect wholly owned subsidiary of Wells Fargo, is the subadviser to the Fund and is entitled to receive a fee from Funds Management at an annual rate starting at 0.20% and declining to 0.10% as the average daily net assets of the Fund increase.
Administration fees
Under a class-level administration agreement, Funds Management provides class-level administrative services to the Fund, which includes paying fees and expenses for services provided by the transfer agent, sub-transfer agents, omnibus account servicers and record-keepers. As compensation for its services under the class-level administration agreement, Funds Management receives an annual fee which is calculated based on the average daily net assets of each class as follows:
| | | | |
| | | Class-level
administration fee | |
Class A, Class C | | | 0.16 | % |
Administrator Class | | | 0.10 | |
Institutional Class | | | 0.08 | |
Funds Management has contractually waived and/or reimbursed management and administration fees to the extent necessary to maintain certain net operating expense ratios for the Fund. Waiver of fees and/or reimbursement of expenses by Funds Management were made first from fund level expenses on a proportionate basis and then from class specific expenses. Funds Management has committed through October 31, 2018 to waive fees and/or reimburse expenses to the extent necessary to cap the Fund’s expenses at 0.85% for Class A shares, 1.60% for Class C shares, 0.60% for Administrator Class shares and 0.52% for Institutional Class shares. After this time, the cap may be increased or the commitment to maintain the cap may be terminated only with the approval of the Board of Trustees.
Distribution fee
The Trust has adopted a distribution plan for Class C shares of the Fund pursuant to Rule 12b-1 under the 1940 Act. A Distribution fee is charged to Class C and paid to Wells Fargo Funds Distributor, LLC (“Funds Distributor”), the principal underwriter, at an annual rate of 0.75% of the average daily net assets of Class C shares.
In addition, Funds Distributor is entitled to receive the front-end sales charge from the purchase of Class A shares and a contingent deferred sales charge on the redemption of certain Class A shares. Funds Distributor is also entitled to receive
| | | | | | |
| Notes to financial statements (unaudited) | | Wells Fargo Minnesota Tax-Free Fund | | | 23 | |
the contingent deferred sales charges from redemptions of Class C shares. For the six months ended December 31, 2017, Funds Distributor received $245 from the sale of Class A shares. No contingent deferred sales charges were incurred by Class A and Class C shares for the six months ended December 31, 2017.
Shareholder servicing fees
The Trust has entered into contracts with one or more shareholder servicing agents, whereby Class A, Class C, and Administrator Class of the Fund are charged a fee at an annual rate of 0.25% of the average daily net assets of each respective class.
A portion of these total shareholder servicing fees were paid to affiliates of Wells Fargo.
Interfund transactions
The Fund may purchase or sell portfolio investment securities to certain other Wells Fargo affiliates pursuant to Rule 17a-7 under the 1940 Act and under procedures adopted by the Board of Trustees. The procedures have been designed to ensure that these interfund transactions, which do not incur broker commissions, are effected at current market prices. Pursuant to these procedures, the Fund had $4,000,000 and $12,250,000 in interfund purchases and sales, respectively, during the six months ended December 31, 2017.
5. INVESTMENT PORTFOLIO TRANSACTIONS
Purchases and sales of investments, excluding U.S. government obligations (if any) and short-term securities, for the six months ended December 31, 2017 were $14,803,542 and $11,634,196, respectively.
6. BANK BORROWINGS
The Trust (excluding the money market funds and certain other funds) and Wells Fargo Variable Trust are parties to a $280,000,000 revolving credit agreement whereby the Fund is permitted to use bank borrowings for temporary or emergency purposes, such as to fund shareholder redemption requests. Interest under the credit agreement is charged to the Fund based on a borrowing rate equal to the higher of the Federal Funds rate in effect on that day plus 1.25% or the overnight LIBOR rate in effect on that day plus 1.25%. In addition, an annual commitment fee equal to 0.25% of the unused balance is allocated to each participating fund. Prior to August 29, 2017, the revolving credit agreement amount was $250,000,000.
For the six months ended December 31, 2017, there were no borrowings by the Fund under the agreement.
7. CONCENTRATION RISK
The Fund invests a substantial portion of its assets in issuers of municipal debt securities located in a single state or territories of the U.S. Therefore, it may be more affected by economic and political developments in that state or region than would be a comparable general tax-exempt fund.
8. INDEMNIFICATION
Under the Trust’s organizational documents, the officers and Trustees have been granted certain indemnification rights against certain liabilities that may arise out of performance of their duties to the Trust. Additionally, in the normal course of business, the Trust may enter into contracts with service providers that contain a variety of indemnification clauses. The Trust’s maximum exposure under these arrangements is dependent on future claims that may be made against the Fund and, therefore, cannot be estimated.
| | | | |
| 24 | | Wells Fargo Minnesota Tax-Free Fund | | Other information (unaudited) |
PROXY VOTING INFORMATION
A description of the policies and procedures that the Fund uses to determine how to vote proxies relating to portfolio securities is available, upon request, by calling 1-800-222-8222, visiting our website at wellsfargofunds.com, or visiting the SEC website at sec.gov. Information regarding how the Fund voted proxies relating to portfolio securities during the most recent 12-month period ended June 30 is available on the Fund’s website at wellsfargofunds.com or by visiting the SEC website at sec.gov.
PORTFOLIO HOLDINGS INFORMATION
The complete portfolio holdings for the Fund are publicly available monthly on the Fund’s website (wellsfargofunds.com), on a one-month delayed basis. In addition, top ten holdings information (excluding derivative positions) for the Fund is publicly available on the Fund’s website on a monthly, seven-day or more delayed basis. The Fund files its complete schedule of portfolio holdings with the SEC for the first and third quarters of each fiscal year on Form N-Q, which is available by visiting the SEC website at sec.gov. In addition, the Fund’s Form N-Q may be reviewed and copied at the SEC’s Public Reference Room in Washington, DC, and at regional offices in New York City, at 233 Broadway, and in Chicago, at 175 West Jackson Boulevard, Suite 900. Information about the Public Reference Room may be obtained by calling 1-800-SEC-0330.
| | | | | | |
| Other information (unaudited) | | Wells Fargo Minnesota Tax-Free Fund | | | 25 | |
BOARD OF TRUSTEES AND OFFICERS
Each of the Trustees and Officers1 listed in the table below acts in identical capacities for each fund in the Wells Fargo family of funds, which consists of 153 mutual funds comprising the Wells Fargo Funds Trust, Wells Fargo Variable Trust, Wells Fargo Master Trust and four closed-end funds (collectively the “Fund Complex”). This table should be read in conjunction with the Prospectus and the Statement of Additional Information2. The mailing address of each Trustee and Officer is 525 Market Street, 12th Floor, San Francisco, CA 94105. Each Trustee and Officer serves an indefinite term, however, each Trustee serves such term until reaching the mandatory retirement age established by the Trustees.
Independent Trustees
| | | | | | |
Name and
year of birth | | Position held and
length of service* | | Principal occupations during past five years or longer | | Current other
public company or
investment company
directorships |
| William R. Ebsworth (Born 1957) | | Trustee, since 2015 | | Retired. From 1984 to 2013, equities analyst, portfolio manager, research director and chief investment officer at Fidelity Management and Research Company in Boston, Tokyo, and Hong Kong, and retired in 2013 as Chief Investment Officer of Fidelity Strategic Advisers, Inc. where he led a team of investment professionals managing client assets. Prior thereto, Board member of Hong Kong Securities Clearing Co., Hong Kong Options Clearing Corp., the Thailand International Fund, Ltd., Fidelity Investments Life Insurance Company, and Empire Fidelity Investments Life Insurance Company. Board member of the Forté Foundation (non-profit organization) and the Vincent Memorial Hospital Endowment (non-profit organization), where he serves on the Investment Committee and as a Chair of the Audit Committee. Mr. Ebsworth is a CFA® charterholder. | | Asset Allocation Trust |
Jane A. Freeman**
(Born 1953) | | Trustee, since 2015; Chair Liaison, since 2018 | | Retired. From 2012 to 2014 and 1999 to 2008, Chief Financial Officer of Scientific Learning Corporation. From 2008 to 2012, Ms. Freeman provided consulting services related to strategic business projects. Prior to 1999, Portfolio Manager at Rockefeller & Co. and Scudder, Stevens & Clark. Board member of the Harding Loevner Funds from 1996 to 2014, serving as both Lead Independent Director and chair of the Audit Committee. Board member of the Russell Exchange Traded Funds Trust from 2011 to 2012 and the chair of the Audit Committee. Ms. Freeman is a Board Member of Ruth Bancroft Garden (non-profit organization) and the Glimmerglass Festival. She is also an inactive Chartered Financial Analyst. | | Asset Allocation Trust |
| Peter G. Gordon*** (Born 1942) | | Trustee, since 1998; Chairman, from 2005 to 2017 | | Co-Founder, Retired Chairman, President and CEO of Crystal Geyser Water Company. Trustee Emeritus, Colby College. | | Asset Allocation Trust |
Isaiah Harris, Jr. (Born 1952) | | Trustee, since 2009 | | Retired. Chairman of the Board of CIGNA Corporation since 2009, and Director since 2005. From 2003 to 2011, Director of Deluxe Corporation. Prior thereto, President and CEO of BellSouth Advertising and Publishing Corp. from 2005 to 2007, President and CEO of BellSouth Enterprises from 2004 to 2005 and President of BellSouth Consumer Services from 2000 to 2003. Emeritus member of the Iowa State University Foundation Board of Governors. Emeritus Member of the Advisory Board of Iowa State University School of Business. Advisory Board Member, Palm Harbor Academy (charter school). Advisory Board Member, Child Evangelism Fellowship (non-profit). Mr. Harris is a certified public accountant (inactive status). | | CIGNA Corporation; Asset Allocation Trust |
Judith M. Johnson
(Born 1949) | | Trustee, since 2008; Audit Committee Chairman, since 2008 | | Retired. Prior thereto, Chief Executive Officer and Chief Investment Officer of Minneapolis Employees Retirement Fund from 1996 to 2008. Ms. Johnson is an attorney, certified public accountant and a certified managerial accountant. | | Asset Allocation Trust |
David F. Larcker
(Born 1950) | | Trustee, since 2009 | | James Irvin Miller Professor of Accounting at the Graduate School of Business, Stanford University, Director of the Corporate Governance Research Initiative and Senior Faculty of The Rock Center for Corporate Governance since 2006. From 2005 to 2008, Professor of Accounting at the Graduate School of Business, Stanford University. Prior thereto, Ernst & Young Professor of Accounting at The Wharton School, University of Pennsylvania from 1985 to 2005. | | Asset Allocation Trust |
| | | | |
| 26 | | Wells Fargo Minnesota Tax-Free Fund | | Other information (unaudited) |
| | | | | | |
Name and
year of birth | | Position held and
length of service* | | Principal occupations during past five years or longer | | Current other
public company or
investment company
directorships |
| Olivia S. Mitchell**** (Born 1953) | | Trustee, since 2006; Governance Committee Chairman, since 2018 | | International Foundation of Employee Benefit Plans Professor, Wharton School of the University of Pennsylvania since 1993. Director of Wharton’s Pension Research Council and Boettner Center on Pensions & Retirement Research, and Research Associate at the National Bureau of Economic Research. Previously, Cornell University Professor from 1978 to 1993. | | Asset Allocation Trust |
Timothy J. Penny***** (Born 1951) | | Trustee, since 1996; Chairman, since 2018; Vice Chairman, from 2017 to 2018 | | President and Chief Executive Officer of Southern Minnesota Initiative Foundation, a non-profit organization, since 2007. Member of the Board of Trustees of NorthStar Education Finance, Inc., a non-profit organization, since 2007. | | Asset Allocation Trust |
James G. Polisson****** (Born 1959) | | Trustee, since 2018; Advisory Board Member, from 2017 to 2018 | | Retired. Chief Marketing Officer, Source (ETF) UK Services, Ltd, from 2015 to 2017. From 2012 to 2015, Principal of The Polisson Group, LLC, a management consulting, corporate advisory and principal investing company. Chief Executive Officer and Managing Director at Russell Investments, Global Exchange Traded Funds from 2010 to 2012. Managing Director of Barclays Global Investors from 1998 to 2010 and Global Chief Marketing Officer for iShares and Barclays Global Investors from 2000 to 2010. Trustee of the San Francisco Mechanics’ Institute, a non-profit organization, from 2013 to 2015. Board member of the Russell Exchange Traded Fund Trust from 2011 to 2012. Director of Barclays Global Investors Holdings Deutschland GmbH from 2006 to 2009. Mr. Polisson is an attorney and has a retired status with the Massachusetts and District of Columbia Bar Associations. | | Asset Allocation Trust |
Michael S. Scofield
(Born 1943) | | Trustee, since 2010 | | Served on the Investment Company Institute’s Board of Governors and Executive Committee from 2008-2011 as well the Governing Council of the Independent Directors Council from 2006-2011 and the Independent Directors Council Executive Committee from 2008-2011. Trustee of the Evergreen Funds complex (and its predecessors) from 1984 to 2010. Chairman of the Evergreen Funds from 2000-2010. Former Trustee of the Mentor Funds. Retired Attorney, Law Offices of Michael S. Scofield. | | Asset Allocation Trust |
| Pamela Wheelock****** (Born 1959) | | Trustee, since 2018; Advisory Board Member, from 2017 to 2018 | | Chief Operating Officer, Twin Cities Habitat for Humanity, since January, 2017. Vice President of University Services, University of Minnesota from 2012 to 2017. Prior thereto, Interim President and Chief Executive Officer of Blue Cross Blue Shield of Minnesota from 2010 to 2011, Chairman of the Board from 2009 to 2011 and Board Director from 2003 to 2015. Vice President, Leadership and Community Engagement, Bush Foundation, Saint Paul, Minnesota (a private foundation) from 2009 to 2011. Executive Vice President and Chief Financial Officer, Minnesota Sports and Entertainment from 2004 to 2009 and Senior Vice President from 2002 to 2004. Commissioner of Finance, State of Minnesota, from 1999 to 2002. Currently on the Board of Directors, Governance Committee and Finance Committee, for the Minnesota Philanthropy Partners (Saint Paul Foundation) since 2012 and Board Chair of the Minnesota Wild Foundation since 2010. | | Asset Allocation Trust |
| * | Length of service dates reflect the Trustee’s commencement of service with the Trust’s predecessor entities, where applicable. |
| ** | Jane Freeman became Chair Liaison effective January 1, 2018. |
| *** | Peter Gordon retired on December 31, 2017. |
| **** | Olivia Mitchell became Chairman of the Governance Committee effective January 1, 2018. |
| ***** | Timothy Penny became Chairman effective January 1, 2018. |
| ****** | James Polisson and Pamela Wheelock each became a Trustee effective January 1, 2018. |
| | | | | | |
| Other information (unaudited) | | Wells Fargo Minnesota Tax-Free Fund | | | 27 | |
Officers
| | | | | | |
Name and
year of birth | | Position held and
length of service | | Principal occupations during past five years or longer | | |
Andrew Owen
(Born 1960) | | President, since 2017 | | Executive Vice President of Wells Fargo & Company and Head of Affiliated Managers, Wells Fargo Asset Management, since 2014. In addition, Mr. Owen is currently President, Chief Executive Officer and Director of Wells Fargo Funds Management, LLC since 2017. Prior thereto, Executive Vice President responsible for marketing, investments and product development for Wells Fargo Funds Management, LLC, from 2009 to 2014. | | |
| Nancy Wiser1 (Born 1967) | | Treasurer, since 2012 | | Executive Vice President of Wells Fargo Funds Management, LLC since 2011. Chief Operating Officer and Chief Compliance Officer at LightBox Capital Management LLC, from 2008 to 2011. | | |
| C. David Messman (Born 1960) | | Secretary, since 2000; Chief Legal Officer, since 2003 | | Senior Vice President and Secretary of Wells Fargo Funds Management, LLC since 2001. Assistant General Counsel of Wells Fargo Bank, N.A. since 2013 and Vice President and Managing Counsel of Wells Fargo Bank, N.A. from 1996 to 2013. | | |
| Michael H. Whitaker (Born 1967) | | Chief Compliance Officer, since 2016 | | Senior Vice President and Chief Compliance Officer since 2016. Senior Vice President and Chief Compliance Officer for Fidelity Investments from 2007 to 2016. | | |
David Berardi
(Born 1975) | | Assistant Treasurer, since 2009 | | Vice President of Wells Fargo Funds Management, LLC since 2009. Vice President of Evergreen Investment Management Company, LLC from 2008 to 2010. Manager of Fund Reporting and Control for Evergreen Investment Management Company, LLC from 2004 to 2010. | | |
| Jeremy DePalma1 (Born 1974) | | Assistant Treasurer, since 2009 | | Senior Vice President of Wells Fargo Funds Management, LLC since 2009. Senior Vice President of Evergreen Investment Management Company, LLC from 2008 to 2010 and head of the Fund Reporting and Control Team within Fund Administration from 2005 to 2010. | | |
| 1 | Nancy Wiser acts as Treasurer of 77 funds in the Fund Complex. Jeremy DePalma acts as Treasurer of 76 funds and Assistant Treasurer of 77 funds in the Fund Complex. |
| 2 | The Statement of Additional Information includes additional information about the Trustees and is available, without charge, upon request, by calling 1-800-222-8222 or by visiting the website at wellsfargofunds.com. |
| | | | |
| 28 | | Wells Fargo Minnesota Tax-Free Fund | | List of abbreviations |
The following is a list of common abbreviations for terms and entities that may have appeared in this report.
| ACA | — ACA Financial Guaranty Corporation |
| ADR | — American depositary receipt |
| ADS | — American depositary shares |
| AGC | — Assured Guaranty Corporation |
| AGM | — Assured Guaranty Municipal |
| Ambac | — Ambac Financial Group Incorporated |
| AMT | — Alternative minimum tax |
| BAN | — Bond anticipation notes |
| BHAC | — Berkshire Hathaway Assurance Corporation |
| CAB | — Capital appreciation bond |
| CCAB | — Convertible capital appreciation bond |
| CDA | — Community Development Authority |
| CDO | — Collateralized debt obligation |
| CLO | — Collateralized loan obligation |
| DRIVER | — Derivative inverse tax-exempt receipts |
| DW&P | — Department of Water & Power |
| DWR | — Department of Water Resources |
| ECFA | — Educational & Cultural Facilities Authority |
| EDA | — Economic Development Authority |
| EDFA | — Economic Development Finance Authority |
| ETF | — Exchange-traded fund |
| FDIC | — Federal Deposit Insurance Corporation |
| FFCB | — Federal Farm Credit Banks |
| FGIC | — Financial Guaranty Insurance Corporation |
| FHA | — Federal Housing Administration |
| FHLB | — Federal Home Loan Bank |
| FHLMC | — Federal Home Loan Mortgage Corporation |
| FICO | — The Financing Corporation |
| FNMA | — Federal National Mortgage Association |
| GDR | — Global depositary receipt |
| GNMA | — Government National Mortgage Association |
| HCFR | — Healthcare facilities revenue |
| HEFA | — Health & Educational Facilities Authority |
| HEFAR | — Higher education facilities authority revenue |
| HFA | — Housing Finance Authority |
| HFFA | — Health Facilities Financing Authority |
| HUD | — Department of Housing and Urban Development |
| IDA | — Industrial Development Authority |
| IDAG | — Industrial Development Agency |
| KRW | — Republic of Korea won |
| LIBOR | — London Interbank Offered Rate |
| LIFER | — Long Inverse Floating Exempt Receipts |
| LLC | — Limited liability company |
| LLLP | — Limited liability limited partnership |
| LLP | — Limited liability partnership |
| MBIA | — Municipal Bond Insurance Association |
| MFHR | — Multifamily housing revenue |
| MSTR | — Municipal securities trust receipts |
| MUD | — Municipal Utility District |
| National | — National Public Finance Guarantee Corporation |
| PCFA | — Pollution Control Financing Authority |
| PCL | — Public Company Limited |
| PCR | — Pollution control revenue |
| PFA | — Public Finance Authority |
| PFFA | — Public Facilities Financing Authority |
| PFOTER | — Puttable floating option tax-exempt receipts |
| PJSC | — Public Joint Stock Company |
| plc | — Public limited company |
| PUTTER | — Puttable tax-exempt receipts |
| R&D | — Research & development |
| Radian | — Radian Asset Assurance |
| RAN | — Revenue anticipation notes |
| RDA | — Redevelopment Agency |
| RDFA | — Redevelopment Finance Authority |
| REIT | — Real estate investment trust |
| ROC | — Reset option certificates |
| SAVRS | — Select auction variable rate securities |
| SBA | — Small Business Authority |
| SDR | — Swedish depositary receipt |
| SFHR | — Single-family housing revenue |
| SFMR | — Single-family mortgage revenue |
| SIFMA | — Securities Industry and Financial Markets Association |
| SPA | — Standby purchase agreement |
| SPDR | — Standard & Poor’s Depositary Receipts |
| SPEAR | — Short Puttable Exempt Adjustable Receipts |
| STRIPS | — Separate trading of registered interest and |
| TAN | — Tax anticipation notes |
| TIPS | — Treasury inflation-protected securities |
| TRAN | — Tax revenue anticipation notes |
| TTFA | — Transportation Trust Fund Authority |
| TVA | — Tennessee Valley Authority |

For more information
More information about Wells Fargo Funds is available free upon request. To obtain literature, please write, email, visit the Fund’s website, or call:
Wells Fargo Funds
P.O. Box 8266
Boston, MA 02266-8266
Email: fundservice@wellsfargo.com
Website: wellsfargofunds.com
Individual investors: 1-800-222-8222
Retail investment professionals: 1-888-877-9275
Institutional investment professionals: 1-866-765-0778
This report and the financial statements contained herein are submitted for the general information of the shareholders of the Fund. If this report is used for promotional purposes, distribution of the report must be accompanied or preceded by a current prospectus. Before investing, please consider the investment objectives, risks, charges, and expenses of the investment. For a current prospectus and, if available, a summary prospectus, containing this information, call 1-800-222-8222 or visit the Fund’s website at wellsfargofunds.com. Read the prospectus carefully before you invest or send money.
Wells Fargo Asset Management (WFAM) is a trade name used by the asset management businesses of Wells Fargo & Company. Wells Fargo Funds Management, LLC, a wholly owned subsidiary of Wells Fargo & Company, provides investment advisory and administrative services for Wells Fargo Funds. Other affiliates of Wells Fargo & Company provide subadvisory and other services for the funds. The funds are distributed by Wells Fargo Funds Distributor, LLC, Member FINRA, an affiliate of Wells Fargo & Company. Neither Wells Fargo Funds Distributor nor Wells Fargo Funds Management holds fund shareholder accounts or assets. This material is for general informational and educational purposes only and is NOT intended to provide investment advice or a recommendation of any kind—including a recommendation for any specific investment, strategy, or plan.
NOT FDIC INSURED ◾ NO BANK GUARANTEE ◾ MAY LOSE VALUE
© 2017 Wells Fargo Funds Management, LLC. All rights reserved.
| | |
 | | 308063 02-18 SA252/SAR252 12-17 |
Semi-Annual Report
December 31, 2017

Wells Fargo Municipal Bond Fund


Reduce clutter. Save trees.
Sign up for electronic delivery of prospectuses and shareholder reports at wellsfargo.com/advantagedelivery
Contents
The views expressed and any forward-looking statements are as of December 31, 2017, unless otherwise noted, and are those of the Fund managers and/or Wells Fargo Funds Management, LLC. Discussions of individual securities, or the markets generally, or any Wells Fargo Fund are not intended as individual recommendations. Future events or results may vary significantly from those expressed in any forward-looking statements. The views expressed are subject to change at any time in response to changing circumstances in the market. Wells Fargo Funds Management, LLC and the Fund disclaim any obligation to publicly update or revise any views expressed or forward-looking statements.
NOT FDIC INSURED ◾ NO BANK GUARANTEE ◾ MAY LOSE VALUE
| | | | |
| 2 | | Wells Fargo Municipal Bond Fund | | Letter to shareholders (unaudited) |

Andrew Owen
President
Wells Fargo Funds
In a predominantly improving global economic environment, global stocks delivered strong results; bond markets had smaller but positive results as well.
Dear Shareholder:
We are pleased to offer you this semi-annual report for the Wells Fargo Municipal Bond Fund for the six-month period that ended December 31, 2017. In a predominantly improving global economic environment, global stocks delivered strong results; bond markets had smaller but positive results as well. U.S. and international stocks delivered similar results, with returns of 11.42% and 11.48%, respectively, for the six-month period, as measured by the S&P 500 Index1 and the MSCI ACWI ex USA Index (Net)2, respectively; within fixed income, the Bloomberg Barclays U.S. Aggregate Bond Index3 returned 1.24% and the Bloomberg Barclays Municipal Bond Index4 returned 1.82%.
As global growth improved in the third quarter of 2017, investment markets generally advanced.
Most stock markets worldwide moved higher during the quarter and ended the period at or near all-time highs. Moderate acceleration in global economic growth was supported by improving corporate earnings, low inflation pressure, and still-low interest rates. Corporate earnings reports were favorable overall as companies continued to benefit from healthy operating leverage. While North Korea’s recent missile launches and nuclear testing raised serious concerns around the world, the heightened geopolitical risk had relatively minimal impact on the quarter’s stock returns. In the U.S., economic data released during the quarter reflected a generally healthy economy. Second-quarter economic output grew at a 3.1% annual rate, and consumers displayed more willingness to spend. Meanwhile, the U.S. Federal Reserve (Fed) maintained the target range for the federal funds rate at 1.00% to 1.25%, noting that inflation had remained below the Fed’s 2.00% objective. However, the Fed also stated the possibility of one more 0.25% increase in the federal funds rate by the end of 2017 and announced plans to begin the process of unwinding its $4.5 trillion portfolio of bonds and other assets in October. Outside the U.S., stocks in the Asia Pacific region benefited from solid earnings reports and investors’ willingness to take on risk despite the rising tensions between North Korea and the U.S. In Europe, markets were supported by better-than-expected economic growth, which led to narrowing of the gap between Europe’s growth rate and that of the U.S. In emerging markets, many countries benefited from stronger currencies versus the U.S. dollar.
Positive economic and market news continued through the fourth quarter.
During the fourth quarter of 2017, stock markets followed a steady, upward trajectory with no meaningful pullbacks, similar to their paths during the previous three quarters of the year. The extended rally was driven largely by reports of strong earnings and revenue surprises from many companies. Synchronous economic expansion worldwide with mild inflation provided a favorable environment for markets to rise with minimal volatility. Data released during the quarter reflected a
| 1 | The S&P 500 Index consists of 500 stocks chosen for market size, liquidity, and industry group representation. It is a market-value-weighted index with each stock’s weight in the index proportionate to its market value. You cannot invest directly in an index. |
| 2 | The Morgan Stanley Capital International (MSCI) All Country World Index (ACWI) ex USA Index (Net) is a free-float-adjusted market-capitalization-weighted index that is designed to measure the equity market performance of developed markets, excluding the United States and Canada. Source: MSCI. MSCI makes no express or implied warranties or representations and shall have no liability whatsoever with respect to any MSCI data contained herein. The MSCI data may not be further redistributed or used as a basis for other indices or any securities or financial products. This report is not approved, reviewed, or produced by MSCI. You cannot invest directly in an index. |
| 3 | The Bloomberg Barclays U.S. Aggregate Bond Index is a broad-based benchmark that measures the investment-grade, U.S. dollar-denominated, fixed-rate taxable bond market, including Treasuries, government-related and corporate securities, mortgage-backed securities (agency fixed-rate and hybrid adjustable-rate mortgage pass-throughs), asset-backed securities, and commercial mortgage-backed securities. You cannot invest directly in an index. |
| 4 | The Bloomberg Barclays Municipal Bond Index is an unmanaged index composed of long-term tax-exempt bonds with a minimum credit rating of Baa. You cannot invest directly in an index. |
| | | | | | |
| Letter to shareholders (unaudited) | | Wells Fargo Municipal Bond Fund | | | 3 | |
healthy U.S. economy. Third-quarter economic output grew at a 3.2% annual rate, just ahead of the second quarter’s 3.1% pace. Hiring remained solid during the quarter; the hiring pace pushed the unemployment rate down to a 17-year low of 4.1% in October, and it remained at 4.1% for both November and December. Fed officials began unwinding the Fed’s $4.5 trillion portfolio of bonds and other assets in October as planned, and in December they raised the target for the federal funds rate to a range of 1.25% to 1.50%. As a result, long-term interest rates in the U.S. continued trending upward, although the 10-year rate remained below 2.5%. Outside the U.S., economies continued to strengthen. In December, the Organisation for Economic Co-operation and Development (OECD) reported that the global economy has been expanding at its fastest rate since 2010; all 45 countries the OECD follows were on track to expand for 2017. International economies have benefited from catalysts such as economic stimulus, improving employment, increased investment, and accelerated trade growth.
Don’t let short-term uncertainty derail long-term investment goals.
Periods of investment uncertainty can present challenges, but experience has taught us that maintaining long-term investment goals can be an effective way to plan for the future. To help you create a sound strategy based on your personal goals and risk tolerance, Wells Fargo Funds offers more than 100 mutual funds spanning a wide range of asset classes and investment styles. Although diversification cannot guarantee an investment profit or prevent losses, we believe it can be an effective way to manage investment risk and potentially smooth out overall portfolio performance. We encourage investors to know their investments and to understand that appropriate levels of risk-taking may unlock opportunities.
Thank you for choosing to invest with Wells Fargo Funds. We appreciate your confidence in us and remain committed to helping you meet your financial needs.
Sincerely,

Andrew Owen
President
Wells Fargo Funds
Although diversification cannot guarantee an investment profit or prevent losses, we believe it can be an effective way to manage investment risk and potentially smooth out overall portfolio performance.
For further information about your Fund, contact your investment professional, visit our website at wellsfargofunds.com, or call us directly at 1-800-222-8222. We are available 24 hours a day, 7 days a week.
| | | | |
| 4 | | Wells Fargo Municipal Bond Fund | | Performance highlights (unaudited) |
Investment objective
The Fund seeks current income exempt from federal income tax.
Manager
Wells Fargo Funds Management, LLC
Subadviser
Wells Capital Management Incorporated
Portfolio managers
Lyle J. Fitterer, CFA®, CPA
Robert J. Miller
Average annual total returns (%) as of December 31, 20171
| | | | | | | | | | | | | | | | | | | | | | | | | | | | | | | | | | |
| | | | | Including sales charge | | | Excluding sales charge | | | Expense ratios2 (%) | |
| | | Inception date | | 1 year | | | 5 year | | | 10 year | | | 1 year | | | 5 year | | | 10 year | | | Gross | | | Net3 | |
| Class A (WMFAX) | | 4-8-2005 | | | 1.23 | | | | 2.65 | | | | 4.65 | | | | 5.95 | | | | 3.60 | | | | 5.14 | | | | 0.79 | | | | 0.75 | |
| Class C (WMFCX) | | 4-8-2005 | | | 4.16 | | | | 2.83 | | | | 4.36 | | | | 5.16 | | | | 2.83 | | | | 4.36 | | | | 1.54 | | | | 1.50 | |
| Administrator Class (WMFDX) | | 4-8-2005 | | | – | | | | – | | | | – | | | | 6.11 | | | | 3.78 | | | | 5.32 | | | | 0.73 | | | | 0.60 | |
| Institutional Class (WMBIX) | | 3-31-2008 | | | – | | | | – | | | | – | | | | 6.25 | | | | 3.90 | | | | 5.44 | | | | 0.46 | | | | 0.46 | |
| Bloomberg Barclays Municipal Bond Index4 | | – | | | – | | | | – | | | | – | | | | 5.45 | | | | 3.02 | | | | 4.46 | | | | – | | | | – | |
Figures quoted represent past performance, which is no guarantee of future results, and do not reflect taxes that a shareholder may pay on fund distributions or the redemption of fund shares. Investment return and principal value of an investment will fluctuate so that an investor’s shares, when redeemed, may be worth more or less than their original cost. Performance shown without sales charges would be lower if sales charges were reflected. Current performance may be lower or higher than the performance data quoted, which assumes the reinvestment of dividends and capital gains. Current month-end performance is available on the Fund’s website, wellsfargofunds.com.
Index returns do not include transaction costs associated with buying and selling securities, any mutual fund fees or expenses, or any taxes. It is not possible to invest directly in an index.
For Class A shares, the maximum front-end sales charge is 4.50%. For Class C shares, the maximum contingent deferred sales charge is 1.00%. Performance including a contingent deferred sales charge assumes the sales charge for the corresponding time period. Administrator Class and Institutional Class shares are sold without a front-end sales charge or contingent deferred sales charge.
Bond values fluctuate in response to the financial condition of individual issuers, general market and economic conditions, and changes in interest rates. Changes in market conditions and government policies may lead to periods of heightened volatility in the bond market and reduced liquidity for certain bonds held by the Fund. In general, when interest rates rise, bond values fall and investors may lose principal value. Interest-rate changes and their impact on the Fund and its share price can be sudden and unpredictable. The use of derivatives may reduce returns and/or increase volatility. Certain investment strategies tend to increase the total risk of an investment (relative to the broader market). The Fund is exposed to high-yield securities risk and municipal securities risk. Consult the Fund’s prospectus for additional information on these and other risks. A portion of the Fund’s income may be subject to federal, state, and/ or local income taxes or the Alternative Minimum Tax (AMT). Any capital gains distributions may be taxable.
Please see footnotes on page 5.
| | | | | | |
| Performance highlights (unaudited) | | Wells Fargo Municipal Bond Fund | | | 5 | |
|
| Effective maturity distribution as of December 31, 20175 |
|
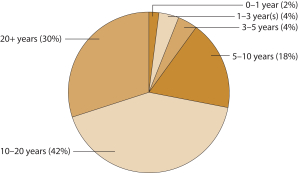
|
|
| Credit quality as of December 31, 20176 |
|
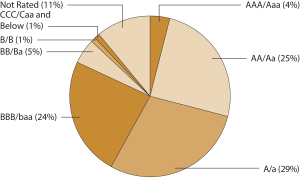 |
| 1 | Historical performance shown for Institutional Class shares prior to their inception reflects the performance of the former Investor Class shares, and includes the higher expenses applicable to the former Investor Class shares. If these expenses had not been included, returns for Institutional Class shares would be higher. |
| 2 | Reflects the expense ratios as stated in the most recent prospectuses. The expense ratios shown are subject to change and may differ from the annualized expense ratios shown in the financial highlights of this report. |
| 3 | The manager has contractually committed through October 31, 2018, to waive fees and/or reimburse expenses to the extent necessary to cap the Fund’s Total Annual Fund Operating Expenses After Fee Waivers at 0.75% for Class A, 1.50% for Class C, 0.60% for Administrator Class, and 0.48% for Institutional Class. After this time, the cap may be increased or the commitment to maintain the cap may be terminated only with the approval of the Board of Trustees. Brokerage commissions, stamp duty fees, interest, taxes, acquired fund fees and expenses, and extraordinary expenses are excluded from the expense cap. Without this cap, the Fund’s returns would have been lower. The expense ratio paid by an investor is the net expense ratio or the Fund’s Total Annual Fund Operating Expenses After Fee Waivers, as stated in the prospectuses. |
| 4 | The Bloomberg Barclays Municipal Bond Index is an unmanaged index composed of long-term tax-exempt bonds with a minimum credit rating of Baa. You cannot invest directly in an index. |
| 5 | Amounts are calculated based on the total investments of the Fund. These amounts are subject to change and may have changed since the date specified. |
| 6 | The credit quality distribution of portfolio holdings reflected in the chart is based on ratings from Standard & Poor’s, Moody’s Investors Service, and/or Fitch Ratings Ltd. Credit quality ratings apply to the underlying holdings of the Fund and not to the Fund itself. The percentages of the Fund’s portfolio with the ratings depicted in the chart are calculated based on the total market value of fixed income securities held by the Fund. If a security was rated by all three rating agencies, the middle rating was utilized. If rated by two of three rating agencies, the lower rating was utilized, and if rated by one of the rating agencies, that rating was utilized. Standard & Poor’s rates the creditworthiness of bonds, ranging from AAA (highest) to D (lowest). Ratings from A to CCC may be modified by the addition of a plus (+) or minus (-) sign to show relative standing within the rating categories. Standard & Poor’s rates the creditworthiness of short-term notes from SP-1 (highest) to SP-3 (lowest). Moody’s rates the creditworthiness of bonds, ranging from Aaa (highest) to C (lowest). Ratings Aa to B may be modified by the addition of a number 1 (highest) to 3 (lowest) to show relative standing within the ratings categories. Moody’s rates the creditworthiness of short-term U.S. tax-exempt municipal securities from MIG 1/VMIG 1 (highest) to SG (lowest). Fitch rates the creditworthiness of bonds, ranging from AAA (highest) to D (lowest). Credit quality distribution is subject to change and may have changed since the date specified. |
| | | | |
| 6 | | Wells Fargo Municipal Bond Fund | | Fund expenses (unaudited) |
As a shareholder of the Fund, you incur two types of costs: (1) transaction costs, including sales charges (loads) on purchase payments and contingent deferred sales charges (if any) on redemptions and (2) ongoing costs, including management fees, distribution (12b-1) and/or shareholder servicing fees, and other Fund expenses. This example is intended to help you understand your ongoing costs (in dollars) of investing in the Fund and to compare these costs with the ongoing costs of investing in other mutual funds.
The example is based on an investment of $1,000 invested at the beginning of the six-month period and held for the entire period from July 1, 2017 to December 31, 2017.
Actual expenses
The “Actual” line of the table below provides information about actual account values and actual expenses. You may use the information in this line, together with the amount you invested, to estimate the expenses that you paid over the period. Simply divide your account value by $1,000 (for example, an $8,600 account value divided by $1,000 = 8.6), then multiply the result by the number in the “Actual” line under the heading entitled “Expenses paid during period” for your applicable class of shares to estimate the expenses you paid on your account during this period.
Hypothetical example for comparison purposes
The “Hypothetical” line of the table below provides information about hypothetical account values and hypothetical expenses based on the Fund’s actual expense ratio and an assumed rate of return of 5% per year before expenses, which is not the Fund’s actual return. The hypothetical account values and expenses may not be used to estimate the actual ending account balance or expenses you paid for the period. You may use this information to compare the ongoing costs of investing in the Fund and other funds. To do so, compare this 5% hypothetical example with the 5% hypothetical examples that appear in the shareholder reports of the other funds.
Please note that the expenses shown in the table are meant to highlight your ongoing costs only and do not reflect any transactional costs, such as sales charges (loads) and contingent deferred sales charges. Therefore, the “Hypothetical” line of the table is useful in comparing ongoing costs only and will not help you determine the relative total costs of owning different funds. In addition, if these transactional costs were included, your costs would have been higher.
| | | | | | | | | | | | | | | | |
| | | Beginning account value 7-1-2017 | | | Ending account value 12-31-2017 | | | Expenses paid during the period¹ | | | Annualized net expense ratio | |
Class A | | | | | | | | | | | | | | | | |
Actual | | $ | 1,000.00 | | | $ | 1,024.48 | | | $ | 3.83 | | | | 0.75 | % |
Hypothetical (5% return before expenses) | | $ | 1,000.00 | | | $ | 1,021.42 | | | $ | 3.82 | | | | 0.75 | % |
Class C | | | | | | | | | | | | | | | | |
Actual | | $ | 1,000.00 | | | $ | 1,021.62 | | | $ | 7.64 | | | | 1.50 | % |
Hypothetical (5% return before expenses) | | $ | 1,000.00 | | | $ | 1,017.64 | | | $ | 7.63 | | | | 1.50 | % |
Administrator Class | | | | | | | | | | | | | | | | |
Actual | | $ | 1,000.00 | | | $ | 1,026.25 | | | $ | 3.06 | | | | 0.60 | % |
Hypothetical (5% return before expenses) | | $ | 1,000.00 | | | $ | 1,022.18 | | | $ | 3.06 | | | | 0.60 | % |
Institutional Class | | | | | | | | | | | | | | | | |
Actual | | $ | 1,000.00 | | | $ | 1,026.96 | | | $ | 2.35 | | | | 0.46 | % |
Hypothetical (5% return before expenses) | | $ | 1,000.00 | | | $ | 1,022.89 | | | $ | 2.35 | | | | 0.46 | % |
| 1 | Expenses paid is equal to the annualized net expense ratio of each class multiplied by the average account value over the period, multiplied by the number of days in the most recent fiscal half-year divided by the number of days in the fiscal year (to reflect the one-half-year period). |
| | | | | | |
| Portfolio of investments—December 31, 2017 (unaudited) | | Wells Fargo Municipal Bond Fund | | | 7 | |
| | | | | | | | | | | | | | | | |
| Security name | | Interest rate | | | Maturity date | | | Principal | | | Value | |
|
Municipal Obligations: 98.53% | |
|
| Alabama: 1.77% | |
Alabama Federal Aid Highway Finance Authority Series A (Tax Revenue) | | | 5.00 | % | | | 9-1-2035 | | | $ | 19,000,000 | | | $ | 22,743,380 | |
Alabama State University General Tuition and Fee (Education Revenue, Syncora Guarantee Incorporated Insured) | | | 5.25 | | | | 8-1-2032 | | | | 10,520,000 | | | | 10,268,467 | |
Birmingham AL CAB Series A1 (GO Revenue) ¤ | | | 0.00 | | | | 3-1-2045 | | | | 3,000,000 | | | | 3,275,400 | |
Jefferson County AL CAB Series B (Water & Sewer Revenue, AGM Insured) ¤ | | | 0.00 | | | | 10-1-2025 | | | | 710,000 | | | | 550,605 | |
Jefferson County AL CAB Series B (Water & Sewer Revenue, AGM Insured) ¤ | | | 0.00 | | | | 10-1-2026 | | | | 3,000,000 | | | | 2,186,460 | |
Jefferson County AL CAB Series B (Water & Sewer Revenue, AGM Insured) ¤ | | | 0.00 | | | | 10-1-2029 | | | | 4,115,000 | | | | 2,448,343 | |
Jefferson County AL Series A (GO Revenue) | | | 4.90 | | | | 4-1-2021 | | | | 4,490,000 | | | | 4,646,207 | |
Jefferson County AL Warrants Series C (GO Revenue) | | | 4.90 | | | | 4-1-2021 | | | | 2,590,000 | | | | 2,680,106 | |
| | | | |
| | | | | | | | | | | | | | | 48,798,968 | |
| | | | | | | | | | | | | | | | |
|
| Alaska: 0.42% | |
Alaska IDA Loan Anticipation Revenue YKHC Project (Health Revenue) | | | 3.50 | | | | 12-1-2020 | | | | 11,300,000 | | | | 11,486,111 | |
| | | | | | | | | | | | | | | | |
|
| Arizona: 1.36% | |
La Paz County AZ IDA Educational Facility Imagine Schools West Middle Project Series A (Education Revenue) 144A | | | 5.75 | | | | 6-15-2038 | | | | 1,085,000 | | | | 1,111,973 | |
La Paz County AZ IDA Educational Facility Imagine Schools West Middle Project Series A (Education Revenue) 144A | | | 5.88 | | | | 6-15-2048 | | | | 2,435,000 | | | | 2,495,193 | |
Maricopa County AZ IDA Senior Living Facility Series 2016 (Health Revenue) 144A | | | 6.00 | | | | 1-1-2048 | | | | 2,250,000 | | | | 2,311,313 | |
Maricopa County AZ PCR Public Service Company of New Mexico Palo Verde Project Series B (Utilities Revenue) | | | 5.20 | | | | 6-1-2043 | | | | 100,000 | | | | 107,887 | |
Navajo Nation AZ Refunding Bond Series A (Miscellaneous Revenue) 144A | | | 5.50 | | | | 12-1-2030 | | | | 7,275,000 | | | | 8,133,959 | |
Phoenix AZ IDA Legacy Traditional Schools Project Series A (Education Revenue) 144A | | | 6.50 | | | | 7-1-2034 | | | | 2,000,000 | | | | 2,277,360 | |
Pima County AZ IDA New Plan Learning Project Series A (Education Revenue) | | | 7.75 | | | | 7-1-2035 | | | | 7,480,000 | | | | 7,614,266 | |
Pima County AZ IDA New Plan Learning Project Series A (Education Revenue) | | | 8.13 | | | | 7-1-2041 | | | | 6,470,000 | | | | 6,584,325 | |
Pima County AZ IDA Noah Webster Schools-Pima Project (Education Revenue) | | | 7.00 | | | | 12-15-2043 | | | | 3,225,000 | | | | 3,576,041 | |
Tempe AZ IDA Friendship Village Project Series A (Health Revenue) | | | 5.25 | | | | 12-1-2020 | | | | 1,000,000 | | | | 1,073,520 | |
Tempe AZ IDA Friendship Village Project Series A (Health Revenue) | | | 5.38 | | | | 12-1-2021 | | | | 1,000,000 | | | | 1,095,520 | |
Tempe AZ IDA Friendship Village Project Series A (Health Revenue) | | | 5.50 | | | | 12-1-2022 | | | | 1,000,000 | | | | 1,096,230 | |
| | | | |
| | | | | | | | | | | | | | | 37,477,587 | |
| | | | | | | | | | | | | | | | |
|
| California: 6.02% | |
Alameda County CA Certificate of Participation (Miscellaneous Revenue, National Insured) ¤ | | | 0.00 | | | | 6-15-2019 | | | | 1,400,000 | | | | 1,354,332 | |
Alhambra CA Unified School District CAB Election of 2008 Series B (GO Revenue, AGM Insured) ¤ | | | 0.00 | | | | 8-1-2031 | | | | 2,175,000 | | | | 1,445,875 | |
Alhambra CA Unified School District CAB Election of 2008 Series B (GO Revenue, AGM Insured) ¤ | | | 0.00 | | | | 8-1-2032 | | | | 3,795,000 | | | | 2,437,529 | |
Alhambra CA Unified School District CAB Election of 2008 Series B (GO Revenue, AGM Insured) ¤ | | | 0.00 | | | | 8-1-2034 | | | | 5,000,000 | | | | 2,944,350 | |
Alhambra CA Unified School District CAB Election of 2008 Series B (GO Revenue, AGM Insured) ¤ | | | 0.00 | | | | 8-1-2035 | | | | 6,700,000 | | | | 3,795,014 | |
Alhambra CA Unified School District CAB Series B (GO Revenue, AGC Insured) ¤ | | | 0.00 | | | | 8-1-2031 | | | | 7,500,000 | | | | 4,932,675 | |
Anaheim CA PFA Convention Center Expansion Project Series A (Miscellaneous Revenue) | | | 5.00 | | | | 5-1-2046 | | | | 8,500,000 | | | | 9,768,455 | |
Bay Area CA Toll Authority Toll Bridge Series A (SIFMA Municipal Swap +1.25%) (Transportation Revenue) ± | | | 2.96 | | | | 4-1-2036 | | | | 18,000,000 | | | | 18,516,420 | |
The accompanying notes are an integral part of these financial statements.
| | | | |
| 8 | | Wells Fargo Municipal Bond Fund | | Portfolio of investments—December 31, 2017 (unaudited) |
| | | | | | | | | | | | | | | | |
| Security name | | Interest rate | | | Maturity date | | | Principal | | | Value | |
| | | | |
| California (continued) | | | | | | | | | | | | | | | | |
California Municipal Finance Authority Charter School Albert Einstein Academies Project Series A (Miscellaneous Revenue) | | | 7.13 | % | | | 8-1-2043 | | | $ | 2,230,000 | | | $ | 2,486,740 | |
California PCFA Solid Waste Disposal AMT Green Bond Calplant I Project (Industrial Development Revenue) 144A | | | 8.00 | | | | 7-1-2039 | | | | 3,270,000 | | | | 3,687,644 | |
California PFOTER Series DCL-011 (GO Revenue, Dexia Credit Local LOC, AGM Insured) 144Aø | | | 1.97 | | | | 8-1-2027 | | | | 15,000,000 | | | | 15,000,000 | |
California Public Works Board Department of General Services Buildings 8 & 9A (Miscellaneous Revenue) | | | 6.25 | | | | 4-1-2034 | | | | 4,000,000 | | | | 4,235,840 | |
California Public Works Board Judicial Council Project Series A (Miscellaneous Revenue) | | | 5.00 | | | | 3-1-2031 | | | | 3,260,000 | | | | 3,694,428 | |
California Statewide CDA School Facility Aspire Public Schools (Education Revenue) | | | 5.00 | | | | 7-1-2020 | | | | 405,000 | | | | 415,526 | |
California Statewide CDA Sutter Health Series A (Health Revenue) | | | 6.00 | | | | 8-15-2042 | | | | 4,900,000 | | | | 5,448,898 | |
Cerritos CA Community College District CAB Election of 2004 Series D (GO Revenue) ¤ | | | 0.00 | | | | 8-1-2027 | | | | 1,000,000 | | | | 781,550 | |
Cerritos CA Community College District CAB Election of 2004 Series D (GO Revenue) ¤ | | | 0.00 | | | | 8-1-2028 | | | | 1,040,000 | | | | 783,120 | |
Colton CA Unified School District CAB Series B (GO Revenue, AGM Insured) ¤ | | | 0.00 | | | | 8-1-2031 | | | | 1,000,000 | | | | 661,220 | |
Colton CA Unified School District CAB Series B (GO Revenue, AGM Insured) ¤ | | | 0.00 | | | | 8-1-2032 | | | | 1,000,000 | | | | 632,240 | |
Colton CA Unified School District CAB Series B (GO Revenue, AGM Insured) ¤ | | | 0.00 | | | | 8-1-2033 | | | | 1,000,000 | | | | 601,490 | |
Compton CA Community College District CAB Election of 2002 Series C (GO Revenue) ¤ | | | 0.00 | | | | 8-1-2032 | | | | 2,515,000 | | | | 1,488,603 | |
Compton CA Community College District CAB Election of 2002 Series C (GO Revenue) ¤ | | | 0.00 | | | | 8-1-2033 | | | | 2,000,000 | | | | 1,129,800 | |
Compton CA PFA Refunding Bond (Miscellaneous Revenue) 144A | | | 4.00 | | | | 9-1-2027 | | | | 3,820,000 | | | | 3,880,432 | |
El Monte CA Union High School District CAB Election of 2008 (GO Revenue, AGM Insured) ¤ | | | 0.00 | | | | 6-1-2028 | | | | 1,165,000 | | | | 873,063 | |
El Monte CA Union High School District CAB Election of 2008 (GO Revenue, AGM Insured) ¤ | | | 0.00 | | | | 6-1-2029 | | | | 1,500,000 | | | | 1,082,385 | |
El Monte CA Union High School District CAB Election of 2008 (GO Revenue, AGM Insured) ¤ | | | 0.00 | | | | 6-1-2030 | | | | 2,000,000 | | | | 1,385,440 | |
El Monte CA Union High School District CAB Election of 2008 (GO Revenue, AGM Insured) ¤ | | | 0.00 | | | | 6-1-2031 | | | | 2,000,000 | | | | 1,327,420 | |
El Monte CA Union High School District CAB Election of 2008 (GO Revenue, AGM Insured) ¤ | | | 0.00 | | | | 6-1-2032 | | | | 1,660,000 | | | | 1,056,524 | |
El Monte CA Union High School District CAB Election of 2008 (GO Revenue, AGM Insured) ¤ | | | 0.00 | | | | 6-1-2033 | | | | 1,230,000 | | | | 750,669 | |
Gilroy CA Unified School District Prerefunded CAB Election of 2008 Series A (GO Revenue, AGC Insured) ¤ | | | 0.00 | | | | 8-1-2032 | | | | 6,470,000 | | | | 4,433,373 | |
Gilroy CA Unified School District Unrefunded CAB Election of 2008 Series A (GO Revenue, AGC Insured) ¤ | | | 0.00 | | | | 8-1-2032 | | | | 3,330,000 | | | | 2,114,417 | |
Golden State Tobacco Securitization Corporation California Tobacco Settlement Revenue Series A (Miscellaneous Revenue) | | | 5.00 | | | | 6-1-2030 | | | | 970,000 | | | | 1,118,526 | |
M-S-R California Energy Authority Gas Series B (Utilities Revenue) | | | 6.13 | | | | 11-1-2029 | | | | 15,925,000 | | | | 20,444,674 | |
Morongo Band of Mission Indians California Enterprise Casino Series B (Miscellaneous Revenue) 144A | | | 6.50 | | | | 3-1-2028 | | | | 2,000,000 | | | | 2,014,420 | |
Ontario Montclair CA School District CAB (GO Revenue, AGC Insured) ¤ | | | 0.00 | | | | 8-1-2028 | | | | 1,500,000 | | | | 1,093,575 | |
Ontario Montclair CA School District CAB (GO Revenue, AGC Insured) ¤ | | | 0.00 | | | | 8-1-2030 | | | | 2,000,000 | | | | 1,348,240 | |
Pasadena CA PFA CAB Rose Bowl Series A (Miscellaneous Revenue) ¤ | | | 0.00 | | | | 3-1-2027 | | | | 2,095,000 | | | | 1,631,230 | |
Pasadena CA PFA CAB Rose Bowl Series A (Miscellaneous Revenue) ¤ | | | 0.00 | | | | 3-1-2028 | | | | 4,450,000 | | | | 3,334,608 | |
Pasadena CA PFA CAB Rose Bowl Series A (Miscellaneous Revenue) ¤ | | | 0.00 | | | | 3-1-2029 | | | | 4,520,000 | | | | 3,274,152 | |
Pasadena CA PFA CAB Rose Bowl Series A (Miscellaneous Revenue) ¤ | | | 0.00 | | | | 3-1-2031 | | | | 2,185,000 | | | | 1,467,009 | |
The accompanying notes are an integral part of these financial statements.
| | | | | | |
| Portfolio of investments—December 31, 2017 (unaudited) | | Wells Fargo Municipal Bond Fund | | | 9 | |
| | | | | | | | | | | | | | | | |
| Security name | | Interest rate | | | Maturity date | | | Principal | | | Value | |
| | | | |
| California (continued) | | | | | | | | | | | | | | | | |
Pasadena CA PFA CAB Rose Bowl Series A (Miscellaneous Revenue) ¤ | | | 0.00 | % | | | 3-1-2032 | | | $ | 2,000,000 | | | $ | 1,293,720 | |
Pasadena CA PFA CAB Rose Bowl Series A (Miscellaneous Revenue) ¤ | | | 0.00 | | | | 3-1-2033 | | | | 4,295,000 | | | | 2,678,061 | |
Richmond CA Joint Powers Financing Authority Civic Center Project Series A (Miscellaneous Revenue, AGC Insured) | | | 5.88 | | | | 8-1-2037 | | | | 25,000 | | | | 26,505 | |
Richmond CA Joint Powers Financing Authority Point Potrero Series A (Miscellaneous Revenue) | | | 6.25 | | | | 7-1-2024 | | | | 5,420,000 | | | | 5,777,395 | |
San Bernardino CA Unified School District Election of 2012 Series A (GO Revenue, AGM Insured) | | | 5.00 | | | | 8-1-2031 | | | | 1,100,000 | | | | 1,252,152 | |
San Bernardino CA Unified School District Series A (GO Revenue, AGM Insured) | | | 5.00 | | | | 8-1-2026 | | | | 1,100,000 | | | | 1,275,230 | |
San Bernardino CA Unified School District Series A (GO Revenue, AGM Insured) | | | 5.00 | | | | 8-1-2028 | | | | 1,250,000 | | | | 1,440,550 | |
San Buenaventura CA Community Mental Health System (Health Revenue) | | | 6.00 | | | | 12-1-2019 | | | | 1,040,000 | | | | 1,105,281 | |
San Buenaventura CA Community Mental Health System (Health Revenue) | | | 6.25 | | | | 12-1-2020 | | | | 2,000,000 | | | | 2,201,560 | |
San Diego CA Unified School District CAB Series C (GO Revenue) ¤ | | | 0.00 | | | | 7-1-2031 | | | | 2,000,000 | | | | 1,338,200 | |
San Diego CA Unified School District CAB Series C (GO Revenue) ¤ | | | 0.00 | | | | 7-1-2033 | | | | 1,000,000 | | | | 615,210 | |
San Diego CA Unified School District CAB Series C (GO Revenue) ¤ | | | 0.00 | | | | 7-1-2034 | | | | 2,000,000 | | | | 1,177,040 | |
Tender Option Bond Trust Receipts/Floater Certificates Santa Clara County CA San Jose Unified School District Series 2015 (GO Revenue, JPMorgan Chase & Company LIQ) 144Aø | | | 1.86 | | | | 8-1-2022 | | | | 2,050,000 | | | | 2,050,000 | |
West Contra Costa CA Unified School District CAB Series C (GO Revenue, AGM Insured) ¤ | | | 0.00 | | | | 8-1-2029 | | | | 3,000,000 | | | | 2,196,720 | |
West Contra Costa CA Unified School District Election of 2005 Series C-1 (GO Revenue, AGC Insured) ¤ | | | 0.00 | | | | 8-1-2029 | | | | 1,690,000 | | | | 1,237,486 | |
Wiseburn CA School District CAB Election of 2010 Series B (GO Revenue, AGM Insured) ¤ | | | 0.00 | | | | 8-1-2034 | | | | 2,530,000 | | | | 1,419,406 | |
| | | | |
| | | | | | | | | | | | | | | 165,956,422 | |
| | | | | | | | | | | | | | | | |
|
| Colorado: 2.27% | |
Colorado E-470 Public Highway Authority CAB Series B (Transportation Revenue, National Insured) ¤ | | | 0.00 | | | | 9-1-2022 | | | | 4,600,000 | | | | 4,121,600 | |
Colorado ECFA Charter School American Academy Project (Education Revenue) | | | 7.13 | | | | 12-1-2033 | | | | 2,200,000 | | | | 2,354,308 | |
Colorado ECFA Charter School Banning Lewis Ranch Academy Project Series A (Education Revenue) | | | 6.00 | | | | 12-15-2037 | | | | 2,900,000 | | | | 2,886,544 | |
Colorado ECFA Charter School Banning Lewis Ranch Academy Project Series B-2 (Education Revenue) | | | 7.00 | | | | 12-15-2046 | | | | 3,940,000 | | | | 4,042,361 | |
Colorado ECFA Charter School Community Leadership Academy (Education Revenue) | | | 5.75 | | | | 7-1-2019 | | | | 380,000 | | | | 383,314 | |
Colorado ECFA Charter School Community Leadership Academy Second Campus Project (Education Revenue) | | | 7.00 | | | | 8-1-2033 | | | | 1,285,000 | | | | 1,464,258 | |
Colorado ECFA Charter School Monument Academy Project Series A (Education Revenue) | | | 7.25 | | | | 10-1-2039 | | | | 500,000 | | | | 521,110 | |
Colorado ECFA Charter School Rocky Mountain Classical Academy Project Series A (Education Revenue) | | | 7.50 | | | | 9-1-2033 | | | | 5,015,000 | | | | 6,493,522 | |
Colorado ECFA Charter School Rocky Mountain Classical Academy Project Series A (Education Revenue) | | | 8.00 | | | | 9-1-2043 | | | | 5,930,000 | | | | 7,817,756 | |
Colorado ECFA Charter School Rocky Mountain Classical Academy Project Series A (Education Revenue) | | | 8.13 | | | | 9-1-2048 | | | | 3,795,000 | | | | 5,028,337 | |
Colorado ECFA Charter School Twin Peaks Charter Academy (Education Revenue) | | | 6.50 | | | | 3-15-2043 | | | | 1,290,000 | | | | 1,402,849 | |
Colorado Health Facilities Authority Catholic Health Initiative Series 2009-A (Health Revenue) | | | 5.00 | | | | 7-1-2039 | | | | 14,260,000 | | | | 14,688,513 | |
Colorado Health Facilities Authority Catholic Health Initiatives Series D-1 (Health Revenue) | | | 6.25 | | | | 10-1-2033 | | | | 4,000,000 | | | | 4,117,600 | |
The accompanying notes are an integral part of these financial statements.
| | | | |
| 10 | | Wells Fargo Municipal Bond Fund | | Portfolio of investments—December 31, 2017 (unaudited) |
| | | | | | | | | | | | | | | | |
| Security name | | Interest rate | | | Maturity date | | | Principal | | | Value | |
| | | | |
| Colorado (continued) | | | | | | | | | | | | | | | | |
Colorado High Performance Transportation Enterprise U.S. 36 & I-25 Managed Lanes (Transportation Revenue) | | | 5.75 | % | | | 1-1-2044 | | | $ | 2,160,000 | | | $ | 2,417,666 | |
Colorado PFA Charter School Highline Academy Project (Education Revenue) | | | 6.25 | | | | 12-15-2020 | | | | 215,000 | | | | 223,892 | |
Colorado PFA Charter School Highline Academy Project (Education Revenue) | | | 6.75 | | | | 12-15-2025 | | | | 455,000 | | | | 479,247 | |
Colorado PFA Charter School Highline Academy Project (Education Revenue) | | | 7.38 | | | | 12-15-2040 | | | | 4,010,000 | | | | 4,241,056 | |
| | | | |
| | | | | | | | | | | | | | | 62,683,933 | |
| | | | | | | | | | | | | | | | |
|
| Connecticut: 0.29% | |
Hamden CT BAN (GO Revenue) | | | 5.00 | | | | 8-15-2026 | | | | 1,235,000 | | | | 1,407,530 | |
Hartford CT Series A (GO Revenue) | | | 5.00 | | | | 4-1-2028 | | | | 3,165,000 | | | | 3,085,115 | |
Hartford CT Series B (GO Revenue) | | | 5.00 | | | | 4-1-2025 | | | | 1,220,000 | | | | 1,204,921 | |
Hartford CT Series B (GO Revenue) | | | 5.00 | | | | 4-1-2026 | | | | 1,470,000 | | | | 1,451,434 | |
Hartford CT Series B (GO Revenue) | | | 5.00 | | | | 4-1-2027 | | | | 1,000,000 | | | | 987,120 | |
| | | | |
| | | | | | | | | | | | | | | 8,136,120 | |
| | | | | | | | | | | | | | | | |
|
| Delaware: 0.36% | |
Delaware EDA Odyssey Charter School Incorporated Project Series A (Education Revenue) 144A | | | 7.00 | | | | 9-1-2045 | | | | 7,500,000 | | | | 7,599,900 | |
Kent County DE Charter School Incorporated Project (Education Revenue) | | | 7.38 | | | | 5-1-2037 | | | | 2,110,000 | | | | 2,314,501 | |
| | | | |
| | | | | | | | | | | | | | | 9,914,401 | |
| | | | | | | | | | | | | | | | |
|
| District of Columbia: 0.19% | |
District of Columbia Cesar Chavez Public Charter School (Education Revenue) | | | 6.50 | | | | 11-15-2021 | | | | 2,925,000 | | | | 3,161,282 | |
District of Columbia Water & Sewer Authority Public Utilities Series A (Water & Sewer Revenue) | | | 6.00 | | | | 10-1-2035 | | | | 2,000,000 | | | | 2,066,780 | |
| | | | |
| | | | | | | | | | | | | | | 5,228,062 | |
| | | | | | | | | | | | | | | | |
|
| Florida: 3.35% | |
ChampionsGate Florida Community Development District Capital Improvement Series A (Miscellaneous Revenue) | | | 6.25 | | | | 5-1-2020 | | | | 795,000 | | | | 796,709 | |
CityPlace Florida Community Development District (Miscellaneous Revenue) | | | 5.00 | | | | 5-1-2022 | | | | 1,000,000 | | | | 1,104,940 | |
Collier County FL School Board Refunding Certificate of Participation (Miscellaneous Revenue, AGM Insured) | | | 5.25 | | | | 2-15-2021 | | | | 1,000,000 | | | | 1,102,490 | |
Crossings at Fleming Island Florida Community Development District Refunding Bond Senior Lien Series A-1 (Miscellaneous Revenue) | | | 2.25 | | | | 5-1-2018 | | | | 1,260,000 | | | | 1,261,071 | |
Crossings at Fleming Island Florida Community Development District Refunding Bond Senior Lien Series A-1 (Miscellaneous Revenue) | | | 2.63 | | | | 5-1-2019 | | | | 1,295,000 | | | | 1,302,485 | |
Daytona Beach FL Refunding & Improvement Project (Water & Sewer Revenue, AGM Insured) | | | 5.00 | | | | 11-1-2031 | | | | 1,155,000 | | | | 1,298,382 | |
Daytona Beach FL Refunding & Improvement Project (Water & Sewer Revenue, AGM Insured) | | | 5.00 | | | | 11-1-2032 | | | | 1,465,000 | | | | 1,641,869 | |
Florida Development Finance Corporation Educational Facilities Renaissance Charter School Project Series A (Education Revenue) | | | 8.50 | | | | 6-15-2044 | | | | 13,290,000 | | | | 15,553,686 | |
Florida Development Finance Corporation Solid Waste AMT Pro USA Incorporated (Resource Recovery Revenue) 144A | | | 5.00 | | | | 8-1-2029 | | | | 4,000,000 | | | | 4,100,040 | |
Florida Development Finance Corporation Surface Brightline Passenger Rail Project (Transportation Revenue) 144A | | | 5.63 | | | | 1-1-2047 | | | | 2,500,000 | | | | 2,603,700 | |
Florida Housing Finance Corporation Journet Place Apartments Series 1 (Housing Revenue) | | | 7.60 | | | | 12-15-2047 | | | | 800,000 | | | | 987,240 | |
Florida Housing Finance Corporation Villa Capri Phase III (Housing Revenue) | | | 7.60 | | | | 12-15-2042 | | | | 2,675,000 | | | | 2,894,992 | |
The accompanying notes are an integral part of these financial statements.
| | | | | | |
| Portfolio of investments—December 31, 2017 (unaudited) | | Wells Fargo Municipal Bond Fund | | | 11 | |
| | | | | | | | | | | | | | | | |
| Security name | | Interest rate | | | Maturity date | | | Principal | | | Value | |
|
| Florida (continued) | |
Holmes County FL Hospital Corporation Doctors Memorial Hospital Project (Health Revenue) | | | 6.00 | % | | | 11-1-2038 | | | $ | 2,500,000 | | | $ | 2,499,825 | |
Indigo FL Community Development District Series C (Miscellaneous Revenue) †† | | | 1.40 | | | | 5-1-2030 | | | | 2,536,248 | | | | 1,141,312 | |
Lakeland FL Educational Facilities Authority Florida Southern College Project Series A (Education Revenue) | | | 5.00 | | | | 9-1-2025 | | | | 530,000 | | | | 592,641 | |
Lakeland FL Educational Facilities Authority Florida Southern College Project Series A (Education Revenue) | | | 5.00 | | | | 9-1-2028 | | | | 1,195,000 | | | | 1,312,923 | |
Lakeside Plantation FL Community Development District Series A (Miscellaneous Revenue) | | | 6.95 | | | | 5-1-2031 | | | | 1,141,000 | | | | 1,142,084 | |
Marshall Creek Florida Community Development District (Miscellaneous Revenue) †† | | | 5.00 | | | | 5-1-2032 | | | | 2,045,000 | | | | 2,018,108 | |
Marshall Creek Florida Community Development District (Miscellaneous Revenue) | | | 6.32 | | | | 5-1-2045 | | | | 130,000 | | | | 124,613 | |
Miami-Dade County FL School District (GO Revenue) | | | 5.00 | | | | 3-15-2046 | | | | 15,000,000 | | | | 17,331,000 | |
Miami-Dade County FL Seaport AMT Series B (Airport Revenue) | | | 6.00 | | | | 10-1-2033 | | | | 500,000 | | | | 593,965 | |
Orlando FL Capital Improvement Special Revenue Series B (Miscellaneous Revenue) | | | 5.00 | | | | 10-1-2033 | | | | 1,525,000 | | | | 1,777,708 | |
Orlando FL Capital Improvement Special Revenue Series B (Miscellaneous Revenue) | | | 5.00 | | | | 10-1-2035 | | | | 1,680,000 | | | | 1,967,549 | |
Orlando FL Capital Improvement Special Revenue Series B (Miscellaneous Revenue) | | | 5.00 | | | | 10-1-2036 | | | | 1,765,000 | | | | 2,063,479 | |
Palm Beach County FL Public Improvement Series 2 (Miscellaneous Revenue) | | | 5.38 | | | | 11-1-2028 | | | | 2,000,000 | | | | 2,063,820 | |
Pinellas County FL Educational Facilities Authority Barry University Project (Education Revenue) | | | 5.00 | | | | 10-1-2027 | | | | 1,600,000 | | | | 1,712,640 | |
Seminole County FL IDA Choices in Learning Series A (Education Revenue) | | | 6.20 | | | | 11-15-2026 | | | | 1,680,000 | | | | 1,813,090 | |
Seminole County FL IDA Choices in Learning Series A (Education Revenue) | | | 7.38 | | | | 11-15-2041 | | | | 3,525,000 | | | | 3,892,270 | |
St. Johns County FL IDA Refunding Glenmoor Project Series A (Health Revenue) †† | | | 1.34 | | | | 1-1-2049 | | | | 326,749 | | | | 184,384 | |
St. Johns County FL IDA Refunding Glenmoor Project Subordinate Series B (Health Revenue) † | | | 2.50 | | | | 1-1-2049 | | | | 277,527 | | | | 3 | |
St. Petersburg FL Health Facilities Authority All Children’s Project Series A (Health Revenue) | | | 6.50 | | | | 11-15-2039 | | | | 5,500,000 | | | | 5,980,755 | |
Trout Creek Florida Community Development District (Miscellaneous Revenue) | | | 4.88 | | | | 5-1-2025 | | | | 2,310,000 | | | | 2,329,058 | |
Viera East Florida Community Development District Water Management Project (Water & Sewer Revenue, National Insured) | | | 5.75 | | | | 5-1-2020 | | | | 2,020,000 | | | | 2,158,491 | |
Viera East Florida Community Development District Water Management Project (Water & Sewer Revenue, National Insured) | | | 5.75 | | | | 5-1-2021 | | | | 2,140,000 | | | | 2,342,744 | |
Viera East Florida Community Development District Water Management Project (Water & Sewer Revenue, National Insured) | | | 5.75 | | | | 5-1-2022 | | | | 2,265,000 | | | | 2,541,353 | |
| | | | |
| | | | | | | | | | | | | | | 92,231,419 | |
| | | | | | | | | | | | | | | | |
|
| Georgia: 0.73% | |
Atlanta GA Development Authority Senior Health Georgia Proton Treatment Center Series A-1 (Health Revenue) | | | 6.00 | | | | 1-1-2023 | | | | 1,500,000 | | | | 1,527,225 | |
Atlanta GA Development Authority Senior Health Georgia Proton Treatment Center Series A-1 (Health Revenue) | | | 6.75 | | | | 1-1-2035 | | | | 2,000,000 | | | | 2,072,000 | |
Atlanta GA Development Authority Senior Health Georgia Proton Treatment Center Series A-1 (Health Revenue) | | | 7.00 | | | | 1-1-2040 | | | | 3,500,000 | | | | 3,674,370 | |
Cobb County GA Development Authority Charter Learning Center Foundation Central Project Series A (Education Revenue) †† | | | 4.38 | | | | 7-1-2025 | | | | 1,920,000 | | | | 1,632,749 | |
Fulton County GA Development Authority Hospital Revenue Bond Series A (Health Revenue) | | | 5.00 | | | | 4-1-2047 | | | | 2,250,000 | | | | 2,581,875 | |
Georgia Municipal Electric Authority Power Series EE (Utilities Revenue, Ambac Insured) | | | 7.25 | | | | 1-1-2024 | | | | 400,000 | | | | 513,640 | |
The accompanying notes are an integral part of these financial statements.
| | | | |
| 12 | | Wells Fargo Municipal Bond Fund | | Portfolio of investments—December 31, 2017 (unaudited) |
| | | | | | | | | | | | | | | | |
| Security name | | Interest rate | | | Maturity date | | | Principal | | | Value | |
|
| Georgia (continued) | |
Georgia Private Colleges & Universities Authority Series A (Education Revenue) | | | 5.25 | % | | | 10-1-2027 | | | $ | 2,655,000 | | | $ | 2,938,315 | |
Georgia Road & Tollway Authority CAB I-75 South Expressway Lanes Project Series A (Transportation Revenue) 144A¤ | | | 0.00 | | | | 6-1-2034 | | | | 3,750,000 | | | | 1,317,038 | |
Georgia Road & Tollway Authority CCAB I-75 South Expressway Lanes Project Series B (Transportation Revenue) 144A¤ | | | 0.00 | | | | 6-1-2049 | | | | 5,600,000 | | | | 3,735,704 | |
| | | | |
| | | | | | | | | | | | | | | 19,992,916 | |
| | | | | | | | | | | | | | | | |
|
| Guam: 0.13% | |
Guam Government Limited Obligation Bonds Section 30 Series A (Miscellaneous Revenue) | | | 5.38 | | | | 12-1-2024 | | | | 3,195,000 | | | | 3,417,947 | |
Guam Housing Corporation Guaranteed Mortgage-Backed Securities Series A (Housing Revenue, FHLMC Insured) | | | 5.75 | | | | 9-1-2031 | | | | 60,000 | | | | 62,146 | |
| | | | |
| | | | | | | | | | | | | | | 3,480,093 | |
| | | | | | | | | | | | | | | | |
|
| Hawaii: 0.11% | |
Hawaii Prerefunded Bond Series DZ (GO Revenue) | | | 5.00 | | | | 12-1-2031 | | | | 1,670,000 | | | | 1,863,553 | |
Hawaii Unrefunded Bond Series DZ (GO Revenue) | | | 5.00 | | | | 12-1-2031 | | | | 1,030,000 | | | | 1,151,437 | |
| | | | |
| | | | | | | | | | | | | | | 3,014,990 | |
| | | | | | | | | | | | | | | | |
|
| Idaho: 0.63% | |
Boise-Kuna ID Irrigation District Arrowrock Hydroelectric Project (Utilities Revenue) | | | 7.38 | | | | 6-1-2040 | | | | 6,300,000 | | | | 6,451,515 | |
Idaho Health Facilities Authority Trinity Health Credit Group Series B (Health Revenue) | | | 6.25 | | | | 12-1-2033 | | | | 3,000,000 | | | | 3,128,970 | |
Idaho Housing & Finance Association Idaho Arts Charter School Incorporated Project Series A (Education Revenue) | | | 5.75 | | | | 12-1-2032 | | | | 500,000 | | | | 552,480 | |
Idaho Housing & Finance Association Idaho Arts Charter School Incorporated Project Series A (Education Revenue) | | | 6.50 | | | | 12-1-2038 | | | | 1,405,000 | | | | 1,468,956 | |
Idaho Housing & Finance Association Legacy Public Charter School Incorporated Project Series A (Education Revenue) | | | 5.85 | | | | 5-1-2033 | | | | 730,000 | | | | 746,323 | |
Idaho Housing & Finance Association Legacy Public Charter School Incorporated Project Series A (Education Revenue) | | | 6.25 | | | | 5-1-2043 | | | | 1,365,000 | | | | 1,406,523 | |
Idaho Housing & Finance Association Liberty Charter School Series A (Education Revenue) | | | 6.00 | | | | 6-1-2038 | | | | 500,000 | | | | 503,960 | |
Idaho Housing & Finance Association Nonprofit CAB North Star Charter School Series A (Education Revenue) | | | 6.75 | | | | 7-1-2048 | | | | 1,322,876 | | | | 1,368,740 | |
Idaho Housing & Finance Association Nonprofit CAB North Star Charter School Series B (Education Revenue) 144A¤ | | | 0.00 | | | | 7-1-2049 | | | | 1,276,564 | | | | 145,758 | |
Idaho Housing & Finance Association Nonprofit Facilities Victory Charter School Incorporated Series A (Education Revenue) | | | 6.13 | | | | 7-1-2038 | | | | 1,500,000 | | | | 1,534,695 | |
| | | | |
| | | | | | | | | | | | | | | 17,307,920 | |
| | | | | | | | | | | | | | | | |
|
| Illinois: 18.65% | |
Chicago IL Board of Education CAB City Colleges (GO Revenue, National Insured) ¤ | | | 0.00 | | | | 1-1-2025 | | | | 9,935,000 | | | | 7,672,006 | |
Chicago IL Board of Education CAB School Reform Series A (GO Revenue, National Insured) ¤ | | | 0.00 | | | | 12-1-2020 | | | | 1,000,000 | | | | 909,120 | |
Chicago IL Board of Education CAB School Reform Series B-1 (GO Revenue, National Insured) ¤ | | | 0.00 | | | | 12-1-2023 | | | | 1,430,000 | | | | 1,149,377 | |
Chicago IL Board of Education CAB School Reform Series B-1 (GO Revenue, National Insured) ¤ | | | 0.00 | | | | 12-1-2026 | | | | 4,245,000 | | | | 2,967,085 | |
Chicago IL Board of Education Series C (GO Revenue, AGM Insured) | | | 5.25 | | | | 12-1-2023 | | | | 1,500,000 | | | | 1,550,685 | |
The accompanying notes are an integral part of these financial statements.
| | | | | | |
| Portfolio of investments—December 31, 2017 (unaudited) | | Wells Fargo Municipal Bond Fund | | | 13 | |
| | | | | | | | | | | | | | | | |
| Security name | | Interest rate | | | Maturity date | | | Principal | | | Value | |
|
| Illinois (continued) | |
Chicago IL Board of Education Series D (GO Revenue, AGM Insured) | | | 5.00 | % | | | 12-1-2025 | | | $ | 1,430,000 | | | $ | 1,450,492 | |
Chicago IL CAB City Colleges (GO Revenue, National Insured) ¤ | | | 0.00 | | | | 1-1-2030 | | | | 5,745,000 | | | | 3,619,120 | |
Chicago IL CAB Project & Refunding Series C (GO Revenue, AGM Insured) ¤ | | | 0.00 | | | | 1-1-2026 | | | | 7,360,000 | | | | 5,603,462 | |
Chicago IL Motor Fuel Refunding (Tax Revenue) | | | 5.00 | | | | 1-1-2025 | | | | 2,595,000 | | | | 2,821,388 | |
Chicago IL Motor Fuel Refunding (Tax Revenue) | | | 5.00 | | | | 1-1-2026 | | | | 4,000,000 | | | | 4,326,400 | |
Chicago IL Motor Fuel Refunding (Tax Revenue) | | | 5.00 | | | | 1-1-2028 | | | | 1,000,000 | | | | 1,070,980 | |
Chicago IL Motor Fuel Tax Refunding Bonds Series 2013 (Tax Revenue) | | | 5.00 | | | | 1-1-2024 | | | | 680,000 | | | | 743,179 | |
Chicago IL Neighborhoods Alive 21 Program Series B (GO Revenue) | | | 5.50 | | | | 1-1-2034 | | | | 1,500,000 | | | | 1,631,325 | |
Chicago IL O’Hare International Airport AMT Passenger Facility Charge Series B (Airport Revenue) | | | 5.00 | | | | 1-1-2026 | | | | 5,000,000 | | | | 5,522,450 | |
Chicago IL O’Hare International Airport AMT Senior Lien Series C (Airport Revenue) | | | 5.50 | | | | 1-1-2044 | | | | 4,000,000 | | | | 4,514,040 | |
Chicago IL O’Hare International Airport Customer Facility Charge Senior Lien (Airport Revenue, AGM Insured) | | | 5.50 | | | | 1-1-2043 | | | | 4,530,000 | | | | 5,210,270 | |
Chicago IL O’Hare International Airport Customer Facility Charge Senior Lien Series D (Airport Revenue) | | | 5.75 | | | | 1-1-2043 | | | | 4,500,000 | | | | 5,240,115 | |
Chicago IL Public Building Commission Transit Authority (Transportation Revenue, Ambac Insured) | | | 5.25 | | | | 3-1-2025 | | | | 2,960,000 | | | | 3,347,227 | |
Chicago IL Public Building Commission Transit Authority (Transportation Revenue, Ambac Insured) | | | 5.25 | | | | 3-1-2027 | | | | 3,400,000 | | | | 3,879,706 | |
Chicago IL Refunding Bonds Series 2002 (Tax Revenue) | | | 5.00 | | | | 1-1-2028 | | | | 4,430,000 | | | | 5,299,831 | |
Chicago IL Refunding Bonds Series 2002 (Tax Revenue) | | | 5.00 | | | | 1-1-2029 | | | | 1,500,000 | | | | 1,794,525 | |
Chicago IL Second Lien (Water & Sewer Revenue) | | | 5.00 | | | | 11-1-2029 | | | | 4,600,000 | | | | 5,088,888 | |
Chicago IL Series A (GO Revenue, National Insured) | | | 5.00 | | | | 1-1-2029 | | | | 3,915,000 | | | | 3,920,520 | |
Chicago IL Series A (Tax Revenue) | | | 5.25 | | | | 1-1-2038 | | | | 6,000,000 | | | | 6,740,100 | |
Chicago IL Series A (GO Revenue) | | | 5.50 | | | | 1-1-2034 | | | | 7,175,000 | | | | 7,803,171 | |
Chicago IL Series A (GO Revenue) | | | 5.50 | | | | 1-1-2035 | | | | 1,715,000 | | | | 1,862,970 | |
Chicago IL Series A (GO Revenue, AGM Insured) | | | 5.00 | | | | 1-1-2028 | | | | 9,550,000 | | | | 10,061,307 | |
Chicago IL Series A (GO Revenue) | | | 5.50 | | | | 1-1-2033 | | | | 12,730,000 | | | | 13,884,993 | |
Chicago IL Series B (GO Revenue) | | | 5.50 | | | | 1-1-2032 | | | | 1,285,000 | | | | 1,406,510 | |
Chicago IL Transit Authority Sales Tax Receipts Bonds (Tax Revenue, AGM Insured) | | | 5.00 | | | | 12-1-2044 | | | | 4,000,000 | | | | 4,427,480 | |
Chicago IL Transit Authority Sales Tax Receipts Bonds (Tax Revenue) | | | 5.00 | | | | 12-1-2046 | | | | 18,250,000 | | | | 20,388,900 | |
Chicago IL Wastewater Transmission Second Lien (Water & Sewer Revenue) | | | 5.00 | | | | 1-1-2027 | | | | 4,000,000 | | | | 4,392,280 | |
Chicago IL Waterworks Second Lien (Water & Sewer Revenue) | | | 5.00 | | | | 11-1-2030 | | | | 5,000,000 | | | | 5,512,300 | |
Cook County IL Series A (GO Revenue) | | | 5.25 | | | | 11-15-2022 | | | | 3,000,000 | | | | 3,260,610 | |
Cook County IL Series C (GO Revenue, AGM Insured) | | | 5.00 | | | | 11-15-2024 | | | | 4,240,000 | | | | 4,764,191 | |
Cook County IL Series C (GO Revenue) | | | 5.00 | | | | 11-15-2025 | | | | 2,140,000 | | | | 2,375,357 | |
Cook County IL Series C (GO Revenue) | | | 5.00 | | | | 11-15-2027 | | | | 325,000 | | | | 357,464 | |
Cook County IL Series G (GO Revenue) | | | 5.00 | | | | 11-15-2028 | | | | 27,000,000 | | | | 28,971,540 | |
DeKalb, Kane & Lasalle Counties IL Kishwaukee Community College District #523 Series B (GO Revenue) ¤ | | | 0.00 | | | | 2-1-2019 | | | | 725,000 | | | | 709,159 | |
Illinois (Miscellaneous Revenue) | | | 5.00 | | | | 8-1-2024 | | | | 2,000,000 | | | | 2,119,740 | |
Illinois (Miscellaneous Revenue) | | | 5.00 | | | | 8-1-2025 | | | | 6,165,000 | | | | 6,515,419 | |
Illinois (GO Revenue, AGM Insured) | | | 5.00 | | | | 4-1-2026 | | | | 3,000,000 | | | | 3,382,920 | |
Illinois (Miscellaneous Revenue) | | | 5.25 | | | | 7-1-2030 | | | | 2,500,000 | | | | 2,685,925 | |
Illinois (Miscellaneous Revenue) | | | 5.50 | | | | 7-1-2025 | | | | 6,000,000 | | | | 6,620,340 | |
Illinois (Miscellaneous Revenue) | | | 5.50 | | | | 7-1-2026 | | | | 4,450,000 | | | | 4,903,055 | |
Illinois (GO Revenue) | | | 5.50 | | | | 1-1-2030 | | | | 2,900,000 | | | | 3,290,485 | |
Illinois (Miscellaneous Revenue) | | | 5.50 | | | | 7-1-2038 | | | | 4,000,000 | | | | 4,334,320 | |
Illinois Educational Facilities Authority Aurora University (Education Revenue, Harris NA LOC) ø | | | 1.70 | | | | 3-1-2032 | | | | 11,000,000 | | | | 11,000,000 | |
The accompanying notes are an integral part of these financial statements.
| | | | |
| 14 | | Wells Fargo Municipal Bond Fund | | Portfolio of investments—December 31, 2017 (unaudited) |
| | | | | | | | | | | | | | | | |
| Security name | | Interest rate | | | Maturity date | | | Principal | | | Value | |
|
| Illinois (continued) | |
Illinois Finance Authority Advocate Healthcare Network Series D (Health Revenue) | | | 6.50 | % | | | 11-1-2038 | | | $ | 5,415,000 | | | $ | 5,630,788 | |
Illinois Finance Authority Centegra Health System Project (Health Revenue) | | | 5.00 | | | | 9-1-2018 | | | | 1,425,000 | | | | 1,447,316 | |
Illinois Finance Authority Centegra Health System Project (Health Revenue) | | | 5.00 | | | | 9-1-2020 | | | | 1,465,000 | | | | 1,548,974 | |
Illinois Finance Authority Charter Schools Project Series A (Education Revenue) | | | 6.25 | | | | 9-1-2039 | | | | 7,955,000 | | | | 9,086,758 | |
Illinois Finance Authority Charter Schools Refunding & Improvement Bonds Series A (Education Revenue) | | | 6.88 | | | | 10-1-2031 | | | | 1,730,000 | | | | 1,867,743 | |
Illinois Finance Authority Charter Schools Refunding & Improvement Bonds Series A (Education Revenue) | | | 7.13 | | | | 10-1-2041 | | | | 3,800,000 | | | | 4,014,624 | |
Illinois Finance Authority Friendship Village of Schaumberg (Health Revenue) | | | 5.00 | | | | 2-15-2022 | | | | 1,680,000 | | | | 1,764,588 | |
Illinois Finance Authority Northwestern Memorial Hospital Project Series A (Health Revenue) | | | 6.00 | | | | 8-15-2039 | | | | 5,000,000 | | | | 5,350,450 | |
Illinois Finance Authority Student Housing Illinois State University (Education Revenue) | | | 6.75 | | | | 4-1-2031 | | | | 8,000,000 | | | | 9,250,480 | |
Illinois Finance Authority University of Chicago Series B (Education Revenue) | | | 6.25 | | | | 7-1-2038 | | | | 3,115,000 | | | | 3,189,324 | |
Illinois Housing Development Authority Multifamily Housing Revenue Bonds (Housing Revenue) | | | 1.80 | | | | 12-1-2020 | | | | 2,900,000 | | | | 2,896,752 | |
Illinois Metropolitan Pier & Exposition Authority CAB McCormick Place Expansion Project Series A (Tax Revenue, National Insured) ¤ | | | 0.00 | | | | 12-15-2026 | | | | 12,245,000 | | | | 8,804,277 | |
Illinois Metropolitan Pier & Exposition Authority CAB McCormick Place Expansion Project Series A (Tax Revenue, National Insured) ¤ | | | 0.00 | | | | 12-15-2030 | | | | 25,700,000 | | | | 15,117,254 | |
Illinois Metropolitan Pier & Exposition Authority CAB McCormick Place Expansion Project Series A (Tax Revenue, National Insured) ¤ | | | 0.00 | | | | 6-15-2031 | | | | 10,035,000 | | | | 5,729,985 | |
Illinois Metropolitan Pier & Exposition Authority CAB McCormick Place Expansion Project Series A (Tax Revenue, National Insured) ¤ | | | 0.00 | | | | 12-15-2031 | | | | 9,800,000 | | | | 5,480,454 | |
Illinois Metropolitan Pier & Exposition Authority CAB McCormick Place Expansion Project Series B (Tax Revenue, National Insured) ¤ | | | 0.00 | | | | 6-15-2029 | | | | 8,000,000 | | | | 5,071,920 | |
Illinois Municipal Electric Agency Power Supply System Series A (Utilities Revenue) | | | 5.00 | | | | 2-1-2030 | | | | 7,000,000 | | | | 8,243,410 | |
Illinois Municipal Electric Agency Power Supply System Series A (Utilities Revenue) | | | 5.00 | | | | 2-1-2031 | | | | 8,000,000 | | | | 9,378,720 | |
Illinois Regional Transportation Authority (Tax Revenue, AGM Insured) | | | 5.75 | | | | 6-1-2023 | | | | 400,000 | | | | 466,076 | |
Illinois Sales Tax Revenue Build Illinois Bonds (Tax Revenue) | | | 5.00 | | | | 6-15-2029 | | | | 3,000,000 | | | | 3,262,980 | |
Illinois Sales Tax Revenue Build Illinois Bonds Junior Obligation Series A (Tax Revenue) | | | 4.00 | | | | 6-15-2032 | | | | 5,000,000 | | | | 5,301,650 | |
Illinois Sales Tax Revenue Build Illinois Bonds Junior Obligation Series D (Tax Revenue) | | | 4.00 | | | | 6-15-2030 | | | | 10,625,000 | | | | 11,363,544 | |
Illinois Series 1 (GO Revenue, National Insured) | | | 6.00 | | | | 11-1-2026 | | | | 3,200,000 | | | | 3,695,648 | |
Illinois Series A (GO Revenue, AGM Insured) | | | 5.00 | | | | 4-1-2024 | | | | 3,000,000 | | | | 3,358,560 | |
Illinois Sports Facilities Authority State Tax Supported CAB (Tax Revenue, Ambac Insured) ¤ | | | 0.00 | | | | 6-15-2026 | | | | 2,020,000 | | | | 1,453,875 | |
Illinois Sports Facilities Authority State Tax Supported CAB (Tax Revenue, Ambac Insured) ¤ | | | 0.00 | | | | 6-15-2021 | | | | 7,705,000 | | | | 6,828,787 | |
Illinois Sports Facilities Authority State Tax Supported CAB (Tax Revenue, Ambac Insured) ¤ | | | 0.00 | | | | 6-15-2022 | | | | 2,295,000 | | | | 1,958,071 | |
Illinois Sports Facilities Authority State Tax Supported CAB (Tax Revenue, Ambac Insured) ¤ | | | 0.00 | | | | 6-15-2024 | | | | 17,570,000 | | | | 13,826,009 | |
Illinois Sports Facilities Authority State Tax Supported CAB (Tax Revenue, Ambac Insured) ¤ | | | 0.00 | | | | 6-15-2025 | | | | 2,515,000 | | | | 1,895,782 | |
Illinois Sports Facilities Authority State Tax Supported Refunding Bonds (Tax Revenue, AGM Insured) | | | 5.00 | | | | 6-15-2028 | | | | 4,030,000 | | | | 4,479,426 | |
Illinois Sports Facilities Authority State Tax Supported Refunding Bonds (Tax Revenue, AGM Insured) | | | 5.00 | | | | 6-15-2025 | | | | 3,745,000 | | | | 4,213,949 | |
Illinois Sports Facilities Authority State Tax Supported Refunding Bonds (Tax Revenue, AGM Insured) | | | 5.00 | | | | 6-15-2026 | | | | 4,775,000 | | | | 5,352,011 | |
The accompanying notes are an integral part of these financial statements.
| | | | | | |
| Portfolio of investments—December 31, 2017 (unaudited) | | Wells Fargo Municipal Bond Fund | | | 15 | |
| | | | | | | | | | | | | | | | |
| Security name | | Interest rate | | | Maturity date | | | Principal | | | Value | |
|
| Illinois (continued) | |
Illinois Sports Facilities Authority State Tax Supported Refunding Bonds (Tax Revenue, AGM Insured) | | | 5.00 | % | | | 6-15-2027 | | | $ | 8,380,000 | | | $ | 9,350,907 | |
Illinois Sports Facilities Authority State Tax Supported Refunding Bonds (Tax Revenue, AGM Insured) | | | 5.25 | | | | 6-15-2032 | | | | 3,500,000 | | | | 3,895,710 | |
Illinois Toll Highway Authority Toll Senior Series B (Transportation Revenue) | | | 5.00 | | | | 1-1-2039 | | | | 1,500,000 | | | | 1,716,540 | |
Kane, Cook & DuPage Counties IL School District #46 CAB Series B (GO Revenue, Ambac Insured) ¤ | | | 0.00 | | | | 1-1-2023 | | | | 8,225,000 | | | | 7,428,409 | |
Kane, Cook & DuPage Counties IL School District #46 CAB Series B (GO Revenue, Ambac Insured) ¤ | | | 0.00 | | | | 1-1-2023 | | | | 16,725,000 | | | | 14,527,670 | |
Kendall, Kane & Will Counties IL CAB School District #308 (GO Revenue, AGM Insured) ¤ | | | 0.00 | | | | 2-1-2025 | | | | 905,000 | | | | 741,249 | |
Kendall, Kane & Will Counties IL CAB School District #308 (GO Revenue, AGM Insured) ¤ | | | 0.00 | | | | 2-1-2026 | | | | 5,050,000 | | | | 3,998,893 | |
Kendall, Kane & Will Counties IL CAB School District #308 (GO Revenue, AGM Insured) ¤ | | | 0.00 | | | | 2-1-2027 | | | | 12,050,000 | | | | 9,212,346 | |
Lake County IL School District #24 Millburn CAB (GO Revenue, National Insured) ¤ | | | 0.00 | | | | 1-1-2024 | | | | 2,000,000 | | | | 1,645,640 | |
Lake County IL School District #38 Big Hollow CAB (GO Revenue, Ambac Insured) ¤ | | | 0.00 | | | | 2-1-2018 | | | | 3,800,000 | | | | 3,793,768 | |
Lake County IL School District #38 Big Hollow CAB (GO Revenue, Ambac Insured) ¤ | | | 0.00 | | | | 2-1-2019 | | | | 675,000 | | | | 655,979 | |
Lake County IL School District #38 Big Hollow CAB (GO Revenue, Ambac Insured) ¤ | | | 0.00 | | | | 2-1-2020 | | | | 1,250,000 | | | | 1,172,363 | |
Lake County IL School District #38 Big Hollow CAB (GO Revenue, Ambac Insured) ¤ | | | 0.00 | | | | 2-1-2021 | | | | 1,325,000 | | | | 1,200,569 | |
Lake County IL School District #38 Big Hollow CAB (GO Revenue, Ambac Insured) ¤ | | | 0.00 | | | | 2-1-2024 | | | | 5,385,000 | | | | 4,392,545 | |
Lake County IL Township High School District #126 Zion-Benton CAB (GO Revenue, National Insured) ¤ | | | 0.00 | | | | 2-1-2020 | | | | 910,000 | | | | 860,851 | |
McHenry & Kane Counties IL Community Consolidated School District #158 (GO Revenue) | | | 5.63 | | | | 1-15-2032 | | | | 2,500,000 | | | | 2,776,625 | |
McHenry & Kane Counties IL Community Consolidated School District #158 CAB (GO Revenue, National Insured) ¤ | | | 0.00 | | | | 1-1-2019 | | | | 765,000 | | | | 753,196 | |
McHenry & Kane Counties IL Community Consolidated School District #158 CAB (GO Revenue, AGM/FGIC Insured) ¤ | | | 0.00 | | | | 1-1-2023 | | | | 1,445,000 | | | | 1,255,156 | |
Railsplitter IL Tobacco Settlement Authority (Tobacco Revenue) | | | 5.00 | | | | 6-1-2024 | | | | 3,000,000 | | | | 3,411,210 | |
Southwestern Illinois Development Authority Local Government Program Collinsville Limited (Tax Revenue) | | | 5.00 | | | | 3-1-2025 | | | | 2,455,000 | | | | 1,702,493 | |
Tazewell County IL School District #51 (GO Revenue, National Insured) | | | 9.00 | | | | 12-1-2023 | | | | 350,000 | | | | 470,621 | |
University of Illinois Auxiliary Facilities Systems Series A (Education Revenue, National Insured) ¤ | | | 0.00 | | | | 4-1-2026 | | | | 2,355,000 | | | | 1,840,856 | |
University of Illinois Auxiliary Facilities Systems Series A (Education Revenue, National Insured) ¤ | | | 0.00 | | | | 4-1-2027 | | | | 2,435,000 | | | | 1,833,969 | |
University of Illinois Auxiliary Facilities Systems Series A (Education Revenue) | | | 5.75 | | | | 4-1-2038 | | | | 14,000,000 | | | | 14,734,020 | |
Will County IL Community High School District #210 Lincoln-Way Unrefunded CAB (GO Revenue, AGM Insured) ¤ | | | 0.00 | | | | 1-1-2026 | | | | 7,000,000 | | | | 5,217,590 | |
Will County IL Community Unit School District #201 Crete-Monee Prerefunded CAB (GO Revenue, National Insured) ¤ | | | 0.00 | | | | 11-1-2023 | | | | 430,000 | | | | 379,178 | |
Will County IL Community Unit School District #201 Crete-Monee Unrefunded CAB (GO Revenue, National Insured) ¤ | | | 0.00 | | | | 11-1-2023 | | | | 1,070,000 | | | | 902,117 | |
Will County IL Lincoln-Way Community High School District #210 CAB Series B (GO Revenue) ¤ | | | 0.00 | | | | 1-1-2033 | | | | 2,830,000 | | | | 1,281,933 | |
Will & Cook Counties IL Community High School District #210 Lincoln-Way CAB Series B (GO Revenue) ¤ | | | 0.00 | | | | 1-1-2032 | | | | 400,000 | | | | 191,716 | |
Will & Cook Counties IL Community High School District #210 Lincoln-Way Refunding Bond Series A (GO Revenue) | | | 5.00 | | | | 1-1-2028 | | | | 500,000 | | | | 499,220 | |
| | | | |
| | | | | | | | | | | | | | | 514,276,251 | |
| | | | | | | | | | | | | | | | |
The accompanying notes are an integral part of these financial statements.
| | | | |
| 16 | | Wells Fargo Municipal Bond Fund | | Portfolio of investments—December 31, 2017 (unaudited) |
| | | | | | | | | | | | | | | | |
| Security name | | Interest rate | | | Maturity date | | | Principal | | | Value | |
|
| Indiana: 1.68% | |
Brookhaven County IN EDA Line Senior Apartments Project Series A (Housing Revenue) | | | 6.25 | % | | | 7-1-2043 | | | $ | 1,970,000 | | | $ | 2,083,846 | |
Brookhaven County IN EDA Line Senior Apartments Project Series A (Housing Revenue) | | | 6.25 | | | | 7-1-2048 | | | | 2,680,000 | | | | 2,828,311 | |
Carmel IN Local Public Improvement Multipurpose Bonds (Miscellaneous Revenue) | | | 5.00 | | | | 7-15-2031 | | | | 6,000,000 | | | | 7,125,900 | |
Indiana Finance Authority Health System Revenue Bonds Franciscan Alliance Incorporated Obligated Group Series C (Health Revenue) | | | 4.00 | | | | 11-1-2033 | | | | 12,885,000 | | | | 13,736,699 | |
Indiana Finance Authority Ohio River Bridges East End Crossing Project Series A (Industrial Development Revenue) | | | 5.00 | | | | 7-1-2035 | | | | 9,970,000 | | | | 10,899,204 | |
Indiana Finance Authority Ohio River Bridges East End Crossing Project Series A (Industrial Development Revenue) | | | 5.00 | | | | 7-1-2040 | | | | 2,470,000 | | | | 2,679,431 | |
Valparaiso IN Pratt Paper LLC Project (Industrial Development Revenue) | | | 5.88 | | | | 1-1-2024 | | | | 1,055,000 | | | | 1,178,878 | |
Whiting IN BP Products North America Incorporated Project (Resource Recovery Revenue) | | | 2.46 | | | | 12-1-2044 | | | | 5,755,000 | | | | 5,768,064 | |
| | | | |
| | | | | | | | | | | | | | | 46,300,333 | |
| | | | | | | | | | | | | | | | |
|
| Iowa: 0.08% | |
Altoona IA Annual Appropriation Urban Renewal Series C (GO Revenue) | | | 5.00 | | | | 6-1-2031 | | | | 1,805,000 | | | | 2,094,847 | |
| | | | | | | | | | | | | | | | |
|
| Kansas: 0.53% | |
Sedgwick & Shawnee Counties KS Mortgage-Backed Securities Series A-2 (Housing Revenue, GNMA Insured) | | | 6.70 | | | | 6-1-2029 | | | | 30,000 | | | | 30,255 | |
Wyandotte County & Kansas City KS Special Obligation Vacation Village Project Area 4 Major Multi-Sport Athletic Complex Project CAB Series 2015 (Tax Revenue) 144A¤ | | | 0.00 | | | | 9-1-2034 | | | | 40,000,000 | | | | 14,533,200 | |
| | | | |
| | | | | | | | | | | | | | | 14,563,455 | |
| | | | | | | | | | | | | | | | |
|
| Kentucky: 1.46% | |
Kentucky EDFA Catholic Health Initiatives Series B (SIFMA Municipal Swap +1.40%) (Health Revenue) ± | | | 3.11 | | | | 2-1-2046 | | | | 22,715,000 | | | | 22,860,376 | |
Kentucky EDFA Norton Healthcare Incorporated Series B (Health Revenue, National Insured) ¤ | | | 0.00 | | | | 10-1-2024 | | | | 9,260,000 | | | | 7,644,500 | |
Kentucky EDFA Norton Healthcare Incorporated Series B (Health Revenue, National Insured) ¤ | | | 0.00 | | | | 10-1-2028 | | | | 4,845,000 | | | | 3,449,592 | |
Kentucky Public Transportation Infrastructure Authority Downtown Crossing Project CAB Series B (Transportation Revenue) ¤ | | | 0.00 | | | | 7-1-2030 | | | | 2,000,000 | | | | 1,170,940 | |
Kentucky Public Transportation Infrastructure Authority Downtown Crossing Project CAB Series B (Transportation Revenue) ¤ | | | 0.00 | | | | 7-1-2031 | | | | 2,780,000 | | | | 1,511,403 | |
Kentucky Public Transportation Infrastructure Authority Downtown Crossing Project CAB Series B (Transportation Revenue) ¤ | | | 0.00 | | | | 7-1-2032 | | | | 2,500,000 | | | | 1,263,450 | |
Kentucky Public Transportation Infrastructure Authority Downtown Crossing Project CAB Series C (Transportation Revenue) ¤ | | | 0.00 | | | | 7-1-2033 | | | | 1,000,000 | | | | 946,600 | |
Kentucky Public Transportation Infrastructure Authority Downtown Crossing Project CAB Series C (Transportation Revenue) ¤ | | | 0.00 | | | | 7-1-2034 | | | | 1,505,000 | | | | 1,420,389 | |
| | | | |
| | | | | | | | | | | | | | | 40,267,250 | |
| | | | | | | | | | | | | | | | |
|
| Louisiana: 1.23% | |
Louisiana Local Government Environmental Facilities & CDA (Miscellaneous Revenue, Ambac Insured) | | | 5.25 | | | | 12-1-2018 | | | | 2,085,000 | | | | 2,091,151 | |
Louisiana Public Facilities Authority Loyola University Project CCAB (Education Revenue) ¤ | | | 0.00 | | | | 10-1-2030 | | | | 4,185,000 | | | | 3,614,626 | |
Louisiana Public Facilities Authority Loyola University Project CCAB (Education Revenue) ¤ | | | 0.00 | | | | 10-1-2031 | | | | 3,675,000 | | | | 3,183,359 | |
The accompanying notes are an integral part of these financial statements.
| | | | | | |
| Portfolio of investments—December 31, 2017 (unaudited) | | Wells Fargo Municipal Bond Fund | | | 17 | |
| | | | | | | | | | | | | | | | |
| Security name | | Interest rate | | | Maturity date | | | Principal | | | Value | |
|
| Louisiana (continued) | |
Louisiana Series D (Miscellaneous Revenue) | | | 4.00 | % | | | 9-1-2032 | | | $ | 7,005,000 | | | $ | 7,552,231 | |
New Orleans LA (GO Revenue, FGIC Insured) | | | 5.50 | | | | 12-1-2021 | | | | 2,050,000 | | | | 2,230,523 | |
New Orleans LA Aviation Board AMT Series B (Airport Revenue, AGM Insured) | | | 5.00 | | | | 1-1-2033 | | | | 3,000,000 | | | | 3,430,950 | |
New Orleans LA Aviation Board AMT Series B (Airport Revenue) | | | 5.00 | | | | 1-1-2034 | | | | 4,500,000 | | | | 5,118,795 | |
New Orleans LA Aviation Board Gulf Opportunity Zone Consolidated Rental Car Series A (Airport Revenue) | | | 6.50 | | | | 1-1-2040 | | | | 6,500,000 | | | | 6,776,055 | |
| | | | |
| | | | | | | | | | | | | | | 33,997,690 | |
| | | | | | | | | | | | | | | | |
|
| Maine: 0.15% | |
Maine Educational Loan Authority Student Loan Series A-3 Class A (Education Revenue, AGC Insured) | | | 5.88 | | | | 12-1-2039 | | | | 1,585,000 | | | | 1,665,692 | |
Maine Finance Authority Solid Waste Disposal AMT Green Bond Coastal Resources of Maine LLC Project (Resource Recovery Revenue) 144A | | | 5.38 | | | | 12-15-2033 | | | | 2,500,000 | | | | 2,552,450 | |
| | | | |
| | | | | | | | | | | | | | | 4,218,142 | |
| | | | | | | | | | | | | | | | |
|
| Maryland: 0.86% | |
Howard County MD Certificate of Participation Agricultural Land Preservation #90-23 Series A (Miscellaneous Revenue) | | | 8.00 | | | | 8-15-2020 | | | | 293,000 | | | | 333,586 | |
Maryland CDA Belnor Senior Residences Series D (Housing Revenue) | | | 1.83 | | | | 6-1-2019 | | | | 6,200,000 | | | | 6,149,718 | |
Prince George’s County MD Chesapeake Lighthouse Charter School Project Series 2016-A (Education Revenue) | | | 5.75 | | | | 8-1-2033 | | | | 1,585,000 | | | | 1,677,738 | |
Prince George’s County MD Chesapeake Lighthouse Charter School Project Series 2016-A (Education Revenue) 144A | | | 6.90 | | | | 8-1-2041 | | | | 8,480,000 | | | | 9,081,062 | |
Prince George’s County MD Chesapeake Lighthouse Charter School Project Series 2016-A (Education Revenue) | | | 7.00 | | | | 8-1-2046 | | | | 6,085,000 | | | | 6,520,443 | |
| | | | |
| | | | | | | | | | | | | | | 23,762,547 | |
| | | | | | | | | | | | | | | | |
|
| Massachusetts: 1.58% | |
Massachusetts Development Finance Agency Partners Healthcare Series S-4 (Health Revenue) | | | 5.00 | | | | 7-1-2038 | | | | 10,000,000 | | | | 11,592,900 | |
Massachusetts Development Finance Agency Sabis International Charter Series A (Education Revenue) | | | 8.00 | | | | 4-15-2031 | | | | 2,150,000 | | | | 2,386,436 | |
Massachusetts Development Finance Agency Sabis International Charter Series A (Education Revenue) | | | 8.00 | | | | 4-15-2039 | | | | 3,900,000 | | | | 4,328,883 | |
Massachusetts Educational Financing Authority AMT Series B (Education Revenue) | | | 5.38 | | | | 1-1-2020 | | | | 140,000 | | | | 147,755 | |
Massachusetts Educational Financing Authority AMT Series J (Education Revenue) | | | 5.00 | | | | 7-1-2020 | | | | 6,000,000 | | | | 6,419,220 | |
Massachusetts Educational Financing Authority AMT Series J (Education Revenue) | | | 5.00 | | | | 7-1-2021 | | | | 3,000,000 | | | | 3,262,050 | |
Massachusetts Educational Financing Authority Series I (Education Revenue) | | | 6.00 | | | | 1-1-2028 | | | | 1,540,000 | | | | 1,629,305 | |
Massachusetts Water Resources Authority Series E (Water & Sewer Revenue, JPMorgan Chase & Company SPA) ø | | | 1.71 | | | | 8-1-2037 | | | | 13,935,000 | | | | 13,935,000 | |
| | | | |
| | | | | | | | | | | | | | | 43,701,549 | |
| | | | | | | | | | | | | | | | |
|
| Michigan: 8.26% | |
Detroit MI Downtown Development Authority CAB (Tax Revenue) ¤ | | | 0.00 | | | | 7-1-2018 | | | | 3,050,000 | | | | 2,988,543 | |
Detroit MI Downtown Development Authority CAB (Tax Revenue) ¤ | | | 0.00 | | | | 7-1-2019 | | | | 3,050,000 | | | | 2,863,371 | |
Detroit MI Downtown Development Authority CAB (Tax Revenue) ¤ | | | 0.00 | | | | 7-1-2020 | | | | 2,070,000 | | | | 1,858,860 | |
Detroit MI Water Supply System Second Lien Series B (Water & Sewer Revenue, AGM Insured) | | | 7.00 | | | | 7-1-2036 | | | | 9,675,000 | | | | 10,438,938 | |
Great Lakes Michigan Water Authority Sewage Disposal System Series 2016-C (Water & Sewer Revenue) | | | 5.00 | | | | 7-1-2036 | | | | 8,500,000 | | | | 9,630,160 | |
The accompanying notes are an integral part of these financial statements.
| | | | |
| 18 | | Wells Fargo Municipal Bond Fund | | Portfolio of investments—December 31, 2017 (unaudited) |
| | | | | | | | | | | | | | | | |
| Security name | | Interest rate | | | Maturity date | | | Principal | | | Value | |
|
| Michigan (continued) | |
Great Lakes Michigan Water Authority Water Supply System Series 2016-D (Water & Sewer Revenue) | | | 4.00 | % | | | 7-1-2032 | | | $ | 11,000,000 | | | $ | 11,624,800 | |
Great Lakes Michigan Water Authority Water Supply System Series 2016-D (Water & Sewer Revenue, AGM Insured) | | | 4.00 | | | | 7-1-2033 | | | | 11,000,000 | | | | 11,708,950 | |
Livonia MI Public Schools School District Building & Site Series I (GO Revenue) | | | 5.00 | | | | 5-1-2026 | | | | 1,075,000 | | | | 1,208,246 | |
Livonia MI Public Schools School District Building & Site Series I (GO Revenue) | | | 5.00 | | | | 5-1-2028 | | | | 1,450,000 | | | | 1,618,215 | |
Livonia MI Public Schools School District Building & Site Series I (GO Revenue) | | | 5.00 | | | | 5-1-2029 | | | | 1,350,000 | | | | 1,504,494 | |
Livonia MI Public Schools School District Building & Site Series I (GO Revenue) | | | 5.00 | | | | 5-1-2030 | | | | 1,775,000 | | | | 1,966,043 | |
Livonia MI Public Schools School District Building & Site Series I (GO Revenue) | | | 5.00 | | | | 5-1-2031 | | | | 1,425,000 | | | | 1,574,654 | |
Michigan Finance Authority Limited Obligation Public School Holly Academy (Education Revenue) | | | 6.50 | | | | 10-1-2020 | | | | 100,000 | | | | 105,526 | |
Michigan Finance Authority Limited Obligation Public School Holly Academy (Education Revenue) | | | 8.00 | | | | 10-1-2040 | | | | 1,350,000 | | | | 1,494,882 | |
Michigan Finance Authority Limited Obligation Public School Madison Academy Project Series A (Miscellaneous Revenue) | | | 7.50 | | | | 12-1-2020 | | | | 200,000 | | | | 206,716 | |
Michigan Finance Authority Limited Obligation Public School Madison Academy Project Series A (Miscellaneous Revenue) | | | 8.00 | | | | 12-1-2030 | | | | 1,135,000 | | | | 1,201,534 | |
Michigan Finance Authority Limited Obligation Public School Madison Academy Project Series A (Miscellaneous Revenue) | | | 8.25 | | | | 12-1-2039 | | | | 2,220,000 | | | | 2,347,184 | |
Michigan Finance Authority Local Government Loan Program Series C (Water & Sewer Revenue, National Insured) | | | 5.00 | | | | 7-1-2025 | | | | 2,000,000 | | | | 2,321,400 | |
Michigan Finance Authority Local Government Loan Program Series C (Water & Sewer Revenue, National Insured) | | | 5.00 | | | | 7-1-2026 | | | | 1,945,000 | | | | 2,237,898 | |
Michigan Finance Authority Local Government Loan Program Series C (Water & Sewer Revenue, National Insured) | | | 5.00 | | | | 7-1-2027 | | | | 2,260,000 | | | | 2,584,287 | |
Michigan Finance Authority Local Government Loan Program Series C (Water & Sewer Revenue, National Insured) | | | 5.00 | | | | 7-1-2028 | | | | 3,480,000 | | | | 3,964,764 | |
Michigan Finance Authority Local Government Loan Program Series C (Water & Sewer Revenue, National Insured) | | | 5.00 | | | | 7-1-2032 | | | | 5,750,000 | | | | 6,454,088 | |
Michigan Finance Authority Local Government Loan Program Series C (Water & Sewer Revenue) | | | 5.00 | | | | 7-1-2035 | | | | 2,000,000 | | | | 2,252,380 | |
Michigan Finance Authority Local Government Loan Program Series D (Water & Sewer Revenue, National Insured) | | | 5.00 | | | | 7-1-2027 | | | | 1,000,000 | | | | 1,143,490 | |
Michigan Finance Authority Local Government Loan Program Series H-1 (Tax Revenue) | | | 5.00 | | | | 10-1-2031 | | | | 1,340,000 | | | | 1,505,959 | |
Michigan Finance Authority Local Government Loan Program Series H-1 (Tax Revenue) | | | 5.00 | | | | 10-1-2032 | | | | 2,000,000 | | | | 2,239,920 | |
Michigan Finance Authority Local Government Loan Program Series H-1 (Tax Revenue) | | | 5.00 | | | | 10-1-2033 | | | | 2,975,000 | | | | 3,318,404 | |
Michigan Finance Authority Local Government Loan Program Series H-1 (Tax Revenue) | | | 5.00 | | | | 10-1-2034 | | | | 3,670,000 | | | | 4,081,847 | |
Michigan Finance Authority Local Government Loan Program Series H-1 (Tax Revenue) | | | 5.00 | | | | 10-1-2039 | | | | 7,955,000 | | | | 8,776,433 | |
Michigan Finance Authority Public School Academy University Learning (Education Revenue) | | | 6.25 | | | | 11-1-2020 | | | | 280,000 | | | | 290,881 | |
Michigan Finance Authority Refunding Bond Local Government Loan Program City of Detroit Financial Recovery Series F (Tax Revenue) | | | 4.50 | | | | 10-1-2029 | | | | 7,000,000 | | | | 7,309,960 | |
Michigan Finance Authority Refunding Bond Local Government Loan Program Detroit Series D-4 (Water & Sewer Revenue) | | | 5.00 | | | | 7-1-2031 | | | | 6,500,000 | | | | 7,327,320 | |
Michigan Finance Authority Refunding Bond Local Government Loan Program Detroit Series D-6 (Water & Sewer Revenue, National Insured) | | | 5.00 | | | | 7-1-2036 | | | | 3,250,000 | | | | 3,601,260 | |
Michigan Finance Authority Refunding Bond Local Government Loan Program Public Lighting Authority Series B (Tax Revenue) | | | 5.00 | | | | 7-1-2044 | | | | 12,625,000 | | | | 13,823,996 | |
The accompanying notes are an integral part of these financial statements.
| | | | | | |
| Portfolio of investments—December 31, 2017 (unaudited) | | Wells Fargo Municipal Bond Fund | | | 19 | |
| | | | | | | | | | | | | | | | |
| Security name | | Interest rate | | | Maturity date | | | Principal | | | Value | |
|
| Michigan (continued) | |
Michigan Finance Authority Trinity Health Credit Group Series A (Health Revenue) | | | 5.00 | % | | | 12-1-2047 | | | $ | 24,620,000 | | | $ | 27,136,164 | |
Michigan Housing Development Authority Multifamily Housing Revenue Bonds Renaissance Estates of Ecorse Phase II Project (Housing Revenue) | | | 1.78 | | | | 11-1-2020 | | | | 9,800,000 | | | | 9,802,842 | |
Michigan Housing Development Authority Series D (Housing Revenue, Industrial and Commercial Bank of China Limited SPA) ø | | | 1.75 | | | | 6-1-2030 | | | | 1,915,000 | | | | 1,915,000 | |
Michigan Municipal Bond Authority Local Government Loan Program Series A (Miscellaneous Revenue, Ambac Insured) | | | 4.00 | | | | 11-1-2021 | | | | 150,000 | | | | 150,110 | |
Michigan Municipal Bond Authority Local Government Loan Program Series B Group A (Miscellaneous Revenue, Ambac Insured) | | | 5.25 | | | | 12-1-2023 | | | | 1,185,000 | | | | 1,187,323 | |
Michigan Municipal Bond Authority Local Government Loan Program Series C (Miscellaneous Revenue, Ambac Insured) | | | 4.00 | | | | 5-1-2019 | | | | 100,000 | | | | 100,059 | |
Michigan Municipal Bond Authority Local Government Loan Program Series C (Miscellaneous Revenue, Ambac Insured) | | | 4.75 | | | | 5-1-2027 | | | | 4,610,000 | | | | 4,611,429 | |
Michigan Municipal Bond Authority Local Government Loan Program Series G (Miscellaneous Revenue, Ambac Insured) ¤ | | | 0.00 | | | | 5-1-2019 | | | | 75,000 | | | | 72,272 | |
Michigan Municipal Bond Authority Local Government Loan Program Series G (Miscellaneous Revenue, Ambac Insured) ¤ | | | 0.00 | | | | 5-1-2020 | | | | 205,000 | | | | 191,271 | |
Michigan Public Educational Facilities Authority Limited Obligation Bradford Academy Project (Education Revenue) 144A | | | 6.50 | | | | 9-1-2037 | | | | 3,660,000 | | | | 2,851,872 | |
Michigan Public Educational Facilities Authority Limited Obligation Bradford Academy Project (Education Revenue) | | | 8.50 | | | | 9-1-2029 | | | | 1,500,000 | | | | 1,292,715 | |
Michigan Public Educational Facilities Authority Limited Obligation Bradford Academy Project (Education Revenue) | | | 8.75 | | | | 9-1-2039 | | | | 3,500,000 | | | | 2,829,540 | |
Michigan Public Educational Facilities Authority Limited Obligation Crescent Academy Project (Education Revenue) | | | 7.00 | | | | 10-1-2036 | | | | 1,122,500 | | | | 1,131,716 | |
Michigan Public Educational Facilities Authority Limited Obligation Madison Academy Project (Education Revenue) | | | 8.38 | | | | 12-1-2030 | | | | 2,085,000 | | | | 2,227,906 | |
Michigan Public Educational Facilities Authority Limited Obligation Madison Academy Project (Education Revenue) | | | 8.63 | | | | 12-1-2039 | | | | 4,170,000 | | | | 4,450,057 | |
Michigan Strategic Fund Limited Obligation Detroit Edison Company Exempt Facilities Project Series KT (Utilities Revenue) | | | 5.63 | | | | 7-1-2020 | | | | 1,200,000 | | | | 1,303,500 | |
Michigan Strategic Fund Limited Obligation Events Center Project Series A (Tax Revenue) | | | 4.13 | | | | 7-1-2045 | | | | 15,500,000 | | | | 15,665,075 | |
Oakland County MI Economic Development Corporation The Academy of The Sacred Heart Project Series A (Education Revenue) | | | 6.50 | | | | 12-15-2036 | | | | 4,410,000 | | | | 4,518,177 | |
Wayne County MI Building Improvement Series A (GO Revenue) | | | 6.75 | | | | 11-1-2039 | | | | 8,545,000 | | | | 8,749,738 | |
| | | | |
| | | | | | | | | | | | | | | 227,762,169 | |
| | | | | | | | | | | | | | | | |
|
| Mississippi: 0.62% | |
Mississippi Business Finance Corporation Power Company Project 1st Series (Utilities Revenue) | | | 1.63 | | | | 12-1-2040 | | | | 8,000,000 | | | | 7,999,200 | |
Mississippi Development Bank Special Obligation Jackson Water & Sewer System Project Series A (Water & Sewer Revenue, AGM Insured) | | | 5.00 | | | | 9-1-2030 | | | | 8,155,000 | | | | 9,012,417 | |
| | | | |
| | | | | | | | | | | | | | | 17,011,617 | |
| | | | | | | | | | | | | | | | |
|
| Missouri: 0.71% | |
Blue Springs MO Special Obligation Tax Refunding & Improvement Bonds Adams Farm Project Series A (Tax Revenue) | | | 4.00 | | | | 6-1-2026 | | | | 8,700,000 | | | | 8,797,962 | |
Manchester MO Highway 141 Manchester Road Project (Tax Revenue) | | | 6.00 | | | | 11-1-2025 | | | | 855,000 | | | | 854,786 | |
St. Louis MO IDA Convention Center Hotel (Miscellaneous Revenue, Ambac Insured) ¤ | | | 0.00 | | | | 7-15-2019 | | | | 2,475,000 | | | | 2,372,783 | |
The accompanying notes are an integral part of these financial statements.
| | | | |
| 20 | | Wells Fargo Municipal Bond Fund | | Portfolio of investments—December 31, 2017 (unaudited) |
| | | | | | | | | | | | | | | | |
| Security name | | Interest rate | | | Maturity date | | | Principal | | | Value | |
|
| Missouri (continued) | |
St. Louis MO Lambert St. Louis International Airport Series A-1 (Airport Revenue) | | | 6.25 | % | | | 7-1-2029 | | | $ | 2,000,000 | | | $ | 2,129,740 | |
St. Louis MO Special Administrative Board of The St. Louis School District (GO Revenue) | | | 4.00 | | | | 4-1-2030 | | | | 4,840,000 | | | | 5,324,678 | |
| | | | |
| | | | | | | | | | | | | | | 19,479,949 | |
| | | | | | | | | | | | | | | | |
|
| Nebraska: 1.05% | |
Nebraska Central Plains Energy Gas Project #3 (Utilities Revenue) | | | 5.00 | | | | 9-1-2027 | | | | 1,020,000 | | | | 1,147,765 | |
Nebraska Central Plains Energy Gas Project #3 Series A (Utilities Revenue) | | | 5.00 | | | | 9-1-2032 | | | | 6,200,000 | | | | 7,579,190 | |
Nebraska Central Plains Energy Gas Project #3 Series A (Utilities Revenue) | | | 5.00 | | | | 9-1-2036 | | | | 2,000,000 | | | | 2,506,040 | |
Nebraska Central Plains Energy Gas Project #3 Series A (Utilities Revenue) | | | 5.00 | | | | 9-1-2042 | | | | 13,700,000 | | | | 17,608,473 | |
| | | | |
| | | | | | | | | | | | | | | 28,841,468 | |
| | | | | | | | | | | | | | | | |
|
| Nevada: 0.04% | |
Las Vegas NV Special Improvement District #60 Local Improvement (Miscellaneous Revenue) | | | 5.00 | | | | 6-1-2022 | | | | 455,000 | | | | 490,763 | |
Las Vegas NV Special Improvement District #60 Local Improvement (Miscellaneous Revenue) | | | 5.00 | | | | 6-1-2023 | | | | 360,000 | | | | 390,463 | |
Las Vegas NV Special Improvement District #60 Local Improvement (Miscellaneous Revenue) | | | 5.00 | | | | 6-1-2024 | | | | 235,000 | | | | 254,098 | |
| | | | |
| | | | | | | | | | | | | | | 1,135,324 | |
| | | | | | | | | | | | | | | | |
|
| New Jersey: 5.25% | |
Bayonne NJ School Refunding Bonds (GO Revenue, AGM Insured) | | | 5.00 | | | | 7-15-2023 | | | | 2,505,000 | | | | 2,855,900 | |
New Jersey EDA School Facilities Construction Refunding Bond Project Series I (SIFMA Municipal Swap +1.55%) (Miscellaneous Revenue) ± | | | 3.26 | | | | 9-1-2027 | | | | 14,745,000 | | | | 14,545,943 | |
New Jersey EDA School Facilities Construction Refunding Bond Project Series I (SIFMA Municipal Swap +1.60%) (Miscellaneous Revenue) ± | | | 3.31 | | | | 3-1-2028 | | | | 1,200,000 | | | | 1,180,932 | |
New Jersey EDA School Facilities Construction Refunding Bond Project Series II (Miscellaneous Revenue) | | | 5.00 | | | | 3-1-2026 | | | | 4,000,000 | | | | 4,315,480 | |
New Jersey EDA School Facilities Construction Refunding Bond Series NN (Miscellaneous Revenue) | | | 5.00 | | | | 3-1-2026 | | | | 15,000,000 | | | | 16,356,450 | |
New Jersey Educational Facilities Authority Higher Education Facilities Trust Fund (Education Revenue) | | | 5.00 | | | | 6-15-2025 | | | | 5,830,000 | | | | 6,472,991 | |
New Jersey TTFA (Transportation Revenue) | | | 6.00 | | | | 12-15-2038 | | | | 10,425,000 | | | | 10,805,304 | |
New Jersey TTFA CAB Series A (Transportation Revenue) ¤ | | | 0.00 | | | | 12-15-2029 | | | | 11,875,000 | | | | 7,302,888 | |
New Jersey TTFA CAB Series A (Transportation Revenue) ¤ | | | 0.00 | | | | 12-15-2031 | | | | 4,500,000 | | | | 2,519,955 | |
New Jersey TTFA CAB Series A (Transportation Revenue) ¤ | | | 0.00 | | | | 12-15-2026 | | | | 1,150,000 | | | | 817,478 | |
New Jersey TTFA Series A (Transportation Revenue) | | | 5.00 | | | | 6-15-2042 | | | | 5,540,000 | | | | 5,896,056 | |
New Jersey TTFA Series A (Miscellaneous Revenue, National Insured) | | | 5.75 | | | | 6-15-2023 | | | | 2,000,000 | | | | 2,321,480 | |
New Jersey TTFA Series A (Miscellaneous Revenue, National Insured) | | | 5.75 | | | | 6-15-2025 | | | | 10,000,000 | | | | 12,008,300 | |
New Jersey TTFA Series AA (Transportation Revenue) | | | 5.00 | | | | 6-15-2044 | | | | 1,000,000 | | | | 1,083,520 | |
New Jersey TTFA Series AA (Transportation Revenue) | | | 5.25 | | | | 6-15-2033 | | | | 10,000,000 | | | | 10,928,700 | |
New Jersey TTFA Series B (Transportation Revenue) | | | 5.25 | | | | 6-15-2036 | | | | 5,575,000 | | | | 5,962,351 | |
New Jersey TTFA Series C (Transportation Revenue) | | | 5.25 | | | | 6-15-2032 | | | | 8,000,000 | | | | 8,846,560 | |
Newark NJ Housing Authority Port Newark Marine Terminal Rental (Miscellaneous Revenue, National Insured) | | | 5.00 | | | | 1-1-2032 | | | | 7,620,000 | | | | 8,815,121 | |
Newark NJ Qualified General Improvement Series A (GO Revenue) | | | 5.00 | | | | 7-15-2025 | | | | 5,000,000 | | | | 5,447,900 | |
Newark NJ Qualified General Improvement Series A (GO Revenue) | | | 5.00 | | | | 7-15-2026 | | | | 2,205,000 | | | | 2,410,109 | |
Newark NJ Qualified General Improvement Series A (GO Revenue) | | | 5.00 | | | | 7-15-2027 | | | | 6,035,000 | | | | 6,588,108 | |
Newark NJ Qualified General Improvement Series A (GO Revenue) | | | 5.25 | | | | 7-15-2024 | | | | 1,325,000 | | | | 1,452,876 | |
The accompanying notes are an integral part of these financial statements.
| | | | | | |
| Portfolio of investments—December 31, 2017 (unaudited) | | Wells Fargo Municipal Bond Fund | | | 21 | |
| | | | | | | | | | | | | | | | |
| Security name | | Interest rate | | | Maturity date | | | Principal | | | Value | |
|
| New Jersey (continued) | |
Newark NJ Qualified General Improvement Series B (GO Revenue) | | | 5.00 | % | | | 7-15-2025 | | | $ | 385,000 | | | $ | 419,488 | |
Newark NJ Qualified General Improvement Series B (GO Revenue) | | | 5.00 | | | | 7-15-2026 | | | | 395,000 | | | | 430,929 | |
Newark NJ Qualified General Improvement Series B (GO Revenue) | | | 5.00 | | | | 7-15-2027 | | | | 405,000 | | | | 441,000 | |
Newark NJ Qualified General Improvement Series B (GO Revenue) | | | 5.25 | | | | 7-15-2024 | | | | 375,000 | | | | 411,191 | |
Rutgers State University Series L (Education Revenue) | | | 5.00 | | | | 5-1-2033 | | | | 3,560,000 | | | | 4,033,551 | |
| | | | |
| | | | | | | | | | | | | | | 144,670,561 | |
| | | | | | | | | | | | | | | | |
|
| New Mexico: 0.38% | |
New Mexico Mortgage Finance Authority SFMR Class I (Housing Revenue, GNMA/FNMA/FHLMC Insured) | | | 5.35 | | | | 3-1-2030 | | | | 550,000 | | | | 593,742 | |
New Mexico Municipal Energy Acquisition Authority Gas Supply Subordinate Series B (1 Month LIBOR +0.75%) (Utilities Revenue, Royal Bank of Canada SPA) ± | | | 1.66 | | | | 11-1-2039 | | | | 10,000,000 | | | | 9,991,300 | |
| | | | |
| | | | | | | | | | | | | | | 10,585,042 | |
| | | | | | | | | | | | | | | | |
|
| New York: 9.28% | |
Hempstead Town NY Local Development Corporation The Academy Charter School Project Series A (Education Revenue) | | | 7.65 | | | | 2-1-2044 | | | | 3,500,000 | | | | 3,780,000 | |
Hempstead Town NY Local Development Corporation The Academy Charter School Project Series A (Education Revenue) | | | 8.25 | | | | 2-1-2041 | | | | 9,655,000 | | | | 10,605,631 | |
New York Dormitory Authority North Shore-Long Island Jewish Obligated Group Series B (3 Month LIBOR +0.73%) (Health Revenue) ± | | | 1.65 | | | | 5-1-2018 | | | | 765,000 | | | | 765,107 | |
New York Dormitory Authority Series B (Tax Revenue) | | | 5.75 | | | | 3-15-2036 | | | | 10,000,000 | | | | 10,505,800 | |
New York Metropolitan Transportation Authority Series A (Transportation Revenue) | | | 5.00 | | | | 11-15-2030 | | | | 11,000,000 | | | | 12,506,340 | |
New York Metropolitan Transportation Authority Series C (Transportation Revenue) | | | 6.50 | | | | 11-15-2028 | | | | 6,465,000 | | | | 6,742,155 | |
New York Metropolitan Transportation Authority Series C (Transportation Revenue) | | | 6.50 | | | | 11-15-2028 | | | | 1,535,000 | | | | 1,603,123 | |
New York NY Adjusted Fiscal 2017 Subordinate Series A-5 (GO Revenue, Landesbank Hessen-Thüringen SPA) ø | | | 1.85 | | | | 8-1-2044 | | | | 12,000,000 | | | | 12,000,000 | |
New York NY IDA Brooklyn Navy Yard Cogeneration Partners LP (Utilities Revenue) | | | 5.75 | | | | 10-1-2036 | | | | 5,000,000 | | | | 4,982,450 | |
New York NY IDA Brooklyn Navy Yard Cogeneration Partners LP (Utilities Revenue) | | | 5.65 | | | | 10-1-2028 | | | | 3,350,000 | | | | 3,336,332 | |
New York NY Municipal Water Finance Authority 2nd General Resolution Series AA (Water & Sewer Revenue) | | | 5.00 | | | | 6-15-2044 | | | | 17,400,000 | | | | 19,009,848 | |
New York NY Municipal Water Finance Authority 2nd General Resolution Series BB (Water & Sewer Revenue) | | | 5.00 | | | | 6-15-2044 | | | | 30,265,000 | | | | 33,490,038 | |
New York NY Municipal Water Finance Authority 2nd General Resolution Series BB (Water & Sewer Revenue) | | | 5.00 | | | | 6-15-2047 | | | | 2,330,000 | | | | 2,629,708 | |
New York NY Municipal Water Finance Authority 2nd General Resolution Series BB (Water & Sewer Revenue) | | | 5.25 | | | | 6-15-2044 | | | | 9,800,000 | | | | 10,995,796 | |
New York NY Municipal Water Finance Authority 2nd General Resolution Series DD (Water & Sewer Revenue) | | | 6.00 | | | | 6-15-2040 | | | | 11,625,000 | | | | 11,868,660 | |
New York NY Municipal Water Finance Authority Water & Sewer System Series A (Water & Sewer Revenue) | | | 5.75 | | | | 6-15-2040 | | | | 1,150,000 | | | | 1,172,092 | |
New York NY Municipal Water Finance Authority Water & Sewer System Series DD (Water & Sewer Revenue) | | | 5.00 | | | | 6-15-2026 | | | | 3,255,000 | | | | 3,603,025 | |
New York NY Municipal Water Finance Authority Water & Sewer System Unrefunded Bond Balance (Water & Sewer Revenue) | | | 5.75 | | | | 6-15-2040 | | | | 3,850,000 | | | | 3,923,959 | |
New York NY Series F-1 (GO Revenue) | | | 5.00 | | | | 3-1-2032 | | | | 3,000,000 | | | | 3,417,060 | |
The accompanying notes are an integral part of these financial statements.
| | | | |
| 22 | | Wells Fargo Municipal Bond Fund | | Portfolio of investments—December 31, 2017 (unaudited) |
| | | | | | | | | | | | | | | | |
| Security name | | Interest rate | | | Maturity date | | | Principal | | | Value | |
|
| New York (continued) | |
New York NY Transitional Finance Authority Building Aid Fiscal Year 2009 Series S-4 (Miscellaneous Revenue) | | | 5.75 | % | | | 1-15-2039 | | | $ | 2,500,000 | | | $ | 2,611,425 | |
New York NY Transitional Finance Authority Future Tax Secured Revenue Series I (Tax Revenue) | | | 5.00 | | | | 5-1-2033 | | | | 5,395,000 | | | | 6,138,701 | |
New York NY Transitional Finance Authority Future Tax Secured Subordinate Bonds Series A (Tax Revenue) | | | 5.00 | | | | 8-1-2031 | | | | 17,075,000 | | | | 20,010,534 | |
New York NY Transitional Finance Authority Future Tax Secured Subordinate Bonds Series B Subseries B-1 (Tax Revenue) | | | 5.00 | | | | 8-1-2045 | | | | 12,140,000 | | | | 14,425,962 | |
New York NY Transitional Finance Authority Subordinate Series A-2 (Tax Revenue, Dexia Credit Local LIQ) ø | | | 1.82 | | | | 11-1-2022 | | | | 7,450,000 | | | | 7,450,000 | |
Niagara Falls NY Bridge Commission (Transportation Revenue, National Insured) | | | 6.25 | | | | 10-1-2021 | | | | 7,230,000 | | | | 8,361,278 | |
Oyster Bay NY BAN Series A (GO Revenue) | | | 3.50 | | | | 6-1-2018 | | | | 3,000,000 | | | | 3,013,470 | |
Oyster Bay NY BAN Series C (GO Revenue) | | | 4.00 | | | | 6-1-2018 | | | | 3,000,000 | | | | 3,018,810 | |
Suffolk County NY TAN (GO Revenue) | | | 2.50 | | | | 7-25-2018 | | | | 26,215,000 | | | | 26,317,239 | |
Suffolk NY Tobacco Securitization Corporation Series B (Tobacco Revenue) | | | 4.50 | | | | 6-1-2026 | | | | 520,000 | | | | 565,895 | |
Westchester County NY Local Development Pace University Series A (Education Revenue) | | | 5.00 | | | | 5-1-2034 | | | | 1,850,000 | | | | 2,055,276 | |
Westchester County NY Local Development Pace University Series B (Education Revenue) øø | | | 1.43 | | | | 5-1-2044 | | | | 5,000,000 | | | | 5,000,000 | |
| | | | |
| | | | | | | | | | | | | | | 255,905,714 | |
| | | | | | | | | | | | | | | | |
|
| North Carolina: 1.29% | |
North Carolina Eastern Municipal Power Agency Series A (Utilities Revenue) | | | 5.50 | | | | 1-1-2026 | | | | 1,250,000 | | | | 1,300,188 | |
North Carolina Eastern Municipal Power Agency Series C (Utilities Revenue) | | | 6.75 | | | | 1-1-2024 | | | | 2,000,000 | | | | 2,103,860 | |
North Carolina Medical Care Commission University Health Systems of Eastern Carolina Series D (Health Revenue) | | | 6.00 | | | | 12-1-2029 | | | | 5,000,000 | | | | 5,203,700 | |
North Carolina Medical Care Commission University Health Systems of Eastern Carolina Series D (Health Revenue) | | | 6.25 | | | | 12-1-2033 | | | | 8,500,000 | | | | 8,865,415 | |
Wake County NC Housing Authority Sunnybrook Pointe Apartments (Housing Revenue) | | | 1.86 | | | | 12-1-2020 | | | | 18,100,000 | | | | 18,069,411 | |
| | | | |
| | | | | | | | | | | | | | | 35,542,574 | |
| | | | | | | | | | | | | | | | |
|
| Ohio: 2.61% | |
Allen County OH Catholic Healthcare Series B (Health Revenue) | | | 5.25 | | | | 9-1-2027 | | | | 3,825,000 | | | | 4,177,780 | |
Allen County OH Hospital Facilities Revenue Bonds Series B (Health Revenue) | | | 5.00 | | | | 8-1-2047 | | | | 5,000,000 | | | | 5,587,200 | |
Cleveland & Cuyahoga Counties OH Port Authority Economic Development Facilities Centers for Dialysis Care Project (Health Revenue) | | | 5.00 | | | | 12-1-2042 | | | | 5,205,000 | | | | 5,530,885 | |
Cleveland OH Airport System Revenue Series A (Airport Revenue) | | | 5.00 | | | | 1-1-2025 | | | | 4,015,000 | | | | 4,467,049 | |
Cleveland OH Airport System Revenue Series A (Airport Revenue, AGM Insured) | | | 5.00 | | | | 1-1-2031 | | | | 3,600,000 | | | | 3,981,996 | |
Montgomery County OH Hospital Kettering Medical Center (Health Revenue, National Insured) | | | 6.25 | | | | 4-1-2020 | | | | 1,935,000 | | | | 2,017,354 | |
Ohio Air Quality Development Authority AMT Refunding Bond Pollution Control 1st Energy Series C (Industrial Development Revenue) | | | 3.95 | | | | 11-1-2032 | | | | 2,700,000 | | | | 1,193,913 | |
Ohio Private Activity Bond AMT Portsmouth Bypass Project (Miscellaneous Revenue, AGM Insured) | | | 5.00 | | | | 12-31-2026 | | | | 1,500,000 | | | | 1,753,635 | |
Ohio Private Activity Bond AMT Portsmouth Bypass Project (Miscellaneous Revenue, AGM Insured) | | | 5.00 | | | | 12-31-2028 | | | | 1,600,000 | | | | 1,856,320 | |
Ohio Private Activity Bond AMT Portsmouth Bypass Project (Miscellaneous Revenue, AGM Insured) | | | 5.00 | | | | 12-31-2030 | | | | 2,250,000 | | | | 2,590,628 | |
Ohio Private Activity Bond AMT Portsmouth Bypass Project (Miscellaneous Revenue, AGM Insured) | | | 5.00 | | | | 12-31-2035 | | | | 12,000,000 | | | | 13,659,960 | |
The accompanying notes are an integral part of these financial statements.
| | | | | | |
| Portfolio of investments—December 31, 2017 (unaudited) | | Wells Fargo Municipal Bond Fund | | | 23 | |
| | | | | | | | | | | | | | | | |
| Security name | | Interest rate | | | Maturity date | | | Principal | | | Value | |
|
| Ohio (continued) | |
Ohio Private Activity Bond AMT Portsmouth Bypass Project (Miscellaneous Revenue, AGM Insured) | | | 5.00 | % | | | 12-31-2039 | | | $ | 2,500,000 | | | $ | 2,831,450 | |
Ohio Turnpike Commission CAB Series A-4 (Transportation Revenue) ¤ | | | 0.00 | | | | 2-15-2034 | | | | 8,500,000 | | | | 8,462,175 | |
Ohio Water Development Authority Pollution Control AMT Series C (Industrial Development Revenue) | | | 3.95 | | | | 11-1-2032 | | | | 8,000,000 | | | | 3,537,520 | |
Ohio Water Development Authority Pollution Control FirstEnergy Nuclear Generation Project (Industrial Development Revenue) | | | 3.75 | | | | 7-1-2033 | | | | 11,580,000 | | | | 5,120,213 | |
Ohio Water Development Authority Pollution Control Series C (Industrial Development Revenue) | | | 4.00 | | | | 6-1-2033 | | | | 3,720,000 | | | | 1,645,430 | |
RiverSouth Authority Ohio Lazarus Building Redevelopment Series A (Miscellaneous Revenue) | | | 5.75 | | | | 12-1-2027 | | | | 3,665,000 | | | | 3,672,770 | |
| | | | |
| | | | | | | | | | | | | | | 72,086,278 | |
| | | | | | | | | | | | | | | | |
|
| Oklahoma: 0.50% | |
Garfield County OK Educational Facilities Authority Enid Public Schools Project Series A (Miscellaneous Revenue) | | | 5.00 | | | | 9-1-2026 | | | | 1,810,000 | | | | 2,185,430 | |
Garfield County OK Educational Facilities Authority Enid Public Schools Project Series A (Miscellaneous Revenue) | | | 5.00 | | | | 9-1-2030 | | | | 2,000,000 | | | | 2,354,760 | |
Garfield County OK Educational Facilities Authority Enid Public Schools Project Series A (Miscellaneous Revenue) | | | 5.00 | | | | 9-1-2031 | | | | 1,145,000 | | | | 1,344,230 | |
McGee Creek Authority Oklahoma Water Revenue (Water & Sewer Revenue, National Insured) | | | 6.00 | | | | 1-1-2023 | | | | 2,865,000 | | | | 3,107,350 | |
Oklahoma Turnpike Authority Series C (Transportation Revenue) | | | 5.00 | | | | 1-1-2047 | | | | 3,000,000 | | | | 3,547,740 | |
Tulsa OK Airports Improvement Trust AMT Series A (Airport Revenue, Build America Mutual Assurance Company Insured) | | | 5.00 | | | | 6-1-2035 | | | | 1,055,000 | | | | 1,169,415 | |
| | | | |
| | | | | | | | | | | | | | | 13,708,925 | |
| | | | | | | | | | | | | | | | |
|
| Oregon: 0.17% | |
Deschutes County OR Hospital Facilities Authority Cascade Healthcare Community Incorporated Project (Health Revenue) | | | 8.25 | | | | 1-1-2038 | | | | 4,500,000 | | | | 4,793,130 | |
| | | | | | | | | | | | | | | | |
|
| Pennsylvania: 7.72% | |
Allegheny County PA Hospital Development Authority University of Pittsburgh Medical Center Series A (Health Revenue) | | | 5.63 | | | | 8-15-2039 | | | | 5,130,000 | | | | 5,444,572 | |
Allegheny County PA IDA Carnegie Museums of Pittsburgh (Miscellaneous Revenue, Citizens Bank LOC) ø | | | 1.74 | | | | 8-1-2032 | | | | 6,910,000 | | | | 6,910,000 | |
Allegheny County PA West Mifflin Area School District (GO Revenue, AGM Insured) | | | 5.00 | | | | 4-1-2025 | | | | 1,180,000 | | | | 1,354,097 | |
Allegheny County PA West Mifflin Area School District (GO Revenue, AGM Insured) | | | 5.00 | | | | 4-1-2026 | | | | 1,200,000 | | | | 1,388,328 | |
Allegheny County PA West Mifflin Area School District (GO Revenue, AGM Insured) | | | 5.00 | | | | 4-1-2027 | | | | 1,000,000 | | | | 1,160,290 | |
Beaver County PA IDA Pollution Control FirstEnergy Nuclear Generation Corporation Project Series A (Utilities Revenue) | | | 2.70 | | | | 4-1-2035 | | | | 2,000,000 | | | | 884,940 | |
Berks County PA Municipal Authority Reading Hospital & Medical Center Project Series B (Health Revenue) | | | 3.21 | | | | 11-1-2039 | | | | 20,000,000 | | | | 20,353,800 | |
Delaware County PA IDA Resource Recovery Facility Series A (Resource Recovery Revenue) | | | 6.20 | | | | 7-1-2019 | | | | 445,000 | | | | 446,095 | |
Delaware Valley PA Regional Finance Authority Local Government Public Improvements Project (Miscellaneous Revenue) | | | 5.75 | | | | 7-1-2032 | | | | 5,000,000 | | | | 6,435,750 | |
Delaware Valley PA Regional Finance Authority Local Government Series A (Miscellaneous Revenue, Ambac Insured) | | | 5.50 | | | | 8-1-2028 | | | | 16,420,000 | | | | 20,150,131 | |
Delaware Valley PA Regional Finance Authority Local Government Series C (Miscellaneous Revenue, Ambac Insured) | | | 7.75 | | | | 7-1-2027 | | | | 4,025,000 | | | | 5,643,211 | |
The accompanying notes are an integral part of these financial statements.
| | | | |
| 24 | | Wells Fargo Municipal Bond Fund | | Portfolio of investments—December 31, 2017 (unaudited) |
| | | | | | | | | | | | | | | | |
| Security name | | Interest rate | | | Maturity date | | | Principal | | | Value | |
|
| Pennsylvania (continued) | |
Luzerne County PA Series E (GO Revenue, AGM Insured) | | | 8.00 | % | | | 11-1-2027 | | | $ | 135,000 | | | $ | 141,842 | |
Montgomery County PA Higher Education & Health Authority Arcadia University (Education Revenue) | | | 5.00 | | | | 4-1-2024 | | | | 1,540,000 | | | | 1,746,961 | |
Montgomery County PA Higher Education & Health Authority Arcadia University (Education Revenue) | | | 5.00 | | | | 4-1-2025 | | | | 1,625,000 | | | | 1,852,159 | |
Montgomery County PA IDA Exelon Generation Company LLC Project Series A (Industrial Development Revenue) | | | 2.55 | | | | 12-1-2029 | | | | 11,530,000 | | | | 11,572,892 | |
Montgomery County PA IDA Peco Energy Company Project Series A (Industrial Development Revenue) | | | 2.50 | | | | 10-1-2030 | | | | 10,625,000 | | | | 10,661,763 | |
Pennsylvania EDFA Bridges Finco LP (Industrial Development Revenue) | | | 5.00 | | | | 12-31-2034 | | | | 14,275,000 | | | | 16,263,508 | |
Pennsylvania EDFA Bridges Finco LP (Industrial Development Revenue) | | | 5.00 | | | | 12-31-2030 | | | | 600,000 | | | | 692,286 | |
Pennsylvania EDFA Bridges Finco LP (Industrial Development Revenue) | | | 5.00 | | | | 12-31-2038 | | | | 2,100,000 | | | | 2,374,134 | |
Pennsylvania Finance Authority Pennsylvania Hills Project Series B (Miscellaneous Revenue, National Insured) ¤ | | | 0.00 | | | | 12-1-2025 | | | | 1,360,000 | | | | 1,083,811 | |
Pennsylvania Turnpike Commission Motor License Series B-1 (Transportation Revenue) | | | 5.00 | | | | 12-1-2040 | | | | 12,410,000 | | | | 13,571,948 | |
Pennsylvania Turnpike Commission Series A-1 (Transportation Revenue) | | | 5.00 | | | | 12-1-2047 | | | | 1,750,000 | | | | 2,041,568 | |
Pennsylvania Turnpike Commission Subordinate Series B-1 (Transportation Revenue) | | | 5.00 | | | | 6-1-2027 | | | | 1,000,000 | | | | 1,196,420 | |
Pennsylvania Turnpike Commission Subordinate Series B-1 (Transportation Revenue) | | | 5.00 | | | | 6-1-2028 | | | | 1,450,000 | | | | 1,710,971 | |
Pennsylvania Turnpike Commission Subordinate Series B-1 (Transportation Revenue) | | | 5.00 | | | | 6-1-2029 | | | | 2,000,000 | | | | 2,347,300 | |
Pennsylvania Turnpike Commission Subordinate Series B-2 (Transportation Revenue) | | | 5.00 | | | | 6-1-2027 | | | | 1,200,000 | | | | 1,435,704 | |
Pennsylvania Turnpike Commission Subordinate Series B-2 (Transportation Revenue) | | | 5.00 | | | | 6-1-2028 | | | | 5,400,000 | | | | 6,371,892 | |
Philadelphia PA Airport Series A (Airport Revenue) | | | 5.00 | | | | 7-1-2047 | | | | 3,000,000 | | | | 3,457,710 | |
Philadelphia PA IDA 1st Philadelphia Preparatory Charter School Project Series A (Education Revenue) | | | 7.00 | | | | 6-15-2033 | | | | 2,000,000 | | | | 2,295,240 | |
Philadelphia PA IDA New Foundations Charter School Project (Education Revenue) | | | 6.00 | | | | 12-15-2027 | | | | 280,000 | | | | 311,422 | |
Philadelphia PA School District Series A (GO Revenue) | | | 5.00 | | | | 9-1-2024 | | | | 2,075,000 | | | | 2,365,459 | |
Philadelphia PA School District Series D (GO Revenue) | | | 5.00 | | | | 9-1-2021 | | | | 5,000,000 | | | | 5,462,050 | |
Philadelphia PA School District Series F (GO Revenue) | | | 5.00 | | | | 9-1-2035 | | | | 3,820,000 | | | | 4,232,713 | |
Philadelphia PA Series B (Water & Sewer Revenue) | | | 5.00 | | | | 7-1-2033 | | | | 8,000,000 | | | | 9,347,200 | |
Quakertown PA General Authority Health LifeQuest Obligated Group Series C (Health Revenue) | | | 4.50 | | | | 7-1-2027 | | | | 750,000 | | | | 744,278 | |
Quakertown PA General Authority Health LifeQuest Obligated Group Series C (Health Revenue) | | | 5.00 | | | | 7-1-2032 | | | | 1,000,000 | | | | 1,001,990 | |
Quakertown PA General Authority Refunding Bond Health LifeQuest Obligated Group Series C (Health Revenue) | | | 5.30 | | | | 7-1-2042 | | | | 1,750,000 | | | | 1,756,930 | |
Scranton PA Notes (GO Revenue) | | | 5.00 | | | | 11-15-2032 | | | | 2,850,000 | | | | 2,990,676 | |
State Public School Building Authority Philadelphia PA School District Project (Miscellaneous Revenue) | | | 5.00 | | | | 4-1-2022 | | | | 2,635,000 | | | | 2,901,978 | |
State Public School Building Authority Philadelphia PA School District Project (Miscellaneous Revenue) | | | 5.00 | | | | 4-1-2024 | | | | 3,960,000 | | | | 4,327,765 | |
State Public School Building Authority Philadelphia PA School District Project (Miscellaneous Revenue) | | | 5.00 | | | | 6-1-2024 | | | | 2,250,000 | | | | 2,556,990 | |
State Public School Building Authority Philadelphia PA School District Project Series A (Miscellaneous Revenue) | | | 5.00 | | | | 6-1-2034 | | | | 1,915,000 | | | | 2,133,214 | |
State Public School Building Authority Philadelphia PA School District Project Series A (Miscellaneous Revenue) | | | 5.00 | | | | 6-1-2035 | | | | 16,715,000 | | | | 18,565,685 | |
The accompanying notes are an integral part of these financial statements.
| | | | | | |
| Portfolio of investments—December 31, 2017 (unaudited) | | Wells Fargo Municipal Bond Fund | | | 25 | |
| | | | | | | | | | | | | | | | |
| Security name | | Interest rate | | | Maturity date | | | Principal | | | Value | |
|
| Pennsylvania (continued) | |
York County PA IDA Philadelphia Electric Company Project Series A (Industrial Development Revenue) | | | 2.55 | % | | | 6-1-2036 | | | $ | 3,140,000 | | | $ | 3,179,690 | |
| | | | |
| | | | | | | | | | | | | | | 212,867,363 | |
| | | | | | | | | | | | | | | | |
|
| Puerto Rico: 0.11% | |
Puerto Rico Highway & Transportation Authority Series AA (Transportation Revenue, National Insured) | | | 5.50 | | | | 7-1-2020 | | | | 3,015,000 | | | | 3,067,672 | |
| | | | | | | | | | | | | | | | |
|
| South Carolina: 0.51% | |
Connector 2000 Association Incorporated CAB Series A (Transportation Revenue) ¤ | | | 0.00 | | | | 1-1-2018 | | | | 181,929 | | | | 181,929 | |
Piedmont SC Municipal Power Agency (Utilities Revenue, FGIC Insured) | | | 6.75 | | | | 1-1-2019 | | | | 210,000 | | | | 221,015 | |
South Carolina Jobs Economic Development Authority Solid Waste Disposal Repower South Berkeley LLC Project Green Bond (Resource Recovery Revenue) 144A | | | 6.00 | | | | 2-1-2035 | | | | 1,880,000 | | | | 1,848,378 | |
South Carolina Education Assistance Authority Student Loan Series I (Education Revenue) | | | 5.10 | | | | 10-1-2029 | | | | 1,440,000 | | | | 1,503,461 | |
South Carolina Jobs EDA Solid Waste Disposal AMT Green Bond RePower So. Berkeley LLC (Resource Recovery Revenue) 144A | | | 6.25 | | | | 2-1-2045 | | | | 2,750,000 | | | | 2,735,618 | |
South Carolina Jobs EDA York Preparatory Academy Project Series A (Education Revenue) | | | 7.25 | | | | 11-1-2045 | | | | 1,500,000 | | | | 1,625,415 | |
South Carolina Public Service Authority Series C (Utilities Revenue) | | | 5.00 | | | | 12-1-2028 | | | | 1,230,000 | | | | 1,453,774 | |
South Carolina Public Service Authority Series C (Utilities Revenue) | | | 5.00 | | | | 12-1-2034 | | | | 1,825,000 | | | | 2,110,047 | |
South Carolina Public Service Authority Series C (Utilities Revenue) | | | 5.00 | | | | 12-1-2035 | | | | 2,000,000 | | | | 2,307,320 | |
| | | | |
| | | | | | | | | | | | | | | 13,986,957 | |
| | | | | | | | | | | | | | | | |
|
| South Dakota: 0.55% | |
Rapid City SD Series A (Airport Revenue) | | | 6.75 | | | | 12-1-2031 | | | | 1,020,000 | | | | 1,116,839 | |
Rapid City SD Series A (Airport Revenue) | | | 7.00 | | | | 12-1-2035 | | | | 750,000 | | | | 823,823 | |
South Dakota Board of Regents Housing & Auxiliary Facilities System (Housing Revenue) | | | 5.00 | | | | 4-1-2023 | | | | 750,000 | | | | 859,058 | |
South Dakota Board of Regents Housing & Auxiliary Facilities System (Housing Revenue) | | | 5.00 | | | | 4-1-2024 | | | | 1,100,000 | | | | 1,282,941 | |
South Dakota Board of Regents Housing & Auxiliary Facilities System (Housing Revenue) | | | 5.00 | | | | 4-1-2025 | | | | 1,000,000 | | | | 1,185,790 | |
South Dakota Board of Regents Housing & Auxiliary Facilities System (Housing Revenue) | | | 5.00 | | | | 4-1-2026 | | | | 1,540,000 | | | | 1,850,587 | |
South Dakota Board of Regents Housing & Auxiliary Facilities System (Housing Revenue) | | | 5.00 | | | | 4-1-2032 | | | | 1,010,000 | | | | 1,203,051 | |
South Dakota Board of Regents Housing & Auxiliary Facilities System (Housing Revenue) | | | 5.00 | | | | 4-1-2033 | | | | 1,250,000 | | | | 1,483,050 | |
South Dakota HEFA Sanford Health Project (Health Revenue) | | | 5.50 | | | | 11-1-2040 | | | | 5,000,000 | | | | 5,318,000 | |
| | | | |
| | | | | | | | | | | | | | | 15,123,139 | |
| | | | | | | | | | | | | | | | |
|
| Tennessee: 0.40% | |
Bristol TN Industrial Development Board The Pinnacle Project Series A (Tax Revenue) 144A | | | 5.00 | | | | 12-1-2035 | | | | 8,500,000 | | | | 8,469,740 | |
Bristol TN Industrial Development Board The Pinnacle Project Series A (Tax Revenue) 144A | | | 5.13 | | | | 12-1-2042 | | | | 2,470,000 | | | | 2,447,572 | |
| | | | |
| | | | | | | | | | | | | | | 10,917,312 | |
| | | | | | | | | | | | | | | | |
The accompanying notes are an integral part of these financial statements.
| | | | |
| 26 | | Wells Fargo Municipal Bond Fund | | Portfolio of investments—December 31, 2017 (unaudited) |
| | | | | | | | | | | | | | | | |
| Security name | | Interest rate | | | Maturity date | | | Principal | | | Value | |
|
| Texas: 8.62% | |
Austin TX Affordable PFC Incorporated Commons at Goodnight Apartments (Housing Revenue) | | | 1.85 | % | | | 1-1-2021 | | | $ | 10,000,000 | | | $ | 9,978,200 | |
Austin TX Airport System AMT (Airport Revenue) | | | 5.00 | | | | 11-15-2039 | | | | 8,000,000 | | | | 9,044,240 | |
Austin TX Airport System AMT (Airport Revenue) | | | 5.00 | | | | 11-15-2044 | | | | 3,500,000 | | | | 3,926,755 | |
Beasley TX Higher Education Finance Corporation Focus Learning Academy Series A (Education Revenue) | | | 7.75 | | | | 8-15-2041 | | | | 2,000,000 | | | | 1,480,000 | |
Brownsville TX Independent School District Maintenance Tax Notes (GO Revenue) | | | 4.00 | | | | 8-15-2022 | | | | 8,435,000 | | | | 9,183,100 | |
Central Texas Regional Mobility Authority Senior Lien (Transportation Revenue) | | | 5.75 | | | | 1-1-2025 | | | | 2,000,000 | | | | 2,154,080 | |
Central Texas Regional Mobility Authority Senior Lien Series A (Transportation Revenue) | | | 5.00 | | | | 1-1-2033 | | | | 3,740,000 | | | | 4,150,465 | |
Clifton TX Higher Educational Finance Corporation International Leadership Series A (Education Revenue) | | | 5.75 | | | | 8-15-2038 | | | | 2,000,000 | | | | 2,170,720 | |
Dallas TX Independent School District School Building (GO Revenue, Permanent School Fund Insured) | | | 6.38 | | | | 2-15-2034 | | | | 10,000,000 | | | | 10,055,900 | |
Dallas TX Refunding & Improvement Bonds (GO Revenue) | | | 5.00 | | | | 2-15-2024 | | | | 13,600,000 | | | | 15,852,568 | |
Grand Parkway Transportation Corporation Texas CAB Series B (Transportation Revenue) ¤ | | | 0.00 | | | | 10-1-2029 | | | | 1,015,000 | | | | 974,796 | |
Grand Parkway Transportation Corporation Texas CAB Series B (Transportation Revenue) ¤ | | | 0.00 | | | | 10-1-2030 | | | | 2,000,000 | | | | 1,917,160 | |
Harris County TX Industrial Development Corporation Deer Park Refining Limited Partnership Project (Resource Recovery Revenue) | | | 4.70 | | | | 5-1-2018 | | | | 5,000,000 | | | | 5,045,700 | |
Houston TX Housing Finance Corporation Cullen Park Apartments Series A (Housing Revenue, FNMA LIQ) | | | 5.70 | | | | 12-1-2033 | | | | 965,000 | | | | 967,210 | |
Houston TX Public Improvement Refunding Bonds Series A (GO Revenue) | | | 4.00 | | | | 3-1-2034 | | | | 1,000,000 | | | | 1,087,070 | |
Houston TX Public Improvement Refunding Bonds Series A (GO Revenue) | | | 5.00 | | | | 3-1-2025 | | | | 3,070,000 | | | | 3,643,261 | |
Houston TX Public Improvement Refunding Bonds Series A (GO Revenue) | | | 5.00 | | | | 3-1-2029 | | | | 2,000,000 | | | | 2,417,980 | |
La Vernia TX Higher Education Finance Corporation Lifeschool of Dallas Series A (Education Revenue) | | | 6.25 | | | | 8-15-2021 | | | | 2,585,000 | | | | 2,737,618 | |
La Vernia TX Higher Education Finance Corporation Lifeschool of Dallas Series A (Education Revenue) | | | 7.50 | | | | 8-15-2041 | | | | 6,500,000 | | | | 7,094,100 | |
Lewisville TX Combination Contract (Miscellaneous Revenue) | | | 6.75 | | | | 10-1-2032 | | | | 1,610,000 | | | | 1,672,661 | |
Lewisville TX Combination Contract (Miscellaneous Revenue) | | | 6.75 | | | | 10-1-2032 | | | | 185,000 | | | | 187,061 | |
Lewisville TX Combination Contract Castle Hills Public Improvement Bonds Project #5 (Miscellaneous Revenue) 144A | | | 6.50 | | | | 9-1-2034 | | | | 6,360,000 | | | | 6,525,932 | |
Lewisville TX Independent School District Unlimited Tax Refunding Bonds Series A (GO Revenue) | | | 5.00 | | | | 8-15-2021 | | | | 2,200,000 | | | | 2,449,480 | |
Lewisville TX Independent School District Unlimited Tax Refunding Bonds Series A (GO Revenue) | | | 5.00 | | | | 8-15-2022 | | | | 2,640,000 | | | | 3,012,583 | |
Lewisville TX Independent School District Unlimited Tax Refunding Bonds Series A (GO Revenue) | | | 5.00 | | | | 8-15-2023 | | | | 3,000,000 | | | | 3,503,610 | |
Lower Colorado TX River Authority Series A (Utilities Revenue) | | | 5.00 | | | | 5-15-2033 | | | | 2,475,000 | | | | 2,761,481 | |
New Hope ECFA Children’s Health System of Texas Project Series A (Health Revenue) | | | 4.00 | | | | 8-15-2033 | | | | 2,000,000 | | | | 2,119,580 | |
North Texas Tollway Authority Series A (Transportation Revenue) | | | 5.00 | | | | 1-1-2033 | | | | 3,600,000 | | | | 4,156,776 | |
North Texas Tollway Authority Series A (Transportation Revenue) | | | 5.00 | | | | 1-1-2035 | | | | 4,000,000 | | | | 4,593,800 | |
Port Arthur TX Navigation District Jefferson County Environmental Facilities Motiva Enterprises LLC Project Series C (Resource Recovery Revenue) ø | | | 1.83 | | | | 4-1-2040 | | | | 6,600,000 | | | | 6,600,000 | |
Port Arthur TX Navigation District Jefferson County Environmental Facilities Motiva Enterprises LLC Project Series D (Resource Recovery Revenue) ø | | | 1.83 | | | | 11-1-2040 | | | | 3,000,000 | | | | 3,000,000 | |
Port Arthur TX Navigation District Motiva Enterprises LLC Project Series A (Resource Recovery Revenue) ø | | | 1.83 | | | | 4-1-2040 | | | | 4,100,000 | | | | 4,100,000 | |
The accompanying notes are an integral part of these financial statements.
| | | | | | |
| Portfolio of investments—December 31, 2017 (unaudited) | | Wells Fargo Municipal Bond Fund | | | 27 | |
| | | | | | | | | | | | | | | | |
| Security name | | Interest rate | | | Maturity date | | | Principal | | | Value | |
|
| Texas (continued) | |
Port Arthur TX Navigation District Motiva Enterprises LLC Project Subordinate Series D (Resource Recovery Revenue) ø | | | 1.83 | % | | | 11-1-2040 | | | $ | 10,500,000 | | | $ | 10,500,000 | |
Port of Houston TX Authority Series D-1 (GO Revenue) | | | 5.00 | | | | 10-1-2035 | | | | 10,000,000 | | | | 10,822,100 | |
Southwest Texas Higher Education Authority Incorporated Southern Methodist University Project (Education Revenue) | | | 5.00 | | | | 10-1-2030 | | | | 1,460,000 | | | | 1,772,469 | |
Southwest Texas Higher Education Authority Incorporated Southern Methodist University Project (Education Revenue) | | | 5.00 | | | | 10-1-2032 | | | | 650,000 | | | | 782,880 | |
Southwest Texas Higher Education Authority Incorporated Southern Methodist University Project (Education Revenue) | | | 5.00 | | | | 10-1-2039 | | | | 750,000 | | | | 889,133 | |
Southwest Texas Higher Education Authority Incorporated Southern Methodist University Project (Education Revenue) | | | 5.00 | | | | 10-1-2040 | | | | 1,000,000 | | | | 1,184,570 | |
Southwest Texas Higher Education Authority Incorporated Southern Methodist University Project (Education Revenue) | | | 5.00 | | | | 10-1-2041 | | | | 900,000 | | | | 1,065,267 | |
Sugar Land TX Refunding Bonds (GO Revenue) | | | 5.00 | | | | 2-15-2030 | | | | 1,250,000 | | | | 1,519,238 | |
Tarrant County TX Cultural Education Facilities Buckingham Senior Living Community Incorporated (Health Revenue) | | | 3.88 | | | | 11-15-2020 | | | | 2,000,000 | | | | 2,000,160 | |
Tarrant County TX Cultural Education Facilities Finance Corporation Series B (Health Revenue) | | | 5.00 | | | | 11-15-2030 | | | | 4,000,000 | | | | 4,301,040 | |
Texas Municipal Gas Acquisition & Supply Corporation III (Utilities Revenue) | | | 5.00 | | | | 12-15-2029 | | | | 5,115,000 | | | | 5,734,682 | |
Texas Municipal Gas Acquisition & Supply Corporation III (Utilities Revenue) | | | 5.00 | | | | 12-15-2031 | | | | 5,000,000 | | | | 5,578,550 | |
Texas Private Activity Bond Surface Transportation Corporation Project NTE Mobility Partners Segments LLC (Transportation Revenue) | | | 6.75 | | | | 6-30-2043 | | | | 4,000,000 | | | | 4,695,800 | |
Texas Private Activity Bond Surface Transportation Corporation Project NTE Mobility Partners Segments LLC (Transportation Revenue) | | | 7.00 | | | | 12-31-2038 | | | | 12,500,000 | | | | 14,884,000 | |
Texas Transportation Commission Highway Improvement (Miscellaneous Revenue) | | | 5.00 | | | | 4-1-2028 | | | | 7,280,000 | | | | 8,560,552 | |
University of Texas Board of Regents Refunding Bonds Series C (Education Revenue) | | | 5.00 | | | | 8-15-2023 | | | | 11,025,000 | | | | 12,901,455 | |
University of Texas Board of Regents Refunding Bonds Series C (Education Revenue) | | | 5.00 | | | | 8-15-2024 | | | | 10,000,000 | | | | 11,946,200 | |
| | | | |
| | | | | | | | | | | | | | | 237,701,983 | |
| | | | | | | | | | | | | | | | |
|
| Utah: 0.53% | |
Utah County UT Charter School Ronald Wilson Reagan Series A (Education Revenue) | | | 5.75 | | | | 2-15-2022 | | | | 485,000 | | | | 487,386 | |
Utah State Charter School Finance Authority Early Light Academy Project (Education Revenue) | | | 8.50 | | | | 7-15-2046 | | | | 7,780,000 | | | | 8,174,446 | |
Utah State Charter School Finance Authority Oquirrh Mountain Charter School Project (Education Revenue) | | | 8.00 | | | | 7-15-2030 | | | | 1,860,000 | | | | 1,922,738 | |
Utah State Charter School Finance Authority Oquirrh Mountain Charter School Project (Education Revenue) | | | 8.00 | | | | 7-15-2041 | | | | 3,910,000 | | | | 4,035,472 | |
| | | | |
| | | | | | | | | | | | | | | 14,620,042 | |
| | | | | | | | | | | | | | | | |
|
| Vermont: 1.30% | |
Vermont Student Assistance Corporation Series B Class A-2 (3 Month LIBOR +3.00%) (Education Revenue) ± | | | 4.50 | | | | 12-3-2035 | | | | 16,800,000 | | | | 17,540,544 | |
Vermont Student Assistance Corporation Series B Class B (1 Month LIBOR +1.00%) (Education Revenue) ± | | | 2.36 | | | | 6-2-2042 | | | | 18,639,810 | | | | 18,276,683 | |
| | | | |
| | | | | | | | | | | | | | | 35,817,227 | |
| | | | | | | | | | | | | | | | |
The accompanying notes are an integral part of these financial statements.
| | | | |
| 28 | | Wells Fargo Municipal Bond Fund | | Portfolio of investments—December 31, 2017 (unaudited) |
| | | | | | | | | | | | | | | | |
| Security name | | Interest rate | | | Maturity date | | | Principal | | | Value | |
|
| Virgin Islands: 0.70% | |
Virgin Islands PFA Matching Fund Loan Note Senior Lien Series A (Tax Revenue) | | | 5.00 | % | | | 10-1-2025 | | | $ | 7,500,000 | | | $ | 4,687,500 | |
Virgin Islands PFA Series C (Tax Revenue) | | | 5.00 | | | | 10-1-2018 | | | | 8,860,000 | | | | 7,763,575 | |
Virgin Islands PFA Series C (Miscellaneous Revenue) | | | 5.00 | | | | 10-1-2039 | | | | 15,795,000 | | | | 6,910,313 | |
| | | | |
| | | | | | | | | | | | | | | 19,361,388 | |
| | | | | | | | | | | | | | | | |
|
| Virginia: 1.33% | |
Loudoun County VA EDA Multifamily Housing Revenue Bonds Stone Springs Apartments (Housing Revenue, GNMA/FHA Insured) | | | 1.84 | | | | 12-1-2020 | | | | 16,500,000 | | | | 16,475,250 | |
Marquis VA CDA CAB (Tax Revenue) 144A¤ | | | 0.00 | | | | 9-1-2045 | | | | 397,000 | | | | 280,115 | |
Marquis VA CDA CAB Series C (Tax Revenue) ¤ | | | 0.00 | | | | 9-1-2041 | | | | 1,824,000 | | | | 237,722 | |
Marquis VA CDA Series B (Tax Revenue) | | | 5.63 | | | | 9-1-2041 | | | | 1,310,000 | | | | 910,254 | |
Newport News VA Redevelopment & Housing Authority Multifamily Housing Series A (Housing Revenue) | | | 1.82 | | | | 11-1-2020 | | | | 2,010,000 | | | | 2,008,533 | |
Norfolk VA Series C (GO Revenue) | | | 4.00 | | | | 9-1-2032 | | | | 5,810,000 | | | | 6,389,489 | |
Virginia Small Business Financing Authority Senior Lien 95 Express Lanes LLC Project (Transportation Revenue) | | | 5.00 | | | | 7-1-2034 | | | | 4,000,000 | | | | 4,328,800 | |
Virginia Commonwealth Transportation Board Refunding Capital Projects Series A (Transportation Revenue) | | | 5.00 | | | | 5-15-2029 | | | | 4,500,000 | | | | 5,575,905 | |
Watkins Centre VA CDA (Miscellaneous Revenue) | | | 5.40 | | | | 3-1-2020 | | | | 477,000 | | | | 477,525 | |
| | | | |
| | | | | | | | | | | | | | | 36,683,593 | |
| | | | | | | | | | | | | | | | |
|
| Washington: 1.41% | |
King County WA (GO Revenue) | | | 4.75 | | | | 1-1-2034 | | | | 1,080,000 | | | | 1,080,000 | |
King County WA Public Hospital District #1 Valley Medical Center Refunding Bond (GO Revenue) | | | 5.00 | | | | 12-1-2029 | | | | 8,940,000 | | | | 10,496,812 | |
King County WA Public Hospital District #1 Valley Medical Center Refunding Bond (GO Revenue) | | | 5.00 | | | | 12-1-2035 | | | | 9,430,000 | | | | 10,870,998 | |
King County WA Sewer Series B (Water & Sewer Revenue, Landesbank Hessen-Thüringen LOC) ø | | | 1.75 | | | | 1-1-2032 | | | | 6,000,000 | | | | 6,000,000 | |
Spokane WA Housing Finance Commission Riverview Retirement Community Project (Health Revenue) | | | 5.00 | | | | 1-1-2023 | | | | 1,155,000 | | | | 1,225,686 | |
Washington Certificate of Participation Series A (Miscellaneous Revenue) | | | 5.00 | | | | 7-1-2038 | | | | 3,265,000 | | | | 3,842,350 | |
Washington Health Care Facilities Authority Central Washington Health Service Association (Health Revenue) | | | 7.00 | | | | 7-1-2039 | | | | 5,000,000 | | | | 5,383,200 | |
| | | | |
| | | | | | | | | | | | | | | 38,899,046 | |
| | | | | | | | | | | | | | | | |
|
| West Virginia: 0.21% | |
Monongalia County WV Commission Refunding & Improvement Bonds University Town Center Series A (Tax Revenue) 144A | | | 5.75 | | | | 6-1-2043 | | | | 675,000 | | | | 706,921 | |
Monongalia County WV Refunding & Improvement Bonds Series A (Tax Revenue) 144A | | | 5.50 | | | | 6-1-2037 | | | | 2,500,000 | | | | 2,601,775 | |
West Virginia Hospital Finance Authority Refunding & Improvement Bonds Series D (Health Revenue, AGM Insured) | | | 5.50 | | | | 6-1-2033 | | | | 2,305,000 | | | | 2,387,450 | |
| | | | |
| | | | | | | | | | | | | | | 5,696,146 | |
| | | | | | | | | | | | | | | | |
|
| Wisconsin: 1.05% | |
Milwaukee WI RDA Science Education Consortium Incorporated Project Series A (Education Revenue) | | | 6.00 | | | | 8-1-2033 | | | | 2,120,000 | | | | 2,335,583 | |
Milwaukee WI RDA Science Education Consortium Incorporated Project Series A (Education Revenue) | | | 6.25 | | | | 8-1-2043 | | | | 4,650,000 | | | | 5,114,582 | |
The accompanying notes are an integral part of these financial statements.
| | | | | | |
| Portfolio of investments—December 31, 2017 (unaudited) | | Wells Fargo Municipal Bond Fund | | | 29 | |
| | | | | | | | | | | | | | | | |
| Security name | | Interest rate | | | Maturity date | | | Principal | | | Value | |
|
| Wisconsin (continued) | |
Verona WI Area School District Building & Improvement Bonds (GO Revenue) | | | 4.00 | % | | | 4-1-2027 | | | $ | 3,385,000 | | | $ | 3,820,243 | |
Verona WI Area School District Building & Improvement Bonds (GO Revenue) | | | 4.00 | | | | 4-1-2028 | | | | 1,380,000 | | | | 1,536,575 | |
Verona WI Area School District Building & Improvement Bonds (GO Revenue) | | | 5.00 | | | | 4-1-2026 | | | | 3,310,000 | | | | 4,041,477 | |
Wisconsin HEFA Aurora Health Care Incorporated Series A (Health Revenue) | | | 5.25 | | | | 4-15-2024 | | | | 1,025,000 | | | | 1,101,127 | |
Wisconsin HEFA Aurora Health Care Incorporated Series C (Health Revenue, JPMorgan Chase & Company LOC) ø | | | 1.65 | | | | 2-15-2029 | | | | 2,545,000 | | | | 2,545,000 | |
Wisconsin PFA Carolina International School Series A (Education Revenue) 144A | | | 6.00 | | | | 8-1-2023 | | | | 440,000 | | | | 477,184 | |
Wisconsin PFA Carolina International School Series A (Education Revenue) 144A | | | 6.75 | | | | 8-1-2033 | | | | 1,430,000 | | | | 1,571,570 | |
Wisconsin PFA Carolina International School Series A (Education Revenue) 144A | | | 7.00 | | | | 8-1-2043 | | | | 1,575,000 | | | | 1,736,249 | |
Wisconsin PFA Carolina International School Series A (Education Revenue) 144A | | | 7.20 | | | | 8-1-2048 | | | | 940,000 | | | | 1,040,495 | |
Wisconsin Public Finance Authority Series A-2 (Resource Recovery Revenue) øø | | | 1.25 | | | | 10-1-2025 | | | | 3,650,000 | | | | 3,644,379 | |
| | | | |
| | | | | | | | | | | | | | | 28,964,464 | |
| | | | | | | | | | | | | | | | |
|
| Wyoming: 0.08% | |
West Park Hospital District Wyoming Series B (Health Revenue) | | | 6.50 | | | | 6-1-2027 | | | | 500,000 | | | | 551,540 | |
Wyoming CDA (Education Revenue) | | | 6.50 | | | | 7-1-2043 | | | | 1,600,000 | | | | 1,726,544 | |
| | | | |
| | | | | | | | | | | | | | | 2,278,084 | |
| | | | | | | | | | | | | | | | |
| |
Total Municipal Obligations (Cost $2,598,603,789) | | | | 2,716,398,173 | |
| | | | | | | | | | | | | | | | |
| | | | |
| | | Yield | | | | | | Shares | | | | |
| Short-Term Investments: 0.52% | |
|
| Investment Companies: 0.52% | |
Wells Fargo Municipal Cash Management Money Market Fund Institutional Class (l)(u) | | | 1.49 | | | | | | | | 14,408,748 | | | | 14,424,598 | |
| | | | | | | | | | | | | | | | |
| |
Total Short-Term Investments (Cost $14,424,073) | | | | 14,424,598 | |
| | | | | | | | | | | | | | | | |
| | | | | | | | |
| Total investments in securities (Cost $2,613,027,862) | | | 99.05 | % | | | 2,730,822,771 | |
Other assets and liabilities, net | | | 0.95 | | | | 26,211,001 | |
| | | | | | | | |
| Total net assets | | | 100.00 | % | | $ | 2,757,033,772 | |
| | | | | | | | |
| ¤ | The security is issued in zero coupon form with no periodic interest payments. |
| 144A | The security may be resold in transactions exempt from registration, normally to qualified institutional buyers, pursuant to Rule 144A under the Securities Act of 1933. |
| ± | Variable rate investment. The rate shown is the rate in effect at period end. |
| ø | Variable rate demand notes are subject to a demand feature which reduces the effective maturity. The maturity date shown represents the final maturity date of the security. The interest rate is determined and reset by the issuer daily, weekly, or monthly depending upon the terms of the security. The rate shown is the rate in effect at period end. |
| †† | On the last interest date, partial interest was paid. |
| † | Non-income-earning security |
| øø | The interest rate is determined and reset by the issuer periodically depending upon the terms of the security. The rate shown is the rate in effect at period end. |
| (l) | The issuer of the security is an affiliated person of the Fund as defined in the Investment Company Act of 1940. |
| (u) | The rate represents the 7-day annualized yield at period end. |
The accompanying notes are an integral part of these financial statements.
| | | | |
| 30 | | Wells Fargo Municipal Bond Fund | | Portfolio of investments—December 31, 2017 (unaudited) |
Credit Default Swaps
Buy protection
| | | | | | | | | | | | | | | | | | | | | | | | | | | | | | | | | | | | |
| Reference entity | | Fixed rate
paid | | | Payment
frequency | | | Counterparty | | | Maturity
date | | | Notional
amount | | | Value | | | Premiums
paid
(received) | | | Unrealized
gains | | | Unrealized
losses | |
Markit CDX North America High Yield Index | | | 5.00 | % | | | Quarterly | | | | JPMorgan | ¤¤°° | | | 12-20-2022 | | | $ | 50,065,000 | | | $ | (4,869,653 | ) | | $ | (4,004,464 | ) | | $ | 0 | | | $ | (865,189 | ) |
| | ¤¤ | Transaction can only be closed with the originating counterparty. |
| | °° | Exchange traded or centrally cleared transaction with counterparty. |
Investments in Affiliates
An affiliated investment is an investment in which the Fund owns at least 5% of the outstanding voting shares of the issuer or as a result of other relationships, such as the Fund and the issuer having the same investment manager. Transactions with issuers that were either affiliated persons of the Fund at the beginning of the period or the end of the period were as follows:
| | | | | | | | | | | | | | | | | | | | | | | | | | | | | | | | | | | | |
| | | Shares,
beginning of period | | | Shares
purchased | | | Shares
sold | | | Shares,
end of
period | | | Net
realized
gains
(losses) | | | Net
change in
unrealized
gains
(losses) | | | Income
from
affiliated
securities | | | Value, end of period | | | % of
net
assets | |
Short-Term Investments | | | | | | | | | | | | | | | | | | | | | | | | | | | | | | | | | | | | |
Investment Companies | | | | | | | | | | | | | | | | | | | | | | | | | | | | | | | | | | | | |
Wells Fargo Municipal Cash Management Money Market Fund Institutional Class | | | 21,484,440 | | | | 357,234,123 | | | | 364,309,815 | | | | 14,408,748 | | | $ | 8,575 | | | $ | 525 | | | $ | 101,068 | | | $ | 14,424,598 | | | | 0.52 | % |
The accompanying notes are an integral part of these financial statements.
| | | | | | |
| Statement of assets and liabilities—December 31, 2017 (unaudited) | | Wells Fargo Municipal Bond Fund | | | 31 | |
| | | | |
| | | | |
|
Assets | |
Investments in unaffiliated securities, at value (cost $2,598,603,789) | | $ | 2,716,398,173 | |
Investments in affiliated securities, at value (cost $14,424,073) | | | 14,424,598 | |
Cash | | | 65,173 | |
Segregated cash for credit default swap | | | 5,837,671 | |
Receivable for investments sold | | | 2,855,177 | |
Receivable for Fund shares sold | | | 4,880,929 | |
Receivable for interest | | | 27,926,111 | |
Prepaid expenses and other assets | | | 280,543 | |
| | | | |
Total assets | | | 2,772,668,375 | |
| | | | |
| |
Liabilities | | | | |
Payable for Fund shares redeemed | | | 7,835,321 | |
Premiums received on credit default swap transactions | | | 4,004,464 | |
Dividends payable | | | 1,320,001 | |
Unrealized losses on credit default swap transactions | | | 865,189 | |
Management fee payable | | | 813,501 | |
Administration fees payable | | | 291,804 | |
Distribution fee payable | | | 94,919 | |
Trustees’ fees and expenses payable | | | 2,296 | |
Accrued expenses and other liabilities | | | 407,108 | |
| | | | |
Total liabilities | | | 15,634,603 | |
| | | | |
Total net assets | | $ | 2,757,033,772 | |
| | | | |
| |
NET ASSETS CONSIST OF | | | | |
Paid-in capital | | $ | 2,645,555,255 | |
Undistributed net investment income | | | 39,439 | |
Accumulated net realized losses on investments | | | (5,490,642 | ) |
Net unrealized gains on investments | | | 116,929,720 | |
| | | | |
Total net assets | | $ | 2,757,033,772 | |
| | | | |
| |
COMPUTATION OF NET ASSET VALUE AND OFFERING PRICE PER SHARE | | | | |
Net assets – Class A | | $ | 1,235,748,525 | |
Shares outstanding – Class A1 | | | 119,683,608 | |
Net asset value per share – Class A | | | $10.33 | |
Maximum offering price per share – Class A2 | | | $10.82 | |
Net assets – Class C | | $ | 144,040,204 | |
Shares outstanding – Class C1 | | | 13,953,867 | |
Net asset value per share – Class C | | | $10.32 | |
Net assets – Administrator Class | | $ | 104,993,998 | |
Shares outstanding – Administrator Class1 | | | 10,166,378 | |
Net asset value per share – Administrator Class | | | $10.33 | |
Net assets – Institutional Class | | $ | 1,272,251,045 | |
Shares outstanding – Institutional Class1 | | | 123,228,629 | |
Net asset value per share – Institutional Class | | | $10.32 | |
| 1 | The Fund has an unlimited number of authorized shares. |
| 2 | Maximum offering price is computed as 100/95.50 of net asset value. On investments of $50,000 or more, the offering price is reduced. |
The accompanying notes are an integral part of these financial statements.
| | | | |
| 32 | | Wells Fargo Municipal Bond Fund | | Statement of operations—six months ended December 31, 2017 (unaudited) |
| | | | |
| | | | |
| |
Investment income | | | | |
Interest | | $ | 50,849,220 | |
Income from affiliated securities | | | 101,068 | |
| | | | |
Total investment income | | | 50,950,288 | |
| | | | |
| |
Expenses | | | | |
Management fee | | | 4,936,621 | |
Administration fees | |
Class A | | | 1,003,983 | |
Class C | | | 117,009 | |
Administrator Class | | | 53,415 | |
Institutional Class | | | 482,169 | |
Shareholder servicing fees | |
Class A | | | 1,568,723 | |
Class C | | | 182,827 | |
Administrator Class | | | 132,232 | |
Distribution fee | |
Class C | | | 548,481 | |
Custody and accounting fees | | | 18,375 | |
Professional fees | | | 46,617 | |
Registration fees | | | 77,393 | |
Shareholder report expenses | | | 92,235 | |
Trustees’ fees and expenses | | | 10,250 | |
Other fees and expenses | | | 19,228 | |
| | | | |
Total expenses | | | 9,289,558 | |
Less: Fee waivers and/or expense reimbursements | | | (372,744 | ) |
| | | | |
Net expenses | | | 8,916,814 | |
| | | | |
Net investment income | | | 42,033,474 | |
| | | | |
| |
REALIZED AND UNREALIZED GAINS (LOSSES) ON INVESTMENTS | | | | |
|
Net realized gains on: | |
Unaffiliated securities | | | 7,896,000 | |
Affiliated securities | | | 8,575 | |
Credit default swap transactions | | | 424,898 | |
| | | | |
Net realized gains on investments | | | 8,329,473 | |
| | | | |
|
Net change in unrealized gains (losses) on: | |
Unaffiliated securities | | | 18,981,517 | |
Affiiliated securities | | | 525 | |
Credit default swap transactions | | | (865,189 | ) |
| | | | |
Net change in unrealized gains (losses) on investments | | | 18,116,853 | |
| | | | |
Net realized and unrealized gains (losses) on investments | | | 26,446,326 | |
| | | | |
Net increase in net assets resulting from operations | | $ | 68,479,800 | |
| | | | |
The accompanying notes are an integral part of these financial statements.
| | | | | | |
| Statement of changes in net assets | | Wells Fargo Municipal Bond Fund | | | 33 | |
| | | | | | | | | | | | | | | | |
| | | Six months ended
December 31, 2017
(unaudited) | | | Year ended
June 30, 2017 | |
| | | | |
Operations | | | | | | | | | | | | | | | | |
Net investment income | | | | | | $ | 42,033,474 | | | | | | | $ | 88,262,849 | |
Net realized gains on investments | | | | | | | 8,329,473 | | | | | | | | 3,961,075 | |
Net change in unrealized gains (losses) on investments | | | | | | | 18,116,853 | | | | | | | | (112,601,384 | ) |
| | | | |
Net increase (decrease) in net assets resulting from operations | | | | | | | 68,479,800 | | | | | | | | (20,377,460 | ) |
| | | | |
| | | | |
Distributions to shareholders from | | | | | | | | | | | | | | | | |
Net investment income | | | | | | | | | | | | | | | | |
Class A | | | | | | | (18,719,000 | ) | | | | | | | (43,248,647 | ) |
Class B | | | | | | | N/A | | | | | | | | (3,436 | )1 |
Class C | | | | | | | (1,633,935 | ) | | | | | | | (4,034,053 | ) |
Administrator Class | | | | | | | (1,673,469 | ) | | | | | | | (5,728,138 | ) |
Institutional Class | | | | | | | (19,714,953 | ) | | | | | | | (35,247,474 | ) |
Net realized gains | | | | | | | | | | | | | | | | |
Class A | | | | | | | (2,915,720 | ) | | | | | | | (9,299,842 | ) |
Class C | | | | | | | (340,495 | ) | | | | | | | (1,129,371 | ) |
Administrator Class | | | | | | | (247,992 | ) | | | | | | | (962,759 | ) |
Institutional Class | | | | | | | (3,001,950 | ) | | | | | | | (6,674,052 | ) |
| | | | |
Total distributions to shareholders | | | | | | | (48,247,514 | ) | | | | | | | (106,327,772 | ) |
| | | | |
| | | | |
Capital share transactions | | | Shares | | | | | | | | Shares | | | | | |
Proceeds from shares sold | | | | | | | | | | | | | | | | |
Class A | | | 5,194,562 | | | | 53,678,146 | | | | 10,866,465 | | | | 111,869,640 | |
Class C | | | 724,609 | | | | 7,495,544 | | | | 1,653,065 | | | | 17,117,595 | |
Administrator Class | | | 667,034 | | | | 6,896,030 | | | | 3,235,894 | | | | 33,803,444 | |
Institutional Class | | | 23,544,776 | | | | 243,473,495 | | | | 68,962,982 | | | | 706,157,623 | |
| | | | |
| | | | | | | 311,543,215 | | | | | | | | 868,948,302 | |
| | | | |
Reinvestment of distributions | | | | | | | | | | | | | | | | |
Class A | | | 1,832,233 | | | | 18,925,252 | | | | 4,549,098 | | | | 46,674,757 | |
Class B | | | N/A | | | | N/A | | | | 313 | 1 | | | 3,298 | 1 |
Class C | | | 169,797 | | | | 1,753,319 | | | | 428,572 | | | | 4,390,538 | |
Administrator Class | | | 172,310 | | | | 1,780,314 | | | | 621,625 | | | | 6,416,038 | |
Institutional Class | | | 1,795,696 | | | | 18,547,328 | | | | 3,251,165 | | | | 33,336,568 | |
| | | | |
| | | | | | | 41,006,213 | | | | | | | | 90,821,199 | |
| | | | |
Payment for shares redeemed | | | | | | | | | | | | | | | | |
Class A | | | (8,787,420 | ) | | | (90,801,322 | ) | | | (36,991,871 | ) | | | (378,880,736 | ) |
Class B | | | N/A | | | | N/A | | | | (43,090 | )1 | | | (440,256 | )1 |
Class C | | | (1,481,505 | ) | | | (15,305,578 | ) | | | (4,936,233 | ) | | | (50,649,505 | ) |
Administrator Class | | | (1,281,427 | ) | | | (13,243,496 | ) | | | (18,507,320 | ) | | | (190,368,235 | ) |
Institutional Class | | | (14,355,082 | ) | | | (148,234,339 | ) | | | (49,843,393 | ) | | | (508,859,565 | ) |
| | | | |
| | | | | | | (267,584,735 | ) | | | | | | | (1,129,198,297 | ) |
| | | | |
Net increase (decrease) in net assets resulting from capital share transactions | | | | | | | 84,964,693 | | | | | | | | (169,428,796 | ) |
| | | | |
Total increase (decrease) in net assets | | | | | | | 105,196,979 | | | | | | | | (296,134,028 | ) |
| | | | |
| | | | |
Net assets | | | | | | | | | | | | | | | | |
Beginning of period | | | | | | | 2,651,836,793 | | | | | | | | 2,947,970,821 | |
| | | | |
End of period | | | | | | $ | 2,757,033,772 | | | | | | | $ | 2,651,836,793 | |
| | | | |
Undistributed (overdistributed) net investment income | | | | | | $ | 39,439 | | | | | | | $ | (252,678 | ) |
| | | | |
| 1 | For the period from July 1, 2016 to December 5, 2016. Effective at the close of business on December 5, 2016, Class B shares were converted to Class A shares and are no longer offered by the Fund. |
The accompanying notes are an integral part of these financial statements.
| | | | |
| 34 | | Wells Fargo Municipal Bond Fund | | Financial highlights |
(For a share outstanding throughout each period)
| | | | | | | | | | | | | | | | | | | | | | | | |
| | | Six months ended
December 31, 2017 (unaudited) | | | Year ended June 30 | |
| CLASS A | | | 2017 | | | 2016 | | | 2015 | | | 2014 | | | 2013 | |
Net asset value, beginning of period | | | $10.25 | | | | $10.70 | | | | $10.25 | | | | $10.33 | | | | $10.00 | | | | $10.24 | |
Net investment income | | | 0.15 | 1 | | | 0.33 | | | | 0.31 | | | | 0.28 | | | | 0.33 | | | | 0.27 | |
Net realized and unrealized gains (losses) on investments | | | 0.10 | | | | (0.38 | ) | | | 0.50 | | | | 0.01 | | | | 0.40 | | | | (0.08 | ) |
| | | | | | | | | | | | | | | | | | | | | | | | |
Total from investment operations | | | 0.25 | | | | (0.05 | ) | | | 0.81 | | | | 0.29 | | | | 0.73 | | | | 0.19 | |
Distributions to shareholders from | | | | | | | | | | | | | | | | | | | | | | | | |
Net investment income | | | (0.15 | ) | | | (0.33 | ) | | | (0.31 | ) | | | (0.28 | ) | | | (0.33 | ) | | | (0.27 | ) |
Net realized gains | | | (0.02 | ) | | | (0.07 | ) | | | (0.05 | ) | | | (0.09 | ) | | | (0.07 | ) | | | (0.16 | ) |
| | | | | | | | | | | | | | | | | | | | | | | | |
Total distributions to shareholders | | | (0.17 | ) | | | (0.40 | ) | | | (0.36 | ) | | | (0.37 | ) | | | (0.40 | ) | | | (0.43 | ) |
Net asset value, end of period | | | $10.33 | | | | $10.25 | | | | $10.70 | | | | $10.25 | | | | $10.33 | | | | $10.00 | |
Total return2 | | | 2.45 | % | | | (0.47 | )% | | | 8.04 | % | | | 2.81 | % | | | 7.60 | % | | | 1.70 | % |
Ratios to average net assets (annualized) | | | | | | | | | | | | | | | | | | | | | | | | |
Gross expenses | | | 0.79 | % | | | 0.79 | %3 | | | 0.79 | %3 | | | 0.80 | %3 | | | 0.80 | %3 | | | 0.80 | %3 |
Net expenses | | | 0.75 | % | | | 0.75 | %3 | | | 0.75 | %3 | | | 0.75 | %3 | | | 0.76 | %3 | | | 0.75 | %3 |
Net investment income | | | 3.00 | % | | | 3.13 | %3 | | | 2.99 | %3 | | | 2.71 | %3 | | | 3.36 | %3 | | | 2.56 | %3 |
Supplemental data | | | | | | | | | | | | | | | | | | | | | | | | |
Portfolio turnover rate | | | 8 | % | | | 24 | % | | | 16 | % | | | 27 | % | | | 37 | % | | | 54 | % |
Net assets, end of period (000s omitted) | | | $1,235,749 | | | | $1,244,267 | | | | $1,529,884 | | | | $1,612,212 | | | | $1,661,362 | | | | $1,807,790 | |
| 1 | Calculated based upon average shares outstanding |
| 2 | Total return calculations do not include any sales charges. Returns for periods of less than one year are not annualized. |
| 3 | Ratios include interest and fee expense relating to inverse floating-rate obligations as follows: |
| | | | |
Six months ended June 30, 2017 (unaudited) | | | 0.00 | % |
Year ended June 30, 2016 | | | 0.00 | % |
Year ended June 30, 2015 | | | 0.00 | % |
Year ended June 30, 2014 | | | 0.01 | % |
Year ended June 30, 2013 | | | 0.00 | % |
The accompanying notes are an integral part of these financial statements.
| | | | | | |
| Financial highlights | | Wells Fargo Municipal Bond Fund | | | 35 | |
(For a share outstanding throughout each period)
| | | | | | | | | | | | | | | | | | | | | | | | |
| | | Six months ended
December 31, 2017 (unaudited) | | | Year ended June 30 | |
| CLASS C | | | 2017 | | | 2016 | | | 2015 | | | 2014 | | | 2013 | |
Net asset value, beginning of period | | | $10.24 | | | | $10.69 | | | | $10.25 | | | | $10.33 | | | | $10.00 | | | | $10.23 | |
Net investment income | | | 0.12 | | | | 0.25 | | | | 0.23 | | | | 0.20 | | | | 0.26 | | | | 0.19 | |
Net realized and unrealized gains (losses) on investments | | | 0.10 | | | | (0.38 | ) | | | 0.49 | | | | 0.01 | | | | 0.40 | | | | (0.07 | ) |
| | | | | | | | | | | | | | | | | | | | | | | | |
Total from investment operations | | | 0.22 | | | | (0.13 | ) | | | 0.72 | | | | 0.21 | | | | 0.66 | | | | 0.12 | |
Distributions to shareholders from | | | | | | | | | | | | | | | | | | | | | | | | |
Net investment income | | | (0.12 | ) | | | (0.25 | ) | | | (0.23 | ) | | | (0.20 | ) | | | (0.26 | ) | | | (0.19 | ) |
Net realized gains | | | (0.02 | ) | | | (0.07 | ) | | | (0.05 | ) | | | (0.09 | ) | | | (0.07 | ) | | | (0.16 | ) |
| | | | | | | | | | | | | | | | | | | | | | | | |
Total distributions to shareholders | | | (0.14 | ) | | | (0.32 | ) | | | (0.28 | ) | | | (0.29 | ) | | | (0.33 | ) | | | (0.35 | ) |
Net asset value, end of period | | | $10.32 | | | | $10.24 | | | | $10.69 | | | | $10.25 | | | | $10.33 | | | | $10.00 | |
Total return1 | | | 2.16 | % | | | (1.21 | )% | | | 7.14 | % | | | 2.05 | % | | | 6.80 | % | | | 1.04 | % |
Ratios to average net assets (annualized) | | | | | | | | | | | | | | | | | | | | | | | | |
Gross expenses | | | 1.54 | % | | | 1.54 | %2 | | | 1.54 | %2 | | | 1.55 | %2 | | | 1.55 | %2 | | | 1.55 | %2 |
Net expenses | | | 1.50 | % | | | 1.50 | %2 | | | 1.50 | %2 | | | 1.50 | %2 | | | 1.51 | %2 | | | 1.50 | %2 |
Net investment income | | | 2.26 | % | | | 2.38 | %2 | | | 2.24 | %2 | | | 1.97 | %2 | | | 2.60 | %2 | | | 1.82 | %2 |
Supplemental data | | | | | | | | | | | | | | | | | | | | | | | | |
Portfolio turnover rate | | | 8 | % | | | 24 | % | | | 16 | % | | | 27 | % | | | 37 | % | | | 54 | % |
Net assets, end of period (000s omitted) | | | $144,040 | | | | $148,944 | | | | $186,036 | | | | $164,703 | | | | $154,863 | | | | $168,658 | |
| 1 | Total return calculations do not include any sales charges. Returns for periods of less than one year are not annualized. |
| 2 | Ratios include interest and fee expense relating to inverse floating-rate obligations as follows: |
| | | | |
Six months ended June 30, 2017 (unaudited) | | | 0.00 | % |
Year ended June 30, 2016 | | | 0.00 | % |
Year ended June 30, 2015 | | | 0.00 | % |
Year ended June 30, 2014 | | | 0.01 | % |
Year ended June 30, 2013 | | | 0.00 | % |
The accompanying notes are an integral part of these financial statements.
| | | | |
| 36 | | Wells Fargo Municipal Bond Fund | | Financial highlights |
(For a share outstanding throughout each period)
| | | | | | | | | | | | | | | | | | | | | | | | |
| | | Six months ended
December 31, 2017 (unaudited) | | | Year ended June 30 | |
| ADMINISTRATOR CLASS | | | 2017 | | | 2016 | | | 2015 | | | 2014 | | | 2013 | |
Net asset value, beginning of period | | | $10.25 | | | | $10.70 | | | | $10.26 | | | | $10.34 | | | | $10.01 | | | | $10.24 | |
Net investment income | | | 0.16 | | | | 0.34 | | | | 0.33 | | | | 0.30 | | | | 0.35 | | | | 0.28 | |
Net realized and unrealized gains (losses) on investments | | | 0.10 | | | | (0.38 | ) | | | 0.49 | | | | 0.01 | | | | 0.40 | | | | (0.07 | ) |
| | | | | | | | | | | | | | | | | | | | | | | | |
Total from investment operations | | | 0.26 | | | | (0.04 | ) | | | 0.82 | | | | 0.31 | | | | 0.75 | | | | 0.21 | |
Distributions to shareholders from | | | | | | | | | | | | | | | | | | | | | | | | |
Net investment income | | | (0.16 | ) | | | (0.34 | ) | | | (0.33 | ) | | | (0.30 | ) | | | (0.35 | ) | | | (0.28 | ) |
Net realized gains | | | (0.02 | ) | | | (0.07 | ) | | | (0.05 | ) | | | (0.09 | ) | | | (0.07 | ) | | | (0.16 | ) |
| | | | | | | | | | | | | | | | | | | | | | | | |
Total distributions to shareholders | | | (0.18 | ) | | | (0.41 | ) | | | (0.38 | ) | | | (0.39 | ) | | | (0.42 | ) | | | (0.44 | ) |
Net asset value, end of period | | | $10.33 | | | | $10.25 | | | | $10.70 | | | | $10.26 | | | | $10.34 | | | | $10.01 | |
Total return1 | | | 2.62 | % | | | (0.32 | )% | | | 8.10 | % | | | 2.97 | % | | | 7.75 | % | | | 1.96 | % |
Ratios to average net assets (annualized) | | | | | | | | | | | | | | | | | | | | | | | | |
Gross expenses | | | 0.73 | % | | | 0.73 | %2 | | | 0.73 | %2 | | | 0.73 | %2 | | | 0.74 | %2 | | | 0.74 | %2 |
Net expenses | | | 0.60 | % | | | 0.60 | %2 | | | 0.60 | %2 | | | 0.60 | %2 | | | 0.61 | %2 | | | 0.60 | %2 |
Net investment income | | | 3.15 | % | | | 3.18 | %2 | | | 3.15 | %2 | | | 2.86 | %2 | | | 3.49 | %2 | | | 2.72 | %2 |
Supplemental data | | | | | | | | | | | | | | | | | | | | | | | | |
Portfolio turnover rate | | | 8 | % | | | 24 | % | | | 16 | % | | | 27 | % | | | 37 | % | | | 54 | % |
Net assets, end of period (000s omitted) | | | $104,994 | | | | $108,715 | | | | $270,304 | | | | $384,884 | | | | $362,896 | | | | $451,005 | |
| 1 | Returns for periods of less than one year are not annualized. |
| 2 | Ratios include interest and fee expense relating to inverse floating-rate obligations as follows: |
| | | | |
Six months ended June 30, 2017 (unaudited) | | | 0.00 | % |
Year ended June 30, 2016 | | | 0.00 | % |
Year ended June 30, 2015 | | | 0.00 | % |
Year ended June 30, 2014 | | | 0.01 | % |
Year ended June 30, 2013 | | | 0.00 | % |
The accompanying notes are an integral part of these financial statements.
| | | | | | |
| Financial highlights | | Wells Fargo Municipal Bond Fund | | | 37 | |
(For a share outstanding throughout each period)
| | | | | | | | | | | | | | | | | | | | | | | | |
| | | Six months ended
December 31, 2017 (unaudited) | | | Year ended June 30 | |
| INSTITUTIONAL CLASS | | | 2017 | | | 2016 | | | 2015 | | | 2014 | | | 2013 | |
Net asset value, beginning of period | | | $10.24 | | | | $10.70 | | | | $10.25 | | | | $10.33 | | | | $10.00 | | | | $10.24 | |
Net investment income | | | 0.17 | | | | 0.36 | | | | 0.34 | | | | 0.31 | | | | 0.36 | | | | 0.30 | |
Net realized and unrealized gains (losses) on investments | | | 0.10 | | | | (0.39 | ) | | | 0.50 | | | | 0.01 | | | | 0.40 | | | | (0.08 | ) |
| | | | | | | | | | | | | | | | | | | | | | | | |
Total from investment operations | | | 0.27 | | | | (0.03 | ) | | | 0.84 | | | | 0.32 | | | | 0.76 | | | | 0.22 | |
Distributions to shareholders from | | | | | | | | | | | | | | | | | | | | | | | | |
Net investment income | | | (0.17 | ) | | | (0.36 | ) | | | (0.34 | ) | | | (0.31 | ) | | | (0.36 | ) | | | (0.30 | ) |
Net realized gains | | | (0.02 | ) | | | (0.07 | ) | | | (0.05 | ) | | | (0.09 | ) | | | (0.07 | ) | | | (0.16 | ) |
| | | | | | | | | | | | | | | | | | | | | | | | |
Total distributions to shareholders | | | (0.19 | ) | | | (0.43 | ) | | | (0.39 | ) | | | (0.40 | ) | | | (0.43 | ) | | | (0.46 | ) |
Net asset value, end of period | | | $10.32 | | | | $10.24 | | | | $10.70 | | | | $10.25 | | | | $10.33 | | | | $10.00 | |
Total return1 | | | 2.70 | % | | | (0.28 | )% | | | 8.35 | % | | | 3.11 | % | | | 7.90 | % | | | 2.00 | % |
Ratios to average net assets (annualized) | | | | | | | | | | | | | | | | | | | | | | | | |
Gross expenses | | | 0.46 | % | | | 0.46 | %2 | | | 0.46 | %2 | | | 0.47 | %2 | | | 0.47 | %2 | | | 0.47 | %2 |
Net expenses | | | 0.46 | % | | | 0.46 | %2 | | | 0.46 | %2 | | | 0.47 | %2 | | | 0.47 | %2 | | | 0.47 | %2 |
Net investment income | | | 3.29 | % | | | 3.44 | %2 | | | 3.27 | %2 | | | 3.02 | %2 | | | 3.58 | %2 | | | 2.85 | %2 |
Supplemental data | | | | | | | | | | | | | | | | | | | | | | | | |
Portfolio turnover rate | | | 8 | % | | | 24 | % | | | 16 | % | | | 27 | % | | | 37 | % | | | 54 | % |
Net assets, end of period (000s omitted) | | | $1,272,251 | | | | $1,149,911 | | | | $961,289 | | | | $523,736 | | | | $255,112 | | | | $143,062 | |
| 1 | Returns for periods of less than one year are not annualized. |
| 2 | Ratios include interest and fee expense relating to inverse floating-rate obligations as follows: |
| | | | |
Six months ended June 30, 2017 (unaudited) | | | 0.00 | % |
Year ended June 30, 2016 | | | 0.00 | % |
Year ended June 30, 2015 | | | 0.00 | % |
Year ended June 30, 2014 | | | 0.01 | % |
Year ended June 30, 2013 | | | 0.00 | % |
The accompanying notes are an integral part of these financial statements.
| | | | |
| 38 | | Wells Fargo Municipal Bond Fund | | Notes to financial statements (unaudited) |
1. ORGANIZATION
Wells Fargo Funds Trust (the “Trust”), a Delaware statutory trust organized on March 10, 1999, is an open-end management investment company registered under the Investment Company Act of 1940, as amended (the “1940 Act”). As an investment company, the Trust follows the accounting and reporting guidance in Financial Accounting Standards Board Accounting Standards Codification Topic 946, Financial Services – Investment Companies. These financial statements report on the Wells Fargo Municipal Bond Fund (the “Fund”) which is a diversified series of the Trust.
Effective at the close of business on December 5, 2016, Class B shares were converted to Class A shares and are no longer offered by the Fund. Information for Class B shares reflected in the financial statements represents activity through December 5, 2016.
2. SIGNIFICANT ACCOUNTING POLICIES
The following significant accounting policies, which are consistently followed in the preparation of the financial statements of the Fund, are in conformity with U.S. generally accepted accounting principles which require management to make estimates and assumptions that affect the reported amounts of assets and liabilities, disclosure of contingent assets and liabilities at the date of the financial statements, and the reported amounts of revenues and expenses during the reporting period. Actual results could differ from those estimates.
Securities valuation
All investments are valued each business day as of the close of regular trading on the New York Stock Exchange (generally 4 p.m. Eastern Time), although the Fund may deviate from this calculation time under unusual or unexpected circumstances.
Debt securities are valued at the evaluated bid price provided by an independent pricing service or, if a reliable price is not available, the quoted bid price from an independent broker-dealer.
Futures that are listed on a foreign or domestic exchange or market are valued at the official closing price or, if none, the last sales price.
Swaps are valued at the evaluated price provided by an independent pricing service or, if a reliable price is not available, the quoted bid price from an independent broker-dealer.
Investments in registered open-end investment companies are valued at net asset value.
Investments which are not valued using any of the methods discussed above are valued at their fair value, as determined in good faith by the Board of Trustees of the Fund. The Board of Trustees has established a Valuation Committee comprised of the Trustees and has delegated to it the authority to take any actions regarding the valuation of portfolio securities that the Valuation Committee deems necessary or appropriate, including determining the fair value of portfolio securities, unless the determination has been delegated to the Management Valuation Team of Wells Fargo Funds Management, LLC (“Funds Management”). The Board of Trustees retains the authority to make or ratify any valuation decisions or approve any changes to the Valuation Procedures as it deems appropriate. On a quarterly basis, the Board of Trustees receives reports on any valuation actions taken by the Valuation Committee or the Management Valuation Team which may include items for ratification.
Valuations of fair valued securities are compared to the next actual sales price when available, or other appropriate market values, to assess the continued appropriateness of the fair valuation methodologies used. These securities are fair valued on a day-to-day basis, taking into consideration changes to appropriate market information and any significant changes to the inputs considered in the valuation process until there is a readily available price provided on an exchange or by an independent pricing service. Valuations received from an independent pricing service or independent broker-dealer quotes are periodically validated by comparisons to most recent trades and valuations provided by other independent pricing services in addition to the review of prices by the manager and/or subadviser. Unobservable inputs used in determining fair valuations are identified based on the type of security, taking into consideration factors utilized by market participants in valuing the investment, knowledge about the issuer and the current market environment.
When-issued transactions
The Fund may purchase securities on a forward commitment or when-issued basis. The Fund records a when-issued transaction on the trade date and will segregate assets in an amount at least equal in value to the Fund’s commitment to purchase when-issued securities. Securities purchased on a when-issued basis are marked-to-market daily and the Fund begins earning interest on the settlement date. Losses may arise due to changes in the market value of the underlying securities or if the counterparty does not perform under the contract.
| | | | | | |
| Notes to financial statements (unaudited) | | Wells Fargo Municipal Bond Fund | | | 39 | |
Futures contracts
The Fund is subject to interest rate risk in the normal course of pursuing its investment objectives. The Fund may buy and sell futures contracts in order to gain exposure to, or protect against, changes in interest rates. The primary risks associated with the use of futures contracts are the imperfect correlation between changes in market values of securities held by the Fund and the prices of futures contracts, and the possibility of an illiquid market.
The aggregate principal amounts of the contracts are not recorded in the financial statements. Fluctuations in the value of the contracts are recorded in the Statement of Assets and Liabilities as an asset or liability and in the Statement of Operations as unrealized gains or losses until the contracts are closed, at which point they are recorded as net realized gains or losses on futures contracts. With futures contracts, there is minimal counterparty risk to the Fund since futures are exchange traded and the exchange’s clearinghouse, as counterparty to all exchange traded futures, guarantees the futures against default.
Inverse floating-rate obligations
The Fund may participate in inverse floating-rate obligation (“Inverse Floater”) structures whereby a fixed-rate bond (“Fixed-Rate Bond”) purchased by the Fund is transferred to a tender option bond trust (“TOB Trust”). The TOB Trust issues floating-rate notes (“Floating-Rate Notes”) to third-parties, which are collateralized by the Fixed-Rate Bond, and the Fund buys a residual interest in the TOB Trust’s assets and cash flows. The Inverse Floater held by the Fund gives the Fund the right (1) to cause the holders of the Floating-Rate Notes to tender their notes at par, and (2) to have the Fixed-Rate Bond held by the TOB Trust transferred back to the Fund, thereby collapsing the TOB Trust. The Fund accounts for the transaction described above as a secured borrowing by including the Fixed-Rate Bond in its Portfolio of Investments, and by recording the Floating-Rate Notes as a liability in the Statement of Assets and Liabilities. The Fund also records the interest paid on Floating-Rate Notes as interest expense. The Floating-Rate Notes have interest rates that generally reset weekly and their holders have the option to tender their notes for redemption at par at each reset date. Inverse Floaters held by the Fund are securities exempt from registration under Rule 144A of the Securities Act of 1933, as amended.
Credit default swaps
The Fund is subject to credit risk in the normal course of pursuing its investment objectives. The Fund may enter into credit default swap contracts for hedging or speculative purposes to provide or receive a measure of protection against default on a referenced entity, obligation or index or for investment gains. Credit default swaps involve an exchange of a stream of payments for protection against the loss in value of an underlying security or index. Under the terms of the swap, one party acts as a guarantor (referred to as the seller of protection) and receives a periodic stream of payments, provided that there is no credit event, from another party (referred to as the buyer of protection) that is a fixed percentage applied to a notional principal amount over the term of the swap. An index credit default swap references all the names in the index, and if a credit event is triggered, the credit event is settled based on that name’s weight in the index. A credit event includes bankruptcy, failure to pay, obligation default, obligation acceleration, repudiation/moratorium, and restructuring. The Fund may enter into credit default swaps as either the seller of protection or the buyer of protection. As the seller of protection, the Fund is subject to investment exposure on the notional amount of the swap and has assumed the risk of default of the underlying security or index. As the buyer of protection, the Fund could be exposed to risks if the seller of the protection defaults on its obligation to perform, or if there are unfavorable changes in the fluctuation of interest rates. The maximum potential amount of future payments (undiscounted) that the Fund as the seller of protection could be required to make under the credit default swap contract would be an amount equal to the notional amount of the swap contract. The Fund’s maximum risk of loss from counterparty risk, either as the protection seller or as the protection buyer, is the fair value of the contract. This risk is mitigated by having a master netting arrangement between the Fund and the counterparty and by having the counterparty post collateral to cover the Fund’s exposure to the counterparty.
If the Fund is the seller of protection and a credit event occurs, as defined under the terms of that particular swap agreement, the Fund will pay to the buyer of protection the notional amount of the swap and take delivery of the referenced obligation or underlying securities comprising the referenced index. If the Fund is the buyer of protection and a credit event occurs, as defined under the terms of that particular swap agreement, the Fund will receive from the seller of protection the notional amount of the swap and deliver the referenced obligation or underlying securities comprising the referenced index.
Any premiums paid or received on the transactions are recorded as an asset or liability on the Statement of Assets and Liabilities and amortized. The value of the swap contract is marked-to-market daily based on quotations from an independent pricing service or an independent broker-dealer and any change in value is recorded as an unrealized gain
| | | | |
| 40 | | Wells Fargo Municipal Bond Fund | | Notes to financial statements (unaudited) |
or loss. Periodic payments made or received are recorded as realized gains or losses. In addition, payments received or made as a result of a credit event or termination of the contract are recognized as realized gains or losses.
Certain credit default swap contracts entered into by the Fund provide for conditions that result in events of default or termination that enable the counterparty to the agreement to cause an early termination of the transactions under those agreements.
Security transactions and income recognition
Securities transactions are recorded on a trade date basis. Realized gains or losses are recorded on the basis of identified cost.
Interest income is accrued daily and bond discounts are accreted and premiums are amortized daily based on the effective interest method. To the extent debt obligations are placed on non-accrual status, any related interest income may be reduced by writing off interest receivables when the collection of all or a portion of interest has been determined to be doubtful based on consistently applied procedures and the fair value has decreased. If the issuer subsequently resumes interest payments or when the collectability of interest is reasonably assured, the debt obligation is removed from non-accrual status.
Distributions to shareholders
Distributions to shareholders from net investment income are accrued daily and paid monthly. Distributions from net realized gains, if any, are recorded on the ex-dividend date. Such distributions are determined in accordance with income tax regulations and may differ from U.S. generally accepted accounting principles. Dividend sources are estimated at the time of declaration. The tax character of distributions is determined as of the Fund’s fiscal year end. Therefore, a portion of the Fund’s distributions made prior to the Fund’s fiscal year end may be categorized as a tax return of capital.
Federal and other taxes
The Fund intends to continue to qualify as a regulated investment company by distributing substantially all of its investment company taxable and tax-exempt income and any net realized capital gains (after reduction for capital loss carryforwards) sufficient to relieve it from all, or substantially all, federal income taxes. Accordingly, no provision for federal income taxes was required.
The Fund’s income and federal excise tax returns and all financial records supporting those returns for the prior three fiscal years are subject to examination by the federal and Delaware revenue authorities. Management has analyzed the Fund’s tax positions taken on federal, state, and foreign tax returns for all open tax years and does not believe that there are any uncertain tax positions that require recognition of a tax liability.
As of December 31, 2017, the aggregate cost of all investments for federal income tax purposes was $2,613,083,484 and the unrealized gains (losses) consisted of:
| | | | |
Gross unrealized gains | | $ | 142,889,088 | |
Gross unrealized losses | | | (26,014,990 | ) |
Net unrealized gains | | $ | 116,874,098 | |
As of June 30, 2017, the Fund had capital loss carryforwards available to offset future net realized capital gains in the amount of $6,054,673 with $5,924,646 expiring in 2018 and $130,027 expiring in 2019.
As of June 30, 2017, the Fund had current year net deferred post-October capital losses consisting of $544,781 in short-term losses which were recognized on the first day of the current fiscal year.
Class allocations
The separate classes of shares offered by the Fund differ principally in applicable sales charges, distribution, shareholder servicing, and administration fees. Class specific expenses are charged directly to that share class. Investment income, common expenses, and realized and unrealized gains (losses) on investments are allocated daily to each class of shares based on the relative proportion of net assets of each class.
3. FAIR VALUATION MEASUREMENTS
Fair value measurements of investments are determined within a framework that has established a fair value hierarchy based upon the various data inputs utilized in determining the value of the Fund’s investments. The three-level hierarchy gives the highest priority to unadjusted quoted prices in active markets for identical assets or liabilities (Level 1) and the
| | | | | | |
| Notes to financial statements (unaudited) | | Wells Fargo Municipal Bond Fund | | | 41 | |
lowest priority to unobservable inputs (Level 3). The Fund’s investments are classified within the fair value hierarchy based on the lowest level of input that is significant to the fair value measurement. The inputs are summarized into three broad levels as follows:
| ∎ | | Level 1 – quoted prices in active markets for identical securities |
| ∎ | | Level 2 – other significant observable inputs (including quoted prices for similar securities, interest rates, prepayment speeds, credit risk, etc.) |
| ∎ | | Level 3 – significant unobservable inputs (including the Fund’s own assumptions in determining the fair value of investments) |
The inputs or methodologies used for valuing investments in securities are not necessarily an indication of the risk associated with investing in those securities.
The following is a summary of the inputs used in valuing the Fund’s assets and liabilities as of December 31, 2017:
| | | | | | | | | | | | | | | | |
| | | Quoted prices
(Level 1) | | | Other significant
observable inputs
(Level 2) | | | Significant
unobservable inputs (Level 3) | | | Total | |
Assets | | | | | | | | | | | | | | | | |
Investments in: | | | | | | | | | | | | | | | | |
| | | | |
Municipal obligations | | $ | 0 | | | | 2,716,398,173 | | | $ | 0 | | | $ | 2,716,398,173 | |
| | | | |
Short-term investments | | | | | | | | | | | | | | | | |
Investment companies | | | 14,424,598 | | | | 0 | | | | 0 | | | | 14,424,598 | |
Total assets | | $ | 14,424,598 | | | $ | 2,716,398,173 | | | $ | 0 | | | $ | 2,730,822,771 | |
Liabilities | | | | | | | | | | | | | | | | |
Credit default swap contracts | | $ | 0 | | | $ | 4,869,653 | | | $ | 0 | | | $ | 4,869,653 | |
Total liabilities | | $ | 0 | | | $ | 4,869,653 | | | $ | 0 | | | $ | 4,869,653 | |
Swap contracts consists of unrealized losses and premiums received on swap contracts, which represents the change in the contract’s value from trade date. All other assets and liabilities are reported at their market value at measurement date.
The Fund recognizes transfers between levels within the fair value hierarchy at the end of the reporting period. At December 31, 2017, the Fund did not have any transfers into/out of Level 1, Level 2, or Level 3.
4. TRANSACTIONS WITH AFFILIATES
Management fee
Funds Management, an indirect wholly owned subsidiary of Wells Fargo & Company (“Wells Fargo”), is the manager of the Fund and provides advisory and fund-level administrative services under an investment management agreement. Under the investment management agreement, Funds Management is responsible for, among other services, implementing the investment objectives and strategies of the Fund, supervising the subadviser, providing fund-level administrative services in connection with the Fund’s operations, and providing any other fund-level administrative services reasonably necessary for the operation of the Fund. As compensation for its services under the investment management agreement, Funds Management is entitled to receive an annual management fee starting at 0.40% and declining to 0.28% as the average daily net assets of the Fund increase. For the six months ended December 31, 2017, the management fee was equivalent to an annual rate of 0.36% of the Fund’s average daily net assets.
Funds Management has retained the services of a subadviser to provide daily portfolio management to the Fund. The fee for subadvisory services is borne by Funds Management. Wells Capital Management Incorporated, an affiliate of Funds Management and an indirect wholly owned subsidiary of Wells Fargo, is the subadviser to the Fund and is entitled to receive a fee from Funds Management at an annual rate starting at 0.20% and declining to 0.10% as the average daily net assets of the Fund increase.
| | | | |
| 42 | | Wells Fargo Municipal Bond Fund | | Notes to financial statements (unaudited) |
Administration fees
Under a class-level administration agreement, Funds Management provides class-level administrative services to the Fund, which includes paying fees and expenses for services provided by the transfer agent, sub-transfer agents, omnibus account servicers and record-keepers. As compensation for its services under the class-level administration agreement, Funds Management receives an annual fee which is calculated based on the average daily net assets of each class as follows:
| | | | |
| | | Class-level
administration fee | |
Class A, Class C | | | 0.16 | % |
Administrator Class | | | 0.10 | |
Institutional Class | | | 0.08 | |
Funds Management has contractually waived and/or reimbursed management and administration fees to the extent necessary to maintain certain net operating expense ratios for the Fund. Waiver of fees and/or reimbursement of expenses by Funds Management were made first from fund level expenses on a proportionate basis and then from class specific expenses. Funds Management has committed through October 31, 2018 to waive fees and/or reimburse expenses to the extent necessary to cap the Fund’s expenses at 0.75% for Class A shares, 1.50% for Class C shares, 0.60% for Administrator Class shares, and 0.48% for Institutional Class shares. After this time, the cap may be increased or the commitment to maintain the cap may be terminated only with the approval of the Board of Trustees.
Distribution fee
The Trust has adopted a distribution plan for Class C shares of the Fund pursuant to Rule 12b-1 under the 1940 Act. A distribution fee is charged to Class C shares and paid to Wells Fargo Funds Distributor, LLC (“Funds Distributor”), the principal underwriter, at an annual rate of 0.75% of the average daily net assets of Class C shares.
In addition, Funds Distributor is entitled to receive the front-end sales charge from the purchase of Class A shares and a contingent deferred sales charge on the redemption of certain Class A shares. Funds Distributor is also entitled to receive the contingent deferred sales charges from redemptions of Class C shares. For the six months ended December 31, 2017, Funds Distributor received $17,661 from the sale of Class A shares. No contingent deferred sales charges were incurred by Class A and Class C shares for the six months ended December 31, 2017.
Shareholder servicing fees
The Trust has entered into contracts with one or more shareholder servicing agents, whereby Class A, Class C, and Administrator Class of the Fund are charged a fee at an annual rate of 0.25% of the average daily net assets of each respective class.
A portion of these total shareholder servicing fees were paid to affiliates of Wells Fargo.
Interfund transactions
The Fund may purchase or sell portfolio investment securities to certain other Wells Fargo affiliates pursuant to Rule 17a-7 under the 1940 Act and under procedures adopted by the Board of Trustees. The procedures have been designed to ensure that these interfund transactions, which do not incur broker commissions, are effected at current market prices. Pursuant to these procedures, the Fund had $117,595,000 and $14,275,000 in interfund purchases and sales, respectively, during the six months ended December 31, 2017.
5. INVESTMENT PORTFOLIO TRANSACTIONS
Purchases and sales of investments, excluding U.S. government obligations (if any) and short-term securities, for the six months ended December 31, 2017 were $531,578,646 and $195,855,116, respectively.
6. DERIVATIVE TRANSACTIONS
During the six months ended December 31, 2017, the Fund enters into credit default swap contracts as a substitute for taking a position in the underlying security or basket of securities or to potentially enhance the Fund’s total return. The Fund had an average notional balance on credit default swaps of $16,597,636 during the six months ended December 31, 2017.
The Fund’s credit default swap may contain provisions for early termination in the event the net assets of the Fund declines below specific levels identified by the counterparty. If these levels are triggered, the counterparty may terminate
| | | | | | |
| Notes to financial statements (unaudited) | | Wells Fargo Municipal Bond Fund | | | 43 | |
the transaction and seek payment or request full collateralization of the derivative transactions in net liability positions. On December 31, 2017, the aggregate fair value of credit defaults swap with net asset contingent features that were in a liability position amounted to $865,189.
The fair value, realized gains or losses and change in unrealized gains or losses, if any, on derivative instruments are reflected in the corresponding financial statement captions.
For certain types of derivative transactions, the Fund has entered into International Swaps and Derivatives Association, Inc. master agreements (“ISDA Master Agreements”) or similar agreements with approved counterparties. The ISDA Master Agreements or similar agreements may have requirements to deliver/deposit securities or cash to/with an exchange or broker-dealer as collateral and allows the Fund to offset, with each counterparty, certain derivative financial instrument’s assets and/or liabilities with collateral held or pledged. Collateral requirements differ by type of derivative. Collateral or margin requirements are set by the broker or exchange clearinghouse for exchange traded derivatives while collateral terms are contract specific for over-the-counter traded derivatives. Cash collateral that has been pledged to cover obligations of the Fund under ISDA Master Agreements or similar agreements, if any, are reported separately in the Statement of Assets and Liabilities. Securities pledged as collateral, if any, are noted in the Portfolio of Investments. With respect to balance sheet offsetting, absent an event of default by the counterparty or a termination of the agreement, the reported amounts of financial assets and financial liabilities in the Statement of Assets and Liabilities are not offset across transactions between the Fund and the applicable counterparty. A reconciliation of the gross amounts on the Statement of Assets and Liabilities to the net amounts by derivative type, including any collateral exposure, is as follows:
| | | | | | | | | | | | |
| Counterparty | | Gross amounts
of liabilities in the
Statement of
Assets and
Liabilities | | Amounts
subject to
netting
agreements | | Collateral
pledged1 | | | Net amount
of liabilities | |
JPMorgan | | $4,869,653 | | $0 | | $ | (4,869,653 | ) | | $ | 0 | |
| | 1 | Collateral pledged within this table is limited to the collateral for the net transaction with the counterparty. | |
7. BANK BORROWINGS
The Trust (excluding the money market funds and certain other funds) and Wells Fargo Variable Trust are parties to a $280,000,000 revolving credit agreement whereby the Fund is permitted to use bank borrowings for temporary or emergency purposes, such as to fund shareholder redemption requests. Interest under the credit agreement is charged to the Fund based on a borrowing rate equal to the higher of the Federal Funds rate in effect on that day plus 1.25% or the overnight LIBOR rate in effect on that day plus 1.25%. In addition, an annual commitment fee equal to 0.25% of the unused balance is allocated to each participating fund. Prior to August 29, 2017, the revolving credit agreement amount was $250,000,000.
For the six months ended December 31, 2017, there were no borrowings by the Fund under the agreement.
8. INDEMNIFICATION
Under the Trust’s organizational documents, the officers and Trustees have been granted certain indemnification rights against certain liabilities that may arise out of performance of their duties to the Trust. Additionally, in the normal course of business, the Trust may enter into contracts with service providers that contain a variety of indemnification clauses. The Trust’s maximum exposure under these arrangements is dependent on future claims that may be made against the Fund and, therefore, cannot be estimated.
| | | | |
| 44 | | Wells Fargo Municipal Bond Fund | | Other information (unaudited) |
PROXY VOTING INFORMATION
A description of the policies and procedures that the Fund uses to determine how to vote proxies relating to portfolio securities is available, upon request, by calling 1-800-222-8222, visiting our website at wellsfargofunds.com, or visiting the SEC website at sec.gov. Information regarding how the Fund voted proxies relating to portfolio securities during the most recent 12-month period ended June 30 is available on the Fund’s website at wellsfargofunds.com or by visiting the SEC website at sec.gov.
PORTFOLIO HOLDINGS INFORMATION
The complete portfolio holdings for the Fund are publicly available monthly on the Fund’s website (wellsfargofunds.com), on a one-month delayed basis. In addition, top ten holdings information (excluding derivative positions) for the Fund is publicly available on the Fund’s website on a monthly, seven-day or more delayed basis. The Fund files its complete schedule of portfolio holdings with the SEC for the first and third quarters of each fiscal year on Form N-Q, which is available by visiting the SEC website at sec.gov. In addition, the Fund’s Form N-Q may be reviewed and copied at the SEC’s Public Reference Room in Washington, DC, and at regional offices in New York City, at 233 Broadway, and in Chicago, at 175 West Jackson Boulevard, Suite 900. Information about the Public Reference Room may be obtained by calling 1-800-SEC-0330.
| | | | | | |
| Other information (unaudited) | | Wells Fargo Municipal Bond Fund | | | 45 | |
BOARD OF TRUSTEES AND OFFICERS
Each of the Trustees and Officers1 listed in the table below acts in identical capacities for each fund in the Wells Fargo family of funds, which consists of 153 mutual funds comprising the Wells Fargo Funds Trust, Wells Fargo Variable Trust, Wells Fargo Master Trust and four closed-end funds (collectively the “Fund Complex”). This table should be read in conjunction with the Prospectus and the Statement of Additional Information2. The mailing address of each Trustee and Officer is 525 Market Street, 12th Floor, San Francisco, CA 94105. Each Trustee and Officer serves an indefinite term, however, each Trustee serves such term until reaching the mandatory retirement age established by the Trustees.
Independent Trustees
| | | | | | |
Name and year of birth | | Position held and length of service* | | Principal occupations during past five years or longer | | Current other public company or
investment company
directorships |
William R. Ebsworth (Born 1957) | | Trustee, since 2015 | | Retired. From 1984 to 2013, equities analyst, portfolio manager, research director and chief investment officer at Fidelity Management and Research Company in Boston, Tokyo, and Hong Kong, and retired in 2013 as Chief Investment Officer of Fidelity Strategic Advisers, Inc. where he led a team of investment professionals managing client assets. Prior thereto, Board member of Hong Kong Securities Clearing Co., Hong Kong Options Clearing Corp., the Thailand International Fund, Ltd., Fidelity Investments Life Insurance Company, and Empire Fidelity Investments Life Insurance Company. Board member of the Forté Foundation (non-profit organization) and the Vincent Memorial Hospital Endowment (non-profit organization), where he serves on the Investment Committee and as a Chair of the Audit Committee. Mr. Ebsworth is a CFA® charterholder. | | Asset Allocation Trust |
Jane A. Freeman** (Born 1953) | | Trustee, since 2015; Chair Liaison, since 2018 | | Retired. From 2012 to 2014 and 1999 to 2008, Chief Financial Officer of Scientific Learning Corporation. From 2008 to 2012, Ms. Freeman provided consulting services related to strategic business projects. Prior to 1999, Portfolio Manager at Rockefeller & Co. and Scudder, Stevens & Clark. Board member of the Harding Loevner Funds from 1996 to 2014, serving as both Lead Independent Director and chair of the Audit Committee. Board member of the Russell Exchange Traded Funds Trust from 2011 to 2012 and the chair of the Audit Committee. Ms. Freeman is a Board Member of Ruth Bancroft Garden (non-profit organization) and the Glimmerglass Festival. She is also an inactive Chartered Financial Analyst. | | Asset Allocation Trust |
Peter G. Gordon*** (Born 1942) | | Trustee, since 1998; Chairman, from 2005 to 2017 | | Co-Founder, Retired Chairman, President and CEO of Crystal Geyser Water Company. Trustee Emeritus, Colby College. | | Asset Allocation Trust |
Isaiah Harris, Jr. (Born 1952) | | Trustee, since 2009 | | Retired. Chairman of the Board of CIGNA Corporation since 2009, and Director since 2005. From 2003 to 2011, Director of Deluxe Corporation. Prior thereto, President and CEO of BellSouth Advertising and Publishing Corp. from 2005 to 2007, President and CEO of BellSouth Enterprises from 2004 to 2005 and President of BellSouth Consumer Services from 2000 to 2003. Emeritus member of the Iowa State University Foundation Board of Governors. Emeritus Member of the Advisory Board of Iowa State University School of Business. Advisory Board Member, Palm Harbor Academy (charter school). Advisory Board Member, Child Evangelism Fellowship (non-profit). Mr. Harris is a certified public accountant (inactive status). | | CIGNA Corporation; Asset Allocation Trust |
Judith M. Johnson (Born 1949) | | Trustee, since 2008; Audit Committee Chairman, since 2008 | | Retired. Prior thereto, Chief Executive Officer and Chief Investment Officer of Minneapolis Employees Retirement Fund from 1996 to 2008. Ms. Johnson is an attorney, certified public accountant and a certified managerial accountant. | | Asset Allocation Trust |
David F. Larcker (Born 1950) | | Trustee, since 2009 | | James Irvin Miller Professor of Accounting at the Graduate School of Business, Stanford University, Director of the Corporate Governance Research Initiative and Senior Faculty of The Rock Center for Corporate Governance since 2006. From 2005 to 2008, Professor of Accounting at the Graduate School of Business, Stanford University. Prior thereto, Ernst & Young Professor of Accounting at The Wharton School, University of Pennsylvania from 1985 to 2005. | | Asset Allocation Trust |
| | | | |
| 46 | | Wells Fargo Municipal Bond Fund | | Other information (unaudited) |
| | | | | | |
Name and year of birth | | Position held and length of service* | | Principal occupations during past five years or longer | | Current other public company or
investment company
directorships |
Olivia S. Mitchell**** (Born 1953) | | Trustee, since 2006; Governance Committee Chairman, since 2018 | | International Foundation of Employee Benefit Plans Professor, Wharton School of the University of Pennsylvania since 1993. Director of Wharton’s Pension Research Council and Boettner Center on Pensions & Retirement Research, and Research Associate at the National Bureau of Economic Research. Previously, Cornell University Professor from 1978 to 1993. | | Asset Allocation Trust |
Timothy J. Penny***** (Born 1951) | | Trustee, since 1996; Chairman, since 2018; Vice Chairman, from 2017 to 2018 | | President and Chief Executive Officer of Southern Minnesota Initiative Foundation, a non-profit organization, since 2007. Member of the Board of Trustees of NorthStar Education Finance, Inc., a non-profit organization, since 2007. | | Asset Allocation Trust |
James G. Polisson****** (Born 1959) | | Trustee, since 2018; Advisory Board Member, from 2017 to 2018 | | Retired. Chief Marketing Officer, Source (ETF) UK Services, Ltd, from 2015 to 2017. From 2012 to 2015, Principal of The Polisson Group, LLC, a management consulting, corporate advisory and principal investing company. Chief Executive Officer and Managing Director at Russell Investments, Global Exchange Traded Funds from 2010 to 2012. Managing Director of Barclays Global Investors from 1998 to 2010 and Global Chief Marketing Officer for iShares and Barclays Global Investors from 2000 to 2010. Trustee of the San Francisco Mechanics’ Institute, a non-profit organization, from 2013 to 2015. Board member of the Russell Exchange Traded Fund Trust from 2011 to 2012. Director of Barclays Global Investors Holdings Deutschland GmbH from 2006 to 2009. Mr. Polisson is an attorney and has a retired status with the Massachusetts and District of Columbia Bar Associations. | | Asset Allocation Trust |
Michael S. Scofield (Born 1943) | | Trustee, since 2010 | | Served on the Investment Company Institute’s Board of Governors and Executive Committee from 2008-2011 as well the Governing Council of the Independent Directors Council from 2006-2011 and the Independent Directors Council Executive Committee from 2008-2011. Trustee of the Evergreen Funds complex (and its predecessors) from 1984 to 2010. Chairman of the Evergreen Funds from 2000-2010. Former Trustee of the Mentor Funds. Retired Attorney, Law Offices of Michael S. Scofield. | | Asset Allocation Trust |
| Pamela Wheelock****** (Born 1959) | | Trustee, since 2018; Advisory Board Member, from 2017 to 2018 | | Chief Operating Officer, Twin Cities Habitat for Humanity, since January, 2017. Vice President of University Services, University of Minnesota from 2012 to 2017. Prior thereto, Interim President and Chief Executive Officer of Blue Cross Blue Shield of Minnesota from 2010 to 2011, Chairman of the Board from 2009 to 2011 and Board Director from 2003 to 2015. Vice President, Leadership and Community Engagement, Bush Foundation, Saint Paul, Minnesota (a private foundation) from 2009 to 2011. Executive Vice President and Chief Financial Officer, Minnesota Sports and Entertainment from 2004 to 2009 and Senior Vice President from 2002 to 2004. Commissioner of Finance, State of Minnesota, from 1999 to 2002. Currently on the Board of Directors, Governance Committee and Finance Committee, for the Minnesota Philanthropy Partners (Saint Paul Foundation) since 2012 and Board Chair of the Minnesota Wild Foundation since 2010. | | Asset Allocation Trust |
| * | Length of service dates reflect the Trustee’s commencement of service with the Trust’s predecessor entities, where applicable. |
| ** | Jane Freeman became Chair Liaison effective January 1, 2018. |
| *** | Peter Gordon retired on December 31, 2017. |
| **** | Olivia Mitchell became Chairman of the Governance Committee effective January 1, 2018. |
| ***** | Timothy Penny became Chairman effective January 1, 2018. |
| ****** | James Polisson and Pamela Wheelock each became a Trustee effective January 1, 2018. |
| | | | | | |
| Other information (unaudited) | | Wells Fargo Municipal Bond Fund | | | 47 | |
Officers
| | | | | | |
Name and
year of birth | | Position held and
length of service | | Principal occupations during past five years or longer | | |
Andrew Owen (Born 1960) | | President, since 2017 | | Executive Vice President of Wells Fargo & Company and Head of Affiliated Managers, Wells Fargo Asset Management, since 2014. In addition, Mr. Owen is currently President, Chief Executive Officer and Director of Wells Fargo Funds Management, LLC since 2017. Prior thereto, Executive Vice President responsible for marketing, investments and product development for Wells Fargo Funds Management, LLC, from 2009 to 2014. | | |
Nancy Wiser1 (Born 1967) | | Treasurer, since 2012 | | Executive Vice President of Wells Fargo Funds Management, LLC since 2011. Chief Operating Officer and Chief Compliance Officer at LightBox Capital Management LLC, from 2008 to 2011. | | |
C. David Messman (Born 1960) | | Secretary, since 2000; Chief Legal Officer, since 2003 | | Senior Vice President and Secretary of Wells Fargo Funds Management, LLC since 2001. Assistant General Counsel of Wells Fargo Bank, N.A. since 2013 and Vice President and Managing Counsel of Wells Fargo Bank, N.A. from 1996 to 2013. | | |
Michael H. Whitaker (Born 1967) | | Chief Compliance Officer, since 2016 | | Senior Vice President and Chief Compliance Officer since 2016. Senior Vice President and Chief Compliance Officer for Fidelity Investments from 2007 to 2016. | | |
David Berardi (Born 1975) | | Assistant Treasurer, since 2009 | | Vice President of Wells Fargo Funds Management, LLC since 2009. Vice President of Evergreen Investment Management Company, LLC from 2008 to 2010. Manager of Fund Reporting and Control for Evergreen Investment Management Company, LLC from 2004 to 2010. | | |
| Jeremy DePalma1 (Born 1974) | | Assistant Treasurer, since 2009 | | Senior Vice President of Wells Fargo Funds Management, LLC since 2009. Senior Vice President of Evergreen Investment Management Company, LLC from 2008 to 2010 and head of the Fund Reporting and Control Team within Fund Administration from 2005 to 2010. | | |
| 1 | Nancy Wiser acts as Treasurer of 77 funds in the Fund Complex. Jeremy DePalma acts as Treasurer of 76 funds and Assistant Treasurer of 77 funds in the Fund Complex. |
| 2 | The Statement of Additional Information includes additional information about the Trustees and is available, without charge, upon request, by calling 1-800-222-8222 or by visiting the website at wellsfargofunds.com. |
| | | | |
| 48 | | Wells Fargo Municipal Bond Fund | | List of abbreviations |
The following is a list of common abbreviations for terms and entities that may have appeared in this report.
| ACA | — ACA Financial Guaranty Corporation |
| ADR | — American depositary receipt |
| ADS | — American depositary shares |
| AGC | — Assured Guaranty Corporation |
| AGM | — Assured Guaranty Municipal |
| Ambac | — Ambac Financial Group Incorporated |
| AMT | — Alternative minimum tax |
| BAN | — Bond anticipation notes |
| BHAC | — Berkshire Hathaway Assurance Corporation |
| CAB | — Capital appreciation bond |
| CCAB | — Convertible capital appreciation bond |
| CDA | — Community Development Authority |
| CDO | — Collateralized debt obligation |
| CLO | — Collateralized loan obligation |
| DRIVER | — Derivative inverse tax-exempt receipts |
| DW&P | — Department of Water & Power |
| DWR | — Department of Water Resources |
| ECFA | — Educational & Cultural Facilities Authority |
| EDA | — Economic Development Authority |
| EDFA | — Economic Development Finance Authority |
| ETF | — Exchange-traded fund |
| FDIC | — Federal Deposit Insurance Corporation |
| FFCB | — Federal Farm Credit Banks |
| FGIC | — Financial Guaranty Insurance Corporation |
| FHA | — Federal Housing Administration |
| FHLB | — Federal Home Loan Bank |
| FHLMC | — Federal Home Loan Mortgage Corporation |
| FICO | — The Financing Corporation |
| FNMA | — Federal National Mortgage Association |
| GDR | — Global depositary receipt |
| GNMA | — Government National Mortgage Association |
| HCFR | — Healthcare facilities revenue |
| HEFA | — Health & Educational Facilities Authority |
| HEFAR | — Higher education facilities authority revenue |
| HFA | — Housing Finance Authority |
| HFFA | — Health Facilities Financing Authority |
| HUD | — Department of Housing and Urban Development |
| IDA | — Industrial Development Authority |
| IDAG | — Industrial Development Agency |
| KRW | — Republic of Korea won |
| LIBOR | — London Interbank Offered Rate |
| LIFER | — Long Inverse Floating Exempt Receipts |
| LLC | — Limited liability company |
| LLLP | — Limited liability limited partnership |
| LLP | — Limited liability partnership |
| MBIA | — Municipal Bond Insurance Association |
| MFHR | — Multifamily housing revenue |
| MSTR | — Municipal securities trust receipts |
| MUD | — Municipal Utility District |
| National | — National Public Finance Guarantee Corporation |
| PCFA | — Pollution Control Financing Authority |
| PCL | — Public Company Limited |
| PCR | — Pollution control revenue |
| PFA | — Public Finance Authority |
| PFFA | — Public Facilities Financing Authority |
| PFOTER | — Puttable floating option tax-exempt receipts |
| PJSC | — Public Joint Stock Company |
| plc | — Public limited company |
| PUTTER | — Puttable tax-exempt receipts |
| R&D | — Research & development |
| Radian | — Radian Asset Assurance |
| RAN | — Revenue anticipation notes |
| RDA | — Redevelopment Agency |
| RDFA | — Redevelopment Finance Authority |
| REIT | — Real estate investment trust |
| ROC | — Reset option certificates |
| SAVRS | — Select auction variable rate securities |
| SBA | — Small Business Authority |
| SDR | — Swedish depositary receipt |
| SFHR | — Single-family housing revenue |
| SFMR | — Single-family mortgage revenue |
| SIFMA | — Securities Industry and Financial Markets Association |
| SPA | — Standby purchase agreement |
| SPDR | — Standard & Poor’s Depositary Receipts |
| SPEAR | — Short Puttable Exempt Adjustable Receipts |
| STRIPS | — Separate trading of registered interest and |
| TAN | — Tax anticipation notes |
| TIPS | — Treasury inflation-protected securities |
| TRAN | — Tax revenue anticipation notes |
| TTFA | — Transportation Trust Fund Authority |
| TVA | — Tennessee Valley Authority |

For more information
More information about Wells Fargo Funds is available free upon request. To obtain literature, please write, email, visit the Fund’s website, or call:
Wells Fargo Funds
P.O. Box 8266
Boston, MA 02266-8266
Email: fundservice@wellsfargo.com
Website: wellsfargofunds.com
Individual investors: 1-800-222-8222
Retail investment professionals: 1-888-877-9275
Institutional investment professionals: 1-866-765-0778
This report and the financial statements contained herein are submitted for the general information of the shareholders of the Fund. If this report is used for promotional purposes, distribution of the report must be accompanied or preceded by a current prospectus. Before investing, please consider the investment objectives, risks, charges, and expenses of the investment. For a current prospectus and, if available, a summary prospectus, containing this information, call 1-800-222-8222 or visit the Fund’s website at wellsfargofunds.com. Read the prospectus carefully before you invest or send money.
Wells Fargo Asset Management (WFAM) is a trade name used by the asset management businesses of Wells Fargo & Company. Wells Fargo Funds Management, LLC, a wholly owned subsidiary of Wells Fargo & Company, provides investment advisory and administrative services for Wells Fargo Funds. Other affiliates of Wells Fargo & Company provide subadvisory and other services for the funds. The funds are distributed by Wells Fargo Funds Distributor, LLC, Member FINRA, an affiliate of Wells Fargo & Company. Neither Wells Fargo Funds Distributor nor Wells Fargo Funds Management holds fund shareholder accounts or assets. This material is for general informational and educational purposes only and is NOT intended to provide investment advice or a recommendation of any kind—including a recommendation for any specific investment, strategy, or plan.
NOT FDIC INSURED ◾ NO BANK GUARANTEE ◾ MAY LOSE VALUE
© 2017 Wells Fargo Funds Management, LLC. All rights reserved.
| | |
 | | 308064 02-18 SA253/SAR253 12-17 |
Semi-Annual Report
December 31, 2017

Wells Fargo North Carolina Tax-Free Fund


Reduce clutter. Save trees.
Sign up for electronic delivery of prospectuses and shareholder reports at wellsfargo.com/advantagedelivery
Contents
The views expressed and any forward-looking statements are as of December 31, 2017, unless otherwise noted, and are those of the Fund managers and/or Wells Fargo Funds Management, LLC. Discussions of individual securities, or the markets generally, or any Wells Fargo Fund are not intended as individual recommendations. Future events or results may vary significantly from those expressed in any forward-looking statements. The views expressed are subject to change at any time in response to changing circumstances in the market. Wells Fargo Funds Management, LLC and the Fund disclaim any obligation to publicly update or revise any views expressed or forward-looking statements.
NOT FDIC INSURED ◾ NO BANK GUARANTEE ◾ MAY LOSE VALUE
| | | | |
| 2 | | Wells Fargo North Carolina Tax-Free Fund | | Letter to shareholders (unaudited) |

Andrew Owen
President
Wells Fargo Funds
In a predominantly improving global economic environment, global stocks delivered strong results; bond markets had smaller but positive results as well.
Dear Shareholder:
We are pleased to offer you this semi-annual report for the Wells Fargo North Carolina Tax-Free Fund for the six-month period that ended December 31, 2017. In a predominantly improving global economic environment, global stocks delivered strong results; bond markets had smaller but positive results as well. U.S. and international stocks delivered similar results, with returns of 11.42% and 11.48%, respectively, for the six-month period, as measured by the S&P 500 Index1 and the MSCI ACWI ex USA Index (Net)2, respectively; within fixed income, the Bloomberg Barclays U.S. Aggregate Bond Index3 returned 1.24% and the Bloomberg Barclays Municipal Bond Index4 returned 1.82%.
As global growth improved in the third quarter of 2017, investment markets generally advanced.
Most stock markets worldwide moved higher during the quarter and ended the period at or near all-time highs. Moderate acceleration in global economic growth was supported by improving corporate earnings, low inflation pressure, and still-low interest rates. Corporate earnings reports were favorable overall as companies continued to benefit from healthy operating leverage. While North Korea’s recent missile launches and nuclear testing raised serious concerns around the world, the heightened geopolitical risk had relatively minimal impact on the quarter’s stock returns. In the U.S., economic data released during the quarter reflected a generally healthy economy. Second-quarter economic output grew at a 3.1% annual rate, and consumers displayed more willingness to spend. Meanwhile, the U.S. Federal Reserve (Fed) maintained the target range for the federal funds rate at 1.00% to 1.25%, noting that inflation had remained below the Fed’s 2.00% objective. However, the Fed also stated the possibility of one more 0.25% increase in the federal funds rate by the end of 2017 and announced plans to begin the process of unwinding its $4.5 trillion portfolio of bonds and other assets in October. Outside the U.S., stocks in the Asia Pacific region benefited from solid earnings reports and investors’ willingness to take on risk despite the rising tensions between North Korea and the U.S. In Europe, markets were supported by better-than-expected economic growth, which led to narrowing of the gap between Europe’s growth rate and that of the U.S. In emerging markets, many countries benefited from stronger currencies versus the U.S. dollar.
Positive economic and market news continued through the fourth quarter.
During the fourth quarter of 2017, stock markets followed a steady, upward trajectory with no meaningful pullbacks, similar to their paths during the previous three quarters of the year. The extended rally was driven largely by reports of strong earnings and revenue surprises from many companies. Synchronous economic expansion worldwide with mild inflation provided a favorable environment for markets to rise with minimal volatility. Data released during the quarter reflected a
| 1 | The S&P 500 Index consists of 500 stocks chosen for market size, liquidity, and industry group representation. It is a market-value-weighted index with each stock’s weight in the index proportionate to its market value. You cannot invest directly in an index. |
| 2 | The Morgan Stanley Capital International (MSCI) All Country World Index (ACWI) ex USA Index (Net) is a free-float-adjusted market-capitalization-weighted index that is designed to measure the equity market performance of developed markets, excluding the United States and Canada. Source: MSCI. MSCI makes no express or implied warranties or representations and shall have no liability whatsoever with respect to any MSCI data contained herein. The MSCI data may not be further redistributed or used as a basis for other indices or any securities or financial products. This report is not approved, reviewed, or produced by MSCI. You cannot invest directly in an index. |
| 3 | The Bloomberg Barclays U.S. Aggregate Bond Index is a broad-based benchmark that measures the investment-grade, U.S. dollar-denominated, fixed-rate taxable bond market, including Treasuries, government-related and corporate securities, mortgage-backed securities (agency fixed-rate and hybrid adjustable-rate mortgage pass-throughs), asset-backed securities, and commercial mortgage-backed securities. You cannot invest directly in an index. |
| 4 | The Bloomberg Barclays Municipal Bond Index is an unmanaged index composed of long-term tax-exempt bonds with a minimum credit rating of Baa. You cannot invest directly in an index. |
| | | | | | |
| Letter to shareholders (unaudited) | | Wells Fargo North Carolina Tax-Free Fund | | | 3 | |
healthy U.S. economy. Third-quarter economic output grew at a 3.2% annual rate, just ahead of the second quarter’s 3.1% pace. Hiring remained solid during the quarter; the hiring pace pushed the unemployment rate down to a 17-year low of 4.1% in October, and it remained at 4.1% for both November and December. Fed officials began unwinding the Fed’s $4.5 trillion portfolio of bonds and other assets in October as planned, and in December they raised the target for the federal funds rate to a range of 1.25% to 1.50%. As a result, long-term interest rates in the U.S. continued trending upward, although the 10-year rate remained below 2.5%. Outside the U.S., economies continued to strengthen. In December, the Organisation for Economic Co-operation and Development (OECD) reported that the global economy has been expanding at its fastest rate since 2010; all 45 countries the OECD follows were on track to expand for 2017. International economies have benefited from catalysts such as economic stimulus, improving employment, increased investment, and accelerated trade growth.
Don’t let short-term uncertainty derail long-term investment goals.
Periods of investment uncertainty can present challenges, but experience has taught us that maintaining long-term investment goals can be an effective way to plan for the future. To help you create a sound strategy based on your personal goals and risk tolerance, Wells Fargo Funds offers more than 100 mutual funds spanning a wide range of asset classes and investment styles. Although diversification cannot guarantee an investment profit or prevent losses, we believe it can be an effective way to manage investment risk and potentially smooth out overall portfolio performance. We encourage investors to know their investments and to understand that appropriate levels of risk-taking may unlock opportunities.
Thank you for choosing to invest with Wells Fargo Funds. We appreciate your confidence in us and remain committed to helping you meet your financial needs.
Sincerely,

Andrew Owen
President
Wells Fargo Funds
Although diversification cannot guarantee an investment profit or prevent losses, we believe it can be an effective way to manage investment risk and potentially smooth out overall portfolio performance.
For further information about your Fund, contact your investment professional, visit our website at wellsfargofunds.com, or call us directly at 1-800-222-8222. We are available 24 hours a day, 7 days a week.
| | | | |
| 4 | | Wells Fargo North Carolina Tax-Free Fund | | Performance highlights (unaudited) |
Investment objective
The Fund seeks current income exempt from federal income tax and North Carolina individual income tax.
Manager
Wells Fargo Funds Management, LLC
Subadviser
Wells Capital Management Incorporated
Portfolio managers
Bruce R. Johns
Robert J. Miller
Average annual total returns (%) as of December 31, 20171
| | | | | | | | | | | | | | | | | | | | | | | | | | | | | | | | | | |
| | | | | Including sales charge | | | Excluding sales charge | | | Expense ratios2 (%) | |
| | | Inception date | | 1 year | | | 5 year | | | 10 year | | | 1 year | | | 5 year | | | 10 year | | | Gross | | | Net3 | |
| Class A (ENCMX) | | 1-11-1993 | | | (1.09 | ) | | | 1.48 | | | | 3.12 | | | | 3.61 | | | | 2.41 | | | | 3.59 | | | | 0.97 | | | | 0.85 | |
| Class C (ENCCX) | | 3-27-2002 | | | 1.84 | | | | 1.65 | | | | 2.82 | | | | 2.84 | | | | 1.65 | | | | 2.82 | | | | 1.72 | | | | 1.60 | |
| Institutional Class (ENCYX) | | 2-28-1994 | | | – | | | | – | | | | – | | | | 3.93 | | | | 2.73 | | | | 3.90 | | | | 0.64 | | | | 0.54 | |
| Bloomberg Barclays Municipal Bond Index4 | | – | | | – | | | | – | | | | – | | | | 5.45 | | | | 3.02 | | | | 4.46 | | | | – | | | | – | |
| Bloomberg Barclays North Carolina Municipal Bond Index5 | | – | | | – | | | | – | | | | – | | | | 4.07 | | | | 2.44 | | | | 4.13 | | | | – | | | | – | |
Figures quoted represent past performance, which is no guarantee of future results, and do not reflect taxes that a shareholder may pay on fund distributions or the redemption of fund shares. Investment return and principal value of an investment will fluctuate so that an investor’s shares, when redeemed, may be worth more or less than their original cost. Performance shown without sales charges would be lower if sales charges were reflected. Current performance may be lower or higher than the performance data quoted, which assumes the reinvestment of dividends and capital gains. Current month-end performance is available on the Fund’s website, wellsfargofunds.com.
Index returns do not include transaction costs associated with buying and selling securities, any mutual fund fees or expenses, or any taxes. It is not possible to invest directly in an index.
For Class A shares, the maximum front-end sales charge is 4.50%. For Class C shares, the maximum contingent deferred sales charge is 1.00%. Performance including a contingent deferred sales charge assumes the sales charge for the corresponding time period. Institutional Class shares are sold without a front-end sales charge or contingent deferred sales charge.
Bond values fluctuate in response to the financial condition of individual issuers, general market and economic conditions, and changes in interest rates. Changes in market conditions and government policies may lead to periods of heightened volatility in the bond market and reduced liquidity for certain bonds held by the Fund. In general, when interest rates rise, bond values fall and investors may lose principal value. Interest-rate changes and their impact on the Fund and its share price can be sudden and unpredictable. The use of derivatives may reduce returns and/or increase volatility. Certain investment strategies tend to increase the total risk of an investment (relative to the broader market). The Fund is exposed to North Carolina municipal securities risk, high-yield securities risk, and non-diversification risk. Consult the Fund’s prospectus for additional information on these and other risks. A portion of the Fund’s income may be subject to federal, state, and/or local income taxes or the Alternative Minimum Tax (AMT). Any capital gains distributions may be taxable.
Please see footnotes on page 5.
| | | | | | |
| Performance highlights (unaudited) | | Wells Fargo North Carolina Tax-Free Fund | | | 5 | |
|
| Effective maturity distribution as of December 31, 20176 |
|
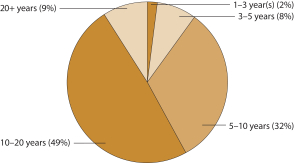
|
|
| Credit quality as of December 31, 20177 |
|
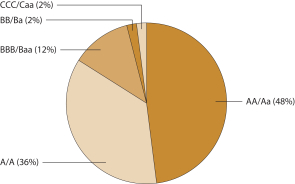 |
| 1 | Historical performance shown for all classes of the Fund prior to July 12, 2010, is based on the performance of the Fund’s predecessor, Evergreen North Carolina Municipal Bond Fund. |
| 2 | Reflects the expense ratios as stated in the most recent prospectuses. The expense ratios shown are subject to change and may differ from the annualized expense ratios shown in the financial highlights of this report. |
| 3 | The manager has contractually committed through October 31, 2018, to waive fees and/or reimburse expenses to the extent necessary to cap the Fund’s Total Annual Fund Operating Expenses After Fee Waivers at the amounts shown. After this time, the cap may be increased or the commitment to maintain the cap may be terminated only with the approval of the Board of Trustees. Brokerage commissions, stamp duty fees, interest, taxes, acquired fund fees and expenses, and extraordinary expenses are excluded from the expense cap. Without this cap, the Fund’s returns would have been lower. The expense ratio paid by an investor is the net expense ratio or the Fund’s Total Annual Fund Operating Expenses After Fee Waivers, as stated in the prospectuses. |
| 4 | The Bloomberg Barclays Municipal Bond Index is an unmanaged index composed of long-term tax-exempt bonds with a minimum credit rating of Baa. You cannot invest directly in an index. |
| 5 | The Bloomberg Barclays North Carolina Municipal Bond Index includes investment-grade, tax-exempt, and fixed-rate bonds issued in the state of North Carolina; all securities have long-term maturities (greater than two years) and are selected from issues larger than $50 million. You cannot invest directly in an index. |
| 6 | Amounts are calculated based on the total investments of the Fund. These amounts are subject to change and may have changed since the date specified. |
| 7 | The credit quality distribution of portfolio holdings reflected in the chart is based on ratings from Standard & Poor’s, Moody’s Investors Service, and/ or Fitch Ratings Ltd. Credit quality ratings apply to the underlying holdings of the Fund and not to the Fund itself. The percentages of the Fund’s portfolio with the ratings depicted in the chart are calculated based on the total market value of fixed income securities held by the Fund. If a security was rated by all three rating agencies, the middle rating was utilized. If rated by two of three rating agencies, the lower rating was utilized, and if rated by one of the rating agencies, that rating was utilized. Standard & Poor’s rates the creditworthiness of bonds, ranging from AAA (highest) to D (lowest). Ratings from A to CCC may be modified by the addition of a plus (+) or minus (-) sign to show relative standing within the rating categories. Standard & Poor’s rates the creditworthiness of short-term notes from SP-1 (highest) to SP-3 (lowest). Moody’s rates the creditworthiness of bonds, ranging from Aaa (highest) to C (lowest). Ratings Aa to B may be modified by the addition of a number 1 (highest) to 3 (lowest) to show relative standing within the ratings categories. Moody’s rates the creditworthiness of short-term U.S. tax-exempt municipal securities from MIG 1/VMIG 1 (highest) to SG (lowest). Fitch rates the creditworthiness of bonds, ranging from AAA (highest) to D (lowest). Credit quality distribution is subject to change and may have changed since the date specified. |
| | | | |
| 6 | | Wells Fargo North Carolina Tax-Free Fund | | Fund expenses (unaudited) |
As a shareholder of the Fund, you incur two types of costs: (1) transaction costs, including sales charges (loads) on purchase payments and contingent deferred sales charges (if any) on redemptions and (2) ongoing costs, including management fees, distribution (12b-1) and/or shareholder servicing fees, and other Fund expenses. This example is intended to help you understand your ongoing costs (in dollars) of investing in the Fund and to compare these costs with the ongoing costs of investing in other mutual funds.
The example is based on an investment of $1,000 invested at the beginning of the six-month period and held for the entire period from July 1, 2017 to December 31, 2017.
Actual expenses
The “Actual” line of the table below provides information about actual account values and actual expenses. You may use the information in this line, together with the amount you invested, to estimate the expenses that you paid over the period. Simply divide your account value by $1,000 (for example, an $8,600 account value divided by $1,000 = 8.6), then multiply the result by the number in the “Actual” line under the heading entitled “Expenses paid during period” for your applicable class of shares to estimate the expenses you paid on your account during this period.
Hypothetical example for comparison purposes
The “Hypothetical” line of the table below provides information about hypothetical account values and hypothetical expenses based on the Fund’s actual expense ratio and an assumed rate of return of 5% per year before expenses, which is not the Fund’s actual return. The hypothetical account values and expenses may not be used to estimate the actual ending account balance or expenses you paid for the period. You may use this information to compare the ongoing costs of investing in the Fund and other funds. To do so, compare this 5% hypothetical example with the 5% hypothetical examples that appear in the shareholder reports of the other funds.
Please note that the expenses shown in the table are meant to highlight your ongoing costs only and do not reflect any transactional costs, such as sales charges (loads) and contingent deferred sales charges. Therefore, the “Hypothetical” line of the table is useful in comparing ongoing costs only and will not help you determine the relative total costs of owning different funds. In addition, if these transactional costs were included, your costs would have been higher.
| | | | | | | | | | | | | | | | |
| | | Beginning
account value
7-1-2017 | | | Ending
account value
12-31-2017 | | | Expenses
paid during
the period¹ | | | Annualized net
expense ratio | |
Class A | | | | | | | | | | | | | | | | |
Actual | | $ | 1,000.00 | | | $ | 1,010.88 | | | $ | 4.31 | | | | 0.85 | % |
Hypothetical (5% return before expenses) | | $ | 1,000.00 | | | $ | 1,020.92 | | | $ | 4.33 | | | | 0.85 | % |
Class C | | | | | | | | | | | | | | | | |
Actual | | $ | 1,000.00 | | | $ | 1,007.07 | | | $ | 8.09 | | | | 1.60 | % |
Hypothetical (5% return before expenses) | | $ | 1,000.00 | | | $ | 1,017.14 | | | $ | 8.13 | | | | 1.60 | % |
Institutional Class | | | | | | | | | | | | | | | | |
Actual | | $ | 1,000.00 | | | $ | 1,012.46 | | | $ | 2.74 | | | | 0.54 | % |
Hypothetical (5% return before expenses) | | $ | 1,000.00 | | | $ | 1,022.48 | | | $ | 2.75 | | | | 0.54 | % |
| 1 | Expenses paid is equal to the annualized net expense ratio of each class multiplied by the average account value over the period, multiplied by the number of days in the most recent fiscal half-year divided by the number of days in the fiscal year (to reflect the one-half-year period). |
| | | | | | |
| Portfolio of investments—December 31, 2017 (unaudited) | | Wells Fargo North Carolina Tax-Free Fund | | | 7 | |
| | | | | | | | | | | | | | | | |
| Security name | | Interest rate | | | Maturity date | | | Principal | | | Value | |
|
Municipal Obligations: 98.81% | |
| | | | |
| California: 1.61% | | | | | | | | | | | | | | | | |
University of California Limited Project Prerefunded Bond Series G (Education Revenue) | | | 5.00 | % | | | 5-15-2037 | | | $ | 500,000 | | | $ | 567,565 | |
University of California Limited Project Unrefunded Bond Series G (Education Revenue) | | | 5.00 | | | | 5-15-2037 | | | | 500,000 | | | | 557,750 | |
| |
| | | | 1,125,315 | |
| | | | | | | | | | | | | | | | |
| | | | |
| Guam: 1.63% | | | | | | | | | | | | | | | | |
Guam Government Waterworks Authority (Water & Sewer Revenue) | | | 5.25 | | | | 7-1-2023 | | | | 1,000,000 | | | | 1,138,520 | |
| | | | | | | | | | | | | | | | |
| | | | |
| Indiana: 1.67% | | | | | | | | | | | | | | | | |
Indiana Finance Authority Clean Water Act Project Series A (Water & Sewer Revenue) | | | 5.00 | | | | 10-1-2031 | | | | 1,000,000 | | | | 1,173,210 | |
| | | | | | | | | | | | | | | | |
| | | | |
| New York: 2.39% | | | | | | | | | | | | | | | | |
New York Dormitory Authority Personal Income Tax Series B (Tax Revenue) | | | 5.00 | | | | 3-15-2042 | | | | 1,500,000 | | | | 1,673,310 | |
| | | | | | | | | | | | | | | | |
| | | | |
| North Carolina: 83.35% | | | | | | | | | | | | | | | | |
Asheville NC Limited Obligation (Miscellaneous Revenue) | | | 5.00 | | | | 10-1-2027 | | | | 300,000 | | | | 374,496 | |
Cabarrus County NC Limited Obligation Installment Financing Contract (Miscellaneous Revenue) | | | 5.00 | | | | 6-1-2031 | | | | 500,000 | | | | 606,575 | |
Cape Fear NC Public Utility Authority (Water & Sewer Revenue) | | | 5.00 | | | | 8-1-2035 | | | | 2,000,000 | | | | 2,040,100 | |
Carolina Beach NC Enterprise System (Water & Sewer Revenue) | | | 5.00 | | | | 6-1-2029 | | | | 250,000 | | | | 299,235 | |
Carolina Beach NC Enterprise System (Water & Sewer Revenue) | | | 5.00 | | | | 6-1-2031 | | | | 245,000 | | | | 290,381 | |
Charlotte NC Airport Series A (Airport Revenue) | | | 5.50 | | | | 7-1-2034 | | | | 2,500,000 | | | | 2,732,975 | |
Charlotte NC AMT Series B (Airport Revenue) | | | 5.00 | | | | 7-1-2020 | | | | 1,480,000 | | | | 1,593,131 | |
Charlotte NC AMT Series B (Airport Revenue) | | | 5.50 | | | | 7-1-2024 | | | | 810,000 | | | | 878,648 | |
Charlotte NC Certificate of Participation Series A (Miscellaneous Revenue) | | | 5.00 | | | | 12-1-2026 | | | | 1,160,000 | | | | 1,295,836 | |
Charlotte NC Certificate of Participation Series A (Miscellaneous Revenue) | | | 5.00 | | | | 6-1-2030 | | | | 1,000,000 | | | | 1,147,030 | |
Charlotte NC Certificate of Participation Series E (Miscellaneous Revenue) | | | 5.00 | | | | 6-1-2023 | | | | 3,650,000 | | | | 3,822,937 | |
Charlotte NC Douglas Airport Series A (Airport Revenue) | | | 5.00 | | | | 7-1-2025 | | | | 1,645,000 | | | | 1,811,342 | |
Charlotte-Mecklenburg NC Hospital Authority (Health Revenue) | | | 5.00 | | | | 1-15-2027 | | | | 1,885,000 | | | | 1,953,576 | |
Charlotte-Mecklenburg NC Hospital Authority Series B (Health Revenue, JPMorgan Chase & Company SPA) ø | | | 1.75 | | | | 1-15-2038 | | | | 395,000 | | | | 395,000 | |
Cumberland County NC Limited Obligation Series B (Miscellaneous Revenue) | | | 5.00 | | | | 11-1-2025 | | | | 1,000,000 | | | | 1,138,110 | |
Cumberland County NC Limited Obligation Series B (Miscellaneous Revenue) | | | 5.00 | | | | 11-1-2026 | | | | 1,000,000 | | | | 1,138,110 | |
Dare County NC Utility System Revenue (Water & Sewer Revenue) | | | 5.00 | | | | 2-1-2029 | | | | 350,000 | | | | 428,302 | |
Henderson County NC Limited Obligation Series A (Miscellaneous Revenue) | | | 5.00 | | | | 10-1-2030 | | | | 500,000 | | | | 599,355 | |
Jacksonville NC Enterprise System (Water & Sewer Revenue) | | | 5.25 | | | | 5-1-2028 | | | | 500,000 | | | | 631,215 | |
New Hanover County NC New Hanover Regional Medical Center (Health Revenue) | | | 5.00 | | | | 10-1-2028 | | | | 3,000,000 | | | | 3,340,260 | |
New Hanover County NC New Hanover Regional Medical Center (Health Revenue) | | | 5.00 | | | | 10-1-2047 | | | | 1,000,000 | | | | 1,151,430 | |
New Hanover County NC New Hanover Regional Medical Center (Health Revenue, AGM Insured) | | | 5.13 | | | | 10-1-2031 | | | | 1,800,000 | | | | 1,908,360 | |
North Carolina Department of Transportation (Transportation Revenue) | | | 5.00 | | | | 6-30-2028 | | | | 1,275,000 | | | | 1,446,781 | |
North Carolina Facilities Finance Agency (Housing Revenue, AGC Insured) | | | 5.00 | | | | 6-1-2027 | | | | 1,000,000 | | | | 1,154,980 | |
North Carolina Facilities Finance Agency The Arc of North Carolina Project Series A (Housing Revenue, HUD Insured) | | | 5.00 | | | | 10-1-2034 | | | | 1,000,000 | | | | 1,120,260 | |
North Carolina HFA Series B (Housing Revenue) | | | 4.25 | | | | 1-1-2028 | | | | 1,360,000 | | | | 1,390,926 | |
North Carolina Medical Care Commission Baptist Hospital Project (Health Revenue) | | | 5.25 | | | | 6-1-2029 | | | | 2,000,000 | | | | 2,174,440 | |
North Carolina Medical Care Commission Deerfield Episcopal Retirement Community Project (Health Revenue) | | | 5.00 | | | | 11-1-2031 | | | | 1,500,000 | | | | 1,748,805 | |
North Carolina Medical Care Commission Presbyterian Homes Project Series C (Health Revenue) | | | 4.00 | | | | 10-1-2031 | | | | 1,500,000 | | | | 1,605,030 | |
North Carolina Medical Care Commission Southeastern Regional Medical Center Project (Health Revenue) | | | 5.00 | | | | 6-1-2026 | | | | 385,000 | | | | 433,190 | |
The accompanying notes are an integral part of these financial statements.
| | | | |
| 8 | | Wells Fargo North Carolina Tax-Free Fund | | Portfolio of investments—December 31, 2017 (unaudited) |
| | | | | | | | | | | | | | | | |
| Security name | | Interest rate | | | Maturity date | | | Principal | | | Value | |
|
| North Carolina (continued) | |
North Carolina Medical Care Commission Southeastern Regional Medical Center Project (Health Revenue) | | | 5.00 | % | | | 6-1-2032 | | | $ | 500,000 | | | $ | 553,135 | |
North Carolina Medical Care Commission Southminster Incorporated (Health Revenue) | | | 5.00 | | | | 10-1-2037 | | | | 500,000 | | | | 543,130 | |
North Carolina Municipal Power Agency #1 Catawba Nuclear Power Project Series A (Utilities Revenue) | | | 5.00 | | | | 1-1-2021 | | | | 2,720,000 | | | | 2,895,277 | |
North Carolina Port Authority Series B (Airport Revenue) | | | 5.00 | | | | 2-1-2025 | | | | 3,540,000 | | | | 3,788,720 | |
North Carolina Turnpike Authority (Transportation Revenue) | | | 5.00 | | | | 7-1-2042 | | | | 500,000 | | | | 556,640 | |
Onslow County NC Water and Sewer Authority (Water & Sewer Revenue) | | | 5.00 | | | | 12-1-2028 | | | | 505,000 | | | | 613,833 | |
Orange County NC Public Facilities Company Limited Obligation (Miscellaneous Revenue) | | | 5.00 | | | | 10-1-2026 | | | | 1,000,000 | | | | 1,114,960 | |
Raleigh NC Limited Obligation Series A (Miscellaneous Revenue) | | | 5.00 | | | | 2-1-2029 | | | | 900,000 | | | | 1,081,125 | |
Raleigh NC Limited Obligation Series A (Miscellaneous Revenue) | | | 5.00 | | | | 10-1-2033 | | | | 1,000,000 | | | | 1,181,450 | |
University of North Carolina at Greensboro (Education Revenue) | | | 5.00 | | | | 4-1-2033 | | | | 2,000,000 | | | | 2,338,980 | |
University of North Carolina at Greensboro (Education Revenue) | | | 5.00 | | | | 4-1-2039 | | | | 1,620,000 | | | | 1,880,172 | |
University of North Carolina at Greensboro (Education Revenue) | | | 5.00 | | | | 6-1-2042 | | | | 625,000 | | | | 721,319 | |
Wilmington NC Limited Obligation Series A (Miscellaneous Revenue) | | | 5.00 | | | | 6-1-2030 | | | | 400,000 | | | | 480,128 | |
| |
| | | | 58,399,685 | |
| | | | | | | | | | | | | | | | |
| | | | |
| Tennessee: 3.30% | | | | | | | | | | | | | | | | |
Tennessee Energy Acquisition Corporation Series A (Utilities Revenue) | | | 5.25 | | | | 9-1-2026 | | | | 1,020,000 | | | | 1,227,499 | |
Tennessee Energy Acquisition Corporation Series C (Utilities Revenue) | | | 5.00 | | | | 2-1-2021 | | | | 1,000,000 | | | | 1,086,910 | |
| |
| | | | 2,314,409 | |
| | | | | | | | | | | | | | | | |
| | | | |
| Virgin Islands: 1.62% | | | | | | | | | | | | | | | | |
Virgin Islands PFA (Tax Revenue) | | | 6.75 | | | | 10-1-2019 | | | | 1,545,000 | | | | 1,135,575 | |
| | | | | | | | | | | | | | | | |
| | | | |
| Washington: 1.67% | | | | | | | | | | | | | | | | |
Washington Office Building Refunding Bond (Miscellaneous Revenue) | | | 5.00 | | | | 7-1-2026 | | | | 1,000,000 | | | | 1,170,570 | |
| | | | | | | | | | | | | | | | |
| | | | |
| Wisconsin: 1.57% | | | | | | | | | | | | | | | | |
Wisconsin PFA Carolina International School Series A (Education Revenue) 144A | | | 6.75 | | | | 8-1-2033 | | | | 1,000,000 | | | | 1,099,000 | |
| | | | | | | | | | | | | | | | |
| |
Total Municipal Obligations (Cost $66,422,088) | | | | 69,229,594 | |
| | | | | | | | | | | | | | | | |
| | | | |
| | | Yield | | | | | | Shares | | | | |
| Short-Term Investments: 0.15% | | | | | | | | | | | | | | | | |
| | | | |
| Investment Companies: 0.15% | | | | | | | | | | | | | | | | |
Wells Fargo Municipal Cash Management Money Market Fund Institutional Class (l)(u) | | | 1.49 | | | | | | | | 104,488 | | | | 104,603 | |
| | | | | | | | | | | | | | | | |
| |
Total Short-Term Investments (Cost $104,584) | | | | 104,603 | |
| | | | | | | | | | | | | | | | |
| | | | | | | | |
| Total investments in securities (Cost $66,526,672) | | | 98.96 | % | | | 69,334,197 | |
Other assets and liabilities, net | | | 1.04 | | | | 729,930 | |
| | | | | | | | |
| Total net assets | | | 100.00 | % | | $ | 70,064,127 | |
| | | | | | | | |
| ø | Variable rate demand notes are subject to a demand feature which reduces the effective maturity. The maturity date shown represents the final maturity date of the security. The interest rate is determined and reset by the issuer daily, weekly, or monthly depending upon the terms of the security. The rate shown is the rate in effect at period end. |
| 144A | The security may be resold in transactions exempt from registration, normally to qualified institutional buyers, pursuant to Rule 144A under the Securities Act of 1933. |
| (l) | The issuer of the security is an affiliated person of the Fund as defined in the Investment Company Act of 1940. |
| (u) | The rate represents the 7-day annualized yield at period end. |
The accompanying notes are an integral part of these financial statements.
| | | | | | |
| Portfolio of investments—December 31, 2017 (unaudited) | | Wells Fargo North Carolina Tax-Free Fund | | | 9 | |
Investments in Affiliates
An affiliated investment is an investment in which the Fund owns at least 5% of the outstanding voting shares of the issuer or as a result of other relationships, such as the Fund and the issuer having the same investment manager. Transactions with issuers that were either affiliated persons of the Fund at the beginning of the period or the end of the period were as follows:
| | | | | | | | | | | | | | | | | | | | | | | | | | | | | | | | | | | | |
| | | Shares,
beginning of
period | | | Shares
purchased | | | Shares
sold | | | Shares,
end of
period | | | Net
realized
gains | | | Net
change in
unrealized
gains | | | Income
from
affiliated
securities | | | Value,
end
of period | | | % of
net
assets | |
Short-Term Investments | | | | | | | | | | | | | | | | | | | | | | | | | | | | | | | | | | | | |
Investment Companies | | | | | | | | | | | | | | | | | | | | | | | | | | | | | | | | | | | | |
Wells Fargo Municipal Cash Management Money Market Fund Institutional Class | | | 1,421,745 | | | | 5,468,860 | | | | 6,786,117 | | | | 104,488 | | | $ | 342 | | | $ | 8 | | | $ | 8,915 | | | $ | 104,603 | | | | 0.15 | % |
The accompanying notes are an integral part of these financial statements.
| | | | |
| 10 | | Wells Fargo North Carolina Tax-Free Fund | | Statement of assets and liabilities—December 31, 2017 (unaudited) |
| | | | |
| | | | |
| |
Assets | | | | |
Investments in unaffiliated securities, at value (cost $66,422,088) | | $ | 69,229,594 | |
Investments in affiliated securities, at value (cost $104,584) | | | 104,603 | |
Receivable for investments sold | | | 175,000 | |
Receivable for Fund shares sold | | | 21,795 | |
Receivable for interest | | | 954,594 | |
Prepaid expenses and other assets | | | 66,019 | |
| | | | |
Total assets | | | 70,551,605 | |
| | | | |
| |
Liabilities | | | | |
Payable for Fund shares redeemed | | | 362,409 | |
Dividends payable | | | 67,299 | |
Management fee payable | | | 15,907 | |
Administration fees payable | | | 7,328 | |
Distribution fee payable | | | 2,812 | |
Trustees’ fees and expenses payable | | | 2,057 | |
Accrued expenses and other liabilities | | | 29,666 | |
| | | | |
Total liabilities | | | 487,478 | |
| | | | |
Total net assets | | $ | 70,064,127 | |
| | | | |
| |
NET ASSETS CONSIST OF | | | | |
Paid-in capital | | $ | 70,982,303 | |
Overdistributed net investment income | | | (59,560 | ) |
Accumulated net realized losses on investments | | | (3,666,141 | ) |
Net unrealized gains on investments | | | 2,807,525 | |
| | | | |
Total net assets | | $ | 70,064,127 | |
| | | | |
| |
COMPUTATION OF NET ASSET VALUE AND OFFERING PRICE PER SHARE | | | | |
Net assets – Class A | | $ | 29,322,065 | |
Shares outstanding – Class A1 | | | 2,885,662 | |
Net asset value per share – Class A | | | $10.16 | |
Maximum offering price per share – Class A2 | | | $10.64 | |
Net assets – Class C | | $ | 4,311,350 | |
Shares outstanding – Class C1 | | | 424,321 | |
Net asset value per share – Class C | | | $10.16 | |
Net assets – Institutional Class | | $ | 36,430,712 | |
Shares outstanding – Institutional Class1 | | | 3,585,394 | |
Net asset value per share – Institutional Class | | | $10.16 | |
| 1 | The Fund has an unlimited number of authorized shares. |
| 2 | Maximum offering price is computed as 100/95.50 of net asset value. On investments of $50,000 or more, the offering price is reduced. |
The accompanying notes are an integral part of these financial statements.
| | | | | | |
| Statement of operations—six months ended December 31, 2017 (unaudited) | | Wells Fargo North Carolina Tax-Free Fund | | | 11 | |
| | | | |
| | | | |
| |
Investment income | | | | |
Interest | | $ | 1,301,443 | |
Income from affiliated securities | | | 8,915 | |
| | | | |
Total investment income | | | 1,310,358 | |
| | | | |
| |
Expenses | | | | |
Management fee | | | 146,445 | |
Administration fees | | | | |
Class A | | | 24,332 | |
Class C | | | 3,693 | |
Institutional Class | | | 15,277 | |
Shareholder servicing fees | | | | |
Class A | | | 38,018 | |
Class C | | | 5,770 | |
Distribution fee | | | | |
Class C | | | 17,310 | |
Custody and accounting fees | | | 3,719 | |
Professional fees | | | 21,943 | |
Registration fees | | | 19,913 | |
Shareholder report expenses | | | 11,185 | |
Trustees’ fees and expenses | | | 10,373 | |
Other fees and expenses | | | 1,366 | |
| | | | |
Total expenses | | | 319,344 | |
Less: Fee waivers and/or expense reimbursements | | | (50,037 | ) |
| | | | |
Net expenses | | | 269,307 | |
| | | | |
Net investment income | | | 1,041,051 | |
| | | | |
| |
REALIZED AND UNREALIZED GAINS (LOSSES) ON INVESTMENTS | | | | |
| |
Net realized gains on: | | | | |
Unaffiliated securities | | | 283,340 | |
Affiliated securities | | | 342 | |
| | | | |
Net realized gains on investments | | | 283,682 | |
| | | | |
| |
Net change in unrealized gains (losses) on: | | | | |
Unaffiliated securities | | | (445,992 | ) |
Affiliated securities | | | 8 | |
| | | | |
Net change in unrealized gains (losses) on investments | | | (445,984 | ) |
| | | | |
Net realized and unrealized gains (losses) on investments | | | (162,302 | ) |
| | | | |
Net increase in net assets resulting from operations | | $ | 878,749 | |
| | | | |
The accompanying notes are an integral part of these financial statements.
| | | | |
| 12 | | Wells Fargo North Carolina Tax-Free Fund | | Statement of changes in net assets |
| | | | | | | | | | | | | | | | |
| | | Six months ended
December 31, 2017
(unaudited) | | | Year ended
June 30, 2017 | |
| | | | |
Operations | | | | | | | | | | | | | | | | |
Net investment income | | | | | | $ | 1,041,051 | | | | | | | $ | 2,687,578 | |
Net realized gains on investments | | | | | | | 283,682 | | | | | | | | 2,002,341 | |
Net change in unrealized gains (losses) on investments | | | | | | | (445,984 | ) | | | | | | | (6,243,071 | ) |
| | | | |
Net increase (decrease) in net assets resulting from operations | | | | | | | 878,749 | | | | | | | | (1,553,152 | ) |
| | | | |
| | | | |
Distributions to shareholders from | | | | | | | | | | | | | | | | |
Net investment income | | | | | | | | | | | | | | | | |
Class A | | | | | | | (415,112 | ) | | | | | | | (967,906 | ) |
Class C | | | | | | | (45,704 | ) | | | | | | | (124,609 | ) |
Institutional Class | | | | | | | (580,234 | ) | | | | | | | (1,595,050 | ) |
| | | | |
Total distributions to shareholders | | | | | | | (1,041,050 | ) | | | | | | | (2,687,565 | ) |
| | | | |
| | | | |
Capital share transactions | | | Shares | | | | | | | | Shares | | | | | |
Proceeds from shares sold | | | | | | | | | | | | | | | | |
Class A | | | 45,941 | | | | 467,019 | | | | 69,761 | | | | 715,735 | |
Class C | | | 16,955 | | | | 173,041 | | | | 67,965 | | | | 705,252 | |
Institutional Class | | | 90,745 | | | | 927,169 | | | | 984,070 | | | | 10,114,177 | |
| | | | |
| | | | | | | 1,567,229 | | | | | | | | 11,535,164 | |
| | | | |
Reinvestment of distributions | | | | | | | | | | | | | | | | |
Class A | | | 38,523 | | | | 392,726 | | | | 88,837 | | | | 909,721 | |
Class C | | | 4,206 | | | | 42,882 | | | | 11,459 | | | | 117,338 | |
Institutional Class | | | 21,572 | | | | 219,922 | | | | 44,606 | | | | 456,676 | |
| | | | |
| | | | | | | 655,530 | | | | | | | | 1,483,735 | |
| | | | |
Payment for shares redeemed | | | | | | | | | | | | | | | | |
Class A | | | (213,457 | ) | | | (2,175,967 | ) | | | (624,944 | ) | | | (6,397,052 | ) |
Class C | | | (85,187 | ) | | | (869,936 | ) | | | (168,603 | ) | | | (1,715,963 | ) |
Institutional Class | | | (394,421 | ) | | | (4,030,154 | ) | | | (3,086,406 | ) | | | (31,388,654 | ) |
| | | | |
| | | | | | | (7,076,057 | ) | | | | | | | (39,501,669 | ) |
| | | | |
Net decrease in net assets resulting from capital share transactions | | | | | | | (4,853,298 | ) | | | | | | | (26,482,770 | ) |
| | | | |
Total decrease in net assets | | | | | | | (5,015,599 | ) | | | | | | | (30,723,487 | ) |
| | | | |
| | | | |
Net assets | | | | | | | | | | | | | | | | |
Beginning of period | | | | | | | 75,079,726 | | | | | | | | 105,803,213 | |
| | | | |
End of period | | | | | | $ | 70,064,127 | | | | | | | $ | 75,079,726 | |
| | | | |
Overdistributed net investment income | | | | | | $ | (59,560 | ) | | | | | | $ | (59,561 | ) |
| | | | |
The accompanying notes are an integral part of these financial statements.
| | | | | | |
| Financial highlights | | Wells Fargo North Carolina Tax-Free Fund | | | 13 | |
(For a share outstanding throughout each period)
| | | | | | | | | | | | | | | | | | | | | | | | |
| | | Six months ended
December 31, 2017 (unaudited) | | | Year ended June 30 | |
| CLASS A | | | 2017 | | | 2016 | | | 2015 | | | 2014 | | | 2013 | |
Net asset value, beginning of period | | | $10.19 | | | | $10.60 | | | | $10.36 | | | | $10.33 | | | | $10.08 | | | | $10.34 | |
Net investment income | | | 0.14 | | | | 0.30 | | | | 0.31 | | | | 0.32 | | | | 0.33 | | | | 0.32 | |
Net realized and unrealized gains (losses) on investments | | | (0.03 | ) | | | (0.41 | ) | | | 0.24 | | | | 0.03 | | | | 0.25 | | | | (0.26 | ) |
| | | | | | | | | | | | | | | | | | | | | | | | |
Total from investment operations | | | 0.11 | | | | (0.11 | ) | | | 0.55 | | | | 0.35 | | | | 0.58 | | | | 0.06 | |
Distributions to shareholders from | | | | | | | | | | | | | | | | | | | | | | | | |
Net investment income | | | (0.14 | ) | | | (0.30 | ) | | | (0.31 | ) | | | (0.32 | ) | | | (0.33 | ) | | | (0.32 | ) |
Net asset value, end of period | | | $10.16 | | | | $10.19 | | | | $10.60 | | | | $10.36 | | | | $10.33 | | | | $10.08 | |
Total return1 | | | 1.09 | % | | | (1.03 | )% | | | 5.43 | % | | | 3.35 | % | | | 5.92 | % | | | 0.51 | % |
Ratios to average net assets (annualized) | | | | | | | | | | | | | | | | | | | | | | | | |
Gross expenses | | | 1.00 | % | | | 0.97 | % | | | 0.96 | % | | | 0.94 | % | | | 0.94 | % | | | 0.91 | % |
Net expenses | | | 0.85 | % | | | 0.85 | % | | | 0.85 | % | | | 0.85 | % | | | 0.85 | % | | | 0.85 | % |
Net investment income | | | 2.73 | % | | | 2.91 | % | | | 3.00 | % | | | 3.01 | % | | | 3.32 | % | | | 3.06 | % |
Supplemental data | | | | | | | | | | | | | | | | | | | | | | | | |
Portfolio turnover rate | | | 5 | % | | | 11 | % | | | 7 | % | | | 12 | % | | | 15 | % | | | 15 | % |
Net assets, end of period (000s omitted) | | | $29,322 | | | | $30,710 | | | | $36,890 | | | | $33,969 | | | | $37,067 | | | | $41,879 | |
| 1 | Total return calculations do not include any sales charges. Returns for periods of less than one year are not annualized. |
The accompanying notes are an integral part of these financial statements.
| | | | |
| 14 | | Wells Fargo North Carolina Tax-Free Fund | | Financial highlights |
(For a share outstanding throughout each period)
| | | | | | | | | | | | | | | | | | | | | | | | |
| | | Six months ended
December 31, 2017 (unaudited) | | | Year ended June 30 | |
| CLASS C | | | 2017 | | | 2016 | | | 2015 | | | 2014 | | | 2013 | |
Net asset value, beginning of period | | | $10.19 | | | | $10.60 | | | | $10.36 | | | | $10.33 | | | | $10.08 | | | | $10.34 | |
Net investment income | | | 0.10 | | | | 0.22 | | | | 0.24 | | | | 0.24 | | | | 0.26 | | | | 0.24 | |
Net realized and unrealized gains (losses) on investments | | | (0.03 | ) | | | (0.41 | ) | | | 0.24 | | | | 0.03 | | | | 0.25 | | | | (0.26 | ) |
| | | | | | | | | | | | | | | | | | | | | | | | |
Total from investment operations | | | 0.07 | | | | (0.19 | ) | | | 0.48 | | | | 0.27 | | | | 0.51 | | | | (0.02 | ) |
Distributions to shareholders from | | | | | | | | | | | | | | | | | | | | | | | | |
Net investment income | | | (0.10 | ) | | | (0.22 | ) | | | (0.24 | ) | | | (0.24 | ) | | | (0.26 | ) | | | (0.24 | ) |
Net asset value, end of period | | | $10.16 | | | | $10.19 | | | | $10.60 | | | | $10.36 | | | | $10.33 | | | | $10.08 | |
Total return1 | | | 0.71 | % | | | (1.77 | )% | | | 4.65 | % | | | 2.58 | % | | | 5.13 | % | | | (0.24 | )% |
Ratios to average net assets (annualized) | | | | | | | | | | | | | | | | | | | | | | | | |
Gross expenses | | | 1.75 | % | | | 1.72 | % | | | 1.71 | % | | | 1.69 | % | | | 1.69 | % | | | 1.66 | % |
Net expenses | | | 1.60 | % | | | 1.60 | % | | | 1.60 | % | | | 1.60 | % | | | 1.60 | % | | | 1.60 | % |
Net investment income | | | 1.98 | % | | | 2.15 | % | | | 2.25 | % | | | 2.26 | % | | | 2.56 | % | | | 2.31 | % |
Supplemental data | | | | | | | | | | | | | | | | | | | | | | | | |
Portfolio turnover rate | | | 5 | % | | | 11 | % | | | 7 | % | | | 12 | % | | | 15 | % | | | 15 | % |
Net assets, end of period (000s omitted) | | | $4,311 | | | | $4,974 | | | | $6,121 | | | | $4,431 | | | | $4,566 | | | | $5,164 | |
| 1 | Total return calculations do not include any sales charges. Returns for periods of less than one year are not annualized. |
The accompanying notes are an integral part of these financial statements.
| | | | | | |
| Financial highlights | | Wells Fargo North Carolina Tax-Free Fund | | | 15 | |
(For a share outstanding throughout each period)
| | | | | | | | | | | | | | | | | | | | | | | | |
| | | Six months ended
December 31, 2017 (unaudited) | | | Year ended June 30 | |
| INSTITUTIONAL CLASS | | | 2017 | | | 2016 | | | 2015 | | | 2014 | | | 2013 | |
Net asset value, beginning of period | | | $10.19 | | | | $10.60 | | | | $10.36 | | | | $10.33 | | | | $10.08 | | | | $10.34 | |
Net investment income | | | 0.16 | 1 | | | 0.33 | | | | 0.35 | | | | 0.35 | | | | 0.36 | | | | 0.35 | |
Net realized and unrealized gains (losses) on investments | | | (0.03 | ) | | | (0.41 | ) | | | 0.24 | | | | 0.03 | | | | 0.26 | | | | (0.26 | ) |
| | | | | | | | | | | | | | | | | | | | | | | | |
Total from investment operations | | | 0.13 | | | | (0.08 | ) | | | 0.59 | | | | 0.38 | | | | 0.62 | | | | 0.09 | |
Distributions to shareholders from | | | | | | | | | | | | | | | | | | | | | | | | |
Net investment income | | | (0.16 | ) | | | (0.33 | ) | | | (0.35 | ) | | | (0.35 | ) | | | (0.37 | ) | | | (0.35 | ) |
Net asset value, end of period | | | $10.16 | | | | $10.19 | | | | $10.60 | | | | $10.36 | | | | $10.33 | | | | $10.08 | |
Total return2 | | | 1.25 | % | | | (0.72 | )% | | | 5.76 | % | | | 3.67 | % | | | 6.25 | % | | | 0.82 | % |
Ratios to average net assets (annualized) | | | | | | | | | | | | | | | | | | | | | | | | |
Gross expenses | | | 0.67 | % | | | 0.64 | % | | | 0.63 | % | | | 0.61 | % | | | 0.61 | % | | | 0.58 | % |
Net expenses | | | 0.54 | % | | | 0.54 | % | | | 0.54 | % | | | 0.54 | % | | | 0.54 | % | | | 0.54 | % |
Net investment income | | | 3.04 | % | | | 3.20 | % | | | 3.32 | % | | | 3.32 | % | | | 3.61 | % | | | 3.37 | % |
Supplemental data | | | | | | | | | | | | | | | | | | | | | | | | |
Portfolio turnover rate | | | 5 | % | | | 11 | % | | | 7 | % | | | 12 | % | | | 15 | % | | | 15 | % |
Net assets, end of period (000s omitted) | | | $36,431 | | | | $39,395 | | | | $62,793 | | | | $60,844 | | | | $72,479 | | | | $77,926 | |
| 1 | Calculated based upon average shares outstanding |
| 2 | Returns for periods of less than one year are not annualized. |
The accompanying notes are an integral part of these financial statements.
| | | | |
| 16 | | Wells Fargo North Carolina Tax-Free Fund | | Notes to financial statements (unaudited) |
1. ORGANIZATION
Wells Fargo Funds Trust (the “Trust”), a Delaware statutory trust organized on March 10, 1999, is an open-end management investment company registered under the Investment Company Act of 1940, as amended (the “1940 Act”). As an investment company, the Trust follows the accounting and reporting guidance in Financial Accounting Standards Board Accounting Standards Codification Topic 946, Financial Services – Investment Companies. These financial statements report on the Wells Fargo North Carolina Tax-Free Fund (the “Fund”) which is a non-diversified series of the Trust.
2. SIGNIFICANT ACCOUNTING POLICIES
The following significant accounting policies, which are consistently followed in the preparation of the financial statements of the Fund, are in conformity with U.S. generally accepted accounting principles which require management to make estimates and assumptions that affect the reported amounts of assets and liabilities, disclosure of contingent assets and liabilities at the date of the financial statements, and the reported amounts of revenues and expenses during the reporting period. Actual results could differ from those estimates.
Securities valuation
All investments are valued each business day as of the close of regular trading on the New York Stock Exchange (generally 4 p.m. Eastern Time), although the Fund may deviate from this calculation time under unusual or unexpected circumstances.
Debt securities are valued at the evaluated bid price provided by an independent pricing service or, if a reliable price is not available, the quoted bid price from an independent broker-dealer.
Investments in registered open-end investment companies are valued at net asset value.
Investments which are not valued using any of the methods discussed above are valued at their fair value, as determined in good faith by the Board of Trustees of the Fund. The Board of Trustees has established a Valuation Committee comprised of the Trustees and has delegated to it the authority to take any actions regarding the valuation of portfolio securities that the Valuation Committee deems necessary or appropriate, including determining the fair value of portfolio securities, unless the determination has been delegated to the Management Valuation Team of Wells Fargo Funds Management, LLC (“Funds Management”). The Board of Trustees retains the authority to make or ratify any valuation decisions or approve any changes to the Valuation Procedures as it deems appropriate. On a quarterly basis, the Board of Trustees receives reports on any valuation actions taken by the Valuation Committee or the Management Valuation Team which may include items for ratification.
Valuations of fair valued securities are compared to the next actual sales price when available, or other appropriate market values, to assess the continued appropriateness of the fair valuation methodologies used. These securities are fair valued on a day-to-day basis, taking into consideration changes to appropriate market information and any significant changes to the inputs considered in the valuation process until there is a readily available price provided on an exchange or by an independent pricing service. Valuations received from an independent pricing service or independent broker-dealer quotes are periodically validated by comparisons to most recent trades and valuations provided by other independent pricing services in addition to the review of prices by the manager and/or subadviser. Unobservable inputs used in determining fair valuations are identified based on the type of security, taking into consideration factors utilized by market participants in valuing the investment, knowledge about the issuer and the current market environment.
Security transactions and income recognition
Securities transactions are recorded on a trade date basis. Realized gains or losses are recorded on the basis of identified cost.
Interest income is accrued daily and bond discounts are accreted and premiums are amortized daily based on the effective interest method. To the extent debt obligations are placed on non-accrual status, any related interest income may be reduced by writing off interest receivables when the collection of all or a portion of interest has been determined to be doubtful based on consistently applied procedures and the fair value has decreased. If the issuer subsequently resumes interest payments or when the collectability of interest is reasonably assured, the debt obligation is removed from non-accrual status.
Distributions to shareholders
Distributions to shareholders from net investment income are accrued daily and paid monthly. Distributions from net realized gains, if any, are recorded on the ex-dividend date. Such distributions are determined in accordance with income tax regulations and may differ from U.S. generally accepted accounting principles. Dividend sources are estimated at the time of declaration. The tax character of distributions is determined as of the Fund’s fiscal year end. Therefore, a portion of the Fund’s distributions made prior to the Fund’s fiscal year end may be categorized as a tax return of capital.
| | | | | | |
| Notes to financial statements (unaudited) | | Wells Fargo North Carolina Tax-Free Fund | | | 17 | |
Federal and other taxes
The Fund intends to continue to qualify as a regulated investment company by distributing substantially all of its investment company taxable and tax-exempt income and any net realized capital gains (after reduction for capital loss carryforwards) sufficient to relieve it from all, or substantially all, federal income taxes. Accordingly, no provision for federal income taxes was required.
The Fund’s income and federal excise tax returns and all financial records supporting those returns for the prior three fiscal years are subject to examination by the federal and Delaware revenue authorities. Management has analyzed the Fund’s tax positions taken on federal, state, and foreign tax returns for all open tax years and does not believe that there are any uncertain tax positions that require recognition of a tax liability.
As of December 31, 2017, the aggregate cost of all investments for federal income tax purposes was $66,526,672 and the unrealized gains (losses) consisted of:
| | | | |
Gross unrealized gains | | $ | 3,387,075 | |
Gross unrealized losses | | | (579,550 | ) |
Net unrealized gains | | $ | 2,807,525 | |
As of June 30, 2017, the Fund had capital loss carryforwards available to offset future net realized capital gains in the amount of $3,623,438 expiring in 2018.
As of June 30, 2017, the Fund had current year deferred post-October capital losses consisting of $326,385 in short-term losses which was recognized on the first day of the current fiscal year.
Class allocations
The separate classes of shares offered by the Fund differ principally in applicable sales charges, distribution, shareholder servicing, and administration fees. Class specific expenses are charged directly to that share class. Investment income, common expenses, and realized and unrealized gains (losses) on investments are allocated daily to each class of shares based on the relative proportion of net assets of each class.
3. FAIR VALUATION MEASUREMENTS
Fair value measurements of investments are determined within a framework that has established a fair value hierarchy based upon the various data inputs utilized in determining the value of the Fund’s investments. The three-level hierarchy gives the highest priority to unadjusted quoted prices in active markets for identical assets or liabilities (Level 1) and the lowest priority to unobservable inputs (Level 3). The Fund’s investments are classified within the fair value hierarchy based on the lowest level of input that is significant to the fair value measurement. The inputs are summarized into three broad levels as follows:
| ∎ | | Level 1 – quoted prices in active markets for identical securities |
| ∎ | | Level 2 – other significant observable inputs (including quoted prices for similar securities, interest rates, prepayment speeds, credit risk, etc.) |
| ∎ | | Level 3 – significant unobservable inputs (including the Fund’s own assumptions in determining the fair value of investments) |
The inputs or methodologies used for valuing investments in securities are not necessarily an indication of the risk associated with investing in those securities.
The following is a summary of the inputs used in valuing the Fund’s assets and liabilities as of December 31, 2017:
| | | | | | | | | | | | | | | | |
| | | Quoted prices
(Level 1) | | | Other significant
observable inputs
(Level 2) | | | Significant
unobservable inputs (Level 3) | | | Total | |
Assets | | | | | | | | | | | | | | | | |
Investments in: | | | | | | | | | | | | | | | | |
| | | | |
Municipal obligations | | $ | 0 | | | $ | 69,229,594 | | | $ | 0 | | | $ | 69,229,594 | |
| | | | |
Short-term investments | | | | | | | | | | | | | | | | |
Investment companies | | | 104,603 | | | | 0 | | | | 0 | | | | 104,603 | |
Total assets | | $ | 104,603 | | | $ | 69,229,594 | | | $ | 0 | | | $ | 69,334,197 | |
| | | | |
| 18 | | Wells Fargo North Carolina Tax-Free Fund | | Notes to financial statements (unaudited) |
The Fund recognizes transfers between levels within the fair value hierarchy at the end of the reporting period. At December 31, 2017, the Fund did not have any transfers into/out of Level 1, Level 2, or Level 3.
4. TRANSACTIONS WITH AFFILIATES
Management fee
Funds Management, an indirect wholly owned subsidiary of Wells Fargo & Company (“Wells Fargo”), is the manager of the Fund and provides advisory and fund-level administrative services under an investment management agreement. Under the investment management agreement, Funds Management is responsible for, among other services, implementing the investment objectives and strategies of the Fund, supervising the subadviser, providing fund-level administrative services in connection with the Fund’s operations, and providing any other fund-level administrative services reasonably necessary for the operation of the Fund. As compensation for its services under the investment management agreement, Funds Management is entitled to receive an annual management fee starting at 0.40% and declining to 0.28% as the average daily net assets of the Fund increase. For the six months ended December 31, 2017, the management fee was equivalent to an annual rate of 0.40% of the Fund’s average daily net assets.
Funds Management has retained the services of a subadviser to provide daily portfolio management to the Fund. The fee for subadvisory services is borne by Funds Management. Wells Capital Management Incorporated, an affiliate of Funds Management and an indirect wholly owned subsidiary of Wells Fargo, is the subadviser to the Fund and is entitled to receive a fee from Funds Management at an annual rate starting at 0.20% and declining to 0.10% as the average daily net assets of the Fund increase.
Administration fees
Under a class-level administration agreement, Funds Management provides class-level administrative services to the Fund, which includes paying fees and expenses for services provided by the transfer agent, sub-transfer agents, omnibus account servicers and record-keepers. As compensation for its services under the class-level administration agreement, Funds Management receives an annual fee which is calculated based on the average daily net assets of each class as follows:
| | | | |
| | | Class-level
administration fee | |
Class A, Class C | | | 0.16 | % |
Institutional Class | | | 0.08 | |
Funds Management has contractually waived and/or reimbursed management and administration fees to the extent necessary to maintain certain net operating expense ratios for the Fund. Waiver of fees and/or reimbursement of expenses by Funds Management were made first from fund level expenses on a proportionate basis and then from class specific expenses. Funds Management has committed through October 31, 2018 to waive fees and/or reimburse expenses to the extent necessary to cap the Fund’s expenses at 0.85% for Class A shares, 1.60% for Class C shares, and 0.54% for Institutional Class shares. After this time, the cap may be increased or the commitment to maintain the cap may be terminated only with the approval of the Board of Trustees.
Distribution fee
The Trust has adopted a distribution plan for Class C shares of the Fund pursuant to Rule 12b-1 under the 1940 Act. A Distribution fee is charged to Class C and paid to Wells Fargo Funds Distributor, LLC (“Funds Distributor”), the principal underwriter, at an annual rate of 0.75% of the average daily net assets of Class C shares.
In addition, Funds Distributor is entitled to receive the front-end sales charge from the purchase of Class A shares and a contingent deferred sales charge on the redemption of certain Class A shares. Funds Distributor is also entitled to receive the contingent deferred sales charges from redemptions of Class C shares. For the six months ended December 31, 2017, Funds Distributor received $30 from the sale of Class A shares. No contingent deferred sales charges were incurred by Class A and Class C shares for the six months ended December 31, 2017.
Shareholder servicing fees
The Trust has entered into contracts with one or more shareholder servicing agents, whereby Class A and Class C of the Fund are charged a fee at an annual rate of 0.25% of the average daily net assets of each respective class.
A portion of these total shareholder servicing fees were paid to affiliates of Wells Fargo.
| | | | | | |
| Notes to financial statements (unaudited) | | Wells Fargo North Carolina Tax-Free Fund | | | 19 | |
Interfund transactions
The Fund may purchase or sell portfolio investment securities to certain other Wells Fargo affiliates pursuant to Rule 17a-7 under the 1940 Act and under procedures adopted by the Board of Trustees. The procedures have been designed to ensure that these interfund transactions, which do not incur broker commissions, are effected at current market prices. Pursuant to these procedures, the Fund had $2,000,000 and $2,600,000 in interfund purchases and sales, respectively, during the six months ended December 31, 2017.
5. INVESTMENT PORTFOLIO TRANSACTIONS
Purchases and sales of investments, excluding U.S. government obligations (if any) and short-term securities, for the six months ended December 31, 2017 were $3,146,245 and $5,271,894, respectively.
6. BANK BORROWINGS
The Trust (excluding the money market funds and certain other funds) and Wells Fargo Variable Trust are parties to a $280,000,000 revolving credit agreement whereby the Fund is permitted to use bank borrowings for temporary or emergency purposes, such as to fund shareholder redemption requests. Interest under the credit agreement is charged to the Fund based on a borrowing rate equal to the higher of the Federal Funds rate in effect on that day plus 1.25% or the overnight LIBOR rate in effect on that day plus 1.25%. In addition, an annual commitment fee equal to 0.25% of the unused balance is allocated to each participating fund. Prior to August 29, 2017, the revolving credit agreement amount was $250,000,000.
For the six months ended December 31, 2017, there were no borrowings by the Fund under the agreement.
7. CONCENTRATION RISK
The Fund invests a substantial portion of its assets in issuers of municipal debt securities located in a single state or territories of the U.S. Therefore, it may be more affected by economic and political developments in that state or region than would be a comparable general tax-exempt fund.
8. INDEMNIFICATION
Under the Trust’s organizational documents, the officers and Trustees have been granted certain indemnification rights against certain liabilities that may arise out of performance of their duties to the Trust. Additionally, in the normal course of business, the Trust may enter into contracts with service providers that contain a variety of indemnification clauses. The Trust’s maximum exposure under these arrangements is dependent on future claims that may be made against the Fund and, therefore, cannot be estimated.
| | | | |
| 20 | | Wells Fargo North Carolina Tax-Free Fund | | Other information (unaudited) |
PROXY VOTING INFORMATION
A description of the policies and procedures that the Fund uses to determine how to vote proxies relating to portfolio securities is available, upon request, by calling 1-800-222-8222, visiting our website at wellsfargofunds.com, or visiting the SEC website at sec.gov. Information regarding how the Fund voted proxies relating to portfolio securities during the most recent 12-month period ended June 30 is available on the Fund’s website at wellsfargofunds.com or by visiting the SEC website at sec.gov.
PORTFOLIO HOLDINGS INFORMATION
The complete portfolio holdings for the Fund are publicly available monthly on the Fund’s website (wellsfargofunds.com), on a one-month delayed basis. In addition, top ten holdings information (excluding derivative positions) for the Fund is publicly available on the Fund’s website on a monthly, seven-day or more delayed basis. The Fund files its complete schedule of portfolio holdings with the SEC for the first and third quarters of each fiscal year on Form N-Q, which is available by visiting the SEC website at sec.gov. In addition, the Fund’s Form N-Q may be reviewed and copied at the SEC’s Public Reference Room in Washington, DC, and at regional offices in New York City, at 233 Broadway, and in Chicago, at 175 West Jackson Boulevard, Suite 900. Information about the Public Reference Room may be obtained by calling 1-800-SEC-0330.
| | | | | | |
| Other information (unaudited) | | Wells Fargo North Carolina Tax-Free Fund | | | 21 | |
BOARD OF TRUSTEES AND OFFICERS
Each of the Trustees and Officers1 listed in the table below acts in identical capacities for each fund in the Wells Fargo family of funds, which consists of 153 mutual funds comprising the Wells Fargo Funds Trust, Wells Fargo Variable Trust, Wells Fargo Master Trust and four closed-end funds (collectively the “Fund Complex”). This table should be read in conjunction with the Prospectus and the Statement of Additional Information2. The mailing address of each Trustee and Officer is 525 Market Street, 12th Floor, San Francisco, CA 94105. Each Trustee and Officer serves an indefinite term, however, each Trustee serves such term until reaching the mandatory retirement age established by the Trustees.
Independent Trustees
| | | | | | |
Name and year of birth | | Position held and length of service* | | Principal occupations during past five years or longer | | Current other
public company or
investment company
directorships |
William R. Ebsworth (Born 1957) | | Trustee, since 2015 | | Retired. From 1984 to 2013, equities analyst, portfolio manager, research director and chief investment officer at Fidelity Management and Research Company in Boston, Tokyo, and Hong Kong, and retired in 2013 as Chief Investment Officer of Fidelity Strategic Advisers, Inc. where he led a team of investment professionals managing client assets. Prior thereto, Board member of Hong Kong Securities Clearing Co., Hong Kong Options Clearing Corp., the Thailand International Fund, Ltd., Fidelity Investments Life Insurance Company, and Empire Fidelity Investments Life Insurance Company. Board member of the Forté Foundation (non-profit organization) and the Vincent Memorial Hospital Endowment (non-profit organization), where he serves on the Investment Committee and as a Chair of the Audit Committee. Mr. Ebsworth is a CFA® charterholder. | | Asset Allocation Trust |
Jane A. Freeman** (Born 1953) | | Trustee, since 2015; Chair Liaison, since 2018 | | Retired. From 2012 to 2014 and 1999 to 2008, Chief Financial Officer of Scientific Learning Corporation. From 2008 to 2012, Ms. Freeman provided consulting services related to strategic business projects. Prior to 1999, Portfolio Manager at Rockefeller & Co. and Scudder, Stevens & Clark. Board member of the Harding Loevner Funds from 1996 to 2014, serving as both Lead Independent Director and chair of the Audit Committee. Board member of the Russell Exchange Traded Funds Trust from 2011 to 2012 and the chair of the Audit Committee. Ms. Freeman is a Board Member of Ruth Bancroft Garden (non-profit organization) and the Glimmerglass Festival. She is also an inactive Chartered Financial Analyst. | | Asset Allocation Trust |
Peter G. Gordon*** (Born 1942) | | Trustee, since 1998; Chairman, from 2005 to 2017 | | Co-Founder, Retired Chairman, President and CEO of Crystal Geyser Water Company. Trustee Emeritus, Colby College. | | Asset Allocation Trust |
Isaiah Harris, Jr. (Born 1952) | | Trustee, since 2009 | | Retired. Chairman of the Board of CIGNA Corporation since 2009, and Director since 2005. From 2003 to 2011, Director of Deluxe Corporation. Prior thereto, President and CEO of BellSouth Advertising and Publishing Corp. from 2005 to 2007, President and CEO of BellSouth Enterprises from 2004 to 2005 and President of BellSouth Consumer Services from 2000 to 2003. Emeritus member of the Iowa State University Foundation Board of Governors. Emeritus Member of the Advisory Board of Iowa State University School of Business. Advisory Board Member, Palm Harbor Academy (charter school). Advisory Board Member, Child Evangelism Fellowship (non-profit). Mr. Harris is a certified public accountant (inactive status). | | CIGNA Corporation; Asset Allocation Trust |
Judith M. Johnson (Born 1949) | | Trustee, since 2008; Audit Committee Chairman, since 2008 | | Retired. Prior thereto, Chief Executive Officer and Chief Investment Officer of Minneapolis Employees Retirement Fund from 1996 to 2008. Ms. Johnson is an attorney, certified public accountant and a certified managerial accountant. | | Asset Allocation Trust |
David F. Larcker (Born 1950) | | Trustee, since 2009 | | James Irvin Miller Professor of Accounting at the Graduate School of Business, Stanford University, Director of the Corporate Governance Research Initiative and Senior Faculty of The Rock Center for Corporate Governance since 2006. From 2005 to 2008, Professor of Accounting at the Graduate School of Business, Stanford University. Prior thereto, Ernst & Young Professor of Accounting at The Wharton School, University of Pennsylvania from 1985 to 2005. | | Asset Allocation Trust |
| | | | |
| 22 | | Wells Fargo North Carolina Tax-Free Fund | | Other information (unaudited) |
| | | | | | |
Name and year of birth | | Position held and length of service* | | Principal occupations during past five years or longer | | Current other
public company or
investment company
directorships |
Olivia S. Mitchell**** (Born 1953) | | Trustee, since 2006; Governance Committee Chairman, since 2018 | | International Foundation of Employee Benefit Plans Professor, Wharton School of the University of Pennsylvania since 1993. Director of Wharton’s Pension Research Council and Boettner Center on Pensions & Retirement Research, and Research Associate at the National Bureau of Economic Research. Previously, Cornell University Professor from 1978 to 1993. | | Asset Allocation Trust |
Timothy J. Penny***** (Born 1951) | | Trustee, since 1996; Chairman, since 2018; Vice Chairman, from 2017 to 2018 | | President and Chief Executive Officer of Southern Minnesota Initiative Foundation, a non-profit organization, since 2007. Member of the Board of Trustees of NorthStar Education Finance, Inc., a non-profit organization, since 2007. | | Asset Allocation Trust |
James G. Polisson****** (Born 1959) | | Trustee, since 2018; Advisory Board Member, from 2017 to 2018 | | Retired. Chief Marketing Officer, Source (ETF) UK Services, Ltd, from 2015 to 2017. From 2012 to 2015, Principal of The Polisson Group, LLC, a management consulting, corporate advisory and principal investing company. Chief Executive Officer and Managing Director at Russell Investments, Global Exchange Traded Funds from 2010 to 2012. Managing Director of Barclays Global Investors from 1998 to 2010 and Global Chief Marketing Officer for iShares and Barclays Global Investors from 2000 to 2010. Trustee of the San Francisco Mechanics’ Institute, a non-profit organization, from 2013 to 2015. Board member of the Russell Exchange Traded Fund Trust from 2011 to 2012. Director of Barclays Global Investors Holdings Deutschland GmbH from 2006 to 2009. Mr. Polisson is an attorney and has a retired status with the Massachusetts and District of Columbia Bar Associations. | | Asset Allocation Trust |
Michael S. Scofield (Born 1943) | | Trustee, since 2010 | | Served on the Investment Company Institute’s Board of Governors and Executive Committee from 2008-2011 as well the Governing Council of the Independent Directors Council from 2006-2011 and the Independent Directors Council Executive Committee from 2008-2011. Trustee of the Evergreen Funds complex (and its predecessors) from 1984 to 2010. Chairman of the Evergreen Funds from 2000-2010. Former Trustee of the Mentor Funds. Retired Attorney, Law Offices of Michael S. Scofield. | | Asset Allocation Trust |
Pamela Wheelock****** (Born 1959) | | Trustee, since 2018; Advisory Board Member, from 2017 to 2018 | | Chief Operating Officer, Twin Cities Habitat for Humanity, since January, 2017. Vice President of University Services, University of Minnesota from 2012 to 2017. Prior thereto, Interim President and Chief Executive Officer of Blue Cross Blue Shield of Minnesota from 2010 to 2011, Chairman of the Board from 2009 to 2011 and Board Director from 2003 to 2015. Vice President, Leadership and Community Engagement, Bush Foundation, Saint Paul, Minnesota (a private foundation) from 2009 to 2011. Executive Vice President and Chief Financial Officer, Minnesota Sports and Entertainment from 2004 to 2009 and Senior Vice President from 2002 to 2004. Commissioner of Finance, State of Minnesota, from 1999 to 2002. Currently on the Board of Directors, Governance Committee and Finance Committee, for the Minnesota Philanthropy Partners (Saint Paul Foundation) since 2012 and Board Chair of the Minnesota Wild Foundation since 2010. | | Asset Allocation Trust |
| * | Length of service dates reflect the Trustee’s commencement of service with the Trust’s predecessor entities, where applicable. |
| ** | Jane Freeman became Chair Liaison effective January 1, 2018. |
| *** | Peter Gordon retired on December 31, 2017. |
| **** | Olivia Mitchell became Chairman of the Governance Committee effective January 1, 2018. |
| ***** | Timothy Penny became Chairman effective January 1, 2018. |
| ****** | James Polisson and Pamela Wheelock each became a Trustee effective January 1, 2018. |
| | | | | | |
| Other information (unaudited) | | Wells Fargo North Carolina Tax-Free Fund | | | 23 | |
Officers
| | | | | | |
Name and year of birth | | Position held and length of service | | Principal occupations during past five years or longer | | |
Andrew Owen (Born 1960) | | President, since 2017 | | Executive Vice President of Wells Fargo & Company and Head of Affiliated Managers, Wells Fargo Asset Management, since 2014. In addition, Mr. Owen is currently President, Chief Executive Officer and Director of Wells Fargo Funds Management, LLC since 2017. Prior thereto, Executive Vice President responsible for marketing, investments and product development for Wells Fargo Funds Management, LLC, from 2009 to 2014. | | |
Nancy Wiser1 (Born 1967) | | Treasurer, since 2012 | | Executive Vice President of Wells Fargo Funds Management, LLC since 2011. Chief Operating Officer and Chief Compliance Officer at LightBox Capital Management LLC, from 2008 to 2011. | | |
C. David Messman (Born 1960) | | Secretary, since 2000; Chief Legal Officer, since 2003 | | Senior Vice President and Secretary of Wells Fargo Funds Management, LLC since 2001. Assistant General Counsel of Wells Fargo Bank, N.A. since 2013 and Vice President and Managing Counsel of Wells Fargo Bank, N.A. from 1996 to 2013. | | |
| Michael H. Whitaker (Born 1967) | | Chief Compliance Officer, since 2016 | | Senior Vice President and Chief Compliance Officer since 2016. Senior Vice President and Chief Compliance Officer for Fidelity Investments from 2007 to 2016. | | |
David Berardi (Born 1975) | | Assistant Treasurer, since 2009 | | Vice President of Wells Fargo Funds Management, LLC since 2009. Vice President of Evergreen Investment Management Company, LLC from 2008 to 2010. Manager of Fund Reporting and Control for Evergreen Investment Management Company, LLC from 2004 to 2010. | | |
Jeremy DePalma1 (Born 1974) | | Assistant Treasurer, since 2009 | | Senior Vice President of Wells Fargo Funds Management, LLC since 2009. Senior Vice President of Evergreen Investment Management Company, LLC from 2008 to 2010 and head of the Fund Reporting and Control Team within Fund Administration from 2005 to 2010. | | |
| 1 | Nancy Wiser acts as Treasurer of 77 funds in the Fund Complex. Jeremy DePalma acts as Treasurer of 76 funds and Assistant Treasurer of 77 funds in the Fund Complex. |
| 2 | The Statement of Additional Information includes additional information about the Trustees and is available, without charge, upon request, by calling 1-800-222-8222 or by visiting the website at wellsfargofunds.com. |
| | | | |
| 24 | | Wells Fargo North Carolina Tax-Free Fund | | List of abbreviations |
The following is a list of common abbreviations for terms and entities that may have appeared in this report.
| ACA | — ACA Financial Guaranty Corporation |
| ADR | — American depositary receipt |
| ADS | — American depositary shares |
| AGC | — Assured Guaranty Corporation |
| AGM | — Assured Guaranty Municipal |
| Ambac | — Ambac Financial Group Incorporated |
| AMT | — Alternative minimum tax |
| BAN | — Bond anticipation notes |
| BHAC | — Berkshire Hathaway Assurance Corporation |
| CAB | — Capital appreciation bond |
| CCAB | — Convertible capital appreciation bond |
| CDA | — Community Development Authority |
| CDO | — Collateralized debt obligation |
| CLO | — Collateralized loan obligation |
| DRIVER | — Derivative inverse tax-exempt receipts |
| DW&P | — Department of Water & Power |
| DWR | — Department of Water Resources |
| ECFA | — Educational & Cultural Facilities Authority |
| EDA | — Economic Development Authority |
| EDFA | — Economic Development Finance Authority |
| ETF | — Exchange-traded fund |
| FDIC | — Federal Deposit Insurance Corporation |
| FFCB | — Federal Farm Credit Banks |
| FGIC | — Financial Guaranty Insurance Corporation |
| FHA | — Federal Housing Administration |
| FHLB | — Federal Home Loan Bank |
| FHLMC | — Federal Home Loan Mortgage Corporation |
| FICO | — The Financing Corporation |
| FNMA | — Federal National Mortgage Association |
| GDR | — Global depositary receipt |
| GNMA | — Government National Mortgage Association |
| HCFR | — Healthcare facilities revenue |
| HEFA | — Health & Educational Facilities Authority |
| HEFAR | — Higher education facilities authority revenue |
| HFA | — Housing Finance Authority |
| HFFA | — Health Facilities Financing Authority |
| HUD | — Department of Housing and Urban Development |
| IDA | — Industrial Development Authority |
| IDAG | — Industrial Development Agency |
| KRW | — Republic of Korea won |
| LIBOR | — London Interbank Offered Rate |
| LIFER | — Long Inverse Floating Exempt Receipts |
| LLC | — Limited liability company |
| LLLP | — Limited liability limited partnership |
| LLP | — Limited liability partnership |
| MBIA | — Municipal Bond Insurance Association |
| MFHR | — Multifamily housing revenue |
| MSTR | — Municipal securities trust receipts |
| MUD | — Municipal Utility District |
| National | — National Public Finance Guarantee Corporation |
| PCFA | — Pollution Control Financing Authority |
| PCL | — Public Company Limited |
| PCR | — Pollution control revenue |
| PFA | — Public Finance Authority |
| PFFA | — Public Facilities Financing Authority |
| PFOTER | — Puttable floating option tax-exempt receipts |
| PJSC | — Public Joint Stock Company |
| plc | — Public limited company |
| PUTTER | — Puttable tax-exempt receipts |
| R&D | — Research & development |
| Radian | — Radian Asset Assurance |
| RAN | — Revenue anticipation notes |
| RDA | — Redevelopment Agency |
| RDFA | — Redevelopment Finance Authority |
| REIT | — Real estate investment trust |
| ROC | — Reset option certificates |
| SAVRS | — Select auction variable rate securities |
| SBA | — Small Business Authority |
| SDR | — Swedish depositary receipt |
| SFHR | — Single-family housing revenue |
| SFMR | — Single-family mortgage revenue |
| SIFMA | — Securities Industry and Financial Markets Association |
| SPA | — Standby purchase agreement |
| SPDR | — Standard & Poor’s Depositary Receipts |
| SPEAR | — Short Puttable Exempt Adjustable Receipts |
| STRIPS | — Separate trading of registered interest and |
| TAN | — Tax anticipation notes |
| TIPS | — Treasury inflation-protected securities |
| TRAN | — Tax revenue anticipation notes |
| TTFA | — Transportation Trust Fund Authority |
| TVA | — Tennessee Valley Authority |

For more information
More information about Wells Fargo Funds is available free upon request. To obtain literature, please write, email, visit the Fund’s website, or call:
Wells Fargo Funds
P.O. Box 8266
Boston, MA 02266-8266
Email: fundservice@wellsfargo.com
Website: wellsfargofunds.com
Individual investors: 1-800-222-8222
Retail investment professionals: 1-888-877-9275
Institutional investment professionals:
1-866-765-0778
This report and the financial statements contained herein are submitted for the general information of the shareholders of the Fund. If this report is used for promotional purposes, distribution of the report must be accompanied or preceded by a current prospectus. Before investing, please consider the investment objectives, risks, charges, and expenses of the investment. For a current prospectus and, if available, a summary prospectus, containing this information, call 1-800-222-8222 or visit the Fund’s website at wellsfargofunds.com. Read the prospectus carefully before you invest or send money.
Wells Fargo Asset Management (WFAM) is a trade name used by the asset management businesses of Wells Fargo & Company. Wells Fargo Funds Management, LLC, a wholly owned subsidiary of Wells Fargo & Company, provides investment advisory and administrative services for Wells Fargo Funds. Other affiliates of Wells Fargo & Company provide subadvisory and other services for the funds. The funds are distributed by Wells Fargo Funds Distributor, LLC, Member FINRA, an affiliate of Wells Fargo & Company. Neither Wells Fargo Funds Distributor nor Wells Fargo Funds Management holds fund shareholder accounts or assets. This material is for general informational and educational purposes only and is NOT intended to provide investment advice or a recommendation of any kind—including a recommendation for any specific investment, strategy, or plan.
NOT FDIC INSURED ◾ NO BANK GUARANTEE ◾ MAY LOSE VALUE
© 2017 Wells Fargo Funds Management, LLC. All rights reserved.
| | |
 | | 308065 02-18 SA254/SAR254 12-17 |
Semi-Annual Report
December 31, 2017

Wells Fargo Pennsylvania Tax-Free Fund


Reduce clutter. Save trees.
Sign up for electronic delivery of prospectuses and shareholder reports at wellsfargo.com/advantagedelivery
Contents
The views expressed and any forward-looking statements are as of December 31, 2017, unless otherwise noted, and are those of the Fund managers and/or Wells Fargo Funds Management, LLC. Discussions of individual securities, or the markets generally, or any Wells Fargo Fund are not intended as individual recommendations. Future events or results may vary significantly from those expressed in any forward-looking statements. The views expressed are subject to change at any time in response to changing circumstances in the market. Wells Fargo Funds Management, LLC and the Fund disclaim any obligation to publicly update or revise any views expressed or forward-looking statements.
NOT FDIC INSURED ◾ NO BANK GUARANTEE ◾ MAY LOSE VALUE
| | | | |
| 2 | | Wells Fargo Pennsylvania Tax-Free Fund | | Letter to shareholders (unaudited) |

Andrew Owen
President
Wells Fargo Funds
In a predominantly improving global economic environment, global stocks delivered strong results; bond markets had smaller but positive results as well.
Dear Shareholder:
We are pleased to offer you this semi-annual report for the Wells Fargo Pennsylvania Tax-Free Fund for the six-month period that ended December 31, 2017. In a predominantly improving global economic environment, global stocks delivered strong results; bond markets had smaller but positive results as well. U.S. and international stocks delivered similar results, with returns of 11.42% and 11.48%, respectively, for the six-month period, as measured by the S&P 500 Index1 and the MSCI ACWI ex USA Index (Net)2, respectively; within fixed income, the Bloomberg Barclays U.S. Aggregate Bond Index3 returned 1.24% and the Bloomberg Barclays Municipal Bond Index4 returned 1.82%.
As global growth improved in the third quarter of 2017, investment markets generally advanced.
Most stock markets worldwide moved higher during the quarter and ended the period at or near all-time highs. Moderate acceleration in global economic growth was supported by improving corporate earnings, low inflation pressure, and still-low interest rates. Corporate earnings reports were favorable overall as companies continued to benefit from healthy operating leverage. While North Korea’s recent missile launches and nuclear testing raised serious concerns around the world, the heightened geopolitical risk had relatively minimal impact on the quarter’s stock returns. In the U.S., economic data released during the quarter reflected a generally healthy economy. Second-quarter economic output grew at a 3.1% annual rate, and consumers displayed more willingness to spend. Meanwhile, the U.S. Federal Reserve (Fed) maintained the target range for the federal funds rate at 1.00% to 1.25%, noting that inflation had remained below the Fed’s 2.00% objective. However, the Fed also stated the possibility of one more 0.25% increase in the federal funds rate by the end of 2017 and announced plans to begin the process of unwinding its $4.5 trillion portfolio of bonds and other assets in October. Outside the U.S., stocks in the Asia Pacific region benefited from solid earnings reports and investors’ willingness to take on risk despite the rising tensions between North Korea and the U.S. In Europe, markets were supported by better-than-expected economic growth, which led to narrowing of the gap between Europe’s growth rate and that of the U.S. In emerging markets, many countries benefited from stronger currencies versus the U.S. dollar.
Positive economic and market news continued through the fourth quarter.
During the fourth quarter of 2017, stock markets followed a steady, upward trajectory with no meaningful pullbacks, similar to their paths during the previous three quarters of the year. The extended rally was driven largely by reports of strong earnings and revenue surprises from many companies. Synchronous economic expansion worldwide with mild inflation provided a favorable environment for markets to rise with minimal volatility. Data released during the quarter reflected a
| 1 | The S&P 500 Index consists of 500 stocks chosen for market size, liquidity, and industry group representation. It is a market-value-weighted index with each stock’s weight in the index proportionate to its market value. You cannot invest directly in an index. |
| 2 | The Morgan Stanley Capital International (MSCI) All Country World Index (ACWI) ex USA Index (Net) is a free-float-adjusted market-capitalization-weighted index that is designed to measure the equity market performance of developed markets, excluding the United States and Canada. Source: MSCI. MSCI makes no express or implied warranties or representations and shall have no liability whatsoever with respect to any MSCI data contained herein. The MSCI data may not be further redistributed or used as a basis for other indices or any securities or financial products. This report is not approved, reviewed, or produced by MSCI. You cannot invest directly in an index. |
| 3 | The Bloomberg Barclays U.S. Aggregate Bond Index is a broad-based benchmark that measures the investment-grade, U.S. dollar-denominated, fixed-rate taxable bond market, including Treasuries, government-related and corporate securities, mortgage-backed securities (agency fixed-rate and hybrid adjustable-rate mortgage pass-throughs), asset-backed securities, and commercial mortgage-backed securities. You cannot invest directly in an index. |
| 4 | The Bloomberg Barclays Municipal Bond Index is an unmanaged index composed of long-term tax-exempt bonds with a minimum credit rating of Baa. You cannot invest directly in an index. |
| | | | | | |
| Letter to shareholders (unaudited) | | Wells Fargo Pennsylvania Tax-Free Fund | | | 3 | |
healthy U.S. economy. Third-quarter economic output grew at a 3.2% annual rate, just ahead of the second quarter’s 3.1% pace. Hiring remained solid during the quarter; the hiring pace pushed the unemployment rate down to a 17-year low of 4.1% in October, and it remained at 4.1% for both November and December. Fed officials began unwinding the Fed’s $4.5 trillion portfolio of bonds and other assets in October as planned, and in December they raised the target for the federal funds rate to a range of 1.25% to 1.50%. As a result, long-term interest rates in the U.S. continued trending upward, although the 10-year rate remained below 2.5%. Outside the U.S., economies continued to strengthen. In December, the Organisation for Economic Co-operation and Development (OECD) reported that the global economy has been expanding at its fastest rate since 2010; all 45 countries the OECD follows were on track to expand for 2017. International economies have benefited from catalysts such as economic stimulus, improving employment, increased investment, and accelerated trade growth.
Don’t let short-term uncertainty derail long-term investment goals.
Periods of investment uncertainty can present challenges, but experience has taught us that maintaining long-term investment goals can be an effective way to plan for the future. To help you create a sound strategy based on your personal goals and risk tolerance, Wells Fargo Funds offers more than 100 mutual funds spanning a wide range of asset classes and investment styles. Although diversification cannot guarantee an investment profit or prevent losses, we believe it can be an effective way to manage investment risk and potentially smooth out overall portfolio performance. We encourage investors to know their investments and to understand that appropriate levels of risk-taking may unlock opportunities.
Thank you for choosing to invest with Wells Fargo Funds. We appreciate your confidence in us and remain committed to helping you meet your financial needs.
Sincerely,

Andrew Owen
President
Wells Fargo Funds
Although diversification cannot guarantee an investment profit or prevent losses, we believe it can be an effective way to manage investment risk and potentially smooth out overall portfolio performance.
For further information about your Fund, contact your investment professional, visit our website at wellsfargofunds.com, or call us directly at 1-800-222-8222. We are available 24 hours a day, 7 days a week.
| | | | |
| 4 | | Wells Fargo Pennsylvania Tax-Free Fund | | Performance highlights (unaudited) |
Investment objective
The Fund seeks current income exempt from federal income tax and Pennsylvania individual income tax.
Manager
Wells Fargo Funds Management, LLC
Subadviser
Wells Capital Management Incorporated
Portfolio managers
Bruce R. Johns
Robert J. Miller
Average annual total returns (%) as of December 31, 20171
| | | | | | | | | | | | | | | | | | | | | | | | | | | | | | | | | | |
| | | | | Including sales charge | | | Excluding sales charge | | | Expense ratios2 (%) | |
| | | Inception date | | 1 year | | | 5 year | | | 10 year | | | 1 year | | | 5 year | | | 10 year | | | Gross | | | Net3 | |
| Class A (EKVAX) | | 12-27-1990 | | | 0.27 | | | | 2.21 | | | | 3.96 | | | | 4.99 | | | | 3.16 | | | | 4.44 | | | | 0.90 | | | | 0.74 | |
| Class C (EKVCX) | | 2-1-1993 | | | 3.21 | | | | 2.39 | | | | 3.66 | | | | 4.21 | | | | 2.39 | | | | 3.66 | | | | 1.65 | | | | 1.49 | |
| Institutional Class (EKVYX) | | 11-24-1997 | | | – | | | | – | | | | – | | | | 5.25 | | | | 3.42 | | | | 4.70 | | | | 0.57 | | | | 0.49 | |
| Bloomberg Barclays Municipal Bond Index4 | | – | | | – | | | | – | | | | – | | | | 5.45 | | | | 3.02 | | | | 4.46 | | | | – | | | | – | |
| Bloomberg Barclays Pennsylvania Municipal Bond Index5 | | – | | | – | | | | – | | | | – | | | | 6.02 | | | | 3.31 | | | | 4.65 | | | | – | | | | – | |
Figures quoted represent past performance, which is no guarantee of future results, and do not reflect taxes that a shareholder may pay on fund distributions or the redemption of fund shares. Investment return and principal value of an investment will fluctuate so that an investor’s shares, when redeemed, may be worth more or less than their original cost. Performance shown without sales charges would be lower if sales charges were reflected. Current performance may be lower or higher than the performance data quoted, which assumes the reinvestment of dividends and capital gains. Current month-end performance is available on the Fund’s website, wellsfargofunds.com.
Index returns do not include transaction costs associated with buying and selling securities, any mutual fund fees or expenses, or any taxes. It is not possible to invest directly in an index.
For Class A shares, the maximum front-end sales charge is 4.50%. For Class C shares, the maximum contingent deferred sales charge is 1.00%. Performance including a contingent deferred sales charge assumes the sales charge for the corresponding time period. Institutional Class shares are sold without a front-end sales charge or contingent deferred sales charge.
Bond values fluctuate in response to the financial condition of individual issuers, general market and economic conditions, and changes in interest rates. Changes in market conditions and government policies may lead to periods of heightened volatility in the bond market and reduced liquidity for certain bonds held by the Fund. In general, when interest rates rise, bond values fall and investors may lose principal value. Interest-rate changes and their impact on the Fund and its share price can be sudden and unpredictable. The use of derivatives may reduce returns and/or increase volatility. Certain investment strategies tend to increase the total risk of an investment (relative to the broader market). The Fund is exposed to Pennsylvania municipal securities risk and high-yield securities risk. Consult the Fund’s prospectus for additional information on these and other risks. A portion of the Fund’s income may be subject to federal, state, and/or local income taxes or the Alternative Minimum Tax (AMT). Any capital gains distributions may be taxable.
Please see footnotes on page 5.
| | | | | | |
| Performance highlights (unaudited) | | Wells Fargo Pennsylvania Tax-Free Fund | | | 5 | |
|
| Effective maturity distribution as of December 31, 20176 |
|
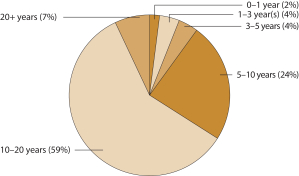
|
|
| Credit quality as of December 31, 20177 |
|
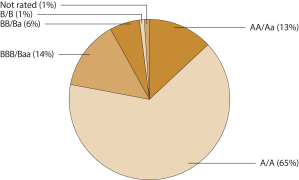 |
| 1 | Historical performance shown for all classes of the Fund prior to July 12, 2010, is based on the performance of the Fund’s predecessor, Evergreen Pennsylvania Municipal Bond Fund. |
| 2 | Reflects the expense ratios as stated in the most recent prospectuses. The expense ratios shown are subject to change and may differ from the annualized expense ratios shown in the financial highlights of this report. |
| 3 | The manager has contractually committed through October 31, 2018, to waive fees and/or reimburse expenses to the extent necessary to cap the Fund’s Total Annual Fund Operating Expenses After Fee Waivers at the amounts shown. After this time, the cap may be increased or the commitment to maintain the cap may be terminated only with the approval of the Board of Trustees. Brokerage commissions, stamp duty fees, interest, taxes, acquired fund fees and expenses, and extraordinary expenses are excluded from the expense cap. Without this cap, the Fund’s returns would have been lower. The expense ratio paid by an investor is the net expense ratio or the Fund’s Total Annual Fund Operating Expenses After Fee Waivers, as stated in the prospectuses. |
| 4 | The Bloomberg Barclays Municipal Bond Index is an unmanaged index composed of long-term tax-exempt bonds with a minimum credit rating of Baa. You cannot invest directly in an index. |
| 5 | The Bloomberg Barclays Pennsylvania Municipal Bond Index is a Pennsylvania-specific total return index. The index is composed of Pennsylvania bonds. The bonds are all investment-grade, fixed-rate, long-term maturities (greater than two years) and are selected from issues larger than $50 million dated since January 1984. Bonds are added to the index and weighted and updated monthly, with a one-month lag. You cannot invest directly in an index. |
| 6 | Amounts are calculated based on the total investments of the Fund. These amounts are subject to change and may have changed since the date specified. |
| 7 | The credit quality distribution of portfolio holdings reflected in the chart is based on ratings from Standard & Poor’s, Moody’s Investors Service, and/ or Fitch Ratings Ltd. Credit quality ratings apply to the underlying holdings of the Fund and not to the Fund itself. The percentages of the Fund’s portfolio with the ratings depicted in the chart are calculated based on the total market value of fixed income securities held by the Fund. If a security was rated by all three rating agencies, the middle rating was utilized. If rated by two of three rating agencies, the lower rating was utilized, and if rated by one of the rating agencies, that rating was utilized. Standard & Poor’s rates the creditworthiness of bonds, ranging from AAA (highest) to D (lowest). Ratings from A to CCC may be modified by the addition of a plus (+) or minus (-) sign to show relative standing within the rating categories. Standard & Poor’s rates the creditworthiness of short-term notes from SP-1 (highest) to SP-3 (lowest). Moody’s rates the creditworthiness of bonds, ranging from Aaa (highest) to C (lowest). Ratings Aa to B may be modified by the addition of a number 1 (highest) to 3 (lowest) to show relative standing within the ratings categories. Moody’s rates the creditworthiness of short-term U.S. tax-exempt municipal securities from MIG 1/VMIG 1 (highest) to SG (lowest). Fitch rates the creditworthiness of bonds, ranging from AAA (highest) to D (lowest). Credit quality distribution is subject to change and may have changed since the date specified. |
| | | | |
| 6 | | Wells Fargo Pennsylvania Tax-Free Fund | | Fund expenses (unaudited) |
As a shareholder of the Fund, you incur two types of costs: (1) transaction costs, including sales charges (loads) on purchase payments and contingent deferred sales charges (if any) on redemptions and (2) ongoing costs, including management fees, distribution (12b-1) and/or shareholder servicing fees, and other Fund expenses. This example is intended to help you understand your ongoing costs (in dollars) of investing in the Fund and to compare these costs with the ongoing costs of investing in other mutual funds.
The example is based on an investment of $1,000 invested at the beginning of the six-month period and held for the entire period from July 1, 2017 to December 31, 2017.
Actual expenses
The “Actual” line of the table below provides information about actual account values and actual expenses. You may use the information in this line, together with the amount you invested, to estimate the expenses that you paid over the period. Simply divide your account value by $1,000 (for example, an $8,600 account value divided by $1,000 = 8.6), then multiply the result by the number in the “Actual” line under the heading entitled “Expenses paid during period” for your applicable class of shares to estimate the expenses you paid on your account during this period.
Hypothetical example for comparison purposes
The “Hypothetical” line of the table below provides information about hypothetical account values and hypothetical expenses based on the Fund’s actual expense ratio and an assumed rate of return of 5% per year before expenses, which is not the Fund’s actual return. The hypothetical account values and expenses may not be used to estimate the actual ending account balance or expenses you paid for the period. You may use this information to compare the ongoing costs of investing in the Fund and other funds. To do so, compare this 5% hypothetical example with the 5% hypothetical examples that appear in the shareholder reports of the other funds.
Please note that the expenses shown in the table are meant to highlight your ongoing costs only and do not reflect any transactional costs, such as sales charges (loads) and contingent deferred sales charges. Therefore, the “Hypothetical” line of the table is useful in comparing ongoing costs only and will not help you determine the relative total costs of owning different funds. In addition, if these transactional costs were included, your costs would have been higher.
| | | | | | | | | | | | | | | | |
| | | Beginning
account value
7-1-2017 | | | Ending
account value
12-31-2017 | | | Expenses
paid during
the period¹ | | | Annualized net
expense ratio | |
Class A | | | | | | | | | | | | | | | | |
Actual | | $ | 1,000.00 | | | $ | 1,016.82 | | | $ | 3.76 | | | | 0.74 | % |
Hypothetical (5% return before expenses) | | $ | 1,000.00 | | | $ | 1,021.48 | | | $ | 3.77 | | | | 0.74 | % |
Class C | | | | | | | | | | | | | | | | |
Actual | | $ | 1,000.00 | | | $ | 1,012.99 | | | $ | 7.56 | | | | 1.49 | % |
Hypothetical (5% return before expenses) | | $ | 1,000.00 | | | $ | 1,017.69 | | | $ | 7.58 | | | | 1.49 | % |
Institutional Class | | | | | | | | | | | | | | | | |
Actual | | $ | 1,000.00 | | | $ | 1,018.10 | | | $ | 2.49 | | | | 0.49 | % |
Hypothetical (5% return before expenses) | | $ | 1,000.00 | | | $ | 1,022.74 | | | $ | 2.50 | | | | 0.49 | % |
| 1 | Expenses paid is equal to the annualized net expense ratio of each class multiplied by the average account value over the period, multiplied by the number of days in the most recent fiscal half-year divided by the number of days in the fiscal year (to reflect the one-half-year period). |
| | | | | | |
| Portfolio of investments—December 31, 2017 (unaudited) | | Wells Fargo Pennsylvania Tax-Free Fund | | | 7 | |
| | | | | | | | | | | | | | | | |
| Security name | | Interest rate | | | Maturity date | | | Principal | | | Value | |
|
Municipal Obligations: 98.73% | |
|
| Florida: 0.64% | |
Jacksonville FL Economic Development AMT Metropolitan Parking Solutions Project (Industrial Development Revenue, ACA Insured) | | | 5.50 | % | | | 10-1-2030 | | | $ | 1,000,000 | | | $ | 1,001,530 | |
| | | | | | | | | | | | | | | | |
|
| Pennsylvania: 97.69% | |
Allegheny County PA Higher Education Building Authority Refunding Bond Duquesne University of The Holy Spirit Series A (Education Revenue) | | | 5.00 | | | | 3-1-2029 | | | | 1,135,000 | | | | 1,313,513 | |
Allegheny County PA Hospital Development Authority Health Center Series B (Health Revenue, National Insured) | | | 6.00 | | | | 7-1-2027 | | | | 1,800,000 | | | | 2,340,144 | |
Allegheny County PA Port Authority Refunding Bond (Tax Revenue) | | | 5.75 | | | | 3-1-2029 | | | | 3,000,000 | | | | 3,360,510 | |
Allegheny County PA Series C-65 (GO Revenue) | | | 5.50 | | | | 5-1-2024 | | | | 4,675,000 | | | | 5,242,452 | |
Berks County PA IDA Tower Health Project (Health Revenue) | | | 5.00 | | | | 11-1-2037 | | | | 1,295,000 | | | | 1,485,469 | |
Blair County PA (GO Revenue, Build America Mutual Assurance Company Insured) | | | 5.00 | | | | 10-1-2026 | | | | 955,000 | | | | 1,127,626 | |
Capital Region Pennsylvania Refunding Bond Water and Sewer System (Water & Sewer Revenue) | | | 5.00 | | | | 7-15-2037 | | | | 1,000,000 | | | | 1,171,080 | |
Central Dauphin PA School District (GO Revenue) | | | 5.00 | | | | 2-1-2037 | | | | 2,075,000 | | | | 2,400,817 | |
Centre County PA Hospital Authority Mount Nittany Medical Center Series A (Health Revenue) | | | 5.00 | | | | 11-15-2029 | | | | 800,000 | | | | 938,384 | |
Centre County PA Hospital Authority Mount Nittany Medical Center Series A (Health Revenue) | | | 5.00 | | | | 11-15-2030 | | | | 675,000 | | | | 787,435 | |
Chester County PA IDA Avon Grove Charter School Project Refunding Bond Series A (Education Revenue) | | | 5.00 | | | | 12-15-2047 | | | | 1,160,000 | | | | 1,232,871 | |
Chester County PA IDA Collegium Charter School Project Refunding Bond Series A (Education Revenue) | | | 5.00 | | | | 10-15-2022 | | | | 1,695,000 | | | | 1,807,531 | |
Chester County PA IDA Collegium Charter School Project Series A (Education Revenue) | | | 5.13 | | | | 10-15-2037 | | | | 1,000,000 | | | | 1,046,300 | |
Chester County PA IDA Renaissance Academy Charter School Project (Education Revenue) | | | 3.75 | | | | 10-1-2024 | | | | 805,000 | | | | 827,202 | |
Chester County PA IDA University Student Housing LLC Project Series A (Housing Revenue) | | | 5.00 | | | | 8-1-2030 | | | | 555,000 | | | | 609,218 | |
Coatesville PA School District Refunding Bond (GO Revenue, AGM Insured) | | | 5.00 | | | | 8-1-2025 | | | | 500,000 | | | | 582,790 | |
Cumberland County PA Municipal Authority Diakon Lutheran Ministries Project (Health Revenue) | | | 5.00 | | | | 1-1-2028 | | | | 2,090,000 | | | | 2,351,961 | |
Cumberland County PA Municipal Authority Dickinson College Project Series HH-1 (Education Revenue) | | | 5.00 | | | | 11-1-2039 | | | | 1,200,000 | | | | 1,272,732 | |
Dauphin County PA Authority Pinnacle Health System Project Series A (Health Revenue) | | | 5.00 | | | | 6-1-2035 | | | | 1,000,000 | | | | 1,161,390 | |
Delaware County PA Authority Neumann University Refunding Bond (Miscellaneous Revenue) | | | 5.00 | | | | 10-1-2031 | | | | 1,500,000 | | | | 1,662,135 | |
Delaware County PA IDA Chester Community Charter School Series A (Education Revenue) | | | 5.00 | | | | 8-15-2020 | | | | 1,795,000 | | | | 1,810,222 | |
Delaware County PA Vocational & Technical School Authority (Miscellaneous Revenue, Build America Mutual Assurance Company Insured) | | | 5.25 | | | | 11-1-2033 | | | | 1,000,000 | | | | 1,131,430 | |
Delaware River PA Joint Toll Bridge Commission (Transportation Revenue) | | | 5.00 | | | | 7-1-2042 | | | | 580,000 | | | | 683,089 | |
Delaware Valley PA Regional Finance Authority Local Government Series A (Miscellaneous Revenue, Ambac Insured) | | | 5.50 | | | | 8-1-2028 | | | | 4,390,000 | | | | 5,387,276 | |
East Hempfield Township PA IDA Refunding Bond Willow Valley Communities Project (Health Revenue) | | | 5.00 | | | | 12-1-2028 | | | | 450,000 | | | | 524,669 | |
East Hempfield Township PA IDA Refunding Bond Willow Valley Communities Project (Health Revenue) | | | 5.00 | | | | 12-1-2029 | | | | 375,000 | | | | 434,325 | |
Easton PA Area Joint Sewer Authority (Water & Sewer Revenue, Build America Mutual Assurance Company Insured) | | | 5.00 | | | | 12-1-2028 | | | | 150,000 | | | | 170,661 | |
Easton PA Area Joint Sewer Authority (Water & Sewer Revenue, Build America Mutual Assurance Company Insured) | | | 5.00 | | | | 12-1-2029 | | | | 200,000 | | | | 226,608 | |
General Authority of South Central Pennsylvania Association of Independent Colleges & Universities (Education Revenue) | | | 6.00 | | | | 11-1-2031 | | | | 2,500,000 | | | | 2,839,350 | |
Lehigh County PA General Purpose Authority CAB Allentown Project (Water & Sewer Revenue) ¤ | | | 0.00 | | | | 12-1-2030 | | | | 2,000,000 | | | | 1,277,840 | |
The accompanying notes are an integral part of these financial statements.
| | | | |
| 8 | | Wells Fargo Pennsylvania Tax-Free Fund | | Portfolio of investments—December 31, 2017 (unaudited) |
| | | | | | | | | | | | | | | | |
| Security name | | Interest rate | | | Maturity date | | | Principal | | | Value | |
|
| Pennsylvania (continued) | |
Lycoming County PA Authority Pennsylvania College of Technology (Education Revenue) | | | 5.50 | % | | | 7-1-2026 | | | $ | 3,000,000 | | | $ | 3,354,840 | |
McKeesport PA Municipal Authority (Water & Sewer Revenue, AGM Insured) | | | 5.50 | | | | 12-15-2027 | | | | 2,405,000 | | | | 2,671,859 | |
Monroe County PA Hospital Authority Pocono Medical Center Series A (Health Revenue) | | | 5.00 | | | | 1-1-2027 | | | | 840,000 | | | | 942,463 | |
Monroe County PA Hospital Authority Pocono Medical Center Series A (Health Revenue) | | | 5.00 | | | | 1-1-2032 | | | | 880,000 | | | | 987,342 | |
Montgomery County PA Higher Education & Health Authority Abington Memorial Hospital Project (Health Revenue) | | | 5.00 | | | | 6-1-2031 | | | | 2,000,000 | | | | 2,254,800 | |
Montgomery County PA Higher Education & Health Authority Refunding Bond Arcadia University (Education Revenue) | | | 5.00 | | | | 4-1-2030 | | | | 1,500,000 | | | | 1,670,235 | |
Montgomery County PA IDA Jefferson Health System Series A (Health Revenue) | | | 5.00 | | | | 10-1-2027 | | | | 1,000,000 | | | | 1,106,850 | |
Montgomery County PA IDA New Regional Medical Center Project (Health Revenue, FHA Insured) | | | 5.00 | | | | 8-1-2020 | | | | 980,000 | | | | 1,060,184 | |
Montgomery County PA Norristown Area School District (GO Revenue) | | | 5.00 | | | | 9-1-2029 | | | | 1,250,000 | | | | 1,481,275 | |
North Eastern PA Hospital & Education Authority Refunding Bond Wilkes University Project Series B (Education Revenue) | | | 5.25 | | | | 3-1-2037 | | | | 1,000,000 | | | | 1,145,820 | |
Northampton County PA St. Luke’s Hospital of Bethlehem Series A (Health Revenue) | | | 5.00 | | | | 8-15-2033 | | | | 1,480,000 | | | | 1,627,378 | |
Pennsylvania Commonwealth Financing Authority Series B (Water & Sewer Revenue) | | | 5.00 | | | | 6-1-2026 | | | | 1,000,000 | | | | 1,108,190 | |
Pennsylvania Financing Authority Pennsylvania Hills Project Series B (Miscellaneous Revenue, National Insured) ¤ | | | 0.00 | | | | 12-1-2022 | | | | 1,200,000 | | | | 1,050,888 | |
Pennsylvania Financing Authority Pennsylvania Hills Project Series B (Miscellaneous Revenue, National Insured) ¤ | | | 0.00 | | | | 12-1-2023 | | | | 3,790,000 | | | | 3,223,054 | |
Pennsylvania HEFAR Shippensburg University Project (Education Revenue) | | | 5.00 | | | | 10-1-2020 | | | | 1,235,000 | | | | 1,285,302 | |
Pennsylvania HEFAR Shippensburg University Project (Education Revenue) | | | 6.00 | | | | 10-1-2031 | | | | 3,000,000 | | | | 3,337,740 | |
Pennsylvania HEFAR Temple University First Series (Education Revenue) | | | 5.00 | | | | 4-1-2032 | | | | 1,000,000 | | | | 1,099,620 | |
Pennsylvania Higher Educational University Pennsylvania Health System Series A (Health Revenue) | | | 5.00 | | | | 8-15-2047 | | | | 1,500,000 | | | | 1,738,080 | |
Pennsylvania Housing Finance Agency SFMR Series 112 (Housing Revenue) | | | 5.00 | | | | 4-1-2028 | | | | 970,000 | | | | 1,011,468 | |
Pennsylvania Infrastructure Investment Authority Series A (Miscellaneous Revenue) | | | 5.00 | | | | 5-15-2031 | | | | 650,000 | | | | 770,705 | |
Pennsylvania Public School Building Authority Chester Upland School District Project Series B (Miscellaneous Revenue) | | | 5.25 | | | | 9-15-2030 | | | | 540,000 | | | | 632,642 | |
Pennsylvania Public School Building Authority Chester Upland School District Project Series C (Miscellaneous Revenue, AGM Insured) | | | 5.00 | | | | 9-15-2026 | | | | 875,000 | | | | 953,759 | |
Pennsylvania Public School Building Authority Northampton County Area Community College Project (Education Revenue) | | | 5.50 | | | | 3-1-2031 | | | | 5,000,000 | | | | 5,509,100 | |
Pennsylvania Public School Building Authority Northampton County Area Community College Project Series A (Education Revenue, Build America Mutual Assurance Company Insured) | | | 5.00 | | | | 6-15-2027 | | | | 1,610,000 | | | | 1,790,690 | |
Pennsylvania Public School Building Authority Series B-2 (Miscellaneous Revenue, Build America Mutual Assurance Company Insured) | | | 5.00 | | | | 12-1-2027 | | | | 1,010,000 | | | | 1,172,105 | |
Pennsylvania State University Refunding Bond Series B (Education Revenue) | | | 5.00 | | | | 9-1-2034 | | | | 2,175,000 | | | | 2,596,015 | |
Pennsylvania Turnpike Commission Motor License Series B-1 (Transportation Revenue) | | | 5.00 | | | | 12-1-2040 | | | | 1,500,000 | | | | 1,640,445 | |
Pennsylvania Turnpike Commission Oil Franchise Series A (Tax Revenue) | | | 5.00 | | | | 12-1-2032 | | | | 1,500,000 | | | | 1,780,740 | |
Pennsylvania Turnpike Commission Series A (Miscellaneous Revenue, AGM Insured) | | | 5.25 | | | | 7-15-2021 | | | | 2,000,000 | | | | 2,232,980 | |
Pennsylvania Turnpike Commission Series A-1 (Transportation Revenue) | | | 5.00 | | | | 12-1-2047 | | | | 1,000,000 | | | | 1,166,610 | |
Pennsylvania Turnpike Commission Subordinate Series A (Transportation Revenue) | | | 5.50 | | | | 12-1-2042 | | | | 3,000,000 | | | | 3,595,530 | |
Philadelphia PA Airport Refunding Bond AMT Series A (Airport Revenue) | | | 5.00 | | | | 6-15-2030 | | | | 1,500,000 | | | | 1,725,930 | |
Philadelphia PA Authority for Industrial Louisiana Salle University (Education Revenue) | | | 5.00 | | | | 5-1-2036 | | | | 1,355,000 | | | | 1,520,324 | |
Philadelphia PA IDA 1st Philadelphia Preparatory Charter School Project Series A (Education Revenue) | | | 7.00 | | | | 6-15-2033 | | | | 1,000,000 | | | | 1,147,620 | |
Philadelphia PA IDA Architecture & Design Charter School Project (Education Revenue) | | | 5.25 | | | | 3-15-2023 | | | | 660,000 | | | | 687,951 | |
The accompanying notes are an integral part of these financial statements.
| | | | | | |
| Portfolio of investments—December 31, 2017 (unaudited) | | Wells Fargo Pennsylvania Tax-Free Fund | | | 9 | |
| | | | | | | | | | | | | | | | |
| Security name | | Interest rate | | | Maturity date | | | Principal | | | Value | |
|
| Pennsylvania (continued) | |
Philadelphia PA IDA Charter School Project Series A (Education Revenue) | | | 5.30 | % | | | 9-15-2027 | | | $ | 5,150,000 | | | $ | 5,154,275 | |
Philadelphia PA IDA Global Leadership Academy Project (Education Revenue) | | | 5.13 | | | | 11-15-2020 | | | | 770,000 | | | | 796,373 | |
Philadelphia PA IDA Global Leadership Academy Project (Education Revenue) | | | 5.75 | | | | 11-15-2030 | | | | 1,000,000 | | | | 1,035,110 | |
Philadelphia PA IDA Master Charter School Aid (Education Revenue) | | | 5.00 | | | | 8-1-2020 | | | | 445,000 | | | | 465,038 | |
Philadelphia PA IDA National Board of Medical Examiners Project (Miscellaneous Revenue) | | | 5.00 | | | | 5-1-2030 | | | | 1,705,000 | | | | 2,017,987 | |
Philadelphia PA IDA Refunding Bond Cultural & Commercial Corridors Program Series A (Miscellaneous Revenue) | | | 5.00 | | | | 12-1-2028 | | | | 2,500,000 | | | | 2,878,225 | |
Philadelphia PA IDA Tacony Academy Charter School Project (Education Revenue) | | | 6.88 | | | | 6-15-2033 | | | | 1,000,000 | | | | 1,116,180 | |
Philadelphia PA IDA Temple University 1st Series 2016 (Education Revenue) | | | 5.00 | | | | 4-1-2029 | | | | 1,000,000 | | | | 1,178,460 | |
Philadelphia PA IDA West Philadelphia Achievement Charter Elementary School Project (Education Revenue) | | | 7.50 | | | | 5-1-2031 | | | | 1,285,000 | | | | 1,385,500 | |
Philadelphia PA Refunding Bond Series A (GO Revenue) | | | 5.25 | | | | 7-15-2033 | | | | 1,500,000 | | | | 1,719,720 | |
Philadelphia PA School District Refunding Bond Series A (GO Revenue, AGM/FGIC Insured) | | | 5.00 | | | | 6-1-2024 | | | | 1,425,000 | | | | 1,613,043 | |
Philadelphia PA School District Refunding Bond Series C (GO Revenue) | | | 5.00 | | | | 9-1-2018 | | | | 3,000,000 | | | | 3,058,350 | |
Philadelphia PA School District Refunding Bond Series C (GO Revenue) | | | 5.00 | | | | 9-1-2021 | | | | 1,395,000 | | | | 1,523,912 | |
Philadelphia PA Series A (GO Revenue) | | | 5.00 | | | | 8-1-2036 | | | | 1,250,000 | | | | 1,468,125 | |
Philadelphia PA Water & Wastewater Refunding Bond (Water & Sewer Revenue) | | | 5.00 | | | | 10-1-2030 | | | | 3,000,000 | | | | 3,567,540 | |
Pittsburgh & Allegheny Counties PA Sports & Exhibition Authority (Tax Revenue, AGM Insured) | | | 5.00 | | | | 2-1-2031 | | | | 3,000,000 | | | | 3,204,660 | |
Pittsburgh PA (GO Revenue, Build America Mutual Assurance Company Insured) | | | 5.00 | | | | 9-1-2030 | | | | 500,000 | | | | 582,250 | |
Pittsburgh PA Moon Area School District Series A (GO Revenue) | | | 5.00 | | | | 11-15-2029 | | | | 1,445,000 | | | | 1,691,474 | |
Reading PA School District Notes Series A (GO Revenue, AGM Insured) | | | 5.00 | | | | 2-1-2033 | | | | 1,500,000 | | | | 1,715,685 | |
Reading PA School District Refunding Bond (GO Revenue) | | | 3.13 | | | | 4-1-2024 | | | | 1,000,000 | | | | 1,000,060 | |
Scranton PA Refunding Notes (GO Revenue) | | | 5.00 | | | | 11-15-2026 | | | | 720,000 | | | | 776,016 | |
Southeastern Pennsylvania Transportation Authority (Miscellaneous Revenue) | | | 5.00 | | | | 6-1-2028 | | | | 4,000,000 | | | | 4,423,000 | |
West Mifflin PA Area School District (GO Revenue, AGM Insured) | | | 5.00 | | | | 4-1-2028 | | | | 1,000,000 | | | | 1,153,620 | |
Wilkes-Barre PA Finance Authority University of Scranton (Education Revenue) | | | 5.00 | | | | 11-1-2020 | | | | 1,005,000 | | | | 1,084,862 | |
York PA City Sewer Authority (Water & Sewer Revenue, AGM Insured) | | | 5.00 | | | | 12-1-2026 | | | | 1,000,000 | | | | 1,191,530 | |
| |
| | | | 154,088,559 | |
| | | | | |
|
| Virgin Islands: 0.40% | |
Virgin Islands PFA Matching Fund Loan Note Senior Lien Series A (Tax Revenue) | | | 5.00 | | | | 10-1-2025 | | | | 1,000,000 | | | | 625,000 | |
| | | | | | | | | | | | | | | | |
| |
Total Municipal Obligations (Cost $147,424,055) | | | | 155,715,089 | |
| | | | | |
| | | | |
| | | Yield | | | | | | Shares | | | | |
| Short-Term Investments: 0.13% | | | | | | | | | | | | | | | | |
| | | | |
| Investment Companies: 0.13% | | | | | | | | | | | | | | | | |
Wells Fargo Municipal Cash Management Money Market Fund Institutional Class (l)(u) | | | 1.49 | | | | | | | | 206,035 | | | | 206,262 | |
| | | | | | | | | | | | | | | | |
| | | | |
Total Short-Term Investments (Cost $206,262) | | | | | | | | | | | | | | | 206,262 | |
| | | | | | | | | | | | | | | | |
| | | | | | | | |
| Total investments in securities (Cost $147,630,317) | | | 98.86 | % | | | 155,921,351 | |
Other assets and liabilities, net | | | 1.14 | | | | 1,805,362 | |
| | | | | | | | |
| Total net assets | | | 100.00 | % | | $ | 157,726,713 | |
| | | | | | | | |
| ¤ | The security is issued in zero coupon form with no periodic interest payments. |
| (l) | The issuer of the security is an affiliated person of the Fund as defined in the Investment Company Act of 1940. |
| (u) | The rate represents the 7-day annualized yield at period end. |
The accompanying notes are an integral part of these financial statements.
| | | | |
| 10 | | Wells Fargo Pennsylvania Tax-Free Fund | | Portfolio of investments—December 31, 2017 (unaudited) |
Investments in Affiliates
An affiliated investment is an investment in which the Fund owns at least 5% of the outstanding voting shares of the issuer or as a result of other relationships, such as the Fund and the issuer having the same investment manager. Transactions with issuers that were either affiliated persons of the Fund at the beginning of the period or the end of the period were as follows:
| | | | | | | | | | | | | | | | | | | | | | | | | | | | | | | | | | | | |
| | | Shares,
beginning of
priod | | | Shares
purchased | | | Shares sold | | | Shares,
end of
period | | | Net
realized
gains
(losses) | | | Net
change in
unrealized
gains
(losses) | | | Income
from
affiliated
securities | | | Value, end
of period | | | % of
net
assets | |
Short-Term Investments | | | | | | | | | | | | | | | | | | | | | | | | | | | | | | | | | | | | |
Investment Companies | | | | | | | | | | | | | | | | | | | | | | | | | | | | | | | | | | | | |
Wells Fargo Municipal Cash Management Money Market Fund Institutional Class | | | 1,179,939 | | | | 14,551,545 | | | | 15,525,449 | | | | 206,035 | | | $ | 519 | | | $ | 0 | | | $ | 4,575 | | | $ | 206,262 | | | | 0.13 | % |
The accompanying notes are an integral part of these financial statements.
| | | | | | |
| Statement of assets and liabilities—December 31, 2017 (unaudited) | | Wells Fargo Pennsylvania Tax-Free Fund | | | 11 | |
| | | | |
| | | | |
| |
Assets | | | | |
Investments in unaffiliated securities, at value (cost $147,424,055) | | $ | 155,715,089 | |
Investments in affiliated securities, at value (cost $206,262) | | | 206,262 | |
Receivable for investments sold | | | 243,067 | |
Receivable for Fund shares sold | | | 177,388 | |
Receivable for interest | | | 1,763,027 | |
Prepaid expenses and other assets | | | 79,729 | |
| | | | |
Total assets | | | 158,184,562 | |
| | | | |
| |
Liabilities | | | | |
Dividends payable | | | 212,923 | |
Payable for Fund shares redeemed | | | 136,886 | |
Management fee payable | | | 40,057 | |
Administration fees payable | | | 15,400 | |
Distribution fee payable | | | 10,141 | |
Trustees’ fees and expenses payable | | | 2,052 | |
Accrued expenses and other liabilities | | | 40,390 | |
| | | | |
Total liabilities | | | 457,849 | |
| | | | |
Total net assets | | $ | 157,726,713 | |
| | | | |
| |
NET ASSETS CONSIST OF | | | | |
Paid-in capital | | $ | 151,010,062 | |
Overdistributed net investment income | | | (240,888 | ) |
Accumulated net realized losses on investments | | | (1,333,495 | ) |
Net unrealized gains on investments | | | 8,291,034 | |
| | | | |
Total net assets | | $ | 157,726,713 | |
| | | | |
| |
COMPUTATION OF NET ASSET VALUE AND OFFERING PRICE PER SHARE | | | | |
Net assets – Class A | | $ | 43,832,808 | |
Shares outstanding – Class A1 | | | 3,752,840 | |
Net asset value per share – Class A | | | $11.68 | |
Maximum offering price per share – Class A2 | | | $12.23 | |
Net assets – Class C | | $ | 15,146,251 | |
Shares outstanding – Class C1 | | | 1,299,182 | |
Net asset value per share – Class C | | | $11.66 | |
Net assets – Institutional Class | | $ | 98,747,654 | |
Shares outstanding – Institutional Class1 | | | 8,454,514 | |
Net asset value per share – Institutional Class | | | $11.68 | |
| 1 | The Fund has an unlimited number of authorized shares. |
| 2 | Maximum offering price is computed as 100/95.50 of net asset value. On investments of $50,000 or more, the offering price is reduced. |
The accompanying notes are an integral part of these financial statements.
| | | | |
| 12 | | Wells Fargo Pennsylvania Tax-Free Fund | | Statement of operations—six months ended December 31, 2017 (unaudited) |
| | | | |
| | | | |
| |
Investment income | | | | |
Interest | | $ | 3,158,684 | |
Income from affiliated securities | | | 4,575 | |
| | | | |
Total investment income | | | 3,163,259 | |
| | | | |
| |
Expenses | | | | |
Management fee | | | 326,127 | |
Administration fees | |
Class A | | | 36,141 | |
Class C | | | 12,821 | |
Institutional Class | | | 40,745 | |
Shareholder servicing fees | |
Class A | | | 56,470 | |
Class C | | | 20,033 | |
Distribution fee | |
Class C | | | 60,099 | |
Custody and accounting fees | | | 5,100 | |
Professional fees | | | 23,015 | |
Registration fees | | | 25,407 | |
Shareholder report expenses | | | 5,640 | |
Trustees’ fees and expenses | | | 10,447 | |
Other fees and expenses | | | 6,393 | |
| | | | |
Total expenses | | | 628,438 | |
Less: Fee waivers and/or expense reimbursements | | | (92,331 | ) |
| | | | |
Net expenses | | | 536,107 | |
| | | | |
Net investment income | | | 2,627,152 | |
| | | | |
| |
REALIZED AND UNREALIZED GAINS (LOSSES) ON INVESTMENTS | | | | |
|
Net realized gains (losses) on: | |
Unaffiliated securities | | | (449,650 | ) |
Affiliated securities | | | 519 | |
| | | | |
Net realized losses on investments | | | (449,131 | ) |
Net change in unrealized gains (losses) on investments | | | 602,029 | |
| | | | |
Net realized and unrealized gains (losses) on investments | | | 152,898 | |
| | | | |
Net increase in net assets resulting from operations | | $ | 2,780,050 | |
| | | | |
The accompanying notes are an integral part of these financial statements.
| | | | | | |
| Statement of changes in net assets | | Wells Fargo Pennsylvania Tax-Free Fund | | | 13 | |
| | | | | | | | | | | | | | | | |
| | | Six months ended
December 31, 2017
(unaudited) | | | Year ended
June 30, 2017 | |
| | | | |
Operations | | | | | | | | | | | | | | | | |
Net investment income | | | | | | $ | 2,627,152 | | | | | | | $ | 5,879,563 | |
Net realized losses on investments | | | | | | | (449,131 | ) | | | | | | | (829,938 | ) |
Net change in unrealized gains (losses) on investments | | | | | | | 602,029 | | | | | | | | (7,877,765 | ) |
| | | | |
Net increase (decrease) in net assets resulting from operations | | | | | | | 2,780,050 | | | | | | | | (2,828,140 | ) |
| | | | |
| | | | |
Distributions to shareholders from | | | | | | | | | | | | | | | | |
Net investment income | | | | | | | | | | | | | | | | |
Class A | | | | | | | (709,216 | ) | | | | | | | (1,548,909 | ) |
Class B | | | | | | | N/A | | | | | | | | (3,509 | )1 |
Class C | | | | | | | (191,504 | ) | | | | | | | (418,645 | ) |
Institutional Class | | | | | | | (1,726,477 | ) | | | | | | | (3,908,483 | ) |
| | | | |
Total distributions to shareholders | | | | | | | (2,627,197 | ) | | | | | | | (5,879,546 | ) |
| | | | |
| | | | |
Capital share transactions | | | Shares | | | | | | | | Shares | | | | | |
Proceeds from shares sold | | | | | | | | | | | | | | | | |
Class A | | | 56,582 | | | | 662,479 | | | | 413,003 | | | | 4,904,051 | |
Class C | | | 57,409 | | | | 671,605 | | | | 181,305 | | | | 2,147,972 | |
Institutional Class | | | 462,524 | | | | 5,408,489 | | | | 1,712,900 | | | | 20,106,404 | |
| | | | |
| | | | | | | 6,742,573 | | | | | | | | 27,158,427 | |
| | | | |
Reinvestment of distributions | | | | | | | | | | | | | | | | |
Class A | | | 56,605 | | | | 661,483 | | | | 124,132 | | | | 1,452,554 | |
Class B | | | N/A | | | | N/A | | | | 289 | 1 | | | 3,452 | 1 |
Class C | | | 15,066 | | | | 175,763 | | | | 32,929 | | | | 384,468 | |
Institutional Class | | | 48,063 | | | | 561,656 | | | | 86,651 | | | | 1,012,840 | |
| | | | |
| | | | | | | 1,398,902 | | | | | | | | 2,853,314 | |
| | | | |
Payment for shares redeemed | | | | | | | | | | | | | | | | |
Class A | | | (249,416 | ) | | | (2,914,155 | ) | | | (1,210,520 | ) | | | (14,014,687 | ) |
Class B | | | N/A | | | | N/A | | | | (44,832 | )1 | | | (531,995 | )1 |
Class C | | | (174,762 | ) | | | (2,038,474 | ) | | | (422,427 | ) | | | (4,908,061 | ) |
Institutional Class | | | (854,870 | ) | | | (9,992,037 | ) | | | (3,950,507 | ) | | | (45,699,646 | ) |
| | | | |
| | | | | | | (14,944,666 | ) | | | | | | | (65,154,389 | ) |
| | | | |
Net decrease in net assets resulting from capital share transactions | | | | | | | (6,803,191 | ) | | | | | | | (35,142,648 | ) |
| | | | |
Total decrease in net assets | | | | | | | (6,650,338 | ) | | | | | | | (43,850,334 | ) |
| | | | |
| | | | |
Net assets | | | | | | | | | | | | | | | | |
Beginning of period | | | | | | | 164,377,051 | | | | | | | | 208,227,385 | |
| | | | |
End of period | | | | | | $ | 157,726,713 | | | | | | | $ | 164,377,051 | |
| | | | |
Overdistributed net investment income | | | | | | $ | (240,888 | ) | | | | | | $ | (240,843 | ) |
| | | | |
| 1 | For the period from July 1, 2016 to December 5, 2016. Effective at the close of business on December 5, 2016, Class B shares were converted to Class A shares and are no longer offered by the Fund. |
The accompanying notes are an integral part of these financial statements.
| | | | |
| 14 | | Wells Fargo Pennsylvania Tax-Free Fund | | Financial highlights |
(For a share outstanding throughout each period)
| | | | | | | | | | | | | | | | | | | | | | | | |
| | | Six months ended
December 31, 2017
(unaudited) | | | Year ended June 30 | |
| CLASS A | | | 2017 | | | 2016 | | | 2015 | | | 2014 | | | 2013 | |
Net asset value, beginning of period | | | $11.67 | | | | $12.13 | | | | $11.75 | | | | $11.65 | | | | $11.36 | | | | $11.65 | |
Net investment income | | | 0.18 | 1 | | | 0.36 | | | | 0.38 | | | | 0.42 | | | | 0.43 | | | | 0.42 | |
Net realized and unrealized gains (losses) on investments | | | 0.01 | | | | (0.46 | ) | | | 0.38 | | | | 0.09 | | | | 0.29 | | | | (0.29 | ) |
| | | | | | | | | | | | | | | | | | | | | | | | |
Total from investment operations | | | 0.19 | | | | (0.10 | ) | | | 0.76 | | | | 0.51 | | | | 0.72 | | | | 0.13 | |
Distributions to shareholders from | | | | | | | | | | | | | | | | | | | | | | | | |
Net investment income | | | (0.18 | ) | | | (0.36 | ) | | | (0.38 | ) | | | (0.41 | ) | | | (0.43 | ) | | | (0.42 | ) |
Net asset value, end of period | | | $11.68 | | | | $11.67 | | | | $12.13 | | | | $11.75 | | | | $11.65 | | | | $11.36 | |
Total return2 | | | 1.68 | % | | | (0.83 | )% | | | 6.62 | % | | | 4.44 | % | | | 6.45 | % | | | 1.02 | % |
Ratios to average net assets (annualized) | | | | | | | | | | | | | | | | | | | | | | | | |
Gross expenses | | | 0.90 | % | | | 0.90 | % | | | 0.90 | % | | | 0.90 | % | | | 0.91 | %3 | | | 0.88 | %3 |
Net expenses | | | 0.74 | % | | | 0.74 | % | | | 0.74 | % | | | 0.74 | % | | | 0.74 | %3 | | | 0.75 | %3 |
Net investment income | | | 3.14 | % | | | 3.02 | % | | | 3.23 | % | | | 3.54 | % | | | 3.75 | %3 | | | 3.55 | %3 |
Supplemental data | | | | | | | | | | | | | | | | | | | | | | | | |
Portfolio turnover rate | | | 6 | % | | | 20 | % | | | 13 | % | | | 15 | % | | | 15 | % | | | 14 | % |
Net assets, end of period (000s omitted) | | | $43,833 | | | | $45,381 | | | | $55,352 | | | | $47,323 | | | | $44,500 | | | | $43,167 | |
| 1 | Calculated based upon average shares outstanding |
| 2 | Total return calculations do not include any sales charges. Returns for periods of less than one year are not annualized. |
| 3 | Ratios include interest and fee expense relating to inverse floating-rate obligations as follows: |
| | | | |
Year ended June 30, 2014 | | | 0.00 | % |
Year ended June 30, 2013 | | | 0.01 | % |
The accompanying notes are an integral part of these financial statements.
| | | | | | |
| Financial highlights | | Wells Fargo Pennsylvania Tax-Free Fund | | | 15 | |
(For a share outstanding throughout each period)
| | | | | | | | | | | | | | | | | | | | | | | | |
| | | Six months ended
December 31, 2017
(unaudited) | | | Year ended June 30 | |
| CLASS C | | | 2017 | | | 2016 | | | 2015 | | | 2014 | | | 2013 | |
Net asset value, beginning of period | | | $11.65 | | | | $12.11 | | | | $11.73 | | | | $11.63 | | | | $11.34 | | | | $11.63 | |
Net investment income | | | 0.14 | | | | 0.27 | 1 | | | 0.29 | 1 | | | 0.33 | | | | 0.34 | | | | 0.33 | |
Net realized and unrealized gains (losses) on investments | | | 0.01 | | | | (0.46 | ) | | | 0.38 | | | | 0.09 | | | | 0.29 | | | | (0.29 | ) |
| | | | | | | | | | | | | | | | | | | | | | | | |
Total from investment operations | | | 0.15 | | | | (0.19 | ) | | | 0.67 | | | | 0.42 | | | | 0.63 | | | | 0.04 | |
Distributions to shareholders from | | | | | | | | | | | | | | | | | | | | | | | | |
Net investment income | | | (0.14 | ) | | | (0.27 | ) | | | (0.29 | ) | | | (0.32 | ) | | | (0.34 | ) | | | (0.33 | ) |
Net asset value, end of period | | | $11.66 | | | | $11.65 | | | | $12.11 | | | | $11.73 | | | | $11.63 | | | | $11.34 | |
Total return2 | | | 1.30 | % | | | (1.58 | )% | | | 5.83 | % | | | 3.66 | % | | | 5.67 | % | | | 0.27 | % |
Ratios to average net assets (annualized) | | | | | | | | | | | | | | | | | | | | | | | | |
Gross expenses | | | 1.65 | % | | | 1.65 | % | | | 1.65 | % | | | 1.65 | % | | | 1.66 | %3 | | | 1.63 | %3 |
Net expenses | | | 1.49 | % | | | 1.49 | % | | | 1.49 | % | | | 1.49 | % | | | 1.49 | %3 | | | 1.50 | %3 |
Net investment income | | | 2.39 | % | | | 2.27 | % | | | 2.46 | % | | | 2.78 | % | | | 3.00 | %3 | | | 2.79 | %3 |
Supplemental data | | | | | | | | | | | | | | | | | | | | | | | | |
Portfolio turnover rate | | | 6 | % | | | 20 | % | | | 13 | % | | | 15 | % | | | 15 | % | | | 14 | % |
Net assets, end of period (000s omitted) | | | $15,146 | | | | $16,323 | | | | $19,493 | | | | $13,062 | | | | $11,192 | | | | $9,798 | |
| 1 | Calculated based upon average shares outstanding |
| 2 | Total return calculations do not include any sales charges. Returns for periods of less than one year are not annualized. |
| 3 | Ratios include interest and fee expense relating to inverse floating-rate obligations as follows: |
| | | | |
Year ended June 30, 2014 | | | 0.00 | % |
Year ended June 30, 2013 | | | 0.01 | % |
The accompanying notes are an integral part of these financial statements.
| | | | |
| 16 | | Wells Fargo Pennsylvania Tax-Free Fund | | Financial highlights |
(For a share outstanding throughout each period)
| | | | | | | | | | | | | | | | | | | | | | | | |
| | | Six months ended
December 31, 2017 (unaudited) | | | Year ended June 30 | |
| INSTITUTIONAL CLASS | | | 2017 | | | 2016 | | | 2015 | | | 2014 | | | 2013 | |
Net asset value, beginning of period | | | $11.67 | | | | $12.13 | | | | $11.75 | | | | $11.65 | | | | $11.36 | | | | $11.65 | |
Net investment income | | | 0.20 | | | | 0.39 | 1 | | | 0.41 | 1 | | | 0.44 | | | | 0.45 | | | | 0.45 | 1 |
Net realized and unrealized gains (losses) on investments | | | 0.01 | | | | (0.46 | ) | | | 0.38 | | | | 0.10 | | | | 0.29 | | | | (0.29 | ) |
| | | | | | | | | | | | | | | | | | | | | | | | |
Total from investment operations | | | 0.21 | | | | (0.07 | ) | | | 0.79 | | | | 0.54 | | | | 0.74 | | | | 0.16 | |
Distributions to shareholders from | | | | | | | | | | | | | | | | | | | | | | | | |
Net investment income | | | (0.20 | ) | | | (0.39 | ) | | | (0.41 | ) | | | (0.44 | ) | | | (0.45 | ) | | | (0.45 | ) |
Net asset value, end of period | | | $11.68 | | | | $11.67 | | | | $12.13 | | | | $11.75 | | | | $11.65 | | | | $11.36 | |
Total return2 | | | 1.81 | % | | | (0.58 | )% | | | 6.88 | % | | | 4.70 | % | | | 6.72 | % | | | 1.28 | % |
Ratios to average net assets (annualized) | | | | | | | | | | | | | | | | | | | | | | | | |
Gross expenses | | | 0.57 | % | | | 0.57 | % | | | 0.57 | % | | | 0.57 | % | | | 0.58 | %3 | | | 0.55 | %3 |
Net expenses | | | 0.49 | % | | | 0.49 | % | | | 0.49 | % | | | 0.49 | % | | | 0.49 | %3 | | | 0.50 | %3 |
Net investment income | | | 3.39 | % | | | 3.27 | % | | | 3.47 | % | | | 3.78 | % | | | 4.00 | %3 | | | 3.79 | %3 |
Supplemental data | | | | | | | | | | | | | | | | | | | | | | | | |
Portfolio turnover rate | | | 6 | % | | | 20 | % | | | 13 | % | | | 15 | % | | | 15 | % | | | 14 | % |
Net assets, end of period (000s omitted) | | | $98,748 | | | | $102,672 | | | | $132,844 | | | | $106,769 | | | | $119,276 | | | | $148,684 | |
| 1 | Calculated based upon average shares outstanding |
| 2 | Returns for periods of less than one year are not annualized. |
| 3 | Ratios include interest and fee expense relating to inverse floating-rate obligations as follows: |
| | | | |
Year ended June 30, 2014 | | | 0.00 | % |
Year ended June 30, 2013 | | | 0.01 | % |
The accompanying notes are an integral part of these financial statements.
| | | | | | |
| Notes to financial statements (unaudited) | | Wells Fargo Pennsylvania Tax-Free Fund | | | 17 | |
1. ORGANIZATION
Wells Fargo Funds Trust (the “Trust”), a Delaware statutory trust organized on March 10, 1999, is an open-end management investment company registered under the Investment Company Act of 1940, as amended (the “1940 Act”). As an investment company, the Trust follows the accounting and reporting guidance in Financial Accounting Standards Board Accounting Standards Codification Topic 946, Financial Services – Investment Companies. These financial statements report on the Wells Fargo Pennsylvania Tax-Free Fund (the “Fund”) which is a diversified series of the Trust.
Effective at the close of business on December 5, 2016, Class B shares were converted to Class A shares and are no longer offered by the Fund. Information for Class B shares reflected in the financial statements represents activity through December 5, 2016.
2. SIGNIFICANT ACCOUNTING POLICIES
The following significant accounting policies, which are consistently followed in the preparation of the financial statements of the Fund, are in conformity with U.S. generally accepted accounting principles which require management to make estimates and assumptions that affect the reported amounts of assets and liabilities, disclosure of contingent assets and liabilities at the date of the financial statements, and the reported amounts of revenues and expenses during the reporting period. Actual results could differ from those estimates.
Securities valuation
All investments are valued each business day as of the close of regular trading on the New York Stock Exchange (generally 4 p.m. Eastern Time), although the Fund may deviate from this calculation time under unusual or unexpected circumstances.
Debt securities are valued at the evaluated bid price provided by an independent pricing service or, if a reliable price is not available, the quoted bid price from an independent broker-dealer.
Investments in registered open-end investment companies are valued at net asset value.
Investments which are not valued using any of the methods discussed above are valued at their fair value, as determined in good faith by the Board of Trustees of the Fund. The Board of Trustees has established a Valuation Committee comprised of the Trustees and has delegated to it the authority to take any actions regarding the valuation of portfolio securities that the Valuation Committee deems necessary or appropriate, including determining the fair value of portfolio securities, unless the determination has been delegated to the Management Valuation Team of Wells Fargo Funds Management, LLC (“Funds Management”). The Board of Trustees retains the authority to make or ratify any valuation decisions or approve any changes to the Valuation Procedures as it deems appropriate. On a quarterly basis, the Board of Trustees receives reports on any valuation actions taken by the Valuation Committee or the Management Valuation Team which may include items for ratification.
Valuations of fair valued securities are compared to the next actual sales price when available, or other appropriate market values, to assess the continued appropriateness of the fair valuation methodologies used. These securities are fair valued on a day-to-day basis, taking into consideration changes to appropriate market information and any significant changes to the inputs considered in the valuation process until there is a readily available price provided on an exchange or by an independent pricing service. Valuations received from an independent pricing service or independent broker-dealer quotes are periodically validated by comparisons to most recent trades and valuations provided by other independent pricing services in addition to the review of prices by the manager and/or subadviser. Unobservable inputs used in determining fair valuations are identified based on the type of security, taking into consideration factors utilized by market participants in valuing the investment, knowledge about the issuer and the current market environment.
When-issued transactions
The Fund may purchase securities on a forward commitment or when-issued basis. The Fund records a when-issued transaction on the trade date and will segregate assets in an amount at least equal in value to the Fund’s commitment to purchase when-issued securities. Securities purchased on a when-issued basis are marked-to-market daily and the Fund begins earning interest on the settlement date. Losses may arise due to changes in the market value of the underlying securities or if the counterparty does not perform under the contract.
Security transactions and income recognition
Securities transactions are recorded on a trade date basis. Realized gains or losses are recorded on the basis of identified cost.
Interest income is accrued daily and bond discounts are accreted and premiums are amortized daily based on the effective interest method. To the extent debt obligations are placed on non-accrual status, any related interest income
| | | | |
| 18 | | Wells Fargo Pennsylvania Tax-Free Fund | | Notes to financial statements (unaudited) |
may be reduced by writing off interest receivables when the collection of all or a portion of interest has been determined to be doubtful based on consistently applied procedures and the fair value has decreased. If the issuer subsequently resumes interest payments or when the collectability of interest is reasonably assured, the debt obligation is removed from non-accrual status.
Distributions to shareholders
Distributions to shareholders from net investment income are accrued daily and paid monthly. Distributions from net realized gains, if any, are recorded on the ex-dividend date. Such distributions are determined in accordance with income tax regulations and may differ from U.S. generally accepted accounting principles. Dividend sources are estimated at the time of declaration. The tax character of distributions is determined as of the Fund’s fiscal year end. Therefore, a portion of the Fund’s distributions made prior to the Fund’s fiscal year end may be categorized as a tax return of capital.
Federal and other taxes
The Fund intends to continue to qualify as a regulated investment company by distributing substantially all of its investment company taxable and tax-exempt income and any net realized capital gains (after reduction for capital loss carryforwards) sufficient to relieve it from all, or substantially all, federal income taxes. Accordingly, no provision for federal income taxes was required.
The Fund’s income and federal excise tax returns and all financial records supporting those returns for the prior three fiscal years are subject to examination by the federal and Delaware revenue authorities. Management has analyzed the Fund’s tax positions taken on federal, state, and foreign tax returns for all open tax years and does not believe that there are any uncertain tax positions that require recognition of a tax liability.
As of December 31, 2017, the aggregate cost of all investments for federal income tax purposes was $147,630,320 and the unrealized gains (losses) consisted of:
| | | | |
Gross unrealized gains | | $ | 8,428,650 | |
Gross unrealized losses | | | (137,619 | ) |
Net unrealized gains | | $ | 8,291,031 | |
As of June 30, 2017, the Fund had capital loss carryforwards which consist of $829,936 in short-term capital losses.
Class allocations
The separate classes of shares offered by the Fund differ principally in applicable sales charges, distribution, shareholder servicing, and administration fees. Class specific expenses are charged directly to that share class. Investment income, common expenses, and realized and unrealized gains (losses) on investments are allocated daily to each class of shares based on the relative proportion of net assets of each class.
3. FAIR VALUATION MEASUREMENTS
Fair value measurements of investments are determined within a framework that has established a fair value hierarchy based upon the various data inputs utilized in determining the value of the Fund’s investments. The three-level hierarchy gives the highest priority to unadjusted quoted prices in active markets for identical assets or liabilities (Level 1) and the lowest priority to unobservable inputs (Level 3). The Fund’s investments are classified within the fair value hierarchy based on the lowest level of input that is significant to the fair value measurement. The inputs are summarized into three broad levels as follows:
| ∎ | | Level 1 – quoted prices in active markets for identical securities |
| ∎ | | Level 2 – other significant observable inputs (including quoted prices for similar securities, interest rates, prepayment speeds, credit risk, etc.) |
| ∎ | | Level 3 – significant unobservable inputs (including the Fund’s own assumptions in determining the fair value of investments) |
The inputs or methodologies used for valuing investments in securities are not necessarily an indication of the risk associated with investing in those securities.
| | | | | | |
| Notes to financial statements (unaudited) | | Wells Fargo Pennsylvania Tax-Free Fund | | | 19 | |
The following is a summary of the inputs used in valuing the Fund’s assets and liabilities as of December 31, 2017:
| | | | | | | | | | | | | | | | |
| | | Quoted prices
(Level 1) | | | Other significant
observable inputs
(Level 2) | | | Significant
unobservable inputs (Level 3) | | | Total | |
Assets | | | | | | | | | | | | | | | | |
Investments in: | | | | | | | | | | | | | | | | |
| | | | |
Municipal obligations | | $ | 0 | | | $ | 155,715,089 | | | $ | 0 | | | $ | 155,715,089 | |
| | | | |
Short-term investments | | | | | | | | | | | | | | | | |
Investment companies | | | 206,262 | | | | 0 | | | | 0 | | | | 206,262 | |
Total assets | | $ | 206,262 | | | $ | 155,715,089 | | | $ | 0 | | | $ | 155,921,351 | |
The Fund recognizes transfers between levels within the fair value hierarchy at the end of the reporting period. At December 31, 2017, the Fund did not have any transfers into/out of Level 1, Level 2, or Level 3.
4. TRANSACTIONS WITH AFFILIATES
Management fee
Funds Management, an indirect wholly owned subsidiary of Wells Fargo & Company (“Wells Fargo”), is the manager of the Fund and provides advisory and fund-level administrative services under an investment management agreement. Under the investment management agreement, Funds Management is responsible for, among other services, implementing the investment objectives and strategies of the Fund, supervising the subadviser, providing fund-level administrative services in connection with the Fund’s operations, and providing any other fund-level administrative services reasonably necessary for the operation of the Fund. As compensation for its services under the investment management agreement, Funds Management is entitled to receive an annual management fee starting at 0.40% and declining to 0.28% as the average daily net assets of the Fund increase. For the six months ended December 31, 2017, the management fee was equivalent to an annual rate of 0.40% of the Fund’s average daily net assets.
Funds Management has retained the services of a subadviser to provide daily portfolio management to the Fund. The fee for subadvisory services is borne by Funds Management. Wells Capital Management Incorporated, an affiliate of Funds Management and an indirect wholly owned subsidiary of Wells Fargo, is the subadviser to the Fund and is entitled to receive a fee from Funds Management at an annual rate starting at 0.20% and declining to 0.10% as the average daily net assets of the Fund increase.
Administration fees
Under a class-level administration agreement, Funds Management provides class-level administrative services to the Fund, which includes paying fees and expenses for services provided by the transfer agent, sub-transfer agents, omnibus account servicers and record-keepers. As compensation for its services under the class-level administration agreement, Funds Management receives an annual fee which is calculated based on the average daily net assets of each class as follows:
| | | | |
| | | Class-level
administration fee | |
Class A, Class C | | | 0.16 | % |
Institutional Class | | | 0.08 | |
Funds Management has contractually waived and/or reimbursed management and administration fees to the extent necessary to maintain certain net operating expense ratios for the Fund. Waiver of fees and/or reimbursement of expenses by Funds Management were made first from fund level expenses on a proportionate basis and then from class specific expenses. Funds Management has committed through October 31, 2018 to waive fees and/or reimburse expenses to the extent necessary to cap the Fund’s expenses at 0.74% for Class A shares, 1.49% for Class C shares, and 0.49% for Institutional Class shares. After this time, the cap may be increased or the commitment to maintain the cap may be terminated only with the approval of the Board of Trustees.
Distribution fee
The Trust has adopted a distribution plan for Class C shares of the Fund pursuant to Rule 12b-1 under the 1940 Act. A distribution fee is charged to Class C shares and paid to Wells Fargo Funds Distributor, LLC (“Funds Distributor”), the principal underwriter, at an annual rate of 0.75% of the average daily net assets of Class C shares.
| | | | |
| 20 | | Wells Fargo Pennsylvania Tax-Free Fund | | Notes to financial statements (unaudited) |
In addition, Funds Distributor is entitled to receive the front-end sales charge from the purchase of Class A shares and a contingent deferred sales charge on the redemption of certain Class A shares. Funds Distributor is also entitled to receive the contingent deferred sales charges from redemptions of Class C shares. For the six months ended December 31, 2017, Funds Distributor received $2,261 from the sale of Class A shares. No contingent deferred sales charges were incurred by Class A and Class C for the six months ended December 31, 2017.
Shareholder servicing fees
The Trust has entered into contracts with one or more shareholder servicing agents, whereby Class A and Class C of the Fund are charged a fee at an annual rate of 0.25% of the average daily net assets of each respective class.
A portion of these total shareholder servicing fees were paid to affiliates of Wells Fargo.
Interfund transactions
The Fund may purchase or sell portfolio investment securities to certain other Wells Fargo affiliates pursuant to Rule 17a-7 under the 1940 Act and under procedures adopted by the Board of Trustees. The procedures have been designed to ensure that these interfund transactions, which do not incur broker commissions, are effected at current market prices. Pursuant to these procedures, the Fund had $2,750,000 in interfund sales during the six months ended December 31, 2017.
5. INVESTMENT PORTFOLIO TRANSACTIONS
Purchases and sales of investments, excluding U.S. government obligations (if any) and short-term securities, for the six months ended December 31, 2017 were $9,048,077 and $14,706,474, respectively.
6. BANK BORROWINGS
The Trust (excluding the money market funds and certain other funds) and Wells Fargo Variable Trust are parties to a $280,000,000 revolving credit agreement whereby the Fund is permitted to use bank borrowings for temporary or emergency purposes, such as to fund shareholder redemption requests. Interest under the credit agreement is charged to the Fund based on a borrowing rate equal to the higher of the Federal Funds rate in effect on that day plus 1.25% or the overnight LIBOR rate in effect on that day plus 1.25%. In addition, an annual commitment fee equal to 0.25% of the unused balance is allocated to each participating fund. Prior to August 29, 2017, the revolving credit agreement amount was $250,000,000.
For the six months ended December 31, 2017, there were no borrowings by the Fund under the agreement.
7. CONCENTRATION RISK
The Fund invests a substantial portion of its assets in issuers of municipal debt securities located in a single state or territories of the U.S. Therefore, it may be more affected by economic and political developments in that state or region than would be a comparable general tax-exempt fund.
8. INDEMNIFICATION
Under the Trust’s organizational documents, the officers and Trustees have been granted certain indemnification rights against certain liabilities that may arise out of performance of their duties to the Trust. Additionally, in the normal course of business, the Trust may enter into contracts with service providers that contain a variety of indemnification clauses. The Trust’s maximum exposure under these arrangements is dependent on future claims that may be made against the Fund and, therefore, cannot be estimated.
| | | | | | |
| Other information (unaudited) | | Wells Fargo Pennsylvania Tax-Free Fund | | | 21 | |
PROXY VOTING INFORMATION
A description of the policies and procedures that the Fund uses to determine how to vote proxies relating to portfolio securities is available, upon request, by calling 1-800-222-8222, visiting our website at wellsfargofunds.com, or visiting the SEC website at sec.gov. Information regarding how the Fund voted proxies relating to portfolio securities during the most recent 12-month period ended June 30 is available on the Fund’s website at wellsfargofunds.com or by visiting the SEC website at sec.gov.
PORTFOLIO HOLDINGS INFORMATION
The complete portfolio holdings for the Fund are publicly available monthly on the Fund’s website (wellsfargofunds.com), on a one-month delayed basis. In addition, top ten holdings information (excluding derivative positions) for the Fund is publicly available on the Fund’s website on a monthly, seven-day or more delayed basis. The Fund files its complete schedule of portfolio holdings with the SEC for the first and third quarters of each fiscal year on Form N-Q, which is available by visiting the SEC website at sec.gov. In addition, the Fund’s Form N-Q may be reviewed and copied at the SEC’s Public Reference Room in Washington, DC, and at regional offices in New York City, at 233 Broadway, and in Chicago, at 175 West Jackson Boulevard, Suite 900. Information about the Public Reference Room may be obtained by calling 1-800-SEC-0330.
| | | | |
| 22 | | Wells Fargo Pennsylvania Tax-Free Fund | | Other information (unaudited) |
BOARD OF TRUSTEES AND OFFICERS
Each of the Trustees and Officers1 listed in the table below acts in identical capacities for each fund in the Wells Fargo family of funds, which consists of 153 mutual funds comprising the Wells Fargo Funds Trust, Wells Fargo Variable Trust, Wells Fargo Master Trust and four closed-end funds (collectively the “Fund Complex”). This table should be read in conjunction with the Prospectus and the Statement of Additional Information2. The mailing address of each Trustee and Officer is 525 Market Street, 12th Floor, San Francisco, CA 94105. Each Trustee and Officer serves an indefinite term, however, each Trustee serves such term until reaching the mandatory retirement age established by the Trustees.
Independent Trustees
| | | | | | |
Name and year of birth | | Position held and
length of service* | | Principal occupations during past five years or longer | | Current other
public company or
investment company
directorships |
William R. Ebsworth (Born 1957) | | Trustee, since 2015 | | Retired. From 1984 to 2013, equities analyst, portfolio manager, research director and chief investment officer at Fidelity Management and Research Company in Boston, Tokyo, and Hong Kong, and retired in 2013 as Chief Investment Officer of Fidelity Strategic Advisers, Inc. where he led a team of investment professionals managing client assets. Prior thereto, Board member of Hong Kong Securities Clearing Co., Hong Kong Options Clearing Corp., the Thailand International Fund, Ltd., Fidelity Investments Life Insurance Company, and Empire Fidelity Investments Life Insurance Company. Board member of the Forté Foundation (non-profit organization) and the Vincent Memorial Hospital Endowment (non-profit organization), where he serves on the Investment Committee and as a Chair of the Audit Committee. Mr. Ebsworth is a CFA® charterholder. | | Asset Allocation Trust |
Jane A. Freeman** (Born 1953) | | Trustee, since 2015; Chair Liaison, since 2018 | | Retired. From 2012 to 2014 and 1999 to 2008, Chief Financial Officer of Scientific Learning Corporation. From 2008 to 2012, Ms. Freeman provided consulting services related to strategic business projects. Prior to 1999, Portfolio Manager at Rockefeller & Co. and Scudder, Stevens & Clark. Board member of the Harding Loevner Funds from 1996 to 2014, serving as both Lead Independent Director and chair of the Audit Committee. Board member of the Russell Exchange Traded Funds Trust from 2011 to 2012 and the chair of the Audit Committee. Ms. Freeman is a Board Member of Ruth Bancroft Garden (non-profit organization) and the Glimmerglass Festival. She is also an inactive Chartered Financial Analyst. | | Asset Allocation Trust |
Peter G. Gordon*** (Born 1942) | | Trustee, since 1998; Chairman, from 2005 to 2017 | | Co-Founder, Retired Chairman, President and CEO of Crystal Geyser Water Company. Trustee Emeritus, Colby College. | | Asset Allocation Trust |
Isaiah Harris, Jr. (Born 1952) | | Trustee, since 2009 | | Retired. Chairman of the Board of CIGNA Corporation since 2009, and Director since 2005. From 2003 to 2011, Director of Deluxe Corporation. Prior thereto, President and CEO of BellSouth Advertising and Publishing Corp. from 2005 to 2007, President and CEO of BellSouth Enterprises from 2004 to 2005 and President of BellSouth Consumer Services from 2000 to 2003. Emeritus member of the Iowa State University Foundation Board of Governors. Emeritus Member of the Advisory Board of Iowa State University School of Business. Advisory Board Member, Palm Harbor Academy (charter school). Advisory Board Member, Child Evangelism Fellowship (non-profit). Mr. Harris is a certified public accountant (inactive status). | | CIGNA Corporation; Asset Allocation Trust |
Judith M. Johnson (Born 1949) | | Trustee, since 2008; Audit Committee Chairman, since 2008 | | Retired. Prior thereto, Chief Executive Officer and Chief Investment Officer of Minneapolis Employees Retirement Fund from 1996 to 2008. Ms. Johnson is an attorney, certified public accountant and a certified managerial accountant. | | Asset Allocation Trust |
David F. Larcker (Born 1950) | | Trustee, since 2009 | | James Irvin Miller Professor of Accounting at the Graduate School of Business, Stanford University, Director of the Corporate Governance Research Initiative and Senior Faculty of The Rock Center for Corporate Governance since 2006. From 2005 to 2008, Professor of Accounting at the Graduate School of Business, Stanford University. Prior thereto, Ernst & Young Professor of Accounting at The Wharton School, University of Pennsylvania from 1985 to 2005. | | Asset Allocation Trust |
| | | | | | |
| Other information (unaudited) | | Wells Fargo Pennsylvania Tax-Free Fund | | | 23 | |
| | | | | | |
Name and
year of birth | | Position held and
length of service* | | Principal occupations during past five years or longer | | Current other
public company or
investment company
directorships |
Olivia S. Mitchell**** (Born 1953) | | Trustee, since 2006; Governance Committee Chairman, since 2018 | | International Foundation of Employee Benefit Plans Professor, Wharton School of the University of Pennsylvania since 1993. Director of Wharton’s Pension Research Council and Boettner Center on Pensions & Retirement Research, and Research Associate at the National Bureau of Economic Research. Previously, Cornell University Professor from 1978 to 1993. | | Asset Allocation Trust |
Timothy J. Penny***** (Born 1951) | | Trustee, since 1996; Chairman, since 2018; Vice Chairman, from 2017 to 2018 | | President and Chief Executive Officer of Southern Minnesota Initiative Foundation, a non-profit organization, since 2007. Member of the Board of Trustees of NorthStar Education Finance, Inc., a non-profit organization, since 2007. | | Asset Allocation Trust |
James G. Polisson****** (Born 1959) | | Trustee, since 2018; Advisory Board Member, from 2017 to 2018 | | Retired. Chief Marketing Officer, Source (ETF) UK Services, Ltd, from 2015 to 2017. From 2012 to 2015, Principal of The Polisson Group, LLC, a management consulting, corporate advisory and principal investing company. Chief Executive Officer and Managing Director at Russell Investments, Global Exchange Traded Funds from 2010 to 2012. Managing Director of Barclays Global Investors from 1998 to 2010 and Global Chief Marketing Officer for iShares and Barclays Global Investors from 2000 to 2010. Trustee of the San Francisco Mechanics’ Institute, a non-profit organization, from 2013 to 2015. Board member of the Russell Exchange Traded Fund Trust from 2011 to 2012. Director of Barclays Global Investors Holdings Deutschland GmbH from 2006 to 2009. Mr. Polisson is an attorney and has a retired status with the Massachusetts and District of Columbia Bar Associations. | | Asset Allocation Trust |
Michael S. Scofield (Born 1943) | | Trustee, since 2010 | | Served on the Investment Company Institute’s Board of Governors and Executive Committee from 2008-2011 as well the Governing Council of the Independent Directors Council from 2006-2011 and the Independent Directors Council Executive Committee from 2008-2011. Trustee of the Evergreen Funds complex (and its predecessors) from 1984 to 2010. Chairman of the Evergreen Funds from 2000-2010. Former Trustee of the Mentor Funds. Retired Attorney, Law Offices of Michael S. Scofield. | | Asset Allocation Trust |
Pamela Wheelock****** (Born 1959) | | Trustee, since 2018; Advisory Board Member, from 2017 to 2018 | | Chief Operating Officer, Twin Cities Habitat for Humanity, since January, 2017. Vice President of University Services, University of Minnesota from 2012 to 2017. Prior thereto, Interim President and Chief Executive Officer of Blue Cross Blue Shield of Minnesota from 2010 to 2011, Chairman of the Board from 2009 to 2011 and Board Director from 2003 to 2015. Vice President, Leadership and Community Engagement, Bush Foundation, Saint Paul, Minnesota (a private foundation) from 2009 to 2011. Executive Vice President and Chief Financial Officer, Minnesota Sports and Entertainment from 2004 to 2009 and Senior Vice President from 2002 to 2004. Commissioner of Finance, State of Minnesota, from 1999 to 2002. Currently on the Board of Directors, Governance Committee and Finance Committee, for the Minnesota Philanthropy Partners (Saint Paul Foundation) since 2012 and Board Chair of the Minnesota Wild Foundation since 2010. | | Asset Allocation Trust |
| * | Length of service dates reflect the Trustee’s commencement of service with the Trust’s predecessor entities, where applicable. |
| ** | Jane Freeman became Chair Liaison effective January 1, 2018. |
| *** | Peter Gordon retired on December 31, 2017. |
| **** | Olivia Mitchell became Chairman of the Governance Committee effective January 1, 2018. |
| ***** | Timothy Penny became Chairman effective January 1, 2018. |
| ****** | James Polisson and Pamela Wheelock each became a Trustee effective January 1, 2018. |
| | | | |
| 24 | | Wells Fargo Pennsylvania Tax-Free Fund | | Other information (unaudited) |
Officers
| | | | | | |
Name and year of birth | | Position held and
length of service | | Principal occupations during past five years or longer | | |
Andrew Owen (Born 1960) | | President, since 2017 | | Executive Vice President of Wells Fargo & Company and Head of Affiliated Managers, Wells Fargo Asset Management, since 2014. In addition, Mr. Owen is currently President, Chief Executive Officer and Director of Wells Fargo Funds Management, LLC since 2017. Prior thereto, Executive Vice President responsible for marketing, investments and product development for Wells Fargo Funds Management, LLC, from 2009 to 2014. | | |
Nancy Wiser1 (Born 1967) | | Treasurer, since 2012 | | Executive Vice President of Wells Fargo Funds Management, LLC since 2011. Chief Operating Officer and Chief Compliance Officer at LightBox Capital Management LLC, from 2008 to 2011. | | |
C. David Messman (Born 1960) | | Secretary, since 2000; Chief Legal Officer, since 2003 | | Senior Vice President and Secretary of Wells Fargo Funds Management, LLC since 2001. Assistant General Counsel of Wells Fargo Bank, N.A. since 2013 and Vice President and Managing Counsel of Wells Fargo Bank, N.A. from 1996 to 2013. | | |
Michael H. Whitaker (Born 1967) | | Chief Compliance Officer, since 2016 | | Senior Vice President and Chief Compliance Officer since 2016. Senior Vice President and Chief Compliance Officer for Fidelity Investments from 2007 to 2016. | | |
David Berardi (Born 1975) | | Assistant Treasurer, since 2009 | | Vice President of Wells Fargo Funds Management, LLC since 2009. Vice President of Evergreen Investment Management Company, LLC from 2008 to 2010. Manager of Fund Reporting and Control for Evergreen Investment Management Company, LLC from 2004 to 2010. | | |
Jeremy DePalma1 (Born 1974) | | Assistant Treasurer, since 2009 | | Senior Vice President of Wells Fargo Funds Management, LLC since 2009. Senior Vice President of Evergreen Investment Management Company, LLC from 2008 to 2010 and head of the Fund Reporting and Control Team within Fund Administration from 2005 to 2010. | | |
| 1 | Nancy Wiser acts as Treasurer of 77 funds in the Fund Complex. Jeremy DePalma acts as Treasurer of 76 funds and Assistant Treasurer of 77 funds in the Fund Complex. |
| 2 | The Statement of Additional Information includes additional information about the Trustees and is available, without charge, upon request, by calling 1-800-222-8222 or by visiting the website at wellsfargofunds.com. |
| | | | | | |
| List of abbreviations | | Wells Fargo Pennsylvania Tax-Free Fund | | | 25 | |
The following is a list of common abbreviations for terms and entities that may have appeared in this report.
| ACA | — ACA Financial Guaranty Corporation |
| ADR | — American depositary receipt |
| ADS | — American depositary shares |
| AGC | — Assured Guaranty Corporation |
| AGM | — Assured Guaranty Municipal |
| Ambac | — Ambac Financial Group Incorporated |
| AMT | — Alternative minimum tax |
| BAN | — Bond anticipation notes |
| BHAC | — Berkshire Hathaway Assurance Corporation |
| CAB | — Capital appreciation bond |
| CCAB | — Convertible capital appreciation bond |
| CDA | — Community Development Authority |
| CDO | — Collateralized debt obligation |
| CLO | — Collateralized loan obligation |
| DRIVER | — Derivative inverse tax-exempt receipts |
| DW&P | — Department of Water & Power |
| DWR | — Department of Water Resources |
| ECFA | — Educational & Cultural Facilities Authority |
| EDA | — Economic Development Authority |
| EDFA | — Economic Development Finance Authority |
| ETF | — Exchange-traded fund |
| FDIC | — Federal Deposit Insurance Corporation |
| FFCB | — Federal Farm Credit Banks |
| FGIC | — Financial Guaranty Insurance Corporation |
| FHA | — Federal Housing Administration |
| FHLB | — Federal Home Loan Bank |
| FHLMC | — Federal Home Loan Mortgage Corporation |
| FICO | — The Financing Corporation |
| FNMA | — Federal National Mortgage Association |
| GDR | — Global depositary receipt |
| GNMA | — Government National Mortgage Association |
| HCFR | — Healthcare facilities revenue |
| HEFA | — Health & Educational Facilities Authority |
| HEFAR | — Higher education facilities authority revenue |
| HFA | — Housing Finance Authority |
| HFFA | — Health Facilities Financing Authority |
| HUD | — Department of Housing and Urban Development |
| IDA | — Industrial Development Authority |
| IDAG | — Industrial Development Agency |
| KRW | — Republic of Korea won |
| LIBOR | — London Interbank Offered Rate |
| LIFER | — Long Inverse Floating Exempt Receipts |
| LLC | — Limited liability company |
| LLLP | — Limited liability limited partnership |
| LLP | — Limited liability partnership |
| MBIA | — Municipal Bond Insurance Association |
| MFHR | — Multifamily housing revenue |
| MSTR | — Municipal securities trust receipts |
| MUD | — Municipal Utility District |
| National | — National Public Finance Guarantee Corporation |
| PCFA | — Pollution Control Financing Authority |
| PCL | — Public Company Limited |
| PCR | — Pollution control revenue |
| PFA | — Public Finance Authority |
| PFFA | — Public Facilities Financing Authority |
| PFOTER | — Puttable floating option tax-exempt receipts |
| PJSC | — Public Joint Stock Company |
| plc | — Public limited company |
| PUTTER | — Puttable tax-exempt receipts |
| R&D | — Research & development |
| Radian | — Radian Asset Assurance |
| RAN | — Revenue anticipation notes |
| RDA | — Redevelopment Agency |
| RDFA | — Redevelopment Finance Authority |
| REIT | — Real estate investment trust |
| ROC | — Reset option certificates |
| SAVRS | — Select auction variable rate securities |
| SBA | — Small Business Authority |
| SDR | — Swedish depositary receipt |
| SFHR | — Single-family housing revenue |
| SFMR | — Single-family mortgage revenue |
| SIFMA | — Securities Industry and Financial Markets Association |
| SPA | — Standby purchase agreement |
| SPDR | — Standard & Poor’s Depositary Receipts |
| SPEAR | — Short Puttable Exempt Adjustable Receipts |
| STRIPS | — Separate trading of registered interest and |
| TAN | — Tax anticipation notes |
| TIPS | — Treasury inflation-protected securities |
| TRAN | — Tax revenue anticipation notes |
| TTFA | — Transportation Trust Fund Authority |
| TVA | — Tennessee Valley Authority |
This page is intentionally left blank.
This page is intentionally left blank.
This page is intentionally left blank.

For more information
More information about Wells Fargo Funds is available free upon request. To obtain literature, please write, email, visit the Fund’s website, or call:
Wells Fargo Funds
P.O. Box 8266
Boston, MA 02266-8266
Email: fundservice@wellsfargo.com
Website: wellsfargofunds.com
Individual investors: 1-800-222-8222
Retail investment professionals: 1-888-877-9275
Institutional investment professionals:
1-866-765-0778
This report and the financial statements contained herein are submitted for the general information of the shareholders of the Fund. If this report is used for promotional purposes, distribution of the report must be accompanied or preceded by a current prospectus. Before investing, please consider the investment objectives, risks, charges, and expenses of the investment. For a current prospectus and, if available, a summary prospectus, containing this information, call 1-800-222-8222 or visit the Fund’s website at wellsfargofunds.com. Read the prospectus carefully before you invest or send money.
Wells Fargo Asset Management (WFAM) is a trade name used by the asset management businesses of Wells Fargo & Company. Wells Fargo Funds Management, LLC, a wholly owned subsidiary of Wells Fargo & Company, provides investment advisory and administrative services for Wells Fargo Funds. Other affiliates of Wells Fargo & Company provide subadvisory and other services for the funds. The funds are distributed by Wells Fargo Funds Distributor, LLC, Member FINRA, an affiliate of Wells Fargo & Company. Neither Wells Fargo Funds Distributor nor Wells Fargo Funds Management holds fund shareholder accounts or assets. This material is for general informational and educational purposes only and is NOT intended to provide investment advice or a recommendation of any kind—including a recommendation for any specific investment, strategy, or plan.
NOT FDIC INSURED ◾ NO BANK GUARANTEE ◾ MAY LOSE VALUE
© 2017 Wells Fargo Funds Management, LLC. All rights reserved.
| | |
 | | 308066 02-18 SA255/SAR255 12-17 |
Semi-Annual Report
December 31, 2017

Wells Fargo Short-Term Municipal Bond Fund


Reduce clutter. Save trees.
Sign up for electronic delivery of prospectuses and shareholder reports at wellsfargo.com/advantagedelivery
Contents
The views expressed and any forward-looking statements are as of December 31, 2017, unless otherwise noted, and are those of the Fund managers and/or Wells Fargo Funds Management, LLC. Discussions of individual securities, or the markets generally, or any Wells Fargo Fund are not intended as individual recommendations. Future events or results may vary significantly from those expressed in any forward-looking statements. The views expressed are subject to change at any time in response to changing circumstances in the market. Wells Fargo Funds Management, LLC and the Fund disclaim any obligation to publicly update or revise any views expressed or forward-looking statements.
NOT FDIC INSURED ◾ NO BANK GUARANTEE ◾ MAY LOSE VALUE
| | | | |
| 2 | | Wells Fargo Short-Term Municipal Bond Fund | | Letter to shareholders (unaudited) |

Andrew Owen
President
Wells Fargo Funds
In a predominantly improving global economic environment, global stocks delivered strong results; bond markets had smaller but positive results as well.
Dear Shareholder:
We are pleased to offer you this semi-annual report for the Wells Fargo Short-Term Municipal Bond Fund for the six-month period that ended December 31, 2017. In a predominantly improving global economic environment, global stocks delivered strong results; bond markets had smaller but positive results as well. U.S. and international stocks delivered similar results, with returns of 11.42% and 11.48%, respectively, for the six-month period, as measured by the S&P 500 Index1 and the MSCI ACWI ex USA Index (Net)2, respectively; within fixed income, the Bloomberg Barclays U.S. Aggregate Bond Index3 returned 1.24% and the Bloomberg Barclays Municipal Bond Index4 returned 1.82%.
As global growth improved in the third quarter of 2017, investment markets generally advanced.
Most stock markets worldwide moved higher during the quarter and ended the period at or near all-time highs. Moderate acceleration in global economic growth was supported by improving corporate earnings, low inflation pressure, and still-low interest rates. Corporate earnings reports were favorable overall as companies continued to benefit from healthy operating leverage. While North Korea’s recent missile launches and nuclear testing raised serious concerns around the world, the heightened geopolitical risk had relatively minimal impact on the quarter’s stock returns. In the U.S., economic data released during the quarter reflected a generally healthy economy. Second-quarter economic output grew at a 3.1% annual rate, and consumers displayed more willingness to spend. Meanwhile, the U.S. Federal Reserve (Fed) maintained the target range for the federal funds rate at 1.00% to 1.25%, noting that inflation had remained below the Fed’s 2.00% objective. However, the Fed also stated the possibility of one more 0.25% increase in the federal funds rate by the end of 2017 and announced plans to begin the process of unwinding its $4.5 trillion portfolio of bonds and other assets in October. Outside the U.S., stocks in the Asia Pacific region benefited from solid earnings reports and investors’ willingness to take on risk despite the rising tensions between North Korea and the U.S. In Europe, markets were supported by better-than-expected economic growth, which led to narrowing of the gap between Europe’s growth rate and that of the U.S. In emerging markets, many countries benefited from stronger currencies versus the U.S. dollar.
Positive economic and market news continued through the fourth quarter.
During the fourth quarter of 2017, stock markets followed a steady, upward trajectory with no meaningful pullbacks, similar to their paths during the previous three quarters of the year. The extended rally was driven largely by reports of strong earnings and revenue surprises from many companies. Synchronous economic expansion worldwide with mild inflation provided a favorable environment for markets to rise with minimal volatility. Data released during the quarter reflected a
| 1 | The S&P 500 Index consists of 500 stocks chosen for market size, liquidity, and industry group representation. It is a market-value-weighted index with each stock’s weight in the index proportionate to its market value. You cannot invest directly in an index. |
| 2 | The Morgan Stanley Capital International (MSCI) All Country World Index (ACWI) ex USA Index (Net) is a free-float-adjusted market-capitalization-weighted index that is designed to measure the equity market performance of developed markets, excluding the United States and Canada. Source: MSCI. MSCI makes no express or implied warranties or representations and shall have no liability whatsoever with respect to any MSCI data contained herein. The MSCI data may not be further redistributed or used as a basis for other indices or any securities or financial products. This report is not approved, reviewed, or produced by MSCI. You cannot invest directly in an index. |
| 3 | The Bloomberg Barclays U.S. Aggregate Bond Index is a broad-based benchmark that measures the investment-grade, U.S. dollar-denominated, fixed-rate taxable bond market, including Treasuries, government-related and corporate securities, mortgage-backed securities (agency fixed-rate and hybrid adjustable-rate mortgage pass-throughs), asset-backed securities, and commercial mortgage-backed securities. You cannot invest directly in an index. |
| 4 | The Bloomberg Barclays Municipal Bond Index is an unmanaged index composed of long-term tax-exempt bonds with a minimum credit rating of Baa. You cannot invest directly in an index. |
| | | | | | |
| Letter to shareholders (unaudited) | | Wells Fargo Short-Term Municipal Bond Fund | | | 3 | |
healthy U.S. economy. Third-quarter economic output grew at a 3.2% annual rate, just ahead of the second quarter’s 3.1% pace. Hiring remained solid during the quarter; the hiring pace pushed the unemployment rate down to a 17-year low of 4.1% in October, and it remained at 4.1% for both November and December. Fed officials began unwinding the Fed’s $4.5 trillion portfolio of bonds and other assets in October as planned, and in December they raised the target for the federal funds rate to a range of 1.25% to 1.50%. As a result, long-term interest rates in the U.S. continued trending upward, although the 10-year rate remained below 2.5%. Outside the U.S., economies continued to strengthen. In December, the Organisation for Economic Co-operation and Development (OECD) reported that the global economy has been expanding at its fastest rate since 2010; all 45 countries the OECD follows were on track to expand for 2017. International economies have benefited from catalysts such as economic stimulus, improving employment, increased investment, and accelerated trade growth.
Don’t let short-term uncertainty derail long-term investment goals.
Periods of investment uncertainty can present challenges, but experience has taught us that maintaining long-term investment goals can be an effective way to plan for the future. To help you create a sound strategy based on your personal goals and risk tolerance, Wells Fargo Funds offers more than 100 mutual funds spanning a wide range of asset classes and investment styles. Although diversification cannot guarantee an investment profit or prevent losses, we believe it can be an effective way to manage investment risk and potentially smooth out overall portfolio performance. We encourage investors to know their investments and to understand that appropriate levels of risk-taking may unlock opportunities.
Thank you for choosing to invest with Wells Fargo Funds. We appreciate your confidence in us and remain committed to helping you meet your financial needs.
Sincerely,

Andrew Owen
President
Wells Fargo Funds
Although diversification cannot guarantee an investment profit or prevent losses, we believe it can be an effective way to manage investment risk and potentially smooth out overall portfolio performance.
For further information about your Fund, contact your investment professional, visit our website at wellsfargofunds.com, or call us directly at 1-800-222-8222. We are available 24 hours a day, 7 days a week.
| | | | |
| 4 | | Wells Fargo Short-Term Municipal Bond Fund | | Performance highlights (unaudited) |
Investment objective
The Fund seeks current income exempt from federal income tax consistent with capital preservation.
Manager
Wells Fargo Funds Management, LLC
Subadviser
Wells Capital Management Incorporated
Portfolio managers
Wendy Casetta
Lyle J. Fitterer, CFA®, CPA
Average annual total returns (%) as of December 31, 20171
| | | | | | | | | | | | | | | | | | | | | | | | | | | | | | | | | | |
| | | | | Including sales charge | | | Excluding sales charge | | | Expense ratios2 (%) | |
| | | Inception date | | 1 year | | | 5 year | | | 10 year | | | 1 year | | | 5 year | | | 10 year | | | Gross | | | Net3 | |
| Class A (WSMAX) | | 7-18-2008 | | | (0.33 | ) | | | 0.44 | | | | 1.91 | | | | 1.70 | | | | 0.85 | | | | 2.11 | | | | 0.76 | | | | 0.63 | |
| Class C (WSSCX) | | 1-31-2003 | | | (0.05 | ) | | | 0.10 | | | | 1.34 | | | | 0.95 | | | | 0.10 | | | | 1.34 | | | | 1.51 | | | | 1.38 | |
| Administrator Class (WSTMX) | | 7-30-2010 | | | – | | | | – | | | | – | | | | 1.73 | | | | 0.83 | | | | 2.11 | | | | 0.70 | | | | 0.60 | |
| Institutional Class (WSBIX) | | 3-31-2008 | | | – | | | | – | | | | – | | | | 1.94 | | | | 1.06 | | | | 2.33 | | | | 0.43 | | | | 0.40 | |
| Bloomberg Barclays 1-3 Year Composite Municipal Bond Index4 | | – | | | – | | | | – | | | | – | | | | 1.24 | | | | 0.86 | | | | 1.92 | | | | – | | | | – | |
Figures quoted represent past performance, which is no guarantee of future results, and do not reflect taxes that a shareholder may pay on fund distributions or the redemption of fund shares. Investment return and principal value of an investment will fluctuate so that an investor’s shares, when redeemed, may be worth more or less than their original cost. Performance shown without sales charges would be lower if sales charges were reflected. Current performance may be lower or higher than the performance data quoted, which assumes the reinvestment of dividends and capital gains. Current month-end performance is available on the Fund’s website, wellsfargofunds.com.
Index returns do not include transaction costs associated with buying and selling securities, any mutual fund fees or expenses, or any taxes. It is not possible to invest directly in an index.
For Class A shares, the maximum front-end sales charge is 2.00%. For Class C shares, the maximum contingent deferred sales charge is 1.00%. Performance including a contingent deferred sales charge assumes the sales charge for the corresponding time period. Administrator Class and Institutional Class shares are sold without a front-end sales charge or contingent deferred sales charge.
Bond values fluctuate in response to the financial condition of individual issuers, general market and economic conditions, and changes in interest rates. Changes in market conditions and government policies may lead to periods of heightened volatility in the bond market and reduced liquidity for certain bonds held by the Fund. In general, when interest rates rise, bond values fall and investors may lose principal value. Interest-rate changes and their impact on the Fund and its share price can be sudden and unpredictable. High-yield securities have a greater risk of default and tend to be more volatile than higher-rated debt securities. The use of derivatives may reduce returns and/or increase volatility. Certain investment strategies tend to increase the total risk of an investment (relative to the broader market). The Fund is exposed to high-yield securities risk and municipal securities risk. Consult the Fund’s prospectus for additional information on these and other risks. A portion of the Fund’s income may be subject to federal, state, and/or local income taxes or the Alternative Minimum Tax (AMT). Any capital gains distributions may be taxable.
Please see footnotes on page 5.
| | | | | | |
| Performance highlights (unaudited) | | Wells Fargo Short-Term Municipal Bond Fund | | | 5 | |
|
| Effective maturity distribution as of December 31, 20175 |
|
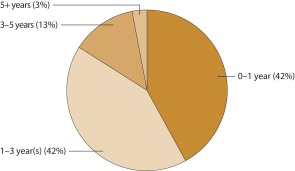 |
|
| Credit quality as of December 31, 20176 |
|
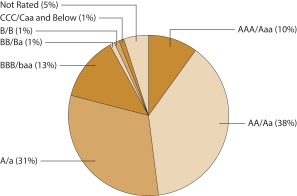 |
| 1 | Historical performance shown for Class A shares prior to their inception reflects the performance of the former Investor Class shares, and includes the higher expenses applicable to the former Investor Class shares (except during those periods in which expenses of Class A shares would have been higher than those of the former Investor Class shares, no such adjustment is reflected). If these expenses had not been included, returns would be higher for Class A shares. Historical performance shown for Administrator Class shares prior to their inception reflects the performance of Institutional Class shares, adjusted to reflect the higher expenses applicable to Administrator Class shares. Historical performance shown for Institutional Class shares prior to their inception reflects the performance of the former Investor Class shares, and includes the higher expenses applicable to the former Investor Class shares. If these expenses had not been included, returns for Institutional Class shares would be higher. |
| 2 | Reflects the expense ratios as stated in the most recent prospectuses. The expense ratios shown are subject to change and may differ from the annualized expense ratios shown in the financial highlights of this report. |
| 3 | The manager has contractually committed through October 31, 2018, to waive fees and/or reimburse expenses to the extent necessary to cap the Fund’s Total Annual Fund Operating Expenses After Fee Waivers at the amounts shown. After this time, the cap may be increased or the commitment to maintain the cap may be terminated only with the approval of the Board of Trustees. Brokerage commissions, stamp duty fees, interest, taxes, acquired fund fees and expenses, and extraordinary expenses are excluded from the expense cap. Without this cap, the Fund’s returns would have been lower. The expense ratio paid by an investor is the net expense ratio or the Fund’s Total Annual Fund Operating Expenses After Fee Waivers, as stated in the prospectuses. |
| 4 | The Bloomberg Barclays 1-3 Year Composite Municipal Bond Index is a blended index weighted 50% in the Bloomberg Barclays 1-Year Municipal Bond Index and 50% in the Bloomberg Barclays 3-Year Municipal Bond Index. You cannot invest directly in an index. |
| 5 | Amounts are calculated based on the total investments of the Fund. These amounts are subject to change and may have changed since the date specified. |
| 6 | The credit quality distribution of portfolio holdings reflected in the chart is based on ratings from Standard & Poor’s, Moody’s Investors Service, and/ or Fitch Ratings Ltd. Credit quality ratings apply to the underlying holdings of the Fund and not to the Fund itself. The percentages of the Fund’s portfolio with the ratings depicted in the chart are calculated based on the total market value of fixed income securities held by the Fund. If a security was rated by all three rating agencies, the middle rating was utilized. If rated by two of three rating agencies, the lower rating was utilized, and if rated by one of the rating agencies, that rating was utilized. Standard & Poor’s rates the creditworthiness of bonds, ranging from AAA (highest) to D (lowest). Ratings from A to CCC may be modified by the addition of a plus (+) or minus (-) sign to show relative standing within the rating categories. Standard & Poor’s rates the creditworthiness of short-term notes from SP-1 (highest) to SP-3 (lowest). Moody’s rates the creditworthiness of bonds, ranging from Aaa (highest) to C (lowest). Ratings Aa to B may be modified by the addition of a number 1 (highest) to 3 (lowest) to show relative standing within the ratings categories. Moody’s rates the creditworthiness of short-term U.S. tax-exempt municipal securities from MIG 1/VMIG 1 (highest) to SG (lowest). Fitch rates the creditworthiness of bonds, ranging from AAA (highest) to D (lowest). Credit quality distribution is subject to change and may have changed since the date specified. |
| | | | |
| 6 | | Wells Fargo Short-Term Municipal Bond Fund | | Fund expenses (unaudited) |
As a shareholder of the Fund, you incur two types of costs: (1) transaction costs, including sales charges (loads) on purchase payments and contingent deferred sales charges (if any) on redemptions and (2) ongoing costs, including management fees, distribution (12b-1) and/or shareholder servicing fees, and other Fund expenses. This example is intended to help you understand your ongoing costs (in dollars) of investing in the Fund and to compare these costs with the ongoing costs of investing in other mutual funds.
The example is based on an investment of $1,000 invested at the beginning of the six-month period and held for the entire period from July 1, 2017 to December 31, 2017.
Actual expenses
The “Actual” line of the table below provides information about actual account values and actual expenses. You may use the information in this line, together with the amount you invested, to estimate the expenses that you paid over the period. Simply divide your account value by $1,000 (for example, an $8,600 account value divided by $1,000 = 8.6), then multiply the result by the number in the “Actual” line under the heading entitled “Expenses paid during period” for your applicable class of shares to estimate the expenses you paid on your account during this period.
Hypothetical example for comparison purposes
The “Hypothetical” line of the table below provides information about hypothetical account values and hypothetical expenses based on the Fund’s actual expense ratio and an assumed rate of return of 5% per year before expenses, which is not the Fund’s actual return. The hypothetical account values and expenses may not be used to estimate the actual ending account balance or expenses you paid for the period. You may use this information to compare the ongoing costs of investing in the Fund and other funds. To do so, compare this 5% hypothetical example with the 5% hypothetical examples that appear in the shareholder reports of the other funds.
Please note that the expenses shown in the table are meant to highlight your ongoing costs only and do not reflect any transactional costs, such as sales charges (loads) and contingent deferred sales charges. Therefore, the “Hypothetical” line of the table is useful in comparing ongoing costs only and will not help you determine the relative total costs of owning different funds. In addition, if these transactional costs were included, your costs would have been higher.
| | | | | | | | | | | | | | | | |
| | | Beginning
account value
7-1-2017 | | | Ending
account value
12-31-2017 | | | Expenses
paid during
the period¹ | | | Annualized net
expense ratio | |
Class A | | | | | | | | | | | | | | | | |
Actual | | $ | 1,000.00 | | | $ | 1,005.16 | | | $ | 3.18 | | | | 0.63 | % |
Hypothetical (5% return before expenses) | | $ | 1,000.00 | | | $ | 1,022.03 | | | $ | 3.21 | | | | 0.63 | % |
Class C | | | | | | | | | | | | | | | | |
Actual | | $ | 1,000.00 | | | $ | 1,001.37 | | | $ | 6.96 | | | | 1.38 | % |
Hypothetical (5% return before expenses) | | $ | 1,000.00 | | | $ | 1,018.25 | | | $ | 7.02 | | | | 1.38 | % |
Administrator Class | | | | | | | | | | | | | | | | |
Actual | | $ | 1,000.00 | | | $ | 1,005.31 | | | $ | 3.03 | | | | 0.60 | % |
Hypothetical (5% return before expenses) | | $ | 1,000.00 | | | $ | 1,022.18 | | | $ | 3.06 | | | | 0.60 | % |
Institutional Class | | | | | | | | | | | | | | | | |
Actual | | $ | 1,000.00 | | | $ | 1,006.32 | | | $ | 2.02 | | | | 0.40 | % |
Hypothetical (5% return before expenses) | | $ | 1,000.00 | | | $ | 1,023.19 | | | $ | 2.04 | | | | 0.40 | % |
| 1 | Expenses paid is equal to the annualized net expense ratio of each class multiplied by the average account value over the period, multiplied by the number of days in the most recent fiscal half-year divided by the number of days in the fiscal year (to reflect the one-half-year period). |
| | | | | | |
| Portfolio of investments—December 31, 2017 (unaudited) | | Wells Fargo Short-Term Municipal Bond Fund | | | 7 | |
| | | | | | | | | | | | | | | | |
| Security name | | Interest rate | | | Maturity date | | | Principal | | | Value | |
|
Municipal Obligations: 98.96% | |
| | | | |
| Alabama: 0.99% | | | | | | | | | | | | | | | | |
Alabama Black Belt Energy Gas District Series A (Utilities Revenue, Royal Bank of Canada LIQ) | | | 4.00 | % | | | 7-1-2046 | | | $ | 10,000,000 | | | $ | 10,595,000 | |
Board of Education of Shelby County AL Public School Warrants Series 2016 (Tax Revenue) | | | 4.00 | | | | 2-1-2020 | | | | 410,000 | | | | 427,540 | |
Jefferson County AL Warrants Series C (GO Revenue) | | | 4.90 | | | | 4-1-2021 | | | | 21,665,000 | | | | 22,418,725 | |
Jefferson County AL Warrants Series D (Water & Sewer Revenue) | | | 5.00 | | | | 10-1-2018 | | | | 3,965,000 | | | | 4,040,771 | |
Mobile County AL Industrial Development Board PCR Alabama Power Company Barry Plant (Industrial Development Revenue) | | | 1.63 | | | | 7-15-2034 | | | | 12,500,000 | | | | 12,451,500 | |
| |
| | | | 49,933,536 | |
| | | | | | | | | | | | | | | | |
| | | | |
| Alaska: 0.51% | | | | | | | | | | | | | | | | |
Alaska IDA Loan Anticipation Revenue YKHC Project (Health Revenue) | | | 3.50 | | | | 12-1-2020 | | | | 21,000,000 | | | | 21,345,870 | |
Alaska IDA Snettisham Hydroelectric Project (Utilities Revenue) | | | 5.00 | | | | 1-1-2021 | | | | 1,400,000 | | | | 1,519,784 | |
North Slope Borough AK Service Area Water & Wastewater Facilities (Water & Sewer Revenue) | | | 5.25 | | | | 6-30-2034 | | | | 2,445,000 | | | | 2,723,681 | |
| |
| | | | 25,589,335 | |
| | | | | | | | | | | | | | | | |
| | | | |
| Arizona: 1.87% | | | | | | | | | | | | | | | | |
Arizona Board of Regents Certificate of Participation Series A (Education Revenue) | | | 5.00 | | | | 6-1-2021 | | | | 3,000,000 | | | | 3,312,000 | |
Arizona HFA Banner Health Center Series D (Health Revenue) | | | 5.50 | | | | 1-1-2038 | | | | 6,300,000 | | | | 6,300,000 | |
Cochise County AZ Community College District of Cochise County Series 2016A (Education Revenue, Build America Mutual Assurance Company Insured) | | | 5.00 | | | | 7-1-2020 | | | | 405,000 | | | | 433,909 | |
Cochise County AZ Community College District of Cochise County Series 2016A (Education Revenue, Build America Mutual Assurance Company Insured) | | | 5.00 | | | | 7-1-2021 | | | | 425,000 | | | | 465,868 | |
Coconino County AZ Pollution Control Corporation Series A (Industrial Development Revenue) | | | 1.80 | | | | 9-1-2032 | | | | 7,100,000 | | | | 7,037,591 | |
Maricopa County AZ Certificate of Participation (Miscellaneous Revenue) | | | 5.00 | | | | 7-1-2018 | | | | 6,100,000 | | | | 6,206,628 | |
Maricopa County AZ PCR Series A (Utilities Revenue) | | | 2.40 | | | | 6-1-2043 | | | | 9,800,000 | | | | 9,928,772 | |
Maricopa County AZ PCR Series B (Utilities Revenue) | | | 5.20 | | | | 6-1-2043 | | | | 2,500,000 | | | | 2,697,175 | |
Maricopa County AZ Unified School District #89 Refunding Bond Series 2016 (GO Revenue, Build America Mutual Assurance Company Insured) | | | 2.00 | | | | 7-1-2019 | | | | 2,265,000 | | | | 2,271,976 | |
Navajo Nation AZ Refunding Bond Series A (Miscellaneous Revenue) 144A | | | 2.90 | | | | 12-1-2020 | | | | 8,820,000 | | | | 8,817,442 | |
Navajo Nation AZ Tribal Utility Authority (Miscellaneous Revenue, Municipal Government Guaranty Insured) | | | 4.00 | | | | 1-1-2021 | | | | 9,259,000 | | | | 9,385,848 | |
Phoenix AZ IDA Various Republic Services Incorporated Projects (Industrial Development Revenue) øø | | | 1.22 | | | | 12-1-2035 | | | | 25,000,000 | | | | 24,998,500 | |
PIMA County AZ IDA Education Facility Odyssey Preparatory Academy Goodyear Project (Education Revenue) | | | 7.00 | | | | 6-1-2034 | | | | 312,000 | | | | 364,628 | |
PIMA County AZ IDA Education Facility Odyssey Preparatory Academy Goodyear Project (Education Revenue) | | | 7.13 | | | | 6-1-2049 | | | | 1,950,000 | | | | 2,286,980 | |
Tempe AZ IDA Mirabella at ASU Project Series B1 (Health Revenue) 144A | | | 4.00 | | | | 10-1-2023 | | | | 6,000,000 | | | | 6,030,720 | |
Verrado AZ Community Facilities District #1 Refunding Bond Series A (GO Revenue) 144A | | | 4.00 | | | | 7-15-2018 | | | | 1,245,000 | | | | 1,253,765 | |
Yavapai County AZ IDA Waste Management Incorporated Project Series A2 (Resource Recovery Revenue) | | | 1.60 | | | | 3-1-2028 | | | | 2,500,000 | | | | 2,501,100 | |
| |
| | | | 94,292,902 | |
| | | | | | | | | | | | | | | | |
The accompanying notes are an integral part of these financial statements.
| | | | |
| 8 | | Wells Fargo Short-Term Municipal Bond Fund | | Portfolio of investments—December 31, 2017 (unaudited) |
| | | | | | | | | | | | | | | | |
| Security name | | Interest rate | | | Maturity date | | | Principal | | | Value | |
|
| California: 5.98% | |
Bay Area CA Toll Authority San Francisco Bay Area Series D (Transportation Revenue) | | | 1.88 | % | | | 4-1-2034 | | | $ | 10,500,000 | | | $ | 10,513,335 | |
California (SIFMA Municipal Swap +0.38%) (GO Revenue) ± | | | 2.09 | | | | 12-1-2027 | | | | 20,000,000 | | | | 19,985,800 | |
California Department of Water Resources Central Valley Project Series AT (SIFMA Municipal Swap +0.37%) (Water & Sewer Revenue) ± | | | 2.08 | | | | 12-1-2035 | | | | 35,500,000 | | | | 35,520,235 | |
California HFFA Providence St. Joseph (Health Revenue) | | | 1.25 | | | �� | 10-1-2036 | | | | 5,550,000 | | | | 5,474,465 | |
California Infrastructure & Economic Development Bank Museum Art Project Series A (1 Month LIBOR +1.75%) (Miscellaneous Revenue) ± | | | 2.85 | | | | 12-1-2037 | | | | 12,185,000 | | | | 12,196,332 | |
California Infrastructure & Economic Development Bank Pacific Gas & Electric Company Series 2010E (Utilities Revenue) | | | 1.75 | | | | 11-1-2026 | | | | 2,000,000 | | | | 1,975,640 | |
California Infrastructure & Economic Development Bank Series A (SIFMA Municipal Swap +1.00%) (Education Revenue) ± | | | 2.71 | | | | 8-1-2037 | | | | 26,185,000 | | | | 26,304,142 | |
California Infrastructure & Refunding Bond Pacific Gas & Electric Company Series (Utilities Revenue) | | | 1.75 | | | | 11-1-2026 | | | | 2,500,000 | | | | 2,469,550 | |
California PCFA AMT Calplant I Project (Industrial Development Revenue) 144A | | | 7.00 | | | | 7-1-2022 | | | | 3,505,000 | | | | 3,722,836 | |
California PCFA Series A-1 (Resource Recovery Revenue) 144Aøø | | | 1.30 | | | | 11-1-2042 | | | | 10,000,000 | | | | 10,000,100 | |
California PFA Village E Apartments Project Series A (Housing Revenue) | | | 1.15 | | | | 10-1-2019 | | | | 7,400,000 | | | | 7,395,930 | |
California PFOTER Series DCL-009 (GO Revenue, Dexia Credit Local LOC, AGM Insured) 144Aø | | | 1.97 | | | | 8-1-2027 | | | | 35,000,000 | | | | 35,000,000 | |
California PFOTER Series DCL-011 (GO Revenue, Dexia Credit Local LOC, AGM Insured) 144Aø | | | 1.97 | | | | 8-1-2027 | | | | 15,000,000 | | | | 15,000,000 | |
California Refunding Bond Series A (SIFMA Municipal Swap +0.25%) (GO Revenue) ± | | | 1.96 | | | | 5-1-2033 | | | | 26,000,000 | | | | 25,991,680 | |
California Refunding Bond Series B (SIFMA Municipal Swap +0.90%) (GO Revenue) ±## | | | 2.61 | | | | 5-1-2018 | | | | 6,000,000 | | | | 6,000,840 | |
California State Index Floating Rate Series E (1 Month LIBOR +0.83%) (GO Revenue) ± | | | 1.79 | | | | 12-1-2029 | | | | 18,000,000 | | | | 18,043,020 | |
California Statewide CDA (Health Revenue) ø | | | 1.56 | | | | 4-1-2038 | | | | 9,475,000 | | | | 9,475,000 | |
California Statewide CDA Health Facilities Catholic Series D (Health Revenue, AGM Insured) (m) | | | 1.91 | | | | 7-1-2041 | | | | 14,850,000 | | | | 14,850,000 | |
California Statewide CDA Health Facilities Catholic Series E (Health Revenue, AGM Insured) (m) | | | 2.05 | | | | 7-1-2040 | | | | 6,100,000 | | | | 6,100,000 | |
California Statewide CDA Health Facilities Catholic Series F (Health Revenue, AGM Insured) (m) | | | 2.05 | | | | 7-1-2040 | | | | 4,950,000 | | | | 4,950,000 | |
Chula Vista CA Elementary School Building Projects Certificate of Participation Series A (Miscellaneous Revenue, AGM Insured) | | | 5.00 | | | | 9-1-2018 | | | | 1,985,000 | | | | 2,030,099 | |
Chula Vista CA Industrial Development Revenue San Diego Gas & Electric Company Series A (Utilities Revenue) ## | | | 1.65 | | | | 7-1-2018 | | | | 5,570,000 | | | | 5,570,334 | |
Commerce CA RDA CAB Project #1 (Tax Revenue) ¤ | | | 0.00 | | | | 8-1-2021 | | | | 3,110,000 | | | | 2,640,235 | |
El Monte CA Union High School District (GO Revenue) | | | 5.00 | | | | 6-1-2018 | | | | 5,840,000 | | | | 5,926,257 | |
Oakland CA Unified School District Alameda County Election of 2012 (GO Revenue) | | | 5.00 | | | | 8-1-2018 | | | | 1,000,000 | | | | 1,020,930 | |
Oakland CA Unified School District Alameda County Election of 2012 (GO Revenue) | | | 5.00 | | | | 8-1-2019 | | | | 1,000,000 | | | | 1,054,360 | |
Palomar CA Pomerado Health CAB Election of 2004 Series A (GO Revenue, National Insured) ¤ | | | 0.00 | | | | 8-1-2019 | | | | 2,215,000 | | | | 2,145,183 | |
Palomar CA Pomerado Health Care District Certificate of Participation Series C (Health Revenue, AGM Insured) (m) | | | 2.15 | | | | 11-1-2036 | | | | 4,900,000 | | | | 4,900,000 | |
San Ysidro CA School District (GO Revenue, AGM Insured) ¤ | | | 0.00 | | | | 8-1-2047 | | | | 3,610,000 | | | | 478,145 | |
Tender Option Bond Trust Receipts/Floater Certificates Series ZP0159 (GO Revenue, JPMorgan Chase & Company LIQ) 144Aø | | | 1.86 | | | | 8-1-2022 | | | | 4,500,000 | | | | 4,500,000 | |
Washington Township CA Health Care District Series B (Health Revenue) | | | 5.00 | | | | 7-1-2020 | | | | 600,000 | | | | 641,616 | |
| |
| | | | 301,876,064 | |
| | | | | | | | | | | | | | | | |
The accompanying notes are an integral part of these financial statements.
| | | | | | |
| Portfolio of investments—December 31, 2017 (unaudited) | | Wells Fargo Short-Term Municipal Bond Fund | | | 9 | |
| | | | | | | | | | | | | | | | |
| Security name | | Interest rate | | | Maturity date | | | Principal | | | Value | |
| | | | |
| Colorado: 0.95% | | | | | | | | | | | | | | | | |
Aurora CO Public Highway Authority CAB Series B (Transportation Revenue, National Insured) ¤ | | | 0.00 | % | | | 9-1-2018 | | | $ | 2,000,000 | | | $ | 1,978,900 | |
Colorado HCFR Catholic Health Initiatives Series C2 (1 Month LIBOR +1.25%) (Health Revenue) ± | | | 2.18 | | | | 10-1-2039 | | | | 8,500,000 | | | | 8,485,040 | |
Colorado HCFR Catholic Health Initiatives Series C4 (1 Month LIBOR +1.25%) (Health Revenue) ± | | | 2.18 | | | | 10-1-2039 | | | | 3,495,000 | | | | 3,488,849 | |
Colorado HFA Multifamily Housing South Range Crossings Project (Housing Revenue) | | | 1.80 | | | | 1-1-2037 | | | | 17,000,000 | | | | 17,000,000 | |
University of Colorado Hospital Authority Series 2017C-1 (Health Revenue) | | | 5.00 | | | | 11-15-2038 | | | | 15,275,000 | | | | 16,936,004 | |
| |
| | | | 47,888,793 | |
| | | | | | | | | | | | | | | | |
| | | | |
| Connecticut: 3.12% | | | | | | | | | | | | | | | | |
Connecticut Economic Recovery Notes Series A (SIFMA Municipal Swap +0.35%) (Miscellaneous Revenue) ± | | | 2.06 | | | | 1-1-2018 | | | | 9,810,000 | | | | 9,810,000 | |
Connecticut HEFA Series 2010A-4 (Education Revenue) | | | 1.20 | | | | 7-1-2049 | | | | 33,190,000 | | | | 33,069,852 | |
Connecticut HEFA Yale University Series A (Education Revenue) | | | 1.30 | | | | 7-1-2048 | | | | 4,400,000 | | | | 4,348,960 | |
Connecticut HEFA Yale University Series X-2 (Education Revenue) | | | 0.90 | | | | 7-1-2037 | | | | 34,000,000 | | | | 33,988,100 | |
Connecticut HEFAR Hartford Healthcare Series G (1 Month LIBOR +0.95%) (Health Revenue) ± | | | 1.88 | | | | 7-1-2049 | | | | 10,000,000 | | | | 10,019,000 | |
Connecticut HEFAR Yale University Issue Series A (Education Revenue) | | | 1.38 | | | | 7-1-2035 | | | | 12,890,000 | | | | 12,889,613 | |
Connecticut HEFAR Yale University Issue Series A-1 (Education Revenue) | | | 1.00 | | | | 7-1-2042 | | | | 600,000 | | | | 594,006 | |
Connecticut Series A (SIFMA Municipal Swap +0.55%) (Miscellaneous Revenue) ± | | | 2.26 | | | | 3-1-2019 | | | | 3,200,000 | | | | 3,204,608 | |
Connecticut Series A (SIFMA Municipal Swap +0.65%) (Miscellaneous Revenue) ± | | | 2.36 | | | | 3-1-2020 | | | | 8,385,000 | | | | 8,404,034 | |
Connecticut Series A (SIFMA Municipal Swap +0.92%) (Miscellaneous Revenue) ±## | | | 2.63 | | | | 5-15-2018 | | | | 17,740,000 | | | | 17,773,883 | |
Connecticut Series A (SIFMA Municipal Swap +1.10%) (Miscellaneous Revenue) ± | | | 2.81 | | | | 4-15-2019 | | | | 5,600,000 | | | | 5,647,208 | |
Connecticut SIFMA Association Index Refunding Bond (SIFMA Municipal Swap +1.10%) (Miscellaneous Revenue) ± | | | 2.81 | | | | 5-15-2019 | | | | 3,500,000 | | | | 3,529,155 | |
Hamden CT Refunding Bond (GO Revenue) | | | 5.00 | | | | 8-15-2018 | | | | 1,000,000 | | | | 1,019,330 | |
Hartford CT Series A (GO Revenue, AGM Insured) | | | 5.00 | | | | 7-1-2018 | | | | 650,000 | | | | 659,159 | |
Hartford CT Series A (GO Revenue, AGM Insured) | | | 5.00 | | | | 7-1-2019 | | | | 700,000 | | | | 725,830 | |
Hartford CT Series B (GO Revenue, AGM Insured) | | | 5.00 | | | | 10-1-2018 | | | | 1,000,000 | | | | 1,026,020 | |
Mohegan Tribe of Indians of Connecticut United States Department of Agriculture BAN (Miscellaneous Revenue) | | | 3.15 | | | | 12-15-2018 | | | | 4,866,000 | | | | 4,880,014 | |
New Haven CT Series A (GO Revenue, AGM Insured) | | | 3.00 | | | | 11-1-2019 | | | | 3,405,000 | | | | 3,463,907 | |
New Haven CT Series A (GO Revenue) | | | 5.25 | | | | 8-1-2021 | | | | 1,830,000 | | | | 2,002,496 | |
West Haven CT Series A (GO Revenue) | | | 3.00 | | | | 11-1-2018 | | | | 215,000 | | | | 215,538 | |
West Haven CT Series A (GO Revenue) | | | 3.00 | | | | 11-1-2019 | | | | 300,000 | | | | 300,471 | |
West Haven CT Series B (GO Revenue) | | | 3.00 | | | | 11-1-2019 | | | | 210,000 | | | | 210,330 | |
| |
| | | | 157,781,514 | |
| | | | | | | | | | | | | | | | |
| | | | |
| Florida: 0.98% | | | | | | | | | | | | | | | | |
Brevard County FL HCFR Refunding Bond Health First Incorporated Series A (Health Revenue) | | | 5.00 | | | | 4-1-2018 | | | | 1,140,000 | | | | 1,149,131 | |
Brevard County FL Space Coast Infrastructure Agency I-95 Project (Industrial Development Revenue) | | | 4.00 | | | | 6-15-2018 | | | | 1,850,000 | | | | 1,860,693 | |
Florida Mid-Bay Bridge Authority Series C (Transportation Revenue) | | | 5.00 | | | | 10-1-2019 | | | | 675,000 | | | | 715,149 | |
Florida Mid-Bay Bridge Authority Series C (Transportation Revenue) | | | 5.00 | | | | 10-1-2020 | | | | 785,000 | | | | 854,378 | |
Lee County FL Solid Waste System Refunding Revenue Bonds AMT (Resource Recovery Revenue) | | | 5.00 | | | | 10-1-2023 | | | | 1,750,000 | | | | 2,003,855 | |
Manatee County FL School Board Certificate of Participation Series A (Miscellaneous Revenue) | | | 5.00 | | | | 7-1-2020 | | | | 1,225,000 | | | | 1,301,673 | |
The accompanying notes are an integral part of these financial statements.
| | | | |
| 10 | | Wells Fargo Short-Term Municipal Bond Fund | | Portfolio of investments—December 31, 2017 (unaudited) |
| | | | | | | | | | | | | | | | |
| Security name | | Interest rate | | | Maturity date | | | Principal | | | Value | |
| | | | |
| Florida (continued) | | | | | | | | | | | | | | | | |
Miami-Dade County FL Expressway Authority Toll System (Transportation Revenue, Dexia Credit Local LOC, Dexia Credit Local LIQ) 144Aøø | | | 1.99 | % | | | 10-13-2023 | | | $ | 5,935,000 | | | $ | 5,935,000 | |
North Broward FL Hospital District Series B (Health Revenue) | | | 5.00 | | | | 1-1-2022 | | | | 1,255,000 | | | | 1,385,633 | |
North Broward FL Hospital District Series B (Health Revenue) | | | 5.00 | | | | 1-1-2023 | | | | 1,700,000 | | | | 1,908,573 | |
North Broward FL Hospital District Series B (Health Revenue) | | | 5.00 | | | | 1-1-2024 | | | | 2,000,000 | | | | 2,277,940 | |
Palm Beach County FL HCFR ACTS Retirement Life Communities Series 2016 (Health Revenue) | | | 5.00 | | | | 11-15-2021 | | | | 3,515,000 | | | | 3,926,255 | |
Palm Beach County FL HCFR Jupiter Medical Center Project Series A (Health Revenue) | | | 4.00 | | | | 11-1-2018 | | | | 1,235,000 | | | | 1,251,574 | |
St. Johns County FL School Board Refunding Bond Certificate of Participation (Miscellaneous Revenue) | | | 5.00 | | | | 7-1-2020 | | | | 2,010,000 | | | | 2,171,845 | |
St. Johns County FL School Board Refunding Bond Certificate of Participation (Miscellaneous Revenue) | | | 5.00 | | | | 7-1-2021 | | | | 1,670,000 | | | | 1,849,007 | |
Sunrise FL Unrefunded Bond (Water & Sewer Revenue, Ambac Insured) | | | 5.20 | | | | 10-1-2022 | | | | 4,775,000 | | | | 4,907,697 | |
Tampa FL Baycare Health System Series 2010 (Health Revenue) | | | 5.00 | | | | 11-15-2023 | | | | 8,080,000 | | | | 8,705,715 | |
University of North Florida Financing Corporation Capital Housing Project (Education Revenue, AGM Insured) | | | 5.00 | | | | 11-1-2020 | | | | 3,125,000 | | | | 3,370,656 | |
University of North Florida Financing Corporation Capital Housing Project (Education Revenue, AGM Insured) | | | 5.00 | | | | 11-1-2021 | | | | 3,440,000 | | | | 3,792,978 | |
| |
| | | | 49,367,752 | |
| | | | | | | | | | | | | | | | |
| | | | |
| Georgia: 3.44% | | | | | | | | | | | | | | | | |
Atlanta GA Urban Residential Finance Authority Multifamily Housing City Lights II Family Apartments Project (Housing Revenue) | | | 1.86 | | | | 12-1-2020 | | | | 11,500,000 | | | | 11,495,745 | |
Atlanta GA Water & Wastewater Project Series A-1 (1 Month LIBOR +1.50%) (Water & Sewer Revenue) ± | | | 2.55 | | | | 11-1-2038 | | | | 21,500,000 | | | | 21,559,125 | |
Bartow County GA Development Authority Georgia Power Company Bowen Project (Utilities Revenue) | | | 2.05 | | | | 9-1-2029 | | | | 4,100,000 | | | | 4,098,442 | |
Bartow County GA Development Authority Georgia Power Company Bowen Project (Utilities Revenue) | | | 2.70 | | | | 8-1-2043 | | | | 20,000,000 | | | | 20,069,200 | |
Burke County GA Development Authority Georgia Power Company Plant Vogtle Project (Utilities Revenue) | | | 1.85 | | | | 12-1-2049 | | | | 17,300,000 | | | | 17,153,469 | |
Burke County GA Development Authority Oglethorpe Power Corporation Vogtle Project Series A (Utilities Revenue) | | | 2.40 | | | | 1-1-2040 | | | | 18,840,000 | | | | 18,636,340 | |
Floyd County GA PCR Georgia Power Company Plant Hammond Project (Utilities Revenue) | | | 2.35 | | | | 7-1-2022 | | | | 11,250,000 | | | | 11,208,713 | |
Gainesville & Hall Counties GA Hospital Authority Health System Project Series B (SIFMA Municipal Swap +0.95%) (Health Revenue) ± | | | 2.66 | | | | 8-15-2035 | | | | 23,000,000 | | | | 22,945,030 | |
Georgia Road & Tollway Authority Federal Highway Grant Anticipation Revenue Bond Series B (Miscellaneous Revenue) | | | 5.00 | | | | 6-1-2020 | | | | 12,980,000 | | | | 13,961,937 | |
Main Street Natural Gas Incorporated Georgia Gas Project Series B (Utilities Revenue) | | | 5.00 | | | | 3-15-2018 | | | | 4,815,000 | | | | 4,847,020 | |
Main Street Natural Gas Incorporated Georgia Gas Project Series B (Utilities Revenue) | | | 5.00 | | | | 3-15-2021 | | | | 2,600,000 | | | | 2,833,792 | |
Monroe County GA PCR Georgia Power Company Plant Scherer Project (Industrial Development Revenue) | | | 2.35 | | | | 10-1-2048 | | | | 16,000,000 | | | | 15,950,240 | |
Peach County GA Development Authority USG Real Estate Foundation LLC Project (Housing Revenue) | | | 1.20 | | | | 10-1-2018 | | | | 3,250,000 | | | | 3,238,008 | |
Savannah GA MFHR Wessels Blackshear Home Project (Housing Revenue) | | | 1.15 | | | | 7-1-2019 | | | | 5,550,000 | | | | 5,536,292 | |
| |
| | | | 173,533,353 | |
| | | | | | | | | | | | | | | | |
| | | | |
| Guam: 0.08% | | | | | | | | | | | | | | | | |
Guam International Airport Authority Series A (Airport Revenue) | | | 5.00 | | | | 10-1-2019 | | | | 450,000 | | | | 470,849 | |
Guam International Airport Authority Series C (Airport Revenue) | | | 5.00 | | | | 10-1-2018 | | | | 3,560,000 | | | | 3,628,672 | |
| |
| | | | 4,099,521 | |
| | | | | | | | | | | | | | | | |
The accompanying notes are an integral part of these financial statements.
| | | | | | |
| Portfolio of investments—December 31, 2017 (unaudited) | | Wells Fargo Short-Term Municipal Bond Fund | | | 11 | |
| | | | | | | | | | | | | | | | |
| Security name | | Interest rate | | | Maturity date | | | Principal | | | Value | |
| | | | |
| Hawaii: 0.39% | | | | | | | | | | | | | | | | |
Hawaii Housing Finance & Development Corporation Multifamily Housing Hale Kewalo Apartments Series A (Housing Revenue, GNMA Insured) | | | 1.90 | % | | | 1-1-2021 | | | $ | 7,160,000 | | | $ | 7,161,360 | |
Honolulu HI Rail Transit Project Series H (SIFMA Municipal Swap +0.32%) (GO Revenue) ± | | | 2.03 | | | | 9-1-2027 | | | | 7,500,000 | | | | 7,500,450 | |
Honolulu HI Rail Transit Project Series H (SIFMA Municipal Swap +0.32%) (GO Revenue) ± | | | 2.03 | | | | 9-1-2028 | | | | 5,000,000 | | | | 5,000,300 | |
| |
| | | | 19,662,110 | |
| | | | | | | | | | | | | | | | |
| | | | |
| Illinois: 9.23% | | | | | | | | | | | | | | | | |
Chicago IL Board of Education Dedicated Revenue Series D (Miscellaneous Revenue, AGC Insured) | | | 5.00 | | | | 12-1-2018 | | | | 1,400,000 | | | | 1,444,422 | |
Chicago IL Board of Education Lease Certificates Refunding Bond Series A (Miscellaneous Revenue, National Insured) | | | 6.00 | | | | 1-1-2020 | | | | 6,330,000 | | | | 6,516,039 | |
Chicago IL Board of Education Prerefunded Bond (GO Revenue) | | | 5.00 | | | | 12-1-2019 | | | | 2,020,000 | | | | 2,083,145 | |
Chicago IL Board of Education Series A (SIFMA Municipal Swap +0.83%) (GO Revenue) ± | | | 2.54 | | | | 3-1-2036 | | | | 48,000,000 | | | | 47,830,080 | |
Chicago IL Board of Education Series A (GO Revenue, National Insured) | | | 5.00 | | | | 12-1-2019 | | | | 895,000 | | | | 933,754 | |
Chicago IL Board of Education Unrefunded Bond (GO Revenue) | | | 5.00 | | | | 12-1-2019 | | | | 3,315,000 | | | | 3,360,880 | |
Chicago IL City Colleges of Chicago Capital Improvement Project CAB (GO Revenue, National Insured) ¤ | | | 0.00 | | | | 1-1-2019 | | | | 8,555,000 | | | | 8,356,096 | |
Chicago IL Modern Schools Across Chicago Program Series A-K (GO Revenue, Ambac Insured) | | | 5.00 | | | | 12-1-2019 | | | | 1,000,000 | | | | 1,003,340 | |
Chicago IL Motor Fuel Tax Refunding Bonds Series 2013 (Tax Revenue) | | | 5.00 | | | | 1-1-2020 | | | | 1,120,000 | | | | 1,165,259 | |
Chicago IL Motor Fuel Tax Refunding Bonds Series 2013 (Tax Revenue) | | | 5.00 | | | | 1-1-2021 | | | | 380,000 | | | | 401,721 | |
Chicago IL Motor Fuel Tax Refunding Bonds Series 2013 (Tax Revenue) | | | 5.00 | | | | 1-1-2022 | | | | 955,000 | | | | 1,022,308 | |
Chicago IL O’Hare International Airport Customer Facility Charge (Airport Revenue) | | | 5.00 | | | | 1-1-2019 | | | | 1,000,000 | | | | 1,033,610 | |
Chicago IL O’Hare International Airport Customer Facility Charge (Airport Revenue) | | | 5.00 | | | | 1-1-2020 | | | | 890,000 | | | | 943,204 | |
Chicago IL Park District Harbor Facility Series C (GO Revenue) | | | 5.00 | | | | 1-1-2022 | | | | 3,155,000 | | | | 3,443,209 | |
Chicago IL Park District Personal Property Replacement Tax (GO Revenue) | | | 5.00 | | | | 1-1-2019 | | | | 500,000 | | | | 513,745 | |
Chicago IL Park District Refunding Bonds Series B (GO Revenue) | | | 5.00 | | | | 1-1-2019 | | | | 3,555,000 | | | | 3,652,727 | |
Chicago IL Park District Refunding Bonds Series D (GO Revenue) | | | 4.00 | | | | 1-1-2019 | | | | 1,990,000 | | | | 2,025,243 | |
Chicago IL Park District Refunding Bonds Series D (GO Revenue) | | | 5.00 | | | | 1-1-2019 | | | | 1,060,000 | | | | 1,089,139 | |
Chicago IL Park District Refunding Bonds Series D (GO Revenue) | | | 5.00 | | | | 1-1-2020 | | | | 1,290,000 | | | | 1,360,099 | |
Chicago IL Park District Refunding Bonds Series D (GO Revenue) | | | 5.00 | | | | 1-1-2021 | | | | 1,000,000 | | | | 1,079,500 | |
Chicago IL Park District Series A (GO Revenue) | | | 4.50 | | | | 1-1-2023 | | | | 250,000 | | | | 265,385 | |
Chicago IL Project & Refunding Bond Series A (GO Revenue, National Insured) | | | 5.00 | | | | 1-1-2019 | | | | 4,010,000 | | | | 4,018,461 | |
Chicago IL Project & Refunding Bond Series A (GO Revenue, Ambac Insured) | | | 5.00 | | | | 1-1-2020 | | | | 105,000 | | | | 105,353 | |
Chicago IL Project & Refunding Bond Series C (GO Revenue, Ambac Insured) | | | 5.00 | | | | 1-1-2021 | | | | 10,070,000 | | | | 10,103,835 | |
Chicago IL Refunding Bond (Tax Revenue) | | | 5.00 | | | | 1-1-2018 | | | | 330,000 | | | | 330,000 | |
Chicago IL Refunding Bond Emergency Telephone System (GO Revenue, National Insured) | | | 5.25 | | | | 1-1-2018 | | | | 1,770,000 | | | | 1,770,000 | |
Chicago IL Refunding Bond Emergency Telephone System (GO Revenue, National Insured) | | | 5.25 | | | | 1-1-2020 | | | | 3,765,000 | | | | 3,997,677 | |
Chicago IL Refunding Bond Emergency Telephone System (GO Revenue, National Insured) | | | 5.50 | | | | 1-1-2019 | | | | 2,600,000 | | | | 2,677,948 | |
Chicago IL Refunding Bond Series A (GO Revenue, AGM Insured) | | | 5.00 | | | | 1-1-2019 | | | | 510,000 | | | | 511,331 | |
Chicago IL Refunding Bond Series A (GO Revenue, AGM Insured) | | | 5.00 | | | | 1-1-2020 | | | | 9,960,000 | | | | 9,994,960 | |
Chicago IL Refunding Bond Series A (GO Revenue, AGM Insured) | | | 5.00 | | | | 1-1-2021 | | | | 1,005,000 | | | | 1,007,151 | |
Chicago IL Refunding Bond Series B (GO Revenue, Ambac Insured) | | | 5.13 | | | | 1-1-2022 | | | | 3,575,000 | | | | 3,704,630 | |
Chicago IL Second Lien (Water & Sewer Revenue, AGM Insured) | | | 4.25 | | | | 11-1-2018 | | | | 1,935,000 | | | | 1,976,003 | |
The accompanying notes are an integral part of these financial statements.
| | | | |
| 12 | | Wells Fargo Short-Term Municipal Bond Fund | | Portfolio of investments—December 31, 2017 (unaudited) |
| | | | | | | | | | | | | | | | |
| Security name | | Interest rate | | | Maturity date | | | Principal | | | Value | |
| | | | |
| Illinois (continued) | | | | | | | | | | | | | | | | |
Chicago IL Second Lien (Water & Sewer Revenue) | | | 5.00 | % | | | 11-1-2020 | | | $ | 740,000 | | | $ | 799,230 | |
Chicago IL Second Lien (Water & Sewer Revenue, National Insured) | | | 5.50 | | | | 1-1-2019 | | | | 1,460,000 | | | | 1,512,414 | |
Chicago IL Series A (GO Revenue) | | | 5.00 | | | | 1-1-2018 | | | | 550,000 | | | | 550,000 | |
Chicago IL Series A (GO Revenue) | | | 5.00 | | | | 1-1-2019 | | | | 2,625,000 | | | | 2,628,045 | |
Chicago IL Series A (GO Revenue) | | | 5.25 | | | | 1-1-2021 | | | | 610,000 | | | | 611,232 | |
Chicago IL Series A-2 (GO Revenue, Ambac Insured) | | | 5.50 | | | | 1-1-2018 | | | | 2,465,000 | | | | 2,465,000 | |
Chicago IL Series C (GO Revenue) | | | 5.00 | | | | 1-1-2021 | | | | 3,000,000 | | | | 3,202,560 | |
Chicago IL Series C (GO Revenue) | | | 5.00 | | | | 1-1-2022 | | | | 12,780,000 | | | | 13,820,548 | |
Chicago IL Series C (GO Revenue) | | | 5.00 | | | | 1-1-2023 | | | | 4,750,000 | | | | 5,173,795 | |
Chicago IL Transit Authority Federal Transit Administration Section 5309 (Transportation Revenue, AGC Insured) | | | 5.25 | | | | 6-1-2019 | | | | 1,680,000 | | | | 1,706,527 | |
Cook County IL Forest Preserve District Series A (GO Revenue) | | | 5.00 | | | | 11-15-2018 | | | | 1,005,000 | | | | 1,031,984 | |
Cook County IL Refunding Bond Series 2016 A (GO Revenue) | | | 5.00 | | | | 11-15-2020 | | | | 5,430,000 | | | | 5,891,007 | |
Cook County IL Series 2009D (GO Revenue) | | | 5.00 | | | | 11-15-2020 | | | | 2,220,000 | | | | 2,342,633 | |
Cook County IL Series A (GO Revenue) | | | 5.00 | | | | 11-15-2019 | | | | 2,275,000 | | | | 2,401,536 | |
Cook County IL Series B (GO Revenue, National Insured) | | | 5.00 | | | | 11-15-2019 | | | | 6,020,000 | | | | 6,034,809 | |
Cook County IL Series C (GO Revenue) | | | 5.00 | | | | 11-15-2020 | | | | 21,615,000 | | | | 22,809,013 | |
Cook, DuPage, Kane, Lake, McHenry, & Will Counties IL Regional Transportation Authority Refunding Bond Series B (Tax Revenue) øø | | | 1.20 | | | | 6-1-2025 | | | | 20,220,000 | | | | 20,220,000 | |
Huntley IL Special Service Area No 6 Special Tax Refunding Bonds (Tax Revenue, Build America Mutual Assurance Company Insured) | | | 2.20 | | | | 3-1-2024 | | | | 2,190,000 | | | | 2,177,451 | |
Illinois (Miscellaneous Revenue) | | | 3.00 | | | | 7-1-2018 | | | | 2,000,000 | | | | 2,005,660 | |
Illinois (GO Revenue) | | | 4.00 | | | | 2-1-2019 | | | | 6,300,000 | | | | 6,386,310 | |
Illinois (GO Revenue) | | | 4.00 | | | | 2-1-2020 | | | | 1,750,000 | | | | 1,785,315 | |
Illinois (GO Revenue) | | | 5.00 | | | | 3-1-2018 | | | | 1,795,000 | | | | 1,802,808 | |
Illinois (GO Revenue) | | | 5.00 | | | | 2-1-2019 | | | | 1,600,000 | | | | 1,638,800 | |
Illinois (GO Revenue) | | | 5.00 | | | | 2-1-2020 | | | | 2,520,000 | | | | 2,621,254 | |
Illinois (Miscellaneous Revenue) | | | 5.00 | | | | 5-1-2021 | | | | 2,000,000 | | | | 2,109,460 | |
Illinois (GO Revenue) | | | 5.00 | | | | 11-1-2021 | | | | 5,000,000 | | | | 5,308,650 | |
Illinois (GO Revenue) | | | 5.00 | | | | 4-1-2022 | | | | 3,000,000 | | | | 3,190,500 | |
Illinois (Tax Revenue, National Insured) | | | 5.75 | | | | 6-15-2018 | | | | 8,050,000 | | | | 8,193,934 | |
Illinois Development Finance Authority St. Vincent De Paul Center Project Series A (Health Revenue) | | | 1.88 | | | | 11-15-2039 | | | | 5,730,000 | | | | 5,715,217 | |
Illinois Finance Authority Ascension Health Alliance Senior Credit Group Series E-2 (Health Revenue) | | | 1.75 | | | | 11-15-2042 | | | | 2,000,000 | | | | 1,984,340 | |
Illinois Finance Authority Centegra Health System Project (Health Revenue) | | | 5.00 | | | | 9-1-2019 | | | | 2,265,000 | | | | 2,348,624 | |
Illinois Finance Authority Friendship Village of Schaumburg (Health Revenue) | | | 4.00 | | | | 2-15-2019 | | | | 1,180,000 | | | | 1,190,502 | |
Illinois Finance Authority Friendship Village of Schaumburg (Health Revenue) | | | 4.00 | | | | 2-15-2020 | | | | 1,230,000 | | | | 1,244,662 | |
Illinois Finance Authority Little Company of Mary Hospital and Health Care Centers Series A (Health Revenue, Barclays Bank plc LOC) ø | | | 1.76 | | | | 8-15-2035 | | | | 10,310,000 | | | | 10,310,000 | |
Illinois Finance Authority Prerefunded Bond OSF Healthcare System Series A (Health Revenue) | | | 6.00 | | | | 5-15-2039 | | | | 14,630,000 | | | | 15,997,027 | |
Illinois Finance Authority Provena Health Series A (Health Revenue) | | | 5.75 | | | | 5-1-2019 | | | | 3,000,000 | | | | 3,158,760 | |
Illinois Finance Authority Refunding Bond Lifespace Communities (Health Revenue) | | | 4.00 | | | | 5-15-2018 | | | | 700,000 | | | | 707,658 | |
Illinois Finance Authority Refunding Bond Lifespace Communities (Health Revenue) | | | 4.00 | | | | 5-15-2019 | | | | 1,090,000 | | | | 1,131,235 | |
Illinois Finance Authority Swedish Covenant Hospital Series A (Health Revenue) | | | 6.00 | | | | 8-15-2038 | | | | 3,360,000 | | | | 3,658,334 | |
Illinois Housing Development Authority (Housing Revenue, GNMA Insured) | | | 5.00 | | | | 8-1-2028 | | | | 725,000 | | | | 748,041 | |
Illinois Metropolitan Pier & Exposition Authority CAB McCormick Place Project Series A (Tax Revenue, National Insured) ¤ | | | 0.00 | | | | 12-15-2021 | | | | 920,000 | | | | 811,256 | |
The accompanying notes are an integral part of these financial statements.
| | | | | | |
| Portfolio of investments—December 31, 2017 (unaudited) | | Wells Fargo Short-Term Municipal Bond Fund | | | 13 | |
| | | | | | | | | | | | | | | | |
| Security name | | Interest rate | | | Maturity date | | | Principal | | | Value | |
| | | | |
| Illinois (continued) | | | | | | | | | | | | | | | | |
Illinois Metropolitan Pier & Exposition Authority CAB McCormick Place Project Series B (Tax Revenue) | | | 5.00 | % | | | 12-15-2020 | | | $ | 1,700,000 | | | $ | 1,822,128 | |
Illinois Metropolitan Pier & Exposition Authority CAB McCormick Place Project Series B (Tax Revenue) | | | 5.00 | | | | 12-15-2022 | | | | 1,260,000 | | | | 1,262,961 | |
Illinois Metropolitan Pier & Exposition Authority McCormick Place Project Series B (Tax Revenue) | | | 5.00 | | | | 12-15-2022 | | | | 7,000,000 | | | | 7,724,150 | |
Illinois Railsplitter Tobacco Settlement Authority I (Tobacco Revenue) | | | 5.00 | | | | 6-1-2022 | | | | 12,000,000 | | | | 13,277,040 | |
Illinois Refunding Bond (GO Revenue) | | | 5.00 | | | | 1-1-2018 | | | | 1,905,000 | | | | 1,905,000 | |
Illinois Refunding Bond (GO Revenue, AGM Insured) | | | 5.00 | | | | 1-1-2018 | | | | 7,740,000 | | | | 7,740,000 | |
Illinois Refunding Bond (Miscellaneous Revenue) | | | 5.00 | | | | 8-1-2018 | | | | 1,525,000 | | | | 1,547,326 | |
Illinois Refunding Bond (GO Revenue) | | | 5.00 | | | | 1-1-2019 | | | | 12,570,000 | | | | 12,854,333 | |
Illinois Refunding Bond (GO Revenue) | | | 5.00 | | | | 1-1-2020 | | | | 13,515,000 | | | | 14,037,084 | |
Illinois Refunding Bond (Miscellaneous Revenue, AGM Insured) | | | 5.00 | | | | 8-1-2020 | | | | 5,000,000 | | | | 5,348,900 | |
Illinois Refunding Bond (Miscellaneous Revenue, Build America Mutual Assurance Company Insured) | | | 5.00 | | | | 8-1-2020 | | | | 9,175,000 | | | | 9,815,232 | |
Illinois Refunding Bond (Tax Revenue) | | | 5.00 | | | | 1-1-2021 | | | | 1,760,000 | | | | 1,848,229 | |
Illinois Refunding Bond (Miscellaneous Revenue) | | | 5.00 | | | | 2-1-2022 | | | | 4,375,000 | | | | 4,644,456 | |
Illinois Refunding Bond (Miscellaneous Revenue) | | | 5.00 | | | | 2-1-2023 | | | | 6,040,000 | | | | 6,460,867 | |
Illinois Refunding Bond Series B (Miscellaneous Revenue) | | | 5.25 | | | | 1-1-2018 | | | | 1,430,000 | | | | 1,430,000 | |
Illinois Regional Transportation Authority Refunding Bond (Tax Revenue, AGM Insured) | | | 5.75 | | | | 6-1-2021 | | | | 3,000,000 | | | | 3,375,450 | |
Illinois Series A (Tax Revenue) | | | 4.00 | | | | 1-1-2020 | | | | 12,265,000 | | | | 12,503,064 | |
Illinois Series A (Tax Revenue) | | | 4.00 | | | | 1-1-2021 | | | | 2,715,000 | | | | 2,774,214 | |
Illinois Series A (GO Revenue) | | | 5.00 | | | | 4-1-2019 | | | | 5,000,000 | | | | 5,137,750 | |
Illinois Series A (GO Revenue) | | | 5.00 | | | | 4-1-2020 | | | | 2,500,000 | | | | 2,607,625 | |
Kane County IL School District Series B (GO Revenue) | | | 2.00 | | | | 2-1-2021 | | | | 880,000 | | | | 880,783 | |
Kane County IL School District Series C (GO Revenue, AGC Insured) | | | 5.00 | | | | 6-1-2019 | | | | 2,110,000 | | | | 2,175,579 | |
Kendall, Kane & Will Counties IL Community Unit School District #308 (GO Revenue, AGM Insured) ¤ | | | 0.00 | | | | 2-1-2020 | | | | 1,000,000 | | | | 953,790 | |
Lake County IL Community Unit School District #60 Waukegan CAB Series A (GO Revenue, AGM Insured) ¤ | | | 0.00 | | | | 12-1-2018 | | | | 1,715,000 | | | | 1,684,490 | |
McHenry & Kane Counties IL Community Consolidated School District #158 CAB (GO Revenue, National Insured) ¤ | | | 0.00 | | | | 1-1-2021 | | | | 2,000,000 | | | | 1,843,480 | |
Northern Illinois Municipal Power Agency Power Project Series A (Utilities Revenue) | | | 5.00 | | | | 12-1-2018 | | | | 1,000,000 | | | | 1,028,310 | |
Sales Tax Securitization Corporation Illinois Sales Tax Securitization Series A (Tax Revenue) | | | 5.00 | | | | 1-1-2024 | | | | 2,500,000 | | | | 2,907,875 | |
Southwestern IL Development Authority Health Facility Memorial Group Incorporated (Health Revenue) | | | 6.38 | | | | 11-1-2023 | | | | 1,950,000 | | | | 2,286,414 | |
Tender Option Bond Trust Receipts/Floater Certificates Series 2017-XG0108 (Tax Revenue, Barclays Bank plc LOC, Barclays Bank plc LIQ) 144Aø | | | 1.89 | | | | 4-1-2046 | | | | 12,000,000 | | | | 12,000,000 | |
University of Illinois Board of Trustees Certificate of Participation Series A (Education Revenue) | | | 4.00 | | | | 8-15-2019 | | | | 1,900,000 | | | | 1,950,331 | |
University of Illinois Auxiliary Facilities CAB (Education Revenue) ¤ | | | 0.00 | | | | 4-1-2019 | | | | 7,110,000 | | | | 6,891,865 | |
Western Illinois University Auxiliary Facilities System (Education Revenue) | | | 4.00 | | | | 4-1-2018 | | | | 800,000 | | | | 801,136 | |
Western Illinois University Auxiliary Facilities System (Education Revenue) | | | 4.00 | | | | 4-1-2020 | | | | 1,480,000 | | | | 1,467,716 | |
Will County IL Community High School District No. 210 (GO Revenue) | | | 5.00 | | | | 1-1-2021 | | | | 1,165,000 | | | | 1,174,437 | |
Will Grundy etc Counties IL Community College District #525 Joliet Junior College (GO Revenue) | | | 6.25 | | | | 6-1-2021 | | | | 1,085,000 | | | | 1,106,385 | |
| |
| | | | 466,414,785 | |
| | | | | | | | | | | | | | | | |
The accompanying notes are an integral part of these financial statements.
| | | | |
| 14 | | Wells Fargo Short-Term Municipal Bond Fund | | Portfolio of investments—December 31, 2017 (unaudited) |
| | | | | | | | | | | | | | | | |
| Security name | | Interest rate | | | Maturity date | | | Principal | | | Value | |
| | | | |
| Indiana: 2.45% | | | | | | | | | | | | | | | | |
Evansville IN Multifamily Housing Series A (Housing Revenue) | | | 1.85 | % | | | 6-1-2020 | | | $ | 7,400,000 | | | $ | 7,391,638 | |
Hammond IN County Local Public Improvement Bond Bank Series A (Miscellaneous Revenue) %% | | | 2.38 | | | | 12-31-2018 | | | | 4,000,000 | | | | 4,006,840 | |
Hammond IN Local Public Improvement Bond Bank Advance Funding Program Series A (Miscellaneous Revenue) %% | | | 2.13 | | | | 6-30-2018 | | | | 2,000,000 | | | | 2,000,340 | |
Indiana Bond Bank Advance Funding Program Series A (Miscellaneous Revenue) | | | 3.00 | | | | 1-3-2018 | | | | 7,185,000 | | | | 7,185,287 | |
Indiana Finance Authority Duke Energy Indiana Incorporated Series A-4 (Industrial Development Revenue, Sumitomo Mitsui Banking LOC) ø | | | 1.72 | | | | 12-1-2039 | | | | 5,000,000 | | | | 5,000,000 | |
Indiana Finance Authority Health System Franciscan Alliance Incorporated Series B (Health Revenue) | | | 5.00 | | | | 11-1-2022 | | | | 1,000,000 | | | | 1,138,860 | |
Indiana Finance Authority Health System Franciscan Alliance Incorporated Series B (Health Revenue) | | | 5.00 | | | | 11-1-2023 | | | | 1,250,000 | | | | 1,452,300 | |
Indiana Finance Authority Health System Franciscan Alliance Incorporated Series B (Health Revenue) | | | 5.00 | | | | 11-1-2024 | | | | 3,000,000 | | | | 3,535,980 | |
Indiana Finance Authority Health System Franciscan Alliance Incorporated Series C (Health Revenue) | | | 5.00 | | | | 11-1-2021 | | | | 1,000,000 | | | | 1,114,290 | |
Indiana Finance Authority Health System Franciscan Alliance Incorporated Series C (Health Revenue) | | | 5.00 | | | | 11-1-2023 | | | | 800,000 | | | | 929,472 | |
Indiana Finance Authority Health System Franciscan Alliance Incorporated Series C (Health Revenue) | | | 5.00 | | | | 11-1-2024 | | | | 1,000,000 | | | | 1,178,660 | |
Indiana Health & Educational Facility Financing Authority Series 2006B (Health Revenue) | | | 1.75 | | | | 11-15-2031 | | | | 11,385,000 | | | | 11,263,864 | |
Indiana HFFA Ascension Health Series A1 (Health Revenue) | | | 2.80 | | | | 11-1-2027 | | | | 10,170,000 | | | | 10,324,279 | |
Indiana HFFA Ascension Health Series A7 (Health Revenue) | | | 2.00 | | | | 10-1-2026 | | | | 9,095,000 | | | | 9,120,284 | |
Indiana HFFA Ascension Health Subordinate Credit Group Series 2015 A4 (Health Revenue) | | | 1.50 | | | | 10-1-2027 | | | | 2,280,000 | | | | 2,260,346 | |
Rockport IN PCR Indiana-Michigan Power Company Series B (Utilities Revenue) | | | 1.75 | | | | 6-1-2025 | | | | 4,285,000 | | | | 4,281,958 | |
Warrick County IN Environment Import Revenue Vectren Energy Delivery of Indiana Incorporated (Utilities Revenue) | | | 2.38 | | | | 9-1-2055 | | | | 6,550,000 | | | | 6,549,083 | |
Whiting IN BP Products North America Incorporated Project (Resource Recovery Revenue) | | | 2.46 | | | | 12-1-2044 | | | | 45,000,000 | | | | 45,102,150 | |
| |
| | | | 123,835,631 | |
| | | | | | | | | | | | | | | | |
| | | | |
| Iowa: 0.65% | | | | | | | | | | | | | | | | |
Iowa Finance Authority Midwestern Disaster Area Project (Industrial Development Revenue, Korea Development Bank LOC) ø | | | 1.90 | | | | 4-1-2022 | | | | 24,300,000 | | | | 24,300,000 | |
Iowa Student Loan Liquidity Corporation Series 2011A-1 (Education Revenue) | | | 4.63 | | | | 12-1-2019 | | | | 4,690,000 | | | | 4,804,014 | |
Iowa Student Loan Liquidity Corporation Series A1 (Education Revenue) | | | 4.40 | | | | 12-1-2018 | | | | 3,750,000 | | | | 3,822,713 | |
| |
| | | | 32,926,727 | |
| | | | | | | | | | | | | | | | |
| | | | |
| Kansas: 0.21% | | | | | | | | | | | | | | | | |
Kansas Development Finance Authority Series A (Miscellaneous Revenue) | | | 5.00 | | | | 5-1-2019 | | | | 10,305,000 | | | | 10,748,012 | |
| | | | | | | | | | | | | | | | |
| | | | |
| Kentucky: 3.19% | | | | | | | | | | | | | | | | |
Ashland KY Ashland Hospital Corporation Medical Center Project Series B (Health Revenue) | | | 5.00 | | | | 2-1-2019 | | | | 1,500,000 | | | | 1,543,170 | |
Hopkins County KY Public Properties Corporation Judicial Center Project (Miscellaneous Revenue) | | | 3.63 | | | | 6-1-2025 | | | | 1,000,000 | | | | 1,041,900 | |
Kentucky EDFA Baptist Healthcare System Series A (Health Revenue) | | | 5.38 | | | | 8-15-2024 | | | | 1,500,000 | | | | 1,536,180 | |
Kentucky EDFA Series B1 (1 Month LIBOR +0.90%) (Health Revenue) ± | | | 1.83 | | | | 2-1-2046 | | | | 10,720,000 | | | | 10,662,112 | |
Kentucky EDFA Series B2 (1 Month LIBOR +0.90%) (Health Revenue) ± | | | 1.83 | | | | 2-1-2046 | | | | 11,220,000 | | | | 11,159,412 | |
The accompanying notes are an integral part of these financial statements.
| | | | | | |
| Portfolio of investments—December 31, 2017 (unaudited) | | Wells Fargo Short-Term Municipal Bond Fund | | | 15 | |
| | | | | | | | | | | | | | | | |
| Security name | | Interest rate | | | Maturity date | | | Principal | | | Value | |
| | | | |
| Kentucky (continued) | | | | | | | | | | | | | | | | |
Kentucky Higher Education Student Loan Corporation Series A (Education Revenue) | | | 3.75 | % | | | 6-1-2026 | | | $ | 520,000 | | | $ | 530,431 | |
Kentucky Higher Education Student Loan Corporation Series A (Education Revenue) | | | 5.00 | | | | 6-1-2018 | | | | 1,200,000 | | | | 1,214,232 | |
Kentucky Municipal Power Agency Prairie State Project Series B (SIFMA Municipal Swap +1.40%) (Utilities
Revenue) ± | | | 3.11 | | | | 9-1-2042 | | | | 25,000,000 | | | | 25,006,250 | |
Louisville & Jefferson Counties KY Catholic Health Initiatives Series A (Health Revenue) | | | 5.00 | | | | 12-1-2021 | | | | 8,060,000 | | | | 8,831,423 | |
Louisville & Jefferson Counties KY Metro Government PCR Series A (Utilities Revenue) | | | 2.20 | | | | 2-1-2035 | | | | 1,000,000 | | | | 1,003,550 | |
Louisville & Jefferson Counties KY Metropolitan Sewer and Drainage System Subordinate BAN (Water & Sewer Revenue) | | | 5.00 | | | | 11-12-2018 | | | | 80,000,000 | | | | 82,359,200 | |
Pendleton County KY Scholl District Finance Corporation (Miscellaneous Revenue) | | | 2.00 | | | | 2-1-2021 | | | | 1,200,000 | | | | 1,179,852 | |
Trimble County KY PCR Louisville Gas And Electric Company Project (Utilities Revenue) øø | | | 1.35 | | | | 11-1-2027 | | | | 15,000,000 | | | | 14,978,850 | |
| |
| | | | 161,046,562 | |
| | | | | | | | | | | | | | | | |
| | | | |
| Louisiana: 2.31% | | | | | | | | | | | | | | | | |
Desoto Parish LA PCR (Utilities Revenue) | | | 1.60 | | | | 1-1-2019 | | | | 15,000,000 | | | | 15,065,100 | |
East Baton Rouge Parish LA Sewerage Commission Refunding Bond Series A (1 Month LIBOR +0.50%) (Water & Sewer Revenue) ± | | | 1.45 | | | | 2-1-2046 | | | | 36,755,000 | | | | 36,747,649 | |
Louisiana Housing Corporation Versailes Project (Housing Revenue) | | | 0.90 | | | | 3-1-2019 | | | | 20,610,000 | | | | 20,594,130 | |
Louisiana Local Government Environmental Facilities & CDA East Baton Rouge Sewer Commission Series B (1 Month LIBOR +0.70%) (Tax Revenue) ± | | | 1.67 | | | | 2-1-2049 | | | | 35,500,000 | | | | 35,508,520 | |
Louisiana Local Government Environmental Facilities & CDA Series 2015 (Tax Revenue, Build America Mutual Assurance Company Insured) | | | 5.00 | | | | 12-1-2020 | | | | 1,135,000 | | | | 1,241,270 | |
Louisiana Regional Transit Authority CAB (Tax Revenue, National Insured) ¤ | | | 0.00 | | | | 12-1-2021 | | | | 3,155,000 | | | | 2,628,336 | |
New Orleans LA Master Lease Agreement (GO Revenue) | | | 5.25 | | | | 1-1-2018 | | | | 1,590,358 | | | | 1,590,358 | |
St. Bernard Parish LA Sales & Uses Tax Refunding Bond Series 2012 (Tax Revenue) | | | 4.00 | | | | 3-1-2018 | | | | 3,245,000 | | | | 3,257,720 | |
| |
| | | | 116,633,083 | |
| | | | | | | | | | | | | | | | |
| | | | |
| Maryland: 2.07% | | | | | | | | | | | | | | | | |
Howard County MD Housing Commission Series A (SIFMA Municipal Swap +1.25%) (Housing Revenue) ± | | | 2.96 | | | | 7-1-2034 | | | | 16,050,000 | | | | 16,051,124 | |
Maryland CDA Multifamily Govans Manor Series M (Housing Revenue) | | | 1.80 | | | | 12-1-2018 | | | | 19,500,000 | | | | 19,492,395 | |
Maryland CDA The Ellerslie Series 2017 (Housing Revenue) | | | 2.00 | | | | 2-1-2019 | | | | 7,500,000 | | | | 7,492,650 | |
Maryland Community Development Administration Department Housing & Community Multifamily Development Pleasant View Gardens Senior Apartments Series H (Housing Revenue) | | | 1.35 | | | | 9-1-2018 | | | | 8,200,000 | | | | 8,176,712 | |
Maryland Community Development Administration Department Housing & Community Multifamily Development Series F (Housing Revenue) | | | 1.80 | | | | 2-1-2019 | | | | 8,500,000 | | | | 8,445,515 | |
Maryland Health & HEFAR John Hopkins Health System Series A (1 Month LIBOR +0.60%) (Health Revenue) ± | | | 1.51 | | | | 5-15-2046 | | | | 8,000,000 | | | | 8,001,680 | |
Maryland Health & HEFAR John Hopkins Health System Series B (1 Month LIBOR +0.58%) (Health Revenue) ± | | | 1.49 | | | | 5-15-2029 | | | | 9,420,000 | | | | 9,421,884 | |
Maryland State & Local Facilities Loan of 2015 Series A (GO Revenue) | | | 5.00 | | | | 3-1-2024 | | | | 23,060,000 | | | | 26,545,750 | |
Rockville MD Mayor and Council Economic Development Ingleside King Farm Project Series A-1 (Health Revenue) | | | 5.00 | | | | 11-1-2020 | | | | 850,000 | | | | 923,415 | |
| |
| | | | 104,551,125 | |
| | | | | | | | | | | | | | | | |
The accompanying notes are an integral part of these financial statements.
| | | | |
| 16 | | Wells Fargo Short-Term Municipal Bond Fund | | Portfolio of investments—December 31, 2017 (unaudited) |
| | | | | | | | | | | | | | | | |
| Security name | | Interest rate | | | Maturity date | | | Principal | | | Value | |
| | | | |
| Massachusetts: 4.32% | | | | | | | | | | | | | | | | |
Massachusetts Consolidated Loan Series D (Miscellaneous Revenue) | | | 1.05 | % | | | 8-1-2043 | | | $ | 11,500,000 | | | $ | 11,292,540 | |
Massachusetts Consolidated Loan Series D (SIFMA Municipal Swap +0.43%) (Tax Revenue) ± | | | 2.14 | | | | 1-1-2018 | | | | 9,500,000 | | | | 9,500,000 | |
Massachusetts Consolidated Loan Subordinate Series D-2 (Miscellaneous Revenue) | | | 1.70 | | | | 8-1-2043 | | | | 24,550,000 | | | | 24,229,132 | |
Massachusetts Development Finance Agency Partners Healthcare System Series S-5 (SIFMA Municipal Swap +0.42%) (Health Revenue) ± | | | 2.13 | | | | 7-1-2044 | | | | 11,230,000 | | | | 11,225,620 | |
Massachusetts Development Finance Agency Waste Management Incorporated (Resource Recovery Revenue) | | | 1.60 | | | | 5-1-2027 | | | | 10,000,000 | | | | 10,005,700 | |
Massachusetts Educational Financing Authority AMT Issue K Series A (Education Revenue) | | | 5.00 | | | | 7-1-2022 | | | | 1,000,000 | | | | 1,103,420 | |
Massachusetts Educational Financing Authority Education Loan Series I (Education Revenue) | | | 4.00 | | | | 1-1-2018 | | | | 4,250,000 | | | | 4,250,000 | |
Massachusetts Educational Financing Authority Series A (Education Revenue) | | | 3.50 | | | | 1-1-2019 | | | | 2,500,000 | | | | 2,534,275 | |
Massachusetts Educational Financing Authority Series A (Education Revenue) | | | 5.00 | | | | 1-1-2018 | | | | 1,500,000 | | | | 1,500,000 | |
Massachusetts Educational Financing Authority Series A (Education Revenue) | | | 5.00 | | | | 1-1-2019 | | | | 4,000,000 | | | | 4,113,560 | |
Massachusetts Educational Financing Authority Series A (Education Revenue) | | | 5.00 | | | | 1-1-2020 | | | | 3,000,000 | | | | 3,157,620 | |
Massachusetts Educational Financing Authority Series A (Education Revenue) | | | 5.00 | | | | 1-1-2022 | | | | 4,115,000 | | | | 4,489,012 | |
Massachusetts Educational Financing Authority Series K (Education Revenue) | | | 5.00 | | | | 7-1-2019 | | | | 2,000,000 | | | | 2,092,440 | |
Massachusetts HFA Construction Loan Notes Series A (Housing Revenue) | | | 1.85 | | | | 6-1-2020 | | | | 5,750,000 | | | | 5,726,713 | |
Massachusetts HFA Construction Loan Notes Series B (Housing Revenue) | | | 2.00 | | | | 6-1-2019 | | | | 9,000,000 | | | | 9,021,060 | |
Massachusetts HFA Construction Loan Notes Series B (Housing Revenue) | | | 2.05 | | | | 12-1-2021 | | | | 26,875,000 | | | | 26,854,575 | |
Massachusetts HFA Highland Glen Project Series A (Housing Revenue) | | | 1.22 | | | | 8-1-2019 | | | | 10,000,000 | | | | 9,919,100 | |
Massachusetts HFA Multifamily Conduit Symphony Plaza Project Series A (Housing Revenue) | | | 1.72 | | | | 2-1-2020 | | | | 61,000,000 | | | | 60,954,250 | |
Massachusetts HFA Multifamily Conduit Van Brodie Mill Series A (Housing Revenue, TD Bank NA LOC) | | | 2.00 | | | | 7-1-2020 | | | | 7,000,000 | | | | 6,993,210 | |
Tender Option Bond Trust Receipts/Floater Certificates Series 2016-XF2306 (Education Revenue, Morgan Stanley Bank LIQ) 144Aø | | | 1.96 | | | | 7-1-2033 | | | | 9,380,000 | | | | 9,380,000 | |
| |
| | | | 218,342,227 | |
| | | | | | | | | | | | | | | | |
| | | | |
| Michigan: 3.61% | | | | | | | | | | | | | | | | |
Allendale MI Public School District Series A (GO Revenue, Qualified School Board Loan Fund Insured) | | | 3.00 | | | | 11-1-2021 | | | | 895,000 | | | | 920,463 | |
Birmingham MI City School District (GO Revenue) | | | 5.00 | | | | 11-1-2018 | | | | 905,000 | | | | 931,245 | |
Birmingham MI City School District (GO Revenue) | | | 5.00 | | | | 11-1-2019 | | | | 5,970,000 | | | | 6,329,633 | |
Caledonia MI Community Schools (GO Revenue, Qualified School Board Loan Fund Insured) | | | 5.00 | | | | 5-1-2018 | | | | 1,315,000 | | | | 1,330,136 | |
Caledonia MI Community Schools (GO Revenue, Qualified School Board Loan Fund Insured) | | | 5.00 | | | | 5-1-2020 | | | | 500,000 | | | | 536,775 | |
Caledonia MI Community Schools (GO Revenue, Qualified School Board Loan Fund Insured) | | | 5.00 | | | | 5-1-2021 | | | | 1,140,000 | | | | 1,256,907 | |
Chippewa Hills MI School District (GO Revenue, Qualified School Board Loan Fund Insured) | | | 4.00 | | | | 5-1-2018 | | | | 1,535,000 | | | | 1,546,912 | |
Chippewa Hills MI School District (GO Revenue, Qualified School Board Loan Fund Insured) | | | 4.00 | | | | 5-1-2019 | | | | 1,595,000 | | | | 1,641,446 | |
Detroit MI Sewage Disposal System Series A (Water & Sewer Revenue, AGM Insured) | | | 5.25 | | | | 7-1-2019 | | | | 980,000 | | | | 1,027,550 | |
Flushing MI Community Schools School District (GO Revenue, Qualified School Board Loan Fund Insured) | | | 4.00 | | | | 5-1-2021 | | | | 1,135,000 | | | | 1,214,144 | |
Forest Hills MI Public Schools (GO Revenue) | | | 5.00 | | | | 5-1-2018 | | | | 2,000,000 | | | | 2,023,020 | |
Forest Hills MI Public Schools (GO Revenue) | | | 5.00 | | | | 5-1-2019 | | | | 1,375,000 | | | | 1,436,325 | |
The accompanying notes are an integral part of these financial statements.
| | | | | | |
| Portfolio of investments—December 31, 2017 (unaudited) | | Wells Fargo Short-Term Municipal Bond Fund | | | 17 | |
| | | | | | | | | | | | | | | | |
| Security name | | Interest rate | | | Maturity date | | | Principal | | | Value | |
| | | | |
| Michigan (continued) | | | | | | | | | | | | | | | | |
Fraser MI Public Schools District (GO Revenue, Qualified School Board Loan Fund Insured) | | | 5.00 | % | | | 5-1-2019 | | | $ | 1,050,000 | | | $ | 1,094,289 | |
Gibraltar MI School District (GO Revenue, Qualified School Board Loan Fund Insured) | | | 5.00 | | | | 5-1-2019 | | | | 1,085,000 | | | | 1,133,695 | |
Gibraltar MI School District (GO Revenue, Qualified School Board Loan Fund Insured) | | | 5.00 | | | | 5-1-2020 | | | | 1,100,000 | | | | 1,179,343 | |
Gibraltar MI School District (GO Revenue, Qualified School Board Loan Fund Insured) | | | 5.00 | | | | 5-1-2021 | | | | 1,185,000 | | | | 1,304,093 | |
Grand Ledge MI Public School District (GO Revenue, Qualified School Board Loan Fund Insured) | | | 5.00 | | | | 5-1-2020 | | | | 2,680,000 | | | | 2,875,211 | |
Haslett MI Public Schools (GO Revenue, Qualified School Board Loan Fund Insured) | | | 4.00 | | | | 5-1-2019 | | | | 515,000 | | | | 530,337 | |
Haslett MI Public Schools (GO Revenue, Qualified School Board Loan Fund Insured) | | | 4.00 | | | | 5-1-2020 | | | | 370,000 | | | | 388,467 | |
Haslett MI Public Schools (GO Revenue, Qualified School Board Loan Fund Insured) | | | 5.00 | | | | 5-1-2021 | | | | 500,000 | | | | 551,105 | |
Hudsonville MI Public Schools (GO Revenue, Qualified School Board Loan Fund Insured) | | | 5.00 | | | | 5-1-2018 | | | | 750,000 | | | | 758,378 | |
Hudsonville MI Public Schools (GO Revenue, Qualified School Board Loan Fund Insured) | | | 5.00 | | | | 5-1-2019 | | | | 1,605,000 | | | | 1,673,774 | |
Lake Orion MI Community School District 2015 Refunding Bond (GO Revenue, Qualified School Board Loan Fund Insured) | | | 5.00 | | | | 5-1-2019 | | | | 2,325,000 | | | | 2,424,626 | |
Lake Orion MI Community School District 2015 Refunding Bond (GO Revenue, Qualified School Board Loan Fund Insured) | | | 5.00 | | | | 5-1-2020 | | | | 1,550,000 | | | | 1,662,902 | |
Lake Orion MI Community School District 2016 Refunding Bond (GO Revenue, Qualified School Board Loan Fund Insured) | | | 5.00 | | | | 5-1-2019 | | | | 915,000 | | | | 954,208 | |
Lake Orion MI Community School District 2016 Refunding Bond (GO Revenue, Qualified School Board Loan Fund Insured) | | | 5.00 | | | | 5-1-2020 | | | | 1,390,000 | | | | 1,491,248 | |
Lake Orion MI Community School District 2016 Refunding Bond (GO Revenue, Qualified School Board Loan Fund Insured) | | | 5.00 | | | | 5-1-2021 | | | | 1,385,000 | | | | 1,526,561 | |
Michigan Finance Authority Refunding Bond 2nd Lien Detroit Water & Sewer Series C-7 (Water & Sewer Revenue, National Insured) | | | 5.00 | | | | 7-1-2019 | | | | 2,500,000 | | | | 2,608,375 | |
Michigan Finance Authority Refunding Bond 2nd Lien Detroit Water & Sewer Series C-7 (Water & Sewer Revenue, National Insured) | | | 5.00 | | | | 7-1-2020 | | | | 3,835,000 | | | | 4,170,026 | |
Michigan Finance Authority Refunding Bond 2nd Lien Detroit Water & Sewer Series C-7 (Water & Sewer Revenue, National Insured) | | | 5.00 | | | | 7-1-2021 | | | | 3,095,000 | | | | 3,459,312 | |
Michigan Finance Authority Refunding Bond 2nd Lien Detroit Water & Sewer Series C-8 (Water & Sewer Revenue) | | | 5.00 | | | | 7-1-2018 | | | | 2,000,000 | | | | 2,030,660 | |
Michigan Finance Authority Refunding Bond Local Government Loan Program Detroit Water & Sewer Series D-3 (Water & Sewer Revenue, National Insured) | | | 5.00 | | | | 7-1-2019 | | | | 7,000,000 | | | | 7,321,440 | |
Michigan Finance Authority Refunding Bond Local Government Loan Program Detroit Water & Sewer Series D-6 (Water & Sewer Revenue, National Insured) | | | 5.00 | | | | 7-1-2019 | | | | 1,500,000 | | | | 1,565,025 | |
Michigan Finance Authority Refunding Bond Local Government Loan Program Detroit Water & Sewer Series D-6 (Water & Sewer Revenue, National Insured) | | | 5.00 | | | | 7-1-2020 | | | | 1,800,000 | | | | 1,957,248 | |
Michigan Finance Authority Refunding Bond Senior Lien Detroit Water & Sewer Series C-5 (Water & Sewer Revenue, National Insured) | | | 5.00 | | | | 7-1-2019 | | | | 7,000,000 | | | | 7,321,440 | |
Michigan Finance Authority School District (Miscellaneous Revenue) | | | 5.00 | | | | 7-1-2021 | | | | 2,060,000 | | | | 2,106,144 | |
Michigan Finance Authority Unemployment Obligation Assessment Series B (Miscellaneous Revenue) | | | 5.00 | | | | 1-1-2020 | | | | 15,000,000 | | | | 15,754,650 | |
Michigan Hospital Finance Authority Ascension Health Series A-3 (Health Revenue) | | | 1.87 | | | | 11-1-2027 | | | | 20,275,000 | | | | 20,301,763 | |
Michigan Hospital Finance Authority Ascension Health Subordinate Credit Group Series 2005 A-4 (Health Revenue) | | | 1.63 | | | | 11-1-2027 | | | | 3,145,000 | | | | 3,132,860 | |
Michigan Housing Development Authority Series A (Housing Revenue) | | | 1.80 | | | | 4-1-2019 | | | | 5,405,000 | | | | 5,405,919 | |
Michigan Housing Development Authority Series D (Housing Revenue, Industrial and Commercial Bank of China Limited SPA) ø | | | 1.75 | | | | 6-1-2030 | | | | 4,780,000 | | | | 4,780,000 | |
The accompanying notes are an integral part of these financial statements.
| | | | |
| 18 | | Wells Fargo Short-Term Municipal Bond Fund | | Portfolio of investments—December 31, 2017 (unaudited) |
| | | | | | | | | | | | | | | | |
| Security name | | Interest rate | | | Maturity date | | | Principal | | | Value | |
| | | | |
| Michigan (continued) | | | | | | | | | | | | | | | | |
Michigan Strategic Fund Limited Obligation Events Center Project Series A (Tax Revenue) | | | 4.13 | % | | | 7-1-2045 | | | $ | 29,250,000 | | | $ | 29,561,513 | |
Rochester MI Community School District (GO Revenue, Qualified School Board Loan Fund Insured) | | | 5.00 | | | | 5-1-2019 | | | | 900,000 | | | | 939,780 | |
South Lyon MI Community School District (GO Revenue) | | | 4.00 | | | | 5-1-2018 | | | | 2,060,000 | | | | 2,075,017 | |
South Lyon MI Community School District (GO Revenue) | | | 4.00 | | | | 5-1-2019 | | | | 1,860,000 | | | | 1,918,627 | |
South Lyon MI Community School District (GO Revenue) | | | 4.00 | | | | 5-1-2020 | | | | 1,425,000 | | | | 1,496,122 | |
Southgate MI Community School District (GO Revenue, Build America Mutual Assurance Company Insured) | | | 5.00 | | | | 5-1-2019 | | | | 1,000,000 | | | | 1,044,880 | |
Southgate MI Community School District (GO Revenue, Build America Mutual Assurance Company Insured) | | | 5.00 | | | | 5-1-2020 | | | | 500,000 | | | | 536,065 | |
Warren Woods MI Public Schools (GO Revenue, Qualified School Board Loan Fund Insured) | | | 5.00 | | | | 5-1-2020 | | | | 1,445,000 | | | | 1,551,280 | |
Wayne County MI Airport Authority Refunding Bond Series A (Airport Revenue) | | | 5.00 | | | | 12-1-2019 | | | | 19,405,000 | | | | 20,505,846 | |
Western Michigan University Refunding Bond (Education Revenue) | | | 5.00 | | | | 11-15-2020 | | | | 1,000,000 | | | | 1,088,410 | |
| |
| | | | 182,375,195 | |
| | | | | | | | | | | | | | | | |
| | | | |
| Minnesota: 0.18% | | | | | | | | | | | | | | | | |
Bemidji MN IDR North Central Door Company Project (Industrial Development Revenue, U.S. Bank NA LOC) ø | | | 1.48 | | | | 5-1-2026 | | | | 2,555,000 | | | | 2,555,000 | |
Minneapolis & St. Paul MN Metropolitan Airports Commission Morgan Stanley Series 3200 (Airport Revenue, Morgan Stanley Bank LIQ) 144Aø | | | 1.74 | | | | 1-1-2035 | | | | 6,000,000 | | | | 6,000,000 | |
Northern Minnesota Municipal Power Agency Series 2008A (Utilities Revenue, AGC Insured) | | | 5.00 | | | | 1-1-2018 | | | | 670,000 | | | | 670,000 | |
| |
| | | | 9,225,000 | |
| | | | | | | | | | | | | | | | |
|
| Mississippi: 0.84% | |
Mississippi Business Finance Corporation Power Company Project 1st Series (Utilities Revenue) | | | 1.63 | | | | 12-1-2040 | | | | 15,275,000 | | | | 15,273,473 | |
Mississippi Home Corporation Multifamily Housing Deville Manor Apartments Project (Housing Revenue) | | | 1.76 | | | | 12-1-2020 | | | | 5,500,000 | | | | 5,495,215 | |
Mississippi Home Corporation Multifamily Vicksburg Housing Authority Rad Project (Housing Revenue, GNMA/FNMA/FHLMC Insured) | | | 1.19 | | | | 12-1-2020 | | | | 21,500,000 | | | | 21,492,045 | |
| |
| | | | 42,260,733 | |
| | | | | | | | | | | | | | | | |
| | | | |
| Missouri: 0.74% | | | | | | | | | | | | | | | | |
Arnold MO Real Property Arnold Triangle Redevelopment Project Series A (Tax Revenue) | | | 3.75 | | | | 5-1-2023 | | | | 2,465,000 | | | | 2,494,629 | |
Kansas City MO Series A (GO Revenue) | | | 5.00 | | | | 2-1-2018 | | | | 1,150,000 | | | | 1,153,209 | |
Kansas City MO Series A (GO Revenue) | | | 5.00 | | | | 2-1-2019 | | | | 1,000,000 | | | | 1,037,270 | |
Kansas City MO Series A (GO Revenue) | | | 5.00 | | | | 2-1-2020 | | | | 1,495,000 | | | | 1,597,497 | |
Kirkwood MO IDA Retirement Community Series A (Health Revenue) | | | 8.25 | | | | 5-15-2045 | | | | 3,000,000 | | | | 3,431,940 | |
Sikeston MO Electric System Refunding Bond (Utilities Revenue) | | | 5.00 | | | | 6-1-2019 | | | | 11,625,000 | | | | 12,177,536 | |
St. Louis MO Special Administrative Board The Transitional School Direct Deposit Program (GO Revenue) | | | 4.00 | | | | 4-1-2022 | | | | 5,030,000 | | | | 5,471,533 | |
Tender Option Bond Trust Receipts/Floater Certificates Series 2015-XF1015 (Health Revenue, Deutsche Bank LIQ) 144Aø | | | 1.79 | | | | 11-15-2048 | | | | 10,000,000 | | | | 10,000,000 | |
| |
| | | | 37,363,614 | |
| | | | | | | | | | | | | | | | |
The accompanying notes are an integral part of these financial statements.
| | | | | | |
| Portfolio of investments—December 31, 2017 (unaudited) | | Wells Fargo Short-Term Municipal Bond Fund | | | 19 | |
| | | | | | | | | | | | | | | | |
| Security name | | Interest rate | | | Maturity date | | | Principal | | | Value | |
| | | | |
| Nebraska: 0.02% | | | | | | | | | | | | | | | | |
Nebraska Public Power Generation Agency Whelan Energy Center Unit 2 Series A (Utilities Revenue) | | | 5.00 | % | | | 1-1-2020 | | | $ | 1,000,000 | | | $ | 1,061,000 | |
| | | | | | | | | | | | | | | | |
| | | | |
| Nevada: 0.91% | | | | | | | | | | | | | | | | |
Clark County NV Airport Jet Aviation Fuel Tax Series A (Airport Revenue) | | | 5.00 | | | | 7-1-2019 | | | | 1,000,000 | | | | 1,046,980 | |
Clark County NV Airport Jet Aviation Fuel Tax Series A (Airport Revenue) | | | 5.00 | | | | 7-1-2020 | | | | 1,000,000 | | | | 1,071,380 | |
Clark County NV PCR (Industrial Development Revenue) | | | 1.88 | | | | 6-1-2031 | | | | 880,000 | | | | 877,967 | |
Clark County NV School District Series B (GO Revenue) | | | 5.00 | | | | 6-15-2019 | | | | 18,800,000 | | | | 19,681,908 | |
Clark County NV School District Series C (GO Revenue) | | | 5.00 | | | | 6-15-2021 | | | | 9,030,000 | | | | 9,963,612 | |
Clark County NV School District Series C (GO Revenue) | | | 5.00 | | | | 6-15-2022 | | | | 2,000,000 | | | | 2,260,600 | |
Clark County NV School District Series D (GO Revenue) | | | 5.00 | | | | 6-15-2021 | | | | 2,395,000 | | | | 2,642,619 | |
Washoe County NV Sierra Pacific Power Series B (Utilities Revenue) | | | 3.00 | | | | 3-1-2036 | | | | 520,000 | | | | 536,728 | |
Washoe County NV Water Facilities Refunding Bond AMT Sierra Pacific Power Company Project Series 2016E (Water & Sewer Revenue) øø | | | 1.80 | | | | 3-1-2036 | | | | 8,000,000 | | | | 8,000,000 | |
| |
| | | | 46,081,794 | |
| | | | | | | | | | | | | | | | |
| | | | |
| New Hampshire: 0.16% | | | | | | | | | | | | | | | | |
New Hampshire HEFA Catholic Medical Center (Health Revenue) | | | 4.00 | | | | 7-1-2018 | | | | 2,405,000 | | | | 2,428,665 | |
New Hampshire HEFA Catholic Medical Center (Health Revenue) | | | 4.00 | | | | 7-1-2019 | | | | 2,635,000 | | | | 2,707,884 | |
New Hampshire HFA Multifamily Housing Series 1 (Housing Revenue, FHA Insured) | | | 1.75 | | | | 1-1-2020 | | | | 2,455,000 | | | | 2,450,213 | |
New Hampshire HFA SFMR Series B (Housing Revenue) | | | 5.00 | | | | 7-1-2027 | | | | 615,000 | | | | 629,735 | |
| |
| | | | 8,216,497 | |
| | | | | | | | | | | | | | | | |
| | | | |
| New Jersey: 5.24% | | | | | | | | | | | | | | | | |
Andover NJ Regional School District Refunding School Bond Series 2014 (GO Revenue, Build America Mutual Assurance Company Insured) | | | 3.00 | | | | 2-15-2020 | | | | 515,000 | | | | 525,614 | |
Hudson County NJ Refunding Bond County College (GO Revenue) | | | 4.00 | | | | 7-15-2018 | | | | 1,135,000 | | | | 1,150,436 | |
New Jersey Casino Reinvestment Development Authority (Tax Revenue) | | | 4.00 | | | | 11-1-2019 | | | | 1,425,000 | | | | 1,469,888 | |
New Jersey Certificate of Participation Equipment Lease Purchase Agreement Series A (Miscellaneous Revenue) | | | 5.00 | | | | 6-15-2018 | | | | 11,160,000 | | | | 11,335,435 | |
New Jersey Economic Development Authority School Facilities Construction Bond Series DDD (Miscellaneous Revenue) | | | 5.00 | | | | 6-15-2023 | | | | 3,000,000 | | | | 3,326,610 | |
New Jersey Economic Development Authority School Facilities Construction Bond Series DDD (Miscellaneous Revenue) | | | 5.00 | | | | 6-15-2024 | | | | 2,605,000 | | | | 2,916,532 | |
New Jersey Economic Development Authority Transportation Project New Jersey Transit Corporation Project Series B (Miscellaneous Revenue) | | | 5.00 | | | | 11-1-2021 | | | | 2,490,000 | | | | 2,698,737 | |
New Jersey Economic Development Authority Transportation Project New Jersey Transit Corporation Project Series B (Miscellaneous Revenue) | | | 5.00 | | | | 11-1-2022 | | | | 26,000,000 | | | | 28,639,260 | |
New Jersey EDA (Tobacco Revenue) | | | 4.00 | | | | 6-15-2019 | | | | 2,500,000 | | | | 2,571,800 | |
New Jersey EDA School Facilities Construction Bonds Series DD-1 (Miscellaneous Revenue) | | | 5.00 | | | | 12-15-2019 | | | | 1,000,000 | | | | 1,048,250 | |
New Jersey EDA School Facilities Construction Bonds Series K (Miscellaneous Revenue, National Insured) | | | 5.25 | | | | 12-15-2021 | | | | 1,040,000 | | | | 1,146,506 | |
New Jersey EDA School Facilities Construction Notes Series NN (Miscellaneous Revenue) | | | 5.00 | | | | 3-1-2022 | | | | 405,000 | | | | 440,085 | |
New Jersey EDA School Facilities Construction Refunding Bond Series NN (Miscellaneous Revenue) | | | 5.00 | | | | 3-1-2021 | | | | 5,020,000 | | | | 5,365,828 | |
New Jersey EDA Series BBB (Miscellaneous Revenue) | | | 5.00 | | | | 6-15-2022 | | | | 6,000,000 | | | | 6,551,220 | |
New Jersey EDA Series BBB (Miscellaneous Revenue) | | | 5.00 | | | | 6-15-2023 | | | | 4,000,000 | | | | 4,435,480 | |
New Jersey EDA Series UU (Miscellaneous Revenue) | | | 5.00 | | | | 6-15-2018 | | | | 7,355,000 | | | | 7,472,312 | |
The accompanying notes are an integral part of these financial statements.
| | | | |
| 20 | | Wells Fargo Short-Term Municipal Bond Fund | | Portfolio of investments—December 31, 2017 (unaudited) |
| | | | | | | | | | | | | | | | |
| Security name | | Interest rate | | | Maturity date | | | Principal | | | Value | |
| | | | |
| New Jersey (continued) | | | | | | | | | | | | | | | | |
New Jersey EDA Series XX (Miscellaneous Revenue) | | | 5.00 | % | | | 6-15-2022 | | | $ | 7,500,000 | | | $ | 8,189,025 | |
New Jersey EDA Unrefunded Bond School Facilities Construction Series EE (Tax Revenue) | | | 5.00 | | | | 9-1-2018 | | | | 865,000 | | | | 881,764 | |
New Jersey EDA Unrefunded Bond School Facilities Construction Series EE (Tax Revenue) | | | 5.00 | | | | 9-1-2020 | | | | 610,000 | | | | 647,710 | |
New Jersey HFFA Greystone Park Psychiatric Hospital Project Series B (Miscellaneous Revenue) | | | 5.00 | | | | 9-15-2019 | | | | 2,135,000 | | | | 2,216,344 | |
New Jersey Higher Education Assistance Authority Series A1 (Education Revenue) | | | 5.00 | | | | 12-1-2020 | | | | 9,775,000 | | | | 10,482,417 | |
New Jersey Housing and Mortgage Finance Agency Multifamily Series A (Housing Revenue) | | | 2.00 | | | | 11-1-2021 | | | | 325,000 | | | | 324,282 | |
New Jersey Housing and Mortgage Finance Agency Multifamily Series B (Housing Revenue) | | | 1.65 | | | | 5-1-2020 | | | | 4,605,000 | | | | 4,584,600 | |
New Jersey Housing and Mortgage Finance Agency Multifamily Series B (Housing Revenue) | | | 2.00 | | | | 5-1-2021 | | | | 14,335,000 | | | | 14,307,333 | |
New Jersey Housing and Mortgage Finance Agency Series B (Housing Revenue) | | | 1.15 | | | | 11-1-2018 | | | | 11,095,000 | | | | 11,047,292 | |
New Jersey Housing and Mortgage Finance Agency Series B (Housing Revenue) | | | 1.25 | | | | 5-1-2019 | | | | 6,000,000 | | | | 5,955,120 | |
New Jersey Prerefunded Bond School Facilities Construction Series EE (Miscellaneous Revenue) | | | 5.00 | | | | 9-1-2018 | | | | 2,375,000 | | | | 2,430,076 | |
New Jersey Prerefunded Bond School Facilities Construction Series EE (Miscellaneous Revenue) | | | 5.00 | | | | 9-1-2020 | | | | 1,650,000 | | | | 1,789,244 | |
New Jersey Sports & Exposition Authority Series B (Miscellaneous Revenue) | | | 5.00 | | | | 9-1-2018 | | | | 1,805,000 | | | | 1,839,746 | |
New Jersey TTFA Federal Highway Reimbursement Notes Subordinate Series A1 (Transportation Revenue) | | | 5.00 | | | | 6-15-2022 | | | | 5,000,000 | | | | 5,078,150 | |
New Jersey TTFA Series A (Miscellaneous Revenue) | | | 5.00 | | | | 12-15-2018 | | | | 1,000,000 | | | | 1,027,410 | |
New Jersey TTFA Series A (Miscellaneous Revenue) | | | 5.00 | | | | 12-15-2019 | | | | 3,000,000 | | | | 3,144,750 | |
New Jersey TTFA Series A (Miscellaneous Revenue) | | | 5.00 | | | | 6-15-2020 | | | | 1,000,000 | | | | 1,058,800 | |
New Jersey TTFA Series A (Transportation Revenue) | | | 5.25 | | | | 12-15-2020 | | | | 33,465,000 | | | | 36,105,723 | |
New Jersey TTFA Series A1 (Transportation Revenue) | | | 5.00 | | | | 6-15-2020 | | | | 7,000,000 | | | | 7,411,600 | |
New Jersey TTFA Series A1 (Transportation Revenue) | | | 5.00 | | | | 6-15-2021 | | | | 5,000,000 | | | | 5,386,600 | |
New Jersey TTFA Series AA (Transportation Revenue) | | | 5.00 | | | | 6-15-2019 | | | | 2,070,000 | | | | 2,146,528 | |
New Jersey TTFA Transit System Series A (GO Revenue) | | | 5.75 | | | | 6-15-2020 | | | | 4,425,000 | | | | 4,695,368 | |
New Jersey TTFA Transportation Program Notes Series BB-2 (SIFMA Municipal Swap +1.20%) (Transportation Revenue) ± | | | 2.91 | | | | 6-15-2034 | | | | 5,000,000 | | | | 4,956,050 | |
New Jersey Turnpike Authority Series C-6 (1 Month LIBOR +0.75%) (Transportation Revenue) ± | | | 1.70 | | | | 1-1-2030 | | | | 21,820,000 | | | | 22,005,470 | |
Newark NJ Housing Authority Refunding Bond Newark Redevelopment Project (Miscellaneous Revenue, National Insured) | | | 5.25 | | | | 1-1-2020 | | | | 2,170,000 | | | | 2,308,533 | |
Newark NJ Housing Authority Refunding Bond Newark Redevelopment Project (Miscellaneous Revenue, National Insured) | | | 5.25 | | | | 1-1-2021 | | | | 4,570,000 | | | | 4,977,324 | |
Rutgers University Series J (Education Revenue) | | | 4.00 | | | | 5-1-2018 | | | | 700,000 | | | | 705,894 | |
Rutgers University Series L (Education Revenue) | | | 5.00 | | | | 5-1-2018 | | | | 300,000 | | | | 303,501 | |
Saddle Brook Township NJ BAN (GO Revenue) | | | 2.25 | | | | 6-1-2018 | | | | 11,137,423 | | | | 11,165,267 | |
Trenton City NJ Refunding Bond (GO Revenue) | | | 4.00 | | | | 7-15-2019 | | | | 1,905,000 | | | | 1,956,111 | |
Trenton City NJ Refunding Bond (GO Revenue) | | | 4.00 | | | | 7-15-2020 | | | | 1,685,000 | | | | 1,738,701 | |
Trenton City NJ Refunding Bond (GO Revenue, Build America Mutual Assurance Company Insured) | | | 5.00 | | | | 12-1-2020 | | | | 1,675,000 | | | | 1,821,345 | |
Winslow Township NJ Board of Education Refunding Bond (GO Revenue) | | | 4.00 | | | | 8-1-2018 | | | | 425,000 | | | | 430,912 | |
Winslow Township NJ Board of Education Refunding Bond (GO Revenue) | | | 4.00 | | | | 8-1-2019 | | | | 525,000 | | | | 543,464 | |
| |
| | | | 264,756,447 | |
| | | | | | | | | | | | | | | | |
The accompanying notes are an integral part of these financial statements.
| | | | | | |
| Portfolio of investments—December 31, 2017 (unaudited) | | Wells Fargo Short-Term Municipal Bond Fund | | | 21 | |
| | | | | | | | | | | | | | | | |
| Security name | | Interest rate | | | Maturity date | | | Principal | | | Value | |
| | | | |
| New Mexico: 0.75% | | | | | | | | | | | | | | | | |
Farmington NM PCR Southern California Edison Company Four Corners Project Series B (Utilities Revenue) | | | 1.88 | % | | | 4-1-2029 | | | $ | 4,750,000 | | | $ | 4,732,853 | |
New Mexico Educational Assistance Foundation Series A2 (3 Month LIBOR +0.65%) (Education Revenue) ± | | | 2.13 | | | | 12-1-2028 | | | | 230,000 | | | | 230,122 | |
New Mexico Mortgage Finance Authority SFMR Class I-A-2 (Housing Revenue, GNMA/FNMA/FHLMC Insured) | | | 5.60 | | | | 1-1-2039 | | | | 190,000 | | | | 193,800 | |
New Mexico Municipal Energy Acquisition Authority Gas Supply Subordinate Series B (1 Month LIBOR +0.75%) (Utilities Revenue, Royal Bank of Canada SPA) ± | | | 1.66 | | | | 11-1-2039 | | | | 32,500,000 | | | | 32,471,725 | |
| |
| | | | 37,628,500 | |
| | | | | | | | | | | | | | | | |
| | | | |
| New York: 10.19% | | | | | | | | | | | | | | | | |
Campbell Savona NY Central School District BAN (GO Revenue) | | | 2.25 | | | | 6-29-2018 | | | | 8,000,000 | | | | 8,020,720 | |
Long Island NY Power Authority Electric System Series C (1 Month LIBOR +0.65%) (Utilities Revenue) ± | | | 1.60 | | | | 5-1-2033 | | | | 12,000,000 | | | | 12,008,880 | |
Long Island NY Power Authority Electric System Series C (1 Month LIBOR +0.88%) (Utilities Revenue) ± | | | 1.83 | | | | 5-1-2033 | | | | 33,750,000 | | | | 33,797,925 | |
Nassau County NY Prerefunded Bond Series C (GO Revenue) | | | 5.00 | | | | 10-1-2020 | | | | 3,020,000 | | | | 3,194,254 | |
Nassau County NY Series A (GO Revenue) | | | 5.00 | | | | 1-1-2020 | | | | 4,000,000 | | | | 4,250,480 | |
Nassau County NY Series F (GO Revenue) | | | 5.00 | | | | 10-1-2020 | | | | 1,780,000 | | | | 1,884,290 | |
Nassau County NY Unrefunded Bond Series C (GO Revenue) | | | 5.00 | | | | 10-1-2020 | | | | 45,000 | | | | 47,637 | |
New York Dormitory Authority North Shore-Long Island Jewish Obligated Group Series B (3 Month LIBOR +0.73%) (Health Revenue) ± | | | 1.65 | | | | 5-1-2018 | | | | 3,420,000 | | | | 3,420,479 | |
New York Environmental Facilities Corporation Municipal Water Series A (Water & Sewer Revenue) | | | 5.00 | | | | 6-15-2018 | | | | 750,000 | | | | 762,300 | |
New York Environmental Facilities Corporation Municipal Water Series A (Water & Sewer Revenue) | | | 5.00 | | | | 6-15-2019 | | | | 1,000,000 | | | | 1,050,300 | |
New York HFA Affordable Housing Series L (Housing Revenue, GNMA/FNMA/FHLMC Insured) | | | 1.65 | | | | 5-1-2021 | | | | 6,400,000 | | | | 6,362,944 | |
New York HFA Affordable Housing Series M-1 (Housing Revenue, GNMA/FNMA/FHLMC Insured) | | | 1.80 | | | | 5-1-2020 | | | | 1,200,000 | | | | 1,199,988 | |
New York HFA Affordable Housing Series M-1 (Housing Revenue, GNMA/FNMA/FHLMC Insured) | | | 1.85 | | | | 11-1-2020 | | | | 3,195,000 | | | | 3,194,968 | |
New York HFA Affordable Housing Series M-1 (Housing Revenue, GNMA/FNMA/FHLMC Insured) | | | 2.00 | | | | 5-1-2021 | | | | 5,000,000 | | | | 4,999,950 | |
New York HFA Affordable Housing Series M-2 (Housing Revenue, GNMA/FNMA/FHLMC Insured) | | | 1.85 | | | | 11-1-2020 | | | | 6,435,000 | | | | 6,434,936 | |
New York Metropolitan Transportation Authority Subordinate Series A-3 (SIFMA Municipal Swap +0.50%) (Transportation Revenue) ± | | | 2.21 | | | | 11-15-2042 | | | | 39,500,000 | | | | 39,464,845 | |
New York Metropolitan Transportation Authority Subordinate Series A2 (SIFMA Municipal Swap +0.58%) (Transportation Revenue) ± | | | 2.29 | | | | 11-15-2039 | | | | 2,000,000 | | | | 2,001,920 | |
New York Metropolitan Transportation Authority Subordinate Series A2A (SIFMA Municipal Swap +0.45%) (Tax Revenue) ± | | | 2.16 | | | | 11-1-2026 | | | | 6,895,000 | | | | 6,886,588 | |
New York Metropolitan Transportation Authority Subordinate Series B3 (SIFMA Municipal Swap +0.90%) (Tax Revenue) ± | | | 2.61 | | | | 11-1-2018 | | | | 32,600,000 | | | | 32,725,184 | |
New York Metropolitan Transportation Authority Subordinate Series B4 (Transportation Revenue) | | | 5.00 | | | | 11-15-2030 | | | | 13,620,000 | | | | 14,436,928 | |
New York Metropolitan Transportation Authority Subordinate Series C2 (Transportation Revenue) | | | 4.00 | | | | 11-15-2033 | | | | 8,000,000 | | | | 8,426,720 | |
New York Metropolitan Transportation Authority Subordinate Series D-2 (Transportation Revenue, Landesbank Hessen-Thüringen LOC) ø | | | 1.95 | | | | 11-1-2035 | | | | 4,455,000 | | | | 4,455,000 | |
New York Metropolitan Transportation Authority Subordinate Series D-2 (SIFMA Municipal Swap +0.45%) (Transportation Revenue) ± | | | 2.16 | | | | 11-15-2044 | | | | 22,545,000 | | | | 22,506,448 | |
The accompanying notes are an integral part of these financial statements.
| | | | |
| 22 | | Wells Fargo Short-Term Municipal Bond Fund | | Portfolio of investments—December 31, 2017 (unaudited) |
| | | | | | | | | | | | | | | | |
| Security name | | Interest rate | | | Maturity date | | | Principal | | | Value | |
| | | | |
| New York (continued) | | | | | | | | | | | | | | | | |
New York Metropolitan Transportation Authority Subordinate Series D-2A-1 (1 Month LIBOR +0.57%) (Transportation Revenue, AGM Insured) ± | | | 1.51 | % | | | 11-1-2032 | | | $ | 7,500,000 | | | $ | 7,501,950 | |
New York Metropolitan Transportation Authority Subordinate Series D-2A-2 (1 Month LIBOR +0.68%) (Transportation Revenue, AGM Insured) ± | | | 1.62 | | | | 11-1-2032 | | | | 20,000,000 | | | | 20,078,000 | |
New York Metropolitan Transportation Authority Subordinate Series D2 (1 Month LIBOR +0.60%) (Transportation Revenue, AGM Insured) ± | | | 1.54 | | | | 11-1-2032 | | | | 15,850,000 | | | | 15,853,963 | |
New York Metropolitan Transportation Authority Subordinate Series D2 (Transportation Revenue) | | | 4.00 | | | | 11-15-2034 | | | | 14,665,000 | | | | 15,195,580 | |
New York Metropolitan Transportation Authority Subordinate Series E1 (Transportation Revenue, Bank of Montreal LOC) ø | | | 1.45 | | | | 11-1-2035 | | | | 8,285,000 | | | | 8,285,000 | |
New York Metropolitan Transportation Authority Subordinate Series G1 (1 Month LIBOR +0.48%) (Transportation Revenue) ± | | | 1.39 | | | | 11-1-2026 | | | | 31,950,000 | | | | 31,951,598 | |
New York NY Adjusted Fiscal 2008 Subordinate Series A-4 (GO Revenue, AGM Insured) (m) | | | 1.95 | | | | 8-1-2026 | | | | 16,075,000 | | | | 16,075,000 | |
New York NY Adjusted Fiscal 2008 Subordinate Series C-4 (GO Revenue, AGC Insured) (m) | | | 1.95 | | | | 10-1-2027 | | | | 15,000,000 | | | | 15,000,000 | |
New York NY Health & Hospital Corporation Health System Series A (Health Revenue) | | | 5.50 | | | | 2-15-2020 | | | | 5,755,000 | | | | 5,783,027 | |
New York NY Housing Development Corporation Multifamily Housing Sustainable Neighborhood Series D1-B (Housing Revenue) | | | 1.50 | | | | 11-1-2018 | | | | 1,000,000 | | | | 997,950 | |
New York NY Housing Development Corporation Sustainable Neighborhood Bonds Series I2B (Housing Revenue) | | | 2.00 | | | | 5-1-2021 | | | | 12,000,000 | | | | 12,029,760 | |
New York NY Series J-4 (SIFMA Municipal Swap +0.55%) (GO Revenue) ± | | | 2.26 | | | | 8-1-2025 | | | | 2,000,000 | | | | 1,999,960 | |
New York NY Subordinate Series J-11 (SIFMA Municipal Swap +0.58%) (GO Revenue) ± | | | 2.29 | | | | 8-1-2027 | | | | 43,810,000 | | | | 43,856,439 | |
New York NY Urban Development Corporation Personal Income Tax Series A (Tax Revenue) | | | 5.00 | | | | 3-15-2019 | | | | 1,855,000 | | | | 1,931,890 | |
New York Transportation Development Corporation American Airlines Incorporated John F. Kennedy International Airport Project Series 2016 (Airport Revenue) | | | 5.00 | | | | 8-1-2019 | | | | 8,000,000 | | | | 8,332,640 | |
Niagara Falls NY Board Community Toll (Transportation Revenue, National Insured) | | | 6.25 | | | | 10-1-2020 | | | | 8,685,000 | | | | 9,702,708 | |
Oyster Bay NY BAN Series A (GO Revenue) | | | 3.50 | | | | 6-1-2018 | | | | 3,000,000 | | | | 3,013,470 | |
Oyster Bay NY Public Improvement Series B (GO Revenue, AGM Insured) | | | 3.00 | | | | 11-1-2018 | | | | 1,140,000 | | | | 1,150,705 | |
Rockland County NY Public Improvement Series C (GO Revenue, AGM Insured) | | | 3.00 | | | | 5-1-2020 | | | | 1,390,000 | | | | 1,421,122 | |
Rockland County NY Refunding Bond (GO Revenue, Build America Mutual Assurance Company Insured) | | | 3.00 | | | | 2-15-2018 | | | | 2,475,000 | | | | 2,479,356 | |
Rockland County NY Refunding Bond (GO Revenue, Build America Mutual Assurance Company Insured) | | | 3.00 | | | | 2-15-2019 | | | | 1,830,000 | | | | 1,858,219 | |
Rockland County NY Refunding Bond (GO Revenue, Build America Mutual Assurance Company Insured) | | | 3.00 | | | | 2-15-2020 | | | | 630,000 | | | | 642,984 | |
Saratoga County NY Capital Resource Corporation Multifamily Housing Preservation LLC Project (Housing Revenue) | | | 2.00 | | | | 7-1-2020 | | | | 3,250,000 | | | | 3,247,465 | |
Suffolk County NY Judicial Facilities Agency Leases H. Lee Dennison Building (Miscellaneous Revenue) | | | 5.00 | | | | 11-1-2018 | | | | 2,640,000 | | | | 2,705,736 | |
Suffolk County NY Judicial Facilities Agency Leases H. Lee Dennison Building (Miscellaneous Revenue) | | | 5.00 | | | | 11-1-2019 | | | | 2,775,000 | | | | 2,939,058 | |
Suffolk County NY Judicial Facilities Agency Leases H. Lee Dennison Building (Miscellaneous Revenue) | | | 5.00 | | | | 11-1-2020 | | | | 2,915,000 | | | | 3,170,150 | |
Suffolk County NY Public Improvement Series A (GO Revenue) | | | 4.00 | | | | 5-15-2018 | | | | 1,615,000 | | | | 1,629,083 | |
Suffolk County NY Refunding Bond Series A (GO Revenue) | | | 5.00 | | | | 4-1-2018 | | | | 2,700,000 | | | | 2,722,275 | |
Suffolk County NY Refunding Bond Series A (GO Revenue) | | | 5.00 | | | | 4-1-2019 | | | | 1,385,000 | | | | 1,439,431 | |
Suffolk County NY TAN (GO Revenue) | | | 2.50 | | | | 7-25-2018 | | | | 50,000,000 | | | | 50,195,000 | |
| |
| | | | 514,723,203 | |
| | | | | | | | | | | | | | | | |
The accompanying notes are an integral part of these financial statements.
| | | | | | |
| Portfolio of investments—December 31, 2017 (unaudited) | | Wells Fargo Short-Term Municipal Bond Fund | | | 23 | |
| | | | | | | | | | | | | | | | |
| Security name | | Interest rate | | | Maturity date | | | Principal | | | Value | |
| | | | |
| North Carolina: 0.01% | | | | | | | | | | | | | | | | |
North Carolina Eastern Municipal Power Agency Series C (Utilities Revenue, AGC Insured) | | | 6.00 | % | | | 1-1-2019 | | | $ | 250,000 | | | $ | 255,358 | |
| | | | | | | | | | | | | | | | |
| | | | |
| Ohio: 2.27% | | | | | | | | | | | | | | | | |
Cuyahoga OH Metropolitan Housing Authority Carver Park Phase I Project (Housing Revenue) | | | 1.00 | | | | 9-1-2019 | | | | 7,000,000 | | | | 6,963,740 | |
Cuyahoga OH Metropolitan Housing Authority Headquarters Project (Housing Revenue) | | | 1.75 | | | | 3-1-2020 | | | | 5,705,000 | | | | 5,706,255 | |
Lake County OH Lake Hospital System Incorporated (Health Revenue) | | | 5.00 | | | | 8-15-2020 | | | | 905,000 | | | | 973,282 | |
Lancaster OH Port Authority (1 Month LIBOR +0.72%) (Utilities Revenue, Royal Bank of Canada SPA) ± | | | 1.63 | | | | 5-1-2038 | | | | 73,500,000 | | | | 73,547,040 | |
Lorain County OH Port Authority EDA Series A (Health Revenue) | | | 4.00 | | | | 11-15-2018 | | | | 670,000 | | | | 687,119 | |
Lucas OH Metropolitan Housing Authority Certificate of Participation (Housing Revenue) | | | 2.25 | | | | 11-1-2020 | | | | 780,000 | | | | 778,752 | |
Muskingum County OH Hospital Facilities Genesis Healthcare System Project (Health Revenue) | | | 5.00 | | | | 2-15-2018 | | | | 1,000,000 | | | | 1,002,700 | |
Ohio Air Quality Development Authority FirstEnergy Generation Series A (Utilities Revenue) | | | 3.75 | | | | 12-1-2023 | | | | 9,000,000 | | | | 3,981,150 | |
Ohio Air Quality Development Authority Series A (Miscellaneous Revenue) | | | 3.13 | | | | 7-1-2033 | | | | 1,500,000 | | | | 663,615 | |
Ohio Air Quality Development Authority Series B (Industrial Development Revenue) | | | 3.63 | | | | 12-1-2033 | | | | 2,000,000 | | | | 884,340 | |
Ohio Portsmouth Bypass Project (Miscellaneous Revenue) | | | 5.00 | | | | 12-31-2020 | | | | 1,000,000 | | | | 1,097,480 | |
Ohio Portsmouth Bypass Project (Miscellaneous Revenue) | | | 5.00 | | | | 12-31-2021 | | | | 1,205,000 | | | | 1,351,492 | |
Ohio Water Development Authority FirstEnergy Nuclear Generation Project Series B (Water & Sewer Revenue) | | | 4.00 | | | | 12-1-2033 | | | | 8,875,000 | | | | 3,925,590 | |
Ohio Water Development Authority Pollution Control FirstEnergy Nuclear Generation Project (Industrial Development Revenue) | | | 3.75 | | | | 7-1-2033 | | | | 17,950,000 | | | | 7,936,772 | |
Springfield OH (GO Revenue, AGC Insured) | | | 4.00 | | | | 12-1-2020 | | | | 730,000 | | | | 749,688 | |
Warren County OH HCFR Otterbein Homes Series A (Health Revenue) | | | 5.00 | | | | 7-1-2018 | | | | 2,000,000 | | | | 2,037,160 | |
Warren County OH HCFR Otterbein Homes Series A (Health Revenue) | | | 5.00 | | | | 7-1-2019 | | | | 2,215,000 | | | | 2,330,822 | |
| |
| | | | 114,616,997 | |
| | | | | | | | | | | | | | | | |
| | | | |
| Oklahoma: 0.72% | | | | | | | | | | | | | | | | |
Blaine County OK Educational Facilities Authority Watonga Public Schools Project (Miscellaneous Revenue) | | | 5.00 | | | | 12-1-2021 | | | | 945,000 | | | | 1,040,643 | |
Cleveland County OK Educational Facilities Authority Norman Public Schools Project (Miscellaneous Revenue) | | | 5.00 | | | | 7-1-2018 | | | | 2,680,000 | | | | 2,725,640 | |
Cleveland County OK Educational Facilities Authority Norman Public Schools Project (Miscellaneous Revenue) | | | 5.00 | | | | 7-1-2019 | | | | 2,000,000 | | | | 2,096,980 | |
Cleveland County OK Justice Authority Detention Facility Project (Tax Revenue) | | | 4.00 | | | | 3-1-2020 | | | | 500,000 | | | | 512,575 | |
Creek County OK Educational Facilities Authority Sapulpa Public School Project (Miscellaneous Revenue) | | | 5.00 | | | | 9-1-2020 | | | | 2,550,000 | | | | 2,754,128 | |
Grady County OK School Finance Authority Tuttle Public School Project (Miscellaneous Revenue) | | | 5.00 | | | | 9-1-2019 | | | | 1,000,000 | | | | 1,053,460 | |
Grady County OK School Finance Authority Tuttle Public School Project (Miscellaneous Revenue) | | | 5.00 | | | | 9-1-2021 | | | | 1,065,000 | | | | 1,178,817 | |
Oklahoma City OK Industrial & Cultural Facilities Series B (Health Revenue, National Insured) (m)(n) | | | 2.33 | | | | 6-1-2019 | | | | 4,050,000 | | | | 4,035,542 | |
Oklahoma County OK Independent School District #52 Series A (GO Revenue) %% | | | 2.50 | | | | 1-1-2021 | | | | 3,535,000 | | | | 3,578,905 | |
Oklahoma County OK Independent School District #52 Series A (GO Revenue) %% | | | 3.00 | | | | 1-1-2022 | | | | 3,535,000 | | | | 3,654,907 | |
Oklahoma County OK Independent School District #52 Series A (GO Revenue) %% | | | 3.00 | | | | 1-1-2023 | | | | 3,135,000 | | | | 3,260,557 | |
Oklahoma County OK Independent School District #52 Series A (GO Revenue) %% | | | 3.50 | | | | 1-1-2020 | | | | 2,840,000 | | | | 2,918,952 | |
The accompanying notes are an integral part of these financial statements.
| | | | |
| 24 | | Wells Fargo Short-Term Municipal Bond Fund | | Portfolio of investments—December 31, 2017 (unaudited) |
| | | | | | | | | | | | | | | | |
| Security name | | Interest rate | | | Maturity date | | | Principal | | | Value | |
| | | | |
| Oklahoma (continued) | | | | | | | | | | | | | | | | |
Tulsa OK Airports Improvement Trust Series 2013A (Airport Revenue, Build America Mutual Assurance Company Insured) | | | 5.00 | % | | | 6-1-2020 | | | $ | 695,000 | | | $ | 743,657 | |
Tulsa OK Airports Improvement Trust Series 2015A (Airport Revenue, Build America Mutual Assurance Company Insured) | | | 5.00 | | | | 6-1-2020 | | | | 1,000,000 | | | | 1,070,010 | |
Tulsa OK Airports Improvement Trust Series A (Airport Revenue, Build America Mutual Assurance Company Insured) | | | 4.00 | | | | 6-1-2018 | | | | 1,240,000 | | | | 1,249,511 | |
Tulsa OK Airports Improvement Trust Series A (Airport Revenue, Build America Mutual Assurance Company Insured) | | | 5.00 | | | | 6-1-2018 | | | | 530,000 | | | | 536,222 | |
Tulsa OK Airports Improvement Trust Series A (Airport Revenue, Build America Mutual Assurance Company Insured) | | | 5.00 | | | | 6-1-2019 | | | | 3,025,000 | | | | 3,139,406 | |
Tulsa OK Airports Improvement Trust Series B (Airport Revenue, Build America Mutual Assurance Company Insured) | | | 4.00 | | | | 6-1-2018 | | | | 860,000 | | | | 866,596 | |
| |
| | | | 36,416,508 | |
| | | | | | | | | | | | | | | | |
| | | | |
| Other: 0.64% | | | | | | | | | | | | | | | | |
Branch Banking & Trust Municipal Investment Trust Various States Class C (SIFMA Municipal Swap +1.05%) (Miscellaneouw Revenue, Rabobank LOC) 144A± | | | 2.76 | | | | 12-31-2019 | | | | 20,000,000 | | | | 19,996,200 | |
Branch Banking & Trust Municipal Investment Trust Various States Class D (SIFMA Municipal Swap +0.80%) (Miscellaneous Revenue, Rabobank LOC) 144A± | | | 2.51 | | | | 11-15-2019 | | | | 4,221,361 | | | | 4,220,601 | |
Public Housing Capital Fund Trust I (Miscellaneous Revenue, HUD Insured) 144A | | | 4.50 | | | | 7-1-2022 | | | | 6,245,907 | | | | 6,267,580 | |
Public Housing Capital Fund Trust II (Miscellaneous Revenue, HUD Insured) 144A | | | 4.50 | | | | 7-1-2022 | | | | 2,028,289 | | | | 2,039,019 | |
| |
| | | | 32,523,400 | |
| | | | | | | | | | | | | | | | |
| | | | |
| Pennsylvania: 5.65% | | | | | | | | | | | | | | | | |
Allegheny County PA Hospital Development Authority University of Pittsburgh Medical Center Series A-1 (3 Month LIBOR +0.72%) (Health Revenue) ± | | | 1.64 | | | | 2-1-2021 | | | | 2,600,000 | | | | 2,598,362 | |
Beaver County PA IDA Pollution Control FirstEnergy Nuclear Generation Corporation Project Series A (Utilities Revenue) | | | 2.70 | | | | 4-1-2035 | | | | 1,400,000 | | | | 619,458 | |
Beaver County PA IDA Pollution Control FirstEnergy Nuclear Generation Corporation Project Series A (Industrial Development Revenue) | | | 4.00 | | | | 1-1-2035 | | | | 7,500,000 | | | | 3,315,150 | |
Beaver County PA IDA Pollution Control FirstEnergy Nuclear Generation Corporation Project Series B (Industrial Development Revenue) | | | 3.50 | | | | 12-1-2035 | | | | 7,705,000 | | | | 3,406,920 | |
Berks County PA IDA Health System Tower Health Project (Health Revenue) | | | 5.00 | | | | 11-1-2023 | | | | 1,000,000 | | | | 1,148,800 | |
Berks County PA IDA Health System Tower Health Project (Health Revenue) | | | 5.00 | | | | 11-1-2024 | | | | 1,000,000 | | | | 1,166,920 | |
Bethlehem PA Area School District Authority Bethlehem Area School District Refunding Project (1 Month LIBOR +0.49%) (Miscellaneous Revenue) ± | | | 1.59 | | | | 1-1-2030 | | | | 4,990,000 | | | | 4,964,551 | |
Coatesville PA Area School District (GO Revenue, AGM Insured) | | | 5.00 | | | | 8-1-2023 | | | | 1,000,000 | | | | 1,131,610 | |
Delaware County PA Authority Neumann University (Miscellaneous Revenue) | | | 4.00 | | | | 10-1-2021 | | | | 2,620,000 | | | | 2,725,010 | |
Delaware County PA IDA Resource Recovery Facility Series A (Resource Recovery Revenue) | | | 6.20 | | | | 7-1-2019 | | | | 805,000 | | | | 806,980 | |
Delaware Valley PA Regional Finance Authority (Miscellaneous Revenue, Ambac Insured) | | | 5.50 | | | | 8-1-2018 | | | | 2,020,000 | | | | 2,066,056 | |
Erie PA Higher Education Building Authority Mercyhurst College Project (Education Revenue) | | | 5.00 | | | | 3-15-2018 | | | | 380,000 | | | | 382,675 | |
Lackawanna County PA Riverside School District Project (GO Revenue, Build America Mutual Assurance Company Insured) | | | 4.00 | | | | 10-15-2019 | | | | 1,400,000 | | | | 1,450,274 | |
Lackawanna County PA Riverside School District Project (GO Revenue, Build America Mutual Assurance Company Insured) | | | 4.00 | | | | 10-15-2020 | | | | 1,455,000 | | | | 1,528,114 | |
Luzerne County PA RAN (GO Revenue) %% | | | 3.00 | | | | 6-29-2018 | | | | 3,000,000 | | | | 3,010,290 | |
Manheim Township PA School District Series A (1 Month LIBOR +0.47%) (GO Revenue) ± | | | 1.40 | | | | 5-1-2025 | | | | 3,760,000 | | | | 3,758,609 | |
The accompanying notes are an integral part of these financial statements.
| | | | | | |
| Portfolio of investments—December 31, 2017 (unaudited) | | Wells Fargo Short-Term Municipal Bond Fund | | | 25 | |
| | | | | | | | | | | | | | | | |
| Security name | | Interest rate | | | Maturity date | | | Principal | | | Value | |
| | | | |
| Pennsylvania (continued) | | | | | | | | | | | | | | | | |
Montgomery County PA IDA Albert Einstein Healthcare Network Issue Series A (Health Revenue) | | | 5.00 | % | | | 1-15-2018 | | | $ | 1,000,000 | | | $ | 1,000,900 | |
Montgomery County PA IDA Albert Einstein Healthcare Network Issue Series A (Health Revenue) | | | 5.00 | | | | 1-15-2020 | | | | 1,315,000 | | | | 1,380,566 | |
Montgomery County PA IDA Exelon Generation Company LLC (Industrial Development Revenue) | | | 2.50 | | | | 10-1-2030 | | | | 15,795,000 | | | | 15,849,651 | |
Montgomery County PA IDA Peco Energy Company Project Series A (Industrial Development Revenue) | | | 2.50 | | | | 10-1-2030 | | | | 30,000,000 | | | | 30,103,800 | |
Montgomery County PA IDA Peco Energy Company Project Series A (Industrial Development Revenue) | | | 2.60 | | | | 3-1-2034 | | | | 2,125,000 | | | | 2,133,670 | |
Penn Hills PA School District (GO Revenue, Build America Mutual Assurance Company Insured) | | | 5.00 | | | | 11-15-2020 | | | | 825,000 | | | | 884,054 | |
Penn Hills PA School District (GO Revenue, Build America Mutual Assurance Company Insured) | | | 5.00 | | | | 11-15-2021 | | | | 1,275,000 | | | | 1,393,231 | |
Pennsylvania Certificate of Participation (Miscellaneous Revenue, AGM Insured) | | | 2.00 | | | | 11-1-2019 | | | | 1,100,000 | | | | 1,094,302 | |
Pennsylvania Certificate of Participation (Miscellaneous Revenue, AGM Insured) | | | 4.00 | | | | 11-1-2019 | | | | 1,005,000 | | | | 1,035,753 | |
Pennsylvania Economic Development Financing Authority Tapestry Moon Senior Housing Project Series A (Health Revenue) øø | | | 2.25 | | | | 12-1-2053 | | | | 10,000,000 | | | | 10,000,000 | |
Pennsylvania EDFA Bridges Finco LP (Industrial Development Revenue) | | | 5.00 | | | | 12-31-2020 | | | | 1,850,000 | | | | 2,000,442 | |
Pennsylvania EDFA Bridges Finco LP (Industrial Development Revenue) | | | 5.00 | | | | 12-31-2021 | | | | 1,095,000 | | | | 1,209,866 | |
Pennsylvania EDFA Rapid Bridge Replacement Project (Industrial Development Revenue) | | | 4.00 | | | | 6-30-2018 | | | | 6,875,000 | | | | 6,947,325 | |
Pennsylvania EDFA Solid Waste Disposal Republic Services Incorporated Project (Resource Recovery Revenue) øø | | | 1.20 | | | | 6-1-2044 | | | | 5,000,000 | | | | 5,000,000 | |
Pennsylvania EDFA Solid Waste Disposal Series A (Resource Recovery Revenue) | | | 1.70 | | | | 8-1-2037 | | | | 8,000,000 | | | | 8,000,000 | |
Pennsylvania HFA Single Family Series 125A (Housing Revenue) | | | 2.38 | | | | 10-1-2025 | | | | 21,925,000 | | | | 21,755,739 | |
Pennsylvania Public School Building Authority (Miscellaneous Revenue) | | | 5.00 | | | | 4-1-2018 | | | | 2,200,000 | | | | 2,216,082 | |
Pennsylvania Public School Building Authority (Miscellaneous Revenue) | | | 5.00 | | | | 4-1-2019 | | | | 1,220,000 | | | | 1,264,884 | |
Pennsylvania Refunding Bond (GO Revenue) | | | 5.00 | | | | 1-15-2022 | | | | 6,540,000 | | | | 7,285,822 | |
Pennsylvania Turnpike Commission Series B (SIFMA Municipal Swap +1.15%) (Transportation Revenue) ± | | | 2.86 | | | | 12-1-2019 | | | | 18,150,000 | | | | 18,321,518 | |
Pennsylvania Turnpike Commission Series B (SIFMA Municipal Swap +1.27%) (Transportation Revenue) ± | | | 2.98 | | | | 12-1-2020 | | | | 11,300,000 | | | | 11,517,977 | |
Philadelphia PA Authority For Industrial Development Thomas Jefferson University Series B (Education Revenue) ø | | | 1.95 | | | | 9-1-2050 | | | | 12,000,000 | | | | 12,000,000 | |
Philadelphia PA Gas Works 10th Series 1998 General Ordinance (Utilities Revenue, AGM Insured) | | | 5.00 | | | | 7-1-2019 | | | | 2,500,000 | | | | 2,618,950 | |
Philadelphia PA Hospital & HEFAR Temple University Health System Series B (Health Revenue) | | | 5.00 | | | | 7-1-2018 | | | | 8,385,000 | | | | 8,498,533 | |
Philadelphia PA Hospitals & Higher Education Facilities Authority Temple University Health System (Health Revenue) | | | 5.00 | | | | 7-1-2021 | | | | 1,250,000 | | | | 1,350,463 | |
Philadelphia PA Hospitals & Higher Education Facilities Authority Temple University Health System (Health Revenue) | | | 5.00 | | | | 7-1-2022 | | | | 2,000,000 | | | | 2,198,800 | |
Philadelphia PA RDA Transformation Initiative Series B (Miscellaneous Revenue) | | | 5.00 | | | | 4-15-2019 | | | | 2,000,000 | | | | 2,062,180 | |
Philadelphia PA RDA Transformation Initiative Series B (Miscellaneous Revenue) | | | 5.00 | | | | 4-15-2020 | | | | 1,870,000 | | | | 1,990,652 | |
Philadelphia PA School District Series C (GO Revenue) | | | 5.00 | | | | 9-1-2020 | | | | 1,125,000 | | | | 1,202,636 | |
Philadelphia PA School District Series D (GO Revenue) | | | 5.00 | | | | 9-1-2018 | | | | 5,300,000 | | | | 5,403,085 | |
Philadelphia PA School District Series D (GO Revenue) | | | 5.00 | | | | 9-1-2020 | | | | 1,500,000 | | | | 1,603,515 | |
Philadelphia PA School District Series D (GO Revenue) | | | 5.00 | | | | 9-1-2021 | | | | 1,750,000 | | | | 1,911,718 | |
Philadelphia PA School District Series E (GO Revenue, State Aid Withholding Insured) | | | 5.00 | | | | 9-1-2020 | | | | 2,225,000 | | | | 2,378,547 | |
The accompanying notes are an integral part of these financial statements.
| | | | |
| 26 | | Wells Fargo Short-Term Municipal Bond Fund | | Portfolio of investments—December 31, 2017 (unaudited) |
| | | | | | | | | | | | | | | | |
| Security name | | Interest rate | | | Maturity date | | | Principal | | | Value | |
| | | | |
| Pennsylvania (continued) | | | | | | | | | | | | | | | | |
Philadelphia PA School District Series E (GO Revenue) | | | 5.25 | % | | | 9-1-2023 | | | $ | 7,000,000 | | | $ | 7,464,380 | |
Philadelphia PA School District Series F (GO Revenue) | | | 5.00 | | | | 9-1-2020 | | | | 2,750,000 | | | | 2,939,778 | |
Philadelphia PA School District Series F (GO Revenue) | | | 5.00 | | | | 9-1-2021 | | | | 3,500,000 | | | | 3,823,435 | |
Philadelphia PA Series A (GO Revenue) | | | 5.00 | | | | 7-15-2018 | | | | 1,000,000 | | | | 1,017,920 | |
Philadelphia PA Unrefunded Bond Series A (GO Revenue, AGM Insured) | | | 5.00 | | | | 8-1-2019 | | | | 3,420,000 | | | | 3,427,798 | |
Pittsburgh PA Water & Sewer Authority Series C (1 Month LIBOR +0.64%) (Water & Sewer Revenue, AGM Insured) ± | | | 1.74 | | | | 9-1-2040 | | | | 15,000,000 | | | | 14,953,800 | |
Quakertown PA Health Facilities Authority Series A (Health Revenue) | | | 3.13 | | | | 7-1-2021 | | | | 3,250,000 | | | | 3,252,113 | |
Reading PA Parking Authority CAB (Transportation Revenue, National Insured) ¤ | | | 0.00 | | | | 11-15-2019 | | | | 1,000,000 | | | | 953,270 | |
Scranton PA (GO Revenue) | | | 5.00 | | | | 9-1-2020 | | | | 2,205,000 | | | | 2,324,423 | |
Scranton PA RAN (GO Revenue) 144A%% | | | 2.90 | | | | 12-15-2018 | | | | 6,375,000 | | | | 6,203,130 | |
Scranton PA RDA Series A (Miscellaneous Revenue, Municipal Government Guaranty Insured) | | | 5.00 | | | | 11-15-2021 | | | | 2,925,000 | | | | 3,030,797 | |
Scranton PA School District Series A (GO Revenue) | | | 5.00 | | | | 6-1-2021 | | | | 680,000 | | | | 732,700 | |
Scranton PA School District Series A (GO Revenue) | | | 5.00 | | | | 6-1-2022 | | | | 730,000 | | | | 799,365 | |
Scranton PA School District Series A (GO Revenue) | | | 5.00 | | | | 6-1-2023 | | | | 835,000 | | | | 927,952 | |
Scranton PA School District Series B (GO Revenue) | | | 5.00 | | | | 6-1-2021 | | | | 580,000 | | | | 624,950 | |
Scranton PA School District Series B (GO Revenue, National Insured) | | | 5.00 | | | | 6-1-2022 | | | | 870,000 | | | | 954,564 | |
Scranton PA School District Series B (GO Revenue, National Insured) | | | 5.00 | | | | 6-1-2023 | | | | 615,000 | | | | 685,098 | |
Scranton PA School District Series C (GO Revenue) | | | 5.00 | | | | 6-1-2020 | | | | 585,000 | | | | 618,719 | |
Scranton PA School District Series C (GO Revenue) | | | 5.00 | | | | 6-1-2021 | | | | 590,000 | | | | 635,725 | |
Warwick PA School District (GO Revenue) | | | 4.00 | | | | 2-15-2020 | | | | 1,000,000 | | | | 1,046,330 | |
West Mifflin PA School District (GO Revenue, AGM Insured) | | | 5.00 | | | | 10-1-2018 | | | | 605,000 | | | | 620,561 | |
West Mifflin PA School District (GO Revenue, AGM Insured) | | | 5.00 | | | | 10-1-2019 | | | | 750,000 | | | | 792,878 | |
| |
| | | | 285,524,126 | |
| | | | | | | | | | | | | | | | |
| | | | |
| Rhode Island: 0.11% | | | | | | | | | | | | | | | | |
Rhode Island Health & Educational Building Corporation Providence College (Education Revenue) | | | 5.00 | | | | 11-1-2018 | | | | 265,000 | | | | 272,174 | |
Rhode Island Health & Educational Building Corporation Providence Public Schools Program Series A (Miscellaneous Revenue) | | | 5.00 | | | | 5-15-2019 | | | | 1,100,000 | | | | 1,141,514 | |
Rhode Island Health & Educational Building Corporation Tockwotton Home Series 2011 (Health Revenue) | | | 8.38 | | | | 1-1-2046 | | | | 3,000,000 | | | | 3,576,390 | |
Rhode Island Student Loan Authority AMT Series A (Education Revenue) | | | 5.00 | | | | 12-1-2019 | | | | 450,000 | | | | 472,235 | |
| |
| | | | 5,462,313 | |
| | | | | | | | | | | | | | | | |
| | | | |
| South Carolina: 1.17% | | | | | | | | | | | | | | | | |
Connector 2000 Association Incorporated CAB Series A (Transportation Revenue) ¤ | | | 0.00 | | | | 1-1-2018 | | | | 198,490 | | | | 198,490 | |
Lee County SC School Facilities Incorporated Lee County School District Project (Miscellaneous Revenue, AGM Insured) | | | 2.00 | | | | 6-1-2018 | | | | 325,000 | | | | 325,767 | |
Lee County SC School Facilities Incorporated Lee County School District Project (Miscellaneous Revenue, AGM Insured) | | | 3.00 | | | | 12-1-2018 | | | | 390,000 | | | | 395,343 | |
South Carolina Housing Finance & Development Authority Housing Waters Berryhill (Housing Revenue) | | | 1.60 | | | | 12-1-2019 | | | | 7,250,000 | | | | 7,250,290 | |
South Carolina Jobs Economic Development Authority Hospital Facilities Series A (Health Revenue, AGM Insured) | | | 5.25 | | | | 8-1-2021 | | | | 1,000,000 | | | | 1,016,290 | |
South Carolina Jobs EDA East Point Academy Project Series A (Education Revenue) 144A | | | 2.25 | | | | 5-1-2019 | | | | 3,500,000 | | | | 3,479,525 | |
Spartanburg County SC School District #7 BAN (GO Revenue) | | | 5.00 | | | | 11-15-2018 | | | | 45,000,000 | | | | 46,351,800 | |
| |
| | | | 59,017,505 | |
| | | | | | | | | | | | | | | | |
The accompanying notes are an integral part of these financial statements.
| | | | | | |
| Portfolio of investments—December 31, 2017 (unaudited) | | Wells Fargo Short-Term Municipal Bond Fund | | | 27 | |
| | | | | | | | | | | | | | | | |
| Security name | | Interest rate | | | Maturity date | | | Principal | | | Value | |
| | | | |
| Tennessee: 1.10% | | | | | | | | | | | | | | | | |
Memphis-Shelby County TN Airport Authority Series A1 (Airport Revenue) | | | 5.75 | % | | | 7-1-2019 | | | $ | 1,500,000 | | | $ | 1,584,240 | |
Memphis-Shelby County TN Airport Authority Series B (Airport Revenue) | | | 5.38 | | | | 7-1-2018 | | | | 1,000,000 | | | | 1,018,320 | |
Memphis-Shelby County TN Airport Authority Series B (Airport Revenue) | | | 5.50 | | | | 7-1-2019 | | | | 1,505,000 | | | | 1,583,997 | |
Tennessee Energy Acquisition Corporation Series A (Utilities Revenue) | | | 4.00 | | | | 5-1-2048 | | | | 25,000,000 | | | | 27,381,750 | |
Tennessee Energy Acquisition Corporation Series A (Utilities Revenue) | | | 5.25 | | | | 9-1-2018 | | | | 3,400,000 | | | | 3,478,948 | |
Tennessee Energy Acquisition Corporation Series A (Utilities Revenue) | | | 5.25 | | | | 9-1-2019 | | | | 6,225,000 | | | | 6,553,742 | |
Tennessee Energy Acquisition Corporation Series C (Utilities Revenue) | | | 5.00 | | | | 2-1-2018 | | | | 8,895,000 | | | | 8,918,394 | |
Tennessee Energy Acquisition Corporation Series C (Utilities Revenue) | | | 5.00 | | | | 2-1-2019 | | | | 5,110,000 | | | | 5,280,367 | |
| |
| | | | 55,799,758 | |
| | | | | | | | | | | | | | | | |
| | | | |
| Texas: 16.67% | | | | | | | | | | | | | | | | |
Austin TX Affordable Housing Public Facility Corporation Pathways at Georgian Manor (Housing Revenue) | | | 1.15 | | | | 11-1-2019 | | | | 14,040,000 | | | | 14,026,943 | |
Austin TX Affordable PFC Incorporated Multifamily Housing Bridge Cameron Apartments (Housing Revenue) | | | 2.90 | | | | 12-1-2021 | | | | 25,000,000 | | | | 24,967,250 | |
Bexar County TX Housing Finance Corporation Medio Springs Apartments Project. (Housing Revenue) | | | 2.00 | | | | 11-1-2020 | | | | 26,000,000 | | | | 25,999,740 | |
Brownsville TX Independent School District Maintenance Tax Notes (GO Revenue) | | | 4.00 | | | | 8-15-2019 | | | | 7,905,000 | | | | 8,191,003 | |
Central Texas Regional Mobility Authority Series B (Transportation Revenue) | | | 5.00 | | | | 1-1-2045 | | | | 310,000 | | | | 336,307 | |
Central Texas Regional Mobility Authority Subordinate Lien (Transportation Revenue) | | | 5.00 | | | | 1-1-2018 | | | | 250,000 | | | | 250,000 | |
Central Texas Regional Mobility Authority Subordinate Lien (Transportation Revenue) | | | 5.00 | | | | 1-1-2019 | | | | 750,000 | | | | 773,775 | |
Clear Creek TX Independent School District Series B (GO Revenue) | | | 1.35 | | | | 2-15-2038 | | | | 12,000,000 | | | | 11,977,200 | |
Clear Creek TX Independent School District Series B (GO Revenue) | | | 3.00 | | | | 2-15-2032 | | | | 4,445,000 | | | | 4,528,699 | |
Coastal Bend TX Health Facilities Development Corporation (Health Revenue, AGM Insured) (m) | | | 1.95 | | | | 7-1-2031 | | | | 9,500,000 | | | | 9,500,000 | |
Cypress Fairbanks TX School District Series B-1 (GO Revenue) | | | 3.00 | | | | 2-15-2036 | | | | 11,130,000 | | | | 11,339,912 | |
Dallas TX Series A (GO Revenue) | | | 5.00 | | | | 2-15-2019 | | | | 5,000,000 | | | | 5,190,150 | |
Dallas TX Unrefunded Balance Refunding Bond (GO Revenue) | | | 5.00 | | | | 2-15-2021 | | | | 3,580,000 | | | | 3,910,828 | |
Denton TX Independent School District Prerefunded Bond Series A (GO Revenue) | | | 2.00 | | | | 8-1-2042 | | | | 2,790,000 | | | | 2,797,979 | |
Denton TX Independent School District Unlimited Tax School Building Bond Series 2013 (GO Revenue) | | | 2.00 | | | | 8-1-2043 | | | | 7,000,000 | | | | 7,026,250 | |
Denton TX Independent School District Unlimited Tax School Building Bond Series 2014B (GO Revenue) | | | 2.00 | | | | 8-1-2044 | | | | 39,075,000 | | | | 39,189,881 | |
Denton TX Independent School District Unrefunded Bond (GO Revenue) | | | 2.00 | | | | 8-1-2042 | | | | 8,105,000 | | | | 8,120,724 | |
Eagle Mountain & Saginaw TX Independent School District (GO Revenue) | | | 2.00 | | | | 8-1-2050 | | | | 12,150,000 | | | | 12,185,721 | |
Fort Bend TX Independent School District Series C (GO Revenue) | | | 1.35 | | | | 8-1-2042 | | | | 5,750,000 | | | | 5,738,385 | |
Fort Bend TX independent School District Series D (GO Revenue) | | | 1.50 | | | | 8-1-2042 | | | | 11,000,000 | | | | 10,969,420 | |
Georgetown TX Independent School District (GO Revenue) | | | 2.00 | | | | 8-1-2034 | | | | 4,620,000 | | | | 4,628,963 | |
Goose Creek TX Consolidated Independent School District (GO Revenue) | | | 1.35 | | | | 2-15-2040 | | | | 15,160,000 | | | | 15,131,196 | |
Harlandale TX Independent School District (GO Revenue) | | | 2.00 | | | | 8-15-2045 | | | | 22,165,000 | | | | 22,210,882 | |
Harris County TX Health Facilities Development Corporation Series A3 (Health Revenue, AGM Insured) (m) | | | 1.95 | | | | 7-1-2031 | | | | 16,850,000 | | | | 16,850,000 | |
Harris County TX Health Facilities Development Corporation Series A4 (Health Revenue, AGM Insured) (m) | | | 1.95 | | | | 7-1-2031 | | | | 14,025,000 | | | | 14,025,000 | |
Harris County TX Houston Independent School District Series B (GO Revenue) | | | 1.45 | | | | 6-1-2035 | | | | 11,580,000 | | | | 11,525,458 | |
Harris County TX Industrial Development Corporation Deer Park Refining Limited Partnership Project (Resource Recovery Revenue) | | | 4.70 | | | | 5-1-2018 | | | | 29,250,000 | | | | 29,517,345 | |
Harris County TX Refunding Bonds Series A (GO Revenue) | | | 5.00 | | | | 10-1-2021 | | | | 10,000,000 | | | | 10,569,900 | |
The accompanying notes are an integral part of these financial statements.
| | | | |
| 28 | | Wells Fargo Short-Term Municipal Bond Fund | | Portfolio of investments—December 31, 2017 (unaudited) |
| | | | | | | | | | | | | | | | |
| Security name | | Interest rate | | | Maturity date | | | Principal | | | Value | |
| | | | |
| Texas (continued) | | | | | | | | | | | | | | | | |
Houston TX Public Improvement Series A (GO Revenue) | | | 5.00 | % | | | 3-1-2019 | | | $ | 7,000,000 | | | $ | 7,280,000 | |
Houston TX Public Improvement Series A (GO Revenue) | | | 5.00 | | | | 3-1-2020 | | | | 4,000,000 | | | | 4,288,560 | |
Houston TX Public Improvement Series A (GO Revenue) | | | 5.00 | | | | 3-1-2021 | | | | 4,000,000 | | | | 4,403,200 | |
Houston TX Public Improvement Series A (GO Revenue) | | | 5.00 | | | | 3-1-2022 | | | | 5,000,000 | | | | 5,608,650 | |
Houston TX Public Improvement Series A (GO Revenue) | | | 5.00 | | | | 3-1-2023 | | | | 3,500,000 | | | | 4,016,075 | |
Hurst Euless Bedford TX Independent School District Prerefunded Bond (GO Revenue) | | | 5.00 | | | | 8-15-2022 | | | | 2,140,000 | | | | 2,314,795 | |
Hutto TX Independent School District Series 2015 (GO Revenue) | | | 3.00 | | | | 2-1-2055 | | | | 23,425,000 | | | | 24,352,396 | |
Laredo TX Public Property Finance Contractual Obligation Bond (GO Revenue) | | | 3.88 | | | | 2-15-2018 | | | | 725,000 | | | | 726,718 | |
Mansfield TX Independent School District (GO Revenue) | | | 2.50 | | | | 8-1-2042 | | | | 8,250,000 | | | | 8,533,388 | |
Midlothian TX Independent School District Series B (GO Revenue) | | | 2.50 | | | | 8-1-2052 | | | | 5,650,000 | | | | 5,677,120 | |
New Hope TX Cultural Education Facilities Finance Corporation Student Housing Revenue Project Series A (Housing Revenue) | | | 3.25 | | | | 8-1-2019 | | | | 13,000,000 | | | | 13,008,190 | |
North East TX Independent School District (GO Revenue) | | | 2.00 | | | | 8-1-2044 | | | | 8,715,000 | | | | 8,740,622 | |
North East TX Independent School District (GO Revenue) | | | 2.38 | | | | 8-1-2047 | | | | 7,000,000 | | | | 7,129,640 | |
North East TX Independent School District Series A (GO Revenue) | | | 2.00 | | | | 8-1-2042 | | | | 28,330,000 | | | | 28,384,960 | |
North Texas Higher Education Authority Incorporated Student Loan Series 2 Class A (3 Month LIBOR +1.00%) (Education Revenue) ± | | | 2.34 | | | | 4-1-2037 | | | | 5,920,000 | | | | 5,944,805 | |
North Texas Tollway Authority Refunding Bond Series A (SIFMA Municipal Swap +0.80%) (Transportation Revenue) ± | | | 2.51 | | | | 1-1-2050 | | | | 17,250,000 | | | | 17,286,915 | |
North Texas Tollway Authority Series A (Transportation Revenue) | | | 5.00 | | | | 1-1-2020 | | | | 1,050,000 | | | | 1,115,111 | |
North Texas Tollway Authority Series A (Transportation Revenue) | | | 5.00 | | | | 1-1-2021 | | | | 1,860,000 | | | | 2,029,334 | |
North Texas Tollway Authority Special Projects System Series A (Transportation Revenue) | | | 6.00 | | | | 9-1-2041 | | | | 3,500,000 | | | | 4,003,755 | |
North Texas Tollway Authority Special Projects System Series D (Transportation Revenue) | | | 5.00 | | | | 9-1-2024 | | | | 1,790,000 | | | | 1,991,357 | |
North Texas Tollway Authority Special Projects System Series D (Transportation Revenue) | | | 5.00 | | | | 9-1-2028 | | | | 4,335,000 | | | | 4,822,644 | |
North Texas Tollway Authority Special Projects System Series D (Transportation Revenue) | | | 5.25 | | | | 9-1-2025 | | | | 3,840,000 | | | | 4,305,792 | |
North Texas Tollway Authority Special Projects System Series D (Transportation Revenue) | | | 5.25 | | | | 9-1-2026 | | | | 3,980,000 | | | | 4,462,774 | |
Northside TX Independent School District Building Project (GO Revenue) | | | 1.65 | | | | 8-1-2045 | | | | 6,650,000 | | | | 6,649,601 | |
Northside TX Independent School District Building Project (GO Revenue) | | | 1.75 | | | | 6-1-2032 | | | | 6,730,000 | | | | 6,651,663 | |
Northside TX Independent School District Building Project (GO Revenue) | | | 2.00 | | | | 8-1-2044 | | | | 21,195,000 | | | | 21,257,313 | |
Northside TX Independent School District Building Project (GO Revenue) | | | 2.00 | | | | 6-1-2046 | | | | 8,400,000 | | | | 8,416,464 | |
Northside TX Independent School District Series A (GO Revenue) | | | 2.00 | | | | 6-1-2039 | | | | 4,115,000 | | | | 4,128,662 | |
Odessa TX Housing Finance Corporation 87th Street Apartments Project (Housing Revenue, FHA Insured) | | | 1.43 | | | | 12-1-2020 | | | | 7,500,000 | | | | 7,500,300 | |
Pasadena TX Independent School District Building Project Series B (GO Revenue) | | | 3.00 | | | | 2-15-2044 | | | | 45,060,000 | | | | 46,018,877 | |
Pflugerville TX Independent School District Prerefunded Bond (GO Revenue) | | | 2.00 | | | | 8-15-2039 | | | | 7,665,000 | | | | 7,721,031 | |
Pflugerville TX Independent School District Prerefunded Bond School Building Series A (GO Revenue) | | | 2.00 | | | | 8-15-2039 | | | | 4,830,000 | | | | 4,865,307 | |
Pflugerville TX Independent School District Unrefunded Bond (GO Revenue) | | | 2.00 | | | | 8-15-2039 | | | | 15,205,000 | | | | 15,250,767 | |
Port Arthur TX Navigation District Jefferson County Environmental Facilities Motiva Enterprises LLC Project Series C (Resource Recovery Revenue) ø | | | 1.56 | | | | 4-1-2040 | | | | 31,000,000 | | | | 31,000,000 | |
Port Arthur TX Navigation District Motiva Enterprises LLC Project Series A (Resource Recovery Revenue) ø | | | 1.55 | | | | 4-1-2040 | | | | 9,775,000 | | | | 9,775,000 | |
Port Arthur TX Navigation District Motiva Enterprises LLC Project Subordinate Series D (Resource Recovery Revenue) ø | | | 1.55 | | | | 11-1-2040 | | | | 10,000,000 | | | | 10,000,000 | |
Sabine River TX Authority PCR Southwestern Electric Company (Industrial Development Revenue, National Insured) | | | 4.95 | | | | 3-1-2018 | | | | 13,000,000 | | | | 13,070,720 | |
The accompanying notes are an integral part of these financial statements.
| | | | | | |
| Portfolio of investments—December 31, 2017 (unaudited) | | Wells Fargo Short-Term Municipal Bond Fund | | | 29 | |
| | | | | | | | | | | | | | | | |
| Security name | | Interest rate | | | Maturity date | | | Principal | | | Value | |
| | | | |
| Texas (continued) | | | | | | | | | | | | | | | | |
San Antonio TX Energy Acquisition Public Facility Corporation (Utilities Revenue) | | | 5.25 | % | | | 8-1-2018 | | | $ | 510,000 | | | $ | 520,389 | |
San Antonio TX Junior Lien Series A (Utilities Revenue) | | | 2.00 | | | | 12-1-2027 | | | | 20,320,000 | | | | 20,367,346 | |
San Antonio TX Junior Lien Series B (Utilities Revenue) | | | 1.75 | | | | 12-1-2027 | | | | 11,000,000 | | | | 11,000,880 | |
San Antonio TX Junior Lien Series C (Utilities Revenue) | | | 3.00 | | | | 12-1-2045 | | | | 13,495,000 | | | | 13,807,949 | |
San Antonio TX Junior Lien Series D (Utilities Revenue) | | | 3.00 | | | | 12-1-2045 | | | | 12,000,000 | | | | 12,538,680 | |
San Antonio TX Series A (Utilities Revenue) | | | 2.25 | | | | 2-1-2033 | | | | 24,350,000 | | | | 24,573,046 | |
San Antonio TX Water System Junior Lien Series B (Water & Sewer Revenue) | | | 2.00 | | | | 5-1-2044 | | | | 5,500,000 | | | | 5,502,475 | |
Tarrant County TX ECFA Hendrick Medical Center Group (Health Revenue) | | | 5.00 | | | | 9-1-2019 | | | | 655,000 | | | | 688,805 | |
Tarrant County TX ECFA Hendrick Medical Center Group (Health Revenue) | | | 5.00 | | | | 9-1-2020 | | | | 920,000 | | | | 990,463 | |
Tarrant County TX ECFA Hendrick Medical Center Group (Health Revenue) | | | 5.00 | | | | 11-15-2020 | | | | 1,045,000 | | | | 1,116,509 | |
Tender Option Bond Trust Receipts/Floater Certificates Series 2017-XM0560 (Transportation Revenue, Bank of America NA LIQ) 144Aø | | | 0.54 | | | | 1-1-2048 | | | | 2,000,000 | | | | 2,000,000 | |
Tender Option Bond Trust Receipts/Floater Certificates Series 2017-XM0561 (Transportation Revenue, Bank of America NA LIQ) 144Aø | | | 0.54 | | | | 1-1-2048 | | | | 2,000,000 | | | | 2,000,000 | |
Texas A&M University System Permanent University Series A (Education Revenue) | | | 5.00 | | | | 7-1-2021 | | | | 4,870,000 | | | | 5,413,005 | |
Texas Municipal Gas Acquisition & Supply Corporation III (Utilities Revenue) | | | 5.00 | | | | 12-15-2018 | | | | 4,500,000 | | | | 4,638,015 | |
Texas Municipal Gas Acquisition & Supply Corporation III (Utilities Revenue) | | | 5.00 | | | | 12-15-2019 | | | | 7,000,000 | | | | 7,395,430 | |
Texas Northside Independent School District (GO Revenue) | | | 1.45 | | | | 6-1-2047 | | | | 4,000,000 | | | | 3,968,040 | |
Texas PFA Southern University Financing System (Education Revenue, Build America Mutual Assurance Company Insured) | | | 5.00 | | | | 11-1-2018 | | | | 3,395,000 | | | | 3,482,082 | |
Texas PFA Southern University Financing System (Education Revenue, Build America Mutual Assurance Company Insured) | | | 5.00 | | | | 11-1-2019 | | | | 2,375,000 | | | | 2,512,323 | |
Texas Veterans Bond Series D (Miscellaneous Revenue, FHLB SPA) ø | | | 1.65 | | | | 6-1-2045 | | | | 8,030,000 | | | | 8,030,000 | |
Tomball TX Independent School District Series B2 (GO Revenue) | | | 3.00 | | | | 2-15-2039 | | | | 10,410,000 | | | | 10,495,154 | |
Travis County TX Health Facilities Development corporation Longhorn Village Project Series A (Health Revenue) | | | 7.13 | | | | 1-1-2046 | | | | 845,000 | | | | 971,328 | |
University of Texas Financing System Refunding Bonds Series C (Education Revenue) | | | 5.00 | | | | 8-15-2022 | | | | 3,000,000 | | | | 3,429,120 | |
Walnut Creek TX Special Utility District (Water & Sewer Revenue, Build America Mutual Assurance Company Insured) | | | 4.00 | | | | 1-10-2018 | | | | 640,000 | | | | 640,326 | |
Walnut Creek TX Special Utility District (Water & Sewer Revenue, Build America Mutual Assurance Company Insured) | | | 4.00 | | | | 1-10-2019 | | | | 1,010,000 | | | | 1,036,068 | |
Walnut Creek TX Special Utility District (Water & Sewer Revenue, Build America Mutual Assurance Company Insured) | | | 4.00 | | | | 1-10-2020 | | | | 500,000 | | | | 520,705 | |
| |
| | | | 841,849,555 | |
| | | | | | | | | | | | | | | | |
| | | | |
| Vermont: 0.09% | | | | | | | | | | | | | | | | |
Vermont Student Assistance Corporation Series B Class-A1 (3 Month LIBOR +1.50%) (Education Revenue) ± | | | 3.00 | | | | 6-1-2022 | | | | 4,783,848 | | | | 4,795,377 | |
| | | | | | | | | | | | | | | | |
| | | | |
| Virgin Islands: 0.07% | | | | | | | | | | | | | | | | |
Virgin Islands PFA Matching Funding Loan Series A (Tax Revenue) | | | 6.75 | | | | 10-1-2019 | | | | 835,000 | | | | 613,725 | |
Virgin Islands PFA Senior Lien Matching Fund Loan Note Series B (Tax Revenue) | | | 5.00 | | | | 10-1-2018 | | | | 2,985,000 | | | | 2,712,619 | |
Virgin Islands PFA Series A (Tax Revenue) | | | 5.00 | | | | 10-1-2018 | | | | 415,000 | | | | 377,131 | |
| |
| | | | 3,703,475 | |
| | | | | | | | | | | | | | | | |
| | | | |
| Virginia: 1.50% | | | | | | | | | | | | | | | | |
Greater Richmond VA Convention Center Authority (Tax Revenue) | | | 5.00 | | | | 6-15-2019 | | | | 1,250,000 | | | | 1,310,475 | |
Greater Richmond VA Convention Center Authority (Tax Revenue) | | | 5.00 | | | | 6-15-2020 | | | | 1,000,000 | | | | 1,076,100 | |
Halifax County VA IDA (Utilities Revenue) | | | 2.15 | | | | 12-1-2041 | | | | 55,950,000 | | | | 56,252,690 | |
The accompanying notes are an integral part of these financial statements.
| | | | |
| 30 | | Wells Fargo Short-Term Municipal Bond Fund | | Portfolio of investments—December 31, 2017 (unaudited) |
| | | | | | | | | | | | | | | | |
| Security name | | Interest rate | | | Maturity date | | | Principal | | | Value | |
| | | | |
| Virginia (continued) | | | | | | | | | | | | | | | | |
Lexington VA IDA Kendal at Lexington (Health Revenue) | | | 3.00 | % | | | 1-1-2019 | | | $ | 320,000 | | | $ | 323,040 | |
Lexington VA IDA Kendal at Lexington (Health Revenue) | | | 3.00 | | | | 1-1-2020 | | | | 450,000 | | | | 457,074 | |
Lexington VA IDA Kendal at Lexington (Health Revenue) | | | 4.00 | | | | 1-1-2021 | | | | 440,000 | | | | 461,133 | |
Lexington VA IDA Kendal at Lexington (Health Revenue) | | | 4.00 | | | | 1-1-2022 | | | | 525,000 | | | | 554,967 | |
Marquis VA CDA CAB (Tax Revenue) 144A | | | 7.50 | | | | 9-1-2045 | | | | 680,000 | | | | 479,794 | |
Marquis VA CDA CAB Series A (Tax Revenue) | | | 5.10 | | | | 9-1-2036 | | | | 2,169,000 | | | | 1,509,125 | |
Marquis VA CDA CAB Series C (Tax Revenue) ¤ | | | 0.00 | | | | 9-1-2041 | | | | 3,493,000 | | | | 455,243 | |
Newport News VA Redevelopment & Housing Authority Multifamily Housing Series A (Housing Revenue) | | | 1.82 | | | | 11-1-2020 | | | | 9,500,000 | | | | 9,493,065 | |
Virginia Commonwealth Transportation Board Refunding Bonds Series A (Miscellaneous Revenue) | | | 5.00 | | | | 5-15-2023 | | | | 1,500,000 | | | | 1,740,300 | |
Washington VA County IDA Series C (Health Revenue) | | | 7.25 | | | | 7-1-2019 | | | | 1,355,000 | | | | 1,425,609 | |
| |
| | | | 75,538,615 | |
| | | | | | | | | | | | | | | | |
| | | | |
| Washington: 0.88% | | | | | | | | | | | | | | | | |
District of Columbia HFA Multifamily Housing Maplewood Courts Apartments Project (Housing Revenue) | | | 1.80 | | | | 2-1-2020 | | | | 11,310,000 | | | | 11,297,672 | |
Washington HCFR Catholic Health Initiatives Series B (SIFMA Municipal Swap +1.00%) (Health Revenue) ± | | | 2.71 | | | | 1-1-2035 | | | | 8,650,000 | | | | 8,607,529 | |
Washington Health Care Facilities Authority (Health Revenue) | | | 5.00 | | | | 2-1-2023 | | | | 1,025,000 | | | | 1,109,306 | |
Washington Health Care Facilities Authority Fred Hutchinson Cancer Research (1 Month LIBOR +1.10%) (Health Revenue) ± | | | 2.15 | | | | 1-1-2042 | | | | 9,500,000 | | | | 9,491,260 | |
Washington Health Care Facilities Authority Series 2015 (Health Revenue) | | | 5.00 | | | | 7-1-2020 | | | | 850,000 | | | | 904,902 | |
Washington Housing finance Commission Multifamily Housing Series A (Housing Revenue) | | | 1.80 | | | | 7-1-2020 | | | | 7,350,000 | | | | 7,334,271 | |
Washington Series A (GO Revenue) | | | 5.00 | | | | 8-1-2022 | | | | 4,800,000 | | | | 5,485,632 | |
| |
| | | | 44,230,572 | |
| | | | | | | | | | | | | | | | |
| | | | |
| West Virginia: 0.05% | | | | | | | | | | | | | | | | |
West Virginia EDA PCR Appalachian Power Company Series D (Resource Recovery Revenue) | | | 3.25 | | | | 5-1-2019 | | | | 2,745,000 | | | | 2,774,564 | |
| | | | | | | | | | | | | | | | |
| | | | |
| Wisconsin: 2.47% | | | | | | | | | | | | | | | | |
Milwaukee WI RAN Series M-11 (Miscellaneous Revenue) | | | 5.00 | | | | 9-27-2018 | | | | 40,000,000 | | | | 41,051,200 | |
Milwaukee WI RDA Public Schools Refunding Bond Series A (Miscellaneous Revenue) | | | 5.00 | | | | 8-1-2018 | | | | 4,770,000 | | | | 4,862,300 | |
Milwaukee WI RDA Wisconsin Housing Preservation Corporation (Housing Revenue, Johnson Bank LOC) ø | | | 2.10 | | | | 12-1-2038 | | | | 2,060,000 | | | | 2,060,000 | |
Waukesha County WI Anticipation Notes Series C (Miscellaneous Revenue) | | | 3.00 | | | | 5-1-2022 | | | | 3,035,000 | | | | 3,085,745 | |
Waukesha County WI Series B (Miscellaneous Revenue) | | | 3.00 | | | | 5-1-2021 | | | | 17,400,000 | | | | 17,476,734 | |
Wisconsin Airport Facilities PFA Senior Obligation Group Series B (Airport Revenue) | | | 5.00 | | | | 7-1-2022 | | | | 11,910,000 | | | | 12,646,157 | |
Wisconsin HEFA Ascension Health Alliance Series B (Health Revenue) | | | 4.00 | | | | 11-15-2043 | | | | 13,000,000 | | | | 13,399,490 | |
Wisconsin HEFA Benevolent Corporation Cedar Community (Health Revenue) | | | 5.00 | | | | 6-1-2019 | | | | 635,000 | | | | 655,968 | |
Wisconsin HEFA Benevolent Corporation Cedar Community (Health Revenue) | | | 5.00 | | | | 6-1-2020 | | | | 880,000 | | | | 925,443 | |
Wisconsin HEFA Mercy Alliance Incorporated Project Series A (Health Revenue) | | | 5.00 | | | | 6-1-2019 | | | | 1,005,000 | | | | 1,032,225 | |
Wisconsin HEFA Vernon Memorial Healthcare Incorporated (Health Revenue) | | | 4.00 | | | | 3-1-2018 | | | | 300,000 | | | | 300,726 | |
Wisconsin HEFA Vernon Memorial Healthcare Incorporated (Health Revenue) | | | 4.00 | | | | 3-1-2019 | | | | 445,000 | | | | 452,374 | |
Wisconsin HEFA Vernon Memorial Healthcare Incorporated (Health Revenue) | | | 5.00 | | | | 3-1-2020 | | | | 375,000 | | | | 394,156 | |
Wisconsin Housing & EDA President House Project (Housing Revenue, Associated Trust Company NA LOC) ø | | | 1.85 | | | | 8-1-2046 | | | | 1,635,000 | | | | 1,635,000 | |
Wisconsin PFA Guilford College (Education Revenue) | | | 5.00 | | | | 1-1-2021 | | | | 650,000 | | | | 693,693 | |
Wisconsin PFA Guilford College (Education Revenue) | | | 5.00 | | | | 1-1-2022 | | | | 625,000 | | | | 676,131 | |
The accompanying notes are an integral part of these financial statements.
| | | | | | |
| Portfolio of investments—December 31, 2017 (unaudited) | | Wells Fargo Short-Term Municipal Bond Fund | | | 31 | |
| | | | | | | | | | | | | | | | |
| Security name | | Interest rate | | | Maturity date | | | Principal | | | Value | |
| | | | |
| Wisconsin (continued) | | | | | | | | | | | | | | | | |
Wisconsin PFA Loan Anticipation Notes Lake Oconee Academy Foundation Incorporated Project (Education Revenue) | | | 2.30 | % | | | 10-1-2019 | | | $ | 4,000,000 | | | $ | 3,993,120 | |
Wisconsin PFA Series A-2 (Resource Recovery Revenue) øø | | | 1.25 | | | | 10-1-2025 | | | | 19,200,000 | | | | 19,170,432 | |
| |
| | | | 124,510,894 | |
| | | | | | | | | | | | | | | | |
| | | | |
| Wyoming: 0.18% | | | | | | | | | | | | | | | | |
Sweetwater County WY PCR Pacificorp Projects Series A (Utilities Revenue) ø | | | 1.71 | | | | 12-1-2020 | | | | 9,335,000 | | | | 9,335,000 | |
| | | | | | | | | | | | | | | | |
| |
Total Municipal Obligations (Cost $5,015,579,025) | | | | 4,998,569,032 | |
| | | | | | | | | | | | | | | | |
| | | | |
Other: 1.36% | | | | | | | | | | | | | | | | |
Eaton Vance Municipal Income Trust (SIFMA Municipal Swap +1.50%) ±144A§ | | | 3.21 | | | | 9-1-2019 | | | | 23,000,000 | | | | 23,001,380 | |
Nuveen California AMT-Free Quality Municipal Income Fund Preferred Shares Series A 144Aøø§ | | | 2.01 | | | | 10-1-2047 | | | | 20,400,000 | | | | 20,400,000 | |
Western Asset Managed Municipal Fund Incorporated AMT Series 1 144Aøø§ | | | 1.86 | | | | 5-31-2018 | | | | 25,000,000 | | | | 25,000,000 | |
| |
Total Other (Cost $68,400,000) | | | | 68,401,380 | |
| | | | | | | | | | | | | | | | |
| | | | | | | | |
| Total investments in securities (Cost $5,083,979,025) | | | 100.32 | % | | | 5,066,970,412 | |
Other assets and liabilities, net | | | (0.32 | ) | | | (15,973,148 | ) |
| | | | | | | | |
| Total net assets | | | 100.00 | % | | $ | 5,050,997,264 | |
| | | | | | | | |
| 144A | The security may be resold in transactions exempt from registration, normally to qualified institutional buyers, pursuant to Rule 144A under the Securities Act of 1933. |
| øø | The interest rate is determined and reset by the issuer periodically depending upon the terms of the security. The rate shown is the rate in effect at period end. |
| ± | Variable rate investment. The rate shown is the rate in effect at period end. |
| ø | Variable rate demand notes are subject to a demand feature which reduces the effective maturity. The maturity date shown represents the final maturity date of the security. The interest rate is determined and reset by the issuer daily, weekly, or monthly depending upon the terms of the security. The rate shown is the rate in effect at period end. |
| ## | All or a portion of this security is segregated for when-issued securities. |
| ¤ | The security is issued in zero coupon form with no periodic interest payments. |
| (m) | The security is an auction-rate security which has an interest rate that resets at predetermined short-term intervals through a Dutch auction. The rate shown is the rate in effect at period end. |
| %% | The security is issued on a when-issued basis. |
| (n) | The auction to set the interest rate on the security failed at period end due to insufficient investor interest. A failed auction does not itself cause a default. |
| § | The security is subject to a demand feature which reduces the effective maturity. |
Investments in Affiliates
An affiliated investment is an investment in which the Fund owns at least 5% of the outstanding voting shares of the issuer or as a result of other relationships, such as the Fund and the issuer having the same investment manager. Transactions with issuers that were either affiliates of the Fund at the beginning of the period or the end of the period were as follows:
| | | | | | | | | | | | | | | | | | | | | | | | | | | | | | | | | | | | |
| | | Shares,
beginning of
period | | | Shares
purchased | | | Shares
sold | | | Shares,
end of
period | | | Net
realized
gains | | | Net
change in
unrealized
gains
(losses) | | | Income
from
affiliated
securities | | | Value,
end
of period | | | % of
net
assets | |
Short-Term Investments | | | | | | | | | | | | | | | | | | | | | | | | | | | | | | | | | | | | |
Investment Companies | | | | | | | | | | | | | | | | | | | | | | | | | | | | | | | | | | | | |
Wells Fargo Municipal Cash Management Money Market Fund Institutional Class | | | 23,294,140 | | | | 857,956,933 | | | | 881,251,073 | | | | 0 | | | $ | 31,122 | | | $ | 0 | | | $ | 172,962 | | | $ | 0 | | | | 0 | % |
The accompanying notes are an integral part of these financial statements.
| | | | |
| 32 | | Wells Fargo Short-Term Municipal Bond Fund | | Statement of assets and liabilities—December 31, 2017 (unaudited) |
| | | | |
| | | | |
| |
Assets | | | | |
Investments in unaffiliated securities, at value (cost $5,083,979,025) | | $ | 5,066,970,412 | |
Cash | | | 18,628,185 | |
Receivable for investments sold | | | 1,797,254 | |
Receivable for Fund shares sold | | | 11,473,942 | |
Receivable for interest | | | 32,320,137 | |
Prepaid expenses and other assets | | | 25,698 | |
| | | | |
Total assets | | | 5,131,215,628 | |
| | | | |
| |
Liabilities | | | | |
Payable for Fund shares redeemed | | | 47,620,516 | |
Payable for investments purchased | | | 28,872,565 | |
Dividends payable | | | 1,405,591 | |
Management fee payable | | | 1,183,664 | |
Administration fees payable | | | 466,785 | |
Distribution fee payable | | | 37,154 | |
Trustees’ fees and expenses payable | | | 2,032 | |
Accrued expenses and other liabilities | | | 630,057 | |
| | | | |
Total liabilities | | | 80,218,364 | |
| | | | |
Total net assets | | $ | 5,050,997,264 | |
| | | | |
| |
NET ASSETS CONSIST OF | | | | |
Paid-in capital | | $ | 5,088,375,269 | |
Undistributed net investment income | | | 230,929 | |
Accumulated net realized losses on investments | | | (20,600,321 | ) |
Net unrealized losses on investments | | | (17,008,613 | ) |
| | | | |
Total net assets | | $ | 5,050,997,264 | |
| | | | |
| |
COMPUTATION OF NET ASSET VALUE AND OFFERING PRICE PER SHARE | | | | |
Net assets – Class A | | $ | 1,388,687,361 | |
Shares outstanding – Class A1 | | | 141,082,858 | |
Net asset value per share – Class A | | | $9.84 | |
Maximum offering price per share – Class A2 | | | $10.04 | |
Net assets – Class C | | $ | 55,585,427 | |
Shares outstanding – Class C1 | | | 5,646,755 | |
Net asset value per share – Class C | | | $9.84 | |
Net assets – Administrator Class | | $ | 56,161,897 | |
Shares outstanding – Administrator Class1 | | | 5,701,863 | |
Net asset value per share – Administrator Class | | | $9.85 | |
Net assets – Institutional Class | | $ | 3,550,562,579 | |
Shares outstanding – Institutional Class1 | | | 360,036,281 | |
Net asset value per share – Institutional Class | | | $9.86 | |
| 1 | The Fund has an unlimited number of authorized shares. |
| 2 | Maximum offering price is computed as 100/98 of net asset value. On investments of $50,000 or more, the offering price is reduced. |
The accompanying notes are an integral part of these financial statements.
| | | | | | |
| Statement of operations—six months ended December 31, 2017 (unaudited) | | Wells Fargo Short-Term Municipal Bond Fund | | | 33 | |
| | | | |
| | | | |
| |
Investment income | | | | |
Interest | | $ | 48,374,190 | |
Income from affiliated securities | | | 172,962 | |
| | | | |
Total investment income | | | 48,547,152 | |
| | | | |
| |
Expenses | | | | |
Management fee | | | 8,606,909 | |
Administration fees | | | | |
Class A | | | 1,224,154 | |
Class C | | | 47,860 | |
Administrator Class | | | 33,328 | |
Institutional Class | | | 1,435,032 | |
Shareholder servicing fees | | | | |
Class A | | | 1,912,741 | |
Class C | | | 74,782 | |
Administrator Class | | | 83,320 | |
Distribution fee | | | | |
Class C | | | 224,345 | |
Custody and accounting fees | | | 109,890 | |
Professional fees | | | 40,895 | |
Registration fees | | | 196,217 | |
Shareholder report expenses | | | 290,521 | |
Trustees’ fees and expenses | | | 10,645 | |
Other fees and expenses | | | 84,773 | |
| | | | |
Total expenses | | | 14,375,412 | |
Less: Fee waivers and/or expense reimbursements | | | (1,767,381 | ) |
| | | | |
Net expenses | | | 12,608,031 | |
| | | | |
Net investment income | | | 35,939,121 | |
| | | | |
| |
REALIZED AND UNREALIZED GAINS (LOSSES) ON INVESTMENTS | | | | |
| |
Net realized gains (losses) on: | | | | |
Unaffiliated securities | | | (15,767,695 | ) |
Affiliated securities | | | 31,122 | |
| | | | |
Net realized losses on investments | | | (15,736,573 | ) |
Net change in unrealized gains (losses) on investments | | | 12,306,448 | |
| | | | |
Net realized and unrealized gains (losses) on investments | | | (3,430,125 | ) |
| | | | |
Net increase in net assets resulting from operations | | $ | 32,508,996 | |
| | | | |
The accompanying notes are an integral part of these financial statements.
| | | | |
| 34 | | Wells Fargo Short-Term Municipal Bond Fund | | Statement of changes in net assets |
| | | | | | | | | | | | | | | | |
| | | Six months ended
December 31, 2017 (unaudited) | | | Year ended
June 30, 2017 | |
| | | | |
Operations | | | | | | | | | | | | | | | | |
Net investment income | | | | | | $ | 35,939,121 | | | | | | | $ | 75,079,481 | |
Net realized losses on investments | | | | | | | (15,736,573 | ) | | | | | | | (4,903,030 | ) |
Net change in unrealized gains (losses) on investments | | | | | | | 12,306,448 | | | | | | | | (63,765,678 | ) |
| | | | |
Net increase in net assets resulting from operations | | | | | | | 32,508,996 | | | | | | | | 6,410,773 | |
| | | | |
| | | | |
Distributions to shareholders from | | | | | | | | | | | | | | | | |
Net investment income | | | | | | | | | | | | | | | | |
Class A | | | | | | | (9,342,877 | ) | | | | | | | (26,881,369 | ) |
Class C | | | | | | | (141,377 | ) | | | | | | | (357,182 | ) |
Administrator Class | | | | | | | (416,604 | ) | | | | | | | (1,047,967 | ) |
Institutional Class | | | | | | | (26,040,386 | ) | | | | | | | (46,799,622 | ) |
| | | | |
Total distributions to shareholders | | | | | | | (35,941,244 | ) | | | | | | | (75,086,140 | ) |
| | | | |
| | | | |
Capital share transactions | | | Shares | | | | | | | | Shares | | | | | |
Proceeds from shares sold | | | | | | | | | | | | | | | | |
Class A | | | 9,789,605 | | | | 96,638,539 | | | | 47,087,343 | | | | 466,462,041 | |
Class C | | | 156,870 | | | | 1,548,257 | | | | 365,633 | | | | 3,610,903 | |
Administrator Class | | | 1,064,023 | | | | 10,514,762 | | | | 3,644,235 | | | | 36,019,668 | |
Institutional Class | | | 78,550,150 | | | | 777,168,208 | | | | 250,417,118 | | | | 2,483,765,001 | |
| | | | |
| | | | | | | 885,869,766 | | | | | | | | 2,989,857,613 | |
| | | | |
Reinvestment of distributions | | | | | | | | | | | | | | | | |
Class A | | | 901,680 | | | | 8,898,140 | | | | 2,631,572 | | | | 25,991,952 | |
Class C | | | 12,820 | | | | 126,524 | | | | 32,008 | | | | 315,831 | |
Administrator Class | | | 41,371 | | | | 408,616 | | | | 105,008 | | | | 1,037,474 | |
Institutional Class | | | 1,914,751 | | | | 18,931,915 | | | | 3,246,381 | | | | 32,092,838 | |
| | | | |
| | | | | | | 28,365,195 | | | | | | | | 59,438,095 | |
| | | | |
Payment for shares redeemed | | | | | | | | | | | | | | | | |
Class A | | | (34,089,206 | ) | | | (336,436,806 | ) | | | (222,685,934 | ) | | | (2,205,141,871 | ) |
Class C | | | (898,434 | ) | | | (8,869,009 | ) | | | (2,262,738 | ) | | | (22,325,473 | ) |
Administrator Class | | | (2,366,154 | ) | | | (23,370,849 | ) | | | (6,327,055 | ) | | | (62,516,576 | ) |
Institutional Class | | | (67,732,864 | ) | | | (669,580,139 | ) | | | (132,881,297 | ) | | | (1,312,656,176 | ) |
| | | | |
| | | | | | | (1,038,256,803 | ) | | | | | | | (3,602,640,096 | ) |
| | | | |
Net decrease in net assets resulting from capital share transactions | | | | | | | (124,021,842 | ) | | | | | | | (553,344,388 | ) |
| | | | |
Total decrease in net assets | | | | | | | (127,454,090 | ) | | | | | | | (622,019,755 | ) |
| | | | |
| | | | |
Net assets | | | | | | | | | | | | | | | | |
Beginning of period | | | | | | | 5,178,451,354 | | | | | | | | 5,800,471,109 | |
| | | | |
End of period | | | | | | $ | 5,050,997,264 | | | | | | | $ | 5,178,451,354 | |
| | | | |
Undistributed net investment income | | | | | | $ | 230,929 | | | | | | | $ | 233,052 | |
| | | | |
The accompanying notes are an integral part of these financial statements.
| | | | | | |
| Financial highlights | | Wells Fargo Short-Term Municipal Bond Fund | | | 35 | |
(For a share outstanding throughout each period)
| | | | | | | | | | | | | | | | | | | | | | | | |
| | | Six months ended
December 31, 2017 (unaudited) | | | Year ended June 30 | |
| CLASS A | | | 2017 | | | 2016 | | | 2015 | | | 2014 | | | 2013 | |
Net asset value, beginning of period | | | $9.85 | | | | $9.96 | | | | $9.93 | | | | $10.00 | | | | $9.97 | | | | $10.01 | |
Net investment income | | | 0.06 | | | | 0.12 | | | | 0.11 | | | | 0.09 | | | | 0.11 | | | | 0.11 | |
Net realized and unrealized gains (losses) on investments | | | (0.01 | ) | | | (0.11 | ) | | | 0.04 | | | | (0.06 | ) | | | 0.05 | | | | 0.00 | 1 |
| | | | | | | | | | | | | | | | | | | | | | | | |
Total from investment operations | | | 0.05 | | | | 0.01 | | | | 0.15 | | | | 0.03 | | | | 0.16 | | | | 0.11 | |
Distributions to shareholders from | | | | | | | | | | | | | | | | | | | | | | | | |
Net investment income | | | (0.06 | ) | | | (0.12 | ) | | | (0.11 | ) | | | (0.09 | ) | | | (0.11 | ) | | | (0.11 | ) |
Net realized gains | | | 0.00 | | | | 0.00 | | | | (0.01 | ) | | | (0.01 | ) | | | (0.02 | ) | | | (0.04 | ) |
| | | | | | | | | | | | | | | | | | | | | | | | |
Total distributions to shareholders | | | (0.06 | ) | | | (0.12 | ) | | | (0.12 | ) | | | (0.10 | ) | | | (0.13 | ) | | | (0.15 | ) |
Net asset value, end of period | | | $9.84 | | | | $9.85 | | | | $9.96 | | | | $9.93 | | | | $10.00 | | | | $9.97 | |
Total return2 | | | 0.52 | % | | | 0.14 | % | | | 1.49 | % | | | 0.27 | % | | | 1.55 | % | | | 1.07 | % |
Ratios to average net assets (annualized) | | | | | | | | | | | | | | | | | | | | | | | | |
Gross expenses | | | 0.77 | % | | | 0.76 | % | | | 0.75 | % | | | 0.75 | % | | | 0.76 | % | | | 0.77 | % |
Net expenses | | | 0.63 | % | | | 0.63 | % | | | 0.62 | % | | | 0.60 | % | | | 0.60 | % | | | 0.60 | % |
Net investment income | | | 1.22 | % | | | 1.23 | % | | | 1.11 | % | | | 0.89 | % | | | 1.08 | % | | | 1.10 | % |
Supplemental data | | | | | | | | | | | | | | | | | | | | | | | | |
Portfolio turnover rate | | | 18 | % | | | 23 | % | | | 16 | % | | | 24 | % | | | 28 | % | | | 39 | % |
Net assets, end of period (000s omitted) | | | $1,388,687 | | | | $1,619,974 | | | | $3,362,147 | | | | $2,228,977 | | | | $2,031,798 | | | | $1,620,994 | |
| 1 | Amount is less than $0.005. |
| 2 | Total return calculations do not include any sales charges. Returns for periods of less than one year are not annualized. |
The accompanying notes are an integral part of these financial statements.
| | | | |
| 36 | | Wells Fargo Short-Term Municipal Bond Fund | | Financial highlights |
(For a share outstanding throughout each period)
| | | | | | | | | | | | | | | | | | | | | | | | |
| | | Six months ended
December 31, 2017 (unaudited) | | | Year ended June 30 | |
| CLASS C | | | 2017 | | | 2016 | | | 2015 | | | 2014 | | | 2013 | |
Net asset value, beginning of period | | | $9.85 | | | | $9.96 | | | | $9.93 | | | | $10.00 | | | | $9.97 | | | | $10.01 | |
Net investment income | | | 0.02 | | | | 0.05 | | | | 0.04 | | | | 0.01 | | | | 0.03 | | | | 0.04 | |
Net realized and unrealized gains (losses) on investments | | | (0.01 | ) | | | (0.11 | ) | | | 0.04 | | | | (0.06 | ) | | | 0.05 | | | | 0.00 | 1 |
| | | | | | | | | | | | | | | | | | | | | | | | |
Total from investment operations | | | 0.01 | | | | (0.06 | ) | | | 0.08 | | | | (0.05 | ) | | | 0.08 | | | | 0.04 | |
Distributions to shareholders from | | | | | | | | | | | | | | | | | | | | | | | | |
Net investment income | | | (0.02 | ) | | | (0.05 | ) | | | (0.04 | ) | | | (0.01 | ) | | | (0.03 | ) | | | (0.04 | ) |
Net realized gains | | | 0.00 | | | | 0.00 | | | | (0.01 | ) | | | (0.01 | ) | | | (0.02 | ) | | | (0.04 | ) |
| | | | | | | | | | | | | | | | | | | | | | | | |
Total distributions to shareholders | | | (0.02 | ) | | | (0.05 | ) | | | (0.05 | ) | | | (0.02 | ) | | | (0.05 | ) | | | (0.08 | ) |
Net asset value, end of period | | | $9.84 | | | | $9.85 | | | | $9.96 | | | | $9.93 | | | | $10.00 | | | | $9.97 | |
Total return2 | | | 0.14 | % | | | (0.61 | )% | | | 0.73 | % | | | (0.48 | )% | | | 0.79 | % | | | 0.32 | % |
Ratios to average net assets (annualized) | | | | | | | | | | | | | | | | | | | | | | | | |
Gross expenses | | | 1.52 | % | | | 1.51 | % | | | 1.50 | % | | | 1.50 | % | | | 1.51 | % | | | 1.52 | % |
Net expenses | | | 1.38 | % | | | 1.38 | % | | | 1.37 | % | | | 1.35 | % | | | 1.35 | % | | | 1.35 | % |
Net investment income | | | 0.47 | % | | | 0.49 | % | | | 0.35 | % | | | 0.14 | % | | | 0.34 | % | | | 0.37 | % |
Supplemental data | | | | | | | | | | | | | | | | | | | | | | | | |
Portfolio turnover rate | | | 18 | % | | | 23 | % | | | 16 | % | | | 24 | % | | | 28 | % | | | 39 | % |
Net assets, end of period (000s omitted) | | | $55,585 | | | | $62,796 | | | | $82,111 | | | | $103,146 | | | | $133,463 | | | | $172,364 | |
| 1 | Amount is less than $0.005. |
| 2 | Total return calculations do not include any sales charges. Returns for periods of less than one year are not annualized. |
The accompanying notes are an integral part of these financial statements.
| | | | | | |
| Financial highlights | | Wells Fargo Short-Term Municipal Bond Fund | | | 37 | |
(For a share outstanding throughout each period)
| | | | | | | | | | | | | | | | | | | | | | | | |
| | | Six months ended
December 31, 2017 (unaudited) | | | Year ended June 30 | |
| ADMINISTRATOR CLASS | | | 2017 | | | 2016 | | | 2015 | | | 2014 | | | 2013 | |
Net asset value, beginning of period | | | $9.86 | | | | $9.97 | | | | $9.95 | | | | $10.03 | | | | $9.99 | | | | $10.03 | |
Net investment income | | | 0.06 | | | | 0.13 | | | | 0.11 | 1 | | | 0.09 | | | | 0.11 | | | | 0.11 | |
Net realized and unrealized gains (losses) on investments | | | (0.01 | ) | | | (0.11 | ) | | | 0.03 | | | | (0.07 | ) | | | 0.06 | | | | 0.00 | 2 |
| | | | | | | | | | | | | | | | | | | | | | | | |
Total from investment operations | | | 0.05 | | | | 0.02 | | | | 0.14 | | | | 0.02 | | | | 0.17 | | | | 0.11 | |
Distributions to shareholders from | | | | | | | | | | | | | | | | | | | | | | | | |
Net investment income | | | (0.06 | ) | | | (0.13 | ) | | | (0.11 | ) | | | (0.09 | ) | | | (0.11 | ) | | | (0.11 | ) |
Net realized gains | | | 0.00 | | | | 0.00 | | | | (0.01 | ) | | | (0.01 | ) | | | (0.02 | ) | | | (0.04 | ) |
| | | | | | | | | | | | | | | | | | | | | | | | |
Total distributions to shareholders | | | (0.06 | ) | | | (0.13 | ) | | | (0.12 | ) | | | (0.10 | ) | | | (0.13 | ) | | | (0.15 | ) |
Net asset value, end of period | | | $9.85 | | | | $9.86 | | | | $9.97 | | | | $9.95 | | | | $10.03 | | | | $9.99 | |
Total return3 | | | 0.53 | % | | | 0.17 | % | | | 1.42 | % | | | 0.17 | % | | | 1.65 | % | | | 1.07 | % |
Ratios to average net assets (annualized) | | | | | | | | | | | | | | | | | | | | | | | | |
Gross expenses | | | 0.71 | % | | | 0.70 | % | | | 0.66 | % | | | 0.68 | % | | | 0.70 | % | | | 0.71 | % |
Net expenses | | | 0.60 | % | | | 0.60 | % | | | 0.59 | % | | | 0.60 | % | | | 0.60 | % | | | 0.60 | % |
Net investment income | | | 1.25 | % | | | 1.27 | % | | | 1.08 | % | | | 0.89 | % | | | 1.08 | % | | | 1.07 | % |
Supplemental data | | | | | | | | | | | | | | | | | | | | | | | | |
Portfolio turnover rate | | | 18 | % | | | 23 | % | | | 16 | % | | | 24 | % | | | 28 | % | | | 39 | % |
Net assets, end of period (000s omitted) | | | $56,162 | | | | $68,621 | | | | $95,121 | | | | $511,894 | | | | $565,737 | | | | $547,806 | |
| 1 | Calculated based upon average shares outstanding |
| 2 | Amount is less than $0.005. |
| 3 | Returns for periods of less than one year are not annualized. |
The accompanying notes are an integral part of these financial statements.
| | | | |
| 38 | | Wells Fargo Short-Term Municipal Bond Fund | | Financial highlights |
(For a share outstanding throughout each period)
| | | | | | | | | | | | | | | | | | | | | | | | |
| | | Six months ended
December 31, 2017 (unaudited) | | | Year ended June 30 | |
| INSTITUTIONAL CLASS | | | 2017 | | | 2016 | | | 2015 | | | 2014 | | | 2013 | |
Net asset value, beginning of period | | | $9.87 | | | | $9.98 | | | | $9.95 | | | | $10.02 | | | | $9.99 | | | | $10.02 | |
Net investment income | | | 0.07 | | | | 0.15 | | | | 0.13 | | | | 0.11 | | | | 0.13 | | | | 0.13 | |
Net realized and unrealized gains (losses) on investments | | | (0.01 | ) | | | (0.11 | ) | | | 0.04 | | | | (0.06 | ) | | | 0.05 | | | | 0.01 | |
| | | | | | | | | | | | | | | | | | | | | | | | |
Total from investment operations | | | 0.06 | | | | 0.04 | | | | 0.17 | | | | 0.05 | | | | 0.18 | | | | 0.14 | |
Distributions to shareholders from | | | | | | | | | | | | | | | | | | | | | | | | |
Net investment income | | | (0.07 | ) | | | (0.15 | ) | | | (0.13 | ) | | | (0.11 | ) | | | (0.13 | ) | | | (0.13 | ) |
Net realized gains | | | 0.00 | | | | 0.00 | | | | (0.01 | ) | | | (0.01 | ) | | | (0.02 | ) | | | (0.04 | ) |
| | | | | | | | | | | | | | | | | | | | | | | | |
Total distributions to shareholders | | | (0.07 | ) | | | (0.15 | ) | | | (0.14 | ) | | | (0.12 | ) | | | (0.15 | ) | | | (0.17 | ) |
Net asset value, end of period | | | $9.86 | | | | $9.87 | | | | $9.98 | | | | $9.95 | | | | $10.02 | | | | $9.99 | |
Total return1 | | | 0.63 | % | | | 0.37 | % | | | 1.71 | % | | | 0.47 | % | | | 1.75 | % | | | 1.37 | % |
Ratios to average net assets (annualized) | | | | | | | | | | | | | | | | | | | | | | | | |
Gross expenses | | | 0.44 | % | | | 0.43 | % | | | 0.42 | % | | | 0.42 | % | | | 0.43 | % | | | 0.45 | % |
Net expenses | | | 0.40 | % | | | 0.40 | % | | | 0.40 | % | | | 0.40 | % | | | 0.40 | % | | | 0.40 | % |
Net investment income | | | 1.45 | % | | | 1.48 | % | | | 1.33 | % | | | 1.09 | % | | | 1.29 | % | | | 1.30 | % |
Supplemental data | | | | | | | | | | | | | | | | | | | | | | | | |
Portfolio turnover rate | | | 18 | % | | | 23 | % | | | 16 | % | | | 24 | % | | | 28 | % | | | 39 | % |
Net assets, end of period (000s omitted) | | | $3,550,563 | | | | $3,427,060 | | | | $2,261,092 | | | | $1,895,713 | | | | $1,382,576 | | | | $1,185,687 | |
| 1 | Returns for periods of less than one year are not annualized. |
The accompanying notes are an integral part of these financial statements.
| | | | | | |
| Notes to financial statements (unaudited) | | Wells Fargo Short-Term Municipal Bond Fund | | | 39 | |
1. ORGANIZATION
Wells Fargo Funds Trust (the “Trust”), a Delaware statutory trust organized on March 10, 1999, is an open-end management investment company registered under the Investment Company Act of 1940, as amended (the “1940 Act”). As an investment company, the Trust follows the accounting and reporting guidance in Financial Accounting Standards Board Accounting Standards Codification Topic 946, Financial Services – Investment Companies. These financial statements report on the Wells Fargo Short-Term Municipal Bond Fund (the “Fund”) which is a diversified series of the Trust.
2. SIGNIFICANT ACCOUNTING POLICIES
The following significant accounting policies, which are consistently followed in the preparation of the financial statements of the Fund, are in conformity with U.S. generally accepted accounting principles which require management to make estimates and assumptions that affect the reported amounts of assets and liabilities, disclosure of contingent assets and liabilities at the date of the financial statements, and the reported amounts of revenues and expenses during the reporting period. Actual results could differ from those estimates.
Securities valuation
All investments are valued each business day as of the close of regular trading on the New York Stock Exchange (generally 4 p.m. Eastern Time), although the Fund may deviate from this calculation time under unusual or unexpected circumstances.
Debt securities are valued at the evaluated bid price provided by an independent pricing service or, if a reliable price is not available, the quoted bid price from an independent broker-dealer.
Futures that are listed on a foreign or domestic exchange or market are valued at the official closing price or, if none, the last sales price.
Investments in registered open-end investment companies are valued at net asset value.
Investments which are not valued using any of the methods discussed above are valued at their fair value, as determined in good faith by the Board of Trustees of the Fund. The Board of Trustees has established a Valuation Committee comprised of the Trustees and has delegated to it the authority to take any actions regarding the valuation of portfolio securities that the Valuation Committee deems necessary or appropriate, including determining the fair value of portfolio securities, unless the determination has been delegated to the Management Valuation Team of Wells Fargo Funds Management, LLC (“Funds Management”). The Board of Trustees retains the authority to make or ratify any valuation decisions or approve any changes to the Valuation Procedures as it deems appropriate. On a quarterly basis, the Board of Trustees receives reports on any valuation actions taken by the Valuation Committee or the Management Valuation Team which may include items for ratification.
Valuations of fair valued securities are compared to the next actual sales price when available, or other appropriate market values, to assess the continued appropriateness of the fair valuation methodologies used. These securities are fair valued on a day-to-day basis, taking into consideration changes to appropriate market information and any significant changes to the inputs considered in the valuation process until there is a readily available price provided on an exchange or by an independent pricing service. Valuations received from an independent pricing service or independent broker-dealer quotes are periodically validated by comparisons to most recent trades and valuations provided by other independent pricing services in addition to the review of prices by the manager and/or subadviser. Unobservable inputs used in determining fair valuations are identified based on the type of security, taking into consideration factors utilized by market participants in valuing the investment, knowledge about the issuer and the current market environment.
When-issued transactions
The Fund may purchase securities on a forward commitment or when-issued basis. The Fund records a when-issued transaction on the trade date and will segregate assets in an amount at least equal in value to the Fund’s commitment to purchase when-issued securities. Securities purchased on a when-issued basis are marked-to-market daily and the Fund begins earning interest on the settlement date. Losses may arise due to changes in the market value of the underlying securities or if the counterparty does not perform under the contract.
Futures contracts
The Fund is subject to interest rate risk in the normal course of pursuing its investment objectives. The Fund may buy and sell futures contracts in order to gain exposure to, or protect against, changes in interest rates. The primary risks associated with the use of futures contracts are the imperfect correlation between changes in market values of securities held by the Fund and the prices of futures contracts, and the possibility of an illiquid market.
The aggregate principal amounts of the contracts are not recorded in the financial statements. Fluctuations in the value of the contracts are recorded in the Statement of Assets and Liabilities as an asset or liability and in the Statement of
| | | | |
| 40 | | Wells Fargo Short-Term Municipal Bond Fund | | Notes to financial statements (unaudited) |
Operations as unrealized gains or losses until the contracts are closed, at which point they are recorded as net realized gains or losses on futures contracts. With futures contracts, there is minimal counterparty risk to the Fund since futures are exchange traded and the exchange’s clearing house, as counterparty to all exchange traded futures, guarantees the futures against default.
Security transactions and income recognition
Securities transactions are recorded on a trade date basis. Realized gains or losses are recorded on the basis of identified cost.
Interest income is accrued daily and bond discounts are accreted and premiums are amortized daily based on the effective interest method. To the extent debt obligations are placed on non-accrual status, any related interest income may be reduced by writing off interest receivables when the collection of all or a portion of interest has been determined to be doubtful based on consistently applied procedures and the fair value has decreased. If the issuer subsequently resumes interest payments or when the collectability of interest is reasonably assured, the debt obligation is removed from non-accrual status.
Distributions to shareholders
Distributions to shareholders from net investment income are accrued daily and paid monthly. Distributions from net realized gains, if any, are recorded on the ex-dividend date. Such distributions are determined in accordance with income tax regulations and may differ from U.S. generally accepted accounting principles. Dividend sources are estimated at the time of declaration. The tax character of distributions is determined as of the Fund’s fiscal year end. Therefore, a portion of the Fund’s distributions made prior to the Fund’s fiscal year end may be categorized as a tax return of capital.
Federal and other taxes
The Fund intends to continue to qualify as a regulated investment company by distributing substantially all of its investment company taxable and tax-exempt income and any net realized capital gains (after reduction for capital loss carryforwards) sufficient to relieve it from all, or substantially all, federal income taxes. Accordingly, no provision for federal income taxes was required.
The Fund’s income and federal excise tax returns and all financial records supporting those returns for the prior three fiscal years are subject to examination by the federal and Delaware revenue authorities. Management has analyzed the Fund’s tax positions taken on federal, state, and foreign tax returns for all open tax years and does not believe that there are any uncertain tax positions that require recognition of a tax liability.
As of December 31, 2017, the aggregate cost of all investments for federal income tax purposes was $5,083,972,361 and the unrealized gains (losses) consisted of:
| | | | |
Gross unrealized gains | | $ | 16,764,949 | |
Gross unrealized losses | | | (33,766,898 | ) |
Net unrealized losses | | $ | (17,001,949 | ) |
As of June 30, 2017, the Fund had capital loss carryforwards which consisted of $4,822,983 in long-term capital losses.
Class allocations
The separate classes of shares offered by the Fund differ principally in applicable sales charges, distribution, shareholder servicing, and administration fees. Class specific expenses are charged directly to that share class. Investment income, common expenses, and realized and unrealized gains (losses) on investments are allocated daily to each class of shares based on the relative proportion of net assets of each class.
3. FAIR VALUATION MEASUREMENTS
Fair value measurements of investments are determined within a framework that has established a fair value hierarchy based upon the various data inputs utilized in determining the value of the Fund’s investments. The three-level hierarchy gives the highest priority to unadjusted quoted prices in active markets for identical assets or liabilities (Level 1) and the lowest priority to unobservable inputs (Level 3). The Fund’s investments are classified within the fair value hierarchy based on the lowest level of input that is significant to the fair value measurement. The inputs are summarized into three broad levels as follows:
| ∎ | | Level 1 – quoted prices in active markets for identical securities |
| ∎ | | Level 2 – other significant observable inputs (including quoted prices for similar securities, interest rates, prepayment speeds, credit risk, etc.) |
| | | | | | |
| Notes to financial statements (unaudited) | | Wells Fargo Short-Term Municipal Bond Fund | | | 41 | |
| ∎ | | Level 3 – significant unobservable inputs (including the Fund’s own assumptions in determining the fair value of investments) |
The inputs or methodologies used for valuing investments in securities are not necessarily an indication of the risk associated with investing in those securities.
The following is a summary of the inputs used in valuing the Fund’s assets and liabilities as of December 31, 2017:
| | | | | | | | | | | | | | | | |
| | | Quoted prices
(Level 1) | | | Other significant
observable inputs
(Level 2) | | | Significant
unobservable inputs (Level 3) | | | Total | |
Assets | | | | | | | | | | | | | | | | |
Investments in: | | | | | | | | | | | | | | | | |
| | | | |
Municipal obligations | | $ | 0 | | | $ | 4,998,569,032 | | | $ | 0 | | | $ | 4,998,569,032 | |
Other | | | 0 | | | | 68,401,380 | | | | 0 | | | | 68,401,380 | |
Total assets | | $ | 0 | | | $ | 5,066,970,412 | | | $ | 0 | | | $ | 5,066,970,412 | |
The Fund recognizes transfers between levels within the fair value hierarchy at the end of the reporting period. At December 31, 2017, the Fund did not have any transfers into/out of Level 1, Level 2, or Level 3.
4. TRANSACTIONS WITH AFFILIATES
Management fee
Funds Management, an indirect wholly owned subsidiary of Wells Fargo & Company (“Wells Fargo”), is the manager of the Fund and provides advisory and fund-level administrative services under an investment management agreement. Under the investment management agreement, Funds Management is responsible for, among other services, implementing the investment objectives and strategies of the Fund, supervising the subadviser, providing fund-level administrative services in connection with the Fund’s operations, and providing any other fund-level administrative services reasonably necessary for the operation of the Fund. As compensation for its services under the investment management agreement, Funds Management is entitled to receive an annual management fee starting at 0.35% and declining to 0.255% as the average daily net assets of the Fund increase. For the six months ended December 31, 2017, the management fee was equivalent to an annual rate of 0.33% of the Fund’s average daily net assets.
Funds Management has retained the services of a subadviser to provide daily portfolio management to the Fund. The fee for subadvisory services is borne by Funds Management. Wells Capital Management Incorporated, an affiliate of Funds Management and an indirect wholly owned subsidiary of Wells Fargo, is the subadviser to the Fund and is entitled to receive a fee from Funds Management at an annual rate starting at 0.15% and declining to 0.05% as the average daily net assets of the Fund increase.
Administration fees
Under a class-level administration agreement, Funds Management provides class-level administrative services to the Fund, which includes paying fees and expenses for services provided by the transfer agent, sub-transfer agents, omnibus account servicers and record-keepers. As compensation for its services under the class-level administration agreement, Funds Management receives an annual fee which is calculated based on the average daily net assets of each class as follows:
| | | | |
| | | Class-level
administration fee | |
Class A, Class C | | | 0.16 | % |
Administrator Class | | | 0.10 | |
Institutional Class | | | 0.08 | |
Funds Management has contractually waived and/or reimbursed management and administration fees to the extent necessary to maintain certain net operating expense ratios for the Fund. Waiver of fees and/or reimbursement of expenses by Funds Management were made first from fund level expenses on a proportionate basis and then from class specific expenses. Funds Management has committed through October 31, 2018 to waive fees and/or reimburse expenses to the extent necessary to cap the Fund’s expenses at 0.63% for Class A shares, 1.38% for Class C shares, 0.60% for Administrator Class shares, and 0.40% for Institutional Class shares. After this time, the cap may be increased or the commitment to maintain the cap may be terminated only with the approval of the Board of Trustees.
| | | | |
| 42 | | Wells Fargo Short-Term Municipal Bond Fund | | Notes to financial statements (unaudited) |
Distribution fee
The Trust has adopted a distribution plan for Class C shares of the Fund pursuant to Rule 12b-1 under the 1940 Act. A distribution fee is charged to Class C shares and paid to Wells Fargo Funds Distributor, LLC (“Funds Distributor”), the principal underwriter, at an annual rate of 0.75% of the average daily net assets of Class C shares.
In addition, Funds Distributor is entitled to receive the front-end sales charge from the purchase of Class A shares and a contingent deferred sales charge on the redemption of certain Class A shares. Funds Distributor is also entitled to receive the contingent deferred sales charges from redemptions of Class C shares. For the six months ended December 31, 2017, Funds Distributor received $824 from the sale of Class A shares and $12 in contingent deferred sales charges from redemptions of Class C shares. No contingent deferred sales charges were incurred by Class A for the six months ended December 31, 2017.
Shareholder servicing fees
The Trust has entered into contracts with one or more shareholder servicing agents, whereby Class A, Class C, and Administrator Class of the Fund are charged a fee at an annual rate of 0.25% of the average daily net assets of each respective class.
A portion of these total shareholder servicing fees were paid to affiliates of Wells Fargo.
Interfund transactions
The Fund may purchase or sell portfolio investment securities to certain other Wells Fargo affiliates pursuant to Rule 17a-7 under the 1940 Act and under procedures adopted by the Board of Trustees. The procedures have been designed to ensure that these interfund transactions, which do not incur broker commissions, are effected at current market prices. Pursuant to these procedures, the Fund had $148,240,000 and $374,405,000 in interfund purchases and sales, respectively, during the six months ended December 31, 2017.
5. INVESTMENT PORTFOLIO TRANSACTIONS
Purchases and sales of investments, excluding U.S. government obligations (if any) and short-term securities, for the six months ended December 31, 2017 were $1,422,861,289 and $765,541,555, respectively.
6. BANK BORROWINGS
The Trust (excluding the money market funds and certain other funds) and Wells Fargo Variable Trust are parties to a $280,000,000 revolving credit agreement whereby the Fund is permitted to use bank borrowings for temporary or emergency purposes, such as to fund shareholder redemption requests. Interest under the credit agreement is charged to the Fund based on a borrowing rate equal to the higher of the Federal Funds rate in effect on that day plus 1.25% or the overnight LIBOR rate in effect on that day plus 1.25%. In addition, an annual commitment fee equal to 0.25% of the unused balance is allocated to each participating fund. Prior to August 29, 2017, the revolving credit agreement amount was $250,000,000.
For the six months ended December 31, 2017, there were no borrowings by the Fund under the agreement.
7. INDEMNIFICATION
Under the Trust’s organizational documents, the officers and Trustees have been granted certain indemnification rights against certain liabilities that may arise out of performance of their duties to the Trust. Additionally, in the normal course of business, the Trust may enter into contracts with service providers that contain a variety of indemnification clauses. The Trust’s maximum exposure under these arrangements is dependent on future claims that may be made against the Fund and, therefore, cannot be estimated.
| | | | | | |
| Other information (unaudited) | | Wells Fargo Short-Term Municipal Bond Fund | | | 43 | |
PROXY VOTING INFORMATION
A description of the policies and procedures that the Fund uses to determine how to vote proxies relating to portfolio securities is available, upon request, by calling 1-800-222-8222, visiting our website at wellsfargofunds.com, or visiting the SEC website at sec.gov. Information regarding how the Fund voted proxies relating to portfolio securities during the most recent 12-month period ended June 30 is available on the Fund’s website at wellsfargofunds.com or by visiting the SEC website at sec.gov.
PORTFOLIO HOLDINGS INFORMATION
The complete portfolio holdings for the Fund are publicly available monthly on the Fund’s website (wellsfargofunds.com), on a one-month delayed basis. In addition, top ten holdings information (excluding derivative positions) for the Fund is publicly available on the Fund’s website on a monthly, seven-day or more delayed basis. The Fund files its complete schedule of portfolio holdings with the SEC for the first and third quarters of each fiscal year on Form N-Q, which is available by visiting the SEC website at sec.gov. In addition, the Fund’s Form N-Q may be reviewed and copied at the SEC’s Public Reference Room in Washington, DC, and at regional offices in New York City, at 233 Broadway, and in Chicago, at 175 West Jackson Boulevard, Suite 900. Information about the Public Reference Room may be obtained by calling 1-800-SEC-0330.
| | | | |
| 44 | | Wells Fargo Short-Term Municipal Bond Fund | | Other information (unaudited) |
BOARD OF TRUSTEES AND OFFICERS
Each of the Trustees and Officers1 listed in the table below acts in identical capacities for each fund in the Wells Fargo family of funds, which consists of 153 mutual funds comprising the Wells Fargo Funds Trust, Wells Fargo Variable Trust, Wells Fargo Master Trust and four closed-end funds (collectively the “Fund Complex”). This table should be read in conjunction with the Prospectus and the Statement of Additional Information2. The mailing address of each Trustee and Officer is 525 Market Street, 12th Floor, San Francisco, CA 94105. Each Trustee and Officer serves an indefinite term, however, each Trustee serves such term until reaching the mandatory retirement age established by the Trustees.
Independent Trustees
| | | | | | |
Name and year of birth | | Position held and length of service* | | Principal occupations during past five years or longer | | Current other public company or investment company
directorships |
William R. Ebsworth (Born 1957) | | Trustee, since 2015 | | Retired. From 1984 to 2013, equities analyst, portfolio manager, research director and chief investment officer at Fidelity Management and Research Company in Boston, Tokyo, and Hong Kong, and retired in 2013 as Chief Investment Officer of Fidelity Strategic Advisers, Inc. where he led a team of investment professionals managing client assets. Prior thereto, Board member of Hong Kong Securities Clearing Co., Hong Kong Options Clearing Corp., the Thailand International Fund, Ltd., Fidelity Investments Life Insurance Company, and Empire Fidelity Investments Life Insurance Company. Board member of the Forté Foundation (non-profit organization) and the Vincent Memorial Hospital Endowment (non-profit organization), where he serves on the Investment Committee and as a Chair of the Audit Committee. Mr. Ebsworth is a CFA® charterholder. | | Asset Allocation Trust |
Jane A. Freeman** (Born 1953) | | Trustee, since 2015; Chair Liaison, since 2018 | | Retired. From 2012 to 2014 and 1999 to 2008, Chief Financial Officer of Scientific Learning Corporation. From 2008 to 2012, Ms. Freeman provided consulting services related to strategic business projects. Prior to 1999, Portfolio Manager at Rockefeller & Co. and Scudder, Stevens & Clark. Board member of the Harding Loevner Funds from 1996 to 2014, serving as both Lead Independent Director and chair of the Audit Committee. Board member of the Russell Exchange Traded Funds Trust from 2011 to 2012 and the chair of the Audit Committee. Ms. Freeman is a Board Member of Ruth Bancroft Garden (non-profit organization) and the Glimmerglass Festival. She is also an inactive Chartered Financial Analyst. | | Asset Allocation Trust |
Peter G. Gordon*** (Born 1942) | | Trustee, since 1998; Chairman, from 2005 to 2017 | | Co-Founder, Retired Chairman, President and CEO of Crystal Geyser Water Company. Trustee Emeritus, Colby College. | | Asset Allocation Trust |
Isaiah Harris, Jr. (Born 1952) | | Trustee, since 2009 | | Retired. Chairman of the Board of CIGNA Corporation since 2009, and Director since 2005. From 2003 to 2011, Director of Deluxe Corporation. Prior thereto, President and CEO of BellSouth Advertising and Publishing Corp. from 2005 to 2007, President and CEO of BellSouth Enterprises from 2004 to 2005 and President of BellSouth Consumer Services from 2000 to 2003. Emeritus member of the Iowa State University Foundation Board of Governors. Emeritus Member of the Advisory Board of Iowa State University School of Business. Advisory Board Member, Palm Harbor Academy (charter school). Advisory Board Member, Child Evangelism Fellowship (non-profit). Mr. Harris is a certified public accountant (inactive status). | | CIGNA Corporation; Asset Allocation Trust |
Judith M. Johnson (Born 1949) | | Trustee, since 2008; Audit Committee Chairman, since 2008 | | Retired. Prior thereto, Chief Executive Officer and Chief Investment Officer of Minneapolis Employees Retirement Fund from 1996 to 2008. Ms. Johnson is an attorney, certified public accountant and a certified managerial accountant. | | Asset Allocation Trust |
David F. Larcker (Born 1950) | | Trustee, since 2009 | | James Irvin Miller Professor of Accounting at the Graduate School of Business, Stanford University, Director of the Corporate Governance Research Initiative and Senior Faculty of The Rock Center for Corporate Governance since 2006. From 2005 to 2008, Professor of Accounting at the Graduate School of Business, Stanford University. Prior thereto, Ernst & Young Professor of Accounting at The Wharton School, University of Pennsylvania from 1985 to 2005. | | Asset Allocation Trust |
| | | | | | |
| Other information (unaudited) | | Wells Fargo Short-Term Municipal Bond Fund | | | 45 | |
| | | | | | |
Name and year of birth | | Position held and length of service* | | Principal occupations during past five years or longer | | Current other public company or investment company
directorships |
Olivia S. Mitchell**** (Born 1953) | | Trustee, since 2006; Governance Committee Chairman, since 2018 | | International Foundation of Employee Benefit Plans Professor, Wharton School of the University of Pennsylvania since 1993. Director of Wharton’s Pension Research Council and Boettner Center on Pensions & Retirement Research, and Research Associate at the National Bureau of Economic Research. Previously, Cornell University Professor from 1978 to 1993. | | Asset Allocation Trust |
Timothy J. Penny***** (Born 1951) | | Trustee, since 1996; Chairman, since 2018; Vice Chairman, from 2017 to 2018 | | President and Chief Executive Officer of Southern Minnesota Initiative Foundation, a non-profit organization, since 2007. Member of the Board of Trustees of NorthStar Education Finance, Inc., a non-profit organization, since 2007. | | Asset Allocation Trust |
James G. Polisson****** (Born 1959) | | Trustee, since 2018; Advisory Board Member, from 2017 to 2018 | | Retired. Chief Marketing Officer, Source (ETF) UK Services, Ltd, from 2015 to 2017. From 2012 to 2015, Principal of The Polisson Group, LLC, a management consulting, corporate advisory and principal investing company. Chief Executive Officer and Managing Director at Russell Investments, Global Exchange Traded Funds from 2010 to 2012. Managing Director of Barclays Global Investors from 1998 to 2010 and Global Chief Marketing Officer for iShares and Barclays Global Investors from 2000 to 2010. Trustee of the San Francisco Mechanics’ Institute, a non-profit organization, from 2013 to 2015. Board member of the Russell Exchange Traded Fund Trust from 2011 to 2012. Director of Barclays Global Investors Holdings Deutschland GmbH from 2006 to 2009. Mr. Polisson is an attorney and has a retired status with the Massachusetts and District of Columbia Bar Associations. | | Asset Allocation Trust |
Michael S. Scofield (Born 1943) | | Trustee, since 2010 | | Served on the Investment Company Institute’s Board of Governors and Executive Committee from 2008-2011 as well the Governing Council of the Independent Directors Council from 2006-2011 and the Independent Directors Council Executive Committee from 2008-2011. Trustee of the Evergreen Funds complex (and its predecessors) from 1984 to 2010. Chairman of the Evergreen Funds from 2000-2010. Former Trustee of the Mentor Funds. Retired Attorney, Law Offices of Michael S. Scofield. | | Asset Allocation Trust |
Pamela Wheelock****** (Born 1959) | | Trustee, since 2018; Advisory Board Member, from 2017 to 2018 | | Chief Operating Officer, Twin Cities Habitat for Humanity, since January, 2017. Vice President of University Services, University of Minnesota from 2012 to 2017. Prior thereto, Interim President and Chief Executive Officer of Blue Cross Blue Shield of Minnesota from 2010 to 2011, Chairman of the Board from 2009 to 2011 and Board Director from 2003 to 2015. Vice President, Leadership and Community Engagement, Bush Foundation, Saint Paul, Minnesota (a private foundation) from 2009 to 2011. Executive Vice President and Chief Financial Officer, Minnesota Sports and Entertainment from 2004 to 2009 and Senior Vice President from 2002 to 2004. Commissioner of Finance, State of Minnesota, from 1999 to 2002. Currently on the Board of Directors, Governance Committee and Finance Committee, for the Minnesota Philanthropy Partners (Saint Paul Foundation) since 2012 and Board Chair of the Minnesota Wild Foundation since 2010. | | Asset Allocation Trust |
| * | Length of service dates reflect the Trustee’s commencement of service with the Trust’s predecessor entities, where applicable. |
| ** | Jane Freeman became Chair Liaison effective January 1, 2018. |
| *** | Peter Gordon retired on December 31, 2017. |
| **** | Olivia Mitchell became Chairman of the Governance Committee effective January 1, 2018. |
| ***** | Timothy Penny became Chairman effective January 1, 2018. |
| ****** | James Polisson and Pamela Wheelock each became a Trustee effective January 1, 2018. |
| | | | |
| 46 | | Wells Fargo Short-Term Municipal Bond Fund | | Other information (unaudited) |
Officers
| | | | | | |
Name and year of birth | | Position held and length of service | | Principal occupations during past five years or longer | | |
Andrew Owen (Born 1960) | | President, since 2017 | | Executive Vice President of Wells Fargo & Company and Head of Affiliated Managers, Wells Fargo Asset Management, since 2014. In addition, Mr. Owen is currently President, Chief Executive Officer and Director of Wells Fargo Funds Management, LLC since 2017. Prior thereto, Executive Vice President responsible for marketing, investments and product development for Wells Fargo Funds Management, LLC, from 2009 to 2014. | | |
Nancy Wiser1 (Born 1967) | | Treasurer, since 2012 | | Executive Vice President of Wells Fargo Funds Management, LLC since 2011. Chief Operating Officer and Chief Compliance Officer at LightBox Capital Management LLC, from 2008 to 2011. | | |
C. David Messman (Born 1960) | | Secretary, since 2000; Chief Legal Officer, since 2003 | | Senior Vice President and Secretary of Wells Fargo Funds Management, LLC since 2001. Assistant General Counsel of Wells Fargo Bank, N.A. since 2013 and Vice President and Managing Counsel of Wells Fargo Bank, N.A. from 1996 to 2013. | | |
Michael H. Whitaker (Born 1967) | | Chief Compliance Officer, since 2016 | | Senior Vice President and Chief Compliance Officer since 2016. Senior Vice President and Chief Compliance Officer for Fidelity Investments from 2007 to 2016. | | |
David Berardi (Born 1975) | | Assistant Treasurer, since 2009 | | Vice President of Wells Fargo Funds Management, LLC since 2009. Vice President of Evergreen Investment Management Company, LLC from 2008 to 2010. Manager of Fund Reporting and Control for Evergreen Investment Management Company, LLC from 2004 to 2010. | | |
Jeremy DePalma1 (Born 1974) | | Assistant Treasurer, since 2009 | | Senior Vice President of Wells Fargo Funds Management, LLC since 2009. Senior Vice President of Evergreen Investment Management Company, LLC from 2008 to 2010 and head of the Fund Reporting and Control Team within Fund Administration from 2005 to 2010. | | |
| 1 | Nancy Wiser acts as Treasurer of 77 funds in the Fund Complex. Jeremy DePalma acts as Treasurer of 76 funds and Assistant Treasurer of 77 funds in the Fund Complex. |
| 2 | The Statement of Additional Information includes additional information about the Trustees and is available, without charge, upon request, by calling 1-800-222-8222 or by visiting the website at wellsfargofunds.com. |
| | | | | | |
| List of abbreviations | | Wells Fargo Short-Term Municipal Bond Fund | | | 47 | |
The following is a list of common abbreviations for terms and entities that may have appeared in this report.
| ACA | — ACA Financial Guaranty Corporation |
| ADR | — American depositary receipt |
| ADS | — American depositary shares |
| AGC | — Assured Guaranty Corporation |
| AGM | — Assured Guaranty Municipal |
| Ambac | — Ambac Financial Group Incorporated |
| AMT | — Alternative minimum tax |
| BAN | — Bond anticipation notes |
| BHAC | — Berkshire Hathaway Assurance Corporation |
| CAB | — Capital appreciation bond |
| CCAB | — Convertible capital appreciation bond |
| CDA | — Community Development Authority |
| CDO | — Collateralized debt obligation |
| CLO | — Collateralized loan obligation |
| DRIVER | — Derivative inverse tax-exempt receipts |
| DW&P | — Department of Water & Power |
| DWR | — Department of Water Resources |
| ECFA | — Educational & Cultural Facilities Authority |
| EDA | — Economic Development Authority |
| EDFA | — Economic Development Finance Authority |
| ETF | — Exchange-traded fund |
| FDIC | — Federal Deposit Insurance Corporation |
| FFCB | — Federal Farm Credit Banks |
| FGIC | — Financial Guaranty Insurance Corporation |
| FHA | — Federal Housing Administration |
| FHLB | — Federal Home Loan Bank |
| FHLMC | — Federal Home Loan Mortgage Corporation |
| FICO | — The Financing Corporation |
| FNMA | — Federal National Mortgage Association |
| GDR | — Global depositary receipt |
| GNMA | — Government National Mortgage Association |
| HCFR | — Healthcare facilities revenue |
| HEFA | — Health & Educational Facilities Authority |
| HEFAR | — Higher education facilities authority revenue |
| HFA | — Housing Finance Authority |
| HFFA | — Health Facilities Financing Authority |
| HUD | — Department of Housing and Urban Development |
| IDA | — Industrial Development Authority |
| IDAG | — Industrial Development Agency |
| KRW | — Republic of Korea won |
| LIBOR | — London Interbank Offered Rate |
| LIFER | — Long Inverse Floating Exempt Receipts |
| LLC | — Limited liability company |
| LLLP | — Limited liability limited partnership |
| LLP | — Limited liability partnership |
| MBIA | — Municipal Bond Insurance Association |
| MFHR | — Multifamily housing revenue |
| MSTR | — Municipal securities trust receipts |
| MUD | — Municipal Utility District |
| National | — National Public Finance Guarantee Corporation |
| PCFA | — Pollution Control Financing Authority |
| PCL | — Public Company Limited |
| PCR | — Pollution control revenue |
| PFA | — Public Finance Authority |
| PFFA | — Public Facilities Financing Authority |
| PFOTER | — Puttable floating option tax-exempt receipts |
| PJSC | — Public Joint Stock Company |
| plc | — Public limited company |
| PUTTER | — Puttable tax-exempt receipts |
| R&D | — Research & development |
| Radian | — Radian Asset Assurance |
| RAN | — Revenue anticipation notes |
| RDA | — Redevelopment Agency |
| RDFA | — Redevelopment Finance Authority |
| REIT | — Real estate investment trust |
| ROC | — Reset option certificates |
| SAVRS | — Select auction variable rate securities |
| SBA | — Small Business Authority |
| SDR | — Swedish depositary receipt |
| SFHR | — Single-family housing revenue |
| SFMR | — Single-family mortgage revenue |
| SIFMA | — Securities Industry and Financial Markets Association |
| SPA | — Standby purchase agreement |
| SPDR | — Standard & Poor’s Depositary Receipts |
| SPEAR | — Short Puttable Exempt Adjustable Receipts |
| STRIPS | — Separate trading of registered interest and |
| TAN | — Tax anticipation notes |
| TIPS | — Treasury inflation-protected securities |
| TRAN | — Tax revenue anticipation notes |
| TTFA | — Transportation Trust Fund Authority |
| TVA | — Tennessee Valley Authority |
This page is intentionally left blank.

For more information
More information about Wells Fargo Funds is available free upon request. To obtain literature, please write, email, visit the Fund’s website, or call:
Wells Fargo Funds
P.O. Box 8266
Boston, MA 02266-8266
Email: fundservice@wellsfargo.com
Website: wellsfargofunds.com
Individual investors: 1-800-222-8222
Retail investment professionals: 1-888-877-9275
Institutional investment professionals:
1-866-765-0778
This report and the financial statements contained herein are submitted for the general information of the shareholders of the Fund. If this report is used for promotional purposes, distribution of the report must be accompanied or preceded by a current prospectus. Before investing, please consider the investment objectives, risks, charges, and expenses of the investment. For a current prospectus and, if available, a summary prospectus, containing this information, call 1-800-222-8222 or visit the Fund’s website at wellsfargofunds.com. Read the prospectus carefully before you invest or send money.
Wells Fargo Asset Management (WFAM) is a trade name used by the asset management businesses of Wells Fargo & Company. Wells Fargo Funds Management, LLC, a wholly owned subsidiary of Wells Fargo & Company, provides investment advisory and administrative services for Wells Fargo Funds. Other affiliates of Wells Fargo & Company provide subadvisory and other services for the funds. The funds are distributed by Wells Fargo Funds Distributor, LLC, Member FINRA, an affiliate of Wells Fargo & Company. Neither Wells Fargo Funds Distributor nor Wells Fargo Funds Management holds fund shareholder accounts or assets. This material is for general informational and educational purposes only and is NOT intended to provide investment advice or a recommendation of any kind—including a recommendation for any specific investment, strategy, or plan.
NOT FDIC INSURED ◾ NO BANK GUARANTEE ◾ MAY LOSE VALUE
© 2017 Wells Fargo Funds Management, LLC. All rights reserved.
| | |
 | | 308067 02-18 SA256/SAR256 12-17 |
Semi-Annual Report
December 31, 2017

Wells Fargo Strategic Municipal Bond Fund


Reduce clutter. Save trees.
Sign up for electronic delivery of prospectuses and shareholder reports at wellsfargo.com/advantagedelivery
Contents
The views expressed and any forward-looking statements are as of December 31, 2017, unless otherwise noted, and are those of the Fund managers and/or Wells Fargo Funds Management, LLC. Discussions of individual securities, or the markets generally, or any Wells Fargo Fund are not intended as individual recommendations. Future events or results may vary significantly from those expressed in any forward-looking statements. The views expressed are subject to change at any time in response to changing circumstances in the market. Wells Fargo Funds Management, LLC and the Fund disclaim any obligation to publicly update or revise any views expressed or forward-looking statements.
NOT FDIC INSURED ◾ NO BANK GUARANTEE ◾ MAY LOSE VALUE
| | | | |
| 2 | | Wells Fargo Strategic Municipal Bond Fund | | Letter to shareholders (unaudited) |

Andrew Owen
President
Wells Fargo Funds
In a predominantly improving global economic environment, global stocks delivered strong results; bond markets had smaller but positive results as well.
Dear Shareholder:
We are pleased to offer you this semi-annual report for the Wells Fargo Strategic Municipal Bond Fund for the six-month period that ended December 31, 2017. In a predominantly improving global economic environment, global stocks delivered strong results; bond markets had smaller but positive results as well. U.S. and international stocks delivered similar results, with returns of 11.42% and 11.48%, respectively, for the six-month period, as measured by the S&P 500 Index1 and the MSCI ACWI ex USA Index (Net)2, respectively; within fixed income, the Bloomberg Barclays U.S. Aggregate Bond Index3 returned 1.24% and the Bloomberg Barclays Municipal Bond Index4 returned 1.82%.
As global growth improved in the third quarter of 2017, investment markets generally advanced.
Most stock markets worldwide moved higher during the quarter and ended the period at or near all-time highs. Moderate acceleration in global economic growth was supported by improving corporate earnings, low inflation pressure, and still-low interest rates. Corporate earnings reports were favorable overall as companies continued to benefit from healthy operating leverage. While North Korea’s recent missile launches and nuclear testing raised serious concerns around the world, the heightened geopolitical risk had relatively minimal impact on the quarter’s stock returns. In the U.S., economic data released during the quarter reflected a generally healthy economy. Second-quarter economic output grew at a 3.1% annual rate, and consumers displayed more willingness to spend. Meanwhile, the U.S. Federal Reserve (Fed) maintained the target range for the federal funds rate at 1.00% to 1.25%, noting that inflation had remained below the Fed’s 2.00% objective. However, the Fed also stated the possibility of one more 0.25% increase in the federal funds rate by the end of 2017 and announced plans to begin the process of unwinding its $4.5 trillion portfolio of bonds and other assets in October. Outside the U.S., stocks in the Asia Pacific region benefited from solid earnings reports and investors’ willingness to take on risk despite the rising tensions between North Korea and the U.S. In Europe, markets were supported by better-than-expected economic growth, which led to narrowing of the gap between Europe’s growth rate and that of the U.S. In emerging markets, many countries benefited from stronger currencies versus the U.S. dollar.
Positive economic and market news continued through the fourth quarter.
During the fourth quarter of 2017, stock markets followed a steady, upward trajectory with no meaningful pullbacks, similar to their paths during the previous three quarters of the year. The extended rally was driven largely by reports of strong earnings and revenue surprises from many companies. Synchronous economic expansion worldwide with mild inflation provided a favorable environment for markets to rise with minimal volatility. Data released during the quarter reflected a
| 1 | The S&P 500 Index consists of 500 stocks chosen for market size, liquidity, and industry group representation. It is a market-value-weighted index with each stock’s weight in the index proportionate to its market value. You cannot invest directly in an index. |
| 2 | The Morgan Stanley Capital International (MSCI) All Country World Index (ACWI) ex USA Index (Net) is a free-float-adjusted market-capitalization-weighted index that is designed to measure the equity market performance of developed markets, excluding the United States and Canada. Source: MSCI. MSCI makes no express or implied warranties or representations and shall have no liability whatsoever with respect to any MSCI data contained herein. The MSCI data may not be further redistributed or used as a basis for other indices or any securities or financial products. This report is not approved, reviewed, or produced by MSCI. You cannot invest directly in an index. |
| 3 | The Bloomberg Barclays U.S. Aggregate Bond Index is a broad-based benchmark that measures the investment-grade, U.S. dollar-denominated, fixed-rate taxable bond market, including Treasuries, government-related and corporate securities, mortgage-backed securities (agency fixed-rate and hybrid adjustable-rate mortgage pass-throughs), asset-backed securities, and commercial mortgage-backed securities. You cannot invest directly in an index. |
| 4 | The Bloomberg Barclays Municipal Bond Index is an unmanaged index composed of long-term tax-exempt bonds with a minimum credit rating of Baa. You cannot invest directly in an index. |
| | | | | | |
| Letter to shareholders (unaudited) | | Wells Fargo Strategic Municipal Bond Fund | | | 3 | |
healthy U.S. economy. Third-quarter economic output grew at a 3.2% annual rate, just ahead of the second quarter’s 3.1% pace. Hiring remained solid during the quarter; the hiring pace pushed the unemployment rate down to a 17-year low of 4.1% in October, and it remained at 4.1% for both November and December. Fed officials began unwinding the Fed’s $4.5 trillion portfolio of bonds and other assets in October as planned, and in December they raised the target for the federal funds rate to a range of 1.25% to 1.50%. As a result, long-term interest rates in the U.S. continued trending upward, although the 10-year rate remained below 2.5%. Outside the U.S., economies continued to strengthen. In December, the Organisation for Economic Co-operation and Development (OECD) reported that the global economy has been expanding at its fastest rate since 2010; all 45 countries the OECD follows were on track to expand for 2017. International economies have benefited from catalysts such as economic stimulus, improving employment, increased investment, and accelerated trade growth.
Don’t let short-term uncertainty derail long-term investment goals.
Periods of investment uncertainty can present challenges, but experience has taught us that maintaining long-term investment goals can be an effective way to plan for the future. To help you create a sound strategy based on your personal goals and risk tolerance, Wells Fargo Funds offers more than 100 mutual funds spanning a wide range of asset classes and investment styles. Although diversification cannot guarantee an investment profit or prevent losses, we believe it can be an effective way to manage investment risk and potentially smooth out overall portfolio performance. We encourage investors to know their investments and to understand that appropriate levels of risk-taking may unlock opportunities.
Thank you for choosing to invest with Wells Fargo Funds. We appreciate your confidence in us and remain committed to helping you meet your financial needs.
Sincerely,

Andrew Owen
President
Wells Fargo Funds
Although diversification cannot guarantee an investment profit or prevent losses, we believe it can be an effective way to manage investment risk and potentially smooth out overall portfolio performance.
For further information about your Fund, contact your investment professional, visit our website at wellsfargofunds.com, or call us directly at 1-800-222-8222. We are available 24 hours a day, 7 days a week.
| | | | |
| 4 | | Wells Fargo Strategic Municipal Bond Fund | | Performance highlights (unaudited) |
Investment objective
The Fund seeks current income exempt from regular federal income tax.
Manager
Wells Fargo Funds Management, LLC
Subadviser
Wells Capital Management Incorporated
Portfolio managers
Wendy Casetta
Lyle J. Fitterer, CFA®, CPA
Robert J. Miller
Average annual total returns (%) as of December 31, 20171
| | | | | | | | | | | | | | | | | | | | | | | | | | | | | | | | | | |
| | | | | Including sales charge | | | Excluding sales charge | | | Expense ratios2 (%) | |
| | | Inception date | | 1 year | | | 5 year | | | 10 year | | | 1 year | | | 5 year | | | 10 year | | | Gross | | | Net3 | |
| Class A (VMPAX) | | 12-1-1994 | | | (1.00 | ) | | | 1.20 | | | | 2.41 | | | | 3.14 | | | | 2.02 | | | | 2.83 | | | | 0.81 | | | | 0.81 | |
| Class C (DHICX) | | 8-18-1997 | | | 1.37 | | | | 1.26 | | | | 2.06 | | | | 2.37 | | | | 1.26 | | | | 2.06 | | | | 1.56 | | | | 1.56 | |
| Administrator Class (VMPYX) | | 10-6-1997 | | | – | | | | – | | | | – | | | | 3.29 | | | | 2.14 | | | | 2.99 | | | | 0.75 | | | | 0.68 | |
| Institutional Class (STRIX) | | 11-30-2012 | | | – | | | | – | | | | – | | | | 3.38 | | | | 2.34 | | | | 3.09 | | | | 0.48 | | | | 0.48 | |
| Bloomberg Barclays Short-Intermediate Municipal Bond Index4 | | – | | | – | | | | – | | | | – | | | | 3.03 | | | | 1.78 | | | | 3.30 | | | | – | | | | – | |
Figures quoted represent past performance, which is no guarantee of future results, and do not reflect taxes that a shareholder may pay on fund distributions or the redemption of fund shares. Investment return and principal value of an investment will fluctuate so that an investor’s shares, when redeemed, may be worth more or less than their original cost. Performance shown without sales charges would be lower if sales charges were reflected. Current performance may be lower or higher than the performance data quoted, which assumes the reinvestment of dividends and capital gains. Current month-end performance is available on the Fund’s website, wellsfargofunds.com.
Index returns do not include transaction costs associated with buying and selling securities, any mutual fund fees or expenses, or any taxes. It is not possible to invest directly in an index.
For Class A shares, the maximum front-end sales charge is 4.00%. For Class C shares, the maximum contingent deferred sales charge is 1.00%. Performance including a contingent deferred sales charge assumes the sales charge for the corresponding time period. Administrator Class and Institutional Class shares are sold without a front-end sales charge or contingent deferred sales charge.
Bond values fluctuate in response to the financial condition of individual issuers, general market and economic conditions, and changes in interest rates. Changes in market conditions and government policies may lead to periods of heightened volatility in the bond market and reduced liquidity for certain bonds held by the Fund. In general, when interest rates rise, bond values fall and investors may lose principal value. Interest-rate changes and their impact on the Fund and its share price can be sudden and unpredictable. High-yield securities have a greater risk of default and tend to be more volatile than higher-rated debt securities. The use of derivatives may reduce returns and/or increase volatility. Certain investment strategies tend to increase the total risk of an investment (relative to the broader market). The Fund is exposed to municipal securities risk. Consult the Fund’s prospectus for additional information on these and other risks. A portion of the Fund’s income may be subject to federal, state, and/or local income taxes or the Alternative Minimum Tax (AMT). Any capital gains distributions may be taxable.
Please see footnotes on page 5.
| | | | | | |
| Performance highlights (unaudited) | | Wells Fargo Strategic Municipal Bond Fund | | | 5 | |
|
| Effective maturity distribution as of December 31, 20175 |
|
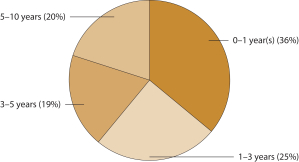
|
|
| Credit quality as of December 31, 20176 |
|
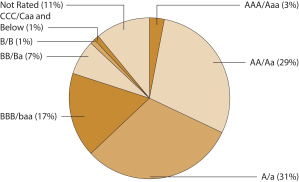 |
| 1 | Historical performance shown for the Institutional Class shares prior to their inception reflects the performance of the Administrator Class shares, and includes the higher expenses applicable to the Administrator Class shares. If these expenses had not been included, returns for Institutional Class shares would be higher. Historical performance shown for all classes of the Fund prior to July 12, 2010, is based on the performance of the Fund’s predecessor, Evergreen Strategic Municipal Bond Fund. |
| 2 | Reflects the expense ratios as stated in the most recent prospectuses. The expense ratios shown are subject to change and may differ from the annualized expense ratios shown in the financial highlights of this report. |
| 3 | The manager has contractually committed through October 31, 2018, to waive fees and/or reimburse expenses to the extent necessary to cap the Fund’s Total Annual Fund Operating Expenses After Fee Waivers at 0.82% for Class A, 1.57% for Class C, 0.68% for Administrator Class, and 0.48% for Institutional Class. After this time, the cap may be increased or the commitment to maintain the cap may be terminated only with the approval of the Board of Trustees. Brokerage commissions, stamp duty fees, interest, taxes, acquired fund fees and expenses, and extraordinary expenses are excluded from the expense cap. Without this cap, the Fund’s returns would have been lower. The expense ratio paid by an investor is the net expense ratio or the Fund’s Total Annual Fund Operating Expenses After Fee Waivers, as stated in the prospectuses. |
| 4 | The Bloomberg Barclays Short-Intermediate Municipal Bond Index is a rules-based, market-value-weighted index composed of publicly traded municipal bonds that cover the U.S. dollar–denominated short-term tax-exempt bond market, including state and local general obligation bonds, revenue bonds, insured bonds, and prefunded bonds. You cannot invest directly in an index. |
| 5 | Amounts are calculated based on the total investments of the Fund. These amounts are subject to change and may have changed since the date specified. |
| 6 | The credit quality distribution of portfolio holdings reflected in the chart is based on ratings from Standard & Poor’s, Moody’s Investors Service, and/ or Fitch Ratings Ltd. Credit quality ratings apply to the underlying holdings of the Fund and not to the Fund itself. The percentages of the Fund’s portfolio with the ratings depicted in the chart are calculated based on the total market value of fixed income securities held by the Fund. If a security was rated by all three rating agencies, the middle rating was utilized. If rated by two of three rating agencies, the lower rating was utilized, and if rated by one of the rating agencies, that rating was utilized. Standard & Poor’s rates the creditworthiness of bonds, ranging from AAA (highest) to D (lowest). Ratings from A to CCC may be modified by the addition of a plus (+) or minus (-) sign to show relative standing within the rating categories. Standard & Poor’s rates the creditworthiness of short-term notes from SP-1 (highest) to SP-3 (lowest). Moody’s rates the creditworthiness of bonds, ranging from Aaa (highest) to C (lowest). Ratings Aa to B may be modified by the addition of a number 1 (highest) to 3 (lowest) to show relative standing within the ratings categories. Moody’s rates the creditworthiness of short-term U.S. tax-exempt municipal securities from MIG 1/VMIG 1 (highest) to SG (lowest). Fitch rates the creditworthiness of bonds, ranging from AAA (highest) to D (lowest). Credit quality distribution is subject to change and may have changed since the date specified. |
| | | | |
| 6 | | Wells Fargo Strategic Municipal Bond Fund | | Fund expenses (unaudited) |
As a shareholder of the Fund, you incur two types of costs: (1) transaction costs, including sales charges (loads) on purchase payments and contingent deferred sales charges (if any) on redemptions and (2) ongoing costs, including management fees, distribution (12b-1) and/or shareholder servicing fees, and other Fund expenses. This example is intended to help you understand your ongoing costs (in dollars) of investing in the Fund and to compare these costs with the ongoing costs of investing in other mutual funds.
The example is based on an investment of $1,000 invested at the beginning of the six-month period and held for the entire period from July 1, 2017 to December 31, 2017.
Actual expenses
The “Actual” line of the table below provides information about actual account values and actual expenses. You may use the information in this line, together with the amount you invested, to estimate the expenses that you paid over the period. Simply divide your account value by $1,000 (for example, an $8,600 account value divided by $1,000 = 8.6), then multiply the result by the number in the “Actual” line under the heading entitled “Expenses paid during period” for your applicable class of shares to estimate the expenses you paid on your account during this period.
Hypothetical example for comparison purposes
The “Hypothetical” line of the table below provides information about hypothetical account values and hypothetical expenses based on the Fund’s actual expense ratio and an assumed rate of return of 5% per year before expenses, which is not the Fund’s actual return. The hypothetical account values and expenses may not be used to estimate the actual ending account balance or expenses you paid for the period. You may use this information to compare the ongoing costs of investing in the Fund and other funds. To do so, compare this 5% hypothetical example with the 5% hypothetical examples that appear in the shareholder reports of the other funds.
Please note that the expenses shown in the table are meant to highlight your ongoing costs only and do not reflect any transactional costs, such as sales charges (loads) and contingent deferred sales charges. Therefore, the “Hypothetical” line of the table is useful in comparing ongoing costs only and will not help you determine the relative total costs of owning different funds. In addition, if these transactional costs were included, your costs would have been higher.
| | | | | | | | | | | | | | | | |
| | | Beginning
account value
7-1-2017 | | | Ending
account value
12-31-2017 | | | Expenses
paid during
the period¹ | | | Annualized net
expense ratio | |
Class A | | | | | | | | | | | | | | | | |
Actual | | $ | 1,000.00 | | | $ | 1,011.24 | | | $ | 4.16 | | | | 0.82 | % |
Hypothetical (5% return before expenses) | | $ | 1,000.00 | | | $ | 1,021.07 | | | $ | 4.18 | | | | 0.82 | % |
Class C | | | | | | | | | | | | | | | | |
Actual | | $ | 1,000.00 | | | $ | 1,007.41 | | | $ | 7.94 | | | | 1.57 | % |
Hypothetical (5% return before expenses) | | $ | 1,000.00 | | | $ | 1,017.29 | | | $ | 7.98 | | | | 1.57 | % |
Administrator Class | | | | | | | | | | | | | | | | |
Actual | | $ | 1,000.00 | | | $ | 1,011.96 | | | $ | 3.45 | | | | 0.68 | % |
Hypothetical (5% return before expenses) | | $ | 1,000.00 | | | $ | 1,021.78 | | | $ | 3.47 | | | | 0.68 | % |
Institutional Class | | | | | | | | | | | | | | | | |
Actual | | $ | 1,000.00 | | | $ | 1,011.84 | | | $ | 2.43 | | | | 0.48 | % |
Hypothetical (5% return before expenses) | | $ | 1,000.00 | | | $ | 1,022.79 | | | $ | 2.45 | | | | 0.48 | % |
| 1 | Expenses paid is equal to the annualized net expense ratio of each class multiplied by the average account value over the period, multiplied by the number of days in the most recent fiscal half-year divided by the number of days in the fiscal year (to reflect the one-half-year period). |
| | | | | | |
| Portfolio of investments—December 31, 2017 (unaudited) | | Wells Fargo Strategic Municipal Bond Fund | | | 7 | |
| | | | | | | | | | | | | | | | |
| Security name | | Interest rate | | | Maturity date | | | Principal | | | Value | |
| | | | |
Municipal Obligations: 97.36% | | | | | | | | | | | | | | | | |
| | | | |
| Alabama: 1.48% | | | | | | | | | | | | | | | | |
Alabama Black Belt Energy Gas District Series A (Utilities Revenue, Royal Bank of Canada LIQ) | | | 4.00 | % | | | 7-1-2046 | | | $ | 19,220,000 | | | $ | 20,363,590 | |
Birmingham AL Special Care Facilities Ascension Senior Credit Group Series C-1 (Health Revenue) | | | 1.85 | | | | 11-15-2046 | | | | 4,725,000 | | | | 4,673,084 | |
Jefferson County AL Series A (GO Revenue) | | | 4.90 | | | | 4-1-2021 | | | | 4,350,000 | | | | 4,501,337 | |
| | | | |
| | | | | | | | | | | | | | | 29,538,011 | |
| | | | | | | | | | | | | | | | |
| | | | |
| Alaska: 0.75% | | | | | | | | | | | | | | | | |
Alaska Housing Finance Corporation Home Mortgage Series A MFHR (Housing Revenue, Bank of Tokyo-Mitsubishi SPA) ø | | | 1.73 | | | | 12-1-2040 | | | | 1,500,000 | | | | 1,500,000 | |
Alaska IDA Loan Anticipation Revenue YKHC Project (Health Revenue) | | | 3.50 | | | | 12-1-2020 | | | | 5,500,000 | | | | 5,590,585 | |
Alaska Industrial Development & Export Authority Power Refunding Bonds Snettisham Hydroelectric Project Series 2015 (Utilities Revenue) | | | 5.00 | | | | 1-1-2022 | | | | 1,200,000 | | | | 1,326,360 | |
Alaska Industrial Development & Export Authority Power Refunding Bonds Snettisham Hydroelectric Project Series 2015 (Utilities Revenue) | | | 5.00 | | | | 1-1-2023 | | | | 1,995,000 | | | | 2,248,784 | |
Valdez AK Marine Terminal BP Pipelines Project Series B (Industrial Development Revenue) | | | 5.00 | | | | 1-1-2021 | | | | 4,000,000 | | | | 4,351,960 | |
| | | | |
| | | | | | | | | | | | | | | 15,017,689 | |
| | | | | | | | | | | | | | | | |
| | | | |
| Arizona: 2.15% | | | | | | | | | | | | | | | | |
Arizona IDA Agribusiness & Equine Center Incorporated Project Series 2017B (Education Revenue) 144A | | | 4.00 | | | | 3-1-2027 | | | | 1,225,000 | | | | 1,214,747 | |
Florence AZ IDA Legacy Traditional School Project (Education Revenue) | | | 4.00 | | | | 7-1-2018 | | | | 270,000 | | | | 272,190 | |
Maricopa County AZ IDA Educational Horizon Community Learning Center Project (Education Revenue) | | | 2.63 | | | | 7-1-2021 | | | | 2,115,000 | | | | 2,103,452 | |
Maricopa County AZ IDA Senior Living Facilities Christian Care Retirement Apartments Incorporated Project (Health Revenue) | | | 5.00 | | | | 1-1-2022 | | | | 1,065,000 | | | | 1,195,782 | |
Maricopa County AZ IDA Senior Living Facilities Christian Care Retirement Apartments Incorporated Project (Health Revenue) | | | 5.00 | | | | 1-1-2023 | | | | 1,120,000 | | | | 1,282,389 | |
Maricopa County AZ IDA Senior Living Facilities Christian Care Surprise Incorporated Project (Health Revenue) 144A | | | 5.00 | | | | 1-1-2026 | | | | 3,205,000 | | | | 3,218,461 | |
Navajo Nation AZ Series A (Miscellaneous Revenue) 144A | | | 5.00 | | | | 12-1-2025 | | | | 4,110,000 | | | | 4,511,917 | |
Navajo Nation AZ Series A (Miscellaneous Revenue) 144A | | | 4.00 | | | | 12-1-2022 | | | | 6,345,000 | | | | 6,557,938 | |
Navajo Nation AZ Tribal Utility Authority (Miscellaneous Revenue, Municipal Government Guaranty Insured) | | | 4.00 | | | | 1-1-2021 | | | | 2,314,000 | | | | 2,345,702 | |
Phoenix AZ IDA BASIS Schools Incorporated Project Series A (Education Revenue) 144A | | | 3.00 | | | | 7-1-2020 | | | | 2,295,000 | | | | 2,279,188 | |
Phoenix AZ IDA Great Hearts Academies Project (Education Revenue) | | | 5.20 | | | | 7-1-2022 | | | | 550,000 | | | | 587,923 | |
Phoenix AZ IDA Legacy Traditional School Project Series 2015 (Education Revenue) 144A | | | 3.00 | | | | 7-1-2020 | | | | 815,000 | | | | 809,963 | |
Pima County AZ IDA American Leadership Academy Project Series 2015 (Education Revenue) 144A | | | 4.60 | | | | 6-15-2025 | | | | 1,400,000 | | | | 1,450,890 | |
Pima County AZ IDA Charter Schools Project Series 2013 (Education Revenue) | | | 4.50 | | | | 7-1-2020 | | | | 530,000 | | | | 557,449 | |
Pima County AZ IDA Charter Schools Project Series 2013 (Education Revenue) | | | 4.50 | | | | 7-1-2021 | | | | 1,310,000 | | | | 1,399,408 | |
Pima County AZ IDA Charter Schools Project Series 2013 (Education Revenue) | | | 4.50 | | | | 7-1-2022 | | | | 1,365,000 | | | | 1,468,071 | |
Pima County AZ IDA New Plan Learning Project Series A (Education Revenue) | | | 7.75 | | | | 7-1-2035 | | | | 995,000 | | | | 1,012,860 | |
Pima County AZ IDA New Plan Learning Project Series A (Education Revenue) | | | 8.13 | | | | 7-1-2041 | | | | 2,985,000 | | | | 3,037,745 | |
The accompanying notes are an integral part of these financial statements.
| | | | |
| 8 | | Wells Fargo Strategic Municipal Bond Fund | | Portfolio of investments—December 31, 2017 (unaudited) |
| | | | | | | | | | | | | | | | |
| Security name | | Interest rate | | | Maturity date | | | Principal | | | Value | |
| | | | |
| Arizona (continued) | | | | | | | | | | | | | | | | |
Pima County AZ IDA Noah Webster Schools Project Series A (Education Revenue) | | | 5.50 | % | | | 12-15-2023 | | | $ | 1,070,000 | | | $ | 1,110,585 | |
Tempe AZ IDA Friendship Village Series A (Health Revenue) | | | 5.00 | | | | 12-1-2018 | | | | 800,000 | | | | 819,496 | |
Tempe AZ IDA Mirabella at ASU Project Series B1 (Health Revenue) 144A | | | 4.00 | | | | 10-1-2023 | | | | 3,000,000 | | | | 3,015,360 | |
Verrado AZ Community Facilities District #1 Series A (GO Revenue) 144A | | | 4.25 | | | | 7-15-2019 | | | | 1,320,000 | | | | 1,343,932 | |
Verrado AZ Community Facilities District #1 Series A (GO Revenue) 144A | | | 5.00 | | | | 7-15-2020 | | | | 700,000 | | | | 725,578 | |
Verrado AZ Community Facilities District #1 Series A (GO Revenue) 144A | | | 5.00 | | | | 7-15-2021 | | | | 500,000 | | | | 521,675 | |
| | | | |
| | | | | | | | | | | | | | | 42,842,701 | |
| | | | | | | | | | | | | | | | |
| | | | |
| Arkansas: 0.24% | | | | | | | | | | | | | | | | |
Boone County AR Hospital Construction Series 2006 (Health Revenue, BOKF NA LOC) ø | | | 2.25 | | | | 5-1-2037 | | | | 4,700,000 | | | | 4,700,000 | |
| | | | | | | | | | | | | | | | |
| | | | |
| California: 5.30% | | | | | | | | | | | | | | | | |
California Bay Area Toll Authority Toll Bridge Series E-3 (SIFMA Municipal Swap +0.70%) (Transportation Revenue) ± | | | 2.41 | | | | 4-1-2047 | | | | 11,750,000 | | | | 11,801,465 | |
California CDA Tender Option Bond Trust Receipts Series ZF0199 (Health Revenue, JPMorgan Chase & Company LIQ) 144Aø | | | 1.91 | | | | 10-1-2020 | | | | 4,805,000 | | | | 4,805,000 | |
California Infrastructure & Economic Development Bank Colburn School Series B (SIFMA Municipal Swap +1.20%) (Education Revenue) ± | | | 2.91 | | | | 8-1-2037 | | | | 6,325,000 | | | | 6,415,890 | |
California Infrastructure & Economic Development Bank Museum Art Project Series A (1 Month LIBOR +1.75%) (Miscellaneous Revenue) ± | | | 2.85 | | | | 12-1-2037 | | | | 3,000,000 | | | | 3,002,790 | |
California Municipal Finance Authority Charter School Nova Academy Project Series 2016A (Education Revenue) 144A | | | 4.00 | | | | 6-15-2026 | | | | 890,000 | | | | 898,259 | |
California PCFA AMT Calplant I Project (Industrial Development Revenue) 144A | | | 7.50 | | | | 7-1-2032 | | | | 3,500,000 | | | | 3,764,985 | |
California PFOTER Series DCL-009 (GO Revenue, Dexia Credit Local LOC, AGM Insured) 144Aø | | | 1.97 | | | | 8-1-2027 | | | | 15,000,000 | | | | 15,000,000 | |
California PFOTER Series DCL-011 (GO Revenue, Dexia Credit Local LOC, AGM Insured) 144Aø | | | 1.97 | | | | 8-1-2027 | | | | 10,000,000 | | | | 10,000,000 | |
California PCFA Series A-1 (Resource Recovery Revenue) 144A | | | 1.30 | | | | 11-1-2042 | | | | 10,000,000 | | | | 10,000,100 | |
California Refunding Bond Series B (SIFMA Municipal Swap +0.90%) (GO Revenue) ± | | | 2.61 | | | | 5-1-2018 | | | | 3,000,000 | | | | 3,000,420 | |
California School Finance Authority Charter School Rocketship Education Obligated Group Series 2017A (Education Revenue) 144A | | | 4.50 | | | | 6-1-2027 | | | | 250,000 | | | | 260,478 | |
California School Finance Authority Charter School Rocketship Education Obligated Group Series 2017A (Education Revenue) 144A | | | 5.00 | | | | 6-1-2034 | | | | 670,000 | | | | 706,656 | |
California Statewide CDA Eskaton Properties Incorporated (Health Revenue) | | | 5.00 | | | | 11-15-2018 | | | | 1,060,000 | | | | 1,093,114 | |
California Student Education Loan Marketing Corporation Series IV-D1 (Education Revenue) | | | 5.88 | | | | 1-1-2018 | | | | 2,370,000 | | | | 2,370,000 | |
California Various Purpose Bonds (Miscellaneous Revenue) | | | 6.25 | | | | 10-1-2019 | | | | 5,000 | | | | 5,057 | |
Chemehuevi Indian Tribe CA BAN (Miscellaneous Revenue) | | | 2.95 | | | | 12-15-2018 | | | | 6,100,000 | | | | 6,102,745 | |
Compton CA PFA Lease (Miscellaneous Revenue) 144A | | | 4.00 | | | | 9-1-2022 | | | | 4,440,000 | | | | 4,565,252 | |
Delhi CA Unified School District CAB (GO Revenue, Ambac Insured) ¤ | | | 0.00 | | | | 8-1-2019 | | | | 965,000 | | | | 914,627 | |
Grossmont CA Union High School District Floaters Series 2015 (GO Revenue, Citibank NA LIQ) 144Aø | | | 1.86 | | | | 1-1-2019 | | | | 7,525,000 | | | | 7,525,000 | |
Palomar CA Health Refunding Bond Series 2016 (Health Revenue) | | | 4.00 | | | | 11-1-2018 | | | | 750,000 | | | | 760,313 | |
Palomar CA Health Refunding Bond Series 2016 (Health Revenue) | | | 4.00 | | | | 11-1-2019 | | | | 1,250,000 | | | | 1,284,850 | |
Riverside CA Tender Option Bond Trust Receipts/Floater Certificates Series 2016-XM0228 (GO Revenue, AGM/National Insured, Bank of America NA LIQ) 144Aø | | | 0.96 | | | | 8-1-2032 | | | | 2,830,000 | | | | 2,830,000 | |
San Buenaventura CA Community Memorial Health System (Health Revenue) | | | 5.75 | | | | 12-1-2018 | | | | 2,110,000 | | | | 2,171,528 | |
The accompanying notes are an integral part of these financial statements.
| | | | | | |
| Portfolio of investments—December 31, 2017 (unaudited) | | Wells Fargo Strategic Municipal Bond Fund | | | 9 | |
| | | | | | | | | | | | | | | | |
| Security name | | Interest rate | | | Maturity date | | | Principal | | | Value | |
| | | | |
| California (continued) | | | | | | | | | | | | | | | | |
San Francisco City & County CA Public Utilities Commission Series 3153X (Water & Sewer Revenue, Morgan Stanley Bank LIQ) 144Aø | | | 1.74 | % | | | 11-1-2039 | | | $ | 2,190,000 | | | $ | 2,190,000 | |
Temecula CA RDA Project #1 (Tax Revenue, National Insured) | | | 5.13 | | | | 8-1-2027 | | | | 4,310,000 | | | | 4,310,000 | |
| | | | |
| | | | | | | | | | | | | | | 105,778,529 | |
| | | | | | | | | | | | | | | | |
| | | | |
| Colorado: 2.12% | | | | | | | | | | | | | | | | |
Centennial CO Southglenn Metropolitan District (GO Revenue) | | | 3.00 | | | | 12-1-2021 | | | | 938,000 | | | | 938,891 | |
Centerra CO Metropolitan District 1 Series 2017 (Tax Revenue) 144A | | | 5.00 | | | | 12-1-2021 | | | | 1,440,000 | | | | 1,567,138 | |
Centerra CO Metropolitan District 1 Series 2017 (Tax Revenue) 144A | | | 5.00 | | | | 12-1-2022 | | | | 1,940,000 | | | | 2,134,524 | |
Colorado ECFA Eagle Ridge Academy Project (Education Revenue) 144A | | | 3.63 | | | | 11-1-2026 | | | | 2,260,000 | | | | 2,232,157 | |
Colorado ECFA Rocky Mountain Classical Academy Project (Education Revenue) | | | 6.38 | | | | 9-1-2023 | | | | 1,680,000 | | | | 1,899,862 | |
Colorado ECFA Vanguard School Project (Education Revenue) | | | 4.00 | | | | 6-15-2021 | | | | 250,000 | | | | 264,528 | |
Colorado ECFA Vanguard School Project (Education Revenue) | | | 4.00 | | | | 6-15-2022 | | | | 515,000 | | | | 551,374 | |
Colorado ECFA Windsor Charter Academy (Education Revenue) 144A | | | 3.88 | | | | 9-1-2026 | | | | 570,000 | | | | 566,301 | |
Colorado Health Facilities Authority Catholic Health Initiatives Series 2009A (Health Revenue) | | | 5.50 | | | | 7-1-2034 | | | | 10,000,000 | | | | 10,484,000 | |
Colorado Health Facilities Authority Catholic Health Initiatives Series 2011A (Health Revenue) | | | 5.00 | | | | 2-1-2022 | | | | 3,415,000 | | | | 3,703,294 | |
Colorado Health Facilities Authority Catholic Health Initiatives Series 2011A (Health Revenue) | | | 5.25 | | | | 2-1-2031 | | | | 5,150,000 | | | | 5,521,058 | |
Colorado Health Facilities Authority Christian Living Neighborhoods Project (Health Revenue) | | | 4.00 | | | | 1-1-2018 | | | | 425,000 | | | | 425,000 | |
Colorado Health Facilities Authority Christian Living Neighborhoods Project (Health Revenue) | | | 4.00 | | | | 1-1-2019 | | | | 385,000 | | | | 392,277 | |
Colorado Health Facilities Authority Christian Living Neighborhoods Project (Health Revenue) | | | 4.00 | | | | 1-1-2020 | | | | 450,000 | | | | 464,472 | |
Colorado Health Facilities Authority Series 2016C (Health Revenue) ø | | | 1.70 | | | | 12-1-2045 | | | | 5,000,000 | | | | 5,000,000 | |
Colorado Springs CO Utilities System Subordinate Lien Improvement Series B (Utilities Revenue, Landesbank Hessen-Thüringen SPA) ø | | | 1.68 | | | | 11-1-2036 | | | | 3,345,000 | | | | 3,345,000 | |
Fountain CO Urban Renewal Authority South Academy Highlands Project Series 2015-A (Tax Revenue) | | | 4.50 | | | | 11-1-2029 | | | | 2,800,000 | | | | 2,838,584 | |
| | | | |
| | | | | | | | | | | | | | | 42,328,460 | |
| | | | | | | | | | | | | | | | |
| | | | |
| Connecticut: 1.85% | | | | | | | | | | | | | | | | |
Connecticut HEFA Bridgeport Hospital Series D (Health Revenue) | | | 5.00 | | | | 7-1-2020 | | | | 500,000 | | | | 539,340 | |
Connecticut Series A (SIFMA Municipal Swap +0.75%) (Miscellaneous Revenue) ± | | | 2.46 | | | | 3-1-2021 | | | | 2,700,000 | | | | 2,699,082 | |
Connecticut Series A (SIFMA Municipal Swap +0.88%) (Miscellaneous Revenue) ± | | | 2.59 | | | | 4-15-2018 | | | | 5,000,000 | | | | 5,007,100 | |
Connecticut Series A (SIFMA Municipal Swap +0.92%) (Miscellaneous Revenue) ± | | | 2.63 | | | | 5-15-2018 | | | | 2,000,000 | | | | 2,003,820 | |
Connecticut Series A (SIFMA Municipal Swap +1.25%) (Miscellaneous Revenue) ± | | | 2.96 | | | | 4-15-2020 | | | | 7,000,000 | | | | 7,081,130 | |
Connecticut Series D (SIFMA Municipal Swap +0.77%) (GO Revenue) ± | | | 2.48 | | | | 9-15-2018 | | | | 1,000,000 | | | | 1,002,460 | |
Connecticut Series D (SIFMA Municipal Swap +0.92%) (GO Revenue) ± | | | 2.63 | | | | 9-15-2019 | | | | 3,345,000 | | | | 3,367,913 | |
Hamden CT Refunding Bond (GO Revenue) | | | 5.00 | | | | 8-15-2019 | | | | 1,835,000 | | | | 1,922,713 | |
Hartford CT (GO Revenue) | | | 5.00 | | | | 4-1-2024 | | | | 1,515,000 | | | | 1,496,699 | |
Hartford CT Series A (GO Revenue) | | | 5.00 | | | | 4-1-2027 | | | | 1,650,000 | | | | 1,609,080 | |
Hartford CT Series A (GO Revenue) | | | 5.00 | | | | 4-1-2025 | | | | 2,500,000 | | | | 2,440,400 | |
Stratford CT Anticipation Notes (GO Revenue) | | | 2.50 | | | | 1-3-2018 | | | | 7,800,000 | | | | 7,800,000 | |
| | | | |
| | | | | | | | | | | | | | | 36,969,737 | |
| | | | | | | | | | | | | | | | |
| | | | |
| Delaware: 0.10% | | | | | | | | | | | | | | | | |
Delaware EDA Odyssey Charter School Project Series A (Education Revenue) 144A | | | 6.25 | | | | 9-1-2025 | | | | 2,035,000 | | | | 2,056,978 | |
| | | | | | | | | | | | | | | | |
The accompanying notes are an integral part of these financial statements.
| | | | |
| 10 | | Wells Fargo Strategic Municipal Bond Fund | | Portfolio of investments—December 31, 2017 (unaudited) |
| | | | | | | | | | | | | | | | |
| Security name | | Interest rate | | | Maturity date | | | Principal | | | Value | |
| | | | |
| District of Columbia: 2.25% | | | | | | | | | | | | | | | | |
District of Columbia HFA Hilltop Apartments Project Series 2017 (Housing Revenue) | | | 1.94 | % | | | 1-1-2021 | | | $ | 5,850,000 | | | $ | 5,850,000 | |
District of Columbia HFA Wah Luck House Apartments Project Series 2017 (Housing Revenue) | | | 1.72 | | | | 2-1-2020 | | | | 39,000,000 | | | | 38,970,750 | |
| | | | |
| | | | | | | | | | | | | | | 44,820,750 | |
| | | | | | | | | | | | | | | | |
| | | | |
| Florida: 1.53% | | | | | | | | | | | | | | | | |
Brevard County FL Space Coast Infrastructure Agency I-95 Project (Industrial Development Revenue) | | | 4.00 | | | | 6-15-2018 | | | | 1,620,000 | | | | 1,629,364 | |
Florida Capital Trust Agency Educational Facilities Renaissance Charter School Projects Series 2017A (Education Revenue) 144A | | | 4.38 | | | | 6-15-2027 | | | | 1,365,000 | | | | 1,350,913 | |
Florida Cityplace Community Development District Special Assessment (Miscellaneous Revenue) | | | 5.00 | | | | 5-1-2018 | | | | 1,375,000 | | | | 1,390,868 | |
Florida Development Finance Corporation Solid Waste AMT Pro USA Incorporated (Resource Recovery Revenue) 144A | | | 5.00 | | | | 8-1-2029 | | | | 3,500,000 | | | | 3,587,535 | |
Florida Village Community Development District #10 Special Assignment (Miscellaneous Revenue) | | | 5.13 | | | | 5-1-2024 | | | | 3,160,000 | | | | 3,424,334 | |
Lakeland FL Hospital System Lakeland Regional Health System (Health Revenue) | | | 5.00 | | | | 11-15-2022 | | | | 4,495,000 | | | | 4,988,956 | |
Miami-Dade County FL IDA Youth Charter Schools Project Series 2015A (Education Revenue) 144A | | | 5.00 | | | | 9-15-2025 | | | | 1,000,000 | | | | 1,029,540 | |
North Brevard County FL Parrish Medical Center Project (Health Revenue) | | | 5.50 | | | | 10-1-2018 | | | | 500,000 | | | | 514,850 | |
Orange County FL IDA Central Florida Kidney Center Project (Industrial Development Revenue, SunTrust Bank LOC) ø | | | 1.78 | | | | 12-1-2020 | | | | 3,250,000 | | | | 3,250,000 | |
Sarasota County FL Health Facilities Authority Village on the Isle Project (Health Revenue) | | | 4.00 | | | | 1-1-2020 | | | | 1,485,000 | | | | 1,546,345 | |
Sumter County FL Village Community Development District #5 Special Assessment Bond Phase I (Miscellaneous Revenue) | | | 3.00 | | | | 5-1-2018 | | | | 555,000 | | | | 557,792 | |
Sumter County FL Village Community Development District #5 Special Assessment Bond Phase II (Miscellaneous Revenue) | | | 3.00 | | | | 5-1-2018 | | | | 785,000 | | | | 788,949 | |
University of West Florida Foundation Incorporated Dormitory Series A (Housing Revenue) | | | 5.00 | | | | 6-1-2020 | | | | 1,210,000 | | | | 1,283,253 | |
University of West Florida Foundation Incorporated Dormitory Series A (Housing Revenue) | | | 5.00 | | | | 6-1-2021 | | | | 1,265,000 | | | | 1,368,629 | |
University of West Florida Foundation Incorporated Dormitory Series A (Housing Revenue) | | | 5.00 | | | | 6-1-2022 | | | | 1,325,000 | | | | 1,462,509 | |
University of West Florida Foundation Incorporated Dormitory Series A (Housing Revenue) | | | 5.00 | | | | 6-1-2023 | | | | 1,190,000 | | | | 1,337,750 | |
Wildwood FL Village Community Development District #12 Series 2016 (Miscellaneous Revenue) | | | 2.88 | | | | 5-1-2021 | | | | 995,000 | | | | 1,012,094 | |
| | | | |
| | | | | | | | | | | | | | | 30,523,681 | |
| | | | | | | | | | | | | | | | |
| | | | |
| Georgia: 3.26% | | | | | | | | | | | | | | | | |
Atlanta GA Development Authority Senior Health Care Facilities Proton Treatment Center Series A1 (Health Revenue) | | | 6.50 | | | | 1-1-2029 | | | | 2,520,000 | | | | 2,617,675 | |
Atlanta GA Water & Wastewater Project Series A-1 (1 Month LIBOR +1.50%) (Water & Sewer Revenue) ± | | | 2.55 | | | | 11-1-2038 | | | | 5,000,000 | | | | 5,013,750 | |
Burke County GA Development Authority Georgia Power Company Plant Vogtle Project First Series 2012 (Utilities Revenue) | | | 1.85 | | | | 12-1-2049 | | | | 3,000,000 | | | | 2,974,590 | |
Burke County GA Development Authority Oglethorpe Power Corporation Vogtle Project Series A (Utilities Revenue) | | | 2.40 | | | | 1-1-2040 | | | | 6,955,000 | | | | 6,879,816 | |
Cherokee County GA Water & Sewage Authority (Water & Sewer Revenue, National Insured) | | | 6.90 | | | | 8-1-2018 | | | | 5,000 | | | | 5,020 | |
The accompanying notes are an integral part of these financial statements.
| | | | | | |
| Portfolio of investments—December 31, 2017 (unaudited) | | Wells Fargo Strategic Municipal Bond Fund | | | 11 | |
| | | | | | | | | | | | | | | | |
| Security name | | Interest rate | | | Maturity date | | | Principal | | | Value | |
| | | | |
| Georgia (continued) | | | | | | | | | | | | | | | | |
Floyd County GA PCR Georgia Power Company Plant Hammond Project (Utilities Revenue) | | | 2.35 | % | | | 7-1-2022 | | | $ | 8,875,000 | | | $ | 8,842,429 | |
Gainesville & Hall Counties GA Hospital Authority Health System Project Series B (SIFMA Municipal Swap +0.95%) (Health Revenue) ± | | | 2.66 | | | | 8-15-2035 | | | | 6,000,000 | | | | 5,985,660 | |
Georgia Private Colleges & Universities Authority (Education Revenue) | | | 5.00 | | | | 10-1-2019 | | | | 1,325,000 | | | | 1,389,740 | |
Georgia Road & Tollway Authority I-75 S Express Lanes Project Series A (Transportation Revenue) 144A¤ | | | 0.00 | | | | 6-1-2024 | | | | 2,500,000 | | | | 1,743,225 | |
Main Street Natural Gas Incorporated Georgia Gas Project Series B (Utilities Revenue) | | | 5.00 | | | | 3-15-2018 | | | | 5,485,000 | | | | 5,521,475 | |
Georgia Medical Center Hospital Authority Taxable Refunding Bond Columbus Regional Healthcare System Incorporated Project (Health Revenue) | | | 4.88 | | | | 8-1-2022 | | | | 17,780,000 | | | | 18,473,242 | |
Monroe County GA Power & Light Company Project Series 2017 (Utilities Revenue) ø | | | 2.00 | | | | 11-1-2047 | | | | 2,000,000 | | | | 2,000,000 | |
Monroe County GA Development Authority Pollution Control Gulf Power Company Plant Scherer Project (Utilities Revenue) | | | 1.40 | | | | 6-1-2049 | | | | 3,750,000 | | | | 3,688,688 | |
| | | | |
| | | | | | | | | | | | | | | 65,135,310 | |
| | | | | | | | | | | | | | | | |
| | | | |
| Guam: 0.05% | | | | | | | | | | | | | | | | |
Guam Government Waterworks Authority Water & Wastewater System Series 2014A (Water & Sewer Revenue) | | | 5.00 | | | | 7-1-2020 | | | | 1,000,000 | | | | 1,065,090 | |
| | | | | | | | | | | | | | | | |
| | | | |
| Hawaii: 0.52% | | | | | | | | | | | | | | | | |
Hawaii Department of Budget and Finance Queens Health System Series B (SIFMA Municipal Swap +0.45%) (Health Revenue) ± | | | 2.16 | | | | 7-1-2039 | | | | 10,310,000 | | | | 10,310,000 | |
| | | | | | | | | | | | | | | | |
| | | | |
| Illinois: 16.42% | | | | | | | | | | | | | | | | |
Chicago IL Board of Education Series A (SIFMA Municipal Swap +0.83%) (GO Revenue) ± | | | 2.54 | | | | 3-1-2036 | | | | 17,200,000 | | | | 17,139,112 | |
Chicago IL CAB City Colleges (GO Revenue, National Insured) ¤ | | | 0.00 | | | | 1-1-2027 | | | | 7,720,000 | | | | 5,507,525 | |
Chicago IL CAB City Colleges Series 1999 (GO Revenue, National Insured) ¤ | | | 0.00 | | | | 1-1-2024 | | | | 9,800,000 | | | | 7,903,602 | |
Chicago IL Metropolitan Pier & Exposition Authority Unrefunded Bond (National Insured) ¤ | | | 0.00 | | | | 12-15-2023 | | | | 845,000 | | | | 685,777 | |
Chicago IL Metropolitan Pier & Exposition Authority Prerefunded Bond (National Insured) | | | 5.70 | | | | 6-15-2025 | | | | 220,000 | | | | 257,943 | |
Chicago IL Metropolitan Pier & Exposition Authority Unrefunded Bond (National Insured) | | | 5.70 | | | | 6-15-2025 | | | | 780,000 | | | | 885,713 | |
Chicago IL Metropolitan Pier & Exposition Authority McCormick Series A (Tax Revenue, National Insured) ¤ | | | 0.00 | | | | 12-15-2022 | | | | 1,390,000 | | | | 1,178,651 | |
Chicago IL Metropolitan Pier & Exposition Authority McCormick Series B (Tax Revenue) | | | 5.00 | | | | 12-15-2028 | | | | 14,090,000 | | | | 15,176,339 | |
Chicago IL Metropolitan Pier & Expostion Authority Prerefunded Bond (National Insured) ¤ | | | 0.00 | | | | 12-15-2023 | | | | 20,000 | | | | 17,642 | |
Chicago IL Motor Fuel Tax Refunding Bonds Series 2013 (Tax Revenue) | | | 5.00 | | | | 1-1-2021 | | | | 1,450,000 | | | | 1,532,882 | |
Chicago IL Motor Fuel Tax Refunding Bonds Series 2013 (Tax Revenue) | | | 5.00 | | | | 1-1-2022 | | | | 1,810,000 | | | | 1,937,569 | |
Chicago IL Motor Fuel Tax Refunding Bonds Series 2013 (Tax Revenue) | | | 5.00 | | | | 1-1-2023 | | | | 2,400,000 | | | | 2,600,256 | |
Chicago IL Motor Fuel Tax Refunding Bonds Series 2013 (Tax Revenue) | | | 5.00 | | | | 1-1-2024 | | | | 2,475,000 | | | | 2,704,952 | |
Chicago IL Motor Fuel Tax Refunding Bonds Series 2013 (Tax Revenue) | | | 5.00 | | | | 1-1-2025 | | | | 1,000,000 | | | | 1,087,240 | |
Chicago IL O’Hare International Airport Senior Lien Bonds Series 2015 C (Airport Revenue) | | | 5.00 | | | | 1-1-2022 | | | | 695,000 | | | | 774,098 | |
Chicago IL O’Hare International Airport Senior Lien Bonds Series 2015 D (Airport Revenue) | | | 5.00 | | | | 1-1-2021 | | | | 500,000 | | | | 545,520 | |
Chicago IL O’Hare International Airport Customer Facility Charge (Airport Revenue) | | | 5.25 | | | | 1-1-2023 | | | | 1,350,000 | | | | 1,536,206 | |
Chicago IL O’Hare International Airport Customer Facility Charge (Airport Revenue) | | | 5.25 | | | | 1-1-2024 | | | | 1,415,000 | | | | 1,615,916 | |
The accompanying notes are an integral part of these financial statements.
| | | | |
| 12 | | Wells Fargo Strategic Municipal Bond Fund | | Portfolio of investments—December 31, 2017 (unaudited) |
| | | | | | | | | | | | | | | | |
| Security name | | Interest rate | | | Maturity date | | | Principal | | | Value | |
| | | | |
| Illinois (continued) | | | | | | | | | | | | | | | | |
Chicago IL Park District General Obligation Limited Series A (GO Revenue) | | | 5.00 | % | | | 1-1-2022 | | | $ | 400,000 | | | $ | 441,316 | |
Chicago IL Park District General Obligation Limited Series A (GO Revenue) | | | 5.00 | | | | 1-1-2023 | | | | 400,000 | | | | 450,280 | |
Chicago IL Park District General Obligation Limited Series A (GO Revenue) | | | 5.00 | | | | 1-1-2024 | | | | 550,000 | | | | 628,408 | |
Chicago IL Park District General Obligation Limited Series A (GO Revenue) | | | 5.00 | | | | 1-1-2025 | | | | 625,000 | | | | 723,825 | |
Chicago IL Park District General Obligation Limited Series C (GO Revenue) | | | 5.00 | | | | 1-1-2022 | | | | 1,000,000 | | | | 1,103,290 | |
Chicago IL Park District General Obligation Limited Series C (GO Revenue) | | | 5.00 | | | | 1-1-2024 | | | | 410,000 | | | | 468,450 | |
Chicago IL Park District General Obligation Series C (GO Revenue) | | | 5.00 | | | | 1-1-2023 | | | | 1,000,000 | | | | 1,125,700 | |
Chicago IL Park District Harbor Facilities Series D (GO Revenue) | | | 5.00 | | | | 1-1-2022 | | | | 1,645,000 | | | | 1,814,912 | |
Chicago IL Park District Harbor Facilities Series D (GO Revenue) | | | 5.00 | | | | 1-1-2023 | | | | 1,175,000 | | | | 1,322,698 | |
Chicago IL Park District Limited Tax Series B (GO Revenue) | | | 5.00 | | | | 1-1-2022 | | | | 4,495,000 | | | | 4,959,289 | |
Chicago IL Park District Unlimited Tax Series E (GO Revenue) | | | 5.00 | | | | 11-15-2022 | | | | 1,235,000 | | | | 1,385,250 | |
Chicago IL Park District Unlimited Tax Series E (GO Revenue) | | | 5.00 | | | | 11-15-2023 | | | | 1,295,000 | | | | 1,478,955 | |
Chicago IL Series A (Tax Revenue) | | | 5.00 | | | | 1-1-2029 | | | | 5,000,000 | | | | 5,327,300 | |
Chicago IL Series A (GO Revenue) | | | 5.25 | | | | 1-1-2022 | | | | 2,275,000 | | | | 2,279,482 | |
Chicago IL Series C (GO Revenue) | | | 5.00 | | | | 1-1-2021 | | | | 1,000,000 | | | | 1,067,520 | |
Chicago IL Series C (GO Revenue) | | | 5.00 | | | | 1-1-2022 | | | | 2,250,000 | | | | 2,433,195 | |
Chicago IL Series C (GO Revenue) | | | 5.00 | | | | 1-1-2023 | | | | 2,500,000 | | | | 2,723,050 | |
Chicago IL Series C (GO Revenue) | | | 5.00 | | | | 1-1-2025 | | | | 4,865,000 | | | | 5,365,025 | |
Chicago IL Series D (GO Revenue, Ambac Insured) | | | 5.00 | | | | 12-1-2022 | | | | 3,915,000 | | | | 3,928,154 | |
Chicago IL Series G (GO Revenue, Ambac Insured) | | | 5.00 | | | | 12-1-2024 | | | | 1,030,000 | | | | 1,033,492 | |
Chicago IL Tax Increment Bond Pilson Redevelopment Project Series A (Tax Revenue) | | | 5.00 | | | | 6-1-2022 | | | | 1,635,000 | | | | 1,818,414 | |
Chicago IL Transit Authority Capital Grant Federal Transit Administration Section 5307-A (Transportation Revenue, AGC Insured) | | | 5.25 | | | | 6-1-2022 | | | | 2,100,000 | | | | 2,133,159 | |
Chicago IL Transit Authority Capital Grant Receipts Refunding Bond Series 2011 (Miscellaneous Revenue, AGM Insured) | | | 5.25 | | | | 6-1-2024 | | | | 4,450,000 | | | | 4,887,435 | |
Chicago IL Unrefunded Balance Bond Series A (GO Revenue, AGM Insured) | | | 5.00 | | | | 1-1-2024 | | | | 75,000 | | | | 75,188 | |
Chicago IL Wastewater Transmission Second Lien Series A (Water & Sewer Revenue) | | | 4.00 | | | | 1-1-2018 | | | | 1,195,000 | | | | 1,195,000 | |
Chicago lL Series A (Tax Revenue) | | | 5.00 | | | | 1-1-2022 | | | | 3,000,000 | | | | 3,196,380 | |
Cook County IL Refunding Bonds Series 2010 G (GO Revenue) | | | 5.00 | | | | 11-15-2026 | | | | 1,000,000 | | | | 1,073,600 | |
Cook County IL School District #153 Homewood Series A (GO Revenue, AGM Insured) ¤ | | | 0.00 | | | | 12-15-2023 | | | | 1,225,000 | | | | 1,029,723 | |
Cook County IL School District #123 Oak Lawn CAB (GO Revenue, National Insured) ¤ | | | 0.00 | | | | 12-1-2021 | | | | 1,090,000 | | | | 978,809 | |
Cook County IL School District #227 Rich (GO Revenue) | | | 3.00 | | | | 12-1-2024 | | | | 965,000 | | | | 980,073 | |
Cook County IL Series A (GO Revenue) | | | 5.00 | | | | 11-15-2021 | | | | 2,250,000 | | | | 2,491,065 | |
Cook County IL Series A (GO Revenue) | | | 5.25 | | | | 11-15-2022 | | | | 11,040,000 | | | | 12,029,825 | |
Cook County IL Series C (GO Revenue, National Insured) | | | 5.00 | | | | 11-15-2020 | | | | 1,150,000 | | | | 1,153,715 | |
Cook County IL Series C (GO Revenue, National Insured) | | | 5.00 | | | | 11-15-2021 | | | | 5,000,000 | | | | 5,016,100 | |
De Kalb & Kane Counties IL Community Unified School District #427 Sycamore CAB Series B (GO Revenue, AGM Insured) ¤ | | | 0.00 | | | | 1-1-2024 | | | | 5,630,000 | | | | 4,726,385 | |
DuPage County IL Forest Preservation District Series 2015 (GO Revenue) | | | 5.00 | | | | 1-1-2023 | | | | 2,455,000 | | | | 2,813,479 | |
Illinois Finance Authority Friendship Village of Schaumburg Series 2017 (Health Revenue) | | | 5.00 | | | | 2-15-2021 | | | | 2,555,000 | | | | 2,663,306 | |
Illinois Finance Authority Rosalind Franklin University of Medicine & Science Series A (Health Revenue) | | | 3.25 | | | | 2-15-2022 | | | | 550,000 | | | | 554,076 | |
Illinois Finance Authority Three Crowns Park (Health Revenue) | | | 4.00 | | | | 2-15-2027 | | | | 785,000 | | | | 798,235 | |
Illinois Metropolitan Pier & Exposition Authority CAB McCormick Place Project Series B (Tax Revenue) | | | 5.00 | | | | 12-15-2022 | | | | 11,520,000 | | | | 11,547,072 | |
Illinois Refunding Bond (Miscellaneous Revenue, AGM Insured) | | | 5.00 | | | | 8-1-2020 | | | | 5,050,000 | | | | 5,402,389 | |
Illinois Refunding Bond (Miscellaneous Revenue) | | | 5.00 | | | | 8-1-2020 | | | | 5,000,000 | | | | 5,243,650 | |
The accompanying notes are an integral part of these financial statements.
| | | | | | |
| Portfolio of investments—December 31, 2017 (unaudited) | | Wells Fargo Strategic Municipal Bond Fund | | | 13 | |
| | | | | | | | | | | | | | | | |
| Security name | | Interest rate | | | Maturity date | | | Principal | | | Value | |
| | | | |
| Illinois (continued) | | | | | | | | | | | | | | | | |
Illinois Refunding Bonds Series 2016 (Miscellaneous Revenue) | | | 5.00 | % | | | 2-1-2026 | | | $ | 7,000,000 | | | $ | 7,650,650 | |
Illinois Sports Facilities Authority Series 2014 (Tax Revenue) | | | 5.00 | | | | 6-15-2022 | | | | 3,395,000 | | | | 3,600,228 | |
Illinois Sports Facilities Authority Series 2014 (Tax Revenue) | | | 5.00 | | | | 6-15-2023 | | | | 3,200,000 | | | | 3,428,032 | |
Illinois Sports Facilities Authority Series 2014 (Tax Revenue) | | | 5.00 | | | | 6-15-2024 | | | | 4,130,000 | | | | 4,455,155 | |
Illinois Sports Facilities Authority State Tax Supported CAB (Tax Revenue, Ambac Insured) ¤ | | | 0.00 | | | | 6-15-2026 | | | | 1,550,000 | | | | 1,115,597 | |
Illinois Sports Facilities Authority State Tax Supported CAB (Tax Revenue, Ambac Insured) ¤ | | | 0.00 | | | | 6-15-2018 | | | | 4,105,000 | | | | 4,056,274 | |
Illinois Sports Facilities Authority State Tax Supported CAB (Tax Revenue, Ambac Insured) ¤ | | | 0.00 | | | | 6-15-2022 | | | | 3,795,000 | | | | 3,237,856 | |
Illinois State Series 2012 (Miscellaneous Revenue) | | | 5.00 | | | | 8-1-2021 | | | | 5,620,000 | | | | 5,947,590 | |
Illinois State Series 2013 (Miscellaneous Revenue, AGM Insured) | | | 5.00 | | | | 7-1-2023 | | | | 4,875,000 | | | | 5,462,486 | |
Illinois State Series A (GO Revenue) | | | 5.00 | | | | 4-1-2020 | | | | 2,000,000 | | | | 2,086,100 | |
Illinois State Series A (GO Revenue) | | | 5.00 | | | | 4-1-2023 | | | | 3,500,000 | | | | 3,749,375 | |
Illinois State Toll Highway Authority Priority RMKT-A- 2A (Transportation Revenue, Bank of Tokyo-Mitsubishi LOC) ø | | | 1.73 | | | | 7-1-2030 | | | | 2,000,000 | | | | 2,000,000 | |
Kane County IL Aurora West School District #129 (GO Revenue, AGM Insured) | | | 5.00 | | | | 2-1-2022 | | | | 6,290,000 | | | | 7,009,639 | |
Kane, Cook & DuPage Counties IL School District #46 Prerefunded CAB Series B (GO Revenue, Ambac Insured) ¤ | | | 0.00 | | | | 1-1-2021 | | | | 510,000 | | | | 481,782 | |
Kane, Cook & DuPage Counties IL School District #46 Unrefunded CAB Series B (GO Revenue, Ambac Insured) ¤ | | | 0.00 | | | | 1-1-2021 | | | | 595,000 | | | | 551,196 | |
Lake County IL Community Consolidated School District #3 Beach Park CAB (GO Revenue, Ambac Insured) ¤ | | | 0.00 | | | | 2-1-2018 | | | | 1,000,000 | | | | 996,800 | |
Lake County IL Community Consolidated School District #3 Beach Park CAB (GO Revenue, Ambac Insured) ¤ | | | 0.00 | | | | 2-1-2019 | | | | 1,100,000 | | | | 1,050,478 | |
Lake County IL School District #38 Big Hollow CAB (GO Revenue, Ambac Insured) ¤ | | | 0.00 | | | | 2-1-2019 | | | | 1,175,000 | | | | 1,141,889 | |
Lake County IL Water Sewerage System Grainger Incorporated Project (, Northern Trust Company LIQ) ø | | | 1.95 | | | | 4-1-2021 | | | | 1,500,000 | | | | 1,500,000 | |
McHenry & Kane Counties IL Community Consolidated School District #158 CAB (GO Revenue, National Insured) ¤ | | | 0.00 | | | | 1-1-2018 | | | | 4,000,000 | | | | 4,000,000 | |
McHenry & Kane Counties IL Community Consolidated School District #158 CAB (GO Revenue, AGM/FGIC Insured) ¤ | | | 0.00 | | | | 1-1-2019 | | | | 1,185,000 | | | | 1,166,715 | |
Railsplitter Tobacco Settlement Authority (Tobacco Revenue) | | | 5.00 | | | | 6-1-2023 | | | | 18,000,000 | | | | 20,215,440 | |
Railsplitter Tobacco Settlement Authority (Tobacco Revenue) | | | 6.25 | | | | 6-1-2024 | | | | 22,750,000 | | | | 22,789,130 | |
Rockford IL Waterworks System Series B (GO Revenue, Build America Mutual Assurance Company Insured) | | | 5.00 | | | | 12-15-2020 | | | | 1,000,000 | | | | 1,078,350 | |
Rockford IL Waterworks System Series B (GO Revenue, Build America Mutual Assurance Company Insured) | | | 5.00 | | | | 12-15-2021 | | | | 1,015,000 | | | | 1,117,099 | |
Rockford IL Waterworks System Series B (GO Revenue, Build America Mutual Assurance Company Insured) | | | 5.00 | | | | 12-15-2022 | | | | 1,065,000 | | | | 1,194,557 | |
Romeoville IL Series B (GO Revenue, AGC Insured) ¤ | | | 0.00 | | | | 12-30-2023 | | | | 3,410,000 | | | | 2,535,744 | |
Romeoville IL Series B (GO Revenue, AGC Insured) ¤ | | | 0.00 | | | | 12-30-2024 | | | | 2,840,000 | | | | 1,993,822 | |
Sales Tax Securitization Corporation Series 2017A (Tax Revenue) | | | 5.00 | | | | 1-1-2025 | | | | 1,370,000 | | | | 1,622,299 | |
Sales Tax Securitization Corporation Series 2017A (Tax Revenue) | | | 5.00 | | | | 1-1-2026 | | | | 3,215,000 | | | | 3,866,391 | |
St. Charles, Kane & Dupage Counties IL Series 2016 (Tax Revenue) | | | 4.00 | | | | 1-1-2020 | | | | 760,000 | | | | 770,921 | |
St. Charles, Kane & Dupage Counties IL Series 2016 (Tax Revenue) | | | 3.00 | | | | 1-1-2018 | | | | 200,000 | | | | 200,000 | |
St. Charles, Kane & Dupage Counties IL Series 2016 (Tax Revenue) | | | 3.00 | | | | 1-1-2019 | | | | 300,000 | | | | 299,382 | |
St. Charles, Kane & Dupage Counties IL Series 2016 (Tax Revenue) | | | 4.00 | | | | 1-1-2021 | | | | 790,000 | | | | 804,963 | |
St. Charles, Kane & Dupage Counties IL Series 2016 (Tax Revenue) | | | 4.00 | | | | 1-1-2022 | | | | 820,000 | | | | 827,232 | |
St. Charles, Kane & Dupage Counties IL Series 2016 (Tax Revenue) | | | 4.00 | | | | 1-1-2023 | | | | 855,000 | | | | 860,002 | |
St. Charles, Kane & Dupage Counties IL Series 2016 (Tax Revenue) | | | 4.00 | | | | 1-1-2024 | | | | 885,000 | | | | 884,062 | |
The accompanying notes are an integral part of these financial statements.
| | | | |
| 14 | | Wells Fargo Strategic Municipal Bond Fund | | Portfolio of investments—December 31, 2017 (unaudited) |
| | | | | | | | | | | | | | | | |
| Security name | | Interest rate | | | Maturity date | | | Principal | | | Value | |
| | | | |
| Illinois (continued) | | | | | | | | | | | | | | | | |
St. Charles, Kane & Dupage Counties IL Series 2016 (Tax Revenue) | | | 4.00 | % | | | 1-1-2025 | | | $ | 925,000 | | | $ | 912,235 | |
St. Clair County IL School District Series B (GO Revenue, National Insured) | | | 4.75 | | | | 1-1-2018 | | | | 655,000 | | | | 655,000 | |
Will County IL Lincoln-Way Community High School District #210 (GO Revenue, AGM Insured) ¤ | | | 0.00 | | | | 1-1-2021 | | | | 1,535,000 | | | | 1,387,594 | |
Will County IL Lincoln-Way Community High School District #210 (GO Revenue, AGM Insured) ¤ | | | 0.00 | | | | 1-1-2025 | | | | 14,285,000 | | | | 11,114,730 | |
Will County IL Lincoln-Way Community High School District #210 Unrefunded CAB (GO Revenue, AGM Insured) ¤ | | | 0.00 | | | | 1-1-2026 | | | | 8,295,000 | | | | 6,182,844 | |
Will County IL Lincoln-Way Community High School District #210 (GO Revenue) | | | 4.00 | | | | 1-1-2022 | | | | 1,630,000 | | | | 1,613,407 | |
Will County IL School District #114 Manhattan CAB Series C (GO Revenue, National Insured) ¤ | | | 0.00 | | | | 12-1-2021 | | | | 1,055,000 | | | | 943,012 | |
Winnebago & Boone Counties IL School District #205 Series A (GO Revenue) ¤ | | | 0.00 | | | | 2-1-2021 | | | | 1,305,000 | | | | 1,202,336 | |
Winnebago & Boone Counties IL School District #205 Series B (GO Revenue) ¤ | | | 0.00 | | | | 2-1-2021 | | | | 3,400,000 | | | | 3,132,522 | |
| | | | |
| | | | | | | | | | | | | | | 327,844,528 | |
| | | | | | | | | | | | | | | | |
| | | | |
| Indiana: 2.46% | | | | | | | | | | | | | | | | |
Anderson IN Economic Development Anderson University (Education Revenue) | | | 3.75 | | | | 10-1-2022 | | | | 2,535,000 | | | | 2,501,285 | |
Hammond IN Local Public Improvement Bond Bank Advance Funding Program Series A (Miscellaneous Revenue) %% | | | 2.13 | | | | 6-30-2018 | | | | 4,395,000 | | | | 4,395,747 | |
Indiana Finance Authority Parkview Health Project Prerefunded Bond (Health Revenue) | | | 5.50 | | | | 5-1-2024 | | | | 4,310,000 | | | | 4,524,035 | |
Indiana Finance Authority Parkview Health Project Unrefunded Bond (Health Revenue) | | | 5.50 | | | | 5-1-2024 | | | | 945,000 | | | | 995,123 | |
Indiana HFFA Ancilla System Incorporated (Health Revenue, National Insured) | | | 5.25 | | | | 7-1-2022 | | | | 325,000 | | | | 325,546 | |
Indiana Housing and CDA Affordable Assisted Living Project Series 2017 (Housing Revenue) | | | 1.80 | | | | 12-1-2019 | | | | 17,030,000 | | | | 17,013,311 | |
Indiana Housing and Community Development Authority Series A-2 (Housing Revenue, GNMA/FNMA/FHLMC Insured) ø | | | 2.16 | | | | 7-1-2039 | | | | 1,035,000 | | | | 1,035,000 | |
Knox County IN EDA Good Samaritan Hospital Series A (Health Revenue) | | | 4.00 | | | | 4-1-2018 | | | | 400,000 | | | | 401,236 | |
Michigan IN City School Building Corporation Series 2016A (Miscellaneous Revenue) | | | 5.00 | | | | 1-15-2025 | | | | 1,000,000 | | | | 1,181,070 | |
Tender Option Bond Trust Receipts/Floater Certificates Series 2015-XF0115 (Utilities Revenue, JPMorgan Chase & Company LIQ) 144Aø | | | 2.06 | | | | 4-15-2019 | | | | 2,300,000 | | | | 2,300,000 | |
Whiting IN BP Products North America Incorporated Project (Industrial Development Revenue) | | | 1.85 | | | | 6-1-2044 | | | | 3,000,000 | | | | 3,018,510 | |
Whiting IN BP Products North America Incorporated Project (Resource Recovery Revenue) | | | 2.46 | | | | 12-1-2044 | | | | 11,400,000 | | | | 11,425,878 | |
| | | | |
| | | | | | | | | | | | | | | 49,116,741 | |
| | | | | | | | | | | | | | | | |
| | | | |
| Iowa: 0.13% | | | | | | | | | | | | | | | | |
Iowa Finance Authority Midwestern Disaster Area Project (Industrial Development Revenue, Korea Development Bank LOC) ø | | | 1.90 | | | | 4-1-2022 | | | | 2,500,000 | | | | 2,500,000 | |
| | | | | | | | | | | | | | | | |
| | | | |
| Kansas: 0.58% | | | | | | | | | | | | | | | | |
Lawrence KS Series A (Industrial Development Revenue, U.S. Bank NA LOC) ø | | | 2.10 | | | | 12-1-2018 | | | | 375,000 | | | | 375,000 | |
Wyandotte County & Kansas City KS Special Obligation Refunding & Improvement Bonds Plaza Redevelopment Project (Tax Revenue) | | | 4.00 | | | | 12-1-2028 | | | | 910,000 | | | | 923,714 | |
Wyandotte County & Kansas City KS Special Obligation Vacation Village Project Area 4 Major Multi-Sport Athletic Complex Project CAB Series 2015 (Tax Revenue) 144A¤ | | | 0.00 | | | | 9-1-2034 | | | | 28,250,000 | | | | 10,264,073 | |
| | | | |
| | | | | | | | | | | | | | | 11,562,787 | |
| | | | | | | | | | | | | | | | |
The accompanying notes are an integral part of these financial statements.
| | | | | | |
| Portfolio of investments—December 31, 2017 (unaudited) | | Wells Fargo Strategic Municipal Bond Fund | | | 15 | |
| | | | | | | | | | | | | | | | |
| Security name | | Interest rate | | | Maturity date | | | Principal | | | Value | |
| | | | |
| Kentucky: 2.79% | | | | | | | | | | | | | | | | |
Christian County KY Jennie Stuart Medical Center (Health Revenue, AGC Insured) | | | 5.25 | % | | | 2-1-2018 | | | $ | 535,000 | | | $ | 536,610 | |
Kentucky EDFA Healthcare Facilities Rosedale Green Project Series 2015 (Health Revenue) | | | 2.75 | | | | 11-15-2018 | | | | 300,000 | | | | 299,613 | |
Kentucky EDFA Healthcare Facilities Rosedale Green Project Series 2015 (Health Revenue) | | | 3.00 | | | | 11-15-2019 | | | | 350,000 | | | | 348,922 | |
Kentucky EDFA Healthcare Facilities Rosedale Green Project Series 2015 (Health Revenue) | | | 3.35 | | | | 11-15-2020 | | | | 335,000 | | | | 334,266 | |
Kentucky EDFA Healthcare Facilities Rosedale Green Project Series 2015 (Health Revenue) | | | 5.00 | | | | 11-15-2025 | | | | 1,500,000 | | | | 1,527,840 | |
Kentucky EDFA Norton Healthcare Incorporated Series B (Health Revenue, National Insured) ¤ | | | 0.00 | | | | 10-1-2022 | | | | 1,000,000 | | | | 880,970 | |
Kentucky EDFA Series 2980 (Health Revenue, Morgan Stanley Bank LIQ) 144Aø | | | 2.03 | | | | 8-15-2024 | | | | 10,500,000 | | | | 10,500,000 | |
Kentucky Housing Corporate Watterson Lakeview Project (Housing Revenue) | | | 0.95 | | | | 7-1-2018 | | | | 5,000,000 | | | | 4,987,600 | |
Kentucky Municipal Power Agency Prairie State Project Series B (SIFMA Municipal Swap +1.40%) (Utilities Revenue) ± | | | 3.11 | | | | 9-1-2042 | | | | 6,500,000 | | | | 6,501,625 | |
Louisville & Jefferson Counties KY Metropolitan Sewer and Drainage System Subordinate BAN (Water & Sewer Revenue) | | | 5.00 | | | | 11-12-2018 | | | | 29,000,000 | | | | 29,855,210 | |
| | | | |
| | | | | | | | | | | | | | | 55,772,656 | |
| | | | | | | | | | | | | | | | |
| | | | |
| Louisiana: 1.93% | | | | | | | | | | | | | | | | |
Louisiana Housing Corporation The Meadows at Nicholson Project Series 2017 (Housing Revenue) | | | 1.83 | | | | 5-1-2020 | | | | 15,500,000 | | | | 15,480,470 | |
Louisiana Housing Corporation Harmony Gaeden Estates Project Series 2017 (Housing Revenue) | | | 1.86 | | | | 12-1-2020 | | | | 13,500,000 | | | | 13,496,220 | |
Louisiana Public Facilities Authority Loyola University Project Series 2011 (Education Revenue) | | | 5.25 | | | | 10-1-2025 | | | | 2,815,000 | | | | 3,063,649 | |
Louisiana Public Facilities Authority Loyola University Project Series 2017 (Education Revenue) ¤ | | | 0.00 | | | | 10-1-2020 | | | | 1,000,000 | | | | 920,780 | |
Louisiana Public Facilities Authority Loyola University Project Series 2017 (Education Revenue) ¤ | | | 0.00 | | | | 10-1-2021 | | | | 950,000 | | | | 845,396 | |
Louisiana Public Facilities Authority Loyola University Project Series 2017 (Education Revenue) ¤ | | | 0.00 | | | | 10-1-2022 | | | | 1,500,000 | | | | 1,287,855 | |
St. Bernard Parish LA Series 2012 (Tax Revenue) | | | 4.00 | | | | 3-1-2019 | | | | 3,355,000 | | | | 3,443,270 | |
| | | | |
| | | | | | | | | | | | | | | 38,537,640 | |
| | | | | | | | | | | | | | | | |
| | | | |
| Maryland: 2.91% | | | | | | | | | | | | | | | | |
Baltimore MD Series A (Water & Sewer Revenue, National Insured) | | | 5.65 | | | | 7-1-2020 | | | | 3,150,000 | | | | 3,300,003 | |
Howard County MD Housing Commission Series A (SIFMA Municipal Swap +1.25%) (Housing Revenue) ± | | | 2.96 | | | | 7-1-2034 | | | | 6,665,000 | | | | 6,665,467 | |
Maryland Community Development Administration Golden Ring Cooperative Apartments (Housing Revenue) | | | 2.00 | | | | 7-1-2018 | | | | 10,000,000 | | | | 9,989,300 | |
Maryland Community Development Administration Park Heights Apartments Series 2016 (Housing Revenue) | | | 2.15 | | | | 12-1-2018 | | | | 8,500,000 | | | | 8,503,060 | |
Maryland Community Development Administration Pleasant View Gardens Townhouses Series F (Housing Revenue) | | | 1.20 | | | | 7-1-2018 | | | | 12,300,000 | | | | 12,267,774 | |
Maryland GO State and Local Facilities Loan of 2015 (GO Revenue) | | | 5.00 | | | | 8-1-2024 | | | | 8,905,000 | | | | 10,303,174 | |
Prince Georges County MD Chesapeake Lighthouse Charter School Project Series 2015 (Education Revenue) 144A | | | 5.25 | | | | 8-1-2022 | | | | 1,630,000 | | | | 1,716,488 | |
Prince Georges County MD Chesapeake Lighthouse Charter School Project Series 2016 (Education Revenue) | | | 5.00 | | | | 8-1-2026 | | | | 1,335,000 | | | | 1,401,403 | |
Rockville MD Mayor & Council Economic Development Ingleside King Farm Project 45 Series C-3 (Health Revenue) | | | 2.50 | | | | 11-1-2024 | | | | 4,000,000 | | | | 4,011,920 | |
| | | | |
| | | | | | | | | | | | | | | 58,158,589 | |
| | | | | | | | | | | | | | | | |
The accompanying notes are an integral part of these financial statements.
| | | | |
| 16 | | Wells Fargo Strategic Municipal Bond Fund | | Portfolio of investments—December 31, 2017 (unaudited) |
| | | | | | | | | | | | | | | | |
| Security name | | Interest rate | | | Maturity date | | | Principal | | | Value | |
| | | | |
| Massachusetts: 1.30% | | | | | | | | | | | | | | | | |
Massachusetts Consolidated Loan Series D (SIFMA Municipal Swap +0.43%) (Tax Revenue) ± | | | 2.14 | % | | | 1-1-2018 | | | $ | 3,000,000 | | | $ | 3,000,000 | |
Massachusetts Development Finance Agency Sabis International Charter School Series 2015 (Education Revenue) | | | 5.00 | | | | 4-15-2025 | | | | 1,000,000 | | | | 1,127,840 | |
Massachusetts Development Finance Agency Partners Healthcare System Issue Series S-3 (SIFMA Municipal Swap +0.50%) (Health Revenue) ± | | | 2.21 | | | | 7-1-2038 | | | | 14,870,000 | | | | 14,870,000 | |
Massachusetts Educational Financing Authority Series J (Education Revenue) | | | 5.00 | | | | 7-1-2018 | | | | 750,000 | | | | 762,510 | |
Massachusetts Educational Financing Authority Series J (Education Revenue) | | | 5.00 | | | | 7-1-2019 | | | | 6,000,000 | | | | 6,277,320 | |
| | | | |
| | | | | | | | | | | | | | | 26,037,670 | |
| | | | | | | | | | | | | | | | |
| | | | |
| Michigan: 3.59% | | | | | | | | | | | | | | | | |
Constantine MI Public Schools (GO Revenue, Qualified School Board Loan Fund Insured) | | | 5.00 | | | | 5-1-2020 | | | | 350,000 | | | | 375,494 | |
Constantine MI Public Schools (GO Revenue, Qualified School Board Loan Fund Insured) | | | 5.00 | | | | 5-1-2021 | | | | 1,200,000 | | | | 1,322,652 | |
Detroit MI Water & Sewage Department Series A (Water & Sewer Revenue) | | | 5.00 | | | | 7-1-2022 | | | | 1,000,000 | | | | 1,115,570 | |
Detroit MI Wayne County Stadium Authority (Miscellaneous Revenue) | | | 5.00 | | | | 10-1-2018 | | | | 3,425,000 | | | | 3,420,034 | |
Flint MI Hospital Building Authority Hurley Medical Center Series 2013B (Health Revenue) | | | 3.75 | | | | 7-1-2018 | | | | 2,250,000 | | | | 2,262,285 | |
Forest Hills MI Public Schools (GO Revenue) | | | 5.00 | | | | 5-1-2020 | | | | 1,600,000 | | | | 1,718,064 | |
Forest Hills MI Public Schools (GO Revenue) | | | 5.00 | | | | 5-1-2021 | | | | 1,600,000 | | | | 1,765,712 | |
Fraser MI Public Schools District (GO Revenue, Qualified School Board Loan Fund Insured) | | | 5.00 | | | | 5-1-2021 | | | | 1,000,000 | | | | 1,104,250 | |
Fraser MI Public Schools District (GO Revenue, Qualified School Board Loan Fund Insured) | | | 5.00 | | | | 5-1-2022 | | | | 610,000 | | | | 688,733 | |
Hudsonville MI Public Schools (GO Revenue, Qualified School Board Loan Fund Insured) | | | 5.00 | | | | 5-1-2021 | | | | 1,465,000 | | | | 1,618,737 | |
Ingham County MI Williamston Community Schools Series A (GO Revenue, Qualified School Board Loan Fund Insured) | | | 4.00 | | | | 5-1-2024 | | | | 1,025,000 | | | | 1,114,442 | |
Ingham County MI Williamston Community Schools Series A (GO Revenue, Qualified School Board Loan Fund Insured) | | | 4.00 | | | | 5-1-2025 | | | | 1,000,000 | | | | 1,091,440 | |
Michigan Finance Authority Detroit Recovery Project Series 2014F (Tax Revenue) | | | 3.88 | | | | 10-1-2023 | | | | 2,500,000 | | | | 2,585,150 | |
Michigan Finance Authority Detroit Recovery Project Series 2014F (Tax Revenue) | | | 3.40 | | | | 10-1-2020 | | | | 500,000 | | | | 502,460 | |
Michigan Finance Authority Detroit Recovery Project Series 2014F (Tax Revenue) | | | 3.60 | | | | 10-1-2021 | | | | 500,000 | | | | 507,340 | |
Michigan Finance Authority Detroit Recovery Project Series 2014F (Tax Revenue) | | | 3.80 | | | | 10-1-2022 | | | | 500,000 | | | | 513,090 | |
Michigan Finance Authority Series 25-A (Education Revenue) | | | 5.00 | | | | 11-1-2018 | | | | 3,100,000 | | | | 3,176,663 | |
Michigan Finance Authority Series 25-A (Education Revenue) | | | 5.00 | | | | 11-1-2019 | | | | 1,500,000 | | | | 1,574,790 | |
Michigan Finance Authority Series H-1 (Tax Revenue) | | | 5.00 | | | | 10-1-2021 | | | | 1,565,000 | | | | 1,684,942 | |
Michigan Finance Authority St. John Health System Series A (Health Revenue, Ambac Insured) | | | 5.00 | | | | 5-15-2018 | | | | 300,000 | | | | 300,771 | |
Michigan Financial Authority Local Government Loan Program Series C7 (Water & Sewer Revenue, National Insured) | | | 5.00 | | | | 7-1-2022 | | | | 2,000,000 | | | | 2,276,060 | |
Michigan Financial Authority Local Government Loan Program Series D1 (Water & Sewer Revenue, AGM Insured) | | | 5.00 | | | | 7-1-2022 | | | | 2,700,000 | | | | 3,035,367 | |
Michigan Financial Authority Local Government Loan Program Series D1 (Water & Sewer Revenue, AGM Insured) | | | 5.00 | | | | 7-1-2023 | | | | 2,000,000 | | | | 2,287,220 | |
Michigan Financial Authority Local Government Loan Program Series D6 (Water & Sewer Revenue, National Insured) | | | 5.00 | | | | 7-1-2022 | | | | 2,080,000 | | | | 2,367,102 | |
Michigan Financial Authority Local Government Loan Program Series D6 (Water & Sewer Revenue, National Insured) | | | 5.00 | | | | 7-1-2023 | | | | 3,670,000 | | | | 4,247,768 | |
The accompanying notes are an integral part of these financial statements.
| | | | | | |
| Portfolio of investments—December 31, 2017 (unaudited) | | Wells Fargo Strategic Municipal Bond Fund | | | 17 | |
| | | | | | | | | | | | | | | | |
| Security name | | Interest rate | | | Maturity date | | | Principal | | | Value | |
| | | | |
| Michigan (continued) | | | | | | | | | | | | | | | | |
Michigan Financial Authority Local Government Loan Program Series D6 (Water & Sewer Revenue, National Insured) | | | 5.00 | % | | | 7-1-2024 | | | $ | 2,130,000 | | | $ | 2,496,126 | |
Michigan Housing Development Authority Series D (Housing Revenue, Industrial and Commercial Bank of China Limited SPA) ø | | | 1.75 | | | | 6-1-2030 | | | | 1,915,000 | | | | 1,915,000 | |
Michigan Housing Development Authority Series E (3 Month LIBOR +1.00%) (Housing Revenue) ± | | | 1.94 | | | | 4-1-2042 | | | | 9,625,000 | | | | 9,653,971 | |
Michigan Municipal Bond Authority Local Government Loan Program Series A (Miscellaneous Revenue, Ambac Insured) | | | 4.00 | | | | 11-1-2019 | | | | 500,000 | | | | 500,810 | |
Michigan Municipal Bond Authority Local Government Loan Program Series A (Miscellaneous Revenue, Ambac Insured) | | | 5.00 | | | | 5-1-2018 | | | | 295,000 | | | | 295,575 | |
Michigan Municipal Bond Authority Local Government Loan Program Series C (Miscellaneous Revenue, Ambac Insured) | | | 4.13 | | | | 5-1-2020 | | | | 500,000 | | | | 500,330 | |
Michigan Municipal Bond Authority Local Government Loan Program Series C (Miscellaneous Revenue, Ambac Insured) | | | 5.00 | | | | 5-1-2023 | | | | 1,900,000 | | | | 1,901,596 | |
Michigan Public Educational Facilities Authority Chandler Park Academy (Miscellaneous Revenue) | | | 6.35 | | | | 11-1-2028 | | | | 1,500,000 | | | | 1,501,965 | |
Michigan Strategic Fund Limited Obligation Events Center Project Series A (Tax Revenue) | | | 4.13 | | | | 7-1-2045 | | | | 9,000,000 | | | | 9,095,850 | |
Wayne County MI Airport Authority AMT Detroit Metropolitan Airport Series C (Airport Revenue) | | | 5.00 | | | | 12-1-2022 | | | | 1,000,000 | | | | 1,081,460 | |
| | | | |
| | | | | | | | | | | | | | | 71,598,819 | |
| | | | | | | | | | | | | | | | |
| | | | |
| Minnesota: 0.35% | | | | | | | | | | | | | | | | |
Cologne MN Charter School Lease Academy Project Series 2014A (Education Revenue) | | | 4.00 | | | | 7-1-2019 | | | | 170,000 | | | | 172,740 | |
Cologne MN Charter School Lease Academy Project Series 2014A (Education Revenue) | | | 4.00 | | | | 7-1-2023 | | | | 260,000 | | | | 268,284 | |
St. Paul MN Housing & RDA Charter School Hmong College Preparatory Academy Project Series A (Education Revenue) | | | 4.75 | | | | 9-1-2022 | | | | 500,000 | | | | 517,445 | |
St. Paul MN Housing & RDA Charter School Hmong College Preparatory Academy Project Series A (Education Revenue) | | | 5.00 | | | | 9-1-2026 | | | | 1,000,000 | | | | 1,044,210 | |
St. Paul MN Housing & RDA Great River School Project Series A (Education Revenue) 144A | | | 4.75 | | | | 7-1-2029 | | | | 250,000 | | | | 254,398 | |
St. Paul MN Housing & RDA Healtheast Care System Project Series 2015A (Health Revenue) | | | 5.25 | | | | 11-15-2035 | | | | 2,850,000 | | | | 3,120,095 | |
St. Paul MN Housing & RDA Healtheast Care System Project Series 2015A (Health Revenue) | | | 5.25 | | | | 11-15-2028 | | | | 1,505,000 | | | | 1,647,629 | |
| | | | |
| | | | | | | | | | | | | | | 7,024,801 | |
| | | | | | | | | | | | | | | | |
| | | | |
| Mississippi: 1.10% | | | | | | | | | | | | | | | | |
Mississippi Business Finance Corporation Power Company Project 1st Series (Utilities Revenue) | | | 1.63 | | | | 12-1-2040 | | | | 6,000,000 | | | | 5,999,400 | |
Mississippi HFFA Baptist Health System Series A (SIFMA Municipal Swap +1.30%) (Health Revenue) ± | | | 3.01 | | | | 8-15-2036 | | | | 5,000,000 | | | | 5,011,950 | |
Perry County MS PCR Leaf River Forest Products Incorporated Project (Industrial Development Revenue, Georgia-Pacific LLC LOC) 144Aø | | | 1.78 | | | | 2-1-2022 | | | | 10,970,000 | | | | 10,970,000 | |
| | | | |
| | | | | | | | | | | | | | | 21,981,350 | |
| | | | | | | | | | | | | | | | |
The accompanying notes are an integral part of these financial statements.
| | | | |
| 18 | | Wells Fargo Strategic Municipal Bond Fund | | Portfolio of investments—December 31, 2017 (unaudited) |
| | | | | | | | | | | | | | | | |
| Security name | | Interest rate | | | Maturity date | | | Principal | | | Value | |
| | | | |
| Missouri: 0.64% | | | | | | | | | | | | | | | | |
Arnold MO Real Property Arnold Triangle Redevelopment Project Series A (Tax Revenue) | | | 3.75 | % | | | 5-1-2023 | | | $ | 1,650,000 | | | $ | 1,669,833 | |
Branson MO IDA Branson Shoppes Series A (Miscellaneous Revenue) | | | 3.00 | | | | 11-1-2018 | | | | 250,000 | | | | 252,328 | |
Branson MO IDA Branson Shoppes Series A (Miscellaneous Revenue) | | | 3.00 | | | | 11-1-2019 | | | | 800,000 | | | | 809,376 | |
Branson MO IDA Branson Shoppes Series A (Miscellaneous Revenue) | | | 3.00 | | | | 11-1-2021 | | | | 350,000 | | | | 351,883 | |
Branson MO IDA Branson Shoppes Series A (Miscellaneous Revenue) | | | 4.00 | | | | 11-1-2022 | | | | 350,000 | | | | 364,970 | |
Branson MO IDA Branson Shoppes Series A (Miscellaneous Revenue) | | | 4.00 | | | | 11-1-2023 | | | | 750,000 | | | | 779,618 | |
Lee’s Summit MO Summit Fair Project Series 2017 (Tax Revenue) 144A | | | 3.50 | | | | 11-1-2023 | | | | 800,000 | | | | 796,840 | |
Platte County MO Riverside-Quindaro Bend Levee District Project L-385 (Miscellaneous Revenue) | | | 4.00 | | | | 3-1-2022 | | | | 970,000 | | | | 1,013,446 | |
Platte County MO Riverside-Quindaro Bend Levee District Project L-385 (Miscellaneous Revenue) | | | 3.00 | | | | 3-1-2020 | | | | 900,000 | | | | 912,240 | |
Platte County MO Riverside-Quindaro Bend Levee District Project L-385 (Miscellaneous Revenue) | | | 5.00 | | | | 3-1-2024 | | | | 1,000,000 | | | | 1,096,960 | |
Platte County MO Riverside-Quindaro Bend Levee District Project L-385 (Miscellaneous Revenue) | | | 4.00 | | | | 3-1-2021 | | | | 930,000 | | | | 969,237 | |
Platte County MO Riverside-Quindaro Bend Levee District Project L-385 (Miscellaneous Revenue) | | | 4.00 | | | | 3-1-2023 | | | | 1,010,000 | | | | 1,055,470 | |
Platte County MO Riverside-Quindaro Bend Levee District Project L-385 (Miscellaneous Revenue) | | | 5.00 | | | | 3-1-2025 | | | | 1,105,000 | | | | 1,216,483 | |
Richmond Heights MO Francis Place Redevelopment Project (Tax Revenue) | | | 5.63 | | | | 11-1-2025 | | | | 1,500,000 | | | | 1,500,090 | |
| | | | |
| | | | | | | | | | | | | | | 12,788,774 | |
| | | | | | | | | | | | | | | | |
| | | | |
| Nebraska: 0.47% | | | | | | | | | | | | | | | | |
Central Plains Energy Nebraska Gas Project No.3 (Utilities Revenue) | | | 5.00 | | | | 9-1-2025 | | | | 3,290,000 | | | | 3,830,218 | |
Central Plains Energy Nebraska Gas Project No.3 (Utilities Revenue) | | | 5.00 | | | | 9-1-2026 | | | | 3,750,000 | | | | 4,424,700 | |
Central Plains Energy Nebraska Gas Project No.3 (Utilities Revenue) | | | 5.00 | | | | 9-1-2027 | | | | 1,000,000 | | | | 1,188,790 | |
| | | | |
| | | | | | | | | | | | | | | 9,443,708 | |
| | | | | | | | | | | | | | | | |
| | | | |
| Nevada: 0.64% | | | | | | | | | | | | | | | | |
Carson City NV Carson Tahoe Regional Medical Center (Health Revenue) | | | 5.00 | | | | 9-1-2018 | | | | 700,000 | | | | 713,986 | |
Clark County NV School District Series 2017-C (GO Revenue) | | | 5.00 | | | | 6-15-2023 | | | | 5,500,000 | | | | 6,341,775 | |
Las Vegas NV Special Improvement District #60 (Miscellaneous Revenue) | | | 4.00 | | | | 6-1-2018 | | | | 630,000 | | | | 633,049 | |
Tender Option Bond Trust Receipts/Floater Certificates Nevada Water District (GO Revenue, JPMorgan Chase & Company LIQ) 144Aø | | | 1.89 | | | | 6-1-2020 | | | | 5,000,000 | | | | 5,000,000 | |
| | | | |
| | | | | | | | | | | | | | | 12,688,810 | |
| | | | | | | | | | | | | | | | |
| | | | |
| New Hampshire: 0.16% | | | | | | | | | | | | | | | | |
New Hampshire HEFA Hillside Village Issue Series 2017C (Health Revenue) 144A | | | 3.50 | | | | 7-1-2022 | | | | 3,250,000 | | | | 3,266,933 | |
| | | | | | | | | | | | | | | | |
| | | | |
| New Jersey: 5.31% | | | | | | | | | | | | | | | | |
Delaware River NJ Port Authority Pennsylvania & New Jersey Port District Project (Airport Revenue) | | | 5.00 | | | | 1-1-2018 | | | | 1,230,000 | | | | 1,230,000 | |
Garden State New Jersey Preservation Open Space and Farmland Series B (Miscellaneous Revenue, AGM Insured) ¤ | | | 0.00 | | | | 11-1-2021 | | | | 8,310,000 | | | | 7,576,144 | |
Hudson County NJ Qualified General and Water Improvements Series 2012A and 2012B (GO Revenue, AGM Insured) | | | 4.00 | | | | 9-1-2018 | | | | 1,140,000 | | | | 1,158,742 | |
New Jersey EDA Elite Pharmaceuticals Project Series A (Industrial Development Revenue) | | | 6.50 | | | | 9-1-2030 | | | | 395,000 | | | | 362,215 | |
The accompanying notes are an integral part of these financial statements.
| | | | | | |
| Portfolio of investments—December 31, 2017 (unaudited) | | Wells Fargo Strategic Municipal Bond Fund | | | 19 | |
| | | | | | | | | | | | | | | | |
| Security name | | Interest rate | | | Maturity date | | | Principal | | | Value | |
| | | | |
| New Jersey (continued) | | | | | | | | | | | | | | | | |
New Jersey EDA School Facilities Construction Project Prerefunded Bond Series EE (Miscellaneous Revenue) | | | 5.50 | % | | | 9-1-2021 | | | $ | 2,025,000 | | | $ | 2,253,521 | |
New Jersey EDA School Facilities Construction Project Series EE (Miscellaneous Revenue) | | | 5.25 | | | | 9-1-2025 | | | | 1,800,000 | | | | 1,943,784 | |
New Jersey EDA School Facilities Construction Project Series K (Miscellaneous Revenue, Ambac Insured) | | | 5.25 | | | | 12-15-2020 | | | | 3,000,000 | | | | 3,237,600 | |
New Jersey EDA School Facilities Construction Project Series NN (Miscellaneous Revenue, AGM Insured) | | | 5.00 | | | | 3-1-2024 | | | | 1,645,000 | | | | 1,821,064 | |
New Jersey EDA School Facilities Construction Project Unrefunded Bond Series EE (Tax Revenue) | | | 5.50 | | | | 9-1-2021 | | | | 750,000 | | | | 815,093 | |
New Jersey EDA School Facilities Construction Refunding Bond Project Series I (SIFMA Municipal Swap +1.55%) (Miscellaneous Revenue) ± | | | 3.26 | | | | 9-1-2027 | | | | 10,000,000 | | | | 9,865,000 | |
New Jersey EDA The Goethals Bridge Replacement Project (Industrial Development Revenue) | | | 5.00 | | | | 7-1-2020 | | | | 500,000 | | | | 537,715 | |
New Jersey EDA The Goethals Bridge Replacement Project (Industrial Development Revenue) | | | 5.00 | | | | 1-1-2021 | | | | 585,000 | | | | 636,299 | |
New Jersey EDA The Goethals Bridge Replacement Project (Industrial Development Revenue) | | | 5.00 | | | | 7-1-2021 | | | | 900,000 | | | | 989,730 | |
New Jersey EDA The Goethals Bridge Replacement Project (Industrial Development Revenue) | | | 5.00 | | | | 1-1-2023 | | | | 400,000 | | | | 451,688 | |
New Jersey Higher Education Student Assistance Authority Series 2017-1B (Education Revenue) | | | 5.00 | | | | 12-1-2020 | | | | 2,250,000 | | | | 2,419,403 | |
New Jersey Higher Education Student Assistance Authority Series 2017-1B (Education Revenue) | | | 5.00 | | | | 12-1-2021 | | | | 1,390,000 | | | | 1,520,855 | |
New Jersey TTFA Floaters Series DC8033 (Transportation Revenue, Dexia Credit Local LOC, AGM Insured, Dexia Credit Local LIQ) 144Aø | | | 1.99 | | | | 12-15-2022 | | | | 19,620,000 | | | | 19,620,000 | |
New Jersey TTFA Series AA (Transportation Revenue) | | | 5.00 | | | | 6-15-2023 | | | | 1,350,000 | | | | 1,475,199 | |
New Jersey TTFA CAB Series A (Transportation Revenue) ¤ | | | 0.00 | | | | 12-15-2026 | | | | 12,000,000 | | | | 8,530,200 | |
New Jersey TTFA Series A (Miscellaneous Revenue) | | | 5.00 | | | | 6-15-2022 | | | | 4,815,000 | | | | 5,210,456 | |
New Jersey TTFA Series A (Transportation Revenue) | | | 5.25 | | | | 12-15-2020 | | | | 1,900,000 | | | | 2,049,929 | |
New Jersey TTFA Series A (Transportation Revenue) | | | 5.25 | | | | 6-15-2022 | | | | 2,785,000 | | | | 3,031,807 | |
New Jersey TTFA Series AA (Transportation Revenue) | | | 2.50 | | | | 6-15-2018 | | | | 2,150,000 | | | | 2,154,773 | |
New Jersey TTFA Series AA (Transportation Revenue) | | | 4.00 | | | | 6-15-2018 | | | | 2,900,000 | | | | 2,925,810 | |
New Jersey TTFA Series AA (Transportation Revenue) | | | 5.00 | | | | 6-15-2023 | | | | 4,665,000 | | | | 5,187,807 | |
New Jersey TTFA Series B (Transportation Revenue) | | | 5.00 | | | | 6-15-2020 | | | | 2,150,000 | | | | 2,276,420 | |
New Jersey TTFA Series D (Transportation Revenue) | | | 5.00 | | | | 12-15-2023 | | | | 6,960,000 | | | | 7,801,882 | |
Newark NJ Housing Authority (Miscellaneous Revenue, National Insured) | | | 5.25 | | | | 1-1-2019 | | | | 2,995,000 | | | | 3,096,980 | |
Paterson NJ General Improvement (GO Revenue, AGM Insured) | | | 5.00 | | | | 6-15-2020 | | | | 400,000 | | | | 414,208 | |
South Jersey NJ Port Corporation Marine Terminal Series 2012 (Airport Revenue) | | | 4.00 | | | | 1-1-2022 | | | | 1,600,000 | | | | 1,662,256 | |
South Jersey NJ Port Corporation Marine Terminal Series S-2 (Airport Revenue) | | | 5.00 | | | | 1-1-2023 | | | | 1,665,000 | | | | 1,818,380 | |
South Jersey NJ Port Corporation Marine Terminal Series S-2 (Airport Revenue) | | | 5.00 | | | | 1-1-2024 | | | | 1,750,000 | | | | 1,937,688 | |
| | | | |
| | | | | | | | | | | | | | | 106,012,648 | |
| | | | | | | | | | | | | | | | |
| | | | |
| New Mexico: 0.86% | | | | | | | | | | | | | | | | |
New Mexico Educational Assistance Foundation Series A2 (3 Month LIBOR +0.65%) (Education Revenue) ± | | | 2.13 | | | | 12-1-2028 | | | | 155,000 | | | | 155,082 | |
New Mexico Municipal Energy Acquisition Authority Gas Supply Subordinate Series B (1 Month LIBOR +0.75%) (Utilities Revenue, Royal Bank of Canada SPA) ± | | | 1.66 | | | | 11-1-2039 | | | | 17,100,000 | | | | 17,085,123 | |
| | | | |
| | | | | | | | | | | | | | | 17,240,205 | |
| | | | | | | | | | | | | | | | |
The accompanying notes are an integral part of these financial statements.
| | | | |
| 20 | | Wells Fargo Strategic Municipal Bond Fund | | Portfolio of investments—December 31, 2017 (unaudited) |
| | | | | | | | | | | | | | | | |
| Security name | | Interest rate | | | Maturity date | | | Principal | | | Value | |
| | | | |
| New York: 6.91% | | | | | | | | | | | | | | | | |
Albany NY IDA Foundation State University Project Series A (Education Revenue) ø | | | 1.99 | % | | | 7-1-2032 | | | $ | 2,825,000 | | | $ | 2,825,000 | |
Build New York City Resource Corporation Bronx Charter School for International Cultures & Arts Series A (Education Revenue) | | | 3.88 | | | | 4-15-2023 | | | | 1,000,000 | | | | 1,014,040 | |
East Rochester NY Housing Authority Home Good Sheperd Project Series A (Housing Revenue, Royal Bank of Scotland LOC) ø | | | 1.87 | | | | 12-1-2036 | | | | 2,590,000 | | | | 2,590,000 | |
Hempstead Town NY Local Development Corporation Academy Charter School Project Series A (Education Revenue) | | | 5.45 | | | | 2-1-2027 | | | | 2,880,000 | | | | 2,890,080 | |
Monroe County NY Industrial Development Corporation Unity Hospital Rochester Project (Health Revenue, FHA Insured) | | | 4.20 | | | | 8-15-2025 | | | | 7,195,000 | | | | 7,206,224 | |
New York Environmental Facilities Corporation Waste Management Incorporated Project (Resource Recovery Revenue) 1 | | | 1.20 | | | | 5-1-2030 | | | | 3,000,000 | | | | 2,999,700 | |
New York HFA Affordable Housing Project Series M (Housing Revenue, GNMA/FNMA/FHLMC Insured) | | | 2.00 | | | | 5-1-2021 | | | | 11,625,000 | | | | 11,624,884 | |
New York HFA Manhattan Residential Housing Series A (Housing Revenue, Bank of China LOC) ø | | | 1.78 | | | | 11-1-2049 | | | | 7,000,000 | | | | 7,000,000 | |
New York HFA Manhattan West Residential Housing Revenue Series 2015-A (Housing Revenue, Bank of China LOC) ø | | | 1.78 | | | | 11-1-2049 | | | | 2,750,000 | | | | 2,750,000 | |
New York Metropolitan Transportation Authority Dedicated Tax Fund (SIFMA Municipal Swap +0.95%) (Tax Revenue) ± | | | 2.66 | | | | 11-1-2019 | | | | 7,500,000 | | | | 7,557,300 | |
New York Metropolitan Transportation Authority Subordinate Series D-2 (Transportation Revenue, Landesbank Hessen-Thüringen LOC) ø | | | 2.00 | | | | 11-1-2035 | | | | 2,400,000 | | | | 2,400,000 | |
New York NY Municipal Water Finance Series F1B-RMKT (Water & Sewer Revenue, U.S. Bank NA SPA) ø | | | 1.72 | | | | 6-15-2035 | | | | 7,450,000 | | | | 7,450,000 | |
New York NY Series J-4 (SIFMA Municipal Swap +0.55%) (GO Revenue) ± | | | 2.26 | | | | 8-1-2025 | | | | 6,700,000 | | | | 6,699,866 | |
New York NY Transitional Finance Authority NYC Recovery Series 3 Subordinate Series 3C (Tax Revenue, Dexia Credit Local SPA) ø | | | 1.78 | | | | 11-1-2022 | | | | 9,965,000 | | | | 9,965,000 | |
New York NY Transitional Finance Authority Subordinate Series 2B (Tax Revenue, Dexia Credit Local SPA) ø | | | 1.80 | | | | 11-1-2022 | | | | 9,515,000 | | | | 9,515,000 | |
New York NY Transitional Finance Authority Subordinate Series A-3 (Tax Revenue, Dexia Credit Local SPA) ø | | | 1.82 | | | | 8-1-2023 | | | | 18,650,000 | | | | 18,650,000 | |
New York State Dormitory Authority (College & University Revenue, Allied Irish Bank plc LOC) (Education Revenue, Bank of America NA LOC) ø | | | 1.73 | | | | 7-1-2032 | | | | 1,500,000 | | | | 1,500,000 | |
New York Thruway Authority Series II (Transportation Revenue, National Insured) | | | 5.00 | | | | 1-1-2021 | | | | 5,900,000 | | | | 5,914,868 | |
Niagara NY Area Development Corporation (Education Revenue) | | | 5.00 | | | | 5-1-2018 | | | | 500,000 | | | | 505,340 | |
Oyster Bay NY BAN Series A (GO Revenue) | | | 3.50 | | | | 6-1-2018 | | | | 4,250,000 | | | | 4,269,083 | |
Poughkeepsie City NY Series 2017A (GO Revenue) | | | 4.00 | | | | 5-4-2018 | | | | 1,200,000 | | | | 1,201,968 | |
Suffolk County NY TAN (GO Revenue) | | | 2.50 | | | | 7-25-2018 | | | | 20,000,000 | | | | 20,078,000 | |
Suffolk County NY Tobacco Asset Securitization Corporation (Tobacco Revenue) | | | 5.00 | | | | 6-1-2019 | | | | 575,000 | | | | 603,319 | |
Suffolk County NY Tobacco Asset Securitization Corporation (Tobacco Revenue) | | | 5.00 | | | | 6-1-2020 | | | | 625,000 | | | | 674,594 | |
| | | | |
| | | | | | | | | | | | | | | 137,884,266 | |
| | | | | | | | | | | | | | | | |
| | | | |
| Ohio: 1.34% | | | | | | | | | | | | | | | | |
Akron OH Bath and Copley Joint Township Hospital District (Health Revenue) | | | 5.00 | | | | 1-1-2031 | | | | 2,000,000 | | | | 2,231,680 | |
Allen County OH Hospital Facilities Revenue Bonds Series B (Health Revenue) | | | 5.00 | | | | 8-1-2047 | | | | 2,500,000 | | | | 2,793,600 | |
Hamilton County OH Healthcare Series 2017 (Health Revenue) | | | 3.00 | | | | 1-1-2022 | | | | 905,000 | | | | 919,679 | |
Ohio University Hospital Health System Series B (Health Revenue) ø | | | 1.75 | | | | 1-15-2033 | | | | 5,000,000 | | | | 5,000,000 | |
Ohio University Hospital Health System Series B (Health Revenue) ø | | | 1.75 | | | | 1-15-2045 | | | | 10,000,000 | | | | 10,000,000 | |
Ohio Water Development Authority FirstEnergy Nuclear Generation Project Series B (Water & Sewer Revenue) | | | 4.00 | | | | 12-1-2033 | | | | 5,425,000 | | | | 2,399,586 | |
The accompanying notes are an integral part of these financial statements.
| | | | | | |
| Portfolio of investments—December 31, 2017 (unaudited) | | Wells Fargo Strategic Municipal Bond Fund | | | 21 | |
| | | | | | | | | | | | | | | | |
| Security name | | Interest rate | | | Maturity date | | | Principal | | | Value | |
| | | | |
| Ohio (continued) | | | | | | | | | | | | | | | | |
Ohio Water Development Authority FirstEnergy Nuclear Generation Project Series A (Water & Sewer Revenue) | | | 3.00 | % | | | 5-15-2019 | | | $ | 2,725,000 | | | $ | 1,205,349 | |
Ohio Water Development Authority Pollution Control FirstEnergy Nuclear Generation Project (Industrial Development Revenue) | | | 3.75 | | | | 7-1-2033 | | | | 5,000,000 | | | | 2,210,800 | |
| | | | |
| | | | | | | | | | | | | | | 26,760,694 | |
| | | | | | | | | | | | | | | | |
| | | | |
| Oklahoma: 0.04% | | | | | | | | | | | | | | | | |
Comanche County OK Hospital Authority Series A (Health Revenue) | | | 5.00 | | | | 7-1-2018 | | | | 795,000 | | | | 803,133 | |
| | | | | | | | | | | | | | | | |
| | | | |
| Oregon: 0.05% | | | | | | | | | | | | | | | | |
Portland OR Portland International Airport Series 18-A (Airport Revenue, Bank of China LOC) ø | | | 1.71 | | | | 7-1-2026 | | | | 955,000 | | | | 955,000 | |
| | | | | | | | | | | | | | | | |
| | | | |
| Other: 0.07% | | | | | | | | | | | | | | | | |
Public Housing Capital Fund Trust II (Miscellaneous Revenue, HUD Insured) 144A | | | 4.50 | | | | 7-1-2022 | | | | 1,475,120 | | | | 1,482,923 | |
| | | | | | | | | | | | | | | | |
| | | | |
| Pennsylvania: 6.96% | | | | | | | | | | | | | | | | |
Allegheny County PA Penn Hills Schools District Series 2015 (GO Revenue, Build America Mutual Assurance Company Insured) | | | 5.00 | | | | 11-15-2022 | | | | 340,000 | | | | 379,042 | |
Allegheny County PA Penn Hills Schools District Series 2015 (GO Revenue, Build America Mutual Assurance Company Insured) | | | 5.00 | | | | 11-15-2023 | | | | 1,025,000 | | | | 1,162,791 | |
Beaver County PA IDA Pollution Control FirstEnergy Nuclear Generation Corporation Project Series A (Utilities Revenue) | | | 2.70 | | | | 4-1-2035 | | | | 2,500,000 | | | | 1,106,175 | |
Beaver County PA IDA Pollution Control FirstEnergy Nuclear Generation Corporation Project Series A (Industrial Development Revenue) | | | 4.00 | | | | 1-1-2035 | | | | 535,000 | | | | 236,481 | |
Beaver County PA IDA Pollution Control FirstEnergy Nuclear Generation Corporation Project Series B (Industrial Development Revenue) | | | 3.50 | | | | 12-1-2035 | | | | 2,245,000 | | | | 992,672 | |
Berks County PA Municipal Authority Reading Hospital & Medical Center Project Series B (Health Revenue) | | | 3.21 | | | | 11-1-2039 | | | | 8,750,000 | | | | 8,904,788 | |
Chester County PA IDA Avon Grove Charter School Project Series 2017A (Education Revenue) | | | 4.00 | | | | 12-15-2027 | | | | 2,250,000 | | | | 2,301,953 | |
Chester County PA IDA Collegium Charter School Project Series A (Education Revenue) | | | 3.70 | | | | 10-15-2022 | | | | 1,150,000 | | | | 1,155,969 | |
Delaware County PA IDA Chester Charter School Series A (Education Revenue) 144A | | | 4.38 | | | | 6-1-2026 | | | | 1,785,000 | | | | 1,810,668 | |
Fulton County PA IDA Medical Center Project (Health Revenue) | | | 2.40 | | | | 7-1-2020 | | | | 2,375,000 | | | | 2,333,153 | |
Luzerne County PA RAN (GO Revenue) %% | | | 3.00 | | | | 6-29-2018 | | | | 2,000,000 | | | | 2,006,860 | |
Montgomery County PA HEFAR Arcadia University (Education Revenue) | | | 5.00 | | | | 4-1-2022 | | | | 1,575,000 | | | | 1,745,966 | |
Montgomery County PA HEFAR Arcadia University (Education Revenue) | | | 5.00 | | | | 4-1-2023 | | | | 1,605,000 | | | | 1,804,373 | |
Montgomery County PA IDA Peco Energy Company Project Series A (Industrial Development Revenue) | | | 2.60 | | | | 3-1-2034 | | | | 8,500,000 | | | | 8,534,680 | |
Montgomery County PA IDA Peco Energy Company Project Series B (Industrial Development Revenue) | | | 2.55 | | | | 6-1-2029 | | | | 10,340,000 | | | | 10,378,465 | |
Pennsylvania EDFA Solid Waste Disposal Republic Services Incorporated Project (Resource Recovery Revenue) ø | | | 1.20 | | | | 6-1-2044 | | | | 4,000,000 | | | | 4,000,000 | |
Pennsylvania Public School Building Authority (Miscellaneous Revenue) | | | 5.00 | | | | 4-1-2019 | | | | 4,650,000 | | | | 4,821,074 | |
Pennsylvania Public School Building Authority Albert Gallatin Area School District Project (1 Month LIBOR +0.80%) (Miscellaneous Revenue) ± | | | 1.71 | | | | 9-1-2024 | | | | 3,470,000 | | | | 3,465,316 | |
Pennsylvania Refunding Bond (GO Revenue) | | | 5.00 | | | | 1-15-2022 | | | | 8,540,000 | | | | 9,513,902 | |
Pennsylvania Turnpike Commission Series A (SIFMA Municipal Swap +0.68%) (Transportation Revenue) ± | | | 2.39 | | | | 12-1-2018 | | | | 11,150,000 | | | | 11,170,628 | |
Pennsylvania Turnpike Commission Series B (SIFMA Municipal Swap +1.27%) (Transportation Revenue) ± | | | 2.98 | | | | 12-1-2020 | | | | 10,000,000 | | | | 10,192,900 | |
The accompanying notes are an integral part of these financial statements.
| | | | |
| 22 | | Wells Fargo Strategic Municipal Bond Fund | | Portfolio of investments—December 31, 2017 (unaudited) |
| | | | | | | | | | | | | | | | |
| Security name | | Interest rate | | | Maturity date | | | Principal | | | Value | |
| | | | |
| Pennsylvania (continued) | | | | | | | | | | | | | | | | |
Philadelphia PA Hospital and HEFA Temple University Health System Series 2017 (Health Revenue) | | | 5.00 | % | | | 7-1-2023 | | | $ | 1,750,000 | | | $ | 1,947,628 | |
Philadelphia PA IDA Charter School Project A (Education Revenue) | | | 4.50 | | | | 8-1-2026 | | | | 3,365,000 | | | | 3,456,528 | |
Philadelphia PA IDA Charter School Project Series 2016B (Education Revenue) | | | 4.88 | | | | 8-1-2026 | | | | 2,190,000 | | | | 2,233,756 | |
Philadelphia PA IDA Tacony Academy Christian School Project Series A-1 (Education Revenue) | | | 6.25 | | | | 6-15-2023 | | | | 730,000 | | | | 797,379 | |
Philadelphia PA IDA University of the Arts Series 2017 (Education Revenue) 144A | | | 5.00 | | | | 3-15-2021 | | | | 1,205,000 | | | | 1,257,357 | |
Philadelphia PA IDA University of the Arts Series 2017 (Education Revenue) 144A | | | 5.00 | | | | 3-15-2019 | | | | 325,000 | | | | 331,087 | |
Philadelphia PA School District Series B (GO Revenue) | | | 3.13 | | | | 9-1-2020 | | | | 200,000 | | | | 204,180 | |
Philadelphia PA School District Series D (GO Revenue) | | | 5.00 | | | | 9-1-2021 | | | | 2,000,000 | | | | 2,184,820 | |
Philadelphia PA School District Series D (GO Revenue) | | | 5.00 | | | | 9-1-2022 | | | | 3,565,000 | | | | 3,956,366 | |
Philadelphia PA School District Series E (GO Revenue) | | | 5.25 | | | | 9-1-2022 | | | | 1,525,000 | | | | 1,628,197 | |
Philadelphia PA School District Series E (GO Revenue) | | | 5.25 | | | | 9-1-2023 | | | | 5,770,000 | | | | 6,152,782 | |
Philadelphia PA School District Series E (GO Revenue, BHAC Insured) | | | 5.38 | | | | 9-1-2028 | | | | 2,425,000 | | | | 2,487,177 | |
Philadelphia PA School District Series F (GO Revenue) | | | 5.00 | | | | 9-1-2022 | | | | 5,000,000 | | | | 5,548,900 | |
Pittsburgh PA Water & Sewer Authority Series C (1 Month LIBOR +0.64%) (Water & Sewer Revenue, AGM Insured) ± | | | 1.74 | | | | 9-1-2040 | | | | 10,000,000 | | | | 9,969,200 | |
Quakertown PA Health Facilities Authority Series A (Health Revenue) | | | 3.13 | | | | 7-1-2021 | | | | 1,500,000 | | | | 1,500,975 | |
Scranton PA Refunding Bonds (GO Revenue) | | | 5.00 | | | | 11-15-2026 | | | | 2,120,000 | | | | 2,284,936 | |
Scranton PA School District Series A (GO Revenue) | | | 5.00 | | | | 6-1-2024 | | | | 750,000 | | | | 844,328 | |
Scranton PA School District Series A (GO Revenue) | | | 5.00 | | | | 6-1-2025 | | | | 1,000,000 | | | | 1,139,830 | |
Scranton PA School District Series B (GO Revenue, National Insured) | | | 5.00 | | | | 6-1-2024 | | | | 665,000 | | | | 748,637 | |
Scranton PA School District Series B (GO Revenue, National Insured) | | | 5.00 | | | | 6-1-2025 | | | | 710,000 | | | | 811,828 | |
Scranton PA Series 2017 (GO Revenue) | | | 5.00 | | | | 9-1-2023 | | | | 1,355,000 | | | | 1,469,348 | |
| | | | |
| | | | | | | | | | | | | | | 138,973,095 | |
| | | | | | | | | | | | | | | | |
| | | | |
| Puerto Rico: 0.03% | | | | | | | | | | | | | | | | |
Puerto Rico Electric Power Authority Series SS (Utilities Revenue, National Insured) | | | 5.00 | | | | 7-1-2018 | | | | 570,000 | | | | 571,174 | |
| | | | | | | | | | | | | | | | |
| | | | |
| Rhode Island: 0.20% | | | | | | | | | | | | | | | | |
Providence RI RDA Series A (Miscellaneous Revenue) | | | 5.00 | | | | 4-1-2022 | | | | 1,940,000 | | | | 2,143,157 | |
Providence RI RDA Series A (Miscellaneous Revenue) | | | 5.00 | | | | 4-1-2023 | | | | 1,585,000 | | | | 1,773,615 | |
Rhode Island Housing & Mortgage Finance (Housing Revenue) | | | 6.50 | | | | 4-1-2027 | | | | 15,000 | | | | 15,068 | |
| | | | |
| | | | | | | | | | | | | | | 3,931,840 | |
| | | | | | | | | | | | | | | | |
| | | | |
| South Carolina: 0.54% | | | | | | | | | | | | | | | | |
Lee County SC School Facilities Incorporated (Miscellaneous Revenue, AGM Insured) | | | 2.00 | | | | 6-1-2020 | | | | 185,000 | | | | 183,043 | |
Lee County SC School Facilities Incorporated (Miscellaneous Revenue, AGM Insured) | | | 4.00 | | | | 12-1-2019 | | | | 560,000 | | | | 578,754 | |
Lee County SC School Facilities Incorporated (Miscellaneous Revenue, AGM Insured) | | | 4.00 | | | | 12-1-2020 | | | | 375,000 | | | | 392,629 | |
South Carolina Jobs EDA East Point Academy Project Series A (Education Revenue) 144A | | | 2.25 | | | | 5-1-2019 | | | | 2,500,000 | | | | 2,485,375 | |
South Carolina Jobs EDA Solid Waste Disposal Repower South Berkeley LLC (Resource Recovery Revenue) 144A | | | 5.25 | | | | 2-1-2027 | | | | 3,310,000 | | | | 3,255,981 | |
South Carolina Jobs EDA The Woodlands at Furman Series 2017 (Health Revenue) | | | 4.00 | | | | 11-15-2027 | | | | 2,895,000 | | | | 2,915,410 | |
South Carolina Jobs EDA York Preparatory Academy Project Series A (Education Revenue) | | | 5.75 | | | | 11-1-2023 | | | | 835,000 | | | | 871,398 | |
| | | | |
| | | | | | | | | | | | | | | 10,682,590 | |
| | | | | | | | | | | | | | | | |
The accompanying notes are an integral part of these financial statements.
| | | | | | |
| Portfolio of investments—December 31, 2017 (unaudited) | | Wells Fargo Strategic Municipal Bond Fund | | | 23 | |
| | | | | | | | | | | | | | | | |
| Security name | | Interest rate | | | Maturity date | | | Principal | | | Value | |
| | | | |
| South Dakota: 0.05% | | | | | | | | | | | | | | | | |
South Dakota HEFA (Health Revenue) | | | 4.50 | % | | | 9-1-2019 | | | $ | 990,000 | | | $ | 1,045,579 | |
| | | | | | | | | | | | | | | | |
| | | | |
| Tennessee: 1.11% | | | | | | | | | | | | | | | | |
Bristol TN Industrial Development Board Sales Tax CAB Series B (Tax Revenue) 144A¤ | | | 0.00 | | | | 12-1-2031 | | | | 2,000,000 | | | | 915,960 | |
Tennessee Energy Acquisition Corporation Series A (Utilities Revenue) | | | 4.00 | | | | 5-1-2048 | | | | 10,000,000 | | | | 10,952,700 | |
Tennessee Energy Acquisition Corporation Series A (Utilities Revenue) | | | 5.25 | | | | 9-1-2018 | | | | 4,000,000 | | | | 4,092,880 | |
Tennessee Energy Acquisition Corporation Series A (Utilities Revenue) | | | 5.25 | | | | 9-1-2020 | | | | 4,720,000 | | | | 5,107,795 | |
Tennessee Energy Acquisition Corporation Series B (Utilities Revenue) | | | 5.63 | | | | 9-1-2026 | | | | 925,000 | | | | 1,098,086 | |
| | | | |
| | | | | | | | | | | | | | | 22,167,421 | |
| | | | | | | | | | | | | | | | |
| | | | |
| Texas: 9.43% | | | | | | | | | | | | | | | | |
Arlington TX Higher Education Finance Corporate Education Series A (Education Revenue) | | | 4.00 | | | | 6-15-2026 | | | | 725,000 | | | | 713,748 | |
Austin Convention Enterprises Incorporated Series 2017B (Industrial Development Revenue) | | | 5.00 | | | | 1-1-2018 | | | | 200,000 | | | | 200,000 | |
Austin Convention Enterprises Incorporated Series 2017B (Industrial Development Revenue) | | | 5.00 | | | | 1-1-2019 | | | | 600,000 | | | | 616,614 | |
Austin Convention Enterprises Incorporated Series 2017B (Industrial Development Revenue) | | | 5.00 | | | | 1-1-2020 | | | | 500,000 | | | | 530,800 | |
Austin Convention Enterprises Incorporated Series 2017B (Industrial Development Revenue) | | | 5.00 | | | | 1-1-2021 | | | | 500,000 | | | | 543,690 | |
Austin TX Community College District Series A (Education Revenue) | | | 4.00 | | | | 2-1-2023 | | | | 320,000 | | | | 349,456 | |
Brownsville TX Independent School District Series 2017 (GO Revenue) | | | 4.00 | | | | 8-15-2021 | | | | 9,555,000 | | | | 10,252,993 | |
Central Texas Regional Mobility Authority Senior Lien Series A (Transportation Revenue) | | | 5.00 | | | | 1-1-2021 | | | | 1,000,000 | | | | 1,087,380 | |
Central Texas Regional Mobility Authority Senior Lien Series A (Transportation Revenue) | | | 5.00 | | | | 1-1-2023 | | | | 500,000 | | | | 567,900 | |
Clifton TX Higher Education Finance Corporation International Leadership Series 2015A (Education Revenue) | | | 4.63 | | | | 8-15-2025 | | | | 8,905,000 | | | | 9,326,385 | |
Clifton TX Higher Education Finance Corporation Uplift Education Series A (Education Revenue) | | | 4.00 | | | | 12-1-2025 | | | | 3,635,000 | | | | 3,862,951 | |
Dallas TX GO Refunding & Improvement Bond Series 2017 (GO Revenue) | | | 5.00 | | | | 2-15-2023 | | | | 7,105,000 | | | | 8,118,031 | |
Dallas TX Performing Arts Cultural Facilities Corporation Dallas Center for Performing Arts Foundation Project Series 2008B (Miscellaneous Revenue, JPMorgan Chase & Company LOC) ø | | | 1.65 | | | | 9-1-2041 | | | | 3,030,000 | | | | 3,030,000 | |
Gulf Coast TX IDA (Industrial Development Revenue, BNP Paribas LOC) ø | | | 1.72 | | | | 11-1-2019 | | | | 3,850,000 | | | | 3,850,000 | |
Harris County TX Industrial Development Corporation Deer Park Refining Limited Partnership Project (Resource Recovery Revenue) | | | 4.70 | | | | 5-1-2018 | | | | 9,000,000 | | | | 9,082,260 | |
Houston TX Airport System Subordinate Lien Series B (Airport Revenue, National Insured) | | | 5.00 | | | | 7-1-2026 | | | | 3,530,000 | | | | 3,538,754 | |
Houston TX Independent School District Series B (GO Revenue) | | | 1.70 | | | | 6-1-2036 | | | | 14,000,000 | | | | 14,002,660 | |
Houston TX Public Improvement Refunding Bonds Series 2017A (GO Revenue) | | | 5.00 | | | | 3-1-2020 | | | | 11,000,000 | | | | 11,793,540 | |
Houston TX Public Improvement Refunding Bonds Series 2017A (GO Revenue) | | | 5.00 | | | | 3-1-2024 | | | | 12,000,000 | | | | 14,061,480 | |
Katy TX Independent School District Series 2016A (GO Revenue) | | | 5.00 | | | | 2-15-2023 | | | | 1,415,000 | | | | 1,627,887 | |
Mesquite TX Health Facilities Development Corporation Christian Care Centers Incorporated Project Series 2016 (Health Revenue) | | | 1.75 | | | | 2-15-2018 | | | | 250,000 | | | | 249,720 | |
Mesquite TX Health Facilities Development Corporation Christian Care Centers Incorporated Project Series 2016 (Health Revenue) | | | 1.95 | | | | 2-15-2019 | | | | 250,000 | | | | 246,978 | |
Mesquite TX Health Facilities Development Corporation Christian Care Centers Incorporated Project Series 2016 (Health Revenue) | | | 5.00 | | | | 2-15-2020 | | | | 810,000 | | | | 846,523 | |
The accompanying notes are an integral part of these financial statements.
| | | | |
| 24 | | Wells Fargo Strategic Municipal Bond Fund | | Portfolio of investments—December 31, 2017 (unaudited) |
| | | | | | | | | | | | | | | | |
| Security name | | Interest rate | | | Maturity date | | | Principal | | | Value | |
| | | | |
| Texas (continued) | | | | | | | | | | | | | | | | |
Mesquite TX Health Facilities Development Corporation Christian Care Centers Incorporated Project Series 2016 (Health Revenue) | | | 5.00 | % | | | 2-15-2021 | | | $ | 560,000 | | | $ | 594,955 | |
New Hope TX Cultural Education Facilities Finance Corporation The Langford Project Series B-2 (Health Revenue) | | | 3.00 | | | | 11-15-2021 | | | | 1,100,000 | | | | 1,096,788 | |
New Hope TX Cultural Education Facilities Finance Corporation Hospital Series 2017A (Health Revenue) | | | 5.00 | | | | 8-15-2024 | | | | 1,000,000 | | | | 1,173,530 | |
New Hope TX Cultural Education Facilities Finance Corporation Jubilee Academic Center (Education Revenue) 144A | | | 3.38 | | | | 8-15-2021 | | | | 1,955,000 | | | | 1,947,376 | |
New Hope TX Cultural Education Facilities Finance Corporation Student Housing Revenue Project Series A (Housing Revenue) | | | 3.25 | | | | 8-1-2019 | | | | 5,000,000 | | | | 5,003,150 | |
New Hope TX Cultural Education Facilities Finance Corporation Student Housing Tarleton State University Project (Housing Revenue) | | | 5.38 | | | | 4-1-2028 | | | | 1,845,000 | | | | 2,102,175 | |
New Hope TX Cultural Education Facilities Finance Corporation Hospital Series 2017A (Health Revenue) | | | 5.00 | | | | 8-15-2026 | | | | 2,000,000 | | | | 2,407,720 | |
Newark TX Higher Educational Finance Corporation Charter Schools Incorporated Series 2015 A (Education Revenue) 144A | | | 4.63 | | | | 8-15-2025 | | | | 1,485,000 | | | | 1,529,624 | |
North Texas Higher Education Authority Incorporated Student Loan Series 2 Class A (3 Month LIBOR +1.00%) (Education Revenue) ± | | | 2.34 | | | | 4-1-2037 | | | | 1,720,000 | | | | 1,727,207 | |
North Texas Tollway Authority System Refunding Bonds Series C (SIFMA Municipal Swap +0.67%) (Transportation Revenue) ± | | | 2.38 | | | | 1-1-2038 | | | | 3,650,000 | | | | 3,660,220 | |
Pearland TX Permanent Improvement Series 2015 (GO Revenue) | | | 5.00 | | | | 3-1-2021 | | | | 1,000,000 | | | | 1,096,590 | |
Port Arthur TX Navigation District Jefferson County Environmental Facilities Motiva Enterprises LLC Project Series D (Resource Recovery Revenue) ø | | | 1.83 | | | | 11-1-2040 | | | | 8,000,000 | | | | 8,000,000 | |
Port Arthur TX Navigation District Motiva Enterprises LLC Project Series A (Resource Recovery Revenue) ø | | | 1.83 | | | | 4-1-2040 | | | | 9,450,000 | | | | 9,450,000 | |
Tarrant County TX Cultural Education Facilities Buckingham Senior Living Community Incorporated (Health Revenue) | | | 3.88 | | | | 11-15-2020 | | | | 2,500,000 | | | | 2,500,200 | |
Tarrant County TX Cultural Education Facilities Finance Corporation Buckner Senior Living-Ventana Project (Health Revenue) | | | 3.88 | | | | 11-15-2022 | | | | 4,315,000 | | | | 4,325,960 | |
Tender Option Bond Trust Receipts/Floater Certificates Series 2015 (Transportation Revenue, Barclays Bank plc LIQ) 144Aø | | | 1.91 | | | | 7-1-2021 | | | | 10,500,000 | | | | 10,500,000 | |
Tender Option Bond Trust Receipts/Floater Certificates Series 2017-XM0560 (Transportation Revenue, Bank of America NA LIQ) 144Aø | | | 0.54 | | | | 1-1-2048 | | | | 2,000,000 | | | | 2,000,000 | |
Tender Option Bond Trust Receipts/Floater Certificates Series 2017-XM0561 (Transportation Revenue, Bank of America NA LIQ) 144Aø | | | 0.54 | | | | 1-1-2048 | | | | 2,750,000 | | | | 2,750,000 | |
Texas General Obligation Veterans Bonds (GO Revenue, Helaba SPA) ø | | | 1.83 | | | | 12-1-2046 | | | | 4,770,000 | | | | 4,770,000 | |
Texas New Hope ECFA Collegiate Housing Tarleton State University Series A (Housing Revenue) | | | 4.00 | | | | 4-1-2020 | | | | 185,000 | | | | 193,451 | |
Texas New Hope ECFA Collegiate Housing Tarleton State University Series A (Housing Revenue) | | | 4.00 | | | | 4-1-2021 | | | | 310,000 | | | | 329,980 | |
Texas New Hope ECFA Collegiate Housing Tarleton State University Series A (Housing Revenue) | | | 4.00 | | | | 4-1-2022 | | | | 870,000 | | | | 930,917 | |
Texas New Hope ECFA Collegiate Housing Tarleton State University Series A (Housing Revenue) | | | 5.00 | | | | 4-1-2025 | | | | 480,000 | | | | 546,082 | |
Texas PFA Southern University Financing System (Education Revenue, Build America Mutual Assurance Company Insured) | | | 5.00 | | | | 11-1-2020 | | | | 1,715,000 | | | | 1,863,125 | |
Texas PFA Southern University Financing System (Education Revenue, Build America Mutual Assurance Company Insured) | | | 5.00 | | | | 11-1-2021 | | | | 1,275,000 | | | | 1,418,731 | |
University of Texas Board of Regents Series 2017C (Education Revenue) | | | 5.00 | | | | 8-15-2025 | | | | 4,750,000 | | | | 5,785,738 | |
University of Texas Board of Regents Series 2017C (Education Revenue) | | | 5.00 | | | | 8-15-2026 | | | | 7,780,000 | | | | 9,611,879 | |
Wood Glen TX Housing Finance Corporation Mortgage Copperwood Project Series A (Miscellaneous Revenue, National/FHA Insured) | | | 7.65 | | | | 7-1-2022 | | | | 2,125,000 | | | | 2,450,614 | |
| | | | |
| | | | | | | | | | | | | | | 188,265,762 | |
| | | | | | | | | | | | | | | | |
The accompanying notes are an integral part of these financial statements.
| | | | | | |
| Portfolio of investments—December 31, 2017 (unaudited) | | Wells Fargo Strategic Municipal Bond Fund | | | 25 | |
| | | | | | | | | | | | | | | | |
| Security name | | Interest rate | | | Maturity date | | | Principal | | | Value | |
| | | | |
| Utah: 0.25% | | | | | | | | | | | | | | | | |
Tender Option Bond Trust Receipts/Floater Certificates Series 2017 (Airport Revenue, JPMorgan Chase & Company LIQ) 144Aø | | | 1.91 | % | | | 1-1-2025 | | | $ | 2,700,000 | | | $ | 2,700,000 | |
Utah Charter School Finance Authority Ronald Wilson Reagan Academy Project Series A (Education Revenue) 144A | | | 3.50 | | | | 2-15-2026 | | | | 1,190,000 | | | | 1,148,267 | |
Utah Infrastructure Agency Telecommunications Series 2017 (Miscellaneous Revenue) | | | 2.00 | | | | 10-15-2018 | | | | 535,000 | | | | 535,407 | |
Utah Infrastructure Agency Telecommunications Series 2017 (Miscellaneous Revenue) | | | 2.00 | | | | 10-15-2019 | | | | 625,000 | | | | 621,625 | |
| | | | |
| | | | | | | | | | | | | | | 5,005,299 | |
| | | | | | | | | | | | | | | | |
| | | | |
| Vermont: 0.69% | | | | | | | | | | | | | | | | |
Vermont Student Assistance Corporation Education Loan Series A (Education Revenue) | | | 5.00 | | | | 6-15-2021 | | | | 1,800,000 | | | | 1,937,952 | |
Vermont Student Assistance Corporation Education Loan Series A (Education Revenue) | | | 5.00 | | | | 6-15-2022 | | | | 550,000 | | | | 603,669 | |
Vermont Student Assistance Corporation Education Loan Series A (Education Revenue) | | | 5.00 | | | | 6-15-2023 | | | | 1,200,000 | | | | 1,338,984 | |
Vermont Student Assistance Corporation Series B Class B (1 Month LIBOR +1.00%) (Education Revenue) ± | | | 2.36 | | | | 6-2-2042 | | | | 9,180,802 | | | | 9,001,960 | |
Vermont Student Assistance Corporation Series B Class-A1 (3 Month LIBOR +1.50%) (Education Revenue) ± | | | 3.00 | | | | 6-1-2022 | | | | 956,770 | | | | 959,076 | |
| | | | |
| | | | | | | | | | | | | | | 13,841,641 | |
| | | | | | | | | | | | | | | | |
| | | | |
| Virgin Islands: 0.30% | | | | | | | | | | | | | | | | |
Virgin Islands PFA Matching Fund Loan Note Senior Lien Series A (Tax Revenue) | | | 5.00 | | | | 10-1-2025 | | | | 5,000,000 | | | | 3,125,000 | |
Virgin Islands PFA Series C (Miscellaneous Revenue) | | | 5.00 | | | | 10-1-2020 | | | | 2,500,000 | | | | 1,350,000 | |
Virgin Islands PFA Series C (Miscellaneous Revenue) | | | 5.00 | | | | 10-1-2024 | | | | 3,600,000 | | | | 1,602,000 | |
| | | | |
| | | | | | | | | | | | | | | 6,077,000 | |
| | | | | | | | | | | | | | | | |
| | | | |
| Virginia: 1.40% | | | | | | | | | | | | | | | | |
Louisa VA Electric and Power IDA Series 2008B (Utilities Revenue) | | | 2.15 | | | | 11-1-2035 | | | | 19,050,000 | | | | 19,182,779 | |
Prince William County VA IDA Westminster At Lake Ridge Series 2016 (Health Revenue) | | | 1.75 | | | | 1-1-2018 | | | | 400,000 | | | | 400,000 | |
Prince William County VA IDA Westminster At Lake Ridge Series 2016 (Health Revenue) | | | 2.00 | | | | 1-1-2019 | | | | 600,000 | | | | 599,766 | |
Prince William County VA IDA Westminster At Lake Ridge Series 2016 (Health Revenue) | | | 2.25 | | | | 1-1-2020 | | | | 910,000 | | | | 910,883 | |
Virginia Commonwealth Transportation Board Capital Projects Series 2017A (Transportation Revenue) | | | 5.00 | | | | 5-15-2024 | | | | 3,000,000 | | | | 3,555,150 | |
Virginia Commonwealth Transportation Board Capital Projects Series 2017A (Transportation Revenue) | | | 5.00 | | | | 5-15-2025 | | | | 2,750,000 | | | | 3,320,790 | |
| | | | |
| | | | | | | | | | | | | | | 27,969,368 | |
| | | | | | | | | | | | | | | | |
| | | | |
| Washington: 1.54% | | | | | | | | | | | | | | | | |
Seattle WA Housing Authority Newholly Phase I Series B (Housing Revenue) | | | 1.25 | | | | 4-1-2019 | | | | 4,505,000 | | | | 4,468,915 | |
Washington HCFR Catholic Health Initiatives Series B (SIFMA Municipal Swap +1.40%) (Health Revenue) ± | | | 3.11 | | | | 1-1-2035 | | | | 11,000,000 | | | | 10,973,050 | |
Washington Health Care Facilities Authority Fred Hutchinson Cancer Research (1 Month LIBOR +1.10%) (Health Revenue) ± | | | 2.15 | | | | 1-1-2042 | | | | 6,050,000 | | | | 6,044,434 | |
Washington Housing Finance Commission Nonprofit Housing Bonds Heron’s Key Senior Living Series B-3 (Health Revenue) 144A | | | 4.38 | | | | 1-1-2021 | | | | 110,000 | | | | 110,000 | |
The accompanying notes are an integral part of these financial statements.
| | | | |
| 26 | | Wells Fargo Strategic Municipal Bond Fund | | Portfolio of investments—December 31, 2017 (unaudited) |
| | | | | | | | | | | | | | | | |
| Security name | | Interest rate | | | Maturity date | | | Principal | | | Value | |
| | | | |
| Washington (continued) | | | | | | | | | | | | | | | | |
Washington Housing Finance Commission Wesley Homes (Health Revenue, AGC Insured) | | | 5.63 | % | | | 1-1-2022 | | | $ | 6,545,000 | | | $ | 6,545,000 | |
Washington State EDFA Waste Management (Resource Recovery Revenue) 144A | | | 2.13 | | | | 6-1-2020 | | | | 2,500,000 | | | | 2,497,350 | |
| | | | |
| | | | | | | | | | | | | | | 30,638,749 | |
| | | | | | | | | | | | | | | | |
| | | | |
| West Virginia: 0.06% | | | | | | | | | | | | | | | | |
Monongalia County WV Commission Special District University Town Center Series A (Tax Revenue) 144A | | | 4.50 | | | | 6-1-2027 | | | | 1,250,000 | | | | 1,256,913 | |
| | | | | | | | | | | | | | | | |
| | | | |
| Wisconsin: 2.83% | | | | | | | | | | | | | | | | |
Appleton WI Recovery Zone Facilities Foremost Farms Project Series 2010 (Industrial Development Revenue, CoBank ACB LOC) ø | | | 1.85 | | | | 5-1-2037 | | | | 8,000,000 | | | | 8,000,000 | |
Eau Claire WI Area School District Refunding Bonds (GO Revenue) | | | 5.00 | | | | 4-1-2022 | | | | 1,245,000 | | | | 1,397,301 | |
Eau Claire WI Area School District Refunding Bonds (GO Revenue) | | | 5.00 | | | | 4-1-2023 | | | | 1,860,000 | | | | 2,134,443 | |
Eau Claire WI Area School District Refunding Bonds (GO Revenue) | | | 5.00 | | | | 4-1-2024 | | | | 1,000,000 | | | | 1,168,220 | |
Milwaukee WI RAN Series M-11 (Miscellaneous Revenue) | | | 5.00 | | | | 9-27-2018 | | | | 14,500,000 | | | | 14,881,060 | |
Milwaukee WI RDA Science Education Consortium Incorporated Project Series A (Education Revenue) | | | 4.75 | | | | 8-1-2023 | | | | 1,140,000 | | | | 1,196,282 | |
Pine Lake WI PFA Preparatory Series 2015 (Education Revenue) 144A | | | 4.35 | | | | 3-1-2025 | | | | 2,710,000 | | | | 2,787,154 | |
Public Finance Authority Education Pine Lake Preparatory Series 2015(Education Revenue) 144A | | | 4.25 | | | | 6-15-2029 | | | | 1,085,000 | | | | 1,089,232 | |
Public Finance Authority Senior Living Marylhurst Project Series 2017B (Health Revenue) 144A | | | 3.00 | | | | 11-15-2022 | | | | 2,200,000 | | | | 2,207,084 | |
Wisconsin Clean Water Refunding Bonds Series 2012 (Water & Sewer Revenue) | | | 5.00 | | | | 6-1-2023 | | | | 310,000 | | | | 358,500 | |
Wisconsin Clean Water Refunding Bonds Series 2013 (Water & Sewer Revenue) | | | 5.00 | | | | 6-1-2024 | | | | 2,285,000 | | | | 2,642,488 | |
Wisconsin Clean Water Refunding Bonds Series 2015 (Water & Sewer Revenue) | | | 5.00 | | | | 6-1-2023 | | | | 3,355,000 | | | | 3,879,890 | |
Wisconsin Clean Water Refunding Bonds Series 2015 (Water & Sewer Revenue) | | | 5.00 | | | | 6-1-2025 | | | | 3,045,000 | | | | 3,596,054 | |
Wisconsin Clean Water Refunding Bonds Series 2015 (Water & Sewer Revenue) | | | 5.00 | | | | 6-1-2026 | | | | 1,525,000 | | | | 1,800,979 | |
Wisconsin HEFA Bellin Memorial Hospital Series 2015 (Health Revenue) | | | 3.00 | | | | 12-1-2020 | | | | 745,000 | | | | 769,674 | |
Wisconsin HEFA Bellin Memorial Hospital Series 2015 (Health Revenue) | | | 5.00 | | | | 12-1-2022 | | | | 755,000 | | | | 861,145 | |
Wisconsin PFA Airport Series C (Airport Revenue) | | | 5.00 | | | | 7-1-2022 | | | | 2,555,000 | | | | 2,757,254 | |
Wisconsin PFA Bancroft Neurohealth Project Series A (Health Revenue) 144A | | | 4.00 | | | | 6-1-2019 | | | | 1,270,000 | | | | 1,298,893 | |
Wisconsin PFA Bancroft Neurohealth Project Series A (Health Revenue) 144A | | | 4.00 | | | | 6-1-2020 | | | | 635,000 | | | | 656,234 | |
Wisconsin PFA Bancroft Neurohealth Project Series A (Health Revenue) 144A | | | 4.00 | | | | 6-1-2021 | | | | 1,370,000 | | | | 1,424,005 | |
Wisconsin PFA Roseman University of Health Sciences Project Series 2012 (Education Revenue) | | | 5.00 | | | | 4-1-2022 | | | | 1,445,000 | | | | 1,533,029 | |
| | | | |
| | | | | | | | | | | | | | | 56,438,921 | |
| | | | | | | | | | | | | | | | |
| | | | |
| Wyoming: 0.32% | | | | | | | | | | | | | | | | |
Sweetwater County WY Pollution Control PacifiCorp Series B (Utilities Revenue) ø | | | 1.71 | | | | 12-1-2020 | | | | 6,305,000 | | | | 6,305,000 | |
| | | | | | | | | | | | | | | | |
| | | | |
Total Municipal Obligations (Cost $1,934,417,525) | | | | | | | | | | | | | | | 1,943,719,963 | |
| | | | | | | | | | | | | | | | |
| | | | |
Other: 1.40% | | | | | | | | | | | | | | | | |
Eaton Vance New York Municipal Income Trust Preferred Shares (SIFMA Municipal Swap +1.00%) ± | | | 3.21 | | | | 9-1-2019 | | | | 10,600,000 | | | | 10,600,636 | |
Eaton Vance Ohio Municipal Bond Fund Institutional Preferred Shares (SIFMA Municipal Swap +1.00%) ± | | | 2.71 | | | | 7-1-2019 | | | | 7,350,000 | | | | 7,349,486 | |
Nuveen California AMT-Free Quality Municipal Income Fund Preferred Shares Series A 144A§øø | | | 2.01 | | | | 10-1-2047 | | | | 10,000,000 | | | | 10,000,000 | |
| | | | |
Total Other (Cost $27,950,000) | | | | | | | | | | | | | | | 27,950,122 | |
| | | | | | | | | | | | | | | | |
The accompanying notes are an integral part of these financial statements.
| | | | | | |
| Portfolio of investments—December 31, 2017 (unaudited) | | Wells Fargo Strategic Municipal Bond Fund | | | 27 | |
| | | | | | | | | | | | | | | | |
| Security name | | Yield | | | | | | Shares | | | Value | |
| Short-Term Investments: 0.62% | | | | | | | | | | | | | | | | |
| | | | |
| Investment Companies: 0.62% | | | | | | | | | | | | | | | | |
Wells Fargo Municipal Cash Management Money Market Fund Institutional Class ##(l)(u) | | | 1.49 | % | | | | | | | 12,489,566 | | | $ | 12,503,304 | |
| | | | | | | | | | | | | | | | |
| | | | |
Total Short-Term Investments (Cost $12,503,304) | | | | | | | | | | | | | | | 12,503,304 | |
| | | | | | | | | | | | | | | | |
| | | | | | | | |
| Total investments in securities (Cost $1,974,870,829) | | | 99.38 | % | | | 1,984,173,389 | |
Other assets and liabilities, net | | | 0.62 | | | | 12,284,646 | |
| | | | | | | | |
| Total net assets | | | 100.00 | % | | $ | 1,996,458,035 | |
| | | | | | | | |
| ø | Variable rate demand notes are subject to a demand feature which reduces the effective maturity. The maturity date shown represents the final maturity date of the security. The interest rate is determined and reset by the issuer daily, weekly, or monthly depending upon the terms of the security. The rate shown is the rate in effect at period end. |
| 144A | The security may be resold in transactions exempt from registration, normally to qualified institutional buyers, pursuant to Rule 144A under the Securities Act of 1933. |
| ± | Variable rate investment. The rate shown is the rate in effect at period end. |
| ¤ | The security is issued in zero coupon form with no periodic interest payments. |
| %% | The security is issued on a when-issued basis. |
| § | The security is subject to a demand feature which reduces the effective maturity. |
| øø | The interest rate is determined and reset by the issuer periodically depending upon the terms of the security. The rate shown is the rate in effect at period end. |
| ## | All or a portion of this security is segregated for when-issued. |
| (l) | The issuer of the security is an affiliated person of the Fund as defined in the Investment Company Act of 1940. |
| (u) | The rate represents the 7-day annualized yield at period end. |
Credit Default Swaps
Buy protection
| | | | | | | | | | | | | | | | | | | | | | | | | | | | | | | | | | | | |
| Reference index | | Fixed rate
paid | | | Payment
frequency | | | Counterparty | | | Maturity
date | | | Notional
amount | | | Value | | | Premiums
paid
(received) | | | Unrealized
gains | | | Unrealized
losses | |
Markit CDX North America High Yield Index | | | 5.00 | % | | | Quarterly | | | | JPMorgan¤¤ | °° | | | 12-20-2022 | | | $ | 36,105,000 | | | $ | (3,055,484 | ) | | $ | (2,887,869 | ) | | $ | 0 | | | $ | (167,615 | ) |
| | ¤¤ | Transaction can only be closed with the originating counterparty |
| | °° | Exchange traded or centrally cleared transaction with counterparty |
Investments in Affiliates
An affiliated investment is an investment in which the Fund owns at least 5% of the outstanding voting shares of the issuer or as a result of other relationships, such as the Fund and the issuer having the same investment manager. Transactions with issuers that were either affiliated persons of the Fund at the beginning of the period or the end of the period were as follows:
| | | | | | | | | | | | | | | | | | | | | | | | | | | | | | | | | | | | |
| | | Shares,
beginning of
period | | | Shares
purchased | | | Shares
sold | | | Shares,
end of
period | | | Net
realized
gains
(losses) | | | Net
change in
unrealized
gains
(losses) | | | Income
from
affiliated
securities | | | Value,
end
of period | | | % of net
asset value | |
Short-Term Investments | | | | | | | | | | | | | | | | | | | | | | | | | | | | | | | | | | | | |
Investment Companies | | | | | | | | | | | | | | | | | | | | | | | | | | | | | | | | | | | | |
Wells Fargo Municipal Cash Management Money Market Fund Institutional Class | | | 11,589,425 | | | | 387,463,140 | | | | 386,562,999 | | | | 12,489,566 | | | $ | 5,669 | | | $ | 0 | | | $ | 92,348 | | | $ | 12,503,304 | | | | 0.62 | % |
The accompanying notes are an integral part of these financial statements.
| | | | |
| 28 | | Wells Fargo Strategic Municipal Bond Fund | | Statement of assets and liabilities—December 31, 2017 (unaudited) |
| | | | |
| | | | |
| |
Assets | | | | |
Investments in unaffiliated securities, at value (cost $1,962,367,525) | | $ | 1,971,670,085 | |
Investments in affiliated securities, at value (cost $12,503,304) | | | 12,503,304 | |
Cash | | | 42,692 | |
Segregated cash for credit default swaps | | | 3,803,693 | |
Receivable for investments sold | | | 2,774,742 | |
Receivable for Fund shares sold | | | 6,561,130 | |
Receivable for interest | | | 14,289,301 | |
Prepaid expenses and other assets | | | 16,649 | |
| | | | |
Total assets | | | 2,011,661,596 | |
| | | | |
| |
Liabilities | | | | |
Payable for investments purchased | | | 6,406,927 | |
Payable for Fund shares redeemed | | | 4,005,550 | |
Premiums received on credit default swap transactions | | | 2,887,869 | |
Management fee payable | | | 626,611 | |
Dividends payable | | | 516,936 | |
Unrealized losses on credit default swap transactions | | | 167,615 | |
Administration fees payable | | | 162,771 | |
Distribution fee payable | | | 85,089 | |
Trustees’ fees and expenses payable | | | 2,187 | |
Accrued expenses and other liabilities | | | 342,006 | |
| | | | |
Total liabilities | | | 15,203,561 | |
| | | | |
Total net assets | | $ | 1,996,458,035 | |
| | | | |
| |
NET ASSETS CONSIST OF | | | | |
Paid-in capital | | $ | 1,987,074,538 | |
Overdistributed net investment income | | | (45,036 | ) |
Accumulated net realized gains on investments | | | 293,588 | |
Net unrealized gains on investments | | | 9,134,945 | |
| | | | |
Total net assets | | $ | 1,996,458,035 | |
| | | | |
| |
COMPUTATION OF NET ASSET VALUE AND OFFERING PRICE PER SHARE | | | | |
Net assets – Class A | | $ | 539,915,919 | |
Shares outstanding – Class A1 | | | 60,353,959 | |
Net asset value per share – Class A | | | $8.95 | |
Maximum offering price per share – Class A2 | | | $9.32 | |
Net assets – Class C | | $ | 129,367,296 | |
Shares outstanding – Class C1 | | | 14,411,162 | |
Net asset value per share – Class C | | | $8.98 | |
Net assets – Administrator Class | | $ | 212,342,854 | |
Shares outstanding – Administrator Class1 | | | 23,749,864 | |
Net asset value per share – Administrator Class | | | $8.94 | |
Net assets – Institutional Class | | $ | 1,114,831,966 | |
Shares outstanding – Institutional Class1 | | | 124,654,594 | |
Net asset value per share – Institutional Class | | | $8.94 | |
| 1 | The Fund has an unlimited number of authorized shares. |
| 2 | Maximum offering price is computed as 100/96 of net asset value. On investments of $50,000 or more, the offering price is reduced. |
The accompanying notes are an integral part of these financial statements.
| | | | | | |
| Statement of operations—six months ended December 31, 2017 (unaudited) | | Wells Fargo Strategic Municipal Bond Fund | | | 29 | |
| | | | |
| | | | |
| |
Investment income | | | | |
Interest | | $ | 23,163,558 | |
Income from affiliated securities | | | 92,348 | |
| | | | |
Total investment income | | | 23,255,906 | |
| | | | |
| |
Expenses | | | | |
Management fee | | | 3,620,945 | |
Administration fees | | | | |
Class A | | | 431,558 | |
Class C | | | 107,052 | |
Administrator Class | | | 102,331 | |
Institutional Class | | | 433,500 | |
Shareholder servicing fees | | | | |
Class A | | | 674,309 | |
Class C | | | 167,270 | |
Administrator Class | | | 255,828 | |
Distribution fee | | | | |
Class C | | | 501,809 | |
Custody and accounting fees | | | 38,888 | |
Professional fees | | | 41,318 | |
Registration fees | | | 155,707 | |
Shareholder report expenses | | | 137,651 | |
Trustees’ fees and expenses | | | 10,434 | |
Other fees and expenses | | | 24,758 | |
| | | | |
Total expenses | | | 6,703,358 | |
Less: Fee waivers and/or expense reimbursements | | | (145,402 | ) |
| | | | |
Net expenses | | | 6,557,956 | |
| | | | |
Net investment income | | | 16,697,950 | |
| | | | |
| |
REALIZED AND UNREALIZED GAINS (LOSSES) ON INVESTMENTS | | | | |
| |
Net realized gains on: | | | | |
Unaffiliated securities | | | 3,008,940 | |
Affiliated securities | | | 5,669 | |
Credit default swap transactions | | | (149,906 | ) |
| | | | |
Net realized gains on investments | | | 2,864,703 | |
| | | | |
| |
Net change in unrealized gains (losses) on: | | | | |
Unaffiliated securities | | | 3,167,195 | |
Credit default swap transactions | | | (167,615 | ) |
| | | | |
Net change in unrealized gains (losses) on investments | | | 2,999,580 | |
| | | | |
Net realized and unrealized gains (losses) on investments | | | 5,864,283 | |
| | | | |
Net increase in net assets resulting from operations | | $ | 22,562,233 | |
| | | | |
The accompanying notes are an integral part of these financial statements.
| | | | |
| 30 | | Wells Fargo Strategic Municipal Bond Fund | | Statement of changes in net assets |
| | | | | | | | | | | | | | | | |
| | | Six months ended
December 31, 2017 (unaudited) | | | Year ended
June 30, 2017 | |
| | | | |
Operations | | | | | | | | | | | | | | | | |
Net investment income | | | | | | $ | 16,697,950 | | | | | | | $ | 30,494,329 | |
Net realized gains on investments | | | | | | | 2,864,703 | | | | | | | | 2,216,902 | |
Net change in unrealized gains (losses) on investments | | | | | | | 2,999,580 | | | | | | | | (20,487,110 | ) |
| | | | |
Net increase in net assets resulting from operations | | | | | | | 22,562,233 | | | | | | | | 12,224,121 | |
| | | | |
| | | | |
Distributions to shareholders from | | | | | | | | | | | | | | | | |
Net investment income | | | | | | | | | | | | | | | | |
Class A | | | | | | | (4,123,334 | ) | | | | | | | (9,721,744 | ) |
Class B | | | | | | | N/A | | | | | | | | (1,637 | )1 |
Class C | | | | | | | (520,456 | ) | | | | | | | (1,101,197 | ) |
Administrator Class | | | | | | | (1,709,347 | ) | | | | | | | (4,158,710 | ) |
Institutional Class | | | | | | | (10,130,045 | ) | | | | | | | (15,510,524 | ) |
Net realized gains | | | | | | | | | | | | | | | | |
Class A | | | | | | | (1,271,860 | ) | | | | | | | (3,453,459 | ) |
Class B | | | | | | | N/A | | | | | | | | (1,604 | )1 |
Class C | | | | | | | (304,884 | ) | | | | | | | (776,260 | ) |
Administrator Class | | | | | | | (493,273 | ) | | | | | | | (1,027,684 | ) |
Institutional Class | | | | | | | (2,702,545 | ) | | | | | | | (4,275,093 | ) |
| | | | |
Total distributions to shareholders | | | | | | | (21,255,744 | ) | | | | | | | (40,027,912 | ) |
| | | | |
| | | | |
Capital share transactions | | | Shares | | | | | | | | Shares | | | | | |
Proceeds from shares sold | | | | | | | | | | | | | | | | |
Class A | | | 6,859,916 | | | | 61,553,330 | | | | 29,705,458 | | | | 265,830,435 | |
Class B | | | N/A | | | | N/A | | | | 1 | 1 | | | 9 | 1 |
Class C | | | 670,630 | | | | 6,045,170 | | | | 2,637,375 | | | | 23,746,452 | |
Administrator Class | | | 4,875,412 | | | | 43,729,812 | | | | 15,699,832 | | | | 140,534,456 | |
Institutional Class | | | 29,353,530 | | | | 263,600,439 | | | | 97,370,291 | | | | 868,468,686 | |
| | | | |
| | | | | | | 374,928,751 | | | | | | | | 1,298,580,038 | |
| | | | |
Reinvestment of distributions | | | | | | | | | | | | | | | | |
Class A | | | 545,184 | | | | 4,891,097 | | | | 1,363,777 | | | | 12,163,513 | |
Class B | | | N/A | | | | N/A | | | | 351 | 1 | | | 3,115 | 1 |
Class C | | | 80,158 | | | | 721,528 | | | | 178,654 | | | | 1,594,886 | |
Administrator Class | | | 239,480 | | | | 2,146,990 | | | | 564,474 | | | | 5,044,561 | |
Institutional Class | | | 1,175,134 | | | | 10,541,360 | | | | 1,810,718 | | | | 16,136,404 | |
| | | | |
| | | | | | | 18,300,975 | | | | | | | | 34,942,479 | |
| | | | |
Payment for shares redeemed | | | | | | | | | | | | | | | | |
Class A | | | (8,697,214 | ) | | | (78,071,100 | ) | | | (49,552,383 | ) | | | (441,381,046 | ) |
Class B | | | N/A | | | | N/A | | | | (69,947 | )1 | | | (623,909 | )1 |
Class C | | | (1,721,903 | ) | | | (15,521,115 | ) | | | (4,649,673 | ) | | | (41,701,524 | ) |
Administrator Class | | | (3,210,984 | ) | | | (28,826,244 | ) | | | (39,549,596 | ) | | | (353,531,649 | ) |
Institutional Class | | | (21,486,101 | ) | | | (192,725,362 | ) | | | (50,783,508 | ) | | | (452,579,827 | ) |
| | | | |
| | | | | | | (315,143,821 | ) | | | | | | | (1,289,817,955 | ) |
| | | | |
Net increase in net assets resulting from capital share transactions | | | | | | | 78,085,905 | | | | | | | | 43,704,562 | |
| | | | |
Total increase in net assets | | | | | | | 79,392,394 | | | | | | | | 15,900,771 | |
| | | | |
| | | | |
Net assets | | | | | | | | | | | | | | | | |
Beginning of period | | | | | | | 1,917,065,641 | | | | | | | | 1,901,164,870 | |
| | | | |
End of period | | | | | | $ | 1,996,458,035 | | | | | | | $ | 1,917,065,641 | |
| | | | |
Overdistributed net investment income | | | | | | $ | (45,036 | ) | | | | | | $ | (259,804 | ) |
| | | | |
| 1 | For the period from July 1, 2016 to May 5, 2017. Effective at the close of business on May 5, 2017, Class B shares were converted to Class A shares and are no longer offered by the Fund. |
The accompanying notes are an integral part of these financial statements.
| | | | | | |
| Financial highlights | | Wells Fargo Strategic Municipal Bond Fund | | | 31 | |
(For a share outstanding throughout each period)
| | | | | | | | | | | | | | | | | | | | | | | | |
| | | Six months ended
December 31, 2017 (unaudited) | | | Year ended June 30 | |
| CLASS A | | | 2017 | | | 2016 | | | 2015 | | | 2014 | | | 2013 | |
Net asset value, beginning of period | | | $8.94 | | | | $9.06 | | | | $8.90 | | | | $9.03 | | | | $8.87 | | | | $8.94 | |
Net investment income | | | 0.07 | | | | 0.13 | | | | 0.14 | | | | 0.10 | | | | 0.17 | | | | 0.13 | |
Net realized and unrealized gains (losses) on investments | | | 0.03 | | | | (0.07 | ) | | | 0.18 | | | | (0.05 | ) | | | 0.21 | | | | 0.01 | |
| | | | | | | | | | | | | | | | | | | | | | | | |
Total from investment operations | | | 0.10 | | | | 0.06 | | | | 0.32 | | | | 0.05 | | | | 0.38 | | | | 0.14 | |
Distributions to shareholders from | | | | | | | | | | | | | | | | | | | | | | | | |
Net investment income | | | (0.07 | ) | | | (0.13 | ) | | | (0.14 | ) | | | (0.10 | ) | | | (0.17 | ) | | | (0.13 | ) |
Net realized gains | | | (0.02 | ) | | | (0.05 | ) | | | (0.02 | ) | | | (0.08 | ) | | | (0.05 | ) | | | (0.08 | ) |
| | | | | | | | | | | | | | | | | | | | | | | | |
Total distributions to shareholders | | | (0.09 | ) | | | (0.18 | ) | | | (0.16 | ) | | | (0.18 | ) | | | (0.22 | ) | | | (0.21 | ) |
Net asset value, end of period | | | $8.95 | | | | $8.94 | | | | $9.06 | | | | $8.90 | | | | $9.03 | | | | $8.87 | |
Total return1 | | | 1.12 | % | | | 0.65 | % | | | 3.67 | % | | | 0.56 | % | | | 4.41 | % | | | 1.59 | % |
Ratios to average net assets (annualized) | | | | | | | | | | | | | | | | | | | | | | | | |
Gross expenses | | | 0.82 | % | | | 0.81 | % | | | 0.81 | % | | | 0.81 | % | | | 0.83 | % | | | 0.82 | % |
Net expenses | | | 0.82 | % | | | 0.81 | % | | | 0.81 | % | | | 0.81 | % | | | 0.82 | % | | | 0.82 | % |
Net investment income | | | 1.55 | % | | | 1.45 | % | | | 1.53 | % | | | 1.16 | % | | | 1.91 | % | | | 1.49 | % |
Supplemental data | | | | | | | | | | | | | | | | | | | | | | | | |
Portfolio turnover rate | | | 14 | % | | | 31 | % | | | 53 | % | | | 39 | % | | | 51 | % | | | 49 | % |
Net assets, end of period (000s omitted) | | | $539,916 | | | | $550,965 | | | | $726,135 | | | | $635,610 | | | | $656,256 | | | | $609,303 | |
| 1 | Total return calculations do not include any sales charges. Returns for periods of less than one year are not annualized. |
The accompanying notes are an integral part of these financial statements.
| | | | |
| 32 | | Wells Fargo Strategic Municipal Bond Fund | | Financial highlights |
(For a share outstanding throughout each period)
| | | | | | | | | | | | | | | | | | | | | | | | |
| | | Six months ended
December 31, 2017 (unaudited) | | | Year ended June 30 | |
| CLASS C | | | 2017 | | | 2016 | | | 2015 | | | 2014 | | | 2013 | |
Net asset value, beginning of period | | | $8.97 | | | | $9.09 | | | | $8.94 | | | | $9.06 | | | | $8.90 | | | | $8.97 | |
Net investment income | | | 0.04 | | | | 0.07 | | | | 0.07 | | | | 0.04 | | | | 0.10 | | | | 0.07 | |
Net realized and unrealized gains (losses) on investments | | | 0.03 | | | | (0.07 | ) | | | 0.17 | | | | (0.04 | ) | | | 0.21 | | | | 0.01 | |
| | | | | | | | | | | | | | | | | | | | | | | | |
Total from investment operations | | | 0.07 | | | | (0.00 | ) | | | 0.24 | | | | 0.00 | | | | 0.31 | | | | 0.08 | |
Distributions to shareholders from | | | | | | | | | | | | | | | | | | | | | | | | |
Net investment income | | | (0.04 | ) | | | (0.07 | ) | | | (0.07 | ) | | | (0.04 | ) | | | (0.10 | ) | | | (0.07 | ) |
Net realized gains | | | (0.02 | ) | | | (0.05 | ) | | | (0.02 | ) | | | (0.08 | ) | | | (0.05 | ) | | | (0.08 | ) |
| | | | | | | | | | | | | | | | | | | | | | | | |
Total distributions to shareholders | | | (0.06 | ) | | | (0.12 | ) | | | (0.09 | ) | | | (0.12 | ) | | | (0.15 | ) | | | (0.15 | ) |
Net asset value, end of period | | | $8.98 | | | | $8.97 | | | | $9.09 | | | | $8.94 | | | | $9.06 | | | | $8.90 | |
Total return1 | | | 0.74 | % | | | (0.10 | )% | | | 2.78 | % | | | (0.08 | )% | | | 3.63 | % | | | 0.83 | % |
Ratios to average net assets (annualized) | | | | | | | | | | | | | | | | | | | | | | | | |
Gross expenses | | | 1.57 | % | | | 1.56 | % | | | 1.56 | % | | | 1.56 | % | | | 1.58 | % | | | 1.57 | % |
Net expenses | | | 1.57 | % | | | 1.56 | % | | | 1.56 | % | | | 1.56 | % | | | 1.57 | % | | | 1.57 | % |
Net investment income | | | 0.80 | % | | | 0.72 | % | | | 0.78 | % | | | 0.40 | % | | | 1.16 | % | | | 0.74 | % |
Supplemental data | | | | | | | | | | | | | | | | | | | | | | | | |
Portfolio turnover rate | | | 14 | % | | | 31 | % | | | 53 | % | | | 39 | % | | | 51 | % | | | 49 | % |
Net assets, end of period (000s omitted) | | | $129,367 | | | | $137,955 | | | | $156,560 | | | | $152,882 | | | | $146,329 | | | | $152,155 | |
| 1 | Total return calculations do not include any sales charges. Returns for periods of less than one year are not annualized. |
The accompanying notes are an integral part of these financial statements.
| | | | | | |
| Financial highlights | | Wells Fargo Strategic Municipal Bond Fund | | | 33 | |
(For a share outstanding throughout each period)
| | | | | | | | | | | | | | | | | | | | | | | | |
| | | Six months ended
December 31, 2017 (unaudited) | | | Year ended June 30 | |
| ADMINISTRATOR CLASS | | | 2017 | | | 2016 | | | 2015 | | | 2014 | | | 2013 | |
Net asset value, beginning of period | | | $8.93 | | | | $9.06 | | | | $8.90 | | | | $9.02 | | | | $8.87 | | | | $8.94 | |
Net investment income | | | 0.08 | | | | 0.14 | | | | 0.15 | | | | 0.12 | | | | 0.18 | | | | 0.15 | |
Net realized and unrealized gains (losses) on investments | | | 0.03 | | | | (0.08 | ) | | | 0.18 | | | | (0.04 | ) | | | 0.20 | | | | 0.01 | |
| | | | | | | | | | | | | | | | | | | | | | | | |
Total from investment operations | | | 0.11 | | | | 0.06 | | | | 0.33 | | | | 0.08 | | | | 0.38 | | | | 0.16 | |
Distributions to shareholders from | | | | | | | | | | | | | | | | | | | | | | | | |
Net investment income | | | (0.08 | ) | | | (0.14 | ) | | | (0.15 | ) | | | (0.12 | ) | | | (0.18 | ) | | | (0.15 | ) |
Net realized gains | | | (0.02 | ) | | | (0.05 | ) | | | (0.02 | ) | | | (0.08 | ) | | | (0.05 | ) | | | (0.08 | ) |
| | | | | | | | | | | | | | | | | | | | | | | | |
Total distributions to shareholders | | | (0.10 | ) | | | (0.19 | ) | | | (0.17 | ) | | | (0.20 | ) | | | (0.23 | ) | | | (0.23 | ) |
Net asset value, end of period | | | $8.94 | | | | $8.93 | | | | $9.06 | | | | $8.90 | | | | $9.02 | | | | $8.87 | |
Total return1 | | | 1.20 | % | | | 0.67 | % | | | 3.80 | % | | | 0.80 | % | | | 4.44 | % | | | 1.73 | % |
Ratios to average net assets (annualized) | | | | | | | | | | | | | | | | | | | | | | | | |
Gross expenses | | | 0.76 | % | | | 0.75 | % | | | 0.74 | % | | | 0.75 | % | | | 0.77 | % | | | 0.76 | % |
Net expenses | | | 0.68 | % | | | 0.68 | % | | | 0.68 | % | | | 0.68 | % | | | 0.68 | % | | | 0.68 | % |
Net investment income | | | 1.69 | % | | | 1.51 | % | | | 1.66 | % | | | 1.28 | % | | | 2.05 | % | | | 1.62 | % |
Supplemental data | | | | | | | | | | | | | | | | | | | | | | | | |
Portfolio turnover rate | | | 14 | % | | | 31 | % | | | 53 | % | | | 39 | % | | | 51 | % | | | 49 | % |
Net assets, end of period (000s omitted) | | | $212,343 | | | | $195,138 | | | | $408,846 | | | | $529,945 | | | | $516,069 | | | | $521,312 | |
| 1 | Returns for periods of less than one year are not annualized. |
The accompanying notes are an integral part of these financial statements.
| | | | |
| 34 | | Wells Fargo Strategic Municipal Bond Fund | | Financial highlights |
(For a share outstanding throughout each period)
| | | | | | | | | | | | | | | | | | | | | | | | |
| | | Six months ended
December��31, 2017 (unaudited) | | | Year ended June 30 | |
| INSTITUTIONAL CLASS | | | 2017 | | | 2016 | | | 2015 | | | 2014 | | | 20131 | |
Net asset value, beginning of period | | | $8.94 | | | | $9.06 | | | | $8.90 | | | | $9.03 | | | | $8.87 | | | | $9.06 | |
Net investment income | | | 0.09 | | | | 0.16 | | | | 0.17 | | | | 0.13 | | | | 0.20 | | | | 0.08 | 2 |
Net realized and unrealized gains (losses) on investments | | | 0.01 | | | | (0.07 | ) | | | 0.18 | | | | (0.05 | ) | | | 0.21 | | | | (0.10 | ) |
| | | | | | | | | | | | | | | | | | | | | | | | |
Total from investment operations | | | 0.10 | | | | 0.09 | | | | 0.35 | | | | 0.08 | | | | 0.41 | | | | (0.02 | ) |
Distributions to shareholders from | | | | | | | | | | | | | | | | | | | | | | | | |
Net investment income | | | (0.08 | ) | | | (0.16 | ) | | | (0.17 | ) | | | (0.13 | ) | | | (0.20 | ) | | | (0.09 | ) |
Net realized gains | | | (0.02 | ) | | | (0.05 | ) | | | (0.02 | ) | | | (0.08 | ) | | | (0.05 | ) | | | (0.08 | ) |
| | | | | | | | | | | | | | | | | | | | | | | | |
Total distributions to shareholders | | | (0.10 | ) | | | (0.21 | ) | | | (0.19 | ) | | | (0.21 | ) | | | (0.25 | ) | | | (0.17 | ) |
Net asset value, end of period | | | $8.94 | | | | $8.94 | | | | $9.06 | | | | $8.90 | | | | $9.03 | | | | $8.87 | |
Total return3 | | | 1.18 | % | | | 0.99 | % | | | 4.02 | % | | | 0.89 | % | | | 4.77 | % | | | (0.28 | )% |
Ratios to average net assets (annualized) | | | | | | | | | | | | | | | | | | | | | | | | |
Gross expenses | | | 0.49 | % | | | 0.48 | % | | | 0.48 | % | | | 0.48 | % | | | 0.50 | % | | | 0.50 | % |
Net expenses | | | 0.48 | % | | | 0.48 | % | | | 0.48 | % | | | 0.48 | % | | | 0.48 | % | | | 0.48 | % |
Net investment income | | | 1.89 | % | | | 1.85 | % | | | 1.85 | % | | | 1.49 | % | | | 2.27 | % | | | 1.65 | % |
Supplemental data | | | | | | | | | | | | | | | | | | | | | | | | |
Portfolio turnover rate | | | 14 | % | | | 31 | % | | | 53 | % | | | 39 | % | | | 51 | % | | | 49 | % |
Net assets, end of period (000s omitted) | | | $1,114,832 | | | | $1,033,007 | | | | $608,995 | | | | $319,313 | | | | $29,528 | | | | $31,868 | |
| 1 | For the period from November 30, 2012 (commencement of class operations) to June 30, 2013 |
| 2 | Calculated based upon average shares outstanding |
| 3 | Returns for periods of less than one year are not annualized. |
The accompanying notes are an integral part of these financial statements.
| | | | | | |
| Notes to financial statements (unaudited) | | Wells Fargo Strategic Municipal Bond Fund | | | 35 | |
1. ORGANIZATION
Wells Fargo Funds Trust (the “Trust”), a Delaware statutory trust organized on March 10, 1999, is an open-end management investment company registered under the Investment Company Act of 1940, as amended (the “1940 Act”). As an investment company, the Trust follows the accounting and reporting guidance in Financial Accounting Standards Board Accounting Standards Codification Topic 946, Financial Services – Investment Companies. These financial statements report on the Wells Fargo Strategic Municipal Bond Fund (the “Fund”) which is a diversified series of the Trust.
Effective at the close of business on May 5, 2017, Class B shares were converted to Class A shares and are no longer offered by the Fund. Information for Class B shares reflected in the financial statements represents activity through May 5, 2017.
2. SIGNIFICANT ACCOUNTING POLICIES
The following significant accounting policies, which are consistently followed in the preparation of the financial statements of the Fund, are in conformity with U.S. generally accepted accounting principles which require management to make estimates and assumptions that affect the reported amounts of assets and liabilities, disclosure of contingent assets and liabilities at the date of the financial statements, and the reported amounts of revenues and expenses during the reporting period. Actual results could differ from those estimates.
Securities valuation
All investments are valued each business day as of the close of regular trading on the New York Stock Exchange (generally 4 p.m. Eastern Time), although the Fund may deviate from this calculation time under unusual or unexpected circumstances.
Debt securities are valued at the evaluated bid price provided by an independent pricing service or, if a reliable price is not available, the quoted bid price from an independent broker-dealer.
Equity securities and futures that are listed on a foreign or domestic exchange or market are valued at the official closing price or, if none, the last sales price. If no sale occurs on the principal exchange or market that day, a fair value price will be determined in accordance with the Fund’s Valuation Procedures.
Investments in registered open-end investment companies are valued at net asset value.
Investments which are not valued using any of the methods discussed above are valued at their fair value, as determined in good faith by the Board of Trustees of the Fund. The Board of Trustees has established a Valuation Committee comprised of the Trustees and has delegated to it the authority to take any actions regarding the valuation of portfolio securities that the Valuation Committee deems necessary or appropriate, including determining the fair value of portfolio securities, unless the determination has been delegated to the Management Valuation Team of Wells Fargo Funds Management, LLC (“Funds Management”). The Board of Trustees retains the authority to make or ratify any valuation decisions or approve any changes to the Valuation Procedures as it deems appropriate. On a quarterly basis, the Board of Trustees receives reports on any valuation actions taken by the Valuation Committee or the Management Valuation Team which may include items for ratification.
Valuations of fair valued securities are compared to the next actual sales price when available, or other appropriate market values, to assess the continued appropriateness of the fair valuation methodologies used. These securities are fair valued on a day-to-day basis, taking into consideration changes to appropriate market information and any significant changes to the inputs considered in the valuation process until there is a readily available price provided on an exchange or by an independent pricing service. Valuations received from an independent pricing service or independent broker-dealer quotes are periodically validated by comparisons to most recent trades and valuations provided by other independent pricing services in addition to the review of prices by the manager and/or subadviser. Unobservable inputs used in determining fair valuations are identified based on the type of security, taking into consideration factors utilized by market participants in valuing the investment, knowledge about the issuer and the current market environment.
When-issued transactions
The Fund may purchase securities on a forward commitment or when-issued basis. The Fund records a when-issued transaction on the trade date and will segregate assets in an amount at least equal in value to the Fund’s commitment to purchase when-issued securities. Securities purchased on a when-issued basis are marked-to-market daily and the Fund begins earning interest on the settlement date. Losses may arise due to changes in the market value of the underlying securities or if the counterparty does not perform under the contract.
| | | | |
| 36 | | Wells Fargo Strategic Municipal Bond Fund | | Notes to financial statements (unaudited) |
Futures contracts
The Fund is subject to interest rate risk in the normal course of pursuing its investment objectives. The Fund may buy and sell futures contracts in order to gain exposure to, or protect against, changes in interest rates. The primary risks associated with the use of futures contracts are the imperfect correlation between changes in market values of securities held by the Fund and the prices of futures contracts, and the possibility of an illiquid market.
The aggregate principal amounts of the contracts are not recorded in the financial statements. Fluctuations in the value of the contracts are recorded in the Statement of Assets and Liabilities as an asset or liability and in the Statement of Operations as unrealized gains or losses until the contracts are closed, at which point they are recorded as net realized gains or losses on futures contracts. With futures contracts, there is minimal counterparty risk to the Fund since futures are exchange traded and the exchange’s clearinghouse, as counterparty to all exchange traded futures, guarantees the futures against default.
Credit default swaps
The Fund is subject to credit risk in the normal course of pursuing its investment objectives. The Fund may enter into credit default swap contracts for hedging or speculative purposes to provide or receive a measure of protection against default on a referenced entity, obligation or index or for investment gains. Credit default swaps involve an exchange of a stream of payments for protection against the loss in value of an underlying security or index. Under the terms of the swap, one party acts as a guarantor (referred to as the seller of protection) and receives a periodic stream of payments, provided that there is no credit event, from another party (referred to as the buyer of protection) that is a fixed percentage applied to a notional principal amount over the term of the swap. An index credit default swap references all the names in the index, and if a credit event is triggered, the credit event is settled based on that name’s weight in the index. A credit event includes bankruptcy, failure to pay, obligation default, obligation acceleration, repudiation/moratorium, and restructuring. The Fund may enter into credit default swaps as either the seller of protection or the buyer of protection. As the seller of protection, the Fund is subject to investment exposure on the notional amount of the swap and has assumed the risk of default of the underlying security or index. As the buyer of protection, the Fund could be exposed to risks if the seller of the protection defaults on its obligation to perform, or if there are unfavorable changes in the fluctuation of interest rates. The maximum potential amount of future payments (undiscounted) that the Fund as the seller of protection could be required to make under the credit default swap contract would be an amount equal to the notional amount of the swap contract. The Fund’s maximum risk of loss from counterparty risk, either as the protection seller or as the protection buyer, is the fair value of the contract. This risk is mitigated by having a master netting arrangement between the Fund and the counterparty and by having the counterparty post collateral to cover the Fund’s exposure to the counterparty.
If the Fund is the seller of protection and a credit event occurs, as defined under the terms of that particular swap agreement, the Fund will pay to the buyer of protection the notional amount of the swap and take delivery of the referenced obligation or underlying securities comprising the referenced index. If the Fund is the buyer of protection and a credit event occurs, as defined under the terms of that particular swap agreement, the Fund will receive from the seller of protection the notional amount of the swap and deliver the referenced obligation or underlying securities comprising the referenced index.
Any premiums paid or received on the transactions are recorded as an asset or liability on the Statement of Assets and Liabilities and amortized. The value of the swap contract is marked-to-market daily based on quotations from an independent pricing service or an independent broker-dealer and any change in value is recorded as an unrealized gain or loss. Periodic payments made or received are recorded as realized gains or losses. In addition, payments received or made as a result of a credit event or termination of the contract are recognized as realized gains or losses.
Certain credit default swap contracts entered into by the Fund provide for conditions that result in events of default or termination that enable the counterparty to the agreement to cause an early termination of the transactions under those agreements.
Security transactions and income recognition
Securities transactions are recorded on a trade date basis. Realized gains or losses are recorded on the basis of identified cost.
Interest income is accrued daily and bond discounts are accreted and premiums are amortized daily based on the effective interest method. To the extent debt obligations are placed on non-accrual status, any related interest income may be reduced by writing off interest receivables when the collection of all or a portion of interest has been determined to be doubtful based on consistently applied procedures and the fair value has decreased. If the issuer subsequently resumes interest payments or when the collectability of interest is reasonably assured, the debt obligation is removed from non-accrual status.
| | | | | | |
| Notes to financial statements (unaudited) | | Wells Fargo Strategic Municipal Bond Fund | | | 37 | |
Distributions to shareholders
Distributions to shareholders from net investment income are accrued daily and paid monthly. Distributions from net realized gains, if any, are recorded on the ex-dividend date. Such distributions are determined in accordance with income tax regulations and may differ from U.S. generally accepted accounting principles. Dividend sources are estimated at the time of declaration. The tax character of distributions is determined as of the Fund’s fiscal year end. Therefore, a portion of the Fund’s distributions made prior to the Fund’s fiscal year end may be categorized as a tax return of capital.
Federal and other taxes
The Fund intends to continue to qualify as a regulated investment company by distributing substantially all of its investment company taxable and tax-exempt income and any net realized capital gains (after reduction for capital loss carryforwards) sufficient to relieve it from all, or substantially all, federal income taxes. Accordingly, no provision for federal income taxes was required.
The Fund’s income and federal excise tax returns and all financial records supporting those returns for the prior three fiscal years are subject to examination by the federal and Delaware revenue authorities. Management has analyzed the Fund’s tax positions taken on federal, state, and foreign tax returns for all open tax years and does not believe that there are any uncertain tax positions that require recognition of a tax liability.
As of December 31, 2017, the aggregate cost of all investments for federal income tax purposes was $1,974,870,826 and the unrealized gains (losses) consisted of:
| | | | |
Gross unrealized gains | | $ | 21,565,309 | |
Gross unrealized losses | | | (12,430,361 | ) |
Net unrealized gains | | $ | 9,134,948 | |
Class allocations
The separate classes of shares offered by the Fund differ principally in applicable sales charges, distribution, shareholder servicing, and administration fees. Class specific expenses are charged directly to that share class. Investment income, common expenses, and realized and unrealized gains (losses) on investments are allocated daily to each class of shares based on the relative proportion of net assets of each class.
3. FAIR VALUATION MEASUREMENTS
Fair value measurements of investments are determined within a framework that has established a fair value hierarchy based upon the various data inputs utilized in determining the value of the Fund’s investments. The three-level hierarchy gives the highest priority to unadjusted quoted prices in active markets for identical assets or liabilities (Level 1) and the lowest priority to unobservable inputs (Level 3). The Fund’s investments are classified within the fair value hierarchy based on the lowest level of input that is significant to the fair value measurement. The inputs are summarized into three broad levels as follows:
| ∎ | | Level 1 – quoted prices in active markets for identical securities |
| ∎ | | Level 2 – other significant observable inputs (including quoted prices for similar securities, interest rates, prepayment speeds, credit risk, etc.) |
| ∎ | | Level 3 – significant unobservable inputs (including the Fund’s own assumptions in determining the fair value of investments) |
The inputs or methodologies used for valuing investments in securities are not necessarily an indication of the risk associated with investing in those securities.
| | | | |
| 38 | | Wells Fargo Strategic Municipal Bond Fund | | Notes to financial statements (unaudited) |
The following is a summary of the inputs used in valuing the Fund’s assets and liabilities as of December 31, 2017:
| | | | | | | | | | | | | | | | |
| | | Quoted prices
(Level 1) | | | Other significant
observable inputs (Level 2) | | | Significant
unobservable inputs (Level 3) | | | Total | |
Assets | | | | | | | | | | | | | | | | |
Investments in: | | | | | | | | | | | | | | | | |
| | | | |
Municipal obligations | | $ | 0 | | | $ | 1,943,719,963 | | | $ | 0 | | | $ | 1,943,719,963 | |
| | | | |
Other | | | 0 | | | | 27,950,122 | | | | 0 | | | | 27,950,122 | |
| | | | |
Short-term investments | | | | | | | | | | | | | | | | |
Investment companies | | | 12,503,304 | | | | 0 | | | | 0 | | | | 12,503,304 | |
Total assets | | $ | 12,503,304 | | | $ | 1,971,670,085 | | | $ | 0 | | | $ | 1,984,173,389 | |
Liabilities | | | | | | | | | | | | | | | | |
Credit default swap contracts | | $ | 0 | | | $ | 3,055,484 | | | $ | 0 | | | $ | 3,055,484 | |
Total liabilities | | $ | 0 | | | $ | 3,055,484 | | | $ | 0 | | | $ | 3,055,484 | |
Swap contracts consists of unrealized losses and premiums received on swap contracts, which represents the change in the contract’s value from trade date. All other assets and liabilities are reported at their market value at measurement date.
The Fund recognizes transfers between levels within the fair value hierarchy at the end of the reporting period. At December 31, 2017, the Fund did not have any transfers into/out of Level 1, Level 2, or Level 3.
4. TRANSACTIONS WITH AFFILIATES
Management fee
Funds Management, an indirect wholly owned subsidiary of Wells Fargo & Company (“Wells Fargo”), is the manager of the Fund and provides advisory and fund-level administrative services under an investment management agreement. Under the investment management agreement, Funds Management is responsible for, among other services, implementing the investment objectives and strategies of the Fund, supervising the subadviser, providing fund-level administrative services in connection with the Fund’s operations, and providing any other fund-level administrative services reasonably necessary for the operation of the Fund. As compensation for its services under the investment management agreement, Funds Management is entitled to receive an annual management fee starting at 0.40% and declining to 0.28% as the average daily net assets of the Fund increase. For the six months ended December 31, 2017, the management fee was equivalent to an annual rate of 0.37% of the Fund’s average daily net assets.
Funds Management has retained the services of a subadviser to provide daily portfolio management to the Fund. The fee for subadvisory services is borne by Funds Management. Wells Capital Management Incorporated, an affiliate of Funds Management and an indirect wholly owned subsidiary of Wells Fargo, is the subadviser to the Fund and is entitled to receive a fee from Funds Management at an annual rate starting at 0.20% and declining to 0.10% as the average daily net assets of the Fund increase.
Administration fees
Under a class-level administration agreement, Funds Management provides class-level administrative services to the Fund, which includes paying fees and expenses for services provided by the transfer agent, sub-transfer agents, omnibus account servicers and record-keepers. As compensation for its services under the class-level administration agreement, Funds Management receives an annual fee which is calculated based on the average daily net assets of each class as follows:
| | | | |
| | | Class-level
administration fee | |
Class A, Class C | | | 0.16 | % |
Administrator Class | | | 0.10 | |
Institutional Class | | | 0.08 | |
| | | | | | |
| Notes to financial statements (unaudited) | | Wells Fargo Strategic Municipal Bond Fund | | | 39 | |
Funds Management has contractually waived and/or reimbursed management and administration fees to the extent necessary to maintain certain net operating expense ratios for the Fund. Waiver of fees and/or reimbursement of expenses by Funds Management were made first from fund level expenses on a proportionate basis and then from class specific expenses. Funds Management has committed through October 31, 2018 to waive fees and/or reimburse expenses to the extent necessary to cap the Fund’s expenses at 0.82% for Class A shares, 1.57% for Class C shares, 0.68% for Administrator Class shares, and 0.48% for Institutional Class shares. After this time, the cap may be increased or the commitment to maintain the cap may be terminated only with the approval of the Board of Trustees.
Distribution fee
The Trust has adopted a distribution plan for Class C shares of the Fund pursuant to Rule 12b-1 under the 1940 Act. A distribution fee is charged to Class C shares and paid to Wells Fargo Funds Distributor, LLC (“Funds Distributor”), the principal underwriter, at an annual rate of 0.75% of the average daily net assets of Class C shares. In addition, Funds Distributor is entitled to receive the front-end sales charge from the purchase of Class A shares and a contingent deferred sales charge on the redemption of certain Class A shares. Funds Distributor is also entitled to receive the contingent deferred sales charges from redemptions of Class C shares. For the six months ended December 31, 2017, Funds Distributor received $7,716 from the sale of Class A shares, and $2,500 and $1,173 in contingent deferred sales charges from redemptions of Class A shares and Class C shares, respectively.
Shareholder servicing fees
The Trust has entered into contracts with one or more shareholder servicing agents, whereby Class A, Class C, and Administrator Class of the Fund are charged a fee at an annual rate of 0.25% of the average daily net assets of each respective class.
A portion of these total shareholder servicing fees were paid to affiliates of Wells Fargo.
Interfund transactions
The Fund may purchase or sell portfolio investment securities to certain other Wells Fargo affiliates pursuant to Rule 17a-7 under the 1940 Act and under procedures adopted by the Board of Trustees. The procedures have been designed to ensure that these interfund transactions, which do not incur broker commissions, are effected at current market prices. Pursuant to these procedures, the Fund had $94,985,000 and $137,375,000 in interfund purchases and sales, respectively, during the six months ended December 31, 2017.
5. INVESTMENT PORTFOLIO TRANSACTIONS
Purchases and sales of investments, excluding U.S. government obligations (if any) and short-term securities, for the six months ended December 31, 2017 were $ 517,363,826 and $ 195,569,329, respectively.
6. DERIVATIVE TRANSACTIONS
During the six months ended December 31, 2017, the Fund enters into credit default swap contracts as a substitute for taking a position in the underlying security or basket of securities or to potentially enhance the Fund’s total return. The Fund had an average notional balance on credit default swaps of $ $11,969,592 during the six months ended December 31, 2017.
The Fund’s credit default swap may contain provisions for early termination in the event the net assets of the Fund declines below specific levels identified by the counterparty. If these levels are triggered, the counterparty may terminate the transaction and seek payment or request full collateralization of the derivative transactions in net liability positions. On December 31, 2017, the aggregate fair value of credit defaults swap with net asset contingent features that were in a liability position amounted to $3,055,484.
The fair value, realized gains or losses and change in unrealized gains or losses, if any, on derivative instruments are reflected in the corresponding financial statement captions.
For certain types of derivative transactions, the Fund has entered into International Swaps and Derivatives Association, Inc. master agreements (“ISDA Master Agreements”) or similar agreements with approved counterparties. The ISDA Master Agreements or similar agreements may have requirements to deliver/deposit securities or cash to/with an exchange or broker-dealer as collateral and allows the Fund to offset, with each counterparty, certain derivative financial instrument’s assets and/or liabilities with collateral held or pledged. Collateral requirements differ by type of derivative. Collateral or margin requirements are set by the broker or exchange clearinghouse for exchange traded derivatives while collateral terms are contract specific for over-the-counter traded derivatives. Cash collateral that has been pledged to cover obligations of the Fund under ISDA Master Agreements or similar agreements, if any, are reported separately in the
| | | | |
| 40 | | Wells Fargo Strategic Municipal Bond Fund | | Notes to financial statements (unaudited) |
Statement of Assets and Liabilities. Securities pledged as collateral, if any, are noted in the Portfolio of Investments. With respect to balance sheet offsetting, absent an event of default by the counterparty or a termination of the agreement, the reported amounts of financial assets and financial liabilities in the Statement of Assets and Liabilities are not offset across transactions between the Fund and the applicable counterparty. A reconciliation of the gross amounts on the Statement of Assets and Liabilities to the net amounts by derivative type, including any collateral exposure, is as follows:
| | | | | | | | | | | | |
| Counterparty | | Gross amounts
of liabilities in the
Statement of
Assets and
Liabilities | | Amounts
subject to
netting
agreements | | Collateral
pledged1 | | | Net amount
of liabilities | |
JPMorgan | | $3,055,484 | | $0 | | $ | (3,055,484 | ) | | $ | 0 | |
| | 1 | Collateral pledged within this table is limited to the collateral for the net transaction with the counterparty. | |
7. BANK BORROWINGS
The Trust (excluding the money market funds and certain other funds) and Wells Fargo Variable Trust are parties to a $280,000,000 revolving credit agreement whereby the Fund is permitted to use bank borrowings for temporary or emergency purposes, such as to fund shareholder redemption requests. Interest under the credit agreement is charged to the Fund based on a borrowing rate equal to the higher of the Federal Funds rate in effect on that day plus 1.25% or the overnight LIBOR rate in effect on that day plus 1.25%. In addition, an annual commitment fee equal to 0.25% of the unused balance is allocated to each participating fund. Prior to August 29, 2017, the revolving credit agreement amount was $250,000,000.
For the six months ended December 31, 2017, there were no borrowings by the Fund under the agreement.
8. INDEMNIFICATION
Under the Trust’s organizational documents, the officers and Trustees have been granted certain indemnification rights against certain liabilities that may arise out of performance of their duties to the Trust. Additionally, in the normal course of business, the Trust may enter into contracts with service providers that contain a variety of indemnification clauses. The Trust’s maximum exposure under these arrangements is dependent on future claims that may be made against the Fund and, therefore, cannot be estimated.
| | | | | | |
| Other information (unaudited) | | Wells Fargo Strategic Municipal Bond Fund | | | 41 | |
PROXY VOTING INFORMATION
A description of the policies and procedures that the Fund uses to determine how to vote proxies relating to portfolio securities is available, upon request, by calling 1-800-222-8222, visiting our website at wellsfargofunds.com, or visiting the SEC website at sec.gov. Information regarding how the Fund voted proxies relating to portfolio securities during the most recent 12-month period ended June 30 is available on the Fund’s website at wellsfargofunds.com or by visiting the SEC website at sec.gov.
PORTFOLIO HOLDINGS INFORMATION
The complete portfolio holdings for the Fund are publicly available monthly on the Fund’s website (wellsfargofunds.com), on a one-month delayed basis. In addition, top ten holdings information (excluding derivative positions) for the Fund is publicly available on the Fund’s website on a monthly, seven-day or more delayed basis. The Fund files its complete schedule of portfolio holdings with the SEC for the first and third quarters of each fiscal year on Form N-Q, which is available by visiting the SEC website at sec.gov. In addition, the Fund’s Form N-Q may be reviewed and copied at the SEC’s Public Reference Room in Washington, DC, and at regional offices in New York City, at 233 Broadway, and in Chicago, at 175 West Jackson Boulevard, Suite 900. Information about the Public Reference Room may be obtained by calling 1-800-SEC-0330.
| | | | |
| 42 | | Wells Fargo Strategic Municipal Bond Fund | | Other information (unaudited) |
BOARD OF TRUSTEES AND OFFICERS
Each of the Trustees and Officers1 listed in the table below acts in identical capacities for each fund in the Wells Fargo family of funds, which consists of 153 mutual funds comprising the Wells Fargo Funds Trust, Wells Fargo Variable Trust, Wells Fargo Master Trust and four closed-end funds (collectively the “Fund Complex”). This table should be read in conjunction with the Prospectus and the Statement of Additional Information2. The mailing address of each Trustee and Officer is 525 Market Street, 12th Floor, San Francisco, CA 94105. Each Trustee and Officer serves an indefinite term, however, each Trustee serves such term until reaching the mandatory retirement age established by the Trustees.
Independent Trustees
| | | | | | |
Name and year of birth | | Position held and length of service* | | Principal occupations during past five years or longer | | Current other public company or
investment company
directorships |
William R. Ebsworth (Born 1957) | | Trustee, since 2015 | | Retired. From 1984 to 2013, equities analyst, portfolio manager, research director and chief investment officer at Fidelity Management and Research Company in Boston, Tokyo, and Hong Kong, and retired in 2013 as Chief Investment Officer of Fidelity Strategic Advisers, Inc. where he led a team of investment professionals managing client assets. Prior thereto, Board member of Hong Kong Securities Clearing Co., Hong Kong Options Clearing Corp., the Thailand International Fund, Ltd., Fidelity Investments Life Insurance Company, and Empire Fidelity Investments Life Insurance Company. Board member of the Forté Foundation (non-profit organization) and the Vincent Memorial Hospital Endowment (non-profit organization), where he serves on the Investment Committee and as a Chair of the Audit Committee. Mr. Ebsworth is a CFA® charterholder. | | Asset Allocation Trust |
Jane A. Freeman** (Born 1953) | | Trustee, since 2015; Chair Liaison, since 2018 | | Retired. From 2012 to 2014 and 1999 to 2008, Chief Financial Officer of Scientific Learning Corporation. From 2008 to 2012, Ms. Freeman provided consulting services related to strategic business projects. Prior to 1999, Portfolio Manager at Rockefeller & Co. and Scudder, Stevens & Clark. Board member of the Harding Loevner Funds from 1996 to 2014, serving as both Lead Independent Director and chair of the Audit Committee. Board member of the Russell Exchange Traded Funds Trust from 2011 to 2012 and the chair of the Audit Committee. Ms. Freeman is a Board Member of Ruth Bancroft Garden (non-profit organization) and the Glimmerglass Festival. She is also an inactive Chartered Financial Analyst. | | Asset Allocation Trust |
Peter G. Gordon*** (Born 1942) | | Trustee, since 1998; Chairman, from 2005 to 2017 | | Co-Founder, Retired Chairman, President and CEO of Crystal Geyser Water Company. Trustee Emeritus, Colby College. | | Asset Allocation Trust |
Isaiah Harris, Jr. (Born 1952) | | Trustee, since 2009 | | Retired. Chairman of the Board of CIGNA Corporation since 2009, and Director since 2005. From 2003 to 2011, Director of Deluxe Corporation. Prior thereto, President and CEO of BellSouth Advertising and Publishing Corp. from 2005 to 2007, President and CEO of BellSouth Enterprises from 2004 to 2005 and President of BellSouth Consumer Services from 2000 to 2003. Emeritus member of the Iowa State University Foundation Board of Governors. Emeritus Member of the Advisory Board of Iowa State University School of Business. Advisory Board Member, Palm Harbor Academy (charter school). Advisory Board Member, Child Evangelism Fellowship (non-profit). Mr. Harris is a certified public accountant (inactive status). | | CIGNA Corporation; Asset Allocation Trust |
Judith M. Johnson (Born 1949) | | Trustee, since 2008; Audit Committee Chairman, since 2008 | | Retired. Prior thereto, Chief Executive Officer and Chief Investment Officer of Minneapolis Employees Retirement Fund from 1996 to 2008. Ms. Johnson is an attorney, certified public accountant and a certified managerial accountant. | | Asset Allocation Trust |
David F. Larcker (Born 1950) | | Trustee, since 2009 | | James Irvin Miller Professor of Accounting at the Graduate School of Business, Stanford University, Director of the Corporate Governance Research Initiative and Senior Faculty of The Rock Center for Corporate Governance since 2006. From 2005 to 2008, Professor of Accounting at the Graduate School of Business, Stanford University. Prior thereto, Ernst & Young Professor of Accounting at The Wharton School, University of Pennsylvania from 1985 to 2005. | | Asset Allocation Trust |
| | | | | | |
| Other information (unaudited) | | Wells Fargo Strategic Municipal Bond Fund | | | 43 | |
| | | | | | |
Name and year of birth | | Position held and length of service* | | Principal occupations during past five years or longer | | Current other public company or
investment company
directorships |
Olivia S. Mitchell**** (Born 1953) | | Trustee, since 2006; Governance Committee Chairman, since 2018 | | International Foundation of Employee Benefit Plans Professor, Wharton School of the University of Pennsylvania since 1993. Director of Wharton’s Pension Research Council and Boettner Center on Pensions & Retirement Research, and Research Associate at the National Bureau of Economic Research. Previously, Cornell University Professor from 1978 to 1993. | | Asset Allocation Trust |
Timothy J. Penny***** (Born 1951) | | Trustee, since 1996; Chairman, since 2018; Vice Chairman, from 2017 to 2018 | | President and Chief Executive Officer of Southern Minnesota Initiative Foundation, a non-profit organization, since 2007. Member of the Board of Trustees of NorthStar Education Finance, Inc., a non-profit organization, since 2007. | | Asset Allocation Trust |
James G. Polisson****** (Born 1959) | | Trustee, since 2018; Advisory Board Member, from 2017 to 2018 | | Retired. Chief Marketing Officer, Source (ETF) UK Services, Ltd, from 2015 to 2017. From 2012 to 2015, Principal of The Polisson Group, LLC, a management consulting, corporate advisory and principal investing company. Chief Executive Officer and Managing Director at Russell Investments, Global Exchange Traded Funds from 2010 to 2012. Managing Director of Barclays Global Investors from 1998 to 2010 and Global Chief Marketing Officer for iShares and Barclays Global Investors from 2000 to 2010. Trustee of the San Francisco Mechanics’ Institute, a non-profit organization, from 2013 to 2015. Board member of the Russell Exchange Traded Fund Trust from 2011 to 2012. Director of Barclays Global Investors Holdings Deutschland GmbH from 2006 to 2009. Mr. Polisson is an attorney and has a retired status with the Massachusetts and District of Columbia Bar Associations. | | Asset Allocation Trust |
Michael S. Scofield (Born 1943) | | Trustee, since 2010 | | Served on the Investment Company Institute’s Board of Governors and Executive Committee from 2008-2011 as well the Governing Council of the Independent Directors Council from 2006-2011 and the Independent Directors Council Executive Committee from 2008-2011. Trustee of the Evergreen Funds complex (and its predecessors) from 1984 to 2010. Chairman of the Evergreen Funds from 2000-2010. Former Trustee of the Mentor Funds. Retired Attorney, Law Offices of Michael S. Scofield. | | Asset Allocation Trust |
Pamela Wheelock****** (Born 1959) | | Trustee, since 2018; Advisory Board Member, from 2017 to 2018 | | Chief Operating Officer, Twin Cities Habitat for Humanity, since January, 2017. Vice President of University Services, University of Minnesota from 2012 to 2017. Prior thereto, Interim President and Chief Executive Officer of Blue Cross Blue Shield of Minnesota from 2010 to 2011, Chairman of the Board from 2009 to 2011 and Board Director from 2003 to 2015. Vice President, Leadership and Community Engagement, Bush Foundation, Saint Paul, Minnesota (a private foundation) from 2009 to 2011. Executive Vice President and Chief Financial Officer, Minnesota Sports and Entertainment from 2004 to 2009 and Senior Vice President from 2002 to 2004. Commissioner of Finance, State of Minnesota, from 1999 to 2002. Currently on the Board of Directors, Governance Committee and Finance Committee, for the Minnesota Philanthropy Partners (Saint Paul Foundation) since 2012 and Board Chair of the Minnesota Wild Foundation since 2010. | | Asset Allocation Trust |
| * | Length of service dates reflect the Trustee’s commencement of service with the Trust’s predecessor entities, where applicable. |
| ** | Jane Freeman became Chair Liaison effective January 1, 2018. |
| *** | Peter Gordon retired on December 31, 2017. |
| **** | Olivia Mitchell became Chairman of the Governance Committee effective January 1, 2018. |
| ***** | Timothy Penny became Chairman effective January 1, 2018. |
| ****** | James Polisson and Pamela Wheelock each became a Trustee effective January 1, 2018. |
| | | | |
| 44 | | Wells Fargo Strategic Municipal Bond Fund | | Other information (unaudited) |
Officers
| | | | | | |
Name and year of birth | | Position held and
length of service | | Principal occupations during past five years or longer | | |
Andrew Owen (Born 1960) | | President, since 2017 | | Executive Vice President of Wells Fargo & Company and Head of Affiliated Managers, Wells Fargo Asset Management, since 2014. In addition, Mr. Owen is currently President, Chief Executive Officer and Director of Wells Fargo Funds Management, LLC since 2017. Prior thereto, Executive Vice President responsible for marketing, investments and product development for Wells Fargo Funds Management, LLC, from 2009 to 2014. | | |
Nancy Wiser1 (Born 1967) | | Treasurer, since 2012 | | Executive Vice President of Wells Fargo Funds Management, LLC since 2011. Chief Operating Officer and Chief Compliance Officer at LightBox Capital Management LLC, from 2008 to 2011. | | |
C. David Messman (Born 1960) | | Secretary, since 2000; Chief Legal Officer, since 2003 | | Senior Vice President and Secretary of Wells Fargo Funds Management, LLC since 2001. Assistant General Counsel of Wells Fargo Bank, N.A. since 2013 and Vice President and Managing Counsel of Wells Fargo Bank, N.A. from 1996 to 2013. | | |
Michael H. Whitaker (Born 1967) | | Chief Compliance Officer, since 2016 | | Senior Vice President and Chief Compliance Officer since 2016. Senior Vice President and Chief Compliance Officer for Fidelity Investments from 2007 to 2016. | | |
David Berardi (Born 1975) | | Assistant Treasurer, since 2009 | | Vice President of Wells Fargo Funds Management, LLC since 2009. Vice President of Evergreen Investment Management Company, LLC from 2008 to 2010. Manager of Fund Reporting and Control for Evergreen Investment Management Company, LLC from 2004 to 2010. | | |
Jeremy DePalma1 (Born 1974) | | Assistant Treasurer, since 2009 | | Senior Vice President of Wells Fargo Funds Management, LLC since 2009. Senior Vice President of Evergreen Investment Management Company, LLC from 2008 to 2010 and head of the Fund Reporting and Control Team within Fund Administration from 2005 to 2010. | | |
| 1 | Nancy Wiser acts as Treasurer of 77 funds in the Fund Complex. Jeremy DePalma acts as Treasurer of 76 funds and Assistant Treasurer of 77 funds in the Fund Complex. |
| 2 | The Statement of Additional Information includes additional information about the Trustees and is available, without charge, upon request, by calling 1-800-222-8222 or by visiting the website at wellsfargofunds.com. |
| | | | | | |
| List of abbreviations | | Wells Fargo Strategic Municipal Bond Fund | | | 45 | |
The following is a list of common abbreviations for terms and entities that may have appeared in this report.
| ACA | — ACA Financial Guaranty Corporation |
| ADR | — American depositary receipt |
| ADS | — American depositary shares |
| AGC | — Assured Guaranty Corporation |
| AGM | — Assured Guaranty Municipal |
| Ambac | — Ambac Financial Group Incorporated |
| AMT | — Alternative minimum tax |
| BAN | — Bond anticipation notes |
| BHAC | — Berkshire Hathaway Assurance Corporation |
| CAB | — Capital appreciation bond |
| CCAB | — Convertible capital appreciation bond |
| CDA | — Community Development Authority |
| CDO | — Collateralized debt obligation |
| CLO | — Collateralized loan obligation |
| DRIVER | — Derivative inverse tax-exempt receipts |
| DW&P | — Department of Water & Power |
| DWR | — Department of Water Resources |
| ECFA | — Educational & Cultural Facilities Authority |
| EDA | — Economic Development Authority |
| EDFA | — Economic Development Finance Authority |
| ETF | — Exchange-traded fund |
| FDIC | — Federal Deposit Insurance Corporation |
| FFCB | — Federal Farm Credit Banks |
| FGIC | — Financial Guaranty Insurance Corporation |
| FHA | — Federal Housing Administration |
| FHLB | — Federal Home Loan Bank |
| FHLMC | — Federal Home Loan Mortgage Corporation |
| FICO | — The Financing Corporation |
| FNMA | — Federal National Mortgage Association |
| GDR | — Global depositary receipt |
| GNMA | — Government National Mortgage Association |
| HCFR | — Healthcare facilities revenue |
| HEFA | — Health & Educational Facilities Authority |
| HEFAR | — Higher education facilities authority revenue |
| HFA | — Housing Finance Authority |
| HFFA | — Health Facilities Financing Authority |
| HUD | — Department of Housing and Urban Development |
| IDA | — Industrial Development Authority |
| IDAG | — Industrial Development Agency |
| KRW | — Republic of Korea won |
| LIBOR | — London Interbank Offered Rate |
| LIFER | — Long Inverse Floating Exempt Receipts |
| LLC | — Limited liability company |
| LLLP | — Limited liability limited partnership |
| LLP | — Limited liability partnership |
| MBIA | — Municipal Bond Insurance Association |
| MFHR | — Multifamily housing revenue |
| MSTR | — Municipal securities trust receipts |
| MUD | — Municipal Utility District |
| National | — National Public Finance Guarantee Corporation |
| PCFA | — Pollution Control Financing Authority |
| PCL | — Public Company Limited |
| PCR | — Pollution control revenue |
| PFA | — Public Finance Authority |
| PFFA | — Public Facilities Financing Authority |
| PFOTER | — Puttable floating option tax-exempt receipts |
| PJSC | — Public Joint Stock Company |
| plc | — Public limited company |
| PUTTER | — Puttable tax-exempt receipts |
| R&D | — Research & development |
| Radian | — Radian Asset Assurance |
| RAN | — Revenue anticipation notes |
| RDA | — Redevelopment Agency |
| RDFA | — Redevelopment Finance Authority |
| REIT | — Real estate investment trust |
| ROC | — Reset option certificates |
| SAVRS | — Select auction variable rate securities |
| SBA | — Small Business Authority |
| SDR | — Swedish depositary receipt |
| SFHR | — Single-family housing revenue |
| SFMR | — Single-family mortgage revenue |
| SIFMA | — Securities Industry and Financial Markets Association |
| SPA | — Standby purchase agreement |
| SPDR | — Standard & Poor’s Depositary Receipts |
| SPEAR | — Short Puttable Exempt Adjustable Receipts |
| STRIPS | — Separate trading of registered interest and |
| TAN | — Tax anticipation notes |
| TIPS | — Treasury inflation-protected securities |
| TRAN | — Tax revenue anticipation notes |
| TTFA | — Transportation Trust Fund Authority |
| TVA | — Tennessee Valley Authority |
This page is intentionally left blank.
This page is intentionally left blank.
This page is intentionally left blank.

For more information
More information about Wells Fargo Funds is available free upon request. To obtain literature, please write, email, visit the Fund’s website, or call:
Wells Fargo Funds
P.O. Box 8266
Boston, MA 02266-8266
Email: fundservice@wellsfargo.com
Website: wellsfargofunds.com
Individual investors: 1-800-222-8222
Retail investment professionals: 1-888-877-9275
Institutional investment professionals: 1-866-765-0778
This report and the financial statements contained herein are submitted for the general information of the shareholders of the Fund. If this report is used for promotional purposes, distribution of the report must be accompanied or preceded by a current prospectus. Before investing, please consider the investment objectives, risks, charges, and expenses of the investment. For a current prospectus and, if available, a summary prospectus, containing this information, call 1-800-222-8222 or visit the Fund’s website at wellsfargofunds.com. Read the prospectus carefully before you invest or send money.
Wells Fargo Asset Management (WFAM) is a trade name used by the asset management businesses of Wells Fargo & Company. Wells Fargo Funds Management, LLC, a wholly owned subsidiary of Wells Fargo & Company, provides investment advisory and administrative services for Wells Fargo Funds. Other affiliates of Wells Fargo & Company provide subadvisory and other services for the funds. The funds are distributed by Wells Fargo Funds Distributor, LLC, Member FINRA, an affiliate of Wells Fargo & Company. Neither Wells Fargo Funds Distributor nor Wells Fargo Funds Management holds fund shareholder accounts or assets. This material is for general informational and educational purposes only and is NOT intended to provide investment advice or a recommendation of any kind—including a recommendation for any specific investment, strategy, or plan.
NOT FDIC INSURED ◾ NO BANK GUARANTEE ◾ MAY LOSE VALUE
© 2017 Wells Fargo Funds Management, LLC. All rights reserved.
| | |
 | | 308068 02-18 SA257/SAR257 12-17 |
Semi-Annual Report
December 31, 2017

Wells Fargo
Ultra Short-Term Municipal Income Fund


Reduce clutter. Save trees.
Sign up for electronic delivery of prospectuses and shareholder reports at wellsfargo.com/advantagedelivery
Contents
The views expressed and any forward-looking statements are as of December 31, 2017, unless otherwise noted, and are those of the Fund managers and/or Wells Fargo Funds Management, LLC. Discussions of individual securities, or the markets generally, or any Wells Fargo Fund are not intended as individual recommendations. Future events or results may vary significantly from those expressed in any forward-looking statements. The views expressed are subject to change at any time in response to changing circumstances in the market. Wells Fargo Funds Management, LLC and the Fund disclaim any obligation to publicly update or revise any views expressed or forward-looking statements.
NOT FDIC INSURED ◾ NO BANK GUARANTEE ◾ MAY LOSE VALUE
| | | | |
| 2 | | Wells Fargo Ultra Short-Term Municipal Income Fund | | Letter to shareholders (unaudited) |

Andrew Owen
President
Wells Fargo Funds
In a predominantly improving global economic environment, global stocks delivered strong results; bond markets had smaller but positive results as well.
Dear Shareholder:
We are pleased to offer you this semi-annual report for the Wells Fargo Ultra Short-Term Municipal Income Fund for the six-month period that ended December 31, 2017. In a predominantly improving global economic environment, global stocks delivered strong results; bond markets had smaller but positive results as well. U.S. and international stocks delivered similar results, with returns of 11.42% and 11.48%, respectively, for the six-month period, as measured by the S&P 500 Index1 and the MSCI ACWI ex USA Index (Net)2, respectively; within fixed income, the Bloomberg Barclays U.S. Aggregate Bond Index3 returned 1.24% and the Bloomberg Barclays Municipal Bond Index4 returned 1.82%.
As global growth improved in the third quarter of 2017, investment markets generally advanced.
Most stock markets worldwide moved higher during the quarter and ended the period at or near all-time highs. Moderate acceleration in global economic growth was supported by improving corporate earnings, low inflation pressure, and still-low interest rates. Corporate earnings reports were favorable overall as companies continued to benefit from healthy operating leverage. While North Korea’s recent missile launches and nuclear testing raised serious concerns around the world, the heightened geopolitical risk had relatively minimal impact on the quarter’s stock returns. In the U.S., economic data released during the quarter reflected a generally healthy economy. Second-quarter economic output grew at a 3.1% annual rate, and consumers displayed more willingness to spend. Meanwhile, the U.S. Federal Reserve (Fed) maintained the target range for the federal funds rate at 1.00% to 1.25%, noting that inflation had remained below the Fed’s 2.00% objective. However, the Fed also stated the possibility of one more 0.25% increase in the federal funds rate by the end of 2017 and announced plans to begin the process of unwinding its $4.5 trillion portfolio of bonds and other assets in October. Outside the U.S., stocks in the Asia Pacific region benefited from solid earnings reports and investors’ willingness to take on risk despite the rising tensions between North Korea and the U.S. In Europe, markets were supported by better-than-expected economic growth, which led to narrowing of the gap between Europe’s growth rate and that of the U.S. In emerging markets, many countries benefited from stronger currencies versus the U.S. dollar.
Positive economic and market news continued through the fourth quarter.
During the fourth quarter of 2017, stock markets followed a steady, upward trajectory with no meaningful pullbacks, similar to their paths during the previous three quarters of the year. The extended rally was driven largely by reports of strong earnings and revenue surprises from many companies. Synchronous economic expansion worldwide with mild inflation provided a favorable environment for markets to rise with minimal volatility. Data released during the quarter reflected a
| 1 | The S&P 500 Index consists of 500 stocks chosen for market size, liquidity, and industry group representation. It is a market-value-weighted index with each stock’s weight in the index proportionate to its market value. You cannot invest directly in an index. |
| 2 | The Morgan Stanley Capital International (MSCI) All Country World Index (ACWI) ex USA Index (Net) is a free-float-adjusted market-capitalization-weighted index that is designed to measure the equity market performance of developed markets, excluding the United States and Canada. Source: MSCI. MSCI makes no express or implied warranties or representations and shall have no liability whatsoever with respect to any MSCI data contained herein. The MSCI data may not be further redistributed or used as a basis for other indices or any securities or financial products. This report is not approved, reviewed, or produced by MSCI. You cannot invest directly in an index. |
| 3 | The Bloomberg Barclays U.S. Aggregate Bond Index is a broad-based benchmark that measures the investment-grade, U.S. dollar-denominated, fixed-rate taxable bond market, including Treasuries, government-related and corporate securities, mortgage-backed securities (agency fixed-rate and hybrid adjustable-rate mortgage pass-throughs), asset-backed securities, and commercial mortgage-backed securities. You cannot invest directly in an index. |
| 4 | The Bloomberg Barclays Municipal Bond Index is an unmanaged index composed of long-term tax-exempt bonds with a minimum credit rating of Baa. You cannot invest directly in an index. |
| | | | | | |
| Letter to shareholders (unaudited) | | Wells Fargo Ultra Short-Term Municipal Income Fund | | | 3 | |
healthy U.S. economy. Third-quarter economic output grew at a 3.2% annual rate, just ahead of the second quarter’s 3.1% pace. Hiring remained solid during the quarter; the hiring pace pushed the unemployment rate down to a 17-year low of 4.1% in October, and it remained at 4.1% for both November and December. Fed officials began unwinding the Fed’s $4.5 trillion portfolio of bonds and other assets in October as planned, and in December they raised the target for the federal funds rate to a range of 1.25% to 1.50%. As a result, long-term interest rates in the U.S. continued trending upward, although the 10-year rate remained below 2.5%. Outside the U.S., economies continued to strengthen. In December, the Organisation for Economic Co-operation and Development (OECD) reported that the global economy has been expanding at its fastest rate since 2010; all 45 countries the OECD follows were on track to expand for 2017. International economies have benefited from catalysts such as economic stimulus, improving employment, increased investment, and accelerated trade growth.
Don’t let short-term uncertainty derail long-term investment goals.
Periods of investment uncertainty can present challenges, but experience has taught us that maintaining long-term investment goals can be an effective way to plan for the future. To help you create a sound strategy based on your personal goals and risk tolerance, Wells Fargo Funds offers more than 100 mutual funds spanning a wide range of asset classes and investment styles. Although diversification cannot guarantee an investment profit or prevent losses, we believe it can be an effective way to manage investment risk and potentially smooth out overall portfolio performance. We encourage investors to know their investments and to understand that appropriate levels of risk-taking may unlock opportunities.
Thank you for choosing to invest with Wells Fargo Funds. We appreciate your confidence in us and remain committed to helping you meet your financial needs.
Sincerely,

Andrew Owen
President
Wells Fargo Funds
Although diversification cannot guarantee an investment profit or prevent losses, we believe it can be an effective way to manage investment risk and potentially smooth out overall portfolio performance.
For further information about your Fund, contact your investment professional, visit our website at wellsfargofunds.com, or call us directly at 1-800-222-8222. We are available 24 hours a day, 7 days a week.
| | | | |
| 4 | | Wells Fargo Ultra Short-Term Municipal Income Fund | | Performance highlights (unaudited) |
Investment objective
The Fund seeks current income exempt from federal income tax, consistent with capital preservation.
Manager
Wells Fargo Funds Management, LLC
Subadviser
Wells Capital Management Incorporated
Portfolio managers
Wendy Casetta
Lyle J. Fitterer, CFA®, CPA
Bruce R. Johns‡
Average annual total returns (%) as of December 31, 20171
| | | | | | | | | | | | | | | | | | | | | | | | | | | | | | | | | | |
| | | | | Including sales charge | | | Excluding sales charge | | | Expense ratios2 (%) | |
| | | Inception date | | 1 year | | | 5 year | | | 10 year | | | 1 year | | | 5 year | | | 10 year | | | Gross | | | Net3 | |
| Class A (SMAVX) | | 10-2-2000 | | | (1.13 | ) | | | (0.14 | ) | | | 1.07 | | | | 0.89 | | | | 0.26 | | | | 1.28 | | | | 0.75 | | | | 0.67 | |
| Class C (WFUSX) | | 3-31-2008 | | | (0.99 | ) | | | (0.51 | ) | | | 0.52 | | | | 0.01 | | | | (0.51 | ) | | | 0.52 | | | | 1.50 | | | | 1.42 | |
| Administrator Class (WUSMX) | | 7-30-2010 | | | – | | | | – | | | | – | | | | 0.96 | | | | 0.33 | | | | 1.36 | | | | 0.69 | | | | 0.60 | |
| Institutional Class (SMAIX) | | 7-31-2000 | | | – | | | | – | | | | – | | | | 1.20 | | | | 0.57 | | | | 1.58 | | | | 0.42 | | | | 0.37 | |
| Ultra Short-Term Municipal Income Blended Index4 | | – | | | – | | | | – | | | | – | | | | 0.75 | | | | 0.41 | | | | 0.90 | | | | – | | | | – | |
| Bloomberg Barclays 1-Year Municipal Bond Index5 | | – | | | – | | | | – | | | | – | | | | 0.92 | | | | 0.64 | | | | 1.48 | | | | – | | | | – | |
| iMoneyNet Tax-Free National Institutional Money Market Funds Average6 | | – | | | – | | | | – | | | | – | | | | 0.58 | | | | 0.17 | | | | 0.32 | | | | – | | | | – | |
Figures quoted represent past performance, which is no guarantee of future results, and do not reflect taxes that a shareholder may pay on fund distributions or the redemption of fund shares. Investment return and principal value of an investment will fluctuate so that an investor’s shares, when redeemed, may be worth more or less than their original cost. Performance shown without sales charges would be lower if sales charges were reflected. Current performance may be lower or higher than the performance data quoted, which assumes the reinvestment of dividends and capital gains. Current month-end performance is available on the Fund’s website, wellsfargofunds.com.
Index returns do not include transaction costs associated with buying and selling securities, any mutual fund fees or expenses, or any taxes. It is not possible to invest directly in an index.
For Class A shares, the maximum front-end sales charge is 2.00%. For Class C shares, the maximum contingent deferred sales charge is 1.00%. Performance including a contingent deferred sales charge assumes the sales charge for the corresponding time period. Administrator Class and Institutional Class shares are sold without a front-end sales charge or contingent deferred sales charge.
Bond values fluctuate in response to the financial condition of individual issuers, general market and economic conditions, and changes in interest rates. Changes in market conditions and government policies may lead to periods of heightened volatility in the bond market and reduced liquidity for certain bonds held by the Fund. In general, when interest rates rise, bond values fall and investors may lose principal value. Interest-rate changes and their impact on the Fund and its share price can be sudden and unpredictable. The use of derivatives may reduce returns and/or increase volatility. Certain investment strategies tend to increase the total risk of an investment (relative to the broader market). The Fund is exposed to high-yield securities risk and municipal securities risk. Consult the Fund’s prospectus for additional information on these and other risks. A portion of the Fund’s income may be subject to federal, state, and/ or local income taxes or the Alternative Minimum Tax (AMT). Any capital gains distributions may be taxable.
Please see footnotes on page 5.
| | | | | | |
| Performance highlights (unaudited) | | Wells Fargo Ultra Short-Term Municipal Income Fund | | | 5 | |
|
| Effective maturity distribution as of December 31, 20177 |
|
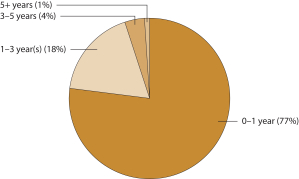
|
|
| Credit quality as of December 31, 20178 |
|
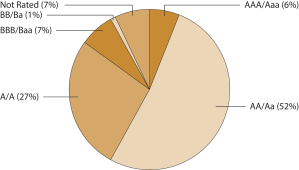
|
| ‡ | Mr. Johns became a portfolio manager of the Fund on November 1, 2017. |
| 1 | Effective June 20, 2008, the Advisor Class was renamed Class A and modified to assume the features and attributes of Class A. Performance shown for the Class A shares through June 19, 2008 includes Advisor Class expenses. Historical performance shown for Class C shares prior to their inception reflects the performance of Class A shares, adjusted to reflect the higher expenses applicable to Class C shares. Historical performance shown for Administrator Class shares prior to their inception reflects the performance of Institutional Class shares, adjusted to reflect the higher expenses applicable to Administrator Class shares. |
| 2 | Reflects the expense ratios as stated in the most recent prospectuses. The expense ratios shown are subject to change and may differ from the annualized expense ratios shown in the financial highlights of this report. |
| 3 | The manager has contractually committed through October 31, 2018, to waive fees and/or reimburse expenses to the extent necessary to cap the Fund’s Total Annual Fund Operating Expenses After Fee Waivers at the amounts shown. After this time, the cap may be increased or the commitment to maintain the cap may be terminated only with the approval of the Board of Trustees. Brokerage commissions, stamp duty fees, interest, taxes, acquired fund fees and expenses, and extraordinary expenses are excluded from the expense cap. Without this cap, the Fund’s returns would have been lower. The expense ratio paid by an investor is the net expense ratio or the Fund’s Total Annual Fund Operating Expenses After Fee Waivers, as stated in the prospectuses. |
| 4 | Source: Wells Fargo Funds Management LLC. The Ultra Short-Term Municipal Income Blended Index is weighted 50% in the Bloomberg Barclays 1-Year Municipal Bond Index and 50% in the iMoneyNet Tax-Free National Institutional Money Market Funds Average. You cannot invest directly in an index. |
| 5 | The Bloomberg Barclays 1-Year Municipal Bond Index is the one-year component of the Bloomberg Barclays Municipal Bond Index, which is an unmanaged index composed of long-term tax-exempt bonds with a minimum credit rating of Baa. You cannot invest directly in an index. |
| 6 | iMoneyNet Tax-Free National Institutional Money Market Funds Average is the return of an unmanaged group of money market funds. You cannot invest directly in this average. |
| 7 | Amounts are calculated based on the total investments of the Fund. These amounts are subject to change and may have changed since the date specified. |
| 8 | The credit quality distribution of portfolio holdings reflected in the chart is based on ratings from Standard & Poor’s, Moody’s Investors Service, and/ or Fitch Ratings Ltd. Credit quality ratings apply to the underlying holdings of the Fund and not to the Fund itself. The percentages of the Fund’s portfolio with the ratings depicted in the chart are calculated based on the total market value of fixed income securities held by the Fund. If a security was rated by all three rating agencies, the middle rating was utilized. If rated by two of three rating agencies, the lower rating was utilized, and if rated by one of the rating agencies, that rating was utilized. Standard & Poor’s rates the creditworthiness of bonds, ranging from AAA (highest) to D (lowest). Ratings from A to CCC may be modified by the addition of a plus (+) or minus (-) sign to show relative standing within the rating categories. Standard & Poor’s rates the creditworthiness of short-term notes from SP-1 (highest) to SP-3 (lowest). Moody’s rates the creditworthiness of bonds, ranging from Aaa (highest) to C (lowest). Ratings Aa to B may be modified by the addition of a number 1 (highest) to 3 (lowest) to show relative standing within the ratings categories. Moody’s rates the creditworthiness of short-term U.S. tax-exempt municipal securities from MIG 1/VMIG 1 (highest) to SG (lowest). Fitch rates the creditworthiness of bonds, ranging from AAA (highest) to D (lowest). Credit quality distribution is subject to change and may have changed since the date specified. |
| | | | |
| 6 | | Wells Fargo Ultra Short-Term Municipal Income Fund | | Fund expenses (unaudited) |
As a shareholder of the Fund, you incur two types of costs: (1) transaction costs, including sales charges (loads) on purchase payments and contingent deferred sales charges (if any) on redemptions and (2) ongoing costs, including management fees, distribution (12b-1) and/or shareholder servicing fees, and other Fund expenses. This example is intended to help you understand your ongoing costs (in dollars) of investing in the Fund and to compare these costs with the ongoing costs of investing in other mutual funds.
The example is based on an investment of $1,000 invested at the beginning of the six-month period and held for the entire period from July 1, 2017 to December 31, 2017.
Actual expenses
The “Actual” line of the table below provides information about actual account values and actual expenses. You may use the information in this line, together with the amount you invested, to estimate the expenses that you paid over the period. Simply divide your account value by $1,000 (for example, an $8,600 account value divided by $1,000 = 8.6), then multiply the result by the number in the “Actual” line under the heading entitled “Expenses paid during period” for your applicable class of shares to estimate the expenses you paid on your account during this period.
Hypothetical example for comparison purposes
The “Hypothetical” line of the table below provides information about hypothetical account values and hypothetical expenses based on the Fund’s actual expense ratio and an assumed rate of return of 5% per year before expenses, which is not the Fund’s actual return. The hypothetical account values and expenses may not be used to estimate the actual ending account balance or expenses you paid for the period. You may use this information to compare the ongoing costs of investing in the Fund and other funds. To do so, compare this 5% hypothetical example with the 5% hypothetical examples that appear in the shareholder reports of the other funds.
Please note that the expenses shown in the table are meant to highlight your ongoing costs only and do not reflect any transactional costs, such as sales charges (loads) and contingent deferred sales charges. Therefore, the “Hypothetical” line of the table is useful in comparing ongoing costs only and will not help you determine the relative total costs of owning different funds. In addition, if these transactional costs were included, your costs would have been higher.
| | | | | | | | | | | | | | | | |
| | | Beginning
account value
7-01-2017 | | | Ending
account value
12-31-2017 | | | Expenses
paid during
the period¹ | | | Annualized net
expense ratio | |
Class A | | | | | | | | | | | | | | | | |
Actual | | $ | 1,000.00 | | | $ | 1,003.54 | | | $ | 3.38 | | | | 0.67 | % |
Hypothetical (5% return before expenses) | | $ | 1,000.00 | | | $ | 1,021.83 | | | $ | 3.41 | | | | 0.67 | % |
Class C | | | | | | | | | | | | | | | | |
Actual | | $ | 1,000.00 | | | $ | 999.02 | | | $ | 7.15 | | | | 1.42 | % |
Hypothetical (5% return before expenses) | | $ | 1,000.00 | | | $ | 1,018.05 | | | $ | 7.22 | | | | 1.42 | % |
Administrator Class | | | | | | | | | | | | | | | | |
Actual | | $ | 1,000.00 | | | $ | 1,003.89 | | | $ | 3.03 | | | | 0.60 | % |
Hypothetical (5% return before expenses) | | $ | 1,000.00 | | | $ | 1,022.18 | | | $ | 3.06 | | | | 0.60 | % |
Institutional Class | | | | | | | | | | | | | | | | |
Actual | | $ | 1,000.00 | | | $ | 1,004.01 | | | $ | 1.87 | | | | 0.37 | % |
Hypothetical (5% return before expenses) | | $ | 1,000.00 | | | $ | 1,023.34 | | | $ | 1.89 | | | | 0.37 | % |
| 1 | Expenses paid is equal to the annualized net expense ratio of each class multiplied by the average account value over the period, multiplied by the number of days in the most recent fiscal half-year divided by the number of days in the fiscal year (to reflect the one-half-year period). |
| | | | | | |
| Portfolio of investments—December 31, 2017 (unaudited) | | Wells Fargo Ultra Short-Term Municipal Income Fund | | | 7 | |
| | | | | | | | | | | | | | | | |
| Security name | | Interest rate | | | Maturity date | | | Principal | | | Value | |
|
Municipal Obligations: 94.67% | |
| | | | |
| Alabama: 2.02% | | | | | | | | | | | | | | | | |
Alabama Black Belt Energy Gas District Series A (Utilities Revenue, Royal Bank of Canada LIQ) | | | 4.00 | % | | | 7-1-2046 | | | $ | 13,915,000 | | | $ | 14,742,943 | |
Alabama Health Care Authority for Baptist Health Series B (Health Revenue, AGC Insured) (m) | | | 2.05 | | | | 11-15-2037 | | | | 2,925,000 | | | | 2,925,000 | |
Alabama Health Care Authority for Baptist Health Series B (Health Revenue) ø | | | 2.10 | | | | 11-1-2042 | | | | 17,000,000 | | | | 17,000,000 | |
Alabama HFA Dauphin Gate Apartments Project Series B (Housing Revenue) | | | 1.35 | | | | 4-1-2020 | | | | 1,500,000 | | | | 1,497,630 | |
Alabama HFA The Park at Sydney Drive Series B (Housing Revenue) | | | 1.50 | | | | 12-1-2019 | | | | 10,000,000 | | | | 9,998,600 | |
Chatom AL Industrial Development Board Alabama Electric Series A (Utilities Revenue, National Rural Utilities Cooperative Finance SPA) | | | 1.30 | | | | 8-1-2037 | | | | 7,445,000 | | | | 7,441,575 | |
Jefferson County AL Series A (GO Revenue) | | | 4.90 | | | | 4-1-2021 | | | | 13,600,000 | | | | 14,073,144 | |
Tender Option Bond Trust Receipts/Floater Certificates Series 2016-XM0184 (Utilities Revenue, Morgan Stanley Bank LIQ) ø144A | | | 2.11 | | | | 9-1-2046 | | | | 31,400,000 | | | | 31,400,000 | |
Tuscaloosa County AL IDA (Industrial Development Revenue) ø | | | 1.60 | | | | 9-1-2020 | | | | 12,600,000 | | | | 12,600,000 | |
| |
| | | | 111,678,892 | |
| | | | | | | | | | | | | | | | |
| | | | |
| Alaska: 0.30% | | | | | | | | | | | | | | | | |
Alaska Housing Finance Corporation Series B (Housing Revenue, FHLB SPA) ø | | | 1.71 | | | | 12-1-2041 | | | | 2,545,000 | | | | 2,545,000 | |
Alaska Housing Finance Corporation Series D (Housing Revenue, Bank of America NA SPA) ø | | | 1.68 | | | | 12-1-2040 | | | | 12,775,000 | | | | 12,775,000 | |
North Slope Borough AK Water & Wastewater Facilities Service (Water & Sewer Revenue) | | | 4.00 | | | | 6-30-2018 | | | | 1,125,000 | | | | 1,138,838 | |
| |
| | | | 16,458,838 | |
| | | | | | | | | | | | | | | | |
| | | | |
| Arizona: 1.37% | | | | | | | | | | | | | | | | |
Maricopa County AZ Gilbert Unified School District #41 (GO Revenue, Build America Mutual Assurance Company Insured) | | | 3.00 | | | | 7-1-2019 | | | | 3,845,000 | | | | 3,923,015 | |
Maricopa County AZ IDA Series A (Health Revenue) | | | 5.00 | | | | 1-1-2048 | | | | 5,000,000 | | | | 5,698,300 | |
Maricopa County AZ Public Service Company Palo Verde Project Series C (Industrial Development Revenue) | | | 1.75 | | | | 5-1-2029 | | | | 4,975,000 | | | | 4,975,199 | |
Phoenix AZ IDA Basis Schools Incorporated Project Series A (Education Revenue) 144A | | | 3.00 | | | | 7-1-2020 | | | | 2,885,000 | | | | 2,865,122 | |
Pima County AZ IDA Charter Schools Refunding Bond Project Series Q (Education Revenue) | | | 4.00 | | | | 7-1-2019 | | | | 1,215,000 | | | | 1,246,797 | |
Pinal County AZ Unified School District #1 Series C (GO Revenue) | | | 5.25 | | | | 7-1-2028 | | | | 2,000,000 | | | | 2,036,900 | |
Scottsdale AZ IDA Healthcare Series F (Health Revenue, AGM Insured) (m) | | | 2.05 | | | | 9-1-2045 | | | | 54,950,000 | | | | 54,950,000 | |
| |
| | | | 75,695,333 | |
| | | | | | | | | | | | | | | | |
| | | | |
| Arkansas: 0.18% | | | | | | | | | | | | | | | | |
Arkansas Development Finance Authority Pine Bluff Rental Assistance Demonstration Conversion Project (Housing Revenue) | | | 1.69 | | | | 11-1-2021 | | | | 9,500,000 | | | | 9,481,190 | |
Arkansas Development Finance Authority Police Headquarters and Wireless Data Equipment Project (Miscellaneous Revenue, AGM Insured) | | | 4.00 | | | | 6-1-2018 | | | | 500,000 | | | | 505,240 | |
| |
| | | | 9,986,430 | |
| | | | | | | | | | | | | | | | |
| | | | |
| California: 8.51% | | | | | | | | | | | | | | | | |
Bay Area CA Toll Authority San Francisco Bay Area Toll Bridge Series C (Transportation Revenue) | | | 1.88 | | | | 4-1-2047 | | | | 3,000,000 | | | | 3,007,830 | |
California (SIFMA Municipal Swap +0.38%) (GO Revenue) ± | | | 2.09 | | | | 12-1-2027 | | | | 15,000,000 | | | | 14,989,350 | |
The accompanying notes are an integral part of these financial statements.
| | | | |
| 8 | | Wells Fargo Ultra Short-Term Municipal Income Fund | | Portfolio of investments—December 31, 2017 (unaudited) |
| | | | | | | | | | | | | | | | |
| Security name | | Interest rate | | | Maturity date | | | Principal | | | Value | |
| | | | |
| California (continued) | | | | | | | | | | | | | | | | |
California HFFA Dignity Health Series A (Health Revenue, Barclays Bank plc LOC, Barclays Bank plc LIQ) ø144A | | | 1.87 | % | | | 3-1-2042 | | | $ | 15,000,000 | | | $ | 15,000,000 | |
California HFFA San Diego Hospital Series A (Health Revenue, National Insured) (m)(n) | | | 1.67 | | | | 7-15-2018 | | | | 1,000,000 | | | | 995,840 | |
California Infrastructure and Economic Development Bank The J. Paul Getty Trust Series A-2 (3 Month LIBOR +0.37%) (Miscellaneous Revenue) ± | | | 1.56 | | | | 4-1-2038 | | | | 32,790,000 | | | | 32,761,473 | |
California Infrastructure and Economic Development Bank The J. Paul Getty Trust Series B-1 (SIFMA Municipal Swap +0.28%) (Miscellaneous Revenue) ± | | | 1.99 | | | | 10-1-2047 | | | | 3,000,000 | | | | 2,999,970 | |
California Municipal Financing Authority BAN Open Door Community Health Centers (Health Revenue) | | | 2.80 | | | | 9-15-2018 | | | | 6,000,000 | | | | 6,005,640 | |
California PFOTER Series DCL-009 (GO Revenue, Dexia Credit Local LOC, AGM Insured) ø144A | | | 1.97 | | | | 8-1-2027 | | | | 41,935,000 | | | | 41,935,000 | |
California PFOTER Series DCL-011 (GO Revenue, Dexia Credit Local LOC, AGM Insured) ø144A | | | 1.97 | | | | 8-1-2027 | | | | 10,665,000 | | | | 10,665,000 | |
California Pollution Control Financing Authority Series A (Resource Recovery Revenue) 144Aøø | | | 1.22 | | | | 8-1-2023 | | | | 20,500,000 | | | | 20,490,160 | |
California Pollution Control Financing Authority Series A-1 (Resource Recovery Revenue) 144Aøø | | | 1.30 | | | | 11-1-2042 | | | | 10,000,000 | | | | 10,000,100 | |
California Public Works Board Department of Corrections Project Series A (Miscellaneous Revenue, Ambac Insured) | | | 5.00 | | | | 12-1-2019 | | | | 1,325,000 | | | | 1,385,327 | |
California Refunding Bond Series A (SIFMA Municipal Swap +0.25%) (GO Revenue) ± | | | 1.96 | | | | 5-1-2033 | | | | 27,500,000 | | | | 27,491,200 | |
California Series D (SIFMA Municipal Swap +0.29%) (GO Revenue) ± | | | 2.00 | | | | 12-1-2028 | | | | 21,500,000 | | | | 21,499,785 | |
California Statewide CDA Health Facilities Catholic Series D (Health Revenue, AGM Insured) (m) | | | 1.91 | | | | 7-1-2041 | | | | 30,600,000 | | | | 30,600,000 | |
California Statewide CDA Health Facilities Catholic Series E (Health Revenue, AGM Insured) (m) | | | 2.05 | | | | 7-1-2040 | | | | 37,450,000 | | | | 37,450,000 | |
California Statewide CDA Health Facilities Catholic Series F (Health Revenue, AGM Insured) (m) | | | 2.05 | | | | 7-1-2040 | | | | 22,125,000 | | | | 22,125,000 | |
Compton CA PFA Prerefunded Bond (Miscellaneous Revenue, Ambac Insured) | | | 5.00 | | | | 9-1-2022 | | | | 5,910,000 | | | | 6,048,235 | |
Culver City CA RDA Series A (Tax Revenue, Ambac Insured) | | | 5.00 | | | | 11-1-2025 | | | | 2,000,000 | | | | 2,000,000 | |
Fontana CA RDA Downtown Redevelopment Project (Tax Revenue, National Insured) | | | 5.00 | | | | 9-1-2021 | | | | 1,480,000 | | | | 1,480,266 | |
Los Angeles CA Department of Water and Power Series B (Utilities Revenue) | | | 5.00 | | | | 12-1-2018 | | | | 53,645,000 | | | | 55,236,647 | |
Palomar Pomerado CA Health Care District Certificate of Participation Series A (Health Revenue, AGM Insured) (m) | | | 2.25 | | | | 11-1-2036 | | | | 13,050,000 | | | | 13,050,000 | |
Palomar Pomerado CA Health Care District Certificate of Participation Series B (Health Revenue, AGM Insured) (m) | | | 2.15 | | | | 11-1-2036 | | | | 15,700,000 | | | | 15,700,000 | |
Sacramento County CA Airport System AMT Senior Series B (Airport Revenue, AGM Insured) | | | 5.50 | | | | 7-1-2018 | | | | 2,240,000 | | | | 2,282,067 | |
Sacramento County CA Airport System Refunding Bond AMT Subordinate and PFC Series E (Airport Revenue, AGM Insured) | | | 5.50 | | | | 7-1-2018 | | | | 2,695,000 | | | | 2,745,612 | |
San Jose CA RDA Series C (Tax Revenue, National Insured) | | | 4.25 | | | | 8-1-2030 | | | | 37,040,000 | | | | 37,053,334 | |
Tender Option Bond Trust Receipts/Floater Certificates Series 2017-013 (Health Revenue, Barclays Bank plc LOC, Barclays Bank plc LIQ) ø144A | | | 1.87 | | | | 8-15-2051 | | | | 11,140,000 | | | | 11,140,000 | |
Tender Option Bond Trust Receipts/Floater Certificates Series 2017-BAML01 (Transportation Revenue, Bank of America NA LIQ) ø144A | | | 1.51 | | | | 4-1-2047 | | | | 23,445,000 | | | | 23,445,000 | |
| |
| | | | 469,582,836 | |
| | | | | | | | | | | | | | | | |
The accompanying notes are an integral part of these financial statements.
| | | | | | |
| Portfolio of investments—December 31, 2017 (unaudited) | | Wells Fargo Ultra Short-Term Municipal Income Fund | | | 9 | |
| | | | | | | | | | | | | | | | |
| Security name | | Interest rate | | | Maturity date | | | Principal | | | Value | |
| | | | |
| Colorado: 1.21% | | | | | | | | | | | | | | | | |
Colorado E-470 Public Highway Authority Series A (1 Month LIBOR +0.90%) (Transportation Revenue) ± | | | 1.95 | % | | | 9-1-2039 | | | $ | 2,750,000 | | | $ | 2,757,398 | |
Colorado Health Facilities Authority Catholic Health Initiatives Series B-3 (Health Revenue) | | | 1.88 | | | | 7-1-2039 | | | | 500,000 | | | | 496,540 | |
Colorado HEFA Covenant Retirement Community Series A (Health Revenue) | | | 4.00 | | | | 12-1-2018 | | | | 1,150,000 | | | | 1,175,174 | |
Colorado HEFA Montbello Senior Housing Project Series I (Housing Revenue, FHA Insured) | | | 1.05 | | | | 8-1-2018 | | | | 4,255,000 | | | | 4,241,512 | |
Colorado Springs CO Subordinate Lien Improvements Series A (Utilities Revenue, JPMorgan Chase & Company SPA) ø | | | 1.65 | | | | 11-1-2025 | | | | 10,900,000 | | | | 10,900,000 | |
Colorado Springs CO Utilities Systems Series B (Utilities Revenue, Sumitomo Mitsui Banking SPA) ø | | | 1.75 | | | | 11-1-2026 | | | | 24,000,000 | | | | 24,000,000 | |
Denver CO City and County Airport Subordinate Series A (Airport Revenue) | | | 5.00 | | | | 11-15-2018 | | | | 500,000 | | | | 514,125 | |
Denver CO City and County Airport Subordinate Series B (Airport Revenue) | | | 5.00 | | | | 11-15-2018 | | | | 600,000 | | | | 618,006 | |
Denver CO City and County Airport Subordinate Series F-2 (Airport Revenue, AGC Insured) (m) | | | 2.10 | | | | 11-15-2025 | | | | 6,100,000 | | | | 6,100,000 | |
Denver CO Health and Hospital Authority Refunding Bond Series A (Health Revenue) 144A | | | 5.00 | | | | 12-1-2018 | | | | 1,550,000 | | | | 1,593,028 | |
Denver CO Health and Hospital Authority Refunding Bond Series A (Health Revenue) 144A | | | 5.00 | | | | 12-1-2019 | | | | 1,730,000 | | | | 1,822,469 | |
Denver CO Health and Hospital Authority Refunding Bond Series A (Health Revenue) 144A | | | 5.00 | | | | 12-1-2020 | | | | 1,500,000 | | | | 1,616,010 | |
Pueblo CO Urban Renewal Authority Regional Tourism Act Project (Tax Revenue) | | | 2.75 | | | | 6-1-2020 | | | | 700,000 | | | | 700,805 | |
University of Colorado Hospital Authority Series C-1 (Health Revenue) | | | 4.00 | | | | 11-15-2047 | | | | 9,940,000 | | | | 10,308,774 | |
| |
| | | | 66,843,841 | |
| | | | | | | | | | | | | | | | |
| | | | |
| Connecticut: 2.03% | | | | | | | | | | | | | | | | |
Connecticut HEFA Yale University Issue Series A (Education Revenue) | | | 1.00 | | | | 7-1-2042 | | | | 15,000,000 | | | | 14,850,150 | |
Connecticut HEFA Yale University Issue Series A (Education Revenue) | | | 1.30 | | | | 7-1-2048 | | | | 8,500,000 | | | | 8,401,400 | |
Connecticut HEFA Yale University Issue Series U-1 (Education Revenue) | | | 1.00 | | | | 7-1-2033 | | | | 1,155,000 | | | | 1,148,266 | |
Connecticut HEFA Yale University Issue Series X-2 (Education Revenue) | | | 0.90 | | | | 7-1-2037 | | | | 24,700,000 | | | | 24,691,355 | |
Connecticut HFA Housing Mortgage Finance Program Series A (Housing Revenue) | | | 2.40 | | | | 11-15-2020 | | | | 1,250,000 | | | | 1,270,850 | |
Connecticut HFA Housing Mortgage Finance Program Series F (Housing Revenue) | | | 1.55 | | | | 5-15-2020 | | | | 1,020,000 | | | | 1,006,658 | |
Connecticut HFA Housing Mortgage Finance Program Series F (Housing Revenue, Helaba SPA) ø | | | 1.76 | | | | 11-15-2046 | | | | 25,500,000 | | | | 25,500,000 | |
Connecticut HFA Subordinate Series E-3 (Housing Revenue, GNMA/FNMA/FHLMC Insured) | | | 1.50 | | | | 11-15-2047 | | | | 7,535,000 | | | | 7,469,069 | |
Connecticut Higher Education Supplemental Loan Authority Chesla Loan Program Series B (Education Revenue) | | | 4.00 | | | | 11-15-2019 | | | | 1,200,000 | | | | 1,231,488 | |
Connecticut Higher Education Supplemental Loan Authority Chesla Loan Program Series B (Education Revenue) | | | 5.00 | | | | 11-15-2021 | | | | 700,000 | | | | 761,131 | |
Connecticut Higher Education Supplemental Loan Authority Chesla Loan Program Series B (Education Revenue) | | | 5.00 | | | | 11-15-2023 | | | | 565,000 | | | | 630,506 | |
Connecticut Series A (SIFMA Municipal Swap +0.42%) (Miscellaneous Revenue) ± | | | 2.13 | | | | 3-1-2018 | | | | 2,875,000 | | | | 2,875,086 | |
Connecticut Series A (SIFMA Municipal Swap +0.92%) (Miscellaneous Revenue) ± | | | 2.63 | | | | 5-15-2018 | | | | 7,000,000 | | | | 7,013,370 | |
Connecticut Series D (SIFMA Municipal Swap +0.88%) (Miscellaneous Revenue) ± | | | 2.59 | | | | 8-15-2018 | | | | 6,000,000 | | | | 6,017,400 | |
Hamden CT BAN (GO Revenue) | | | 3.00 | | | | 8-23-2018 | | | | 2,250,000 | | | | 2,268,743 | |
Hartford CT Metropolitan District Series B (GO Revenue) | | | 5.00 | | | | 6-1-2018 | | | | 2,280,000 | | | | 2,310,461 | |
Hartford CT Series A (GO Revenue) | | | 5.00 | | | | 12-1-2018 | | | | 510,000 | | | | 506,083 | |
New Haven CT Series A (GO Revenue) | | | 5.25 | | | | 8-1-2019 | | | | 735,000 | | | | 771,316 | |
New Haven CT TAN (GO Revenue) | | | 2.50 | | | | 5-15-2018 | | | | 2,000,000 | | | | 2,005,220 | |
Waterbury CT (GO Revenue) | | | 5.00 | | | | 2-1-2018 | | | | 1,215,000 | | | | 1,218,244 | |
| |
| | | | 111,946,796 | |
| | | | | | | | | | | | | | | | |
The accompanying notes are an integral part of these financial statements.
| | | | |
| 10 | | Wells Fargo Ultra Short-Term Municipal Income Fund | | Portfolio of investments—December 31, 2017 (unaudited) |
| | | | | | | | | | | | | | | | |
| Security name | | Interest rate | | | Maturity date | | | Principal | | | Value | |
| | | | |
| Delaware: 0.12% | | | | | | | | | | | | | | | | |
New Castle County DE Series ZF2088 (GO Revenue, Morgan Stanley Bank LIQ) ø144A | | | 1.76 | % | | | 10-1-2045 | | | $ | 6,665,000 | | | $ | 6,665,000 | |
| | | | | | | | | | | | | | | | |
|
| District of Columbia: 1.04% | |
District of Columbia DW&P Series B (Water & Sewer Revenue, TD Bank NA SPA) ø | | | 1.70 | | | | 10-1-2050 | | | | 25,500,000 | | | | 25,500,000 | |
District of Columbia National Child Research Center (Miscellaneous Revenue, SunTrust Bank LOC) ø | | | 1.78 | | | | 4-1-2038 | | | | 5,335,000 | | | | 5,335,000 | |
District of Columbia Population Services International (Miscellaneous Revenue, SunTrust Bank LOC) ø | | | 1.78 | | | | 11-1-2042 | | | | 26,300,000 | | | | 26,300,000 | |
| |
| | | | 57,135,000 | |
| | | | | | | | | | | | | | | | |
| | | | |
| Florida: 4.54% | | | | | | | | | | | | | | | | |
Central Florida Expressway Authority BAN (Transportation Revenue) | | | 1.63 | | | | 1-1-2019 | | | | 2,500,000 | | | | 2,499,800 | |
Escambia County FL HFA ACTS Retirement-Life Communities Incorporated Series B (Health Revenue, AGC Insured, TD Bank NA SPA) ø | | | 1.34 | | | | 11-15-2029 | | | | 8,155,000 | | | | 8,155,000 | |
Florida Department of Environmental Protection Everglades Restoration Series B (Tax Revenue, AGC Insured) ø | | | 1.45 | | | | 7-1-2027 | | | | 11,810,000 | | | | 11,810,000 | |
Florida Housing Finance Corporation Series 1 (Housing Revenue, GNMA/FNMA/FHLMC Insured) | | | 1.95 | | | | 1-1-2021 | | | | 2,130,000 | | | | 2,124,462 | |
Florida Housing Finance Corporation Series 1 (Housing Revenue, GNMA/FNMA/FHLMC Insured) | | | 2.00 | | | | 7-1-2021 | | | | 1,855,000 | | | | 1,849,398 | |
Florida Housing Finance Corporation Series 1 (Housing Revenue, GNMA/FNMA/FHLMC Insured) | | | 2.05 | | | | 1-1-2022 | | | | 1,390,000 | | | | 1,386,817 | |
Gainesville FL Utilities System Series A (Utilities Revenue, State Street Bank & Trust Company SPA) ø | | | 1.52 | | | | 10-1-2036 | | | | 14,000,000 | | | | 14,000,000 | |
Gainesville FL Utilities System Series B (Utilities Revenue, Barclays Bank plc SPA) ø | | | 1.45 | | | | 10-1-2038 | | | | 21,000,000 | | | | 21,000,000 | |
Highlands County FL Health Facilities Authority Adventist Health System Series A (Health Revenue) ø | | | 1.69 | | | | 11-15-2037 | | | | 46,770,000 | | | | 46,770,000 | |
Hillsborough County FL IDA University Community Hospital Series B (Health Revenue) | | | 8.00 | | | | 8-15-2032 | | | | 4,900,000 | | | | 5,430,229 | |
Lee County FL Solid Waste System (Resource Recovery Revenue) | | | 5.00 | | | | 10-1-2018 | | | | 2,350,000 | | | | 2,409,197 | |
Lee County FL Solid Waste System (Resource Recovery Revenue) | | | 5.00 | | | | 10-1-2020 | | | | 600,000 | | | | 647,652 | |
Miami FL HFFA Miami Jewish Health Systems Incorporate Project (Health Revenue) | | | 5.00 | | | | 7-1-2020 | | | | 500,000 | | | | 530,295 | |
Miami-Dade County FL Expressway Authority Toll System (Transportation Revenue, AGM Insured, Citibank NA LIQ) ø144A | | | 1.88 | | | | 7-1-2018 | | | | 1,000,000 | | | | 1,000,000 | |
Miami-Dade County FL Expressway Authority Toll System (Transportation Revenue, Dexia Credit Local LOC, Dexia Credit Local LIQ) 144Aøø | | | 1.99 | | | | 10-13-2023 | | | | 8,590,000 | | | | 8,590,000 | |
Miami-Dade County FL Expressway Authority Toll System Series DCL-2012-003 (Transportation Revenue, Dexia Credit Local LOC, Ambac Insured, Dexia Credit Local LIQ) 144Aøø | | | 1.99 | | | | 3-8-2026 | | | | 16,860,000 | | | | 16,860,000 | |
Miami-Dade County FL Health Facilities Authority Miami Children’s Hospital Project Series A (Health Revenue) | | | 5.25 | | | | 8-1-2021 | | | | 705,000 | | | | 755,929 | |
Miami-Dade County FL HFA St. John Plaza Apartments (Housing Revenue) | | | 0.95 | | | | 8-1-2019 | | | | 9,750,000 | | | | 9,721,433 | |
Miami-Dade County FL School Board Certificate of Participation Series A (Miscellaneous Revenue) | | | 5.00 | | | | 5-1-2018 | | | | 6,985,000 | | | | 7,063,302 | |
North Broward FL Hospital District Series B (Health Revenue) | | | 5.00 | | | | 1-1-2020 | | | | 1,000,000 | | | | 1,055,550 | |
North Broward FL Hospital District Series B (Health Revenue) | | | 5.00 | | | | 1-1-2021 | | | | 1,130,000 | | | | 1,221,202 | |
Orange County FL Health Facilities Authority Lakeside Behavioral Healthcare Incorporated Project (Health Revenue, SunTrust Bank LOC) ø | | | 1.78 | | | | 7-1-2027 | | | | 9,150,000 | | | | 9,150,000 | |
Orange County FL Health Facilities Authority Nemours Foundation Series B (Health Revenue, Northern Trust Company LOC) ø | | | 1.78 | | | | 1-1-2039 | | | | 9,600,000 | | | | 9,600,000 | |
The accompanying notes are an integral part of these financial statements.
| | | | | | |
| Portfolio of investments—December 31, 2017 (unaudited) | | Wells Fargo Ultra Short-Term Municipal Income Fund | | | 11 | |
| | | | | | | | | | | | | | | | |
| Security name | | Interest rate | | | Maturity date | | | Principal | | | Value | |
| | | | |
| Florida (continued) | | | | | | | | | | | | | | | | |
Palm Beach County FL Health Facilities Authority Lifespace Communities Series C (Health Revenue) | | | 4.00 | % | | | 5-15-2018 | | | $ | 500,000 | | | $ | 505,470 | |
Palm Beach County FL Health Facilities Authority Lifespace Communities Series C (Health Revenue) | | | 4.00 | | | | 5-15-2019 | | | | 780,000 | | | | 809,507 | |
Palm Beach County FL Health Facilities Authority Retirement Life Communities Project (Health Revenue) | | | 4.00 | | | | 11-15-2019 | | | | 2,675,000 | | | | 2,796,097 | |
Pasco County FL School Board Certificate of Participation Series B (Miscellaneous Revenue, Ambac Insured) (m) | | | 1.95 | | | | 8-1-2030 | | | | 19,050,000 | | | | 19,050,000 | |
Sunrise FL Unrefunded Bond (Water & Sewer Revenue, Ambac Insured) | | | 5.20 | | | | 10-1-2022 | | | | 4,775,000 | | | | 4,907,697 | |
Tender Option Bond Trust Receipts/Floater Certificates Series 2016-XG0010 (Airport Revenue, AGC Insured, Bank of America NA LIQ) ø144A | | | 1.86 | | | | 10-1-2038 | | | | 13,500,000 | | | | 13,500,000 | |
Tender Option Bond Trust Receipts/Floater Certificates Series 2016-ZF0286 (Airport Revenue, AGC Insured, TD Bank NA LIQ) ø144A | | | 1.65 | | | | 10-1-2032 | | | | 8,510,000 | | | | 8,510,000 | |
Tender Option Bond Trust Receipts/Floater Certificates Series 2017-XF2517 (Health Revenue, Morgan Stanley Bank LIQ) ø144A | | | 1.81 | | | | 8-15-2047 | | | | 10,130,000 | | | | 10,130,000 | |
University of North Florida Financing Corporation Housing Project (Education Revenue, AGM Insured) | | | 5.00 | | | | 11-1-2018 | | | | 3,100,000 | | | | 3,180,817 | |
University of North Florida Financing Corporation Housing Project (Education Revenue, AGM Insured) | | | 5.00 | | | | 11-1-2019 | | | | 3,215,000 | | | | 3,389,542 | |
| |
| | | | 250,409,396 | |
| | | | | | | | | | | | | | | | |
| | | | |
| Georgia: 2.54% | | | | | | | | | | | | | | | | |
Atlanta GA Urban Residential Finance Authority The Remington Apartments Project (Housing Revenue) | | | 1.05 | | | | 6-1-2019 | | | | 10,250,000 | | | | 10,233,498 | |
Augusta GA Housing Authority Richmond Villas Apartments Project (Housing Revenue) | | | 1.20 | | | | 9-1-2019 | | | | 7,000,000 | | | | 6,936,020 | |
Burke County GA Development Authority Georgia Power Company Plant Vogtle Project Fifth Series 1995 (Utilities Revenue) | | | 2.05 | | | | 10-1-2032 | | | | 1,725,000 | | | | 1,724,345 | |
Burke County GA Development Authority Georgia Power Company Plant Vogtle Project First Series 1996 (Utilities Revenue) | | | 2.35 | | | | 10-1-2032 | | | | 6,800,000 | | | | 6,778,852 | |
Burke County GA Development Authority Georgia Power Company Plant Vogtle Project First Series 2008 (Utilities Revenue) | | | 1.65 | | | | 11-1-2048 | | | | 2,240,000 | | | | 2,162,832 | |
Burke County GA Development Authority Georgia Power Company Plant Vogtle Project First Series 2012 (Utilities Revenue) | | | 1.85 | | | | 12-1-2049 | | | | 15,500,000 | | | | 15,368,715 | |
Burke County GA Development Authority Georgia Transmission Corporation (Industrial Development Revenue) | | | 1.30 | | | | 1-1-2052 | | | | 16,525,000 | | | | 16,488,149 | |
Cedartown GA Housing Authority Cherokee Springs Apartments Project (Housing Revenue) | | | 1.00 | | | | 4-1-2019 | | | | 5,000,000 | | | | 4,989,100 | |
DeKalb County GA Housing Authority Sterling at Candler Village Project (Housing Revenue) | | | 1.75 | | | | 1-1-2021 | | | | 7,200,000 | | | | 7,199,568 | |
Gainesville & Hall Counties GA Development Authority Senior Living Facilities Lanier Village Series B (Health Revenue, AGC Insured, TD Bank NA SPA) ø | | | 1.34 | | | | 11-15-2033 | | | | 28,930,000 | | | | 28,930,000 | |
Gainesville GA Hospital Authority Series C (Health Revenue) ø | | | 1.30 | | | | 2-15-2047 | | | | 8,500,000 | | | | 8,500,000 | |
Georgia Municipal Electric Authority Subordinate Series A (Utilities Revenue) | | | 5.25 | | | | 1-1-2018 | | | | 7,500,000 | | | | 7,500,000 | |
Monroe County GA Development Authority Power Company Plant Scherer Project (Utilities Revenue) | | | 2.05 | | | | 7-1-2049 | | | | 3,250,000 | | | | 3,248,765 | |
Monroe County GA PCR Georgia Power Company Plant Scherer Project (Industrial Development Revenue) | | | 2.35 | | | | 10-1-2048 | | | | 9,500,000 | | | | 9,470,455 | |
Peach County GA Development Authority USG Real Estate Foundation LLC Project (Housing Revenue) | | | 1.20 | | | | 10-1-2018 | | | | 3,920,000 | | | | 3,905,535 | |
Savannah GA EDA Exempt Facilities Home Depot Project Series B (Industrial Development Revenue, SunTrust Bank LOC) ø | | | 1.80 | | | | 8-1-2025 | | | | 6,400,000 | | | | 6,400,000 | |
| |
| | | | 139,835,834 | |
| | | | | | | | | | | | | | | | |
The accompanying notes are an integral part of these financial statements.
| | | | |
| 12 | | Wells Fargo Ultra Short-Term Municipal Income Fund | | Portfolio of investments—December 31, 2017 (unaudited) |
| | | | | | | | | | | | | | | | |
| Security name | | Interest rate | | | Maturity date | | | Principal | | | Value | |
| | | | |
| Hawaii: 0.49% | | | | | | | | | | | | | | | | |
Hawaii Department of Budget and Finance Queens Health System Series B (SIFMA Municipal Swap +0.45%) (Health Revenue) ± | | | 2.16 | % | | | 7-1-2039 | | | $ | 2,925,000 | | | $ | 2,925,000 | |
Hawaii Department of Transportation Airports Division Lease AMT (Miscellaneous Revenue) | | | 4.00 | | | | 8-1-2018 | | | | 1,000,000 | | | | 1,014,550 | |
Honolulu HI Rail Transit Project Series H (SIFMA Municipal Swap +0.31%) (GO Revenue) ± | | | 2.02 | | | | 9-1-2024 | | | | 10,000,000 | | | | 10,000,600 | |
Honolulu HI Rail Transit Project Series H (SIFMA Municipal Swap +0.32%) (GO Revenue) ± | | | 2.03 | | | | 9-1-2025 | | | | 9,000,000 | | | | 9,000,540 | |
Honolulu HI Rail Transit Project Series H (SIFMA Municipal Swap +0.32%) (GO Revenue) ± | | | 2.03 | | | | 9-1-2026 | | | | 4,000,000 | | | | 4,000,240 | |
| |
| | | | 26,940,930 | |
| | | | | | | | | | | | | | | | |
| | | | |
| Idaho: 0.21% | | | | | | | | | | | | | | | | |
Idaho Housing and Finance Association Series A (Housing Revenue, FNMA LOC) ø | | | 1.78 | | | | 1-1-2038 | | | | 11,835,000 | | | | 11,835,000 | |
| | | | | | | | | | | | | | | | |
| | | | |
| Illinois: 9.00% | | | | | | | | | | | | | | | | |
Chicago IL (GO Revenue) | | | 5.00 | | | | 1-1-2020 | | | | 1,285,000 | | | | 1,346,860 | |
Chicago IL (GO Revenue) | | | 5.00 | | | | 1-1-2021 | | | | 2,000,000 | | | | 2,133,260 | |
Chicago IL Neighborhoods Alive 21 Program Series B (GO Revenue) | | | 5.00 | | | | 1-1-2019 | | | | 1,925,000 | | | | 1,974,473 | |
Chicago IL Park District Limited Tax Series D (GO Revenue) | | | 4.00 | | | | 1-1-2018 | | | | 2,760,000 | | | | 2,760,000 | |
Chicago IL Park District Refunding Bond Series B (GO Revenue) | | | 4.00 | | | | 1-1-2018 | | | | 500,000 | | | | 500,000 | |
Chicago IL Prerefunded Bond (GO Revenue, Build America Mutual Assurance Company Insured) | | | 5.00 | | | | 1-1-2019 | | | | 2,010,000 | | | | 2,010,000 | |
Chicago IL Refunding Bond (Tax Revenue) | | | 5.00 | | | | 1-1-2018 | | | | 530,000 | | | | 530,000 | |
Chicago IL Refunding Bond (Tax Revenue) | | | 5.00 | | | | 1-1-2019 | | | | 800,000 | | | | 816,112 | |
Chicago IL Refunding Bond (Water & Sewer Revenue) | | | 5.00 | | | | 11-1-2019 | | | | 2,500,000 | | | | 2,638,975 | |
Chicago IL Refunding Bond Emergency System (GO Revenue, AGM/FGIC Insured) | | | 5.50 | | | | 1-1-2019 | | | | 3,000,000 | | | | 3,095,340 | |
Chicago IL Refunding Bond Project Series A (GO Revenue) | | | 4.00 | | | | 1-1-2019 | | | | 1,250,000 | | | | 1,269,913 | |
Chicago IL Refunding Bond Project Series B (GO Revenue) | | | 5.00 | | | | 1-1-2019 | | | | 3,205,000 | | | | 3,287,369 | |
Chicago IL Refunding Bond Project Series B (GO Revenue) | | | 5.00 | | | | 1-1-2020 | | | | 3,295,000 | | | | 3,460,211 | |
Chicago IL Series A (GO Revenue) | | | 4.00 | | | | 1-1-2019 | | | | 1,335,000 | | | | 1,356,267 | |
Chicago IL Series A (GO Revenue) | | | 5.00 | | | | 12-1-2019 | | | | 1,000,000 | | | | 1,049,600 | |
Chicago IL Series A-2 (GO Revenue, Ambac Insured) | | | 5.50 | | | | 1-1-2018 | | | | 4,535,000 | | | | 4,535,000 | |
Chicago IL Series B (GO Revenue, Ambac Insured) | | | 5.00 | | | | 12-1-2018 | | | | 2,540,000 | | | | 2,542,972 | |
Chicago IL Series C (GO Revenue, National Insured) | | | 5.00 | | | | 1-1-2018 | | | | 5,350,000 | | | | 5,350,000 | |
Chicago IL Series C-2 (Airport Revenue, Bank of Montreal LOC) ø | | | 1.74 | | | | 1-1-2035 | | | | 1,920,000 | | | | 1,920,000 | |
Cook County IL Bedford Park Village Refunding Bond (Tax Revenue) | | | 3.00 | | | | 12-30-2018 | | | | 880,000 | | | | 881,795 | |
Cook, DuPage, Kane, Lake, McHenry, & Will Counties IL Regional Transportation Authority Refunding Bond Series B (Tax Revenue) øø | | | 1.65 | | | | 6-1-2025 | | | | 38,340,000 | | | | 38,340,000 | |
Country Club Hills IL Refunding Bond (GO Revenue, Build America Mutual Assurance Company Insured) | | | 4.00 | | | | 12-1-2018 | | | | 325,000 | | | | 330,597 | |
Country Club Hills IL Refunding Bond (GO Revenue, Build America Mutual Assurance Company Insured) | | | 4.00 | | | | 12-1-2020 | | | | 340,000 | | | | 356,181 | |
DuPage County IL Community High School District #99 (GO Revenue) | | | 5.00 | | | | 12-1-2018 | | | | 3,365,000 | | | | 3,465,546 | |
Grundy, Kendall & Will Counties IL Community School District #201 (GO Revenue, AGC Insured) | | | 5.75 | | | | 10-15-2019 | | | | 540,000 | | | | 558,743 | |
Illinois (GO Revenue) | | | 4.00 | | | | 2-1-2018 | | | | 5,550,000 | | | | 5,557,437 | |
Illinois (Miscellaneous Revenue) | | | 4.00 | | | | 7-1-2018 | | | | 13,610,000 | | | | 13,715,069 | |
Illinois (GO Revenue) | | | 5.00 | | | | 3-1-2018 | | | | 2,000,000 | | | | 2,008,700 | |
Illinois (Tax Revenue) | | | 5.00 | | | | 6-15-2018 | | | | 4,970,000 | | | | 5,041,121 | |
The accompanying notes are an integral part of these financial statements.
| | | | | | |
| Portfolio of investments—December 31, 2017 (unaudited) | | Wells Fargo Ultra Short-Term Municipal Income Fund | | | 13 | |
| | | | | | | | | | | | | | | | |
| Security name | | Interest rate | | | Maturity date | | | Principal | | | Value | |
| | | | |
| Illinois (continued) | | | | | | | | | | | | | | | | |
Illinois (Tax Revenue) | | | 5.00 | % | | | 6-15-2018 | | | $ | 2,390,000 | | | $ | 2,424,201 | |
Illinois (Tax Revenue) | | | 5.00 | | | | 6-15-2019 | | | | 3,050,000 | | | | 3,181,882 | |
Illinois (Miscellaneous Revenue) | | | 5.00 | | | | 8-1-2019 | | | | 10,135,000 | | | | 10,479,793 | |
Illinois (GO Revenue) | | | 5.00 | | | | 1-1-2020 | | | | 8,075,000 | | | | 8,386,937 | |
Illinois (GO Revenue) | | | 5.00 | | | | 2-1-2020 | | | | 3,040,000 | | | | 3,162,147 | |
Illinois (GO Revenue) | | | 5.00 | | | | 2-1-2021 | | | | 3,980,000 | | | | 4,184,731 | |
Illinois (GO Revenue) | | | 5.00 | | | | 11-1-2021 | | | | 6,885,000 | | | | 7,310,011 | |
Illinois (GO Revenue) | | | 5.00 | | | | 1-1-2022 | | | | 7,565,000 | | | | 8,022,229 | |
Illinois (Tax Revenue, National Insured) | | | 5.75 | | | | 6-15-2018 | | | | 2,930,000 | | | | 2,982,388 | |
Illinois Development Finance Authority Evanston Northwestern Healthcare Corporation Series B (Health Revenue, JPMorgan Chase & Company SPA) ø | | | 1.25 | | | | 5-1-2031 | | | | 10,000,000 | | | | 10,000,000 | |
Illinois Development Finance Authority Lyric Opera Chicago Project (Miscellaneous Revenue, Northern Trust Company LOC) ø | | | 1.53 | | | | 12-1-2028 | | | | 7,700,000 | | | | 7,700,000 | |
Illinois Educational Authority University of Chicago Series B-1 (Education Revenue) | | | 1.10 | | | | 7-1-2036 | | | | 6,485,000 | | | | 6,481,368 | |
Illinois Finance Authority Edward Hospital Obligated Group Series B-2 (Health Revenue, JPMorgan Chase & Company LOC) ø | | | 1.45 | | | | 2-1-2040 | | | | 25,885,000 | | | | 25,885,000 | |
Illinois Finance Authority Little Company of Mary Hospital and Health Care Centers Series A (Health Revenue, Barclays Bank plc LOC) ø | | | 1.76 | | | | 8-15-2035 | | | | 18,115,000 | | | | 18,115,000 | |
Illinois Finance Authority Little Company of Mary Hospital and Health Care Centers Series B (Health Revenue, Barclays Bank plc LOC) ø | | | 1.76 | | | | 8-15-2035 | | | | 42,155,000 | | | | 42,155,000 | |
Illinois Finance Authority OSF Healthcare System Series D (Health Revenue, JPMorgan Chase & Company LOC) ø | | | 1.76 | | | | 11-15-2037 | | | | 12,050,000 | | | | 12,050,000 | |
Illinois Finance Authority OSF Healthcare System Series E (Health Revenue, Barclays Bank plc LOC) ø | | | 1.76 | | | | 11-15-2037 | | | | 10,000,000 | | | | 10,000,000 | |
Illinois Finance Authority Presbyterian Homes Obligated Group Series A (Health Revenue) | | | 4.00 | | | | 5-1-2019 | | | | 500,000 | | | | 515,830 | |
Illinois Finance Authority Presbyterian Homes Obligated Group Series A (Health Revenue) | | | 4.00 | | | | 11-1-2019 | | | | 500,000 | | | | 521,705 | |
Illinois Finance Authority Presbyterian Homes Obligated Group Series B (1 Month LIBOR +1.35%) (Health Revenue) ± | | | 2.45 | | | | 5-1-2036 | | | | 5,000,000 | | | | 5,006,000 | |
Illinois Finance Authority Series XF2243 (Health Revenue, AGC Insured, Citibank NA LIQ) ø144A | | | 1.81 | | | | 8-15-2039 | | | | 16,100,000 | | | | 16,100,000 | |
Illinois Finance Authority YMCA of Metropolitan Chicago Project (Miscellaneous Revenue, BMO Harris Bank NA LOC) ø | | | 1.48 | | | | 6-1-2034 | | | | 5,000,000 | | | | 5,000,000 | |
Illinois Health Facilities Authority Evanston Hospital Corporation (Health Revenue, JPMorgan Chase & Company SPA) ø | | | 1.74 | | | | 6-1-2035 | | | | 10,000,000 | | | | 10,000,000 | |
Illinois Housing Development Authority University Village Apartments Phase I & II Series A (Housing Revenue) | | | 1.33 | | | | 2-1-2020 | | | | 8,250,000 | | | | 8,240,595 | |
Illinois Metropolitan Pier & Exposition Authority McCormick Place Project Series B (Tax Revenue) | | | 5.00 | | | | 12-15-2022 | | | | 7,580,000 | | | | 8,364,151 | |
Illinois Metropolitan Pier & Exposition Authority Unrefunded Bond (Tax Revenue, National Insured) | | | 5.30 | | | | 6-15-2018 | | | | 2,655,000 | | | | 2,682,081 | |
Illinois Refunding Bond (Miscellaneous Revenue) | | | 5.00 | | | | 8-1-2018 | | | | 1,715,000 | | | | 1,740,108 | |
Illinois Refunding Bond (Miscellaneous Revenue) | | | 5.00 | | | | 8-1-2022 | | | | 2,925,000 | | | | 3,121,765 | |
Illinois Series A (Tax Revenue) | | | 5.00 | | | | 6-1-2021 | | | | 1,860,000 | | | | 1,964,253 | |
Illinois Series D (Miscellaneous Revenue) | | | 5.00 | | | | 11-1-2021 | | | | 10,000,000 | | | | 10,617,300 | |
Illinois Toll Highway Authority Series A-2A (Transportation Revenue, Bank of America NA LOC) ø | | | 1.73 | | | | 7-1-2030 | | | | 22,500,000 | | | | 22,500,000 | |
Kane County IL School District #129 Aurora West Side Series B (GO Revenue) | | | 2.00 | | | | 2-1-2018 | | | | 2,430,000 | | | | 2,430,583 | |
Kendall, Kane & Will Counties IL Community Unit School District #308 (GO Revenue) | | | 4.00 | | | | 10-1-2018 | | | | 2,000,000 | | | | 2,035,040 | |
The accompanying notes are an integral part of these financial statements.
| | | | |
| 14 | | Wells Fargo Ultra Short-Term Municipal Income Fund | | Portfolio of investments—December 31, 2017 (unaudited) |
| | | | | | | | | | | | | | | | |
| Security name | | Interest rate | | | Maturity date | | | Principal | | | Value | |
| | | | |
| Illinois (continued) | | | | | | | | | | | | | | | | |
Minooka IL Special Assessment Refunding & Improvement Bond (Miscellaneous Revenue, AGM Insured) | | | 3.50 | % | | | 12-1-2019 | | | $ | 559,000 | | | $ | 571,253 | |
State of Illinois (Miscellaneous Revenue) | | | 5.00 | | | | 5-1-2019 | | | | 2,500,000 | | | | 2,573,075 | |
Tender Option Bond Trust Receipts/Floater Certificates Series 2016-XG0008 (Health Revenue, AGC Insured, Bank of America NA LIQ) ø144A | | | 1.81 | | | | 8-15-2047 | | | | 23,375,000 | | | | 23,375,000 | |
Tender Option Bond Trust Receipts/Floater Certificates Series 2016-XG0050 (Health Revenue, Deutsche Bank LIQ) ø144A | | | 1.77 | | | | 11-1-2039 | | | | 31,420,000 | | | | 31,420,000 | |
Tender Option Bond Trust Receipts/Floater Certificates Series 2017-XG0108 (Tax Revenue, Barclays Bank plc LOC, Barclays Bank plc LIQ) ø144A | | | 1.89 | | | | 4-1-2046 | | | | 24,870,000 | | | | 24,870,000 | |
University of Illinois Auxiliary Facilities (Education Revenue, JPMorgan Chase & Company SPA) ø | | | 1.55 | | | | 4-1-2038 | | | | 17,085,000 | | | | 17,085,000 | |
Western Illinois University Board of Trustees Certificate of Participation (Miscellaneous Revenue, AGM Insured) | | | 3.00 | | | | 10-1-2018 | | | | 500,000 | | | | 502,225 | |
| |
| | | | 496,588,192 | |
| | | | | | | | | | | | | | | | |
| | | | |
| Indiana: 1.31% | | | | | | | | | | | | | | | | |
Anderson IN EDA Cottages of Anderson Apartments Project (Housing Revenue) | | | 1.70 | | | | 7-1-2019 | | | | 1,650,000 | | | | 1,648,053 | |
Evansville City IN MFHR Consolidated Rental Assistance Demonstration Project Series A (Housing Revenue) øø | | | 1.35 | | | | 6-1-2018 | | | | 5,795,000 | | | | 5,795,000 | |
Fort Wayne IN Cambridge Square Project (Housing Revenue) | | | 1.20 | | | | 5-1-2019 | | | | 8,200,000 | | | | 8,154,244 | |
Hammond IN County Local Public Improvement Bond Bank Series A (Miscellaneous Revenue) %% | | | 2.38 | | | | 12-31-2018 | | | | 5,000,000 | | | | 5,008,550 | |
Indiana Finance Authority Parkview Health Project Prerefunded (Health Revenue) | | | 5.50 | | | | 5-1-2024 | | | | 5,745,000 | | | | 6,030,297 | |
Indiana Health Facilities Authority Prerefunded Bond (Health Revenue) | | | 1.38 | | | | 10-1-2027 | | | | 105,000 | | | | 104,319 | |
Indiana Health Facilities Authority Unrefunded Bond (Health Revenue) | | | 1.38 | | | | 10-1-2027 | | | | 4,960,000 | | | | 4,903,158 | |
Indiana HFFA Ascension Health Subordinated Credit Group Series A-3 (Health Revenue) | | | 1.35 | | | | 11-1-2027 | | | | 915,000 | | | | 901,897 | |
Indiana HFFA Ascension Health Subordinated Credit Group Series A-5 (Health Revenue) | | | 1.35 | | | | 11-1-2027 | | | | 9,230,000 | | | | 9,097,826 | |
Indiana HFFA Ascension Health Subordinated Credit Group Series A-8 (Health Revenue) | | | 1.25 | | | | 11-1-2027 | | | | 1,345,000 | | | | 1,325,780 | |
Indiana HFFA Ascension Health Subordinated Credit Group Series E-7 (Health Revenue) øø | | | 1.43 | | | | 11-15-2033 | | | | 15,175,000 | | | | 15,175,000 | |
Indiana Housing & Community Development Authority DBG Apartment Projects (Housing Revenue) | | | 1.10 | | | | 3-1-2018 | | | | 4,380,000 | | | | 4,377,854 | |
Rockport IN PCR Indiana-Michigan Power Company Series B (Utilities Revenue) | | | 1.75 | | | | 6-1-2025 | | | | 2,000,000 | | | | 1,998,580 | |
Tender Option Bond Trust Receipts/Floater Certificates Series 2015-XF0115 (Utilities Revenue, JPMorgan Chase & Company LIQ) ø144A | | | 2.06 | | | | 4-15-2019 | | | | 1,200,000 | | | | 1,200,000 | |
Trustees of Purdue University Series AA (Education Revenue) | | | 5.00 | | | | 7-1-2027 | | | | 1,150,000 | | | | 1,305,009 | |
Whiting IN BP Products North America Incorporated Project (Resource Recovery Revenue) | | | 2.46 | | | | 12-1-2044 | | | | 5,000,000 | | | | 5,011,350 | |
| |
| | | | 72,036,917 | |
| | | | | | | | | | | | | | | | |
| | | | |
| Iowa: 0.94% | | | | | | | | | | | | | | | | |
Buchanan County IA People’s Memorial Hospital (Health Revenue) | | | 1.50 | | | | 12-1-2018 | | | | 2,500,000 | | | | 2,482,275 | |
Iowa Finance Authority BAN Shenandoah Medical Center Project (Health Revenue) | | | 1.75 | | | | 6-1-2018 | | | | 7,000,000 | | | | 6,976,060 | |
Iowa Finance Authority Midwestern Disaster Area Project (Industrial Development Revenue, Korea Development Bank LOC) ø | | | 1.90 | | | | 4-1-2022 | | | | 24,200,000 | | | | 24,200,000 | |
Iowa Higher Education Loan Authority Central College Project Series A (Education Revenue) | | | 2.00 | | | | 12-1-2018 | | | | 18,400,000 | | | | 18,410,304 | |
| |
| | | | 52,068,639 | |
| | | | | | | | | | | | | | | | |
The accompanying notes are an integral part of these financial statements.
| | | | | | |
| Portfolio of investments—December 31, 2017 (unaudited) | | Wells Fargo Ultra Short-Term Municipal Income Fund | | | 15 | |
| | | | | | | | | | | | | | | | |
| Security name | | Interest rate | | | Maturity date | | | Principal | | | Value | |
| | | | |
| Kansas: 0.34% | | | | | | | | | | | | | | | | |
Kansas Department of Transportation Highway LIBOR Index Series B-4 (1 Month LIBOR +0.32%) (Tax Revenue) ± | | | 1.37 | % | | | 9-1-2018 | | | $ | 7,000,000 | | | $ | 6,991,740 | |
Kansas Department of Transportation Highway LIBOR Index Series B-5 (1 Month LIBOR +0.40%) (Tax Revenue) ± | | | 1.45 | | | | 9-1-2019 | | | | 6,000,000 | | | | 5,986,080 | |
Kansas Development Finance Authority Series A (GO Revenue) | | | 5.00 | | | | 5-1-2018 | | | | 5,710,000 | | | | 5,775,322 | |
| |
| | | | 18,753,142 | |
| | | | | | | | | | | | | | | | |
| | | | |
| Kentucky: 2.40% | | | | | | | | | | | | | | | | |
Ashland KY Medical Center Ashland Hospital Corporation Series B (Health Revenue) | | | 5.00 | | | | 2-1-2018 | | | | 900,000 | | | | 901,962 | |
Kentucky EDFA Owensboro Health Incorporated Series A (Health Revenue) | | | 5.00 | | | | 6-1-2020 | | | | 500,000 | | | | 528,700 | |
Kentucky EDFA Owensboro Health Incorporated Series A (Health Revenue) | | | 5.00 | | | | 6-1-2021 | | | | 1,055,000 | | | | 1,138,187 | |
Kentucky EDFA Series B1 (1 Month LIBOR +0.90%) (Health Revenue) ± | | | 1.96 | | | | 2-1-2046 | | | | 7,000,000 | | | | 6,962,200 | |
Kentucky Housing Corporation Parkway Manor Project (Housing Revenue) | | | 1.45 | | | | 3-1-2020 | | | | 4,675,000 | | | | 4,660,040 | |
Kentucky Rural Water Finance Corporation Public Project Series A (Water & Sewer Revenue) | | | 1.25 | | | | 2-1-2018 | | | | 6,385,000 | | | | 6,382,765 | |
Louisville & Jefferson Counties KY Environmental Facilities Series A (Utilities Revenue) | | | 1.25 | | | | 6-1-2033 | | | | 4,000,000 | | | | 3,960,480 | |
Louisville & Jefferson Counties KY PCR Louisville Gas & Electric Company Project Series B (Utilities Revenue) øø | | | 1.35 | | | | 11-1-2027 | | | | 16,000,000 | | | | 15,970,080 | |
Louisville & Jefferson Counties KY Metropolitan Sewer and Drainage System Subordinate BAN (Water & Sewer Revenue) | | | 5.00 | | | | 11-12-2018 | | | | 73,000,000 | | | | 75,152,770 | |
Trimble County KY Series A (Industrial Development Revenue) | | | 1.05 | | | | 9-1-2026 | | | | 16,750,000 | | | | 16,732,413 | |
| |
| | | | 132,389,597 | |
| | | | | | | | | | | | | | | | |
| | | | |
| Louisiana: 1.41% | | | | | | | | | | | | | | | | |
East Baton Rouge Parish LA Sewerage Commission Refunding Bond Series A (1 Month LIBOR +0.50%) (Water & Sewer Revenue) ± | | | 1.60 | | | | 2-1-2046 | | | | 23,925,000 | | | | 23,920,215 | |
Louisiana Housing Corporation Twin Lakes of Leesville Project (Housing Revenue) | | | 1.00 | | | | 9-1-2019 | | | | 7,200,000 | | | | 7,190,928 | |
Louisiana Offshore Terminal Authority Deepwater Loop LLC Project Series B-1A (Airport Revenue) | | | 2.00 | | | | 10-1-2040 | | | | 3,750,000 | | | | 3,746,588 | |
Louisiana PFFA Department of Public Safety Project (Miscellaneous Revenue) | | | 4.00 | | | | 8-1-2019 | | | | 4,320,000 | | | | 4,472,626 | |
New Orleans LA Aviation Board Series D-1 (Airport Revenue) | | | 5.00 | | | | 1-1-2019 | | | | 600,000 | | | | 620,106 | |
New Orleans LA Aviation Board Series D-1 (Airport Revenue) | | | 5.00 | | | | 1-1-2020 | | | | 1,000,000 | | | | 1,064,240 | |
New Orleans LA Aviation Board Series D-2 (Airport Revenue) | | | 5.00 | | | | 1-1-2019 | | | | 1,000,000 | | | | 1,033,110 | |
New Orleans LA Aviation Board Series D-2 (Airport Revenue) | | | 5.00 | | | | 1-1-2021 | | | | 750,000 | | | | 818,280 | |
St. James Parish LA Nucor Steel LLC Project Gulf Opportunity Zone Series A-1 (Industrial Development Revenue) ø | | | 1.55 | | | | 11-1-2040 | | | | 35,000,000 | | | | 35,000,000 | |
| |
| | | | 77,866,093 | |
| | | | | | | | | | | | | | | | |
| | | | |
| Maine: 0.28% | | | | | | | | | | | | | | | | |
Old Town ME Georgia-Pacific Corporation Project (Resource Recovery Revenue) ø | | | 1.50 | | | | 12-1-2024 | | | | 15,260,000 | | | | 15,260,000 | |
| | | | | | | | | | | | | | | | |
| | | | |
| Maryland: 1.40% | | | | | | | | | | | | | | | | |
Maryland CDA Bealls Grant Series B (Housing Revenue) | | | 1.85 | | | | 7-1-2018 | | | | 8,570,000 | | | | 8,565,287 | |
Maryland CDA Belnor Senior Residences Series D (Housing Revenue) | | | 1.83 | | | | 6-1-2019 | | | | 6,700,000 | | | | 6,645,663 | |
Maryland CDA Chase House (Housing Revenue) | | | 2.15 | | | | 12-1-2018 | | | | 17,600,000 | | | | 17,599,296 | |
Maryland CDA Keys Pointe Phase 1B Series I (Housing Revenue) | | | 1.60 | | | | 11-1-2018 | | | | 11,000,000 | | | | 10,983,830 | |
Maryland CDA St. James Terrace Apartments Series J (Housing Revenue) | | | 1.60 | | | | 4-1-2019 | | | | 12,000,000 | | | | 11,962,440 | |
Maryland CDA The Ellerslie Series 2017 (Housing Revenue) | | | 2.00 | | | | 2-1-2019 | | | | 6,000,000 | | | | 5,994,120 | |
The accompanying notes are an integral part of these financial statements.
| | | | |
| 16 | | Wells Fargo Ultra Short-Term Municipal Income Fund | | Portfolio of investments—December 31, 2017 (unaudited) |
| | | | | | | | | | | | | | | | |
| Security name | | Interest rate | | | Maturity date | | | Principal | | | Value | |
| | | | |
| Maryland (continued) | | | | | | | | | | | | | | | | |
Maryland CDA Waverly View Apartments Series G (Housing Revenue) | | | 1.15 | % | | | 2-1-2019 | | | $ | 8,000,000 | | | $ | 7,944,880 | |
Maryland Industrial Development Financing Authority Occidental Pete Corporation Series 2010 (Industrial Development Revenue) ø | | | 1.60 | | | | 3-1-2030 | | | | 7,560,000 | | | | 7,560,000 | |
| |
| | | | 77,255,516 | |
| | | | | | | | | | | | | | | | |
| | | | |
| Massachusetts: 1.38% | | | | | | | | | | | | | | | | |
Commonwealth of Massachusetts Series A (SIFMA Municipal Swap +0.47%) (Miscellaneous Revenue) ± | | | 2.18 | | | | 2-1-2019 | | | | 4,070,000 | | | | 4,076,471 | |
Massachusetts Consolidated Loan Series D (SIFMA Municipal Swap +0.43%) (Tax Revenue) ± | | | 1.54 | | | | 1-1-2018 | | | | 10,000,000 | | | | 10,000,000 | |
Massachusetts Development Finance Agency Lawrence General Hospital (Health Revenue) | | | 5.00 | | | | 7-1-2019 | | | | 330,000 | | | | 342,817 | |
Massachusetts Development Finance Agency Lawrence General Hospital (Health Revenue) | | | 5.00 | | | | 7-1-2020 | | | | 470,000 | | | | 498,830 | |
Massachusetts Development Finance Agency Lawrence General Hospital (Health Revenue) | | | 5.00 | | | | 7-1-2021 | | | | 480,000 | | | | 519,581 | |
Massachusetts HEFA Partners Healthcare Series G-2 (Health Revenue, AGM Insured) (m) | | | 1.75 | | | | 7-1-2042 | | | | 5,000,000 | | | | 5,000,000 | |
Massachusetts HFA Binnall House Project Series A (Housing Revenue) | | | 1.50 | | | | 8-1-2018 | | | | 6,625,000 | | | | 6,623,609 | |
Massachusetts HFA Highland Glen Project Series A (Housing Revenue) | | | 1.22 | | | | 8-1-2019 | | | | 13,150,000 | | | | 13,043,617 | |
Massachusetts HFA Series 187 (Housing Revenue, FNMA Insured) | | | 1.50 | | | | 12-1-2047 | | | | 1,550,000 | | | | 1,537,399 | |
Massachusetts Refunding Bond Series C (GO Revenue, Barclays Bank plc SPA) ø | | | 1.75 | | | | 1-1-2021 | | | | 21,400,000 | | | | 21,400,000 | |
Tender Option Bond Trust Receipts/Floater Certificates Series 2016-XF2306 (Education Revenue, Morgan Stanley Bank LIQ) ø144A | | | 1.96 | | | | 7-1-2033 | | | | 13,135,000 | | | | 13,135,000 | |
| |
| | | | 76,177,324 | |
| | | | | | | | | | | | | | | | |
| | | | |
| Michigan: 2.50% | | | | | | | | | | | | | | | | |
Charlotte MI Public School District (GO Revenue, Qualified School Board Loan Fund Insured) | | | 5.00 | | | | 5-1-2019 | | | | 1,515,000 | | | | 1,579,918 | |
Lake Orion MI Community School District (GO Revenue, Qualified School Board Loan Fund Insured) | | | 5.00 | | | | 5-1-2018 | | | | 4,650,000 | | | | 4,701,941 | |
Mattawan MI Consolidated School District (GO Revenue, Qualified School Board Loan Fund Insured) | | | 5.00 | | | | 5-1-2018 | | | | 855,000 | | | | 864,550 | |
Michigan Finance Authority Local Government Loan Program Detroit Water & Sewer Series D-3 (Water & Sewer Revenue, National Insured) | | | 5.00 | | | | 7-1-2018 | | | | 20,000,000 | | | | 20,319,600 | |
Michigan Finance Authority Senior Lien Detroit Water & Sewer Series C-5 (Water & Sewer Revenue, National Insured) | | | 5.00 | | | | 7-1-2018 | | | | 17,500,000 | | | | 17,779,650 | |
Michigan Finance Authority Senior Lien Detroit Water & Sewer Series C-6 (Water & Sewer Revenue) | | | 5.00 | | | | 7-1-2018 | | | | 4,230,000 | | | | 4,294,846 | |
Michigan Hospital Finance Authority Ascension Health Group Project Series A-2 (Health Revenue) | | | 1.50 | | | | 11-1-2027 | | | | 1,705,000 | | | | 1,690,303 | |
Michigan Hospital Finance Authority Ascension Health Group Project Series E-1 (Health Revenue) | | | 1.10 | | | | 11-15-2046 | | | | 4,250,000 | | | | 4,201,465 | |
Michigan Hospital Finance Authority Ascension Health Series A-3 (Health Revenue) | | | 1.87 | | | | 11-1-2027 | | | | 6,555,000 | | | | 6,563,653 | |
Michigan Hospital Finance Authority Ascension Health Series F-3 (Health Revenue) | | | 1.40 | | | | 11-15-2047 | | | | 9,500,000 | | | | 9,496,770 | |
Michigan Hospital Finance Authority Unrefunded Bond (Health Revenue) | | | 0.95 | | | | 11-15-2033 | | | | 7,745,000 | | | | 7,740,353 | |
Michigan Housing Development Authority Newman Court Apartments Project (Housing Revenue, FHA Insured) | | | 1.46 | | | | 11-1-2019 | | | | 9,900,000 | | | | 9,842,283 | |
Michigan Housing Development Authority Series C (Housing Revenue, Barclays Bank plc SPA) ø | | | 1.48 | | | | 12-1-2035 | | | | 5,980,000 | | | | 5,980,000 | |
The accompanying notes are an integral part of these financial statements.
| | | | | | |
| Portfolio of investments—December 31, 2017 (unaudited) | | Wells Fargo Ultra Short-Term Municipal Income Fund | | | 17 | |
| | | | | | | | | | | | | | | | |
| Security name | | Interest rate | | | Maturity date | | | Principal | | | Value | |
| | | | |
| Michigan (continued) | | | | | | | | | | | | | | | | |
Michigan Housing Development Authority Series D (Housing Revenue, Industrial and Commercial Bank of China Limited SPA) ø | | | 1.75 | % | | | 6-1-2030 | | | $ | 5,450,000 | | | $ | 5,450,000 | |
Michigan Strategic Fund Limited Obligation Events Center Project Series A (Tax Revenue) | | | 4.13 | | | | 7-1-2045 | | | | 23,500,000 | | | | 23,750,275 | |
Michigan Strategic Fund Waste Management Incorporated Project (Resource Recovery Revenue) | | | 1.45 | | | | 8-1-2027 | | | | 4,500,000 | | | | 4,500,765 | |
Pinckney MI Community Schools (GO Revenue, Qualified School Board Loan Fund Insured) | | | 5.00 | | | | 5-1-2018 | | | | 1,035,000 | | | | 1,046,054 | |
Rockford MI Public School District (GO Revenue, Qualified School Board Loan Fund Insured) | | | 5.00 | | | | 5-1-2018 | | | | 750,000 | | | | 758,258 | |
Rockford MI Public School District (GO Revenue, Qualified School Board Loan Fund Insured) | | | 5.00 | | | | 5-1-2019 | | | | 1,000,000 | | | | 1,042,180 | |
Walled Lake MI Consolidated School District (GO Revenue, Qualified School Board Loan Fund Insured) | | | 5.00 | | | | 5-1-2018 | | | | 6,020,000 | | | | 6,089,290 | |
| |
| | | | 137,692,154 | |
| | | | | | | | | | | | | | | | |
| | | | |
| Minnesota: 0.37% | | | | | | | | | | | | | | | | |
Apple Valley MN Senior Living LLC Project Series B (Health Revenue) | | | 3.00 | | | | 1-1-2019 | | | | 650,000 | | | | 655,922 | |
Apple Valley MN Senior Living LLC Project Series B (Health Revenue) | | | 3.00 | | | | 1-1-2020 | | | | 670,000 | | | | 680,010 | |
Apple Valley MN Senior Living LLC Project Series B (Health Revenue) | | | 4.00 | | | | 1-1-2021 | | | | 695,000 | | | | 726,532 | |
Apple Valley MN Senior Living LLC Project Series B (Health Revenue) | | | 4.00 | | | | 1-1-2022 | | | | 720,000 | | | | 757,166 | |
Duluth MN Housing and Redevelopment Authority Terex-Heritage Affordable Project (Housing Revenue) | | | 1.67 | | | | 12-1-2019 | | | | 5,715,000 | | | | 5,709,285 | |
Minneapolis & St. Paul MN Housing & RDA Union Flats Apartments Project Series B (Housing Revenue) | | | 2.75 | | | | 2-1-2022 | | | | 4,500,000 | | | | 4,470,345 | |
Minnesota HCFR Maple Grove Hospital Corporation (Health Revenue) | | | 4.00 | | | | 5-1-2020 | | | | 500,000 | | | | 523,905 | |
Minnesota HCFR Maple Grove Hospital Corporation (Health Revenue) | | | 4.00 | | | | 5-1-2021 | | | | 500,000 | | | | 533,195 | |
Minnesota HCFR Maple Grove Hospital Corporation (Health Revenue) | | | 4.00 | | | | 5-1-2022 | | | | 500,000 | | | | 541,250 | |
Minnesota HCFR Maple Grove Hospital Corporation (Health Revenue) | | | 5.00 | | | | 5-1-2023 | | | | 500,000 | | | | 572,715 | |
Minnesota HFA Series C (Housing Revenue) | | | 1.60 | | | | 8-1-2018 | | | | 2,210,000 | | | | 2,210,287 | |
Todd County MN United Hospital District BAN Lakewood Health System Series A (Health Revenue) | | | 1.30 | | | | 12-1-2018 | | | | 3,000,000 | | | | 2,985,960 | |
| |
| | | | 20,366,572 | |
| | | | | | | | | | | | | | | | |
| | | | |
| Mississippi: 0.70% | | | | | | | | | | | | | | | | |
Mississippi Business Finance Corporation Coast Electric Power Association (Utilities Revenue, National Rural Utilities Cooperative Finance SPA) øø | | | 1.15 | | | | 5-1-2037 | | | | 4,508,000 | | | | 4,502,500 | |
Mississippi Development Bank Magnolia Regional Health Center Series 2011A (Health Revenue) | | | 5.50 | | | | 10-1-2018 | | | | 595,000 | | | | 607,882 | |
Mississippi Hospital Equipment & Facilities Authority Baptist Memorial Health Series B2 (Health Revenue) 144Aøø | | | 1.40 | | | | 9-1-2022 | | | | 3,350,000 | | | | 3,349,665 | |
Perry County MS PCR Leaf River Forest Products Incorporated Project (Industrial Development Revenue, Georgia-Pacific LLC LOC) ø144A | | | 1.78 | | | | 2-1-2022 | | | | 30,000,000 | | | | 30,000,000 | |
| |
| | | | 38,460,047 | |
| | | | | | | | | | | | | | | | |
| | | | |
| Missouri: 0.94% | | | | | | | | | | | | | | | | |
Cape Girardeau County MO IDA South Eastern Health Series A (Health Revenue) | | | 5.00 | | | | 3-1-2019 | | | | 615,000 | | | | 634,760 | |
Independence MO IDA Heritage House Apartments Project (Housing Revenue) | | | 1.50 | | | | 12-1-2018 | | | | 8,700,000 | | | | 8,700,609 | |
Missouri HEFA Lutheran Senior Services (Health Revenue, Bank of America NA LOC) ø | | | 1.45 | | | | 2-1-2031 | | | | 16,890,000 | | | | 16,890,000 | |
The accompanying notes are an integral part of these financial statements.
| | | | |
| 18 | | Wells Fargo Ultra Short-Term Municipal Income Fund | | Portfolio of investments—December 31, 2017 (unaudited) |
| | | | | | | | | | | | | | | | |
| Security name | | Interest rate | | | Maturity date | | | Principal | | | Value | |
| | | | |
| Missouri (continued) | | | | | | | | | | | | | | | | |
St. Louis MO Series 004 (Airport Revenue, Dexia Credit Local LOC, AGM Insured, Dexia Credit Local LIQ) ø144A | | | 1.94 | % | | | 7-1-2026 | | | $ | 10,960,000 | | | $ | 10,960,000 | |
Tender Option Bond Trust Receipts/Floater Certificates Series 2015-XF1015 (Health Revenue, Deutsche Bank LIQ) ø144A | | | 1.79 | | | | 11-15-2048 | | | | 14,805,000 | | | | 14,805,000 | |
| |
| | | | 51,990,369 | |
| | | | | | | | | | | | | | | | |
| | | | |
| Nebraska: 0.29% | | | | | | | | | | | | | | | | |
Nebraska Central Plains Energy Project Refunding Bond (Utilities Revenue, Royal Bank of Canada SPA) | | | 5.00 | | | | 8-1-2039 | | | | 6,260,000 | | | | 6,621,202 | |
Nebraska Public Power Generation Agency Whelan Energy Center Series A (Utilities Revenue) | | | 5.00 | | | | 1-1-2018 | | | | 2,050,000 | | | | 2,050,000 | |
Tender Option Bond Trust Receipts/Floater Certificates Series XM0184 (Airport Revenue, AGC Insured, Bank of America NA LIQ) ø144A | | | 1.86 | | | | 10-1-2033 | | | | 7,500,000 | | | | 7,500,000 | |
| |
| | | | 16,171,202 | |
| | | | | | | | | | | | | | | | |
| | | | |
| Nevada: 0.50% | | | | | | | | | | | | | | | | |
Clark County NV Las Vegas McCarran International Airport Series 2010-F-2 (Airport Revenue, Union Bank NA LOC) ø | | | 1.48 | | | | 7-1-2022 | | | | 21,100,000 | | | | 21,100,000 | |
Clark County Refunding Bond Series C (GO Revenue) | | | 5.00 | | | | 6-15-2020 | | | | 4,250,000 | | | | 4,579,800 | |
Clark County Refunding Bond Series D (GO Revenue) | | | 5.00 | | | | 6-15-2020 | | | | 1,040,000 | | | | 1,120,704 | |
Washoe County NV Sierra Pacific Power Company Project Series A (Utilities Revenue) | | | 1.50 | | | | 8-1-2031 | | | | 850,000 | | | | 842,325 | |
| |
| | | | 27,642,829 | |
| | | | | | | | | | | | | | | | |
| | | | |
| New Hampshire: 0.02% | | | | | | | | | | | | | | | | |
New Hampshire Business Finance Authority Waste Management Incorporated Project (Resource Recovery Revenue) | | | 2.13 | | | | 8-1-2024 | | | | 1,000,000 | | | | 1,001,440 | |
| | | | | | | | | | | | | | | | |
| | | | |
| New Jersey: 3.83% | | | | | | | | | | | | | | | | |
Beach Haven NJ BAN (GO Revenue) | | | 2.00 | | | | 5-11-2018 | | | | 6,152,500 | | | | 6,147,516 | |
Burlington County NJ Bridge Commission Series C (Miscellaneous Revenue) | | | 2.50 | | | | 12-12-2018 | | | | 4,800,000 | | | | 4,840,080 | |
Cherry Hill NJ BAN (GO Revenue) | | | 3.00 | | | | 10-16-2018 | | | | 10,000,000 | | | | 10,117,800 | |
East Orange NJ Capital Improvement Series A (GO Revenue, AGM Insured) | | | 4.00 | | | | 6-1-2018 | | | | 650,000 | | | | 656,117 | |
Flemington NJ BAN (GO Revenue) | | | 2.25 | | | | 1-16-2018 | | | | 3,900,000 | | | | 3,900,897 | |
Monmouth County NJ BAN (GO Revenue) | | | 2.25 | | | | 4-27-2018 | | | | 4,775,000 | | | | 4,782,640 | |
New Jersey Building Authority Unrefunded Bond Series A (Miscellaneous Revenue) | | | 5.00 | | | | 6-15-2018 | | | | 910,000 | | | | 922,158 | |
New Jersey Building Authority Unrefunded Bond Series A (Miscellaneous Revenue) | | | 5.00 | | | | 6-15-2019 | | | | 660,000 | | | | 684,400 | |
New Jersey EDA Cigarette Tax Refunding Bond (Tobacco Revenue) | | | 5.00 | | | | 6-15-2018 | | | | 6,000,000 | | | | 6,089,400 | |
New Jersey EDA Refunding Bond Transportation Project Subordinate Lease Series A (Transportation Revenue) | | | 5.00 | | | | 5-1-2018 | | | | 5,170,000 | | | | 5,221,080 | |
New Jersey EDA School Facilities Construction Notes Series BBB (Miscellaneous Revenue) | | | 5.00 | | | | 6-15-2021 | | | | 5,000,000 | | | | 5,378,050 | |
New Jersey EDA School Facilities Construction Notes Series DD1 (Miscellaneous Revenue) | | | 5.00 | | | | 12-15-2018 | | | | 2,285,000 | | | | 2,347,632 | |
New Jersey EDA School Facilities Construction Notes Series DDD (Miscellaneous Revenue) | | | 5.00 | | | | 6-15-2022 | | | | 1,000,000 | | | | 1,091,870 | |
New Jersey EDA School Facilities Construction Notes Series PP (Miscellaneous Revenue) | | | 5.00 | | | | 6-15-2019 | | | | 12,710,000 | | | | 13,179,889 | |
New Jersey EDA School Facilities Construction Notes Series XX (Miscellaneous Revenue) | | | 5.00 | | | | 6-15-2019 | | | | 15,000,000 | | | | 15,554,550 | |
The accompanying notes are an integral part of these financial statements.
| | | | | | |
| Portfolio of investments—December 31, 2017 (unaudited) | | Wells Fargo Ultra Short-Term Municipal Income Fund | | | 19 | |
| | | | | | | | | | | | | | | | |
| Security name | | Interest rate | | | Maturity date | | | Principal | | | Value | |
| | | | |
| New Jersey (continued) | | | | | | | | | | | | | | | | |
New Jersey EDA Transportation Project Series B (Miscellaneous Revenue) | | | 5.00 | % | | | 11-1-2018 | | | $ | 3,500,000 | | | $ | 3,583,930 | |
New Jersey EDA Transportation Project Series B (Miscellaneous Revenue) | | | 5.00 | | | | 11-1-2019 | | | | 5,000,000 | | | | 5,227,300 | |
New Jersey EDA Transportation Project Series B (Miscellaneous Revenue) | | | 5.00 | | | | 11-1-2020 | | | | 10,000,000 | | | | 10,672,500 | |
New Jersey HFFA St. Joseph’s Healthcare System Group (Health Revenue) | | | 3.00 | | | | 7-1-2018 | | | | 1,000,000 | | | | 1,003,470 | |
New Jersey HFFA St. Joseph’s Healthcare System Group (Health Revenue) | | | 4.00 | | | | 7-1-2019 | | | | 1,200,000 | | | | 1,225,704 | |
New Jersey HFFA St. Joseph’s Healthcare System Group (Health Revenue) | | | 4.00 | | | | 7-1-2020 | | | | 1,965,000 | | | | 2,033,441 | |
New Jersey HFFA St. Joseph’s Healthcare System Group (Health Revenue) | | | 5.00 | | | | 7-1-2021 | | | | 1,000,000 | | | | 1,080,720 | |
New Jersey Housing and Mortgage Finance Agency Series A (Housing Revenue) | | | 1.35 | | | | 11-1-2018 | | | | 1,715,000 | | | | 1,710,850 | |
New Jersey Housing and Mortgage Finance Agency Series A (Housing Revenue) | | | 1.50 | | | | 11-1-2019 | | | | 600,000 | | | | 595,398 | |
New Jersey Housing and Mortgage Finance Agency Series A (Housing Revenue) | | | 1.75 | | | | 11-1-2020 | | | | 8,255,000 | | | | 8,216,449 | |
New Jersey Housing and Mortgage Finance Agency Series B (Housing Revenue) | | | 1.05 | | | | 5-1-2018 | | | | 1,900,000 | | | | 1,897,815 | |
New Jersey TTFA Series A (Miscellaneous Revenue) | | | 5.00 | | | | 12-15-2019 | | | | 4,405,000 | | | | 4,617,541 | |
New Jersey TTFA Series A-1 (Transportation Revenue) | | | 5.00 | | | | 6-15-2019 | | | | 5,400,000 | | | | 5,599,638 | |
New Jersey TTFA Series AA (Miscellaneous Revenue) | | | 5.00 | | | | 6-15-2020 | | | | 1,600,000 | | | | 1,694,080 | |
New Jersey TTFA Series DC8033 (Transportation Revenue, Dexia Credit Local LOC, AGM Insured, Dexia Credit Local LIQ) ø144A | | | 1.99 | | | | 12-15-2022 | | | | 9,960,000 | | | | 9,960,000 | |
New Jersey Turnpike Authority Series C (SIFMA Municipal Swap +0.55%) (Transportation Revenue) ± | | | 2.26 | | | | 1-1-2018 | | | | 10,000,000 | | | | 10,000,000 | |
New Jersey Turnpike Authority Series C-5 (1 Month LIBOR +0.46%) (Transportation Revenue) ± | | | 1.56 | | | | 1-1-2028 | | | | 26,000,000 | | | | 25,966,720 | |
Paulsboro NJ BAN Series A (GO Revenue) | | | 2.25 | | | | 4-12-2018 | | | | 1,517,000 | | | | 1,518,896 | |
Salem County NJ BAN (GO Revenue) | | | 2.25 | | | | 6-21-2018 | | | | 3,920,000 | | | | 3,925,958 | |
Southampton NJ Board of Education Series A (GO Revenue) | | | 2.25 | | | | 6-28-2018 | | | | 3,014,000 | | | | 3,019,666 | |
Tender Option Bond Trust Receipts/Floater Certificates Series 2016-XG0047 (Health Revenue, AGC Insured, Deutsche Bank LIQ) ø144A | | | 2.05 | | | | 7-1-2038 | | | | 24,431,373 | | | | 24,431,373 | |
West Deptford NJ BAN (GO Revenue) | | | 2.25 | | | | 4-12-2018 | | | | 2,495,415 | | | | 2,498,534 | |
| |
| | | | 211,394,062 | |
| | | | | | | | | | | | | | | | |
| | | | |
| New Mexico: 0.98% | | | | | | | | | | | | | | | | |
Farmington NM Public Service Company of New Mexico San Juan Project Series A (Utilities Revenue) | | | 5.20 | | | | 6-1-2040 | | | | 1,000,000 | | | | 1,078,870 | |
New Mexico Mortgage Finance Authority South Shiprock Homes Project (Housing Revenue) | | | 1.35 | | | | 6-1-2020 | | | | 1,400,000 | | | | 1,393,406 | |
New Mexico Municipal Energy Acquisition Authority Gas Supply Subordinate Series B (1 Month LIBOR +0.75%) (Utilities Revenue, Royal Bank of Canada SPA) ± | | | 1.80 | | | | 11-1-2039 | | | | 41,155,000 | | | | 41,119,195 | |
New Mexico Municipal Energy Acquisition Authority Subordinate Series A (Utilities Revenue, Royal Bank of Canada SPA) | | | 5.00 | | | | 11-1-2039 | | | | 9,915,000 | | | | 10,390,424 | |
| |
| | | | 53,981,895 | |
| | | | | | | | | | | | | | | | |
| | | | |
| New York: 14.77% | | | | | | | | | | | | | | | | |
Babylon NY IDA Covanta Babylon Series A (Industrial Development Revenue) | | | 5.00 | | | | 1-1-2018 | | | | 2,500,000 | | | | 2,500,000 | |
Broome County NY Chenango Forks Central School District BAN (GO Revenue) | | | 2.25 | | | | 6-20-2018 | | | | 17,858,484 | | | | 17,909,738 | |
Cayuga County NY Jordan-Elbridge Central School District BAN (GO Revenue) | | | 2.25 | | | | 6-28-2018 | | | | 5,075,000 | | | | 5,088,043 | |
Chautauqua County NY Cassadaga Valley Central School District BAN Series A (GO Revenue) | | | 2.25 | | | | 7-17-2018 | | | | 4,000,000 | | | | 4,009,920 | |
Chautauqua County NY Randolph Central School District BAN (GO Revenue) | | | 2.25 | | | | 6-20-2018 | | | | 4,250,000 | | | | 4,262,198 | |
Franklin County NY Tupper Lake Central School District BAN (GO Revenue) | | | 2.25 | | | | 6-21-2018 | | | | 4,085,000 | | | | 4,096,561 | |
Hornell Steuben County NY School District BAN (GO Revenue) | | | 2.00 | | | | 6-22-2018 | | | | 11,330,000 | | | | 11,341,217 | |
The accompanying notes are an integral part of these financial statements.
| | | | |
| 20 | | Wells Fargo Ultra Short-Term Municipal Income Fund | | Portfolio of investments—December 31, 2017 (unaudited) |
| | | | | | | | | | | | | | | | |
| Security name | | Interest rate | | | Maturity date | | | Principal | | | Value | |
| | | | |
| New York (continued) | | | | | | | | | | | | | | | | |
Ilion NY Housing Authority John Guy Prindle Apartments Project (Housing Revenue) | | | 2.00 | % | | | 7-1-2020 | | | $ | 3,250,000 | | | $ | 3,247,465 | |
Island Park NY BAN (GO Revenue) | | | 2.50 | | | | 6-6-2018 | | | | 2,950,000 | | | | 2,957,995 | |
Long Island NY Power Authority Electric System Series C (1 Month LIBOR +0.88%) (Utilities Revenue) ± | | | 1.98 | | | | 5-1-2033 | | | | 10,000,000 | | | | 10,014,200 | |
Nassau County NY Interim Finance Authority Series B (Tax Revenue, Sumitomo Mitsui Banking SPA) ø | | | 1.45 | | | | 11-15-2021 | | | | 9,600,000 | | | | 9,600,000 | |
Nassau County NY TAN Series B (GO Revenue) | | | 3.00 | | | | 9-18-2018 | | | | 19,000,000 | | | | 19,182,590 | |
Nassau NY Health Care Corporation RAN (Health Revenue) | | | 2.75 | | | | 1-16-2018 | | | | 15,260,000 | | | | 15,262,289 | |
New York Dormitory Authority Orange Regional Medical Center (Health Revenue) 144A | | | 4.00 | | | | 12-1-2018 | | | | 1,400,000 | | | | 1,420,174 | |
New York Dormitory Authority Orange Regional Medical Center (Health Revenue) 144A | | | 4.00 | | | | 12-1-2019 | | | | 1,500,000 | | | | 1,541,715 | |
New York Dormitory Authority Orange Regional Medical Center (Health Revenue) 144A | | | 4.00 | | | | 12-1-2020 | | | | 1,000,000 | | | | 1,040,700 | |
New York Energy R&D Authority PCR Keyspan Generation Series A (Industrial Development Revenue, Ambac Insured) (m) | | | 2.00 | | | | 10-1-2028 | | | | 1,300,000 | | | | 1,300,000 | |
New York HFA Manhattan Residential Housing Series A (Housing Revenue, Bank of China LOC) ø | | | 1.48 | | | | 11-1-2049 | | | | 11,000,000 | | | | 11,000,000 | |
New York HFA Manhattan Residential Housing Series A (Housing Revenue, Bank of China LOC) ø | | | 1.55 | | | | 11-1-2049 | | | | 7,000,000 | | | | 7,000,000 | |
New York Metropolitan Transportation Authority Refunding Bond Subordinate Series B-3A (SIFMA Municipal Swap +0.37%) (Tax Revenue) ± | | | 2.08 | | | | 11-1-2028 | | | | 3,000,000 | | | | 2,999,760 | |
New York Metropolitan Transportation Authority Series B (1 Month LIBOR +0.55%) (Transportation Revenue) ± | | | 1.60 | | | | 11-1-2041 | | | | 8,000,000 | | | | 7,956,560 | |
New York Metropolitan Transportation Authority Subordinate Series A-3 (SIFMA Municipal Swap +0.50%) (Transportation Revenue) ± | | | 2.21 | | | | 11-15-2042 | | | | 10,000,000 | | | | 9,991,100 | |
New York Metropolitan Transportation Authority Subordinate Series D-2 (SIFMA Municipal Swap +0.45%) (Transportation Revenue) ± | | | 2.16 | | | | 11-15-2044 | | | | 30,000,000 | | | | 29,948,700 | |
New York NY Adjusted Fiscal 2006 Subordinate Series F-3 (GO Revenue, Sumitomo Mitsui Banking LOC) ø | | | 1.70 | | | | 9-1-2035 | | | | 23,700,000 | | | | 23,700,000 | |
New York NY Adjusted Fiscal 2008 Subordinate Series A-2 (GO Revenue, AGM Insured) (m) | | | 1.90 | | | | 8-1-2026 | | | | 11,225,000 | | | | 11,225,000 | |
New York NY Adjusted Fiscal 2008 Subordinate Series A-3 (GO Revenue, AGM Insured) (m) | | | 1.90 | | | | 8-1-2026 | | | | 4,200,000 | | | | 4,200,000 | |
New York NY Adjusted Fiscal 2008 Subordinate Series C-4 (GO Revenue, AGC Insured) (m) | | | 1.95 | | | | 10-1-2027 | | | | 53,975,000 | | | | 53,975,000 | |
New York NY Adjusted Fiscal 2017 Subordinate Series A-5 (GO Revenue, Landesbank Hessen-Thüringen SPA) ø | | | 1.85 | | | | 8-1-2044 | | | | 54,400,000 | | | | 54,400,000 | |
New York NY Fiscal 2012 Subordinate Series G-4 (GO Revenue, Citibank NA LOC) ø | | | 1.78 | | | | 4-1-2042 | | | | 20,000,000 | | | | 20,000,000 | |
New York NY Fiscal 2017 Subordinate Series A-6 (GO Revenue, Landesbank Hessen-Thüringen SPA) ø | | | 1.45 | | | | 8-1-2044 | | | | 13,855,000 | | | | 13,855,000 | |
New York NY Housing Development Corporation Series F (Housing Revenue) øø | | | 1.00 | | | | 11-1-2047 | | | | 15,250,000 | | | | 15,228,345 | |
New York NY Housing Development Corporation Series G-2 (Housing Revenue) | | | 2.00 | | | | 11-1-2057 | | | | 7,000,000 | | | | 6,986,630 | |
New York NY Housing Development Corporation Series I-2-B (Housing Revenue) | | | 1.85 | | | | 5-1-2021 | | | | 16,050,000 | | | | 16,068,137 | |
New York NY Municipal Water Authority Series BB-1 (Water & Sewer Revenue, State Street Bank & Trust Company SPA) ø | | | 1.43 | | | | 6-15-2049 | | | | 7,000,000 | | | | 7,000,000 | |
New York NY Municipal Water Finance Authority Adjusted Fiscal 2013 Subordinate Series AA-2 (Water & Sewer Revenue, Bank of Tokyo-Mitsubishi SPA) ø | | | 1.76 | | | | 6-15-2046 | | | | 29,215,000 | | | | 29,215,000 | |
New York NY Municipal Water Finance Authority Adjusted Fiscal 2017 Subordinate Series BB (Water & Sewer Revenue, State Street Bank & Trust Company SPA) ø | | | 1.43 | | | | 6-15-2049 | | | | 26,000,000 | | | | 26,000,000 | |
The accompanying notes are an integral part of these financial statements.
| | | | | | |
| Portfolio of investments—December 31, 2017 (unaudited) | | Wells Fargo Ultra Short-Term Municipal Income Fund | | | 21 | |
| | | | | | | | | | | | | | | | |
| Security name | | Interest rate | | | Maturity date | | | Principal | | | Value | |
| | | | |
| New York (continued) | | | | | | | | | | | | | | | | |
New York NY Series A-6 (SIFMA Municipal Swap +0.50%) (GO Revenue) ± | | | 2.21 | % | | | 8-1-2031 | | | $ | 39,950,000 | | | $ | 39,945,206 | |
New York NY Series J Subordinate Series J-2 (GO Revenue, AGM Insured) (m) | | | 1.85 | | | | 6-1-2036 | | | | 22,900,000 | | | | 22,900,000 | |
New York NY Series J Subordinate Series J-3 (GO Revenue, AGM Insured) (m) | | | 1.95 | | | | 6-1-2036 | | | | 35,800,000 | | | | 35,800,000 | |
New York NY Series J-4 (SIFMA Municipal Swap +0.55%) (GO Revenue) ± | | | 2.26 | | | | 8-1-2025 | | | | 10,880,000 | | | | 10,879,782 | |
New York NY Subordinate Series B-3 (GO Revenue, Citibank NA LOC) ø | | | 1.78 | | | | 4-1-2042 | | | | 25,325,000 | | | | 25,325,000 | |
New York NY Subordinate Series C-4 (GO Revenue, AGM Insured) (m) | | | 2.10 | | | | 1-1-2032 | | | | 1,025,000 | | | | 1,025,000 | |
New York NY Subordinate Series I-3 (GO Revenue, Bank of America NA LOC) ø | | | 1.43 | | | | 4-1-2036 | | | | 16,050,000 | | | | 16,050,000 | |
New York NY Transitional Finance Authority Fiscal 2003 Subordinate Series A-3 (Tax Revenue, Bank of Tokyo-Mitsubishi LOC) ø | | | 1.76 | | | | 11-1-2029 | | | | 8,700,000 | | | | 8,700,000 | |
New York NY Transitional Finance Authority NYC Recovery Series 3 Subordinate Series 3D (Tax Revenue, Dexia Credit Local SPA) ø | | | 1.50 | | | | 11-1-2022 | | | | 29,360,000 | | | | 29,360,000 | |
New York NY Transitional Finance Authority Subordinate Series 2-E (Tax Revenue, Dexia Credit Local SPA) ø | | | 1.50 | | | | 11-1-2022 | | | | 15,425,000 | | | | 15,425,000 | |
New York NY Transitional Finance Authority Subordinate Series A-3 (Tax Revenue, Dexia Credit Local SPA) ø | | | 1.82 | | | | 8-1-2023 | | | | 8,600,000 | | | | 8,600,000 | |
New York Thruway Authority Series II (Transportation Revenue, National Insured) | | | 5.00 | | | | 1-1-2020 | | | | 8,940,000 | | | | 8,962,708 | |
New York Transportation Development Corporation American Airlines Incorporated John F. Kennedy International Airport Project (Airport Revenue) | | | 5.00 | | | | 8-1-2018 | | | | 11,000,000 | | | | 11,180,730 | |
New York Triborough Bridge And Tunnel Authority Series A (Transportation Revenue, TD Bank NA LOC) ø | | | 1.45 | | | | 11-1-2035 | | | | 8,355,000 | | | | 8,355,000 | |
Onondaga County NY Lafayette Central School District RAN (GO Revenue) | | | 2.25 | | | | 6-22-2018 | | | | 4,000,000 | | | | 4,011,240 | |
Onondaga County NY West Genesee Central School District BAN Series A (GO Revenue) | | | 2.25 | | | | 7-6-2018 | | | | 3,515,305 | | | | 3,524,937 | |
Oyster Bay NY BAN Series A (GO Revenue) | | | 3.50 | | | | 6-1-2018 | | | | 2,000,000 | | | | 2,008,980 | |
Oyster Bay NY BAN Series B (GO Revenue) | | | 3.50 | | | | 2-2-2018 | | | | 2,250,000 | | | | 2,252,430 | |
Oyster Bay NY Public Improvement Series A (GO Revenue, AGM Insured) | | | 3.00 | | | | 3-1-2018 | | | | 4,235,000 | | | | 4,243,258 | |
Oyster Bay NY Public Improvement Series C (GO Revenue) | | | 2.50 | | | | 6-1-2018 | | | | 2,750,000 | | | | 2,751,568 | |
Oyster Bay NY RAN (GO Revenue) | | | 2.50 | | | | 2-23-2018 | | | | 3,200,000 | | | | 3,201,536 | |
Suffolk County NY Amityville Union Free School District BAN (GO Revenue) | | | 2.25 | | | | 6-22-2018 | | | | 2,110,000 | | | | 2,116,942 | |
Suffolk County NY Public Improvement Serial Bonds Series B (GO Revenue, Build America Mutual Assurance Company Insured) | | | 2.00 | | | | 10-15-2019 | | | | 880,000 | | | | 882,138 | |
Suffolk County NY TAN (GO Revenue) | | | 2.50 | | | | 7-25-2018 | | | | 55,000,000 | | | | 55,214,500 | |
Tonawanda Erie County NY BAN (GO Revenue) | | | 2.25 | | | | 6-7-2018 | | | | 5,817,000 | | | | 5,831,135 | |
Ulster County NY Ellenville Central School District BAN (GO Revenue) | | | 2.25 | | | | 6-29-2018 | | | | 10,350,000 | | | | 10,375,772 | |
Wayne County NY Sodus Central School District BAN (GO Revenue) | | | 2.25 | | | | 6-19-2018 | | | | 5,500,000 | | | | 5,515,730 | |
Yonkers NY Series D (GO Revenue) | | | 4.00 | | | | 8-1-2018 | | | | 3,135,000 | | | | 3,177,511 | |
Yonkers NY Series E (GO Revenue) | | | 4.00 | | | | 9-1-2018 | | | | 1,225,000 | | | | 1,243,914 | |
| |
| | | | 814,384,054 | |
| | | | | | | | | | | | | | | | |
| | | | |
| North Carolina: 1.17% | | | | | | | | | | | | | | | | |
Charlotte-Mecklenburg NC Hospital Authority Carolinas Health Care System Series 2007-E (Health Revenue, TD Bank NA LOC, AGM Insured) ø | | | 1.30 | | | | 1-15-2044 | | | | 1,200,000 | | | | 1,200,000 | |
Durham NC Housing Authority Morreene Road Apartments Project (Housing Revenue) | | | 1.85 | | | | 1-1-2021 | | | | 4,000,000 | | | | 3,996,120 | |
Gastonia NC Housing Authority Cameron Courts & Weldon Heights Apartments (Housing Revenue) | | | 1.78 | | | | 11-1-2020 | | | | 10,500,000 | | | | 10,477,320 | |
Gastonia NC Housing Authority Linwood Terrace Apartments (Housing Revenue) | | | 1.78 | | | | 11-1-2020 | | | | 5,000,000 | | | | 4,989,200 | |
Gastonia NC Housing Authority Mountain View Apartments (Housing Revenue) | | | 1.78 | | | | 11-1-2020 | | | | 4,750,000 | | | | 4,739,740 | |
North Carolina Capital Finance Republic Services Incorporated Project Series 2013 (Resource Recovery Revenue) øø | | | 1.45 | | | | 6-1-2038 | | | | 12,500,000 | | | | 12,503,375 | |
The accompanying notes are an integral part of these financial statements.
| | | | |
| 22 | | Wells Fargo Ultra Short-Term Municipal Income Fund | | Portfolio of investments—December 31, 2017 (unaudited) |
| | | | | | | | | | | | | | | | |
| Security name | | Interest rate | | | Maturity date | | | Principal | | | Value | |
| | | | |
| North Carolina (continued) | | | | | | | | | | | | | | | | |
North Carolina HFA Weaver Investment Company Rural Development Portfolio Series A (Housing Revenue) | | | 1.50 | % | | | 12-1-2018 | | | $ | 12,800,000 | | | $ | 12,789,376 | |
North Carolina Medical Care Commission FirstHealth of the Carolinas Series A (Health Revenue, Branch Banking & Trust SPA) ø | | | 1.50 | | | | 10-1-2028 | | | | 13,570,000 | | | | 13,570,000 | |
| |
| | | | 64,265,131 | |
| | | | | | | | | | | | | | | | |
| | | | |
| Ohio: 2.20% | | | | | | | | | | | | | | | | |
Allen County OH Mercy Health Hospital Series A (Health Revenue) | | | 5.00 | | | | 8-1-2021 | | | | 3,575,000 | | | | 3,942,188 | |
Cleveland OH Airport System Series D (Airport Revenue, U.S. Bank NA LOC) ø | | | 1.70 | | | | 1-1-2024 | | | | 11,480,000 | | | | 11,480,000 | |
Cuyahoga OH Metropolitan Housing Authority Carver Park Phase I Project (Housing Revenue) | | | 1.00 | | | | 9-1-2019 | | | | 7,000,000 | | | | 6,963,740 | |
Franklin County OH Sawyer and Trevitt Project (Housing Revenue) | | | 1.30 | | | | 6-1-2020 | | | | 4,000,000 | | | | 3,981,160 | |
Lancaster OH Port Authority (1 Month LIBOR +0.55%) (Utilities Revenue, Royal Bank of Canada SPA) ± | | | 1.60 | | | | 8-1-2018 | | | | 4,000,000 | | | | 3,999,920 | |
Lancaster OH Port Authority (1 Month LIBOR +0.72%) (Utilities Revenue, Royal Bank of Canada SPA) ± | | | 1.77 | | | | 5-1-2038 | | | | 9,585,000 | | | | 9,591,134 | |
Mahoning County OH (GO Revenue) | | | 1.25 | | | | 1-24-2018 | | | | 1,480,000 | | | | 1,479,926 | |
Mahoning County OH (GO Revenue) | | | 2.00 | | | | 9-24-2018 | | | | 3,960,000 | | | | 3,971,444 | |
Newark OH BAN (GO Revenue) | | | 2.25 | | | | 5-8-2018 | | | | 2,700,000 | | | | 2,704,563 | |
Ohio Air Quality Development Authority AMT Refunding Bond Pollution Control 1st Energy Series C (Industrial Development Revenue) | | | 3.95 | | | | 11-1-2032 | | | | 450,000 | | | | 198,986 | |
Ohio Air Quality Development Authority FirstEnergy Generation Series A (Utilities Revenue) | | | 3.75 | | | | 12-1-2023 | | | | 17,635,000 | | | | 7,800,842 | |
Ohio Air Quality Development Authority FirstEnergy Generation Series A (Utilities Revenue) | | | 5.70 | | | | 8-1-2020 | | | | 10,290,000 | | | | 4,549,826 | |
Ohio American Municipal Power Incorporated (Utilities Revenue) | | | 2.25 | | | | 3-27-2018 | | | | 3,968,486 | | | | 3,976,383 | |
Ohio Higher Educational Facility John Carroll University Project (Education Revenue) | | | 2.25 | | | | 9-1-2033 | | | | 1,200,000 | | | | 1,203,912 | |
Ohio University Hospital Health System Series B (Health Revenue) ø | | | 1.75 | | | | 1-15-2033 | | | | 24,520,000 | | | | 24,520,000 | |
Ohio University Hospital Health System Series B (Health Revenue) ø | | | 1.75 | | | | 1-15-2045 | | | | 13,000,000 | | | | 13,000,000 | |
Ohio Water Development Authority Pollution Control FirstEnergy Nuclear Generation Project Series A (Industrial Development Revenue) | | | 3.75 | | | | 7-1-2033 | | | | 1,000,000 | | | | 442,160 | |
Ohio Water Development Authority Pollution Control FirstEnergy Nuclear Generation Project Series B (Water & Sewer Revenue) | | | 4.00 | | | | 12-1-2033 | | | | 9,575,000 | | | | 4,235,214 | |
Ohio Water Development Authority Pollution Control FirstEnergy Nuclear Generation Project Series C (Industrial Development Revenue) | | | 4.00 | | | | 6-1-2033 | | | | 3,290,000 | | | | 1,455,233 | |
Ohio Water Development Authority Series B (SIFMA Municipal Swap +0.22%) (Water & Sewer Revenue) ± | | | 1.93 | | | | 12-1-2020 | | | | 3,950,000 | | | | 3,948,499 | |
Scioto County OH Southern Ohio Medical Center (Miscellaneous Revenue) | | | 5.50 | | | | 2-15-2028 | | | | 3,000,000 | | | | 3,013,890 | |
Springboro OH BAN (GO Revenue) | | | 2.00 | | | | 1-26-2018 | | | | 5,050,000 | | | | 5,050,960 | |
| |
| | | | 121,509,980 | |
| | | | | | | | | | | | | | | | |
| | | | |
| Oklahoma: 0.38% | | | | | | | | | | | | | | | | |
Carter County OK Independent School District (GO Revenue) | | | 0.90 | | | | 3-1-2018 | | | | 500,000 | | | | 498,965 | |
Cleveland County OK Detention Facilities Project (Tax Revenue) | | | 3.00 | | | | 3-1-2018 | | | | 1,000,000 | | | | 1,002,390 | |
Cleveland County OK Detention Facilities Project (Tax Revenue) | | | 3.00 | | | | 3-1-2019 | | | | 1,505,000 | | | | 1,528,252 | |
Garfield County OK Independent School District #42 Series A (GO Revenue) | | | 0.95 | | | | 6-1-2018 | | | | 500,000 | | | | 497,200 | |
Oklahoma Capitol Improvement Authority Higher Education Projects Series A (Miscellaneous Revenue) | | | 5.00 | | | | 7-1-2018 | | | | 2,225,000 | | | | 2,263,893 | |
Oklahoma County OK Independent School District (GO Revenue) | | | 1.75 | | | | 7-1-2019 | | | | 1,110,000 | | | | 1,103,440 | |
The accompanying notes are an integral part of these financial statements.
| | | | | | |
| Portfolio of investments—December 31, 2017 (unaudited) | | Wells Fargo Ultra Short-Term Municipal Income Fund | | | 23 | |
| | | | | | | | | | | | | | | | |
| Security name | | Interest rate | | | Maturity date | | | Principal | | | Value | |
| | | | |
| Oklahoma (continued) | | | | | | | | | | | | | | | | |
Oklahoma County OK Independent School District (GO Revenue) | | | 1.75 | % | | | 7-1-2020 | | | $ | 1,215,000 | | | $ | 1,199,023 | |
Oklahoma HFA Savanna Landing Apartments (Housing Revenue) | | | 0.85 | | | | 7-1-2019 | | | | 2,500,000 | | | | 2,493,125 | |
Oklahoma Independent School District #52 Series A
(GO Revenue) %% | | | 2.50 | | | | 1-1-2020 | | | | 3,035,000 | | | | 3,062,133 | |
Oklahoma Independent School District Certificates of Participation (GO Revenue) | | | 1.30 | | | | 6-29-2018 | | | | 7,430,000 | | | | 7,397,159 | |
| |
| | | | 21,045,580 | |
| | | | | | | | | | | | | | | | |
| | | | |
| Oregon: 0.23% | | | | | | | | | | | | | | | | |
Oregon Facilities Authority Peace Health Hospitals Series A (Health Revenue, U.S. Bank NA LOC) ø | | | 1.65 | | | | 8-1-2034 | | | | 12,500,000 | | | | 12,500,000 | |
| | | | | | | | | | | | | | | | |
| | | | |
| Pennsylvania: 4.77% | | | | | | | | | | | | | | | | |
Allegheny County PA Hospital Development Authority Series E (Health Revenue, Royal Bank of Canada LOC, Royal Bank of Canada LIQ) ø144A | | | 1.40 | | | | 4-1-2022 | | | | 10,000,000 | | | | 10,000,000 | |
Beaver County PA IDA Pollution Control FirstEnergy Generation Project Series B (Industrial Development Revenue) | | | 4.25 | | | | 10-1-2047 | | | | 5,000,000 | | | | 4,920,650 | |
Beaver County PA IDA Pollution Control FirstEnergy Nuclear Generation Project Series B (Industrial Development Revenue) | | | 3.50 | | | | 12-1-2035 | | | | 3,025,000 | | | | 1,337,564 | |
Chester County PA HEFA Immaculata University Project (Education Revenue) | | | 3.00 | | | | 11-1-2018 | | | | 400,000 | | | | 398,208 | |
Chester County PA HEFA Immaculata University Project (Education Revenue) | | | 4.00 | | | | 11-1-2019 | | | | 655,000 | | | | 657,836 | |
Chester County PA HEFA Immaculata University Project (Education Revenue) | | | 5.00 | | | | 11-1-2020 | | | | 705,000 | | | | 726,298 | |
Chester County PA HEFA Immaculata University Project (Education Revenue) | | | 5.00 | | | | 11-1-2021 | | | | 740,000 | | | | 767,047 | |
Cumberland County PA Authority Association of Independent Colleges & Universities of Pennsylvania Financing Program Series T-1 (Education Revenue) øø | | | 2.00 | | | | 5-1-2044 | | | | 1,500,000 | | | | 1,480,800 | |
Indiana County PA IDA Residential Revival Indiana Student Housing Project at University of Pennsylvania Series A (Housing Revenue) | | | 1.55 | | | | 4-1-2019 | | | | 10,000,000 | | | | 9,933,600 | |
Luzerne County PA RAN (GO Revenue) %% | | | 3.00 | | | | 6-29-2018 | | | | 3,000,000 | | | | 3,010,290 | |
Lycoming County PA Authority Association of Independent Colleges & Universities of Pennsylvania Financing Program (Education Revenue) | | | 1.85 | | | | 11-1-2035 | | | | 2,000,000 | | | | 2,000,000 | |
Montgomery County PA Higher Education and Health Authority Presbytery Homes Incorporated Project (Health Revenue) | | | 2.00 | | | | 12-1-2018 | | | | 570,000 | | | | 573,186 | |
Montgomery County PA Higher Education and Health Authority Presbytery Homes Incorporated Project (Health Revenue) | | | 2.00 | | | | 12-1-2019 | | | | 735,000 | | | | 740,784 | |
Montgomery County PA Higher Education and Health Authority Presbytery Homes Incorporated Project (Health Revenue) | | | 2.00 | | | | 12-1-2020 | | | | 650,000 | | | | 653,666 | |
Montgomery County PA Higher Education and Health Authority Presbytery Homes Incorporated Project (Health Revenue) | | | 3.00 | | | | 12-1-2021 | | | | 715,000 | | | | 742,856 | |
Montgomery County PA IDA Peco Energy Company Project Series A (Industrial Development Revenue) | | | 2.50 | | | | 10-1-2030 | | | | 3,000,000 | | | | 3,010,380 | |
Montgomery County PA IDA Peco Energy Company Project Series A (Industrial Development Revenue) | | | 2.60 | | | | 3-1-2034 | | | | 5,000,000 | | | | 5,020,400 | |
North Pennsylvania Water Authority (1 Month LIBOR +0.35%) (Water & Sewer Revenue) ± | | | 1.40 | | | | 11-1-2018 | | | | 700,000 | | | | 698,376 | |
North Pennsylvania Water Authority (1 Month LIBOR +0.41%) (Water & Sewer Revenue) ± | | | 1.46 | | | | 11-1-2019 | | | | 1,000,000 | | | | 995,620 | |
North Pennsylvania Water Authority (1 Month LIBOR +0.50%) (Water & Sewer Revenue) ± | | | 1.55 | | | | 11-1-2024 | | | | 5,000,000 | | | | 4,983,750 | |
Pennsylvania (GO Revenue) | | | 5.00 | | | | 1-15-2020 | | | | 16,430,000 | | | | 17,447,839 | |
Pennsylvania Economic Development Financing Authority Tapestry Moon Senior Housing Project Series A (Health Revenue) øø | | | 2.25 | | | | 12-1-2053 | | | | 20,000,000 | | | | 20,000,000 | |
Pennsylvania EDFA Solid Waste Disposal Republic Services Incorporated Project (Resource Recovery Revenue) øø | | | 1.20 | | | | 6-1-2044 | | | | 8,000,000 | | | | 8,000,000 | |
The accompanying notes are an integral part of these financial statements.
| | | | |
| 24 | | Wells Fargo Ultra Short-Term Municipal Income Fund | | Portfolio of investments—December 31, 2017 (unaudited) |
| | | | | | | | | | | | | | | | |
| Security name | | Interest rate | | | Maturity date | | | Principal | | | Value | |
| | | | |
| Pennsylvania (continued) | | | | | | | | | | | | | | | | |
Pennsylvania EDFA Solid Waste Disposal Waste Management Incorporated Project (Resource Recovery Revenue) øø | | | 1.20 | % | | | 8-1-2045 | | | $ | 22,500,000 | | | $ | 22,497,525 | |
Pennsylvania HEFA Association of Independent Colleges and Universities of Pennsylvania Financing Program Series T-2 (Education Revenue) øø | | | 1.50 | | | | 5-1-2030 | | | | 2,215,000 | | | | 2,211,500 | |
Pennsylvania HEFA Association of Independent Colleges and Universities of Pennsylvania Financing Program Series T-3 (Education Revenue) øø | | | 2.25 | | | | 5-1-2033 | | | | 5,000,000 | | | | 4,960,650 | |
Pennsylvania HEFA Association of Independent Colleges and Universities of Pennsylvania Financing Program Series T-4 (Education Revenue) | | | 1.35 | | | | 5-1-2034 | | | | 2,500,000 | | | | 2,494,675 | |
Pennsylvania HEFA Independent Colleges Series I4 (Education Revenue) | | | 1.50 | | | | 11-1-2031 | | | | 5,800,000 | | | | 5,789,154 | |
Pennsylvania HEFA Wilkes University Project Series A (Education Revenue) | | | 4.00 | | | | 3-1-2020 | | | | 735,000 | | | | 771,669 | |
Pennsylvania HEFA Wilkes University Project Series A (Education Revenue) | | | 5.00 | | | | 3-1-2021 | | | | 500,000 | | | | 549,265 | |
Pennsylvania HEFAR BAN Series C-1B (Housing Revenue) | | | 0.88 | | | | 2-1-2018 | | | | 2,800,000 | | | | 2,797,284 | |
Pennsylvania HEFAR Thomas Jefferson University Series B (Education Revenue) ø | | | 1.95 | | | | 9-1-2045 | | | | 12,075,000 | | | | 12,075,000 | |
Pennsylvania HEFAR University of Pennsylvania Health System Series A (Health Revenue, Bank of America NA LOC) ø | | | 1.35 | | | | 1-1-2038 | | | | 500,000 | | | | 500,000 | |
Pennsylvania HFA Courtyard Preservation Project (Housing Revenue) | | | 1.85 | | | | 12-1-2019 | | | | 17,145,000 | | | | 17,156,830 | |
Pennsylvania Turnpike Commission Series A-2 (1 Month LIBOR +0.70%) (Transportation Revenue) ± | | | 1.80 | | | | 12-1-2018 | | | | 5,000,000 | | | | 5,007,200 | |
Pennsylvania Turnpike Commission Series B-1 (SIFMA Municipal Swap +0.60%) (Transportation Revenue) ± | | | 2.31 | | | | 12-1-2018 | | | | 19,000,000 | | | | 19,028,880 | |
Philadelphia PA Hospital and Higher Education Facilities Authority (Health Revenue) | | | 5.00 | | | | 7-1-2019 | | | | 1,000,000 | | | | 1,038,540 | |
Philadelphia PA Hospital and Higher Education Facilities Authority (Health Revenue) | | | 5.00 | | | | 7-1-2020 | | | | 1,000,000 | | | | 1,059,590 | |
Philadelphia PA Authority For Industrial Development Thomas Jefferson University Series B (Education Revenue) ø | | | 1.95 | | | | 9-1-2050 | | | | 24,565,000 | | | | 24,565,000 | |
Philadelphia PA School District Refunding Bond Series C (GO Revenue) | | | 5.00 | | | | 9-1-2018 | | | | 1,880,000 | | | | 1,916,566 | |
Philadelphia PA School District Series D (GO Revenue) | | | 5.00 | | | | 9-1-2019 | | | | 1,250,000 | | | | 1,309,888 | |
Philadelphia PA School District Series F (GO Revenue) | | | 5.00 | | | | 9-1-2019 | | | | 1,000,000 | | | | 1,047,910 | |
Pittsburgh PA Housing Authority East Liberty Phase II Apartments (Housing Revenue) | | | 1.40 | | | | 10-1-2021 | | | | 3,500,000 | | | | 3,470,075 | |
Pittsburgh PA Water & Sewer Authority Series C (1 Month LIBOR +0.64%) (Water & Sewer Revenue, AGM Insured) ± | | | 1.74 | | | | 9-1-2040 | | | | 15,000,000 | | | | 14,953,800 | |
Quakertown PA Health Facilities Authority Series A (Health Revenue) | | | 3.13 | | | | 7-1-2021 | | | | 3,250,000 | | | | 3,252,113 | |
Scranton PA RAN (GO Revenue) 144A%% | | | 2.90 | | | | 12-15-2018 | | | | 6,375,000 | | | | 6,203,130 | |
Scranton PA School District Series A (GO Revenue) | | | 5.00 | | | | 6-1-2019 | | | | 500,000 | | | | 518,485 | |
Scranton PA School District Series A (GO Revenue) | | | 5.00 | | | | 6-1-2020 | | | | 635,000 | | | | 671,601 | |
Scranton PA School District Series B (GO Revenue) | | | 4.00 | | | | 6-1-2018 | | | | 500,000 | | | | 503,715 | |
Scranton PA School District Series B (GO Revenue) | | | 5.00 | | | | 6-1-2020 | | | | 540,000 | | | | 571,126 | |
Sctanton PA (GO Revenue) | | | 5.00 | | | | 9-1-2018 | | | | 1,000,000 | | | | 1,015,570 | |
Sctanton PA (GO Revenue) | | | 5.00 | | | | 9-1-2019 | | | | 2,100,000 | | | | 2,175,516 | |
Upper Darby PA School District (GO Revenue) | | | 4.00 | | | | 5-1-2018 | | | | 700,000 | | | | 705,635 | |
Warwick PA School District (GO Revenue) | | | 4.00 | | | | 2-15-2018 | | | | 1,250,000 | | | | 1,253,788 | |
Warwick PA School District (GO Revenue) | | | 4.00 | | | | 2-15-2019 | | | | 1,025,000 | | | | 1,052,798 | |
Westmoreland County PA IDA Excela Health Project (Health Revenue) | | | 5.00 | | | | 7-1-2018 | | | | 1,650,000 | | | | 1,677,275 | |
| |
| | | | 262,900,903 | |
| | | | | | | | | | | | | | | | |
| | | | |
| Rhode Island: 0.22% | | | | | | | | | | | | | | | | |
Providence RI RDA Public Safety Building Project Series A (Miscellaneous Revenue) | | | 4.00 | | | | 4-1-2018 | | | | 3,025,000 | | | | 3,041,275 | |
Rhode Island HEFA Refunding Bond Providence Financing Program (Education Revenue, AGM Insured) | | | 3.00 | | | | 5-15-2018 | | | | 1,535,000 | | | | 1,542,798 | |
The accompanying notes are an integral part of these financial statements.
| | | | | | |
| Portfolio of investments—December 31, 2017 (unaudited) | | Wells Fargo Ultra Short-Term Municipal Income Fund | | | 25 | |
| | | | | | | | | | | | | | | | |
| Security name | | Interest rate | | | Maturity date | | | Principal | | | Value | |
| | | | |
| Rhode Island (continued) | | | | | | | | | | | | | | | | |
Rhode Island Housing and Mortgage Finance Corporation Series 4-A (Housing Revenue) | | | 1.85 | % | | | 4-1-2056 | | | $ | 2,500,000 | | | $ | 2,500,000 | |
Rhode Island Housing and Mortgage Finance Corporation Series 66-B (SIFMA Municipal Swap +0.70%) (Housing Revenue) ± | | | 2.41 | | | | 10-1-2045 | | | | 4,400,000 | | | | 4,400,000 | |
Rhode Island Student Loan Authority AMT Program Senior Series A (Education Revenue) | | | 5.00 | | | | 12-1-2019 | | | | 750,000 | | | | 787,058 | |
| |
| | | | 12,271,131 | |
| | | | | | | | | | | | | | | | |
| | | | |
| South Carolina: 1.63% | | | | | | | | | | | | | | | | |
Berkeley County SC IDA Nucor Corporation Project (Industrial Development Revenue) ø | | | 1.60 | | | | 4-1-2030 | | | | 5,000,000 | | | | 5,000,000 | |
Columbia SC Waterworks (Water & Sewer Revenue, Sumitomo Mitsui Banking LOC) ø | | | 1.71 | | | | 2-1-2038 | | | | 8,075,000 | | | | 8,075,000 | |
Jasper County SC Jasper County School Project (Miscellaneous Revenue) | | | 3.00 | | | | 4-1-2018 | | | | 500,000 | | | | 500,080 | |
Jasper County SC Jasper County School Project (Miscellaneous Revenue) | | | 4.00 | | | | 4-1-2019 | | | | 85,000 | | | | 85,965 | |
Piedmont SC Municipal Power Agency Prerefunded Bond Series A-3 (Utilities Revenue) | | | 5.25 | | | | 1-1-2019 | | | | 1,580,000 | | | | 1,580,000 | |
Piedmont SC Municipal Power Agency Unrefunded Bond Series A-3 (Utilities Revenue) | | | 5.25 | | | | 1-1-2019 | | | | 4,140,000 | | | | 4,140,000 | |
South Carolina EDA Brashier Charter LLC Project (Education Revenue, SunTrust Bank LOC) ø | | | 1.78 | | | | 12-1-2038 | | | | 6,680,000 | | | | 6,680,000 | |
South Carolina HFA West Greenville Project (Housing Revenue) | | | 1.00 | | | | 4-1-2019 | | | | 7,600,000 | | | | 7,592,020 | |
South Carolina Housing Finance and Development Authority Waters at Longcreek (Housing Revenue) | | | 1.60 | | | | 12-1-2019 | | | | 9,075,000 | | | | 9,075,363 | |
Spartanburg County SC School District #7 BAN (GO Revenue) | | | 5.00 | | | | 11-15-2018 | | | | 45,575,000 | | | | 46,944,073 | |
| |
| | | | 89,672,501 | |
| | | | | | | | | | | | | | | | |
| | | | |
| Tennessee: 1.68% | | | | | | | | | | | | | | | | |
Hamilton County TN Industrial Development Board Jaycee Tower Apartments Project (Housing Revenue) | | | 1.37 | | | | 7-1-2020 | | | | 5,500,000 | | | | 5,487,295 | |
Memphis TN HEFA Ashland Lakes II Apartments Project Series A (Housing Revenue, U.S. Bank NA LOC) ø | | | 1.72 | | | | 5-1-2043 | | | | 11,500,000 | | | | 11,500,000 | |
Metropolitan Government of Nashville & Davidson County TN Industrial Development Board (Resource Recovery Revenue) | | | 1.45 | | | | 8-1-2031 | | | | 6,500,000 | | | | 6,501,105 | |
Nashville & Davidson County TN HEFA Twelfth & Wedgewood Apartments Project (Housing Revenue, HUD Insured) | | | 1.80 | | | | 12-1-2020 | | | | 1,500,000 | | | | 1,500,855 | |
Nashville TN HEFA The Paddock at Grandview Apartments Project (Housing Revenue) | | | 0.95 | | | | 5-1-2018 | | | | 16,500,000 | | | | 16,474,755 | |
Shelby County TN Health Educational & Housing Facilities Board Methodist Le Bonheur Series A (Health Revenue, AGM Insured, U.S. Bank NA SPA) ø | | | 1.30 | | | | 6-1-2042 | | | | 51,355,000 | | | | 51,355,000 | |
| |
| | | | 92,819,010 | |
| | | | | | | | | | | | | | | | |
| | | | |
| Texas: 10.22% | | | | | | | | | | | | | | | | |
Alamo TX Community College District (Education Revenue) | | | 3.00 | | | | 11-1-2046 | | | | 4,090,000 | | | | 4,167,424 | |
Austin TX Affordable Housing Public Facility Corporation Pathways at Georgian Manor (Housing Revenue) | | | 1.15 | | | | 11-1-2019 | | | | 14,040,000 | | | | 14,026,943 | |
Bexar County TX Northside Independent School District (GO Revenue) | | | 1.35 | | | | 6-1-2033 | | | | 2,000,000 | | | | 1,997,120 | |
Cypress-Fairbanks TX Independent School District Series A-1 (GO Revenue) | | | 2.00 | | | | 2-15-2027 | | | | 7,000,000 | | | | 7,014,490 | |
Cypress-Fairbanks TX Independent School District Series A-2 (GO Revenue) | | | 2.50 | | | | 2-15-2036 | | | | 17,000,000 | | | | 17,185,810 | |
Cypress-Fairbanks TX Independent School District Series A-3 (GO Revenue) | | | 3.00 | | | | 2-15-2043 | | | | 2,900,000 | | | | 3,013,709 | |
The accompanying notes are an integral part of these financial statements.
| | | | |
| 26 | | Wells Fargo Ultra Short-Term Municipal Income Fund | | Portfolio of investments—December 31, 2017 (unaudited) |
| | | | | | | | | | | | | | | | |
| Security name | | Interest rate | | | Maturity date | | | Principal | | | Value | |
| | | | |
| Texas (continued) | | | | | | | | | | | | | | | | |
Dallas Performing Arts Cultural Facilities Corporation Project Series A (Miscellaneous Revenue, Bank of America NA LOC) ø | | | 1.73 | % | | | 9-1-2041 | | | $ | 3,220,000 | | | $ | 3,220,000 | |
Dallas TX Independent High School District (GO Revenue) | | | 1.50 | | | | 2-15-2034 | | | | 4,375,000 | | | | 4,368,044 | |
Dallas TX Refunding Bond (GO Revenue) | | | 5.00 | | | | 2-15-2019 | | | | 6,135,000 | | | | 6,368,314 | |
Del Rio TX Housing Facility Corporation (Housing Revenue) | | | 1.35 | | | | 6-1-2021 | | | | 2,500,000 | | | | 2,488,025 | |
Denton TX Independent School District Unlimited Tax School Building Bond Series 2013 (GO Revenue) | | | 2.00 | | | | 8-1-2043 | | | | 2,530,000 | | | | 2,539,488 | |
Donna TX International Toll Bridge (Transportation Revenue) | | | 6.25 | | | | 2-15-2037 | | | | 21,350,000 | | | | 21,895,066 | |
Fort Bend TX Series B (GO Revenue) | | | 1.35 | | | | 8-1-2040 | | | | 2,000,000 | | | | 1,985,740 | |
Galveston TX Dickinson Independent High School District (GO Revenue) | | | 1.35 | | | | 8-1-2037 | | | | 4,585,000 | | | | 4,552,309 | |
Goose Creek TX Independent School District Series B (GO Revenue) | | | 1.18 | | | | 2-15-2035 | | | | 10,000,000 | | | | 9,900,000 | |
Grapevine-Colleyville TX Independent School District Series B (GO Revenue) | | | 2.00 | | | | 8-1-2036 | | | | 8,500,000 | | | | 8,609,225 | |
Harris County TX Cypress-Fairbanks Independent High School Series 2014B-2 (GO Revenue) | | | 1.40 | | | | 2-15-2040 | | | | 5,200,000 | | | | 5,174,676 | |
Harris County TX Cypress-Fairbanks Independent High School Series 2014B-3 (GO Revenue) | | | 1.40 | | | | 2-15-2044 | | | | 10,750,000 | | | | 10,705,925 | |
Harris County TX Cypress-Fairbanks Independent High School Series B-1 (GO Revenue) | | | 0.90 | | | | 2-15-2040 | | | | 12,180,000 | | | | 12,123,363 | |
Harris County TX Industrial Development Corporation Deer Park Refining Limited Partnership Project (Resource Recovery Revenue) | | | 4.70 | | | | 5-1-2018 | | | | 15,000,000 | | | | 15,137,100 | |
Houston TX Independent School District (GO Revenue) | | | 1.45 | | | | 6-1-2029 | | | | 20,000,000 | | | | 19,882,200 | |
Houston TX Independent School District Series 1A (GO Revenue) | | | 3.00 | | | | 6-1-2039 | | | | 5,580,000 | | | | 5,610,634 | |
Houston TX Independent School District Series B (GO Revenue) | | | 1.70 | | | | 6-1-2036 | | | | 2,000,000 | | | | 2,000,380 | |
Matagorda County TX Navigation District Central Power and Light Company Project (Industrial Development Revenue) | | | 1.75 | | | | 5-1-2030 | | | | 6,750,000 | | | | 6,644,295 | |
Midland County TX PFFA Compass Pointe Apartments (Housing Revenue) | | | 1.25 | | | | 3-1-2018 | | | | 7,000,000 | | | | 6,998,600 | |
Midlothian TX Independent School District Series B (GO Revenue) | | | 2.50 | | | | 8-1-2052 | | | | 6,500,000 | | | | 6,531,200 | |
Mission TX Economic Development Corporation Republic Services Incorporated Project (Resource Recovery Revenue) øø | | | 1.22 | | | | 1-1-2026 | | | | 5,000,000 | | | | 4,999,700 | |
New Hope TX Cultural Education Facilities Finance Corporation MRC Crestview Project (Health Revenue) | | | 1.75 | | | | 11-15-2018 | | | | 500,000 | | | | 497,945 | |
New Hope TX Cultural Education Facilities Finance Corporation Student Housing Revenue Project Series A (Housing Revenue) | | | 3.25 | | | | 8-1-2019 | | | | 15,720,000 | | | | 15,729,904 | |
New Hope TX ECFA Collegiate Housing Commerce LLC at Texas A&M University Series A (Housing Revenue) | | | 1.00 | | | | 2-1-2018 | | | | 2,000,000 | | | | 1,998,900 | |
North East TX Independent School District Series A (GO Revenue) | | | 2.00 | | | | 8-1-2042 | | | | 25,365,000 | | | | 25,414,208 | |
North East TX Independent School District Series B (GO Revenue) | | | 1.42 | | | | 8-1-2040 | | | | 1,440,000 | | | | 1,431,014 | |
North Texas Tollway Authority Prerefunded Bond (Miscellaneous Revenue) | | | 5.63 | | | | 1-1-2033 | | | | 3,460,000 | | | | 3,460,000 | |
North TX Tollway Authority Series F (Transportation Revenue) | | | 5.75 | | | | 1-1-2033 | | | | 23,450,000 | | | | 23,450,000 | |
North TX Tollway Authority Series F (Transportation Revenue) | | | 5.75 | | | | 1-1-2038 | | | | 32,000,000 | | | | 32,000,000 | |
Northside TX Independent School District Building Project (GO Revenue) | | | 2.00 | | | | 8-1-2044 | | | | 2,610,000 | | | | 2,617,673 | |
Northside TX Independent School District Building Project (GO Revenue) | | | 2.00 | | | | 6-1-2046 | | | | 1,450,000 | | | | 1,452,842 | |
Northside TX Independent School District Building Project (GO Revenue) | | | 2.13 | | | | 8-1-2040 | | | | 1,870,000 | | | | 1,870,823 | |
Northside TX Independent School District Series A (GO Revenue) | | | 2.00 | | | | 6-1-2039 | | | | 27,055,000 | | | | 27,144,823 | |
Odessa TX Housing Finance Corporation 87th Street Apartments Project (Housing Revenue, FHA Insured) | | | 1.43 | | | | 12-1-2020 | | | | 8,000,000 | | | | 8,000,320 | |
Port Arthur TX Navigation District Jefferson County Environmental Facilities Motiva Enterprises LLC Project Series B (Resource Recovery Revenue) ø | | | 1.45 | | | | 4-1-2040 | | | | 26,530,000 | | | | 26,530,000 | |
Port Arthur TX Navigation District Jefferson County Environmental Facilities Motiva Enterprises LLC Project Series D (Resource Recovery Revenue) ø | | | 1.45 | | | | 11-1-2040 | | | | 7,000,000 | | | | 7,000,000 | |
The accompanying notes are an integral part of these financial statements.
| | | | | | |
| Portfolio of investments—December 31, 2017 (unaudited) | | Wells Fargo Ultra Short-Term Municipal Income Fund | | | 27 | |
| | | | | | | | | | | | | | | | |
| Security name | | Interest rate | | | Maturity date | | | Principal | | | Value | |
| | | | |
| Texas (continued) | | | | | | | | | | | | | | | | |
Port Arthur TX Navigation District Motiva Enterprises LLC Project Subordinate Series D (Resource Recovery Revenue) ø | | | 1.45 | % | | | 11-1-2040 | | | $ | 15,000,000 | | | $ | 15,000,000 | |
San Antonio TX Electric and Gas Systems Refunding Bond Series B (Utilities Revenue) | | | 2.00 | | | | 2-1-2033 | | | | 14,250,000 | | | | 14,433,683 | |
San Antonio TX Housing Trust Finance Corporation Freedom Hills Ranch Apartments Project (Housing Revenue) | | | 1.00 | | | | 1-1-2018 | | | | 12,650,000 | | | | 12,650,000 | |
San Antonio TX Series A (Utilities Revenue) | | | 2.25 | | | | 2-1-2033 | | | | 20,000,000 | | | | 20,183,200 | |
San Antonio TX Series C (Utilities Revenue) | | | 2.00 | | | | 12-1-2027 | | | | 3,380,000 | | | | 3,387,943 | |
Tarrant County TX Cultural Education Facilities Finance Corporation Edgemere Project Refunding Bond Series A (Health Revenue) | | | 4.00 | | | | 11-15-2018 | | | | 500,000 | | | | 507,675 | |
Tarrant County TX Cultural Education Facilities Finance Corporation Edgemere Project Refunding Bond Series A (Health Revenue) | | | 4.00 | | | | 11-15-2019 | | | | 510,000 | | | | 525,361 | |
Tarrant County TX Cultural Education Facilities Finance Corporation Edgemere Project Series B (Health Revenue) | | | 4.00 | | | | 11-15-2018 | | | | 500,000 | | | | 507,675 | |
Tarrant County TX Cultural Education Facilities Finance Corporation Edgemere Project Series B (Health Revenue) | | | 4.00 | | | | 11-15-2019 | | | | 710,000 | | | | 731,385 | |
Tarrant County TX Cultural Education Facilities Finance Corporation Series 2973 (Health Revenue, Morgan Stanley Bank LIQ) ø144A | | | 1.94 | | | | 11-15-2029 | | | | 30,400,000 | | | | 30,400,000 | |
Tender Option Bond Trust Receipts/Floater Certificates Series 2016-XG0058 (Health Revenue, Deutsche Bank LIQ) ø144A | | | 1.78 | | | | 8-15-2027 | | | | 4,985,000 | | | | 4,985,000 | |
Tender Option Bond Trust Receipts/Floater Certificates Series 2017-XM0560 (Transportation Revenue, Bank of America NA LIQ) ø144A | | | 0.54 | | | | 1-1-2048 | | | | 2,485,000 | | | | 2,485,000 | |
Tender Option Bond Trust Receipts/Floater Certificates Series 2017-XM0561 (Transportation Revenue, Bank of America NA LIQ) ø144A | | | 0.54 | | | | 1-1-2048 | | | | 3,690,000 | | | | 3,690,000 | |
Texas Affordable Housing Corporation Palladium Glenn Heights Apartments (Housing Revenue) | | | 1.90 | | | | 12-1-2020 | | | | 1,200,000 | | | | 1,200,324 | |
Texas Bravos River Authority Houston Lighting & Power Company Project (Industrial Development Revenue, Ambac Insured) | | | 5.05 | | | | 11-1-2018 | | | | 1,000,000 | | | | 1,029,070 | |
Texas Department of Housing and Community Affairs (Housing Revenue) | | | 1.80 | | | | 12-1-2020 | | | | 2,500,000 | | | | 2,496,250 | |
Texas Northside Independent School District (GO Revenue) | | | 1.45 | | | | 6-1-2047 | | | | 4,000,000 | | | | 3,968,040 | |
Texas Tollway Authority Series C (Transportation Revenue) | | | 1.95 | | | | 1-1-2038 | | | | 1,535,000 | | | | 1,535,031 | |
Texas Tollway Authority Series D (Transportation Revenue, Royal Bank of Canada LOC) ø | | | 1.46 | | | | 1-1-2049 | | | | 1,500,000 | | | | 1,500,000 | |
Texas Transportation Commission State Highway Fund Series B-1 (Miscellaneous Revenue, Sumitomo Mitsui Banking LIQ) ø | | | 1.42 | | | | 4-1-2032 | | | | 7,000,000 | | | | 7,000,000 | |
Texas Veterans Bond Series B (GO Revenue, FHLB SPA) ø | | | 1.48 | | | | 6-1-2046 | | | | 10,010,000 | | | | 10,010,000 | |
Texas Veterans Bond Series D (Miscellaneous Revenue, FHLB SPA) ø | | | 1.48 | | | | 6-1-2045 | | | | 19,480,000 | | | | 19,480,000 | |
University of Texas Board of Regents Series C (Education Revenue) | | | 5.00 | | | | 8-15-2020 | | | | 5,000,000 | | | | 5,425,800 | |
University of Texas Board of Regents Series C (Education Revenue) | | | 5.00 | | | | 8-15-2021 | | | | 8,925,000 | | | | 9,950,393 | |
Williamson County TX (GO Revenue) | | | 1.45 | | | | 8-15-2034 | | | | 2,600,000 | | | | 2,589,834 | |
| |
| | | | 563,409,896 | |
| | | | | | | | | | | | | | | | |
| | | | |
| Vermont: 0.01% | | | | | | | | | | | | | | | | |
Burlington VT Airport Refunding Bond Series 2012B (Airport Revenue) | | | 3.50 | | | | 7-1-2018 | | | | 795,000 | | | | 801,129 | |
| | | | | | | | | | | | | | | | |
| | | | |
| Virginia: 1.20% | | | | | | | | | | | | | | | | |
Charles City VA EDA Solid Waste Disposal Waste Management Incorporated (Resource Recovery Revenue) | | | 1.60 | | | | 8-1-2027 | | | | 10,000,000 | | | | 10,005,700 | |
Chesapeake VA EDA Electric and Power Company Series 2008A (Utilities Revenue) | | | 1.75 | | | | 2-1-2032 | | | | 30,000,000 | | | | 30,096,900 | |
Colonial Heights VA EDA Colonial Ridge Apartments Series A (Housing Revenue) | | | 1.80 | | | | 1-1-2020 | | | | 10,000,000 | | | | 9,989,700 | |
The accompanying notes are an integral part of these financial statements.
| | | | |
| 28 | | Wells Fargo Ultra Short-Term Municipal Income Fund | | Portfolio of investments—December 31, 2017 (unaudited) |
| | | | | | | | | | | | | | | | |
| Security name | | Interest rate | | | Maturity date | | | Principal | | | Value | |
| | | | |
| Virginia (continued) | | | | | | | | | | | | | | | | |
Fairfax County VA EDA Smithsonian Institution Series A (Miscellaneous Revenue, Northern Trust Company SPA) ø | | | 1.70 | % | | | 12-1-2033 | | | $ | 2,500,000 | | | $ | 2,500,000 | |
Greater Richmond VA Convention Center Authority (Tax Revenue) | | | 5.00 | | | | 6-15-2018 | | | | 1,500,000 | | | | 1,523,715 | |
Prince William County VA IDA Glen Arbor Apartments Project Series A (Housing Revenue) | | | 1.35 | | | | 7-1-2019 | | | | 10,500,000 | | | | 10,472,280 | |
Prince William County VA IDA Glen Arbor Apartments Project Series B (Housing Revenue) | | | 1.30 | | | | 7-1-2019 | | | | 1,600,000 | | | | 1,590,512 | |
| |
| | | | 66,178,807 | |
| | | | | | | | | | | | | | | | |
| | | | |
| Washington: 0.34% | | | | | | | | | | | | | | | | |
Grays Harbor County WA Public Hospital District #1 (Health Revenue) | | | 3.00 | | | | 8-1-2019 | | | | 7,630,000 | | | | 7,628,703 | |
Washington HCFR Series XF2035 (Health Revenue, Morgan Stanley Bank LIQ) ø144A | | | 2.11 | | | | 10-1-2036 | | | | 8,155,000 | | | | 8,155,000 | |
Washington HCFR Central Washington Health Service Association (Health Revenue) | | | 7.00 | | | | 7-1-2039 | | | | 3,000,000 | | | | 3,229,920 | |
| |
| | | | 19,013,623 | |
| | | | | | | | | | | | | | | | |
| | | | |
| West Virginia: 0.31% | | | | | | | | | | | | | | | | |
Mason County WV PCR Appalachian Power Company Series L (Industrial Development Revenue) | | | 1.63 | | | | 10-1-2022 | | | | 16,400,000 | | | | 16,364,233 | |
West Virginia EDA Solid Waste Disposal Facilities Appalachian Power Company Series A (Utilities Revenue) | | | 1.70 | | | | 1-1-2041 | | | | 1,000,000 | | | | 983,570 | |
| |
| | | | 17,347,803 | |
| | | | | | | | | | | | | | | | |
| | | | |
| Wisconsin: 1.92% | | | | | | | | | | | | | | | | |
Appleton WI RDA Fox Cities Performing Arts Center Project Series B (Miscellaneous Revenue, JPMorgan Chase & Company LOC) ø | | | 1.48 | | | | 6-1-2036 | | | | 9,700,000 | | | | 9,700,000 | |
Mequon-Thiensville WI School District RAN Series R-1 (Education Revenue) | | | 1.50 | | | | 2-22-2018 | | | | 1,750,000 | | | | 1,750,700 | |
Milwaukee WI RAN Series M-11 (Miscellaneous Revenue) | | | 5.00 | | | | 9-27-2018 | | | | 41,440,000 | | | | 42,529,043 | |
Tender Option Bond Trust Receipts/Floater Certificates Series 2015-XF0127 (Health Revenue, JPMorgan Chase & Company LIQ) ø144A | | | 1.89 | | | | 10-1-2020 | | | | 4,875,000 | | | | 4,875,000 | |
Tender Option Bond Trust Receipts/Floater Certificates Series 2015-XF1028 (Health Revenue, Deutsche Bank LIQ) ø144A | | | 1.78 | | | | 11-15-2044 | | | | 10,880,000 | | | | 10,880,000 | |
Waukesha County WI Series D (Miscellaneous Revenue) | | | 2.00 | | | | 7-1-2018 | | | | 4,165,000 | | | | 4,169,790 | |
Wisconsin Health and Educational Facilities Authority ThedaCare Incorporated Series A (Health Revenue) | | | 5.25 | | | | 12-15-2018 | | | | 1,120,000 | | | | 1,158,595 | |
Wisconsin Health and Educational Facilities Authority ThedaCare Incorporated Series B (Health Revenue) | | | 4.50 | | | | 12-15-2018 | | | | 2,755,000 | | | | 2,830,542 | |
Wisconsin Health and Educational Facilities Authority Tomah Memorial Hospital Series A (Health Revenue) | | | 2.65 | | | | 11-1-2020 | | | | 4,000,000 | | | | 3,957,960 | |
Wisconsin HEFA Ascension Senior Credit Group Series B-5 (Health Revenue) | | | 1.38 | | | | 11-15-2038 | | | | 1,620,000 | | | | 1,603,152 | |
Wisconsin HEFA Bellin Memorial Hospital Incorporated (Health Revenue) | | | 3.00 | | | | 12-1-2018 | | | | 650,000 | | | | 658,073 | |
Wisconsin Housing and Economic Development Authority Series A (Housing Revenue) | | | 1.95 | | | | 11-1-2047 | | | | 6,225,000 | | | | 6,225,623 | |
Wisconsin Public Finance Authority Guilford College (Education Revenue) | | | 5.00 | | | | 1-1-2020 | | | | 625,000 | | | | 655,213 | |
Wisconsin Public Finance Authority Series A-2 (Resource Recovery Revenue) øø | | | 1.25 | | | | 10-1-2025 | | | | 15,000,000 | | | | 14,976,900 | |
| |
| | | | 105,970,591 | |
| | | | | | | | | | | | | | | | |
The accompanying notes are an integral part of these financial statements.
| | | | | | |
| Portfolio of investments—December 31, 2017 (unaudited) | | Wells Fargo Ultra Short-Term Municipal Income Fund | | | 29 | |
| | | | | | | | | | | | | | | | |
| Security name | | Interest rate | | | Maturity date | | | Principal | | | Value | |
| | | | |
| Wyoming: 0.47% | | | | | | | | | | | | | | | | |
Converse County WY Pollution Control PacifiCorp Projects (Utilities Revenue) ø | | | 1.54 | % | | | 12-1-2020 | | | $ | 16,485,000 | | | $ | 16,485,000 | |
Gillette WY Customized Purchase Pollution Control Series 1988 (Industrial Development Revenue) ø | | | 1.82 | | | | 1-1-2018 | | | | 9,200,000 | | | | 9,200,000 | |
| |
| | | | 25,685,000 | |
| | | | | | | | | | | | | | | | |
| |
Total Municipal Obligations (Cost $5,242,453,152) | | | | 5,221,885,255 | |
| | | | | | | | | | | | | | | | |
|
Other: 2.45% | |
Branch Banking & Trust Municipal Investment Trust Various States Class C (SIFMA Municipal Swap +1.05%) 144A±§ | | | 2.76 | | | | 12-31-2019 | | | | 9,600,000 | | | | 9,598,176 | |
Eaton Vance California Municipal Income Trust Preferred Shares 144Aøø§ | | | 3.21 | | | | 9-1-2019 | | | | 16,975,000 | | | | 16,976,019 | |
Eaton Vance Massachusetts Municipal Bond Fund Institutional MuniFund Term Preferred Shares (SIFMA Municipal Swap +1.00%) 144A±§ | | | 2.71 | | | | 7-1-2019 | | | | 6,475,000 | | | | 6,474,547 | |
Eaton Vance Municipal Bond Fund 2 Institutional MuniFund Term Preferred Shares (SIFMA Municipal Swap +1.05%) 144A±§ | | | 2.76 | | | | 7-1-2019 | | | | 9,950,000 | | | | 9,949,105 | |
Eaton Vance Pennsylvania Municipal Bond Fund Institutional MuniFund Term Preferred Shares (SIFMA Municipal Swap +1.00%) 144A± | | | 2.71 | | | | 7-1-2019 | | | | 6,000,000 | | | | 5,999,580 | |
Nuveen AMT-Free Quality Municipal Income Fund Preferred Shares 144Aøø§ | | | 1.84 | | | | 6-1-2040 | | | | 35,000,000 | | | | 35,000,000 | |
Nuveen California AMT-Free Quality Municipal Income Fund Preferred Shares 144Aøø§ | | | 2.01 | | | | 10-1-2047 | | | | 20,000,000 | | | | 20,000,000 | |
Nuveen New York Quality Municipal Income Fund Institutional MuniFund Term Preferred Shares 144Aøø | | | 1.98 | | | | 5-1-2047 | | | | 31,000,000 | | | | 31,000,000 | |
| |
Total Other (Cost $135,000,000) | | | | 134,997,427 | |
| | | | | | | | | | | | | | | | |
| | | | |
| | | Yield | | | | | | Shares | | | | |
| Short-Term Investments: 1.77% | | | | | | | | | | | | | | | | |
| | | | |
| Investment Companies: 1.77% | | | | | | | | | | | | | | | | |
Wells Fargo Municipal Cash Management Money Market Fund Institutional Class (l)(u)## | | | 1.49 | | | | | | | | 97,460,344 | | | | 97,567,551 | |
| | | | | | | | | | | | | | | | |
| | | | |
Total Short-Term Investments (Cost $97,566,218) | | | | | | | | | | | | | | | 97,567,551 | |
| | | | | | | | | | | | | | | | |
| | | | | | | | |
| Total investments in securities (Cost $5,475,019,370) | | | 98.89 | % | | | 5,454,450,233 | |
Other assets and liabilities, net | | | 1.11 | | | | 61,052,044 | |
| | | | | | | | |
| Total net assets | | | 100.00 | % | | $ | 5,515,502,277 | |
| | | | | | | | |
| (m) | The security is an auction-rate security which has an interest rate that resets at predetermined short-term intervals through a Dutch auction. The rate shown is the rate in effect at period end. |
| ø | Variable rate demand notes are subject to a demand feature which reduces the effective maturity. The maturity date shown represents the final maturity date of the security. The interest rate is determined and reset by the issuer daily, weekly, or monthly depending upon the terms of the security. The rate shown is the rate in effect at period end. |
| 144A | The security may be resold in transactions exempt from registration, normally to qualified institutional buyers, pursuant to Rule 144A under the Securities Act of 1933. |
| (n) | The auction to set the interest rate on the security failed at period end due to insufficient investor interest. A failed auction does not itself cause a default. |
| ± | Variable rate investment. The rate shown is the rate in effect at period end. |
| øø | The interest rate is determined and reset by the issuer periodically depending upon the terms of the security. The rate shown is the rate in effect at period end. |
| %% | The security is issued on a when-issued basis. |
| § | The security is subject to a demand feature which reduces the effective maturity. |
| (l) | The issuer of the security is an affiliated person of the Fund as defined in the Investment Company Act of 1940. |
| (u) | The rate represents the 7-day annualized yield at period end. |
| ## | All or a portion of this security is segregated for when-issued securities. |
The accompanying notes are an integral part of these financial statements.
| | | | |
| 30 | | Wells Fargo Ultra Short-Term Municipal Income Fund | | Portfolio of investments—December 31, 2017 (unaudited) |
Investments in Affiliates
An affiliated investment is an investment in which the Fund owns at least 5% of the outstanding voting shares of the issuer or as a result of other relationships, such as the Fund and the issuer having the same investment manager. Transactions with issuers that were either affiliates of the Fund at the beginning of the period or the end of the period were as follows:
| | | | | | | | | | | | | | | | | | | | | | | | | | | | | | | | | | | | |
| | | Shares,
beginning of
period | | | Shares
purchased | | | Shares
sold | | | Shares,
end of
period | | | Net
realized
gains
(losses) | | | Net
change in
unrealized
gains
(losses) | | | Income
from
affiliated
securities | | | Value,
end
of period | | | % of
net
assets | |
Short-Term Investments | | | | | | | | | | | | | | | | | | | | | | | | | | | | | | | | | | | | |
Investment Companies | | | | | | | | | | | | | | | | | | | | | | | | | | | | | | | | | | | | |
Wells Fargo Municipal Cash Management Money Market Fund Institutional Class | | | 60,013,304 | | | | 993,259,004 | | | | 955,811,964 | | | | 97,460,344 | | | $ | 28,435 | | | $ | (1,130 | ) | | $ | 315,571 | | | $ | 97,567,551 | | | | 1.77 | % |
The accompanying notes are an integral part of these financial statements.
| | | | | | |
| Statement of assets and liabilities—December 31, 2017 (unaudited) | | Wells Fargo Ultra Short-Term Municipal Income Fund | | | 31 | |
| | | | |
| | | | |
| |
Assets | | | | |
Investments in unaffiliated securities, at value (cost $5,377,453,152) | | $ | 5,356,882,682 | |
Investments in affiliated securities, at value (cost $97,566,218) | | | 97,567,551 | |
Cash | | | 8,806,334 | |
Receivable for investments sold | | | 121,575,821 | |
Receivable for Fund shares sold | | | 19,665,041 | |
Receivable for interest | | | 25,347,875 | |
Prepaid expenses and other assets | | | 29,593 | |
| | | | |
Total assets | | | 5,629,874,897 | |
| | | | |
| |
Liabilities | | | | |
Payable for Fund shares redeemed | | | 93,067,758 | |
Payable for investments purchased | | | 17,477,508 | |
Management fee payable | | | 1,222,415 | |
Dividends payable | | | 1,210,583 | |
Administration fees payable | | | 488,431 | |
Distribution fee payable | | | 13,349 | |
Trustees’ fees and expenses payable | | | 2,113 | |
Accrued expenses and other liabilities | | | 890,463 | |
| | | | |
Total liabilities | | | 114,372,620 | |
| | | | |
Total net assets | | $ | 5,515,502,277 | |
| | | | |
| |
NET ASSETS CONSIST OF | | | | |
Paid-in capital | | $ | 5,544,750,015 | |
Overdistributed net investment income | | | (483,889 | ) |
Accumulated net realized losses on investments | | | (8,194,712 | ) |
Net unrealized losses on investments | | | (20,569,137 | ) |
| | | | |
Total net assets | | $ | 5,515,502,277 | |
| | | | |
| |
COMPUTATION OF NET ASSET VALUE AND OFFERING PRICE PER SHARE | | | | |
Net assets – Class A | | $ | 816,983,743 | |
Shares outstanding – Class A1 | | | 85,381,051 | |
Net asset value per share – Class A | | | $9.57 | |
Maximum offering price per share – Class A2 | | | $9.77 | |
Net assets – Class C | | $ | 19,886,904 | |
Shares outstanding – Class C1 | | | 2,116,891 | |
Net asset value per share – Class C | | | $9.39 | |
Net assets – Administrator Class | | $ | 2,150,389,146 | |
Shares outstanding – Administrator Class1 | | | 224,777,349 | |
Net asset value per share – Administrator Class | | | $9.57 | |
Net assets – Institutional Class | | $ | 2,528,242,484 | |
Shares outstanding – Institutional Class1 | | | 264,188,162 | |
Net asset value per share – Institutional Class | | | $9.57 | |
| 1 | The Fund has an unlimited number of authorized shares. |
| 2 | Maximum offering price is computed as 100/98 of net asset value. On investments of $50,000 or more, the offering price is reduced. |
The accompanying notes are an integral part of these financial statements.
| | | | |
| 32 | | Wells Fargo Ultra Short-Term Municipal Income Fund | | Statement of operations—six months ended December 31, 2017 (unaudited) |
| | | | |
| | | | |
| |
Investment income | | | | |
Interest | | $ | 37,890,507 | |
Income from affiliated securities | | | 315,571 | |
| | | | |
Total investment income | | | 38,206,078 | |
| | | | |
| |
Expenses | | | | |
Management fee | | | 9,066,703 | |
Administration fees | | | | |
Class A | | | 716,220 | |
Class C | | | 17,510 | |
Administrator Class | | | 1,017,497 | |
Institutional Class | | | 1,043,679 | |
Shareholder servicing fees | | | | |
Class A | | | 1,119,094 | |
Class C | | | 27,360 | |
Administrator Class | | | 2,543,741 | |
Distribution fee | | | | |
Class C | | | 82,080 | |
Custody and accounting fees | | | 58,803 | |
Professional fees | | | 29,331 | |
Registration fees | | | 216,305 | |
Shareholder report expenses | | | 187,942 | |
Trustees’ fees and expenses | | | 10,411 | |
Other fees and expenses | | | 70,933 | |
| | | | |
Total expenses | | | 16,207,609 | |
Less: Fee waivers and/or expense reimbursements | | | (2,121,038 | ) |
| | | | |
Net expenses | | | 14,086,571 | |
| | | | |
Net investment income | | | 24,119,507 | |
| | | | |
| |
REALIZED AND UNREALIZED GAINS (LOSSES) ON INVESTMENTS | | | | |
| |
Net realized gains on: | | | | |
Unaffiliated securities | | | 645,964 | |
Affiliated securities | | | 28,435 | |
| | | | |
Net realized gains on investments | | | 674,399 | |
| | | | |
| |
Net change in unrealized gain (losses) on: | | | | |
Unaffiliated securities | | | (3,631,607 | ) |
Affiliated securities | | | (1,130 | ) |
| | | | |
Net change in unrealized gains (losses) on investments | | | (3,632,737 | ) |
| | | | |
Net realized and unrealized gains (losses) on investments | | | (2,958,338 | ) |
| | | | |
Net increase in net assets resulting from operations | | $ | 21,161,169 | |
| | | | |
The accompanying notes are an integral part of these financial statements.
| | | | | | |
| Statement of changes in net assets | | Wells Fargo Ultra Short-Term Municipal Income Fund | | | 33 | |
| | | | | | | | | | | | | | | | |
| | | Six months ended
December 31, 2017 (unaudited) | | | Year ended
June 30, 2017 | |
| | | | |
Operations | | | | | | | | | | | | | | | | |
Net investment income | | | | | | $ | 24,119,507 | | | | | | | $ | 42,653,161 | |
Net realized gains (losses) on investments | | | | | | | 674,399 | | | | | | | | (9,436,697 | ) |
Net change in unrealized gains (losses) on investments | | | | | | | (3,632,737 | ) | | | | | | | (21,304,005 | ) |
| | | | |
Net increase in net assets resulting from operations | | | | | | | 21,161,169 | | | | | | | | 11,912,459 | |
| | | | |
| | | | |
Distributions to shareholders from | | | | | | | | | | | | | | | | |
Net investment income | | | | | | | | | | | | | | | | |
Class A | | | | | | | (3,134,734 | ) | | | | | | | (6,520,540 | ) |
Class C | | | | | | | (1,766 | ) | | | | | | | (281 | ) |
Administrator Class | | | | | | | (7,892,731 | ) | | | | | | | (7,844,623 | ) |
Institutional Class | | | | | | | (13,088,461 | ) | | | | | | | (28,287,401 | ) |
Net realized gains | | | | | | | | | | | | | | | | |
Class A | | | | | | | 0 | | | | | | | | (99,615 | ) |
Class C | | | | | | | 0 | | | | | | | | (2,471 | ) |
Administrator Class | | | | | | | 0 | | | | | | | | (112,414 | ) |
Institutional Class | | | | | | | 0 | | | | | | | | (253,274 | ) |
| | | | |
Total distributions to shareholders | | | | | | | (24,117,692 | ) | | | | | | | (43,120,619 | ) |
| | | | |
| | | | |
Capital share transactions | | | Shares | | | | | | | | Shares | | | | | |
Proceeds from shares sold | | | | | | | | | | | | | | | | |
Class A | | | 10,681,144 | | | | 102,344,960 | | | | 36,302,461 | | | | 348,026,490 | |
Class C | | | 16,398 | | | | 154,233 | | | | 212,003 | | | | 1,993,924 | |
Administrator Class | | | 34,202,534 | | | | 327,672,902 | | | | 215,642,662 | | | | 2,067,326,776 | |
Institutional Class | | | 131,655,757 | | | | 1,261,778,278 | | | | 351,117,791 | | | | 3,367,207,776 | |
| | | | |
| | | | | | | 1,691,950,373 | | | | | | | | 5,784,554,966 | |
| | | | |
Reinvestment of distributions | | | | | | | | | | | | | | | | |
Class A | | | 314,413 | | | | 3,012,473 | | | | 669,913 | | | | 6,418,030 | |
Class C | | | 140 | | | | 1,316 | | | | 247 | | | | 2,319 | |
Administrator Class | | | 815,599 | | | | 7,811,519 | | | | 825,123 | | | | 7,894,711 | |
Institutional Class | | | 811,763 | | | | 7,777,615 | | | | 1,774,130 | | | | 17,010,290 | |
| | | | |
| | | | | | | 18,602,923 | | | | | | | | 31,325,350 | |
| | | | |
Payment for shares redeemed | | | | | | | | | | | | | | | | |
Class A | | | (27,053,957 | ) | | | (259,265,371 | ) | | | (61,210,799 | ) | | | (586,282,444 | ) |
Class C | | | (414,933 | ) | | | (3,904,453 | ) | | | (1,058,562 | ) | | | (9,967,002 | ) |
Administrator Class | | | (13,644,689 | ) | | | (130,740,985 | ) | | | (36,554,416 | ) | | | (350,037,312 | ) |
Institutional Class | | | (151,653,055 | ) | | | (1,453,327,087 | ) | | | (491,434,725 | ) | | | (4,712,668,313 | ) |
| | | | |
| | | | | | | (1,847,237,896 | ) | | | | | | | (5,658,955,071 | ) |
| | | | |
Net increase (decrease) in net assets resulting from capital share transactions | | | | | | | (136,684,600 | ) | | | | | | | 156,925,245 | |
| | | | |
Total increase (decrease) in net assets | | | | | | | (139,641,123 | ) | | | | | | | 125,717,085 | |
| | | | |
| | | | |
Net assets | | | | | | | | | | | | | | | | |
Beginning of period | | | | | | | 5,655,143,400 | | | | | | | | 5,529,426,315 | |
| | | | |
End of period | | | | | | $ | 5,515,502,277 | | | | | | | $ | 5,655,143,400 | |
| | | | |
Overdistributed net investment income | | | | | | $ | (483,889 | ) | | | | | | $ | (485,704 | ) |
| | | | |
The accompanying notes are an integral part of these financial statements.
| | | | |
| 34 | | Wells Fargo Ultra Short-Term Municipal Income Fund | | Financial highlights |
(For a share outstanding throughout each period)
| | | | | | | | | | | | | | | | | | | | | | | | |
| | | Six months ended
December 31, 2017 (unaudited) | | | Year ended June 30 | |
| CLASS A | | | 2017 | | | 2016 | | | 20151 | | | 20141 | | | 20131 | |
Net asset value, beginning of period | | | $9.57 | | | | $9.63 | | | | $9.61 | | | | $9.64 | | | | $9.64 | | | | $9.64 | |
Net investment income | | | 0.03 | | | | 0.06 | | | | 0.04 | | | | 0.02 | | | | 0.04 | | | | 0.04 | |
Net realized and unrealized gains (losses) on investments | | | 0.00 | 2 | | | (0.06 | ) | | | 0.02 | | | | (0.03 | ) | | | 0.00 | 2 | | | (0.02 | ) |
| | | | | | | | | | | | | | | | | | | | | | | | |
Total from investment operations | | | 0.03 | | | | 0.00 | | | | 0.06 | | | | (0.01 | ) | | | 0.04 | | | | 0.02 | |
Distributions to shareholders from | | | | | | | | | | | | | | | | | | | | | | | | |
Net investment income | | | (0.03 | ) | | | (0.06 | ) | | | (0.04 | ) | | | (0.02 | ) | | | (0.04 | ) | | | (0.02 | ) |
Net realized gains | | | 0.00 | | | | (0.00 | )2 | | | (0.00 | )2 | | | (0.00 | )2 | | | (0.00 | )2 | | | 0.00 | |
| | | | | | | | | | | | | | | | | | | | | | | | |
Total distributions to shareholders | | | (0.03 | ) | | | (0.06 | ) | | | (0.04 | ) | | | (0.02 | ) | | | (0.04 | ) | | | (0.02 | ) |
Net asset value, end of period | | | $9.57 | | | | $9.57 | | | | $9.63 | | | | $9.61 | | | | $9.64 | | | | $9.64 | |
Total return3 | | | 0.35 | % | | | (0.04 | )% | | | 0.61 | % | | | (0.07 | )% | | | 0.35 | % | | | 0.31 | % |
Ratios to average net assets (annualized) | | | | | | | | | | | | | | | | | | | | | | | | |
Gross expenses | | | 0.76 | % | | | 0.75 | % | | | 0.75 | % | | | 0.75 | % | | | 0.75 | % | | | 0.75 | % |
Net expenses | | | 0.67 | % | | | 0.67 | % | | | 0.67 | % | | | 0.67 | % | | | 0.67 | % | | | 0.67 | % |
Net investment income | | | 0.70 | % | | | 0.57 | % | | | 0.38 | % | | | 0.23 | % | | | 0.34 | % | | | 0.32 | % |
Supplemental data | | | | | | | | | | | | | | | | | | | | | | | | |
Portfolio turnover rate | | | 27 | % | | | 56 | % | | | 41 | % | | | 44 | % | | | 51 | % | | | 65 | % |
Net assets, end of period (000s omitted) | | | $816,984 | | | | $971,189 | | | | $1,209,818 | | | | $961,485 | | | | $1,582,112 | | | | $1,914,970 | |
| 1 | A one-for-two share split took place after the close of business on June 12, 2015 for all classes of the Fund. The per share information has been adjusted to give effect to this transaction. |
| 2 | Amount is less than $0.005. |
| 3 | Total return calculations do not include any sales charges. Returns for periods of less than one year are not annualized. |
The accompanying notes are an integral part of these financial statements.
| | | | | | |
| Financial highlights | | Wells Fargo Ultra Short-Term Municipal Income Fund | | | 35 | |
(For a share outstanding throughout each period)
| | | | | | | | | | | | | | | | | | | | | | | | |
| | | Six months ended
December 31, 2017 (unaudited) | | | Year ended June 30 | |
| CLASS C | | | 2017 | | | 2016 | | | 20151 | | | 20141 | | | 20131 | |
Net asset value, beginning of period | | | $9.40 | | | | $9.47 | | | | $9.49 | | | | $9.58 | | | | $9.62 | | | | $9.64 | |
Net investment loss | | | (0.00 | )2,3 | | | (0.02 | )2 | | | (0.04 | )2 | | | (0.11 | ) | | | (0.04 | )2 | | | (0.06 | ) |
Net realized and unrealized gains (losses) on investments | | | (0.01 | ) | | | (0.05 | ) | | | 0.02 | | | | 0.02 | | | | 0.00 | 3 | | | 0.04 | |
| | | | | | | | | | | | | | | | | | | | | | | | |
Total from investment operations | | | (0.01 | ) | | | (0.07 | ) | | | (0.02 | ) | | | (0.09 | ) | | | (0.04 | ) | | | (0.02 | ) |
Distributions to shareholders from | | | | | | | | | | | | | | | | | | | | | | | | |
Net investment income | | | (0.00 | )3 | | | (0.00 | )3 | | | 0.00 | | | | 0.00 | | | | 0.00 | | | | 0.00 | |
Net realized gains | | | 0.00 | | | | (0.00 | )3 | | | (0.00 | )3 | | | (0.00 | )3 | | | (0.00 | )3 | | | 0.00 | |
| | | | | | | | | | | | | | | | | | | | | | | | |
Total distributions to shareholders | | | (0.00 | )3 | | | (0.00 | )3 | | | (0.00 | )3 | | | (0.00 | )3 | | | (0.00 | )3 | | | 0.00 | |
Net asset value, end of period | | | $9.39 | | | | $9.40 | | | | $9.47 | | | | $9.49 | | | | $9.58 | | | | $9.62 | |
Total return4 | | | (0.10 | )% | | | (0.73 | )% | | | (0.19 | )% | | | (0.93 | )% | | | (0.40 | )% | | | (0.21 | )% |
Ratios to average net assets (annualized) | | | | | | | | | | | | | | | | | | | | | | | | |
Gross expenses | | | 1.51 | % | | | 1.50 | % | | | 1.50 | % | | | 1.50 | % | | | 1.50 | % | | | 1.50 | % |
Net expenses | | | 1.42 | % | | | 1.42 | % | | | 1.42 | % | | | 1.42 | % | | | 1.42 | % | | | 1.42 | % |
Net investment loss | | | (0.05 | )% | | | (0.18 | )% | | | (0.37 | )% | | | (0.52 | )% | | | (0.41 | )% | | | (0.43 | )% |
Supplemental data | | | | | | | | | | | | | | | | | | | | | | | | |
Portfolio turnover rate | | | 27 | % | | | 56 | % | | | 41 | % | | | 44 | % | | | 51 | % | | | 65 | % |
Net assets, end of period (000s omitted) | | | $19,887 | | | | $23,650 | | | | $31,837 | | | | $42,289 | | | | $59,352 | | | | $89,148 | |
| 1 | A one-for-two share split took place after the close of business on June 12, 2015 for all classes of the Fund. The per share information has been adjusted to give effect to this transaction. |
| 2 | Calculated based upon average shares outstanding |
| 3 | Amount is less than $0.005. |
| 4 | Total return calculations do not include any sales charges. Returns for periods of less than one year are not annualized. |
The accompanying notes are an integral part of these financial statements.
| | | | |
| 36 | | Wells Fargo Ultra Short-Term Municipal Income Fund | | Financial highlights |
(For a share outstanding throughout each period)
| | | | | | | | | | | | | | | | | | | | | | | | |
| | | Six months ended
December 31, 2017 (unaudited) | | | Year ended June 30 | |
| ADMINISTRATOR CLASS | | | 2017 | | | 2016 | | | 20151 | | | 20141 | | | 20131 | |
Net asset value, beginning of period | | | $9.57 | | | | $9.63 | | | | $9.61 | | | | $9.64 | | | | $9.64 | | | | $9.64 | |
Net investment income | | | 0.04 | | | | 0.06 | | | | 0.04 | | | | 0.03 | | | | 0.04 | | | | 0.04 | |
Net realized and unrealized gains (losses) on investments | | | 0.00 | 2 | | | (0.06 | ) | | | 0.02 | | | | (0.03 | ) | | | 0.00 | 2 | | | 0.00 | 2 |
| | | | | | | | | | | | | | | | | | | | | | | | |
Total from investment operations | | | 0.04 | | | | 0.00 | | | | 0.06 | | | | 0.00 | | | | 0.04 | | | | 0.04 | |
Distributions to shareholders from | | | | | | | | | | | | | | | | | | | | | | | | |
Net investment income | | | (0.04 | ) | | | (0.06 | ) | | | (0.04 | ) | | | (0.03 | ) | | | (0.04 | ) | | | (0.04 | ) |
Net realized gains | | | 0.00 | | | | (0.00 | )2 | | | (0.00 | )2 | | | (0.00 | )2 | | | (0.00 | )2 | | | 0.00 | |
| | | | | | | | | | | | | | | | | | | | | | | | |
Total distributions to shareholders | | | (0.04 | ) | | | (0.06 | ) | | | (0.04 | ) | | | (0.03 | ) | | | (0.04 | ) | | | (0.04 | ) |
Net asset value, end of period | | | $9.57 | | | | $9.57 | | | | $9.63 | | | | $9.61 | | | | $9.64 | | | | $9.64 | |
Total return3 | | | 0.39 | % | | | 0.03 | % | | | 0.68 | % | | | 0.00 | % | | | 0.42 | % | | | 0.38 | % |
Ratios to average net assets (annualized) | | | | | | | | | | | | | | | | | | | | | | | | |
Gross expenses | | | 0.70 | % | | | 0.70 | % | | | 0.68 | % | | | 0.69 | % | | | 0.69 | % | | | 0.69 | % |
Net expenses | | | 0.60 | % | | | 0.60 | % | | | 0.60 | % | | | 0.60 | % | | | 0.60 | % | | | 0.60 | % |
Net investment income | | | 0.78 | % | | | 0.69 | % | | | 0.45 | % | | | 0.30 | % | | | 0.41 | % | | | 0.39 | % |
Supplemental data | | | | | | | | | | | | | | | | | | | | | | | | |
Portfolio turnover rate | | | 27 | % | | | 56 | % | | | 41 | % | | | 44 | % | | | 51 | % | | | 65 | % |
Net assets, end of period (000s omitted) | | | $2,150,389 | | | | $1,946,987 | | | | $226,125 | | | | $328,134 | | | | $407,791 | | | | $482,711 | |
| 1 | A one-for-two share split took place after the close of business on June 12, 2015 for all classes of the Fund. The per share information has been adjusted to give effect to this transaction. |
| 2 | Amount is less than $0.005. |
| 3 | Returns for periods of less than one year are not annualized. |
The accompanying notes are an integral part of these financial statements.
| | | | | | |
| Financial highlights | | Wells Fargo Ultra Short-Term Municipal Income Fund | | | 37 | |
(For a share outstanding throughout each period)
| | | | | | | | | | | | | | | | | | | | | | | | |
| | | Six months ended
December 31, 2017 (unaudited) | | | Year ended June 30 | |
| INSTITUTIONAL CLASS | | | 2017 | | | 2016 | | | 20151 | | | 20141 | | | 20131 | |
Net asset value, beginning of period | | | $9.58 | | | | $9.63 | | | | $9.61 | | | | $9.64 | | | | $9.64 | | | | $9.64 | |
Net investment income | | | 0.05 | | | | 0.08 | 2 | | | 0.07 | | | | 0.05 | | | | 0.06 | | | | 0.06 | |
Net realized and unrealized gains (losses) on investments | | | (0.01 | ) | | | (0.05 | ) | | | 0.02 | | | | (0.03 | ) | | | 0.00 | 3 | | | 0.00 | 3 |
| | | | | | | | | | | | | | | | | | | | | | | | |
Total from investment operations | | | 0.04 | | | | 0.03 | | | | 0.09 | | | | 0.02 | | | | 0.06 | | | | 0.06 | |
Distributions to shareholders from | | | | | | | | | | | | | | | | | | | | | | | | |
Net investment income | | | (0.05 | ) | | | (0.08 | ) | | | (0.07 | ) | | | (0.05 | ) | | | (0.06 | ) | | | (0.06 | ) |
Net realized gains | | | 0.00 | | | | (0.00 | )3 | | | (0.00 | )3 | | | (0.00 | )3 | | | (0.00 | )3 | | | 0.00 | |
| | | | | | | | | | | | | | | | | | | | | | | | |
Total distributions to shareholders | | | (0.05 | ) | | | (0.08 | ) | | | (0.07 | ) | | | (0.05 | ) | | | (0.06 | ) | | | (0.06 | ) |
Net asset value, end of period | | | $9.57 | | | | $9.58 | | | | $9.63 | | | | $9.61 | | | | $9.64 | | | | $9.64 | |
Total return4 | | | 0.40 | % | | | 0.36 | % | | | 0.91 | % | | | 0.23 | % | | | 0.65 | % | | | 0.61 | % |
Ratios to average net assets (annualized) | | | | | | | | | | | | | | | | | | | | | | | | |
Gross expenses | | | 0.43 | % | | | 0.42 | % | | | 0.42 | % | | | 0.42 | % | | | 0.42 | % | | | 0.42 | % |
Net expenses | | | 0.37 | % | | | 0.37 | % | | | 0.37 | % | | | 0.37 | % | | | 0.37 | % | | | 0.37 | % |
Net investment income | | | 1.00 | % | | | 0.86 | % | | | 0.68 | % | | | 0.54 | % | | | 0.64 | % | | | 0.61 | % |
Supplemental data | | | | | | | | | | | | | | | | | | | | | | | | |
Portfolio turnover rate | | | 27 | % | | | 56 | % | | | 41 | % | | | 44 | % | | | 51 | % | | | 65 | % |
Net assets, end of period (000s omitted) | | | $2,528,242 | | | | $2,713,317 | | | | $4,061,647 | | | | $3,930,234 | | | | $3,403,244 | | | | $3,085,284 | |
| 1 | A one-for-two share split took place after the close of business on June 12, 2015 for all classes of the Fund. The per share information has been adjusted to give effect to this transaction. |
| 2 | Calculated based upon average shares outstanding |
| 3 | Amount is less than $0.005. |
| 4 | Returns for periods of less than one year are not annualized. |
The accompanying notes are an integral part of these financial statements.
| | | | |
| 38 | | Wells Fargo Ultra Short-Term Municipal Income Fund | | Notes to financial statements (unaudited) |
1. ORGANIZATION
Wells Fargo Funds Trust (the “Trust”), a Delaware statutory trust organized on March 10, 1999, is an open-end management investment company registered under the Investment Company Act of 1940, as amended (the “1940 Act”). As an investment company, the Trust follows the accounting and reporting guidance in Financial Accounting Standards Board Accounting Standards Codification Topic 946, Financial Services – Investment Companies. These financial statements report on the Wells Fargo Ultra Short-Term Municipal Income Fund (the “Fund”) which is a diversified series of the Trust.
2. SIGNIFICANT ACCOUNTING POLICIES
The following significant accounting policies, which are consistently followed in the preparation of the financial statements of the Fund, are in conformity with U.S. generally accepted accounting principles which require management to make estimates and assumptions that affect the reported amounts of assets and liabilities, disclosure of contingent assets and liabilities at the date of the financial statements, and the reported amounts of revenues and expenses during the reporting period. Actual results could differ from those estimates.
Securities valuation
All investments are valued each business day as of the close of regular trading on the New York Stock Exchange (generally 4 p.m. Eastern Time), although the Fund may deviate from this calculation time under unusual or unexpected circumstances.
Debt securities are valued at the evaluated bid price provided by an independent pricing service or, if a reliable price is not available, the quoted bid price from an independent broker-dealer.
Futures that are listed on a foreign or domestic exchange or market are valued at the official closing price or, if none, the last sales price.
Investments in registered open-end investment companies are valued at net asset value.
Investments which are not valued using any of the methods discussed above are valued at their fair value, as determined in good faith by the Board of Trustees of the Fund. The Board of Trustees has established a Valuation Committee comprised of the Trustees and has delegated to it the authority to take any actions regarding the valuation of portfolio securities that the Valuation Committee deems necessary or appropriate, including determining the fair value of portfolio securities, unless the determination has been delegated to the Management Valuation Team of Wells Fargo Funds Management, LLC (“Funds Management”). The Board of Trustees retains the authority to make or ratify any valuation decisions or approve any changes to the Valuation Procedures as it deems appropriate. On a quarterly basis, the Board of Trustees receives reports on any valuation actions taken by the Valuation Committee or the Management Valuation Team which may include items for ratification.
Valuations of fair valued securities are compared to the next actual sales price when available, or other appropriate market values, to assess the continued appropriateness of the fair valuation methodologies used. These securities are fair valued on a day-to-day basis, taking into consideration changes to appropriate market information and any significant changes to the inputs considered in the valuation process until there is a readily available price provided on an exchange or by an independent pricing service. Valuations received from an independent pricing service or independent broker-dealer quotes are periodically validated by comparisons to most recent trades and valuations provided by other independent pricing services in addition to the review of prices by the manager and/or subadviser. Unobservable inputs used in determining fair valuations are identified based on the type of security, taking into consideration factors utilized by market participants in valuing the investment, knowledge about the issuer and the current market environment.
When-issued transactions
The Fund may purchase securities on a forward commitment or when-issued basis. The Fund records a when-issued transaction on the trade date and will segregate assets in an amount at least equal in value to the Fund’s commitment to purchase when-issued securities. Securities purchased on a when-issued basis are marked-to-market daily and the Fund begins earning interest on the settlement date. Losses may arise due to changes in the market value of the underlying securities or if the counterparty does not perform under the contract.
Futures contracts
The Fund is subject to interest rate risk in the normal course of pursuing its investment objectives. The Fund may buy and sell futures contracts in order to gain exposure to, or protect against, changes in interest rates. The primary risks associated with the use of futures contracts are the imperfect correlation between changes in market values of securities held by the Fund and the prices of futures contracts, and the possibility of an illiquid market.
The aggregate principal amounts of the contracts are not recorded in the financial statements. Fluctuations in the value of the contracts are recorded in the Statement of Assets and Liabilities as an asset or liability and in the Statement of Operations as
| | | | | | |
| Notes to financial statements (unaudited) | | Wells Fargo Ultra Short-Term Municipal Income Fund | | | 39 | |
unrealized gains or losses until the contracts are closed, at which point they are recorded as net realized gains or losses on futures contracts. With futures contracts, there is minimal counterparty risk to the Fund since futures are exchange traded and the exchange’s clearinghouse, as counterparty to all exchange traded futures, guarantees the futures against default.
Security transactions and income recognition
Securities transactions are recorded on a trade date basis. Realized gains or losses are recorded on the basis of identified cost.
Interest income is accrued daily and bond discounts are accreted and premiums are amortized daily based on the effective interest method. To the extent debt obligations are placed on non-accrual status, any related interest income may be reduced by writing off interest receivables when the collection of all or a portion of interest has been determined to be doubtful based on consistently applied procedures and the fair value has decreased. If the issuer subsequently resumes interest payments or when the collectability of interest is reasonably assured, the debt obligation is removed from non-accrual status.
Distributions to shareholders
Distributions to shareholders from net investment income are accrued daily and paid monthly. Distributions from net realized gains, if any, are recorded on the ex-dividend date. Such distributions are determined in accordance with income tax regulations and may differ from U.S. generally accepted accounting principles. Dividend sources are estimated at the time of declaration. The tax character of distributions is determined as of the Fund’s fiscal year end. Therefore, a portion of the Fund’s distributions made prior the Fund’s fiscal year end may be categorized as a tax return of capital.
Federal and other taxes
The Fund intends to continue to qualify as a regulated investment company by distributing substantially all of its investment company taxable and tax-exempt income and any net realized capital gains (after reduction for capital loss carryforwards) sufficient to relieve it from all, or substantially all, federal income taxes. Accordingly, no provision for federal income taxes was required.
The Fund’s income and federal excise tax returns and all financial records supporting those returns for the prior three fiscal years are subject to examination by the federal and Delaware revenue authorities. Management has analyzed the Fund’s tax positions taken on federal, state, and foreign tax returns for all open tax years and does not believe that there are any uncertain tax positions that require recognition of a tax liability.
As of December 31, 2017, the aggregate cost of all investments for federal income tax purposes was $5,475,004,123 and the unrealized gains (losses) consisted of:
| | | | |
Gross unrealized gains | | $ | 4,596,192 | |
Gross unrealized losses | | | (25,150,082 | ) |
Net unrealized losses | | $ | (20,553,890 | ) |
As of June 30, 2017, the Fund had current year deferred post-October capital losses consisting of $3,906,834 in short-term losses and $4,887,432 in long-term losses which were recognized on the first day of the current fiscal year.
Class allocations
The separate classes of shares offered by the Fund differ principally in applicable sales charges, distribution, shareholder servicing, and administration fees. Class specific expenses are charged directly to that share class. Investment income, common expenses, and realized and unrealized gains (losses) on investments are allocated daily to each class of shares based on the relative proportion of net assets of each class.
3. FAIR VALUATION MEASUREMENTS
Fair value measurements of investments are determined within a framework that has established a fair value hierarchy based upon the various data inputs utilized in determining the value of the Fund’s investments. The three-level hierarchy gives the highest priority to unadjusted quoted prices in active markets for identical assets or liabilities (Level 1) and the lowest priority to unobservable inputs (Level 3). The Fund’s investments are classified within the fair value hierarchy based on the lowest level of input that is significant to the fair value measurement. The inputs are summarized into three broad levels as follows:
| ∎ | | Level 1 – quoted prices in active markets for identical securities |
| ∎ | | Level 2 – other significant observable inputs (including quoted prices for similar securities, interest rates, prepayment speeds, credit risk, etc.) |
| ∎ | | Level 3 – significant unobservable inputs (including the Fund’s own assumptions in determining the fair value of investments) |
| | | | |
| 40 | | Wells Fargo Ultra Short-Term Municipal Income Fund | | Notes to financial statements (unaudited) |
The inputs or methodologies used for valuing investments in securities are not necessarily an indication of the risk associated with investing in those securities.
The following is a summary of the inputs used in valuing the Fund’s assets and liabilities as of December 31, 2017:
| | | | | | | | | | | | | | | | |
| | | Quoted prices
(Level 1) | | | Other significant
observable inputs
(Level 2) | | | Significant
unobservable inputs (Level 3) | | | Total | |
Assets | | | | | | | | | | | | | | | | |
Investments in: | | | | | | | | | | | | | | | | |
| | | | |
Municipal obligations | | $ | 0 | | | $ | 5,221,885,255 | | | $ | 0 | | | $ | 5,221,885,255 | |
| | | | |
Other | | | 0 | | | | 134,997,427 | | | | 0 | | | | 134,997,427 | |
| | | | |
Short-term investments | | | | | | | | | | | | | | | | |
Investment companies | | | 97,567,551 | | | | 0 | | | | 0 | | | | 97,567,551 | |
Total assets | | $ | 97,567,551 | | | $ | 5,356,882,682 | | | $ | 0 | | | $ | 5,454,450,233 | |
The Fund recognizes transfers between levels within the fair value hierarchy at the end of the reporting period. At December 31, 2017, the Fund did not have any transfers into/out of Level 1, Level 2, or Level 3.
4. TRANSACTIONS WITH AFFILIATES
Management fee
Funds Management, an indirect wholly owned subsidiary of Wells Fargo & Company (“Wells Fargo”), is the manager of the Fund and provides advisory and fund-level administrative services under an investment management agreement. Under the investment management agreement, Funds Management is responsible for, among other services, implementing the investment objectives and strategies of the Fund, supervising the subadviser, providing fund-level administrative services in connection with the Fund’s operations, and providing any other fund-level administrative services reasonably necessary for the operation of the Fund. As compensation for its services under the investment management agreement, Funds Management is entitled to receive an annual management fee starting at 0.35% and declining to 0.255% as the average daily net assets of the Fund increase. For the six months ended December 31, 2017, the management fee was equivalent to an annual rate of 0.33% of the Fund’s average daily net assets.
Funds Management has retained the services of a subadviser to provide daily portfolio management to the Fund. The fee for subadvisory services is borne by Funds Management. Wells Capital Management Incorporated, an affiliate of Funds Management and an indirect wholly owned subsidiary of Wells Fargo, is the subadviser to the Fund and is entitled to receive a fee from Funds Management at an annual rate starting at 0.15% and declining to 0.05% as the average daily net assets of the Fund increase.
Administration fees
Under a class-level administration agreement, Funds Management provides class-level administrative services to the Fund, which includes paying fees and expenses for services provided by the transfer agent, sub-transfer agents, omnibus account servicers and record-keepers. As compensation for its services under the class-level administration agreement, Funds Management receives an annual fee which is calculated based on the average daily net assets of each class as follows:
| | | | |
| | | Class level
administration fee | |
Class A, Class C | | | 0.16 | % |
Administrator Class | | | 0.10 | |
Institutional Class | | | 0.08 | |
Funds Management has contractually waived and/or reimbursed management and administration fees to the extent necessary to maintain certain net operating expense ratios for the Fund. Waiver of fees and/or reimbursement of expenses by Funds Management were made first from fund level expenses on a proportionate basis and then from class specific expenses. Funds Management has committed through October 31, 2018 to waive fees and/or reimburse expenses to the extent necessary to cap the Fund’s expenses at 0.67% for Class A shares, 1.42% for Class C shares, 0.60%
| | | | | | |
| Notes to financial statements (unaudited) | | Wells Fargo Ultra Short-Term Municipal Income Fund | | | 41 | |
for Administrator Class shares, and 0.37% for Institutional Class shares. After this time, the cap may be increased or the commitment to maintain the cap may be terminated only with the approval of the Board of Trustees.
Distribution fee
The Trust has adopted a distribution plan for Class C shares of the Fund pursuant to Rule 12b-1 under the 1940 Act. A distribution fee is charged to Class C shares and paid to Wells Fargo Funds Distributor, LLC (“Funds Distributor”), the principal underwriter, at an annual rate of 0.75% of the average daily net assets of Class C shares.
In addition, Funds Distributor is entitled to receive the front-end sales charge from the purchase of Class A shares and a contingent deferred sales charge on the redemption of certain Class A shares. Funds Distributor is also entitled to receive the contingent deferred sales charges from redemptions of Class C shares. For the six months ended December 31, 2017, Funds Distributor received $1,007 from the sale of Class A shares. No contingent deferred sales charges were incurred by Class A and Class C shares for the six months ended December 31, 2017.
Shareholder servicing fees
The Trust has entered into contracts with one or more shareholder servicing agents, whereby Class A, Class C, and Administrator Class of the Fund are charged a fee at an annual rate of 0.25% of the average daily net assets of each respective class.
A portion of these total shareholder servicing fees were paid to affiliates of Wells Fargo.
Interfund transactions
The Fund may purchase or sell portfolio investment securities to certain other Wells Fargo affiliates pursuant to Rule 17a-7 under the 1940 Act and under procedures adopted by the Board of Trustees. The procedures have been designed to ensure that these interfund transactions, which do not incur broker commissions, are effected at current market prices. Pursuant to these procedures, the Fund had $591,375,000 and $56,090,000 in interfund purchases and sales, respectively, during the six months ended December 31, 2017.
5. INVESTMENT PORTFOLIO TRANSACTIONS
Purchases and sales of investments, excluding U.S. government obligations (if any) and short-term securities, for the six months ended December 31, 2017 were $1,443,584,015 and $861,506,833, respectively.
6. BANK BORROWINGS
The Trust (excluding the money market funds and certain other funds) and Wells Fargo Variable Trust are parties to a $280,000,000 revolving credit agreement whereby the Fund is permitted to use bank borrowings for temporary or emergency purposes, such as to fund shareholder redemption requests. Interest under the credit agreement is charged to the Fund based on a borrowing rate equal to the higher of the Federal Funds rate in effect on that day plus 1.25% or the overnight LIBOR rate in effect on that day plus 1.25%. In addition, an annual commitment fee equal to 0.25% of the unused balance is allocated to each participating fund. Prior to August 29, 2017, the revolving credit agreement amount was $250,000,000.
For the six months ended December 31, 2017, there were no borrowings by the Fund under the agreement.
7. INDEMNIFICATION
Under the Trust’s organizational documents, the officers and Trustees have been granted certain indemnification rights against certain liabilities that may arise out of performance of their duties to the Trust. Additionally, in the normal course of business, the Trust may enter into contracts with service providers that contain a variety of indemnification clauses. The Trust’s maximum exposure under these arrangements is dependent on future claims that may be made against the Fund and, therefore, cannot be estimated.
| | | | |
| 42 | | Wells Fargo Ultra Short-Term Municipal Income Fund | | Other information (unaudited) |
PROXY VOTING INFORMATION
A description of the policies and procedures that the Fund uses to determine how to vote proxies relating to portfolio securities is available, upon request, by calling 1-800-222-8222, visiting our website at wellsfargofunds.com, or visiting the SEC website at sec.gov. Information regarding how the Fund voted proxies relating to portfolio securities during the most recent 12-month period ended June 30 is available on the Fund’s website at wellsfargofunds.com or by visiting the SEC website at sec.gov.
PORTFOLIO HOLDINGS INFORMATION
The complete portfolio holdings for the Fund are publicly available monthly on the Fund’s website (wellsfargofunds.com), on a one-month delayed basis. In addition, top ten holdings information (excluding derivative positions) for the Fund is publicly available on the Fund’s website on a monthly, seven-day or more delayed basis. The Fund files its complete schedule of portfolio holdings with the SEC for the first and third quarters of each fiscal year on Form N-Q, which is available by visiting the SEC website at sec.gov. In addition, the Fund’s Form N-Q may be reviewed and copied at the SEC’s Public Reference Room in Washington, DC, and at regional offices in New York City, at 233 Broadway, and in Chicago, at 175 West Jackson Boulevard, Suite 900. Information about the Public Reference Room may be obtained by calling 1-800-SEC-0330.
| | | | | | |
| Other information (unaudited) | | Wells Fargo Ultra Short-Term Municipal Income Fund | | | 43 | |
BOARD OF TRUSTEES AND OFFICERS
Each of the Trustees and Officers1 listed in the table below acts in identical capacities for each fund in the Wells Fargo family of funds, which consists of 153 mutual funds comprising the Wells Fargo Funds Trust, Wells Fargo Variable Trust, Wells Fargo Master Trust and four closed-end funds (collectively the “Fund Complex”). This table should be read in conjunction with the Prospectus and the Statement of Additional Information2. The mailing address of each Trustee and Officer is 525 Market Street, 12th Floor, San Francisco, CA 94105. Each Trustee and Officer serves an indefinite term, however, each Trustee serves such term until reaching the mandatory retirement age established by the Trustees.
Independent Trustees
| | | | | | |
Name and year of birth | | Position held and length of service* | | Principal occupations during past five years or longer | | Current other
public company or
investment company
directorships |
William R. Ebsworth (Born 1957) | | Trustee, since 2015 | | Retired. From 1984 to 2013, equities analyst, portfolio manager, research director and chief investment officer at Fidelity Management and Research Company in Boston, Tokyo, and Hong Kong, and retired in 2013 as Chief Investment Officer of Fidelity Strategic Advisers, Inc. where he led a team of investment professionals managing client assets. Prior thereto, Board member of Hong Kong Securities Clearing Co., Hong Kong Options Clearing Corp., the Thailand International Fund, Ltd., Fidelity Investments Life Insurance Company, and Empire Fidelity Investments Life Insurance Company. Board member of the Forté Foundation (non-profit organization) and the Vincent Memorial Hospital Endowment (non-profit organization), where he serves on the Investment Committee and as a Chair of the Audit Committee. Mr. Ebsworth is a CFA® charterholder. | | Asset Allocation Trust |
Jane A. Freeman** (Born 1953) | | Trustee, since 2015; Chair Liaison, since 2018 | | Retired. From 2012 to 2014 and 1999 to 2008, Chief Financial Officer of Scientific Learning Corporation. From 2008 to 2012, Ms. Freeman provided consulting services related to strategic business projects. Prior to 1999, Portfolio Manager at Rockefeller & Co. and Scudder, Stevens & Clark. Board member of the Harding Loevner Funds from 1996 to 2014, serving as both Lead Independent Director and chair of the Audit Committee. Board member of the Russell Exchange Traded Funds Trust from 2011 to 2012 and the chair of the Audit Committee. Ms. Freeman is a Board Member of Ruth Bancroft Garden (non-profit organization) and the Glimmerglass Festival. She is also an inactive Chartered Financial Analyst. | | Asset Allocation Trust |
Peter G. Gordon*** (Born 1942) | | Trustee, since 1998; Chairman, from 2005 to 2017 | | Co-Founder, Retired Chairman, President and CEO of Crystal Geyser Water Company. Trustee Emeritus, Colby College. | | Asset Allocation Trust |
Isaiah Harris, Jr. (Born 1952) | | Trustee, since 2009 | | Retired. Chairman of the Board of CIGNA Corporation since 2009, and Director since 2005. From 2003 to 2011, Director of Deluxe Corporation. Prior thereto, President and CEO of BellSouth Advertising and Publishing Corp. from 2005 to 2007, President and CEO of BellSouth Enterprises from 2004 to 2005 and President of BellSouth Consumer Services from 2000 to 2003. Emeritus member of the Iowa State University Foundation Board of Governors. Emeritus Member of the Advisory Board of Iowa State University School of Business. Advisory Board Member, Palm Harbor Academy (charter school). Advisory Board Member, Child Evangelism Fellowship (non-profit). Mr. Harris is a certified public accountant (inactive status). | | CIGNA Corporation; Asset Allocation Trust |
Judith M. Johnson (Born 1949) | | Trustee, since 2008; Audit Committee Chairman, since 2008 | | Retired. Prior thereto, Chief Executive Officer and Chief Investment Officer of Minneapolis Employees Retirement Fund from 1996 to 2008. Ms. Johnson is an attorney, certified public accountant and a certified managerial accountant. | | Asset Allocation Trust |
David F. Larcker (Born 1950) | | Trustee, since 2009 | | James Irvin Miller Professor of Accounting at the Graduate School of Business, Stanford University, Director of the Corporate Governance Research Initiative and Senior Faculty of The Rock Center for Corporate Governance since 2006. From 2005 to 2008, Professor of Accounting at the Graduate School of Business, Stanford University. Prior thereto, Ernst & Young Professor of Accounting at The Wharton School, University of Pennsylvania from 1985 to 2005. | | Asset Allocation Trust |
| | | | |
| 44 | | Wells Fargo Ultra Short-Term Municipal Income Fund | | Other information (unaudited) |
| | | | | | |
Name and year of birth | | Position held and length of service* | | Principal occupations during past five years or longer | | Current other
public company or
investment company
directorships |
Olivia S. Mitchell**** (Born 1953) | | Trustee, since 2006; Governance Committee Chairman, since 2018 | | International Foundation of Employee Benefit Plans Professor, Wharton School of the University of Pennsylvania since 1993. Director of Wharton’s Pension Research Council and Boettner Center on Pensions & Retirement Research, and Research Associate at the National Bureau of Economic Research. Previously, Cornell University Professor from 1978 to 1993. | | Asset Allocation Trust |
Timothy J. Penny***** (Born 1951) | | Trustee, since 1996; Chairman, since 2018; Vice Chairman, from 2017 to 2018 | | President and Chief Executive Officer of Southern Minnesota Initiative Foundation, a non-profit organization, since 2007. Member of the Board of Trustees of NorthStar Education Finance, Inc., a non-profit organization, since 2007. | | Asset Allocation Trust |
James G. Polisson****** (Born 1959) | | Trustee, since 2018; Advisory Board Member, from 2017 to 2018 | | Retired. Chief Marketing Officer, Source (ETF) UK Services, Ltd, from 2015 to 2017. From 2012 to 2015, Principal of The Polisson Group, LLC, a management consulting, corporate advisory and principal investing company. Chief Executive Officer and Managing Director at Russell Investments, Global Exchange Traded Funds from 2010 to 2012. Managing Director of Barclays Global Investors from 1998 to 2010 and Global Chief Marketing Officer for iShares and Barclays Global Investors from 2000 to 2010. Trustee of the San Francisco Mechanics’ Institute, a non-profit organization, from 2013 to 2015. Board member of the Russell Exchange Traded Fund Trust from 2011 to 2012. Director of Barclays Global Investors Holdings Deutschland GmbH from 2006 to 2009. Mr. Polisson is an attorney and has a retired status with the Massachusetts and District of Columbia Bar Associations. | | Asset Allocation Trust |
Michael S. Scofield (Born 1943) | | Trustee, since 2010 | | Served on the Investment Company Institute’s Board of Governors and Executive Committee from 2008-2011 as well the Governing Council of the Independent Directors Council from 2006-2011 and the Independent Directors Council Executive Committee from 2008-2011. Trustee of the Evergreen Funds complex (and its predecessors) from 1984 to 2010. Chairman of the Evergreen Funds from 2000-2010. Former Trustee of the Mentor Funds. Retired Attorney, Law Offices of Michael S. Scofield. | | Asset Allocation Trust |
Pamela Wheelock****** (Born 1959) | | Trustee, since 2018; Advisory Board Member, from 2017 to 2018 | | Chief Operating Officer, Twin Cities Habitat for Humanity, since January, 2017. Vice President of University Services, University of Minnesota from 2012 to 2017. Prior thereto, Interim President and Chief Executive Officer of Blue Cross Blue Shield of Minnesota from 2010 to 2011, Chairman of the Board from 2009 to 2011 and Board Director from 2003 to 2015. Vice President, Leadership and Community Engagement, Bush Foundation, Saint Paul, Minnesota (a private foundation) from 2009 to 2011. Executive Vice President and Chief Financial Officer, Minnesota Sports and Entertainment from 2004 to 2009 and Senior Vice President from 2002 to 2004. Commissioner of Finance, State of Minnesota, from 1999 to 2002. Currently on the Board of Directors, Governance Committee and Finance Committee, for the Minnesota Philanthropy Partners (Saint Paul Foundation) since 2012 and Board Chair of the Minnesota Wild Foundation since 2010. | | Asset Allocation Trust |
| * | Length of service dates reflect the Trustee’s commencement of service with the Trust’s predecessor entities, where applicable. |
| ** | Jane Freeman became Chair Liaison effective January 1, 2018. |
| *** | Peter Gordon retired on December 31, 2017. |
| **** | Olivia Mitchell became Chairman of the Governance Committee effective January 1, 2018. |
| ***** | Timothy Penny became Chairman effective January 1, 2018. |
| ****** | James Polisson and Pamela Wheelock each became a Trustee effective January 1, 2018. |
| | | | | | |
| Other information (unaudited) | | Wells Fargo Ultra Short-Term Municipal Income Fund | | | 45 | |
Officers
| | | | | | |
Name and year of birth | | Position held and length of service | | Principal occupations during past five years or longer | | |
Andrew Owen (Born 1960) | | President, since 2017 | | Executive Vice President of Wells Fargo & Company and Head of Affiliated Managers, Wells Fargo Asset Management, since 2014. In addition, Mr. Owen is currently President, Chief Executive Officer and Director of Wells Fargo Funds Management, LLC since 2017. Prior thereto, Executive Vice President responsible for marketing, investments and product development for Wells Fargo Funds Management, LLC, from 2009 to 2014. | | |
Nancy Wiser1 (Born 1967) | | Treasurer, since 2012 | | Executive Vice President of Wells Fargo Funds Management, LLC since 2011. Chief Operating Officer and Chief Compliance Officer at LightBox Capital Management LLC, from 2008 to 2011. | | |
C. David Messman (Born 1960) | | Secretary, since 2000; Chief Legal Officer, since 2003 | | Senior Vice President and Secretary of Wells Fargo Funds Management, LLC since 2001. Assistant General Counsel of Wells Fargo Bank, N.A. since 2013 and Vice President and Managing Counsel of Wells Fargo Bank, N.A. from 1996 to 2013. | | |
Michael H. Whitaker (Born 1967) | | Chief Compliance Officer, since 2016 | | Senior Vice President and Chief Compliance Officer since 2016. Senior Vice President and Chief Compliance Officer for Fidelity Investments from 2007 to 2016. | | |
David Berardi (Born 1975) | | Assistant Treasurer, since 2009 | | Vice President of Wells Fargo Funds Management, LLC since 2009. Vice President of Evergreen Investment Management Company, LLC from 2008 to 2010. Manager of Fund Reporting and Control for Evergreen Investment Management Company, LLC from 2004 to 2010. | | |
Jeremy DePalma1 (Born 1974) | | Assistant Treasurer, since 2009 | | Senior Vice President of Wells Fargo Funds Management, LLC since 2009. Senior Vice President of Evergreen Investment Management Company, LLC from 2008 to 2010 and head of the Fund Reporting and Control Team within Fund Administration from 2005 to 2010. | | |
| 1 | Nancy Wiser acts as Treasurer of 77 funds in the Fund Complex. Jeremy DePalma acts as Treasurer of 76 funds and Assistant Treasurer of 77 funds in the Fund Complex. |
| 2 | The Statement of Additional Information includes additional information about the Trustees and is available, without charge, upon request, by calling 1-800-222-8222 or by visiting the website at wellsfargofunds.com. |
| | | | |
| 46 | | Wells Fargo Ultra Short-Term Municipal Income Fund | | List of abbreviations |
The following is a list of common abbreviations for terms and entities that may have appeared in this report.
| ACA | — ACA Financial Guaranty Corporation |
| ADR | — American depositary receipt |
| ADS | — American depositary shares |
| AGC | — Assured Guaranty Corporation |
| AGM | — Assured Guaranty Municipal |
| Ambac | — Ambac Financial Group Incorporated |
| AMT | — Alternative minimum tax |
| BAN | — Bond anticipation notes |
| BHAC | — Berkshire Hathaway Assurance Corporation |
| CAB | — Capital appreciation bond |
| CCAB | — Convertible capital appreciation bond |
| CDA | — Community Development Authority |
| CDO | — Collateralized debt obligation |
| CLO | — Collateralized loan obligation |
| DRIVER | — Derivative inverse tax-exempt receipts |
| DW&P | — Department of Water & Power |
| DWR | — Department of Water Resources |
| ECFA | — Educational & Cultural Facilities Authority |
| EDA | — Economic Development Authority |
| EDFA | — Economic Development Finance Authority |
| ETF | — Exchange-traded fund |
| FDIC | — Federal Deposit Insurance Corporation |
| FFCB | — Federal Farm Credit Banks |
| FGIC | — Financial Guaranty Insurance Corporation |
| FHA | — Federal Housing Administration |
| FHLB | — Federal Home Loan Bank |
| FHLMC | — Federal Home Loan Mortgage Corporation |
| FICO | — The Financing Corporation |
| FNMA | — Federal National Mortgage Association |
| GDR | — Global depositary receipt |
| GNMA | — Government National Mortgage Association |
| HCFR | — Healthcare facilities revenue |
| HEFA | — Health & Educational Facilities Authority |
| HEFAR | — Higher education facilities authority revenue |
| HFA | — Housing Finance Authority |
| HFFA | — Health Facilities Financing Authority |
| HUD | — Department of Housing and Urban Development |
| IDA | — Industrial Development Authority |
| IDAG | — Industrial Development Agency |
| KRW | — Republic of Korea won |
| LIBOR | — London Interbank Offered Rate |
| LIFER | — Long Inverse Floating Exempt Receipts |
| LLC | — Limited liability company |
| LLLP | — Limited liability limited partnership |
| LLP | — Limited liability partnership |
| MBIA | — Municipal Bond Insurance Association |
| MFHR | — Multifamily housing revenue |
| MSTR | — Municipal securities trust receipts |
| MUD | — Municipal Utility District |
| National | — National Public Finance Guarantee Corporation |
| PCFA | — Pollution Control Financing Authority |
| PCL | — Public Company Limited |
| PCR | — Pollution control revenue |
| PFA | — Public Finance Authority |
| PFFA | — Public Facilities Financing Authority |
| PFOTER | — Puttable floating option tax-exempt receipts |
| PJSC | — Public Joint Stock Company |
| plc | — Public limited company |
| PUTTER | — Puttable tax-exempt receipts |
| R&D | — Research & development |
| Radian | — Radian Asset Assurance |
| RAN | — Revenue anticipation notes |
| RDA | — Redevelopment Agency |
| RDFA | — Redevelopment Finance Authority |
| REIT | — Real estate investment trust |
| ROC | — Reset option certificates |
| SAVRS | — Select auction variable rate securities |
| SBA | — Small Business Authority |
| SDR | — Swedish depositary receipt |
| SFHR | — Single-family housing revenue |
| SFMR | — Single-family mortgage revenue |
| SIFMA | — Securities Industry and Financial Markets Association |
| SPA | — Standby purchase agreement |
| SPDR | — Standard & Poor’s Depositary Receipts |
| SPEAR | — Short Puttable Exempt Adjustable Receipts |
| STRIPS | — Separate trading of registered interest and |
| TAN | — Tax anticipation notes |
| TIPS | — Treasury inflation-protected securities |
| TRAN | — Tax revenue anticipation notes |
| TTFA | — Transportation Trust Fund Authority |
| TVA | — Tennessee Valley Authority |
This page is intentionally left blank.
This page is intentionally left blank.

For more information
More information about Wells Fargo Funds is available free upon request. To obtain literature, please write, email, visit the Fund’s website, or call:
Wells Fargo Funds
P.O. Box 8266
Boston, MA 02266-8266
Email: fundservice@wellsfargo.com
Website: wellsfargofunds.com
Individual investors: 1-800-222-8222
Retail investment professionals: 1-888-877-9275
Institutional investment professionals: 1-866-765-0778
This report and the financial statements contained herein are submitted for the general information of the shareholders of the Fund. If this report is used for promotional purposes, distribution of the report must be accompanied or preceded by a current prospectus. Before investing, please consider the investment objectives, risks, charges, and expenses of the investment. For a current prospectus and, if available, a summary prospectus, containing this information, call 1-800-222-8222 or visit the Fund’s website at wellsfargofunds.com. Read the prospectus carefully before you invest or send money.
Wells Fargo Asset Management (WFAM) is a trade name used by the asset management businesses of Wells Fargo & Company. Wells Fargo Funds Management, LLC, a wholly owned subsidiary of Wells Fargo & Company, provides investment advisory and administrative services for Wells Fargo Funds. Other affiliates of Wells Fargo & Company provide subadvisory and other services for the funds. The funds are distributed by Wells Fargo Funds Distributor, LLC, Member FINRA, an affiliate of Wells Fargo & Company. Neither Wells Fargo Funds Distributor nor Wells Fargo Funds Management holds fund shareholder accounts or assets. This material is for general informational and educational purposes only and is NOT intended to provide investment advice or a recommendation of any kind—including a recommendation for any specific investment, strategy, or plan.
NOT FDIC INSURED ◾ NO BANK GUARANTEE ◾ MAY LOSE VALUE
© 2017 Wells Fargo Funds Management, LLC. All rights reserved.
| | |
 | | 308069 02-18 SA258/SAR258 12-17 |
Semi-Annual Report
December 31, 2017

Wells Fargo Wisconsin Tax-Free Fund


Reduce clutter. Save trees.
Sign up for electronic delivery of prospectuses and shareholder reports at wellsfargo.com/advantagedelivery
Contents
The views expressed and any forward-looking statements are as of December 31, 2017, unless otherwise noted, and are those of the Fund managers and/or Wells Fargo Funds Management, LLC. Discussions of individual securities, or the markets generally, or any Wells Fargo Fund are not intended as individual recommendations. Future events or results may vary significantly from those expressed in any forward-looking statements. The views expressed are subject to change at any time in response to changing circumstances in the market. Wells Fargo Funds Management, LLC and the Fund disclaim any obligation to publicly update or revise any views expressed or forward-looking statements.
NOT FDIC INSURED ◾ NO BANK GUARANTEE ◾ MAY LOSE VALUE
| | | | |
| 2 | | Wells Fargo Wisconsin Tax-Free Fund | | Letter to shareholders (unaudited) |

Andrew Owen
President
Wells Fargo Funds
In a predominantly improving global economic environment, global stocks delivered strong results; bond markets had smaller but positive results as well.
Dear Shareholder:
We are pleased to offer you this semi-annual report for the Wells Fargo Wisconsin Tax-Free Fund for the six-month period that ended December 31, 2017. In a predominantly improving global economic environment, global stocks delivered strong results; bond markets had smaller but positive results as well. U.S. and international stocks delivered similar results, with returns of 11.42% and 11.48%, respectively, for the six-month period, as measured by the S&P 500 Index1 and the MSCI ACWI ex USA Index (Net)2, respectively; within fixed income, the Bloomberg Barclays U.S. Aggregate Bond Index3 returned 1.24% and the Bloomberg Barclays Municipal Bond Index4 returned 1.82%.
As global growth improved in the third quarter of 2017, investment markets generally advanced.
Most stock markets worldwide moved higher during the quarter and ended the period at or near all-time highs. Moderate acceleration in global economic growth was supported by improving corporate earnings, low inflation pressure, and still-low interest rates. Corporate earnings reports were favorable overall as companies continued to benefit from healthy operating leverage. While North Korea’s recent missile launches and nuclear testing raised serious concerns around the world, the heightened geopolitical risk had relatively minimal impact on the quarter’s stock returns. In the U.S., economic data released during the quarter reflected a generally healthy economy. Second-quarter economic output grew at a 3.1% annual rate, and consumers displayed more willingness to spend. Meanwhile, the U.S. Federal Reserve (Fed) maintained the target range for the federal funds rate at 1.00% to 1.25%, noting that inflation had remained below the Fed’s 2.00% objective. However, the Fed also stated the possibility of one more 0.25% increase in the federal funds rate by the end of 2017 and announced plans to begin the process of unwinding its $4.5 trillion portfolio of bonds and other assets in October. Outside the U.S., stocks in the Asia Pacific region benefited from solid earnings reports and investors’ willingness to take on risk despite the rising tensions between North Korea and the U.S. In Europe, markets were supported by better-than-expected economic growth, which led to narrowing of the gap between Europe’s growth rate and that of the U.S. In emerging markets, many countries benefited from stronger currencies versus the U.S. dollar.
Positive economic and market news continued through the fourth quarter.
During the fourth quarter of 2017, stock markets followed a steady, upward trajectory with no meaningful pullbacks, similar to their paths during the previous three quarters of the year. The extended rally was driven largely by reports of strong earnings and revenue surprises from many companies. Synchronous economic expansion worldwide with mild inflation provided a favorable environment for markets to rise with minimal volatility. Data released during the quarter reflected a
| 1 | The S&P 500 Index consists of 500 stocks chosen for market size, liquidity, and industry group representation. It is a market-value-weighted index with each stock’s weight in the index proportionate to its market value. You cannot invest directly in an index. |
| 2 | The Morgan Stanley Capital International (MSCI) All Country World Index (ACWI) ex USA Index (Net) is a free-float-adjusted market-capitalization-weighted index that is designed to measure the equity market performance of developed markets, excluding the United States and Canada. Source: MSCI. MSCI makes no express or implied warranties or representations and shall have no liability whatsoever with respect to any MSCI data contained herein. The MSCI data may not be further redistributed or used as a basis for other indices or any securities or financial products. This report is not approved, reviewed, or produced by MSCI. You cannot invest directly in an index. |
| 3 | The Bloomberg Barclays U.S. Aggregate Bond Index is a broad-based benchmark that measures the investment-grade, U.S. dollar-denominated, fixed-rate taxable bond market, including Treasuries, government-related and corporate securities, mortgage-backed securities (agency fixed-rate and hybrid adjustable-rate mortgage pass-throughs), asset-backed securities, and commercial mortgage-backed securities. You cannot invest directly in an index. |
| 4 | The Bloomberg Barclays Municipal Bond Index is an unmanaged index composed of long-term tax-exempt bonds with a minimum credit rating of Baa. You cannot invest directly in an index. |
| | | | | | |
| Letter to shareholders (unaudited) | | Wells Fargo Wisconsin Tax-Free Fund | | | 3 | |
healthy U.S. economy. Third-quarter economic output grew at a 3.2% annual rate, just ahead of the second quarter’s 3.1% pace. Hiring remained solid during the quarter; the hiring pace pushed the unemployment rate down to a 17-year low of 4.1% in October, and it remained at 4.1% for both November and December. Fed officials began unwinding the Fed’s $4.5 trillion portfolio of bonds and other assets in October as planned, and in December they raised the target for the federal funds rate to a range of 1.25% to 1.50%. As a result, long-term interest rates in the U.S. continued trending upward, although the 10-year rate remained below 2.5%. Outside the U.S., economies continued to strengthen. In December, the Organisation for Economic Co-operation and Development (OECD) reported that the global economy has been expanding at its fastest rate since 2010; all 45 countries the OECD follows were on track to expand for 2017. International economies have benefited from catalysts such as economic stimulus, improving employment, increased investment, and accelerated trade growth.
Don’t let short-term uncertainty derail long-term investment goals.
Periods of investment uncertainty can present challenges, but experience has taught us that maintaining long-term investment goals can be an effective way to plan for the future. To help you create a sound strategy based on your personal goals and risk tolerance, Wells Fargo Funds offers more than 100 mutual funds spanning a wide range of asset classes and investment styles. Although diversification cannot guarantee an investment profit or prevent losses, we believe it can be an effective way to manage investment risk and potentially smooth out overall portfolio performance. We encourage investors to know their investments and to understand that appropriate levels of risk-taking may unlock opportunities.
Thank you for choosing to invest with Wells Fargo Funds. We appreciate your confidence in us and remain committed to helping you meet your financial needs.
Sincerely,

Andrew Owen
President
Wells Fargo Funds
Although diversification cannot guarantee an investment profit or prevent losses, we believe it can be an effective way to manage investment risk and potentially smooth out overall portfolio performance.
For further information about your Fund, contact your investment professional, visit our website at wellsfargofunds.com, or call us directly at 1-800-222-8222. We are available 24 hours a day, 7 days a week.
| | | | |
| 4 | | Wells Fargo Wisconsin Tax-Free Fund | | Performance highlights (unaudited) |
Investment objective
The Fund seeks current income exempt from federal income tax and Wisconsin individual income tax.
Manager
Wells Fargo Funds Management, LLC
Subadviser
Wells Capital Management Incorporated
Portfolio managers
Lyle J. Fitterer, CFA®, CPA
Bruce R. Johns‡
Thomas Stoeckmann
Average annual total returns (%) as of December 31, 20171
| | | | | | | | | | | | | | | | | | | | | | | | | | | | | | | | | | |
| | | | | Including sales charge | | | Excluding sales charge | | | Expense ratios2 (%) | |
| | | Inception date | | 1 year | | | 5 year | | | 10 year | | | 1 year | | | 5 year | | | 10 year | | | Gross | | | Net3 | |
| Class A (WWTFX) | | 3-31-2008 | | | (0.36 | ) | | | 1.53 | | | | 3.10 | | | | 4.30 | | | | 2.47 | | | | 3.57 | | | | 0.93 | | | | 0.70 | |
| Class C (WWTCX) | | 12-26-2002 | | | 2.52 | | | | 1.70 | | | | 2.78 | | | | 3.52 | | | | 1.70 | | | | 2.78 | | | | 1.68 | | | | 1.45 | |
| Institutional Class (WWTIX) | | 10-31-2016 | | | – | | | | – | | | | – | | | | 4.49 | | | | 2.51 | | | | 3.59 | | | | 0.60 | | | | 0.52 | |
| Bloomberg Barclays Municipal Bond Index4 | | – | | | – | | | | – | | | | – | | | | 5.45 | | | | 3.02 | | | | 4.46 | | | | – | | | | – | |
| Bloomberg Barclays Wisconsin Municipal Bond Index5 | | – | | | – | | | | – | | | �� | – | | | | 4.81 | | | | 2.78 | | | | 4.45 | | | | – | | | | – | |
Figures quoted represent past performance, which is no guarantee of future results, and do not reflect taxes that a shareholder may pay on fund distributions or the redemption of fund shares. Investment return and principal value of an investment will fluctuate so that an investor’s shares, when redeemed, may be worth more or less than their original cost. Performance shown without sales charges would be lower if sales charges were reflected. Current performance may be lower or higher than the performance data quoted, which assumes the reinvestment of dividends and capital gains. Current month-end performance is available on the Fund’s website, wellsfargofunds.com.
Index returns do not include transaction costs associated with buying and selling securities, any mutual fund fees or expenses, or any taxes. It is not possible to invest directly in an index.
For Class A shares, the maximum front-end sales charge is 4.50%. For Class C shares, the maximum contingent deferred sales charge is 1.00%. Performance including a contingent deferred sales charge assumes the sales charge for the corresponding time period. Institutional Class shares are sold without a front-end sales charge or contingent deferred sales charge.
Bond values fluctuate in response to the financial condition of individual issuers, general market and economic conditions, and changes in interest rates. Changes in market conditions and government policies may lead to periods of heightened volatility in the bond market and reduced liquidity for certain bonds held by the Fund. In general, when interest rates rise, bond values fall and investors may lose principal value. Interest-rate changes and their impact on the Fund and its share price can be sudden and unpredictable. The use of derivatives may reduce returns and/or increase volatility. Certain investment strategies tend to increase the total risk of an investment (relative to the broader market). The Fund is exposed Wisconsin and Puerto Rico municipal securities risk, high-yield securities, and non-diversification risk. Consult the Fund’s prospectus for additional information on these and other risks. A portion of the Fund’s income may be subject to federal, state, and/or local income taxes or the Alternative Minimum Tax (AMT). Any capital gains distributions may be taxable.
Please see footnotes on page 5.
| | | | | | |
| Performance highlights (unaudited) | | Wells Fargo Wisconsin Tax-Free Fund | | | 5 | |
|
| Effective maturity distribution as of December 31, 20176 |
|
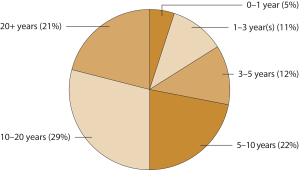
|
|
| Credit quality as of December 31, 20177 |
|
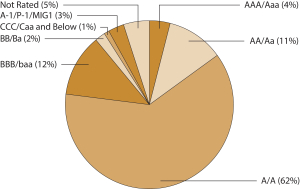 |
| ‡ | Mr. Johns became a portfolio manager of the Fund on November 1, 2017. |
| 1 | Historical performance shown for Class A shares prior to their inception reflects the performance of the former Investor Class shares, and includes the higher expenses applicable to the former Investor Class shares (except during those periods in which expenses of Class A shares would have been higher than those of the former Investor Class shares, no such adjustment is reflected). If these expenses had not been included, returns for Class A shares would be higher. Historical performance shown for the Institutional Class shares prior to their inception reflects the performance of the Class A shares, and is not adjusted to reflect Institutional Class expenses. If these expenses had been included, returns for Institutional Class would be higher. |
| 2 | Reflects the expense ratios as stated in the most recent prospectuses. The expense ratios shown are subject to change and may differ from the annualized expense ratios shown in the financial highlights of this report. |
| 3 | The manager has contractually committed through October 31, 2018, to waive fees and/or reimburse expenses to the extent necessary to cap the Fund’s Total Annual Fund Operating Expenses After Fee Waivers at the amounts shown. After this time, the cap may be increased or the commitment to maintain the cap may be terminated only with the approval of the Board of Trustees. Brokerage commissions, stamp duty fees, interest, taxes, acquired fund fees and expenses, and extraordinary expenses are excluded from the expense cap. Without this cap, the Fund’s returns would have been lower. The expense ratio paid by an investor is the net expense ratio or the Fund’s Total Annual Fund Operating Expenses After Fee Waivers, as stated in the prospectuses. |
| 4 | The Bloomberg Barclays Municipal Bond Index is an unmanaged index composed of long-term tax-exempt bonds with a minimum credit rating of Baa. You cannot invest directly in an index. |
| 5 | The Bloomberg Barclays Wisconsin Municipal Bond Index is the Wisconsin component of the Bloomberg Barclays Municipal Bond Index. You cannot invest directly in an index. |
| 6 | Amounts are calculated based on the total investments of the Fund. These amounts are subject to change and may have changed since the date specified. |
| 7 | The credit quality distribution of portfolio holdings reflected in the chart is based on ratings from Standard & Poor’s, Moody’s Investors Service, and/ or Fitch Ratings Ltd. Credit quality ratings apply to the underlying holdings of the Fund and not to the Fund itself. The percentages of the Fund’s portfolio with the ratings depicted in the chart are calculated based on the total market value of fixed income securities held by the Fund. If a security was rated by all three rating agencies, the middle rating was utilized. If rated by two of three rating agencies, the lower rating was utilized, and if rated by one of the rating agencies, that rating was utilized. Standard & Poor’s rates the creditworthiness of bonds, ranging from AAA (highest) to D (lowest). Ratings from A to CCC may be modified by the addition of a plus (+) or minus (-) sign to show relative standing within the rating categories. Standard & Poor’s rates the creditworthiness of short-term notes from SP-1 (highest) to SP-3 (lowest). Moody’s rates the creditworthiness of bonds, ranging from Aaa (highest) to C (lowest). Ratings Aa to B may be modified by the addition of a number 1 (highest) to 3 (lowest) to show relative standing within the ratings categories. Moody’s rates the creditworthiness of short-term U.S. tax-exempt municipal securities from MIG 1/VMIG 1 (highest) to SG (lowest). Fitch rates the creditworthiness of bonds, ranging from AAA (highest) to D (lowest). Credit quality distribution is subject to change and may have changed since the date specified. |
| | | | |
| 6 | | Wells Fargo Wisconsin Tax-Free Fund | | Fund expenses (unaudited) |
As a shareholder of the Fund, you incur two types of costs: (1) transaction costs, including sales charges (loads) on purchase payments and contingent deferred sales charges (if any) on redemptions and (2) ongoing costs, including management fees, distribution (12b-1) and/or shareholder servicing fees, and other Fund expenses. This example is intended to help you understand your ongoing costs (in dollars) of investing in the Fund and to compare these costs with the ongoing costs of investing in other mutual funds.
The example is based on an investment of $1,000 invested at the beginning of the six-month period and held for the entire period from July 1, 2017 to December 31, 2017.
Actual expenses
The “Actual” line of the table below provides information about actual account values and actual expenses. You may use the information in this line, together with the amount you invested, to estimate the expenses that you paid over the period. Simply divide your account value by $1,000 (for example, an $8,600 account value divided by $1,000 = 8.6), then multiply the result by the number in the “Actual” line under the heading entitled “Expenses paid during period” for your applicable class of shares to estimate the expenses you paid on your account during this period.
Hypothetical example for comparison purposes
The “Hypothetical” line of the table below provides information about hypothetical account values and hypothetical expenses based on the Fund’s actual expense ratio and an assumed rate of return of 5% per year before expenses, which is not the Fund’s actual return. The hypothetical account values and expenses may not be used to estimate the actual ending account balance or expenses you paid for the period. You may use this information to compare the ongoing costs of investing in the Fund and other funds. To do so, compare this 5% hypothetical example with the 5% hypothetical examples that appear in the shareholder reports of the other funds.
Please note that the expenses shown in the table are meant to highlight your ongoing costs only and do not reflect any transactional costs, such as sales charges (loads) and contingent deferred sales charges. Therefore, the “Hypothetical” line of the table is useful in comparing ongoing costs only and will not help you determine the relative total costs of owning different funds. In addition, if these transactional costs were included, your costs would have been higher.
| | | | | | | | | | | | | | | | |
| | | Beginning account value 7-1-2017 | | | Ending account value 12-31-2017 | | | Expenses paid during the period¹ | | | Annualized net expense ratio | |
Class A | | | | | | | | | | | | | | | | |
Actual | | $ | 1,000.00 | | | $ | 1,017.27 | | | $ | 3.56 | | | | 0.70 | % |
Hypothetical (5% return before expenses) | | $ | 1,000.00 | | | $ | 1,021.68 | | | $ | 3.57 | | | | 0.70 | % |
Class C | | | | | | | | | | | | | | | | |
Actual | | $ | 1,000.00 | | | $ | 1,013.45 | | | $ | 7.36 | | | | 1.45 | % |
Hypothetical (5% return before expenses) | | $ | 1,000.00 | | | $ | 1,017.90 | | | $ | 7.38 | | | | 1.45 | % |
Institutional Class | | | | | | | | | | | | | | | | |
Actual | | $ | 1,000.00 | | | $ | 1,018.20 | | | $ | 2.65 | | | | 0.52 | % |
Hypothetical (5% return before expenses) | | $ | 1,000.00 | | | $ | 1,022.58 | | | $ | 2.65 | | | | 0.52 | % |
| 1 | Expenses paid is equal to the annualized net expense ratio of each class multiplied by the average account value over the period, multiplied by the number of days in the most recent fiscal half-year divided by the number of days in the fiscal year (to reflect the one-half-year period). |
| | | | | | |
| Portfolio of investments—December 31, 2017 (unaudited) | | Wells Fargo Wisconsin Tax-Free Fund | | | 7 | |
| | | | | | | | | | | | | | | | |
| Security name | | Interest rate | | | Maturity date | | | Principal | | | Value | |
|
Municipal Obligations: 99.12% | |
|
| Guam: 5.96% | |
Guam Government Limited Obligation Bonds Section 30 Series A (Miscellaneous Revenue) | | | 5.38 | % | | | 12-1-2024 | | | $ | 1,000,000 | | | $ | 1,069,780 | |
Guam Government Limited Obligation Bonds Section 30 Series A (Miscellaneous Revenue) | | | 5.50 | | | | 12-1-2019 | | | | 1,000,000 | | | | 1,072,120 | |
Guam Government Series A (GO Revenue) | | | 7.00 | | | | 11-15-2039 | | | | 2,000,000 | | | | 2,194,280 | |
Guam International Airport Authority Series C (Airport Revenue, AGM Insured) | | | 6.13 | | | | 10-1-2043 | | | | 1,500,000 | | | | 1,763,490 | |
Guam Power Authority Series A (Utilities Revenue, AGM Insured) | | | 5.00 | | | | 10-1-2019 | | | | 1,575,000 | | | | 1,654,727 | |
Guam Power Authority Series A (Utilities Revenue, AGM Insured) | | | 5.00 | | | | 10-1-2020 | | | | 500,000 | | | | 537,765 | |
| |
| | | | 8,292,162 | |
| | | | | |
|
| Illinois: 3.82% | |
Chicago IL CAB City Colleges (GO Revenue, National Insured) ¤ | | | 0.00 | | | | 1-1-2027 | | | | 1,000,000 | | | | 713,410 | |
Chicago IL Metropolitan Pier & Exposition Authority McCormick Place Project Series B (Tax Revenue) | | | 5.00 | | | | 12-15-2028 | | | | 750,000 | | | | 807,825 | |
Chicago IL Park District Special Recreation Activity Series E (GO Revenue) | | | 5.00 | | | | 11-15-2027 | | | | 1,000,000 | | | | 1,164,820 | |
Chicago IL Series A (GO Revenue) | | | 5.00 | | | | 1-1-2027 | | | | 1,700,000 | | | | 1,841,593 | |
Chicago IL Waterworks Second Lien (Water & Sewer Revenue, AGM Insured) | | | 5.00 | | | | 11-1-2020 | | | | 500,000 | | | | 515,595 | |
Illinois State (Miscellaneous Revenue) | | | 5.50 | | | | 7-1-2026 | | | | 250,000 | | | | 275,453 | |
| |
| | | | 5,318,696 | |
| | | | | |
|
| Michigan: 0.15% | |
Michigan Municipal Bond Authority Local Government Loan Program Series A (Miscellaneous Revenue, Ambac Insured) | | | 4.00 | | | | 11-1-2021 | | | | 215,000 | | | | 215,157 | |
| | | | | | | | | | | | | | | | |
|
| New Jersey: 1.53% | |
New Jersey EDA Series EE (Miscellaneous Revenue) | | | 5.00 | | | | 9-1-2023 | | | | 935,000 | | | | 1,002,058 | |
New Jersey TTFA CAB Series A (Transportation Revenue) ¤ | | | 0.00 | | | | 12-15-2031 | | | | 2,000,000 | | | | 1,119,980 | |
| |
| | | | 2,122,038 | |
| | | | | |
|
| New York: 0.73% | |
Hempstead Town NY Local Development Corporation The Academy Charter School Project Series A (Education Revenue) | | | 6.24 | | | | 2-1-2047 | | | | 1,000,000 | | | | 1,008,890 | |
| | | | | | | | | | | | | | | | |
|
| Ohio: 0.32% | |
Ohio Water Development Authority Pollution Control Series C (Industrial Development Revenue) øø | | | 4.00 | | | | 6-1-2033 | | | | 1,000,000 | | | | 442,320 | |
| | | | | | | | | | | | | | | | |
|
| Puerto Rico: 1.98% | |
Puerto Rico Highway & Transportation Authority Refunding Bond Series L (Transportation Revenue, AGC Insured) | | | 5.25 | | | | 7-1-2019 | | | | 1,000,000 | | | | 1,033,680 | |
Puerto Rico Highway & Transportation Authority Refunding Bond Series L (Transportation Revenue, BHAC/FGIC Insured) | | | 5.25 | | | | 7-1-2021 | | | | 300,000 | | | | 329,340 | |
Puerto Rico Industrial Tourist Educational Medical & Environmental Control Facilities Financing Authority Hospital Auxilio Mutuo Obligated Group Series A (Health Revenue) | | | 5.00 | | | | 7-1-2018 | | | | 1,375,000 | | | | 1,392,256 | |
| |
| | | | 2,755,276 | |
| | | | | |
The accompanying notes are an integral part of these financial statements.
| | | | |
| 8 | | Wells Fargo Wisconsin Tax-Free Fund | | Portfolio of investments—December 31, 2017 (unaudited) |
| | | | | | | | | | | | | | | | |
| Security name | | Interest rate | | | Maturity date | | | Principal | | | Value | |
|
| Virgin Islands: 5.43% | |
Virgin Islands PFA (Miscellaneous Revenue) 144A | | | 5.00 | % | | | 9-1-2020 | | | $ | 750,000 | | | $ | 792,000 | |
Virgin Islands PFA Gross Receipts Taxes Loan Notes (Miscellaneous Revenue, National Insured) | | | 4.00 | | | | 10-1-2020 | | | | 450,000 | | | | 445,676 | |
Virgin Islands PFA Gross Receipts Taxes Loan Notes (Miscellaneous Revenue, AGM Insured) | | | 4.00 | | | | 10-1-2022 | | | | 3,000,000 | | | | 3,043,200 | |
Virgin Islands PFA Matching Fund Loan Notes Senior Lien Series B (Tax Revenue, AGM Insured) | | | 5.00 | | | | 10-1-2025 | | | | 2,000,000 | | | | 2,090,000 | |
Virgin Islands PFA Series A (Tax Revenue) | | | 5.00 | | | | 10-1-2018 | | | | 1,295,000 | | | | 1,176,831 | |
Virgin Islands PFA Unrefunded Balance Bond Series A (Miscellaneous Revenue) | | | 7.30 | | | | 10-1-2018 | | | | 5,000 | | | | 5,218 | |
| |
| | | | 7,552,925 | |
| | | | | |
|
| Wisconsin: 79.20% | |
Beloit WI CDA Series A (Tax Revenue) | | | 1.82 | | | | 6-1-2018 | | | | 475,000 | | | | 475,067 | |
Brookfield WI Community Development & RDA Series A (Miscellaneous Revenue) | | | 1.15 | | | | 6-1-2018 | | | | 550,000 | | | | 548,378 | |
Brookfield WI Community Development & RDA Series A (Miscellaneous Revenue) | | | 1.35 | | | | 6-1-2019 | | | | 750,000 | | | | 743,520 | |
Cudahy WI CDA Series A (Miscellaneous Revenue) | | | 1.75 | | | | 6-1-2019 | | | | 300,000 | | | | 299,415 | |
Cudahy WI CDA Series A (Miscellaneous Revenue) | | | 1.95 | | | | 6-1-2019 | | | | 145,000 | | | | 145,583 | |
Cudahy WI CDA Series A (Miscellaneous Revenue) | | | 1.50 | | | | 6-1-2018 | | | | 200,000 | | | | 199,974 | |
Cudahy WI CDA Series C (Miscellaneous Revenue) | | | 0.90 | | | | 6-1-2018 | | | | 200,000 | | | | 199,224 | |
Cudahy WI CDA Series C (Miscellaneous Revenue) | | | 1.05 | | | | 6-1-2019 | | | | 125,000 | | | | 123,391 | |
Glendale WI CDA Bayshore Public Parking (Miscellaneous Revenue) | | | 1.50 | | | | 10-1-2019 | | | | 375,000 | | | | 372,570 | |
Glendale WI CDA Series A (Miscellaneous Revenue) | | | 3.50 | | | | 10-1-2018 | | | | 1,700,000 | | | | 1,724,412 | |
Green Bay WI Housing Authority University Village Housing Incorporated (Education Revenue) | | | 1.20 | | | | 4-1-2018 | | | | 500,000 | | | | 499,395 | |
Green Bay WI Housing Authority University Village Housing Incorporated (Education Revenue) | | | 4.38 | | | | 4-1-2022 | | | | 200,000 | | | | 206,114 | |
Green Bay WI Housing Authority University Village Housing Incorporated (Education Revenue) | | | 5.00 | | | | 4-1-2030 | | | | 1,410,000 | | | | 1,481,374 | |
Green Bay WI RDA Bellin Memorial Hospital Incorporated (Health Revenue) | | | 5.50 | | | | 12-1-2023 | | | | 250,000 | | | | 258,998 | |
Green Bay WI RDA Bellin Memorial Hospital Incorporated (Health Revenue) | | | 5.65 | | | | 12-1-2026 | | | | 100,000 | | | | 103,735 | |
Green Bay WI RDA Bellin Memorial Hospital Incorporated (Health Revenue) | | | 6.00 | | | | 12-1-2029 | | | | 260,000 | | | | 270,535 | |
Green Bay WI RDA Bellin Memorial Hospital Incorporated (Health Revenue) | | | 6.15 | | | | 12-1-2032 | | | | 420,000 | | | | 437,590 | |
Kaukauna WI RDA (Miscellaneous Revenue) | | | 3.75 | | | | 6-1-2032 | | | | 850,000 | | | | 884,026 | |
Kaukauna WI RDA (Miscellaneous Revenue) | | | 4.00 | | | | 6-1-2019 | | | | 50,000 | | | | 51,625 | |
Kaukauna WI RDA (Miscellaneous Revenue) | | | 4.00 | | | | 6-1-2020 | | | | 100,000 | | | | 104,708 | |
Kaukauna WI RDA (Miscellaneous Revenue) | | | 4.00 | | | | 6-1-2021 | | | | 310,000 | | | | 329,391 | |
Kaukauna WI RDA (Miscellaneous Revenue) | | | 4.00 | | | | 6-1-2022 | | | | 235,000 | | | | 252,994 | |
Kaukauna WI RDA (Miscellaneous Revenue) | | | 4.00 | | | | 6-1-2023 | | | | 200,000 | | | | 217,840 | |
Kaukauna WI RDA (Miscellaneous Revenue) | | | 4.00 | | | | 6-1-2025 | | | | 425,000 | | | | 470,607 | |
Kaukauna WI RDA (Miscellaneous Revenue) | | | 4.00 | | | | 6-1-2028 | | | | 425,000 | | | | 463,072 | |
Kaukauna WI RDA (Miscellaneous Revenue) | | | 4.00 | | | | 6-1-2035 | | | | 900,000 | | | | 957,546 | |
Madison WI CDA Wisconsin Alumni Research Foundation (Education Revenue) | | | 5.00 | | | | 10-1-2023 | | | | 150,000 | | | | 159,003 | |
Madison WI CDA Wisconsin Alumni Research Foundation (Education Revenue) | | | 5.00 | | | | 10-1-2025 | | | | 475,000 | | | | 503,001 | |
Madison WI CDA Wisconsin Alumni Research Foundation (Education Revenue) | | | 5.00 | | | | 10-1-2039 | | | | 5,000,000 | | | | 5,260,150 | |
Menomonie WI Area School District (GO Revenue, Build America Mutual Assurance Company Insured) | | | 2.00 | | | | 3-1-2018 | | | | 420,000 | | | | 420,269 | |
Milwaukee WI RDA Milwaukee Public Schools (Miscellaneous Revenue) | | | 5.00 | | | | 11-15-2034 | | | | 675,000 | | | | 787,975 | |
Milwaukee WI RDA Milwaukee Public Schools (Miscellaneous Revenue) | | | 5.00 | | | | 11-15-2035 | | | | 1,000,000 | | | | 1,165,670 | |
Milwaukee WI RDA Milwaukee Public Schools (Miscellaneous Revenue) | | | 5.00 | | | | 11-15-2036 | | | | 500,000 | | | | 581,985 | |
Milwaukee WI RDA Milwaukee Public Schools Series A (Miscellaneous Revenue) | | | 5.00 | | | | 11-15-2027 | | | | 1,020,000 | | | | 1,227,937 | |
Milwaukee WI RDA Milwaukee Public Schools Series A (Miscellaneous Revenue) | | | 5.00 | | | | 11-15-2028 | | | | 1,000,000 | | | | 1,195,930 | |
The accompanying notes are an integral part of these financial statements.
| | | | | | |
| Portfolio of investments—December 31, 2017 (unaudited) | | Wells Fargo Wisconsin Tax-Free Fund | | | 9 | |
| | | | | | | | | | | | | | | | |
| Security name | | Interest rate | | | Maturity date | | | Principal | | | Value | |
| | | | |
| Wisconsin (continued) | | | | | | | | | | | | | | | | |
Milwaukee WI RDA Milwaukee Public Schools Series A (Miscellaneous Revenue) | | | 5.00 | % | | | 11-15-2031 | | | $ | 750,000 | | | $ | 884,543 | |
Milwaukee WI RDA Public Schools Series A (Miscellaneous Revenue) | | | 5.00 | | | | 8-1-2019 | | | | 915,000 | | | | 960,622 | |
Milwaukee WI RDA Public Schools Series A (Miscellaneous Revenue) | | | 5.00 | | | | 8-1-2020 | | | | 1,100,000 | | | | 1,186,526 | |
Milwaukee WI RDA Public Schools Series A (Miscellaneous Revenue) | | | 5.00 | | | | 8-1-2021 | | | | 3,330,000 | | | | 3,676,853 | |
Milwaukee WI RDA Science Education Consortium Incorporated Project Series A (Education Revenue) | | | 6.25 | | | | 8-1-2043 | | | | 2,100,000 | | | | 2,309,811 | |
Milwaukee WI RDA Summer Festival Project (Miscellaneous Revenue) | | | 4.60 | | | | 8-1-2024 | | | | 870,000 | | | | 902,608 | |
Milwaukee WI RDA Summer Festival Project (Miscellaneous Revenue) | | | 5.00 | | | | 8-1-2030 | | | | 3,000,000 | | | | 3,130,950 | |
Milwaukee WI RDA Wisconsin Housing Preservation Corporation (Housing Revenue, Johnson Bank LOC) ø | | | 2.10 | | | | 12-1-2038 | | | | 1,785,000 | | | | 1,785,000 | |
Milwaukee WI RDA Wisconsin Montessori Society (Education Revenue, U.S. Bank NA LOC) ø | | | 1.80 | | | | 7-1-2021 | | | | 400,000 | | | | 400,000 | |
Milwaukee WI Series B6 (GO Revenue) | | | 2.00 | | | | 4-1-2021 | | | | 175,000 | | | | 176,428 | |
Milwaukee WI Series B6 (GO Revenue) | | | 3.00 | | | | 4-1-2024 | | | | 570,000 | | | | 602,952 | |
Milwaukee WI Series B6 (GO Revenue) | | | 5.00 | | | | 4-1-2022 | | | | 350,000 | | | | 395,868 | |
Milwaukee WI Series B6 (GO Revenue) | | | 5.00 | | | | 4-1-2023 | | | | 580,000 | | | | 671,524 | |
Milwaukee WI Series B6 (GO Revenue) | | | 5.00 | | | | 4-1-2025 | | | | 550,000 | | | | 662,393 | |
Monroe WI RDA Monroe Clinic Incorporated (Health Revenue) | | | 5.50 | | | | 2-15-2029 | | | | 1,000,000 | | | | 1,044,800 | |
Monroe WI RDA Monroe Clinic Incorporated (Health Revenue) | | | 5.88 | | | | 2-15-2039 | | | | 1,570,000 | | | | 1,646,820 | |
North Fond Du Lac WI CDA (Miscellaneous Revenue) | | | 1.70 | | | | 12-1-2018 | | | | 50,000 | | | | 49,661 | |
Oostburg WI CDA Series A (Miscellaneous Revenue) | | | 1.75 | | | | 5-1-2018 | | | | 50,000 | | | | 49,960 | |
Platteville WI RDA University of Wisconsin Platteville Real Estate Foundation Incorporated (Education Revenue) | | | 5.00 | | | | 7-1-2022 | | | | 1,250,000 | | | | 1,319,725 | |
Platteville WI RDA University of Wisconsin Platteville Real Estate Foundation Incorporated (Education Revenue) | | | 5.00 | | | | 7-1-2032 | | | | 1,500,000 | | | | 1,586,415 | |
Prairie du Chien WI RDA Series B (Miscellaneous Revenue) | | | 1.65 | | | | 9-1-2020 | | | | 200,000 | | | | 199,584 | |
Southeast Wisconsin Professional Baseball Park District Series A (Tax Revenue, National Insured) | | | 5.50 | | | | 12-15-2018 | | | | 380,000 | | | | 394,356 | |
Southeast Wisconsin Professional Baseball Park District Series A (Tax Revenue, National Insured) | | | 5.50 | | | | 12-15-2019 | | | | 100,000 | | | | 107,397 | |
Southeast Wisconsin Professional Baseball Park District Series A (Tax Revenue, National Insured) | | | 5.50 | | | | 12-15-2021 | | | | 2,000,000 | | | | 2,284,200 | |
Southeast Wisconsin Professional Baseball Park District Series A (Tax Revenue, National Insured) | | | 5.50 | | | | 12-15-2023 | | | | 1,600,000 | | | | 1,903,744 | |
Southeast Wisconsin Professional Baseball Park District Series A (Tax Revenue, National Insured) | | | 5.50 | | | | 12-15-2026 | | | | 2,435,000 | | | | 2,992,883 | |
Warrens WI CDA Economic Improvements (Miscellaneous Revenue) | | | 5.10 | | | | 11-1-2020 | | | | 70,000 | | | | 64,392 | |
Warrens WI CDA Interim Workout Extension (Tax Revenue) | | | 3.70 | | | | 11-1-2029 | | | | 163,947 | | | | 100,466 | |
Waukesha WI RDA Welldall Manufacturing Incorporated Project (Industrial Development Revenue, U.S. Bank NA LOC) | | | 4.00 | | | | 12-1-2023 | | | | 150,000 | | | | 153,098 | |
Waukesha WI RDA Welldall Manufacturing Incorporated Project (Industrial Development Revenue, U.S. Bank NA LOC) | | | 4.20 | | | | 12-1-2024 | | | | 150,000 | | | | 153,410 | |
Waukesha WI RDA Welldall Manufacturing Incorporated Project (Industrial Development Revenue, U.S. Bank NA LOC) | | | 4.25 | | | | 12-1-2025 | | | | 250,000 | | | | 255,728 | |
Weston WI CDA Series A (Miscellaneous Revenue) | | | 1.25 | | | | 10-1-2018 | | | | 250,000 | | | | 248,548 | |
Weston WI CDA Series A (Miscellaneous Revenue) | | | 1.40 | | | | 10-1-2019 | | | | 625,000 | | | | 616,181 | |
Weston WI CDA Series A (Miscellaneous Revenue) | | | 1.50 | | | | 10-1-2020 | | | | 500,000 | | | | 489,805 | |
Weston WI CDA Series A (Miscellaneous Revenue) | | | 1.60 | | | | 10-1-2021 | | | | 340,000 | | | | 331,466 | |
Weston WI CDA Series A (Miscellaneous Revenue) | | | 1.75 | | | | 10-1-2022 | | | | 200,000 | | | | 194,832 | |
Weston WI CDA Series A (Miscellaneous Revenue) | | | 1.90 | | | | 10-1-2023 | | | | 100,000 | | | | 98,024 | |
Weston WI CDA Series A (Miscellaneous Revenue) | | | 2.00 | | | | 10-1-2024 | | | | 625,000 | | | | 617,194 | |
The accompanying notes are an integral part of these financial statements.
| | | | |
| 10 | | Wells Fargo Wisconsin Tax-Free Fund | | Portfolio of investments—December 31, 2017 (unaudited) |
| | | | | | | | | | | | | | | | |
| Security name | | Interest rate | | | Maturity date | | | Principal | | | Value | |
| | | | |
| Wisconsin (continued) | | | | | | | | | | | | | | | | |
Weston WI CDA Series A (Miscellaneous Revenue) | | | 2.15 | % | | | 10-1-2025 | | | $ | 615,000 | | | $ | 610,640 | |
Weston WI CDA Series A (Miscellaneous Revenue) | | | 2.25 | | | | 10-1-2026 | | | | 940,000 | | | | 943,318 | |
Weston WI CDA Series A (Miscellaneous Revenue) | | | 2.40 | | | | 10-1-2027 | | | | 570,000 | | | | 571,995 | |
Wisconsin Center District CAB (Tax Revenue, AGM Insured) ¤ | | | 0.00 | | | | 12-15-2030 | | | | 295,000 | | | | 206,060 | |
Wisconsin Center District CAB Senior Dedicated Milwaukee Arena Project Series A (Tax Revenue, Build America Mutual Assurance Company Insured) ¤ | | | 0.00 | | | | 12-15-2033 | | | | 2,985,000 | | | | 1,732,106 | |
Wisconsin Center District CAB Series A (Tax Revenue, National Insured) ¤ | | | 0.00 | | | | 12-15-2019 | | | | 275,000 | | | | 263,615 | |
Wisconsin Center District CAB Series A (Tax Revenue, National Insured) ¤ | | | 0.00 | | | | 12-15-2027 | | | | 100,000 | | | | 76,654 | |
Wisconsin Center District Junior Dedicated Bond (Tax Revenue, AGM Insured) | | | 5.25 | | | | 12-15-2018 | | | | 65,000 | | | | 67,215 | |
Wisconsin Center District Junior Dedicated Bond (Tax Revenue, AGM Insured) | | | 5.25 | | | | 12-15-2019 | | | | 500,000 | | | | 533,200 | |
Wisconsin Center District Junior Dedicated Bond (Tax Revenue, AGM Insured) | | | 5.25 | | | | 12-15-2023 | | | | 2,150,000 | | | | 2,444,421 | |
Wisconsin Center District Junior Dedicated Bond (Tax Revenue, AGM Insured) | | | 5.25 | | | | 12-15-2027 | | | | 1,005,000 | | | | 1,192,041 | |
Wisconsin Center District Junior Dedicated Bond Series A (Tax Revenue) | | | 5.00 | | | | 12-15-2022 | | | | 730,000 | | | | 833,828 | |
Wisconsin Center District Junior Dedicated Bond Series A (Tax Revenue) | | | 5.00 | | | | 12-15-2030 | | | | 2,100,000 | | | | 2,279,760 | |
Wisconsin Center District Milwaukee Arena Project (Tax Revenue) | | | 4.00 | | | | 12-15-2032 | | | | 1,100,000 | | | | 1,190,948 | |
Wisconsin Center District Milwaukee Arena Project (Tax Revenue) | | | 4.00 | | | | 12-15-2033 | | | | 920,000 | | | | 991,769 | |
Wisconsin Center District Milwaukee Arena Project (Tax Revenue) | | | 4.00 | | | | 12-15-2034 | | | | 2,000,000 | | | | 2,149,820 | |
Wisconsin HEFA Aurora Health Care Series B (Health Revenue, Bank of Montreal LOC) ø | | | 1.75 | | | | 7-15-2028 | | | | 1,220,000 | | | | 1,220,000 | |
Wisconsin HEFA Aurora Health Care Series C (Health Revenue, JPMorgan Chase & Company LOC) ø | | | 1.65 | | | | 2-15-2029 | | | | 1,000,000 | | | | 1,000,000 | |
Wisconsin HEFA Aurora Health Care Series D (Health Revenue, Bank of Montreal LOC) ø | | | 1.69 | | | | 7-15-2028 | | | | 2,000,000 | | | | 2,000,000 | |
Wisconsin HEFA Bellin Memorial Hospital Obligated Group (Health Revenue) | | | 3.00 | | | | 12-1-2019 | | | | 1,475,000 | | | | 1,506,698 | |
Wisconsin HEFA Bellin Memorial Hospital Obligated Group (Health Revenue) | | | 4.00 | | | | 12-1-2035 | | | | 1,000,000 | | | | 1,057,400 | |
Wisconsin HEFA Bellin Memorial Hospital Obligated Group (Health Revenue) | | | 5.00 | | | | 12-1-2025 | | | | 1,500,000 | | | | 1,743,645 | |
Wisconsin HEFA Bellin Memorial Hospital Obligated Group (Health Revenue) | | | 5.00 | | | | 12-1-2026 | | | | 1,740,000 | | | | 2,017,634 | |
Wisconsin HEFA Bellin Memorial Hospital Obligated Group (Health Revenue, Ambac Insured) | | | 5.50 | | | | 2-15-2019 | | | | 15,000 | | | | 15,346 | |
Wisconsin HEFA Marshfield Clinic Health System Obligated Group Series C (Health Revenue) | | | 5.00 | | | | 2-15-2020 | | | | 850,000 | | | | 900,932 | |
Wisconsin HEFA Marshfield Clinic Health System Obligated Group Series C (Health Revenue) | | | 5.00 | | | | 2-15-2027 | | | | 400,000 | | | | 477,104 | |
Wisconsin HEFA Marshfield Clinic Health System Obligated Group Series C (Health Revenue) | | | 5.00 | | | | 2-15-2028 | | | | 650,000 | | | | 763,198 | |
Wisconsin HEFA Marshfield Clinic Health System Obligated Group Series C (Health Revenue) | | | 5.00 | | | | 2-15-2029 | | | | 500,000 | | | | 583,570 | |
Wisconsin HEFA Monroe Clinic Incorporated (Health Revenue) | | | 4.00 | | | | 2-15-2031 | | | | 900,000 | | | | 962,208 | |
Wisconsin HEFA Monroe Clinic Incorporated (Health Revenue) | | | 4.00 | | | | 2-15-2033 | | | | 550,000 | | | | 582,615 | |
Wisconsin HEFA Monroe Clinic Incorporated (Health Revenue) | | | 5.00 | | | | 2-15-2028 | | | | 500,000 | | | | 583,350 | |
Wisconsin HEFA Monroe Clinic Incorporated (Health Revenue) | | | 5.00 | | | | 2-15-2029 | | | | 575,000 | | | | 668,254 | |
Wisconsin HEFA Rogers Memorial Hospital Incorporated Series B (Health Revenue) | | | 5.00 | | | | 7-1-2044 | | | | 3,250,000 | | | | 3,582,573 | |
Wisconsin Housing & EDA AMT Series A (Housing Revenue) | | | 4.63 | | | | 11-1-2037 | | | | 25,000 | | | | 25,018 | |
Wisconsin Housing & EDA AMT Series A (Housing Revenue) | | | 4.75 | | | | 5-1-2037 | | | | 250,000 | | | | 250,208 | |
Wisconsin Housing & EDA Madison Pool Project Series A (Housing Revenue) | | | 4.55 | | | | 7-1-2037 | | | | 165,000 | | | | 174,184 | |
Wisconsin Housing & EDA Madison Pool Project Series A (Housing Revenue) | | | 4.70 | | | | 7-1-2047 | | | | 2,300,000 | | | | 2,512,359 | |
Wisconsin Housing & EDA Madison Pool Project Series A (Housing Revenue) | | | 4.85 | | | | 7-1-2052 | | | | 3,000,000 | | | | 3,153,750 | |
Wisconsin Housing & EDA Series A (Housing Revenue) | | | 1.15 | | | | 6-1-2018 | | | | 55,000 | | | | 54,916 | |
Wisconsin Housing & EDA Series A (Housing Revenue) | | | 1.25 | | | | 12-1-2018 | | | | 55,000 | | | | 54,854 | |
Wisconsin Housing & EDA Series A (Housing Revenue) | | | 1.55 | | | | 12-1-2019 | | | | 55,000 | | | | 55,016 | |
The accompanying notes are an integral part of these financial statements.
| | | | | | |
| Portfolio of investments—December 31, 2017 (unaudited) | | Wells Fargo Wisconsin Tax-Free Fund | | | 11 | |
| | | | | | | | | | | | | | | | |
| Security name | | Interest rate | | | Maturity date | | | Principal | | | Value | |
| | | | |
| Wisconsin (continued) | | | | | | | | | | | | | | | | |
Wisconsin Housing & EDA Series A (Housing Revenue) | | | 1.95 | % | | | 12-1-2020 | | | $ | 55,000 | | | $ | 55,301 | |
Wisconsin Housing & EDA Series A (Housing Revenue) | | | 3.00 | | | | 5-1-2022 | | | | 100,000 | | | | 103,684 | |
Wisconsin Housing & EDA Series A (Housing Revenue) | | | 3.00 | | | | 11-1-2022 | | | | 125,000 | | | | 129,956 | |
Wisconsin Housing & EDA Series A (Housing Revenue) | | | 3.40 | | | | 11-1-2032 | | | | 2,450,000 | | | | 2,491,123 | |
Wisconsin Housing & EDA Series A (Housing Revenue) | | | 4.05 | | | | 12-1-2049 | | | | 800,000 | | | | 833,336 | |
Wisconsin Housing & EDA Series A (Housing Revenue) | | | 5.75 | | | | 11-1-2043 | | | | 2,835,000 | | | | 2,964,531 | |
Wisconsin Housing & EDA Series C (Housing Revenue) | | | 3.25 | | | | 12-1-2036 | | | | 785,000 | | | | 775,125 | |
Wisconsin Housing & EDA Series C (Housing Revenue) | | | 3.88 | | | | 11-1-2035 | | | | 1,000,000 | | | | 1,040,140 | |
Wisconsin Oneida Tribe of Indians (Tax Revenue) 144A | | | 5.50 | | | | 2-1-2021 | | | | 1,835,000 | | | | 1,923,704 | |
| |
| | | | 110,120,893 | |
| | | | | |
| |
Total Municipal Obligations (Cost $134,109,031) | | | | 137,828,357 | |
| | | | | |
| | | | | | | | |
| Total investments in securities (Cost $134,109,031) | | | 99.12 | % | | | 137,828,357 | |
Other assets and liabilities, net | | | 0.88 | | | | 1,220,649 | |
| | | | | | | | |
| Total net assets | | | 100.00 | % | | $ | 139,049,006 | |
| | | | | | | | |
| ¤ | The security is issued in zero coupon form with no periodic interest payments. |
| øø | Variable rate investment. The rate shown is the rate in effect at period end. |
| 144A | The security may be resold in transactions exempt from registration, normally to qualified institutional buyers, pursuant to Rule 144A under the Securities Act of 1933. |
| ø | Variable rate demand notes are subject to a demand feature which reduces the effective maturity. The maturity date shown represents the final maturity date of the security. The interest rate is determined and reset by the issuer daily, weekly, or monthly depending upon the terms of the security. The rate shown is the rate in effect at period end. |
The accompanying notes are an integral part of these financial statements.
| | | | |
| 12 | | Wells Fargo Wisconsin Tax-Free Fund | | Statement of assets and liabilities—December 31, 2017 (unaudited) |
| | | | |
| | | | |
| |
Assets | | | | |
Investments in unaffiliated securities, at value (cost $134,109,031) | | $ | 137,828,357 | |
Cash | | | 63,290 | |
Receivable for investments sold | | | 10,000 | |
Receivable for Fund shares sold | | | 275,148 | |
Receivable for interest | | | 1,418,182 | |
Prepaid expenses and other assets | | | 83,816 | |
| | | | |
Total assets | | | 139,678,793 | |
| | | | |
| |
Liabilities | | | | |
Payable for investments purchased | | | 320,000 | |
Payable for Fund shares redeemed | | | 161,999 | |
Dividends payable | | | 33,221 | |
Management fee payable | | | 30,585 | |
Administration fees payable | | | 19,119 | |
Distribution fee payable | | | 5,792 | |
Trustees’ fees and expenses payable | | | 2,092 | |
Accrued expenses and other liabilities | | | 56,979 | |
| | | | |
Total liabilities | | | 629,787 | |
| | | | |
Total net assets | | $ | 139,049,006 | |
| | | | |
| |
NET ASSETS CONSIST OF | | | | |
Paid-in capital | | $ | 135,431,308 | |
Overdistributed net investment income | | | (10,724 | ) |
Accumulated net realized losses on investments | | | (90,904 | ) |
Net unrealized gains on investments | | | 3,719,326 | |
| | | | |
Total net assets | | $ | 139,049,006 | |
| | | | |
| |
COMPUTATION OF NET ASSET VALUE AND OFFERING PRICE PER SHARE | | | | |
Net assets – Class A | | $ | 112,825,889 | |
Shares outstanding – Class A1 | | | 10,372,165 | |
Net asset value per share – Class A | | | $10.88 | |
Maximum offering price per share – Class A2 | | | $11.39 | |
Net assets – Class C | | $ | 8,903,086 | |
Shares outstanding – Class C1 | | | 818,505 | |
Net asset value per share – Class C | | | $10.88 | |
Net assets – Institutional Class | | $ | 17,320,031 | |
Shares outstanding – Institutional Class1 | | | 1,592,310 | |
Net asset value per share – Institutional Class | | | $10.88 | |
| 1 | The Fund has an unlimited number of authorized shares. |
| 2 | Maximum offering price is computed as 100/95.50 of net asset value. On investments of $50,000 or more, the offering price is reduced. |
The accompanying notes are an integral part of these financial statements.
| | | | | | |
| Statement of operations—six months ended December 31, 2017 (unaudited) | | Wells Fargo Wisconsin Tax-Free Fund | | | 13 | |
| | | | |
| | | | |
| |
Investment income | | | | |
Interest | | $ | 2,368,191 | |
| | | | |
| |
Expenses | | | | |
Management fee | | | 297,583 | |
Administration fees | | | | |
Class A | | | 99,037 | |
Class C | | | 7,329 | |
Institutional Class | | | 6,333 | |
Shareholder servicing fees | | | | |
Class A | | | 154,746 | |
Class C | | | 11,452 | |
Distribution fee | | | | |
Class C | | | 34,357 | |
Custody and accounting fees | | | 2,048 | |
Professional fees | | | 15,063 | |
Registration fees | | | 13,783 | |
Shareholder report expenses | | | 950 | |
Trustees’ fees and expenses | | | 10,021 | |
Other fees and expenses | | | 6,059 | |
| | | | |
Total expenses | | | 658,761 | |
Less: Fee waivers and/or expense reimbursements | | | (117,884 | ) |
| | | | |
Net expenses | | | 540,877 | |
| | | | |
Net investment income | | | 1,827,314 | |
| | | | |
| |
REALIZED AND UNREALIZED GAINS (LOSSES) ON INVESTMENTS | | | | |
Net realized gains on investments | | | 501,592 | |
Net change in unrealized gains (losses) on investments | | | 153,311 | |
| | | | |
Net realized and unrealized gains (losses) on investments | | | 654,903 | |
| | | | |
Net increase in net assets resulting from operations | | $ | 2,482,217 | |
| | | | |
The accompanying notes are an integral part of these financial statements.
| | | | |
| 14 | | Wells Fargo Wisconsin Tax-Free Fund | | Statement of changes in net assets |
| | | | | | | | | | | | | | | | |
| | | Six months ended
December 31, 2017 (unaudited) | | | Year ended
June 30, 2017 | |
| | | | |
Operations | | | | | | | | | | | | | | | | |
Net investment income | | | | | | $ | 1,827,314 | | | | | | | $ | 3,855,173 | |
Net realized gains (losses) on investments | | | | | | | 501,592 | | | | | | | | (594,954 | ) |
Net change in unrealized gains (losses) on investments | | | | | | | 153,311 | | | | | | | | (4,361,846 | ) |
| | | | |
Net increase (decrease) in net assets resulting from operations | | | | | | | 2,482,217 | | | | | | | | (1,101,627 | ) |
| | | | |
| | | | |
Distributions to shareholders from | | | | | | | | | | | | | | | | |
Net investment income | | | | | | | | | | | | | | | | |
Class A | | | | | | | (1,536,256 | ) | | | | | | | (3,557,019 | ) |
Class C | | | | | | | (79,633 | ) | | | | | | | (172,568 | ) |
Institutional Class | | | | | | | (211,425 | ) | | | | | | | (125,586 | )1 |
Net realized gains | | | | | | | | | | | | | | | | |
Class A | | | | | | | 0 | | | | | | | | (142,177 | ) |
Class C | | | | | | | 0 | | | | | | | | (9,882 | ) |
Institutional Class | | | | | | | 0 | | | | | | | | (994 | )1 |
| | | | |
Total distributions to shareholders | | | | | | | (1,827,314 | ) | | | | | | | (4,008,226 | ) |
| | | | |
| | | | |
Capital share transactions | | | Shares | | | | | | | | Shares | | | | | |
Proceeds from shares sold | | | | | | | | | | | | | | | | |
Class A | | | 691,286 | | | | 7,520,193 | | | | 1,860,008 | | | | 20,164,339 | |
Class C | | | 44,091 | | | | 479,554 | | | | 91,778 | | | | 1,003,341 | |
Institutional Class | | | 475,770 | | | | 5,177,604 | | | | 1,421,443 | 1 | | | 15,229,319 | 1 |
| | | | |
| | | | | | | 13,177,351 | | | | | | | | 36,396,999 | |
| | | | |
Reinvestment of distributions | | | | | | | | | | | | | | | | |
Class A | | | 125,214 | | | | 1,363,067 | | | | 307,156 | | | | 3,331,908 | |
Class C | | | 7,219 | | | | 78,588 | | | | 16,607 | | | | 179,986 | |
Institutional Class | | | 19,287 | | | | 209,934 | | | | 11,725 | 1 | | | 126,578 | 1 |
| | | | |
| | | | | | | 1,651,589 | | | | | | | | 3,638,472 | |
| | | | |
Payment for shares redeemed | | | | | | | | | | | | | | | | |
Class A | | | (2,584,220 | ) | | | (28,135,473 | ) | | | (4,403,681 | ) | | | (47,523,168 | ) |
Class C | | | (105,053 | ) | | | (1,144,252 | ) | | | (217,008 | ) | | | (2,352,650 | ) |
Institutional Class | | | (155,696 | ) | | | (1,695,600 | ) | | | (180,219 | )1 | | | (1,937,935 | )1 |
| | | | |
| | | | | | | (30,975,325 | ) | | | | | | | (51,813,753 | ) |
| | | | |
Net decrease in net assets resulting from capital share transactions | | | | | | | (16,146,385 | ) | | | | | | | (11,778,282 | ) |
| | | | |
Total decrease in net assets | | | | | | | (15,491,482 | ) | | | | | | | (16,888,135 | ) |
| | | | |
| | | | |
Net assets | | | | | | | | | | | | | | | | |
Beginning of period | | | | | | | 154,540,488 | | | | | | | | 171,428,623 | |
| | | | |
End of period | | | | | | $ | 139,049,006 | | | | | | | $ | 154,540,488 | |
| | | | |
Overdistributed net investment income | | | | | | $ | (10,724 | ) | | | | | | $ | (10,724 | ) |
| | | | |
| 1 | For the period from October 31, 2016 (commencement of class operations) to June 30, 2017 |
The accompanying notes are an integral part of these financial statements.
| | | | | | |
| Financial highlights | | Wells Fargo Wisconsin Tax-Free Fund | | | 15 | |
(For a share outstanding throughout each period)
| | | | | | | | | | | | | | | | | | | | | | | | |
| | | Six months ended
December 31, 2017 (unaudited) | | | Year ended June 30 | |
| CLASS A | | | 2017 | | | 2016 | | | 2015 | | | 2014 | | | 2013 | |
Net asset value, beginning of period | | | $10.83 | | | | $11.16 | | | | $10.83 | | | | $10.96 | | | | $10.86 | | | | $11.09 | |
Net investment income | | | 0.14 | | | | 0.26 | | | | 0.25 | | | | 0.24 | | | | 0.33 | | | | 0.27 | |
Net realized and unrealized gains (losses) on investments | | | 0.05 | | | | (0.32 | ) | | | 0.33 | | | | (0.02 | ) | | | 0.18 | | | | (0.22 | ) |
| | | | | | | | | | | | | | | | | | | | | | | | |
Total from investment operations | | | 0.19 | | | | (0.06 | ) | | | 0.58 | | | | 0.22 | | | | 0.51 | | | | 0.05 | |
Distributions to shareholders from | | | | | | | | | | | | | | | | | | | | | | | | |
Net investment income | | | (0.14 | ) | | | (0.26 | ) | | | (0.25 | ) | | | (0.24 | ) | | | (0.33 | ) | | | (0.27 | ) |
Net realized gains | | | 0.00 | | | | (0.01 | ) | | | (0.00 | )1 | | | (0.11 | ) | | | (0.08 | ) | | | (0.01 | ) |
| | | | | | | | | | | | | | | | | | | | | | | | |
Total distributions to shareholders | | | (0.14 | ) | | | (0.27 | ) | | | (0.25 | ) | | | (0.35 | ) | | | (0.41 | ) | | | (0.28 | ) |
Net asset value, end of period | | | $10.88 | | | | $10.83 | | | | $11.16 | | | | $10.83 | | | | $10.96 | | | | $10.86 | |
Total return2 | | | 1.73 | % | | | (0.48 | )% | | | 5.44 | % | | | 2.07 | % | | | 4.80 | % | | | 0.46 | % |
Ratios to average net assets (annualized) | | | | | | | | | | | | | | | | | | | | | | | | |
Gross expenses | | | 0.87 | % | | | 0.93 | % | | | 0.94 | % | | | 0.90 | % | | | 0.92 | % | | | 0.90 | % |
Net expenses | | | 0.70 | % | | | 0.70 | % | | | 0.70 | % | | | 0.70 | % | | | 0.70 | % | | | 0.70 | % |
Net investment income | | | 2.48 | % | | | 2.41 | % | | | 2.26 | % | | | 2.22 | % | | | 3.02 | % | | | 2.44 | % |
Supplemental data | | | | | | | | | | | | | | | | | | | | | | | | |
Portfolio turnover rate | | | 6 | % | | | 27 | % | | | 16 | % | | | 28 | % | | | 25 | % | | | 31 | % |
Net assets, end of period (000s omitted) | | | $112,826 | | | | $131,518 | | | | $160,480 | | | | $23,824 | | | | $19,825 | | | | $25,641 | |
| 1 | Amount is less than $0.005. |
| 2 | Total return calculations do not include any sales charges. Returns for periods of less than one year are not annualized. |
The accompanying notes are an integral part of these financial statements.
| | | | |
| 16 | | Wells Fargo Wisconsin Tax-Free Fund | | Financial highlights |
(For a share outstanding throughout each period)
| | | | | | | | | | | | | | | | | | | | | | | | |
| | | Six months ended
December 31, 2017 (unaudited) | | | Year ended June 30 | |
| CLASS C | | | 2017 | | | 2016 | | | 2015 | | | 2014 | | | 2013 | |
Net asset value, beginning of period | | | $10.83 | | | | $11.16 | | | | $10.83 | | | | $10.96 | | | | $10.86 | | | | $11.09 | |
Net investment income | | | 0.09 | | | | 0.18 | | | | 0.17 | | | | 0.16 | | | | 0.25 | | | | 0.19 | |
Net realized and unrealized gains (losses) on investments | | | 0.05 | | | | (0.32 | ) | | | 0.33 | | | | (0.02 | ) | | | 0.18 | | | | (0.22 | ) |
| | | | | | | | | | | | | | | | | | | | | | | | |
Total from investment operations | | | 0.14 | | | | (0.14 | ) | | | 0.50 | | | | 0.14 | | | | 0.43 | | | | (0.03 | ) |
Distributions to shareholders from | | | | | | | | | | | | | | | | | | | | | | | | |
Net investment income | | | (0.09 | ) | | | (0.18 | ) | | | (0.17 | ) | | | (0.16 | ) | | | (0.25 | ) | | | (0.19 | ) |
Net realized gains | | | 0.00 | | | | (0.01 | ) | | | (0.00 | )1 | | | (0.11 | ) | | | (0.08 | ) | | | (0.01 | ) |
| | | | | | | | | | | | | | | | | | | | | | | | |
Total distributions to shareholders | | | (0.09 | ) | | | (0.19 | ) | | | (0.17 | ) | | | (0.27 | ) | | | (0.33 | ) | | | (0.20 | ) |
Net asset value, end of period | | | $10.88 | | | | $10.83 | | | | $11.16 | | | | $10.83 | | | | $10.96 | | | | $10.86 | |
Total return2 | | | 1.34 | % | | | (1.22 | )% | | | 4.66 | % | | | 1.31 | % | | | 4.02 | % | | | (0.29 | )% |
Ratios to average net assets (annualized) | | | | | | | | | | | | | | | | | | | | | | | | |
Gross expenses | | | 1.63 | % | | | 1.68 | % | | | 1.68 | % | | | 1.65 | % | | | 1.67 | % | | | 1.65 | % |
Net expenses | | | 1.45 | % | | | 1.45 | % | | | 1.45 | % | | | 1.45 | % | | | 1.45 | % | | | 1.45 | % |
Net investment income | | | 1.74 | % | | | 1.67 | % | | | 1.52 | % | | | 1.47 | % | | | 2.28 | % | | | 1.69 | % |
Supplemental data | | | | | | | | | | | | | | | | | | | | | | | | |
Portfolio turnover rate | | | 6 | % | | | 27 | % | | | 16 | % | | | 28 | % | | | 25 | % | | | 31 | % |
Net assets, end of period (000s omitted) | | | $8,903 | | | | $9,449 | | | | $10,949 | | | | $10,923 | | | | $10,431 | | | | $12,094 | |
| 1 | Amount is less than $0.005. |
| 2 | Total return calculations do not include any sales charges. Returns for periods of less than one year are not annualized. |
The accompanying notes are an integral part of these financial statements.
| | | | | | |
| Financial highlights | | Wells Fargo Wisconsin Tax-Free Fund | | | 17 | |
(For a share outstanding throughout each period)
| | | | | | | | |
| | | Six months ended
December 31, 2017 (unaudited) | | | Year ended June 30 20171 | |
| INSTITUTIONAL CLASS | | |
Net asset value, beginning of period | | | $10.83 | | | | $10.99 | |
Net investment income | | | 0.15 | | | | 0.20 | |
Net realized and unrealized gains (losses) on investments | | | 0.05 | | | | (0.15 | ) |
| | | | | | | | |
Total from investment operations | | | 0.20 | | | | 0.05 | |
Distributions to shareholders from | | | | | | | | |
Net investment income | | | (0.15 | ) | | | (0.20 | ) |
Net realized gains | | | 0.00 | | | | (0.01 | ) |
| | | | | | | | |
Total distributions to shareholders | | | (0.15 | ) | | | (0.21 | ) |
Net asset value, end of period | | | $10.88 | | | | $10.83 | |
Total return2 | | | 1.82 | % | | | 0.44 | % |
Ratios to average net assets (annualized) | | | | | | | | |
Gross expenses | | | 0.55 | % | | | 0.54 | % |
Net expenses | | | 0.52 | % | | | 0.52 | % |
Net investment income | | | 2.67 | % | | | 2.74 | % |
Supplemental data | | | | | | | | |
Portfolio turnover rate | | | 6 | % | | | 27 | % |
Net assets, end of period (000s omitted) | | | $17,320 | | | | $13,573 | |
| 1 | For the period from October 31, 2016 (commencement of class operations) to June 30, 2017 |
| 2 | Returns for periods of less than one year are not annualized. |
The accompanying notes are an integral part of these financial statements.
| | | | |
| 18 | | Wells Fargo Wisconsin Tax-Free Fund | | Notes to financial statements (unaudited) |
1. ORGANIZATION
Wells Fargo Funds Trust (the “Trust”), a Delaware statutory trust organized on March 10, 1999, is an open-end management investment company registered under the Investment Company Act of 1940, as amended (the “1940 Act”). As an investment company, the Trust follows the accounting and reporting guidance in Financial Accounting Standards Board Accounting Standards Codification Topic 946, Financial Services – Investment Companies. These financial statements report on the Wells Fargo Wisconsin Tax-Free Fund (the “Fund”) which is a non-diversified series of the Trust.
2. SIGNIFICANT ACCOUNTING POLICIES
The following significant accounting policies, which are consistently followed in the preparation of the financial statements of the Fund, are in conformity with U.S. generally accepted accounting principles which require management to make estimates and assumptions that affect the reported amounts of assets and liabilities, disclosure of contingent assets and liabilities at the date of the financial statements, and the reported amounts of revenues and expenses during the reporting period. Actual results could differ from those estimates.
Securities valuation
All investments are valued each business day as of the close of regular trading on the New York Stock Exchange (generally 4 p.m. Eastern Time), although the Fund may deviate from this calculation time under unusual or unexpected circumstances.
Debt securities are valued at the evaluated bid price provided by an independent pricing service or, if a reliable price is not available, the quoted bid price from an independent broker-dealer.
Investments which are not valued using any of the methods discussed above are valued at their fair value, as determined in good faith by the Board of Trustees of the Fund. The Board of Trustees has established a Valuation Committee comprised of the Trustees and has delegated to it the authority to take any actions regarding the valuation of portfolio securities that the Valuation Committee deems necessary or appropriate, including determining the fair value of portfolio securities, unless the determination has been delegated to the Management Valuation Team of Wells Fargo Funds Management, LLC (“Funds Management”). The Board of Trustees retains the authority to make or ratify any valuation decisions or approve any changes to the Valuation Procedures as it deems appropriate. On a quarterly basis, the Board of Trustees receives reports on any valuation actions taken by the Valuation Committee or the Management Valuation Team which may include items for ratification.
Valuations of fair valued securities are compared to the next actual sales price when available, or other appropriate market values, to assess the continued appropriateness of the fair valuation methodologies used. These securities are fair valued on a day-to-day basis, taking into consideration changes to appropriate market information and any significant changes to the inputs considered in the valuation process until there is a readily available price provided on an exchange or by an independent pricing service. Valuations received from an independent pricing service or independent broker-dealer quotes are periodically validated by comparisons to most recent trades and valuations provided by other independent pricing services in addition to the review of prices by the manager and/or subadviser. Unobservable inputs used in determining fair valuations are identified based on the type of security, taking into consideration factors utilized by market participants in valuing the investment, knowledge about the issuer and the current market environment.
When-issued transactions
The Fund may purchase securities on a forward commitment or when-issued basis. The Fund records a when-issued transaction on the trade date and will segregate assets in an amount at least equal in value to the Fund’s commitment to purchase when-issued securities. Securities purchased on a when-issued basis are marked-to-market daily and the Fund begins earning interest on the settlement date. Losses may arise due to changes in the market value of the underlying securities or if the counterparty does not perform under the contract.
Security transactions and income recognition
Securities transactions are recorded on a trade date basis. Realized gains or losses are recorded on the basis of identified cost.
Interest income is accrued daily and bond discounts are accreted and premiums are amortized daily based on the effective interest method. To the extent debt obligations are placed on non-accrual status, any related interest income may be reduced by writing off interest receivables when the collection of all or a portion of interest has been determined to be doubtful based on consistently applied procedures and the fair value has decreased. If the issuer subsequently resumes interest payments or when the collectability of interest is reasonably assured, the debt obligation is removed from non-accrual status.
| | | | | | |
| Notes to financial statements (unaudited) | | Wells Fargo Wisconsin Tax-Free Fund | | | 19 | |
Distributions to shareholders
Distributions to shareholders from net investment income are accrued daily and paid monthly. Distributions from net realized gains, if any, are recorded on the ex-dividend date. Such distributions are determined in accordance with income tax regulations and may differ from U.S. generally accepted accounting principles. Dividend sources are estimated at the time of declaration. The tax character of distributions is determined as of the Fund’s fiscal year end. Therefore, a portion of the Fund’s distributions made prior to the Fund’s fiscal year end may be categorized as a tax return of capital.
Federal and other taxes
The Fund intends to continue to qualify as a regulated investment company by distributing substantially all of its investment company taxable and tax-exempt income and any net realized capital gains (after reduction for capital loss carryforwards) sufficient to relieve it from all, or substantially all, federal income taxes. Accordingly, no provision for federal income taxes was required.
The Fund’s income and federal excise tax returns and all financial records supporting those returns for the prior three fiscal years are subject to examination by the federal and Delaware revenue authorities. Management has analyzed the Fund’s tax positions taken on federal, state, and foreign tax returns for all open tax years and does not believe that there are any uncertain tax positions that require recognition of a tax liability.
As of December 31, 2017, the aggregate cost of all investments for federal income tax purposes was $134,108,546 and the unrealized gains (losses) consisted of:
| | | | |
Gross unrealized gains | | $ | 4,264,233 | |
Gross unrealized losses | | | (544,422 | ) |
Net unrealized gains | | $ | 3,719,811 | |
As of June 30, 2017, the Fund had capital loss carryforwards which consist of $8,353 in short-term capital losses.
As of June 30, 2017, the Fund had current year net deferred post-October capital losses consisting of $584,622 in short-term losses which was recognized on the first day of the current fiscal year.
Class allocations
The separate classes of shares offered by the Fund differ principally in applicable sales charges, distribution, shareholder servicing, and administration fees. Class specific expenses are charged directly to that share class. Investment income, common expenses, and realized and unrealized gains (losses) on investments are allocated daily to each class of shares based on the relative proportion of net assets of each class.
3. FAIR VALUATION MEASUREMENTS
Fair value measurements of investments are determined within a framework that has established a fair value hierarchy based upon the various data inputs utilized in determining the value of the Fund’s investments. The three-level hierarchy gives the highest priority to unadjusted quoted prices in active markets for identical assets or liabilities (Level 1) and the lowest priority to unobservable inputs (Level 3). The Fund’s investments are classified within the fair value hierarchy based on the lowest level of input that is significant to the fair value measurement. The inputs are summarized into three broad levels as follows:
| ∎ | | Level 1 – quoted prices in active markets for identical securities |
| ∎ | | Level 2 – other significant observable inputs (including quoted prices for similar securities, interest rates, prepayment speeds, credit risk, etc.) |
| ∎ | | Level 3 – significant unobservable inputs (including the Fund’s own assumptions in determining the fair value of investments) |
The inputs or methodologies used for valuing investments in securities are not necessarily an indication of the risk associated with investing in those securities.
| | | | |
| 20 | | Wells Fargo Wisconsin Tax-Free Fund | | Notes to financial statements (unaudited) |
The following is a summary of the inputs used in valuing the Fund’s assets and liabilities as of December 31, 2017:
| | | | | | | | | | | | | | | | |
| | | Quoted prices
(Level 1) | | | Other significant
observable inputs
(Level 2) | | | Significant
unobservable inputs (Level 3) | | | Total | |
Assets | | | | | | | | | | | | | | | | |
Investments in: | | | | | | | | | | | | | | | | |
| | | | |
Municipal obligations | | $ | 0 | | | $ | 137,828,357 | | | $ | 0 | | | $ | 137,828,357 | |
The Fund recognizes transfers between levels within the fair value hierarchy at the end of the reporting period. At December 31, 2017, the Fund did not have any transfers into/out of Level 1, Level 2, or Level 3.
4. TRANSACTIONS WITH AFFILIATES
Management fee
Funds Management, an indirect wholly owned subsidiary of Wells Fargo & Company (“Wells Fargo”), is the manager of the Fund and provides advisory and fund-level administrative services under an investment management agreement. Under the investment management agreement, Funds Management is responsible for, among other services, implementing the investment objectives and strategies of the Fund, supervising the subadviser, providing fund-level administrative services in connection with the Fund’s operations, and providing any other fund-level administrative services reasonably necessary for the operation of the Fund. As compensation for its services under the investment management agreement, Funds Management is entitled to receive an annual management fee starting at 0.40% and declining to 0.28% as the average daily net assets of the Fund increase. For the six months ended December 31, 2017, the management fee was equivalent to an annual rate of 0.40% of the Fund’s average daily net assets.
Funds Management has retained the services of a subadviser to provide daily portfolio management to the Fund. The fee for subadvisory services is borne by Funds Management. Wells Capital Management Incorporated, an affiliate of Funds Management and an indirect wholly owned subsidiary of Wells Fargo, is the subadviser to the Fund and is entitled to receive a fee from Funds Management at an annual rate starting at 0.20% and declining to 0.10% as the average daily net assets of the Fund increase.
Administration fees
Under a class-level administration agreement, Funds Management provides class-level administrative services to the Fund, which includes paying fees and expenses for services provided by the transfer agent, sub-transfer agents, omnibus account servicers and record-keepers. As compensation for its services under the class-level administration agreement, Funds Management receives an annual fee which is calculated based on the average daily net assets of each class as follows:
| | | | |
| | | Class-level
administration fee | |
Class A, Class C | | | 0.16 | % |
Institutional Class | | | 0.08 | |
Funds Management has contractually waived and/or reimbursed management and administration fees to the extent necessary to maintain certain net operating expense ratios for the Fund. Waiver of fees and/or reimbursement of expenses by Funds Management were made first from fund level expenses on a proportionate basis and then from class specific expenses. Funds Management has committed through October 31, 2018 to waive fees and/or reimburse expenses to the extent necessary to cap the Fund’s expenses at 0.70% for Class A shares, 1.45% for Class C shares, and 0.52% for Institutional Class shares. After this time, the cap may be increased or the commitment to maintain the cap may be terminated only with the approval of the Board of Trustees.
Distribution fee
The Trust has adopted a distribution plan for Class C shares of the Fund pursuant to Rule 12b-1 under the 1940 Act. A distribution fee is charged to Class C shares and paid to Wells Fargo Funds Distributor, LLC (“Funds Distributor”), the principal underwriter, at an annual rate of 0.75% of the average daily net assets of Class C shares.
In addition, Funds Distributor is entitled to receive the front-end sales charge from the purchase of Class A shares and a contingent deferred sales charge on the redemption of certain Class A shares. Funds Distributor is also entitled to receive
| | | | | | |
| Notes to financial statements (unaudited) | | Wells Fargo Wisconsin Tax-Free Fund | | | 21 | |
the contingent deferred sales charges from redemptions of Class C shares. For the six months ended December 31, 2017, Funds Distributor received $579 from the sale of Class A shares. No contingent deferred sales charges were incurred by Class A and Class C shares for the six months ended December 31, 2017.
Shareholder servicing fees
The Trust has entered into contracts with one or more shareholder servicing agents, whereby Class A and Class C of the Fund are charged a fee at an annual rate of 0.25% of the average daily net assets of each respective class.
A portion of these total shareholder servicing fees were paid to affiliates of Wells Fargo.
Interfund transactions
The Fund may purchase or sell portfolio investment securities to certain other Wells Fargo affiliates pursuant to Rule 17a-7 under the 1940 Act and under procedures adopted by the Board of Trustees. The procedures have been designed to ensure that these interfund transactions, which do not incur broker commissions, are effected at current market prices. Pursuant to these procedures, the Fund had $6,130,000 and $15,310,000 in interfund purchases and sales, respectively, during the six months ended December 31, 2017.
5. INVESTMENT PORTFOLIO TRANSACTIONS
Purchases and sales of investments, excluding U.S. government obligations (if any) and short-term securities, for the six months ended December 31, 2017 were $8,214,806 and $23,539,812, respectively.
6. BANK BORROWINGS
The Trust (excluding the money market funds and certain other funds) and Wells Fargo Variable Trust are parties to a $280,000,000 revolving credit agreement whereby the Fund is permitted to use bank borrowings for temporary or emergency purposes, such as to fund shareholder redemption requests. Interest under the credit agreement is charged to the Fund based on a borrowing rate equal to the higher of the Federal Funds rate in effect on that day plus 1.25% or the overnight LIBOR rate in effect on that day plus 1.25%. In addition, an annual commitment fee equal to 0.25% of the unused balance is allocated to each participating fund. Prior to August 29, 2017, the revolving credit agreement amount was $250,000,000.
For the six months ended December 31, 2017, there were no borrowings by the Fund under the agreement.
7. CONCENTRATION RISK
The Fund invests a substantial portion of its assets in issuers of municipal debt securities located in a single state or territories of the U.S. Therefore, it may be more affected by economic and political developments in that state or region than would be a comparable general tax-exempt fund.
8. INDEMNIFICATION
Under the Trust’s organizational documents, the officers and Trustees have been granted certain indemnification rights against certain liabilities that may arise out of performance of their duties to the Trust. Additionally, in the normal course of business, the Trust may enter into contracts with service providers that contain a variety of indemnification clauses. The Trust’s maximum exposure under these arrangements is dependent on future claims that may be made against the Fund and, therefore, cannot be estimated.
| | | | |
| 22 | | Wells Fargo Wisconsin Tax-Free Fund | | Other information (unaudited) |
PROXY VOTING INFORMATION
A description of the policies and procedures that the Fund uses to determine how to vote proxies relating to portfolio securities is available, upon request, by calling 1-800-222-8222, visiting our website at wellsfargofunds.com, or visiting the SEC website at sec.gov. Information regarding how the Fund voted proxies relating to portfolio securities during the most recent 12-month period ended June 30 is available on the Fund’s website at wellsfargofunds.com or by visiting the SEC website at sec.gov.
PORTFOLIO HOLDINGS INFORMATION
The complete portfolio holdings for the Fund are publicly available monthly on the Fund’s website (wellsfargofunds.com), on a one-month delayed basis. In addition, top ten holdings information (excluding derivative positions) for the Fund is publicly available on the Fund’s website on a monthly, seven-day or more delayed basis. The Fund files its complete schedule of portfolio holdings with the SEC for the first and third quarters of each fiscal year on Form N-Q, which is available by visiting the SEC website at sec.gov. In addition, the Fund’s Form N-Q may be reviewed and copied at the SEC’s Public Reference Room in Washington, DC, and at regional offices in New York City, at 233 Broadway, and in Chicago, at 175 West Jackson Boulevard, Suite 900. Information about the Public Reference Room may be obtained by calling 1-800-SEC-0330.
| | | | | | |
| Other information (unaudited) | | Wells Fargo Wisconsin Tax-Free Fund | | | 23 | |
BOARD OF TRUSTEES AND OFFICERS
Each of the Trustees and Officers1 listed in the table below acts in identical capacities for each fund in the Wells Fargo family of funds, which consists of 153 mutual funds comprising the Wells Fargo Funds Trust, Wells Fargo Variable Trust, Wells Fargo Master Trust and four closed-end funds (collectively the “Fund Complex”). This table should be read in conjunction with the Prospectus and the Statement of Additional Information2. The mailing address of each Trustee and Officer is 525 Market Street, 12th Floor, San Francisco, CA 94105. Each Trustee and Officer serves an indefinite term, however, each Trustee serves such term until reaching the mandatory retirement age established by the Trustees.
Independent Trustees
| | | | | | |
Name and year of birth | | Position held and length of service* | | Principal occupations during past five years or longer | | Current other public company or investment company directorships |
William R. Ebsworth (Born 1957) | | Trustee, since 2015 | | Retired. From 1984 to 2013, equities analyst, portfolio manager, research director and chief investment officer at Fidelity Management and Research Company in Boston, Tokyo, and Hong Kong, and retired in 2013 as Chief Investment Officer of Fidelity Strategic Advisers, Inc. where he led a team of investment professionals managing client assets. Prior thereto, Board member of Hong Kong Securities Clearing Co., Hong Kong Options Clearing Corp., the Thailand International Fund, Ltd., Fidelity Investments Life Insurance Company, and Empire Fidelity Investments Life Insurance Company. Board member of the Forté Foundation (non-profit organization) and the Vincent Memorial Hospital Endowment (non-profit organization), where he serves on the Investment Committee and as a Chair of the Audit Committee. Mr. Ebsworth is a CFA® charterholder. | | Asset Allocation Trust |
Jane A. Freeman** (Born 1953) | | Trustee, since 2015; Chair Liaison, since 2018 | | Retired. From 2012 to 2014 and 1999 to 2008, Chief Financial Officer of Scientific Learning Corporation. From 2008 to 2012, Ms. Freeman provided consulting services related to strategic business projects. Prior to 1999, Portfolio Manager at Rockefeller & Co. and Scudder, Stevens & Clark. Board member of the Harding Loevner Funds from 1996 to 2014, serving as both Lead Independent Director and chair of the Audit Committee. Board member of the Russell Exchange Traded Funds Trust from 2011 to 2012 and the chair of the Audit Committee. Ms. Freeman is a Board Member of Ruth Bancroft Garden (non-profit organization) and the Glimmerglass Festival. She is also an inactive Chartered Financial Analyst. | | Asset Allocation Trust |
Peter G. Gordon*** (Born 1942) | | Trustee, since 1998; Chairman, from 2005 to 2017 | | Co-Founder, Retired Chairman, President and CEO of Crystal Geyser Water Company. Trustee Emeritus, Colby College. | | Asset Allocation Trust |
Isaiah Harris, Jr. (Born 1952) | | Trustee, since 2009 | | Retired. Chairman of the Board of CIGNA Corporation since 2009, and Director since 2005. From 2003 to 2011, Director of Deluxe Corporation. Prior thereto, President and CEO of BellSouth Advertising and Publishing Corp. from 2005 to 2007, President and CEO of BellSouth Enterprises from 2004 to 2005 and President of BellSouth Consumer Services from 2000 to 2003. Emeritus member of the Iowa State University Foundation Board of Governors. Emeritus Member of the Advisory Board of Iowa State University School of Business. Advisory Board Member, Palm Harbor Academy (charter school). Advisory Board Member, Child Evangelism Fellowship (non-profit). Mr. Harris is a certified public accountant (inactive status). | | CIGNA Corporation; Asset Allocation Trust |
Judith M. Johnson (Born 1949) | | Trustee, since 2008; Audit Committee Chairman, since 2008 | | Retired. Prior thereto, Chief Executive Officer and Chief Investment Officer of Minneapolis Employees Retirement Fund from 1996 to 2008. Ms. Johnson is an attorney, certified public accountant and a certified managerial accountant. | | Asset Allocation Trust |
David F. Larcker (Born 1950) | | Trustee, since 2009 | | James Irvin Miller Professor of Accounting at the Graduate School of Business, Stanford University, Director of the Corporate Governance Research Initiative and Senior Faculty of The Rock Center for Corporate Governance since 2006. From 2005 to 2008, Professor of Accounting at the Graduate School of Business, Stanford University. Prior thereto, Ernst & Young Professor of Accounting at The Wharton School, University of Pennsylvania from 1985 to 2005. | | Asset Allocation Trust |
| | | | |
| 24 | | Wells Fargo Wisconsin Tax-Free Fund | | Other information (unaudited) |
| | | | | | |
Name and year of birth | | Position held and length of service* | | Principal occupations during past five years or longer | | Current other public company or investment company directorships |
Olivia S. Mitchell**** (Born 1953) | | Trustee, since 2006; Governance Committee Chairman, since 2018 | | International Foundation of Employee Benefit Plans Professor, Wharton School of the University of Pennsylvania since 1993. Director of Wharton’s Pension Research Council and Boettner Center on Pensions & Retirement Research, and Research Associate at the National Bureau of Economic Research. Previously, Cornell University Professor from 1978 to 1993. | | Asset Allocation Trust |
Timothy J. Penny***** (Born 1951) | | Trustee, since 1996; Chairman, since 2018; Vice Chairman, from 2017 to 2018 | | President and Chief Executive Officer of Southern Minnesota Initiative Foundation, a non-profit organization, since 2007. Member of the Board of Trustees of NorthStar Education Finance, Inc., a non-profit organization, since 2007. | | Asset Allocation Trust |
James G. Polisson****** (Born 1959) | | Trustee, since 2018; Advisory Board Member, from 2017 to 2018 | | Retired. Chief Marketing Officer, Source (ETF) UK Services, Ltd, from 2015 to 2017. From 2012 to 2015, Principal of The Polisson Group, LLC, a management consulting, corporate advisory and principal investing company. Chief Executive Officer and Managing Director at Russell Investments, Global Exchange Traded Funds from 2010 to 2012. Managing Director of Barclays Global Investors from 1998 to 2010 and Global Chief Marketing Officer for iShares and Barclays Global Investors from 2000 to 2010. Trustee of the San Francisco Mechanics’ Institute, a non-profit organization, from 2013 to 2015. Board member of the Russell Exchange Traded Fund Trust from 2011 to 2012. Director of Barclays Global Investors Holdings Deutschland GmbH from 2006 to 2009. Mr. Polisson is an attorney and has a retired status with the Massachusetts and District of Columbia Bar Associations. | | Asset Allocation Trust |
Michael S. Scofield (Born 1943) | | Trustee, since 2010 | | Served on the Investment Company Institute’s Board of Governors and Executive Committee from 2008-2011 as well the Governing Council of the Independent Directors Council from 2006-2011 and the Independent Directors Council Executive Committee from 2008-2011. Trustee of the Evergreen Funds complex (and its predecessors) from 1984 to 2010. Chairman of the Evergreen Funds from 2000-2010. Former Trustee of the Mentor Funds. Retired Attorney, Law Offices of Michael S. Scofield. | | Asset Allocation Trust |
Pamela Wheelock****** (Born 1959) | | Trustee, since 2018; Advisory Board Member, from 2017 to 2018 | | Chief Operating Officer, Twin Cities Habitat for Humanity, since January, 2017. Vice President of University Services, University of Minnesota from 2012 to 2017. Prior thereto, Interim President and Chief Executive Officer of Blue Cross Blue Shield of Minnesota from 2010 to 2011, Chairman of the Board from 2009 to 2011 and Board Director from 2003 to 2015. Vice President, Leadership and Community Engagement, Bush Foundation, Saint Paul, Minnesota (a private foundation) from 2009 to 2011. Executive Vice President and Chief Financial Officer, Minnesota Sports and Entertainment from 2004 to 2009 and Senior Vice President from 2002 to 2004. Commissioner of Finance, State of Minnesota, from 1999 to 2002. Currently on the Board of Directors, Governance Committee and Finance Committee, for the Minnesota Philanthropy Partners (Saint Paul Foundation) since 2012 and Board Chair of the Minnesota Wild Foundation since 2010. | | Asset Allocation Trust |
| * | Length of service dates reflect the Trustee’s commencement of service with the Trust’s predecessor entities, where applicable. |
| ** | Jane Freeman became Chair Liaison effective January 1, 2018. |
| *** | Peter Gordon retired on December 31, 2017. |
| **** | Olivia Mitchell became Chairman of the Governance Committee effective January 1, 2018. |
| ***** | Timothy Penny became Chairman effective January 1, 2018. |
| ****** | James Polisson and Pamela Wheelock each became a Trustee effective January 1, 2018. |
| | | | | | |
| Other information (unaudited) | | Wells Fargo Wisconsin Tax-Free Fund | | | 25 | |
Officers
| | | | | | |
Name and year of birth | | Position held and length of service | | Principal occupations during past five years or longer | | |
Andrew Owen (Born 1960) | | President, since 2017 | | Executive Vice President of Wells Fargo & Company and Head of Affiliated Managers, Wells Fargo Asset Management, since 2014. In addition, Mr. Owen is currently President, Chief Executive Officer and Director of Wells Fargo Funds Management, LLC since 2017. Prior thereto, Executive Vice President responsible for marketing, investments and product development for Wells Fargo Funds Management, LLC, from 2009 to 2014. | | |
Nancy Wiser1 (Born 1967) | | Treasurer, since 2012 | | Executive Vice President of Wells Fargo Funds Management, LLC since 2011. Chief Operating Officer and Chief Compliance Officer at LightBox Capital Management LLC, from 2008 to 2011. | | |
C. David Messman (Born 1960) | | Secretary, since 2000; Chief Legal Officer, since 2003 | | Senior Vice President and Secretary of Wells Fargo Funds Management, LLC since 2001. Assistant General Counsel of Wells Fargo Bank, N.A. since 2013 and Vice President and Managing Counsel of Wells Fargo Bank, N.A. from 1996 to 2013. | | |
Michael H. Whitaker (Born 1967) | | Chief Compliance Officer, since 2016 | | Senior Vice President and Chief Compliance Officer since 2016. Senior Vice President and Chief Compliance Officer for Fidelity Investments from 2007 to 2016. | | |
David Berardi (Born 1975) | | Assistant Treasurer, since 2009 | | Vice President of Wells Fargo Funds Management, LLC since 2009. Vice President of Evergreen Investment Management Company, LLC from 2008 to 2010. Manager of Fund Reporting and Control for Evergreen Investment Management Company, LLC from 2004 to 2010. | | |
Jeremy DePalma1 (Born 1974) | | Assistant Treasurer, since 2009 | | Senior Vice President of Wells Fargo Funds Management, LLC since 2009. Senior Vice President of Evergreen Investment Management Company, LLC from 2008 to 2010 and head of the Fund Reporting and Control Team within Fund Administration from 2005 to 2010. | | |
| 1 | Nancy Wiser acts as Treasurer of 77 funds in the Fund Complex. Jeremy DePalma acts as Treasurer of 76 funds and Assistant Treasurer of 77 funds in the Fund Complex. |
| 2 | The Statement of Additional Information includes additional information about the Trustees and is available, without charge, upon request, by calling 1-800-222-8222 or by visiting the website at wellsfargofunds.com. |
| | | | |
| 26 | | Wells Fargo Wisconsin Tax-Free Fund | | List of abbreviations |
The following is a list of common abbreviations for terms and entities that may have appeared in this report.
| ACA | — ACA Financial Guaranty Corporation |
| ADR | — American depositary receipt |
| ADS | — American depositary shares |
| AGC | — Assured Guaranty Corporation |
| AGM | — Assured Guaranty Municipal |
| Ambac | — Ambac Financial Group Incorporated |
| AMT | — Alternative minimum tax |
| BAN | — Bond anticipation notes |
| BHAC | — Berkshire Hathaway Assurance Corporation |
| CAB | — Capital appreciation bond |
| CCAB | — Convertible capital appreciation bond |
| CDA | — Community Development Authority |
| CDO | — Collateralized debt obligation |
| CLO | — Collateralized loan obligation |
| DRIVER | — Derivative inverse tax-exempt receipts |
| DW&P | — Department of Water & Power |
| DWR | — Department of Water Resources |
| ECFA | — Educational & Cultural Facilities Authority |
| EDA | — Economic Development Authority |
| EDFA | — Economic Development Finance Authority |
| ETF | — Exchange-traded fund |
| FDIC | — Federal Deposit Insurance Corporation |
| FFCB | — Federal Farm Credit Banks |
| FGIC | — Financial Guaranty Insurance Corporation |
| FHA | — Federal Housing Administration |
| FHLB | — Federal Home Loan Bank |
| FHLMC | — Federal Home Loan Mortgage Corporation |
| FICO | — The Financing Corporation |
| FNMA | — Federal National Mortgage Association |
| GDR | — Global depositary receipt |
| GNMA | — Government National Mortgage Association |
| HCFR | — Healthcare facilities revenue |
| HEFA | — Health & Educational Facilities Authority |
| HEFAR | — Higher education facilities authority revenue |
| HFA | — Housing Finance Authority |
| HFFA | — Health Facilities Financing Authority |
| HUD | — Department of Housing and Urban Development |
| IDA | — Industrial Development Authority |
| IDAG | — Industrial Development Agency |
| KRW | — Republic of Korea won |
| LIBOR | — London Interbank Offered Rate |
| LIFER | — Long Inverse Floating Exempt Receipts |
| LLC | — Limited liability company |
| LLLP | — Limited liability limited partnership |
| LLP | — Limited liability partnership |
| MBIA | — Municipal Bond Insurance Association |
| MFHR | — Multifamily housing revenue |
| MSTR | — Municipal securities trust receipts |
| MUD | — Municipal Utility District |
| National | — National Public Finance Guarantee Corporation |
| PCFA | — Pollution Control Financing Authority |
| PCL | — Public Company Limited |
| PCR | — Pollution control revenue |
| PFA | — Public Finance Authority |
| PFFA | — Public Facilities Financing Authority |
| PFOTER | — Puttable floating option tax-exempt receipts |
| PJSC | — Public Joint Stock Company |
| plc | — Public limited company |
| PUTTER | — Puttable tax-exempt receipts |
| R&D | — Research & development |
| Radian | — Radian Asset Assurance |
| RAN | — Revenue anticipation notes |
| RDA | — Redevelopment Agency |
| RDFA | — Redevelopment Finance Authority |
| REIT | — Real estate investment trust |
| ROC | — Reset option certificates |
| SAVRS | — Select auction variable rate securities |
| SBA | — Small Business Authority |
| SDR | — Swedish depositary receipt |
| SFHR | — Single-family housing revenue |
| SFMR | — Single-family mortgage revenue |
| SIFMA | — Securities Industry and Financial Markets Association |
| SPA | — Standby purchase agreement |
| SPDR | — Standard & Poor’s Depositary Receipts |
| SPEAR | — Short Puttable Exempt Adjustable Receipts |
| STRIPS | — Separate trading of registered interest and |
| TAN | — Tax anticipation notes |
| TIPS | — Treasury inflation-protected securities |
| TRAN | — Tax revenue anticipation notes |
| TTFA | — Transportation Trust Fund Authority |
| TVA | — Tennessee Valley Authority |
This page is intentionally left blank.
This page is intentionally left blank.

For more information
More information about Wells Fargo Funds is available free upon request. To obtain literature, please write, email, visit the Fund’s website, or call:
Wells Fargo Funds
P.O. Box 8266
Boston, MA 02266-8266
Email: fundservice@wellsfargo.com
Website: wellsfargofunds.com
Individual investors: 1-800-222-8222
Retail investment professionals: 1-888-877-9275
Institutional investment professionals:
1-866-765-0778
This report and the financial statements contained herein are submitted for the general information of the shareholders of the Fund. If this report is used for promotional purposes, distribution of the report must be accompanied or preceded by a current prospectus. Before investing, please consider the investment objectives, risks, charges, and expenses of the investment. For a current prospectus and, if available, a summary prospectus, containing this information, call 1-800-222-8222 or visit the Fund’s website at wellsfargofunds.com. Read the prospectus carefully before you invest or send money.
Wells Fargo Asset Management (WFAM) is a trade name used by the asset management businesses of Wells Fargo & Company. Wells Fargo Funds Management, LLC, a wholly owned subsidiary of Wells Fargo & Company, provides investment advisory and administrative services for Wells Fargo Funds. Other affiliates of Wells Fargo & Company provide subadvisory and other services for the funds. The funds are distributed by Wells Fargo Funds Distributor, LLC, Member FINRA, an affiliate of Wells Fargo & Company. Neither Wells Fargo Funds Distributor nor Wells Fargo Funds Management holds fund shareholder accounts or assets. This material is for general informational and educational purposes only and is NOT intended to provide investment advice or a recommendation of any kind—including a recommendation for any specific investment, strategy, or plan.
NOT FDIC INSURED ◾ NO BANK GUARANTEE ◾ MAY LOSE VALUE
© 2017 Wells Fargo Funds Management, LLC. All rights reserved.
| | |
 | | 308070 02-18 SA259/SAR259 12-17 |
ITEM 2. CODE OF ETHICS
Not applicable.
ITEM 3. AUDIT COMMITTEE FINANCIAL EXPERT
Not applicable.
ITEM 4. PRINCIPAL ACCOUNTANT FEES AND SERVICES
Not applicable.
ITEM 5. AUDIT COMMITTEE OF LISTED REGISTRANTS
Not applicable.
ITEM 6. INVESTMENTS
A Portfolio of Investments for each series of Wells Fargo Funds Trust is included as part of the report to shareholders filed under Item 1 of this Form.
ITEM 7. DISCLOSURE OF PROXY VOTING POLICIES AND PROCEDURES FOR CLOSED-END MANAGEMENT INVESTMENT COMPANIES
Not applicable.
ITEM 8. PORTFOLIO MANAGERS OF CLOSED-END MANAGEMENT INVESTMENT COMPANIES
Not applicable.
ITEM 9. PURCHASES OF EQUITY SECURITIES BY CLOSED-END MANAGEMEENT INVESTMENT COMPANY AND AFFILIATED PURCHASERS
Not applicable.
ITEM 10. SUBMISSION OF MATTERS TO A VOTE OF SECURITY HOLDERS
There have been no material changes to the procedures by which shareholders may recommend nominees to the registrant’s Board of Trustees that have been implemented since the registrant’s last provided disclosure in response to the requirements of this Item.
ITEM 11. CONTROLS AND PROCEDURES
(a) The President and Treasurer have concluded that the Wells Fargo Funds Trust (the “Trust”) disclosure controls and procedures (as defined in Rule 30a-3(c) under the Investment Company Act of 1940) provide reasonable assurances that material information relating to the Trust is made known to them by the appropriate persons, based on their evaluation of these controls and procedures as of a date within 90 days of the filing of this report.
(b) There were no significant changes in the Trust’s internal controls over financial reporting (as defined in Rule 30a-3(d) under the Investment Company Act of 1940) that occurred during the second fiscal quarter of the period covered by this report that materially affected, or is reasonably likely to materially affect, the registrant’s internal control over financial reporting.
ITEM 12. EXHIBITS
(a)(1) Not applicable.
(a)(2) Certification pursuant to Rule 30a-2(a) under the Investment Company Act of 1940 (17 CFR 270.30a-2(a)) is filed and attached hereto as Exhibit 99.CERT.
(a)(3) Not applicable.
(b) Certification pursuant to Rule 30a-2(b) under the Investment Company Act of 1940 (17 CFR 270.30a-2(b)) is filed and attached hereto as Exhibit 99.906CERT.
SIGNATURES
Pursuant to the requirements of the Securities Exchange Act of 1934 and the Investment Company Act of 1940, the registrant has duly caused this report to be signed on its behalf by the undersigned, thereunto duly authorized.
| | |
| Wells Fargo Funds Trust |
| |
| By: | | |
| |
| | /s/ Andrew Owen |
| |
| | Andrew Owen |
| | President |
| |
| Date: | | February 26, 2018 |
Pursuant to the requirements of the Securities Exchange Act of 1934 and the Investment Company Act of 1940, this report has been signed below by the following persons on behalf of the registrant and in the capacities and on the date indicated.
| | |
| Wells Fargo Funds Trust |
| |
| By: | | |
| |
| | /s/ Andrew Owen |
| |
| | Andrew Owen |
| | President |
| |
| Date: | | February 26, 2018 |
| |
| By: | | |
| |
| | /s/ Nancy Wiser |
| |
| | Nancy Wiser |
| | Treasurer |
| |
| Date: | | February 26, 2018 |
| |
| By: | | |
| |
| | /s/ Jeremy DePalma |
| |
| | Jeremy DePalma |
| | Treasurer |
| |
| Date: | | February 26, 2018 |