
UNITED STATES
SECURITIES AND EXCHANGE COMMISSION
Washington, D.C. 20549
FORM N-CSRS
CERTIFIED SHAREHOLDER REPORT OF REGISTERED
MANAGEMENT INVESTMENT COMPANIES
Investment Company Act file number: 811-09253
Wells Fargo Funds Trust
(Exact name of registrant as specified in charter)
525 Market St., San Francisco, CA 94105
(Address of principal executive offices) (Zip code)
C. David Messman
Wells Fargo Funds Management, LLC
525 Market St., San Francisco, CA 94105
(Name and address of agent for service)
Registrant’s telephone number, including area code: 800-222-8222
Date of fiscal year end: July 31
Registrant is making a filing for 11 of its series:
Wells Fargo Capital Growth Fund, Wells Fargo Disciplined U.S. Core Fund, Wells Fargo Endeavor Select Fund, Wells Fargo Growth Fund, Wells Fargo Intrinsic Value Fund, Wells Fargo Large Cap Core Fund, Wells Fargo Large Cap Growth Fund, Wells Fargo Large Company Value Fund, Wells Fargo Low Volatility U.S. Equity Fund, Wells Fargo Omega Growth Fund, and Wells Fargo Premier Large Company Growth Fund;
Date of reporting period: January 31, 2018
| ITEM 1. | REPORT TO STOCKHOLDERS |
Semi-Annual Report
January 31, 2018

Wells Fargo Capital Growth Fund


Reduce clutter. Save trees.
Sign up for electronic delivery of prospectuses and shareholder reports at wellsfargo.com/advantagedelivery
Contents
The views expressed and any forward-looking statements are as of January 31, 2018, unless otherwise noted, and are those of the Fund managers and/or Wells Fargo Funds Management, LLC. Discussions of individual securities, or the markets generally, or any Wells Fargo Fund are not intended as individual recommendations. Future events or results may vary significantly from those expressed in any forward-looking statements. The views expressed are subject to change at any time in response to changing circumstances in the market. Wells Fargo Funds Management, LLC and the Fund disclaim any obligation to publicly update or revise any views expressed or forward-looking statements.
NOT FDIC INSURED ◾ NO BANK GUARANTEE ◾ MAY LOSE VALUE
| | | | |
| 2 | | Wells Fargo Capital Growth Fund | | Letter to shareholders (unaudited) |

Andrew Owen
President
Wells Fargo Funds
While investing in stocks and bonds generally delivered favorable returns during the past six months, fixed-income investments in the U.S. diverged from the global trend.
Dear Shareholder:
We are pleased to offer you this semi-annual report for the Wells Fargo Capital Growth Fund for the six-month period that ended January 31, 2018. While investing in stocks generally delivered favorable returns during the past six months, fixed-income investments in the U.S. diverged from the global trend. U.S. and international stocks delivered similar results, with returns of 15.43% and 13.50%, respectively, for the six-month period, as measured by the S&P 500 Index1 and the MSCI ACWI ex USA Index (Net)2, respectively. Within fixed income, the Bloomberg Barclays Global Aggregate ex-USD Index3 earned 4.50%. In the U.S., fixed-income investments, as measured by the Bloomberg Barclays U.S. Aggregate Bond Index4, fell 0.35% and the Bloomberg Barclays Municipal Bond Index5 declined 0.19%.
As global growth improved in the third quarter of 2017, investment markets advanced.
Globally, stocks moved higher during the late summer of 2017 as they were subject to the same positive economic conditions that influenced their advances during first half of the year: moderately accelerating global economic growth supported by improving corporate earnings as well as low inflation and interest rates. Brief episodes of geopolitical tensions, primarily associated with North Korea’s advancing nuclear missile program, flaring conflicts in the Middle East, and uncertainty surrounding the new U.S. administration’s trade policies, did not discourage investing activity. In the U.S., economic data released during the quarter reflected a generally healthy economy. Second-quarter economic output grew at a 3.1% annual rate.
Outside the U.S., stocks in international developed and emerging markets were supported by improved economic growth. Advances in emerging markets equity valuations slowed compared with the pace of the first half of 2017 but continued an upward path. Central banks in Europe, Asia, and Japan maintained low-interest-rate policies that supported business growth and equity investing.
In the U.S., Federal Reserve (Fed) officials announced in October plans to begin the process of unwinding its $4.5 trillion portfolio of bonds and other assets accumulated during rounds of quantitative easing conducted since the 2008–2009 recession. Still, restrained inflation kept long-term bond rates steady and the flattening of the yield curve persisted.
Positive economic and market news continued as 2017 closed and 2018 began.
During the fourth quarter of 2017, stock markets continued an upward trajectory. Synchronous economic expansion worldwide continued with mild inflation and low volatility. Data released during the quarter reflected a healthy U.S. economy.
| 1 | The S&P 500 Index consists of 500 stocks chosen for market size, liquidity, and industry group representation. It is a market-value-weighted index with each stock’s weight in the index proportionate to its market value. You cannot invest directly in an index. |
| 2 | The Morgan Stanley Capital International (MSCI) All Country World Index (ACWI) ex USA Index (Net) is a free-float-adjusted market-capitalization-weighted index that is designed to measure the equity market performance of developed markets, excluding the United States and Canada. Source: MSCI. MSCI makes no express or implied warranties or representations and shall have no liability whatsoever with respect to any MSCI data contained herein. The MSCI data may not be further redistributed or used as a basis for other indices or any securities or financial products. This report is not approved, reviewed, or produced by MSCI. You cannot invest directly in an index. |
| 3 | The Bloomberg Barclays Global Aggregate ex-USD Index is an unmanaged index that provides a broad-based measure of the global investment-grade fixed-income markets excluding the U.S.-dollar-denominated debt market. You cannot invest directly in an index. |
| 4 | The Bloomberg Barclays U.S. Aggregate Bond Index is a broad-based benchmark that measures the investment-grade, U.S. dollar-denominated, fixed-rate taxable bond market, including Treasuries, government-related and corporate securities, mortgage-backed securities (agency fixed-rate and hybrid adjustable-rate mortgage pass-throughs), asset-backed securities, and commercial mortgage-backed securities. You cannot invest directly in an index. |
| 5 | The Bloomberg Barclays Municipal Bond Index is an unmanaged index composed of long-term tax-exempt bonds with a minimum credit rating of Baa. You cannot invest directly in an index. |
| | | | | | |
| Letter to shareholders (unaudited) | | Wells Fargo Capital Growth Fund | | | 3 | |
Third-quarter economic output grew at a 3.2% annual rate. Increased hiring pushed the unemployment rate down to a 17-year low of 4.1%. Tax reform in the U.S. that passed as the year ended also encouraged increased spending among businesses and individuals. Signs of long-awaited wage growth appeared to emerge.
Outside the U.S., economies continued to strengthen. In December, the Organisation for Economic Co-operation and Development (OECD) reported that the global economy has been expanding at its fastest rate since 2010; all 35 countries the OECD follows were on track to expand for 2017. International economies have benefited from catalysts such as economic stimulus, improving employment, increased investment, accelerated trade growth, and the firming of prices for some of the commodities that are essential exports of many international economies.
October 2017 marked one year since regulatory reform of money market investing in the U.S. By December 2017, money market fund asset levels exceeded their December 2016 levels, reflecting continued investor demand for the short-term investment opportunities afforded them by money market funds.
In December 2017, the Fed raised the federal funds rate target to a range of 1.25% to 1.50%. The Fed also began reducing its bond portfolio. Long-term interest rates in the U.S. trended higher as the yield curve steepened—the 10-year Treasury rate moved from 2.46% to 2.84% and the 30-year rate moved from 2.81% to 3.08% during January 2018.
Don’t let short-term uncertainty derail long-term investment goals.
Periods of investment uncertainty can present challenges, but experience has taught us that maintaining long-term investment goals can be an effective way to plan for the future. To help you create a sound strategy based on your personal goals and risk tolerance, Wells Fargo Funds offers more than 100 mutual funds spanning a wide range of asset classes and investment styles. Although diversification cannot guarantee an investment profit or prevent losses, we believe it can be an effective way to manage investment risk and potentially smooth out overall portfolio performance. We encourage investors to know their investments and to understand that appropriate levels of risk-taking may unlock opportunities.
Thank you for choosing to invest with Wells Fargo Funds. We appreciate your confidence in us and remain committed to helping you meet your financial needs.
Sincerely,

Andrew Owen
President
Wells Fargo Funds
Although diversification cannot guarantee an investment profit or prevent losses, we believe it can be an effective way to manage investment risk and potentially smooth out overall portfolio performance.
For further information about your Fund, contact your investment professional, visit our website at wellsfargofunds.com, or call us directly at 1-800-222-8222.
| | | | |
| 4 | | Wells Fargo Capital Growth Fund | | Performance highlights (unaudited) |
Investment objective
The Fund seeks long-term capital appreciation.
Manager
Wells Fargo Funds Management, LLC
Subadviser
Wells Capital Management Incorporated
Portfolio managers
Michael T. Smith, CFA®
Christopher J. Warner, CFA®
Average annual total returns (%) as of January 31, 20181
| | | | | | | | | | | | | | | | | | | | | | | | | | | | | | | | | | |
| | | | | Including sales charge | | | Excluding sales charge | | | Expense ratios2 (%) | |
| | | Inception date | | 1 year | | | 5 year | | | 10 year | | | 1 year | | | 5 year | | | 10 year | | | Gross | | | Net3 | |
| Class A (WFCGX) | | 7-31-2007 | | | 32.25 | | | | 15.13 | | | | 8.29 | | | | 40.27 | | | | 16.51 | | | | 8.94 | | | | 1.24 | | | | 1.11 | |
| Class C (WFCCX) | | 7-31-2007 | | | 38.18 | | | | 15.63 | | | | 8.12 | | | | 39.18 | | | | 15.63 | | | | 8.12 | | | | 1.99 | | | | 1.86 | |
| Class R6 (WFCRX) | | 11-30-2012 | | | – | | | | – | | | | – | | | | 40.92 | | | | 17.07 | | | | 9.47 | | | | 0.81 | | | | 0.60 | |
| Administrator Class (WFCDX) | | 6-30-2003 | | | – | | | | – | | | | – | | | | 40.42 | | | | 16.70 | | | | 9.17 | | | | 1.16 | | | | 0.94 | |
| Institutional Class (WWCIX) | | 4-8-2005 | | | – | | | | – | | | | – | | | | 40.82 | | | | 17.00 | | | | 9.44 | | | | 0.91 | | | | 0.70 | |
| Russell 1000® Growth Index4 | | – | | | – | | | | – | | | | – | | | | 34.89 | | | | 17.95 | | | | 11.65 | | | | – | | | | – | |
Figures quoted represent past performance, which is no guarantee of future results, and do not reflect taxes that a shareholder may pay on fund distributions or the redemption of fund shares. Investment return and principal value of an investment will fluctuate so that an investor’s shares, when redeemed, may be worth more or less than their original cost. Performance shown without sales charges would be lower if sales charges were reflected. Current performance may be lower or higher than the performance data quoted, which assumes the reinvestment of dividends and capital gains. Current month-end performance is available on the Fund’s website, wellsfargofunds.com.
Please keep in mind that high double-digit returns were primarily achieved during favorable market conditions. You should not expect that such favorable returns can be consistently achieved. A fund’s performance, especially for short time periods, should not be the sole factor in making your investment decision.
Index returns do not include transaction costs associated with buying and selling securities, any mutual fund fees or expenses, or any taxes. It is not possible to invest directly in an index.
For Class A shares, the maximum front-end sales charge is 5.75%. For Class C shares, the maximum contingent deferred sales charge is 1.00%. Performance including a contingent deferred sales charge assumes the sales charge for the corresponding time period. Class R6, Administrator Class, and Institutional Class shares are sold without a front-end sales charge or contingent deferred sales charge.
Stock values fluctuate in response to the activities of individual companies and general market and economic conditions. Certain investment strategies tend to increase the total risk of an investment (relative to the broader market). The Fund is exposed to foreign investment risk. Consult the Fund’s prospectus for additional information on these and other risks.
Please see footnotes on page 5.
| | | | | | |
| Performance highlights (unaudited) | | Wells Fargo Capital Growth Fund | | | 5 | |
| | | | |
| Ten largest holdings (%) as of January 31, 20185 | |
Amazon.com Incorporated | | | 7.29 | |
Microsoft Corporation | | | 6.38 | |
Alphabet Incorporated Class A | | | 6.08 | |
Visa Incorporated Class A | | | 4.69 | |
UnitedHealth Group Incorporated | | | 4.61 | |
Waste Connections Incorporated | | | 2.79 | |
The Home Depot Incorporated | | | 2.70 | |
Facebook Incorporated Class A | | | 2.56 | |
Salesforce.com Incorporated | | | 2.54 | |
FleetCor Technologies Incorporated | | | 2.17 | |
|
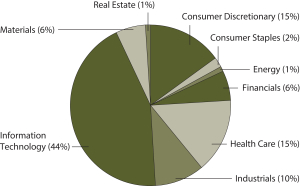
| Sector distribution as of January 31, 20186 |
|
|
| 1 | Historical performance shown for Class R6 shares prior to their inception reflects the performance of Institutional Class shares, and includes the higher expenses applicable to Institutional Class shares. If these expenses had not been included, returns for Class R6 shares would be higher. |
| 2 | Reflects the expense ratios as stated in the most recent prospectuses. The expense ratios shown are subject to change and may differ from the annualized expense ratios shown in the financial highlights of this report. |
| 3 | The manager has contractually committed through November 30, 2018, to waive fees and/or reimburse expenses to the extent necessary to cap the Fund’s Total Annual Fund Operating Expenses After Fee Waivers at the amounts shown. After this time, the cap may be increased or the commitment to maintain the cap may be terminated only with the approval of the Board of Trustees. Brokerage commissions, stamp duty fees, interest, taxes, acquired fund fees and expenses, and extraordinary expenses are excluded from the expense cap. Without this cap, the Fund’s returns would have been lower. The expense ratio paid by an investor is the net expense ratio or the Fund’s Total Annual Fund Operating Expenses After Fee Waivers, as stated in the prospectuses. |
| 4 | The Russell 1000® Growth Index measures the performance of those Russell 1000 companies with higher price/book ratios and higher forecasted growth values. You cannot invest directly in an index. |
| 5 | The ten largest holdings, excluding cash and cash equivalents, are calculated based on the value of the investments divided by total net assets of the Fund. Holdings are subject to change and may have changed since the date specified. |
| 6 | Amounts are calculated based on the total long-term investments of the Fund. These amounts are subject to change and may have changed since the date specified. |
| | | | |
| 6 | | Wells Fargo Capital Growth Fund | | Fund expenses (unaudited) |
As a shareholder of the Fund, you incur two types of costs: (1) transaction costs, including sales charges (loads) on purchase payments and contingent deferred sales charges (if any) on redemptions and (2) ongoing costs, including management fees, distribution (12b-1) and/or shareholder servicing fees, and other Fund expenses. This example is intended to help you understand your ongoing costs (in dollars) of investing in the Fund and to compare these costs with the ongoing costs of investing in other mutual funds.
The example is based on an investment of $1,000 invested at the beginning of the six-month period and held for the entire period from August 1, 2017 to January 31, 2018.
Actual expenses
The “Actual” line of the table below provides information about actual account values and actual expenses. You may use the information in this line, together with the amount you invested, to estimate the expenses that you paid over the period. Simply divide your account value by $1,000 (for example, an $8,600 account value divided by $1,000 = 8.6), then multiply the result by the number in the “Actual” line under the heading entitled “Expenses paid during period” for your applicable class of shares to estimate the expenses you paid on your account during this period.
Hypothetical example for comparison purposes
The “Hypothetical” line of the table below provides information about hypothetical account values and hypothetical expenses based on the Fund’s actual expense ratio and an assumed rate of return of 5% per year before expenses, which is not the Fund’s actual return. The hypothetical account values and expenses may not be used to estimate the actual ending account balance or expenses you paid for the period. You may use this information to compare the ongoing costs of investing in the Fund and other funds. To do so, compare this 5% hypothetical example with the 5% hypothetical examples that appear in the shareholder reports of the other funds.
Please note that the expenses shown in the table are meant to highlight your ongoing costs only and do not reflect any transactional costs, such as sales charges (loads) and contingent deferred sales charges. Therefore, the “Hypothetical” line of the table is useful in comparing ongoing costs only and will not help you determine the relative total costs of owning different funds. In addition, if these transactional costs were included, your costs would have been higher.
| | | | | | | | | | | | | | | | |
| | | Beginning
account value
8-1-2017 | | | Ending
account value
1-31-2018 | | | Expenses
paid during
the period¹ | | | Annualized net
expense ratio | |
Class A | | | | | | | | | | | | | | | | |
Actual | | $ | 1,000.00 | | | $ | 1,197.45 | | | $ | 5.87 | | | | 1.06 | % |
Hypothetical (5% return before expenses) | | $ | 1,000.00 | | | $ | 1,019.86 | | | $ | 5.40 | | | | 1.06 | % |
Class C | | | | | | | | | | | | | | | | |
Actual | | $ | 1,000.00 | | | $ | 1,192.56 | | | $ | 10.00 | | | | 1.81 | % |
Hypothetical (5% return before expenses) | | $ | 1,000.00 | | | $ | 1,016.08 | | | $ | 9.20 | | | | 1.81 | % |
Class R6 | | | | | | | | | | | | | | | | |
Actual | | $ | 1,000.00 | | | $ | 1,199.82 | | | $ | 3.33 | | | | 0.60 | % |
Hypothetical (5% return before expenses) | | $ | 1,000.00 | | | $ | 1,022.18 | | | $ | 3.06 | | | | 0.60 | % |
Administrator Class | | | | | | | | | | | | | | | | |
Actual | | $ | 1,000.00 | | | $ | 1,198.08 | | | $ | 5.21 | | | | 0.94 | % |
Hypothetical (5% return before expenses) | | $ | 1,000.00 | | | $ | 1,020.47 | | | $ | 4.79 | | | | 0.94 | % |
Institutional Class | | | | | | | | | | | | | | | | |
Actual | | $ | 1,000.00 | | | $ | 1,199.59 | | | $ | 3.88 | | | | 0.70 | % |
Hypothetical (5% return before expenses) | | $ | 1,000.00 | | | $ | 1,021.68 | | | $ | 3.57 | | | | 0.70 | % |
| 1 | Expenses paid is equal to the annualized net expense ratio of each class multiplied by the average account value over the period, multiplied by the number of days in the most recent fiscal half-year divided by the number of days in the fiscal year (to reflect the one-half-year period). |
| | | | | | |
| Portfolio of investments—January 31, 2018 (unaudited) | | Wells Fargo Capital Growth Fund | | | 7 | |
| | | | | | | | | | | | | | | | |
| Security name | | | | | | | | Shares | | | Value | |
| | | | |
Common Stocks: 95.71% | | | | | | | | | | | | | | | | |
| | | | |
Consumer Discretionary: 14.24% | | | | | | | | | | | | | | | | |
| | | | |
| Auto Components: 1.40% | | | | | | | | | | | | | | | | |
Aptiv plc | | | | | | | | | | | 30,950 | | | $ | 2,936,531 | |
| | | | | | | | | | | | | | | | |
| | | | |
| Automobiles: 1.03% | | | | | | | | | | | | | | | | |
Ferrari NV | | | | | | | | | | | 18,050 | | | | 2,156,975 | |
| | | | | | | | | | | | | | | | |
| | | | |
| Internet & Direct Marketing Retail: 9.11% | | | | | | | | | | | | | | | | |
Amazon.com Incorporated † | | | | | | | | | | | 10,555 | | | | 15,314,144 | |
Netflix Incorporated † | | | | | | | | | | | 14,150 | | | | 3,824,745 | |
| | | | |
| | | | | | | | | | | | | | | 19,138,889 | |
| | | | | | | | | | | | | | | | |
| | | | |
| Specialty Retail: 2.70% | | | | | | | | | | | | | | | | |
The Home Depot Incorporated | | | | | | | | | | | 28,233 | | | | 5,672,010 | |
| | | | | | | | | | | | | | | | |
| | | | |
Consumer Staples: 2.06% | | | | | | | | | | | | | | | | |
| | | | |
| Beverages: 1.10% | | | | | | | | | | | | | | | | |
Monster Beverage Corporation † | | | | | | | | | | | 34,050 | | | | 2,323,232 | |
| | | | | | | | | | | | | | | | |
| | | | |
| Food Products: 0.96% | | | | | | | | | | | | | | | | |
Lamb Weston Holdings Incorporated | | | | | | | | | | | 34,350 | | | | 2,012,910 | |
| | | | | | | | | | | | | | | | |
| | | | |
Energy: 0.98% | | | | | | | | | | | | | | | | |
| | | | |
| Oil, Gas & Consumable Fuels: 0.98% | | | | | | | | | | | | | | | | |
Pioneer Natural Resources Company | | | | | | | | | | | 11,200 | | | | 2,048,592 | |
| | | | | | | | | | | | | | | | |
| | | | |
Financials: 5.44% | | | | | | | | | | | | | | | | |
| | | | |
| Capital Markets: 5.44% | | | | | | | | | | | | | | | | |
Intercontinental Exchange Incorporated | | | | | | | | | | | 60,325 | | | | 4,454,398 | |
Raymond James Financial Incorporated | | | | | | | | | | | 43,550 | | | | 4,197,785 | |
S&P Global Incorporated | | | | | | | | | | | 15,363 | | | | 2,782,239 | |
| | | | |
| | | | | | | | | | | | | | | 11,434,422 | |
| | | | | | | | | | | | | | | | |
| | | | |
Health Care: 14.45% | | | | | | | | | | | | | | | | |
| | | | |
| Biotechnology: 3.62% | | | | | | | | | | | | | | | | |
Celgene Corporation † | | | | | | | | | | | 30,450 | | | | 3,080,322 | |
Exelixis Incorporated † | | | | | | | | | | | 77,350 | | | | 2,344,479 | |
Incyte Corporation † | | | | | | | | | | | 10,750 | | | | 970,618 | |
Regeneron Pharmaceuticals Incorporated † | | | | | | | | | | | 3,300 | | | | 1,209,945 | |
| | | | |
| | | | | | | | | | | | | | | 7,605,364 | |
| | | | | | | | | | | | | | | | |
| | | | |
| Health Care Equipment & Supplies: 6.22% | | | | | | | | | | | | | | | | |
Baxter International Incorporated | | | | | | | | | | | 37,150 | | | | 2,675,915 | |
Boston Scientific Corporation † | | | | | | | | | | | 115,000 | | | | 3,215,400 | |
Edwards Lifesciences Corporation † | | | | | | | | | | | 25,450 | | | | 3,221,461 | |
Hologic Incorporated † | | | | | | | | | | | 92,700 | | | | 3,958,290 | |
| | | | |
| | | | | | | | | | | | | | | 13,071,066 | |
| | | | | | | | | | | | | | | | |
The accompanying notes are an integral part of these financial statements.
| | | | |
| 8 | | Wells Fargo Capital Growth Fund | | Portfolio of investments—January 31, 2018 (unaudited) |
| | | | | | | | | | | | | | | | |
| Security name | | | | | | | | Shares | | | Value | |
| | | | |
| Health Care Providers & Services: 4.61% | | | | | | | | | | | | | | | | |
UnitedHealth Group Incorporated | | | | | | | | | | | 40,900 | | | $ | 9,684,302 | |
| | | | | | | | | | | | | | | | |
| | | | |
Industrials: 9.30% | | | | | | | | | | | | | | | | |
| | | | |
| Aerospace & Defense: 2.74% | | | | | | | | | | | | | | | | |
BWX Technologies Incorporated | | | | | | | | | | | 35,000 | | | | 2,220,400 | |
Northrop Grumman Corporation | | | | | | | | | | | 10,400 | | | | 3,541,512 | |
| | | | |
| | | | | | | | | | | | | | | 5,761,912 | |
| | | | | | | | | | | | | | | | |
| | | | |
| Commercial Services & Supplies: 4.41% | | | | | | | | | | | | | | | | |
Cintas Corporation | | | | | | | | | | | 20,250 | | | | 3,411,113 | |
Waste Connections Incorporated | | | | | | | | | | | 81,530 | | | | 5,855,485 | |
| | | | |
| | | | | | | | | | | | | | | 9,266,598 | |
| | | | | | | | | | | | | | | | |
| | | | |
| Electrical Equipment: 1.11% | | | | | | | | | | | | | | | | |
Rockwell Automation Incorporated | | | | | | | | | | | 11,850 | | | | 2,337,887 | |
| | | | | | | | | | | | | | | | |
| | | | |
| Professional Services: 1.04% | | | | | | | | | | | | | | | | |
TransUnion † | | | | | | | | | | | 36,573 | | | | 2,170,973 | |
| | | | | | | | | | | | | | | | |
| | | | |
Information Technology: 42.24% | | | | | | | | | | | | | | | | |
| | | | |
| Internet Software & Services: 12.06% | | | | | | | | | | | | | | | | |
Alphabet Incorporated Class A † | | | | | | | | | | | 10,808 | | | | 12,777,434 | |
Facebook Incorporated Class A † | | | | | | | | | | | 28,824 | | | | 5,386,917 | |
MercadoLibre Incorporated | | | | | | | | | | | 7,600 | | | | 2,941,960 | |
Tencent Holdings Limited ADR | | | | | | | | | | | 71,300 | | | | 4,218,821 | |
| | | | |
| | | | | | | | | | | | | | | 25,325,132 | |
| | | | | | | | | | | | | | | | |
| | | | |
| IT Services: 12.42% | | | | | | | | | | | | | | | | |
Black Knight Incorporated † | | | | | | | | | | | 43,500 | | | | 2,153,250 | |
Fidelity National Information Services Incorporated | | | | | | | | | | | 28,550 | | | | 2,922,378 | |
First Data Corporation Class A † | | | | | | | | | | | 121,350 | | | | 2,147,895 | |
FleetCor Technologies Incorporated † | | | | | | | | | | | 21,500 | | | | 4,568,750 | |
PayPal Holdings Incorporated † | | | | | | | | | | | 23,600 | | | | 2,013,552 | |
Total System Services Incorporated | | | | | | | | | | | 27,300 | | | | 2,425,878 | |
Visa Incorporated Class A | | | | | | | | | | | 79,283 | | | | 9,849,327 | |
| | | | |
| | | | | | | | | | | | | | | 26,081,030 | |
| | | | | | | | | | | | | | | | |
| | | | |
| Semiconductors & Semiconductor Equipment: 2.89% | | | | | | | | | | | | | | | | |
Broadcom Limited | | | | | | | | | | | 16,750 | | | | 4,154,503 | |
Infineon Technologies AG ADR | | | | | | | | | | | 66,050 | | | | 1,926,216 | |
| | | | |
| | | | | | | | | | | | | | | 6,080,719 | |
| | | | | | | | | | | | | | | | |
| | | | |
| Software: 14.87% | | | | | | | | | | | | | | | | |
Activision Blizzard Incorporated | | | | | | | | | | | 45,700 | | | | 3,387,741 | |
Electronic Arts Incorporated † | | | | | | | | | | | 24,200 | | | | 3,072,432 | |
Microsoft Corporation | | | | | | | | | | | 141,150 | | | | 13,410,662 | |
Nintendo Company Limited | | | | | | | | | | | 62,650 | | | | 3,576,062 | |
Salesforce.com Incorporated † | | | | | | | | | | | 46,930 | | | | 5,345,796 | |
The accompanying notes are an integral part of these financial statements.
| | | | | | |
| Portfolio of investments—January 31, 2018 (unaudited) | | Wells Fargo Capital Growth Fund | | | 9 | |
| | | | | | | | | | | | | | | | |
| Security name | | | | | | | | Shares | | | Value | |
| | | | |
| Software (continued) | | | | | | | | | | | | | | | | |
ServiceNow Incorporated † | | | | | | | | | | | 16,480 | | | $ | 2,453,378 | |
| | | | |
| | | | | | | | | | | | | | | 31,246,071 | |
| | | | | | | | | | | | | | | | |
| | | | |
Materials: 6.10% | | | | | | | | | | | | | | | | |
| | | | |
| Chemicals: 4.03% | | | | | | | | | | | | | | | | |
Air Products & Chemicals Incorporated | | | | | | | | | | | 24,550 | | | | 4,133,484 | |
The Sherwin-Williams Company | | | | | | | | | | | 10,400 | | | | 4,337,944 | |
| | | | |
| | | | | | | | | | | | | | | 8,471,428 | |
| | | | | | | | | | | | | | | | |
| | | | |
| Construction Materials: 2.07% | | | | | | | | | | | | | | | | |
Vulcan Materials Company | | | | | | | | | | | 32,050 | | | | 4,339,570 | |
| | | | | | | | | | | | | | | | |
| | | | |
Real Estate: 0.90% | | | | | | | | | | | | | | | | |
| | | | |
| Equity REITs: 0.90% | | | | | | | | | | | | | | | | |
SBA Communications Corporation † | | | | | | | | | | | 10,800 | | | | 1,884,600 | |
| | | | | | | | | | | | | | | | |
| | | | |
Total Common Stocks (Cost $118,958,320) | | | | | | | | | | | | | | | 201,050,213 | |
| | | | | | | | | | | | | | | | |
| | | | |
| | | Yield | | | | | | | | | | |
| Short-Term Investments: 4.42% | | | | | | | | | | | | | | | | |
| | | | |
| Investment Companies: 4.42% | | | | | | | | | | | | | | | | |
Wells Fargo Government Money Market Fund Select Class (l)(u) | | | 1.24 | % | | | | | | | 9,290,514 | | | | 9,290,514 | |
| | | | | | | | | | | | | | | | |
| | | | |
Total Short-Term Investments (Cost $9,290,514) | | | | | | | | | | | | | | | 9,290,514 | |
| | | | | | | | | | | | | | | | |
| | | | | | | | |
| Total investments in securities (Cost $128,248,834) | | | 100.13 | % | | | 210,340,727 | |
Other assets and liabilities, net | | | (0.13 | ) | | | (279,843 | ) |
| | | | | | | | |
| Total net assets | | | 100.00 | % | | $ | 210,060,884 | |
| | | | | | | | |
| † | Non-income-earning security |
| (l) | The issuer of the security is an affiliated person of the Fund as defined in the Investment Company Act of 1940. |
| (u) | The rate represents the 7-day annualized yield at period end. |
Investments in Affiliates
An affiliated investment is an investment in which the Fund owns at least 5% of the outstanding voting shares of the issuer or as a result of other relationships, such as the Fund and the issuer having the same investment manager. Transactions with issuers that were either affiliated persons of the Fund at the beginning of the period or the end of the period were as follows:
| | | | | | | | | | | | | | | | | | | | | | | | | | | | | | | | | | | | |
| | | Shares,
beginning of
period | | | Shares
purchased | | | Shares
sold | | | Shares,
end of
period | | | Net
realized
gains
(losses) | | | Net
change in
unrealized
gains
(losses) | | | Income
from
affiliated
securities | | | Value,
end
of period | | | % of
net
assets | |
Short-Term Investments | | | | | | | | | | | | | | | | | | | | | | | | | | | | | | | | | | | | |
Investment Companies | | | | | | | | | | | | | | | | | | | | | | | | | | | | | | | | | | | | |
Wells Fargo Government Money Market Fund Select Class | | | 3,766,873 | | | | 48,403,654 | | | | 42,880,013 | | | | 9,290,514 | | | $ | 0 | | | $ | 0 | | | $ | 44,820 | | | $ | 9,290,514 | | | | 4.42 | % |
Affiliated securities no longer held at end of the period | | | 695,935 | | | | 64,513,125 | | | | 65,209,060 | | | | 0 | | | | 0 | | | | 0 | | | | 8,332 | | | | 0 | | | | | |
| | | | | | | | | | | | | | | | | | | | | | | | | | | | | | | | | | | | |
| | | | | | | | | | | | | | | | | | $ | 0 | | | $ | 0 | | | $ | 53,152 | | | $ | 9,290,514 | | | | 4.42 | % |
| | | | | | | | | | | | | | | | | | | | | | | | | | | | | | | | | | | | |
The accompanying notes are an integral part of these financial statements.
| | | | |
| 10 | | Wells Fargo Capital Growth Fund | | Statement of assets and liabilities—January 31, 2018 (unaudited) |
| | | | |
| | | | |
| |
Assets | | | | |
Investments in unaffiliated securities, at value (cost $118,958,320) | | $ | 201,050,213 | |
Investments in affiliated securities, at value (cost $9,290,514) | | | 9,290,514 | |
Receivable for Fund shares sold | | | 79,822 | |
Receivable for dividends | | | 13,594 | |
Receivable for securities lending income | | | 302 | |
Prepaid expenses and other assets | | | 81,710 | |
| | | | |
Total assets | | | 210,516,155 | |
| | | | |
| |
Liabilities | | | | |
Payable for Fund shares redeemed | | | 294,598 | |
Management fee payable | | | 82,682 | |
Administration fees payable | | | 20,653 | |
Trustees’ fees and expenses payable | | | 2,574 | |
Distribution fee payable | | | 2,100 | |
Accrued expenses and other liabilities | | | 52,664 | |
| | | | |
Total liabilities | | | 455,271 | |
| | | | |
Total net assets | | $ | 210,060,884 | |
| | | | |
| |
NET ASSETS CONSIST OF | | | | |
Paid-in capital | | $ | 91,526,588 | |
Accumulated net investment loss | | | (172,900 | ) |
Accumulated net realized gains on investments | | | 36,615,303 | |
Net unrealized gains on investments | | | 82,091,893 | |
| | | | |
Total net assets | | $ | 210,060,884 | |
| | | | |
| |
COMPUTATION OF NET ASSET VALUE AND OFFERING PRICE PER SHARE | | | | |
Net assets – Class A | | $ | 85,031,677 | |
Shares outstanding – Class A1 | | | 4,696,533 | |
Net asset value per share – Class A | | | $18.11 | |
Maximum offering price per share – Class A2 | | | $19.21 | |
Net assets – Class C | | $ | 3,354,277 | |
Shares outstanding – Class C1 | | | 214,058 | |
Net asset value per share – Class C | | | $15.67 | |
Net assets – Class R6 | | $ | 92,408,449 | |
Shares outstanding – Class R61 | | | 4,508,772 | |
Net asset value per share – Class R6 | | | $20.50 | |
Net assets – Administrator Class | | $ | 8,429,549 | |
Shares outstanding – Administrator Class1 | | | 428,059 | |
Net asset value per share – Administrator Class | | | $19.69 | |
Net assets – Institutional Class | | $ | 20,836,931 | |
Shares outstanding – Institutional Class1 | | | 1,021,654 | |
Net asset value per share – Institutional Class | | | $20.40 | |
| 1 | The Fund has an unlimited number of authorized shares. |
| 2 | Maximum offering price is computed as 100/94.25 of net asset value. On investments of $50,000 or more, the offering price is reduced. |
The accompanying notes are an integral part of these financial statements.
| | | | | | |
| Statement of operations—six months ended January 31, 2018 (unaudited) | | Wells Fargo Capital Growth Fund | | | 11 | |
| | | | |
| | | | |
| |
Investment income | | | | |
Dividends (net of foreign withholding taxes of $4,901) | | $ | 848,515 | |
Income from affiliated securities | | | 53,152 | |
| | | | |
Total investment income | | | 901,667 | |
| | | | |
| |
Expenses | | | | |
Management fee | | | 873,221 | |
Administration fees | | | | |
Class A | | | 80,117 | |
Class C | | | 3,164 | |
Class R4 | | | 4 | 1 |
Class R6 | | | 19,595 | |
Administrator Class | | | 11,727 | |
Institutional Class | | | 13,968 | |
Shareholder servicing fees | | | | |
Class A | | | 95,377 | |
Class C | | | 3,767 | |
Class R4 | | | 5 | 1 |
Administrator Class | | | 22,551 | |
Distribution fee | | | | |
Class C | | | 11,300 | |
Custody and accounting fees | | | 4,839 | |
Professional fees | | | 25,493 | |
Registration fees | | | 41,740 | |
Shareholder report expenses | | | 16,083 | |
Trustees’ fees and expenses | | | 12,611 | |
Other fees and expenses | | | 3,954 | |
| | | | |
Total expenses | | | 1,239,516 | |
Less: Fee waivers and/or expense reimbursements | | | (255,893 | ) |
| | | | |
Net expenses | | | 983,623 | |
| | | | |
Net investment loss | | | (81,956 | ) |
| | | | |
| |
REALIZED AND UNREALIZED GAINS (LOSSES) ON INVESTMENTS | | | | |
Net realized gains on investments | | | 46,718,258 | |
Net change in unrealized gains (losses) on investments | | | (4,909,149 | ) |
| | | | |
Net realized and unrealized gains (losses) on investments | | | 41,809,109 | |
| | | | |
Net increase in net assets resulting from operations | | $ | 41,727,153 | |
| | | | |
| 1 | For the period from August 1, 2017 to November 13, 2017. Effective at the close of business on November 13, 2017, Class R4 shares were liquidated and the class was subsequently closed. Class R4 shares are no longer offered by the Fund. |
The accompanying notes are an integral part of these financial statements.
| | | | |
| 12 | | Wells Fargo Capital Growth Fund | | Statement of changes in net assets |
| | | | | | | | | | | | | | | | |
| | | Six months ended
January 31, 2018 (unaudited) | | | Year ended
July 31, 2017 | |
| | | | |
Operations | | | | | | | | | | | | | | | | |
Net investment income (loss) | | | | | | $ | (81,956 | ) | | | | | | $ | 164,681 | |
Net realized gains on investments | | | | | | | 46,718,258 | | | | | | | | 31,756,709 | |
Net change in unrealized gains (losses) on investments | | | | | | | (4,909,149 | ) | | | | | | | 15,387,708 | |
| | | | |
Net increase in net assets resulting from operations | | | | | | | 41,727,153 | | | | | | | | 47,309,098 | |
| | | | |
| | | | |
Distributions to shareholders from | | | | | | | | | | | | | | | | |
Net investment income | | | | | | | | | | | | | | | | |
Class A | | | | | | | 0 | | | | | | | | (97,914 | ) |
Class R4 | | | | | | | 0 | 1 | | | | | | | (38 | ) |
Class R6 | | | | | | | 0 | | | | | | | | (412,002 | ) |
Administrator Class | | | | | | | 0 | | | | | | | | (39,091 | ) |
Institutional Class | | | | | | | 0 | | | | | | | | (65,942 | ) |
Net realized gains | | | | | | | | | | | | | | | | |
Class A | | | | | | | (10,659,612 | ) | | | | | | | (1,953,165 | ) |
Class C | | | | | | | (475,651 | ) | | | | | | | (101,375 | ) |
Class R4 | | | | | | | (1,544 | )1 | | | | | | | (384 | ) |
Class R6 | | | | | | | (16,512,790 | ) | | | | | | | (3,243,150 | ) |
Administrator Class | | | | | | | (2,322,996 | ) | | | | | | | (611,585 | ) |
Institutional Class | | | | | | | (2,869,464 | ) | | | | | | | (616,477 | ) |
| | | | |
Total distributions to shareholders | | | | | | | (32,842,057 | ) | | | | | | | (7,141,123 | ) |
| | | | |
| | | | |
Capital share transactions | | | Shares | | | | | | | | Shares | | | | | |
Proceeds from shares sold | | | | | | | | | | | | | | | | |
Class A | | | 210,756 | | | | 3,612,385 | | | | 198,409 | | | | 3,094,087 | |
Class C | | | 28,417 | | | | 416,910 | | | | 32,238 | | | | 431,568 | |
Class R6 | | | 334,864 | | | | 6,360,944 | | | | 877,107 | | | | 15,875,391 | |
Administrator Class | | | 79,354 | | | | 1,466,324 | | | | 166,111 | | | | 2,827,992 | |
Institutional Class | | | 102,057 | | | | 1,961,241 | | | | 929,940 | | | | 16,102,051 | |
| | | | |
| | | | | | | 13,817,804 | | | | | | | | 38,331,089 | |
| | | | |
Reinvestment of distributions | | | | | | | | | | | | | | | | |
Class A | | | 642,270 | | | | 10,449,869 | | | | 137,411 | | | | 2,007,306 | |
Class C | | | 30,860 | | | | 437,693 | | | | 6,718 | | | | 87,332 | |
Class R4 | | | 0 | 1 | | | 0 | 1 | | | 26 | | | | 422 | |
Class R6 | | | 905,002 | | | | 16,500,487 | | | | 225,598 | | | | 3,655,152 | |
Administrator Class | | | 131,868 | | | | 2,308,838 | | | | 41,308 | | | | 647,990 | |
Institutional Class | | | 155,432 | | | | 2,828,945 | | | | 41,696 | | | | 673,156 | |
| | | | |
| | | | | | | 32,525,832 | | | | | | | | 7,071,358 | |
| | | | |
Payment for shares redeemed | | | | | | | | | | | | | | | | |
Class A | | | (284,780 | ) | | | (4,892,438 | ) | | | (1,344,184 | ) | | | (20,771,420 | ) |
Class C | | | (30,550 | ) | | | (459,518 | ) | | | (105,879 | ) | | | (1,470,006 | ) |
Class R4 | | | (974 | )1 | | | (18,521 | )1 | | | 0 | | | | 0 | |
Class R6 | | | (4,799,131 | ) | | | (92,142,433 | ) | | | (1,450,824 | ) | | | (24,773,295 | ) |
Administrator Class | | | (1,009,465 | ) | | | (18,886,334 | ) | | | (898,996 | ) | | | (14,559,948 | ) |
Institutional Class | | | (503,697 | ) | | | (9,446,328 | ) | | | (1,125,342 | ) | | | (19,712,480 | ) |
| | | | |
| | | | | | | (125,845,572 | ) | | | | | | | (81,287,149 | ) |
| | | | |
Net decrease in net assets resulting from capital share transactions | | | | | | | (79,501,936 | ) | | | | | | | (35,884,702 | ) |
| | | | |
Total increase (decrease) in net assets | | | | | | | (70,616,840 | ) | | | | | | | 4,283,273 | |
| | | | |
| | | | |
Net assets | | | | | | | | | | | | | | | | |
Beginning of period | | | | | | | 280,677,724 | | | | | | | | 276,394,451 | |
| | | | |
End of period | | | | | | $ | 210,060,884 | | | | | | | $ | 280,677,724 | |
| | | | |
Overdistributed/accumulated net investment income (loss) | | | | | | $ | (172,900 | ) | | | | | | $ | (90,944 | ) |
| | | | |
| 1 | For the period from August 1, 2017 to November 13, 2017. Effective at the close of business on November 13, 2017, Class R4 shares were liquidated and the class was subsequently closed. Class R4 shares are no longer offered by the Fund. |
The accompanying notes are an integral part of these financial statements.
| | | | | | |
| Financial highlights | | Wells Fargo Capital Growth Fund | | | 13 | |
(For a share outstanding throughout each period)
| | | | | | | | | | | | | | | | | | | | | | | | |
| | | Six months ended
January 31, 2018 (unaudited) | | | Year ended July 31 | |
| CLASS A | | | 2017 | | | 2016 | | | 2015 | | | 2014 | | | 2013 | |
Net asset value, beginning of period | | | $17.56 | | | | $15.12 | | | | $17.38 | | | | $21.31 | | | | $19.87 | | | | $16.74 | |
Net investment income (loss) | | | (0.03 | )1 | | | (0.03 | )1 | | | (0.03 | )1 | | | (0.07 | )1 | | | (0.10 | )1 | | | 0.00 | 1,2 |
Net realized and unrealized gains (losses) on investments | | | 3.11 | | | | 2.90 | | | | 0.04 | | | | 2.09 | | | | 3.79 | | | | 3.43 | |
| | | | | | | | | | | | | | | | | | | | | | | | |
Total from investment operations | | | 3.08 | | | | 2.87 | | | | 0.01 | | | | 2.02 | | | | 3.69 | | | | 3.43 | |
Distributions to shareholders from | | | | | | | | | | | | | | | | | | | | | | | | |
Net investment income | | | 0.00 | | | | (0.02 | ) | | | 0.00 | | | | 0.00 | | | | (0.02 | ) | | | 0.00 | |
Net realized gains | | | (2.53 | ) | | | (0.41 | ) | | | (2.27 | ) | | | (5.95 | ) | | | (2.23 | ) | | | (0.30 | ) |
| | | | | | | | | | | | | | | | | | | | | | | | |
Total distributions to shareholders | | | (2.53 | ) | | | (0.43 | ) | | | (2.27 | ) | | | (5.95 | ) | | | (2.25 | ) | | | (0.30 | ) |
Net asset value, end of period | | | $18.11 | | | | $17.56 | | | | $15.12 | | | | $17.38 | | | | $21.31 | | | | $19.87 | |
Total return3 | | | 19.74 | % | | | 19.52 | % | | | 0.75 | % | | | 11.00 | % | | | 19.09 | % | | | 20.85 | % |
Ratios to average net assets (annualized) | | | | | | | | | | | | | | | | | | | | | | | | |
Gross expenses | | | 1.25 | % | | | 1.24 | % | | | 1.24 | % | | | 1.27 | % | | | 1.26 | % | | | 1.26 | % |
Net expenses | | | 1.06 | % | | | 1.06 | % | | | 1.06 | % | | | 1.11 | % | | | 1.11 | % | | | 1.14 | % |
Net investment income (loss) | | | (0.37 | )% | | | (0.21 | )% | | | (0.18 | )% | | | (0.39 | )% | | | (0.46 | )% | | | 0.01 | % |
Supplemental data | | | | | | | | | | | | | | | | | | | | | | | | |
Portfolio turnover rate | | | 23 | % | | | 59 | % | | | 85 | % | | | 114 | % | | | 94 | % | | | 107 | % |
Net assets, end of period (000s omitted) | | | $85,032 | | | | $72,511 | | | | $77,648 | | | | $17,126 | | | | $18,561 | | | | $16,390 | |
| 1 | Calculated based upon average shares outstanding |
| 2 | Amount is less than $0.005. |
| 3 | Total return calculations do not include any sales charges. Returns for periods of less than one year are not annualized. |
The accompanying notes are an integral part of these financial statements.
| | | | |
| 14 | | Wells Fargo Capital Growth Fund | | Financial highlights |
(For a share outstanding throughout each period)
| | | | | | | | | | | | | | | | | | | | | | | | |
| | | Six months ended
January 31, 2018 (unaudited) | | | Year ended July 31 | |
| CLASS C | | | 2017 | | | 2016 | | | 2015 | | | 2014 | | | 2013 | |
Net asset value, beginning of period | | | $15.58 | | | | $13.54 | | | | $15.92 | | | | $20.12 | | | | $18.98 | | | | $16.12 | |
Net investment loss | | | (0.09 | )1 | | | (0.13 | )1 | | | (0.13 | )1 | | | (0.20 | )1 | | | (0.24 | )1 | | | (0.13 | )1 |
Net realized and unrealized gains (losses) on investments | | | 2.71 | | | | 2.58 | | | | 0.02 | | | | 1.95 | | | | 3.61 | | | | 3.29 | |
| | | | | | | | | | | | | | | | | | | | | | | | |
Total from investment operations | | | 2.62 | | | | 2.45 | | | | (0.11 | ) | | | 1.75 | | | | 3.37 | | | | 3.16 | |
Distributions to shareholders from | | | | | | | | | | | | | | | | | | | | | | | | |
Net realized gains | | | (2.53 | ) | | | (0.41 | ) | | | (2.27 | ) | | | (5.95 | ) | | | (2.23 | ) | | | (0.30 | ) |
Net asset value, end of period | | | $15.67 | | | | $15.58 | | | | $13.54 | | | | $15.92 | | | | $20.12 | | | | $18.98 | |
Total return2 | | | 19.26 | % | | | 18.65 | % | | | 0.00 | % | | | 10.15 | % | | | 18.21 | % | | | 19.97 | % |
Ratios to average net assets (annualized) | | | | | | | | | | | | | | | | | | | | | | | | |
Gross expenses | | | 2.00 | % | | | 1.99 | % | | | 1.99 | % | | | 2.02 | % | | | 2.01 | % | | | 2.01 | % |
Net expenses | | | 1.81 | % | | | 1.81 | % | | | 1.81 | % | | | 1.86 | % | | | 1.86 | % | | | 1.89 | % |
Net investment loss | | | (1.13 | )% | | | (0.95 | )% | | | (0.98 | )% | | | (1.14 | )% | | | (1.20 | )% | | | (0.73 | )% |
Supplemental data | | | | | | | | | | | | | | | | | | | | | | | | |
Portfolio turnover rate | | | 23 | % | | | 59 | % | | | 85 | % | | | 114 | % | | | 94 | % | | | 107 | % |
Net assets, end of period (000s omitted) | | | $3,354 | | | | $2,888 | | | | $3,415 | | | | $4,212 | | | | $4,628 | | | | $4,503 | |
| 1 | Calculated based upon average shares outstanding |
| 2 | Total return calculations do not include any sales charges. Returns for periods of less than one year are not annualized. |
The accompanying notes are an integral part of these financial statements.
| | | | | | |
| Financial highlights | | Wells Fargo Capital Growth Fund | | | 15 | |
(For a share outstanding throughout each period)
| | | | | | | | | | | | | | | | | | | | | | | | |
| | | Six months ended
January 31, 2018 (unaudited) | | | Year ended July 31 | |
| CLASS R6 | | | 2017 | | | 2016 | | | 2015 | | | 2014 | | | 20131 | |
Net asset value, beginning of period | | | $19.52 | | | | $16.70 | | | | $18.87 | | | | $22.56 | | | | $20.85 | | | | $18.22 | |
Net investment income | | | 0.01 | 2 | | | 0.04 | | | | 0.04 | 2 | | | 0.02 | | | | 0.00 | 2,3 | | | 0.07 | |
Net realized and unrealized gains (losses) on investments | | | 3.50 | | | | 3.24 | | | | 0.06 | | | | 2.24 | | | | 4.00 | | | | 2.95 | |
| | | | | | | | | | | | | | | | | | | | | | | | |
Total from investment operations | | | 3.51 | | | | 3.28 | | | | 0.10 | | | | 2.26 | | | | 4.00 | | | | 3.02 | |
Distributions to shareholders from | | | | | | | | | | | | | | | | | | | | | | | | |
Net investment income | | | 0.00 | | | | (0.05 | ) | | | 0.00 | | | | 0.00 | | | | (0.06 | ) | | | (0.09 | ) |
Net realized gains | | | (2.53 | ) | | | (0.41 | ) | | | (2.27 | ) | | | (5.95 | ) | | | (2.23 | ) | | | (0.30 | ) |
| | | | | | | | | | | | | | | | | | | | | | | | |
Total distributions to shareholders | | | (2.53 | ) | | | (0.46 | ) | | | (2.27 | ) | | | (5.95 | ) | | | (2.29 | ) | | | (0.39 | ) |
Net asset value, end of period | | | $20.50 | | | | $19.52 | | | | $16.70 | | | | $18.87 | | | | $22.56 | | | | $20.85 | |
Total return4 | | | 19.98 | % | | | 20.18 | % | | | 1.20 | % | | | 11.54 | % | | | 19.71 | % | | | 16.99 | % |
Ratios to average net assets (annualized) | | | | | | | | | | | | | | | | | | | | | | | | |
Gross expenses | | | 0.81 | % | | | 0.81 | % | | | 0.81 | % | | | 0.79 | % | | | 0.78 | % | | | 0.79 | % |
Net expenses | | | 0.60 | % | | | 0.60 | % | | | 0.60 | % | | | 0.60 | % | | | 0.60 | % | | | 0.60 | % |
Net investment income | | | 0.14 | % | | | 0.23 | % | | | 0.23 | % | | | 0.11 | % | | | 0.01 | % | | | 0.52 | % |
Supplemental data | | | | | | | | | | | | | | | | | | | | | | | | |
Portfolio turnover rate | | | 23 | % | | | 59 | % | | | 85 | % | | | 114 | % | | | 94 | % | | | 107 | % |
Net assets, end of period (000s omitted) | | | $92,408 | | | | $157,462 | | | | $140,581 | | | | $153,009 | | | | $142,754 | | | | $58 | |
| 1 | For the period from November 30, 2012 (commencement of class operations) to July 31, 2013 |
| 2 | Calculated based upon average shares outstanding |
| 3 | Amount is less than $0.005. |
| 4 | Returns for periods of less than one year are not annualized. |
The accompanying notes are an integral part of these financial statements.
| | | | |
| 16 | | Wells Fargo Capital Growth Fund | | Financial highlights |
(For a share outstanding throughout each period)
| | | | | | | | | | | | | | | | | | | | | | | | |
| | | Six months ended
January 31, 2018 (unaudited) | | | Year ended July 31 | |
| ADMINISTRATOR CLASS | | | 2017 | | | 2016 | | | 2015 | | | 2014 | | | 2013 | |
Net asset value, beginning of period | | | $18.87 | | | | $16.20 | | | | $18.43 | | | | $22.22 | | | | $20.61 | | | | $17.32 | |
Net investment income (loss) | | | (0.02 | )1 | | | (0.01 | )1 | | | (0.01 | )1 | | | (0.03 | )1 | | | (0.05 | )1 | | | 0.04 | 1 |
Net realized and unrealized gains (losses) on investments | | | 3.37 | | | | 3.12 | | | | 0.05 | | | | 2.19 | | | | 3.93 | | | | 3.55 | |
| | | | | | | | | | | | | | | | | | | | | | | | |
Total from investment operations | | | 3.35 | | | | 3.11 | | | | 0.04 | | | | 2.16 | | | | 3.88 | | | | 3.59 | |
Distributions to shareholders from | | | | | | | | | | | | | | | | | | | | | | | | |
Net investment income | | | 0.00 | | | | (0.03 | ) | | | 0.00 | | | | 0.00 | | | | (0.04 | ) | | | 0.00 | |
Net realized gains | | | (2.53 | ) | | | (0.41 | ) | | | (2.27 | ) | | | (5.95 | ) | | | (2.23 | ) | | | (0.30 | ) |
| | | | | | | | | | | | | | | | | | | | | | | | |
Total distributions to shareholders | | | (2.53 | ) | | | (0.44 | ) | | | (2.27 | ) | | | (5.95 | ) | | | (2.27 | ) | | | (0.30 | ) |
Net asset value, end of period | | | $19.69 | | | | $18.87 | | | | $16.20 | | | | $18.43 | | | | $22.22 | | | | $20.61 | |
Total return2 | | | 19.81 | % | | | 19.68 | % | | | 0.88 | % | | | 11.22 | % | | | 19.35 | % | | | 21.15 | % |
Ratios to average net assets (annualized) | | | | | | | | | | | | | | | | | | | | | | | | |
Gross expenses | | | 1.16 | % | | | 1.16 | % | | | 1.16 | % | | | 1.11 | % | | | 1.09 | % | | | 1.09 | % |
Net expenses | | | 0.94 | % | | | 0.94 | % | | | 0.93 | % | | | 0.90 | % | | | 0.90 | % | | | 0.91 | % |
Net investment income (loss) | | | (0.19 | )% | | | (0.04 | )% | | | (0.09 | )% | | | (0.16 | )% | | | (0.24 | )% | | | 0.24 | % |
Supplemental data | | | | | | | | | | | | | | | | | | | | | | | | |
Portfolio turnover rate | | | 23 | % | | | 59 | % | | | 85 | % | | | 114 | % | | | 94 | % | | | 107 | % |
Net assets, end of period (000s omitted) | | | $8,430 | | | | $23,144 | | | | $31,064 | | | | $34,886 | | | | $67,830 | | | | $63,786 | |
| 1 | Calculated based upon average shares outstanding |
| 2 | Returns for periods of less than one year are not annualized. |
The accompanying notes are an integral part of these financial statements.
| | | | | | |
| Financial highlights | | Wells Fargo Capital Growth Fund | | | 17 | |
(For a share outstanding throughout each period)
| | | | | | | | | | | | | | | | | | | | | | | | |
| | | Six months ended
January 31, 2018 (unaudited) | | | Year ended July 31 | |
| INSTITUTIONAL CLASS | | | 2017 | | | 2016 | | | 2015 | | | 2014 | | | 2013 | |
Net asset value, beginning of period | | | $19.44 | | | | $16.65 | | | | $18.84 | | | | $22.54 | | | | $20.84 | | | | $17.56 | |
Net investment income | | | 0.00 | 1,2 | | | 0.02 | 1 | | | 0.03 | 1 | | | 0.02 | 1 | | | 0.01 | 1 | | | 0.09 | 1 |
Net realized and unrealized gains (losses) on investments | | | 3.49 | | | | 3.22 | | | | 0.05 | | | | 2.23 | | | | 4.00 | | | | 3.58 | |
| | | | | | | | | | | | | | | | | | | | | | | | |
Total from investment operations | | | 3.49 | | | | 3.24 | | | | 0.08 | | | | 2.25 | | | | 4.01 | | | | 3.67 | |
Distributions to shareholders from | | | | | | | | | | | | | | | | | | | | | | | | |
Net investment income | | | 0.00 | | | | (0.04 | ) | | | 0.00 | | | | 0.00 | | | | (0.08 | ) | | | (0.09 | ) |
Net realized gains | | | (2.53 | ) | | | (0.41 | ) | | | (2.27 | ) | | | (5.95 | ) | | | (2.23 | ) | | | (0.30 | ) |
| | | | | | | | | | | | | | | | | | | | | | | | |
Total distributions to shareholders | | | (2.53 | ) | | | (0.45 | ) | | | (2.27 | ) | | | (5.95 | ) | | | (2.31 | ) | | | (0.39 | ) |
Net asset value, end of period | | | $20.40 | | | | $19.44 | | | | $16.65 | | | | $18.84 | | | | $22.54 | | | | $20.84 | |
Total return3 | | | 19.96 | % | | | 20.00 | % | | | 1.09 | % | | | 11.50 | % | | | 19.76 | % | | | 21.42 | % |
Ratios to average net assets (annualized) | | | | | | | | | | | | | | | | | | | | | | | | |
Gross expenses | | | 0.91 | % | | | 0.91 | % | | | 0.91 | % | | | 0.84 | % | | | 0.82 | % | | | 0.82 | % |
Net expenses | | | 0.70 | % | | | 0.70 | % | | | 0.68 | % | | | 0.65 | % | | | 0.65 | % | | | 0.67 | % |
Net investment income | | | 0.02 | % | | | 0.13 | % | | | 0.16 | % | | | 0.09 | % | | | 0.05 | % | | | 0.46 | % |
Supplemental data | | | | | | | | | | | | | | | | | | | | | | | | |
Portfolio turnover rate | | | 23 | % | | | 59 | % | | | 85 | % | | | 114 | % | | | 94 | % | | | 107 | % |
Net assets, end of period (000s omitted) | | | $20,837 | | | | $24,653 | | | | $23,670 | | | | $22,578 | | | | $49,816 | | | | $331,310 | |
| 1 | Calculated based upon average shares outstanding |
| 2 | Amount is less than $0.005. |
| 3 | Returns for periods of less than one year are not annualized. |
The accompanying notes are an integral part of these financial statements.
| | | | |
| 18 | | Wells Fargo Capital Growth Fund | | Notes to financial statements (unaudited) |
1. ORGANIZATION
Wells Fargo Funds Trust (the “Trust”), a Delaware statutory trust organized on March 10, 1999, is an open-end management investment company registered under the Investment Company Act of 1940, as amended (the “1940 Act”). As an investment company, the Trust follows the accounting and reporting guidance in Financial Accounting Standards Board (“FASB”) Accounting Standards Codification Topic 946, Financial Services – Investment Companies. These financial statements report on the Wells Fargo Capital Growth Fund (the “Fund”) which is a diversified series of the Trust.
Effective at the close of business on November 13, 2017, Class R4 shares were liquidated and the class was subsequently closed. Class R4 shares are no longer offered by the Fund. Information for Class R4 shares reflected in the financial statements represents activity through November 13, 2017.
2. SIGNIFICANT ACCOUNTING POLICIES
The following significant accounting policies, which are consistently followed in the preparation of the financial statements of the Fund, are in conformity with U.S. generally accepted accounting principles which require management to make estimates and assumptions that affect the reported amounts of assets and liabilities, disclosure of contingent assets and liabilities at the date of the financial statements, and the reported amounts of revenues and expenses during the reporting period. Actual results could differ from those estimates.
Securities valuation
All investments are valued each business day as of the close of regular trading on the New York Stock Exchange (generally 4 p.m. Eastern Time), although the Fund may deviate from this calculation time under unusual or unexpected circumstances.
Equity securities that are listed on a foreign or domestic exchange or market are valued at the official closing price or, if none, the last sales price. If no sale occurs on the principal exchange or market that day, a fair value price will be determined in accordance with the Fund’s Valuation Procedures.
Investments in registered open-end investment companies are valued at net asset value. Interests in non-registered investment vehicles that are redeemable at net asset value are fair valued normally at net asset value.
Investments which are not valued using any of the methods discussed above are valued at their fair value, as determined in good faith by the Board of Trustees of the Fund. The Board of Trustees has established a Valuation Committee comprised of the Trustees and has delegated to it the authority to take any actions regarding the valuation of portfolio securities that the Valuation Committee deems necessary or appropriate, including determining the fair value of portfolio securities, unless the determination has been delegated to the Wells Fargo Asset Management Pricing Committee of Wells Fargo Funds Management, LLC (“Funds Management”). The Board of Trustees retains the authority to make or ratify any valuation decisions or approve any changes to the Valuation Procedures as it deems appropriate. On a quarterly basis, the Board of Trustees receives reports on any valuation actions taken by the Valuation Committee or the Wells Fargo Asset Management Pricing Committee which may include items for ratification.
Valuations of fair valued securities are compared to the next actual sales price when available, or other appropriate market values, to assess the continued appropriateness of the fair valuation methodologies used. These securities are fair valued on a day-to-day basis, taking into consideration changes to appropriate market information and any significant changes to the inputs considered in the valuation process until there is a readily available price provided on an exchange or by an independent pricing service. Valuations received from an independent pricing service or independent broker-dealer quotes are periodically validated by comparisons to most recent trades and valuations provided by other independent pricing services in addition to the review of prices by the manager and/or subadviser. Unobservable inputs used in determining fair valuations are identified based on the type of security, taking into consideration factors utilized by market participants in valuing the investment, knowledge about the issuer and the current market environment.
Security loans
The Fund may lend its securities from time to time in order to earn additional income in the form of fees or interest on securities received as collateral or the investment of any cash received as collateral. The Fund continues to receive interest or dividends on the securities loaned. The Fund receives collateral in the form of cash or securities with a value at least equal to the value of the securities on loan. The value of the loaned securities is determined at the close of each business day and any additional required collateral is delivered to the Fund on the next business day. In a securities lending transaction, the net asset value of the Fund will be affected by an increase or decrease in the value of the securities loaned and by an increase or decrease in the value of the instrument in which collateral is invested. The amount of securities lending activity undertaken by the Fund fluctuates from time to time. In the event of default or bankruptcy
| | | | | | |
| Notes to financial statements (unaudited) | | Wells Fargo Capital Growth Fund | | | 19 | |
by the borrower, the Fund may be prevented from recovering the loaned securities or gaining access to the collateral or may experience delays or costs in doing so. In addition, the investment of any cash collateral received may lose all or part of its value. The Fund has the right under the lending agreement to recover the securities from the borrower on demand.
The Fund lends its securities through an unaffiliated securities lending agent. Cash collateral received in connection with its securities lending transactions is invested in Securities Lending Cash Investments, LLC (the “Securities Lending Fund”). The Securities Lending Fund is exempt from registration under Section 3(c)(7) of the 1940 Act and is managed by Funds Management and is subadvised by Wells Capital Management Incorporated (“WellsCap”), an affiliate of Funds Management and an indirect wholly owned subsidiary of Wells Fargo & Company (“Wells Fargo”). Funds Management receives an advisory fee starting at 0.05% and declining to 0.01% as the average daily net assets of the Securities Lending Fund increase. All of the fees received by Funds Management are paid to WellsCap for its services as subadviser. The Securities Lending Fund seeks to provide a positive return compared to the daily Fed Funds Open Rate by investing in high-quality, U.S. dollar-denominated short-term money market instruments. Securities Lending Fund investments are valued at the evaluated bid price provided by an independent pricing service. Income earned from investment in the Securities Lending Fund is included in income from affiliated securities on the Statement of Operations.
Security transactions and income recognition
Securities transactions are recorded on a trade date basis. Realized gains or losses are recorded on the basis of identified cost.
Dividend income is recognized on the ex-dividend date. Dividend income is recorded net of foreign taxes withheld where recovery of such taxes is not assured.
Distributions to shareholders
Distributions to shareholders from net investment income and net realized gains, if any, are recorded on the ex-dividend date. Such distributions are determined in accordance with income tax regulations and may differ from U.S. generally accepted accounting principles. Dividend sources are estimated at the time of declaration. The tax character of distributions is determined as of the Fund’s fiscal year end. Therefore, a portion of the Fund’s distributions made prior to the Fund’s fiscal year end may be categorized as a tax return of capital.
Federal and other taxes
The Fund intends to continue to qualify as a regulated investment company by distributing substantially all of its investment company taxable income and any net realized capital gains (after reduction for capital loss carryforwards) sufficient to relieve it from all, or substantially all, federal income taxes. Accordingly, no provision for federal income taxes was required.
The Fund’s income and federal excise tax returns and all financial records supporting those returns for the prior three fiscal years are subject to examination by the federal and Delaware revenue authorities. Management has analyzed the Fund’s tax positions taken on federal, state, and foreign tax returns for all open tax years and does not believe that there are any uncertain tax positions that require recognition of a tax liability.
As of January 31, 2018, the aggregate cost of all investments for federal income tax purposes was $128,286,757 and the unrealized gains (losses) consisted of:
| | | | |
Gross unrealized gains | | $ | 82,806,573 | |
Gross unrealized losses | | | (752,603 | ) |
Net unrealized gains | | $ | 82,053,970 | |
As of July 31, 2017, the Fund had a qualified late-year ordinary loss of $90,944 which was recognized on the first day of the current fiscal year.
Class allocations
The separate classes of shares offered by the Fund differ principally in applicable sales charges, distribution, shareholder servicing, and administration fees. Class specific expenses are charged directly to that share class. Investment income, common expenses, and realized and unrealized gains (losses) on investments are allocated daily to each class of shares based on the relative proportion of net assets of each class.
| | | | |
| 20 | | Wells Fargo Capital Growth Fund | | Notes to financial statements (unaudited) |
3. FAIR VALUATION MEASUREMENTS
Fair value measurements of investments are determined within a framework that has established a fair value hierarchy based upon the various data inputs utilized in determining the value of the Fund’s investments. The three-level hierarchy gives the highest priority to unadjusted quoted prices in active markets for identical assets or liabilities (Level 1) and the lowest priority to unobservable inputs (Level 3). The Fund’s investments are classified within the fair value hierarchy based on the lowest level of input that is significant to the fair value measurement. The inputs are summarized into three broad levels as follows:
| ∎ | | Level 1 – quoted prices in active markets for identical securities |
| ∎ | | Level 2 – other significant observable inputs (including quoted prices for similar securities, interest rates, prepayment speeds, credit risk, etc.) |
| ∎ | | Level 3 – significant unobservable inputs (including the Fund’s own assumptions in determining the fair value of investments) |
The inputs or methodologies used for valuing investments in securities are not necessarily an indication of the risk associated with investing in those securities.
The following is a summary of the inputs used in valuing the Fund’s assets and liabilities as of January 31, 2018:
| | | | | | | | | | | | | | | | |
| | | Quoted prices
(Level 1) | | | Other significant
observable inputs
(Level 2) | | | Significant
unobservable inputs
(Level 3) | | | Total | |
Assets | | | | | | | | | | | | | | | | |
Investments in: | | | | | | | | | | | | | | | | |
| | | | |
Common stocks | | | | | | | | | | | | | | | | |
Consumer discretionary | | $ | 29,904,405 | | | $ | 0 | | | $ | 0 | | | $ | 29,904,405 | |
Consumer staples | | | 4,336,142 | | | | 0 | | | | 0 | | | | 4,336,142 | |
Energy | | | 2,048,592 | | | | 0 | | | | 0 | | | | 2,048,592 | |
Financials | | | 11,434,422 | | | | 0 | | | | 0 | | | | 11,434,422 | |
Health care | | | 30,360,732 | | | | 0 | | | | 0 | | | | 30,360,732 | |
Industrials | | | 19,537,370 | | | | 0 | | | | 0 | | | | 19,537,370 | |
Information technology | | | 88,732,952 | | | | 0 | | | | 0 | | | | 88,732,952 | |
Materials | | | 12,810,998 | | | | 0 | | | | 0 | | | | 12,810,998 | |
Real estate | | | 1,884,600 | | | | 0 | | | | 0 | | | | 1,884,600 | |
| | | | |
Short-term investments | | | | | | | | | | | | | | | | |
Investment companies | | | 9,290,514 | | | | 0 | | | | 0 | | | | 9,290,514 | |
Total assets | | $ | 210,340,727 | | | $ | 0 | | | $ | 0 | | | $ | 210,340,727 | |
The Fund recognizes transfers between levels within the fair value hierarchy at the end of the reporting period. At January 31, 2018, the Fund did not have any transfers into/out of Level 1, Level 2, or Level 3.
4. TRANSACTIONS WITH AFFILIATES
Management fee
Funds Management, an indirect wholly owned subsidiary of Wells Fargo, is the manager of the Fund and provides advisory and fund-level administrative services under an investment management agreement. Under the investment management agreement, Funds Management is responsible for, among other services, implementing the investment objectives and strategies of the Fund, supervising the subadviser, providing fund-level administrative services in connection with the Fund’s operations, and providing any other fund-level administrative services reasonably necessary for the operation of the Fund. As compensation for its services under the investment management agreement, Funds Management is entitled to receive an annual management fee starting at 0.70% and declining to 0.505% as the average daily net assets of the Fund increase. For the six months ended January 31, 2018, the management fee was equivalent to an annual rate of 0.70% of the Fund’s average daily net assets.
Funds Management has retained the services of a subadviser to provide daily portfolio management to the Fund. The fee for subadvisory services is borne by Funds Management. WellsCap is the subadviser to the Fund and is entitled to receive a fee from Funds Management at an annual rate starting at 0.30% and declining to 0.20% as the average daily net assets of the Fund increase.
| | | | | | |
| Notes to financial statements (unaudited) | | Wells Fargo Capital Growth Fund | | | 21 | |
Administration fees
Under a class-level administration agreement, Funds Management provides class-level administrative services to the Fund, which includes paying fees and expenses for services provided by the transfer agent, sub-transfer agents, omnibus account servicers and record-keepers. As compensation for its services under the class-level administration agreement, Funds Management receives an annual fee which is calculated based on the average daily net assets of each class as follows:
| | | | |
| | | Class-level
administration fee | |
Class A, Class C | | | 0.21 | % |
Class R4 | | | 0.08 | |
Class R6 | | | 0.03 | |
Administrator Class, Institutional Class | | | 0.13 | |
Funds Management has contractually waived and/or reimbursed management and administration fees to the extent necessary to maintain certain net operating expense ratios for the Fund. Waiver of fees and/or reimbursement of expenses by Funds Management were made first from fund level expenses on a proportionate basis and then from class specific expenses. Funds Management has committed through November 30, 2018 to waive fees and/or reimburse expenses to the extent necessary to cap the Fund’s expenses at 1.11% for Class A shares, 1.86% for Class C shares, 0.60% for R6 shares, 0.94% for Administrator Class shares, and 0.70% for Institutional Class shares. After this time, the cap may be increased or the commitment to maintain the cap may be terminated only with the approval of the Board of Trustees.
Distribution fee
The Trust has adopted a distribution plan for Class C shares of the Fund pursuant to Rule 12b-1 under the 1940 Act. A distribution fee is charged to Class C shares and paid to Wells Fargo Funds Distributor, LLC (“Funds Distributor”), the principal underwriter, at an annual rate of 0.75% of the average daily net assets of Class C shares.
In addition, Funds Distributor is entitled to receive the front-end sales charge from the purchase of Class A shares and a contingent deferred sales charge on the redemption of certain Class A shares. Funds Distributor is also entitled to receive the contingent deferred sales charges from redemptions of Class C shares. For the six months ended January 31, 2018, Funds Distributor received $1,657 from the sale of Class A shares. No contingent deferred sales charges were incurred by Class A and Class C for the six months ended January 31, 2018.
Shareholder servicing fees
The Trust has entered into contracts with one or more shareholder servicing agents, whereby Class A, Class C, and Administrator Class of the Fund are charged a fee at an annual rate of 0.25% of the average daily net assets of each respective class. Class R4 was charged a fee at an annual rate of 0.10% of its average daily net assets.
A portion of these total shareholder servicing fees were paid to affiliates of Wells Fargo.
Interfund transactions
The Fund may purchase or sell investment securities to other Wells Fargo affiliates pursuant to Rule 17a-7 of the 1940 Act and under procedures adopted by the Board of Trustees. The procedures have been designed to ensure that these interfund transactions, which do not incur broker commissions, are effected at current market prices.
5. INVESTMENT PORTFOLIO TRANSACTIONS
Purchases and sales of investments, excluding U.S. government obligations (if any) and short-term securities, for the six months ended January 31, 2018 were $55,281,177 and $169,850,989, respectively.
6. BANK BORROWINGS
The Trust (excluding the money market funds and certain other funds) and Wells Fargo Variable Trust are parties to a $280,000,000 revolving credit agreement whereby the Fund is permitted to use bank borrowings for temporary or emergency purposes, such as to fund shareholder redemption requests. Interest under the credit agreement is charged to the Fund based on a borrowing rate equal to the higher of the Federal Funds rate in effect on that day plus 1.25% or the overnight LIBOR rate in effect on that day plus 1.25%. In addition, an annual commitment fee equal to 0.25% of the unused balance is allocated to each participating fund. Prior to August 29, 2017, the revolving credit agreement amount was $250,000,000.
For the six months ended January 31, 2018, there were no borrowings by the Fund under the agreement.
| | | | |
| 22 | | Wells Fargo Capital Growth Fund | | Notes to financial statements (unaudited) |
7. CONCENTRATION RISK
Concentration risks result from exposure to a limited number of sectors. A fund that invests a substantial portion of its assets in any sector may be more affected by changes in that sector than would be a fund whose investments are not heavily weighted in any sector.
8. INDEMNIFICATION
Under the Trust’s organizational documents, the officers and Trustees have been granted certain indemnification rights against certain liabilities that may arise out of performance of their duties to the Trust. Additionally, in the normal course of business, the Trust may enter into contracts with service providers that contain a variety of indemnification clauses. The Trust’s maximum exposure under these arrangements is dependent on future claims that may be made against the Fund and, therefore, cannot be estimated.
| | | | | | |
| Other information (unaudited) | | Wells Fargo Capital Growth Fund | | | 23 | |
PROXY VOTING INFORMATION
A description of the policies and procedures that the Fund uses to determine how to vote proxies relating to portfolio securities is available, upon request, by calling 1-800-222-8222, visiting our website at wellsfargofunds.com, or visiting the SEC website at sec.gov. Information regarding how the Fund voted proxies relating to portfolio securities during the most recent 12-month period ended June 30 is available on the Fund’s website at wellsfargofunds.com or by visiting the SEC website at sec.gov.
PORTFOLIO HOLDINGS INFORMATION
The complete portfolio holdings for the Fund are publicly available monthly on the Fund’s website (wellsfargofunds.com), on a one-month delayed basis. In addition, top ten holdings information (excluding derivative positions) for the Fund is publicly available on the Fund’s website on a monthly, seven-day or more delayed basis. The Fund files its complete schedule of portfolio holdings with the SEC for the first and third quarters of each fiscal year on Form N-Q, which is available by visiting the SEC website at sec.gov. In addition, the Fund’s Form N-Q may be reviewed and copied at the SEC’s Public Reference Room in Washington, DC, and at regional offices in New York City, at 233 Broadway, and in Chicago, at 175 West Jackson Boulevard, Suite 900. Information about the Public Reference Room may be obtained by calling 1-800-SEC-0330.
| | | | |
| 24 | | Wells Fargo Capital Growth Fund | | Other information (unaudited) |
BOARD OF TRUSTEES AND OFFICERS
Each of the Trustees and Officers1 listed in the table below acts in identical capacities for each fund in the Wells Fargo family of funds, which consists of 153 mutual funds comprising the Wells Fargo Funds Trust, Wells Fargo Variable Trust, Wells Fargo Master Trust and four closed-end funds (collectively the “Fund Complex”). This table should be read in conjunction with the Prospectus and the Statement of Additional Information2. The mailing address of each Trustee and Officer is 525 Market Street, 12th Floor, San Francisco, CA 94105. Each Trustee and Officer serves an indefinite term, however, each Trustee serves such term until reaching the mandatory retirement age established by the Trustees.
Independent Trustees
| | | | | | |
Name and year of birth | | Position held and length of service* | | Principal occupations during past five years or longer | | Current other public company or
investment company
directorships |
| William R. Ebsworth (Born 1957) | | Trustee, since 2015 | | Retired. From 1984 to 2013, equities analyst, portfolio manager, research director and chief investment officer at Fidelity Management and Research Company in Boston, Tokyo, and Hong Kong, and retired in 2013 as Chief Investment Officer of Fidelity Strategic Advisers, Inc. where he led a team of investment professionals managing client assets. Prior thereto, Board member of Hong Kong Securities Clearing Co., Hong Kong Options Clearing Corp., the Thailand International Fund, Ltd., Fidelity Investments Life Insurance Company, and Empire Fidelity Investments Life Insurance Company. Board member of the Forté Foundation (non-profit organization) and the Vincent Memorial Hospital Endowment (non-profit organization), where he serves on the Investment Committee and as a Chair of the Audit Committee. Mr. Ebsworth is a CFA® charterholder. | | Asset Allocation Trust |
Jane A. Freeman** (Born 1953) | | Trustee, since 2015; Chair Liaison, since 2018 | | Retired. From 2012 to 2014 and 1999 to 2008, Chief Financial Officer of Scientific Learning Corporation. From 2008 to 2012, Ms. Freeman provided consulting services related to strategic business projects. Prior to 1999, Portfolio Manager at Rockefeller & Co. and Scudder, Stevens & Clark. Board member of the Harding Loevner Funds from 1996 to 2014, serving as both Lead Independent Director and chair of the Audit Committee. Board member of the Russell Exchange Traded Funds Trust from 2011 to 2012 and the chair of the Audit Committee. Ms. Freeman is a Board Member of Ruth Bancroft Garden (non-profit organization) and the Glimmerglass Festival. She is also an inactive Chartered Financial Analyst. | | Asset Allocation Trust |
Isaiah Harris, Jr. (Born 1952) | | Trustee, since 2009 | | Retired. Chairman of the Board of CIGNA Corporation since 2009, and Director since 2005. From 2003 to 2011, Director of Deluxe Corporation. Prior thereto, President and CEO of BellSouth Advertising and Publishing Corp. from 2005 to 2007, President and CEO of BellSouth Enterprises from 2004 to 2005 and President of BellSouth Consumer Services from 2000 to 2003. Emeritus member of the Iowa State University Foundation Board of Governors. Emeritus Member of the Advisory Board of Iowa State University School of Business. Advisory Board Member, Palm Harbor Academy (charter school). Advisory Board Member, Child Evangelism Fellowship (non-profit). Mr. Harris is a certified public accountant (inactive status). | | CIGNA Corporation; Asset Allocation Trust |
Judith M. Johnson (Born 1949) | | Trustee, since 2008; Audit Committee Chairman, since 2008 | | Retired. Prior thereto, Chief Executive Officer and Chief Investment Officer of Minneapolis Employees Retirement Fund from 1996 to 2008. Ms. Johnson is an attorney, certified public accountant and a certified managerial accountant. | | Asset Allocation Trust |
David F. Larcker (Born 1950) | | Trustee, since 2009 | | James Irvin Miller Professor of Accounting at the Graduate School of Business, Stanford University, Director of the Corporate Governance Research Initiative and Senior Faculty of The Rock Center for Corporate Governance since 2006. From 2005 to 2008, Professor of Accounting at the Graduate School of Business, Stanford University. Prior thereto, Ernst & Young Professor of Accounting at The Wharton School, University of Pennsylvania from 1985 to 2005. | | Asset Allocation Trust |
| | | | | | |
| Other information (unaudited) | | Wells Fargo Capital Growth Fund | | | 25 | |
| | | | | | |
Name and year of birth | | Position held and length of service* | | Principal occupations during past five years or longer | | Current other public company or
investment company
directorships |
Olivia S. Mitchell*** (Born 1953) | | Trustee, since 2006; Governance Committee Chairman, since 2018 | | International Foundation of Employee Benefit Plans Professor, Wharton School of the University of Pennsylvania since 1993. Director of Wharton’s Pension Research Council and Boettner Center on Pensions & Retirement Research, and Research Associate at the National Bureau of Economic Research. Previously, Cornell University Professor from 1978 to 1993. | | Asset Allocation Trust |
Timothy J. Penny**** (Born 1951) | | Trustee since 1996; Chairman, since 2018; Vice Chairman, from 2017 to 2018 | | President and Chief Executive Officer of Southern Minnesota Initiative Foundation, a non-profit organization, since 2007. Member of the Board of Trustees of NorthStar Education Finance, Inc., a non-profit organization, since 2007. | | Asset Allocation Trust |
| James G. Polisson***** (Born 1959) | | Trustee, since 2018; Advisory Board Member, from 2017 to 2018 | | Retired. Chief Marketing Officer, Source (ETF) UK Services, Ltd, from 2015 to 2017. From 2012 to 2015, Principal of The Polisson Group, LLC, a management consulting, corporate advisory and principal investing company. Chief Executive Officer and Managing Director at Russell Investments, Global Exchange Traded Funds from 2010 to 2012. Managing Director of Barclays Global Investors from 1998 to 2010 and Global Chief Marketing Officer for iShares and Barclays Global Investors from 2000 to 2010. Trustee of the San Francisco Mechanics’ Institute, a non-profit organization, from 2013 to 2015. Board member of the Russell Exchange Traded Fund Trust from 2011 to 2012. Director of Barclays Global Investors Holdings Deutschland GmbH from 2006 to 2009. Mr. Polisson is an attorney and has a retired status with the Massachusetts and District of Columbia Bar Associations. | | Asset Allocation Trust |
| Michael S. Scofield (Born 1943) | | Trustee, since 2010 | | Served on the Investment Company Institute’s Board of Governors and Executive Committee from 2008-2011 as well the Governing Council of the Independent Directors Council from 2006-2011 and the Independent Directors Council Executive Committee from 2008-2011. Trustee of the Evergreen Fund complex (and its predecessors) from 1984 to 2010. Chairman of the Evergreen Funds from 2000-2010. Former Trustee of the Mentor Funds. Retired Attorney, Law Offices of Michael S. Scofield. | | Asset Allocation Trust |
| Pamela Wheelock***** (Born 1959) | | Trustee, since 2018; Advisory Board Member, from 2017 to 2018 | | Chief Operating Officer, Twin Cities Habitat for Humanity, since January, 2017. Vice President of University Services, University of Minnesota from 2012 to 2017. Prior thereto, Interim President and Chief Executive Officer of Blue Cross Blue Shield of Minnesota from 2010 to 2011, Chairman of the Board from 2009 to 2011 and Board Director from 2003 to 2015. Vice President, Leadership and Community Engagement, Bush Foundation, Saint Paul, Minnesota (a private foundation) from 2009 to 2011. Executive Vice President and Chief Financial Officer, Minnesota Sports and Entertainment from 2004 to 2009 and Senior Vice President from 2002 to 2004. Commissioner of Finance, State of Minnesota, from 1999 to 2002. Currently on the Board of Directors, Governance Committee and Finance Committee, for the Minnesota Philanthropy Partners (Saint Paul Foundation) since 2012 and Board Chair of the Minnesota Wild Foundation since 2010. | | Asset Allocation Trust |
| * | Length of service dates reflect the Trustee’s commencement of service with the Trust’s predecessor entities, where applicable. |
| ** | Jane Freeman became Chair Liaison effective January 1, 2018. |
| *** | Olivia Mitchell became Chairman of the Governance Committee effective January 1, 2018. |
| **** | Timothy Penny became Chairman effective January 1, 2018. |
| ***** | James Polisson and Pamela Wheelock each became a Trustee effective January 1, 2018. |
| | | | |
| 26 | | Wells Fargo Capital Growth Fund | | Other information (unaudited) |
Officers
| | | | | | |
Name and year of birth | | Position held and
length of service | | Principal occupations during past five years or longer | | |
Andrew Owen (Born 1960) | | President, since 2017 | | Executive Vice President of Wells Fargo & Company and Head of Affiliated Managers, Wells Fargo Asset Management, since 2014. In addition, Mr. Owen is currently President, Chief Executive Officer and Director of Wells Fargo Funds Management, LLC since 2017. Prior thereto, Executive Vice President responsible for marketing, investments and product development for Wells Fargo Funds Management, LLC, from 2009 to 2014. | | |
Jeremy DePalma1 (Born 1974) | | Treasurer, since 2012 | | Senior Vice President of Wells Fargo Funds Management, LLC since 2009. Senior Vice President of Evergreen Investment Management Company, LLC from 2008 to 2010 and head of the Fund Reporting and Control Team within Fund Administration from 2005 to 2010. | | |
C. David Messman (Born 1960) | | Secretary, since 2000; Chief Legal Officer, since 2003 | | Senior Vice President and Secretary of Wells Fargo Funds Management, LLC since 2001. Assistant General Counsel of Wells Fargo Bank, N.A. since 2013 and Vice President and Managing Counsel of Wells Fargo Bank, N.A. from 1996 to 2013. | | |
Michael H. Whitaker (Born 1967) | | Chief Compliance Officer, since 2016 | | Senior Vice President and Chief Compliance Officer since 2016. Senior Vice President and Chief Compliance Officer for Fidelity Investments from 2007 to 2016. | | |
David Berardi (Born 1975) | | Assistant Treasurer, since 2009 | | Vice President of Wells Fargo Funds Management, LLC since 2009. Vice President of Evergreen Investment Management Company, LLC from 2008 to 2010. Manager of Fund Reporting and Control for Evergreen Investment Management Company, LLC from 2004 to 2010. | | |
| 1 | Jeremy DePalma acts as Treasurer of 76 funds and Assistant Treasurer of 77 funds in the Fund Complex. |
| 2 | The Statement of Additional Information includes additional information about the Trustees and is available, without charge, upon request, by calling 1-800-222-8222 or by visiting the website at wellsfargofunds.com. |
| | | | | | |
| List of abbreviations | | Wells Fargo Capital Growth Fund | | | 27 | |
The following is a list of common abbreviations for terms and entities that may have appeared in this report.
| ACA | — ACA Financial Guaranty Corporation |
| ADR | — American depositary receipt |
| ADS | — American depositary shares |
| AGC | — Assured Guaranty Corporation |
| AGM | — Assured Guaranty Municipal |
| Ambac | — Ambac Financial Group Incorporated |
| AMT | — Alternative minimum tax |
| BAN | — Bond anticipation notes |
| BHAC | — Berkshire Hathaway Assurance Corporation |
| CAB | — Capital appreciation bond |
| CCAB | — Convertible capital appreciation bond |
| CDA | — Community Development Authority |
| CDO | — Collateralized debt obligation |
| CLO | — Collateralized loan obligation |
| DRIVER | — Derivative inverse tax-exempt receipts |
| DW&P | — Department of Water & Power |
| DWR | — Department of Water Resources |
| ECFA | — Educational & Cultural Facilities Authority |
| EDA | — Economic Development Authority |
| EDFA | — Economic Development Finance Authority |
| ETF | — Exchange-traded fund |
| FDIC | — Federal Deposit Insurance Corporation |
| FFCB | — Federal Farm Credit Banks |
| FGIC | — Financial Guaranty Insurance Corporation |
| FHA | — Federal Housing Administration |
| FHLB | — Federal Home Loan Bank |
| FHLMC | — Federal Home Loan Mortgage Corporation |
| FICO | — The Financing Corporation |
| FNMA | — Federal National Mortgage Association |
| GDR | — Global depositary receipt |
| GNMA | — Government National Mortgage Association |
| HCFR | — Healthcare facilities revenue |
| HEFA | — Health & Educational Facilities Authority |
| HEFAR | — Higher education facilities authority revenue |
| HFA | — Housing Finance Authority |
| HFFA | — Health Facilities Financing Authority |
| HUD | — Department of Housing and Urban Development |
| IDA | — Industrial Development Authority |
| IDAG | — Industrial Development Agency |
| KRW | — Republic of Korea won |
| LIBOR | — London Interbank Offered Rate |
| LIFER | — Long Inverse Floating Exempt Receipts |
| LLC | — Limited liability company |
| LLLP | — Limited liability limited partnership |
| LLP | — Limited liability partnership |
| MBIA | — Municipal Bond Insurance Association |
| MFHR | — Multifamily housing revenue |
| MSTR | — Municipal securities trust receipts |
| MUD | — Municipal Utility District |
| National | — National Public Finance Guarantee Corporation |
| PCFA | — Pollution Control Financing Authority |
| PCL | — Public Company Limited |
| PCR | — Pollution control revenue |
| PFA | — Public Finance Authority |
| PFFA | — Public Facilities Financing Authority |
| PFOTER | — Puttable floating option tax-exempt receipts |
| PJSC | — Public Joint Stock Company |
| plc | — Public limited company |
| PUTTER | — Puttable tax-exempt receipts |
| R&D | — Research & development |
| Radian | — Radian Asset Assurance |
| RAN | — Revenue anticipation notes |
| RDA | — Redevelopment Agency |
| RDFA | — Redevelopment Finance Authority |
| REIT | — Real estate investment trust |
| ROC | — Reset option certificates |
| SAVRS | — Select auction variable rate securities |
| SBA | — Small Business Authority |
| SDR | — Swedish depositary receipt |
| SFHR | — Single-family housing revenue |
| SFMR | — Single-family mortgage revenue |
| SIFMA | — Securities Industry and Financial Markets Association |
| SPA | — Standby purchase agreement |
| SPDR | — Standard & Poor’s Depositary Receipts |
| SPEAR | — Short Puttable Exempt Adjustable Receipts |
| STRIPS | — Separate trading of registered interest and |
| TAN | — Tax anticipation notes |
| TIPS | — Treasury inflation-protected securities |
| TRAN | — Tax revenue anticipation notes |
| TTFA | — Transportation Trust Fund Authority |
| TVA | — Tennessee Valley Authority |
This page is intentionally left blank.

For more information
More information about Wells Fargo Funds is available free upon request. To obtain literature, please write, email, visit the Fund’s website, or call:
Wells Fargo Funds
P.O. Box 8266
Boston, MA 02266-8266
Email: fundservice@wellsfargo.com
Website: wellsfargofunds.com
Individual investors: 1-800-222-8222
Retail investment professionals: 1-888-877-9275
Institutional investment professionals: 1-866-765-0778
This report and the financial statements contained herein are submitted for the general information of the shareholders of the Fund. If this report is used for promotional purposes, distribution of the report must be accompanied or preceded by a current prospectus. Before investing, please consider the investment objectives, risks, charges, and expenses of the investment. For a current prospectus and, if available, a summary prospectus, containing this information, call 1-800-222-8222 or visit the Fund’s website at wellsfargofunds.com. Read the prospectus carefully before you invest or send money.
Wells Fargo Asset Management (WFAM) is a trade name used by the asset management businesses of Wells Fargo & Company. Wells Fargo Funds Management, LLC, a wholly owned subsidiary of Wells Fargo & Company, provides investment advisory and administrative services for Wells Fargo Funds. Other affiliates of Wells Fargo & Company provide subadvisory and other services for the funds. The funds are distributed by Wells Fargo Funds Distributor, LLC, Member FINRA, an affiliate of Wells Fargo & Company. Neither Wells Fargo Funds Distributor nor Wells Fargo Funds Management holds fund shareholder accounts or assets. This material is for general informational and educational purposes only and is NOT intended to provide investment advice or a recommendation of any kind—including a recommendation for any specific investment, strategy, or plan.
NOT FDIC INSURED ◾ NO BANK GUARANTEE ◾ MAY LOSE VALUE
© 2018 Wells Fargo Funds Management, LLC. All rights reserved.
| | |
 | | 309111 03-18 SA200/SAR200 01-18 |
Semi-Annual Report
January 31, 2018

Wells Fargo Disciplined U.S. Core Fund


Reduce clutter. Save trees.
Sign up for electronic delivery of prospectuses and shareholder reports at wellsfargo.com/advantagedelivery
Contents
The views expressed and any forward-looking statements are as of January 31, 2018, unless otherwise noted, and are those of the Fund managers and/or Wells Fargo Funds Management, LLC. Discussions of individual securities, or the markets generally, or any Wells Fargo Fund are not intended as individual recommendations. Future events or results may vary significantly from those expressed in any forward-looking statements. The views expressed are subject to change at any time in response to changing circumstances in the market. Wells Fargo Funds Management, LLC and the Fund disclaim any obligation to publicly update or revise any views expressed or forward-looking statements.
NOT FDIC INSURED ◾ NO BANK GUARANTEE ◾ MAY LOSE VALUE
| | | | |
| 2 | | Wells Fargo Disciplined U.S. Core Fund | | Letter to shareholders (unaudited) |

Andrew Owen
President
Wells Fargo Funds
While investing in stocks and bonds generally delivered favorable returns during the past six months, fixed-income investments in the U.S. diverged from the global trend.
Dear Shareholder:
We are pleased to offer you this semi-annual report for the Wells Fargo Disciplined U.S. Core Fund for the six-month period that ended January 31, 2018. While investing in stocks generally delivered favorable returns during the past six months, fixed-income investments in the U.S. diverged from the global trend. U.S. and international stocks delivered similar results, with returns of 15.43% and 13.50%, respectively, for the six-month period, as measured by the S&P 500 Index1 and the MSCI ACWI ex USA Index (Net)2, respectively. Within fixed income, the Bloomberg Barclays Global Aggregate ex-USD Index3 earned 4.50%. In the U.S., fixed-income investments, as measured by the Bloomberg Barclays U.S. Aggregate Bond Index4, fell 0.35% and the Bloomberg Barclays Municipal Bond Index5 declined 0.19%.
As global growth improved in the third quarter of 2017, investment markets advanced.
Globally, stocks moved higher during the late summer of 2017 as they were subject to the same positive economic conditions that influenced their advances during first half of the year: moderately accelerating global economic growth supported by improving corporate earnings as well as low inflation and interest rates. Brief episodes of geopolitical tensions, primarily associated with North Korea’s advancing nuclear missile program, flaring conflicts in the Middle East, and uncertainty surrounding the new U.S. administration’s trade policies, did not discourage investing activity. In the U.S., economic data released during the quarter reflected a generally healthy economy. Second-quarter economic output grew at a 3.1% annual rate.
Outside the U.S., stocks in international developed and emerging markets were supported by improved economic growth. Advances in emerging markets equity valuations slowed compared with the pace of the first half of 2017 but continued an upward path. Central banks in Europe, Asia, and Japan maintained low-interest-rate policies that supported business growth and equity investing.
In the U.S., Federal Reserve (Fed) officials announced in October plans to begin the process of unwinding its $4.5 trillion portfolio of bonds and other assets accumulated during rounds of quantitative easing conducted since the 2008–2009 recession. Still, restrained inflation kept long-term bond rates steady and the flattening of the yield curve persisted.
Positive economic and market news continued as 2017 closed and 2018 began.
During the fourth quarter of 2017, stock markets continued an upward trajectory. Synchronous economic expansion worldwide continued with mild inflation and low volatility. Data released during the quarter reflected a healthy U.S. economy.
| 1 | The S&P 500 Index consists of 500 stocks chosen for market size, liquidity, and industry group representation. It is a market-value-weighted index with each stock’s weight in the index proportionate to its market value. You cannot invest directly in an index. |
| 2 | The Morgan Stanley Capital International (MSCI) All Country World Index (ACWI) ex USA Index (Net) is a free-float-adjusted market-capitalization-weighted index that is designed to measure the equity market performance of developed markets, excluding the United States and Canada. Source: MSCI. MSCI makes no express or implied warranties or representations and shall have no liability whatsoever with respect to any MSCI data contained herein. The MSCI data may not be further redistributed or used as a basis for other indices or any securities or financial products. This report is not approved, reviewed, or produced by MSCI. You cannot invest directly in an index. |
| 3 | The Bloomberg Barclays Global Aggregate ex-USD Index is an unmanaged index that provides a broad-based measure of the global investment-grade fixed-income markets excluding the U.S.-dollar-denominated debt market. You cannot invest directly in an index. |
| 4 | The Bloomberg Barclays U.S. Aggregate Bond Index is a broad-based benchmark that measures the investment-grade, U.S. dollar-denominated, fixed-rate taxable bond market, including Treasuries, government-related and corporate securities, mortgage-backed securities (agency fixed-rate and hybrid adjustable-rate mortgage pass-throughs), asset-backed securities, and commercial mortgage-backed securities. You cannot invest directly in an index. |
| 5 | The Bloomberg Barclays Municipal Bond Index is an unmanaged index composed of long-term tax-exempt bonds with a minimum credit rating of Baa. You cannot invest directly in an index. |
| | | | | | |
| Letter to shareholders (unaudited) | | Wells Fargo Disciplined U.S. Core Fund | | | 3 | |
Third-quarter economic output grew at a 3.2% annual rate. Increased hiring pushed the unemployment rate down to a 17-year low of 4.1%. Tax reform in the U.S. that passed as the year ended also encouraged increased spending among businesses and individuals. Signs of long-awaited wage growth appeared to emerge.
Outside the U.S., economies continued to strengthen. In December, the Organisation for Economic Co-operation and Development (OECD) reported that the global economy has been expanding at its fastest rate since 2010; all 35 countries the OECD follows were on track to expand for 2017. International economies have benefited from catalysts such as economic stimulus, improving employment, increased investment, accelerated trade growth, and the firming of prices for some of the commodities that are essential exports of many international economies.
October 2017 marked one year since regulatory reform of money market investing in the U.S. By December 2017, money market fund asset levels exceeded their December 2016 levels, reflecting continued investor demand for the short-term investment opportunities afforded them by money market funds.
In December 2017, the Fed raised the federal funds rate target to a range of 1.25% to 1.50%. The Fed also began reducing its bond portfolio. Long-term interest rates in the U.S. trended higher as the yield curve steepened—the 10-year Treasury rate moved from 2.46% to 2.84% and the 30-year rate moved from 2.81% to 3.08% during January 2018.
Don’t let short-term uncertainty derail long-term investment goals.
Periods of investment uncertainty can present challenges, but experience has taught us that maintaining long-term investment goals can be an effective way to plan for the future. To help you create a sound strategy based on your personal goals and risk tolerance, Wells Fargo Funds offers more than 100 mutual funds spanning a wide range of asset classes and investment styles. Although diversification cannot guarantee an investment profit or prevent losses, we believe it can be an effective way to manage investment risk and potentially smooth out overall portfolio performance. We encourage investors to know their investments and to understand that appropriate levels of risk-taking may unlock opportunities.
Thank you for choosing to invest with Wells Fargo Funds. We appreciate your confidence in us and remain committed to helping you meet your financial needs.
Sincerely,

Andrew Owen
President
Wells Fargo Funds
Although diversification cannot guarantee an investment profit or prevent losses, we believe it can be an effective way to manage investment risk and potentially smooth out overall portfolio performance.
For further information about your Fund, contact your investment professional, visit our website at wellsfargofunds.com, or call us directly at 1-800-222-8222.
| | | | |
| 4 | | Wells Fargo Disciplined U.S. Core Fund | | Performance highlights (unaudited) |
Investment objective
The Fund seeks long-term capital appreciation.
Manager
Wells Fargo Funds Management, LLC
Subadviser
Wells Capital Management Incorporated
Portfolio manager
Justin Carr, CFA®
Greg W. Golden, CFA®
Average annual total returns (%) as of January 31, 20181
| | | | | | | | | | | | | | | | | | | | | | | | | | | | | | | | | | |
| | | | | Including sales charge | | | Excluding sales charge | | | Expense ratios2 (%) | |
| | | Inception date | | 1 year | | | 5 year | | | 10 year | | | 1 year | | | 5 year | | | 10 year | | | Gross | | | Net3 | |
| Class A (EVSAX) | | 2-28-1990 | | | 17.83 | | | | 14.72 | | | | 8.99 | | | | 24.98 | | | | 16.09 | | | | 9.64 | | | | 0.85 | | | | 0.85 | |
| Class C (EVSTX) | | 6-30-1999 | | | 23.12 | | | | 15.23 | | | | 8.83 | | | | 24.12 | | | | 15.23 | | | | 8.83 | | | | 1.60 | | | | 1.60 | |
| Class R (EVSHX) | | 9-30-2015 | | | – | | | | – | | | | – | | | | 24.70 | | | | 15.80 | | | | 9.35 | | | | 1.10 | | | | 1.10 | |
| Class R6 (EVSRX) | | 9-30-2015 | | | – | | | | – | | | | – | | | | 25.59 | | | | 16.59 | | | | 10.07 | | | | 0.42 | | | | 0.42 | |
| Administrator Class (EVSYX) | | 2-21-1995 | | | – | | | | – | | | | – | | | | 25.13 | | | | 16.25 | | | | 9.84 | | | | 0.77 | | | | 0.74 | |
| Institutional Class (EVSIX) | | 7-30-2010 | | | – | | | | – | | | | – | | | | 25.41 | | | | 16.55 | | | | 10.05 | | | | 0.52 | | | | 0.48 | |
| S&P 500 Index4 | | – | | | – | | | | – | | | | – | | | | 26.41 | | | | 15.91 | | | | 9.78 | | | | – | | | | – | |
Figures quoted represent past performance, which is no guarantee of future results, and do not reflect taxes that a shareholder may pay on fund distributions or the redemption of fund shares. Investment return and principal value of an investment will fluctuate so that an investor’s shares, when redeemed, may be worth more or less than their original cost. Performance shown without sales charges would be lower if sales charges were reflected. Current performance may be lower or higher than the performance data quoted, which assumes the reinvestment of dividends and capital gains. Current month-end performance is available on the Fund’s website, wellsfargofunds.com.
Index returns do not include transaction costs associated with buying and selling securities, any mutual fund fees or expenses, or any taxes. It is not possible to invest directly in an index.
For Class A shares, the maximum front-end sales charge is 5.75%. For Class C shares, the maximum contingent deferred sales charge is 1.00%. Performance including a contingent deferred sales charge assumes the sales charge for the corresponding time period. Class R, Class R6, Administrator Class, and Institutional Class shares are sold without a front-end sales charge or contingent deferred sales charge.
Stock values fluctuate in response to the activities of individual companies and general market and economic conditions. The use of derivatives may reduce returns and/or increase volatility. Consult the Fund’s prospectus for additional information on these and other risks.
Please see footnotes on page 5.
| | | | | | |
| Performance highlights (unaudited) | | Wells Fargo Disciplined U.S. Core Fund | | | 5 | |
| | | | |
| Ten largest holdings (%) as of January 31, 20185 | |
Microsoft Corporation | | | 3.63 | |
Apple Incorporated | | | 3.59 | |
Berkshire Hathaway Incorporated Class B | | | 2.11 | |
Johnson & Johnson | | | 2.07 | |
Exxon Mobil Corporation | | | 2.04 | |
Amazon .com Incorporated | | | 2.03 | |
Facebook Incorporated Class A | | | 1.94 | |
Alphabet Incorporated Class C | | | 1.86 | |
JPMorgan Chase & Company | | | 1.85 | |
Alphabet Incorporated Class A | | | 1.81 | |
|
| Sector distribution as of January 31, 20186 |
|
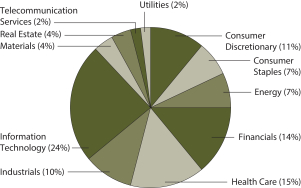
|
| 1 | Historical performance shown for Class R shares prior to their inception reflects the performance of Administrator Class shares, adjusted to reflect higher expenses applicable to Class R shares. Historical performance shown for Class R6 shares prior to their inception reflects the performance of Institutional Class shares, and includes the higher expenses applicable to Institutional Class shares. If these expenses had not been included, returns for Class R6 shares would be higher. Historical performance shown for Institutional Class shares prior to their inception reflects the performance of Administrator Class shares, and includes the higher expenses applicable to Administrator Class shares. If these expenses had not been included, returns for Institutional Class shares would be higher. Historical performance shown for all classes of the Fund prior to July 19, 2010, is based on the performance of the Fund’s predecessor, Evergreen Enhanced S&P 500 Fund. |
| 2 | Reflects the expense ratios as stated in the most recent prospectuses. The expense ratios shown are subject to change and may differ from the annualized expense ratios shown in the financial highlights of this report. |
| 3 | The manager has contractually committed through November 30, 2018, to waive fees and/or reimburse expenses to the extent necessary to cap the Fund’s Total Annual Fund Operating Expenses After Fee Waivers at 0.87% for Class A, 1.62% for Class C, 1.12% for Class R, 0.43% for Class R6, 0.74% for Administrator Class, and 0.48% for Institutional Class. After this time, the cap may be increased or the commitment to maintain the cap may be terminated only with the approval of the Board of Trustees. Brokerage commissions, stamp duty fees, interest, taxes, acquired fund fees and expenses, and extraordinary expenses are excluded from the expense cap. Without this cap, the Fund’s returns would have been lower. The expense ratio paid by an investor is the net expense ratio or the Fund’s Total Annual Fund Operating Expenses After Fee Waivers, as stated in the prospectuses. |
| 4 | The S&P 500 Index consists of 500 stocks chosen for market size, liquidity, and industry group representation. It is a market-value-weighted index with each stock’s weight in the index proportionate to its market value. You cannot invest directly in an index. |
| 5 | The ten largest holdings, excluding cash and cash equivalents, are calculated based on the value of the investments divided by total net assets of the Fund. Holdings are subject to change and may have changed since the date specified. |
| 6 | Amounts are calculated based on the total long-term investments of the Fund. These amounts are subject to change and may have changed since the date specified. |
| | | | |
| 6 | | Wells Fargo Disciplined U.S. Core Fund | | Fund expenses (unaudited) |
As a shareholder of the Fund, you incur two types of costs: (1) transaction costs, including sales charges (loads) on purchase payments and contingent deferred sales charges (if any) on redemptions and (2) ongoing costs, including management fees, distribution (12b-1) and/or shareholder servicing fees, and other Fund expenses. This example is intended to help you understand your ongoing costs (in dollars) of investing in the Fund and to compare these costs with the ongoing costs of investing in other mutual funds.
The example is based on an investment of $1,000 invested at the beginning of the six-month period and held for the entire period from August 1, 2017 to January 31, 2018.
Actual expenses
The “Actual” line of the table below provides information about actual account values and actual expenses. You may use the information in this line, together with the amount you invested, to estimate the expenses that you paid over the period. Simply divide your account value by $1,000 (for example, an $8,600 account value divided by $1,000 = 8.6), then multiply the result by the number in the “Actual” line under the heading entitled “Expenses paid during period” for your applicable class of shares to estimate the expenses you paid on your account during this period.
Hypothetical example for comparison purposes
The “Hypothetical” line of the table below provides information about hypothetical account values and hypothetical expenses based on the Fund’s actual expense ratio and an assumed rate of return of 5% per year before expenses, which is not the Fund’s actual return. The hypothetical account values and expenses may not be used to estimate the actual ending account balance or expenses you paid for the period. You may use this information to compare the ongoing costs of investing in the Fund and other funds. To do so, compare this 5% hypothetical example with the 5% hypothetical examples that appear in the shareholder reports of the other funds.
Please note that the expenses shown in the table are meant to highlight your ongoing costs only and do not reflect any transactional costs, such as sales charges (loads) and contingent deferred sales charges. Therefore, the “Hypothetical” line of the table is useful in comparing ongoing costs only and will not help you determine the relative total costs of owning different funds. In addition, if these transactional costs were included, your costs would have been higher.
| | | | | | | | | | | | | | | | |
| | | Beginning
account value
8-1-2017 | | | Ending
account value
1-31-2018 | | | Expenses
paid during
the period¹ | | | Annualized net
expense ratio | |
Class A | | | | | | | | | | | | | | | | |
Actual | | $ | 1,000.00 | | | $ | 1,149.40 | | | $ | 4.55 | | | | 0.84 | % |
Hypothetical (5% return before expenses) | | $ | 1,000.00 | | | $ | 1,020.97 | | | $ | 4.28 | | | | 0.84 | % |
Class C | | | | | | | | | | | | | | | | |
Actual | | $ | 1,000.00 | | | $ | 1,145.50 | | | $ | 8.60 | | | | 1.59 | % |
Hypothetical (5% return before expenses) | | $ | 1,000.00 | | | $ | 1,017.19 | | | $ | 8.08 | | | | 1.59 | % |
Class R | | | | | | | | | | | | | | | | |
Actual | | $ | 1,000.00 | | | $ | 1,148.05 | | | $ | 5.90 | | | | 1.09 | % |
Hypothetical (5% return before expenses) | | $ | 1,000.00 | | | $ | 1,019.71 | | | $ | 5.55 | | | | 1.09 | % |
Class R6 | | | | | | | | | | | | | | | | |
Actual | | $ | 1,000.00 | | | $ | 1,152.21 | | | $ | 2.17 | | | | 0.40 | % |
Hypothetical (5% return before expenses) | | $ | 1,000.00 | | | $ | 1,023.19 | | | $ | 2.04 | | | | 0.40 | % |
Administrator Class | | | | | | | | | | | | | | | | |
Actual | | $ | 1,000.00 | | | $ | 1,150.24 | | | $ | 4.01 | | | | 0.74 | % |
Hypothetical (5% return before expenses) | | $ | 1,000.00 | | | $ | 1,021.48 | | | $ | 3.77 | | | | 0.74 | % |
Institutional Class | | | | | | | | | | | | | | | | |
Actual | | $ | 1,000.00 | | | $ | 1,151.08 | | | $ | 2.60 | | | | 0.48 | % |
Hypothetical (5% return before expenses) | | $ | 1,000.00 | | | $ | 1,022.79 | | | $ | 2.45 | | | | 0.48 | % |
| 1 | Expenses paid is equal to the annualized net expense ratio of each class multiplied by the average account value over the period, multiplied by the number of days in the most recent fiscal half-year divided by the number of days in the fiscal year (to reflect the one-half-year period). |
| | | | | | |
| Portfolio of investments—January 31, 2018 (unaudited) | | Wells Fargo Disciplined U.S. Core Fund | | | 7 | |
| | | | | | | | | | | | | | | | |
| Security name | | | | | | | | Shares | | | Value | |
| | | | |
Common Stocks: 98.97% | | | | | | | | | | | | | | | | |
| | | | |
Consumer Discretionary: 11.43% | | | | | | | | | | | | | | | | |
| | | | |
| Automobiles: 0.63% | | | | | | | | | | | | | | | | |
Ford Motor Company | | | | | | | | | | | 784,696 | | | $ | 8,608,115 | |
| | | | | | | | | | | | | | | | |
| | | | |
| Hotels, Restaurants & Leisure: 1.47% | | | | | | | | | | | | | | | | |
Carnival Corporation | | | | | | | | | | | 116,168 | | | | 8,318,790 | |
Penn National Gaming Incorporated † | | | | | | | | | | | 154,677 | | | | 4,935,743 | |
Royal Caribbean Cruises Limited | | | | | | | | | | | 31,683 | | | | 4,231,265 | |
Starbucks Corporation | | | | | | | | | | | 44,610 | | | | 2,534,294 | |
| | | | |
| | | | | | | | | | | | | | | 20,020,092 | |
| | | | | | | | | | | | | | | | |
| | | | |
| Internet & Direct Marketing Retail: 2.52% | | | | | | | | | | | | | | | | |
Amazon.com Incorporated † | | | | | | | | | | | 19,098 | | | | 27,709,097 | |
Nutrisystem Incorporated | | | | | | | | | | | 156,558 | | | | 6,771,134 | |
| | | | |
| | | | | | | | | | | | | | | 34,480,231 | |
| | | | | | | | | | | | | | | | |
| | | | |
| Media: 3.36% | | | | | | | | | | | | | | | | |
Comcast Corporation Class A | | | | | | | | | | | 454,262 | | | | 19,319,763 | |
News Corporation Class A | | | | | | | | | | | 156,482 | | | | 2,677,407 | |
The Walt Disney Company | | | | | | | | | | | 129,863 | | | | 14,112,212 | |
Time Warner Incorporated | | | | | | | | | | | 47,202 | | | | 4,500,711 | |
Twenty-First Century Fox Incorporated Class A | | | | | | | | | | | 141,753 | | | | 5,230,686 | |
| | | | |
| | | | | | | | | | | | | | | 45,840,779 | |
| | | | | | | | | | | | | | | | |
| | | | |
| Multiline Retail: 0.68% | | | | | | | | | | | | | | | | |
Big Lots Stores Incorporated | | | | | | | | | | | 73,165 | | | | 4,446,969 | |
Kohl’s Corporation | | | | | | | | | | | 32,550 | | | | 2,108,264 | |
Macy’s Incorporated | | | | | | | | | | | 104,796 | | | | 2,719,456 | |
| | | | |
| | | | | | | | | | | | | | | 9,274,689 | |
| | | | | | | | | | | | | | | | |
| | | | |
| Specialty Retail: 2.77% | | | | | | | | | | | | | | | | |
Best Buy Company Incorporated | | | | | | | | | | | 129,083 | | | | 9,430,804 | |
GameStop Corporation Class A « | | | | | | | | | | | 206,383 | | | | 3,469,298 | |
The Home Depot Incorporated | | | | | | | | | | | 107,464 | | | | 21,589,518 | |
The TJX Companies Incorporated | | | | | | | | | | | 42,055 | | | | 3,377,858 | |
| | | | |
| | | | | | | | | | | | | | | 37,867,478 | |
| | | | | | | | | | | | | | | | |
| | | | |
Consumer Staples: 7.11% | | | | | | | | | | | | | | | | |
| | | | |
| Beverages: 1.17% | | | | | | | | | | | | | | | | |
Molson Coors Brewing Company Class B | | | | | | | | | | | 96,275 | | | | 8,089,026 | |
The Coca-Cola Company | | | | | | | | | | | 166,802 | | | | 7,938,107 | |
| | | | |
| | | | | | | | | | | | | | | 16,027,133 | |
| | | | | | | | | | | | | | | | |
| | | | |
| Food & Staples Retailing: 3.09% | | | | | | | | | | | | | | | | |
CVS Health Corporation | | | | | | | | | | | 159,900 | | | | 12,582,531 | |
The Kroger Company | | | | | | | | | | | 165,541 | | | | 5,025,825 | |
Wal-Mart Stores Incorporated | | | | | | | | | | | 160,141 | | | | 17,071,031 | |
The accompanying notes are an integral part of these financial statements.
| | | | |
| 8 | | Wells Fargo Disciplined U.S. Core Fund | | Portfolio of investments—January 31, 2018 (unaudited) |
| | | | | | | | | | | | | | | | |
| Security name | | | | | | | | Shares | | | Value | |
| | | | |
| Food & Staples Retailing (continued) | | | | | | | | | | | | | | | | |
Walgreens Boots Alliance Incorporated | | | | | | | | | | | 100,316 | | | $ | 7,549,782 | |
| | | | |
| | | | | | | | | | | | | | | 42,229,169 | |
| | | | | | | | | | | | | | | | |
| | | | |
| Food Products: 1.11% | | | | | | | | | | | | | | | | |
Sanderson Farms Incorporated | | | | | | | | | | | 51,173 | | | | 6,493,854 | |
Tyson Foods Incorporated Class A | | | | | | | | | | | 113,332 | | | | 8,625,699 | |
| | | | |
| | | | | | | | | | | | | | | 15,119,553 | |
| | | | | | | | | | | | | | | | |
| | | | |
| Household Products: 0.67% | | | | | | | | | | | | | | | | |
Kimberly-Clark Corporation | | | | | | | | | | | 28,800 | | | | 3,369,600 | |
The Procter & Gamble Company | | | | | | | | | | | 67,332 | | | | 5,813,445 | |
| | | | |
| | | | | | | | | | | | | | | 9,183,045 | |
| | | | | | | | | | | | | | | | |
| | | | |
| Tobacco: 1.07% | | | | | | | | | | | | | | | | |
Altria Group Incorporated | | | | | | | | | | | 206,970 | | | | 14,558,270 | |
| | | | | | | | | | | | | | | | |
| | | | |
Energy: 6.61% | | | | | | | | | | | | | | | | |
| | | | |
| Energy Equipment & Services: 0.99% | | | | | | | | | | | | | | | | |
Schlumberger Limited | | | | | | | | | | | 183,935 | | | | 13,533,937 | |
| | | | | | | | | | | | | | | | |
| | | | |
| Oil, Gas & Consumable Fuels: 5.62% | | | | | | | | | | | | | | | | |
Chevron Corporation | | | | | | | | | | | 167,770 | | | | 21,029,970 | |
ConocoPhillips | | | | | | | | | | | 80,582 | | | | 4,739,027 | |
Exxon Mobil Corporation | | | | | | | | | | | 318,812 | | | | 27,832,288 | |
Kinder Morgan Incorporated | | | | | | | | | | | 526,080 | | | | 9,458,918 | |
Marathon Petroleum Corporation | | | | | | | | | | | 44,374 | | | | 3,073,787 | |
Valero Energy Corporation | | | | | | | | | | | 109,517 | | | | 10,510,346 | |
| | | | |
| | | | | | | | | | | | | | | 76,644,336 | |
| | | | | | | | | | | | | | | | |
| | | | |
Financials: 14.22% | | | | | | | | | | | | | | | | |
| | | | |
| Banks: 5.92% | | | | | | | | | | | | | | | | |
Bank of America Corporation | | | | | | | | | | | 535,842 | | | | 17,146,944 | |
Citigroup Incorporated | | | | | | | | | | | 246,727 | | | | 19,363,135 | |
Comerica Incorporated | | | | | | | | | | | 31,771 | | | | 3,025,235 | |
JPMorgan Chase & Company | | | | | | | | | | | 218,250 | | | | 25,244,978 | |
People’s United Financial Incorporated | | | | | | | | | | | 167,370 | | | | 3,292,168 | |
PNC Financial Services Group Incorporated | | | | | | | | | | | 26,449 | | | | 4,179,471 | |
Popular Incorporated | | | | | | | | | | | 103,136 | | | | 4,191,447 | |
Regions Financial Corporation | | | | | | | | | | | 228,380 | | | | 4,391,747 | |
| | | | |
| | | | | | | | | | | | | | | 80,835,125 | |
| | | | | | | | | | | | | | | | |
| | | | |
| Capital Markets: 1.94% | | | | | | | | | | | | | | | | |
Bank of New York Mellon Corporation | | | | | | | | | | | 117,731 | | | | 6,675,348 | |
BGC Partners Incorporated | | | | | | | | | | | 476,567 | | | | 6,819,674 | |
Invesco Limited | | | | | | | | | | | 57,456 | | | | 2,075,885 | |
Morgan Stanley | | | | | | | | | | | 140,071 | | | | 7,921,015 | |
State Street Corporation | | | | | | | | | | | 26,551 | | | | 2,925,124 | |
| | | | |
| | | | | | | | | | | | | | | 26,417,046 | |
| | | | | | | | | | | | | | | | |
The accompanying notes are an integral part of these financial statements.
| | | | | | |
| Portfolio of investments—January 31, 2018 (unaudited) | | Wells Fargo Disciplined U.S. Core Fund | | | 9 | |
| | | | | | | | | | | | | | | | |
| Security name | | | | | | | | Shares | | | Value | |
| | | | |
| Consumer Finance: 0.47% | | | | | | | | | | | | | | | | |
Synchrony Financial | | | | | | | | | | | 162,230 | | | $ | 6,437,286 | |
| | | | | | | | | | | | | | | | |
| | | | |
| Diversified Financial Services: 2.11% | | | | | | | | | | | | | | | | |
Berkshire Hathaway Incorporated Class B † | | | | | | | | | | | 134,418 | | | | 28,816,531 | |
| | | | | | | | | | | | | | | | |
| | | | |
| Insurance: 3.56% | | | | | | | | | | | | | | | | |
AFLAC Incorporated | | | | | | | | | | | 102,940 | | | | 9,079,308 | |
American Equity Investment Life Holding Company | | | | | | | | | | | 125,713 | | | | 4,148,529 | |
Assured Guaranty Limited | | | | | | | | | | | 202,365 | | | | 7,202,170 | |
FNF Group | | | | | | | | | | | 71,840 | | | | 2,800,323 | |
MetLife Incorporated | | | | | | | | | | | 208,060 | | | | 10,001,444 | |
Principal Financial Group Incorporated | | | | | | | | | | | 75,113 | | | | 5,077,639 | |
Prudential Financial Incorporated | | | | | | | | | | | 23,621 | | | | 2,806,647 | |
The Progressive Corporation | | | | | | | | | | | 137,156 | | | | 7,420,140 | |
| | | | |
| | | | | | | | | | | | | | | 48,536,200 | |
| | | | | | | | | | | | | | | | |
| | | | |
| Thrifts & Mortgage Finance: 0.22% | | | | | | | | | | | | | | | | |
MGIC Investment Corporation † | | | | | | | | | | | 203,072 | | | | 3,009,527 | |
| | | | | | | | | | | | | | | | |
| | | | |
Health Care: 14.75% | | | | | | | | | | | | | | | | |
| | | | |
| Biotechnology: 3.21% | | | | | | | | | | | | | | | | |
AbbVie Incorporated | | | | | | | | | | | 170,201 | | | | 19,099,956 | |
Amgen Incorporated | | | | | | | | | | | 70,099 | | | | 13,041,919 | |
Gilead Sciences Incorporated | | | | | | | | | | | 138,693 | | | | 11,622,473 | |
| | | | |
| | | | | | | | | | | | | | | 43,764,348 | |
| | | | | | | | | | | | | | | | |
| | | | |
| Health Care Equipment & Supplies: 2.49% | | | | | | | | | | | | | | | | |
Abbott Laboratories | | | | | | | | | | | 233,906 | | | | 14,539,597 | |
Baxter International Incorporated | | | | | | | | | | | 143,214 | | | | 10,315,704 | |
Medtronic plc | | | | | | | | | | | 106,749 | | | | 9,168,672 | |
| | | | |
| | | | | | | | | | | | | | | 34,023,973 | |
| | | | | | | | | | | | | | | | |
| | | | |
| Health Care Providers & Services: 3.58% | | | | | | | | | | | | | | | | |
Anthem Incorporated | | | | | | | | | | | 22,912 | | | | 5,678,739 | |
Cigna Corporation | | | | | | | | | | | 13,977 | | | | 2,912,108 | |
Humana Incorporated | | | | | | | | | | | 29,165 | | | | 8,219,572 | |
Magellan Health Services Incorporated † | | | | | | | | | | | 38,385 | | | | 3,823,146 | |
McKesson Corporation | | | | | | | | | | | 48,212 | | | | 8,142,043 | |
UnitedHealth Group Incorporated | | | | | | | | | | | 84,757 | | | | 20,068,762 | |
| | | | |
| | | | | | | | | | | | | | | 48,844,370 | |
| | | | | | | | | | | | | | | | |
| | | | |
| Pharmaceuticals: 5.47% | | | | | | | | | | | | | | | | |
Bristol-Myers Squibb Company | | | | | | | | | | | 134,287 | | | | 8,406,366 | |
Eli Lilly & Company | | | | | | | | | | | 47,540 | | | | 3,872,133 | |
Johnson & Johnson | | | | | | | | | | | 204,185 | | | | 28,216,325 | |
Merck & Company Incorporated | | | | | | | | | | | 275,510 | | | | 16,323,968 | |
Pfizer Incorporated | | | | | | | | | | | 482,710 | | | | 17,879,578 | |
| | | | |
| | | | | | | | | | | | | | | 74,698,370 | |
| | | | | | | | | | | | | | | | |
The accompanying notes are an integral part of these financial statements.
| | | | |
| 10 | | Wells Fargo Disciplined U.S. Core Fund | | Portfolio of investments—January 31, 2018 (unaudited) |
| | | | | | | | | | | | | | | | |
| Security name | | | | | | | | Shares | | | Value | |
| | | | |
Industrials: 9.77% | | | | | | | | | | | | | | | | |
| | | | |
| Aerospace & Defense: 1.75% | | | | | | | | | | | | | | | | |
The Boeing Company | | | | | | | | | | | 57,156 | | | $ | 20,254,372 | |
United Technologies Corporation | | | | | | | | | | | 26,892 | | | | 3,711,365 | |
| | | | |
| | | | | | | | | | | | | | | 23,965,737 | |
| | | | | | | | | | | | | | | | |
| | | | |
| Air Freight & Logistics: 1.12% | | | | | | | | | | | | | | | | |
FedEx Corporation | | | | | | | | | | | 16,742 | | | | 4,394,440 | |
United Parcel Service Incorporated Class B | | | | | | | | | | | 86,030 | | | | 10,953,340 | |
| | | | |
| | | | | | | | | | | | | | | 15,347,780 | |
| | | | | | | | | | | | | | | | |
| | | | |
| Airlines: 1.73% | | | | | | | | | | | | | | | | |
Copa Holdings SA Class A | | | | | | | | | �� | | 30,085 | | | | 4,161,658 | |
Delta Air Lines Incorporated | | | | | | | | | | | 162,098 | | | | 9,202,303 | |
Hawaiian Holdings Incorporated † | | | | | | | | | | | 161,150 | | | | 6,018,953 | |
United Continental Holdings Incorporated † | | | | | | | | | | | 61,792 | | | | 4,190,733 | |
| | | | |
| | | | | | | | | | | | | | | 23,573,647 | |
| | | | | | | | | | | | | | | | |
| | | | |
| Commercial Services & Supplies: 1.15% | | | | | | | | | | | | | | | | |
Tetra Tech Incorporated | | | | | | | | | | | 60,009 | | | | 2,982,447 | |
The Brink’s Company | | | | | | | | | | | 47,621 | | | | 3,971,591 | |
Waste Management Incorporated | | | | | | | | | | | 99,162 | | | | 8,768,896 | |
| | | | |
| | | | | | | | | | | | | | | 15,722,934 | |
| | | | | | | | | | | | | | | | |
| | | | |
| Construction & Engineering: 0.59% | | | | | | | | | | | | | | | | |
MasTec Incorporated † | | | | | | | | | | | 79,131 | | | | 4,225,595 | |
Valmont Industries Incorporated | | | | | | | | | | | 23,195 | | | | 3,794,702 | |
| | | | |
| | | | | | | | | | | | | | | 8,020,297 | |
| | | | | | | | | | | | | | | | |
| | | | |
| Electrical Equipment: 0.17% | | | | | | | | | | | | | | | | |
AMETEK Incorporated | | | | | | | | | | | 30,277 | | | | 2,310,135 | |
| | | | | | | | | | | | | | | | |
| | | | |
| Industrial Conglomerates: 1.02% | | | | | | | | | | | | | | | | |
3M Company | | | | | | | | | | | 28,136 | | | | 7,048,068 | |
Honeywell International Incorporated | | | | | | | | | | | 42,689 | | | | 6,816,153 | |
| | | | |
| | | | | | | | | | | | | | | 13,864,221 | |
| | | | | | | | | | | | | | | | |
| | | | |
| Machinery: 1.31% | | | | | | | | | | | | | | | | |
Caterpillar Incorporated | | | | | | | | | | | 39,841 | | | | 6,485,318 | |
Crane Company Crane Co | | | | | | | | | | | 44,786 | | | | 4,475,913 | |
Cummins Incorporated | | | | | | | | | | | 30,509 | | | | 5,735,692 | |
EnPro Industries Incorporated | | | | | | | | | | | 14,361 | | | | 1,263,624 | |
| | | | |
| | | | | | | | | | | | | | | 17,960,547 | |
| | | | | | | | | | | | | | | | |
| | | | |
| Professional Services: 0.59% | | | | | | | | | | | | | | | | |
Manpower Incorporated | | | | | | | | | | | 60,913 | | | | 8,003,359 | |
| | | | | | | | | | | | | | | | |
| | | | |
| Trading Companies & Distributors: 0.34% | | | | | | | | | | | | | | | | |
Applied Industrial Technologies Incorporated | | | | | | | | | | | 62,366 | | | | 4,599,493 | |
| | | | | | | | | | | | | | | | |
The accompanying notes are an integral part of these financial statements.
| | | | | | |
| Portfolio of investments—January 31, 2018 (unaudited) | | Wells Fargo Disciplined U.S. Core Fund | | | 11 | |
| | | | | | | | | | | | | | | | |
| Security name | | | | | | | | Shares | | | Value | |
| | | | |
Information Technology: 23.76% | | | | | | | | | | | | | | | | |
| | | | |
| Communications Equipment: 1.35% | | | | | | | | | | | | | | | | |
ARRIS International plc † | | | | | | | | | | | 106,764 | | | $ | 2,701,129 | |
Cisco Systems Incorporated | | | | | | | | | | | 377,598 | | | | 15,685,421 | |
| | | | |
| | | | | | | | | | | | | | | 18,386,550 | |
| | | | | | | | | | | | | | | | |
| | | | |
| Electronic Equipment, Instruments & Components: 0.55% | | | | | | | | | | | | | | | | |
Corning Incorporated | | | | | | | | | | | 137,110 | | | | 4,280,574 | |
Jabil Circuit Incorporated | | | | | | | | | | | 127,015 | | | | 3,229,991 | |
| | | | |
| | | | | | | | | | | | | | | 7,510,565 | |
| | | | | | | | | | | | | | | | |
| | | | |
| Internet Software & Services: 5.62% | | | | | | | | | | | | | | | | |
Alphabet Incorporated Class A † | | | | | | | | | | | 20,897 | | | | 24,704,851 | |
Alphabet Incorporated Class C † | | | | | | | | | | | 21,752 | | | | 25,448,535 | |
Facebook Incorporated Class A † | | | | | | | | | | | 141,932 | | | | 26,525,671 | |
| | | | |
| | | | | | | | | | | | | | | 76,679,057 | |
| | | | | | | | | | | | | | | | |
| | | | |
| IT Services: 2.90% | | | | | | | | | | | | | | | | |
Accenture plc Class A | | | | | | | | | | | 79,077 | | | | 12,707,674 | |
International Business Machines Corporation | | | | | | | | | | | 80,927 | | | | 13,247,750 | |
Total System Services Incorporated | | | | | | | | | | | 101,085 | | | | 8,982,413 | |
Visa Incorporated Class A | | | | | | | | | | | 37,690 | | | | 4,682,229 | |
| | | | |
| | | | | | | | | | | | | | | 39,620,066 | |
| | | | | | | | | | | | | | | | |
| | | | |
| Semiconductors & Semiconductor Equipment: 3.66% | | | | | | | | | | | | | | | | |
Applied Materials Incorporated | | | | | | | | | | | 148,946 | | | | 7,987,974 | |
Intel Corporation | | | | | | | | | | | 399,181 | | | | 19,216,573 | |
Lam Research Corporation | | | | | | | | | | | 15,522 | | | | 2,972,773 | |
Micron Technology Incorporated † | | | | | | | | | | | 238,154 | | | | 10,412,093 | |
NVIDIA Corporation | | | | | | | | | | | 13,110 | | | | 3,222,438 | |
Texas Instruments Incorporated | | | | | | | | | | | 56,710 | | | | 6,219,386 | |
| | | | |
| | | | | | | | | | | | | | | 50,031,237 | |
| | | | | | | | | | | | | | | | |
| | | | |
| Software: 4.80% | | | | | | | | | | | | | | | | |
Microsoft Corporation | | | | | | | | | | | 521,493 | | | | 49,547,050 | |
Oracle Corporation | | | | | | | | | | | 310,607 | | | | 16,024,215 | |
| | | | |
| | | | | | | | | | | | | | | 65,571,265 | |
| | | | | | | | | | | | | | | | |
| | | | |
| Technology Hardware, Storage & Peripherals: 4.88% | | | | | | | | | | | | | | | | |
Apple Incorporated | | | | | | | | | | | 292,886 | | | | 49,037,903 | |
HP Incorporated | | | | | | | | | | | 411,897 | | | | 9,605,438 | |
Western Digital Corporation | | | | | | | | | | | 89,342 | | | | 7,949,651 | |
| | | | |
| | | | | | | | | | | | | | | 66,592,992 | |
| | | | | | | | | | | | | | | | |
| | | | |
Materials: 3.77% | | | | | | | | | | | | | | | | |
| | | | |
| Chemicals: 1.08% | | | | | | | | | | | | | | | | |
Huntsman Corporation | | | | | | | | | | | 138,123 | | | | 4,774,912 | |
LyondellBasell Industries NV Class A | | | | | | | | | | | 83,472 | | | | 10,003,284 | |
| | | | |
| | | | | | | | | | | | | | | 14,778,196 | |
| | | | | | | | | | | | | | | | |
The accompanying notes are an integral part of these financial statements.
| | | | |
| 12 | | Wells Fargo Disciplined U.S. Core Fund | | Portfolio of investments—January 31, 2018 (unaudited) |
| | | | | | | | | | | | | | | | |
| Security name | | | | | | | | Shares | | | Value | |
| | | | |
| Containers & Packaging: 0.57% | | | | | | | | | | | | | | | | |
Avery Dennison Corporation | | | | | | | | | | | 63,580 | | | $ | 7,799,994 | |
| | | | | | | | | | | | | | | | |
| | | | |
| Metals & Mining: 1.20% | | | | | | | | | | | | | | | | |
Freeport-McMoRan Incorporated † | | | | | | | | | | | 380,647 | | | | 7,422,617 | |
Newmont Mining Corporation | | | | | | | | | | | 220,716 | | | | 8,941,205 | |
| | | | |
| | | | | | | | | | | | | | | 16,363,822 | |
| | | | | | | | | | | | | | | | |
| | | | |
| Paper & Forest Products: 0.92% | | | | | | | | | | | | | | | | |
Domtar Corporation | | | | | | | | | | | 77,667 | | | | 3,988,977 | |
Louisiana-Pacific Corporation † | | | | | | | | | | | 287,070 | | | | 8,500,143 | |
| | | | |
| | | | | | | | | | | | | | | 12,489,120 | |
| | | | | | | | | | | | | | | | |
| | | | |
Real Estate: 3.62% | | | | | | | | | | | | | | | | |
| | | | |
| Equity REITs: 3.19% | | | | | | | | | | | | | | | | |
American Tower Corporation | | | | | | | | | | | 72,662 | | | | 10,732,177 | |
Equinix Incorporated | | | | | | | | | | | 19,056 | | | | 8,674,101 | |
GGP Incorporated | | | | | | | | | | | 353,751 | | | | 8,146,886 | |
Kimco Realty Corporation | | | | | | | | | | | 141,210 | | | | 2,246,651 | |
Prologis Incorporated | | | | | | | | | | | 58,526 | | | | 3,810,628 | |
Weyerhaeuser Company | | | | | | | | 264,583 | | | | 9,932,446 | |
| | | | |
| | | | | | | | | | | | | | | 43,542,889 | |
| | | | | | | | | | | | | | | | |
| | | | |
| Real Estate Management & Development: 0.43% | | | | | | | | | | | | | | | | |
CBRE Group Incorporated Class A † | | | | | | | | 129,813 | | | | 5,931,156 | |
| | | | | | | | | | | | | | | | |
| | | | |
Telecommunication Services: 1.63% | | | | | | | | | | | | | | | | |
| | | | |
| Diversified Telecommunication Services: 1.63% | | | | | | | | | | | | | | | | |
AT&T Incorporated | | | | | | | | 518,791 | | | | 19,428,723 | |
Verizon Communications Incorporated | | | | | | | | 53,027 | | | | 2,867,170 | |
| | | | |
| | | | | | | | | | | | | | | 22,295,893 | |
| | | | | | | | | | | | | | | | |
| | | |
Utilities: 2.30% | | | | | | | | | | | | | |
| | | | |
| Electric Utilities: 1.75% | | | | | | | | | | | | | | | | |
Avangrid Incorporated | | | | | | | | 158,679 | | | | 7,730,841 | |
Exelon Corporation | | | | | | | | 243,334 | | | | 9,370,792 | |
Otter Tail Corporation | | | | | | | | 62,402 | | | | 2,658,325 | |
PG&E Corporation | | | | | | | | 96,521 | | | | 4,095,386 | |
| | | | |
| | | | | | | | | | | | | | | 23,855,344 | |
| | | | | | | | | | | | | | | | |
| | | | |
| Multi-Utilities: 0.55% | | | | | | | | | | | | | | | | |
CenterPoint Energy Incorporated | | | | | | | | 98,722 | | | | 2,781,986 | |
DTE Energy Company | | | | | | | | 44,517 | | | | 4,702,776 | |
| | | | |
| | | | | | | | | | | | | | | 7,484,762 | |
| | | | | | | | | | | | | | | | |
| |
Total Common Stocks (Cost $968,626,130) | | | | 1,351,070,661 | |
| | | | | | | | | | | | | | | | |
The accompanying notes are an integral part of these financial statements.
| | | | | | |
| Portfolio of investments—January 31, 2018 (unaudited) | | Wells Fargo Disciplined U.S. Core Fund | | | 13 | |
| | | | | | | | | | | | | | | | |
| Security name | | Yield | | | | | | Shares | | | Value | |
| | | | |
Short-Term Investments: 1.09% | | | | | | | | | | | | | | | | |
| | | | |
| Investment Companies: 1.09% | | | | | | | | | | | | | | | | |
Securities Lending Cash Investment LLC (l)(r)(u) | | | 1.60 | % | | | | | | | 1,993,051 | | | $ | 1,993,250 | |
Wells Fargo Government Money Market Fund Select Class (l)(u) | | | 1.24 | | | | | | | | 12,955,100 | | | | 12,955,100 | |
| | | | |
Total Short-Term Investments (Cost $14,948,350) | | | | | | | | | | | | | | | 14,948,350 | |
| | | | | | | | | | | | | | | | |
| | | | | | | | |
| Total investments in securities (Cost $983,574,480) | | | 100.06 | % | | | 1,366,019,011 | |
Other assets and liabilities, net | | | (0.06 | ) | | | (848,599 | ) |
| | | | | | | | |
| Total net assets | | | 100.00 | % | | $ | 1,365,170,412 | |
| | | | | | | | |
| † | Non-income-earning security |
| « | All or a portion of this security is on loan. |
| (l) | The issuer of the security is an affiliated person of the Fund as defined in the Investment Company Act of 1940. |
| (r) | The investment is a non-registered investment company purchased with cash collateral received from securities on loan. |
| (u) | The rate represents the 7-day annualized yield at period end. |
Investments in Affiliates
An affiliated investment is an investment in which the Fund owns at least 5% of the outstanding voting shares of the issuer or as a result of other relationships, such as the Fund and the issuer having the same investment manager. Transactions with issuers that were either affiliated persons of the Fund at the beginning of the period or the end of the period were as follows:
| | | | | | | | | | | | | | | | | | | | | | | | | | | | | | | | | | | | |
| | | Shares,
beginning of
period | | | Shares
purchased | | | Shares
sold | | | Shares,
end of
period | | | Net
realized
gains
(losses) | | | Net
change in
unrealized
gains
(losses) | | | Income
from
affiliated
securities | | | Value,
end
of period | | | % of
net
assets | |
Short-Term Investments | | | | | | | | | | | | | | | | | | | | | | | | | | | | | | | | | | | | |
Investment Companies | | | | | | | | | | | | | | | | | | | | | | | | | | | | | | | | | | | | |
Securities Lending Cash Investment LLC | | | 13,021,998 | | | | 78,362,489 | | | | 89,391,436 | | | | 1,993,051 | | | $ | 0 | | | $ | (1,103 | ) | | $ | 13,812 | | | $ | 1,993,250 | | | | | |
Wells Fargo Government Money Market Fund Select Class | | | 5,020,581 | | | | 120,160,349 | | | | 112,225,830 | | | | 12,955,100 | | | | 0 | | | | 0 | | | | 56,375 | | | | 12,955,100 | | | | | |
| | | | | | | | | | | | | | | | | | | | | | | | | | | | | | | | | | | | |
| | | | | | | | | | | | | | | | | | $ | 0 | | | $ | (1,103 | ) | | $ | 70,187 | | | $ | 14,948,350 | | | | 1.09 | % |
| | | | | | | | | | | | | | | | | | | | | | | | | | | | | | | | | | | | |
The accompanying notes are an integral part of these financial statements.
| | | | |
| 14 | | Wells Fargo Disciplined U.S. Core Fund | | Statement of assets and liabilities—January 31, 2018 (unaudited) |
| | | | |
| | | | |
| |
Assets | | | | |
Investments in unaffiliated securities (including $1,944,273 of securities loaned), at value (cost $968,626,130) | | $ | 1,351,070,661 | |
Investments in affiliated securities, at value (cost $14,948,350) | | | 14,948,350 | |
Receivable for Fund shares sold | | | 1,615,428 | |
Receivable for dividends | | | 1,187,878 | |
Receivable for securities lending income | | | 2,129 | |
Prepaid expenses and other assets | | | 140,183 | |
| | | | |
Total assets | | | 1,368,964,629 | |
| | | | |
| |
Liabilities | | | | |
Payable upon receipt of securities loaned | | | 1,990,956 | |
Payable for Fund shares redeemed | | | 1,064,399 | |
Management fee payable | | | 385,468 | |
Administration fees payable | | | 167,986 | |
Distribution fees payable | | | 35,338 | |
Trustees’ fees and expenses payable | | | 2,045 | |
Accrued expenses and other liabilities | | | 148,025 | |
| | | | |
Total liabilities | | | 3,794,217 | |
| | | | |
Total net assets | | $ | 1,365,170,412 | |
| | | | |
| |
NET ASSETS CONSIST OF | | | | |
Paid-in capital | | $ | 954,728,846 | |
Undistributed net investment income | | | 8,104,426 | |
Accumulated net realized gains on investments | | | 19,892,609 | |
Net unrealized gains on investments | | | 382,444,531 | |
| | | | |
Total net assets | | $ | 1,365,170,412 | |
| | | | |
| |
COMPUTATION OF NET ASSET VALUE AND OFFERING PRICE PER SHARE | | | | |
Net assets – Class A | | $ | 523,588,099 | |
Shares outstanding – Class A1 | | | 29,149,473 | |
Net asset value per share – Class A | | | $17.96 | |
Maximum offering price per share – Class A2 | | | $19.06 | |
Net assets – Class C | | $ | 58,282,320 | |
Shares outstanding – Class C1 | | | 3,513,388 | |
Net asset value per share – Class C | | | $16.59 | |
Net assets – Class R | | $ | 2,593,827 | |
Shares outstanding – Class R1 | | | 142,769 | |
Net asset value per share – Class R | | | $18.17 | |
Net assets – Class R6 | | $ | 236,550,468 | |
Shares outstanding – Class R61 | | | 12,856,263 | |
Net asset value per share – Class R6 | | | $18.40 | |
Net assets – Administrator Class | | $ | 102,514,124 | |
Shares outstanding – Administrator Class1 | | | 5,561,353 | |
Net asset value per share – Administrator Class | | | $18.43 | |
Net assets – Institutional Class | | $ | 441,641,574 | |
Shares outstanding – Institutional Class1 | | | 24,246,195 | |
Net asset value per share – Institutional Class | | | $18.21 | |
| 1 | The Fund has an unlimited number of authorized shares. |
| 2 | Maximum offering price is computed as 100/94.25 of net asset value. On investments of $50,000 or more, the offering price is reduced. |
The accompanying notes are an integral part of these financial statements.
| | | | | | |
| Statement of operations—six months ended January 31, 2018 (unaudited) | | Wells Fargo Disciplined U.S. Core Fund | | | 15 | |
| | | | |
| | | | |
| |
Investment income | | | | |
Dividends (net of foreign withholding taxes of $1,731) | | $ | 12,161,472 | |
Income from affiliated securities | | | 70,187 | |
| | | | |
Total investment income | | | 12,231,659 | |
| | | | |
| |
Expenses | | | | |
Management fee | | | 2,032,277 | |
Administration fees | | | | |
Class A | | | 513,961 | |
Class C | | | 58,041 | |
Class R | | | 2,267 | |
Class R6 | | | 19,404 | |
Administrator Class | | | 63,562 | |
Institutional Class | | | 259,360 | |
Shareholder servicing fees | | | | |
Class A | | | 611,858 | |
Class C | | | 69,097 | |
Class R | | | 2,698 | |
Administrator Class | | | 122,234 | |
Distribution fees | | | | |
Class C | | | 207,290 | |
Class R | | | 2,698 | |
Custody and accounting fees | | | 19,274 | |
Professional fees | | | 26,921 | |
Registration fees | | | 70,163 | |
Shareholder report expenses | | | 33,319 | |
Trustees’ fees and expenses | | | 14,231 | |
Other fees and expenses | | | 12,327 | |
| | | | |
Total expenses | | | 4,140,982 | |
Less: Fee waivers and/or expense reimbursements | | | (61,997 | ) |
| | | | |
Net expenses | | | 4,078,985 | |
| | | | |
Net investment income | | | 8,152,674 | |
| | | | |
| |
REALIZED AND UNREALIZED GAINS (LOSSES) ON INVESTMENTS | | | | |
| |
Net realized gains on investments | | | 24,017,222 | |
| |
Net change in unrealized gains (losses) on: | | | | |
Unaffiliated securities | | | 137,046,041 | |
Affiliated securities | | | (1,103 | ) |
| | | | |
Net change in unrealized gains (losses) on investments | | | 137,044,938 | |
| | | | |
Net realized and unrealized gains (losses) on investments | | | 161,062,160 | |
| | | | |
Net increase in net assets resulting from operations | | $ | 169,214,834 | |
| | | | |
The accompanying notes are an integral part of these financial statements.
| | | | |
| 16 | | Wells Fargo Disciplined U.S. Core Fund | | Statement of changes in net assets |
| | | | | | | | | | | | | | | | |
| | | Six months ended
January 31, 2018
(unaudited) | | | Year ended July 31, 2017 | |
| | | | |
Operations | | | | | | | | | | | | | | | | |
Net investment income | | | | | | $ | 8,152,674 | | | | | | | $ | 13,483,173 | |
Net realized gains on investments | | | | | | | 24,017,222 | | | | | | | | 40,249,528 | |
Net change in unrealized gains (losses) on investments | | | | | | | 137,044,938 | | | | | | | | 73,326,880 | |
| | | | |
Net increase in net assets resulting from operations | | | | | | | 169,214,834 | | | | | | | | 127,059,581 | |
| | | | |
| | | | |
Distributions to shareholders from | | | | | | | | | | | | | | | | |
Net investment income | | | | | | | | | | | | | | | | |
Class A | | | | | | | (4,337,310 | ) | | | | | | | (4,241,326 | ) |
Class C | | | | | | | (71,920 | ) | | | | | | | (349,824 | ) |
Class R | | | | | | | (19,170 | ) | | | | | | | (11,093 | ) |
Class R6 | | | | | | | (2,941,311 | ) | | | | | | | (347,445 | ) |
Administrator Class | | | | | | | (938,093 | ) | | | | | | | (881,706 | ) |
Institutional Class | | | | | | | (5,006,239 | ) | | | | | | | (3,455,983 | ) |
Net realized gains | | | | | | | | | | | | | | | | |
Class A | | | | | | | (16,367,452 | ) | | | | | | | (5,786,410 | ) |
Class C | | | | | | | (1,975,046 | ) | | | | | | | (762,481 | ) |
Class R | | | | | | | (67,065 | ) | | | | | | | (10,965 | ) |
Class R6 | | | | | | | (7,459,553 | ) | | | | | | | (335,630 | ) |
Administrator Class | | | | | | | (3,240,553 | ) | | | | | | | (1,132,641 | ) |
Institutional Class | | | | | | | (13,501,914 | ) | | | | | | | (3,458,102 | ) |
| | | | |
Total distributions to shareholders | | | | | | | (55,925,626 | ) | | | | | | | (20,773,606 | ) |
| | | | |
| | | | |
Capital share transactions | | | Shares | | | | | | | | Shares | | | | | |
Proceeds from shares sold | | | | | | | | | | | | | | | | |
Class A | | | 1,769,940 | | | | 30,277,833 | | | | 7,395,158 | | | | 112,884,775 | |
Class C | | | 198,673 | | | | 3,141,140 | | | | 944,833 | | | | 13,103,182 | |
Class R | | | 34,859 | | | | 603,387 | | | | 123,340 | | | | 1,889,259 | |
Class R6 | | | 10,872,828 | | | | 192,608,185 | | | | 2,649,029 | | | | 41,071,466 | |
Administrator Class | | | 536,564 | | | | 9,409,663 | | | | 2,626,510 | | | | 40,190,122 | |
Institutional Class | | | 4,999,897 | | | | 85,932,565 | | | | 17,067,003 | | | | 262,837,225 | |
| | | | |
| | | | | | | 321,972,773 | | | | | | | | 471,976,029 | |
| | | | |
Reinvestment of distributions | | | | | | | | | | | | | | | | |
Class A | | | 1,131,935 | | | | 19,445,471 | | | | 632,192 | | | | 9,490,471 | |
Class C | | | 117,892 | | | | 1,860,460 | | | | 67,906 | | | | 944,467 | |
Class R | | | 4,876 | | | | 84,764 | | | | 1,447 | | | | 22,058 | |
Class R6 | | | 589,809 | | | | 10,399,263 | | | | 44,450 | | | | 683,075 | |
Administrator Class | | | 230,133 | | | | 4,058,515 | | | | 122,191 | | | | 1,880,016 | |
Institutional Class | | | 851,853 | | | | 14,861,788 | | | | 358,107 | | | | 5,452,012 | |
| | | | |
| | | | | | | 50,710,261 | | | | | | | | 18,472,099 | |
| | | | |
Payment for shares redeemed | | | | | | | | | | | | | | | | |
Class A | | | (2,435,257 | ) | | | (41,363,398 | ) | | | (7,798,736 | ) | | | (119,001,666 | ) |
Class C | | | (396,842 | ) | | | (6,208,775 | ) | | | (897,430 | ) | | | (12,701,056 | ) |
Class R | | | (18,211 | ) | | | (314,114 | ) | | | (17,137 | ) | | | (260,936 | ) |
Class R6 | | | (1,105,889 | ) | | | (19,664,453 | ) | | | (464,804 | ) | | | (7,429,067 | ) |
Administrator Class | | | (847,051 | ) | | | (14,748,233 | ) | | | (4,970,876 | ) | | | (75,703,203 | ) |
Institutional Class | | | (2,975,357 | ) | | | (51,685,029 | ) | | | (7,177,876 | ) | | | (112,590,745 | ) |
| | | | |
| | | | | | | (133,984,002 | ) | | | | | | | (327,686,673 | ) |
| | | | |
Net increase in net assets resulting from capital share transactions | | | | | | | 238,699,032 | | | | | | | | 162,761,455 | |
| | | | |
Total increase in net assets | | | | | | | 351,988,240 | | | | | | | | 269,047,430 | |
| | | | |
| | | | |
Net assets | | | | | | | | | | | | | | | | |
Beginning of period | | | | | | | 1,013,182,172 | | | | | | | | 744,134,742 | |
| | | | |
End of period | | | | | | $ | 1,365,170,412 | | | | | | | $ | 1,013,182,172 | |
| | | | |
Undistributed net investment income | | | | | | $ | 8,104,426 | | | | | | | $ | 13,265,795 | |
| | | | |
The accompanying notes are an integral part of these financial statements.
| | | | | | |
| Financial Highlights | | Wells Fargo Disciplined U.S. Core Fund | | | 17 | |
(For a share outstanding throughout each period)
| | | | | | | | | | | | | | | | | | | | | | | | |
| | | Six months ended
January 31, 2018 (unaudited) | | | Year ended July 31 | |
| CLASS A | | | 2017 | | | 2016 | | | 2015 | | | 2014 | | | 2013 | |
Net asset value, beginning of period | | | $16.30 | | | | $14.50 | | | | $15.45 | | | | $16.29 | | | | $16.27 | | | | $14.65 | |
Net investment income | | | 0.11 | | | | 0.22 | | | | 0.21 | | | | 0.21 | | | | 0.19 | | | | 0.24 | |
Net realized and unrealized gains (losses) on investments | | | 2.29 | | | | 1.94 | | | | 0.47 | | | | 1.60 | | | | 2.35 | | | | 3.25 | |
| | | | | | | | | | | | | | | | | | | | | | | | |
Total from investment operations | | | 2.40 | | | | 2.16 | | | | 0.68 | | | | 1.81 | | | | 2.54 | | | | 3.49 | |
Distributions to shareholders from | | | | | | | | | | | | | | | | | | | | | | | | |
Net investment income | | | (0.15 | ) | | | (0.15 | ) | | | (0.19 | ) | | | (0.16 | ) | | | (0.24 | ) | | | (0.24 | ) |
Net realized gains | | | (0.59 | ) | | | (0.21 | ) | | | (1.44 | ) | | | (2.49 | ) | | | (2.28 | ) | | | (1.63 | ) |
| | | | | | | | | | | | | | | | | | | | | | | | |
Total distributions to shareholders | | | (0.74 | ) | | | (0.36 | ) | | | (1.63 | ) | | | (2.65 | ) | | | (2.52 | ) | | | (1.87 | ) |
Net asset value, end of period | | | $17.96 | | | | $16.30 | | | | $14.50 | | | | $15.45 | | | | $16.29 | | | | $16.27 | |
Total return1 | | | 14.94 | % | | | 15.12 | % | | | 5.22 | % | | | 12.01 | % | | | 17.00 | % | | | 26.62 | % |
Ratios to average net assets (annualized) | | | | | | | | | | | | | | | | | | | | | | | | |
Gross expenses | | | 0.84 | % | | | 0.85 | % | | | 0.87 | % | | | 0.89 | % | | | 0.93 | % | | | 0.94 | % |
Net expenses | | | 0.84 | % | | | 0.85 | % | | | 0.87 | % | | | 0.89 | % | | | 0.92 | % | | | 0.92 | % |
Net investment income | | | 1.26 | % | | | 1.45 | % | | | 1.60 | % | | | 1.43 | % | | | 1.27 | % | | | 1.66 | % |
Supplemental data | | | | | | | | | | | | | | | | | | | | | | | | |
Portfolio turnover rate | | | 31 | % | | | 60 | % | | | 52 | % | | | 53 | % | | | 71 | % | | | 64 | % |
Net assets, end of period (000s omitted) | | | $523,588 | | | | $467,491 | | | | $412,629 | | | | $331,123 | | | | $305,577 | | | | $285,780 | |
| 1 | Total return calculations do not include any sales charges. Returns for periods of less than one year are not annualized. |
The accompanying notes are an integral part of these financial statements.
| | | | |
| 18 | | Wells Fargo Disciplined U.S. Core Fund | | Financial highlights |
(For a share outstanding throughout each period)
| | | | | | | | | | | | | | | | | | | | | | | | |
| | | Six months ended
January 31, 2018 (unaudited) | | | Year ended July 31 | |
| CLASS C | | | 2017 | | | 2016 | | | 2015 | | | 2014 | | | 2013 | |
Net asset value, beginning of period | | | $15.04 | | | | $13.45 | | | | $14.50 | | | | $15.47 | | | | $15.58 | | | | $14.10 | |
Net investment income | | | 0.04 | | | | 0.10 | | | | 0.14 | | | | 0.13 | | | | 0.08 | | | | 0.12 | |
Net realized and unrealized gains (losses) on investments | | | 2.12 | | | | 1.79 | | | | 0.38 | | | | 1.48 | | | | 2.23 | | | | 3.12 | |
| | | | | | | | | | | | | | | | | | | | | | | | |
Total from investment operations | | | 2.16 | | | | 1.89 | | | | 0.52 | | | | 1.61 | | | | 2.31 | | | | 3.24 | |
Distributions to shareholders from | | | | | | | | | | | | | | | | | | | | | | | | |
Net investment income | | | (0.02 | ) | | | (0.09 | ) | | | (0.13 | ) | | | (0.09 | ) | | | (0.14 | ) | | | (0.13 | ) |
Net realized gains | | | (0.59 | ) | | | (0.21 | ) | | | (1.44 | ) | | | (2.49 | ) | | | (2.28 | ) | | | (1.63 | ) |
| | | | | | | | | | | | | | | | | | | | | | | | |
Total distributions to shareholders | | | (0.61 | ) | | | (0.30 | ) | | | (1.57 | ) | | | (2.58 | ) | | | (2.42 | ) | | | (1.76 | ) |
Net asset value, end of period | | | $16.59 | | | | $15.04 | | | | $13.45 | | | | $14.50 | | | | $15.47 | | | | $15.58 | |
Total return1 | | | 14.55 | % | | | 14.27 | % | | | 4.43 | % | | | 11.18 | % | | | 16.10 | % | | | 25.65 | % |
Ratios to average net assets (annualized) | | | | | | | | | | | | | | | | | | | | | | | | |
Gross expenses | | | 1.59 | % | | | 1.60 | % | | | 1.62 | % | | | 1.64 | % | | | 1.68 | % | | | 1.69 | % |
Net expenses | | | 1.59 | % | | | 1.60 | % | | | 1.62 | % | | | 1.64 | % | | | 1.67 | % | | | 1.67 | % |
Net investment income | | | 0.52 | % | | | 0.69 | % | | | 0.82 | % | | | 0.66 | % | | | 0.51 | % | | | 0.92 | % |
Supplemental data | | | | | | | | | | | | | | | | | | | | | | | | |
Portfolio turnover rate | | | 31 | % | | | 60 | % | | | 52 | % | | | 53 | % | | | 71 | % | | | 64 | % |
Net assets, end of period (000s omitted) | | | $58,282 | | | | $54,054 | | | | $46,801 | | | | $20,680 | | | | $10,913 | | | | $9,544 | |
| 1 | Total return calculations do not include any sales charges. Returns for periods of less than one year are not annualized. |
The accompanying notes are an integral part of these financial statements.
| | | | | | |
| Financial highlights | | Wells Fargo Disciplined U.S. Core Fund | | | 19 | |
(For a share outstanding throughout each period)
| | | | | | | | | | | | |
| | | Six months ended
January 31, 2018 (unaudited) | | | Year ended July 31 | |
| CLASS R | | | 2017 | | | 20161 | |
Net asset value, beginning of period | | | $16.51 | | | | $14.77 | | | | $14.62 | |
Net investment income | | | 0.10 | | | | 0.17 | 2 | | | 0.13 | 2 |
Net realized and unrealized gains (losses) on investments | | | 2.31 | | | | 1.99 | | | | 1.72 | |
| | | | | | | | | | | | |
Total from investment operations | | | 2.41 | | | | 2.16 | | | | 1.85 | |
Distributions to shareholders from | | | | | | | | | | | | |
Net investment income | | | (0.16 | ) | | | (0.21 | ) | | | (0.26 | ) |
Net realized gains | | | (0.59 | ) | | | (0.21 | ) | | | (1.44 | ) |
| | | | | | | | | | | | |
Total distributions to shareholders | | | (0.75 | ) | | | (0.42 | ) | | | (1.70 | ) |
Net asset value, end of period | | | $18.17 | | | | $16.51 | | | | $14.77 | |
Total return3 | | | 14.81 | % | | | 14.86 | % | | | 13.56 | % |
Ratios to average net assets (annualized) | | | | | | | | | | | | |
Gross expenses | | | 1.09 | % | | | 1.10 | % | | | 1.12 | % |
Net expenses | | | 1.09 | % | | | 1.10 | % | | | 1.12 | % |
Net investment income | | | 1.12 | % | | | 1.10 | % | | | 1.12 | % |
Supplemental data | | | | | | | | | | | | |
Portfolio turnover rate | | | 31 | % | | | 60 | % | | | 52 | % |
Net assets, end of period (000s omitted) | | | $2,594 | | | | $2,001 | | | | $201 | |
| 1 | For the period from September 30, 2015 (commencement of class operations) to July 31, 2016 |
| 2 | Calculated based upon average shares outstanding |
| 3 | Returns for periods of less than one year are not annualized. |
The accompanying notes are an integral part of these financial statements.
| | | | |
| 20 | | Wells Fargo Disciplined U.S. Core Fund | | Financial highlights |
(For a share outstanding throughout each period)
| | | | | | | | | | | | |
| | | Six months ended
January 31, 2018 (unaudited) | | | Year ended July 31 | |
| CLASS R6 | | | 2017 | | | 20161 | |
Net asset value, beginning of period | | | $16.71 | | | | $14.86 | | | | $14.62 | |
Net investment income | | | 0.15 | 2 | | | 0.28 | 2 | | | 0.22 | 2 |
Net realized and unrealized gains (losses) on investments | | | 2.35 | | | | 1.99 | | | | 1.72 | |
| | | | | | | | | | | | |
Total from investment operations | | | 2.50 | | | | 2.27 | | | | 1.94 | |
Distributions to shareholders from | | | | | | | | | | | | |
Net investment income | | | (0.22 | ) | | | (0.21 | ) | | | (0.26 | ) |
Net realized gains | | | (0.59 | ) | | | (0.21 | ) | | | (1.44 | ) |
| | | | | | | | | | | | |
Total distributions to shareholders | | | (0.81 | ) | | | (0.42 | ) | | | (1.70 | ) |
Net asset value, end of period | | | $18.40 | | | | $16.71 | | | | $14.86 | |
Total return3 | | | 15.22 | % | | | 15.56 | % | | | 14.24 | % |
Ratios to average net assets (annualized) | | | | | | | | | | | | |
Gross expenses | | | 0.40 | % | | | 0.42 | % | | | 0.44 | % |
Net expenses | | | 0.40 | % | | | 0.42 | % | | | 0.43 | % |
Net investment income | | | 1.62 | % | | | 1.77 | % | | | 1.88 | % |
Supplemental data | | | | | | | | | | | | |
Portfolio turnover rate | | | 31 | % | | | 60 | % | | | 52 | % |
Net assets, end of period (000s omitted) | | | $236,550 | | | | $41,770 | | | | $4,024 | |
| 1 | For the period from September 30, 2015 (commencement of class operations) to July 31, 2016 |
| 2 | Calculated based upon average shares outstanding |
| 3 | Returns for periods of less than one year are not annualized. |
The accompanying notes are an integral part of these financial statements.
| | | | | | |
| Financial highlights | | Wells Fargo Disciplined U.S. Core Fund | | | 21 | |
(For a share outstanding throughout each period)
| | | | | | | | | | | | | | | | | | | | | | | | |
| | | Six months ended January 31, 2018 (unaudited) | | | Year ended July 31 | |
| ADMINISTRATOR CLASS | | | 2017 | | | 2016 | | | 2015 | | | 2014 | | | 2013 | |
Net asset value, beginning of period | | | $16.71 | | | | $14.85 | | | | $15.80 | | | | $16.60 | | | | $16.47 | | | | $14.79 | |
Net investment income | | | 0.13 | | | | 0.25 | 1 | | | 0.24 | 1 | | | 0.25 | 1 | | | 0.25 | 1 | | | 0.28 | 1 |
Net realized and unrealized gains (losses) on investments | | | 2.35 | | | | 1.98 | | | | 0.48 | | | | 1.63 | | | | 2.35 | | | | 3.27 | |
| | | | | | | | | | | | | | | | | | | | | | | | |
Total from investment operations | | | 2.48 | | | | 2.23 | | | | 0.72 | | | | 1.88 | | | | 2.60 | | | | 3.55 | |
Distributions to shareholders from | | | | | | | | | | | | | | | | | | | | | | | | |
Net investment income | | | (0.17 | ) | | | (0.16 | ) | | | (0.23 | ) | | | (0.19 | ) | | | (0.19 | ) | | | (0.24 | ) |
Net realized gains | | | (0.59 | ) | | | (0.21 | ) | | | (1.44 | ) | | | (2.49 | ) | | | (2.28 | ) | | | (1.63 | ) |
| | | | | | | | | | | | | | | | | | | | | | | | |
Total distributions to shareholders | | | (0.76 | ) | | | (0.37 | ) | | | (1.67 | ) | | | (2.68 | ) | | | (2.47 | ) | | | (1.87 | ) |
Net asset value, end of period | | | $18.43 | | | | $16.71 | | | | $14.85 | | | | $15.80 | | | | $16.60 | | | | $16.47 | |
Total return2 | | | 15.02 | % | | | 15.24 | % | | | 5.36 | % | | | 12.20 | % | | | 17.12 | % | | | 26.82 | % |
Ratios to average net assets (annualized) | | | | | | | | | | | | | | | | | | | | | | | | |
Gross expenses | | | 0.76 | % | | | 0.77 | % | | | 0.78 | % | | | 0.74 | % | | | 0.76 | % | | | 0.78 | % |
Net expenses | | | 0.74 | % | | | 0.74 | % | | | 0.74 | % | | | 0.73 | % | | | 0.74 | % | | | 0.74 | % |
Net investment income | | | 1.36 | % | | | 1.60 | % | | | 1.71 | % | | | 1.58 | % | | | 1.56 | % | | | 1.87 | % |
Supplemental data | | | | | | | | | | | | | | | | | | | | | | | | |
Portfolio turnover rate | | | 31 | % | | | 60 | % | | | 52 | % | | | 53 | % | | | 71 | % | | | 64 | % |
Net assets, end of period (000s omitted) | | | $102,514 | | | | $94,294 | | | | $116,807 | | | | $63,544 | | | | $50,498 | | | | $127,384 | |
| 1 | Calculated based upon average shares outstanding |
| 2 | Returns for periods of less than one year are not annualized. |
The accompanying notes are an integral part of these financial statements.
| | | | |
| 22 | | Wells Fargo Disciplined U.S. Core Fund | | Financial highlights |
(For a share outstanding throughout each period)
| | | | | | | | | | | | | | | | | | | | | | | | |
| | | Six months ended January 31, 2018 (unaudited) | | | Year ended July 31 | |
| INSTITUTIONAL CLASS | | | 2017 | | | 2016 | | | 2015 | | | 2014 | | | 2013 | |
Net asset value, beginning of period | | | $16.55 | | | | $14.72 | | | | $15.66 | | | | $16.47 | | | | $16.43 | | | | $14.78 | |
Net investment income | | | 0.14 | 1 | | | 0.27 | 1 | | | 0.28 | 1 | | | 0.30 | | | | 0.26 | 1 | | | 0.35 | |
Net realized and unrealized gains (losses) on investments | | | 2.32 | | | | 1.98 | | | | 0.47 | | | | 1.61 | | | | 2.37 | | | | 3.23 | |
| | | | | | | | | | | | | | | | | | | | | | | | |
Total from investment operations | | | 2.46 | | | | 2.25 | | | | 0.75 | | | | 1.91 | | | | 2.63 | | | | 3.58 | |
Distributions to shareholders from | | | | | | | | | | | | | | | | | | | | | | | | |
Net investment income | | | (0.21 | ) | | | (0.21 | ) | | | (0.25 | ) | | | (0.23 | ) | | | (0.31 | ) | | | (0.30 | ) |
Net realized gains | | | (0.59 | ) | | | (0.21 | ) | | | (1.44 | ) | | | (2.49 | ) | | | (2.28 | ) | | | (1.63 | ) |
| | | | | | | | | | | | | | | | | | | | | | | | |
Total distributions to shareholders | | | (0.80 | ) | | | (0.42 | ) | | | (1.69 | ) | | | (2.72 | ) | | | (2.59 | ) | | | (1.93 | ) |
Net asset value, end of period | | | $18.21 | | | | $16.55 | | | | $14.72 | | | | $15.66 | | | | $16.47 | | | | $16.43 | |
Total return2 | | | 15.11 | % | | | 15.51 | % | | | 5.64 | % | | | 12.55 | % | | | 17.48 | % | | | 27.16 | % |
Ratios to average net assets (annualized) | | | | | | | | | | | | | | | | | | | | | | | | |
Gross expenses | | | 0.51 | % | | | 0.52 | % | | | 0.54 | % | | | 0.47 | % | | | 0.50 | % | | | 0.51 | % |
Net expenses | | | 0.48 | % | | | 0.48 | % | | | 0.48 | % | | | 0.47 | % | | | 0.48 | % | | | 0.48 | % |
Net investment income | | | 1.60 | % | | | 1.76 | % | | | 1.96 | % | | | 1.86 | % | | | 1.63 | % | | | 2.08 | % |
Supplemental data | | | | | | | | | | | | | | | | | | | | | | | | |
Portfolio turnover rate | | | 31 | % | | | 60 | % | | | 52 | % | | | 53 | % | | | 71 | % | | | 64 | % |
Net assets, end of period (000s omitted) | | | $441,642 | | | | $353,573 | | | | $163,674 | | | | $109,901 | | | | $91,144 | | | | $1,875 | |
| 1 | Calculated based upon average shares outstanding |
| 2 | Returns for periods of less than one year are not annualized. |
The accompanying notes are an integral part of these financial statements.
| | | | | | |
| Notes to financial statements (unaudited) | | Wells Fargo Disciplined U.S. Core Fund | | | 23 | |
1. ORGANIZATION
Wells Fargo Funds Trust (the “Trust”), a Delaware statutory trust organized on March 10, 1999, is an open-end management investment company registered under the Investment Company Act of 1940, as amended (the “1940 Act”). As an investment company, the Trust follows the accounting and reporting guidance in Financial Accounting Standards Board Accounting Standards Codification Topic 946, Financial Services – Investment Companies. These financial statements report on the Wells Fargo Disciplined U.S. Core Fund (the “Fund”) which is a diversified series of the Trust.
2. SIGNIFICANT ACCOUNTING POLICIES
The following significant accounting policies, which are consistently followed in the preparation of the financial statements of the Fund, are in conformity with U.S. generally accepted accounting principles which require management to make estimates and assumptions that affect the reported amounts of assets and liabilities, disclosure of contingent assets and liabilities at the date of the financial statements, and the reported amounts of revenues and expenses during the reporting period. Actual results could differ from those estimates.
Securities valuation
All investments are valued each business day as of the close of regular trading on the New York Stock Exchange (generally 4 p.m. Eastern Time), although the Fund may deviate from this calculation time under unusual or unexpected circumstances.
Equity securities that are listed on a foreign or domestic exchange or market are valued at the official closing price or, if none, the last sales price. If no sale occurs on the principal exchange or market that day, a fair value price will be determined in accordance with the Fund’s Valuation Procedures.
Investments in registered open-end investment companies are valued at net asset value. Interests in non-registered investment vehicles that are redeemable at net asset value are fair valued normally at net asset value.
Investments which are not valued using any of the methods discussed above are valued at their fair value, as determined in good faith by the Board of Trustees of the Fund. The Board of Trustees has established a Valuation Committee comprised of the Trustees and has delegated to it the authority to take any actions regarding the valuation of portfolio securities that the Valuation Committee deems necessary or appropriate, including determining the fair value of portfolio securities, unless the determination has been delegated to the Wells Fargo Asset Management Pricing Committee of Wells Fargo Funds Management, LLC (“Funds Management”). The Board of Trustees retains the authority to make or ratify any valuation decisions or approve any changes to the Valuation Procedures as it deems appropriate. On a quarterly basis, the Board of Trustees receives reports on any valuation actions taken by the Valuation Committee or the Wells Fargo Asset Management Pricing Committee which may include items for ratification.
Valuations of fair valued securities are compared to the next actual sales price when available, or other appropriate market values, to assess the continued appropriateness of the fair valuation methodologies used. These securities are fair valued on a day-to-day basis, taking into consideration changes to appropriate market information and any significant changes to the inputs considered in the valuation process until there is a readily available price provided on an exchange or by an independent pricing service. Valuations received from an independent pricing service or independent broker-dealer quotes are periodically validated by comparisons to most recent trades and valuations provided by other independent pricing services in addition to the review of prices by the manager and/or subadviser. Unobservable inputs used in determining fair valuations are identified based on the type of security, taking into consideration factors utilized by market participants in valuing the investment, knowledge about the issuer and the current market environment.
Security loans
The Fund may lend its securities from time to time in order to earn additional income in the form of fees or interest on securities received as collateral or the investment of any cash received as collateral. The Fund continues to receive interest or dividends on the securities loaned. The Fund receives collateral in the form of cash or securities with a value at least equal to the value of the securities on loan. The value of the loaned securities is determined at the close of each business day and any additional required collateral is delivered to the Fund on the next business day. In a securities lending transaction, the net asset value of the Fund will be affected by an increase or decrease in the value of the securities loaned and by an increase or decrease in the value of the instrument in which collateral is invested. The amount of securities lending activity undertaken by the Fund fluctuates from time to time. In the event of default or bankruptcy by the borrower, the Fund may be prevented from recovering the loaned securities or gaining access to the collateral or may experience delays or costs in doing so. In addition, the investment of any cash collateral received may lose all or part of its value. The Fund has the right under the lending agreement to recover the securities from the borrower on demand.
| | | | |
| 24 | | Wells Fargo Disciplined U.S. Core Fund | | Notes to financial statements (unaudited) |
The Fund lends its securities through an unaffiliated securities lending agent. Cash collateral received in connection with its securities lending transactions is invested in Securities Lending Cash Investments, LLC (the “Securities Lending Fund”). The Securities Lending Fund is exempt from registration under Section 3(c)(7) of the 1940 Act and is managed by Funds Management and is subadvised by Wells Capital Management Incorporated (“WellsCap”), an affiliate of Funds Management and an indirect wholly owned subsidiary of Wells Fargo & Company (“Wells Fargo”). Funds Management receives an advisory fee starting at 0.05% and declining to 0.01% as the average daily net assets of the Securities Lending Fund increase. All of the fees received by Funds Management are paid to WellsCap for its services as subadviser. The Securities Lending Fund seeks to provide a positive return compared to the daily Fed Funds Open Rate by investing in high-quality, U.S. dollar-denominated short-term money market instruments. Securities Lending Fund investments are valued at the evaluated bid price provided by an independent pricing service. Income earned from investment in the Securities Lending Fund is included in income from affiliated securities on the Statement of Operations.
Security transactions and income recognition
Securities transactions are recorded on a trade date basis. Realized gains or losses are recorded on the basis of identified cost.
Dividend income is recognized on the ex-dividend date. Dividend income is recorded net of foreign taxes withheld where recovery of such taxes is not assured.
Distributions to shareholders
Distributions to shareholders from net investment income and net realized gains, if any, are recorded on the ex-dividend date. Such distributions are determined in accordance with income tax regulations and may differ from U.S. generally accepted accounting principles. Dividend sources are estimated at the time of declaration. The tax character of distributions is determined as of the Fund’s fiscal year end. Therefore, a portion of the Fund’s distributions made prior the Fund’s fiscal year end may be categorized as a tax return of capital.
Federal and other taxes
The Fund intends to continue to qualify as a regulated investment company by distributing substantially all of its investment company taxable income and any net realized capital gains (after reduction for capital loss carryforwards) sufficient to relieve it from all, or substantially all, federal income taxes. Accordingly, no provision for federal income taxes was required.
The Fund’s income and federal excise tax returns and all financial records supporting those returns for the prior three fiscal years are subject to examination by the federal and Delaware revenue authorities. Management has analyzed the Fund’s tax positions taken on federal, state, and foreign tax returns for all open tax years and does not believe that there are any uncertain tax positions that require recognition of a tax liability.
As of January 31, 2018, the aggregate cost of all investments for federal income tax purposes was $983,524,158 and the unrealized gains (losses) consisted of:
| | | | |
Gross unrealized gains | | $ | 391,460,314 | |
Gross unrealized losses | | | (8,965,461 | ) |
Net unrealized gains | | $ | 382,494,853 | |
Class allocations
The separate classes of shares offered by the Fund differ principally in applicable sales charges, distribution, shareholder servicing, and administration fees. Class specific expenses are charged directly to that share class. Investment income, common expenses, and realized and unrealized gains (losses) on investments are allocated daily to each class of shares based on the relative proportion of net assets of each class.
3. FAIR VALUATION MEASUREMENTS
Fair value measurements of investments are determined within a framework that has established a fair value hierarchy based upon the various data inputs utilized in determining the value of the Fund’s investments. The three-level hierarchy gives the highest priority to unadjusted quoted prices in active markets for identical assets or liabilities (Level 1) and the lowest priority to unobservable inputs (Level 3). The Fund’s investments are classified within the fair value hierarchy based on the lowest level of input that is significant to the fair value measurement. The inputs are summarized into three broad levels as follows:
| | | | | | |
| Notes to financial statements (unaudited) | | Wells Fargo Disciplined U.S. Core Fund | | | 25 | |
| ∎ | | Level 1 – quoted prices in active markets for identical securities |
| ∎ | | Level 2 – other significant observable inputs (including quoted prices for similar securities, interest rates, prepayment speeds, credit risk, etc.) |
| ∎ | | Level 3 – significant unobservable inputs (including the Fund’s own assumptions in determining the fair value of investments) |
The inputs or methodologies used for valuing investments in securities are not necessarily an indication of the risk associated with investing in those securities.
The following is a summary of the inputs used in valuing the Fund’s assets and liabilities as of January 31, 2018:
| | | | | | | | | | | | | | | | |
| | | Quoted prices
(Level 1) | | | Other significant
observable inputs
(Level 2) | | | Significant
unobservable inputs
(Level 3) | | | Total | |
Assets | | | | | | | | | | | | | | | | |
Investments in: | | | | | | | | | | | | | | | | |
| | | | |
Common stocks | | | | | | | | | | | | | | | | |
Consumer discretionary | | $ | 156,091,384 | | | $ | 0 | | | $ | 0 | | | $ | 156,091,384 | |
Consumer staples | | | 97,117,170 | | | | 0 | | | | 0 | | | | 97,117,170 | |
Energy | | | 90,178,273 | | | | 0 | | | | 0 | | | | 90,178,273 | |
Financials | | | 194,051,715 | | | | 0 | | | | 0 | | | | 194,051,715 | |
Health care | | | 201,331,061 | | | | 0 | | | | 0 | | | | 201,331,061 | |
Industrials | | | 133,368,150 | | | | 0 | | | | 0 | | | | 133,368,150 | |
Information technology | | | 324,391,732 | | | | 0 | | | | 0 | | | | 324,391,732 | |
Materials | | | 51,431,132 | | | | 0 | | | | 0 | | | | 51,431,132 | |
Real estate | | | 49,474,045 | | | | 0 | | | | 0 | | | | 49,474,045 | |
Telecommunications | | | 22,295,893 | | | | 0 | | | | 0 | | | | 22,295,893 | |
Utilities | | | 31,340,106 | | | | 0 | | | | 0 | | | | 31,340,106 | |
| | | | |
Short-term investments | | | | | | | | | | | | | | | | |
Investment companies | | | 12,955,100 | | | | 0 | | | | 0 | | | | 12,955,100 | |
Investments measured at net asset value* | | | | | | | | | | | | | | | 1,993,250 | |
Total assets | | $ | 1,364,025,761 | | | $ | 0 | | | $ | 0 | | | $ | 1,366,019,011 | |
| * | Investments that are measured at fair value using the net asset value per share (or its equivalent) as a practical expedient have not been categorized in the fair value hierarchy. The fair value amount presented in the table is intended to permit reconciliation of the fair value hierarchy to the amounts presented in the Statement of Assets and Liabilities. The Fund’s investment in Securities Lending Cash Investments, LLC valued at $1,993,250 does not have a redemption period notice, can be redeemed daily and does not have any unfunded commitments. |
The Fund recognizes transfers between levels within the fair value hierarchy at the end of the reporting period. At January 31, 2018, the Fund did not have any transfers into/out of Level 1, Level 2, or Level 3.
4. TRANSACTIONS WITH AFFILIATES
Management fee
Funds Management, an indirect wholly owned subsidiary of Wells Fargo, is the manager of the Fund and provides advisory and fund-level administrative services under an investment management agreement. Under the investment management agreement, Funds Management is responsible for, among other services, implementing the investment objectives and strategies of the Fund, supervising the subadviser, providing fund-level administrative services in connection with the Fund’s operations, and providing any other fund-level administrative services reasonably necessary for the operation of the Fund. As compensation for its services under the investment management agreement, Funds Management is entitled to receive an annual management fee starting at 0.35% and declining to 0.28% as the average daily net assets of the Fund increase. For the six months ended January 31, 2018, the management fee was equivalent to an annual rate of 0.35% of the Fund’s average daily net assets.
Funds Management has retained the services of a subadviser to provide daily portfolio management to the Fund. The fee for subadvisory services is borne by Funds Management. Golden Capital Management, LLC, an affiliate of Funds Management and an indirect wholly owned subsidiary of Wells Fargo, was the subadviser to the Fund and was entitled to
| | | | |
| 26 | | Wells Fargo Disciplined U.S. Core Fund | | Notes to financial statements (unaudited) |
receive a fee from Funds Management at an annual rate which started at 0.25% and declined to 0.15% as the average daily net assets of the Fund increased. In connection with the completion of the merger of Golden Capital Management LLC into WellsCap on January 1, 2018, WellsCap became the subadvisor to the Fund. The merger did not result in any change to the services provided to the Fund or to its strategies or fees and expenses. WellsCap receives an annual subadvisory fee from Funds Management at an annual rate starting at 0.25% and declining to 0.15% as the average daily net assets of the Fund increase.
Administration fees
Under a class-level administration agreement, Funds Management provides class-level administrative services to the Fund, which includes paying fees and expenses for services provided by the transfer agent, sub-transfer agents, omnibus account servicers and record-keepers. As compensation for its services under the class-level administration agreement, Funds Management receives an annual fee which is calculated based on the average daily net assets of each class as follows:
| | | | |
| | | Class-level
administration fee | |
Class A, Class C, Class R | | | 0.21 | % |
Class R6 | | | 0.03 | |
Administrator Class, Institutional Class | | | 0.13 | |
Funds Management has contractually waived and/or reimbursed management and administration fees to the extent necessary to maintain certain net operating expense ratios for the Fund. Waiver of fees and/or reimbursement of expenses by Funds Management were made first from fund level expenses on a proportionate basis and then from class specific expenses. Funds Management has committed through November 30, 2018 to waive fees and/or reimburse expenses to the extent necessary to cap the Fund’s expenses at 0.87% for Class A shares, 1.62% for Class C shares, 1.12% for Class R shares, 0.43% for Class R6 shares, 0.74% for Administrator Class shares, and 0.48% for Institutional Class shares. After this time, the cap may be increased or the commitment to maintain the cap may be terminated only with the approval of the Board of Trustees.
Distribution fees
The Trust has adopted a distribution plan for Class C and Class R shares of the Fund pursuant to Rule 12b-1 under the 1940 Act. Distribution fees are charged to Class C and Class R shares and paid to Wells Fargo Funds Distributor, LLC (“Funds Distributor”), the principal underwriter, at an annual rate of 0.75% of the average daily net assets of Class C shares and 0.25% of the average daily net assets of Class R shares.
In addition, Funds Distributor is entitled to receive the front-end sales charge from the purchase of Class A shares and a contingent deferred sales charge on the redemption of certain Class A shares. Funds Distributor is also entitled to receive the contingent deferred sales charges from redemptions of Class C shares. For the six months ended January 31, 2018, Funds Distributor received $15,056 from the sale of Class A shares and $227 in contingent deferred sales charges from redemptions of Class C shares. No contingent deferred sales charges were incurred by Class A shares for the six months ended January 31, 2018.
Shareholder servicing fees
The Trust has entered into contracts with one or more shareholder servicing agents, whereby Class A, Class C, Class R, and Administrator Class of the Fund are charged a fee at an annual rate of 0.25% of the average daily net assets of each respective class. A portion of these total shareholder servicing fees were paid to affiliates of Wells Fargo.
A portion of these total shareholder servicing fees were paid to affiliates of Wells Fargo.
Interfund transactions
The Fund may purchase or sell portfolio investment securities to certain other Wells Fargo affiliates pursuant to Rule 17a-7 under the 1940 Act and under procedures adopted by the Board of Trustees. The procedures have been designed to ensure that these interfund transactions, which do not incur broker commissions, are effected at current market prices.
5. INVESTMENT PORTFOLIO TRANSACTIONS
Purchases and sales of investments, excluding U.S. government obligations (if any) and short-term securities, for the six months ended January 31, 2018 were $546,174,673 and $352,628,269, respectively.
| | | | | | |
| Notes to financial statements (unaudited) | | Wells Fargo Disciplined U.S. Core Fund | | | 27 | |
6. BANK BORROWINGS
The Trust (excluding the money market funds and certain other funds) and Wells Fargo Variable Trust are parties to a $280,000,000 revolving credit agreement whereby the Fund is permitted to use bank borrowings for temporary or emergency purposes, such as to fund shareholder redemption requests. Interest under the credit agreement is charged to the Fund based on a borrowing rate equal to the higher of the Federal Funds rate in effect on that day plus 1.25% or the overnight LIBOR rate in effect on that day plus 1.25%. In addition, an annual commitment fee equal to 0.25% of the unused balance is allocated to each participating fund. Prior to August 29, 2017, the revolving credit agreement amount was $250,000,000.
For the six months ended January 31, 2018, there were no borrowings by the Fund under the agreement.
7. INDEMNIFICATION
Under the Trust’s organizational documents, the officers and Trustees have been granted certain indemnification rights against certain liabilities that may arise out of performance of their duties to the Trust. Additionally, in the normal course of business, the Trust may enter into contracts with service providers that contain a variety of indemnification clauses. The Trust’s maximum exposure under these arrangements is dependent on future claims that may be made against the Fund and, therefore, cannot be estimated.
| | | | |
| 28 | | Wells Fargo Disciplined U.S. Core Fund | | Other information (unaudited) |
PROXY VOTING INFORMATION
A description of the policies and procedures that the Fund uses to determine how to vote proxies relating to portfolio securities is available, upon request, by calling 1-800-222-8222, visiting our website at wellsfargofunds.com, or visiting the SEC website at sec.gov. Information regarding how the Fund voted proxies relating to portfolio securities during the most recent 12-month period ended June 30 is available on the Fund’s website at wellsfargofunds.com or by visiting the SEC website at sec.gov.
PORTFOLIO HOLDINGS INFORMATION
The complete portfolio holdings for the Fund are publicly available monthly on the Fund’s website (wellsfargofunds.com), on a one-month delayed basis. In addition, top ten holdings information (excluding derivative positions) for the Fund is publicly available on the Fund’s website on a monthly, seven-day or more delayed basis. The Fund files its complete schedule of portfolio holdings with the SEC for the first and third quarters of each fiscal year on Form N-Q, which is available by visiting the SEC website at sec.gov. In addition, the Fund’s Form N-Q may be reviewed and copied at the SEC’s Public Reference Room in Washington, DC, and at regional offices in New York City, at 233 Broadway, and in Chicago, at 175 West Jackson Boulevard, Suite 900. Information about the Public Reference Room may be obtained by calling 1-800-SEC-0330.
| | | | | | |
| Other information (unaudited) | | Wells Fargo Disciplined U.S. Core Fund | | | 29 | |
BOARD OF TRUSTEES AND OFFICERS
Each of the Trustees and Officers1 listed in the table below acts in identical capacities for each fund in the Wells Fargo family of funds, which consists of 153 mutual funds comprising the Wells Fargo Funds Trust, Wells Fargo Variable Trust, Wells Fargo Master Trust and four closed-end funds (collectively the “Fund Complex”). This table should be read in conjunction with the Prospectus and the Statement of Additional Information2. The mailing address of each Trustee and Officer is 525 Market Street, 12th Floor, San Francisco, CA 94105. Each Trustee and Officer serves an indefinite term, however, each Trustee serves such term until reaching the mandatory retirement age established by the Trustees.
Independent Trustees
| | | | | | |
Name and year of birth | | Position held and length of service* | | Principal occupations during past five years or longer | | Current other public company or investment company directorships |
William R. Ebsworth (Born 1957) | | Trustee, since 2015 | | Retired. From 1984 to 2013, equities analyst, portfolio manager, research director and chief investment officer at Fidelity Management and Research Company in Boston, Tokyo, and Hong Kong, and retired in 2013 as Chief Investment Officer of Fidelity Strategic Advisers, Inc. where he led a team of investment professionals managing client assets. Prior thereto, Board member of Hong Kong Securities Clearing Co., Hong Kong Options Clearing Corp., the Thailand International Fund, Ltd., Fidelity Investments Life Insurance Company, and Empire Fidelity Investments Life Insurance Company. Board member of the Forté Foundation (non-profit organization) and the Vincent Memorial Hospital Endowment (non-profit organization), where he serves on the Investment Committee and as a Chair of the Audit Committee. Mr. Ebsworth is a CFA® charterholder. | | Asset Allocation Trust |
Jane A. Freeman** (Born 1953) | | Trustee, since 2015; Chair Liaison, since 2018 | | Retired. From 2012 to 2014 and 1999 to 2008, Chief Financial Officer of Scientific Learning Corporation. From 2008 to 2012, Ms. Freeman provided consulting services related to strategic business projects. Prior to 1999, Portfolio Manager at Rockefeller & Co. and Scudder, Stevens & Clark. Board member of the Harding Loevner Funds from 1996 to 2014, serving as both Lead Independent Director and chair of the Audit Committee. Board member of the Russell Exchange Traded Funds Trust from 2011 to 2012 and the chair of the Audit Committee. Ms. Freeman is a Board Member of Ruth Bancroft Garden (non-profit organization) and the Glimmerglass Festival. She is also an inactive Chartered Financial Analyst. | | Asset Allocation Trust |
Isaiah Harris, Jr. (Born 1952) | | Trustee, since 2009 | | Retired. Chairman of the Board of CIGNA Corporation since 2009, and Director since 2005. From 2003 to 2011, Director of Deluxe Corporation. Prior thereto, President and CEO of BellSouth Advertising and Publishing Corp. from 2005 to 2007, President and CEO of BellSouth Enterprises from 2004 to 2005 and President of BellSouth Consumer Services from 2000 to 2003. Emeritus member of the Iowa State University Foundation Board of Governors. Emeritus Member of the Advisory Board of Iowa State University School of Business. Advisory Board Member, Palm Harbor Academy (charter school). Advisory Board Member, Child Evangelism Fellowship (non-profit). Mr. Harris is a certified public accountant (inactive status). | | CIGNA Corporation; Asset Allocation Trust |
Judith M. Johnson (Born 1949) | | Trustee, since 2008; Audit Committee Chairman, since 2008 | | Retired. Prior thereto, Chief Executive Officer and Chief Investment Officer of Minneapolis Employees Retirement Fund from 1996 to 2008. Ms. Johnson is an attorney, certified public accountant and a certified managerial accountant. | | Asset Allocation Trust |
David F. Larcker (Born 1950) | | Trustee, since 2009 | | James Irvin Miller Professor of Accounting at the Graduate School of Business, Stanford University, Director of the Corporate Governance Research Initiative and Senior Faculty of The Rock Center for Corporate Governance since 2006. From 2005 to 2008, Professor of Accounting at the Graduate School of Business, Stanford University. Prior thereto, Ernst & Young Professor of Accounting at The Wharton School, University of Pennsylvania from 1985 to 2005. | | Asset Allocation Trust |
| | | | |
| 30 | | Wells Fargo Disciplined U.S. Core Fund | | Other information (unaudited) |
| | | | | | |
Name and year of birth | | Position held and length of service* | | Principal occupations during past five years or longer | | Current other public company or investment company directorships |
Olivia S. Mitchell*** (Born 1953) | | Trustee, since 2006; Governance Committee Chairman, since 2018 | | International Foundation of Employee Benefit Plans Professor, Wharton School of the University of Pennsylvania since 1993. Director of Wharton’s Pension Research Council and Boettner Center on Pensions & Retirement Research, and Research Associate at the National Bureau of Economic Research. Previously, Cornell University Professor from 1978 to 1993. | | Asset Allocation Trust |
Timothy J. Penny**** (Born 1951) | | Trustee since 1996; Chairman, since 2018; Vice Chairman, from 2017 to 2018 | | President and Chief Executive Officer of Southern Minnesota Initiative Foundation, a non-profit organization, since 2007. Member of the Board of Trustees of NorthStar Education Finance, Inc., a non-profit organization, since 2007. | | Asset Allocation Trust |
James G. Polisson***** (Born 1959) | | Trustee, since 2018; Advisory Board Member, from 2017 to 2018 | | Retired. Chief Marketing Officer, Source (ETF) UK Services, Ltd, from 2015 to 2017. From 2012 to 2015, Principal of The Polisson Group, LLC, a management consulting, corporate advisory and principal investing company. Chief Executive Officer and Managing Director at Russell Investments, Global Exchange Traded Funds from 2010 to 2012. Managing Director of Barclays Global Investors from 1998 to 2010 and Global Chief Marketing Officer for iShares and Barclays Global Investors from 2000 to 2010. Trustee of the San Francisco Mechanics’ Institute, a non-profit organization, from 2013 to 2015. Board member of the Russell Exchange Traded Fund Trust from 2011 to 2012. Director of Barclays Global Investors Holdings Deutschland GmbH from 2006 to 2009. Mr. Polisson is an attorney and has a retired status with the Massachusetts and District of Columbia Bar Associations. | | Asset Allocation Trust |
Michael S. Scofield (Born 1943) | | Trustee, since 2010 | | Served on the Investment Company Institute’s Board of Governors and Executive Committee from 2008-2011 as well the Governing Council of the Independent Directors Council from 2006-2011 and the Independent Directors Council Executive Committee from 2008-2011. Trustee of the Evergreen Fund complex (and its predecessors) from 1984 to 2010. Chairman of the Evergreen Funds from 2000-2010. Former Trustee of the Mentor Funds. Retired Attorney, Law Offices of Michael S. Scofield. | | Asset Allocation Trust |
Pamela Wheelock***** (Born 1959) | | Trustee, since 2018; Advisory Board Member, from 2017 to 2018 | | Chief Operating Officer, Twin Cities Habitat for Humanity, since January, 2017. Vice President of University Services, University of Minnesota from 2012 to 2017. Prior thereto, Interim President and Chief Executive Officer of Blue Cross Blue Shield of Minnesota from 2010 to 2011, Chairman of the Board from 2009 to 2011 and Board Director from 2003 to 2015. Vice President, Leadership and Community Engagement, Bush Foundation, Saint Paul, Minnesota (a private foundation) from 2009 to 2011. Executive Vice President and Chief Financial Officer, Minnesota Sports and Entertainment from 2004 to 2009 and Senior Vice President from 2002 to 2004. Commissioner of Finance, State of Minnesota, from 1999 to 2002. Currently on the Board of Directors, Governance Committee and Finance Committee, for the Minnesota Philanthropy Partners (Saint Paul Foundation) since 2012 and Board Chair of the Minnesota Wild Foundation since 2010. | | Asset Allocation Trust |
| * | Length of service dates reflect the Trustee’s commencement of service with the Trust’s predecessor entities, where applicable. |
| ** | Jane Freeman became Chair Liaison effective January 1, 2018. |
| *** | Olivia Mitchell became Chairman of the Governance Committee effective January 1, 2018. |
| **** | Timothy Penny became Chairman effective January 1, 2018. |
| ***** | James Polisson and Pamela Wheelock each became a Trustee effective January 1, 2018. |
| | | | | | |
| Other information (unaudited) | | Wells Fargo Disciplined U.S. Core Fund | | | 31 | |
Officers
| | | | | | |
Name and year of birth | | Position held and length of service | | Principal occupations during past five years or longer | | |
Andrew Owen (Born 1960) | | President, since 2017 | | Executive Vice President of Wells Fargo & Company and Head of Affiliated Managers, Wells Fargo Asset Management, since 2014. In addition, Mr. Owen is currently President, Chief Executive Officer and Director of Wells Fargo Funds Management, LLC since 2017. Prior thereto, Executive Vice President responsible for marketing, investments and product development for Wells Fargo Funds Management, LLC, from 2009 to 2014. | | |
Jeremy DePalma1 (Born 1974) | | Treasurer, since 2012 | | Senior Vice President of Wells Fargo Funds Management, LLC since 2009. Senior Vice President of Evergreen Investment Management Company, LLC from 2008 to 2010 and head of the Fund Reporting and Control Team within Fund Administration from 2005 to 2010. | | |
C. David Messman (Born 1960) | | Secretary, since 2000; Chief Legal Officer, since 2003 | | Senior Vice President and Secretary of Wells Fargo Funds Management, LLC since 2001. Assistant General Counsel of Wells Fargo Bank, N.A. since 2013 and Vice President and Managing Counsel of Wells Fargo Bank, N.A. from 1996 to 2013. | | |
Michael H. Whitaker (Born 1967) | | Chief Compliance Officer, since 2016 | | Senior Vice President and Chief Compliance Officer since 2016. Senior Vice President and Chief Compliance Officer for Fidelity Investments from 2007 to 2016. | | |
David Berardi (Born 1975) | | Assistant Treasurer, since 2009 | | Vice President of Wells Fargo Funds Management, LLC since 2009. Vice President of Evergreen Investment Management Company, LLC from 2008 to 2010. Manager of Fund Reporting and Control for Evergreen Investment Management Company, LLC from 2004 to 2010. | | |
| 1 | Jeremy DePalma acts as Treasurer of 76 funds and Assistant Treasurer of 77 funds in the Fund Complex. |
| 2 | The Statement of Additional Information includes additional information about the Trustees and is available, without charge, upon request, by calling 1-800-222-8222 or by visiting the website at wellsfargofunds.com. |
| | | | |
| 32 | | Wells Fargo Disciplined U.S. Core Fund | | List of abbreviations |
The following is a list of common abbreviations for terms and entities that may have appeared in this report.
| ACA | — ACA Financial Guaranty Corporation |
| ADR | — American depositary receipt |
| ADS | — American depositary shares |
| AGC | — Assured Guaranty Corporation |
| AGM | — Assured Guaranty Municipal |
| Ambac | — Ambac Financial Group Incorporated |
| AMT | — Alternative minimum tax |
| BAN | — Bond anticipation notes |
| BHAC | — Berkshire Hathaway Assurance Corporation |
| CAB | — Capital appreciation bond |
| CCAB | — Convertible capital appreciation bond |
| CDA | — Community Development Authority |
| CDO | — Collateralized debt obligation |
| CLO | — Collateralized loan obligation |
| DRIVER | — Derivative inverse tax-exempt receipts |
| DW&P | — Department of Water & Power |
| DWR | — Department of Water Resources |
| ECFA | — Educational & Cultural Facilities Authority |
| EDA | — Economic Development Authority |
| EDFA | — Economic Development Finance Authority |
| ETF | — Exchange-traded fund |
| FDIC | — Federal Deposit Insurance Corporation |
| FFCB | — Federal Farm Credit Banks |
| FGIC | — Financial Guaranty Insurance Corporation |
| FHA | — Federal Housing Administration |
| FHLB | — Federal Home Loan Bank |
| FHLMC | — Federal Home Loan Mortgage Corporation |
| FICO | — The Financing Corporation |
| FNMA | — Federal National Mortgage Association |
| GDR | — Global depositary receipt |
| GNMA | — Government National Mortgage Association |
| HCFR | — Healthcare facilities revenue |
| HEFA | — Health & Educational Facilities Authority |
| HEFAR | — Higher education facilities authority revenue |
| HFA | — Housing Finance Authority |
| HFFA | — Health Facilities Financing Authority |
| HUD | — Department of Housing and Urban Development |
| IDA | — Industrial Development Authority |
| IDAG | — Industrial Development Agency |
| KRW | — Republic of Korea won |
| LIBOR | — London Interbank Offered Rate |
| LIFER | — Long Inverse Floating Exempt Receipts |
| LLC | — Limited liability company |
| LLLP | — Limited liability limited partnership |
| LLP | — Limited liability partnership |
| MBIA | — Municipal Bond Insurance Association |
| MFHR | — Multifamily housing revenue |
| MSTR | — Municipal securities trust receipts |
| MUD | — Municipal Utility District |
| National | — National Public Finance Guarantee Corporation |
| PCFA | — Pollution Control Financing Authority |
| PCL | — Public Company Limited |
| PCR | — Pollution control revenue |
| PFA | — Public Finance Authority |
| PFFA | — Public Facilities Financing Authority |
| PFOTER | — Puttable floating option tax-exempt receipts |
| PJSC | — Public Joint Stock Company |
| plc | — Public limited company |
| PUTTER | — Puttable tax-exempt receipts |
| R&D | — Research & development |
| Radian | — Radian Asset Assurance |
| RAN | — Revenue anticipation notes |
| RDA | — Redevelopment Agency |
| RDFA | — Redevelopment Finance Authority |
| REIT | — Real estate investment trust |
| ROC | — Reset option certificates |
| SAVRS | — Select auction variable rate securities |
| SBA | — Small Business Authority |
| SDR | — Swedish depositary receipt |
| SFHR | — Single-family housing revenue |
| SFMR | — Single-family mortgage revenue |
| SIFMA | — Securities Industry and Financial Markets Association |
| SPA | — Standby purchase agreement |
| SPDR | — Standard & Poor’s Depositary Receipts |
| SPEAR | — Short Puttable Exempt Adjustable Receipts |
| STRIPS | — Separate trading of registered interest and |
| TAN | — Tax anticipation notes |
| TIPS | — Treasury inflation-protected securities |
| TRAN | — Tax revenue anticipation notes |
| TTFA | — Transportation Trust Fund Authority |
| TVA | — Tennessee Valley Authority |

For more information
More information about Wells Fargo Funds is available free upon request. To obtain literature, please write, email, visit the Fund’s website, or call:
Wells Fargo Funds
P.O. Box 8266
Boston, MA 02266-8266
Email: fundservice@wellsfargo.com
Website: wellsfargofunds.com
Individual investors: 1-800-222-8222
Retail investment professionals: 1-888-877-9275
Institutional investment professionals: 1-866-765-0778
This report and the financial statements contained herein are submitted for the general information of the shareholders of the Fund. If this report is used for promotional purposes, distribution of the report must be accompanied or preceded by a current prospectus. Before investing, please consider the investment objectives, risks, charges, and expenses of the investment. For a current prospectus and, if available, a summary prospectus, containing this information, call 1-800-222-8222 or visit the Fund’s website at wellsfargofunds.com. Read the prospectus carefully before you invest or send money.
Wells Fargo Asset Management (WFAM) is a trade name used by the asset management businesses of Wells Fargo & Company. Wells Fargo Funds Management, LLC, a wholly owned subsidiary of Wells Fargo & Company, provides investment advisory and administrative services for Wells Fargo Funds. Other affiliates of Wells Fargo & Company provide subadvisory and other services for the funds. The funds are distributed by Wells Fargo Funds Distributor, LLC, Member FINRA, an affiliate of Wells Fargo & Company. Neither Wells Fargo Funds Distributor nor Wells Fargo Funds Management holds fund shareholder accounts or assets. This material is for general informational and educational purposes only and is NOT intended to provide investment advice or a recommendation of any kind—including a recommendation for any specific investment, strategy, or plan.
NOT FDIC INSURED ◾ NO BANK GUARANTEE ◾ MAY LOSE VALUE
© 2018 Wells Fargo Funds Management, LLC. All rights reserved.
| | |
 | | 309112 03-18 SA203/SAR203 01-18 |
Semi-Annual Report
January 31, 2018

Wells Fargo Endeavor Select Fund


Reduce clutter. Save trees.
Sign up for electronic delivery of prospectuses and shareholder reports at wellsfargo.com/advantagedelivery
Contents
The views expressed and any forward-looking statements are as of January 31, 2018, unless otherwise noted, and are those of the Fund managers and/or Wells Fargo Funds Management, LLC. Discussions of individual securities, or the markets generally, or any Wells Fargo Fund are not intended as individual recommendations. Future events or results may vary significantly from those expressed in any forward-looking statements. The views expressed are subject to change at any time in response to changing circumstances in the market. Wells Fargo Funds Management, LLC and the Fund disclaim any obligation to publicly update or revise any views expressed or forward-looking statements.
NOT FDIC INSURED ◾ NO BANK GUARANTEE ◾ MAY LOSE VALUE
| | | | |
| 2 | | Wells Fargo Endeavor Select Fund | | Letter to shareholders (unaudited) |

Andrew Owen
President
Wells Fargo Funds
While investing in stocks and bonds generally delivered favorable returns during the past six months, fixed-income investments in the U.S. diverged from the global trend.
Dear Shareholder:
We are pleased to offer you this semi-annual report for the Wells Fargo Endeavor Select Fund for the six-month period that ended January 31, 2018. While investing in stocks generally delivered favorable returns during the past six months, fixed-income investments in the U.S. diverged from the global trend. U.S. and international stocks delivered similar results, with returns of 15.43% and 13.50%, respectively, for the six-month period, as measured by the S&P 500 Index1 and the MSCI ACWI ex USA Index (Net)2, respectively. Within fixed income, the Bloomberg Barclays Global Aggregate ex-USD Index3 earned 4.50%. In the U.S., fixed-income investments, as measured by the Bloomberg Barclays U.S. Aggregate Bond Index4, fell 0.35% and the Bloomberg Barclays Municipal Bond Index5 declined 0.19%.
As global growth improved in the third quarter of 2017, investment markets advanced.
Globally, stocks moved higher during the late summer of 2017 as they were subject to the same positive economic conditions that influenced their advances during first half of the year: moderately accelerating global economic growth supported by improving corporate earnings as well as low inflation and interest rates. Brief episodes of geopolitical tensions, primarily associated with North Korea’s advancing nuclear missile program, flaring conflicts in the Middle East, and uncertainty surrounding the new U.S. administration’s trade policies, did not discourage investing activity. In the U.S., economic data released during the quarter reflected a generally healthy economy. Second-quarter economic output grew at a 3.1% annual rate.
Outside the U.S., stocks in international developed and emerging markets were supported by improved economic growth. Advances in emerging markets equity valuations slowed compared with the pace of the first half of 2017 but continued an upward path. Central banks in Europe, Asia, and Japan maintained low-interest-rate policies that supported business growth and equity investing.
In the U.S., Federal Reserve (Fed) officials announced in October plans to begin the process of unwinding its $4.5 trillion portfolio of bonds and other assets accumulated during rounds of quantitative easing conducted since the 2008–2009 recession. Still, restrained inflation kept long-term bond rates steady and the flattening of the yield curve persisted.
Positive economic and market news continued as 2017 closed and 2018 began.
During the fourth quarter of 2017, stock markets continued an upward trajectory. Synchronous economic expansion worldwide continued with mild inflation and low volatility. Data released during the quarter reflected a healthy U.S. economy.
| 1 | The S&P 500 Index consists of 500 stocks chosen for market size, liquidity, and industry group representation. It is a market-value-weighted index with each stock’s weight in the index proportionate to its market value. You cannot invest directly in an index. |
| 2 | The Morgan Stanley Capital International (MSCI) All Country World Index (ACWI) ex USA Index (Net) is a free-float-adjusted market-capitalization-weighted index that is designed to measure the equity market performance of developed markets, excluding the United States and Canada. Source: MSCI. MSCI makes no express or implied warranties or representations and shall have no liability whatsoever with respect to any MSCI data contained herein. The MSCI data may not be further redistributed or used as a basis for other indices or any securities or financial products. This report is not approved, reviewed, or produced by MSCI. You cannot invest directly in an index. |
| 3 | The Bloomberg Barclays Global Aggregate ex-USD Index is an unmanaged index that provides a broad-based measure of the global investment-grade fixed-income markets excluding the U.S.-dollar-denominated debt market. You cannot invest directly in an index. |
| 4 | The Bloomberg Barclays U.S. Aggregate Bond Index is a broad-based benchmark that measures the investment-grade, U.S. dollar-denominated, fixed-rate taxable bond market, including Treasuries, government-related and corporate securities, mortgage-backed securities (agency fixed-rate and hybrid adjustable-rate mortgage pass-throughs), asset-backed securities, and commercial mortgage-backed securities. You cannot invest directly in an index. |
| 5 | The Bloomberg Barclays Municipal Bond Index is an unmanaged index composed of long-term tax-exempt bonds with a minimum credit rating of Baa. You cannot invest directly in an index. |
| | | | | | |
| Letter to shareholders (unaudited) | | Wells Fargo Endeavor Select Fund | | | 3 | |
Third-quarter economic output grew at a 3.2% annual rate. Increased hiring pushed the unemployment rate down to a 17-year low of 4.1%. Tax reform in the U.S. that passed as the year ended also encouraged increased spending among businesses and individuals. Signs of long-awaited wage growth appeared to emerge.
Outside the U.S., economies continued to strengthen. In December, the Organisation for Economic Co-operation and Development (OECD) reported that the global economy has been expanding at its fastest rate since 2010; all 35 countries the OECD follows were on track to expand for 2017. International economies have benefited from catalysts such as economic stimulus, improving employment, increased investment, accelerated trade growth, and the firming of prices for some of the commodities that are essential exports of many international economies.
October 2017 marked one year since regulatory reform of money market investing in the U.S. By December 2017, money market fund asset levels exceeded their December 2016 levels, reflecting continued investor demand for the short-term investment opportunities afforded them by money market funds.
In December 2017, the Fed raised the federal funds rate target to a range of 1.25% to 1.50%. The Fed also began reducing its bond portfolio. Long-term interest rates in the U.S. trended higher as the yield curve steepened—the 10-year Treasury rate moved from 2.46% to 2.84% and the 30-year rate moved from 2.81% to 3.08% during January 2018.
Don’t let short-term uncertainty derail long-term investment goals.
Periods of investment uncertainty can present challenges, but experience has taught us that maintaining long-term investment goals can be an effective way to plan for the future. To help you create a sound strategy based on your personal goals and risk tolerance, Wells Fargo Funds offers more than 100 mutual funds spanning a wide range of asset classes and investment styles. Although diversification cannot guarantee an investment profit or prevent losses, we believe it can be an effective way to manage investment risk and potentially smooth out overall portfolio performance. We encourage investors to know their investments and to understand that appropriate levels of risk-taking may unlock opportunities.
Thank you for choosing to invest with Wells Fargo Funds. We appreciate your confidence in us and remain committed to helping you meet your financial needs.
Sincerely,

Andrew Owen
President
Wells Fargo Funds
Although diversification cannot guarantee an investment profit or prevent losses, we believe it can be an effective way to manage investment risk and potentially smooth out overall portfolio performance.
For further information about your Fund, contact your investment professional, visit our website at wellsfargofunds.com, or call us directly at 1-800-222-8222.
| | | | |
| 4 | | Wells Fargo Endeavor Select Fund | | Performance highlights (unaudited) |
Investment objective
The Fund seeks long-term capital appreciation.
Manager
Wells Fargo Funds Management, LLC
Subadviser
Wells Capital Management Incorporated
Portfolio managers
Michael T. Smith, CFA®
Christopher J. Warner, CFA®
Average annual total returns (%) as of January 31, 2018
| | | | | | | | | | | | | | | | | | | | | | | | | | | | | | | | | | |
| | | | | Including sales charge | | | Excluding sales charge | | | Expense ratios1 (%) | |
| | | Inception date | | 1 year | | | 5 year | | | 10 year | | | 1 year | | | 5 year | | | 10 year | | | Gross | | | Net2 | |
| Class A (STAEX) | | 12-29-2000 | | | 33.18 | | | | 14.90 | | | | 8.49 | | | | 41.22 | | | | 16.27 | | | | 9.14 | | | | 1.22 | | | | 1.20 | |
| Class C (WECCX) | | 12-29-2000 | | | 39.15 | | | | 15.41 | | | | 8.32 | | | | 40.15 | | | | 15.41 | | | | 8.32 | | | | 1.97 | | | | 1.95 | |
| Administrator Class (WECDX) | | 4-8-2005 | | | – | | | | – | | | | – | | | | 41.46 | | | | 16.54 | | | | 9.41 | | | | 1.14 | | | | 1.00 | |
| Institutional Class (WFCIX) | | 4-8-2005 | | | – | | | | – | | | | – | | | | 41.76 | | | | 16.76 | | | | 9.61 | | | | 0.89 | | | | 0.80 | |
| Russell 1000® Growth Index3 | | – | | | – | | | | – | | | | – | | | | 34.89 | | | | 17.95 | | | | 11.65 | | | | – | | | | – | |
Figures quoted represent past performance, which is no guarantee of future results, and do not reflect taxes that a shareholder may pay on fund distributions or the redemption of fund shares. Investment return and principal value of an investment will fluctuate so that an investor’s shares, when redeemed, may be worth more or less than their original cost. Performance shown without sales charges would be lower if sales charges were reflected. Current performance may be lower or higher than the performance data quoted, which assumes the reinvestment of dividends and capital gains. Current month-end performance is available on the Fund’s website, wellsfargofunds.com.
Please keep in mind that high double-digit returns were primarily achieved during favorable market conditions. You should not expect that such favorable returns can be consistently achieved. A fund’s performance, especially for short time periods, should not be the sole factor in making your investment decision.
Index returns do not include transaction costs associated with buying and selling securities, any mutual fund fees or expenses, or any taxes. It is not possible to invest directly in an index.
For Class A shares, the maximum front-end sales charge is 5.75%. For Class C shares, the maximum contingent deferred sales charge is 1.00%. Performance including a contingent deferred sales charge assumes the sales charge for the corresponding time period. Administrator Class and Institutional Class shares are sold without a front-end sales charge or contingent deferred sales charge.
Stock values fluctuate in response to the activities of individual companies and general market and economic conditions. Certain investment strategies tend to increase the total risk of an investment (relative to the broader market). The Fund is exposed to foreign investment risk, focused portfolio risk, and smaller-company securities risk. Consult the Fund’s prospectus for additional information on these and other risks.
Please see footnotes on page 5.
| | | | | | |
| Performance highlights (unaudited) | | Wells Fargo Endeavor Select Fund | | | 5 | |
| | | | |
| Ten largest holdings (%) as of January 31, 20184 | |
Amazon.com Incorporated | | | 8.34 | |
Alphabet Incorporated Class A | | | 5.63 | |
Microsoft Corporation | | | 5.50 | |
Visa Incorporated Class A | | | 5.31 | |
UnitedHealth Group Incorporated | | | 5.24 | |
The Home Depot Incorporated | | | 3.32 | |
Waste Connections Incorporated | | | 3.26 | |
salesforce.com Incorporated | | | 3.17 | |
FleetCor Technologies Incorporated | | | 2.78 | |
Intercontinental Exchange Incorporated | | | 2.70 | |
|
| Sector distribution as of January 31, 20185 |
|
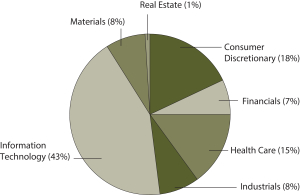
|
| 1 | Reflects the expense ratios as stated in the most recent prospectuses. The expense ratios shown are subject to change and may differ from the annualized expense ratios shown in the financial highlights of this report. |
| 2 | The manager has contractually committed through November 30, 2018, to waive fees and/or reimburse expenses to the extent necessary to cap the Fund’s Total Annual Fund Operating Expenses After Fee Waivers at the amounts shown. After this time, the cap may be increased or the commitment to maintain the cap may be terminated only with the approval of the Board of Trustees. Brokerage commissions, stamp duty fees, interest, taxes, acquired fund fees and expenses, and extraordinary expenses are excluded from the expense cap. Without this cap, the Fund’s returns would have been lower. The expense ratio paid by an investor is the net expense ratio or the Fund’s Total Annual Fund Operating Expenses After Fee Waivers, as stated in the prospectuses. |
| 3 | The Russell 1000® Growth Index measures the performance of those Russell 1000 companies with higher price/book ratios and higher forecasted growth values. You cannot invest directly in an index. |
| 4 | The ten largest holdings, excluding cash and cash equivalents, are calculated based on the value of the investments divided by total net assets of the Fund. Holdings are subject to change and may have changed since the date specified. |
| 5 | Amounts are calculated based on the total long-term investments of the Fund. These amounts are subject to change and may have changed since the date specified. |
| | | | |
| 6 | | Wells Fargo Endeavor Select Fund | | Fund expenses (unaudited) |
As a shareholder of the Fund, you incur two types of costs: (1) transaction costs, including sales charges (loads) on purchase payments and contingent deferred sales charges (if any) on redemptions and (2) ongoing costs, including management fees, distribution (12b-1) and/or shareholder servicing fees, and other Fund expenses. This example is intended to help you understand your ongoing costs (in dollars) of investing in the Fund and to compare these costs with the ongoing costs of investing in other mutual funds.
The example is based on an investment of $1,000 invested at the beginning of the six-month period and held for the entire period from August 1, 2017 to January 31, 2018.
Actual expenses
The “Actual” line of the table below provides information about actual account values and actual expenses. You may use the information in this line, together with the amount you invested, to estimate the expenses that you paid over the period. Simply divide your account value by $1,000 (for example, an $8,600 account value divided by $1,000 = 8.6), then multiply the result by the number in the “Actual” line under the heading entitled “Expenses paid during period” for your applicable class of shares to estimate the expenses you paid on your account during this period.
Hypothetical example for comparison purposes
The “Hypothetical” line of the table below provides information about hypothetical account values and hypothetical expenses based on the Fund’s actual expense ratio and an assumed rate of return of 5% per year before expenses, which is not the Fund’s actual return. The hypothetical account values and expenses may not be used to estimate the actual ending account balance or expenses you paid for the period. You may use this information to compare the ongoing costs of investing in the Fund and other funds. To do so, compare this 5% hypothetical example with the 5% hypothetical examples that appear in the shareholder reports of the other funds.
Please note that the expenses shown in the table are meant to highlight your ongoing costs only and do not reflect any transactional costs, such as sales charges (loads) and contingent deferred sales charges. Therefore, the “Hypothetical” line of the table is useful in comparing ongoing costs only and will not help you determine the relative total costs of owning different funds. In addition, if these transactional costs were included, your costs would have been higher.
| | | | | | | | | | | | | | | | |
| | | Beginning
account value
8-1-2017 | | | Ending
account value
1-31-2018 | | | Expenses
paid during
the period¹ | | | Annualized net
expense ratio | |
Class A | | | | | | | | | | | | | | | | |
Actual | | $ | 1,000.00 | | | $ | 1,208.71 | | | $ | 6.68 | | | | 1.20 | % |
Hypothetical (5% return before expenses) | | $ | 1,000.00 | | | $ | 1,019.16 | | | $ | 6.11 | | | | 1.20 | % |
Class C | | | | | | | | | | | | | | | | |
Actual | | $ | 1,000.00 | | | $ | 1,203.64 | | | $ | 10.83 | | | | 1.95 | % |
Hypothetical (5% return before expenses) | | $ | 1,000.00 | | | $ | 1,015.38 | | | $ | 9.91 | | | | 1.95 | % |
Administrator Class | | | | | | | | | | | | | | | | |
Actual | | $ | 1,000.00 | | | $ | 1,208.69 | | | $ | 5.57 | | | | 1.00 | % |
Hypothetical (5% return before expenses) | | $ | 1,000.00 | | | $ | 1,020.16 | | | $ | 5.09 | | | | 1.00 | % |
Institutional Class | | | | | | | | | | | | | | | | |
Actual | | $ | 1,000.00 | | | $ | 1,211.02 | | | $ | 4.46 | | | | 0.80 | % |
Hypothetical (5% return before expenses) | | $ | 1,000.00 | | | $ | 1,021.17 | | | $ | 4.08 | | | | 0.80 | % |
| 1 | Expenses paid is equal to the annualized net expense ratio of each class multiplied by the average account value over the period, multiplied by the number of days in the most recent fiscal half-year divided by the number of days in the fiscal year (to reflect the one-half-year period). |
| | | | | | |
| Portfolio of investments—January 31, 2018 (unaudited) | | Wells Fargo Endeavor Select Fund | | | 7 | |
| | | | | | | | | | | | | | | | |
| Security name | | | | | | | | Shares | | | Value | |
| | | | |
Common Stocks: 98.77% | | | | | | | | | | | | | | | | |
| | | | |
Consumer Discretionary: 17.57% | | | | | | | | | | | | | | | | |
| | | | |
| Auto Components: 1.97% | | | | | | | | | | | | | | | | |
Aptiv plc | | | | | | | | | | | 34,900 | | | $ | 3,311,312 | |
| | | | | | | | | | | | | | | | |
| | | | |
| Automobiles: 1.62% | | | | | | | | | | | | | | | | |
Ferrari NV | | | | | | | | | | | 22,700 | | | | 2,712,649 | |
| | | | | | | | | | | | | | | | |
| | | | |
| Internet & Direct Marketing Retail: 10.66% | | | | | | | | | | | | | | | | |
Amazon.com Incorporated † | | | | | | | | | | | 9,653 | | | | 14,005,441 | |
Netflix Incorporated † | | | | | | | | | | | 14,400 | | | | 3,892,320 | |
| | | | |
| | | | | | | | | | | | | | | 17,897,761 | |
| | | | | | | | | | | | | | | | |
| | | | |
| Specialty Retail: 3.32% | | | | | | | | | | | | | | | | |
The Home Depot Incorporated | | | | | | | | | | | 27,783 | | | | 5,581,605 | |
| | | | | | | | | | | | | | | | |
| | | | |
Financials: 7.26% | | | | | | | | | | | | | | | | |
| | | | |
| Capital Markets: 7.26% | | | | | | | | | | | | | | | | |
Intercontinental Exchange Incorporated | | | | | | | | | | | 61,515 | | | | 4,542,268 | |
Raymond James Financial Incorporated | | | | | | | | | | | 45,800 | | | | 4,414,662 | |
S&P Global Incorporated | | | | | | | | | | | 17,878 | | | | 3,237,706 | |
| | | | |
| | | | | | | | | | | | | | | 12,194,636 | |
| | | | | | | | | | | | | | | | |
| | | | |
Health Care: 14.63% | | | | | | | | | | | | | | | | |
| | | | |
| Biotechnology: 2.00% | | | | | | | | | | | | | | | | |
Celgene Corporation † | | | | | | | | | | | 33,279 | | | | 3,366,504 | |
| | | | | | | | | | | | | | | | |
| | | | |
| Health Care Equipment & Supplies: 7.38% | | | | | | | | | | | | | | | | |
Baxter International Incorporated | | | | | | | | | | | 37,300 | | | | 2,686,719 | |
Boston Scientific Corporation † | | | | | | | | | | | 93,700 | | | | 2,619,852 | |
Edwards Lifesciences Corporation † | | | | | | | | | | | 23,500 | | | | 2,974,630 | |
Hologic Incorporated † | | | | | | | | | | | 96,200 | | | | 4,107,740 | |
| | | | |
| | | | | | | | | | | | | | | 12,388,941 | |
| | | | | | | | | | | | | | | | |
| | | | |
| Health Care Providers & Services: 5.25% | | | | | | | | | | | | | | | | |
UnitedHealth Group Incorporated | | | | | | | | | | | 37,200 | | | | 8,808,216 | |
| | | | | | | | | | | | | | | | |
| | | | |
Industrials: 7.93% | | | | | | | | | | | | | | | | |
| | | | |
| Aerospace & Defense: 1.99% | | | | | | | | | | | | | | | | |
Northrop Grumman Corporation | | | | | | | | | | | 9,800 | | | | 3,337,194 | |
| | | | | | | | | | | | | | | | |
| | | | |
| Commercial Services & Supplies: 5.94% | | | | | | | | | | | | | | | | |
Cintas Corporation | | | | | | | | | | | 26,800 | | | | 4,514,460 | |
Waste Connections Incorporated | | | | | | | | | | | 76,160 | | | | 5,469,811 | |
| | | | |
| | | | | | | | | | | | | | | 9,984,271 | |
| | | | | | | | | | | | | | | | |
| | | | |
Information Technology: 42.28% | | | | | | | | | | | | | | | | |
| | | | |
| Internet Software & Services: 13.63% | | | | | | | | | | | | | | | | |
Alphabet Incorporated Class A † | | | | | | | | | | | 7,999 | | | | 9,456,578 | |
Alphabet Incorporated Class C † | | | | | | | | | | | 1,650 | | | | 1,930,401 | |
The accompanying notes are an integral part of these financial statements.
| | | | |
| 8 | | Wells Fargo Endeavor Select Fund | | Portfolio of investments—January 31, 2018 (unaudited) |
| | | | | | | | | | | | | | | | |
| Security name | | | | | | | | Shares | | | Value | |
| | | | |
| Internet Software & Services (continued) | | | | | | | | | | | | | | | | |
Facebook Incorporated Class A † | | | | | | | | | | | 23,449 | | | $ | 4,382,384 | |
MercadoLibre Incorporated | | | | | | | | | | | 7,300 | | | | 2,825,830 | |
Tencent Holdings Limited ADR « | | | | | | | | | | | 72,600 | | | | 4,295,742 | |
| | | | |
| | | | | | | | | | | | | | | 22,890,935 | |
| | | | | | | | | | | | | | | | |
| | | | |
| IT Services: 14.34% | | | | | | | | | | | | | | | | |
Fidelity National Information Services Incorporated | | | | | | | | | | | 27,800 | | | | 2,845,608 | |
First Data Corporation Class A † | | | | | | | | | | | 143,900 | | | | 2,547,030 | |
FleetCor Technologies Incorporated † | | | | | | | | | | | 22,000 | | | | 4,675,000 | |
PayPal Holdings Incorporated † | | | | | | | | | | | 25,600 | | | | 2,184,192 | |
Total System Services Incorporated | | | | | | | | | | | 32,900 | | | | 2,923,494 | |
Visa Incorporated Class A | | | | | | | | | | | 71,758 | | | | 8,914,496 | |
| | | | |
| | | | | | | | | | | | | | | 24,089,820 | |
| | | | | | | | | | | | | | | | |
| | | | |
| Semiconductors & Semiconductor Equipment: 2.08% | | | | | | | | | | | | | | | | |
Broadcom Limited | | | | | | | | | | | 14,100 | | | | 3,497,223 | |
| | | | | | | | | | | | | | | | |
| | | | |
| Software: 12.23% | | | | | | | | | | | | | | | | |
Activision Blizzard Incorporated | | | | | | | | | | | 42,600 | | | | 3,157,938 | |
Electronic Arts Incorporated † | | | | | | | | | | | 22,100 | | | | 2,805,816 | |
Microsoft Corporation | | | | | | | | | | | 97,200 | | | | 9,234,972 | |
salesforce.com Incorporated † | | | | | | | | | | | 46,800 | | | | 5,330,988 | |
| | | | |
| | | | | | | | | | | | | | | 20,529,714 | |
| | | | | | | | | | | | | | | | |
| | | | |
Materials: 7.73% | | | | | | | | | | | | | | | | |
| | | | |
| Chemicals: 5.08% | | | | | | | | | | | | | | | | |
Air Products & Chemicals Incorporated | | | | | | | | | | | 24,700 | | | | 4,158,739 | |
The Sherwin-Williams Company | | | | | | | | | | | 10,500 | | | | 4,379,655 | |
| | | | |
| | | | | | | | | | | | | | | 8,538,394 | |
| | | | | | | | | | | | | | | | |
| | | | |
| Construction Materials: 2.65% | | | | | | | | | | | | | | | | |
Vulcan Materials Company | | | | | | | | | | | 32,800 | | | | 4,441,120 | |
| | | | | | | | | | | | | | | | |
| | | | |
Real Estate: 1.37% | | | | | | | | | | | | | | | | |
| | | | |
| Equity REITs: 1.37% | | | | | | | | | | | | | | | | |
SBA Communications Corporation † | | | | | | | | | | | 13,200 | | | | 2,303,400 | |
| | | | | | | | | | | | | | | | |
| | | | |
Total Common Stocks (Cost $97,943,507) | | | | | | | | | | | | | | | 165,873,695 | |
| | | | | | | | | | | | | | | | |
| | | | |
| | | Yield | | | | | | | | | | |
| Short-Term Investments: 1.60% | | | | | | | | | | | | | | | | |
| | | | |
| Investment Companies: 1.60% | | | | | | | | | | | | | | | | |
Securities Lending Cash Investment LLC (l)(r)(u) | | | 1.60 | % | | | | | | | 722,903 | | | | 722,975 | |
Wells Fargo Government Money Market Fund Select Class (l)(u) | | | 1.24 | | | | | | | | 1,959,183 | | | | 1,959,183 | |
| | | | |
Total Short-Term Investments (Cost $2,682,158) | | | | | | | | | | | | | | | 2,682,158 | |
| | | | | | | | | | | | | | | | |
| | | | | | | | |
| Total investments in securities (Cost $100,625,665) | | | 100.37 | % | | | 168,555,853 | |
Other assets and liabilities, net | | | (0.37 | ) | | | (613,787 | ) |
| | | | | | | | |
| Total net assets | | | 100.00 | % | | $ | 167,942,066 | |
| | | | | | | | |
The accompanying notes are an integral part of these financial statements.
| | | | | | |
| Portfolio of investments—January 31, 2018 (unaudited) | | Wells Fargo Endeavor Select Fund | | | 9 | |
| † | Non-income-earning security |
| « | All or a portion of this security is on loan. |
| (l) | The issuer of the security is an affiliated person of the Fund as defined in the Investment Company Act of 1940. |
| (r) | The investment is a non-registered investment company purchased with cash collateral received from securities on loan. |
| (u) | The rate represents the 7-day annualized yield at period end. |
Investments in Affiliates
An affiliated investment is an investment in which the Fund owns at least 5% of the outstanding voting shares of the issuer or as a result of other relationships, such as the Fund and the issuer having the same investment manager. Transactions with issuers that were either affiliated persons of the Fund at the beginning of the period or the end of the period were as follows:
| | | | | | | | | | | | | | | | | | | | | | | | | | | | | | | | | | | | |
| | | Shares,
beginning of
period | | | Shares
purchased | | | Shares
sold | | | Shares,
end of
period | | | Net
realized
gains
(losses) | | | Net
change in
unrealized
gains
(losses) | | | Income
from
affiliated
securities | | | Value,
end
of period | | | % of
net
assets | |
Short-Term Investments | | | | | | | | | | | | | | | | | | | | | | | | | | | | | | | | | | | | |
Investment companies | | | | | | | | | | | | | | | | | | | | | | | | | | | | | | | | | | | | |
Securities Lending Cash Investment LLC | | | 0 | | | | 59,924,408 | | | | 59,201,505 | | | | 722,903 | | | $ | 0 | | | $ | 0 | | | $ | 4,432 | | | $ | 722,975 | | | | | |
Wells Fargo Government Money Market Fund Select Class | | | 4,487,680 | | | | 40,353,793 | | | | 42,882,290 | | | | 1,959,183 | | | | 0 | | | | 0 | | | | 15,580 | | | | 1,959,183 | | | | | |
| | | | | | | | | | | | | | | | | | | | | | | | | | | | | | | | | | | | |
| | | | | | | | | | | | | | | | | | $ | 0 | | | $ | 0 | | | $ | 20,012 | | | $ | 2,682,158 | | | | 1.60 | % |
| | | | | | | | | | | | | | | | | | | | | | | | | | | | | | | | | | | | |
The accompanying notes are an integral part of these financial statements.
| | | | |
| 10 | | Wells Fargo Endeavor Select Fund | | Statement of assets and liabilities—January 31, 2018 (unaudited) |
| | | | |
| | | | |
| |
Assets | | | | |
Investments in unaffiliated securities (including $714,573 of securities loaned), at value (cost $97,943,507) | | $ | 165,873,695 | |
Investments in affiliated securities, at value (cost $2,682,158) | | | 2,682,158 | |
Receivable for Fund shares sold | | | 482,015 | |
Receivable for dividends | | | 7,157 | |
Receivable for securities lending income | | | 201 | |
Prepaid expenses and other assets | | | 148,473 | |
| | | | |
Total assets | | | 169,193,699 | |
| | | | |
| |
Liabilities | | | | |
Payable upon receipt of securities loaned | | | 722,975 | |
Payable for Fund shares redeemed | | | 349,219 | |
Management fee payable | | | 86,462 | |
Administration fees payable | | | 19,404 | |
Trustees’ fees and expenses payable | | | 2,212 | |
Distribution fee payable | | | 2,454 | |
Accrued expenses and other liabilities | | | 68,907 | |
| | | | |
Total liabilities | | | 1,251,633 | |
| | | | |
Total net assets | | $ | 167,942,066 | |
| | | | |
| |
NET ASSETS CONSIST OF | | | | |
Paid-in capital | | $ | 90,968,702 | |
Accumulated net investment loss | | | (150,792 | ) |
Accumulated net realized gains on investments | | | 9,193,968 | |
Net unrealized gains on investments | | | 67,930,188 | |
| | | | |
Total net assets | | $ | 167,942,066 | |
| | | | |
| |
COMPUTATION OF NET ASSET VALUE AND OFFERING PRICE PER SHARE | | | | |
Net assets – Class A | | $ | 14,632,071 | |
Shares outstanding – Class A1 | | | 1,635,409 | |
Net asset value per share – Class A | | | $8.95 | |
Maximum offering price per share – Class A2 | | | $9.50 | |
Net assets – Class C | | $ | 3,947,670 | |
Shares outstanding – Class C1 | | | 641,820 | |
Net asset value per share – Class C | | | $6.15 | |
Net assets – Administrator Class | | $ | 3,442,180 | |
Shares outstanding – Administrator Class1 | | | 358,841 | |
Net asset value per share – Administrator Class | | | $9.59 | |
Net assets – Institutional Class | | $ | 145,920,145 | |
Shares outstanding – Institutional Class1 | | | 14,588,248 | |
Net asset value per share – Institutional Class | | | $10.00 | |
| 1 | The Fund has an unlimited number of authorized shares. |
| 2 | Maximum offering price is computed as 100/94.25 of net asset value. On investments of $50,000 or more, the offering price is reduced. |
The accompanying notes are an integral part of these financial statements.
| | | | | | |
| Statement of operations—six months ended January 31, 2018 (unaudited) | | Wells Fargo Endeavor Select Fund | | | 11 | |
| | | | |
| | | | |
| |
Investment income | | | | |
Dividends (net of foreign withholding taxes of $3,279) | | $ | 539,539 | |
Income from affiliated securities | | | 20,012 | |
| | | | |
Total investment income | | | 559,551 | |
| | | | |
| |
Expenses | | | | |
Management fee | | | 575,849 | |
Administration fees | | | | |
Class A | | | 14,065 | |
Class C | | | 3,983 | |
Administrator Class | | | 2,269 | |
Institutional Class | | | 93,502 | |
Shareholder servicing fees | | | | |
Class A | | | 16,744 | |
Class C | | | 4,742 | |
Administrator Class | | | 4,363 | |
Distribution fee | | | | |
Class C | | | 14,225 | |
Custody and accounting fees | | | 7,009 | |
Professional fees | | | 22,893 | |
Registration fees | | | 962 | |
Trustees’ fees and expenses | | | 11,741 | |
Other fees and expenses | | | 6,249 | |
| | | | |
Total expenses | | | 778,596 | |
Less: Fee waivers and/or expense reimbursements | | | (68,390 | ) |
| | | | |
Net expenses | | | 710,206 | |
| | | | |
Net investment loss | | | (150,655 | ) |
| | | | |
| |
REALIZED AND UNREALIZED GAINS (LOSSES) ON INVESTMENTS | | | | |
Net realized gains on investments | | | 14,783,899 | |
Net change in unrealized gains (losses) on investments | | | 16,608,014 | |
| | | | |
Net realized and unrealized gains (losses) on investments | | | 31,391,913 | |
| | | | |
Net increase in net assets resulting from operations | | $ | 31,241,258 | |
| | | | |
The accompanying notes are an integral part of these financial statements.
| | | | |
| 12 | | Wells Fargo Endeavor Select Fund | | Statement of changes in net assets |
| | | | | | | | | | | | | | | | |
| | | Six months ended January 31, 2018 (unaudited) | | | Year ended
July 31, 2017 | |
| | | | |
Operations | | | | | | | | | | | | | | | | |
Net investment loss | | | | | | $ | (150,655 | ) | | | | | | $ | (27,223 | ) |
Net realized gains on investments | | | | | | | 14,783,899 | | | | | | | | 31,650,789 | |
Net change in unrealized gains (losses) on investments | | | | | | | 16,608,014 | | | | | | | | (1,943,395 | ) |
| | | | |
Net increase in net assets resulting from operations | | | | | | | 31,241,258 | | | | | | | | 29,680,171 | |
| | | | |
| | | | |
Distributions to shareholders from | | | | | | | | | | | | | | | | |
Net investment income | | | | | | | | | | | | | | | | |
Institutional Class | | | | | | | (159,467 | ) | | | | | | | (104,471 | ) |
Net realized gains | | | | | | | | | | | | | | | | |
Class A | | | | | | | (2,526,049 | ) | | | | | | | (2,338,187 | ) |
Class C | | | | | | | (946,756 | ) | | | | | | | (802,158 | ) |
Administrator Class | | | | | | | (597,660 | ) | | | | | | | (612,919 | ) |
Institutional Class | | | | | | | (24,016,577 | ) | | | | | | | (20,446,180 | ) |
| | | | |
Total distributions to shareholders | | | | | | | (28,246,509 | ) | | | | | | | (24,303,915 | ) |
| | | | |
| | | | |
Capital share transactions | | | Shares | | | | | | | | Shares | | | | | |
Proceeds from shares sold | | | | | | | | | | | | | | | | |
Class A | | | 196,499 | | | | 1,762,883 | | | | 223,513 | | | | 1,869,031 | |
Class C | | | 21,237 | | | | 142,265 | | | | 16,419 | | | | 100,249 | |
Administrator Class | | | 420 | | | | 4,104 | | | | 43,507 | | | | 395,396 | |
Institutional Class | | | 300,421 | | | | 2,979,798 | | | | 926,362 | | | | 8,245,314 | |
| | | | |
| | | | | | | 4,889,050 | | | | | | | | 10,609,990 | |
| | | | |
Reinvestment of distributions | | | | | | | | | | | | | | | | |
Class A | | | 267,712 | | | | 2,179,176 | | | | 285,522 | | | | 2,141,414 | |
Class C | | | 168,269 | | | | 942,309 | | | | 141,389 | | | | 797,434 | |
Administrator Class | | | 65,748 | | | | 573,324 | | | | 74,930 | | | | 594,196 | |
Institutional Class | | | 2,647,483 | | | | 24,092,788 | | | | 2,494,029 | | | | 20,451,160 | |
| | | | |
| | | | | | | 27,787,597 | | | | | | | | 23,984,204 | |
| | | | |
Payment for shares redeemed | | | | | | | | | | | | | | | | |
Class A | | | (253,818 | ) | | | (2,291,577 | ) | | | (1,149,400 | ) | | | (9,511,750 | ) |
Class B | | | N/A | | | | N/A | | | | (3,203 | )1 | | | (22,604 | )1 |
Class C | | | (88,240 | ) | | | (572,271 | ) | | | (301,126 | ) | | | (1,863,589 | ) |
Administrator Class | | | (91,565 | ) | | | (883,108 | ) | | | (294,386 | ) | | | (2,594,416 | ) |
Institutional Class | | | (2,845,443 | ) | | | (28,504,357 | ) | | | (5,816,960 | ) | | | (53,011,376 | ) |
| | | | |
| | | | | | | (32,251,313 | ) | | | | | | | (67,003,735 | ) |
| | | | |
Net increase (decrease) in net assets resulting from capital share transactions | | | | | | | 425,334 | | | | | | | | (32,409,541 | ) |
| | | | |
Total increase (decrease) in net assets | | | | | | | 3,420,083 | | | | | | | | (27,033,285 | ) |
| | | | |
| | | | |
Net assets | | | | | | | | | | | | | | | | |
Beginning of period | | | | | | | 164,521,983 | | | | | | | | 191,555,268 | |
| | | | |
End of period | | | | | | $ | 167,942,066 | | | | | | | $ | 164,521,983 | |
| | | | |
Undistributed (accumulated) net investment income (loss) | | | | | | $ | (150,792 | ) | | | | | | $ | 159,330 | |
| | | | |
| 1 | For the period from August 1, 2016 to September 9, 2016. Class B shares of the Fund were no longer offered to shareholders effective September 10, 2016. |
The accompanying notes are an integral part of these financial statements.
| | | | | | |
| Financial highlights | | Wells Fargo Endeavor Select Fund | | | 13 | |
(For a share outstanding throughout each period)
| | | | | | | | | | | | | | | | | | | | | | | | |
| | | Six months ended
January 31, 2018 (unaudited) | | | Year ended July 31 | |
| CLASS A | | | 2017 | | | 2016 | | | 2015 | | | 2014 | | | 2013 | |
Net asset value, beginning of period | | | $9.09 | | | | $8.96 | | | | $13.74 | | | | $14.13 | | | | $12.52 | | | | $10.45 | |
Net investment income (loss) | | | (0.02 | )1 | | | (0.03 | )1 | | | (0.04 | )1 | | | (0.08 | )1 | | | (0.09 | )1 | | | 0.00 | 1,2 |
Net realized and unrealized gains (losses) on investments | | | 1.73 | | | | 1.49 | | | | (0.14 | ) | | | 1.65 | | | | 2.37 | | | | 2.07 | |
| | | | | | | | | | | | | | | | | | | | | | | | |
Total from investment operations | | | 1.71 | | | | 1.46 | | | | (0.18 | ) | | | 1.57 | | | | 2.28 | | | | 2.07 | |
Distributions to shareholders from | | | | | | | | | | | | | | | | | | | | | | | | |
Net realized gains | | | (1.85 | ) | | | (1.33 | ) | | | (4.60 | ) | | | (1.96 | ) | | | (0.67 | ) | | | 0.00 | |
Net asset value, end of period | | | $8.95 | | | | $9.09 | | | | $8.96 | | | | $13.74 | | | | $14.13 | | | | $12.52 | |
Total return3 | | | 20.87 | % | | | 19.39 | % | | | (0.07 | )% | | | 12.14 | % | | | 18.40 | % | | | 19.81 | % |
Ratios to average net assets (annualized) | | | | | | | | | | | | | | | | | | | | | | | | |
Gross expenses | | | 1.22 | % | | | 1.22 | % | | | 1.28 | % | | | 1.24 | % | | | 1.25 | % | | | 1.26 | % |
Net expenses | | | 1.20 | % | | | 1.20 | % | | | 1.20 | % | | | 1.23 | % | | | 1.24 | % | | | 1.25 | % |
Net investment income (loss) | | | (0.53 | )% | | | (0.33 | )% | | | (0.36 | )% | | | (0.55 | )% | | | (0.66 | )% | | | 0.03 | % |
Supplemental data | | | | | | | | | | | | | | | | | | | | | | | | |
Portfolio turnover rate | | | 24 | % | | | 59 | % | | | 79 | % | | | 126 | % | | | 100 | % | | | 97 | % |
Net assets, end of period (000s omitted) | | | $14,632 | | | | $12,953 | | | | $18,498 | | | | $26,197 | | | | $41,708 | | | | $44,041 | |
| 1 | Calculated based upon average shares outstanding |
| 2 | Amount is less than $0.005. |
| 3 | Total return calculations do not include any sales charges. Returns for periods of less than one year are not annualized. |
The accompanying notes are an integral part of these financial statements.
| | | | |
| 14 | | Wells Fargo Endeavor Select Fund | | Financial highlights |
(For a share outstanding throughout each period)
| | | | | | | | | | | | | | | | | | | | | | | | |
| | | Six months ended
January 31, 2018 (unaudited) | | | Year ended July 31 | |
| CLASS C | | | 2017 | | | 2016 | | | 2015 | | | 2014 | | | 2013 | |
Net asset value, beginning of period | | | $6.80 | | | | $7.09 | | | | $11.93 | | | | $12.61 | | | | $11.32 | | | | $9.51 | |
Net investment loss | | | (0.04 | )1 | | | (0.07 | )1 | | | (0.09 | )1 | | | (0.16 | )1 | | | (0.17 | )1 | | | (0.07 | )1 |
Net realized and unrealized gains (losses) on investments | | | 1.24 | | | | 1.11 | | | | (0.15 | ) | | | 1.44 | | | | 2.13 | | | | 1.88 | |
| | | | | | | | | | | | | | | | | | | | | | | | |
Total from investment operations | | | 1.20 | | | | 1.04 | | | | (0.24 | ) | | | 1.28 | | | | 1.96 | | | | 1.81 | |
Distributions to shareholders from | | | | | | | | | | | | | | | | | | | | | | | | |
Net realized gains | | | (1.85 | ) | | | (1.33 | ) | | | (4.60 | ) | | | (1.96 | ) | | | (0.67 | ) | | | 0.00 | |
Net asset value, end of period | | | $6.15 | | | | $6.80 | | | | $7.09 | | | | $11.93 | | | | $12.61 | | | | $11.32 | |
Total return2 | | | 20.36 | % | | | 18.46 | % | | | (0.76 | )% | | | 11.21 | % | | | 17.60 | % | | | 18.93 | % |
Ratios to average net assets (annualized) | | | | | | | | | | | | | | | | | | | | | | | | |
Gross expenses | | | 1.97 | % | | | 1.97 | % | | | 2.03 | % | | | 1.99 | % | | | 2.00 | % | | | 2.01 | % |
Net expenses | | | 1.95 | % | | | 1.95 | % | | | 1.95 | % | | | 1.99 | % | | | 1.99 | % | | | 2.00 | % |
Net investment loss | | | (1.27 | )% | | | (1.08 | )% | | | (1.11 | )% | | | (1.32 | )% | | | (1.41 | )% | | | (0.72 | )% |
Supplemental data | | | | | | | | | | | | | | | | | | | | | | | | |
Portfolio turnover rate | | | 24 | % | | | 59 | % | | | 79 | % | | | 126 | % | | | 100 | % | | | 97 | % |
Net assets, end of period (000s omitted) | | | $3,948 | | | | $3,676 | | | | $4,845 | | | | $6,914 | | | | $6,747 | | | | $6,320 | |
| 1 | Calculated based upon average shares outstanding |
| 2 | Total return calculations do not include any sales charges. Returns for periods of less than one year are not annualized. |
The accompanying notes are an integral part of these financial statements.
| | | | | | |
| Financial highlights | | Wells Fargo Endeavor Select Fund | | | 15 | |
(For a share outstanding throughout each period)
| | | | | | | | | | | | | | | | | | | | | | | | |
| | | Six months ended
January 31, 2018 (unaudited) | | | Year ended July 31 | |
| ADMINISTRATOR CLASS | | | 2017 | | | 2016 | | | 2015 | | | 2014 | | | 2013 | |
Net asset value, beginning of period | | | $9.62 | | | | $9.38 | | | | $14.13 | | | | $14.45 | | | | $12.78 | | | | $10.63 | |
Net investment income (loss) | | | (0.02 | )1 | | | (0.01 | )1 | | | 0.01 | 1 | | | (0.05 | )1 | | | (0.06 | )1 | | | 0.03 | 1 |
Net realized and unrealized gains (losses) on investments | | | 1.84 | | | | 1.58 | | | | (0.16 | ) | | | 1.69 | | | | 2.42 | | | | 2.12 | |
| | | | | | | | | | | | | | | | | | | | | | | | |
Total from investment operations | | | 1.82 | | | | 1.57 | | | | (0.15 | ) | | | 1.64 | | | | 2.36 | | | | 2.15 | |
Distributions to shareholders from | | | | | | | | | | | | | | | | | | | | | | | | |
Net investment income | | | 0.00 | | | | 0.00 | | | | 0.00 | | | | 0.00 | | | | (0.02 | ) | | | 0.00 | |
Net realized gains | | | (1.85 | ) | | | (1.33 | ) | | | (4.60 | ) | | | (1.96 | ) | | | (0.67 | ) | | | 0.00 | |
| | | | | | | | | | | | | | | | | | | | | | | | |
Total distributions to shareholders | | | (1.85 | ) | | | (1.33 | ) | | | (4.60 | ) | | | (1.96 | ) | | | (0.69 | ) | | | 0.00 | |
Net asset value, end of period | | | $9.59 | | | | $9.62 | | | | $9.38 | | | | $14.13 | | | | $14.45 | | | | $12.78 | |
Total return2 | | | 20.87 | % | | | 19.71 | % | | | 0.16 | % | | | 12.38 | % | | | 18.77 | % | | | 20.13 | % |
Ratios to average net assets (annualized) | | | | | | | | | | | | | | | | | | | | | | | | |
Gross expenses | | | 1.14 | % | | | 1.14 | % | | | 1.14 | % | | | 1.05 | % | | | 1.06 | % | | | 1.08 | % |
Net expenses | | | 1.00 | % | | | 1.00 | % | | | 1.00 | % | | | 0.99 | % | | | 1.00 | % | | | 1.00 | % |
Net investment income (loss) | | | (0.31 | )% | | | (0.12 | )% | | | 0.06 | % | | | (0.32 | )% | | | (0.42 | )% | | | 0.23 | % |
Supplemental data | | | | | | | | | | | | | | | | | | | | | | | | |
Portfolio turnover rate | | | 24 | % | | | 59 | % | | | 79 | % | | | 126 | % | | | 100 | % | | | 97 | % |
Net assets, end of period (000s omitted) | | | $3,442 | | | | $3,695 | | | | $5,254 | | | | $42,776 | | | | $48,560 | | | | $68,611 | |
| 1 | Calculated based upon average shares outstanding |
| 2 | Returns for periods of less than one year are not annualized. |
The accompanying notes are an integral part of these financial statements.
| | | | |
| 16 | | Wells Fargo Endeavor Select Fund | | Financial highlights |
(For a share outstanding throughout each period)
| | | | | | | | | | | | | | | | | | | | | | | | |
| | | Six months ended
January 31, 2018 (unaudited) | | | Year ended July 31 | |
| INSTITUTIONAL CLASS | | | 2017 | | | 2016 | | | 2015 | | | 2014 | | | 2013 | |
Net asset value, beginning of period | | | $9.95 | | | | $9.65 | | | | $14.39 | | | | $14.65 | | | | $12.95 | | | | $10.75 | |
Net investment income (loss) | | | (0.01 | ) | | | 0.00 | 1,2 | | | 0.00 | 1,2 | | | (0.01 | )1 | | | (0.03 | )1 | | | 0.06 | 1 |
Net realized and unrealized gains (losses) on investments | | | 1.92 | | | | 1.64 | | | | (0.14 | ) | | | 1.71 | | | | 2.45 | | | | 2.14 | |
| | | | | | | | | | | | | | | | | | | | | | | | |
Total from investment operations | | | 1.91 | | | | 1.64 | | | | (0.14 | ) | | | 1.70 | | | | 2.42 | | | | 2.20 | |
Distributions to shareholders from | | | | | | | | | | | | | | | | | | | | | | | | |
Net investment income | | | (0.01 | ) | | | (0.01 | ) | | | 0.00 | | | | 0.00 | | | | (0.05 | ) | | | 0.00 | |
Net realized gains | | | (1.85 | ) | | | (1.33 | ) | | | (4.60 | ) | | | (1.96 | ) | | | (0.67 | ) | | | 0.00 | |
| | | | | | | | | | | | | | | | | | | | | | | | |
Total distributions to shareholders | | | (1.86 | ) | | | (1.34 | ) | | | (4.60 | ) | | | (1.96 | ) | | | (0.72 | ) | | | 0.00 | |
Net asset value, end of period | | | $10.00 | | | | $9.95 | | | | $9.65 | | | | $14.39 | | | | $14.65 | | | | $12.95 | |
Total return3 | | | 21.10 | % | | | 19.87 | % | | | 0.27 | % | | | 12.63 | % | | | 18.98 | % | | | 20.37 | % |
Ratios to average net assets (annualized) | | | | | | | | | | | | | | | | | | | | | | | | |
Gross expenses | | | 0.89 | % | | | 0.89 | % | | | 0.95 | % | | | 0.81 | % | | | 0.82 | % | | | 0.83 | % |
Net expenses | | | 0.80 | % | | | 0.80 | % | | | 0.80 | % | | | 0.80 | % | | | 0.80 | % | | | 0.80 | % |
Net investment income (loss) | | | (0.12 | )% | | | 0.05 | % | | | 0.04 | % | | | (0.09 | )% | | | (0.22 | )% | | | 0.50 | % |
Supplemental data | | | | | | | | | | | | | | | | | | | | | | | | |
Portfolio turnover rate | | | 24 | % | | | 59 | % | | | 79 | % | | | 126 | % | | | 100 | % | | | 97 | % |
Net assets, end of period (000s omitted) | | | $145,920 | | | | $144,199 | | | | $162,935 | | | | $221,801 | | | | $618,502 | | | | $508,685 | |
| 1 | Calculated based upon average shares outstanding |
| 2 | Amount is less than $0.005. |
| 3 | Returns for periods of less than one year are not annualized. |
The accompanying notes are an integral part of these financial statements.
| | | | | | |
| Notes to financial statements (unaudited) | | Wells Fargo Endeavor Select Fund | | | 17 | |
1. ORGANIZATION
Wells Fargo Funds Trust (the “Trust”), a Delaware statutory trust organized on March 10, 1999, is an open-end management investment company registered under the Investment Company Act of 1940, as amended (the “1940 Act”). As an investment company, the Trust follows the accounting and reporting guidance in Financial Accounting Standards Board Accounting Standards Codification Topic 946, Financial Services – Investment Companies. These financial statements report on the Wells Fargo Endeavor Select Fund (the “Fund”) which is a diversified series of the Trust.
Effective September 10, 2016, Class B shares of the Fund are no longer offered. Information for Class B shares reflected in the financial statements represents activity through September 9, 2016.
2. SIGNIFICANT ACCOUNTING POLICIES
The following significant accounting policies, which are consistently followed in the preparation of the financial statements of the Fund, are in conformity with U.S. generally accepted accounting principles which require management to make estimates and assumptions that affect the reported amounts of assets and liabilities, disclosure of contingent assets and liabilities at the date of the financial statements, and the reported amounts of revenues and expenses during the reporting period. Actual results could differ from those estimates.
Securities valuation
All investments are valued each business day as of the close of regular trading on the New York Stock Exchange (generally 4 p.m. Eastern Time), although the Fund may deviate from this calculation time under unusual or unexpected circumstances.
Equity securities that are listed on a foreign or domestic exchange or market are valued at the official closing price or, if none, the last sales price. If no sale occurs on the principal exchange or market that day, a fair value price will be determined in accordance with the Fund’s Valuation Procedures.
Investments in registered open-end investment companies are valued at net asset value. Interests in non-registered investment companies that are redeemable at net asset value are fair valued normally at net asset value.
Investments which are not valued using any of the methods discussed above are valued at their fair value, as determined in good faith by the Board of Trustees of the Fund. The Board of Trustees has established a Valuation Committee comprised of the Trustees and has delegated to it the authority to take any actions regarding the valuation of portfolio securities that the Valuation Committee deems necessary or appropriate, including determining the fair value of portfolio securities, unless the determination has been delegated to the Wells Fargo Asset Management Pricing Committee of Wells Fargo Funds Management, LLC (“Funds Management”). The Board of Trustees retains the authority to make or ratify any valuation decisions or approve any changes to the Valuation Procedures as it deems appropriate. On a quarterly basis, the Board of Trustees receives reports on any valuation actions taken by the Valuation Committee or the Wells Fargo Asset Management Pricing Committee which may include items for ratification.
Valuations of fair valued securities are compared to the next actual sales price when available, or other appropriate market values, to assess the continued appropriateness of the fair valuation methodologies used. These securities are fair valued on a day-to-day basis, taking into consideration changes to appropriate market information and any significant changes to the inputs considered in the valuation process until there is a readily available price provided on an exchange or by an independent pricing service. Valuations received from an independent pricing service or independent broker-dealer quotes are periodically validated by comparisons to most recent trades and valuations provided by other independent pricing services in addition to the review of prices by the manager and/or subadviser. Unobservable inputs used in determining fair valuations are identified based on the type of security, taking into consideration factors utilized by market participants in valuing the investment, knowledge about the issuer and the current market environment.
Security loans
The Fund may lend its securities from time to time in order to earn additional income in the form of fees or interest on securities received as collateral or the investment of any cash received as collateral. The Fund continues to receive interest or dividends on the securities loaned. The Fund receives collateral in the form of cash or securities with a value at least equal to the value of the securities on loan. The value of the loaned securities is determined at the close of each business day and any additional required collateral is delivered to the Fund on the next business day. In a securities lending transaction, the net asset value of the Fund will be affected by an increase or decrease in the value of the securities loaned and by an increase or decrease in the value of the instrument in which collateral is invested. The amount of securities lending activity undertaken by the Fund fluctuates from time to time. In the event of default or bankruptcy
| | | | |
| 18 | | Wells Fargo Endeavor Select Fund | | Notes to financial statements (unaudited) |
by the borrower, the Fund may be prevented from recovering the loaned securities or gaining access to the collateral or may experience delays or costs in doing so. In addition, the investment of any cash collateral received may lose all or part of its value. The Fund has the right under the lending agreement to recover the securities from the borrower on demand.
The Fund lends its securities through an unaffiliated securities lending agent. Cash collateral received in connection with its securities lending transactions is invested in Securities Lending Cash Investments, LLC (the “Securities Lending Fund”). The Securities Lending Fund is exempt from registration under Section 3(c)(7) of the 1940 Act and is managed by Funds Management and is subadvised by Wells Capital Management Incorporated (“WellsCap”), an affiliate of Funds Management and an indirect wholly owned subsidiary of Wells Fargo & Company (“Wells Fargo”). Funds Management receives an advisory fee starting at 0.05% and declining to 0.01% as the average daily net assets of the Securities Lending Fund increase. All of the fees received by Funds Management are paid to WellsCap for its services as subadviser. The Securities Lending Fund seeks to provide a positive return compared to the daily Fed Funds Open Rate by investing in high-quality, U.S. dollar-denominated short-term money market instruments. Securities Lending Fund investments are valued at the evaluated bid price provided by an independent pricing service. Income earned from investment in the Securities Lending Fund is included in income from affiliated securities on the Statement of Operations.
Security transactions and income recognition
Securities transactions are recorded on a trade date basis. Realized gains or losses are recorded on the basis of identified cost.
Dividend income is recognized on the ex-dividend date. Dividend income is recorded net of foreign taxes withheld where recovery of such taxes is not assured.
Distributions to shareholders
Distributions to shareholders from net investment income and net realized gains, if any, are recorded on the ex-dividend date. Such distributions are determined in accordance with income tax regulations and may differ from U.S. generally accepted accounting principles. Dividend sources are estimated at the time of declaration. The tax character of distributions is determined as of the Fund’s fiscal year end. Therefore, a portion of the Fund’s distributions made prior to the Fund’s fiscal year end may be categorized as a tax return of capital.
Federal and other taxes
The Fund intends to continue to qualify as a regulated investment company by distributing substantially all of its investment company taxable income and any net realized capital gains (after reduction for capital loss carryforwards) sufficient to relieve it from all, or substantially all, federal income taxes. Accordingly, no provision for federal income taxes was required.
The Fund’s income and federal excise tax returns and all financial records supporting those returns for the prior three fiscal years are subject to examination by the federal and Delaware revenue authorities. Management has analyzed the Fund’s tax positions taken on federal, state, and foreign tax returns for all open tax years and does not believe that there are any uncertain tax positions that require recognition of a tax liability.
As of January 31, 2018, the aggregate cost of all investments for federal income tax purposes was $100,600,878 and the unrealized gains (losses) consisted of:
| | | | |
Gross unrealized gains | | $ | 68,091,584 | |
Gross unrealized losses | | | (136,609 | ) |
Net unrealized gains | | $ | 67,954,975 | |
Class allocations
The separate classes of shares offered by the Fund differ principally in applicable sales charges, distribution, shareholder servicing, and administration fees. Class specific expenses are charged directly to that share class. Investment income, common expenses, and realized and unrealized gains (losses) on investments are allocated daily to each class of shares based on the relative proportion of net assets of each class.
3. FAIR VALUATION MEASUREMENTS
Fair value measurements of investments are determined within a framework that has established a fair value hierarchy based upon the various data inputs utilized in determining the value of the Fund’s investments. The three-level hierarchy gives the highest priority to unadjusted quoted prices in active markets for identical assets or liabilities (Level 1) and the
| | | | | | |
| Notes to financial statements (unaudited) | | Wells Fargo Endeavor Select Fund | | | 19 | |
lowest priority to unobservable inputs (Level 3). The Fund’s investments are classified within the fair value hierarchy based on the lowest level of input that is significant to the fair value measurement. The inputs are summarized into three broad levels as follows:
| ∎ | | Level 1 – quoted prices in active markets for identical securities |
| ∎ | | Level 2 – other significant observable inputs (including quoted prices for similar securities, interest rates, prepayment speeds, credit risk, etc.) |
| ∎ | | Level 3 – significant unobservable inputs (including the Fund’s own assumptions in determining the fair value of investments) |
The inputs or methodologies used for valuing investments in securities are not necessarily an indication of the risk associated with investing in those securities.
The following is a summary of the inputs used in valuing the Fund’s assets and liabilities as of January 31, 2018:
| | | | | | | | | | | | | | | | |
| | | Quoted prices
(Level 1) | | | Other significant
observable inputs
(Level 2) | | | Significant
unobservable inputs (Level 3) | | | Total | |
Assets | | | | | | | | | | | | | | | | |
Investments in: | | | | | | | | | | | | | | | | |
| | | | |
Common stocks | | | | | | | | | | | | | | | | |
Consumer discretionary | | $ | 29,503,327 | | | $ | 0 | | | $ | 0 | | | $ | 29,503,327 | |
Financials | | | 12,194,636 | | | | 0 | | | | 0 | | | | 12,194,636 | |
Health care | | | 24,563,661 | | | | 0 | | | | 0 | | | | 24,563,661 | |
Industrials | | | 13,321,465 | | | | 0 | | | | 0 | | | | 13,321,465 | |
Information technology | | | 71,007,692 | | | | 0 | | | | 0 | | | | 71,007,692 | |
Materials | | | 12,979,514 | | | | 0 | | | | 0 | | | | 12,979,514 | |
Real estate | | | 2,303,400 | | | | 0 | | | | 0 | | | | 2,303,400 | |
| | | | |
Short-term investments | | | | | | | | | | | | | | | | |
Investment companies | | | 1,959,183 | | | | 0 | | | | 0 | | | | 1,959,183 | |
Investments measured at net asset value* | | | | | | | | | | | | | | | 722,975 | |
Total assets | | $ | 167,832,878 | | | $ | 0 | | | $ | 0 | | | $ | 168,555,853 | |
| * | Investments that are measured at fair value using the net asset value per share (or its equivalent) as a practical expedient have not been categorized in the fair value hierarchy. The fair value amount presented in the table is intended to permit reconciliation of the fair value hierarchy to the amounts presented in the Statement of Assets and Liabilities. The Fund’s investment in Securities Lending Cash Investments, LLC valued at $722,975 does not have a redemption period notice, can be redeemed daily and does not have any unfunded commitments. |
The Fund recognizes transfers between levels within the fair value hierarchy at the end of the reporting period. At January 31, 2018, the Fund did not have any transfers into/out of Level 1, Level 2, or Level 3.
4. TRANSACTIONS WITH AFFILIATES
Management fee
Funds Management, an indirect wholly owned subsidiary of Wells Fargo, is the manager of the Fund and provides advisory and fund-level administrative services under an investment management agreement. Under the investment management agreement, Funds Management is responsible for, among other services, implementing the investment objectives and strategies of the Fund, supervising the subadviser, providing fund-level administrative services in connection with the Fund’s operations, and providing any other fund-level administrative services reasonably necessary for the operation of the Fund. As compensation for its services under the investment management agreement, Funds Management is entitled to receive an annual management fee starting at 0.70% and declining to 0.505% as the average daily net assets of the Fund increase. For the six months ended January 31, 2018, the management fee was equivalent to an annual rate of 0.70% of the Fund’s average daily net assets.
Funds Management has retained the services of a subadviser to provide daily portfolio management to the Fund. The fee for subadvisory services is borne by Funds Management. WellsCap is the subadviser to the Fund and is entitled to receive a fee from Funds Management at an annual rate starting at 0.30% and declining to 0.20% as the average daily net assets of the Fund increase.
| | | | |
| 20 | | Wells Fargo Endeavor Select Fund | | Notes to financial statements (unaudited) |
Administration fees
Under a class-level administration agreement, Funds Management provides class-level administrative services to the Fund, which includes paying fees and expenses for services provided by the transfer agent, sub-transfer agents, omnibus account servicers and record-keepers. As compensation for its services under the class-level administration agreement, Funds Management receives an annual fee which is calculated based on the average daily net assets of each class as follows:
| | | | |
| | | Class-level
administration fee | |
Class A, Class C | | | 0.21 | % |
Administrator Class, Institutional Class | | | 0.13 | |
Funds Management has contractually waived and/or reimbursed management and administration fees to the extent necessary to maintain certain net operating expense ratios for the Fund. Waiver of fees and/or reimbursement of expenses by Funds Management were made first from fund level expenses on a proportionate basis and then from class specific expenses. Funds Management has committed through November 30, 2018 to waive fees and/or reimburse expenses to the extent necessary to cap the Fund’s expenses at 1.20% for Class A shares, 1.95% for Class C shares, 1.00% for Administrator Class shares, and 0.80% for Institutional Class shares. After this time, the cap may be increased or the commitment to maintain the cap may be terminated only with the approval of the Board of Trustees.
Distribution fee
The Trust has adopted a distribution plan for Class C shares of the Fund pursuant to Rule 12b-1 under the 1940 Act. A distribution fee is charged to Class C share and paid to Wells Fargo Funds Distributor, LLC (“Funds Distributor”), the principal underwriter, at an annual rate of 0.75% of the average daily net assets of Class C shares.
In addition, Funds Distributor is entitled to receive the front-end sales charge from the purchase of Class A shares and a contingent deferred sales charge on the redemption of certain Class A shares. Funds Distributor is also entitled to receive the contingent deferred sales charges from redemptions of Class C shares. For the six months ended January 31, 2018, Funds Distributor received $554 from the sale of Class A shares. No contingent deferred sales charges were incurred by Class A and Class C shares for the six months ended January 31, 2018.
Shareholder servicing fees
The Trust has entered into contracts with one or more shareholder servicing agents, whereby Class A, Class C, and Administrator Class of the Fund are charged a fee at an annual rate of 0.25% of the average daily net assets of each respective class.
A portion of these total shareholder servicing fees were paid to affiliates of Wells Fargo.
Interfund transactions
The Fund may purchase or sell portfolio investment securities to certain other Wells Fargo affiliates pursuant to Rule 17a-7 under the 1940 Act and under procedures adopted by the Board of Trustees. The procedures have been designed to ensure that these interfund transactions, which do not incur broker commissions, are effected at current market prices.
5. INVESTMENT PORTFOLIO TRANSACTIONS
Purchases and sales of investments, excluding U.S. government obligations (if any) and short-term securities, for the six months ended January 31, 2018 were $38,387,405 and $62,782,784, respectively.
6. BANK BORROWINGS
The Trust (excluding the money market funds and certain other funds) and Wells Fargo Variable Trust are parties to a $280,000,000 revolving credit agreement whereby the Fund is permitted to use bank borrowings for temporary or emergency purposes, such as to fund shareholder redemption requests. Interest under the credit agreement is charged to the Fund based on a borrowing rate equal to the higher of the Federal Funds rate in effect on that day plus 1.25% or the overnight LIBOR rate in effect on that day plus 1.25%. In addition, an annual commitment fee equal to 0.25% of the unused balance is allocated to each participating fund. Prior to August 29, 2017, the revolving credit agreement amount was $250,000,000.
For the six months ended January 31, 2018, there were no borrowings by the Fund under the agreement.
| | | | | | |
| Notes to financial statements (unaudited) | | Wells Fargo Endeavor Select Fund | | | 21 | |
7. CONCENTRATION RISK
Concentration risks result from exposure to a limited number of sectors. A fund that invests a substantial portion of its assets in any sector may be more affected by changes in that sector than would be a fund whose investments are not heavily weighted in any sector.
8. INDEMNIFICATION
Under the Trust’s organizational documents, the officers and Trustees have been granted certain indemnification rights against certain liabilities that may arise out of performance of their duties to the Trust. Additionally, in the normal course of business, the Trust may enter into contracts with service providers that contain a variety of indemnification clauses. The Trust’s maximum exposure under these arrangements is dependent on future claims that may be made against the Fund and, therefore, cannot be estimated.
| | | | |
| 22 | | Wells Fargo Endeavor Select Fund | | Other information (unaudited) |
PROXY VOTING INFORMATION
A description of the policies and procedures that the Fund uses to determine how to vote proxies relating to portfolio securities is available, upon request, by calling 1-800-222-8222, visiting our website at wellsfargofunds.com, or visiting the SEC website at sec.gov. Information regarding how the Fund voted proxies relating to portfolio securities during the most recent 12-month period ended June 30 is available on the Fund’s website at wellsfargofunds.com or by visiting the SEC website at sec.gov.
PORTFOLIO HOLDINGS INFORMATION
The complete portfolio holdings for the Fund are publicly available monthly on the Fund’s website (wellsfargofunds.com), on a one-month delayed basis. In addition, top ten holdings information (excluding derivative positions) for the Fund is publicly available on the Fund’s website on a monthly, seven-day or more delayed basis. The Fund files its complete schedule of portfolio holdings with the SEC for the first and third quarters of each fiscal year on Form N-Q, which is available by visiting the SEC website at sec.gov. In addition, the Fund’s Form N-Q may be reviewed and copied at the SEC’s Public Reference Room in Washington, DC, and at regional offices in New York City, at 233 Broadway, and in Chicago, at 175 West Jackson Boulevard, Suite 900. Information about the Public Reference Room may be obtained by calling 1-800-SEC-0330.
| | | | | | |
| Other information (unaudited) | | Wells Fargo Endeavor Select Fund | | | 23 | |
BOARD OF TRUSTEES AND OFFICERS
Each of the Trustees and Officers1 listed in the table below acts in identical capacities for each fund in the Wells Fargo family of funds, which consists of 153 mutual funds comprising the Wells Fargo Funds Trust, Wells Fargo Variable Trust, Wells Fargo Master Trust and four closed-end funds (collectively the “Fund Complex”). This table should be read in conjunction with the Prospectus and the Statement of Additional Information2. The mailing address of each Trustee and Officer is 525 Market Street, 12th Floor, San Francisco, CA 94105. Each Trustee and Officer serves an indefinite term, however, each Trustee serves such term until reaching the mandatory retirement age established by the Trustees.
Independent Trustees
| | | | | | |
Name and year of birth | | Position held and length of service* | | Principal occupations during past five years or longer | | Current other public company or
investment company
directorships |
William R. Ebsworth (Born 1957) | | Trustee, since 2015 | | Retired. From 1984 to 2013, equities analyst, portfolio manager, research director and chief investment officer at Fidelity Management and Research Company in Boston, Tokyo, and Hong Kong, and retired in 2013 as Chief Investment Officer of Fidelity Strategic Advisers, Inc. where he led a team of investment professionals managing client assets. Prior thereto, Board member of Hong Kong Securities Clearing Co., Hong Kong Options Clearing Corp., the Thailand International Fund, Ltd., Fidelity Investments Life Insurance Company, and Empire Fidelity Investments Life Insurance Company. Board member of the Forté Foundation (non-profit organization) and the Vincent Memorial Hospital Endowment (non-profit organization), where he serves on the Investment Committee and as a Chair of the Audit Committee. Mr. Ebsworth is a CFA® charterholder. | | Asset Allocation Trust |
Jane A. Freeman** (Born 1953) | | Trustee, since 2015; Chair Liaison, since 2018 | | Retired. From 2012 to 2014 and 1999 to 2008, Chief Financial Officer of Scientific Learning Corporation. From 2008 to 2012, Ms. Freeman provided consulting services related to strategic business projects. Prior to 1999, Portfolio Manager at Rockefeller & Co. and Scudder, Stevens & Clark. Board member of the Harding Loevner Funds from 1996 to 2014, serving as both Lead Independent Director and chair of the Audit Committee. Board member of the Russell Exchange Traded Funds Trust from 2011 to 2012 and the chair of the Audit Committee. Ms. Freeman is a Board Member of Ruth Bancroft Garden (non-profit organization) and the Glimmerglass Festival. She is also an inactive Chartered Financial Analyst. | | Asset Allocation Trust |
Isaiah Harris, Jr. (Born 1952) | | Trustee, since 2009 | | Retired. Chairman of the Board of CIGNA Corporation since 2009, and Director since 2005. From 2003 to 2011, Director of Deluxe Corporation. Prior thereto, President and CEO of BellSouth Advertising and Publishing Corp. from 2005 to 2007, President and CEO of BellSouth Enterprises from 2004 to 2005 and President of BellSouth Consumer Services from 2000 to 2003. Emeritus member of the Iowa State University Foundation Board of Governors. Emeritus Member of the Advisory Board of Iowa State University School of Business. Advisory Board Member, Palm Harbor Academy (charter school). Advisory Board Member, Child Evangelism Fellowship (non-profit). Mr. Harris is a certified public accountant (inactive status). | | CIGNA Corporation; Asset Allocation Trust |
Judith M. Johnson (Born 1949) | | Trustee, since 2008; Audit Committee Chairman, since 2008 | | Retired. Prior thereto, Chief Executive Officer and Chief Investment Officer of Minneapolis Employees Retirement Fund from 1996 to 2008. Ms. Johnson is an attorney, certified public accountant and a certified managerial accountant. | | Asset Allocation Trust |
David F. Larcker (Born 1950) | | Trustee, since 2009 | | James Irvin Miller Professor of Accounting at the Graduate School of Business, Stanford University, Director of the Corporate Governance Research Initiative and Senior Faculty of The Rock Center for Corporate Governance since 2006. From 2005 to 2008, Professor of Accounting at the Graduate School of Business, Stanford University. Prior thereto, Ernst & Young Professor of Accounting at The Wharton School, University of Pennsylvania from 1985 to 2005. | | Asset Allocation Trust |
| | | | |
| 24 | | Wells Fargo Endeavor Select Fund | | Other information (unaudited) |
| | | | | | |
Name and year of birth | | Position held and length of service* | | Principal occupations during past five years or longer | | Current other public company or
investment company
directorships |
| Olivia S. Mitchell*** (Born 1953) | | Trustee, since 2006; Governance Committee Chairman, since 2018 | | International Foundation of Employee Benefit Plans Professor, Wharton School of the University of Pennsylvania since 1993. Director of Wharton’s Pension Research Council and Boettner Center on Pensions & Retirement Research, and Research Associate at the National Bureau of Economic Research. Previously, Cornell University Professor from 1978 to 1993. | | Asset Allocation Trust |
Timothy J. Penny**** (Born 1951) | | Trustee since 1996; Chairman, since 2018; Vice Chairman, from 2017 to 2018 | | President and Chief Executive Officer of Southern Minnesota Initiative Foundation, a non-profit organization, since 2007. Member of the Board of Trustees of NorthStar Education Finance, Inc., a non-profit organization, since 2007. | | Asset Allocation Trust |
James G. Polisson***** (Born 1959) | | Trustee, since 2018; Advisory Board Member, from 2017 to 2018 | | Retired. Chief Marketing Officer, Source (ETF) UK Services, Ltd, from 2015 to 2017. From 2012 to 2015, Principal of The Polisson Group, LLC, a management consulting, corporate advisory and principal investing company. Chief Executive Officer and Managing Director at Russell Investments, Global Exchange Traded Funds from 2010 to 2012. Managing Director of Barclays Global Investors from 1998 to 2010 and Global Chief Marketing Officer for iShares and Barclays Global Investors from 2000 to 2010. Trustee of the San Francisco Mechanics’ Institute, a non-profit organization, from 2013 to 2015. Board member of the Russell Exchange Traded Fund Trust from 2011 to 2012. Director of Barclays Global Investors Holdings Deutschland GmbH from 2006 to 2009. Mr. Polisson is an attorney and has a retired status with the Massachusetts and District of Columbia Bar Associations. | | Asset Allocation Trust |
Michael S. Scofield (Born 1943) | | Trustee, since 2010 | | Served on the Investment Company Institute’s Board of Governors and Executive Committee from 2008-2011 as well the Governing Council of the Independent Directors Council from 2006-2011 and the Independent Directors Council Executive Committee from 2008-2011. Trustee of the Evergreen Fund complex (and its predecessors) from 1984 to 2010. Chairman of the Evergreen Funds from 2000-2010. Former Trustee of the Mentor Funds. Retired Attorney, Law Offices of Michael S. Scofield. | | Asset Allocation Trust |
Pamela Wheelock***** (Born 1959) | | Trustee, since 2018; Advisory Board Member, from 2017 to 2018 | | Chief Operating Officer, Twin Cities Habitat for Humanity, since January, 2017. Vice President of University Services, University of Minnesota from 2012 to 2017. Prior thereto, Interim President and Chief Executive Officer of Blue Cross Blue Shield of Minnesota from 2010 to 2011, Chairman of the Board from 2009 to 2011 and Board Director from 2003 to 2015. Vice President, Leadership and Community Engagement, Bush Foundation, Saint Paul, Minnesota (a private foundation) from 2009 to 2011. Executive Vice President and Chief Financial Officer, Minnesota Sports and Entertainment from 2004 to 2009 and Senior Vice President from 2002 to 2004. Commissioner of Finance, State of Minnesota, from 1999 to 2002. Currently on the Board of Directors, Governance Committee and Finance Committee, for the Minnesota Philanthropy Partners (Saint Paul Foundation) since 2012 and Board Chair of the Minnesota Wild Foundation since 2010. | | Asset Allocation Trust |
| * | Length of service dates reflect the Trustee’s commencement of service with the Trust’s predecessor entities, where applicable. |
| ** | Jane Freeman became Chair Liaison effective January 1, 2018. |
| *** | Olivia Mitchell became Chairman of the Governance Committee effective January 1, 2018. |
| **** | Timothy Penny became Chairman effective January 1, 2018. |
| ***** | James Polisson and Pamela Wheelock each became a Trustee effective January 1, 2018. |
| | | | | | |
| Other information (unaudited) | | Wells Fargo Endeavor Select Fund | | | 25 | |
Officers
| | | | | | |
Name and year of birth | | Position held and length of service | | Principal occupations during past five years or longer | | |
Andrew Owen (Born 1960) | | President, since 2017 | | Executive Vice President of Wells Fargo & Company and Head of Affiliated Managers, Wells Fargo Asset Management, since 2014. In addition, Mr. Owen is currently President, Chief Executive Officer and Director of Wells Fargo Funds Management, LLC since 2017. Prior thereto, Executive Vice President responsible for marketing, investments and product development for Wells Fargo Funds Management, LLC, from 2009 to 2014. | | |
Jeremy DePalma1 (Born 1974) | | Treasurer, since 2012 | | Senior Vice President of Wells Fargo Funds Management, LLC since 2009. Senior Vice President of Evergreen Investment Management Company, LLC from 2008 to 2010 and head of the Fund Reporting and Control Team within Fund Administration from 2005 to 2010. | | |
C. David Messman (Born 1960) | | Secretary, since 2000; Chief Legal Officer, since 2003 | | Senior Vice President and Secretary of Wells Fargo Funds Management, LLC since 2001. Assistant General Counsel of Wells Fargo Bank, N.A. since 2013 and Vice President and Managing Counsel of Wells Fargo Bank, N.A. from 1996 to 2013. | | |
Michael H. Whitaker (Born 1967) | | Chief Compliance Officer, since 2016 | | Senior Vice President and Chief Compliance Officer since 2016. Senior Vice President and Chief Compliance Officer for Fidelity Investments from 2007 to 2016. | | |
David Berardi (Born 1975) | | Assistant Treasurer, since 2009 | | Vice President of Wells Fargo Funds Management, LLC since 2009. Vice President of Evergreen Investment Management Company, LLC from 2008 to 2010. Manager of Fund Reporting and Control for Evergreen Investment Management Company, LLC from 2004 to 2010. | | |
| 1 | Jeremy DePalma acts as Treasurer of 76 funds and Assistant Treasurer of 77 funds in the Fund Complex. |
| 2 | The Statement of Additional Information includes additional information about the Trustees and is available, without charge, upon request, by calling 1-800-222-8222 or by visiting the website at wellsfargofunds.com. |
| | | | |
| 26 | | Wells Fargo Endeavor Select Fund | | List of abbreviations |
The following is a list of common abbreviations for terms and entities that may have appeared in this report.
| ACA | — ACA Financial Guaranty Corporation |
| ADR | — American depositary receipt |
| ADS | — American depositary shares |
| AGC | — Assured Guaranty Corporation |
| AGM | — Assured Guaranty Municipal |
| Ambac | — Ambac Financial Group Incorporated |
| AMT | — Alternative minimum tax |
| BAN | — Bond anticipation notes |
| BHAC | — Berkshire Hathaway Assurance Corporation |
| CAB | — Capital appreciation bond |
| CCAB | — Convertible capital appreciation bond |
| CDA | — Community Development Authority |
| CDO | — Collateralized debt obligation |
| CLO | — Collateralized loan obligation |
| DRIVER | — Derivative inverse tax-exempt receipts |
| DW&P | — Department of Water & Power |
| DWR | — Department of Water Resources |
| ECFA | — Educational & Cultural Facilities Authority |
| EDA | — Economic Development Authority |
| EDFA | — Economic Development Finance Authority |
| ETF | — Exchange-traded fund |
| FDIC | — Federal Deposit Insurance Corporation |
| FFCB | — Federal Farm Credit Banks |
| FGIC | — Financial Guaranty Insurance Corporation |
| FHA | — Federal Housing Administration |
| FHLB | — Federal Home Loan Bank |
| FHLMC | — Federal Home Loan Mortgage Corporation |
| FICO | — The Financing Corporation |
| FNMA | — Federal National Mortgage Association |
| GDR | — Global depositary receipt |
| GNMA | — Government National Mortgage Association |
| HCFR | — Healthcare facilities revenue |
| HEFA | — Health & Educational Facilities Authority |
| HEFAR | — Higher education facilities authority revenue |
| HFA | — Housing Finance Authority |
| HFFA | — Health Facilities Financing Authority |
| HUD | — Department of Housing and Urban Development |
| IDA | — Industrial Development Authority |
| IDAG | — Industrial Development Agency |
| KRW | — Republic of Korea won |
| LIBOR | — London Interbank Offered Rate |
| LIFER | — Long Inverse Floating Exempt Receipts |
| LLC | — Limited liability company |
| LLLP | — Limited liability limited partnership |
| LLP | — Limited liability partnership |
| MBIA | — Municipal Bond Insurance Association |
| MFHR | — Multifamily housing revenue |
| MSTR | — Municipal securities trust receipts |
| MUD | — Municipal Utility District |
| National | — National Public Finance Guarantee Corporation |
| PCFA | — Pollution Control Financing Authority |
| PCL | — Public Company Limited |
| PCR | — Pollution control revenue |
| PFA | — Public Finance Authority |
| PFFA | — Public Facilities Financing Authority |
| PFOTER | — Puttable floating option tax-exempt receipts |
| PJSC | — Public Joint Stock Company |
| plc | — Public limited company |
| PUTTER | — Puttable tax-exempt receipts |
| R&D | — Research & development |
| Radian | — Radian Asset Assurance |
| RAN | — Revenue anticipation notes |
| RDA | — Redevelopment Agency |
| RDFA | — Redevelopment Finance Authority |
| REIT | — Real estate investment trust |
| ROC | — Reset option certificates |
| SAVRS | — Select auction variable rate securities |
| SBA | — Small Business Authority |
| SDR | — Swedish depositary receipt |
| SFHR | — Single-family housing revenue |
| SFMR | — Single-family mortgage revenue |
| SIFMA | — Securities Industry and Financial Markets Association |
| SPA | — Standby purchase agreement |
| SPDR | — Standard & Poor’s Depositary Receipts |
| SPEAR | — Short Puttable Exempt Adjustable Receipts |
| STRIPS | — Separate trading of registered interest and |
| TAN | — Tax anticipation notes |
| TIPS | — Treasury inflation-protected securities |
| TRAN | — Tax revenue anticipation notes |
| TTFA | — Transportation Trust Fund Authority |
| TVA | — Tennessee Valley Authority |
This page is intentionally left blank.
This page is intentionally left blank.

For more information
More information about Wells Fargo Funds is available free upon request. To obtain literature, please write, email, visit the Fund’s website, or call:
Wells Fargo Funds
P.O. Box 8266
Boston, MA 02266-8266
Email: fundservice@wellsfargo.com
Website: wellsfargofunds.com
Individual investors: 1-800-222-8222
Retail investment professionals: 1-888-877-9275
Institutional investment professionals: 1-866-765-0778
This report and the financial statements contained herein are submitted for the general information of the shareholders of the Fund. If this report is used for promotional purposes, distribution of the report must be accompanied or preceded by a current prospectus. Before investing, please consider the investment objectives, risks, charges, and expenses of the investment. For a current prospectus and, if available, a summary prospectus, containing this information, call 1-800-222-8222 or visit the Fund’s website at wellsfargofunds.com. Read the prospectus carefully before you invest or send money.
Wells Fargo Asset Management (WFAM) is a trade name used by the asset management businesses of Wells Fargo & Company. Wells Fargo Funds Management, LLC, a wholly owned subsidiary of Wells Fargo & Company, provides investment advisory and administrative services for Wells Fargo Funds. Other affiliates of Wells Fargo & Company provide subadvisory and other services for the funds. The funds are distributed by Wells Fargo Funds Distributor, LLC, Member FINRA, an affiliate of Wells Fargo & Company. Neither Wells Fargo Funds Distributor nor Wells Fargo Funds Management holds fund shareholder accounts or assets. This material is for general informational and educational purposes only and is NOT intended to provide investment advice or a recommendation of any kind—including a recommendation for any specific investment, strategy, or plan.
NOT FDIC INSURED ◾ NO BANK GUARANTEE ◾ MAY LOSE VALUE
© 2018 Wells Fargo Funds Management, LLC. All rights reserved.
| | |
 | | 309113 03-18 SA205/SAR205 01-18 |
Semi-Annual Report
January 31, 2018

Wells Fargo Growth Fund


Reduce clutter. Save trees.
Sign up for electronic delivery of prospectuses and shareholder reports at wellsfargo.com/advantagedelivery
Contents
The views expressed and any forward-looking statements are as of January 31, 2018, unless otherwise noted, and are those of the Fund managers and/or Wells Fargo Funds Management, LLC. Discussions of individual securities, or the markets generally, or any Wells Fargo Fund are not intended as individual recommendations. Future events or results may vary significantly from those expressed in any forward-looking statements. The views expressed are subject to change at any time in response to changing circumstances in the market. Wells Fargo Funds Management, LLC and the Fund disclaim any obligation to publicly update or revise any views expressed or forward-looking statements.
NOT FDIC INSURED ◾ NO BANK GUARANTEE ◾ MAY LOSE VALUE
| | | | |
| 2 | | Wells Fargo Growth Fund | | Letter to shareholders (unaudited) |

Andrew Owen
President
Wells Fargo Funds
While investing in stocks and bonds generally delivered favorable returns during the past six months, fixed-income investments in the U.S. diverged from the global trend.
Dear Shareholder:
We are pleased to offer you this semi-annual report for the Wells Fargo Growth Fund for the six-month period that ended January 31, 2018. While investing in stocks generally delivered favorable returns during the past six months, fixed-income investments in the U.S. diverged from the global trend. U.S. and international stocks delivered similar results, with returns of 15.43% and 13.50%, respectively, for the six-month period, as measured by the S&P 500 Index1 and the MSCI ACWI ex USA Index (Net)2, respectively. Within fixed income, the Bloomberg Barclays Global Aggregate ex-USD Index3 earned 4.50%. In the U.S., fixed-income investments, as measured by the Bloomberg Barclays U.S. Aggregate Bond Index4, fell 0.35% and the Bloomberg Barclays Municipal Bond Index5 declined 0.19%.
As global growth improved in the third quarter of 2017, investment markets advanced.
Globally, stocks moved higher during the late summer of 2017 as they were subject to the same positive economic conditions that influenced their advances during first half of the year: moderately accelerating global economic growth supported by improving corporate earnings as well as low inflation and interest rates. Brief episodes of geopolitical tensions, primarily associated with North Korea’s advancing nuclear missile program, flaring conflicts in the Middle East, and uncertainty surrounding the new U.S. administration’s trade policies, did not discourage investing activity. In the U.S., economic data released during the quarter reflected a generally healthy economy. Second-quarter economic output grew at a 3.1% annual rate.
Outside the U.S., stocks in international developed and emerging markets were supported by improved economic growth. Advances in emerging markets equity valuations slowed compared with the pace of the first half of 2017 but continued an upward path. Central banks in Europe, Asia, and Japan maintained low-interest-rate policies that supported business growth and equity investing.
In the U.S., Federal Reserve (Fed) officials announced in October plans to begin the process of unwinding its $4.5 trillion portfolio of bonds and other assets accumulated during rounds of quantitative easing conducted since the 2008–2009 recession. Still, restrained inflation kept long-term bond rates steady and the flattening of the yield curve persisted.
Positive economic and market news continued as 2017 closed and 2018 began.
During the fourth quarter of 2017, stock markets continued an upward trajectory. Synchronous economic expansion worldwide continued with mild inflation and low volatility. Data released during the quarter reflected a healthy U.S. economy.
| 1 | The S&P 500 Index consists of 500 stocks chosen for market size, liquidity, and industry group representation. It is a market-value-weighted index with each stock’s weight in the index proportionate to its market value. You cannot invest directly in an index. |
| 2 | The Morgan Stanley Capital International (MSCI) All Country World Index (ACWI) ex USA Index (Net) is a free-float-adjusted market-capitalization-weighted index that is designed to measure the equity market performance of developed markets, excluding the United States and Canada. Source: MSCI. MSCI makes no express or implied warranties or representations and shall have no liability whatsoever with respect to any MSCI data contained herein. The MSCI data may not be further redistributed or used as a basis for other indices or any securities or financial products. This report is not approved, reviewed, or produced by MSCI. You cannot invest directly in an index. |
| 3 | The Bloomberg Barclays Global Aggregate ex-USD Index is an unmanaged index that provides a broad-based measure of the global investment-grade fixed-income markets excluding the U.S.-dollar-denominated debt market. You cannot invest directly in an index. |
| 4 | The Bloomberg Barclays U.S. Aggregate Bond Index is a broad-based benchmark that measures the investment-grade, U.S. dollar-denominated, fixed-rate taxable bond market, including Treasuries, government-related and corporate securities, mortgage-backed securities (agency fixed-rate and hybrid adjustable-rate mortgage pass-throughs), asset-backed securities, and commercial mortgage-backed securities. You cannot invest directly in an index. |
| 5 | The Bloomberg Barclays Municipal Bond Index is an unmanaged index composed of long-term tax-exempt bonds with a minimum credit rating of Baa. You cannot invest directly in an index. |
| | | | | | |
| Letter to shareholders (unaudited) | | Wells Fargo Growth Fund | | | 3 | |
Third-quarter economic output grew at a 3.2% annual rate. Increased hiring pushed the unemployment rate down to a 17-year low of 4.1%. Tax reform in the U.S. that passed as the year ended also encouraged increased spending among businesses and individuals. Signs of long-awaited wage growth appeared to emerge.
Outside the U.S., economies continued to strengthen. In December, the Organisation for Economic Co-operation and Development (OECD) reported that the global economy has been expanding at its fastest rate since 2010; all 35 countries the OECD follows were on track to expand for 2017. International economies have benefited from catalysts such as economic stimulus, improving employment, increased investment, accelerated trade growth, and the firming of prices for some of the commodities that are essential exports of many international economies.
October 2017 marked one year since regulatory reform of money market investing in the U.S. By December 2017, money market fund asset levels exceeded their December 2016 levels, reflecting continued investor demand for the short-term investment opportunities afforded them by money market funds.
In December 2017, the Fed raised the federal funds rate target to a range of 1.25% to 1.50%. The Fed also began reducing its bond portfolio. Long-term interest rates in the U.S. trended higher as the yield curve steepened—the 10-year Treasury rate moved from 2.46% to 2.84% and the 30-year rate moved from 2.81% to 3.08% during January 2018.
Don’t let short-term uncertainty derail long-term investment goals.
Periods of investment uncertainty can present challenges, but experience has taught us that maintaining long-term investment goals can be an effective way to plan for the future. To help you create a sound strategy based on your personal goals and risk tolerance, Wells Fargo Funds offers more than 100 mutual funds spanning a wide range of asset classes and investment styles. Although diversification cannot guarantee an investment profit or prevent losses, we believe it can be an effective way to manage investment risk and potentially smooth out overall portfolio performance. We encourage investors to know their investments and to understand that appropriate levels of risk-taking may unlock opportunities.
Thank you for choosing to invest with Wells Fargo Funds. We appreciate your confidence in us and remain committed to helping you meet your financial needs.
Sincerely,

Andrew Owen
President
Wells Fargo Funds
Although diversification cannot guarantee an investment profit or prevent losses, we believe it can be an effective way to manage investment risk and potentially smooth out overall portfolio performance.
For further information about your Fund, contact your investment professional, visit our website at wellsfargofunds.com, or call us directly at 1-800-222-8222.
| | | | |
| 4 | | Wells Fargo Growth Fund | | Performance highlights (unaudited) |
Investment objective
The Fund seeks long-term capital appreciation.
Manager
Wells Fargo Funds Management, LLC
Subadviser
Wells Capital Management Incorporated
Portfolio managers
Joseph M. Eberhardy, CFA®, CPA
Thomas C. Ognar, CFA®
Bruce C. Olson, CFA®‡
Average annual total returns (%) as of January 31, 20181
| | | | | | | | | | | | | | | | | | | | | | | | | | | | | | | | | | |
| | | | | Including sales charge | | | Excluding sales charge | | | Expense ratios2 (%) | |
| | | Inception date | | 1 year | | | 5 year | | | 10 year | | | 1 year | | | 5 year | | | 10 year | | | Gross | | | Net3 | |
| Class A (SGRAX) | | 2-24-2000 | | | 29.88 | | | | 12.95 | | | | 11.65 | | | | 37.81 | | | | 14.30 | | | | 12.31 | | | | 1.17 | | | | 1.16 | |
| Class C (WGFCX) | | 12-26-2002 | | | 35.79 | | | | 13.44 | | | | 11.47 | | | | 36.79 | | | | 13.44 | | | | 11.47 | | | | 1.92 | | | | 1.91 | |
| Class R6 (SGRHX) | | 9-30-2015 | | | – | | | | – | | | | – | | | | 38.50 | | | | 14.81 | | | | 12.83 | | | | 0.74 | | | | 0.70 | |
| Administrator Class (SGRKX) | | 8-30-2002 | | | – | | | | – | | | | – | | | | 38.11 | | | | 14.54 | | | | 12.59 | | | | 1.09 | | | | 0.96 | |
| Institutional Class (SGRNX) | | 2-24-2000 | | | – | | | | – | | | | – | | | | 38.41 | | | | 14.78 | | | | 12.81 | | | | 0.84 | | | | 0.75 | |
| Russell 3000® Growth Index4 | | – | | | – | | | | – | | | | – | | | | 34.11 | | | | 17.69 | | | | 11.58 | | | | – | | | | – | |
Figures quoted represent past performance, which is no guarantee of future results, and do not reflect taxes that a shareholder may pay on fund distributions or the redemption of fund shares. Investment return and principal value of an investment will fluctuate so that an investor’s shares, when redeemed, may be worth more or less than their original cost. Performance shown without sales charges would be lower if sales charges were reflected. Current performance may be lower or higher than the performance data quoted, which assumes the reinvestment of dividends and capital gains. Current month-end performance is available on the Fund’s website, wellsfargofunds.com.
Please keep in mind that high double-digit returns were primarily achieved during favorable market conditions. You should not expect that such favorable returns can be consistently achieved. A fund’s performance, especially for short time periods, should not be the sole factor in making your investment decision.
Index returns do not include transaction costs associated with buying and selling securities, any mutual fund fees or expenses, or any taxes. It is not possible to invest directly in an index.
For Class A shares, the maximum front-end sales charge is 5.75%. For Class C shares, the maximum contingent deferred sales charge is 1.00%. Performance including a contingent deferred sales charge assumes the sales charge for the corresponding time period. Class R6, Administrator Class, and Institutional Class shares are sold without a front-end sales charge or contingent deferred sales charge.
Stock values fluctuate in response to the activities of individual companies and general market and economic conditions. Certain investment strategies tend to increase the total risk of an investment (relative to the broader market). The Fund is exposed to foreign investment risk and smaller-company securities risk. Consult the Fund’s prospectus for additional information on these and other risks.
Please see footnotes on page 5.
| | | | | | |
| Performance highlights (unaudited) | | Wells Fargo Growth Fund | | | 5 | |
| | | | |
| Ten largest holdings (%) as of January 31, 20185 | |
Amazon.com Incorporated | | | 7.05 | |
Alphabet Incorporated Class A | | | 6.06 | |
Facebook Incorporated Class A | | | 5.29 | |
Microchip Technology Incorporated | | | 3.76 | |
Visa Incorporated Class A | | | 2.94 | |
MasterCard Incorporated Class A | | | 2.73 | |
Microsoft Corporation | | | 2.66 | |
Apple Incorporated | | | 2.36 | |
PayPal Holdings Incorporated | | | 2.16 | |
MarketAxess Holdings Incorporated | | | 2.11 | |
|
| Sector distribution as of January 31, 20186 |
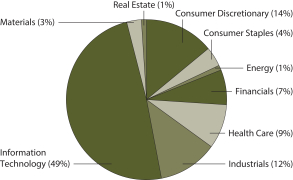
|
| ‡ | Mr. Olson has announced his intention to retire from Wells Capital Management on April 30, 2018. |
| 1 | Effective June 20, 2008, Advisor Class was renamed Class A and modified to assume the features and attributes of Class A. Historical performance shown for Class A shares through June 20, 2008, includes Advisor Class expenses. Historical performance shown for Class R6 shares prior to their inception reflects the performance of Institutional Class shares, and includes the higher expenses applicable to Institutional Class shares. If these expenses had not been included, returns for Class R6 shares would be higher. |
| 2 | Reflects the expense ratios as stated in the most recent prospectuses. The expense ratios shown are subject to change and may differ from the annualized expense ratios shown in the financial highlights of this report. |
| 3 | The manager has contractually committed through November 30, 2018, to waive fees and/or reimburse expenses to the extent necessary to cap the Fund’s Total Annual Fund Operating Expenses After Fee Waivers at the amounts shown. After this time, the cap may be increased or the commitment to maintain the cap may be terminated only with the approval of the Board of Trustees. Brokerage commissions, stamp duty fees, interest, taxes, acquired fund fees and expenses, and extraordinary expenses are excluded from the expense cap. Without this cap, the Fund’s returns would have been lower. The expense ratio paid by an investor is the net expense ratio or the Fund’s Total Annual Fund Operating Expenses After Fee Waivers, as stated in the prospectuses. |
| 4 | The Russell 3000® Growth Index measures the performance of those Russell 3000® Index companies with higher price/book ratios and higher forecasted growth values. You cannot invest directly in an index. |
| 5 | The ten largest holdings, excluding cash and cash equivalents, are calculated based on the value of the investments divided by total net assets of the Fund. Holdings are subject to change and may have changed since the date specified. |
| 6 | Amounts are calculated based on the total long-term investments of the Fund. These amounts are subject to change and may have changed since the date specified. |
| | | | |
| 6 | | Wells Fargo Growth Fund | | Fund expenses (unaudited) |
As a shareholder of the Fund, you incur two types of costs: (1) transaction costs, including sales charges (loads) on purchase payments and contingent deferred sales charges (if any) on redemptions and (2) ongoing costs, including management fees, distribution (12b-1) and/or shareholder servicing fees, and other Fund expenses. This example is intended to help you understand your ongoing costs (in dollars) of investing in the Fund and to compare these costs with the ongoing costs of investing in other mutual funds.
The example is based on an investment of $1,000 invested at the beginning of the six-month period and held for the entire period from August 1, 2017 to January 31, 2018.
Actual expenses
The “Actual” line of the table below provides information about actual account values and actual expenses. You may use the information in this line, together with the amount you invested, to estimate the expenses that you paid over the period. Simply divide your account value by $1,000 (for example, an $8,600 account value divided by $1,000 = 8.6), then multiply the result by the number in the “Actual” line under the heading entitled “Expenses paid during period” for your applicable class of shares to estimate the expenses you paid on your account during this period.
Hypothetical example for comparison purposes
The “Hypothetical” line of the table below provides information about hypothetical account values and hypothetical expenses based on the Fund’s actual expense ratio and an assumed rate of return of 5% per year before expenses, which is not the Fund’s actual return. The hypothetical account values and expenses may not be used to estimate the actual ending account balance or expenses you paid for the period. You may use this information to compare the ongoing costs of investing in the Fund and other funds. To do so, compare this 5% hypothetical example with the 5% hypothetical examples that appear in the shareholder reports of the other funds.
Please note that the expenses shown in the table are meant to highlight your ongoing costs only and do not reflect any transactional costs, such as sales charges (loads) and contingent deferred sales charges. Therefore, the “Hypothetical” line of the table is useful in comparing ongoing costs only and will not help you determine the relative total costs of owning different funds. In addition, if these transactional costs were included, your costs would have been higher.
| | | | | | | | | | | | | | | | |
| | | Beginning
account value
8-1-2017 | | | Ending
account value
1-31-2018 | | | Expenses
paid during
the period¹ | | | Annualized net
expense ratio | |
Class A | | | | | | | | | | | | | | | | |
Actual | | $ | 1,000.00 | | | $ | 1,202.34 | | | $ | 6.44 | | | | 1.16 | % |
Hypothetical (5% return before expenses) | | $ | 1,000.00 | | | $ | 1,019.36 | | | $ | 5.90 | | | | 1.16 | % |
Class C | | | | | | | | | | | | | | | | |
Actual | | $ | 1,000.00 | | | $ | 1,197.98 | | | $ | 10.58 | | | | 1.91 | % |
Hypothetical (5% return before expenses) | | $ | 1,000.00 | | | $ | 1,015.58 | | | $ | 9.70 | | | | 1.91 | % |
Class R6 | | | | | | | | | | | | | | | | |
Actual | | $ | 1,000.00 | | | $ | 1,205.42 | | | $ | 3.89 | | | | 0.70 | % |
Hypothetical (5% return before expenses) | | $ | 1,000.00 | | | $ | 1,021.68 | | | $ | 3.57 | | | | 0.70 | % |
Administrator Class | | | | | | | | | | | | | | | | |
Actual | | $ | 1,000.00 | | | $ | 1,203.52 | | | $ | 5.33 | | | | 0.96 | % |
Hypothetical (5% return before expenses) | | $ | 1,000.00 | | | $ | 1,020.37 | | | $ | 4.89 | | | | 0.96 | % |
Institutional Class | | | | | | | | | | | | | | | | |
Actual | | $ | 1,000.00 | | | $ | 1,205.03 | | | $ | 4.17 | | | | 0.75 | % |
Hypothetical (5% return before expenses) | | $ | 1,000.00 | | | $ | 1,021.42 | | | $ | 3.82 | | | | 0.75 | % |
| 1 | Expenses paid is equal to the annualized net expense ratio of each class multiplied by the average account value over the period, multiplied by the number of days in the most recent fiscal half-year divided by the number of days in the fiscal year (to reflect the one-half-year period). |
| | | | | | |
| Portfolio of investments—January 31, 2018 (unaudited) | | Wells Fargo Growth Fund | | | 7 | |
| | | | | | | | | | | | | | | | |
| Security name | | | | | | | | Shares | | | Value | |
|
Common Stocks: 100.03% | |
| | | | |
Consumer Discretionary: 13.99% | | | | | | | | | | | | | | | | |
| | | | |
| Diversified Consumer Services: 0.58% | | | | | | | | | | | | | | | | |
Bright Horizons Family Solutions Incorporated † | | | | | | | | | | | 137,550 | | | $ | 13,507,410 | |
Grand Canyon Education Incorporated † | | | | | | | | | | | 152,100 | | | | 14,143,779 | |
| |
| | | | 27,651,189 | |
| | | | | | | | | | | | | | | | |
| | | | |
| Hotels, Restaurants & Leisure: 0.79% | | | | | | | | | | | | | | | | |
Royal Caribbean Cruises Limited | | | | | | | | | | | 229,900 | | | | 30,703,145 | |
The Habit Restaurants Incorporated Class A †« | | | | | | | | | | | 817,885 | | | | 7,156,494 | |
| |
| | | | 37,859,639 | |
| | | | | | | | | | | | | | | | |
| | | | |
| Household Durables: 0.48% | | | | | | | | | | | | | | | | |
Mohawk Industries Incorporated † | | | | | | | | | | | 82,290 | | | | 23,128,427 | |
| | | | | | | | | | | | | | | | |
| | | | |
| Internet & Direct Marketing Retail: 7.73% | | | | | | | | | | | | | | | | |
Amazon.com Incorporated † | | | | | | | | | | | 231,800 | | | | 336,316,302 | |
Netflix Incorporated † | | | | | | | | | | | 120,900 | | | | 32,679,270 | |
| |
| | | | 368,995,572 | |
| | | | | | | | | | | | | | | | |
| | | | |
| Multiline Retail: 1.35% | | | | | | | | | | | | | | | | |
Dollar Tree Incorporated † | | | | | | | | | | | 559,460 | | | | 64,337,900 | |
| | | | | | | | | | | | | | | | |
| | | | |
| Specialty Retail: 3.06% | | | | | | | | | | | | | | | | |
Burlington Stores Incorporated † | | | | | | | | | | | 731,140 | | | | 88,987,049 | |
Five Below Incorporated † | | | | | | | | | | | 59,210 | | | | 3,844,505 | |
The Home Depot Incorporated | | | | | | | | | | | 263,940 | | | | 53,025,546 | |
| |
| | | | 145,857,100 | |
| | | | | | | | | | | | | | | | |
| | | | |
Consumer Staples: 3.80% | | | | | | | | | | | | | | | | |
| | | | |
| Beverages: 1.25% | | | | | | | | | | | | | | | | |
Constellation Brands Incorporated Class A | | | | | | | | | | | 271,110 | | | | 59,500,512 | |
| | | | | | | | | | | | | | | | |
| | | | |
| Food & Staples Retailing: 1.28% | | | | | | | | | | | | | | | | |
Costco Wholesale Corporation | | | | | | | | | | | 312,700 | | | | 60,935,849 | |
| | | | | | | | | | | | | | | | |
| | | | |
| Food Products: 0.36% | | | | | | | | | | | | | | | | |
Blue Buffalo Pet Products Incorporated †« | | | | | | | | | | | 512,270 | | | | 17,406,935 | |
| | | | | | | | | | | | | | | | |
| | | | |
| Personal Products: 0.91% | | | | | | | | | | | | | | | | |
The Estee Lauder Companies Incorporated Class A | | | | | | | | | | | 321,220 | | | | 43,351,851 | |
| | | | | | | | | | | | | | | | |
| | | | |
Energy: 1.46% | | | | | | | | | | | | | | | | |
| | | | |
| Energy Equipment & Services: 0.33% | | | | | | | | | | | | | | | | |
Halliburton Company | | | | | | | | | | | 209,100 | | | | 11,228,670 | |
Liberty Oilfield Services A † | | | | | | | | | | | 199,500 | | | | 4,416,930 | |
| |
| | | | 15,645,600 | |
| | | | | | | | | | | | | | | | |
| | | | |
| Oil, Gas & Consumable Fuels: 1.13% | | | | | | | | | | | | | | | | |
Concho Resources Incorporated † | | | | | | | | | | | 341,950 | | | | 53,836,608 | |
| | | | | | | | | | | | | | | | |
The accompanying notes are an integral part of these financial statements.
| | | | |
| 8 | | Wells Fargo Growth Fund | | Portfolio of investments—January 31, 2018 (unaudited) |
| | | | | | | | | | | | | | | | |
| Security name | | | | | | | | Shares | | | Value | |
|
Financials: 7.14% | |
| | | | |
| Capital Markets: 6.93% | | | | | | | | | | | | | | | | |
CME Group Incorporated | | | | | | | | | | | 504,810 | | | $ | 77,478,239 | |
MarketAxess Holdings Incorporated | | | | | | | | | | | 512,271 | | | | 100,512,693 | |
Morgan Stanley | | | | | | | | | | | 1,141,550 | | | | 64,554,653 | |
Raymond James Financial Incorporated | | | | | | | | | | | 405,440 | | | | 39,080,362 | |
TD Ameritrade Holding Corporation | | | | | | | | | | | 435,610 | | | | 24,302,682 | |
The Charles Schwab Corporation | | | | | | | | | | | 462,500 | | | | 24,669,750 | |
| |
| | | | 330,598,379 | |
| | | | | | | | | | | | | | | | |
| | | | |
| Thrifts & Mortgage Finance: 0.21% | | | | | | | | | | | | | | | | |
LendingTree Incorporated †« | | | | | | | | | | | 27,340 | | | | 10,057,019 | |
| | | | | | | | | | | | | | | | |
| | | | |
Health Care: 8.78% | | | | | | | | | | | | | | | | |
| | | | |
| Biotechnology: 2.83% | | | | | | | | | | | | | | | | |
BioMarin Pharmaceutical Incorporated † | | | | | | | | | | | 185,900 | | | | 16,773,757 | |
Incyte Corporation † | | | | | | | | | | | 23,250 | | | | 2,099,243 | |
Neurocrine Biosciences Incorporated † | | | | | | | | | | | 368,940 | | | | 31,533,302 | |
Portola Pharmaceuticals Incorporated † | | | | | | | | | | | 313,600 | | | | 16,090,816 | |
Spark Therapeutics Incorporated †« | | | | | | | | | | | 98,030 | | | | 5,494,582 | |
Vertex Pharmaceuticals Incorporated † | | | | | | | | | | | 378,080 | | | | 63,090,210 | |
| |
| | | | 135,081,910 | |
| | | | | | | | | | | | | | | | |
| | | | |
| Health Care Equipment & Supplies: 3.61% | | | | | | | | | | | | | | | | |
Boston Scientific Corporation † | | | | | | | | | | | 2,993,100 | | | | 83,687,076 | |
Edwards Lifesciences Corporation † | | | | | | | | | | | 390,070 | | | | 49,375,061 | |
ICU Medical Incorporated † | | | | | | | | | | | 54,480 | | | | 12,473,196 | |
Nevro Corporation † | | | | | | | | | | | 332,310 | | | | 26,671,201 | |
| |
| | | | 172,206,534 | |
| | | | | | | | | | | | | | | | |
| | | | |
| Health Care Technology: 1.72% | | | | | | | | | | | | | | | | |
Veeva Systems Incorporated Class A † | | | | | | | | | | | 1,310,680 | | | | 82,389,345 | |
| | | | | | | | | | | | | | | | |
| | | | |
| Pharmaceuticals: 0.62% | | | | | | | | | | | | | | | | |
Zoetis Incorporated | | | | | | | | | | | 384,660 | | | | 29,514,962 | |
| | | | | | | | | | | | | | | | |
| | | | |
Industrials: 11.76% | | | | | | | | | | | | | | | | |
| | | | |
| Aerospace & Defense: 1.43% | | | | | | | | | | | | | | | | |
The Boeing Company | | | | | | | | | | | 193,210 | | | | 68,467,828 | |
| | | | | | | | | | | | | | | | |
| | | | |
| Air Freight & Logistics: 1.16% | | | | | | | | | | | | | | | | |
FedEx Corporation | | | | | | | | | | | 36,200 | | | | 9,501,776 | |
XPO Logistics Incorporated † | | | | | | | | | | | 484,382 | | | | 45,745,036 | |
| |
| | | | 55,246,812 | |
| | | | | | | | | | | | | | | | |
| | | | |
| Commercial Services & Supplies: 3.03% | | | | | | | | | | | | | | | | |
Copart Incorporated † | | | | | | | | | | | 388,450 | | | | 17,118,992 | |
KAR Auction Services Incorporated | | | | | | | | | | | 918,560 | | | | 50,098,262 | |
Waste Connections Incorporated | | | | | | | | | | | 1,075,625 | | | | 77,251,388 | |
| |
| | | | 144,468,642 | |
| | | | | | | | | | | | | | | | |
| | | | |
| Industrial Conglomerates: 0.10% | | | | | | | | | | | | | | | | |
Roper Industries Incorporated | | | | | | | | | | | 17,200 | | | | 4,826,148 | |
| | | | | | | | | | | | | | | | |
The accompanying notes are an integral part of these financial statements.
| | | | | | |
| Portfolio of investments—January 31, 2018 (unaudited) | | Wells Fargo Growth Fund | | | 9 | |
| | | | | | | | | | | | | | | | |
| Security name | | | | | | | | Shares | | | Value | |
| | | | |
| Machinery: 2.27% | | | | | | | | | | | | | | | | |
Fortive Corporation | | | | | | | | | | | 128,900 | | | $ | 9,798,978 | |
John Bean Technologies Corporation | | | | | | | | | | | 80,344 | | | | 9,139,130 | |
Milacron Holdings Corporation † | | | | | | | | | | | 3,305,935 | | | | 62,713,587 | |
Nordson Corporation | | | | | | | | | | | 56,650 | | | | 8,141,738 | |
REV Group Incorporated | | | | | | | | | | | 632,910 | | | | 18,518,947 | |
| |
| | | | 108,312,380 | |
| | | | | | | | | | | | | | | | |
| | | | |
| Road & Rail: 3.77% | | | | | | | | | | | | | | | | |
CSX Corporation | | | | | | | | | | | 378,870 | | | | 21,508,450 | |
Norfolk Southern Corporation | | | | | | | | | | | 518,340 | | | | 78,207,139 | |
Union Pacific Corporation | | | | | | | | | | | 599,620 | | | | 80,049,270 | |
| |
| | | | 179,764,859 | |
| | | | | | | | | | | | | | | | |
| | | | |
Information Technology: 49.03% | | | | | | | | | | | | | | | | |
| | | | |
| Internet Software & Services: 17.91% | | | | | | | | | | | | | | | | |
2U Incorporated † | | | | | | | | | | | 241,840 | | | | 17,961,457 | |
Alibaba Group Holding Limited ADR †« | | | | | | | | | | | 210,110 | | | | 42,923,372 | |
Alphabet Incorporated Class A † | | | | | | | | | | | 244,765 | | | | 289,366,069 | |
Alphabet Incorporated Class C † | | | | | | | | | | | 23,300 | | | | 27,259,602 | |
Envestnet Incorporated † | | | | | | | | | | | 1,492,010 | | | | 80,195,538 | |
Facebook Incorporated Class A † | | | | | | | | | | | 1,351,800 | | | | 252,637,902 | |
LogMeIn Incorporated | | | | | | | | | | | 621,562 | | | | 78,192,500 | |
MercadoLibre Incorporated | | | | | | | | | | | 76,300 | | | | 29,535,730 | |
MongoDB Incorporated †« | | | | | | | | | | | 382,950 | | | | 10,381,775 | |
New Relic Incorporated † | | | | | | | | | | | 144,360 | | | | 8,622,623 | |
Shopify Incorporated Class A † | | | | | | | | | | | 68,590 | | | | 8,774,033 | |
Twilio Incorporated Class A †« | | | | | | | | | | | 338,750 | | | | 8,888,800 | |
| |
| | | | 854,739,401 | |
| | | | | | | | | | | | | | | | |
| | | | |
| IT Services: 11.30% | | | | | | | | | | | | | | | | |
Euronet Worldwide Incorporated † | | | | | | | | | | | 590,580 | | | | 55,437,745 | |
Global Payments Incorporated | | | | | | | | | | | 607,570 | | | | 67,914,175 | |
MasterCard Incorporated Class A | | | | | | | | | | | 771,780 | | | | 130,430,820 | |
PayPal Holdings Incorporated † | | | | | | | | | | | 1,210,990 | | | | 103,321,667 | |
Square Incorporated Class A †« | | | | | | | | | | | 604,010 | | | | 28,334,109 | |
Switch Incorporated Class A « | | | | | | | | | | | 839,810 | | | | 13,621,718 | |
Visa Incorporated Class A | | | | | | | | | | | 1,130,170 | | | | 140,401,019 | |
| |
| | | | 539,461,253 | |
| | | | | | | | | | | | | | | | |
| | | | |
| Semiconductors & Semiconductor Equipment: 7.32% | | | | | | | | | | | | | | | | |
Broadcom Limited | | | | | | | | | | | 57,420 | | | | 14,241,883 | |
Microchip Technology Incorporated « | | | | | | | | | | | 1,882,530 | | | | 179,254,507 | |
Monolithic Power Systems Incorporated | | | | | | | | | | | 545,900 | | | | 65,027,608 | |
NVIDIA Corporation | | | | | | | | | | | 119,500 | | | | 29,373,100 | |
Texas Instruments Incorporated | | | | | | | | | | | 560,850 | | | | 61,508,420 | |
| |
| | | | 349,405,518 | |
| | | | | | | | | | | | | | | | |
| | | | |
| Software: 10.14% | | | | | | | | | | | | | | | | |
Activision Blizzard Incorporated | | | | | | | | | | | 267,090 | | | | 19,799,382 | |
Adobe Systems Incorporated † | | | | | | | | | | | 174,930 | | | | 34,944,017 | |
BlackLine Incorporated † | | | | | | | | | | | 407,330 | | | | 13,535,576 | |
Electronic Arts Incorporated † | | | | | | | | | | | 220,600 | | | | 28,007,376 | |
The accompanying notes are an integral part of these financial statements.
| | | | |
| 10 | | Wells Fargo Growth Fund | | Portfolio of investments—January 31, 2018 (unaudited) |
| | | | | | | | | | | | | | | | |
| Security name | | | | | | | | Shares | | | Value | |
| | | | |
| Software (continued) | | | | | | | | | | | | | | | | |
ForeScout Technologies Incorporated † | | | | | | | | | | | 55,663 | | | $ | 1,693,268 | |
Microsoft Corporation | | | | | | | | | | | 1,334,490 | | | | 126,789,895 | |
Paycom Software Incorporated † | | | | | | | | | | | 58,200 | | | | 5,333,448 | |
Paylocity Holding Corporation † | | | | | | | | | | | 488,060 | | | | 25,520,657 | |
Proofpoint Incorporated † | | | | | | | | | | | 869,440 | | | | 88,700,269 | |
SailPoint Technologies Holdings Incorporated † | | | | | | | | | | | 246,841 | | | | 4,129,650 | |
salesforce.com Incorporated † | | | | | | | | | | | 352,830 | | | | 40,190,865 | |
ServiceNow Incorporated † | | | | | | | | | | | 179,640 | | | | 26,743,007 | |
Splunk Incorporated † | | | | | | | | | | | 157,200 | | | | 14,520,564 | |
Ultimate Software Group Incorporated † | | | | | | | | | | | 232,260 | | | | 54,091,031 | |
| |
| | | | 483,999,005 | |
| | | | | | | | | | | | | | | | |
| | | | |
| Technology Hardware, Storage & Peripherals: 2.36% | | | | | | | | | | | | | | | | |
Apple Incorporated | | | | | | | | | | | 673,500 | | | | 112,764,105 | |
| | | | | | | | | | | | | | | | |
| | | | |
Materials: 3.49% | | | | | | | | | | | | | | | | |
| | | | |
| Chemicals: 3.49% | | | | | | | | | | | | | | | | |
Ecolab Incorporated | | | | | | | | | | | 167,780 | | | | 23,099,950 | |
PolyOne Corporation | | | | | | | | | | | 1,344,663 | | | | 58,439,054 | |
Praxair Incorporated | | | | | | | | | | | 527,520 | | | | 85,189,205 | |
| |
| | | | 166,728,209 | |
| | | | | | | | | | | | | | | | |
| | | | |
Real Estate: 0.58% | | | | | | | | | | | | | | | | |
| | | | |
| Equity REITs: 0.58% | | | | | | | | | | | | | | | | |
American Tower Corporation | | | | | | | | | | | 76,370 | | | | 11,279,849 | |
Equinix Incorporated | | | | | | | | | | | 18,640 | | | | 8,484,742 | |
SBA Communications Corporation † | | | | | | | | | | | 46,530 | | | | 8,119,485 | |
| |
| | | | 27,884,076 | |
| | | | | | | | | | | | | | | | |
| |
Total Common Stocks (Cost $2,234,202,830) | | | | 4,774,423,567 | |
| | | | | | | | | | | | | | | | |
| | | | |
| | | Yield | | | | | | | | | | |
| Short-Term Investments: 4.66% | | | | | | | | | | | | | | | | |
| | | | |
| Investment Companies: 4.66% | | | | | | | | | | | | | | | | |
Securities Lending Cash Investment LLC (l)(r)(u) | | | 1.60 | % | | | | | | | 196,245,604 | | | | 196,265,229 | |
Wells Fargo Government Money Market Fund Select Class (l)(u) | | | 1.24 | | | | | | | | 26,275,984 | | | | 26,275,984 | |
| | | | |
Total Short-Term Investments (Cost $222,535,072) | | | | | | | | | | | | | | | 222,541,213 | |
| | | | | | | | | | | | | | | | |
| | | | | | | | |
| Total investments in securities (Cost $2,456,737,902) | | | 104.69 | % | | | 4,996,964,780 | |
Other assets and liabilities, net | | | (4.69 | ) | | | (224,024,093 | ) |
| | | | | | | | |
| Total net assets | | | 100.00 | % | | $ | 4,772,940,687 | |
| | | | | | | | |
| † | Non-income-earning security |
| « | All or a portion of this security is on loan. |
| (l) | The issuer of the security is an affiliated person of the Fund as defined in the Investment Company Act of 1940. |
| (r) | The investment is a non-registered investment company purchased with cash collateral received from securities on loan. |
| (u) | The rate represents the 7-day annualized yield at period end. |
The accompanying notes are an integral part of these financial statements.
| | | | | | |
| Portfolio of investments—January 31, 2018 (unaudited) | | Wells Fargo Growth Fund | | | 11 | |
Investments in Affiliates
An affiliated investment is an investment in which the Fund owns at least 5% of the outstanding voting shares of the issuer or as a result of other relationships, such as the Fund and the issuer having the same investment manager. Transactions with issuers that were either affiliated persons of the Fund at the beginning of the period or the end of the period were as follows:
| | | | | | | | | | | | | | | | | | | | | | | | |
| | | Shares, end of period | | | Net realized gains (losses) | | | Net change in unrealized gains (losses) | | | Income from affiliated securities | | | Value, end of period | | | % of net assets | |
Short-Term Investments | | | | | | | | | | | | | | | | | | | | | | | | |
Investment Companies | | | | | | | | | | | | | | | | | | | | | | | | |
Securities Lending Cash Investment LLC | | | 196,245,604 | | | $ | 0 | | | $ | 0 | | | $ | 365,168 | | | $ | 196,265,229 | | | | | |
Wells Fargo Government Money Market Fund Select Class | | | 26,275,984 | | | | 0 | | | | 0 | | | | 161,021 | | | | 26,275,984 | | | | | |
| | | | | | |
| | | | | | | | | | | | | | | | | | | 222,541,213 | | | | 4.66 | % |
| | | | | | | | | | | | | | | | | | | | | | | | |
Securities no longer affiliated at the end of the period | | | | | | | (10,519,753 | ) | | | 4,210,514 | | | | 0 | | | | | | | | | |
| | | | | | | | | | | | | | | | | | | | | | | | |
| | | | | | $ | (10,519,753 | ) | | $ | 4,210,514 | | | $ | 526,189 | | | $ | 222,541,213 | | | | 4.66 | % |
| | | | | | | | | | | | | | | | | | | | | | | | |
For the six months ended January 31, 2018, investment activity in affiliates of the Fund was as follows:
| | | | | | | | | | | | | | | | |
| | | Shares, beginning of period | | | Shares purchased | | | Shares sold | | | Shares, end of period | |
Common Stock | | | | | | | | | | | | | | | | |
Consumer Discretionary | | | | | | | | | | | | | | | | |
Hotels, Restaurants & Leisure | | | | | | | | | | | | | | | | |
The Habit Restaurants Incorporated Class A* | | | 1,735,600 | | | | 51,000 | | | | 968,715 | | | | 817,885 | |
| | | | |
Short-Term Investments | | | | | | | | | | | | | | | | |
Investment Companies | | | | | | | | | | | | | | | | |
Securities Lending Cash Investment LLC | | | 92,492,281 | | | | 859,738,520 | | | | 755,985,197 | | | | 196,245,604 | |
Wells Fargo Government Money Market Fund Select Class | | | 36,046,917 | | | | 538,142,335 | | | | 547,913,268 | | | | 26,275,984 | |
| | * | No longer an affiliate of the Fund at the end of period |
The accompanying notes are an integral part of these financial statements.
| | | | |
| 12 | | Wells Fargo Growth Fund | | Statement of assets and liabilities—January 31, 2018 (unaudited) |
| | | | |
| | | | |
| |
Assets | | | | |
Investments in unaffiliated securities (including $192,050,215 of securities loaned), at value (cost $2,234,202,830) | | $ | 4,774,423,567 | |
Investments in affiliated securities, at value (cost $222,535,072) | | | 222,541,213 | |
Receivable for investments sold | | | 3,060,071 | |
Receivable for Fund shares sold | | | 4,395,615 | |
Receivable for dividends | | | 946,270 | |
Receivable for securities lending income | | | 61,712 | |
Prepaid expenses and other assets | | | 18,952 | |
| | | | |
Total assets | | | 5,005,447,400 | |
| | | | |
| |
Liabilities | | | | |
Payable upon receipt of securities loaned | | | 196,254,674 | |
Payable for Fund shares redeemed | | | 22,224,237 | |
Payable for investments purchased | | | 9,499,693 | |
Management fee payable | | | 2,545,104 | |
Administration fees payable | | | 660,110 | |
Distribution fee payable | | | 123,214 | |
Trustees’ fees and expenses payable | | | 2,572 | |
Accrued expenses and other liabilities | | | 1,197,109 | |
| | | | |
Total liabilities | | | 232,506,713 | |
| | | | |
Total net assets | | $ | 4,772,940,687 | |
| | | | |
| |
NET ASSETS CONSIST OF | | | | |
Paid-in capital | | $ | 2,031,557,313 | |
Accumulated net investment loss | | | (6,408,635 | ) |
Accumulated net realized gains on investments | | | 207,565,131 | |
Net unrealized gains on investments | | | 2,540,226,878 | |
| | | | |
Total net assets | | $ | 4,772,940,687 | |
| | | | |
| |
COMPUTATION OF NET ASSET VALUE AND OFFERING PRICE PER SHARE | | | | |
Net assets – Class A | | $ | 2,132,512,710 | |
Shares outstanding – Class A1 | | | 58,545,683 | |
Net asset value per share – Class A | | | $36.42 | |
Maximum offering price per share – Class A2 | | | $38.64 | |
Net assets – Class C | | $ | 196,319,390 | |
Shares outstanding – Class C1 | | | 6,847,404 | |
Net asset value per share – Class C | | | $28.67 | |
Net assets – Class R6 | | $ | 203,038,905 | |
Shares outstanding – Class R61 | | | 4,545,619 | |
Net asset value per share – Class R6 | | | $44.67 | |
Net assets – Administrator Class | | $ | 583,810,798 | |
Shares outstanding – Administrator Class1 | | | 14,134,982 | |
Net asset value per share – Administrator Class | | | $41.30 | |
Net assets – Institutional Class | | $ | 1,657,258,884 | |
Shares outstanding – Institutional Class1 | | | 37,176,446 | |
Net asset value per share – Institutional Class | | | $44.58 | |
| 1 | The Fund has an unlimited number of authorized shares. |
| 2 | Maximum offering price is computed as 100/94.25 of net asset value. On investments of $50,000 or more, the offering price is reduced. |
The accompanying notes are an integral part of these financial statements.
| | | | | | |
| Statement of operations—six months ended January 31, 2018 (unaudited) | | Wells Fargo Growth Fund | | | 13 | |
| | | | |
| | | | |
| |
Investment income | | | | |
Dividends (net of foreign withholding taxes of $46,255) | | $ | 16,201,082 | |
Income from affiliated securities | | | 526,189 | |
| | | | |
Total investment income | | | 16,727,271 | |
| | | | |
| |
Expenses | | | | |
Management fee | | | 16,056,563 | |
Administration fees | | | | |
Class A | | | 2,117,142 | |
Class C | | | 210,242 | |
Class R6 | | | 12,405 | |
Administrator Class | | | 398,503 | |
Institutional Class | | | 1,091,442 | |
Shareholder servicing fees | | | | |
Class A | | | 2,520,407 | |
Class C | | | 250,289 | |
Administrator Class | | | 766,144 | |
Distribution fee | | | | |
Class C | | | 750,865 | |
Custody and accounting fees | | | 79,293 | |
Professional fees | | | 25,686 | |
Registration fees | | | 92,618 | |
Shareholder report expenses | | | 156,273 | |
Trustees’ fees and expenses | | | 12,610 | |
Other fees and expenses | | | 77,551 | |
| | | | |
Total expenses | | | 24,618,033 | |
Less: Fee waivers and/or expense reimbursements | | | (1,482,127 | ) |
| | | | |
Net expenses | | | 23,135,906 | |
| | | | |
Net investment loss | | | (6,408,635 | ) |
| | | | |
| |
REALIZED AND UNREALIZED GAINS (LOSSES) ON INVESTMENTS | | | | |
| |
Net realized gains (losses) on: | | | | |
Unaffiliated securities | | | 412,401,662 | |
Affiliated securities | | | (10,519,753 | ) |
| | | | |
Net realized gains on investments | | | 401,881,909 | |
| | | | |
| |
Net change in unrealized gains (losses) on: | | | | |
Unaffiliated securities | | | 448,352,224 | |
Affiiliated securities | | | 4,210,514 | |
| | | | |
Net change in unrealized gains (losses) on investments | | | 452,562,738 | |
| | | | |
Net realized and unrealized gains (losses) on investments | | | 854,444,647 | |
| | | | |
Net increase in net assets resulting from operations | | $ | 848,036,012 | |
| | | | |
The accompanying notes are an integral part of these financial statements.
| | | | |
| 14 | | Wells Fargo Growth Fund | | Statement of changes in net assets |
| | | | | | | | | | | | | | | | |
| | | Six months ended
January 31, 2018
(unaudited) | | | Year ended
July 31, 2017 | |
| | | | |
Operations | | | | | | | | | | | | | | | | |
Net investment loss | | | | | | $ | (6,408,635 | ) | | | | | | $ | (17,306,908 | ) |
Net realized gains on investments | | | | | | | 401,881,909 | | | | | | | | 1,277,104,391 | |
Net change in unrealized gains (losses) on investments | | | | | | | 452,562,738 | | | | | | | | (595,860,372 | ) |
| | | | |
Net increase in net assets resulting from operations | | | | | | | 848,036,012 | | | | | | | | 663,937,111 | |
| | | | |
| | | | |
Distributions to shareholders from | | | | | | | | | | | | | | | | |
Net realized gains | | | | | | | | | | | | | | | | |
Class A | | | | | | | (505,431,285 | ) | | | | | | | (385,155,921 | ) |
Class C | | | | | | | (57,934,182 | ) | | | | | | | (51,825,133 | ) |
Class R6 | | | | | | | (16,966,960 | ) | | | | | | | (3,453,520 | ) |
Administrator Class | | | | | | | (138,040,210 | ) | | | | | | | (132,054,015 | ) |
Institutional Class | | | | | | | (379,819,630 | ) | | | | | | | (317,034,333 | ) |
| | | | |
Total distributions to shareholders | | | | | | | (1,098,192,267 | ) | | | | | | | (889,522,922 | ) |
| | | | |
| | | | |
Capital share transactions | | | Shares | | | | | | | | Shares | | | | | |
Proceeds from shares sold | | | | | | | | | | | | | | | | |
Class A | | | 1,327,584 | | | | 50,301,629 | | | | 2,480,636 | | | | 94,368,185 | |
Class C | | | 395,896 | | | | 10,803,460 | | | | 652,761 | | | | 19,766,572 | |
Class R6 | | | 3,276,273 | | | | 144,360,942 | | | | 1,123,887 | | | | 49,275,787 | |
Administrator Class | | | 906,702 | | | | 39,143,193 | | | | 2,602,562 | | | | 109,976,524 | |
Institutional Class | | | 5,156,448 | | | | 251,453,972 | | | | 12,846,486 | | | | 573,284,219 | |
| | | | |
| | | | | | | 496,063,196 | | | | | | | | 846,671,287 | |
| | | | |
Reinvestment of distributions | | | | | | | | | | | | | | | | |
Class A | | | 14,511,944 | | | | 482,812,377 | | | | 10,734,969 | | | | 367,135,939 | |
Class C | | | 1,880,250 | | | | 49,281,340 | | | | 1,346,264 | | | | 39,028,199 | |
Class R6 | | | 415,977 | | | | 16,959,366 | | | | 86,772 | | | | 3,453,520 | |
Administrator Class | | | 3,626,546 | | | | 136,757,066 | | | | 3,489,159 | | | | 131,017,902 | |
Institutional Class | | | 9,008,188 | | | | 366,543,153 | | | | 7,686,540 | | | | 305,616,849 | |
| | | | |
| | | | | | | 1,052,353,302 | | | | | | | | 846,252,409 | |
| | | | |
Payment for shares redeemed | | | | | | | | | | | | | | | | |
Class A | | | (5,595,721 | ) | | | (218,229,240 | ) | | | (26,011,523 | ) | | | (994,860,639 | ) |
Class C | | | (1,466,475 | ) | | | (46,868,905 | ) | | | (4,621,153 | ) | | | (150,552,988 | ) |
Class R6 | | | (195,848 | ) | | | (8,897,875 | ) | | | (806,700 | ) | | | (36,722,935 | ) |
Administrator Class | | | (4,767,833 | ) | | | (203,077,191 | ) | | | (25,194,674 | ) | | | (1,090,486,678 | ) |
Institutional Class | | | (12,161,372 | ) | | | (547,569,142 | ) | | | (35,457,129 | ) | | | (1,556,706,417 | ) |
| | | | |
| | | | | | | (1,024,642,353 | ) | | | | | | | (3,829,329,657 | ) |
| | | | |
Net increase (decrease) in net assets resulting from capital share transactions | | | | | | | 523,774,145 | | | | | | | | (2,136,405,961 | ) |
| | | | |
Total increase (decrease) in net assets | | | | | | | 273,617,890 | | | | | | | | (2,361,991,772 | ) |
| | | | |
| | | | |
Net assets | | | | | | | | | | | | | | | | |
Beginning of period | | | | | | | 4,499,322,797 | | | | | | | | 6,861,314,569 | |
| | | | |
End of period | | | | | | $ | 4,772,940,687 | | | | | | | $ | 4,499,322,797 | |
| | | | |
Undistributed (accumulated) net investment income (loss) | | | | | | $ | (6,408,635 | ) | | | | | | $ | 0 | |
| | | | |
The accompanying notes are an integral part of these financial statements.
| | | | | | |
| Financial highlights | | Wells Fargo Growth Fund | | | 15 | |
(For a share outstanding throughout each period)
| | | | | | | | | | | | | | | | | | | | | | | | |
| | | Six months ended
January 31, 2018 (unaudited) | | | Year ended July 31 | |
| CLASS A | | | 2017 | | | 2016 | | | 2015 | | | 2014 | | | 2013 | |
Net asset value, beginning of period | | | $40.38 | | | | $42.28 | | | | $49.50 | | | | $49.99 | | | | $46.74 | | | | $37.85 | |
Net investment loss | | | (0.09 | )1 | | | (0.19 | )1 | | | (0.20 | )1 | | | (0.29 | )1 | | | (0.32 | )1 | | | (0.17 | )1 |
Net realized and unrealized gains (losses) on investments | | | 7.21 | | | | 5.61 | | | | (0.99 | ) | | | 7.03 | | | | 5.34 | | | | 9.06 | |
| | | | | | | | | | | | | | | | | | | | | | | | |
Total from investment operations | | | 7.12 | | | | 5.42 | | | | (1.19 | ) | | | 6.74 | | | | 5.02 | | | | 8.89 | |
Distributions to shareholders from | | | | | | | | | | | | | | | | | | | | | | | | |
Net realized gains | | | (11.08 | ) | | | (7.32 | ) | | | (6.03 | ) | | | (7.23 | ) | | | (1.77 | ) | | | 0.00 | |
Net asset value, end of period | | | $36.42 | | | | $40.38 | | | | $42.28 | | | | $49.50 | | | | $49.99 | | | | $46.74 | |
Total return2 | | | 20.23 | % | | | 15.95 | % | | | (1.69 | )% | | | 15.01 | % | | | 10.77 | % | | | 23.49 | % |
Ratios to average net assets (annualized) | | | | | | | | | | | | | | | | | | | | | | | | |
Gross expenses | | | 1.18 | % | | | 1.17 | % | | | 1.15 | % | | | 1.18 | % | | | 1.18 | % | | | 1.19 | % |
Net expenses | | | 1.16 | % | | | 1.16 | % | | | 1.14 | % | | | 1.18 | % | | | 1.18 | % | | | 1.19 | % |
Net investment loss | | | (0.43 | )% | | | (0.49 | )% | | | (0.49 | )% | | | (0.59 | )% | | | (0.64 | )% | | | (0.41 | )% |
Supplemental data | | | | | | | | | | | | | | | | | | | | | | | | |
Portfolio turnover rate | | | 16 | % | | | 42 | % | | | 38 | % | | | 35 | % | | | 42 | % | | | 38 | % |
Net assets, end of period (000s omitted) | | | $2,132,513 | | | | $1,950,551 | | | | $2,582,955 | | | | $1,465,643 | | | | $2,047,410 | | | | $2,464,533 | |
| 1 | Calculated based upon average shares outstanding |
| 2 | Total return calculations do not include any sales charges. Returns for periods of less than one year are not annualized. |
The accompanying notes are an integral part of these financial statements.
| | | | |
| 16 | | Wells Fargo Growth Fund | | Financial highlights |
(For a share outstanding throughout each period)
| | | | | | | | | | | | | | | | | | | | | | | | |
| | | Six months ended
January 31, 2018
(unaudited) | | | Year ended July 31 | |
| CLASS C | | | 2017 | | | 2016 | | | 2015 | | | 2014 | | | 2013 | |
Net asset value, beginning of period | | | $34.05 | | | | $37.07 | | | | $44.51 | | | | $45.95 | | | | $43.41 | | | | $35.42 | |
Net investment loss | | | (0.20 | )1 | | | (0.41 | )1 | | | (0.46 | )1 | | | (0.60 | )1 | | | (0.64 | )1 | | | (0.45 | )1 |
Net realized and unrealized gains (losses) on investments | | | 5.90 | | | | 4.71 | | | | (0.95 | ) | | | 6.39 | | | | 4.95 | | | | 8.44 | |
| | | | | | | | | | | | | | | | | | | | | | | | |
Total from investment operations | | | 5.70 | | | | 4.30 | | | | (1.41 | ) | | | 5.79 | | | | 4.31 | | | | 7.99 | |
Distributions to shareholders from | | | | | | | | | | | | | | | | | | | | | | | | |
Net realized gains | | | (11.08 | ) | | | (7.32 | ) | | | (6.03 | ) | | | (7.23 | ) | | | (1.77 | ) | | | 0.00 | |
Net asset value, end of period | | | $28.67 | | | | $34.05 | | | | $37.07 | | | | $44.51 | | | | $45.95 | | | | $43.41 | |
Total return2 | | | 19.80 | % | | | 15.05 | % | | | (2.44 | )% | | | 14.16 | % | | | 9.96 | % | | | 22.56 | % |
Ratios to average net assets (annualized) | | | | | | | | | | | | | | | | | | | | | | | | |
Gross expenses | | | 1.93 | % | | | 1.92 | % | | | 1.90 | % | | | 1.93 | % | | | 1.93 | % | | | 1.94 | % |
Net expenses | | | 1.91 | % | | | 1.91 | % | | | 1.89 | % | | | 1.93 | % | | | 1.93 | % | | | 1.94 | % |
Net investment loss | | | (1.18 | )% | | | (1.23 | )% | | | (1.24 | )% | | | (1.34 | )% | | | (1.39 | )% | | | (1.16 | )% |
Supplemental data | | | | | | | | | | | | | | | | | | | | | | | | |
Portfolio turnover rate | | | 16 | % | | | 42 | % | | | 38 | % | | | 35 | % | | | 42 | % | | | 38 | % |
Net assets, end of period (000s omitted) | | | $196,319 | | | | $205,607 | | | | $321,032 | | | | $465,833 | | | | $560,481 | | | | $589,402 | |
| 1 | Calculated based upon average shares outstanding |
| 2 | Total return calculations do not include any sales charges. Returns for periods of less than one year are not annualized. |
The accompanying notes are an integral part of these financial statements.
| | | | | | |
| Financial highlights | | Wells Fargo Growth Fund | | | 17 | |
(For a share outstanding throughout each period)
| | | | | | | | | | | | |
| | | Six months ended
January 31, 2018 (unaudited) | | | Year ended July 31 | |
| CLASS R6 | | | 2017 | | | 20161 | |
Net asset value, beginning of period | | | $47.13 | | | | $47.90 | | | | $48.97 | |
Net investment loss | | | (0.01 | )2 | | | (0.02 | )2 | | | (0.02 | ) |
Net realized and unrealized gains (losses) on investments | | | 8.63 | | | | 6.57 | | | | 4.98 | |
| | | | | | | | | | | | |
Total from investment operations | | | 8.62 | | | | 6.55 | | | | 4.96 | |
Distributions to shareholders from | | | | | | | | | | | | |
Net realized gains | | | (11.08 | ) | | | (7.32 | ) | | | (6.03 | ) |
Net asset value, end of period | | | $44.67 | | | | $47.13 | | | | $47.90 | |
Total return3 | | | 20.54 | % | | | 16.49 | % | | | 10.89 | % |
Ratios to average net assets (annualized) | | | | | | | | | | | | |
Gross expenses | | | 0.75 | % | | | 0.74 | % | | | 0.74 | % |
Net expenses | | | 0.70 | % | | | 0.70 | % | | | 0.70 | % |
Net investment loss | | | (0.04 | )% | | | (0.05 | )% | | | (0.23 | )% |
Supplemental data | | | | | | | | | | | | |
Portfolio turnover rate | | | 16 | % | | | 42 | % | | | 38 | % |
Net assets, end of period (000s omitted) | | | $203,039 | | | | $49,454 | | | | $30,906 | |
| 1 | For the period from September 30, 2015 (commencement of class operations) to July 31, 2016 |
| 2 | Calculated based upon average shares outstanding |
| 3 | Returns for periods of less than one year are not annualized. |
The accompanying notes are an integral part of these financial statements.
| | | | |
| 18 | | Wells Fargo Growth Fund | | Financial highlights |
(For a share outstanding throughout each period)
| | | | | | | | | | | | | | | | | | | | | | | | |
| | | Six months ended
January 31, 2018
(unaudited) | | | Year ended July 31 | |
| ADMINISTRATOR CLASS | | | 2017 | | | 2016 | | | 2015 | | | 2014 | | | 2013 | |
Net asset value, beginning of period | | | $44.40 | | | | $45.66 | | | | $52.86 | | | | $52.80 | | | | $49.16 | | | | $39.72 | |
Net investment loss | | | (0.06 | ) | | | (0.11 | )1 | | | (0.14 | )1 | | | (0.20 | )1 | | | (0.23 | ) | | | (0.08 | )1 |
Net realized and unrealized gains (losses) on investments | | | 8.04 | | | | 6.17 | | | | (1.03 | ) | | | 7.49 | | | | 5.64 | | | | 9.52 | |
| | | | | | | | | | | | | | | | | | | | | | | | |
Total from investment operations | | | 7.98 | | | | 6.06 | | | | (1.17 | ) | | | 7.29 | | | | 5.41 | | | | 9.44 | |
Distributions to shareholders from | | | | | | | | | | | | | | | | | | | | | | | | |
Net realized gains | | | (11.08 | ) | | | (7.32 | ) | | | (6.03 | ) | | | (7.23 | ) | | | (1.77 | ) | | | 0.00 | |
Net asset value, end of period | | | $41.30 | | | | $44.40 | | | | $45.66 | | | | $52.86 | | | | $52.80 | | | | $49.16 | |
Total return2 | | | 20.35 | % | | | 16.20 | % | | | (1.53 | )% | | | 15.28 | % | | | 11.04 | % | | | 23.77 | % |
Ratios to average net assets (annualized) | | | | | | | | | | | | | | | | | | | | | | | | |
Gross expenses | | | 1.10 | % | | | 1.09 | % | | | 1.07 | % | | | 1.02 | % | | | 1.02 | % | | | 1.03 | % |
Net expenses | | | 0.96 | % | | | 0.96 | % | | | 0.96 | % | | | 0.96 | % | | | 0.96 | % | | | 0.96 | % |
Net investment loss | | | (0.23 | )% | | | (0.27 | )% | | | (0.31 | )% | | | (0.37 | )% | | | (0.42 | )% | | | (0.18 | )% |
Supplemental data | | | | | | | | | | | | | | | | | | | | | | | | |
Portfolio turnover rate | | | 16 | % | | | 42 | % | | | 38 | % | | | 35 | % | | | 42 | % | | | 38 | % |
Net assets, end of period (000s omitted) | | | $583,811 | | | | $637,987 | | | | $1,528,288 | | | | $2,349,359 | | | | $3,359,480 | | | | $3,309,683 | |
| 1 | Calculated based upon average shares outstanding |
| 2 | Returns for periods of less than one year are not annualized. |
The accompanying notes are an integral part of these financial statements.
| | | | | | |
| Financial highlights | | Wells Fargo Growth Fund | | | 19 | |
(For a share outstanding throughout each period)
| | | | | | | | | | | | | | | | | | | | | | | | |
| | | Six months ended
January 31, 2018
(unaudited) | | | Year ended July 31 | |
| INSTITUTIONAL CLASS | | | 2017 | | | 2016 | | | 2015 | | | 2014 | | | 2013 | |
Net asset value, beginning of period | | | $47.07 | | | | $47.87 | | | | $54.99 | | | | $54.54 | | | | $50.63 | | | | $40.83 | |
Net investment income (loss) | | | (0.00 | )1,2 | | | (0.04 | )1 | | | (0.05 | )1 | | | (0.09 | )1 | | | (0.13 | ) | | | 0.01 | 1 |
Net realized and unrealized gains (losses) on investments | | | 8.59 | | | | 6.56 | | | | (1.04 | ) | | | 7.77 | | | | 5.81 | | | | 9.79 | |
| | | | | | | | | | | | | | | | | | | | | | | | |
Total from investment operations | | | 8.59 | | | | 6.52 | | | | (1.09 | ) | | | 7.68 | | | | 5.68 | | | | 9.80 | |
Distributions to shareholders from | | | | | | | | | | | | | | | | | | | | | | | | |
Net realized gains | | | (11.08 | ) | | | (7.32 | ) | | | (6.03 | ) | | | (7.23 | ) | | | (1.77 | ) | | | 0.00 | |
Net asset value, end of period | | | $44.58 | | | | $47.07 | | | | $47.87 | | | | $54.99 | | | | $54.54 | | | | $50.63 | |
Total return3 | | | 20.50 | % | | | 16.44 | % | | | (1.31 | )% | | | 15.53 | % | | | 11.26 | % | | | 24.03 | % |
Ratios to average net assets (annualized) | | | | | | | | | | | | | | | | | | | | | | | | |
Gross expenses | | | 0.85 | % | | | 0.84 | % | | | 0.82 | % | | | 0.76 | % | | | 0.75 | % | | | 0.76 | % |
Net expenses | | | 0.75 | % | | | 0.75 | % | | | 0.75 | % | | | 0.75 | % | | | 0.75 | % | | | 0.75 | % |
Net investment income (loss) | | | (0.02 | )% | | | (0.08 | )% | | | (0.10 | )% | | | (0.17 | )% | | | (0.21 | )% | | | 0.02 | % |
Supplemental data | | | | | | | | | | | | | | | | | | | | | | | | |
Portfolio turnover rate | | | 16 | % | | | 42 | % | | | 38 | % | | | 35 | % | | | 42 | % | | | 38 | % |
Net assets, end of period (000s omitted) | | | $1,657,259 | | | | $1,655,724 | | | | $2,398,134 | | | | $3,863,196 | | | | $2,975,721 | | | | $2,649,095 | |
| 1 | Calculated based upon average shares outstanding |
| 2 | Amount is less than $0.005. |
| 3 | Returns for periods of less than one year are not annualized. |
The accompanying notes are an integral part of these financial statements.
| | | | |
| 20 | | Wells Fargo Growth Fund | | Notes to financial statements (unaudited) |
1. ORGANIZATION
Wells Fargo Funds Trust (the “Trust”), a Delaware statutory trust organized on March 10, 1999, is an open-end management investment company registered under the Investment Company Act of 1940, as amended (the “1940 Act”). As an investment company, the Trust follows the accounting and reporting guidance in Financial Accounting Standards Board Accounting Standards Codification Topic 946, Financial Services – Investment Companies. These financial statements report on the Wells Fargo Growth Fund (the “Fund”) which is a diversified series of the Trust.
2. SIGNIFICANT ACCOUNTING POLICIES
The following significant accounting policies, which are consistently followed in the preparation of the financial statements of the Fund, are in conformity with U.S. generally accepted accounting principles which require management to make estimates and assumptions that affect the reported amounts of assets and liabilities, disclosure of contingent assets and liabilities at the date of the financial statements, and the reported amounts of revenues and expenses during the reporting period. Actual results could differ from those estimates.
Securities valuation
All investments are valued each business day as of the close of regular trading on the New York Stock Exchange (generally 4 p.m. Eastern Time), although the Fund may deviate from this calculation time under unusual or unexpected circumstances.
Equity securities that are listed on a foreign or domestic exchange or market are valued at the official closing price or, if none, the last sales price. If no sale occurs on the principal exchange or market that day, a fair value price will be determined in accordance with the Fund’s Valuation Procedures.
Investments in registered open-end investment companies are valued at net asset value. Interests in non-registered investment companies that are redeemable at net asset value are fair valued normally at net asset value.
Investments which are not valued using any of the methods discussed above are valued at their fair value, as determined in good faith by the Board of Trustees of the Fund. The Board of Trustees has established a Valuation Committee comprised of the Trustees and has delegated to it the authority to take any actions regarding the valuation of portfolio securities that the Valuation Committee deems necessary or appropriate, including determining the fair value of portfolio securities, unless the determination has been delegated to the Wells Fargo Asset Management Pricing Committee of Wells Fargo Funds Management, LLC (“Funds Management”). The Board of Trustees retains the authority to make or ratify any valuation decisions or approve any changes to the Valuation Procedures as it deems appropriate. On a quarterly basis, the Board of Trustees receives reports on any valuation actions taken by the Valuation Committee or the Wells Fargo Asset Management Pricing Committee which may include items for ratification.
Valuations of fair valued securities are compared to the next actual sales price when available, or other appropriate market values, to assess the continued appropriateness of the fair valuation methodologies used. These securities are fair valued on a day-to-day basis, taking into consideration changes to appropriate market information and any significant changes to the inputs considered in the valuation process until there is a readily available price provided on an exchange or by an independent pricing service. Valuations received from an independent pricing service or independent broker-dealer quotes are periodically validated by comparisons to most recent trades and valuations provided by other independent pricing services in addition to the review of prices by the manager and/or subadviser. Unobservable inputs used in determining fair valuations are identified based on the type of security, taking into consideration factors utilized by market participants in valuing the investment, knowledge about the issuer and the current market environment.
Security loans
The Fund may lend its securities from time to time in order to earn additional income in the form of fees or interest on securities received as collateral or the investment of any cash received as collateral. The Fund continues to receive interest or dividends on the securities loaned. The Fund receives collateral in the form of cash or securities with a value at least equal to the value of the securities on loan. The value of the loaned securities is determined at the close of each business day and any additional required collateral is delivered to the Fund on the next business day. In a securities lending transaction, the net asset value of the Fund will be affected by an increase or decrease in the value of the securities loaned and by an increase or decrease in the value of the instrument in which collateral is invested. The amount of securities lending activity undertaken by the Fund fluctuates from time to time. In the event of default or bankruptcy by the borrower, the Fund may be prevented from recovering the loaned securities or gaining access to the collateral or may experience delays or costs in doing so. In addition, the investment of any cash collateral received may lose all or part of its value. The Fund has the right under the lending agreement to recover the securities from the borrower on demand.
| | | | | | |
| Notes to financial statements (unaudited) | | Wells Fargo Growth Fund | | | 21 | |
The Fund lends its securities through an unaffiliated securities lending agent. Cash collateral received in connection with its securities lending transactions is invested in Securities Lending Cash Investments, LLC (the “Securities Lending Fund”). The Securities Lending Fund is exempt from registration under Section 3(c)(7) of the 1940 Act and is managed by Funds Management and is subadvised by Wells Capital Management Incorporated (“WellsCap”), an affiliate of Funds Management and an indirect wholly owned subsidiary of Wells Fargo & Company (“Wells Fargo”). Funds Management receives an advisory fee starting at 0.05% and declining to 0.01% as the average daily net assets of the Securities Lending Fund increase. All of the fees received by Funds Management are paid to WellsCap for its services as subadviser. The Securities Lending Fund seeks to provide a positive return compared to the daily Fed Funds Open Rate by investing in high-quality, U.S. dollar-denominated short-term money market instruments. Securities Lending Fund investments are valued at the evaluated bid price provided by an independent pricing service. Income earned from investment in the Securities Lending Fund is included in income from affiliated securities on the Statement of Operations.
Security transactions and income recognition
Securities transactions are recorded on a trade date basis. Realized gains or losses are recorded on the basis of identified cost.
Dividend income is recognized on the ex-dividend date. Dividend income is recorded net of foreign taxes withheld where recovery of such taxes is not assured.
Distributions to shareholders
Distributions to shareholders from net investment income and net realized gains, if any, are recorded on the ex-dividend date. Such distributions are determined in accordance with income tax regulations and may differ from U.S. generally accepted accounting principles. Dividend sources are estimated at the time of declaration. The tax character of distributions is determined as of the Fund’s fiscal year end. Therefore, a portion of the Fund’s distributions made prior to the Fund’s fiscal year end may be categorized as a tax return of capital.
Federal and other taxes
The Fund intends to continue to qualify as a regulated investment company by distributing substantially all of its investment company taxable income and any net realized capital gains (after reduction for capital loss carryforwards) sufficient to relieve it from all, or substantially all, federal income taxes. Accordingly, no provision for federal income taxes was required.
The Fund’s income and federal excise tax returns and all financial records supporting those returns for the prior three fiscal years are subject to examination by the federal and Delaware revenue authorities. Management has analyzed the Fund’s tax positions taken on federal, state, and foreign tax returns for all open tax years and does not believe that there are any uncertain tax positions that require recognition of a tax liability.
As of January 31, 2018, the aggregate cost of all investments for federal income tax purposes was $2,464,254,295 and the unrealized gains (losses) consisted of:
| | | | |
Gross unrealized gains | | $ | 2,552,698,575 | |
Gross unrealized losses | | | (19,988,090 | ) |
Net unrealized gains | | $ | 2,532,710,485 | |
Class allocations
The separate classes of shares offered by the Fund differ principally in applicable sales charges, distribution, shareholder servicing, and administration fees. Class specific expenses are charged directly to that share class. Investment income, common expenses, and realized and unrealized gains (losses) on investments are allocated daily to each class of shares based on the relative proportion of net assets of each class.
3. FAIR VALUATION MEASUREMENTS
Fair value measurements of investments are determined within a framework that has established a fair value hierarchy based upon the various data inputs utilized in determining the value of the Fund’s investments. The three-level hierarchy gives the highest priority to unadjusted quoted prices in active markets for identical assets or liabilities (Level 1) and the lowest priority to unobservable inputs (Level 3). The Fund’s investments are classified within the fair value hierarchy based on the lowest level of input that is significant to the fair value measurement. The inputs are summarized into three broad levels as follows:
| | | | |
| 22 | | Wells Fargo Growth Fund | | Notes to financial statements (unaudited) |
| ∎ | | Level 1 – quoted prices in active markets for identical securities |
| ∎ | | Level 2 – other significant observable inputs (including quoted prices for similar securities, interest rates, prepayment speeds, credit risk, etc.) |
| ∎ | | Level 3 – significant unobservable inputs (including the Fund’s own assumptions in determining the fair value of investments) |
The inputs or methodologies used for valuing investments in securities are not necessarily an indication of the risk associated with investing in those securities.
The following is a summary of the inputs used in valuing the Fund’s assets and liabilities as of January 31, 2018:
| | | | | | | | | | | | | | | | |
| | | Quoted prices
(Level 1) | | | Other significant
observable inputs (Level 2) | | | Significant
unobservable inputs (Level 3) | | | Total | |
Assets | | | | | | | | | | | | | | | | |
Investments in: | | | | | | | | | | | | | | | | |
| | | | |
Common stocks | | | | | | | | | | | | | | | | |
Consumer discretionary | | $ | 667,829,827 | | | $ | 0 | | | $ | 0 | | | $ | 667,829,827 | |
Consumer staples | | | 181,195,147 | | | | 0 | | | | 0 | | | | 181,195,147 | |
Energy | | | 69,482,208 | | | | 0 | | | | 0 | | | | 69,482,208 | |
Financials | | | 340,655,398 | | | | 0 | | | | 0 | | | | 340,655,398 | |
Health care | | | 419,192,751 | | | | 0 | | | | 0 | | | | 419,192,751 | |
Industrials | | | 561,086,669 | | | | 0 | | | | 0 | | | | 561,086,669 | |
Information technology | | | 2,340,369,282 | | | | 0 | | | | 0 | | | | 2,340,369,282 | |
Materials | | | 166,728,209 | | | | 0 | | | | 0 | | | | 166,728,209 | |
Real estate | | | 27,884,076 | | | | 0 | | | | 0 | | | | 27,884,076 | |
| | | | |
Short-term investments | | | | | | | | | | | | | | | | |
Investment companies | | | 26,275,984 | | | | 0 | | | | 0 | | | | 26,275,984 | |
Investments measured at net asset value* | | | | | | | | | | | | | | | 196,265,229 | |
Total assets | | $ | 4,800,699,551 | | | $ | 0 | | | $ | 0 | | | $ | 4,996,964,780 | |
| * | Investments that are measured at fair value using the net asset value per share (or its equivalent) as a practical expedient have not been categorized in the fair value hierarchy. The fair value amount presented in the table is intended to permit reconciliation of the fair value hierarchy to the amounts presented in the Statement of Assets and Liabilities. The Fund’s investment in Securities Lending Cash Investments, LLC valued at $196,265,229 does not have a redemption period notice, can be redeemed daily and does not have any unfunded commitments. |
The Fund recognizes transfers between levels within the fair value hierarchy at the end of the reporting period. At January 31, 2018, the Fund did not have any transfers into/out of Level 1, Level 2, or Level 3.
4. TRANSACTIONS WITH AFFILIATES
Management fee
Funds Management an indirect wholly owned subsidiary of Wells Fargo, is the manager of the Fund and provides advisory and fund-level administrative services under an investment management agreement. Under the investment management agreement, Funds Management is responsible for, among other services, implementing the investment objectives and strategies of the Fund, supervising the subadviser, providing fund-level administrative services in connection with the Fund’s operations, and providing any other fund-level administrative services reasonably necessary for the operation of the Fund. As compensation for its services under the investment management agreement, Funds Management is entitled to receive an annual management fee starting at 0.80% and declining to 0.555% as the average daily net assets of the Fund increase. For the six months ended January 31, 2018, the management fee was equivalent to an annual rate of 0.70% of the Fund’s average daily net assets.
Funds Management has retained the services of a subadviser to provide daily portfolio management to the Fund. The fee for subadvisory services is borne by Funds Management. WellsCap is the subadviser to the Fund and is entitled to receive a fee from Funds Management at an annual rate starting at 0.45% and declining to 0.30% as the average daily net assets of the Fund increase.
| | | | | | |
| Notes to financial statements (unaudited) | | Wells Fargo Growth Fund | | | 23 | |
Administration fees
Under a class-level administration agreement, Funds Management provides class-level administrative services to the Fund, which includes paying fees and expenses for services provided by the transfer agent, sub-transfer agents, omnibus account servicers and record-keepers. As compensation for its services under the class-level administration agreement, Funds Management receives an annual fee which is calculated based on the average daily net assets of each class as follows:
| | | | |
| | | Class-level
administration fee | |
Class A, Class C | | | 0.21 | % |
Class R6 | | | 0.03 | |
Administrator Class, Institutional Class | | | 0.13 | |
Funds Management has contractually waived and/or reimbursed management and administration fees to the extent necessary to maintain certain net operating expense ratios for the Fund. Waiver of fees and/or reimbursement of expenses by Funds Management were made first from fund level expenses on a proportionate basis and then from class specific expenses. Funds Management has committed through November 30, 2018 to waive fees and/or reimburse expenses to the extent necessary to cap the Fund’s expenses at 1.16% for Class A shares, 1.91% for Class C shares, 0.70% for Class R6 shares, 0.96% for Administrator Class shares, and 0.75% for Institutional Class shares. After this time, the cap may be increased or the commitment to maintain the cap may be terminated only with the approval of the Board of Trustees.
Distribution fee
The Trust has adopted a distribution plan for Class C shares of the Fund pursuant to Rule 12b-1 under the 1940 Act. A distribution fee is charged to Class C shares and paid to Wells Fargo Funds Distributor, LLC (“Funds Distributor”), the principal underwriter, at an annual rate of 0.75% of the average daily net assets of Class C shares.
In addition, Funds Distributor is entitled to receive the front-end sales charge from the purchase of Class A shares and a contingent deferred sales charge on the redemption of certain Class A shares. Funds Distributor is also entitled to receive the contingent deferred sales charges from redemptions of Class C shares. For the six months ended January 31, 2018, Funds Distributor received $9,653 from the sale of Class A shares and $416 in contingent deferred sales charges from redemptions of Class C shares. No contingent deferred sales charges were incurred by Class A for the six months ended January 31, 2018.
Shareholder servicing fees
The Trust has entered into contracts with one or more shareholder servicing agents, whereby Class A, Class C, and Administrator Class of the Fund are charged a fee at an annual rate of 0.25% of the average daily net assets of each respective class.
A portion of these total shareholder servicing fees were paid to affiliates of Wells Fargo.
Interfund transactions
The Fund may purchase or sell portfolio investment securities to certain other Wells Fargo affiliates pursuant to Rule 17a-7 under the 1940 Act and under procedures adopted by the Board of Trustees. The procedures have been designed to ensure that these interfund transactions, which do not incur broker commissions, are effected at current market prices.
5. INVESTMENT PORTFOLIO TRANSACTIONS
Purchases and sales of investments, excluding U.S. government obligations (if any) and short-term securities, for the six months ended January 31, 2018 were $726,089,225 and $1,267,459,627, respectively.
6. BANK BORROWINGS
The Trust (excluding the money market funds and certain other funds) and Wells Fargo Variable Trust are parties to a $280,000,000 revolving credit agreement whereby the Fund is permitted to use bank borrowings for temporary or emergency purposes, such as to fund shareholder redemption requests. Interest under the credit agreement is charged to the Fund based on a borrowing rate equal to the higher of the Federal Funds rate in effect on that day plus 1.25% or the overnight LIBOR rate in effect on that day plus 1.25%. In addition, an annual commitment fee equal to 0.25% of the unused balance is allocated to each participating fund. Prior to August 29, 2017, the revolving credit agreement amount was $250,000,000.
For the six months ended January 31, 2018, there were no borrowings by the Fund under the agreement.
| | | | |
| 24 | | Wells Fargo Growth Fund | | Notes to financial statements (unaudited) |
7. CONCENTRATION RISK
Concentration risks result from exposure to a limited number of sectors. A fund that invests a substantial portion of its assets in any sector may be more affected by changes in that sector than would be a fund whose investments are not heavily weighted in any sector.
8. INDEMNIFICATION
Under the Trust’s organizational documents, the officers and Trustees have been granted certain indemnification rights against certain liabilities that may arise out of performance of their duties to the Trust. Additionally, in the normal course of business, the Trust may enter into contracts with service providers that contain a variety of indemnification clauses. The Trust’s maximum exposure under these arrangements is dependent on future claims that may be made against the Fund and, therefore, cannot be estimated.
| | | | | | |
| Other information (unaudited) | | Wells Fargo Growth Fund | | | 25 | |
PROXY VOTING INFORMATION
A description of the policies and procedures that the Fund uses to determine how to vote proxies relating to portfolio securities is available, upon request, by calling 1-800-222-8222, visiting our website at wellsfargofunds.com, or visiting the SEC website at sec.gov. Information regarding how the Fund voted proxies relating to portfolio securities during the most recent 12-month period ended June 30 is available on the Fund’s website at wellsfargofunds.com or by visiting the SEC website at sec.gov.
PORTFOLIO HOLDINGS INFORMATION
The complete portfolio holdings for the Fund are publicly available monthly on the Fund’s website (wellsfargofunds.com), on a one-month delayed basis. In addition, top ten holdings information (excluding derivative positions) for the Fund is publicly available on the Fund’s website on a monthly, seven-day or more delayed basis. The Fund files its complete schedule of portfolio holdings with the SEC for the first and third quarters of each fiscal year on Form N-Q, which is available by visiting the SEC website at sec.gov. In addition, the Fund’s Form N-Q may be reviewed and copied at the SEC’s Public Reference Room in Washington, DC, and at regional offices in New York City, at 233 Broadway, and in Chicago, at 175 West Jackson Boulevard, Suite 900. Information about the Public Reference Room may be obtained by calling 1-800-SEC-0330.
| | | | |
| 26 | | Wells Fargo Growth Fund | | Other information (unaudited) |
BOARD OF TRUSTEES AND OFFICERS
Each of the Trustees and Officers1 listed in the table below acts in identical capacities for each fund in the Wells Fargo family of funds, which consists of 153 mutual funds comprising the Wells Fargo Funds Trust, Wells Fargo Variable Trust, Wells Fargo Master Trust and four closed-end funds (collectively the “Fund Complex”). This table should be read in conjunction with the Prospectus and the Statement of Additional Information2. The mailing address of each Trustee and Officer is 525 Market Street, 12th Floor, San Francisco, CA 94105. Each Trustee and Officer serves an indefinite term, however, each Trustee serves such term until reaching the mandatory retirement age established by the Trustees.
Independent Trustees
| | | | | | |
Name and year of birth | | Position held and length of service* | | Principal occupations during past five years or longer | | Current other public company or
investment company
directorships |
William R. Ebsworth (Born 1957) | | Trustee, since 2015 | | Retired. From 1984 to 2013, equities analyst, portfolio manager, research director and chief investment officer at Fidelity Management and Research Company in Boston, Tokyo, and Hong Kong, and retired in 2013 as Chief Investment Officer of Fidelity Strategic Advisers, Inc. where he led a team of investment professionals managing client assets. Prior thereto, Board member of Hong Kong Securities Clearing Co., Hong Kong Options Clearing Corp., the Thailand International Fund, Ltd., Fidelity Investments Life Insurance Company, and Empire Fidelity Investments Life Insurance Company. Board member of the Forté Foundation (non-profit organization) and the Vincent Memorial Hospital Endowment (non-profit organization), where he serves on the Investment Committee and as a Chair of the Audit Committee. Mr. Ebsworth is a CFA® charterholder. | | Asset Allocation Trust |
Jane A. Freeman** (Born 1953) | | Trustee, since 2015; Chair Liaison, since 2018 | | Retired. From 2012 to 2014 and 1999 to 2008, Chief Financial Officer of Scientific Learning Corporation. From 2008 to 2012, Ms. Freeman provided consulting services related to strategic business projects. Prior to 1999, Portfolio Manager at Rockefeller & Co. and Scudder, Stevens & Clark. Board member of the Harding Loevner Funds from 1996 to 2014, serving as both Lead Independent Director and chair of the Audit Committee. Board member of the Russell Exchange Traded Funds Trust from 2011 to 2012 and the chair of the Audit Committee. Ms. Freeman is a Board Member of Ruth Bancroft Garden (non-profit organization) and the Glimmerglass Festival. She is also an inactive Chartered Financial Analyst. | | Asset Allocation Trust |
Isaiah Harris, Jr. (Born 1952) | | Trustee, since 2009 | | Retired. Chairman of the Board of CIGNA Corporation since 2009, and Director since 2005. From 2003 to 2011, Director of Deluxe Corporation. Prior thereto, President and CEO of BellSouth Advertising and Publishing Corp. from 2005 to 2007, President and CEO of BellSouth Enterprises from 2004 to 2005 and President of BellSouth Consumer Services from 2000 to 2003. Emeritus member of the Iowa State University Foundation Board of Governors. Emeritus Member of the Advisory Board of Iowa State University School of Business. Advisory Board Member, Palm Harbor Academy (charter school). Advisory Board Member, Child Evangelism Fellowship (non-profit). Mr. Harris is a certified public accountant (inactive status). | | CIGNA Corporation; Asset Allocation Trust |
Judith M. Johnson (Born 1949) | | Trustee, since 2008; Audit Committee Chairman, since 2008 | | Retired. Prior thereto, Chief Executive Officer and Chief Investment Officer of Minneapolis Employees Retirement Fund from 1996 to 2008. Ms. Johnson is an attorney, certified public accountant and a certified managerial accountant. | | Asset Allocation Trust |
David F. Larcker (Born 1950) | | Trustee, since 2009 | | James Irvin Miller Professor of Accounting at the Graduate School of Business, Stanford University, Director of the Corporate Governance Research Initiative and Senior Faculty of The Rock Center for Corporate Governance since 2006. From 2005 to 2008, Professor of Accounting at the Graduate School of Business, Stanford University. Prior thereto, Ernst & Young Professor of Accounting at The Wharton School, University of Pennsylvania from 1985 to 2005. | | Asset Allocation Trust |
| | | | | | |
| Other information (unaudited) | | Wells Fargo Growth Fund | | | 27 | |
| | | | | | |
Name and year of birth | | Position held and length of service* | | Principal occupations during past five years or longer | | Current other public company or
investment company
directorships |
Olivia S. Mitchell*** (Born 1953) | | Trustee, since 2006; Governance Committee Chairman, since 2018 | | International Foundation of Employee Benefit Plans Professor, Wharton School of the University of Pennsylvania since 1993. Director of Wharton’s Pension Research Council and Boettner Center on Pensions & Retirement Research, and Research Associate at the National Bureau of Economic Research. Previously, Cornell University Professor from 1978 to 1993. | | Asset Allocation Trust |
Timothy J. Penny**** (Born 1951) | | Trustee since 1996; Chairman, since 2018; Vice Chairman, from 2017 to 2018 | | President and Chief Executive Officer of Southern Minnesota Initiative Foundation, a non-profit organization, since 2007. Member of the Board of Trustees of NorthStar Education Finance, Inc., a non-profit organization, since 2007. | | Asset Allocation Trust |
James G. Polisson***** (Born 1959) | | Trustee, since 2018; Advisory Board Member, from 2017 to 2018 | | Retired. Chief Marketing Officer, Source (ETF) UK Services, Ltd, from 2015 to 2017. From 2012 to 2015, Principal of The Polisson Group, LLC, a management consulting, corporate advisory and principal investing company. Chief Executive Officer and Managing Director at Russell Investments, Global Exchange Traded Funds from 2010 to 2012. Managing Director of Barclays Global Investors from 1998 to 2010 and Global Chief Marketing Officer for iShares and Barclays Global Investors from 2000 to 2010. Trustee of the San Francisco Mechanics’ Institute, a non-profit organization, from 2013 to 2015. Board member of the Russell Exchange Traded Fund Trust from 2011 to 2012. Director of Barclays Global Investors Holdings Deutschland GmbH from 2006 to 2009. Mr. Polisson is an attorney and has a retired status with the Massachusetts and District of Columbia Bar Associations. | | Asset Allocation Trust |
Michael S. Scofield (Born 1943) | | Trustee, since 2010 | | Served on the Investment Company Institute’s Board of Governors and Executive Committee from 2008-2011 as well the Governing Council of the Independent Directors Council from 2006-2011 and the Independent Directors Council Executive Committee from 2008-2011. Trustee of the Evergreen Fund complex (and its predecessors) from 1984 to 2010. Chairman of the Evergreen Funds from 2000-2010. Former Trustee of the Mentor Funds. Retired Attorney, Law Offices of Michael S. Scofield. | | Asset Allocation Trust |
Pamela Wheelock***** (Born 1959) | | Trustee, since 2018; Advisory Board Member, from 2017 to 2018 | | Chief Operating Officer, Twin Cities Habitat for Humanity, since January, 2017. Vice President of University Services, University of Minnesota from 2012 to 2017. Prior thereto, Interim President and Chief Executive Officer of Blue Cross Blue Shield of Minnesota from 2010 to 2011, Chairman of the Board from 2009 to 2011 and Board Director from 2003 to 2015. Vice President, Leadership and Community Engagement, Bush Foundation, Saint Paul, Minnesota (a private foundation) from 2009 to 2011. Executive Vice President and Chief Financial Officer, Minnesota Sports and Entertainment from 2004 to 2009 and Senior Vice President from 2002 to 2004. Commissioner of Finance, State of Minnesota, from 1999 to 2002. Currently on the Board of Directors, Governance Committee and Finance Committee, for the Minnesota Philanthropy Partners (Saint Paul Foundation) since 2012 and Board Chair of the Minnesota Wild Foundation since 2010. | | Asset Allocation Trust |
| * | Length of service dates reflect the Trustee’s commencement of service with the Trust’s predecessor entities, where applicable. |
| ** | Jane Freeman became Chair Liaison effective January 1, 2018. |
| *** | Olivia Mitchell became Chairman of the Governance Committee effective January 1, 2018. |
| **** | Timothy Penny became Chairman effective January 1, 2018. |
| ***** | James Polisson and Pamela Wheelock each became a Trustee effective January 1, 2018. |
| | | | |
| 28 | | Wells Fargo Growth Fund | | Other information (unaudited) |
Officers
| | | | | | |
Name and year of birth | | Position held and length of service | | Principal occupations during past five years or longer | | |
Andrew Owen (Born 1960) | | President, since 2017 | | Executive Vice President of Wells Fargo & Company and Head of Affiliated Managers, Wells Fargo Asset Management, since 2014. In addition, Mr. Owen is currently President, Chief Executive Officer and Director of Wells Fargo Funds Management, LLC since 2017. Prior thereto, Executive Vice President responsible for marketing, investments and product development for Wells Fargo Funds Management, LLC, from 2009 to 2014. | | |
Jeremy DePalma1 (Born 1974) | | Treasurer, since 2012 | | Senior Vice President of Wells Fargo Funds Management, LLC since 2009. Senior Vice President of Evergreen Investment Management Company, LLC from 2008 to 2010 and head of the Fund Reporting and Control Team within Fund Administration from 2005 to 2010. | | |
C. David Messman (Born 1960) | | Secretary, since 2000; Chief Legal Officer, since 2003 | | Senior Vice President and Secretary of Wells Fargo Funds Management, LLC since 2001. Assistant General Counsel of Wells Fargo Bank, N.A. since 2013 and Vice President and Managing Counsel of Wells Fargo Bank, N.A. from 1996 to 2013. | | |
Michael H. Whitaker (Born 1967) | | Chief Compliance Officer, since 2016 | | Senior Vice President and Chief Compliance Officer since 2016. Senior Vice President and Chief Compliance Officer for Fidelity Investments from 2007 to 2016. | | |
David Berardi (Born 1975) | | Assistant Treasurer, since 2009 | | Vice President of Wells Fargo Funds Management, LLC since 2009. Vice President of Evergreen Investment Management Company, LLC from 2008 to 2010. Manager of Fund Reporting and Control for Evergreen Investment Management Company, LLC from 2004 to 2010. | | |
| 1 | Jeremy DePalma acts as Treasurer of 76 funds and Assistant Treasurer of 77 funds in the Fund Complex. |
| 2 | The Statement of Additional Information includes additional information about the Trustees and is available, without charge, upon request, by calling 1-800-222-8222 or by visiting the website at wellsfargofunds.com. |
| | | | | | |
| List of abbreviations | | Wells Fargo Growth Fund | | | 29 | |
The following is a list of common abbreviations for terms and entities that may have appeared in this report.
| ACA | — ACA Financial Guaranty Corporation |
| ADR | — American depositary receipt |
| ADS | — American depositary shares |
| AGC | — Assured Guaranty Corporation |
| AGM | — Assured Guaranty Municipal |
| Ambac | — Ambac Financial Group Incorporated |
| AMT | — Alternative minimum tax |
| BAN | — Bond anticipation notes |
| BHAC | — Berkshire Hathaway Assurance Corporation |
| CAB | — Capital appreciation bond |
| CCAB | — Convertible capital appreciation bond |
| CDA | — Community Development Authority |
| CDO | — Collateralized debt obligation |
| CLO | — Collateralized loan obligation |
| DRIVER | — Derivative inverse tax-exempt receipts |
| DW&P | — Department of Water & Power |
| DWR | — Department of Water Resources |
| ECFA | — Educational & Cultural Facilities Authority |
| EDA | — Economic Development Authority |
| EDFA | — Economic Development Finance Authority |
| ETF | — Exchange-traded fund |
| FDIC | — Federal Deposit Insurance Corporation |
| FFCB | — Federal Farm Credit Banks |
| FGIC | — Financial Guaranty Insurance Corporation |
| FHA | — Federal Housing Administration |
| FHLB | — Federal Home Loan Bank |
| FHLMC | — Federal Home Loan Mortgage Corporation |
| FICO | — The Financing Corporation |
| FNMA | — Federal National Mortgage Association |
| GDR | — Global depositary receipt |
| GNMA | — Government National Mortgage Association |
| HCFR | — Healthcare facilities revenue |
| HEFA | — Health & Educational Facilities Authority |
| HEFAR | — Higher education facilities authority revenue |
| HFA | — Housing Finance Authority |
| HFFA | — Health Facilities Financing Authority |
| HUD | — Department of Housing and Urban Development |
| IDA | — Industrial Development Authority |
| IDAG | — Industrial Development Agency |
| KRW | — Republic of Korea won |
| LIBOR | — London Interbank Offered Rate |
| LIFER | — Long Inverse Floating Exempt Receipts |
| LLC | — Limited liability company |
| LLLP | — Limited liability limited partnership |
| LLP | — Limited liability partnership |
| MBIA | — Municipal Bond Insurance Association |
| MFHR | — Multifamily housing revenue |
| MSTR | — Municipal securities trust receipts |
| MUD | — Municipal Utility District |
| National | — National Public Finance Guarantee Corporation |
| PCFA | — Pollution Control Financing Authority |
| PCL | — Public Company Limited |
| PCR | — Pollution control revenue |
| PFA | — Public Finance Authority |
| PFFA | — Public Facilities Financing Authority |
| PFOTER | — Puttable floating option tax-exempt receipts |
| PJSC | — Public Joint Stock Company |
| plc | — Public limited company |
| PUTTER | — Puttable tax-exempt receipts |
| R&D | — Research & development |
| Radian | — Radian Asset Assurance |
| RAN | — Revenue anticipation notes |
| RDA | — Redevelopment Agency |
| RDFA | — Redevelopment Finance Authority |
| REIT | — Real estate investment trust |
| ROC | — Reset option certificates |
| SAVRS | — Select auction variable rate securities |
| SBA | — Small Business Authority |
| SDR | — Swedish depositary receipt |
| SFHR | — Single-family housing revenue |
| SFMR | — Single-family mortgage revenue |
| SIFMA | — Securities Industry and Financial Markets Association |
| SPA | — Standby purchase agreement |
| SPDR | — Standard & Poor’s Depositary Receipts |
| SPEAR | — Short Puttable Exempt Adjustable Receipts |
| STRIPS | — Separate trading of registered interest and |
| TAN | — Tax anticipation notes |
| TIPS | — Treasury inflation-protected securities |
| TRAN | — Tax revenue anticipation notes |
| TTFA | — Transportation Trust Fund Authority |
| TVA | — Tennessee Valley Authority |
This page is intentionally left blank.
This page is intentionally left blank.
This page is intentionally left blank.

For more information
More information about Wells Fargo Funds is available free upon request. To obtain literature, please write, email, visit the Fund’s website, or call:
Wells Fargo Funds
P.O. Box 8266
Boston, MA 02266-8266
Email: fundservice@wellsfargo.com
Website: wellsfargofunds.com
Individual investors: 1-800-222-8222
Retail investment professionals: 1-888-877-9275
Institutional investment professionals: 1-866-765-0778
This report and the financial statements contained herein are submitted for the general information of the shareholders of the Fund. If this report is used for promotional purposes, distribution of the report must be accompanied or preceded by a current prospectus. Before investing, please consider the investment objectives, risks, charges, and expenses of the investment. For a current prospectus and, if available, a summary prospectus, containing this information, call 1-800-222-8222 or visit the Fund’s website at wellsfargofunds.com. Read the prospectus carefully before you invest or send money.
Wells Fargo Asset Management (WFAM) is a trade name used by the asset management businesses of Wells Fargo & Company. Wells Fargo Funds Management, LLC, a wholly owned subsidiary of Wells Fargo & Company, provides investment advisory and administrative services for Wells Fargo Funds. Other affiliates of Wells Fargo & Company provide subadvisory and other services for the funds. The funds are distributed by Wells Fargo Funds Distributor, LLC, Member FINRA, an affiliate of Wells Fargo & Company. Neither Wells Fargo Funds Distributor nor Wells Fargo Funds Management holds fund shareholder accounts or assets. This material is for general informational and educational purposes only and is NOT intended to provide investment advice or a recommendation of any kind—including a recommendation for any specific investment, strategy, or plan.
NOT FDIC INSURED ◾ NO BANK GUARANTEE ◾ MAY LOSE VALUE
© 2018 Wells Fargo Funds Management, LLC. All rights reserved.
| | |
 | | 309114 03-18 SA206/SAR206 01-18 |
Semi-Annual Report
January 31, 2018

Wells Fargo Intrinsic Value Fund


Reduce clutter. Save trees.
Sign up for electronic delivery of prospectuses and shareholder reports at wellsfargo.com/advantagedelivery
Contents
The views expressed and any forward-looking statements are as of January 31, 2018, unless otherwise noted, and are those of the Fund managers and/or Wells Fargo Funds Management, LLC. Discussions of individual securities, or the markets generally, or any Wells Fargo Fund are not intended as individual recommendations. Future events or results may vary significantly from those expressed in any forward-looking statements. The views expressed are subject to change at any time in response to changing circumstances in the market. Wells Fargo Funds Management, LLC and the Fund disclaim any obligation to publicly update or revise any views expressed or forward-looking statements.
NOT FDIC INSURED ◾ NO BANK GUARANTEE ◾ MAY LOSE VALUE
| | | | |
| 2 | | Wells Fargo Intrinsic Value Fund | | Letter to shareholders (unaudited) |

Andrew Owen
President
Wells Fargo Funds
While investing in stocks and bonds generally delivered favorable returns during the past six months, fixed-income investments in the U.S. diverged from the global trend.
Dear Shareholder:
We are pleased to offer you this semi-annual report for the Wells Fargo Intrinsic Value Fund for the six-month period that ended January 31, 2018. While investing in stocks generally delivered favorable returns during the past six months, fixed-income investments in the U.S. diverged from the global trend. U.S. and international stocks delivered similar results, with returns of 15.43% and 13.50%, respectively, for the six-month period, as measured by the S&P 500 Index1 and the MSCI ACWI ex USA Index (Net)2, respectively. Within fixed income, the Bloomberg Barclays Global Aggregate ex-USD Index3 earned 4.50%. In the U.S., fixed-income investments, as measured by the Bloomberg Barclays U.S. Aggregate Bond Index4, fell 0.35% and the Bloomberg Barclays Municipal Bond Index5 declined 0.19%.
As global growth improved in the third quarter of 2017, investment markets advanced.
Globally, stocks moved higher during the late summer of 2017 as they were subject to the same positive economic conditions that influenced their advances during first half of the year: moderately accelerating global economic growth supported by improving corporate earnings as well as low inflation and interest rates. Brief episodes of geopolitical tensions, primarily associated with North Korea’s advancing nuclear missile program, flaring conflicts in the Middle East, and uncertainty surrounding the new U.S. administration’s trade policies, did not discourage investing activity. In the U.S., economic data released during the quarter reflected a generally healthy economy. Second-quarter economic output grew at a 3.1% annual rate.
Outside the U.S., stocks in international developed and emerging markets were supported by improved economic growth. Advances in emerging markets equity valuations slowed compared with the pace of the first half of 2017 but continued an upward path. Central banks in Europe, Asia, and Japan maintained low-interest-rate policies that supported business growth and equity investing.
In the U.S., Federal Reserve (Fed) officials announced in October plans to begin the process of unwinding its $4.5 trillion portfolio of bonds and other assets accumulated during rounds of quantitative easing conducted since the 2008–2009 recession. Still, restrained inflation kept long-term bond rates steady and the flattening of the yield curve persisted.
Positive economic and market news continued as 2017 closed and 2018 began.
During the fourth quarter of 2017, stock markets continued an upward trajectory. Synchronous economic expansion worldwide continued with mild inflation and low volatility. Data released during the quarter reflected a healthy U.S. economy.
| 1 | The S&P 500 Index consists of 500 stocks chosen for market size, liquidity, and industry group representation. It is a market-value-weighted index with each stock’s weight in the index proportionate to its market value. You cannot invest directly in an index. |
| 2 | The Morgan Stanley Capital International (MSCI) All Country World Index (ACWI) ex USA Index (Net) is a free-float-adjusted market-capitalization-weighted index that is designed to measure the equity market performance of developed markets, excluding the United States and Canada. Source: MSCI. MSCI makes no express or implied warranties or representations and shall have no liability whatsoever with respect to any MSCI data contained herein. The MSCI data may not be further redistributed or used as a basis for other indices or any securities or financial products. This report is not approved, reviewed, or produced by MSCI. You cannot invest directly in an index. |
| 3 | The Bloomberg Barclays Global Aggregate ex-USD Index is an unmanaged index that provides a broad-based measure of the global investment-grade fixed-income markets excluding the U.S.-dollar-denominated debt market. You cannot invest directly in an index. |
| 4 | The Bloomberg Barclays U.S. Aggregate Bond Index is a broad-based benchmark that measures the investment-grade, U.S. dollar-denominated, fixed-rate taxable bond market, including Treasuries, government-related and corporate securities, mortgage-backed securities (agency fixed-rate and hybrid adjustable-rate mortgage pass-throughs), asset-backed securities, and commercial mortgage-backed securities. You cannot invest directly in an index. |
| 5 | The Bloomberg Barclays Municipal Bond Index is an unmanaged index composed of long-term tax-exempt bonds with a minimum credit rating of Baa. You cannot invest directly in an index. |
| | | | | | |
| Letter to shareholders (unaudited) | | Wells Fargo Intrinsic Value Fund | | | 3 | |
Third-quarter economic output grew at a 3.2% annual rate. Increased hiring pushed the unemployment rate down to a 17-year low of 4.1%. Tax reform in the U.S. that passed as the year ended also encouraged increased spending among businesses and individuals. Signs of long-awaited wage growth appeared to emerge.
Outside the U.S., economies continued to strengthen. In December, the Organisation for Economic Co-operation and Development (OECD) reported that the global economy has been expanding at its fastest rate since 2010; all 35 countries the OECD follows were on track to expand for 2017. International economies have benefited from catalysts such as economic stimulus, improving employment, increased investment, accelerated trade growth, and the firming of prices for some of the commodities that are essential exports of many international economies.
October 2017 marked one year since regulatory reform of money market investing in the U.S. By December 2017, money market fund asset levels exceeded their December 2016 levels, reflecting continued investor demand for the short-term investment opportunities afforded them by money market funds.
In December 2017, the Fed raised the federal funds rate target to a range of 1.25% to 1.50%. The Fed also began reducing its bond portfolio. Long-term interest rates in the U.S. trended higher as the yield curve steepened—the 10-year Treasury rate moved from 2.46% to 2.84% and the 30-year rate moved from 2.81% to 3.08% during January 2018.
Don’t let short-term uncertainty derail long-term investment goals.
Periods of investment uncertainty can present challenges, but experience has taught us that maintaining long-term investment goals can be an effective way to plan for the future. To help you create a sound strategy based on your personal goals and risk tolerance, Wells Fargo Funds offers more than 100 mutual funds spanning a wide range of asset classes and investment styles. Although diversification cannot guarantee an investment profit or prevent losses, we believe it can be an effective way to manage investment risk and potentially smooth out overall portfolio performance. We encourage investors to know their investments and to understand that appropriate levels of risk-taking may unlock opportunities.
Thank you for choosing to invest with Wells Fargo Funds. We appreciate your confidence in us and remain committed to helping you meet your financial needs.
Sincerely,

Andrew Owen
President
Wells Fargo Funds
Although diversification cannot guarantee an investment profit or prevent losses, we believe it can be an effective way to manage investment risk and potentially smooth out overall portfolio performance.
For further information about your Fund, contact your investment professional, visit our website at wellsfargofunds.com, or call us directly at 1-800-222-8222.
| | | | |
| 4 | | Wells Fargo Intrinsic Value Fund | | Performance highlights (unaudited) |
Investment objective
The Fund seeks long-term capital appreciation.
Manager
Wells Fargo Funds Management, LLC
Subadviser
Wells Capital Management Incorporated
Portfolio managers
Miguel E. Giaconi, CFA®
Jean-Baptiste Nadal, CFA®
Average annual total returns (%) as of January 31, 20181
| | | | | | | | | | | | | | | | | | | | | | | | | | | | | | | | | | |
| | | | | Including sales charge | | | Excluding sales charge | | | Expense ratios2 (%) | |
| | | Inception date | | 1 year | | | 5 year | | | 10 year | | | 1 year | | | 5 year | | | 10 year | | | Gross | | | Net3 | |
| Class A (EIVAX) | | 8-1-2006 | | | 13.61 | | | | 10.64 | | | | 7.62 | | | | 20.54 | | | | 11.96 | | | | 8.26 | | | | 1.18 | | | | 1.11 | |
| Class C (EIVCX) | | 8-1-2006 | | | 18.57 | | | | 11.10 | | | | 7.43 | | | | 19.57 | | | | 11.10 | | | | 7.43 | | | | 1.93 | | | | 1.86 | |
| Class R (EIVTX) | | 3-1-2013 | | | – | | | | – | | | | – | | | | 20.15 | | | | 11.69 | | | | 7.99 | | | | 1.43 | | | | 1.36 | |
| Class R6 (EIVFX) | | 11-30-2012 | | | – | | | | – | | | | – | | | | 21.03 | | | | 12.38 | | | | 8.62 | | | | 0.75 | | | | 0.65 | |
| Administrator Class (EIVDX) | | 7-30-2010 | | | – | | | | – | | | | – | | | | 20.79 | | | | 12.16 | | | | 8.45 | | | | 1.10 | | | | 0.95 | |
| Institutional Class (EIVIX) | | 8-1-2006 | | | – | | | | – | | | | – | | | | 21.10 | | | | 12.45 | | | | 8.65 | | | | 0.85 | | | | 0.70 | |
| Russell 1000® Value Index4 | | – | | | – | | | | – | | | | – | | | | 17.22 | | | | 13.47 | | | | 7.95 | | | | – | | | | – | |
Figures quoted represent past performance, which is no guarantee of future results, and do not reflect taxes that a shareholder may pay on fund distributions or the redemption of fund shares. Investment return and principal value of an investment will fluctuate so that an investor’s shares, when redeemed, may be worth more or less than their original cost. Performance shown without sales charges would be lower if sales charges were reflected. Current performance may be lower or higher than the performance data quoted, which assumes the reinvestment of dividends and capital gains. Current month-end performance is available on the Fund’s website, wellsfargofunds.com.
Index returns do not include transaction costs associated with buying and selling securities, any mutual fund fees or expenses, or any taxes. It is not possible to invest directly in an index.
For Class A shares, the maximum front-end sales charge is 5.75%. For Class C shares, the maximum contingent deferred sales charge is 1.00%. Performance including a contingent deferred sales charge assumes the sales charge for the corresponding time period. Class R, Class R6, Administrator Class, and Institutional Class shares are sold without a front-end sales charge or contingent deferred sales charge.
Stock values fluctuate in response to the activities of individual companies and general market and economic conditions. Certain investment strategies tend to increase the total risk of an investment (relative to the broader market). The Fund is exposed to foreign investment risk and focused portfolio risk. Consult the Fund’s prospectus for additional information on these and other risks.
Please see footnotes on page 5.
| | | | | | |
| Performance highlights (unaudited) | | Wells Fargo Intrinsic Value Fund | | | 5 | |
| | | | |
| Ten largest holdings (%) as of January 31, 20185 | |
Alphabet Incorporated Class C | | | 3.67 | |
Microsoft Corporation | | | 3.42 | |
EOG Resources Incorporated | | | 3.36 | |
Synchrony Financial | | | 3.20 | |
BB&T Corporation | | | 3.13 | |
Honeywell International Incorporated | | | 3.02 | |
Vulcan Materials Company | | | 3.01 | |
US Bancorp | | | 2.95 | |
AerCap Holdings NV | | | 2.89 | |
Cisco Systems Incorporated | | | 2.82 | |
|
| Sector distribution as of January 31, 20186 |
|
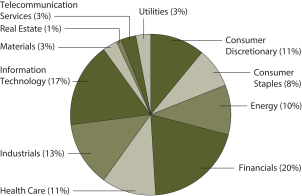
|
| 1 | Historical performance shown for Class R shares prior to their inception reflects the performance of Institutional Class shares, adjusted to reflect the higher expenses applicable to Class R shares. Historical performance shown for Class R6 shares prior to their inception reflects the performance of Institutional Class shares and includes the higher expenses applicable to Institutional Class shares. If these expenses had not been included, returns for Class R6 shares would be higher. Historical performance shown for Administrator Class shares prior to their inception reflects the performance of Institutional Class shares, adjusted to reflect the higher expenses applicable to Administrator Class shares. Historical performance shown for all classes of the Fund prior to July 19, 2010, is based on the performance of the Fund’s predecessor, Evergreen Intrinsic Value Fund. |
| 2 | Reflects the expense ratios as stated in the most recent prospectuses. The expense ratios shown are subject to change and may differ from the annualized expense ratios shown in the financial highlights of this report. |
| 3 | The manager has contractually committed through November 30, 2018, to waive fees and/or reimburse expenses to the extent necessary to cap the Fund’s Total Annual Fund Operating Expenses After Fee Waivers at the amounts shown. After this time, the cap may be increased or the commitment to maintain the cap may be terminated only with the approval of the Board of Trustees. Brokerage commissions, stamp duty fees, interest, taxes, acquired fund fees and expenses, and extraordinary expenses are excluded from the expense cap. Without this cap, the Fund’s returns would have been lower. The expense ratio paid by an investor is the net expense ratio or the Fund’s Total Annual Fund Operating Expenses After Fee Waivers, as stated in the prospectuses. |
| 4 | The Russell 1000® Value Index measures the performance of those Russell 1000 companies with lower price/book ratios and lower forecasted growth values. You cannot invest directly in an index. |
| 5 | The ten largest holdings, excluding cash and cash equivalents, are calculated based on the value of the investments divided by total net assets of the Fund. Holdings are subject to change and may have changed since the date specified. |
| 6 | Amounts are calculated based on the total long-term investments of the Fund. These amounts are subject to change and may have changed since the date specified. |
| | | | |
| 6 | | Wells Fargo Intrinsic Value Fund | | Fund expenses (unaudited) |
As a shareholder of the Fund, you incur two types of costs: (1) transaction costs, including sales charges (loads) on purchase payments and contingent deferred sales charges (if any) on redemptions and (2) ongoing costs, including management fees, distribution (12b-1) and/or shareholder servicing fees, and other Fund expenses. This example is intended to help you understand your ongoing costs (in dollars) of investing in the Fund and to compare these costs with the ongoing costs of investing in other mutual funds.
The example is based on an investment of $1,000 invested at the beginning of the six-month period and held for the entire period from August 1, 2017 to January 31, 2018.
Actual expenses
The “Actual” line of the table below provides information about actual account values and actual expenses. You may use the information in this line, together with the amount you invested, to estimate the expenses that you paid over the period. Simply divide your account value by $1,000 (for example, an $8,600 account value divided by $1,000 = 8.6), then multiply the result by the number in the “Actual” line under the heading entitled “Expenses paid during period” for your applicable class of shares to estimate the expenses you paid on your account during this period.
Hypothetical example for comparison purposes
The “Hypothetical” line of the table below provides information about hypothetical account values and hypothetical expenses based on the Fund’s actual expense ratio and an assumed rate of return of 5% per year before expenses, which is not the Fund’s actual return. The hypothetical account values and expenses may not be used to estimate the actual ending account balance or expenses you paid for the period. You may use this information to compare the ongoing costs of investing in the Fund and other funds. To do so, compare this 5% hypothetical example with the 5% hypothetical examples that appear in the shareholder reports of the other funds.
Please note that the expenses shown in the table are meant to highlight your ongoing costs only and do not reflect any transactional costs, such as sales charges (loads) and contingent deferred sales charges. Therefore, the “Hypothetical” line of the table is useful in comparing ongoing costs only and will not help you determine the relative total costs of owning different funds. In addition, if these transactional costs were included, your costs would have been higher.
| | | | | | | | | | | | | | | | |
| | | Beginning
account value
8-1-2017 | | | Ending
account value
1-31-2018 | | | Expenses
paid during
the period¹ | | | Annualized net
expense ratio | |
Class A | | | | | | | | | | | | | | | | |
Actual | | $ | 1,000.00 | | | $ | 1,125.12 | | | $ | 5.89 | | | | 1.10 | % |
Hypothetical (5% return before expenses) | | $ | 1,000.00 | | | $ | 1,019.66 | | | $ | 5.60 | | | | 1.10 | % |
Class C | | | | | | | | | | | | | | | | |
Actual | | $ | 1,000.00 | | | $ | 1,120.93 | | | $ | 9.94 | | | | 1.86 | % |
Hypothetical (5% return before expenses) | | $ | 1,000.00 | | | $ | 1,015.83 | | | $ | 9.45 | | | | 1.86 | % |
Class R | | | | | | | | | | | | | | | | |
Actual | | $ | 1,000.00 | | | $ | 1,122.96 | | | $ | 7.28 | | | | 1.36 | % |
Hypothetical (5% return before expenses) | | $ | 1,000.00 | | | $ | 1,018.35 | | | $ | 6.92 | | | | 1.36 | % |
Class R6 | | | | | | | | | | | | | | | | |
Actual | | $ | 1,000.00 | | | $ | 1,127.01 | | | $ | 3.48 | | | | 0.65 | % |
Hypothetical (5% return before expenses) | | $ | 1,000.00 | | | $ | 1,021.93 | | | $ | 3.31 | | | | 0.65 | % |
Administrator Class | | | | | | | | | | | | | | | | |
Actual | | $ | 1,000.00 | | | $ | 1,126.26 | | | $ | 5.09 | | | | 0.95 | % |
Hypothetical (5% return before expenses) | | $ | 1,000.00 | | | $ | 1,020.42 | | | $ | 4.84 | | | | 0.95 | % |
Institutional Class | | | | | | | | | | | | | | | | |
Actual | | $ | 1,000.00 | | | $ | 1,127.90 | | | $ | 3.75 | | | | 0.70 | % |
Hypothetical (5% return before expenses) | | $ | 1,000.00 | | | $ | 1,021.68 | | | $ | 3.57 | | | | 0.70 | % |
| 1 | Expenses paid is equal to the annualized net expense ratio of each class multiplied by the average account value over the period, multiplied by the number of days in the most recent fiscal half-year divided by the number of days in the fiscal year (to reflect the one-half-year period). |
| | | | | | |
| Portfolio of investments—January 31, 2018 (unaudited) | | Wells Fargo Intrinsic Value Fund | | | 7 | |
| | | | | | | | | | | | | | | | |
| Security name | | | | | | | | Shares | | | Value | |
|
Common Stocks: 98.87% | |
| | | | |
Consumer Discretionary: 10.86% | | | | | | | | | | | | | | | | |
| | | | |
| Media: 4.82% | | | | | | | | | | | | | | | | |
Comcast Corporation Class A | | | | | | | | | | | 592,500 | | | $ | 25,199,025 | |
The Walt Disney Company | | | | | | | | | | | 199,700 | | | | 21,701,399 | |
| |
| | | | 46,900,424 | |
| | | | | | | | | | | | | | | | |
| | | | |
| Specialty Retail: 4.53% | | | | | | | | | | | | | | | | |
Advance Auto Parts Incorporated | | | | | | | | | | | 185,200 | | | | 21,666,548 | |
The TJX Companies Incorporated | | | | | | | | | | | 279,800 | | | | 22,473,536 | |
| |
| | | | 44,140,084 | |
| | | | | | | | | | | | | | | | |
| | | | |
| Textiles, Apparel & Luxury Goods: 1.51% | | | | | | | | | | | | | | | | |
Nike Incorporated Class B | | | | | | | | | | | 215,100 | | | | 14,674,122 | |
| | | | | | | | | | | | | | | | |
| | | | |
Consumer Staples: 8.02% | | | | | | | | | | | | | | | | |
| | | | |
| Beverages: 2.21% | | | | | | | | | | | | | | | | |
Anheuser-Busch InBev NV ADR | | | | | | | | | | | 189,300 | | | | 21,481,764 | |
| | | | | | | | | | | | | | | | |
| | | | |
| Food Products: 5.81% | | | | | | | | | | | | | | | | |
Mondelez International Incorporated Class A | | | | | | | | | | | 566,300 | | | | 25,143,720 | |
Nestle SA ADR | | | | | | | | | | | 198,400 | | | | 17,141,760 | |
TreeHouse Foods Incorporated † | | | | | | | | | | | 303,800 | | | | 14,327,208 | |
| |
| | | | 56,612,688 | |
| | | | | | | | | | | | | | | | |
| | | | |
Energy: 10.24% | | | | | | | | | | | | | | | | |
| | | | |
| Energy Equipment & Services: 3.49% | | | | | | | | | | | | | | | | |
Schlumberger Limited | | | | | | | | | | | 312,300 | | | | 22,979,034 | |
TechnipFMC plc | | | | | | | | | | | 338,400 | | | | 10,984,464 | |
| |
| | | | 33,963,498 | |
| | | | | | | | | | | | | | | | |
| | | | |
| Oil, Gas & Consumable Fuels: 6.75% | | | | | | | | | | | | | | | | |
Chevron Corporation | | | | | | | | | | | 159,000 | | | | 19,930,650 | |
Concho Resources Incorporated † | | | | | | | | | | | 82,800 | | | | 13,036,032 | |
EOG Resources Incorporated | | | | | | | | | | | 284,400 | | | | 32,706,000 | |
| |
| | | | 65,672,682 | |
| | | | | | | | | | | | | | | | |
| | | | |
Financials: 19.65% | | | | | | | | | | | | | | | | |
| | | | |
| Banks: 10.39% | | | | | | | | | | | | | | | | |
Bank of America Corporation | | | | | | | | | | | 561,200 | | | | 17,958,400 | |
BB&T Corporation | | | | | | | | | | | 551,600 | | | | 30,442,804 | |
CIT Group Incorporated | | | | | | | | | | | 473,100 | | | | 23,981,439 | |
US Bancorp | | | | | | | | | | | 503,200 | | | | 28,752,848 | |
| |
| | | | 101,135,491 | |
| | | | | | | | | | | | | | | | |
| | | | |
| Capital Markets: 3.73% | | | | | | | | | | | | | | | | |
Intercontinental Exchange Incorporated | | | | | | | | | | | 167,600 | | | | 12,375,584 | |
UBS Group AG « | | | | | | | | | | | 1,178,200 | | | | 23,941,024 | |
| |
| | | | 36,316,608 | |
| | | | | | | | | | | | | | | | |
The accompanying notes are an integral part of these financial statements.
| | | | |
| 8 | | Wells Fargo Intrinsic Value Fund | | Portfolio of investments—January 31, 2018 (unaudited) |
| | | | | | | | | | | | | | | | |
| Security name | | | | | | | | Shares | | | Value | |
| | | | |
| Consumer Finance: 3.20% | | | | | | | | | | | | | | | | |
Synchrony Financial | | | | | | | | | | | 784,300 | | | $ | 31,121,024 | |
| | | | | | | | | | | | | | | | |
| | | | |
| Insurance: 2.33% | | | | | | | | | | | | | | | | |
The Allstate Corporation | | | | | | | | | | | 229,500 | | | | 22,667,715 | |
| | | | | | | | | | | | | | | | |
| | | | |
Health Care: 10.41% | | | | | | | | | | | | | | | | |
| | | | |
| Biotechnology: 2.31% | | | | | | | | | | | | | | | | |
Gilead Sciences Incorporated | | | | | | | | | | | 267,894 | | | | 22,449,517 | |
| | | | | | | | | | | | | | | | |
| | | | |
| Health Care Equipment & Supplies: 1.68% | | | | | | | | | | | | | | | | |
Abbott Laboratories | | | | | | | | | | | 262,600 | | | | 16,323,216 | |
| | | | | | | | | | | | | | | | |
| | | | |
| Health Care Providers & Services: 2.53% | | | | | | | | | | | | | | | | |
Cigna Corporation | | | | | | | | | | | 118,300 | | | | 24,647,805 | |
| | | | | | | | | | | | | | | | |
| | | | |
| Pharmaceuticals: 3.89% | | | | | | | | | | | | | | | | |
Eli Lilly & Company | | | | | | | | | | | 142,300 | | | | 11,590,335 | |
Merck & Company Incorporated | | | | | | | | | | | 443,400 | | | | 26,271,450 | |
| |
| | | | 37,861,785 | |
| | | | | | | | | | | | | | | | |
| | | | |
Industrials: 12.44% | | | | | | | | | | | | | | | | |
| | | | |
| Aerospace & Defense: 3.15% | | | | | | | | | | | | | | | | |
General Dynamics Corporation | | | | | | | | | | | 93,000 | | | | 20,690,640 | |
Lockheed Martin Corporation | | | | | | | | | | | 28,100 | | | | 9,971,285 | |
| |
| | | | 30,661,925 | |
| | | | | | | | | | | | | | | | |
| | | | |
| Air Freight & Logistics: 2.07% | | | | | | | | | | | | | | | | |
United Parcel Service Incorporated Class B | | | | | | | | | | | 158,100 | | | | 20,129,292 | |
| | | | | | | | | | | | | | | | |
| | | | |
| Electrical Equipment: 1.31% | | | | | | | | | | | | | | | | |
Sensata Technologies Holding NV † | | | | | | | | | | | 226,600 | | | | 12,746,250 | |
| | | | | | | | | | | | | | | | |
| | | | |
| Industrial Conglomerates: 3.02% | | | | | | | | | | | | | | | | |
Honeywell International Incorporated | | | | | | | | | | | 183,800 | | | | 29,347,346 | |
| | | | | | | | | | | | | | | | |
| | | | |
| Trading Companies & Distributors: 2.89% | | | | | | | | | | | | | | | | |
AerCap Holdings NV † | | | | | | | | | | | 520,100 | | | | 28,137,410 | |
| | | | | | | | | | | | | | | | |
| | | | |
Information Technology: 17.25% | | | | | | | | | | | | | | | | |
| | | | |
| Communications Equipment: 5.50% | | | | | | | | | | | | | | | | |
Cisco Systems Incorporated | | | | | | | | | | | 660,300 | | | | 27,428,862 | |
Motorola Solutions Incorporated | | | | | | | | | | | 262,700 | | | | 26,128,142 | |
| |
| | | | 53,557,004 | |
| | | | | | | | | | | | | | | | |
| | | | |
| Internet Software & Services: 3.67% | | | | | | | | | | | | | | | | |
Alphabet Incorporated Class C † | | | | | | | | | | | 30,500 | | | | 35,683,170 | |
| | | | | | | | | | | | | | | | |
| | | | |
| IT Services: 2.70% | | | | | | | | | | | | | | | | |
Accenture plc Class A | | | | | | | | | | | 127,000 | | | | 20,408,900 | |
The Western Union Company | | | | | | | | | | | 280,638 | | | | 5,834,464 | |
| |
| | | | 26,243,364 | |
| | | | | | | | | | | | | | | | |
The accompanying notes are an integral part of these financial statements.
| | | | | | |
| Portfolio of investments—January 31, 2018 (unaudited) | | Wells Fargo Intrinsic Value Fund | | | 9 | |
| | | | | | | | | | | | | | | | |
| Security name | | | | | | | | Shares | | | Value | |
| | | | |
| Software: 4.48% | | | | | | | | | | | | | | | | |
Microsoft Corporation | | | | | | | | | | | 350,400 | | | $ | 33,291,504 | |
Oracle Corporation | | | | | | | | | | | 201,000 | | | | 10,369,590 | |
| | | | |
| | | | | | | | | | | | | | | 43,661,094 | |
| | | | | | | | | | | | | | | | |
| | | | |
| Technology Hardware, Storage & Peripherals: 0.90% | | | | | | | | | | | | | | | | |
Apple Incorporated | | | | | | | | | | | 52,200 | | | | 8,739,846 | |
| | | | | | | | | | | | | | | | |
| | | | |
Materials: 3.01% | | | | | | | | | | | | | | | | |
| | | | |
| Construction Materials: 3.01% | | | | | | | | | | | | | | | | |
Vulcan Materials Company | | | | | | | | | | | 216,100 | | | | 29,259,940 | |
| | | | | | | | | | | | | | | | |
| | | | |
Real Estate: 0.96% | | | | | | | | | | | | | | | | |
| | | | |
| Equity REITs: 0.96% | | | | | | | | | | | | | | | | |
Crown Castle International Corporation | | | | | | | | | | | 82,636 | | | | 9,318,862 | |
| | | | | | | | | | | | | | | | |
| | | | |
Telecommunication Services: 2.81% | | | | | | | | | | | | | | | | |
| | | | |
| Diversified Telecommunication Services: 2.81% | | | | | | | | | | | | | | | | |
Verizon Communications Incorporated | | | | | | | | | | | 506,400 | | | | 27,381,048 | |
| | | | | | | | | | | | | | | | |
| | | | |
Utilities: 3.22% | | | | | | | | | | | | | | | | |
| | | | |
| Electric Utilities: 2.36% | | | | | | | | | | | | | | | | |
NextEra Energy Incorporated | | | | | | | | | | | 145,200 | | | | 23,002,584 | |
| | | | | | | | | | | | | | | | |
| | | | |
| Multi-Utilities: 0.86% | | | | | | | | | | | | | | | | |
WEC Energy Group Incorporated | | | | | | | | | | | 129,600 | | | | 8,333,279 | |
| | | | | | | | | | | | | | | | |
| | | | |
Total Common Stocks (Cost $714,097,956) | | | | | | | | | | | | | | | 962,170,837 | |
| | | | | | | | | | | | | | | | |
| | | | |
| | | Yield | | | | | | | | | | |
| Short-Term Investments: 3.24% | | | | | | | | | | | | | | | | |
| | | | |
| Investment Companies: 3.24% | | | | | | | | | | | | | | | | |
Securities Lending Cash Investment LLC (l)(r)(u) | | | 1.60 | % | | | | | | | 19,890,532 | | | | 19,892,522 | |
Wells Fargo Government Money Market Fund Select Class (l)(u) | | | 1.24 | | | | | | | | 11,625,412 | | | | 11,625,412 | |
| | | | |
Total Short-Term Investments (Cost $31,517,934) | | | | | | | | | | | | | | | 31,517,934 | |
| | | | | | | | | | | | | | | | |
| | | | | | | | |
| Total investments in securities (Cost $745,615,890) | | | 102.11 | % | | | 993,688,771 | |
Other assets and liabilities, net | | | (2.11 | ) | | | (20,502,242 | ) |
| | | | | | | | |
| Total net assets | | | 100.00 | % | | $ | 973,186,529 | |
| | | | | | | | |
| † | Non-income-earning security |
| « | All or a portion of this security is on loan. |
| (l) | The issuer of the security is an affiliated person of the Fund as defined in the Investment Company Act of 1940. |
| (r) | The investment is a non-registered investment company purchased with cash collateral received from securities on loan. |
| (u) | The rate represents the 7-day annualized yield at period end. |
The accompanying notes are an integral part of these financial statements.
| | | | |
| 10 | | Wells Fargo Intrinsic Value Fund | | Portfolio of investments—January 31, 2018 (unaudited) |
Investments in Affiliates
An affiliated investment is an investment in which the Fund owns at least 5% of the outstanding voting shares of the issuer or as a result of other relationships, such as the Fund and the issuer having the same investment manager. Transactions with issuers that were either affiliated persons of the Fund at the beginning of the period or the end of the period were as follows:
| | | | | | | | | | | | | | | | | | | | | | | | | | | | | | | | | | | | |
| | | Shares,
beginning of
period | | | Shares
purchased | | | Shares
sold | | | Shares,
end of
period | | | Net
realized
gains
(losses) | | | Net
change in
unrealized
gains
(losses) | | | Income
from
affiliated
securities | | | Value,
end
of period | | | % of
net
assets | |
Short-Term Investments | | | | | | | | | | | | | | | | | | | | | | | | | | | | | | | | | | | | |
Investment Companies | | | | | | | | | | | | | | | | | | | | | | | | | | | | | | | | | | | | |
Securities Lending Cash Investment LLC | | | 17,030,618 | | | | 307,866,748 | | | | 305,006,834 | | | | 19,890,532 | | | $ | 28 | | | $ | (29 | ) | | $ | 58,101 | | | $ | 19,892,522 | | | | | |
Wells Fargo Government Money Market Fund Select Class | | | 9,318,825 | | | | 96,985,399 | | | | 94,678,812 | | | | 11,625,412 | | | | 0 | | | | 0 | | | | 59,318 | | | | 11,625,412 | | | | | |
| | | | | | | | | | | | | | | | | | | | | | | | | | | | | | | | | | | | |
| | | | | | | | | | | | | | | | | | $ | 28 | | | $ | (29 | ) | | $ | 117,419 | | | $ | 31,517,934 | | | | 3.24 | % |
| | | | | | | | | | | | | | | | | | | | | | | | | | | | | | | | | | | | |
The accompanying notes are an integral part of these financial statements.
| | | | | | |
| Statement of assets and liabilities—January 31, 2018 (unaudited) | | Wells Fargo Intrinsic Value Fund | | | 11 | |
| | | | |
| | | | |
| |
Assets | | | | |
Investments in unaffiliated securities (including $19,284,992 of securities on loan), at value (cost $714,097,956) | | $ | 962,170,837 | |
Investments in affiliated securities, at value (cost $31,517,934) | | | 31,517,934 | |
Receivable for investments sold | | | 2,534,023 | |
Receivable for Fund shares sold | | | 87,177 | |
Receivable for dividends | | | 718,864 | |
Receivable for securities lending income | | | 7,268 | |
Prepaid expenses and other assets | | | 94,364 | |
| | | | |
Total assets | | | 997,130,467 | |
| | | | |
| |
Liabilities | | | | |
Payable upon receipt of securities loaned | | | 19,891,200 | |
Payable for investments purchased | | | 2,401,928 | |
Payable for Fund shares redeemed | | | 698,181 | |
Management fee payable | | | 461,822 | |
Administration fees payable | | | 128,666 | |
Distribution fees payable | | | 14,151 | |
Trustees’ fees and expenses payable | | | 1,922 | |
Accrued expenses and other liabilities | | | 346,068 | |
| | | | |
Total liabilities | | | 23,943,938 | |
| | | | |
Total net assets | | $ | 973,186,529 | |
| | | | |
| |
NET ASSETS CONSIST OF | | | | |
Paid-in capital | | $ | 707,738,623 | |
Undistributed net investment income | | | 2,373,756 | |
Accumulated net realized gains on investments | | | 15,001,269 | |
Net unrealized gains on investments | | | 248,072,881 | |
| | | | |
Total net assets | | $ | 973,186,529 | |
| | | | |
| |
COMPUTATION OF NET ASSET VALUE AND OFFERING PRICE PER SHARE | | | | |
Net assets – Class A | | $ | 307,470,776 | |
Shares outstanding – Class A1 | | | 23,551,380 | |
Net asset value per share – Class A | | | $13.06 | |
Maximum offering price per share – Class A2 | | | $13.86 | |
Net assets – Class C | | $ | 22,220,517 | |
Shares outstanding – Class C1 | | | 1,743,999 | |
Net asset value per share – Class C | | | $12.74 | |
Net assets – Class R | | $ | 54,784 | |
Shares outstanding – Class R1 | | | 4,162 | |
Net asset value per share – Class R | | | $13.16 | |
Net assets – Class R6 | | $ | 2,544,316 | |
Shares outstanding – Class R61 | | | 197,340 | |
Net asset value per share – Class R6 | | | $12.89 | |
Net assets – Administrator Class | | $ | 488,522,817 | |
Shares outstanding – Administrator Class1 | | | 35,720,861 | |
Net asset value per share – Administrator Class | | | $13.68 | |
Net assets – Institutional Class | | $ | 152,373,319 | |
Shares outstanding – Institutional Class1 | | | 11,617,386 | |
Net asset value per share – Institutional Class | | | $13.12 | |
| 1 | The Fund has an unlimited number of authorized shares. |
| 2 | Maximum offering price is computed as 100/94.25 of net asset value. On investments of $50,000 or more, the offering price is reduced. |
The accompanying notes are an integral part of these financial statements.
| | | | |
| 12 | | Wells Fargo Intrinsic Value Fund | | Statement of operations—six months ended January 31, 2018 (unaudited) |
| | | | |
| | | | |
| |
Investment income | | | | |
Dividends (net of foreign withholding taxes of $62,921) | | $ | 8,177,776 | |
Income from affiliated securities | | | 117,419 | |
| | | | |
Total investment income | | | 8,295,195 | |
| | | | |
| |
Expenses | | | | |
Management fee | | | 3,222,129 | |
Administration fees | | | | |
Class A | | | 309,340 | |
Class C | | | 22,629 | |
Class R | | | 53 | |
Class R4 | | | 4 | 1 |
Class R6 | | | 370 | |
Administrator Class | | | 302,407 | |
Institutional Class | | | 98,869 | |
Shareholder servicing fees | | | | |
Class A | | | 356,208 | |
Class C | | | 26,939 | |
Class R | | | 63 | |
Class R4 | | | 5 | 1 |
Administrator Class | | | 581,553 | |
Distribution fees | | | | |
Class C | | | 80,818 | |
Class R | | | 63 | |
Custody and accounting fees | | | 17,721 | |
Professional fees | | | 22,574 | |
Registration fees | | | 50,425 | |
Shareholder report expenses | | | 32,022 | |
Trustees’ fees and expenses | | | 28,765 | |
Other fees and expenses | | | 12,998 | |
| | | | |
Total expenses | | | 5,165,955 | |
Less: Fee waivers and/or expense reimbursements | | | (594,509 | ) |
| | | | |
Net expenses | | | 4,571,446 | |
| | | | |
Net investment income | | | 3,723,749 | |
| | | | |
| |
REALIZED AND UNREALIZED GAINS (LOSSES) ON INVESTMENTS | | | | |
| |
Net realized gains on: | | | | |
Unaffiliated securities | | | 41,223,549 | |
Affiliated securities | | | 28 | |
| | | | |
Net realized gains on investments | | | 41,223,577 | |
| | | | |
| |
Net change in unrealized gains (losses) on: | | | | |
Unaffiliated securities | | | 66,003,443 | |
Affiliated securities | | | (29 | ) |
| | | | |
Net change in unrealized gains (losses) on investments | | | 66,003,414 | |
| | | | |
Net realized and unrealized gains (losses) on investments | | | 107,226,991 | |
| | | | |
Net increase in net assets resulting from operations | | $ | 110,950,740 | |
| | | | |
| 1 | For the period from August 1, 2017 to November 13, 2017. Effective at the close of business on November 13, 2017, Class R4 shares were liquidated and the class was subsequently closed. Class R4 shares are no longer offered by the Fund. |
The accompanying notes are an integral part of these financial statements.
| | | | | | |
| Statement of changes in net assets | | Wells Fargo Intrinsic Value Fund | | | 13 | |
| | | | | | | | | | | | | | | | |
| | | Six months ended
January 31, 2018
(unaudited) | | | Year ended
July 31, 2017 | |
| | | |
Operations | | | | | | | | | | | | |
Net investment income | | | | | | $ | 3,723,749 | | | | | | | $ | 10,341,304 | |
Net realized gains on investments | | | | | | | 41,223,577 | | | | | | | | 70,124,352 | |
Net change in unrealized gains (losses) on investments | | | | | | | 66,003,414 | | | | | | | | 41,233,576 | |
| | | | |
Net increase in net assets resulting from operations | | | | | | | 110,950,740 | | | | | | | | 121,699,232 | |
| | | | |
| | | |
Distributions to shareholders from | | | | | | | | | | | | |
Net investment income | | | | |
Class A | | | | | | | (1,516,748 | ) | | | | | | | (3,621,237 | ) |
Class C | | | | | | | 0 | | | | | | | | (86,648 | ) |
Class R | | | | | | | (163 | ) | | | | | | | (354 | ) |
Class R4 | | | | | | | 0 | 1 | | | | | | | (231 | ) |
Class R6 | | | | | | | (23,745 | ) | | | | | | | (49,302 | ) |
Administrator Class | | | | | | | (3,138,315 | ) | | | | | | | (6,085,411 | ) |
Institutional Class | | | | | | | (1,366,652 | ) | | | | | | | (2,733,344 | ) |
Net realized gains | | | | |
Class A | | | | | | | (22,059,131 | ) | | | | | | | (19,813,428 | ) |
Class B | | | | | | | N/A | | | | | | | | (17,948 | )2 |
Class C | | | | | | | (1,660,928 | ) | | | | | | | (1,747,106 | ) |
Class R | | | | | | | (3,846 | ) | | | | | | | (2,423 | ) |
Class R4 | | | | | | | 0 | 1 | | | | | | | (1,001 | ) |
Class R6 | | | | | | | (185,128 | ) | | | | | | | (195,458 | ) |
Administrator Class | | | | | | | (33,610,953 | ) | | | | | | | (28,268,900 | ) |
Institutional Class | | | | | | | (11,360,927 | ) | | | | | | | (11,235,310 | ) |
| | | | |
Total distributions to shareholders | | | | | | | (74,926,536 | ) | | | | | | | (73,858,101 | ) |
| | | | |
| | | | |
Capital share transactions | | | Shares | | | | | | | | Shares | | | | | |
Proceeds from shares sold | | | | |
Class A | | | 177,135 | | | | 2,235,284 | | | | 305,954 | | | | 3,691,813 | |
Class B | | | N/A | | | | N/A | | | | 1 | 2 | | | 13 | 2 |
Class C | | | 14,361 | | | | 175,304 | | | | 51,575 | | | | 603,442 | |
Class R | | | 190 | | | | 2,417 | | | | 719 | | | | 8,721 | |
Class R6 | | | 6,168 | | | | 77,743 | | | | 11,205 | | | | 133,634 | |
Administrator Class | | | 65,641 | | | | 868,948 | | | | 221,167 | | | | 2,768,721 | |
Institutional Class | | | 302,689 | | | | 3,872,615 | | | | 2,650,238 | | | | 32,333,431 | |
| | | | |
| | | | | | | 7,232,311 | | | | | | | | 39,539,775 | |
| | | | |
Reinvestment of distributions | | | | |
Class A | | | 1,816,483 | | | | 22,389,992 | | | | 1,877,183 | | | | 22,194,613 | |
Class B | | | N/A | | | | N/A | | | | 1,535 | 2 | | | 17,865 | 2 |
Class C | | | 131,832 | | | | 1,579,351 | | | | 138,250 | | | | 1,593,565 | |
Class R | | | 220 | | | | 2,728 | | | | 233 | | | | 2,777 | |
Class R4 | | | 0 | 1 | | | 0 | 1 | | | 104 | | | | 1,232 | |
Class R6 | | | 16,488 | | | | 201,277 | | | | 20,897 | | | | 244,760 | |
Administrator Class | | | 2,684,570 | | | | 34,693,107 | | | | 2,623,161 | | | | 32,407,128 | |
Institutional Class | | | 901,012 | | | | 11,188,786 | | | | 949,096 | | | | 11,290,466 | |
| | | | |
| | | | | | | 70,055,241 | | | | | | | | 67,752,406 | |
| | | | |
Please see footnotes on page 14.
The accompanying notes are an integral part of these financial statements.
| | | | |
| 14 | | Wells Fargo Intrinsic Value Fund | | Statement of changes in net assets |
| | | | | | | | | | | | | | | | |
| | | Six months ended
January 31, 2018
(unaudited) | | | Year ended
July 31, 2017 | |
| | | | |
| | | Shares | | | | | | Shares | | | | |
| | | | |
Capital share transactions (continued) | | | | | | | | | | | | | | | | |
Payment for shares redeemed | | | | |
Class A | | | (1,729,807 | ) | | $ | (21,997,010 | ) | | | (5,420,473 | ) | | $ | (65,302,884 | ) |
Class B | | | N/A | | | | N/A | | | | (47,468 | )2 | | | (566,965 | )2 |
Class C | | | (166,563 | ) | | | (2,059,969 | ) | | | (875,054 | ) | | | (10,310,692 | ) |
Class R | | | (32 | ) | | | (410 | ) | | | (698 | ) | | | (8,357 | ) |
Class R4 | | | (1,342 | )1 | | | (17,226 | )1 | | | 0 | | | | 0 | |
Class R6 | | | (17,301 | ) | | | (220,658 | ) | | | (78,948 | ) | | | (936,987 | ) |
Administrator Class | | | (1,925,884 | ) | | | (25,602,298 | ) | | | (5,523,798 | ) | | | (69,697,862 | ) |
Institutional Class | | | (2,396,022 | ) | | | (30,145,825 | ) | | | (8,606,311 | ) | | | (104,462,351 | ) |
| | | | |
| | | | | | | (80,043,396 | ) | | | | | | | (251,286,098 | ) |
| | | | |
Net decrease in net assets resulting from capital share transactions | | | | | | | (2,755,844 | ) | | | | | | | (143,993,917 | ) |
| | | | |
Total increase (decrease) in net assets | | | | | | | 33,268,360 | | | | | | | | (96,152,786 | ) |
| | | | |
| | | | |
Net assets | | | | | | | | | | | | | | | | |
Beginning of period | | | | | | | 939,918,169 | | | | | | | | 1,036,070,955 | |
| | | | |
End of period | | | | | | $ | 973,186,529 | | | | | | | $ | 939,918,169 | |
| | | | |
Undistributed net investment income | | | | | | $ | 2,373,756 | | | | | | | $ | 4,695,630 | |
| | | | |
| 1 | For the period from August 1, 2017 to November 13, 2017. Effective at the close of business on November 13, 2017, Class R4 shares were liquidated and the class was subsequently closed. Class R4 shares are no longer offered by the Fund. |
| 2 | For the period from August 1, 2016 to May 5, 2017. Effective at the close of business on May 5, 2017, Class B shares were converted to Class A shares and are no longer offered by the Fund. |
The accompanying notes are an integral part of these financial statements.
| | | | | | |
| Financial highlights | | Wells Fargo Intrinsic Value Fund | | | 15 | |
(For a share outstanding throughout each period)
| | | | | | | | | | | | | | | | | | | | | | | | |
| | | Six months ended
January 31, 2018
(unaudited) | | | Year ended July 31 | |
| CLASS A | | | 2017 | | | 2016 | | | 2015 | | | 2014 | | | 2013 | |
Net asset value, beginning of period | | | $12.61 | | | | $12.01 | | | | $13.73 | | | | $13.60 | | | | $12.52 | | | | $10.44 | |
Net investment income | | | 0.04 | | | | 0.12 | 1 | | | 0.13 | | | | 0.10 | | | | 0.07 | | | | 0.07 | 1 |
Net realized and unrealized gains (losses) on investments | | | 1.47 | | | | 1.43 | | | | (0.42 | ) | | | 1.09 | | | | 1.53 | | | | 2.75 | |
| | | | | | | | | | | | | | | | | | | | | | | | |
Total from investment operations | | | 1.51 | | | | 1.55 | | | | (0.29 | ) | | | 1.19 | | | | 1.60 | | | | 2.82 | |
Distributions to shareholders from | | | | | | | | | | | | | | | | | | | | | | | | |
Net investment income | | | (0.06 | ) | | | (0.14 | ) | | | (0.11 | ) | | | (0.07 | ) | | | (0.06 | ) | | | (0.10 | ) |
Net realized gains | | | (1.00 | ) | | | (0.81 | ) | | | (1.32 | ) | | | (0.99 | ) | | | (0.46 | ) | | | (0.64 | ) |
| | | | | | | | | | | | | | | | | | | | | | | | |
Total distributions to shareholders | | | (1.06 | ) | | | (0.95 | ) | | | (1.43 | ) | | | (1.06 | ) | | | (1.52 | ) | | | (0.74 | ) |
Net asset value, end of period | | | $13.06 | | | | $12.61 | | | | $12.01 | | | | $13.73 | | | | $13.60 | | | | $12.52 | |
Total return2 | | | 12.51 | % | | | 13.50 | % | | | (1.73 | )% | | | 9.19 | % | | | 13.09 | % | | | 28.53 | % |
Ratios to average net assets (annualized) | | | | | | | | | | | | | | | | | | | | | | | | |
Gross expenses | | | 1.18 | % | | | 1.17 | % | | | 1.17 | % | | | 1.20 | % | | | 1.21 | % | | | 1.20 | % |
Net expenses | | | 1.10 | % | | | 1.10 | % | | | 1.10 | % | | | 1.16 | % | | | 1.16 | % | | | 1.16 | % |
Net investment income | | | 0.67 | % | | | 0.95 | % | | | 1.12 | % | | | 0.75 | % | | | 0.53 | % | | | 0.57 | % |
Supplemental data | | | | | | | | | | | | | | | | | | | | | | | | |
Portfolio turnover rate | | | 9 | % | | | 27 | % | | | 34 | % | | | 29 | % | | | 23 | % | | | 28 | % |
Net assets, end of period (000s omitted) | | | $307,471 | | | | $293,599 | | | | $318,543 | | | | $372,443 | | | | $391,028 | | | | $386,655 | |
| 1 | Calculated based upon average shares outstanding |
| 2 | Total return calculations do not include any sales charges. Returns for periods of less than one year are not annualized. |
The accompanying notes are an integral part of these financial statements.
| | | | |
| 16 | | Wells Fargo Intrinsic Value Fund | | Financial highlights |
(For a share outstanding throughout each period)
| | | | | | | | | | | | | | | | | | | | | | | | |
| | | Six months ended
January 31, 2018
(unaudited) | | | Year ended July 31 | |
| CLASS C | | | 2017 | | | 2016 | | | 2015 | | | 2014 | | | 2013 | |
Net asset value, beginning of period | | | $12.31 | | | | $11.74 | | | | $13.45 | | | | $13.36 | | | | $12.35 | | | | $10.30 | |
Net investment income (loss) | | | (0.01 | ) | | | 0.02 | 1 | | | 0.03 | | | | 0.00 | 2 | | | (0.03 | ) | | | (0.01 | )1 |
Net realized and unrealized gains (losses) on investments | | | 1.44 | | | | 1.40 | | | | (0.41 | ) | | | 1.08 | | | | 1.50 | | | | 2.72 | |
| | | | | | | | | | | | | | | | | | | | | | | | |
Total from investment operations | | | 1.43 | | | | 1.42 | | | | (0.38 | ) | | | 1.08 | | | | 1.47 | | | | 2.71 | |
Distributions to shareholders from | | | | | | | | | | | | | | | | | | | | | | | | |
Net investment income | | | 0.00 | | | | (0.04 | ) | | | (0.01 | ) | | | 0.00 | | | | 0.00 | | | | (0.02 | ) |
Net realized gains | | | (1.00 | ) | | | (0.81 | ) | | | (1.32 | ) | | | (0.99 | ) | | | (0.46 | ) | | | (0.64 | ) |
| | | | | | | | | | | | | | | | | | | | | | | | |
Total distributions to shareholders | | | (1.00 | ) | | | (0.85 | ) | | | (1.33 | ) | | | (0.99 | ) | | | (0.46 | ) | | | (0.66 | ) |
Net asset value, end of period | | | $12.74 | | | | $12.31 | | | | $11.74 | | | | $13.45 | | | | $13.36 | | | | $12.35 | |
Total return3 | | | 12.09 | % | | | 12.58 | % | | | (2.47 | )% | | | 8.42 | % | | | 12.24 | % | | | 27.50 | % |
Ratios to average net assets (annualized) | | | | | | | | | | | | | | | | | | | | | | | | |
Gross expenses | | | 1.93 | % | | | 1.93 | % | | | 1.93 | % | | | 1.96 | % | | | 1.97 | % | | | 1.97 | % |
Net expenses | | | 1.86 | % | | | 1.86 | % | | | 1.86 | % | | | 1.91 | % | | | 1.91 | % | | | 1.91 | % |
Net investment income (loss) | | | (0.09 | )% | | | 0.20 | % | | | 0.37 | % | | | 0.00 | % | | | (0.22 | )% | | | (0.05 | )% |
Supplemental data | | | | | | | | | | | | | | | | | | | | | | | | |
Portfolio turnover rate | | | 9 | % | | | 27 | % | | | 34 | % | | | 29 | % | | | 23 | % | | | 28 | % |
Net assets, end of period (000s omitted) | | | $22,221 | | | | $21,727 | | | | $28,756 | | | | $36,098 | | | | $36,654 | | | | $35,616 | |
| 1 | Calculated based upon average shares outstanding |
| 2 | Amount is less than $0.005. |
| 3 | Total return calculations do not include any sales charges. Returns for periods of less than one year are not annualized. |
The accompanying notes are an integral part of these financial statements.
| | | | | | |
| Financial highlights | | Wells Fargo Intrinsic Value Fund | | | 17 | |
(For a share outstanding throughout each period)
| | | | | | | | | | | | | | | | | | | | | | | | |
| | | Six months ended
January 31, 2018
(unaudited) | | | Year ended July 31 | |
| CLASS R | | | 2017 | | | 2016 | | | 2015 | | | 2014 | | | 20131 | |
Net asset value, beginning of period | | | $12.70 | | | | $12.09 | | | | $13.81 | | | | $13.66 | | | | $12.55 | | | | $11.20 | |
Net investment income | | | 0.02 | | | | 0.08 | 2 | | | 0.10 | | | | 0.05 | | | | 0.03 | | | | 0.00 | 3 |
Net realized and unrealized gains (losses) on investments | | | 1.48 | | | | 1.45 | | | | (0.43 | ) | | | 1.12 | | | | 1.54 | | | | 1.35 | |
| | | | | | | | | | | | | | | | | | | | | | | | |
Total from investment operations | | | 1.50 | | | | 1.53 | | | | (0.33 | ) | | | 1.17 | | | | 1.57 | | | | 1.35 | |
Distributions to shareholders from | | | | | | | | | | | | | | | | | | | | | | | | |
Net investment income | | | (0.04 | ) | | | (0.11 | ) | | | (0.07 | ) | | | (0.03 | ) | | | 0.00 | | | | 0.00 | |
Net realized gains | | | (1.00 | ) | | | (0.81 | ) | | | (1.32 | ) | | | (0.99 | ) | | | (0.46 | ) | | | 0.00 | |
| | | | | | | | | | | | | | | | | | | | | | | | |
Total distributions to shareholders | | | (1.04 | ) | | | (0.92 | ) | | | (1.39 | ) | | | (1.02 | ) | | | (0.46 | ) | | | 0.00 | |
Net asset value, end of period | | | $13.16 | | | | $12.70 | | | | $12.09 | | | | $13.81 | | | | $13.66 | | | | $12.55 | |
Total return4 | | | 12.30 | % | | | 13.22 | % | | | (1.99 | )% | | | 8.96 | % | | | 12.77 | % | | | 12.05 | % |
Ratios to average net assets (annualized) | | | | | | | | | | | | | | | | | | | | | | | | |
Gross expenses | | | 1.44 | % | | | 1.44 | % | | | 1.44 | % | | | 1.47 | % | | | 1.49 | % | | | 1.46 | % |
Net expenses | | | 1.36 | % | | | 1.36 | % | | | 1.36 | % | | | 1.40 | % | | | 1.41 | % | | | 1.41 | % |
Net investment income | | | 0.41 | % | | | 0.69 | % | | | 0.86 | % | | | 0.50 | % | | | 0.26 | % | | | 0.01 | % |
Supplemental data | | | | | | | | | | | | | | | | | | | | | | | | |
Portfolio turnover rate | | | 9 | % | | | 27 | % | | | 34 | % | | | 29 | % | | | 23 | % | | | 28 | % |
Net assets, end of period (000s omitted) | | | $55 | | | | $48 | | | | $43 | | | | $41 | | | | $28 | | | | $18 | |
| 1 | For the period from March 1, 2013 (commencement of class operations) to July 31, 2013 |
| 2 | Calculated based upon average shares outstanding |
| 3 | Amount is less than $0.005. |
| 4 | Returns for periods of less than one year are not annualized. |
The accompanying notes are an integral part of these financial statements.
| | | | |
| 18 | | Wells Fargo Intrinsic Value Fund | | Financial highlights |
(For a share outstanding throughout each period)
| | | | | | | | | | | | | | | | | | | | | | | | |
| | | Six months ended
January 31, 2018
(unaudited) | | | Year ended July 31 | |
| CLASS R6 | | | 2017 | | | 2016 | | | 2015 | | | 2014 | | | 20131 | |
Net asset value, beginning of period | | | $12.49 | | | | $11.90 | | | | $13.62 | | | | $13.60 | | | | $12.56 | | | | $11.10 | |
Net investment income | | | 0.07 | | | | 0.17 | 2 | | | 0.17 | | | | 0.17 | 2 | | | 0.14 | 2 | | | 0.19 | |
Net realized and unrealized gains (losses) on investments | | | 1.45 | | | | 1.42 | | | | (0.40 | ) | | | 1.08 | | | | 1.47 | | | | 2.06 | |
| | | | | | | | | | | | | | | | | | | | | | | | |
Total from investment operations | | | 1.52 | | | | 1.59 | | | | (0.23 | ) | | | 1.25 | | | | 1.61 | | | | 2.25 | |
Distributions to shareholders from | | | | | | | | | | | | | | | | | | | | | | | | |
Net investment income | | | (0.12 | ) | | | (0.19 | ) | | | (0.17 | ) | | | (0.24 | ) | | | (0.11 | ) | | | (0.15 | ) |
Net realized gains | | | (1.00 | ) | | | (0.81 | ) | | | (1.32 | ) | | | (0.99 | ) | | | (0.46 | ) | | | (0.64 | ) |
| | | | | | | | | | | | | | | | | | | | | | | | |
Total distributions to shareholders | | | (1.12 | ) | | | (1.00 | ) | | | (1.49 | ) | | | (1.23 | ) | | | (0.57 | ) | | | (0.79 | ) |
Net asset value, end of period | | | $12.89 | | | | $12.49 | | | | $11.90 | | | | $13.62 | | | | $13.60 | | | | $12.56 | |
Total return3 | | | 12.70 | % | | | 14.03 | % | | | (1.30 | )% | | | 9.74 | % | | | 13.19 | % | | | 21.84 | % |
Ratios to average net assets (annualized) | | | | | | | | | | | | | | | | | | | | | | | | |
Gross expenses | | | 0.75 | % | | | 0.75 | % | | | 0.75 | % | | | 0.74 | % | | | 0.74 | % | | | 0.73 | % |
Net expenses | | | 0.65 | % | | | 0.65 | % | | | 0.65 | % | | | 0.65 | % | | | 0.65 | % | | | 0.65 | % |
Net investment income | | | 1.14 | % | | | 1.40 | % | | | 1.47 | % | | | 1.25 | % | | | 1.10 | % | | | 0.85 | % |
Supplemental data | | | | | | | | | | | | | | | | | | | | | | | | |
Portfolio turnover rate | | | 9 | % | | | 27 | % | | | 34 | % | | | 29 | % | | | 23 | % | | | 28 | % |
Net assets, end of period (000s omitted) | | | $2,544 | | | | $2,397 | | | | $2,842 | | | | $169 | | | | $150 | | | | $3,359 | |
| 1 | For the period from November 30, 2012 (commencement of class operations) to July 31, 2013 |
| 2 | Calculated based upon average shares outstanding |
| 3 | Returns for periods of less than one year are not annualized. |
The accompanying notes are an integral part of these financial statements.
| | | | | | |
| Financial highlights | | Wells Fargo Intrinsic Value Fund | | | 19 | |
(For a share outstanding throughout each period)
| | | | | | | | | | | | | | | | | | | | | | | | |
| | | Six months ended
January 31, 2018
(unaudited) | | | Year ended July 31 | |
| ADMINISTRATOR CLASS | | | 2017 | | | 2016 | | | 2015 | | | 2014 | | | 2013 | |
Net asset value, beginning of period | | | $13.17 | | | | $12.51 | | | | $14.25 | | | | $14.08 | | | | $12.95 | | | | $10.78 | |
Net investment income | | | 0.05 | | | | 0.14 | 1 | | | 0.15 | | | | 0.13 | | | | 0.10 | | | | 0.08 | 1 |
Net realized and unrealized gains (losses) on investments | | | 1.55 | | | | 1.49 | | | | (0.43 | ) | | | 1.14 | | | | 1.58 | | | | 2.87 | |
| | | | | | | | | | | | | | | | | | | | | | | | |
Total from investment operations | | | 1.60 | | | | 1.63 | | | | (0.28 | ) | | | 1.27 | | | | 1.68 | | | | 2.95 | |
Distributions to shareholders from | | | | | | | | | | | | | | | | | | | | | | | | |
Net investment income | | | (0.09 | ) | | | (0.16 | ) | | | (0.14 | ) | | | (0.11 | ) | | | (0.09 | ) | | | (0.14 | ) |
Net realized gains | | | (1.00 | ) | | | (0.81 | ) | | | (1.32 | ) | | | (0.99 | ) | | | (0.46 | ) | | | (0.64 | ) |
| | | | | | | | | | | | | | | | | | | | | | | | |
Total distributions to shareholders | | | (1.09 | ) | | | (0.97 | ) | | | (1.46 | ) | | | (1.10 | ) | | | (0.55 | ) | | | (0.78 | ) |
Net asset value, end of period | | | $13.68 | | | | $13.17 | | | | $12.51 | | | | $14.25 | | | | $14.08 | | | | $12.95 | |
Total return2 | | | 12.63 | % | | | 13.66 | % | | | (1.58 | )% | | | 9.42 | % | | | 13.36 | % | | | 28.77 | % |
Ratios to average net assets (annualized) | | | | | | | | | | | | | | | | | | | | | | | | |
Gross expenses | | | 1.10 | % | | | 1.10 | % | | | 1.10 | % | | | 1.06 | % | | | 1.06 | % | | | 1.05 | % |
Net expenses | | | 0.95 | % | | | 0.95 | % | | | 0.95 | % | | | 0.95 | % | | | 0.95 | % | | | 0.95 | % |
Net investment income | | | 0.82 | % | | | 1.10 | % | | | 1.27 | % | | | 0.95 | % | | | 0.74 | % | | | 0.68 | % |
Supplemental data | | | | | | | | | | | | | | | | | | | | | | | | |
Portfolio turnover rate | | | 9 | % | | | 27 | % | | | 34 | % | | | 29 | % | | | 23 | % | | | 28 | % |
Net assets, end of period (000s omitted) | | | $488,523 | | | | $459,650 | | | | $470,152 | | | | $529,293 | | | | $534,641 | | | | $515,012 | |
| 1 | Calculated based upon average shares outstanding |
| 2 | Returns for periods of less than one year are not annualized. |
The accompanying notes are an integral part of these financial statements.
| | | | |
| 20 | | Wells Fargo Intrinsic Value Fund | | Financial highlights |
(For a share outstanding throughout each period)
| | | | | | | | | | | | | | | | | | | | | | | | |
| | | Six months ended
January 31, 2018
(unaudited) | | | Year ended July 31 | |
| INSTITUTIONAL CLASS | | | 2017 | | | 2016 | | | 2015 | | | 2014 | | | 2013 | |
Net asset value, beginning of period | | | $12.68 | | | | $12.08 | | | | $13.80 | | | | $13.67 | | | | $12.58 | | | | $10.48 | |
Net investment income | | | 0.07 | 1 | | | 0.17 | 1 | | | 0.18 | | | | 0.15 | | | | 0.13 | | | | 0.16 | |
Net realized and unrealized gains (losses) on investments | | | 1.48 | | | | 1.43 | | | | (0.41 | ) | | | 1.11 | | | | 1.53 | | | | 2.73 | |
| | | | | | | | | | | | | | | | | | | | | | | | |
Total from investment operations | | | 1.55 | | | | 1.60 | | | | (0.23 | ) | | | 1.26 | | | | 1.66 | | | | 2.89 | |
Distributions to shareholders from | | | | | | | | | | | | | | | | | | | | | | | | |
Net investment income | | | (0.11 | ) | | | (0.19 | ) | | | (0.17 | ) | | | (0.14 | ) | | | (1.11 | ) | | | (0.15 | ) |
Net realized gains | | | (1.00 | ) | | | (0.81 | ) | | | (1.32 | ) | | | (0.99 | ) | | | (0.46 | ) | | | (0.64 | ) |
| | | | | | | | | | | | | | | | | | | | | | | | |
Total distributions to shareholders | | | (1.11 | ) | | | (1.00 | ) | | | (1.49 | ) | | | (1.13 | ) | | | (0.57 | ) | | | (0.79 | ) |
Net asset value, end of period | | | $13.12 | | | | $12.68 | | | | $12.08 | | | | $13.80 | | | | $13.67 | | | | $12.58 | |
Total return2 | | | 12.79 | % | | | 13.88 | % | | | (1.27 | )% | | | 9.66 | % | | | 13.64 | % | | | 29.04 | % |
Ratios to average net assets (annualized) | | | | | | | | | | | | | | | | | | | | | | | | |
Gross expenses | | | 0.85 | % | | | 0.85 | % | | | 0.85 | % | | | 0.79 | % | | | 0.79 | % | | | 0.79 | % |
Net expenses | | | 0.70 | % | | | 0.70 | % | | | 0.70 | % | | | 0.70 | % | | | 0.70 | % | | | 0.73 | % |
Net investment income | | | 1.08 | % | | | 1.36 | % | | | 1.52 | % | | | 1.20 | % | | | 0.99 | % | | | 1.21 | % |
Supplemental data | | | | | | | | | | | | | | | | | | | | | | | | |
Portfolio turnover rate | | | 9 | % | | | 27 | % | | | 34 | % | | | 29 | % | | | 23 | % | | | 28 | % |
Net assets, end of period (000s omitted) | | | $152,373 | | | | $162,480 | | | | $215,175 | | | | $255,565 | | | | $244,378 | | | | $221,128 | |
| 1 | Calculated based upon average shares outstanding |
| 2 | Returns for periods of less than one year are not annualized. |
The accompanying notes are an integral part of these financial statements.
| | | | | | |
| Notes to financial statements (unaudited) | | Wells Fargo Intrinsic Value Fund | | | 21 | |
1. ORGANIZATION
Wells Fargo Funds Trust (the “Trust”), a Delaware statutory trust organized on March 10, 1999, is an open-end management investment company registered under the Investment Company Act of 1940, as amended (the “1940 Act”). As an investment company, the Trust follows the accounting and reporting guidance in Financial Accounting Standards Board Accounting Standards Codification Topic 946, Financial Services – Investment Companies. These financial statements report on the Wells Fargo Intrinsic Value Fund (the “Fund”) which is a diversified series of the Trust.
Effective at the close of business on November 13, 2017, Class R4 shares were liquidated and the class was subsequently closed. Class R4 shares are no longer offered by the Fund. Information for Class R4 shares reflected in the financial statements represents activity through November 13, 2017.
Effective at the close of business on May 5, 2017, Class B shares were converted to Class A shares and are no longer offered by the Fund. Information for Class B shares reflected in the financial statements represents activity through May 5, 2017.
2. SIGNIFICANT ACCOUNTING POLICIES
The following significant accounting policies, which are consistently followed in the preparation of the financial statements of the Fund, are in conformity with U.S. generally accepted accounting principles which require management to make estimates and assumptions that affect the reported amounts of assets and liabilities, disclosure of contingent assets and liabilities at the date of the financial statements, and the reported amounts of revenues and expenses during the reporting period. Actual results could differ from those estimates.
Securities valuation
All investments are valued each business day as of the close of regular trading on the New York Stock Exchange (generally 4 p.m. Eastern Time), although the Fund may deviate from this calculation time under unusual or unexpected circumstances.
Equity securities that are listed on a foreign or domestic exchange or market are valued at the official closing price or, if none, the last sales price. If no sale occurs on the principal exchange or market that day, a fair value price will be determined in accordance with the Fund’s Valuation Procedures.
Investments in registered open-end investment companies are valued at net asset value. Interests in non-registered investment companies that are redeemable at net asset value are fair valued normally at net asset value.
Investments which are not valued using any of the methods discussed above are valued at their fair value, as determined in good faith by the Board of Trustees of the Fund. The Board of Trustees has established a Valuation Committee comprised of the Trustees and has delegated to it the authority to take any actions regarding the valuation of portfolio securities that the Valuation Committee deems necessary or appropriate, including determining the fair value of portfolio securities, unless the determination has been delegated to the Wells Fargo Asset Management Pricing Committee of Wells Fargo Funds Management, LLC (“Funds Management”). The Board of Trustees retains the authority to make or ratify any valuation decisions or approve any changes to the Valuation Procedures as it deems appropriate. On a quarterly basis, the Board of Trustees receives reports on any valuation actions taken by the Valuation Committee or the Wells Fargo Asset Management Pricing Committee which may include items for ratification.
Valuations of fair valued securities are compared to the next actual sales price when available, or other appropriate market values, to assess the continued appropriateness of the fair valuation methodologies used. These securities are fair valued on a day-to-day basis, taking into consideration changes to appropriate market information and any significant changes to the inputs considered in the valuation process until there is a readily available price provided on an exchange or by an independent pricing service. Valuations received from an independent pricing service or independent broker-dealer quotes are periodically validated by comparisons to most recent trades and valuations provided by other independent pricing services in addition to the review of prices by the manager and/or subadviser. Unobservable inputs used in determining fair valuations are identified based on the type of security, taking into consideration factors utilized by market participants in valuing the investment, knowledge about the issuer and the current market environment.
Security loans
The Fund may lend its securities from time to time in order to earn additional income in the form of fees or interest on securities received as collateral or the investment of any cash received as collateral. The Fund continues to receive interest or dividends on the securities loaned. The Fund receives collateral in the form of cash or securities with a value at least equal to the value of the securities on loan. The value of the loaned securities is determined at the close of each business day and any additional required collateral is delivered to the Fund on the next business day. In a securities lending transaction, the net asset value of the Fund will be affected by an increase or decrease in the value of the securities loaned and by an increase or decrease in the value of the instrument in which collateral is invested. The amount
| | | | |
| 22 | | Wells Fargo Intrinsic Value Fund | | Notes to financial statements (unaudited) |
of securities lending activity undertaken by the Fund fluctuates from time to time. In the event of default or bankruptcy by the borrower, the Fund may be prevented from recovering the loaned securities or gaining access to the collateral or may experience delays or costs in doing so. In addition, the investment of any cash collateral received may lose all or part of its value. The Fund has the right under the lending agreement to recover the securities from the borrower on demand.
The Fund lends its securities through an unaffiliated securities lending agent. Cash collateral received in connection with its securities lending transactions is invested in Securities Lending Cash Investments, LLC (the “Securities Lending Fund”). The Securities Lending Fund is exempt from registration under Section 3(c)(7) of the 1940 Act and is managed by Funds Management and is subadvised by Wells Capital Management Incorporated (“WellsCap”), an affiliate of Funds Management and an indirect wholly owned subsidiary of Wells Fargo & Company (“Wells Fargo”). Funds Management receives an advisory fee starting at 0.05% and declining to 0.01% as the average daily net assets of the Securities Lending Fund increase. All of the fees received by Funds Management are paid to WellsCap for its services as subadviser. The Securities Lending Fund seeks to provide a positive return compared to the daily Fed Funds Open Rate by investing in high-quality, U.S. dollar-denominated short-term money market instruments. Securities Lending Fund investments are valued at the evaluated bid price provided by an independent pricing service. Income earned from investment in the Securities Lending Fund is included in income from affiliated securities on the Statement of Operations.
Security transactions and income recognition
Securities transactions are recorded on a trade date basis. Realized gains or losses are recorded on the basis of identified cost.
Dividend income is recognized on the ex-dividend date. Dividend income is recorded net of foreign taxes withheld where recovery of such taxes is not assured.
Distributions to shareholders
Distributions to shareholders from net investment income and net realized gains, if any, are recorded on the ex-dividend date. Such distributions are determined in accordance with income tax regulations and may differ from U.S. generally accepted accounting principles. Dividend sources are estimated at the time of declaration. The tax character of distributions is determined as of the Fund’s fiscal year end. Therefore, a portion of the Fund’s distributions made prior to the Fund’s fiscal year end may be categorized as a tax return of capital.
Federal and other taxes
The Fund intends to continue to qualify as a regulated investment company by distributing substantially all of its investment company taxable income and any net realized capital gains (after reduction for capital loss carryforwards) sufficient to relieve it from all, or substantially all, federal income taxes. Accordingly, no provision for federal income taxes was required.
The Fund’s income and federal excise tax returns and all financial records supporting those returns for the prior three fiscal years are subject to examination by the federal and Delaware revenue authorities. Management has analyzed the Fund’s tax positions taken on federal, state, and foreign tax returns for all open tax years and does not believe that there are any uncertain tax positions that require recognition of a tax liability.
As of January 31, 2018, the aggregate cost of all investments for federal income tax purposes was $745,260,895 and the unrealized gains (losses) consisted of:
| | | | |
Gross unrealized gains | | $ | 266,331,004 | |
Gross unrealized losses | | | (17,903,128 | ) |
Net unrealized gains | | $ | 248,427,876 | |
Class allocations
The separate classes of shares offered by the Fund differ principally in applicable sales charges, distribution, shareholder servicing, and administration fees. Class specific expenses are charged directly to that share class. Investment income, common expenses, and realized and unrealized gains (losses) on investments are allocated daily to each class of shares based on the relative proportion of net assets of each class.
3. FAIR VALUATION MEASUREMENTS
Fair value measurements of investments are determined within a framework that has established a fair value hierarchy based upon the various data inputs utilized in determining the value of the Fund’s investments. The three-level hierarchy gives the highest priority to unadjusted quoted prices in active markets for identical assets or liabilities (Level 1) and the lowest priority to unobservable inputs (Level 3). The Fund’s investments are classified within the fair value hierarchy
| | | | | | |
| Notes to financial statements (unaudited) | | Wells Fargo Intrinsic Value Fund | | | 23 | |
based on the lowest level of input that is significant to the fair value measurement. The inputs are summarized into three broad levels as follows:
| ∎ | | Level 1 – quoted prices in active markets for identical securities |
| ∎ | | Level 2 – other significant observable inputs (including quoted prices for similar securities, interest rates, prepayment speeds, credit risk, etc.) |
| ∎ | | Level 3 – significant unobservable inputs (including the Fund’s own assumptions in determining the fair value of investments) |
The inputs or methodologies used for valuing investments in securities are not necessarily an indication of the risk associated with investing in those securities.
The following is a summary of the inputs used in valuing the Fund’s assets and liabilities as of January 31, 2018:
| | | | | | | | | | | | | | | | |
| | | Quoted prices
(Level 1) | | | Other significant
observable inputs
(Level 2) | | | Significant
unobservable inputs (Level 3) | | | Total | |
Assets | | | | | | | | | | | | | | | | |
Investments in: | | | | | | | | | | | | | | | | |
| | | | |
Common stocks | | | | | | | | | | | | | | | | |
Consumer discretionary | | $ | 105,714,630 | | | $ | 0 | | | $ | 0 | | | $ | 105,714,630 | |
Consumer staples | | | 78,094,452 | | | | 0 | | | | 0 | | | | 78,094,452 | |
Energy | | | 99,636,180 | | | | 0 | | | | 0 | | | | 99,636,180 | |
Financials | | | 191,240,838 | | | | 0 | | | | 0 | | | | 191,240,838 | |
Health care | | | 101,282,323 | | | | 0 | | | | 0 | | | | 101,282,323 | |
Industrials | | | 121,022,223 | | | | 0 | | | | 0 | | | | 121,022,223 | |
Information technology | | | 167,884,478 | | | | 0 | | | | 0 | | | | 167,884,478 | |
Materials | | | 29,259,940 | | | | 0 | | | | 0 | | | | 29,259,940 | |
Real estate | | | 9,318,862 | | | | 0 | | | | 0 | | | | 9,318,862 | |
Telecommunication services | | | 27,381,048 | | | | 0 | | | | 0 | | | | 27,381,048 | |
Utilities | | | 31,335,863 | | | | 0 | | | | 0 | | | | 31,335,863 | |
| | | | |
Short-term investments | | | | | | | | | | | | | | | | |
Investment companies | | | 11,625,412 | | | | 0 | | | | 0 | | | | 11,625,412 | |
Investments measured at net asset value* | | | | | | | | | | | | | | | 19,892,522 | |
Total assets | | $ | 973,796,249 | | | $ | 0 | | | $ | 0 | | | $ | 993,688,771 | |
| * | Investments that are measured at fair value using the net asset value per share (or its equivalent) as a practical expedient have not been categorized in the fair value hierarchy. The fair value amount presented in the table is intended to permit reconciliation of the fair value hierarchy to the amounts presented in the Statement of Assets and Liabilities. The Fund’s investment in Securities Lending Cash Investments, LLC valued at $19,982,522 does not have a redemption period notice, can be redeemed daily and does not have any unfunded commitments. |
The Fund recognizes transfers between levels within the fair value hierarchy at the end of the reporting period. At January 31, 2018, the Fund did not have any transfers into/out of Level 1, Level 2, or Level 3.
4. TRANSACTIONS WITH AFFILIATES
Management fee
Funds Management, an indirect wholly owned subsidiary of Wells Fargo, is the manager of the Fund and provides advisory and fund-level administrative services under an investment management agreement. Under the investment management agreement, Funds Management is responsible for, among other services, implementing the investment objectives and strategies of the Fund, supervising the subadviser, providing fund-level administrative services in connection with the Fund’s operations, and providing any other fund-level administrative services reasonably necessary for the operation of the Fund. As compensation for its services under the investment management agreement, Funds Management is entitled to receive an annual management fee starting at 0.70% and declining to 0.505% as the average daily net assets of the Fund increase. For the six months ended January 31, 2018, the management fee was equivalent to an annual rate of 0.69% of the Fund’s average daily net assets.
| | | | |
| 24 | | Wells Fargo Intrinsic Value Fund | | Notes to financial statements (unaudited) |
Funds Management has retained the services of a subadviser to provide daily portfolio management to the Fund. The fee for subadvisory services is borne by Funds Management. WellsCap is the subadviser to the Fund and is entitled to receive a fee from Funds Management at an annual rate starting at 0.35% and declining to 0.25% as the average daily net assets of the Fund increase.
Administration fees
Under a class-level administration agreement, Funds Management provides class-level administrative services to the Fund, which includes paying fees and expenses for services provided by the transfer agent, sub-transfer agents, omnibus account servicers and record-keepers. As compensation for its services under the class-level administration agreement, Funds Management receives an annual fee which is calculated based on the average daily net assets of each class as follows:
| | | | |
| | | Class-level
administration fee | |
Class A, Class C, Class R | | | 0.21 | % |
Class R4 | | | 0.08 | |
Class R6 | | | 0.03 | |
Administrator Class, Institutional Class | | | 0.13 | |
Funds Management has contractually waived and/or reimbursed management and administration fees to the extent necessary to maintain certain net operating expense ratios for the Fund. Waiver of fees and/or reimbursement of expenses by Funds Management were made first from fund level expenses on a proportionate basis and then from class specific expenses. Funds Management has committed through November 30, 2018 to waive fees and/or reimburse expenses to the extent necessary to cap the Fund’s expenses at 1.11% for Class A shares, 1.86% for Class C shares, 1.36% for Class R shares, 0.65% for Class R6 shares, 0.95% for Administrator Class shares, and 0.70% for Institutional Class shares. After this time, the cap may be increased or the commitment to maintain the cap may be terminated only with the approval of the Board of Trustees.
Distribution fees
The Trust has adopted a distribution plan for Class C and Class R shares of the Fund pursuant to Rule 12b-1 under the 1940 Act. Distribution fees are charged to Class C and Class R shares and paid to Wells Fargo Funds Distributor, LLC (“Funds Distributor”), the principal underwriter, at an annual rate of 0.75% of the average daily net assets of Class C shares and 0.25% of the average daily net assets of Class R shares.
In addition, Funds Distributor is entitled to receive the front-end sales charge from the purchase of Class A shares and a contingent deferred sales charge on the redemption of certain Class A shares. Funds Distributor is also entitled to receive the contingent deferred sales charges from redemptions of Class C shares. For the six months ended January 31, 2018, Funds Distributor received $2,145 from the sale of Class A shares. No contingent deferred sales charges were incurred by Class A and Class C shares for the six months ended January 31, 2018.
Shareholder servicing fees
The Trust has entered into contracts with one or more shareholder servicing agents, whereby Class A, Class C, Class R, and Administrator Class of the Fund are charged a fee at an annual rate of 0.25% of the average daily net assets of each respective class. Class R4 was charged a fee at an annual rate of 0.10% of its average daily net assets.
A portion of these total shareholder servicing fees were paid to affiliates of Wells Fargo.
Interfund transactions
The Fund may purchase or sell investment securities to other Wells Fargo affiliates pursuant to Rule 17a-7 under the 1940 Act and under procedures adopted by the Board of Trustees. The procedures have been designed to ensure that these interfund transactions, which do not incur broker commissions, are effected at current market prices.
5. INVESTMENT PORTFOLIO TRANSACTIONS
Purchases and sales of investments, excluding U.S. government obligations (if any) and short-term securities, for the six months ended January 31, 2018 were $546,174,673 and $352,628,269, respectively.
6. BANK BORROWINGS
The Trust (excluding the money market funds and certain other funds) and Wells Fargo Variable Trust are parties to a $280,000,000 revolving credit agreement whereby the Fund is permitted to use bank borrowings for temporary or
| | | | | | |
| Notes to financial statements (unaudited) | | Wells Fargo Intrinsic Value Fund | | | 25 | |
emergency purposes, such as to fund shareholder redemption requests. Interest under the credit agreement is charged to the Fund based on a borrowing rate equal to the higher of the Federal Funds rate in effect on that day plus 1.25% or the overnight LIBOR rate in effect on that day plus 1.25%. In addition, an annual commitment fee equal to 0.25% of the unused balance is allocated to each participating fund. Prior to August 29, 2017, the revolving credit agreement amount was $250,000,000.
For the six months ended January 31, 2018, there were no borrowings by the Fund under the agreement.
7. INDEMNIFICATION
Under the Trust’s organizational documents, the officers and Trustees have been granted certain indemnification rights against certain liabilities that may arise out of performance of their duties to the Trust. Additionally, in the normal course of business, the Trust may enter into contracts with service providers that contain a variety of indemnification clauses. The Trust’s maximum exposure under these arrangements is dependent on future claims that may be made against the Fund and, therefore, cannot be estimated.
| | | | |
| 26 | | Wells Fargo Intrinsic Value Fund | | Other information (unaudited) |
PROXY VOTING INFORMATION
A description of the policies and procedures that the Fund uses to determine how to vote proxies relating to portfolio securities is available, upon request, by calling 1-800-222-8222, visiting our website at wellsfargofunds.com, or visiting the SEC website at sec.gov. Information regarding how the Fund voted proxies relating to portfolio securities during the most recent 12-month period ended June 30 is available on the Fund’s website at wellsfargofunds.com or by visiting the SEC website at sec.gov.
PORTFOLIO HOLDINGS INFORMATION
The complete portfolio holdings for the Fund are publicly available monthly on the Fund’s website (wellsfargofunds.com), on a one-month delayed basis. In addition, top ten holdings information (excluding derivative positions) for the Fund is publicly available on the Fund’s website on a monthly, seven-day or more delayed basis. The Fund files its complete schedule of portfolio holdings with the SEC for the first and third quarters of each fiscal year on Form N-Q, which is available by visiting the SEC website at sec.gov. In addition, the Fund’s Form N-Q may be reviewed and copied at the SEC’s Public Reference Room in Washington, DC, and at regional offices in New York City, at 233 Broadway, and in Chicago, at 175 West Jackson Boulevard, Suite 900. Information about the Public Reference Room may be obtained by calling 1-800-SEC-0330.
| | | | | | |
| Other information (unaudited) | | Wells Fargo Intrinsic Value Fund | | | 27 | |
BOARD OF TRUSTEES AND OFFICERS
Each of the Trustees and Officers1 listed in the table below acts in identical capacities for each fund in the Wells Fargo family of funds, which consists of 153 mutual funds comprising the Wells Fargo Funds Trust, Wells Fargo Variable Trust, Wells Fargo Master Trust and four closed-end funds (collectively the “Fund Complex”). This table should be read in conjunction with the Prospectus and the Statement of Additional Information2. The mailing address of each Trustee and Officer is 525 Market Street, 12th Floor, San Francisco, CA 94105. Each Trustee and Officer serves an indefinite term, however, each Trustee serves such term until reaching the mandatory retirement age established by the Trustees.
Independent Trustees
| | | | | | |
Name and year of birth | | Position held and length of service* | | Principal occupations during past five years or longer | | Current other public company or investment company directorships |
William R. Ebsworth (Born 1957) | | Trustee, since 2015 | | Retired. From 1984 to 2013, equities analyst, portfolio manager, research director and chief investment officer at Fidelity Management and Research Company in Boston, Tokyo, and Hong Kong, and retired in 2013 as Chief Investment Officer of Fidelity Strategic Advisers, Inc. where he led a team of investment professionals managing client assets. Prior thereto, Board member of Hong Kong Securities Clearing Co., Hong Kong Options Clearing Corp., the Thailand International Fund, Ltd., Fidelity Investments Life Insurance Company, and Empire Fidelity Investments Life Insurance Company. Board member of the Forté Foundation (non-profit organization) and the Vincent Memorial Hospital Endowment (non-profit organization), where he serves on the Investment Committee and as a Chair of the Audit Committee. Mr. Ebsworth is a CFA® charterholder. | | Asset Allocation Trust |
Jane A. Freeman** (Born 1953) | | Trustee, since 2015; Chair Liaison, since 2018 | | Retired. From 2012 to 2014 and 1999 to 2008, Chief Financial Officer of Scientific Learning Corporation. From 2008 to 2012, Ms. Freeman provided consulting services related to strategic business projects. Prior to 1999, Portfolio Manager at Rockefeller & Co. and Scudder, Stevens & Clark. Board member of the Harding Loevner Funds from 1996 to 2014, serving as both Lead Independent Director and chair of the Audit Committee. Board member of the Russell Exchange Traded Funds Trust from 2011 to 2012 and the chair of the Audit Committee. Ms. Freeman is a Board Member of Ruth Bancroft Garden (non-profit organization) and the Glimmerglass Festival. She is also an inactive Chartered Financial Analyst. | | Asset Allocation Trust |
Isaiah Harris, Jr. (Born 1952) | | Trustee, since 2009 | | Retired. Chairman of the Board of CIGNA Corporation since 2009, and Director since 2005. From 2003 to 2011, Director of Deluxe Corporation. Prior thereto, President and CEO of BellSouth Advertising and Publishing Corp. from 2005 to 2007, President and CEO of BellSouth Enterprises from 2004 to 2005 and President of BellSouth Consumer Services from 2000 to 2003. Emeritus member of the Iowa State University Foundation Board of Governors. Emeritus Member of the Advisory Board of Iowa State University School of Business. Advisory Board Member, Palm Harbor Academy (charter school). Advisory Board Member, Child Evangelism Fellowship (non-profit). Mr. Harris is a certified public accountant (inactive status). | | CIGNA Corporation; Asset Allocation Trust |
Judith M. Johnson (Born 1949) | | Trustee, since 2008; Audit Committee Chairman, since 2008 | | Retired. Prior thereto, Chief Executive Officer and Chief Investment Officer of Minneapolis Employees Retirement Fund from 1996 to 2008. Ms. Johnson is an attorney, certified public accountant and a certified managerial accountant. | | Asset Allocation Trust |
David F. Larcker (Born 1950) | | Trustee, since 2009 | | James Irvin Miller Professor of Accounting at the Graduate School of Business, Stanford University, Director of the Corporate Governance Research Initiative and Senior Faculty of The Rock Center for Corporate Governance since 2006. From 2005 to 2008, Professor of Accounting at the Graduate School of Business, Stanford University. Prior thereto, Ernst & Young Professor of Accounting at The Wharton School, University of Pennsylvania from 1985 to 2005. | | Asset Allocation Trust |
| | | | |
| 28 | | Wells Fargo Intrinsic Value Fund | | Other information (unaudited) |
| | | | | | |
Name and year of birth | | Position held and length of service* | | Principal occupations during past five years or longer | | Current other public company or investment company directorships |
Olivia S. Mitchell*** (Born 1953) | | Trustee, since 2006; Governance Committee Chairman, since 2018 | | International Foundation of Employee Benefit Plans Professor, Wharton School of the University of Pennsylvania since 1993. Director of Wharton’s Pension Research Council and Boettner Center on Pensions & Retirement Research, and Research Associate at the National Bureau of Economic Research. Previously, Cornell University Professor from 1978 to 1993. | | Asset Allocation Trust |
Timothy J. Penny**** (Born 1951) | | Trustee since 1996; Chairman, since 2018; Vice Chairman, from 2017 to 2018 | | President and Chief Executive Officer of Southern Minnesota Initiative Foundation, a non-profit organization, since 2007. Member of the Board of Trustees of NorthStar Education Finance, Inc., a non-profit organization, since 2007. | | Asset Allocation Trust |
James G. Polisson***** (Born 1959) | | Trustee, since 2018; Advisory Board Member, from 2017 to 2018 | | Retired. Chief Marketing Officer, Source (ETF) UK Services, Ltd, from 2015 to 2017. From 2012 to 2015, Principal of The Polisson Group, LLC, a management consulting, corporate advisory and principal investing company. Chief Executive Officer and Managing Director at Russell Investments, Global Exchange Traded Funds from 2010 to 2012. Managing Director of Barclays Global Investors from 1998 to 2010 and Global Chief Marketing Officer for iShares and Barclays Global Investors from 2000 to 2010. Trustee of the San Francisco Mechanics’ Institute, a non-profit organization, from 2013 to 2015. Board member of the Russell Exchange Traded Fund Trust from 2011 to 2012. Director of Barclays Global Investors Holdings Deutschland GmbH from 2006 to 2009. Mr. Polisson is an attorney and has a retired status with the Massachusetts and District of Columbia Bar Associations. | | Asset Allocation Trust |
Michael S. Scofield (Born 1943) | | Trustee, since 2010 | | Served on the Investment Company Institute’s Board of Governors and Executive Committee from 2008-2011 as well the Governing Council of the Independent Directors Council from 2006-2011 and the Independent Directors Council Executive Committee from 2008-2011. Trustee of the Evergreen Fund complex (and its predecessors) from 1984 to 2010. Chairman of the Evergreen Funds from 2000-2010. Former Trustee of the Mentor Funds. Retired Attorney, Law Offices of Michael S. Scofield. | | Asset Allocation Trust |
Pamela Wheelock***** (Born 1959) | | Trustee, since 2018; Advisory Board Member, from 2017 to 2018 | | Chief Operating Officer, Twin Cities Habitat for Humanity, since January, 2017. Vice President of University Services, University of Minnesota from 2012 to 2017. Prior thereto, Interim President and Chief Executive Officer of Blue Cross Blue Shield of Minnesota from 2010 to 2011, Chairman of the Board from 2009 to 2011 and Board Director from 2003 to 2015. Vice President, Leadership and Community Engagement, Bush Foundation, Saint Paul, Minnesota (a private foundation) from 2009 to 2011. Executive Vice President and Chief Financial Officer, Minnesota Sports and Entertainment from 2004 to 2009 and Senior Vice President from 2002 to 2004. Commissioner of Finance, State of Minnesota, from 1999 to 2002. Currently on the Board of Directors, Governance Committee and Finance Committee, for the Minnesota Philanthropy Partners (Saint Paul Foundation) since 2012 and Board Chair of the Minnesota Wild Foundation since 2010. | | Asset Allocation Trust |
| * | Length of service dates reflect the Trustee’s commencement of service with the Trust’s predecessor entities, where applicable. |
| ** | Jane Freeman became Chair Liaison effective January 1, 2018. |
| *** | Olivia Mitchell became Chairman of the Governance Committee effective January 1, 2018. |
| **** | Timothy Penny became Chairman effective January 1, 2018. |
| ***** | James Polisson and Pamela Wheelock each became a Trustee effective January 1, 2018. |
| | | | | | |
| Other information (unaudited) | | Wells Fargo Intrinsic Value Fund | | | 29 | |
Officers
| | | | | | |
Name and year of birth | | Position held and length of service | | Principal occupations during past five years or longer | | |
Andrew Owen (Born 1960) | | President, since 2017 | | Executive Vice President of Wells Fargo & Company and Head of Affiliated Managers, Wells Fargo Asset Management, since 2014. In addition, Mr. Owen is currently President, Chief Executive Officer and Director of Wells Fargo Funds Management, LLC since 2017. Prior thereto, Executive Vice President responsible for marketing, investments and product development for Wells Fargo Funds Management, LLC, from 2009 to 2014. | | |
Jeremy DePalma1 (Born 1974) | | Treasurer, since 2012 | | Senior Vice President of Wells Fargo Funds Management, LLC since 2009. Senior Vice President of Evergreen Investment Management Company, LLC from 2008 to 2010 and head of the Fund Reporting and Control Team within Fund Administration from 2005 to 2010. | | |
C. David Messman (Born 1960) | | Secretary, since 2000; Chief Legal Officer, since 2003 | | Senior Vice President and Secretary of Wells Fargo Funds Management, LLC since 2001. Assistant General Counsel of Wells Fargo Bank, N.A. since 2013 and Vice President and Managing Counsel of Wells Fargo Bank, N.A. from 1996 to 2013. | | |
Michael H. Whitaker (Born 1967) | | Chief Compliance Officer, since 2016 | | Senior Vice President and Chief Compliance Officer since 2016. Senior Vice President and Chief Compliance Officer for Fidelity Investments from 2007 to 2016. | | |
David Berardi (Born 1975) | | Assistant Treasurer, since 2009 | | Vice President of Wells Fargo Funds Management, LLC since 2009. Vice President of Evergreen Investment Management Company, LLC from 2008 to 2010. Manager of Fund Reporting and Control for Evergreen Investment Management Company, LLC from 2004 to 2010. | | |
| 1 | Jeremy DePalma acts as Treasurer of 76 funds and Assistant Treasurer of 77 funds in the Fund Complex. |
| 2 | The Statement of Additional Information includes additional information about the Trustees and is available, without charge, upon request, by calling 1-800-222-8222 or by visiting the website at wellsfargofunds.com. |
| | | | |
| 30 | | Wells Fargo Intrinsic Value Fund | | List of abbreviations |
The following is a list of common abbreviations for terms and entities that may have appeared in this report.
| ACA | — ACA Financial Guaranty Corporation |
| ADR | — American depositary receipt |
| ADS | — American depositary shares |
| AGC | — Assured Guaranty Corporation |
| AGM | — Assured Guaranty Municipal |
| Ambac | — Ambac Financial Group Incorporated |
| AMT | — Alternative minimum tax |
| BAN | — Bond anticipation notes |
| BHAC | — Berkshire Hathaway Assurance Corporation |
| CAB | — Capital appreciation bond |
| CCAB | — Convertible capital appreciation bond |
| CDA | — Community Development Authority |
| CDO | — Collateralized debt obligation |
| CLO | — Collateralized loan obligation |
| DRIVER | — Derivative inverse tax-exempt receipts |
| DW&P | — Department of Water & Power |
| DWR | — Department of Water Resources |
| ECFA | — Educational & Cultural Facilities Authority |
| EDA | — Economic Development Authority |
| EDFA | — Economic Development Finance Authority |
| ETF | — Exchange-traded fund |
| FDIC | — Federal Deposit Insurance Corporation |
| FFCB | — Federal Farm Credit Banks |
| FGIC | — Financial Guaranty Insurance Corporation |
| FHA | — Federal Housing Administration |
| FHLB | — Federal Home Loan Bank |
| FHLMC | — Federal Home Loan Mortgage Corporation |
| FICO | — The Financing Corporation |
| FNMA | — Federal National Mortgage Association |
| GDR | — Global depositary receipt |
| GNMA | — Government National Mortgage Association |
| HCFR | — Healthcare facilities revenue |
| HEFA | — Health & Educational Facilities Authority |
| HEFAR | — Higher education facilities authority revenue |
| HFA | — Housing Finance Authority |
| HFFA | — Health Facilities Financing Authority |
| HUD | — Department of Housing and Urban Development |
| IDA | — Industrial Development Authority |
| IDAG | — Industrial Development Agency |
| KRW | — Republic of Korea won |
| LIBOR | — London Interbank Offered Rate |
| LIFER | — Long Inverse Floating Exempt Receipts |
| LLC | — Limited liability company |
| LLLP | — Limited liability limited partnership |
| LLP | — Limited liability partnership |
| MBIA | — Municipal Bond Insurance Association |
| MFHR | — Multifamily housing revenue |
| MSTR | — Municipal securities trust receipts |
| MUD | — Municipal Utility District |
| National | — National Public Finance Guarantee Corporation |
| PCFA | — Pollution Control Financing Authority |
| PCL | — Public Company Limited |
| PCR | — Pollution control revenue |
| PFA | — Public Finance Authority |
| PFFA | — Public Facilities Financing Authority |
| PFOTER | — Puttable floating option tax-exempt receipts |
| PJSC | — Public Joint Stock Company |
| plc | — Public limited company |
| PUTTER | — Puttable tax-exempt receipts |
| R&D | — Research & development |
| Radian | — Radian Asset Assurance |
| RAN | — Revenue anticipation notes |
| RDA | — Redevelopment Agency |
| RDFA | — Redevelopment Finance Authority |
| REIT | — Real estate investment trust |
| ROC | — Reset option certificates |
| SAVRS | — Select auction variable rate securities |
| SBA | — Small Business Authority |
| SDR | — Swedish depositary receipt |
| SFHR | — Single-family housing revenue |
| SFMR | — Single-family mortgage revenue |
| SIFMA | — Securities Industry and Financial Markets Association |
| SPA | — Standby purchase agreement |
| SPDR | — Standard & Poor’s Depositary Receipts |
| SPEAR | — Short Puttable Exempt Adjustable Receipts |
| STRIPS | — Separate trading of registered interest and |
| TAN | — Tax anticipation notes |
| TIPS | — Treasury inflation-protected securities |
| TRAN | — Tax revenue anticipation notes |
| TTFA | — Transportation Trust Fund Authority |
| TVA | — Tennessee Valley Authority |
This page is intentionally left blank.
This page is intentionally left blank.

For more information
More information about Wells Fargo Funds is available free upon request. To obtain literature, please write, email, visit the Fund’s website, or call:
Wells Fargo Funds
P.O. Box 8266
Boston, MA 02266-8266
Email: fundservice@wellsfargo.com
Website: wellsfargofunds.com
Individual investors: 1-800-222-8222
Retail investment professionals: 1-888-877-9275
Institutional investment professionals:
1-866-765-0778
This report and the financial statements contained herein are submitted for the general information of the shareholders of the Fund. If this report is used for promotional purposes, distribution of the report must be accompanied or preceded by a current prospectus. Before investing, please consider the investment objectives, risks, charges, and expenses of the investment. For a current prospectus and, if available, a summary prospectus, containing this information, call 1-800-222-8222 or visit the Fund’s website at wellsfargofunds.com. Read the prospectus carefully before you invest or send money.
Wells Fargo Asset Management (WFAM) is a trade name used by the asset management businesses of Wells Fargo & Company. Wells Fargo Funds Management, LLC, a wholly owned subsidiary of Wells Fargo & Company, provides investment advisory and administrative services for Wells Fargo Funds. Other affiliates of Wells Fargo & Company provide subadvisory and other services for the funds. The funds are distributed by Wells Fargo Funds Distributor, LLC, Member FINRA, an affiliate of Wells Fargo & Company. Neither Wells Fargo Funds Distributor nor Wells Fargo Funds Management holds fund shareholder accounts or assets. This material is for general informational and educational purposes only and is NOT intended to provide investment advice or a recommendation of any kind—including a recommendation for any specific investment, strategy, or plan.
NOT FDIC INSURED ◾ NO BANK GUARANTEE ◾ MAY LOSE VALUE
© 2018 Wells Fargo Funds Management, LLC. All rights reserved.
| | |
 | | 309115 03-18 SA207/SAR207 01-18 |
Semi-Annual Report
January 31, 2018

Wells Fargo Large Cap Core Fund


Reduce clutter. Save trees.
Sign up for electronic delivery of prospectuses and shareholder reports at wellsfargo.com/advantagedelivery
Contents
The views expressed and any forward-looking statements are as of January 31, 2018, unless otherwise noted, and are those of the Fund managers and/or Wells Fargo Funds Management, LLC. Discussions of individual securities, or the markets generally, or any Wells Fargo Fund are not intended as individual recommendations. Future events or results may vary significantly from those expressed in any forward-looking statements. The views expressed are subject to change at any time in response to changing circumstances in the market. Wells Fargo Funds Management, LLC and the Fund disclaim any obligation to publicly update or revise any views expressed or forward-looking statements.
NOT FDIC INSURED ◾ NO BANK GUARANTEE ◾ MAY LOSE VALUE
| | | | |
| 2 | | Wells Fargo Large Cap Core Fund | | Letter to shareholders (unaudited) |

Andrew Owen
President
Wells Fargo Funds
While investing in stocks and bonds generally delivered favorable returns during the past six months, fixed-income investments in the U.S. diverged from the global trend.
Dear Shareholder:
We are pleased to offer you this semi-annual report for the Wells Fargo Large Cap Core Fund for the six-month period that ended January 31, 2018. While investing in stocks generally delivered favorable returns during the past six months, fixed-income investments in the U.S. diverged from the global trend. U.S. and international stocks delivered similar results, with returns of 15.43% and 13.50%, respectively, for the six-month period, as measured by the S&P 500 Index1 and the MSCI ACWI ex USA Index (Net)2, respectively. Within fixed income, the Bloomberg Barclays Global Aggregate ex-USD Index3 earned 4.50%. In the U.S., fixed-income investments, as measured by the Bloomberg Barclays U.S. Aggregate Bond Index4, fell 0.35% and the Bloomberg Barclays Municipal Bond Index5 declined 0.19%.
As global growth improved in the third quarter of 2017, investment markets advanced.
Globally, stocks moved higher during the late summer of 2017 as they were subject to the same positive economic conditions that influenced their advances during first half of the year: moderately accelerating global economic growth supported by improving corporate earnings as well as low inflation and interest rates. Brief episodes of geopolitical tensions, primarily associated with North Korea’s advancing nuclear missile program, flaring conflicts in the Middle East, and uncertainty surrounding the new U.S. administration’s trade policies, did not discourage investing activity. In the U.S., economic data released during the quarter reflected a generally healthy economy. Second-quarter economic output grew at a 3.1% annual rate.
Outside the U.S., stocks in international developed and emerging markets were supported by improved economic growth. Advances in emerging markets equity valuations slowed compared with the pace of the first half of 2017 but continued an upward path. Central banks in Europe, Asia, and Japan maintained low-interest-rate policies that supported business growth and equity investing.
In the U.S., Federal Reserve (Fed) officials announced in October plans to begin the process of unwinding its $4.5 trillion portfolio of bonds and other assets accumulated during rounds of quantitative easing conducted since the 2008–2009 recession. Still, restrained inflation kept long-term bond rates steady and the flattening of the yield curve persisted.
Positive economic and market news continued as 2017 closed and 2018 began.
During the fourth quarter of 2017, stock markets continued an upward trajectory. Synchronous economic expansion worldwide continued with mild inflation and low volatility. Data released during the quarter reflected a healthy U.S. economy.
| 1 | The S&P 500 Index consists of 500 stocks chosen for market size, liquidity, and industry group representation. It is a market-value-weighted index with each stock’s weight in the index proportionate to its market value. You cannot invest directly in an index. |
| 2 | The Morgan Stanley Capital International (MSCI) All Country World Index (ACWI) ex USA Index (Net) is a free-float-adjusted market-capitalization-weighted index that is designed to measure the equity market performance of developed markets, excluding the United States and Canada. Source: MSCI. MSCI makes no express or implied warranties or representations and shall have no liability whatsoever with respect to any MSCI data contained herein. The MSCI data may not be further redistributed or used as a basis for other indices or any securities or financial products. This report is not approved, reviewed, or produced by MSCI. You cannot invest directly in an index. |
| 3 | The Bloomberg Barclays Global Aggregate ex-USD Index is an unmanaged index that provides a broad-based measure of the global investment-grade fixed-income markets excluding the U.S.-dollar-denominated debt market. You cannot invest directly in an index. |
| 4 | The Bloomberg Barclays U.S. Aggregate Bond Index is a broad-based benchmark that measures the investment-grade, U.S. dollar-denominated, fixed-rate taxable bond market, including Treasuries, government-related and corporate securities, mortgage-backed securities (agency fixed-rate and hybrid adjustable-rate mortgage pass-throughs), asset-backed securities, and commercial mortgage-backed securities. You cannot invest directly in an index. |
| 5 | The Bloomberg Barclays Municipal Bond Index is an unmanaged index composed of long-term tax-exempt bonds with a minimum credit rating of Baa. You cannot invest directly in an index. |
| | | | | | |
| Letter to shareholders (unaudited) | | Wells Fargo Large Cap Core Fund | | | 3 | |
Third-quarter economic output grew at a 3.2% annual rate. Increased hiring pushed the unemployment rate down to a 17-year low of 4.1%. Tax reform in the U.S. that passed as the year ended also encouraged increased spending among businesses and individuals. Signs of long-awaited wage growth appeared to emerge.
Outside the U.S., economies continued to strengthen. In December, the Organisation for Economic Co-operation and Development (OECD) reported that the global economy has been expanding at its fastest rate since 2010; all 35 countries the OECD follows were on track to expand for 2017. International economies have benefited from catalysts such as economic stimulus, improving employment, increased investment, accelerated trade growth, and the firming of prices for some of the commodities that are essential exports of many international economies.
October 2017 marked one year since regulatory reform of money market investing in the U.S. By December 2017, money market fund asset levels exceeded their December 2016 levels, reflecting continued investor demand for the short-term investment opportunities afforded them by money market funds.
In December 2017, the Fed raised the federal funds rate target to a range of 1.25% to 1.50%. The Fed also began reducing its bond portfolio. Long-term interest rates in the U.S. trended higher as the yield curve steepened—the 10-year Treasury rate moved from 2.46% to 2.84% and the 30-year rate moved from 2.81% to 3.08% during January 2018.
Don’t let short-term uncertainty derail long-term investment goals.
Periods of investment uncertainty can present challenges, but experience has taught us that maintaining long-term investment goals can be an effective way to plan for the future. To help you create a sound strategy based on your personal goals and risk tolerance, Wells Fargo Funds offers more than 100 mutual funds spanning a wide range of asset classes and investment styles. Although diversification cannot guarantee an investment profit or prevent losses, we believe it can be an effective way to manage investment risk and potentially smooth out overall portfolio performance. We encourage investors to know their investments and to understand that appropriate levels of risk-taking may unlock opportunities.
Thank you for choosing to invest with Wells Fargo Funds. We appreciate your confidence in us and remain committed to helping you meet your financial needs.
Sincerely,

Andrew Owen
President
Wells Fargo Funds
Although diversification cannot guarantee an investment profit or prevent losses, we believe it can be an effective way to manage investment risk and potentially smooth out overall portfolio performance.
For further information about your Fund, contact your investment professional, visit our website at wellsfargofunds.com, or call us directly at 1-800-222-8222.
| | | | |
| 4 | | Wells Fargo Large Cap Core Fund | | Performance highlights (unaudited) |
Investment objective
The Fund seeks long-term capital appreciation.
Manager
Wells Fargo Funds Management, LLC
Subadviser
Wells Capital Management Incorporated
Portfolio managers
John R. Campbell, CFA®
Jeff C. Moser, CFA®
Average annual total returns (%) as of January 31, 20181
| | | | | | | | | | | | | | | | | | | | | | | | | | | | | | | | | | |
| | | | | Including sales charge | | | Excluding sales charge | | | Expense ratios2 (%) | |
| | | Inception date | | 1 year | | | 5 year | | | Since
inception | | | 1 year | | | 5 year | | | Since
inception | | | Gross | | | Net3 | |
| Class A (EGOAX) | | 12-17-2007 | | | 22.03 | | | | 14.92 | | | | 8.68 | | | | 29.51 | | | | 16.29 | | | | 9.32 | | | | 1.19 | | | | 1.08 | |
| Class C (EGOCX) | | 12-17-2007 | | | 27.57 | | | | 15.42 | | | | 8.51 | | | | 28.57 | | | | 15.42 | | | | 8.51 | | | | 1.94 | | | | 1.83 | |
| Class R (EGOHX) | | 9-30-2015 | | | – | | | | – | | | | – | | | | 29.20 | | | | 16.00 | | | | 9.06 | | | | 1.44 | | | | 1.33 | |
| Class R6 (EGORX) | | 9-30-2015 | | | – | | | | – | | | | – | | | | 30.15 | | | | 17.51 | | | | 10.10 | | | | 0.76 | | | | 0.65 | |
| Administrator Class (WFLLX) | | 7-16-2010 | | | – | | | | – | | | | – | | | | 29.70 | | | | 16.51 | | | | 9.51 | | | | 1.11 | | | | 0.97 | |
| Institutional Class (EGOIX) | | 12-17-2007 | | | – | | | | – | | | | – | | | | 30.04 | | | | 16.83 | | | | 9.78 | | | | 0.86 | | | | 0.67 | |
| S&P 500 Index4 | | – | | | – | | | | – | | | | – | | | | 26.41 | | | | 15.91 | | | | 9.78 | | | | – | | | | – | |
Figures quoted represent past performance, which is no guarantee of future results, and do not reflect taxes that a shareholder may pay on fund distributions or the redemption of fund shares. Investment return and principal value of an investment will fluctuate so that an investor’s shares, when redeemed, may be worth more or less than their original cost. Performance shown without sales charges would be lower if sales charges were reflected. Current performance may be lower or higher than the performance data quoted, which assumes the reinvestment of dividends and capital gains. Current month-end performance is available on the Fund’s website, wellsfargofunds.com.
Please keep in mind that high double-digit returns were primarily achieved during favorable market conditions. You should not expect that such favorable returns can be consistently achieved. A fund’s performance, especially for short time periods, should not be the sole factor in making your investment decision.
Index returns do not include transaction costs associated with buying and selling securities, any mutual fund fees or expenses, or any taxes. It is not possible to invest directly in an index.
For Class A shares, the maximum front-end sales charge is 5.75%. For Class C shares, the maximum contingent deferred sales charge is 1.00%. Performance including a contingent deferred sales charge assumes the sales charge for the corresponding time period. Class R, Class R6, Administrator Class, and Institutional Class shares are sold without a front-end sales charge or contingent deferred sales charge.
Stock values fluctuate in response to the activities of individual companies and general market and economic conditions. Certain investment strategies tend to increase the total risk of an investment (relative to the broader market). The Fund is exposed to foreign investment risk and focused portfolio risk. Consult the Fund’s prospectus for additional information on these and other risks.
Please see footnotes on page 5.
| | | | | | |
| Performance highlights (unaudited) | | Wells Fargo Large Cap Core Fund | | | 5 | |
| | | | |
| Ten largest holdings (%) as of January 31, 20185 | |
NetApp Incorporated | | | 2.60 | |
JPMorgan Chase & Company | | | 2.49 | |
Apple Incorporated | | | 2.41 | |
NVIDIA Corporation | | | 2.41 | |
The Home Depot Incorporated | | | 2.41 | |
Centene Corporation | | | 2.39 | |
Avery Dennison Corporation | | | 2.38 | |
Lear Corporation | | | 2.35 | |
CDW Corporation of Delaware | | | 2.34 | |
Northrop Grumman Corporation | | | 2.34 | |
|
| Sector distribution as of January 31, 20186 |
|
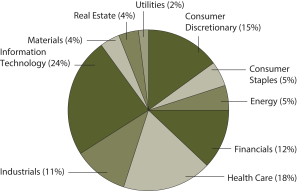
|
| 1 | Historical performance shown for Class R shares prior to their inception reflects the performance of Administrator Class shares, adjusted to reflect higher expenses applicable to Class R shares. Historical performance shown for Class R6 shares prior to their inception reflects the performance of Institutional Class shares, adjusted to reflect higher expenses applicable to Class R6 shares. Historical performance shown for Administrator Class shares prior to their inception reflects the performance of Institutional Class shares, adjusted to reflect higher expenses applicable to Administrator Class shares. Historical performance shown for all classes of the Fund prior to July 19, 2010, is based on the performance of the Fund’s predecessor, Evergreen Golden Large Cap Core Fund. |
| 2 | Reflects the expense ratios as stated in the most recent prospectuses. The expense ratios shown are subject to change and may differ from the annualized expense ratios shown in the financial highlights of this report. |
| 3 | The manager has contractually committed through November 30, 2018, to waive fees and/or reimburse expenses to the extent necessary to cap the Fund’s Total Annual Fund Operating Expenses After Fee Waivers at the amounts shown. After this time, the cap may be increased or the commitment to maintain the cap may be terminated only with the approval of the Board of Trustees. Brokerage commissions, stamp duty fees, interest, taxes, acquired fund fees and expenses, and extraordinary expenses are excluded from the expense cap. Without this cap, the Fund’s returns would have been lower. The expense ratio paid by an investor is the net expense ratio or the Fund’s Total Annual Fund Operating Expenses After Fee Waivers, as stated in the prospectuses. |
| 4 | The S&P 500 Index consists of 500 stocks chosen for market size, liquidity, and industry group representation. It is a market-value-weighted index with each stock’s weight in the index proportionate to its market value. You cannot invest directly in an index. |
| 5 | The ten largest holdings, excluding cash and cash equivalents, are calculated based on the value of the investments divided by total net assets of the Fund. Holdings are subject to change and may have changed since the date specified. |
| 6 | Amounts are calculated based on the total long-term investments of the Fund. These amounts are subject to change and may have changed since the date specified. |
| | | | |
| 6 | | Wells Fargo Large Cap Core Fund | | Fund expenses (unaudited) |
As a shareholder of the Fund, you incur two types of costs: (1) transaction costs, including sales charges (loads) on purchase payments and contingent deferred sales charges (if any) on redemptions and (2) ongoing costs, including management fees, distribution (12b-1) and/or shareholder servicing fees, and other Fund expenses. This example is intended to help you understand your ongoing costs (in dollars) of investing in the Fund and to compare these costs with the ongoing costs of investing in other mutual funds.
The example is based on an investment of $1,000 invested at the beginning of the six-month period and held for the entire period from August 1, 2017 to January 31, 2018.
Actual expenses
The “Actual” line of the table below provides information about actual account values and actual expenses. You may use the information in this line, together with the amount you invested, to estimate the expenses that you paid over the period. Simply divide your account value by $1,000 (for example, an $8,600 account value divided by $1,000 = 8.6), then multiply the result by the number in the “Actual” line under the heading entitled “Expenses paid during period” for your applicable class of shares to estimate the expenses you paid on your account during this period.
Hypothetical example for comparison purposes
The “Hypothetical” line of the table below provides information about hypothetical account values and hypothetical expenses based on the Fund’s actual expense ratio and an assumed rate of return of 5% per year before expenses, which is not the Fund’s actual return. The hypothetical account values and expenses may not be used to estimate the actual ending account balance or expenses you paid for the period. You may use this information to compare the ongoing costs of investing in the Fund and other funds. To do so, compare this 5% hypothetical example with the 5% hypothetical examples that appear in the shareholder reports of the other funds.
Please note that the expenses shown in the table are meant to highlight your ongoing costs only and do not reflect any transactional costs, such as sales charges (loads) and contingent deferred sales charges. Therefore, the “Hypothetical” line of the table is useful in comparing ongoing costs only and will not help you determine the relative total costs of owning different funds. In addition, if these transactional costs were included, your costs would have been higher.
| | | | | | | | | | | | | | | | |
| | | Beginning account value 8-1-2017 | | | Ending account value 1-31-2018 | | | Expenses paid during the period¹ | | | Annualized net expense ratio | |
Class A | | | | | | | | | | | | | | | | |
Actual | | $ | 1,000.00 | | | $ | 1,185.08 | | | $ | 6.17 | | | | 1.12 | % |
Hypothetical (5% return before expenses) | | $ | 1,000.00 | | | $ | 1,019.56 | | | $ | 5.70 | | | | 1.12 | % |
Class C | | | | | | | | | | | | | | | | |
Actual | | $ | 1,000.00 | | | $ | 1,180.41 | | | $ | 10.28 | | | | 1.87 | % |
Hypothetical (5% return before expenses) | | $ | 1,000.00 | | | $ | 1,015.78 | | | $ | 9.50 | | | | 1.87 | % |
Class R | | | | | | | | | | | | | | | | |
Actual | | $ | 1,000.00 | | | $ | 1,183.87 | | | $ | 7.54 | | | | 1.37 | % |
Hypothetical (5% return before expenses) | | $ | 1,000.00 | | | $ | 1,018.30 | | | $ | 6.97 | | | | 1.37 | % |
Class R6 | | | | | | | | | | | | | | | | |
Actual | | $ | 1,000.00 | | | $ | 1,187.80 | | | $ | 3.69 | | | | 0.67 | % |
Hypothetical (5% return before expenses) | | $ | 1,000.00 | | | $ | 1,021.83 | | | $ | 3.41 | | | | 0.67 | % |
Administrator Class | | | | | | | | | | | | | | | | |
Actual | | $ | 1,000.00 | | | $ | 1,185.93 | | | $ | 5.45 | | | | 0.99 | % |
Hypothetical (5% return before expenses) | | $ | 1,000.00 | | | $ | 1,020.21 | | | $ | 5.04 | | | | 0.99 | % |
Institutional Class | | | | | | | | | | | | | | | | |
Actual | | $ | 1,000.00 | | | $ | 1,187.76 | | | $ | 3.80 | | | | 0.69 | % |
Hypothetical (5% return before expenses) | | $ | 1,000.00 | | | $ | 1,021.73 | | | $ | 3.52 | | | | 0.69 | % |
| 1 | Expenses paid is equal to the annualized net expense ratio of each class multiplied by the average account value over the period, multiplied by the number of days in the most recent fiscal half-year divided by the number of days in the fiscal year (to reflect the one-half-year period). |
| | | | | | |
| Portfolio of investments—January 31, 2018 (unaudited) | | Wells Fargo Large Cap Core Fund | | | 7 | |
| | | | | | | | | | | | | | | | |
| Security name | | | | | | | | Shares | | | Value | |
| | | | |
Common Stocks: 98.92% | | | | | | | | | | | | | | | | |
| | | | |
Consumer Discretionary: 14.44% | | | | | | | | | | | | | | | | |
| | | | |
| Auto Components: 2.35% | | | | | | | | | | | | | | | | |
Lear Corporation | | | | | | | | | | | 144,879 | | | $ | 27,981,930 | |
| | | | | | | | | | | | | | | | |
| | | | |
| Automobiles: 1.83% | | | | | | | | | | | | | | | | |
General Motors Company | | | | | | | | | | | 512,000 | | | | 21,713,920 | |
| | | | | | | | | | | | | | | | |
| | | | |
| Media: 1.99% | | | | | | | | | | | | | | | | |
Comcast Corporation Class A | | | | | | | | | | | 556,707 | | | | 23,676,749 | |
| | | | | | | | | | | | | | | | |
| | | | |
| Multiline Retail: 2.17% | | | | | | | | | | | | | | | | |
Target Corporation | | | | | | | | | | | 342,668 | | | | 25,775,487 | |
| | | | | | | | | | | | | | | | |
| | | | |
| Specialty Retail: 6.10% | | | | | | | | | | | | | | | | |
Lowe’s Companies Incorporated | | | | | | | | | | | 255,030 | | | | 26,709,292 | |
The Home Depot Incorporated | | | | | | | | | | | 142,337 | | | | 28,595,503 | |
The TJX Companies Incorporated | | | | | | | | | | | 214,680 | | | | 17,243,098 | |
| |
| | | | 72,547,893 | |
| | | | | | | | | | | | | | | | |
| | | | |
Consumer Staples: 5.46% | | | | | | | | | | | | | | | | |
| | | | |
| Food & Staples Retailing: 3.79% | | | | | | | | | | | | | | | | |
Sysco Corporation | | | | | | | | | | | 320,005 | | | | 20,118,714 | |
Wal-Mart Stores Incorporated | | | | | | | | | | | 233,195 | | | | 24,858,587 | |
| |
| | | | 44,977,301 | |
| | | | | | | | | | | | | | | | |
| | | | |
| Food Products: 1.67% | | | | | | | | | | | | | | | | |
Tyson Foods Incorporated Class A | | | | | | | | | | | 261,349 | | | | 19,891,272 | |
| | | | | | | | | | | | | | | | |
| | | | |
Energy: 5.06% | | | | | | | | | | | | | | | | |
| | | | |
| Oil, Gas & Consumable Fuels: 5.06% | | | | | | | | | | | | | | | | |
Chevron Corporation | | | | | | | | | | | 154,739 | | | | 19,396,534 | |
Exxon Mobil Corporation | | | | | | | | | | | 194,501 | | | | 16,979,937 | |
Valero Energy Corporation | | | | | | | | | | | 247,737 | | | | 23,775,320 | |
| |
| | | | 60,151,791 | |
| | | | | | | | | | | | | | | | |
| | | | |
Financials: 12.41% | | | | | | | | | | | | | | | | |
| | | | |
| Banks: 6.52% | | | | | | | | | | | | | | | | |
Bank of America Corporation | | | | | | | | | | | 786,493 | | | | 25,167,776 | |
Citizens Financial Group Incorporated | | | | | | | | | | | 497,070 | | | | 22,815,513 | |
JPMorgan Chase & Company | | | | | | | | | | | 255,840 | | | | 29,593,012 | |
| |
| | | | 77,576,301 | |
| | | | | | | | | | | | | | | | |
| | | | |
| Capital Markets: 2.03% | | | | | | | | | | | | | | | | |
Raymond James Financial Incorporated | | | | | | | | | | | 250,342 | | | | 24,130,465 | |
| | | | | | | | | | | | | | | | |
| | | | |
| Insurance: 3.86% | | | | | | | | | | | | | | | | |
Lincoln National Corporation | | | | | | | | | | | 288,739 | | | | 23,907,589 | |
Prudential Financial Incorporated | | | | | | | | | | | 184,703 | | | | 21,946,410 | |
| |
| | | | 45,853,999 | |
| | | | | | | | | | | | | | | | |
The accompanying notes are an integral part of these financial statements.
| | | | |
| 8 | | Wells Fargo Large Cap Core Fund | | Portfolio of investments—January 31, 2018 (unaudited) |
| | | | | | | | | | | | | | | | |
| Security name | | | | | | | | Shares | | | Value | |
| | | | |
Health Care: 17.51% | | | | | | | | | | | | | | | | |
| | | | |
| Biotechnology: 3.19% | | | | | | | | | | | | | | | | |
Amgen Incorporated | | | | | | | | | | | 101,707 | | | $ | 18,922,587 | |
Gilead Sciences Incorporated | | | | | | | | | | | 226,817 | | | | 19,007,265 | |
| | | | |
| | | | | | | | | | | | | | | 37,929,852 | |
| | | | | | | | | | | | | | | | |
| | | | |
| Health Care Equipment & Supplies: 4.01% | | | | | | | | | | | | | | | | |
Abbott Laboratories | | | | | | | | | | | 378,002 | | | | 23,496,604 | |
Baxter International Incorporated | | | | | | | | | | | 335,962 | | | | 24,199,343 | |
| | | | |
| | | | | | | | | | | | | | | 47,695,947 | |
| | | | | | | | | | | | | | | | |
| | | | |
| Health Care Providers & Services: 6.72% | | | | | | | | | | | | | | | | |
Aetna Incorporated | | | | | | | | | | | 128,317 | | | | 23,972,182 | |
Centene Corporation † | | | | | | | | | | | 265,462 | | | | 28,468,145 | |
UnitedHealth Group Incorporated | | | | | | | | | | | 115,698 | | | | 27,394,972 | |
| | | | |
| | | | | | | | | | | | | | | 79,835,299 | |
| | | | | | | | | | | | | | | | |
| | | | |
| Life Sciences Tools & Services: 1.85% | | | | | | | | | | | | | | | | |
Agilent Technologies Incorporated | | | | | | | | | | | 299,924 | | | | 22,023,419 | |
| | | | | | | | | | | | | | | | |
| | | | |
| Pharmaceuticals: 1.74% | | | | | | | | | | | | | | | | |
Johnson & Johnson | | | | | | | | | | | 149,792 | | | | 20,699,756 | |
| | | | | | | | | | | | | | | | |
| | | | |
Industrials: 11.02% | | | | | | | | | | | | | | | | |
| | | | |
| Aerospace & Defense: 2.34% | | | | | | | | | | | | | | | | |
Northrop Grumman Corporation | | | | | | | | | | | 81,621 | | | | 27,794,399 | |
| | | | | | | | | | | | | | | | |
| | | | |
| Airlines: 1.68% | | | | | | | | | | | | | | | | |
Delta Air Lines Incorporated | | | | | | | | | | | 351,353 | | | | 19,946,310 | |
| | | | | | | | | | | | | | | | |
| | | | |
| Construction & Engineering: 1.67% | | | | | | | | | | | | | | | | |
EMCOR Group Incorporated | | | | | | | | | | | 243,975 | | | | 19,830,288 | |
| | | | | | | | | | | | | | | | |
| | | | |
| Machinery: 5.33% | | | | | | | | | | | | | | | | |
Cummins Incorporated | | | | | | | | | | | 124,226 | | | | 23,354,488 | |
Stanley Black & Decker Incorporated | | | | | | | | | | | 133,320 | | | | 22,161,784 | |
The Toro Company | | | | | | | | | | | 271,767 | | | | 17,841,504 | |
| | | | |
| | | | | | | | | | | | | | | 63,357,776 | |
| | | | | | | | | | | | | | | | |
| | | | |
Information Technology: 23.50% | | | | | | | | | | | | | | | | |
| | | | |
| Electronic Equipment, Instruments & Components: 3.80% | | | | | | | | | | | | | | | | |
CDW Corporation of Delaware | | | | | | | | | | | 371,743 | | | | 27,802,659 | |
Jabil Circuit Incorporated | | | | | | | | | | | 681,126 | | | | 17,321,034 | |
| | | | |
| | | | | | | | | | | | | | | 45,123,693 | |
| | | | | | | | | | | | | | | | |
| | | | |
| Internet Software & Services: 2.03% | | | | | | | | | | | | | | | | |
Alphabet Incorporated Class C † | | | | | | | | | | | 20,672 | | | | 24,185,000 | |
| | | | | | | | | | | | | | | | |
The accompanying notes are an integral part of these financial statements.
| | | | | | |
| Portfolio of investments—January 31, 2018 (unaudited) | | Wells Fargo Large Cap Core Fund | | | 9 | |
| | | | | | | | | | | | | | | | |
| Security name | | | | | | | | Shares | | | Value | |
| | | | |
| Semiconductors & Semiconductor Equipment: 6.25% | | | | | | | | | | | | | | | | |
Intel Corporation | | | | | | | | | | | 444,164 | | | $ | 21,382,055 | |
NVIDIA Corporation | | | | | | | | | | | 116,420 | | | | 28,616,036 | |
ON Semiconductor Corporation † | | | | | | | | | | | 982,266 | | | | 24,301,261 | |
| | | | |
| | | | | | | | | | | | | | | 74,299,352 | |
| | | | | | | | | | | | | | | | |
| | | | |
| Software: 4.45% | | | | | | | | | | | | | | | | |
Microsoft Corporation | | | | | | | | | | | 279,249 | | | | 26,531,447 | |
VMware Incorporated Class A Ǡ | | | | | | | | | | | 212,691 | | | | 26,329,019 | |
| | | | |
| | | | | | | | | | | | | | | 52,860,466 | |
| | | | | | | | | | | | | | | | |
| | | | |
| Technology Hardware, Storage & Peripherals: 6.97% | | | | | | | | | | | | | | | | |
Apple Incorporated | | | | | | | | | | | 171,402 | | | | 28,697,837 | |
HP Incorporated | | | | | | | | | | | 993,824 | | | | 23,175,976 | |
NetApp Incorporated | | | | | | | | | | | 503,421 | | | | 30,960,392 | |
| | | | |
| | | | | | | | | | | | | | | 82,834,205 | |
| | | | | | | | | | | | | | | | |
| | | | |
Materials: 4.43% | | | | | | | | | | | | | | | | |
| | | | |
| Chemicals: 2.05% | | | | | | | | | | | | | | | | |
DowDuPont Incorporated | | | | | | | | | | | 321,755 | | | | 24,318,243 | |
| | | | | | | | | | | | | | | | |
| | | | |
| Containers & Packaging: 2.38% | | | | | | | | | | | | | | | | |
Avery Dennison Corporation | | | | | | | | | | | 230,927 | | | | 28,330,124 | |
| | | | | | | | | | | | | | | | |
| | | | |
Real Estate: 3.52% | | | | | | | | | | | | | | | | |
| | | | |
| Equity REITs: 3.52% | | | | | | | | | | | | | | | | |
American Tower Corporation | | | | | | | | | | | 145,771 | | | | 21,530,377 | |
Prologis Incorporated | | | | | | | | | | | 311,888 | | | | 20,307,028 | |
| | | | |
| | | | | | | | | | | | | | | 41,837,405 | |
| | | | | | | | | | | | | | | | |
| | | | |
Utilities: 1.57% | | | | | | | | | | | | | | | | |
| | | | |
| Multi-Utilities: 1.57% | | | | | | | | | | | | | | | | |
CenterPoint Energy Incorporated | | | | | | | | | | | 661,677 | | | | 18,646,058 | |
| | | | | | | | | | | | | | | | |
| | | | |
Total Common Stocks (Cost $795,899,248) | | | | | | | | | | | | | | | 1,175,824,700 | |
| | | | | | | | | | | | | | | | |
| | | | |
| | | Yield | | | | | | | | | | |
| Short-Term Investments: 3.14% | | | | | | | | | | | | | | | | |
| | | | |
| Investment Companies: 3.14% | | | | | | | | | | | | | | | | |
Securities Lending Cash Investment LLC (l)(r)(u) | | | 1.60 | % | | | | | | | 24,490,035 | | | | 24,492,484 | |
Wells Fargo Government Money Market Fund Select Class (l)(u) | | | 1.24 | | | | | | | | 12,847,596 | | | | 12,847,596 | |
| | | | |
Total Short-Term Investments (Cost $37,340,080) | | | | | | | | | | | | | | | 37,340,080 | |
| | | | | | | | | | | | | | | | |
| | | | | | | | |
| Total investments in securities (Cost $833,239,328) | | | 102.06 | % | | | 1,213,164,780 | |
Other assets and liabilities, net | | | (2.06 | ) | | | (24,454,289 | ) |
| | | | | | | | |
| Total net assets | | | 100.00 | % | | $ | 1,188,710,491 | |
| | | | | | | | |
The accompanying notes are an integral part of these financial statements.
| | | | |
| 10 | | Wells Fargo Large Cap Core Fund | | Portfolio of investments—January 31, 2018 (unaudited) |
| † | Non-income-earning security |
| « | All or a portion of this security is on loan. |
| (l) | The issuer of the security is an affiliated person of the Fund as defined in the Investment Company Act of 1940. |
| (r) | The investment is a non-registered investment company purchased with cash collateral received from securities on loan. |
| (u) | The rate represents the 7-day annualized yield at period end. |
Investments in Affiliates
An affiliated investment is an investment in which the Fund owns at least 5% of the outstanding voting shares of the issuer or as a result of other relationships, such as the Fund and the issuer having the same investment manager. Transactions with issuers that were either affiliated persons of the Fund at the beginning of the period or the end of the period were as follows:
| | | | | | | | | | | | | | | | | | | | | | | | | | | | | | | | | | | | |
| | | Shares,
beginning of
period | | | Shares
purchased | | | Shares
sold | | | Shares,
end of
period | | | Net
realized
gains
(losses) | | | Net
change in
unrealized
gains
(losses) | | | Income
from
affiliated
securities | | | Value,
end
of period | | | % of
net
assets | |
Short-Term Investments | | | | | | | | | | | | | | | | | | | | | | | | | | | | | | | | | | | | |
Investment Companies | | | | | | | | | | | | | | | | | | | | | | | | | | | | | | | | | | | | |
Securities Lending Cash Investment LLC | | | 19,847,049 | | | | 94,951,061 | | | | 90,308,075 | | | | 24,490,035 | | | $ | 0 | | | $ | 0 | | | $ | 73,214 | | | $ | 24,492,484 | | | | | |
Wells Fargo Government Money Market Fund Select Class | | | 7,987,308 | | | | 70,480,847 | | | | 65,620,559 | | | | 12,847,596 | | | | 0 | | | | 0 | | | | 48,105 | | | | 12,847,596 | | | | | |
| | | | | | | | | | | | | | | | | | | | | | | | | | | | | | | | | | | | |
| | | | | | | | | | | | | | | | | | $ | 0 | | | $ | 0 | | | $ | 121,319 | | | $ | 37,340,080 | | | | 3.14 | % |
| | | | | | | | | | | | | | | | | | | | | | | | | | | | | | | | | | | | |
The accompanying notes are an integral part of these financial statements.
| | | | | | |
| Statement of assets and liabilities—January 31, 2018 (unaudited) | | Wells Fargo Large Cap Core Fund | | | 11 | |
| | | | |
| | | | |
| |
Assets | | | | |
Investments in unaffiliated securities (including $23,985,480 of securities loaned), at value (cost $795,899,248) | | $ | 1,175,824,700 | |
Investments in affiliated securities, at value (cost $37,340,080) | | | 37,340,080 | |
Receivable for Fund shares sold | | | 1,582,490 | |
Receivable for dividends | | | 426,466 | |
Receivable for securities lending income | | | 11,086 | |
Prepaid expenses and other assets | | | 68,768 | |
| | | | |
Total assets | | | 1,215,253,590 | |
| | | | |
| |
Liabilities | | | | |
Payable upon receipt of securities loaned | | | 24,492,500 | |
Payable for Fund shares redeemed | | | 1,279,145 | |
Management fee payable | | | 533,855 | |
Administration fees payable | | | 158,945 | |
Distribution fees payable | | | 42,525 | |
Trustees’ fees and expenses payable | | | 1,747 | |
Accrued expenses and other liabilities | | | 34,382 | |
| | | | |
Total liabilities | | | 26,543,099 | |
| | | | |
Total net assets | | $ | 1,188,710,491 | |
| | | | |
| |
NET ASSETS CONSIST OF | | | | |
Paid-in capital | | $ | 776,783,642 | |
Overdistributed net investment income | | | (56,445 | ) |
Accumulated net realized gains on investments | | | 32,057,842 | |
Net unrealized gains on investments | | | 379,925,452 | |
| | | | |
Total net assets | | $ | 1,188,710,491 | |
| | | | |
| |
COMPUTATION OF NET ASSET VALUE AND OFFERING PRICE PER SHARE | | | | |
Net assets – Class A | | $ | 375,138,039 | |
Shares outstanding – Class A1 | | | 17,886,807 | |
Net asset value per share – Class A | | | $20.97 | |
Maximum offering price per share – Class A2 | | | $22.25 | |
Net assets – Class C | | $ | 66,517,920 | |
Shares outstanding – Class C1 | | | 3,218,963 | |
Net asset value per share – Class C | | | $20.66 | |
Net assets – Class R | | $ | 2,286,561 | |
Shares outstanding – Class R1 | | | 108,913 | |
Net asset value per share – Class R | | | $20.99 | |
Net assets – Class R6 | | $ | 695,280 | |
Shares outstanding – Class R61 | | | 33,062 | |
Net asset value per share – Class R6 | | | $21.03 | |
Net assets – Administrator Class | | $ | 35,018,709 | |
Shares outstanding – Administrator Class1 | | | 1,652,344 | |
Net asset value per share – Administrator Class | | | $21.19 | |
Net assets – Institutional Class | | $ | 709,053,982 | |
Shares outstanding – Institutional Class1 | | | 33,660,773 | |
Net asset value per share – Institutional Class | | | $21.06 | |
| 1 | The Fund has an unlimited number of authorized shares. |
| 2 | Maximum offering price is computed as 100/94.25 of net asset value. On investments of $50,000 or more, the offering price is reduced. |
The accompanying notes are an integral part of these financial statements.
| | | | |
| 12 | | Wells Fargo Large Cap Core Fund | | Statement of operations—six months ended January 31, 2018 (unaudited) |
| | | | |
| | | | |
| |
Investment income | | | | |
Dividends | | $ | 9,393,922 | |
Income from affiliated securities | | | 121,319 | |
| | | | |
Total investment income | | | 9,515,241 | |
| | | | |
| |
Expenses | | | | |
Management fee | | | 3,764,283 | |
Administration fees | | | | |
Class A | | | 364,620 | |
Class C | | | 65,347 | |
Class R | | | 1,579 | |
Class R6 | | | 84 | |
Administrator Class | | | 21,975 | |
Institutional Class | | | 425,561 | |
Shareholder servicing fees | | | | |
Class A | | | 434,071 | |
Class C | | | 77,794 | |
Class R | | | 1,880 | |
Administrator Class | | | 42,260 | |
Distribution fees | | | | |
Class C | | | 233,381 | |
Class R | | | 1,880 | |
Custody and accounting fees | | | 18,413 | |
Professional fees | | | 23,489 | |
Registration fees | | | 76,638 | |
Shareholder report expenses | | | 60,569 | |
Trustees’ fees and expenses | | | 11,745 | |
Other fees and expenses | | | 11,268 | |
| | | | |
Total expenses | | | 5,636,837 | |
Less: Fee waivers and/or expense reimbursements | | | (676,591 | ) |
| | | | |
Net expenses | | | 4,960,246 | |
| | | | |
Net investment income | | | 4,554,995 | |
| | | | |
| |
REALIZED AND UNREALIZED GAINS (LOSSES) ON INVESTMENTS | | | | |
Net realized gains on investments | | | 44,203,610 | |
Net change in unrealized gains (losses) on investments | | | 140,280,499 | |
| | | | |
Net realized and unrealized gains (losses) on investments | | | 184,484,109 | |
| | | | |
Net increase in net assets resulting from operations | | $ | 189,039,104 | |
| | | | |
The accompanying notes are an integral part of these financial statements.
| | | | | | |
| Statement of changes in net assets | | Wells Fargo Large Cap Core Fund | | | 13 | |
| | | | | | | | | | | | | | | | |
| | | Six months ended
January 31, 2018
(unaudited) | | | Year ended
July 31, 2017 | |
| | | | |
Operations | | | | | | | | | | | | | | | | |
Net investment income | | | | | | $ | 4,554,995 | | | | | | | $ | 10,460,847 | |
Net realized gains on investments | | | | | | | 44,203,610 | | | | | | | | 51,027,002 | |
Net change in unrealized gains (losses) on investments | | | | | | | 140,280,499 | | | | | | | | 125,930,322 | |
| | | | |
Net increase in net assets resulting from operations | | | | | | | 189,039,104 | | | | | | | | 187,418,171 | |
| | | | |
| | | |
Distributions to shareholders from | | | | | | | | | | | | |
Net investment income | | | | | | | | | | | | | | | | |
Class A | | | | | | | (2,344,339 | ) | | | | | | | (2,565,745 | ) |
Class R | | | | | | | (8,939 | ) | | | | | | | (172 | ) |
Class R6 | | | | | | | (6,623 | ) | | | | | | | (1,269 | ) |
Administrator Class | | | | | | | (275,902 | ) | | | | | | | (3,812 | ) |
Institutional Class | | | | | | | (7,110,676 | ) | | | | | | | (7,464,521 | ) |
Net realized gains | | | | | | | | | | | | | | | | |
Class A | | | | | | | (3,861,410 | ) | | | | | | | 0 | |
Class C | | | | | | | (697,513 | ) | | | | | | | 0 | |
Class R | | | | | | | (15,405 | ) | | | | | | | 0 | |
Class R6 | | | | | | | (6,840 | ) | | | | | | | 0 | |
Administrator Class | | | | | | | (370,395 | ) | | | | | | | 0 | |
Institutional Class | | | | | | | (7,219,501 | ) | | | | | | | 0 | |
| | | | |
Total distributions to shareholders | | | | | | | (21,917,543 | ) | | | | | | | (10,035,519 | ) |
| | | | |
| | | | |
Capital share transactions | | | Shares | | | | | | | | Shares | | | | | |
Proceeds from shares sold | | | | | | | | | | | | | | | | |
Class A | | | 519,643 | | | | 10,160,053 | | | | 1,356,533 | | | | 22,414,439 | |
Class C | | | 178,130 | | | | 3,444,060 | | | | 498,889 | | | | 8,120,255 | |
Class R | | | 49,499 | | | | 970,429 | | | | 75,652 | | | | 1,314,056 | |
Class R6 | | | 26,133 | | | | 470,921 | | | | 7,956 | | | | 134,824 | |
Administrator Class | | | 114,709 | | | | 2,202,316 | | | | 1,481,988 | | | | 25,548,238 | |
Institutional Class | | | 3,386,597 | | | | 66,372,416 | | | | 23,412,722 | | | | 371,792,237 | |
| | | | |
| | | | | | | 83,620,195 | | | | | | | | 429,324,049 | |
| | | | |
Reinvestment of distributions | | | | | | | | | | | | | | | | |
Class A | | | 301,834 | | | | 5,924,920 | | | | 149,877 | | | | 2,451,983 | |
Class C | | | 30,164 | | | | 580,958 | | | | 0 | | | | 0 | |
Class R | | | 1,208 | | | | 23,748 | | | | 10 | | | | 172 | |
Class R6 | | | 644 | | | | 12,693 | | | | 77 | | | | 1,269 | |
Administrator Class | | | 31,853 | | | | 632,062 | | | | 230 | | | | 3,794 | |
Institutional Class | | | 658,543 | | | | 12,996,677 | | | | 405,841 | | | | 6,663,907 | |
| | | | |
| | | | | | | 20,171,058 | | | | | | | | 9,121,125 | |
| | | | |
Payment for shares redeemed | | | | | | | | | | | | | | | | |
Class A | | | (1,258,011 | ) | | | (24,133,809 | ) | | | (6,971,518 | ) | | | (112,765,238 | ) |
Class C | | | (419,211 | ) | | | (7,885,210 | ) | | | (1,878,343 | ) | | | (29,564,534 | ) |
Class R | | | (17,698 | ) | | | (330,814 | ) | | | (1,487 | ) | | | (25,647 | ) |
Class R6 | | | (452 | ) | | | (8,686 | ) | | | (162,028 | ) | | | (2,459,889 | ) |
Administrator Class | | | (256,503 | ) | | | (5,042,366 | ) | | | (3,533,468 | ) | | | (56,128,061 | ) |
Institutional Class | | | (4,700,764 | ) | | | (90,918,280 | ) | | | (16,596,815 | ) | | | (273,283,736 | ) |
| | | | |
| | | | | | | (128,319,165 | ) | | | | | | | (474,227,105 | ) |
| | | | |
Net decrease in net assets resulting from capital share transactions | | | | | | | (24,527,912 | ) | | | | | | | (35,781,931 | ) |
| | | | |
Total increase in net assets | | | | | | | 142,593,649 | | | | | | | | 141,600,721 | |
| | | | |
| | |
Net assets | | | | | | | | |
Beginning of period | | | | | | | 1,046,116,842 | | | | | | | | 904,516,121 | |
| | | | |
End of period | | | | | | $ | 1,188,710,491 | | | | | | | $ | 1,046,116,842 | |
| | | | |
Undistributed (overdistributed) net investment income | | | | | | $ | (56,445 | ) | | | | | | $ | 5,135,039 | |
| | | | |
The accompanying notes are an integral part of these financial statements.
| | | | |
| 14 | | Wells Fargo Large Cap Core Fund | | Financial highlights |
(For a share outstanding throughout each period)
| | | | | | | | | | | | | | | | | | | | | | | | |
| | | Six months ended
January 31, 2018
(unaudited) | | | Year ended July 31 | |
| CLASS A | | | 2017 | | | 2016 | | | 2015 | | | 2014 | | | 2013 | |
Net asset value, beginning of period | | | $18.01 | | | | $15.13 | | | | $15.81 | | | | $14.30 | | | | $12.13 | | | | $9.50 | |
Net investment income | | | 0.06 | | | | 0.15 | | | | 0.10 | | | | 0.06 | | | | 0.06 | 1 | | | 0.07 | |
Net realized and unrealized gains (losses) on investments | | | 3.25 | | | | 2.85 | | | | (0.60 | ) | | | 1.50 | | | | 2.20 | | | | 2.64 | |
| | | | | | | | | | | | | | | | | | | | | | | | |
Total from investment operations | | | 3.31 | | | | 3.00 | | | | (0.50 | ) | | | 1.56 | | | | 2.26 | | | | 2.71 | |
Distributions to shareholders from | | | | | | | | | | | | | | | | | | | | | | | | |
Net investment income | | | (0.13 | ) | | | (0.12 | ) | | | (0.05 | ) | | | (0.05 | ) | | | (0.09 | ) | | | (0.08 | ) |
Net realized gains | | | (0.22 | ) | | | 0.00 | | | | (0.13 | ) | | | 0.00 | | | | 0.00 | | | | 0.00 | |
| | | | | | | | | | | | | | | | | | | | | | | | |
Total distributions to shareholders | | | (0.35 | ) | | | (0.12 | ) | | | (0.18 | ) | | | (0.05 | ) | | | (0.09 | ) | | | (0.08 | ) |
Net asset value, end of period | | | $20.97 | | | | $18.01 | | | | $15.13 | | | | $15.81 | | | | $14.30 | | | | $12.13 | |
Total return2 | | | 18.51 | % | | | 19.94 | % | | | (3.18 | )% | | | 10.99 | % | | | 18.58 | % | | | 28.76 | % |
Ratios to average net assets (annualized) | | | | | | | | | | | | | | | | | | | | | | | | |
Gross expenses | | | 1.18 | % | | | 1.19 | % | | | 1.20 | % | | | 1.26 | % | | | 1.29 | % | | | 1.33 | % |
Net expenses | | | 1.12 | % | | | 1.14 | % | | | 1.14 | % | | | 1.14 | % | | | 1.14 | % | | | 1.14 | % |
Net investment income | | | 0.61 | % | | | 0.82 | % | | | 0.80 | % | | | 0.35 | % | | | 0.47 | % | | | 0.75 | % |
Supplemental data | | | | | | | | | | | | | | | | | | | | | | | | |
Portfolio turnover rate | | | 18 | % | | | 50 | % | | | 51 | % | | | 44 | % | | | 61 | % | | | 67 | % |
Net assets, end of period (000s omitted) | | | $375,138 | | | | $329,974 | | | | $359,971 | | | | $97,041 | | | | $26,685 | | | | $15,267 | |
| 1 | Calculated based upon average shares outstanding |
| 2 | Total return calculations do not include any sales charges. Returns for periods of less than one year are not annualized. |
The accompanying notes are an integral part of these financial statements.
| | | | | | |
| Financial highlights | | Wells Fargo Large Cap Core Fund | | | 15 | |
(For a share outstanding throughout each period)
| | | | | | | | | | | | | | | | | | | | | | | | |
| | | Six months ended
January 31, 2018
(unaudited) | | | Year ended July 31 | |
| CLASS C | | | 2017 | | | 2016 | | | 2015 | | | 2014 | | | 2013 | |
Net asset value, beginning of period | | | $17.70 | | | | $14.87 | | | | $15.61 | | | | $14.17 | | | | $12.05 | | | | $9.45 | |
Net investment income (loss) | | | (0.02 | ) | | | 0.00 | 1 | | | 0.00 | 1,2 | | | (0.06 | )2 | | | (0.01 | ) | | | (0.00 | )1 |
Net realized and unrealized gains (losses) on investments | | | 3.20 | | | | 2.83 | | | | (0.61 | ) | | | 1.50 | | | | 2.15 | | | | 2.62 | |
| | | | | | | | | | | | | | | | | | | | | | | | |
Total from investment operations | | | 3.18 | | | | 2.83 | | | | (0.61 | ) | | | 1.44 | | | | 2.14 | | | | 2.62 | |
Distributions to shareholders from | | | | | | | | | | | | | | | | | | | | | | | | |
Net investment income | | | 0.00 | | | | 0.00 | | | | 0.00 | | | | 0.00 | | | | (0.02 | ) | | | (0.02 | ) |
Net realized gains | | | (0.22 | ) | | | 0.00 | | | | (0.13 | ) | | | 0.00 | | | | 0.00 | | | | 0.00 | |
| | | | | | | | | | | | | | | | | | | | | | | | |
Total distributions to shareholders | | | (0.22 | ) | | | 0.00 | | | | (0.13 | ) | | | 0.00 | | | | (0.02 | ) | | | (0.02 | ) |
Net asset value, end of period | | | $20.66 | | | | $17.70 | | | | $14.87 | | | | $15.61 | | | | $14.17 | | | | $12.05 | |
Total return3 | | | 18.04 | % | | | 19.03 | % | | | (3.90 | )% | | | 10.16 | % | | | 17.73 | % | | | 27.82 | % |
Ratios to average net assets (annualized) | | | | | | | | | | | | | | | | | | | | | | | | |
Gross expenses | | | 1.93 | % | | | 1.94 | % | | | 1.95 | % | | | 2.01 | % | | | 2.04 | % | | | 2.08 | % |
Net expenses | | | 1.87 | % | | | 1.89 | % | | | 1.89 | % | | | 1.89 | % | | | 1.89 | % | | | 1.89 | % |
Net investment income (loss) | | | (0.14 | )% | | | 0.07 | % | | | 0.02 | % | | | (0.38 | )% | | | (0.30 | )% | | | (0.01 | )% |
Supplemental data | | | | | | | | | | | | | | | | | | | | | | | | |
Portfolio turnover rate | | | 18 | % | | | 50 | % | | | 51 | % | | | 44 | % | | | 61 | % | | | 67 | % |
Net assets, end of period (000s omitted) | | | $66,518 | | | | $60,697 | | | | $71,512 | | | | $53,076 | | | | $8,624 | | | | $3,786 | |
| 1 | Amount is less than $0.005. |
| 2 | Calculated based upon average shares outstanding |
| 3 | Total return calculations do not include any sales charges. Returns for periods of less than one year are not annualized. |
The accompanying notes are an integral part of these financial statements.
| | | | |
| 16 | | Wells Fargo Large Cap Core Fund | | Financial highlights |
(For a share outstanding throughout each period)
| | | | | | | | | | | | |
| | | Six months ended
January 31, 2018
(unaudited) | | | Year ended July 31 | |
| CLASS R | | | 2017 | | | 20161 | |
Net asset value, beginning of period | | | $18.04 | | | | $15.17 | | | | $14.66 | |
Net investment income | | | 0.03 | | | | 0.13 | | | | 0.06 | |
Net realized and unrealized gains (losses) on investments | | | 3.26 | | | | 2.84 | | | | 0.66 | |
| | | | | | | | | | | | |
Total from investment operations | | | 3.29 | | | | 2.97 | | | | 0.72 | |
Distributions to shareholders from | | | | | | | | | | | | |
Net investment income | | | (0.12 | ) | | | (0.10 | ) | | | (0.08 | ) |
Net realized gains | | | (0.22 | ) | | | 0.00 | | | | (0.13 | ) |
| | | | | | | | | | | | |
Total distributions to shareholders | | | (0.34 | ) | | | (0.10 | ) | | | (0.21 | ) |
Net asset value, end of period | | | $20.99 | | | | $18.04 | | | | $15.17 | |
Total return2 | | | 18.39 | % | | | 19.64 | % | | | 4.90 | % |
Ratios to average net assets (annualized) | | | | | | | | | | | | |
Gross expenses | | | 1.43 | % | | | 1.44 | % | | | 1.46 | % |
Net expenses | | | 1.37 | % | | | 1.39 | % | | | 1.39 | % |
Net investment income | | | 0.31 | % | | | 0.51 | % | | | 0.52 | % |
Supplemental data | | | | | | | | | | | | |
Portfolio turnover rate | | | 18 | % | | | 50 | % | | | 51 | % |
Net assets, end of period (000s omitted) | | | $2,287 | | | | $1,369 | | | | $26 | |
| 1 | For the period from September 30, 2015 (commencement of class operations) to July 31, 2016 |
| 2 | Returns for periods of less than one year are not annualized. |
The accompanying notes are an integral part of these financial statements.
| | | | | | |
| Financial highlights | | Wells Fargo Large Cap Core Fund | | | 17 | |
(For a share outstanding throughout each period)
| | | | | | | | | | | | |
| | | Six months ended
January 31, 2018
(unaudited) | | | Year ended July 31 | |
| CLASS R6 | | | 2017 | | | 20161 | |
Net asset value, beginning of period | | | $18.09 | | | | $15.24 | | | | $14.66 | |
Net investment income | | | 0.10 | 2 | | | 0.25 | 2 | | | 0.20 | |
Net realized and unrealized gains (losses) on investments | | | 3.27 | | | | 3.33 | | | | 0.62 | |
| | | | | | | | | | | | |
Total from investment operations | | | 3.37 | | | | 3.58 | | | | 0.82 | |
Distributions to shareholders from | | | | | | | | | | | | |
Net investment income | | | (0.21 | ) | | | (0.73 | ) | | | (0.11 | ) |
Net realized gains | | | (0.22 | ) | | | 0.00 | | | | (0.13 | ) |
| | | | | | | | | | | | |
Total distributions to shareholders | | | (0.43 | ) | | | (0.73 | ) | | | (0.24 | ) |
Net asset value, end of period | | | $21.03 | | | | $18.09 | | | | $15.24 | |
Total return3 | | | 18.78 | % | | | 24.01 | % | | | 5.57 | % |
Ratios to average net assets (annualized) | | | | | | | | | | | | |
Gross expenses | | | 0.75 | % | | | 0.76 | % | | | 0.77 | % |
Net expenses | | | 0.67 | % | | | 0.68 | % | | | 0.68 | % |
Net investment income | | | 0.98 | % | | | 1.62 | % | | | 1.31 | % |
Supplemental data | | | | | | | | | | | | |
Portfolio turnover rate | | | 18 | % | | | 50 | % | | | 51 | % |
Net assets, end of period (000s omitted) | | | $695 | | | | $122 | | | | $2,449 | |
| 1 | For the period from September 30, 2015 (commencement of class operations) to July 31, 2016 |
| 2 | Calculated based upon average shares outstanding |
| 3 | Returns for periods of less than one year are not annualized. |
The accompanying notes are an integral part of these financial statements.
| | | | |
| 18 | | Wells Fargo Large Cap Core Fund | | Financial highlights |
(For a share outstanding throughout each period)
| | | | | | | | | | | | | | | | | | | | | | | | |
| | | Six months ended
January 31, 2018
(unaudited) | | | Year ended July 31 | |
| ADMINISTRATOR CLASS | | | 2017 | | | 2016 | | | 2015 | | | 2014 | | | 2013 | |
Net asset value, beginning of period | | | $18.21 | | | | $15.18 | | | | $15.87 | | | | $14.34 | | | | $12.16 | | | | $9.52 | |
Net investment income | | | 0.09 | | | | 0.16 | 1 | | | 0.15 | | | | 0.10 | | | | 0.09 | | | | 0.10 | |
Net realized and unrealized gains (losses) on investments | | | 3.27 | | | | 2.87 | | | | (0.62 | ) | | | 1.50 | | | | 2.20 | | | | 2.64 | |
| | | | | | | | | | | | | | | | | | | | | | | | |
Total from investment operations | | | 3.36 | | | | 3.03 | | | | (0.47 | ) | | | 1.60 | | | | 2.29 | | | | 2.74 | |
Distributions to shareholders from | | | | | | | | | | | | | | | | | | | | | | | | |
Net investment income | | | (0.16 | ) | | | (0.00 | )2 | | | (0.09 | ) | | | (0.07 | ) | | | (0.11 | ) | | | (0.10 | ) |
Net realized gains | | | (0.22 | ) | | | 0.00 | | | | (0.13 | ) | | | 0.00 | | | | 0.00 | | | | 0.00 | |
| | | | | | | | | | | | | | | | | | | | | | | | |
Total distributions to shareholders | | | (0.38 | ) | | | (0.00 | )2 | | | (0.22 | ) | | | (0.07 | ) | | | (0.11 | ) | | | (0.10 | ) |
Net asset value, end of period | | | $21.19 | | | | $18.21 | | | | $15.18 | | | | $15.87 | | | | $14.34 | | | | $12.16 | |
Total return3 | | | 18.59 | % | | | 19.99 | % | | | (2.98 | )% | | | 11.28 | % | | | 18.83 | % | | | 29.12 | % |
Ratios to average net assets (annualized) | | | | | | | | | | | | | | | | | | | | | | | | |
Gross expenses | | | 1.10 | % | | | 1.10 | % | | | 1.12 | % | | | 1.11 | % | | | 1.11 | % | | | 1.14 | % |
Net expenses | | | 0.99 | % | | | 1.00 | % | | | 0.96 | % | | | 0.90 | % | | | 0.90 | % | | | 0.89 | % |
Net investment income | | | 0.75 | % | | | 1.00 | % | | | 0.95 | % | | | 0.61 | % | | | 0.63 | % | | | 1.00 | % |
Supplemental data | | | | | | | | | | | | | | | | | | | | | | | | |
Portfolio turnover rate | | | 18 | % | | | 50 | % | | | 51 | % | | | 44 | % | | | 61 | % | | | 67 | % |
Net assets, end of period (000s omitted) | | | $35,019 | | | | $32,091 | | | | $57,879 | | | | $83,692 | | | | $6,849 | | | | $1,192 | |
| 1 | Calculated based upon average shares outstanding |
| 2 | Amount is less than $0.005. |
| 3 | Returns for periods of less than one year are not annualized. |
The accompanying notes are an integral part of these financial statements.
| | | | | | |
| Financial highlights | | Wells Fargo Large Cap Core Fund | | | 19 | |
(For a share outstanding throughout each period)
| | | | | | | | | | | | | | | | | | | | | | | | |
| | | Six months ended
January 31, 2018
(unaudited) | | | Year ended July 31 | |
| INSTITUTIONAL CLASS | | | 2017 | | | 2016 | | | 2015 | | | 2014 | | | 2013 | |
Net asset value, beginning of period | | | $18.12 | | | | $15.23 | | | | $15.91 | | | | $14.35 | | | | $12.16 | | | | $9.52 | |
Net investment income | | | 0.10 | | | | 0.18 | | | | 0.18 | 1 | | | 0.14 | 1 | | | 0.11 | 1 | | | 0.13 | 1 |
Net realized and unrealized gains (losses) on investments | | | 3.27 | | | | 2.91 | | | | (0.62 | ) | | | 1.50 | | | | 2.21 | | | | 2.63 | |
| | | | | | | | | | | | | | | | | | | | | | | | |
Total from investment operations | | | 3.37 | | | | 3.09 | | | | (0.44 | ) | | | 1.64 | | | | 2.32 | | | | 2.76 | |
Distributions to shareholders from | | | | | | | | | | | | | | | | | | | | | | | | |
Net investment income | | | (0.21 | ) | | | (0.20 | ) | | | (0.11 | ) | | | (0.08 | ) | | | (0.13 | ) | | | (0.12 | ) |
Net realized gains | | | (0.22 | ) | | | 0.00 | | | | (0.13 | ) | | | 0.00 | | | | 0.00 | | | | 0.00 | |
| | | | | | | | | | | | | | | | | | | | | | | | |
Total distributions to shareholders | | | (0.43 | ) | | | (0.20 | ) | | | (0.24 | ) | | | (0.08 | ) | | | (0.13 | ) | | | (0.12 | ) |
Net asset value, end of period | | | $21.06 | | | | $18.12 | | | | $15.23 | | | | $15.91 | | | | $14.35 | | | | $12.16 | |
Total return2 | | | 18.78 | % | | | 20.43 | % | | | (2.75 | )% | | | 11.51 | % | | | 19.21 | % | | | 29.38 | % |
Ratios to average net assets (annualized) | | | | | | | | | | | | | | | | | | | | | | | | |
Gross expenses | | | 0.85 | % | | | 0.86 | % | | | 0.87 | % | | | 0.84 | % | | | 0.85 | % | | | 0.90 | % |
Net expenses | | | 0.69 | % | | | 0.70 | % | | | 0.70 | % | | | 0.66 | % | | | 0.66 | % | | | 0.66 | % |
Net investment income | | | 1.04 | % | | | 1.23 | % | | | 1.22 | % | | | 0.86 | % | | | 0.83 | % | | | 1.24 | % |
Supplemental data | | | | | | | | | | | | | | | | | | | | | | | | |
Portfolio turnover rate | | | 18 | % | | | 50 | % | | | 51 | % | | | 44 | % | | | 61 | % | | | 67 | % |
Net assets, end of period (000s omitted) | | | $709,054 | | | | $621,864 | | | | $412,678 | | | | $63,235 | | | | $5,775 | | | | $537 | |
| 1 | Calculated based upon average shares outstanding |
| 2 | Returns for periods of less than one year are not annualized. |
The accompanying notes are an integral part of these financial statements.
| | | | |
| 20 | | Wells Fargo Large Cap Core Fund | | Notes to financial statements (unaudited) |
1. ORGANIZATION
Wells Fargo Funds Trust (the “Trust”), a Delaware statutory trust organized on March 10, 1999, is an open-end management investment company registered under the Investment Company Act of 1940, as amended (the “1940 Act”). As an investment company, the Trust follows the accounting and reporting guidance in Financial Accounting Standards Board Accounting Standards Codification Topic 946, Financial Services – Investment Companies. These financial statements report on the Wells Fargo Large Cap Core Fund (the “Fund”) which is a diversified series of the Trust.
2. SIGNIFICANT ACCOUNTING POLICIES
The following significant accounting policies, which are consistently followed in the preparation of the financial statements of the Fund, are in conformity with U.S. generally accepted accounting principles which require management to make estimates and assumptions that affect the reported amounts of assets and liabilities, disclosure of contingent assets and liabilities at the date of the financial statements, and the reported amounts of revenues and expenses during the reporting period. Actual results could differ from those estimates.
Securities valuation
All investments are valued each business day as of the close of regular trading on the New York Stock Exchange (generally 4 p.m. Eastern Time), although the Fund may deviate from this calculation time under unusual or unexpected circumstances.
Equity securities that are listed on a foreign or domestic exchange or market are valued at the official closing price or, if none, the last sales price. If no sale occurs on the principal exchange or market that day, a fair value price will be determined in accordance with the Fund’s Valuation Procedures.
Investments in registered open-end investment companies are valued at net asset value. Interests in non-registered investment companies that are redeemable at net asset value are fair valued normally at net asset value.
Investments which are not valued using any of the methods discussed above are valued at their fair value, as determined in good faith by the Board of Trustees of the Fund. The Board of Trustees has established a Valuation Committee comprised of the Trustees and has delegated to it the authority to take any actions regarding the valuation of portfolio securities that the Valuation Committee deems necessary or appropriate, including determining the fair value of portfolio securities, unless the determination has been delegated to the Wells Fargo Asset Management Pricing Committee of Wells Fargo Funds Management, LLC (“Funds Management”). The Board of Trustees retains the authority to make or ratify any valuation decisions or approve any changes to the Valuation Procedures as it deems appropriate. On a quarterly basis, the Board of Trustees receives reports on any valuation actions taken by the Valuation Committee or the Wells Fargo Asset Management Pricing Committee which may include items for ratification.
Valuations of fair valued securities are compared to the next actual sales price when available, or other appropriate market values, to assess the continued appropriateness of the fair valuation methodologies used. These securities are fair valued on a day-to-day basis, taking into consideration changes to appropriate market information and any significant changes to the inputs considered in the valuation process until there is a readily available price provided on an exchange or by an independent pricing service. Valuations received from an independent pricing service or independent broker-dealer quotes are periodically validated by comparisons to most recent trades and valuations provided by other independent pricing services in addition to the review of prices by the manager and/or subadviser. Unobservable inputs used in determining fair valuations are identified based on the type of security, taking into consideration factors utilized by market participants in valuing the investment, knowledge about the issuer and the current market environment.
Security loans
The Fund may lend its securities from time to time in order to earn additional income in the form of fees or interest on securities received as collateral or the investment of any cash received as collateral. The Fund continues to receive interest or dividends on the securities loaned. The Fund receives collateral in the form of cash or securities with a value at least equal to the value of the securities on loan. The value of the loaned securities is determined at the close of each business day and any additional required collateral is delivered to the Fund on the next business day. In a securities lending transaction, the net asset value of the Fund will be affected by an increase or decrease in the value of the securities loaned and by an increase or decrease in the value of the instrument in which collateral is invested. The amount of securities lending activity undertaken by the Fund fluctuates from time to time. In the event of default or bankruptcy by the borrower, the Fund may be prevented from recovering the loaned securities or gaining access to the collateral or may experience delays or costs in doing so. In addition, the investment of any cash collateral received may lose all or part of its value. The Fund has the right under the lending agreement to recover the securities from the borrower on demand.
| | | | | | |
| Notes to financial statements (unaudited) | | Wells Fargo Large Cap Core Fund | | | 21 | |
The Fund lends its securities through an unaffiliated securities lending agent. Cash collateral received in connection with its securities lending transactions is invested in Securities Lending Cash Investments, LLC (the “Securities Lending Fund”). The Securities Lending Fund is exempt from registration under Section 3(c)(7) of the 1940 Act and is managed by Funds Management and is subadvised by Wells Capital Management Incorporated (“WellsCap”), an affiliate of Funds Management and an indirect wholly owned subsidiary of Wells Fargo & Company (“Wells Fargo”). Funds Management receives an advisory fee starting at 0.05% and declining to 0.01% as the average daily net assets of the Securities Lending Fund increase. All of the fees received by Funds Management are paid to WellsCap for its services as subadviser. The Securities Lending Fund seeks to provide a positive return compared to the daily Fed Funds Open Rate by investing in high-quality, U.S. dollar-denominated short-term money market instruments. Securities Lending Fund investments are valued at the evaluated bid price provided by an independent pricing service. Income earned from investment in the Securities Lending Fund is included in income from affiliated securities on the Statement of Operations.
Security transactions and income recognition
Securities transactions are recorded on a trade date basis. Realized gains or losses are recorded on the basis of identified cost.
Dividend income is recognized on the ex-dividend date.
Distributions to shareholders
Distributions to shareholders from net investment income and net realized gains, if any, are recorded on the ex-dividend date. Such distributions are determined in accordance with income tax regulations and may differ from U.S. generally accepted accounting principles. Dividend sources are estimated at the time of declaration. The tax character of distributions is determined as of the Fund’s fiscal year end. Therefore, a portion of the Fund’s distributions made prior to the Fund’s fiscal year end may be categorized as a tax return of capital.
Federal and other taxes
The Fund intends to continue to qualify as a regulated investment company by distributing substantially all of its investment company taxable income and any net realized capital gains (after reduction for capital loss carryforwards) sufficient to relieve it from all, or substantially all, federal income taxes. Accordingly, no provision for federal income taxes was required.
The Fund’s income and federal excise tax returns and all financial records supporting those returns for the prior three fiscal years are subject to examination by the federal and Delaware revenue authorities. Management has analyzed the Fund’s tax positions taken on federal, state, and foreign tax returns for all open tax years and does not believe that there are any uncertain tax positions that require recognition of a tax liability.
As of January 31, 2018, the aggregate cost of all investments for federal income tax purposes was $834,096,356 and the unrealized gains (losses) consisted of:
| | | | |
Gross unrealized gains | | $ | 384,649,481 | |
Gross unrealized losses | | | (5,581,057 | ) |
Net unrealized gains | | $ | 379,068,424 | |
Class allocations
The separate classes of shares offered by the Fund differ principally in applicable sales charges, distribution, shareholder servicing, and administration fees. Class specific expenses are charged directly to that share class. Investment income, common expenses, and realized and unrealized gains (losses) on investments are allocated daily to each class of shares based on the relative proportion of net assets of each class.
3. FAIR VALUATION MEASUREMENTS
Fair value measurements of investments are determined within a framework that has established a fair value hierarchy based upon the various data inputs utilized in determining the value of the Fund’s investments. The three-level hierarchy gives the highest priority to unadjusted quoted prices in active markets for identical assets or liabilities (Level 1) and the lowest priority to unobservable inputs (Level 3). The Fund’s investments are classified within the fair value hierarchy based on the lowest level of input that is significant to the fair value measurement. The inputs are summarized into three broad levels as follows:
| | | | |
| 22 | | Wells Fargo Large Cap Core Fund | | Notes to financial statements (unaudited) |
| ∎ | | Level 1 – quoted prices in active markets for identical securities |
| ∎ | | Level 2 – other significant observable inputs (including quoted prices for similar securities, interest rates, prepayment speeds, credit risk, etc.) |
| ∎ | | Level 3 – significant unobservable inputs (including the Fund’s own assumptions in determining the fair value of investments) |
The inputs or methodologies used for valuing investments in securities are not necessarily an indication of the risk associated with investing in those securities.
The following is a summary of the inputs used in valuing the Fund’s assets and liabilities as of January 31, 2018:
| | | | | | | | | | | | | | | | |
| | | Quoted prices
(Level 1) | | | Other significant
observable inputs
(Level 2) | | | Significant
unobservable inputs (Level 3) | | | Total | |
Assets | | | | | | | | | | | | | | | | |
Investments in: | | | | | | | | | | | | | | | | |
| | | | |
Common stocks | | | | | | | | | | | | | | | | |
Consumer discretionary | | $ | 171,695,979 | | | $ | 0 | | | $ | 0 | | | $ | 171,695,979 | |
Consumer staples | | | 64,868,573 | | | | 0 | | | | 0 | | | | 64,868,573 | |
Energy | | | 60,151,791 | | | | 0 | | | | 0 | | | | 60,151,791 | |
Financials | | | 147,560,765 | | | | 0 | | | | 0 | | | | 147,560,765 | |
Health care | | | 208,184,273 | | | | 0 | | | | 0 | | | | 208,184,273 | |
Industrials | | | 130,928,773 | | | | 0 | | | | 0 | | | | 130,928,773 | |
Information technology | | | 279,302,716 | | | | 0 | | | | 0 | | | | 279,302,716 | |
Materials | | | 52,648,367 | | | | 0 | | | | 0 | | | | 52,648,367 | |
Real estate | | | 41,837,405 | | | | 0 | | | | 0 | | | | 41,837,405 | |
Utilities | | | 18,646,058 | | | | 0 | | | | 0 | | | | 18,646,058 | |
| | | | |
Short-term investments | | | | | | | | | | | | | | | | |
Investment companies | | | 12,847,596 | | | | 0 | | | | 0 | | | | 12,847,596 | |
Investments measured at net asset value* | | | | | | | | | | | | | | | 24,492,484 | |
| | | $ | 1,188,672,296 | | | $ | 0 | | | $ | 0 | | | $ | 1,213,164,780 | |
| * | Investments that are measured at fair value using the net asset value per share (or its equivalent) as a practical expedient have not been categorized in the fair value hierarchy. The fair value amount presented in the table is intended to permit reconciliation of the fair value hierarchy to the amounts presented in the Statement of Assets and Liabilities. The Fund’s investment in Securities Lending Cash Investments, LLC valued at $24,492,484 does not have a redemption period notice, can be redeemed daily and does not have any unfunded commitments. |
The Fund recognizes transfers between levels within the fair value hierarchy at the end of the reporting period. At January 31, 2018, the Fund did not have any transfers into/out of Level 1, Level 2, or Level 3.
4. TRANSACTIONS WITH AFFILIATES
Management fee
Funds Management, an indirect wholly owned subsidiary of Wells Fargo, is the manager of the Fund and provides advisory and fund-level administrative services under an investment management agreement. Under the investment management agreement, Funds Management is responsible for, among other services, implementing the investment objectives and strategies of the Fund, supervising the subadviser, providing fund-level administrative services in connection with the Fund’s operations, and providing any other fund-level administrative services reasonably necessary for the operation of the Fund. As compensation for its services under the investment management agreement, Funds Management is entitled to receive an annual management fee starting at 0.70% and declining to 0.505% as the average daily net assets of the Fund increase. For the six months ended January 31, 2018, the management fee was equivalent to an annual rate of 0.68% of the Fund’s average daily net assets.
Funds Management has retained the services of a subadviser to provide daily portfolio management to the Fund. The fee for subadvisory services is borne by Funds Management. Golden Capital Management, LLC, an affiliate of Funds Management and an indirect wholly owned subsidiary of Wells Fargo, was the subadviser to the Fund and was entitled to receive a fee from Funds Management at an annual rate which started at 0.35% and declined to 0.30% as the average
| | | | | | |
| Notes to financial statements (unaudited) | | Wells Fargo Large Cap Core Fund | | | 23 | |
daily net assets of the Fund increased. In connection with the completion of the merger of Golden Capital Management LLC into WellsCap on January 1, 2018, WellsCap became the subadvisor to the Fund. The merger did not result in any change to the services provided to the Fund or to its strategies or fees and expenses. WellsCap receives an annual subadvisory fee from Funds Management at an annual rate starting at 0.35% and declining to 0.30% as the average daily net assets of the Fund increase.
Administration fees
Under a class-level administration agreement, Funds Management provides class-level administrative services to the Fund, which includes paying fees and expenses for services provided by the transfer agent, sub-transfer agents, omnibus account servicers and record-keepers. As compensation for its services under the class-level administration agreement, Funds Management receives an annual fee which is calculated based on the average daily net assets of each class as follows:
| | | | |
| | | Class-level
administration fee | |
Class A, Class C, Class R | | | 0.21 | % |
Class R6 | | | 0.03 | |
Administrator Class, Institutional Class | | | 0.13 | |
Funds Management has contractually waived and/or reimbursed management and administration fees to the extent necessary to maintain certain net operating expense ratios for the Fund. Waiver of fees and/or reimbursement of expenses by Funds Management were made first from fund level expenses on a proportionate basis and then from class specific expenses. Funds Management has committed through November 30, 2018 to waive fees and/or reimburse expenses to the extent necessary to cap the Fund’s expenses at 1.08% for Class A shares, 1.83% for Class C shares, 1.33% for Class R shares, 0.65% for Class R6 shares, 0.97% for Administrator Class shares, and 0.67% for Institutional Class shares. After this time, the cap may be increased or the commitment to maintain the cap may be terminated only with the approval of the Board of Trustees. Prior to December 1, 2017, the Fund’s expenses were capped at 1.14% for Class A shares, 1.89% for Class C shares, 1.39% for Class R shares, 0.68% for Class R6 shares, 1.00% for Administrator Class shares, and 0.70% for Institutional Class shares.
Distribution fees
The Trust has adopted a distribution plan for Class C and Class R shares of the Fund pursuant to Rule 12b-1 under the 1940 Act. Distribution fees are charged to Class C and Class R shares and paid to Wells Fargo Funds Distributor, LLC (“Funds Distributor”), the principal underwriter, at an annual rate of 0.75% of the average daily net assets of Class C shares and 0.25% of the average daily net assets of Class R shares.
In addition, Funds Distributor is entitled to receive the front-end sales charge from the purchase of Class A shares and a contingent deferred sales charge on the redemption of certain Class A shares. Funds Distributor is also entitled to receive the contingent deferred sales charges from redemptions of Class C shares. For the six months ended January 31, 2018, Funds Distributor received $9,548 from the sale of Class A shares and $2,718 in contingent deferred sales charges from redemptions of Class C shares. No contingent deferred sales charges were incurred by Class A shares for the six months ended January 31, 2018.
Shareholder servicing fees
The Trust has entered into contracts with one or more shareholder servicing agents, whereby Class A, Class C, Class R, and Administrator Class, of the Fund are charged a fee at an annual rate of 0.25% of the average daily net assets of each respective class.
A portion of these total shareholder servicing fees were paid to affiliates of Wells Fargo.
Interfund transactions
The Fund may purchase or sell investment securities to other Wells Fargo affiliates pursuant to Rule 17a-7 under the 1940 Act and under procedures adopted by the Board of Trustees. The procedures have been designed to ensure that these interfund transactions, which do not incur broker commissions, are effected at current market prices.
5. INVESTMENT PORTFOLIO TRANSACTIONS
Purchases and sales of investments, excluding U.S. government obligations (if any) and short-term securities, for the six months ended January 31, 2018 were $190,007,291 and $234,104,391, respectively.
| | | | |
| 24 | | Wells Fargo Large Cap Core Fund | | Notes to financial statements (unaudited) |
6. BANK BORROWINGS
The Trust (excluding the money market funds and certain other funds) and Wells Fargo Variable Trust are parties to a $280,000,000 revolving credit agreement whereby the Fund is permitted to use bank borrowings for temporary or emergency purposes, such as to fund shareholder redemption requests. Interest under the credit agreement is charged to the Fund based on a borrowing rate equal to the higher of the Federal Funds rate in effect on that day plus 1.25% or the overnight LIBOR rate in effect on that day plus 1.25%. In addition, an annual commitment fee equal to 0.25% of the unused balance is allocated to each participating fund. Prior to August 29, 2017, the revolving credit agreement amount was $250,000,000.
For the six months ended January 31, 2018, there were no borrowings by the Fund under the agreement.
7. INDEMNIFICATION
Under the Trust’s organizational documents, the officers and Trustees have been granted certain indemnification rights against certain liabilities that may arise out of performance of their duties to the Trust. Additionally, in the normal course of business, the Trust may enter into contracts with service providers that contain a variety of indemnification clauses. The Trust’s maximum exposure under these arrangements is dependent on future claims that may be made against the Fund and, therefore, cannot be estimated.
| | | | | | |
| Other information (unaudited) | | Wells Fargo Large Cap Core Fund | | | 25 | |
PROXY VOTING INFORMATION
A description of the policies and procedures that the Fund uses to determine how to vote proxies relating to portfolio securities is available, upon request, by calling 1-800-222-8222, visiting our website at wellsfargofunds.com, or visiting the SEC website at sec.gov. Information regarding how the Fund voted proxies relating to portfolio securities during the most recent 12-month period ended June 30 is available on the Fund’s website at wellsfargofunds.com or by visiting the SEC website at sec.gov.
PORTFOLIO HOLDINGS INFORMATION
The complete portfolio holdings for the Fund are publicly available monthly on the Fund’s website (wellsfargofunds.com), on a one-month delayed basis. In addition, top ten holdings information (excluding derivative positions) for the Fund is publicly available on the Fund’s website on a monthly, seven-day or more delayed basis. The Fund files its complete schedule of portfolio holdings with the SEC for the first and third quarters of each fiscal year on Form N-Q, which is available by visiting the SEC website at sec.gov. In addition, the Fund’s Form N-Q may be reviewed and copied at the SEC’s Public Reference Room in Washington, DC, and at regional offices in New York City, at 233 Broadway, and in Chicago, at 175 West Jackson Boulevard, Suite 900. Information about the Public Reference Room may be obtained by calling 1-800-SEC-0330.
| | | | |
| 26 | | Wells Fargo Large Cap Core Fund | | Other information (unaudited) |
BOARD OF TRUSTEES AND OFFICERS
Each of the Trustees and Officers1 listed in the table below acts in identical capacities for each fund in the Wells Fargo family of funds, which consists of 153 mutual funds comprising the Wells Fargo Funds Trust, Wells Fargo Variable Trust, Wells Fargo Master Trust and four closed-end funds (collectively the “Fund Complex”). This table should be read in conjunction with the Prospectus and the Statement of Additional Information2. The mailing address of each Trustee and Officer is 525 Market Street, 12th Floor, San Francisco, CA 94105. Each Trustee and Officer serves an indefinite term, however, each Trustee serves such term until reaching the mandatory retirement age established by the Trustees.
Independent Trustees
| | | | | | |
Name and
year of birth | | Position held and
length of service* | | Principal occupations during past five years or longer | | Current other
public company or
investment company
directorships |
William R. Ebsworth (Born 1957) | | Trustee, since 2015 | | Retired. From 1984 to 2013, equities analyst, portfolio manager, research director and chief investment officer at Fidelity Management and Research Company in Boston, Tokyo, and Hong Kong, and retired in 2013 as Chief Investment Officer of Fidelity Strategic Advisers, Inc. where he led a team of investment professionals managing client assets. Prior thereto, Board member of Hong Kong Securities Clearing Co., Hong Kong Options Clearing Corp., the Thailand International Fund, Ltd., Fidelity Investments Life Insurance Company, and Empire Fidelity Investments Life Insurance Company. Board member of the Forté Foundation (non-profit organization) and the Vincent Memorial Hospital Endowment (non-profit organization), where he serves on the Investment Committee and as a Chair of the Audit Committee. Mr. Ebsworth is a CFA® charterholder. | | Asset Allocation Trust |
Jane A. Freeman** (Born 1953) | | Trustee, since 2015; Chair Liaison, since 2018 | | Retired. From 2012 to 2014 and 1999 to 2008, Chief Financial Officer of Scientific Learning Corporation. From 2008 to 2012, Ms. Freeman provided consulting services related to strategic business projects. Prior to 1999, Portfolio Manager at Rockefeller & Co. and Scudder, Stevens & Clark. Board member of the Harding Loevner Funds from 1996 to 2014, serving as both Lead Independent Director and chair of the Audit Committee. Board member of the Russell Exchange Traded Funds Trust from 2011 to 2012 and the chair of the Audit Committee. Ms. Freeman is a Board Member of Ruth Bancroft Garden (non-profit organization) and the Glimmerglass Festival. She is also an inactive Chartered Financial Analyst. | | Asset Allocation Trust |
Isaiah Harris, Jr. (Born 1952) | | Trustee, since 2009 | | Retired. Chairman of the Board of CIGNA Corporation since 2009, and Director since 2005. From 2003 to 2011, Director of Deluxe Corporation. Prior thereto, President and CEO of BellSouth Advertising and Publishing Corp. from 2005 to 2007, President and CEO of BellSouth Enterprises from 2004 to 2005 and President of BellSouth Consumer Services from 2000 to 2003. Emeritus member of the Iowa State University Foundation Board of Governors. Emeritus Member of the Advisory Board of Iowa State University School of Business. Advisory Board Member, Palm Harbor Academy (charter school). Advisory Board Member, Child Evangelism Fellowship (non-profit). Mr. Harris is a certified public accountant (inactive status). | | CIGNA Corporation; Asset Allocation Trust |
Judith M. Johnson (Born 1949) | | Trustee, since 2008; Audit Committee Chairman, since 2008 | | Retired. Prior thereto, Chief Executive Officer and Chief Investment Officer of Minneapolis Employees Retirement Fund from 1996 to 2008. Ms. Johnson is an attorney, certified public accountant and a certified managerial accountant. | | Asset Allocation Trust |
David F. Larcker (Born 1950) | | Trustee, since 2009 | | James Irvin Miller Professor of Accounting at the Graduate School of Business, Stanford University, Director of the Corporate Governance Research Initiative and Senior Faculty of The Rock Center for Corporate Governance since 2006. From 2005 to 2008, Professor of Accounting at the Graduate School of Business, Stanford University. Prior thereto, Ernst & Young Professor of Accounting at The Wharton School, University of Pennsylvania from 1985 to 2005. | | Asset Allocation Trust |
| | | | | | |
| Other information (unaudited) | | Wells Fargo Large Cap Core Fund | | | 27 | |
| | | | | | |
Name and
year of birth | | Position held and
length of service* | | Principal occupations during past five years or longer | | Current other
public company or
investment company
directorships |
Olivia S. Mitchell*** (Born 1953) | | Trustee, since 2006; Governance Committee Chairman, since 2018 | | International Foundation of Employee Benefit Plans Professor, Wharton School of the University of Pennsylvania since 1993. Director of Wharton’s Pension Research Council and Boettner Center on Pensions & Retirement Research, and Research Associate at the National Bureau of Economic Research. Previously, Cornell University Professor from 1978 to 1993. | | Asset Allocation Trust |
Timothy J. Penny**** (Born 1951) | | Trustee since 1996; Chairman, since 2018; Vice Chairman, from 2017 to 2018 | | President and Chief Executive Officer of Southern Minnesota Initiative Foundation, a non-profit organization, since 2007. Member of the Board of Trustees of NorthStar Education Finance, Inc., a non-profit organization, since 2007. | | Asset Allocation Trust |
James G. Polisson***** (Born 1959) | | Trustee, since 2018; Advisory Board Member, from 2017 to 2018 | | Retired. Chief Marketing Officer, Source (ETF) UK Services, Ltd, from 2015 to 2017. From 2012 to 2015, Principal of The Polisson Group, LLC, a management consulting, corporate advisory and principal investing company. Chief Executive Officer and Managing Director at Russell Investments, Global Exchange Traded Funds from 2010 to 2012. Managing Director of Barclays Global Investors from 1998 to 2010 and Global Chief Marketing Officer for iShares and Barclays Global Investors from 2000 to 2010. Trustee of the San Francisco Mechanics’ Institute, a non-profit organization, from 2013 to 2015. Board member of the Russell Exchange Traded Fund Trust from 2011 to 2012. Director of Barclays Global Investors Holdings Deutschland GmbH from 2006 to 2009. Mr. Polisson is an attorney and has a retired status with the Massachusetts and District of Columbia Bar Associations. | | Asset Allocation Trust |
Michael S. Scofield (Born 1943) | | Trustee, since 2010 | | Served on the Investment Company Institute’s Board of Governors and Executive Committee from 2008-2011 as well the Governing Council of the Independent Directors Council from 2006-2011 and the Independent Directors Council Executive Committee from 2008-2011. Trustee of the Evergreen Fund complex (and its predecessors) from 1984 to 2010. Chairman of the Evergreen Funds from 2000-2010. Former Trustee of the Mentor Funds. Retired Attorney, Law Offices of Michael S. Scofield. | | Asset Allocation Trust |
Pamela Wheelock***** (Born 1959) | | Trustee, since 2018; Advisory Board Member, from 2017 to 2018 | | Chief Operating Officer, Twin Cities Habitat for Humanity, since January, 2017. Vice President of University Services, University of Minnesota from 2012 to 2017. Prior thereto, Interim President and Chief Executive Officer of Blue Cross Blue Shield of Minnesota from 2010 to 2011, Chairman of the Board from 2009 to 2011 and Board Director from 2003 to 2015. Vice President, Leadership and Community Engagement, Bush Foundation, Saint Paul, Minnesota (a private foundation) from 2009 to 2011. Executive Vice President and Chief Financial Officer, Minnesota Sports and Entertainment from 2004 to 2009 and Senior Vice President from 2002 to 2004. Commissioner of Finance, State of Minnesota, from 1999 to 2002. Currently on the Board of Directors, Governance Committee and Finance Committee, for the Minnesota Philanthropy Partners (Saint Paul Foundation) since 2012 and Board Chair of the Minnesota Wild Foundation since 2010. | | Asset Allocation Trust |
| * | Length of service dates reflect the Trustee’s commencement of service with the Trust’s predecessor entities, where applicable. |
| ** | Jane Freeman became Chair Liaison effective January 1, 2018. |
| *** | Olivia Mitchell became Chairman of the Governance Committee effective January 1, 2018. |
| **** | Timothy Penny became Chairman effective January 1, 2018. |
| ***** | James Polisson and Pamela Wheelock each became a Trustee effective January 1, 2018. |
| | | | |
| 28 | | Wells Fargo Large Cap Core Fund | | Other information (unaudited) |
Officers
| | | | | | |
Name and
year of birth | | Position held and
length of service | | Principal occupations during past five years or longer | | |
Andrew Owen (Born 1960) | | President, since 2017 | | Executive Vice President of Wells Fargo & Company and Head of Affiliated Managers, Wells Fargo Asset Management, since 2014. In addition, Mr. Owen is currently President, Chief Executive Officer and Director of Wells Fargo Funds Management, LLC since 2017. Prior thereto, Executive Vice President responsible for marketing, investments and product development for Wells Fargo Funds Management, LLC, from 2009 to 2014. | | |
Jeremy DePalma1 (Born 1974) | | Treasurer, since 2012 | | Senior Vice President of Wells Fargo Funds Management, LLC since 2009. Senior Vice President of Evergreen Investment Management Company, LLC from 2008 to 2010 and head of the Fund Reporting and Control Team within Fund Administration from 2005 to 2010. | | |
C. David Messman (Born 1960) | | Secretary, since 2000; Chief Legal Officer, since 2003 | | Senior Vice President and Secretary of Wells Fargo Funds Management, LLC since 2001. Assistant General Counsel of Wells Fargo Bank, N.A. since 2013 and Vice President and Managing Counsel of Wells Fargo Bank, N.A. from 1996 to 2013. | | |
Michael H. Whitaker (Born 1967) | | Chief Compliance Officer, since 2016 | | Senior Vice President and Chief Compliance Officer since 2016. Senior Vice President and Chief Compliance Officer for Fidelity Investments from 2007 to 2016. | | |
David Berardi (Born 1975) | | Assistant Treasurer, since 2009 | | Vice President of Wells Fargo Funds Management, LLC since 2009. Vice President of Evergreen Investment Management Company, LLC from 2008 to 2010. Manager of Fund Reporting and Control for Evergreen Investment Management Company, LLC from 2004 to 2010. | | |
| 1 | Jeremy DePalma acts as Treasurer of 76 funds and Assistant Treasurer of 77 funds in the Fund Complex. |
| 2 | The Statement of Additional Information includes additional information about the Trustees and is available, without charge, upon request, by calling 1-800-222-8222 or by visiting the website at wellsfargofunds.com. |
| | | | | | |
| List of abbreviations | | Wells Fargo Large Cap Core Fund | | | 29 | |
The following is a list of common abbreviations for terms and entities that may have appeared in this report.
| ACA | — ACA Financial Guaranty Corporation |
| ADR | — American depositary receipt |
| ADS | — American depositary shares |
| AGC | — Assured Guaranty Corporation |
| AGM | — Assured Guaranty Municipal |
| Ambac | — Ambac Financial Group Incorporated |
| AMT | — Alternative minimum tax |
| BAN | — Bond anticipation notes |
| BHAC | — Berkshire Hathaway Assurance Corporation |
| CAB | — Capital appreciation bond |
| CCAB | — Convertible capital appreciation bond |
| CDA | — Community Development Authority |
| CDO | — Collateralized debt obligation |
| CLO | — Collateralized loan obligation |
| DRIVER | — Derivative inverse tax-exempt receipts |
| DW&P | — Department of Water & Power |
| DWR | — Department of Water Resources |
| ECFA | — Educational & Cultural Facilities Authority |
| EDA | — Economic Development Authority |
| EDFA | — Economic Development Finance Authority |
| ETF | — Exchange-traded fund |
| FDIC | — Federal Deposit Insurance Corporation |
| FFCB | — Federal Farm Credit Banks |
| FGIC | — Financial Guaranty Insurance Corporation |
| FHA | — Federal Housing Administration |
| FHLB | — Federal Home Loan Bank |
| FHLMC | — Federal Home Loan Mortgage Corporation |
| FICO | — The Financing Corporation |
| FNMA | — Federal National Mortgage Association |
| GDR | — Global depositary receipt |
| GNMA | — Government National Mortgage Association |
| HCFR | — Healthcare facilities revenue |
| HEFA | — Health & Educational Facilities Authority |
| HEFAR | — Higher education facilities authority revenue |
| HFA | — Housing Finance Authority |
| HFFA | — Health Facilities Financing Authority |
| HUD | — Department of Housing and Urban Development |
| IDA | — Industrial Development Authority |
| IDAG | — Industrial Development Agency |
| KRW | — Republic of Korea won |
| LIBOR | — London Interbank Offered Rate |
| LIFER | — Long Inverse Floating Exempt Receipts |
| LLC | — Limited liability company |
| LLLP | — Limited liability limited partnership |
| LLP | — Limited liability partnership |
| MBIA | — Municipal Bond Insurance Association |
| MFHR | — Multifamily housing revenue |
| MSTR | — Municipal securities trust receipts |
| MUD | — Municipal Utility District |
| National | — National Public Finance Guarantee Corporation |
| PCFA | — Pollution Control Financing Authority |
| PCL | — Public Company Limited |
| PCR | — Pollution control revenue |
| PFA | — Public Finance Authority |
| PFFA | — Public Facilities Financing Authority |
| PFOTER | — Puttable floating option tax-exempt receipts |
| PJSC | — Public Joint Stock Company |
| plc | — Public limited company |
| PUTTER | — Puttable tax-exempt receipts |
| R&D | — Research & development |
| Radian | — Radian Asset Assurance |
| RAN | — Revenue anticipation notes |
| RDA | — Redevelopment Agency |
| RDFA | — Redevelopment Finance Authority |
| REIT | — Real estate investment trust |
| ROC | — Reset option certificates |
| SAVRS | — Select auction variable rate securities |
| SBA | — Small Business Authority |
| SDR | — Swedish depositary receipt |
| SFHR | — Single-family housing revenue |
| SFMR | — Single-family mortgage revenue |
| SIFMA | — Securities Industry and Financial Markets Association |
| SPA | — Standby purchase agreement |
| SPDR | — Standard & Poor’s Depositary Receipts |
| SPEAR | — Short Puttable Exempt Adjustable Receipts |
| STRIPS | — Separate trading of registered interest and |
| TAN | — Tax anticipation notes |
| TIPS | — Treasury inflation-protected securities |
| TRAN | — Tax revenue anticipation notes |
| TTFA | — Transportation Trust Fund Authority |
| TVA | — Tennessee Valley Authority |
This page is intentionally left blank.
This page is intentionally left blank.
This page is intentionally left blank.

For more information
More information about Wells Fargo Funds is available free upon request. To obtain literature, please write, email, visit the Fund’s website, or call:
Wells Fargo Funds
P.O. Box 8266
Boston, MA 02266-8266
Email: fundservice@wellsfargo.com
Website: wellsfargofunds.com
Individual investors: 1-800-222-8222
Retail investment professionals: 1-888-877-9275
Institutional investment professionals:
1-866-765-0778
This report and the financial statements contained herein are submitted for the general information of the shareholders of the Fund. If this report is used for promotional purposes, distribution of the report must be accompanied or preceded by a current prospectus. Before investing, please consider the investment objectives, risks, charges, and expenses of the investment. For a current prospectus and, if available, a summary prospectus, containing this information, call 1-800-222-8222 or visit the Fund’s website at wellsfargofunds.com. Read the prospectus carefully before you invest or send money.
Wells Fargo Asset Management (WFAM) is a trade name used by the asset management businesses of Wells Fargo & Company. Wells Fargo Funds Management, LLC, a wholly owned subsidiary of Wells Fargo & Company, provides investment advisory and administrative services for Wells Fargo Funds. Other affiliates of Wells Fargo & Company provide subadvisory and other services for the funds. The funds are distributed by Wells Fargo Funds Distributor, LLC, Member FINRA, an affiliate of Wells Fargo & Company. Neither Wells Fargo Funds Distributor nor Wells Fargo Funds Management holds fund shareholder accounts or assets. This material is for general informational and educational purposes only and is NOT intended to provide investment advice or a recommendation of any kind—including a recommendation for any specific investment, strategy, or plan.
NOT FDIC INSURED ◾ NO BANK GUARANTEE ◾ MAY LOSE VALUE
© 2018 Wells Fargo Funds Management, LLC. All rights reserved.
| | |
 | | 309116 03-18 SA208/SAR208 01-18 |
Semi-Annual Report
January 31, 2018

Wells Fargo Large Cap Growth Fund


Reduce clutter. Save trees.
Sign up for electronic delivery of prospectuses and shareholder reports at wellsfargo.com/advantagedelivery
Contents
The views expressed and any forward-looking statements are as of January 31, 2018, unless otherwise noted, and are those of the Fund managers and/or Wells Fargo Funds Management, LLC. Discussions of individual securities, or the markets generally, or any Wells Fargo Fund are not intended as individual recommendations. Future events or results may vary significantly from those expressed in any forward-looking statements. The views expressed are subject to change at any time in response to changing circumstances in the market. Wells Fargo Funds Management, LLC and the Fund disclaim any obligation to publicly update or revise any views expressed or forward-looking statements.
NOT FDIC INSURED ◾ NO BANK GUARANTEE ◾ MAY LOSE VALUE
| | | | |
| 2 | | Wells Fargo Large Cap Growth Fund | | Letter to shareholders (unaudited) |

Andrew Owen
President
Wells Fargo Funds
While investing in stocks and bonds generally delivered favorable returns during the past six months, fixed-income investments in the U.S. diverged from the global trend.
Dear Shareholder:
We are pleased to offer you this semi-annual report for the Wells Fargo Large Cap Growth Fund for the six-month period that ended January 31, 2018. While investing in stocks generally delivered favorable returns during the past six months, fixed-income investments in the U.S. diverged from the global trend. U.S. and international stocks delivered similar results, with returns of 15.43% and 13.50%, respectively, for the six-month period, as measured by the S&P 500 Index1 and the MSCI ACWI ex USA Index (Net)2, respectively. Within fixed income, the Bloomberg Barclays Global Aggregate ex-USD Index3 earned 4.50%. In the U.S., fixed-income investments, as measured by the Bloomberg Barclays U.S. Aggregate Bond Index4, fell 0.35% and the Bloomberg Barclays Municipal Bond Index5 declined 0.19%.
As global growth improved in the third quarter of 2017, investment markets advanced.
Globally, stocks moved higher during the late summer of 2017 as they were subject to the same positive economic conditions that influenced their advances during first half of the year: moderately accelerating global economic growth supported by improving corporate earnings as well as low inflation and interest rates. Brief episodes of geopolitical tensions, primarily associated with North Korea’s advancing nuclear missile program, flaring conflicts in the Middle East, and uncertainty surrounding the new U.S. administration’s trade policies, did not discourage investing activity. In the U.S., economic data released during the quarter reflected a generally healthy economy. Second-quarter economic output grew at a 3.1% annual rate.
Outside the U.S., stocks in international developed and emerging markets were supported by improved economic growth. Advances in emerging markets equity valuations slowed compared with the pace of the first half of 2017 but continued an upward path. Central banks in Europe, Asia, and Japan maintained low-interest-rate policies that supported business growth and equity investing.
In the U.S., Federal Reserve (Fed) officials announced in October plans to begin the process of unwinding its $4.5 trillion portfolio of bonds and other assets accumulated during rounds of quantitative easing conducted since the 2008–2009 recession. Still, restrained inflation kept long-term bond rates steady and the flattening of the yield curve persisted.
Positive economic and market news continued as 2017 closed and 2018 began.
During the fourth quarter of 2017, stock markets continued an upward trajectory. Synchronous economic expansion worldwide continued with mild inflation and low volatility. Data released during the quarter reflected a healthy U.S. economy.
| 1 | The S&P 500 Index consists of 500 stocks chosen for market size, liquidity, and industry group representation. It is a market-value-weighted index with each stock’s weight in the index proportionate to its market value. You cannot invest directly in an index. |
| 2 | The Morgan Stanley Capital International (MSCI) All Country World Index (ACWI) ex USA Index (Net) is a free-float-adjusted market-capitalization-weighted index that is designed to measure the equity market performance of developed markets, excluding the United States and Canada. Source: MSCI. MSCI makes no express or implied warranties or representations and shall have no liability whatsoever with respect to any MSCI data contained herein. The MSCI data may not be further redistributed or used as a basis for other indices or any securities or financial products. This report is not approved, reviewed, or produced by MSCI. You cannot invest directly in an index. |
| 3 | The Bloomberg Barclays Global Aggregate ex-USD Index is an unmanaged index that provides a broad-based measure of the global investment-grade fixed-income markets excluding the U.S.-dollar-denominated debt market. You cannot invest directly in an index. |
| 4 | The Bloomberg Barclays U.S. Aggregate Bond Index is a broad-based benchmark that measures the investment-grade, U.S. dollar-denominated, fixed-rate taxable bond market, including Treasuries, government-related and corporate securities, mortgage-backed securities (agency fixed-rate and hybrid adjustable-rate mortgage pass-throughs), asset-backed securities, and commercial mortgage-backed securities. You cannot invest directly in an index. |
| 5 | The Bloomberg Barclays Municipal Bond Index is an unmanaged index composed of long-term tax-exempt bonds with a minimum credit rating of Baa. You cannot invest directly in an index. |
| | | | | | |
| Letter to shareholders (unaudited) | | Wells Fargo Large Cap Growth Fund | | | 3 | |
Third-quarter economic output grew at a 3.2% annual rate. Increased hiring pushed the unemployment rate down to a 17-year low of 4.1%. Tax reform in the U.S. that passed as the year ended also encouraged increased spending among businesses and individuals. Signs of long-awaited wage growth appeared to emerge.
Outside the U.S., economies continued to strengthen. In December, the Organisation for Economic Co-operation and Development (OECD) reported that the global economy has been expanding at its fastest rate since 2010; all 35 countries the OECD follows were on track to expand for 2017. International economies have benefited from catalysts such as economic stimulus, improving employment, increased investment, accelerated trade growth, and the firming of prices for some of the commodities that are essential exports of many international economies.
October 2017 marked one year since regulatory reform of money market investing in the U.S. By December 2017, money market fund asset levels exceeded their December 2016 levels, reflecting continued investor demand for the short-term investment opportunities afforded them by money market funds.
In December 2017, the Fed raised the federal funds rate target to a range of 1.25% to 1.50%. The Fed also began reducing its bond portfolio. Long-term interest rates in the U.S. trended higher as the yield curve steepened—the 10-year Treasury rate moved from 2.46% to 2.84% and the 30-year rate moved from 2.81% to 3.08% during January 2018.
Don’t let short-term uncertainty derail long-term investment goals.
Periods of investment uncertainty can present challenges, but experience has taught us that maintaining long-term investment goals can be an effective way to plan for the future. To help you create a sound strategy based on your personal goals and risk tolerance, Wells Fargo Funds offers more than 100 mutual funds spanning a wide range of asset classes and investment styles. Although diversification cannot guarantee an investment profit or prevent losses, we believe it can be an effective way to manage investment risk and potentially smooth out overall portfolio performance. We encourage investors to know their investments and to understand that appropriate levels of risk-taking may unlock opportunities.
Thank you for choosing to invest with Wells Fargo Funds. We appreciate your confidence in us and remain committed to helping you meet your financial needs.
Sincerely,

Andrew Owen
President
Wells Fargo Funds
Although diversification cannot guarantee an investment profit or prevent losses, we believe it can be an effective way to manage investment risk and potentially smooth out overall portfolio performance.
For further information about your Fund, contact your investment professional, visit our website at wellsfargofunds.com, or call us directly at 1-800-222-8222.
| | | | |
| 4 | | Wells Fargo Large Cap Growth Fund | | Performance highlights (unaudited) |
Investment objective
The Fund seeks long-term capital appreciation.
Manager
Wells Fargo Funds Management, LLC
Subadviser
Wells Capital Management Incorporated
Portfolio managers
Joseph M. Eberhardy, CFA®, CPA
Bob Gruendyke, CFA®‡
Thomas C. Ognar, CFA®
Bruce C. Olson, CFA®*
Average annual total returns (%) as of January 31, 20181
| | | | | | | | | | | | | | | | | | | | | | | | | | | | | | | | | | |
| | | | | Including sales charge | | | Excluding sales charge | | | Expense ratios2 (%) | |
| | | Inception date | | 1 year | | | 5 year | | | 10 year | | | 1 year | | | 5 year | | | 10 year | | | Gross | | | Net3 | |
| Class A (STAFX) | | 7-30-2010 | | | 30.84 | | | | 14.53 | | | | 9.86 | | | | 38.82 | | | | 15.89 | | | | 10.51 | | | | 1.16 | | | | 1.07 | |
| Class C (STOFX) | | 7-30-2010 | | | 36.79 | | | | 15.03 | | | | 9.71 | | | | 37.79 | | | | 15.03 | | | | 9.71 | | | | 1.91 | | | | 1.82 | |
| Class R (STMFX) | | 6-15-2012 | | | – | | | | – | | | | – | | | | 38.48 | | | | 15.60 | | | | 10.27 | | | | 1.41 | | | | 1.32 | |
| Class R4 (SLGRX) | | 11-30-2012 | | | – | | | | – | | | | – | | | | 39.27 | | | | 16.25 | | | | 10.78 | | | | 0.88 | | | | 0.80 | |
| Class R6 (STFFX) | | 11-30-2012 | | | – | | | | – | | | | – | | | | 39.43 | | | | 16.42 | | | | 10.87 | | | | 0.73 | | | | 0.65 | |
| Administrator Class (STDFX) | | 7-30-2010 | | | – | | | | – | | | | – | | | | 39.03 | | | | 16.04 | | | | 10.62 | | | | 1.08 | | | | 0.95 | |
| Institutional Class (STNFX) | | 7-30-2010 | | | – | | | | – | | | | – | | | | 39.27 | | | | 16.34 | | | | 10.82 | | | | 0.83 | | | | 0.75 | |
| Russell 1000® Growth Index4 | | – | | | – | | | | – | | | | – | | | | 34.89 | | | | 17.95 | | | | 11.65 | | | | – | | | | – | |
Figures quoted represent past performance, which is no guarantee of future results, and do not reflect taxes that a shareholder may pay on fund distributions or the redemption of fund shares. Investment return and principal value of an investment will fluctuate so that an investor’s shares, when redeemed, may be worth more or less than their original cost. Performance shown without sales charges would be lower if sales charges were reflected. Current performance may be lower or higher than the performance data quoted, which assumes the reinvestment of dividends and capital gains. Current month-end performance is available on the Fund’s website, wellsfargofunds.com.
Please keep in mind that high double-digit returns were primarily achieved during favorable market conditions. You should not expect that such favorable returns can be consistently achieved. A fund’s performance, especially for short time periods, should not be the sole factor in making your investment decision.
Index returns do not include transaction costs associated with buying and selling securities, any mutual fund fees or expenses, or any taxes. It is not possible to invest directly in an index.
For Class A shares, the maximum front-end sales charge is 5.75%. For Class C shares, the maximum contingent deferred sales charge is 1.00%. Performance including a contingent deferred sales charge assumes the sales charge for the corresponding time period. Class R, Class R4, Class R6, Administrator Class, and Institutional Class shares are sold without a front-end sales charge or contingent deferred sales charge.
Stock values fluctuate in response to the activities of individual companies and general market and economic conditions. Certain investment strategies tend to increase the total risk of an investment (relative to the broader market). The Fund is exposed to foreign investment risk. Consult the Fund’s prospectus for additional information on these and other risks.
Please see footnotes on page 5.
| | | | | | |
| Performance highlights (unaudited) | | Wells Fargo Large Cap Growth Fund | | | 5 | |
| | | | |
| Ten largest holdings (%) as of January 31, 20185 | |
Amazon.com Incorporated | | | 7.24 | |
Microsoft Corporation | | | 5.54 | |
Facebook Incorporated Class A | | | 5.44 | |
Alphabet Incorporated Class A | | | 4.43 | |
MasterCard Incorporated Class A | | | 3.31 | |
Alphabet Incorporated Class C | | | 3.26 | |
Visa Incorporated Class A | | | 3.16 | |
Microchip Technology Incorporated | | | 3.03 | |
Dollar Tree Incorporated | | | 2.40 | |
PayPal Holdings Incorporated | | | 2.37 | |
|
| Sector distribution as of January 31, 20186 |
|

|
| ‡ | Mr. Gruendyke became a portfolio manager of the Fund on December 1, 2017. |
| * | Mr. Olson has announced his intention to retire from Wells Capital Management on April 30, 2018. |
| 1 | Historical performance shown for Class A, Administrator Class, and Institutional Class shares prior to their inception reflects the performance of the former Investor Class shares, and includes the higher expenses applicable to the former Investor Class shares. If these expenses had not been included, returns for Class A, Administrator Class, and Institutional Class shares would be higher. Historical performance shown for Class C and Class R shares prior to their inception reflects the performance of the former Investor Class shares, adjusted to reflect the higher expenses applicable to Class C and Class R shares. Historical performance shown for Class R4 shares prior to their inception reflects the performance of Institutional Class shares, adjusted to reflect the higher expenses applicable to Class R4 shares. Historical performance shown for Class R6 shares prior to their inception reflects the performance of Institutional Class shares, and includes the higher expenses applicable to Institutional Class shares. If these expenses had not been included, returns for Class R6 shares would be higher. |
| 2 | Reflects the expense ratios as stated in the most recent prospectuses. The expense ratios shown are subject to change and may differ from the annualized expense ratios shown in the financial highlights of this report. |
| 3 | The manager has contractually committed through November 30, 2018, to waive fees and/or reimburse expenses to the extent necessary to cap the Fund’s Total Annual Fund Operating Expenses After Fee Waivers at the amounts shown. After this time, the cap may be increased or the commitment to maintain the cap may be terminated only with the approval of the Board of Trustees. Brokerage commissions, stamp duty fees, interest, taxes, acquired fund fees and expenses, and extraordinary expenses are excluded from the expense cap. Without this cap, the Fund’s returns would have been lower. The expense ratio paid by an investor is the net expense ratio or the Fund’s Total Annual Fund Operating Expenses After Fee Waivers, as stated in the prospectuses. |
| 4 | The Russell 1000® Growth Index measures the performance of those Russell 1000 companies with higher price/book ratios and higher forecasted growth values. You cannot invest directly in an index. |
| 5 | The ten largest holdings, excluding cash and cash equivalents, are calculated based on the value of the investments divided by total net assets of the Fund. Holdings are subject to change and may have changed since the date specified. |
| 6 | Amounts are calculated based on the total long-term investments of the Fund. These amounts are subject to change and may have changed since the date specified. |
| | | | |
| 6 | | Wells Fargo Large Cap Growth Fund | | Fund expenses (unaudited) |
As a shareholder of the Fund, you incur two types of costs: (1) transaction costs, including sales charges (loads) on purchase payments and contingent deferred sales charges (if any) on redemptions and (2) ongoing costs, including management fees, distribution (12b-1) and/or shareholder servicing fees, and other Fund expenses. This example is intended to help you understand your ongoing costs (in dollars) of investing in the Fund and to compare these costs with the ongoing costs of investing in other mutual funds.
The example is based on an investment of $1,000 invested at the beginning of the six-month period and held for the entire period from August 1, 2017 to January 31, 2018.
Actual expenses
The “Actual” line of the table below provides information about actual account values and actual expenses. You may use the information in this line, together with the amount you invested, to estimate the expenses that you paid over the period. Simply divide your account value by $1,000 (for example, an $8,600 account value divided by $1,000 = 8.6), then multiply the result by the number in the “Actual” line under the heading entitled “Expenses paid during period” for your applicable class of shares to estimate the expenses you paid on your account during this period.
Hypothetical example for comparison purposes
The “Hypothetical” line of the table below provides information about hypothetical account values and hypothetical expenses based on the Fund’s actual expense ratio and an assumed rate of return of 5% per year before expenses, which is not the Fund’s actual return. The hypothetical account values and expenses may not be used to estimate the actual ending account balance or expenses you paid for the period. You may use this information to compare the ongoing costs of investing in the Fund and other funds. To do so, compare this 5% hypothetical example with the 5% hypothetical examples that appear in the shareholder reports of the other funds.
Please note that the expenses shown in the table are meant to highlight your ongoing costs only and do not reflect any transactional costs, such as sales charges (loads) and contingent deferred sales charges. Therefore, the “Hypothetical” line of the table is useful in comparing ongoing costs only and will not help you determine the relative total costs of owning different funds. In addition, if these transactional costs were included, your costs would have been higher.
| | | | | | | | | | | | | | | | |
| | | Beginning account value 8-1-2017 | | | Ending account value 1-31-2018 | | | Expenses paid during the period¹ | | | Annualized net expense ratio | |
Class A | | | | | | | | | | | | | | | | |
Actual | | $ | 1,000.00 | | | $ | 1,226.69 | | | $ | 6.01 | | | | 1.07 | % |
Hypothetical (5% return before expenses) | | $ | 1,000.00 | | | $ | 1,019.81 | | | $ | 5.45 | | | | 1.07 | % |
Class C | | | | | | | | | | | | | | | | |
Actual | | $ | 1,000.00 | | | $ | 1,222.15 | | | $ | 10.19 | | | | 1.82 | % |
Hypothetical (5% return before expenses) | | $ | 1,000.00 | | | $ | 1,016.03 | | | $ | 9.25 | | | | 1.82 | % |
Class R | | | | | | | | | | | | | | | | |
Actual | | $ | 1,000.00 | | | $ | 1,225.07 | | | $ | 7.40 | | | | 1.32 | % |
Hypothetical (5% return before expenses) | | $ | 1,000.00 | | | $ | 1,018.55 | | | $ | 6.72 | | | | 1.32 | % |
Class R4 | | | | | | | | | | | | | | | | |
Actual | | $ | 1,000.00 | | | $ | 1,228.36 | | | $ | 4.49 | | | | 0.80 | % |
Hypothetical (5% return before expenses) | | $ | 1,000.00 | | | $ | 1,021.17 | | | $ | 4.08 | | | | 0.80 | % |
Class R6 | | | | | | | | | | | | | | | | |
Actual | | $ | 1,000.00 | | | $ | 1,229.32 | | | $ | 3.65 | | | | 0.65 | % |
Hypothetical (5% return before expenses) | | $ | 1,000.00 | | | $ | 1,021.93 | | | $ | 3.31 | | | | 0.65 | % |
Administrator Class | | | | | | | | | | | | | | | | |
Actual | | $ | 1,000.00 | | | $ | 1,227.49 | | | $ | 5.33 | | | | 0.95 | % |
Hypothetical (5% return before expenses) | | $ | 1,000.00 | | | $ | 1,020.42 | | | $ | 4.84 | | | | 0.95 | % |
Institutional Class | | | | | | | | | | | | | | | | |
Actual | | $ | 1,000.00 | | | $ | 1,228.59 | | | $ | 4.21 | | | | 0.75 | % |
Hypothetical (5% return before expenses) | | $ | 1,000.00 | | | $ | 1,021.42 | | | $ | 3.82 | | | | 0.75 | % |
| 1 | Expenses paid is equal to the annualized net expense ratio of each class multiplied by the average account value over the period, multiplied by the number of days in the most recent fiscal half-year divided by the number of days in the fiscal year (to reflect the one-half-year period). |
| | | | | | |
| Portfolio of investments—January 31, 2018 (unaudited) | | Wells Fargo Large Cap Growth Fund | | | 7 | |
| | | | | | | | | | | | | | | | |
| Security name | | | | | | | | Shares | | | Value | |
| | | |
Common Stocks: 99.72% | | | | | | | | | | | | | |
| | | | |
Consumer Discretionary: 16.29% | | | | | | | | | | | | | | | | |
| | | |
| Auto Components: 0.15% | | | | | | | | | | | | | |
Aptiv plc | | | | | | | | | | | 18,200 | | | $ | 1,726,816 | |
| | | | | | | | | | | | | | | | |
|
| Hotels, Restaurants & Leisure: 1.97% | |
Marriott International Incorporated Class A | | | | | | | | | | | 55,300 | | | | 8,147,902 | |
Norwegian Cruise Line Holdings Limited † | | | | | | | | | | | 186,374 | | | | 11,320,357 | |
Royal Caribbean Cruises Limited | | | | | | | | | | | 21,300 | | | | 2,844,615 | |
| | | | |
| | | | | | | | | | | | | | | 22,312,874 | |
| | | | | | | | | | | | | | | | |
|
| Household Durables: 1.01% | |
Mohawk Industries Incorporated † | | | | | | | | | | | 40,800 | | | | 11,467,248 | |
| | | | | | | | | | | | | | | | |
|
| Internet & Direct Marketing Retail: 8.98% | |
Amazon.com Incorporated † | | | | | | | | | | | 56,500 | | | | 81,975,285 | |
Netflix Incorporated † | | | | | | | | | | | 48,000 | | | | 12,974,400 | |
The Priceline Group Incorporated † | | | | | | | | | | | 3,500 | | | | 6,692,175 | |
| | | | |
| | | | | | | | | | | | | | | 101,641,860 | |
| | | | | | | | | | | | | | | | |
|
| Multiline Retail: 2.40% | |
Dollar Tree Incorporated † | | | | | | | | | | | 236,100 | | | | 27,151,500 | |
| | | | | | | | | | | | | | | | |
|
| Specialty Retail: 1.78% | |
The Home Depot Incorporated | | | | | | | | | | | 100,000 | | | | 20,090,000 | |
| | | | | | | | | | | | | | | | |
|
Consumer Staples: 3.24% | |
|
| Beverages: 0.68% | |
Constellation Brands Incorporated Class A | | | | | | | | | | | 35,100 | | | | 7,703,397 | |
| | | | | | | | | | | | | | | | |
|
| Food & Staples Retailing: 1.25% | |
Costco Wholesale Corporation | | | | | | | | | | | 72,350 | | | | 14,098,845 | |
| | | | | | | | | | | | | | | | |
|
| Personal Products: 1.31% | |
The Estee Lauder Companies Incorporated Class A | | | | | | | | | | | 110,000 | | | | 14,845,600 | |
| | | | | | | | | | | | | | | | |
|
Energy: 1.44% | |
|
| Oil, Gas & Consumable Fuels: 1.44% | |
Concho Resources Incorporated † | | | | | | | | | | | 103,300 | | | | 16,263,552 | |
| | | | | | | | | | | | | | | | |
|
Financials: 6.81% | |
|
| Capital Markets: 6.21% | |
CME Group Incorporated | | | | | | | | | | | 129,360 | | | | 19,854,173 | |
Morgan Stanley | | | | | | | | | | | 339,740 | | | | 19,212,297 | |
Raymond James Financial Incorporated | | | | | | | | | | | 72,800 | | | | 7,017,192 | |
The Charles Schwab Corporation | | | | | | | | | | | 405,450 | | | | 21,626,703 | |
The Goldman Sachs Group Incorporated | | | | | | | | | | | 9,500 | | | | 2,544,955 | |
| | | | |
| | | | | | | | | | | | | | | 70,255,320 | |
| | | | | | | | | | | | | | | | |
The accompanying notes are an integral part of these financial statements.
| | | | |
| 8 | | Wells Fargo Large Cap Growth Fund | | Portfolio of investments—January 31, 2018 (unaudited) |
| | | | | | | | | | | | | | | | |
| Security name | | | | | | | | Shares | | | Value | |
|
| Insurance: 0.60% | |
The Progressive Corporation | | | | | | | | | | | 127,000 | | | $ | 6,870,700 | |
| | | | | | | | | | | | | | | | |
|
Health Care: 7.95% | |
|
| Biotechnology: 2.25% | |
BioMarin Pharmaceutical Incorporated † | | | | | | | | | | | 76,420 | | | | 6,895,377 | |
Incyte Corporation † | | | | | | | | | | | 11,510 | | | | 1,039,238 | |
Vertex Pharmaceuticals Incorporated † | | | | | | | | | | | 105,480 | | | | 17,601,448 | |
| | | | |
| | | | | | | | | | | | | | | 25,536,063 | |
| | | | | | | | | | | | | | | | |
|
| Health Care Equipment & Supplies: 2.87% | |
Boston Scientific Corporation † | | | | | | | | | | | 484,890 | | | | 13,557,524 | |
Edwards Lifesciences Corporation † | | | | | | | | | | | 105,480 | | | | 13,351,658 | |
Stryker Corporation | | | | | | | | | | | 34,000 | | | | 5,588,920 | |
| | | | |
| | | | | | | | | | | | | | | 32,498,102 | |
| | | | | | | | | | | | | | | | |
|
| Life Sciences Tools & Services: 0.41% | |
Agilent Technologies Incorporated | | | | | | | | | | | 63,100 | | | | 4,633,433 | |
| | | | | | | | | | | | | | | | |
|
| Pharmaceuticals: 2.42% | |
Bristol-Myers Squibb Company | | | | | | | | | | | 104,200 | | | | 6,522,920 | |
Zoetis Incorporated | | | | | | | | | | | 271,700 | | | | 20,847,541 | |
| | | | |
| | | | | | | | | | | | | | | 27,370,461 | |
| | | | | | | | | | | | | | | | |
|
Industrials: 13.17% | |
|
| Aerospace & Defense: 1.97% | |
The Boeing Company | | | | | | | | | | | 63,000 | | | | 22,325,310 | |
| | | | | | | | | | | | | | | | |
|
| Air Freight & Logistics: 1.32% | |
FedEx Corporation | | | | | | | | | | | 56,650 | | | | 14,869,492 | |
| | | | | | | | | | | | | | | | |
|
| Airlines: 1.10% | |
Southwest Airlines Company | | | | | | | | | | | 204,000 | | | | 12,403,200 | |
| | | | | | | | | | | | | | | | |
|
| Commercial Services & Supplies: 2.07% | |
KAR Auction Services Incorporated | | | | | | | | | | | 137,432 | | | | 7,495,541 | |
Waste Connections Incorporated | | | | | | | | | | | 222,000 | | | | 15,944,040 | |
| | | | |
| | | | | | | | | | | | | | | 23,439,581 | |
| | | | | | | | | | | | | | | | |
|
| Electrical Equipment: 1.15% | |
Rockwell Automation Incorporated | | | | | | | | | | | 66,100 | | | | 13,040,869 | |
| | | | | | | | | | | | | | | | |
|
| Industrial Conglomerates: 1.28% | |
3M Company | | | | | | | | | | | 58,000 | | | | 14,529,000 | |
| | | | | | | | | | | | | | | | |
|
| Machinery: 0.76% | |
Fortive Corporation | | | | | | | | | | | 113,000 | | | | 8,590,260 | |
| | | | | | | | | | | | | | | | |
|
| Road & Rail: 3.52% | |
CSX Corporation | | | | | | | | | | | 94,692 | | | | 5,375,665 | |
Norfolk Southern Corporation | | | | | | | | | | | 97,410 | | | | 14,697,221 | |
The accompanying notes are an integral part of these financial statements.
| | | | | | |
| Portfolio of investments—January 31, 2018 (unaudited) | | Wells Fargo Large Cap Growth Fund | | | 9 | |
| | | | | | | | | | | | | | | | |
| Security name | | | | | | | | Shares | | | Value | |
|
| Road & Rail (continued) | |
Union Pacific Corporation | | | | | | | | | | | 148,300 | | | $ | 19,798,050 | |
| | | | |
| | | | | | | | | | | | | | | 39,870,936 | |
| | | | | | | | | | | | | | | | |
|
Information Technology: 47.69% | |
|
| Internet Software & Services: 14.19% | |
Alibaba Group Holding Limited ADR † | | | | | | | | | | | 28,400 | | | | 5,801,836 | |
Alphabet Incorporated Class A † | | | | | | | | | | | 42,400 | | | | 50,126,128 | |
Alphabet Incorporated Class C † | | | | | | | | | | | 31,500 | | | | 36,853,110 | |
Facebook Incorporated Class A † | | | | | | | | 329,600 | | | | 61,598,944 | |
Shopify Incorporated Class A † | | | | | | | | 48,700 | | | | 6,229,704 | |
| | | | |
| | | | | | | | | | | | | | | 160,609,722 | |
| | | | | | | | | | | | | | | | |
|
| IT Services: 10.06% | |
MasterCard Incorporated Class A | | | | | | | | 221,400 | | | | 37,416,600 | |
PayPal Holdings Incorporated † | | | | | | | | 314,300 | | | | 26,816,076 | |
Square Incorporated Class A †« | | | | | | | | 237,000 | | | | 11,117,670 | |
Visa Incorporated Class A | | | | | | | | 288,300 | | | | 35,815,509 | |
Worldpay Incorporated Class A † | | | | | | | | 34,000 | | | | 2,730,540 | |
| | | | |
| | | | | | | | | | | | | | | 113,896,395 | |
| | | | | | | | | | | | | | | | |
|
| Semiconductors & Semiconductor Equipment: 8.40% | |
Broadcom Limited | | | | | | | | 86,400 | | | | 21,429,790 | |
Microchip Technology Incorporated | | | | | | | | 360,080 | | | | 34,286,818 | |
NVIDIA Corporation | | | | | | | | 57,140 | | | | 14,045,012 | |
Texas Instruments Incorporated | | | | | | | | 231,100 | | | | 25,344,737 | |
| | | | |
| | | | | | | | | | | | | | | 95,106,357 | |
| | | | | | | | | | | | | | | | |
|
| Software: 13.11% | |
Activision Blizzard Incorporated | | | | | | | | 165,030 | | | | 12,233,674 | |
Adobe Systems Incorporated † | | | | | | | | 88,700 | | | | 17,718,712 | |
Electronic Arts Incorporated † | | | | | | | | 40,600 | | | | 5,154,576 | |
Microsoft Corporation | | | | | | | | 660,400 | | | | 62,744,604 | |
salesforce.com Incorporated † | | | | | | | | 143,000 | | | | 16,289,130 | |
ServiceNow Incorporated † | | | | | | | | 123,000 | | | | 18,311,010 | |
Splunk Incorporated † | | | | | | | | 42,510 | | | | 3,926,649 | |
The Ultimate Software Group Incorporated † | | | | | | | | 26,000 | | | | 6,055,140 | |
VMware Incorporated Class A †« | | | | | | | | 48,000 | | | | 5,941,920 | |
| | | | |
| | | | | | | | | | | | | | | 148,375,415 | |
| | | | | | | | | | | | | | | | |
|
| Technology Hardware, Storage & Peripherals: 1.93% | |
Apple Incorporated | | | | | | | | 130,000 | | | | 21,765,900 | |
| | | | | | | | | | | | | | | | |
|
Materials: 3.13% | |
|
| Chemicals: 3.13% | |
Ecolab Incorporated | | | | | | | | 75,200 | | | | 10,353,536 | |
Praxair Incorporated | | | | | | | | 145,000 | | | | 23,416,050 | |
The Sherwin-Williams Company | | | | | | | | 3,900 | | | | 1,626,729 | |
| | | | |
| | | | | | | | | | | | | | | 35,396,315 | |
| | | | | | | | | | | | | | | | |
| |
Total Common Stocks (Cost $526,111,038) | | | | 1,128,684,523 | |
| | | | | | | | | | | | | | | | |
The accompanying notes are an integral part of these financial statements.
| | | | |
| 10 | | Wells Fargo Large Cap Growth Fund | | Portfolio of investments—January 31, 2018 (unaudited) |
| | | | | | | | | | | | | | | | |
| Security name | | Yield | | | | | | Shares | | | Value | |
|
Short-Term Investments: 1.73% | |
|
| Investment Companies: 1.73% | |
Securities Lending Cash Investment LLC (l)(r)(u) | | | 1.60 | % | | | | | | | 15,373,163 | | | $ | 15,374,700 | |
Wells Fargo Government Money Market Fund Select Class (l)(u) | | | 1.24 | | | | | | | | 4,138,207 | | | | 4,138,207 | |
| |
Total Short-Term Investments (Cost $19,512,907) | | | | 19,512,907 | |
| | | | | | | | | | | | | | | | |
| | | | | | | | |
| Total investments in securities (Cost $545,623,945) | | | 101.45 | % | | | 1,148,197,430 | |
Other assets and liabilities, net | | | (1.45 | ) | | | (16,355,387 | ) |
| | | | | | | | |
| Total net assets | | | 100.00 | % | | $ | 1,131,842,043 | |
| | | | | | | | |
| † | Non-income-earning security |
| « | All or a portion of this security is on loan. |
| (l) | The issuer of the security is an affiliated person of the Fund as defined in the Investment Company Act of 1940. |
| (r) | The investment is a non-registered investment company purchased with cash collateral received from securities on loan. |
| (u) | The rate represents the 7-day annualized yield at period end. |
Investments in Affiliates
An affiliated investment is an investment in which the Fund owns at least 5% of the outstanding voting shares of the issuer or as a result of other relationships, such as the Fund and the issuer having the same investment manager. Transactions with issuers that were either affiliated persons of the Fund at the beginning of the period or the end of the period were as follows:
| | | | | | | | | | | | | | | | | | | | | | | | | | | | | | | | | | | | |
| | | Shares,
beginning of
period | | | Shares
purchased | | | Shares
sold | | | Shares,
end of
period | | | Net
realized
gains
(losses) | | | Net change in
unrealized
gains
(losses) | | | Income
from
affiliated
securities | | | Value, end
of period | | | % of
net assets | |
| | | | | | | | | |
Short-Term Investments | | | | | | | | | | | | | | | | | | | | | | | | | | | | | | | | | | | | |
Investment Companies | | | | | | | | | | | | | | | | | | | | | | | | | | | | | | | | | | | | |
Securities Lending Cash Investment LLC | | | 3,647,110 | | | | 155,973,353 | | | | 144,247,300 | | | | 15,373,163 | | | $ | 0 | | | $ | 0 | | | $ | 20,897 | | | $ | 15,374,700 | | | | | |
Wells Fargo Government Money Market Fund Select Class | | | 14,826,435 | | | | 111,372,306 | | | | 122,060,534 | | | | 4,138,207 | | | | 0 | | | | 0 | | | | 53,781 | | | | 4,138,207 | | | | | |
| | | | | | | | | | | | | | | | | | | | | | | | | | | | | | | | | | | | |
| | | | | | | | | | | | | | | | | | $ | 0 | | | $ | 0 | | | $ | 74,678 | | | $ | 19,512,907 | | | | 1.73 | % |
| | | | | | | | | | | | | | | | | | | | | | | | | | | | | | | | | | | | |
The accompanying notes are an integral part of these financial statements.
| | | | | | |
| Statement of assets and liabilities—January 31, 2018 (unaudited) | | Wells Fargo Large Cap Growth Fund | | | 11 | |
| | | | |
| | | | |
| |
Assets | | | | |
Investments in unaffiliated securities (including $15,052,716 of securities loaned), at value (cost $526,111,038) | | $ | 1,128,684,523 | |
Investments in affiliated securities, at value (cost $19,512,907) | | | 19,512,907 | |
Receivable for investments sold | | | 2,703,686 | |
Receivable for Fund shares sold | | | 545,198 | |
Receivable for dividends | | | 369,172 | |
Receivable for securities lending income | | | 3,365 | |
Prepaid expenses and other assets | | | 62,750 | |
| | | | |
Total assets | | | 1,151,881,601 | |
| | | | |
| |
Liabilities | | | | |
Payable upon receipt of securities loaned | | | 15,373,253 | |
Payable for investments purchased | | | 3,008,210 | |
Payable for Fund shares redeemed | | | 800,186 | |
Management fee payable | | | 545,587 | |
Administration fees payable | | | 128,880 | |
Distribution fees payable | | | 11,159 | |
Trustees’ fees and expenses payable | | | 1,892 | |
Accrued expenses and other liabilities | | | 170,392 | |
| | | | |
Total liabilities | | | 20,039,558 | |
| | | | |
Total net assets | | $ | 1,131,842,043 | |
| | | | |
| |
NET ASSETS CONSIST OF | | | | |
Paid-in capital | | $ | 461,869,305 | |
Undistributed net investment income | | | 16,615 | |
Accumulated net realized gains on investments | | | 67,382,638 | |
Net unrealized gains on investments | | | 602,573,485 | |
| | | | |
Total net assets | | $ | 1,131,842,043 | |
| | | | |
| |
COMPUTATION OF NET ASSET VALUE AND OFFERING PRICE PER SHARE | | | | |
Net assets – Class A | | $ | 532,801,088 | |
Shares outstanding – Class A1 | | | 10,687,338 | |
Net asset value per share – Class A | | | $49.85 | |
Maximum offering price per share – Class A2 | | | $52.89 | |
Net assets – Class C | | $ | 15,979,534 | |
Shares outstanding – Class C1 | | | 346,235 | |
Net asset value per share – Class C | | | $46.15 | |
Net assets – Class R | | $ | 6,093,122 | |
Shares outstanding – Class R1 | | | 124,755 | |
Net asset value per share – Class R | | | $48.84 | |
Net assets – Class R4 | | $ | 533,172 | |
Share outstanding – Class R41 | | | 10,463 | |
Net asset value per share – Class R4 | | | $50.96 | |
Net assets – Class R6 | | $ | 356,357,108 | |
Shares outstanding – Class R61 | | | 6,964,461 | |
Net asset value per share – Class R6 | | | $51.17 | |
Net assets – Administrator Class | | $ | 76,173,384 | |
Shares outstanding – Administrator Class1 | | | 1,513,433 | |
Net asset value per share – Administrator Class | | | $50.33 | |
Net assets – Institutional Class | | $ | 143,904,635 | |
Shares outstanding – Institutional Class1 | | | 2,820,356 | |
Net asset value per share – Institutional Class | | | $51.02 | |
| 1 | The Fund has an unlimited number of authorized shares. |
| 2 | Maximum offering price is computed as 100/94.25 of net asset value. On investments of $50,000 or more, the offering price is reduced. |
The accompanying notes are an integral part of these financial statements.
| | | | |
| 12 | | Wells Fargo Large Cap Growth Fund | | Statement of operations—six months ended January 31, 2018 (unaudited) |
| | | | |
| | | | |
| |
Investment income | | | | |
Dividends (net of foreign withholding taxes of $8,432) | | $ | 4,917,744 | |
Income from affiliated securities | | | 74,678 | |
| | | | |
Total investment income | | | 4,992,422 | |
| | | | |
| |
Expenses | | | | |
Management fee | | | 3,749,627 | |
Administration fees | | | | |
Class A | | | 547,328 | |
Class C | | | 15,743 | |
Class R | | | 6,620 | |
Class R4 | | | 165 | |
Class R6 | | | 48,808 | |
Administrator Class | | | 47,358 | |
Institutional Class | | | 100,326 | |
Shareholder servicing fees | | | | |
Class A | | | 651,581 | |
Class C | | | 18,742 | |
Class R | | | 7,674 | |
Class R4 | | | 206 | |
Administrator Class | | | 91,073 | |
Distribution fees | | | | |
Class C | | | 56,225 | |
Class R | | | 7,881 | |
Custody and accounting fees | | | 21,946 | |
Professional fees | | | 21,556 | |
Registration fees | | | 58,499 | |
Shareholder report expenses | | | 39,439 | |
Trustees’ fees and expenses | | | 2,283 | |
Other fees and expenses | | | 13,333 | |
| | | | |
Total expenses | | | 5,506,413 | |
Less: Fee waivers and/or expense reimbursements | | | (555,568 | ) |
| | | | |
Net expenses | | | 4,950,845 | |
| | | | |
Net investment income | | | 41,577 | |
| | | | |
| |
REALIZED AND UNREALIZED GAINS (LOSSES) ON INVESTMENTS | | | | |
Net realized gains on investments | | | 138,135,457 | |
Net change in unrealized gains (losses) on investments | | | 84,915,068 | |
| | | | |
Net realized and unrealized gains (losses) on investments | | | 223,050,525 | |
| | | | |
Net increase in net assets resulting from operations | | $ | 223,092,102 | |
| | | | |
The accompanying notes are an integral part of these financial statements.
| | | | | | |
| Statement of changes in net assets | | Wells Fargo Large Cap Growth Fund | | | 13 | |
| | | | | | | | | | | | | | | | |
| | | Six months ended
January 31, 2018 (unaudited) | | | Year ended
July 31, 2017 | |
| | | | |
Operations | | | | | | | | | | | | | | | | |
Net investment income | | | | | | $ | 41,577 | | | | | | | $ | 1,325,530 | |
Net realized gains on investments | | | | | | | 138,135,457 | | | | | | | | 162,163,835 | |
Net change in unrealized gains (losses) on investments | | | | | | | 84,915,068 | | | | | | | | 387,141 | |
| | | | |
Net increase (decrease) in net assets resulting from operations | | | | | | | 223,092,102 | | | | | | | | 163,876,506 | |
| | | | |
| | | | |
Distributions to shareholders from | | | | | | | | | | | | | | | | |
Net investment income | | | | | | | | | | | | | | | | |
Class R4 | | | | | | | 0 | | | | | | | | (9,195 | ) |
Class R6 | | | | | | | (368,832 | ) | | | | | | | (472,646 | ) |
Administrator Class | | | | | | | 0 | | | | | | | | (63,610 | ) |
Institutional Class | | | | | | | (76,634 | ) | | | | | | | (294,392 | ) |
Net realized gains | | | | | | | | | | | | | | | | |
Class A | | | | | | | (94,299,274 | ) | | | | | | | (26,874,841 | ) |
Class C | | | | | | | (2,995,367 | ) | | | | | | | (872,051 | ) |
Class R | | | | | | | (1,226,176 | ) | | | | | | | (365,902 | ) |
Class R4 | | | | | | | (86,325 | ) | | | | | | | (424,319 | ) |
Class R6 | | | | | | | (60,525,258 | ) | | | | | | | (13,853,634 | ) |
Administrator Class | | | | | | | (12,791,477 | ) | | | | | | | (10,174,259 | ) |
Institutional Class | | | | | | | (29,516,610 | ) | | | | | | | (11,729,550 | ) |
| | | | |
Total distributions to shareholders | | | | | | | (201,885,953 | ) | | | | | | | (65,134,399 | ) |
| | | | |
| | | | |
Capital share transactions | | | Shares | | | | | | | | Shares | | | | | |
Proceeds from shares sold | | | | | | | | | | | | | | | | |
Class A | | | 187,429 | | | | 9,254,077 | | | | 426,944 | | | | 19,594,139 | |
Class C | | | 22,545 | | | | 1,010,420 | | | | 29,111 | | | | 1,256,023 | |
Class R | | | 40,855 | | | | 1,908,763 | | | | 59,408 | | | | 2,657,278 | |
Class R4 | | | 2,494 | | | | 134,591 | | | | 32,423 | | | | 1,499,183 | |
Class R6 | | | 346,826 | | | | 17,973,803 | | | | 2,266,868 | | | | 106,883,116 | |
Administrator Class | | | 114,377 | | | | 5,802,171 | | | | 538,207 | | | | 24,604,747 | |
Institutional Class | | | 112,940 | | | | 5,811,991 | | | | 757,332 | | | | 35,288,511 | |
| | | | |
| | | | | | | 41,895,816 | | | | | | | | 191,782,997 | |
| | | | |
Reinvestment of distributions | | | | | | | | | | | | | | | | |
Class A | | | 1,969,729 | | | | 89,405,992 | | | | 579,132 | | | | 25,111,167 | |
Class C | | | 60,978 | | | | 2,564,729 | | | | 17,868 | | | | 734,193 | |
Class R | | | 3,414 | | | | 151,866 | | | | 934 | | | | 39,944 | |
Class R4 | | | 1,781 | | | | 82,592 | | | | 9,844 | | | | 433,514 | |
Class R6 | | | 1,305,992 | | | | 60,875,276 | | | | 324,173 | | | | 14,326,280 | |
Administrator Class | | | 278,848 | | | | 12,776,830 | | | | 234,472 | | | | 10,234,532 | |
Institutional Class | | | 442,110 | | | | 20,540,888 | | | | 204,593 | | | | 9,023,692 | |
| | | | |
| | | | | | | 186,398,173 | | | | | | | | 59,903,322 | |
| | | | |
Payment for shares redeemed | | | | | | | | | | | | | | | | |
Class A | | | (1,776,835 | ) | | | (93,684,370 | ) | | | (3,218,869 | ) | | | (147,540,890 | ) |
Class C | | | (47,101 | ) | | | (2,248,279 | ) | | | (167,349 | ) | | | (7,261,013 | ) |
Class R | | | (48,962 | ) | | | (2,386,802 | ) | | | (111,516 | ) | | | (5,013,319 | ) |
Class R4 | | | (423 | ) | | | (23,200 | ) | | | (215,577 | ) | | | (10,318,581 | ) |
Class R6 | | | (694,968 | ) | | | (36,597,184 | ) | | | (1,407,477 | ) | | | (66,431,975 | ) |
Administrator Class | | | (483,709 | ) | | | (25,226,164 | ) | | | (4,298,307 | ) | | | (200,619,787 | ) |
Institutional Class | | | (1,064,824 | ) | | | (53,085,614 | ) | | | (4,398,813 | ) | | | (209,337,854 | ) |
| | | | |
| | | | | | | (213,251,613 | ) | | | | | | | (646,523,419 | ) |
| | | | |
Net increase (decrease) in net assets resulting from capital share transactions | | | | | | | 15,042,376 | | | | | | | | (394,837,100 | ) |
| | | | |
Total increase (decrease) in net assets | | | | | | | 36,248,525 | | | | | | | | (296,094,993 | ) |
| | | | |
| | | | |
Net assets | | | | | | | | | | | | | | | | |
Beginning of period | | | | | | | 1,095,593,518 | | | | | | | | 1,391,688,511 | |
| | | | |
End of period | | | | | | $ | 1,131,842,043 | | | | | | | $ | 1,095,593,518 | |
| | | | |
Undistributed net investment income | | | | | | $ | 16,615 | | | | | | | $ | 420,504 | |
| | | | |
The accompanying notes are an integral part of these financial statements.
| | | | |
| 14 | | Wells Fargo Large Cap Growth Fund | | Financial highlights |
(For a share outstanding throughout each period)
| | | | | | | | | | | | | | | | | | | | | | | | |
| | | Six months ended
January 31, 2018 (unaudited) | | | Year ended July 31 | |
| CLASS A | | | 2017 | | | 2016 | | | 2015 | | | 2014 | | | 2013 | |
Net asset value, beginning of period | | | $50.10 | | | | $46.05 | | | | $49.55 | | | | $45.30 | | | | $39.73 | | | | $32.92 | |
Net investment income (loss) | | | (0.04 | ) | | | (0.03 | )1 | | | (0.03 | )1 | | | (0.01 | )1 | | | (0.06 | ) | | | 0.04 | |
Net realized and unrealized gains (losses) on investments | | | 10.36 | | | | 6.39 | | | | (0.92 | ) | | | 6.33 | | | | 7.01 | | | | 6.81 | |
| | | | | | | | | | | | | | | | | | | | | | | | |
Total from investment operations | | | 10.32 | | | | 6.36 | | | | (0.95 | ) | | | 6.32 | | | | 6.95 | | | | 6.85 | |
Distributions to shareholders from | | | | | | | | | | | | | | | | | | | | | | | | |
Net investment income | | | 0.00 | | | | 0.00 | | | | (0.00 | )2 | | | 0.00 | | | | 0.00 | | | | (0.04 | ) |
Net realized gains | | | (10.57 | ) | | | (2.31 | ) | | | (2.55 | ) | | | (2.07 | ) | | | (1.38 | ) | | | 0.00 | |
| | | | | | | | | | | | | | | | | | | | | | | | |
Total distributions to shareholders | | | (10.57 | ) | | | (2.31 | ) | | | (2.55 | ) | | | (2.07 | ) | | | (1.38 | ) | | | (0.04 | ) |
Net asset value, end of period | | | $49.85 | | | | $50.10 | | | | $46.05 | | | | $49.55 | | | | $45.30 | | | | $39.73 | |
Total return3 | | | 22.67 | % | | | 14.60 | % | | | (1.83 | )% | | | 14.35 | % | | | 17.69 | % | | | 20.84 | % |
Ratios to average net assets (annualized) | | | | | | | | | | | | | | | | | | | | | | | | |
Gross expenses | | | 1.17 | % | | | 1.17 | % | | | 1.16 | % | | | 1.20 | % | | | 1.22 | % | | | 1.23 | % |
Net expenses | | | 1.07 | % | | | 1.07 | % | | | 1.07 | % | | | 1.07 | % | | | 1.07 | % | | | 1.07 | % |
Net investment income (loss) | | | (0.16 | )% | | | (0.06 | )% | | | (0.06 | )% | | | (0.02 | )% | | | (0.17 | )% | | | 0.09 | % |
Supplemental data | | | | | | | | | | | | | | | | | | | | | | | | |
Portfolio turnover rate | | | 14 | % | | | 40 | % | | | 31 | % | | | 26 | % | | | 35 | % | | | 57 | % |
Net assets, end of period (000s omitted) | | | $532,801 | | | | $516,410 | | | | $576,502 | | | | $184,504 | | | | $212,273 | | | | $131,616 | |
| 1 | Calculated based upon average shares outstanding |
| 2 | Amount is less than $0.005. |
| 3 | Total return calculations do not include any sales charges. Returns for periods of less than one year are not annualized. |
The accompanying notes are an integral part of these financial statements.
| | | | | | |
| Financial highlights | | Wells Fargo Large Cap Growth Fund | | | 15 | |
(For a share outstanding throughout each period)
| | | | | | | | | | | | | | | | | | | | | | | | |
| | | Six months ended
January 31, 2018 (unaudited) | | | Year ended July 31 | |
| CLASS C | | | 2017 | | | 2016 | | | 2015 | | | 2014 | | | 2013 | |
Net asset value, beginning of period | | | $47.25 | | | | $43.88 | | | | $47.68 | | | | $43.99 | | | | $38.90 | | | | $32.43 | |
Net investment loss | | | (0.22 | )1 | | | (0.35 | )1 | | | (0.32 | )1 | | | (0.42 | ) | | | (0.33 | ) | | | (0.20 | ) |
Net realized and unrealized gains (losses) on investments | | | 9.69 | | | | 6.03 | | | | (0.93 | ) | | | 6.18 | | | | 6.80 | | | | 6.67 | |
| | | | | | | | | | | | | | | | | | | | | | | | |
Total from investment operations | | | 9.47 | | | | 5.68 | | | | (1.25 | ) | | | 5.76 | | | | 6.47 | | | | 6.47 | |
Distributions to shareholders from | | | | | | | | | | | | | | | | | | | | | | | | |
Net realized gains | | | (10.57 | ) | | | (2.31 | ) | | | (2.55 | ) | | | (2.07 | ) | | | (1.38 | ) | | | 0.00 | |
Net asset value, end of period | | | $46.15 | | | | $47.25 | | | | $43.88 | | | | $47.68 | | | | $43.99 | | | | $38.90 | |
Total return2 | | | 22.22 | % | | | 13.74 | % | | | (2.56 | )% | | | 13.47 | % | | | 16.81 | % | | | 19.95 | % |
Ratios to average net assets (annualized) | | | | | | | | | | | | | | | | | | | | | | | | |
Gross expenses | | | 1.92 | % | | | 1.91 | % | | | 1.91 | % | | | 1.95 | % | | | 1.97 | % | | | 1.98 | % |
Net expenses | | | 1.82 | % | | | 1.82 | % | | | 1.82 | % | | | 1.82 | % | | | 1.82 | % | | | 1.82 | % |
Net investment loss | | | (0.91 | )% | | | (0.81 | )% | | | (0.75 | )% | | | (0.77 | )% | | | (0.89 | )% | | | (0.65 | )% |
Supplemental data | | | | | | | | | | | | | | | | | | | | | | | | |
Portfolio turnover rate | | | 14 | % | | | 40 | % | | | 31 | % | | | 26 | % | | | 35 | % | | | 57 | % |
Net assets, end of period (000s omitted) | | | $15,980 | | | | $14,640 | | | | $18,877 | | | | $22,839 | | | | $22,767 | | | | $17,748 | |
| 1 | Calculated based upon average shares outstanding |
| 2 | Total return calculations do not include any sales charges. Returns for periods of less than one year are not annualized. |
The accompanying notes are an integral part of these financial statements.
| | | | |
| 16 | | Wells Fargo Large Cap Growth Fund | | Financial highlights |
(For a share outstanding throughout each period)
| | | | | | | | | | | | | | | | | | | | | | | | |
| | | Six months ended
January 31, 2018 (unaudited) | | | Year ended July 31 | |
| CLASS R | | | 2017 | | | 2016 | | | 2015 | | | 2014 | | | 2013 | |
Net asset value, beginning of period | | | $49.34 | | | | $45.50 | | | | $49.11 | | | | $45.03 | | | | $39.59 | | | | $32.86 | |
Net investment loss | | | (0.14 | ) | | | (0.14 | )1 | | | (0.10 | )1 | | | (0.16 | ) | | | (0.15 | ) | | | (0.06 | )1 |
Net realized and unrealized gains (losses) on investments | | | 10.21 | | | | 6.29 | | | | (0.96 | ) | | | 6.31 | | | | 6.97 | | | | 6.80 | |
| | | | | | | | | | | | | | | | | | | | | | | | |
Total from investment operations | | | 10.07 | | | | 6.15 | | | | (1.06 | ) | | | 6.15 | | | | 6.82 | | | | 6.74 | |
Distributions to shareholders from | | | | | | | | | | | | | | | | | | | | | | | | |
Net investment income | | | 0.00 | | | | 0.00 | | | | 0.00 | | | | 0.00 | | | | 0.00 | | | | (0.01 | ) |
Net realized gains | | | (10.57 | ) | | | (2.31 | ) | | | (2.55 | ) | | | (2.07 | ) | | | (1.38 | ) | | | 0.00 | |
| | | | | | | | | | | | | | | | | | | | | | | | |
Total distributions to shareholders | | | (10.57 | ) | | | (2.31 | ) | | | (2.55 | ) | | | (2.07 | ) | | | (1.38 | ) | | | (0.01 | ) |
Net asset value, end of period | | | $48.84 | | | | $49.34 | | | | $45.50 | | | | $49.11 | | | | $45.03 | | | | $39.59 | |
Total return2 | | | 22.51 | % | | | 14.30 | % | | | (2.08 | )% | | | 14.05 | % | | | 17.42 | % | | | 20.53 | % |
Ratios to average net assets (annualized) | | | | | | | | | | | | | | | | | | | | | | | | |
Gross expenses | | | 1.42 | % | | | 1.41 | % | | | 1.41 | % | | | 1.45 | % | | | 1.47 | % | | | 1.47 | % |
Net expenses | | | 1.32 | % | | | 1.32 | % | | | 1.32 | % | | | 1.32 | % | | | 1.32 | % | | | 1.32 | % |
Net investment loss | | | (0.40 | )% | | | (0.31 | )% | | | (0.23 | )% | | | (0.28 | )% | | | (0.41 | )% | | | (0.16 | )% |
Supplemental data | | | | | | | | | | | | | | | | | | | | | | | | |
Portfolio turnover rate | | | 14 | % | | | 40 | % | | | 31 | % | | | 26 | % | | | 35 | % | | | 57 | % |
Net assets, end of period (000s omitted) | | | $6,093 | | | | $6,387 | | | | $8,218 | | | | $12,086 | | | | $12,295 | | | | $8,149 | |
| 1 | Calculated based upon average shares outstanding |
| 2 | Returns for periods of less than one year are not annualized. |
The accompanying notes are an integral part of these financial statements.
| | | | | | |
| Financial highlights | | Wells Fargo Large Cap Growth Fund | | | 17 | |
(For a share outstanding throughout each period)
| | | | | | | | | | | | | | | | | | | | | | | | |
| | | Six months ended
January 31, 2018 (unaudited) | | | Year ended July 31 | |
| CLASS R4 | | | 2017 | | | 2016 | | | 2015 | | | 2014 | | | 20131 | |
Net asset value, beginning of period | | | $50.94 | | | | $46.69 | | | | $50.23 | | | | $45.76 | | | | $40.05 | | | | $34.26 | |
Net investment income | | | 0.03 | 2 | | | 0.11 | 2 | | | 0.13 | | | | 0.07 | | | | 0.08 | | | | 0.09 | |
Net realized and unrealized gains (losses) on investments | | | 10.56 | | | | 6.50 | | | | (0.95 | ) | | | 6.47 | | | | 7.11 | | | | 5.81 | |
| | | | | | | | | | | | | | | | | | | | | | | | |
Total from investment operations | | | 10.59 | | | | 6.61 | | | | (0.82 | ) | | | 6.54 | | | | 7.19 | | | | 5.90 | |
Distributions to shareholders from | | | | | | | | | | | | | | | | | | | | | | | | |
Net investment income | | | 0.00 | | | | (0.05 | ) | | | (0.17 | ) | | | 0.00 | | | | (0.10 | ) | | | (0.11 | ) |
Net realized gains | | | (10.57 | ) | | | (2.31 | ) | | | (2.55 | ) | | | (2.07 | ) | | | (1.38 | ) | | | 0.00 | |
| | | | | | | | | | | | | | | | | | | | | | | | |
Total distributions to shareholders | | | (10.57 | ) | | | (2.36 | ) | | | (2.72 | ) | | | (2.07 | ) | | | (1.48 | ) | | | (0.11 | ) |
Net asset value, end of period | | | $50.96 | | | | $50.94 | | | | $46.69 | | | | $50.23 | | | | $45.76 | | | | $40.05 | |
Total return3 | | | 22.84 | % | | | 14.96 | % | | | (1.54 | )% | | | 14.69 | % | | | 18.07 | % | | | 17.37 | % |
Ratios to average net assets (annualized) | | | | | | | | | | | | | | | | | | | | | | | | |
Gross expenses | | | 0.89 | % | | | 0.88 | % | | | 0.88 | % | | | 0.87 | % | | | 0.89 | % | | | 0.87 | % |
Net expenses | | | 0.80 | % | | | 0.80 | % | | | 0.78 | % | | | 0.75 | % | | | 0.75 | % | | | 0.75 | % |
Net investment income | | | 0.11 | % | | | 0.25 | % | | | 0.27 | % | | | 0.17 | % | | | 0.17 | % | | | 0.39 | % |
Supplemental data | | | | | | | | | | | | | | | | | | | | | | | | |
Portfolio turnover rate | | | 14 | % | | | 40 | % | | | 31 | % | | | 26 | % | | | 35 | % | | | 57 | % |
Net assets, end of period (000s omitted) | | | $533 | | | | $337 | | | | $8,400 | | | | $7,205 | | | | $2,129 | | | | $12 | |
| 1 | For the period from November 30, 2012 (commencement of class operations) to July 31, 2013 |
| 2 | Calculated based upon average shares outstanding |
| 3 | Returns for periods of less than one year are not annualized. |
The accompanying notes are an integral part of these financial statements.
| | | | |
| 18 | | Wells Fargo Large Cap Growth Fund | | Financial highlights |
(For a share outstanding throughout each period)
| | | | | | | | | | | | | | | | | | | | | | | | |
| | | Six months ended
January 31, 2018 (unaudited) | | | Year ended July 31 | |
| CLASS R6 | | | 2017 | | | 2016 | | | 2015 | | | 2014 | | | 20131 | |
Net asset value, beginning of period | | | $51.12 | | | | $46.82 | | | | $50.34 | | | | $45.82 | | | | $40.11 | | | | $34.26 | |
Net investment income | | | 0.07 | 2 | | | 0.17 | | | | 0.22 | | | | 0.07 | 2 | | | 0.12 | | | | 0.15 | |
Net realized and unrealized gains (losses) on investments | | | 10.60 | | | | 6.52 | | | | (0.97 | ) | | | 6.56 | | | | 7.11 | | | | 5.82 | |
| | | | | | | | | | | | | | | | | | | | | | | | |
Total from investment operations | | | 10.67 | | | | 6.69 | | | | (0.75 | ) | | | 6.63 | | | | 7.23 | | | | 5.97 | |
Distributions to shareholders from | | | | | | | | | | | | | | | | | | | | | | | | |
Net investment income | | | (0.05 | ) | | | (0.08 | ) | | | (0.22 | ) | | | (0.04 | ) | | | (0.14 | ) | | | (0.12 | ) |
Net realized gains | | | (10.57 | ) | | | (2.31 | ) | | | (2.55 | ) | | | (2.07 | ) | | | (1.38 | ) | | | 0.00 | |
| | | | | | | | | | | | | | | | | | | | | | | | |
Total distributions to shareholders | | | (10.62 | ) | | | (2.39 | ) | | | (2.77 | ) | | | (2.11 | ) | | | (1.52 | ) | | | (0.12 | ) |
Net asset value, end of period | | | $51.17 | | | | $51.12 | | | | $46.82 | | | | $50.34 | | | | $45.82 | | | | $40.11 | |
Total return3 | | | 22.93 | % | | | 15.09 | % | | | (1.39 | )% | | | 14.88 | % | | | 18.25 | % | | | 17.48 | % |
Ratios to average net assets (annualized) | | | | | | | | | | | | | | | | | | | | | | | | |
Gross expenses | | | 0.74 | % | | | 0.74 | % | | | 0.73 | % | | | 0.72 | % | | | 0.74 | % | | | 0.75 | % |
Net expenses | | | 0.65 | % | | | 0.65 | % | | | 0.64 | % | | | 0.60 | % | | | 0.60 | % | | | 0.60 | % |
Net investment income | | | 0.26 | % | | | 0.36 | % | | | 0.39 | % | | | 0.13 | % | | | 0.29 | % | | | 0.26 | % |
Supplemental data | | | | | | | | | | | | | | | | | | | | | | | | |
Portfolio turnover rate | | | 14 | % | | | 40 | % | | | 31 | % | | | 26 | % | | | 35 | % | | | 57 | % |
Net assets, end of period (000s omitted) | | | $356,357 | | | | $307,048 | | | | $225,805 | | | | $117,741 | | | | $5,942 | | | | $2,278 | |
| 1 | For the period from November 30, 2012 (commencement of class operations) to July 31, 2013 |
| 2 | Calculated based upon average shares outstanding |
| 3 | Returns for periods of less than one year are not annualized. |
The accompanying notes are an integral part of these financial statements.
| | | | | | |
| Financial highlights | | Wells Fargo Large Cap Growth Fund | | | 19 | |
(For a share outstanding throughout each period)
| | | | | | | | | | | | | | | | | | | | | | | | |
| | | Six months ended
January 31, 2018 (unaudited) | | | Year ended July 31 | |
| ADMINISTRATOR CLASS | | | 2017 | | | 2016 | | | 2015 | | | 2014 | | | 2013 | |
Net asset value, beginning of period | | | $50.46 | | | | $46.32 | | | | $49.84 | | | | $45.50 | | | | $39.86 | | | | $33.02 | |
Net investment income (loss) | | | (0.00 | )1 | | | 0.05 | | | | 0.05 | | | | 0.05 | | | | (0.01 | ) | | | 0.09 | 2 |
Net realized and unrealized gains (losses) on investments | | | 10.44 | | | | 6.41 | | | | (0.94 | ) | | | 6.36 | | | | 7.04 | | | | 6.83 | |
| | | | | | | | | | | | | | | | | | | | | | | | |
Total from investment operations | | | 10.44 | | | | 6.46 | | | | (0.89 | ) | | | 6.41 | | | | 7.03 | | | | 6.92 | |
Distributions to shareholders from | | | | | | | | | | | | | | | | | | | | | | | | |
Net investment income | | | 0.00 | | | | (0.01 | ) | | | (0.08 | ) | | | 0.00 | | | | (0.01 | ) | | | (0.08 | ) |
Net realized gains | | | (10.57 | ) | | | (2.31 | ) | | | (2.55 | ) | | | (2.07 | ) | | | (1.38 | ) | | | 0.00 | |
| | | | | | | | | | | | | | | | | | | | | | | | |
Total distributions to shareholders | | | (10.57 | ) | | | (2.32 | ) | | | (2.63 | ) | | | (2.07 | ) | | | (1.39 | ) | | | (0.08 | ) |
Net asset value, end of period | | | $50.33 | | | | $50.46 | | | | $46.32 | | | | $49.84 | | | | $45.50 | | | | $39.86 | |
Total return3 | | | 22.75 | % | | | 14.75 | % | | | (1.71 | )% | | | 14.48 | % | | | 17.84 | % | | | 21.00 | % |
Ratios to average net assets (annualized) | | | | | | | | | | | | | | | | | | | | | | | | |
Gross expenses | | | 1.09 | % | | | 1.08 | % | | | 1.08 | % | | | 1.05 | % | | | 1.06 | % | | | 1.07 | % |
Net expenses | | | 0.95 | % | | | 0.95 | % | | | 0.95 | % | | | 0.95 | % | | | 0.95 | % | | | 0.95 | % |
Net investment income (loss) | | | (0.02 | )% | | | 0.06 | % | | | 0.12 | % | | | 0.10 | % | | | (0.02 | )% | | | 0.24 | % |
Supplemental data | | | | | | | | | | | | | | | | | | | | | | | | |
Portfolio turnover rate | | | 14 | % | | | 40 | % | | | 31 | % | | | 26 | % | | | 35 | % | | | 57 | % |
Net assets, end of period (000s omitted) | | | $76,173 | | | | $80,937 | | | | $237,577 | | | | $262,535 | | | | $245,364 | | | | $208,053 | |
| 1 | Amount is less than $0.005. |
| 2 | Calculated based upon average shares outstanding |
| 3 | Returns for periods of less than one year are not annualized. |
The accompanying notes are an integral part of these financial statements.
| | | | |
| 20 | | Wells Fargo Large Cap Growth Fund | | Financial highlights |
(For a share outstanding throughout each period)
| | | | | | | | | | | | | | | | | | | | | | | | |
| | | Six months ended
January 31, 2018 (unaudited) | | | Year ended July 31 | |
| INSTITUTIONAL CLASS | | | 2017 | | | 2016 | | | 2015 | | | 2014 | | | 2013 | |
Net asset value, beginning of period | | | $51.00 | | | | $46.74 | | | | $50.30 | | | | $45.80 | | | | $40.11 | | | | $33.16 | |
Net investment income | | | 0.05 | 1 | | | 0.12 | 1 | | | 0.17 | 1 | | | 0.19 | 1 | | | 0.11 | | | | 0.20 | |
Net realized and unrealized gains (losses) on investments | | | 10.56 | | | | 6.51 | | | | (0.96 | ) | | | 6.41 | | | | 7.09 | | | | 6.86 | |
| | | | | | | | | | | | | | | | | | | | | | | | |
Total from investment operations | | | 10.61 | | | | 6.63 | | | | (0.79 | ) | | | 6.60 | | | | 7.20 | | | | 7.06 | |
Distributions to shareholders from | | | | | | | | | | | | | | | | | | | | | | | | |
Net investment income | | | (0.02 | ) | | | (0.06 | ) | | | (0.22 | ) | | | (0.03 | ) | | | (0.13 | ) | | | (0.11 | ) |
Net realized gains | | | (10.57 | ) | | | (2.31 | ) | | | (2.55 | ) | | | (2.07 | ) | | | (1.38 | ) | | | 0.00 | |
| | | | | | | | | | | | | | | | | | | | | | | | |
Total distributions to shareholders | | | (10.59 | ) | | | (2.37 | ) | | | (2.77 | ) | | | (2.10 | ) | | | (1.51 | ) | | | (0.11 | ) |
Net asset value, end of period | | | $51.02 | | | | $51.00 | | | | $46.74 | | | | $50.30 | | | | $45.80 | | | | $40.11 | |
Total return2 | | | 22.86 | % | | | 14.98 | % | | | (1.49 | )% | | | 14.82 | % | | | 18.16 | % | | | 21.34 | % |
Ratios to average net assets (annualized) | | | | | | | | | | | | | | | | | | | | | | | | |
Gross expenses | | | 0.84 | % | | | 0.83 | % | | | 0.83 | % | | | 0.78 | % | | | 0.79 | % | | | 0.79 | % |
Net expenses | | | 0.75 | % | | | 0.75 | % | | | 0.71 | % | | | 0.65 | % | | | 0.65 | % | | | 0.69 | % |
Net investment income | | | 0.17 | % | | | 0.27 | % | | | 0.37 | % | | | 0.40 | % | | | 0.28 | % | | | 0.53 | % |
Supplemental data | | | | | | | | | | | | | | | | | | | | | | | | |
Portfolio turnover rate | | | 14 | % | | | 40 | % | | | 31 | % | | | 26 | % | | | 35 | % | | | 57 | % |
Net assets, end of period (000s omitted) | | | $143,905 | | | | $169,836 | | | | $316,310 | | | | $534,975 | | | | $596,006 | | | | $508,853 | |
| 1 | Calculated based upon average shares outstanding |
| 2 | Returns for periods of less than one year are not annualized. |
The accompanying notes are an integral part of these financial statements.
| | | | | | |
| Notes to financial statements (unaudited) | | Wells Fargo Large Cap Growth Fund | | | 21 | |
1. ORGANIZATION
Wells Fargo Funds Trust (the “Trust”), a Delaware statutory trust organized on March 10, 1999, is an open-end management investment company registered under the Investment Company Act of 1940, as amended (the “1940 Act”). As an investment company, the Trust follows the accounting and reporting guidance in Financial Accounting Standards Board Accounting Standards Codification Topic 946, Financial Services – Investment Companies. These financial statements report on the Wells Fargo Large Cap Growth Fund (the “Fund”) which is a diversified series of the Trust.
2. SIGNIFICANT ACCOUNTING POLICIES
The following significant accounting policies, which are consistently followed in the preparation of the financial statements of the Fund, are in conformity with U.S. generally accepted accounting principles which require management to make estimates and assumptions that affect the reported amounts of assets and liabilities, disclosure of contingent assets and liabilities at the date of the financial statements, and the reported amounts of revenues and expenses during the reporting period. Actual results could differ from those estimates.
Securities valuation
All investments are valued each business day as of the close of regular trading on the New York Stock Exchange (generally 4 p.m. Eastern Time), although the Fund may deviate from this calculation time under unusual or unexpected circumstances.
Equity securities that are listed on a foreign or domestic exchange or market are valued at the official closing price or, if none, the last sales price. If no sale occurs on the principal exchange or market that day, a fair value price will be determined in accordance with the Fund’s Valuation Procedures.
Investments in registered open-end investment companies are valued at net asset value. Interests in non-registered investment companies that are redeemable at net asset value are fair valued normally at net asset value.
Investments which are not valued using any of the methods discussed above are valued at their fair value, as determined in good faith by the Board of Trustees of the Fund. The Board of Trustees has established a Valuation Committee comprised of the Trustees and has delegated to it the authority to take any actions regarding the valuation of portfolio securities that the Valuation Committee deems necessary or appropriate, including determining the fair value of portfolio securities, unless the determination has been delegated to the Wells Fargo Asset Management Pricing Committee of Wells Fargo Funds Management, LLC (“Funds Management”). The Board of Trustees retains the authority to make or ratify any valuation decisions or approve any changes to the Valuation Procedures as it deems appropriate. On a quarterly basis, the Board of Trustees receives reports on any valuation actions taken by the Valuation Committee or the Wells Fargo Asset Management Pricing Committee which may include items for ratification.
Valuations of fair valued securities are compared to the next actual sales price when available, or other appropriate market values, to assess the continued appropriateness of the fair valuation methodologies used. These securities are fair valued on a day-to-day basis, taking into consideration changes to appropriate market information and any significant changes to the inputs considered in the valuation process until there is a readily available price provided on an exchange or by an independent pricing service. Valuations received from an independent pricing service or independent broker-dealer quotes are periodically validated by comparisons to most recent trades and valuations provided by other independent pricing services in addition to the review of prices by the manager and/or subadviser. Unobservable inputs used in determining fair valuations are identified based on the type of security, taking into consideration factors utilized by market participants in valuing the investment, knowledge about the issuer and the current market environment.
Security loans
The Fund may lend its securities from time to time in order to earn additional income in the form of fees or interest on securities received as collateral or the investment of any cash received as collateral. The Fund continues to receive interest or dividends on the securities loaned. The Fund receives collateral in the form of cash or securities with a value at least equal to the value of the securities on loan. The value of the loaned securities is determined at the close of each business day and any additional required collateral is delivered to the Fund on the next business day. In a securities lending transaction, the net asset value of the Fund will be affected by an increase or decrease in the value of the securities loaned and by an increase or decrease in the value of the instrument in which collateral is invested. The amount of securities lending activity undertaken by the Fund fluctuates from time to time. In the event of default or bankruptcy by the borrower, the Fund may be prevented from recovering the loaned securities or gaining access to the collateral or may experience delays or costs in doing so. In addition, the investment of any cash collateral received may lose all or part of its value. The Fund has the right under the lending agreement to recover the securities from the borrower on demand.
| | | | |
| 22 | | Wells Fargo Large Cap Growth Fund | | Notes to financial statements (unaudited) |
The Fund lends its securities through an unaffiliated securities lending agent. Cash collateral received in connection with its securities lending transactions is invested in Securities Lending Cash Investments, LLC (the “Securities Lending Fund”). The Securities Lending Fund is exempt from registration under Section 3(c)(7) of the 1940 Act and is managed by Funds Management and is subadvised by Wells Capital Management Incorporated (“WellsCap”), an affiliate of Funds Management and an indirect wholly owned subsidiary of Wells Fargo & Company (“Wells Fargo”). Funds Management receives an advisory fee starting at 0.05% and declining to 0.01% as the average daily net assets of the Securities Lending Fund increase. All of the fees received by Funds Management are paid to WellsCap for its services as subadviser. The Securities Lending Fund seeks to provide a positive return compared to the daily Fed Funds Open Rate by investing in high-quality, U.S. dollar-denominated short-term money market instruments. Securities Lending Fund investments are valued at the evaluated bid price provided by an independent pricing service. Income earned from investment in the Securities Lending Fund is included in income from affiliated securities on the Statement of Operations.
Security transactions and income recognition
Securities transactions are recorded on a trade date basis. Realized gains or losses are recorded on the basis of identified cost.
Dividend income is recognized on the ex-dividend date. Dividend income is recorded net of foreign taxes withheld where recovery of such taxes is not assured.
Distributions to shareholders
Distributions to shareholders from net investment income and net realized gains, if any, are recorded on the ex-dividend date. Such distributions are determined in accordance with income tax regulations and may differ from U.S. generally accepted accounting principles. Dividend sources are estimated at the time of declaration. The tax character of distributions is determined as of the Fund’s fiscal year end. Therefore, a portion of the Fund’s distributions made prior to the Fund’s fiscal year end may be categorized as a tax return of capital.
Federal and other taxes
The Fund intends to continue to qualify as a regulated investment company by distributing substantially all of its investment company taxable income and any net realized capital gains (after reduction for capital loss carryforwards) sufficient to relieve it from all, or substantially all, federal income taxes. Accordingly, no provision for federal income taxes was required.
The Fund’s income and federal excise tax returns and all financial records supporting those returns for the prior three fiscal years are subject to examination by the federal and Delaware revenue authorities. Management has analyzed the Fund’s tax positions taken on federal, state, and foreign tax returns for all open tax years and does not believe that there are any uncertain tax positions that require recognition of a tax liability.
As of January 31, 2018, the aggregate cost of all investments for federal income tax purposes was $545,477,335 and the unrealized gains (losses) consisted of:
| | | | |
Gross unrealized gains | | $ | 602,937,780 | |
Gross unrealized losses | | | (217,685 | ) |
Net unrealized gains | | $ | 602,720,095 | |
Class allocations
The separate classes of shares offered by the Fund differ principally in applicable sales charges, distribution, shareholder servicing, and administration fees. Class specific expenses are charged directly to that share class. Investment income, common expenses, and realized and unrealized gains (losses) on investments are allocated daily to each class of shares based on the relative proportion of net assets of each class.
3. FAIR VALUATION MEASUREMENTS
Fair value measurements of investments are determined within a framework that has established a fair value hierarchy based upon the various data inputs utilized in determining the value of the Fund’s investments. The three-level hierarchy gives the highest priority to unadjusted quoted prices in active markets for identical assets or liabilities (Level 1) and the lowest priority to unobservable inputs (Level 3). The Fund’s investments are classified within the fair value hierarchy based on the lowest level of input that is significant to the fair value measurement. The inputs are summarized into three broad levels as follows:
| | | | | | |
| Notes to financial statements (unaudited) | | Wells Fargo Large Cap Growth Fund | | | 23 | |
| ∎ | | Level 1 – quoted prices in active markets for identical securities |
| ∎ | | Level 2 – other significant observable inputs (including quoted prices for similar securities, interest rates, prepayment speeds, credit risk, etc.) |
| ∎ | | Level 3 – significant unobservable inputs (including the Fund’s own assumptions in determining the fair value of investments) |
The inputs or methodologies used for valuing investments in securities are not necessarily an indication of the risk associated with investing in those securities.
The following is a summary of the inputs used in valuing the Fund’s assets and liabilities as of January 31, 2018:
| | | | | | | | | | | | | | | | |
| | | Quoted prices (Level 1) | | | Other significant
observable inputs
(Level 2) | | | Significant
unobservable inputs (Level 3) | | | Total | |
Assets | | | | | | | | | | | | | | | | |
Investments in: | | | | | | | | | | | | | | | | |
| | | | |
Common stocks | | | | | | | | | | | | | | | | |
Consumer discretionary | | $ | 184,390,298 | | | $ | 0 | | | $ | 0 | | | $ | 184,390,298 | |
Consumer staples | | | 36,647,842 | | | | 0 | | | | 0 | | | | 36,647,842 | |
Energy | | | 16,263,552 | | | | 0 | | | | 0 | | | | 16,263,552 | |
Financials | | | 77,126,020 | | | | 0 | | | | 0 | | | | 77,126,020 | |
Health care | | | 90,038,059 | | | | 0 | | | | 0 | | | | 90,038,059 | |
Industrials | | | 149,068,648 | | | | 0 | | | | 0 | | | | 149,068,648 | |
Information technology | | | 539,753,789 | | | | 0 | | | | 0 | | | | 539,753,789 | |
Materials | | | 35,396,315 | | | | 0 | | | | 0 | | | | 35,396,315 | |
| | | | |
Short-term investments | | | | | | | | | | | | | | | | |
Investment companies | | | 4,138,207 | | | | 0 | | | | 0 | | | | 4,138,207 | |
Investments measured at net asset value* | | | | | | | | | | | | | | | 15,374,700 | |
Total assets | | $ | 1,132,822,730 | | | $ | 0 | | | $ | 0 | | | $ | 1,148,197,430 | |
| * | Investments that are measured at fair value using the net asset value per share (or its equivalent) as a practical expedient have not been categorized in the fair value hierarchy. The fair value amount presented in the table is intended to permit reconciliation of the fair value hierarchy to the amounts presented in the Statement of Assets and Liabilities. The Fund’s investment in Securities Lending Cash Investments, LLC valued at $15,374,700 does not have a redemption period notice, can be redeemed daily and does not have any unfunded commitments. |
The Fund recognizes transfers between levels within the fair value hierarchy at the end of the reporting period. At January 31, 2018, the Fund did not have any transfers into/out of Level 1, Level 2, or Level 3.
4. TRANSACTIONS WITH AFFILIATES
Management fee
Funds Management, an indirect wholly owned subsidiary of Wells Fargo, is the manager of the Fund and provides advisory and fund-level administrative services under an investment management agreement. Under the investment management agreement, Funds Management is responsible for, among other services, implementing the investment objectives and strategies of the Fund, supervising the subadviser, providing fund-level administrative services in connection with the Fund’s operations, and providing any other fund-level administrative services reasonably necessary for the operation of the Fund. As compensation for its services under the investment management agreement, Funds Management is entitled to receive an annual management fee starting at 0.70% and declining to 0.505% as the average daily net assets of the Fund increase. For the six months ended January 31, 2018, the management fee was equivalent to an annual rate of 0.68% of the Fund’s average daily net assets.
Funds Management has retained the services of a subadviser to provide daily portfolio management to the Fund. The fee for subadvisory services is borne by Funds Management. WellsCap is the subadviser to the Fund and is entitled to receive a fee from Funds Management at an annual rate starting at 0.30% and declining to 0.20% as the average daily net assets of the Fund increase.
| | | | |
| 24 | | Wells Fargo Large Cap Growth Fund | | Notes to financial statements (unaudited) |
Administration fees
Under a class-level administration agreement, Funds Management provides class-level administrative services to the Fund, which includes paying fees and expenses for services provided by the transfer agent, sub-transfer agents, omnibus account servicers and record-keepers. As compensation for its services under the class-level administration agreement, Funds Management receives an annual fee which is calculated based on the average daily net assets of each class as follows:
| | | | |
| | | Class-level
administration fee | |
Class A, Class C, Class R | | | 0.21 | % |
Class R4 | | | 0.08 | |
Class R6 | | | 0.03 | |
Administrator Class, Institutional Class | | | 0.13 | |
Funds Management has contractually waived and/or reimbursed management and administration fees to the extent necessary to maintain certain net operating expense ratios for the Fund. Waiver of fees and/or reimbursement of expenses by Funds Management were made first from fund level expenses on a proportionate basis and then from class specific expenses. Funds Management has committed through November 30, 2018 to waive fees and/or reimburse expenses to the extent necessary to cap the Fund’s expenses at 1.07% for Class A shares, 1.82% for Class C shares, 1.32% for Class R shares, 0.80% for Class R4 shares, 0.65% for Class R6 shares, 0.95% for Administrator Class shares, and 0.75% for Institutional Class shares. After this time, the cap may be increased or the commitment to maintain the cap may be terminated only with the approval of the Board of Trustees.
Distribution fees
The Trust has adopted a distribution plan for Class C and Class R shares of the Fund pursuant to Rule 12b-1 under the 1940 Act. Distribution fees are charged to Class C and Class R shares and paid to Wells Fargo Funds Distributor, LLC (“Funds Distributor”), the principal underwriter, at an annual rate of 0.75% of the average daily net assets of Class C shares and 0.25% of the average daily net assets of Class R shares.
In addition, Funds Distributor is entitled to receive the front-end sales charge from the purchase of Class A shares and a contingent deferred sales charge on the redemption of certain Class A shares. Funds Distributor is also entitled to receive the contingent deferred sales charges from redemptions of Class C shares. For the six months ended January 31, 2018, Funds Distributor received $1,092 from the sale of Class A shares and $160 in contingent deferred sales charges from redemptions of Class C shares. No contingent deferred sales charges were incurred by Class A shares for the six months ended January 31, 2018.
Shareholder servicing fees
The Trust has entered into contracts with one or more shareholder servicing agents, whereby Class A, Class C, Class R, and Administrator Class of the Fund are charged a fee at an annual rate of 0.25% of the average daily net assets of each respective class. Class R4 is charged a fee at an annual rate of 0.10% of its average daily net assets.
A portion of these total shareholder servicing fees were paid to affiliates of Wells Fargo.
Interfund transactions
The Fund may purchase or sell portfolio investment securities to certain other Wells Fargo affiliates pursuant to Rule 17a-7 under the 1940 Act and under procedures adopted by the Board of Trustees. The procedures have been designed to ensure that these interfund transactions, which do not incur broker commissions, are effected at current market prices.
5. INVESTMENT PORTFOLIO TRANSACTIONS
Purchases and sales of investments, excluding U.S. government obligations (if any) and short-term securities, for the six months ended January 31, 2018 were $154,930,953 and $351,745,434, respectively.
6. BANK BORROWINGS
The Trust (excluding the money market funds and certain other funds) and Wells Fargo Variable Trust are parties to a $280,000,000 revolving credit agreement whereby the Fund is permitted to use bank borrowings for temporary or emergency purposes, such as to fund shareholder redemption requests. Interest under the credit agreement is charged to the Fund based on a borrowing rate equal to the higher of the Federal Funds rate in effect on that day plus 1.25% or
| | | | | | |
| Notes to financial statements (unaudited) | | Wells Fargo Large Cap Growth Fund | | | 25 | |
the overnight LIBOR rate in effect on that day plus 1.25%. In addition, an annual commitment fee equal to 0.25% of the unused balance is allocated to each participating fund. Prior to August 29, 2017, the revolving credit agreement amount was $250,000,000.
For the six months ended January 31, 2018, there were no borrowings by the Fund under the agreement.
7. CONCENTRATION RISK
Concentration risks result from exposure to a limited number of sectors. A fund that invests a substantial portion of its assets in any sector may be more affected by changes in that sector than would be a fund whose investments are not heavily weighted in any sector.
8. INDEMNIFICATION
Under the Trust’s organizational documents, the officers and Trustees have been granted certain indemnification rights against certain liabilities that may arise out of performance of their duties to the Trust. Additionally, in the normal course of business, the Trust may enter into contracts with service providers that contain a variety of indemnification clauses. The Trust’s maximum exposure under these arrangements is dependent on future claims that may be made against the Fund and, therefore, cannot be estimated.
| | | | |
| 26 | | Wells Fargo Large Cap Growth Fund | | Other information (unaudited) |
PROXY VOTING INFORMATION
A description of the policies and procedures that the Fund uses to determine how to vote proxies relating to portfolio securities is available, upon request, by calling 1-800-222-8222, visiting our website at wellsfargofunds.com, or visiting the SEC website at sec.gov. Information regarding how the Fund voted proxies relating to portfolio securities during the most recent 12-month period ended June 30 is available on the Fund’s website at wellsfargofunds.com or by visiting the SEC website at sec.gov.
PORTFOLIO HOLDINGS INFORMATION
The complete portfolio holdings for the Fund are publicly available monthly on the Fund’s website (wellsfargofunds.com), on a one-month delayed basis. In addition, top ten holdings information (excluding derivative positions) for the Fund is publicly available on the Fund’s website on a monthly, seven-day or more delayed basis. The Fund files its complete schedule of portfolio holdings with the SEC for the first and third quarters of each fiscal year on Form N-Q, which is available by visiting the SEC website at sec.gov. In addition, the Fund’s Form N-Q may be reviewed and copied at the SEC’s Public Reference Room in Washington, DC, and at regional offices in New York City, at 233 Broadway, and in Chicago, at 175 West Jackson Boulevard, Suite 900. Information about the Public Reference Room may be obtained by calling 1-800-SEC-0330.
| | | | | | |
| Other information (unaudited) | | Wells Fargo Large Cap Growth Fund | | | 27 | |
BOARD OF TRUSTEES AND OFFICERS
Each of the Trustees and Officers1 listed in the table below acts in identical capacities for each fund in the Wells Fargo family of funds, which consists of 153 mutual funds comprising the Wells Fargo Funds Trust, Wells Fargo Variable Trust, Wells Fargo Master Trust and four closed-end funds (collectively the “Fund Complex”). This table should be read in conjunction with the Prospectus and the Statement of Additional Information2. The mailing address of each Trustee and Officer is 525 Market Street, 12th Floor, San Francisco, CA 94105. Each Trustee and Officer serves an indefinite term, however, each Trustee serves such term until reaching the mandatory retirement age established by the Trustees.
Independent Trustees
| | | | | | |
Name and year of birth | | Position held and length of service* | | Principal occupations during past five years or longer | | Current other public company or
investment company
directorships |
William R. Ebsworth (Born 1957) | | Trustee, since 2015 | | Retired. From 1984 to 2013, equities analyst, portfolio manager, research director and chief investment officer at Fidelity Management and Research Company in Boston, Tokyo, and Hong Kong, and retired in 2013 as Chief Investment Officer of Fidelity Strategic Advisers, Inc. where he led a team of investment professionals managing client assets. Prior thereto, Board member of Hong Kong Securities Clearing Co., Hong Kong Options Clearing Corp., the Thailand International Fund, Ltd., Fidelity Investments Life Insurance Company, and Empire Fidelity Investments Life Insurance Company. Board member of the Forté Foundation (non-profit organization) and the Vincent Memorial Hospital Endowment (non-profit organization), where he serves on the Investment Committee and as a Chair of the Audit Committee. Mr. Ebsworth is a CFA® charterholder. | | Asset Allocation Trust |
Jane A. Freeman** (Born 1953) | | Trustee, since 2015; Chair Liaison, since 2018 | | Retired. From 2012 to 2014 and 1999 to 2008, Chief Financial Officer of Scientific Learning Corporation. From 2008 to 2012, Ms. Freeman provided consulting services related to strategic business projects. Prior to 1999, Portfolio Manager at Rockefeller & Co. and Scudder, Stevens & Clark. Board member of the Harding Loevner Funds from 1996 to 2014, serving as both Lead Independent Director and chair of the Audit Committee. Board member of the Russell Exchange Traded Funds Trust from 2011 to 2012 and the chair of the Audit Committee. Ms. Freeman is a Board Member of Ruth Bancroft Garden (non-profit organization) and the Glimmerglass Festival. She is also an inactive Chartered Financial Analyst. | | Asset Allocation Trust |
Isaiah Harris, Jr. (Born 1952) | | Trustee, since 2009 | | Retired. Chairman of the Board of CIGNA Corporation since 2009, and Director since 2005. From 2003 to 2011, Director of Deluxe Corporation. Prior thereto, President and CEO of BellSouth Advertising and Publishing Corp. from 2005 to 2007, President and CEO of BellSouth Enterprises from 2004 to 2005 and President of BellSouth Consumer Services from 2000 to 2003. Emeritus member of the Iowa State University Foundation Board of Governors. Emeritus Member of the Advisory Board of Iowa State University School of Business. Advisory Board Member, Palm Harbor Academy (charter school). Advisory Board Member, Child Evangelism Fellowship (non-profit). Mr. Harris is a certified public accountant (inactive status). | | CIGNA Corporation; Asset Allocation Trust |
Judith M. Johnson (Born 1949) | | Trustee, since 2008; Audit Committee Chairman, since 2008 | | Retired. Prior thereto, Chief Executive Officer and Chief Investment Officer of Minneapolis Employees Retirement Fund from 1996 to 2008. Ms. Johnson is an attorney, certified public accountant and a certified managerial accountant. | | Asset Allocation Trust |
David F. Larcker (Born 1950) | | Trustee, since 2009 | | James Irvin Miller Professor of Accounting at the Graduate School of Business, Stanford University, Director of the Corporate Governance Research Initiative and Senior Faculty of The Rock Center for Corporate Governance since 2006. From 2005 to 2008, Professor of Accounting at the Graduate School of Business, Stanford University. Prior thereto, Ernst & Young Professor of Accounting at The Wharton School, University of Pennsylvania from 1985 to 2005. | | Asset Allocation Trust |
| | | | |
| 28 | | Wells Fargo Large Cap Growth Fund | | Other information (unaudited) |
| | | | | | |
Name and year of birth | | Position held and length of service* | | Principal occupations during past five years or longer | | Current other public company or
investment company
directorships |
Olivia S. Mitchell*** (Born 1953) | | Trustee, since 2006; Governance Committee Chairman, since 2018 | | International Foundation of Employee Benefit Plans Professor, Wharton School of the University of Pennsylvania since 1993. Director of Wharton’s Pension Research Council and Boettner Center on Pensions & Retirement Research, and Research Associate at the National Bureau of Economic Research. Previously, Cornell University Professor from 1978 to 1993. | | Asset Allocation Trust |
Timothy J. Penny**** (Born 1951) | | Trustee since 1996; Chairman, since 2018; Vice Chairman, from 2017 to 2018 | | President and Chief Executive Officer of Southern Minnesota Initiative Foundation, a non-profit organization, since 2007. Member of the Board of Trustees of NorthStar Education Finance, Inc., a non-profit organization, since 2007. | | Asset Allocation Trust |
James G. Polisson***** (Born 1959) | | Trustee, since 2018; Advisory Board Member, from 2017 to 2018 | | Retired. Chief Marketing Officer, Source (ETF) UK Services, Ltd, from 2015 to 2017. From 2012 to 2015, Principal of The Polisson Group, LLC, a management consulting, corporate advisory and principal investing company. Chief Executive Officer and Managing Director at Russell Investments, Global Exchange Traded Funds from 2010 to 2012. Managing Director of Barclays Global Investors from 1998 to 2010 and Global Chief Marketing Officer for iShares and Barclays Global Investors from 2000 to 2010. Trustee of the San Francisco Mechanics’ Institute, a non-profit organization, from 2013 to 2015. Board member of the Russell Exchange Traded Fund Trust from 2011 to 2012. Director of Barclays Global Investors Holdings Deutschland GmbH from 2006 to 2009. Mr. Polisson is an attorney and has a retired status with the Massachusetts and District of Columbia Bar Associations. | | Asset Allocation Trust |
Michael S. Scofield (Born 1943) | | Trustee, since 2010 | | Served on the Investment Company Institute’s Board of Governors and Executive Committee from 2008-2011 as well the Governing Council of the Independent Directors Council from 2006-2011 and the Independent Directors Council Executive Committee from 2008-2011. Trustee of the Evergreen Fund complex (and its predecessors) from 1984 to 2010. Chairman of the Evergreen Funds from 2000-2010. Former Trustee of the Mentor Funds. Retired Attorney, Law Offices of Michael S. Scofield. | | Asset Allocation Trust |
Pamela Wheelock***** (Born 1959) | | Trustee, since 2018; Advisory Board Member, from 2017 to 2018 | | Chief Operating Officer, Twin Cities Habitat for Humanity, since January, 2017. Vice President of University Services, University of Minnesota from 2012 to 2017. Prior thereto, Interim President and Chief Executive Officer of Blue Cross Blue Shield of Minnesota from 2010 to 2011, Chairman of the Board from 2009 to 2011 and Board Director from 2003 to 2015. Vice President, Leadership and Community Engagement, Bush Foundation, Saint Paul, Minnesota (a private foundation) from 2009 to 2011. Executive Vice President and Chief Financial Officer, Minnesota Sports and Entertainment from 2004 to 2009 and Senior Vice President from 2002 to 2004. Commissioner of Finance, State of Minnesota, from 1999 to 2002. Currently on the Board of Directors, Governance Committee and Finance Committee, for the Minnesota Philanthropy Partners (Saint Paul Foundation) since 2012 and Board Chair of the Minnesota Wild Foundation since 2010. | | Asset Allocation Trust |
| * | Length of service dates reflect the Trustee’s commencement of service with the Trust’s predecessor entities, where applicable. |
| ** | Jane Freeman became Chair Liaison effective January 1, 2018. |
| *** | Olivia Mitchell became Chairman of the Governance Committee effective January 1, 2018. |
| **** | Timothy Penny became Chairman effective January 1, 2018. |
| ***** | James Polisson and Pamela Wheelock each became a Trustee effective January 1, 2018. |
| | | | | | |
| Other information (unaudited) | | Wells Fargo Large Cap Growth Fund | | | 29 | |
Officers
| | | | | | |
Name and year of birth | | Position held and
length of service | | Principal occupations during past five years or longer | | |
Andrew Owen (Born 1960) | | President, since 2017 | | Executive Vice President of Wells Fargo & Company and Head of Affiliated Managers, Wells Fargo Asset Management, since 2014. In addition, Mr. Owen is currently President, Chief Executive Officer and Director of Wells Fargo Funds Management, LLC since 2017. Prior thereto, Executive Vice President responsible for marketing, investments and product development for Wells Fargo Funds Management, LLC, from 2009 to 2014. | | |
Jeremy DePalma1 (Born 1974) | | Treasurer, since 2012 | | Senior Vice President of Wells Fargo Funds Management, LLC since 2009. Senior Vice President of Evergreen Investment Management Company, LLC from 2008 to 2010 and head of the Fund Reporting and Control Team within Fund Administration from 2005 to 2010. | | |
C. David Messman (Born 1960) | | Secretary, since 2000; Chief Legal Officer, since 2003 | | Senior Vice President and Secretary of Wells Fargo Funds Management, LLC since 2001. Assistant General Counsel of Wells Fargo Bank, N.A. since 2013 and Vice President and Managing Counsel of Wells Fargo Bank, N.A. from 1996 to 2013. | | |
Michael H. Whitaker (Born 1967) | | Chief Compliance Officer, since 2016 | | Senior Vice President and Chief Compliance Officer since 2016. Senior Vice President and Chief Compliance Officer for Fidelity Investments from 2007 to 2016. | | |
David Berardi (Born 1975) | | Assistant Treasurer, since 2009 | | Vice President of Wells Fargo Funds Management, LLC since 2009. Vice President of Evergreen Investment Management Company, LLC from 2008 to 2010. Manager of Fund Reporting and Control for Evergreen Investment Management Company, LLC from 2004 to 2010. | | |
| 1 | Jeremy DePalma acts as Treasurer of 76 funds and Assistant Treasurer of 77 funds in the Fund Complex. |
| 2 | The Statement of Additional Information includes additional information about the Trustees and is available, without charge, upon request, by calling 1-800-222-8222 or by visiting the website at wellsfargofunds.com. |
| | | | |
| 30 | | Wells Fargo Large Cap Growth Fund | | List of abbreviations |
The following is a list of common abbreviations for terms and entities that may have appeared in this report.
| ACA | — ACA Financial Guaranty Corporation |
| ADR | — American depositary receipt |
| ADS | — American depositary shares |
| AGC | — Assured Guaranty Corporation |
| AGM | — Assured Guaranty Municipal |
| Ambac | — Ambac Financial Group Incorporated |
| AMT | — Alternative minimum tax |
| BAN | — Bond anticipation notes |
| BHAC | — Berkshire Hathaway Assurance Corporation |
| CAB | — Capital appreciation bond |
| CCAB | — Convertible capital appreciation bond |
| CDA | — Community Development Authority |
| CDO | — Collateralized debt obligation |
| CLO | — Collateralized loan obligation |
| DRIVER | — Derivative inverse tax-exempt receipts |
| DW&P | — Department of Water & Power |
| DWR | — Department of Water Resources |
| ECFA | — Educational & Cultural Facilities Authority |
| EDA | — Economic Development Authority |
| EDFA | — Economic Development Finance Authority |
| ETF | — Exchange-traded fund |
| FDIC | — Federal Deposit Insurance Corporation |
| FFCB | — Federal Farm Credit Banks |
| FGIC | — Financial Guaranty Insurance Corporation |
| FHA | — Federal Housing Administration |
| FHLB | — Federal Home Loan Bank |
| FHLMC | — Federal Home Loan Mortgage Corporation |
| FICO | — The Financing Corporation |
| FNMA | — Federal National Mortgage Association |
| GDR | — Global depositary receipt |
| GNMA | — Government National Mortgage Association |
| HCFR | — Healthcare facilities revenue |
| HEFA | — Health & Educational Facilities Authority |
| HEFAR | — Higher education facilities authority revenue |
| HFA | — Housing Finance Authority |
| HFFA | — Health Facilities Financing Authority |
| HUD | — Department of Housing and Urban Development |
| IDA | — Industrial Development Authority |
| IDAG | — Industrial Development Agency |
| KRW | — Republic of Korea won |
| LIBOR | — London Interbank Offered Rate |
| LIFER | — Long Inverse Floating Exempt Receipts |
| LLC | — Limited liability company |
| LLLP | — Limited liability limited partnership |
| LLP | — Limited liability partnership |
| MBIA | — Municipal Bond Insurance Association |
| MFHR | — Multifamily housing revenue |
| MSTR | — Municipal securities trust receipts |
| MUD | — Municipal Utility District |
| National | — National Public Finance Guarantee Corporation |
| PCFA | — Pollution Control Financing Authority |
| PCL | — Public Company Limited |
| PCR | — Pollution control revenue |
| PFA | — Public Finance Authority |
| PFFA | — Public Facilities Financing Authority |
| PFOTER | — Puttable floating option tax-exempt receipts |
| PJSC | — Public Joint Stock Company |
| plc | — Public limited company |
| PUTTER | — Puttable tax-exempt receipts |
| R&D | — Research & development |
| Radian | — Radian Asset Assurance |
| RAN | — Revenue anticipation notes |
| RDA | — Redevelopment Agency |
| RDFA | — Redevelopment Finance Authority |
| REIT | — Real estate investment trust |
| ROC | — Reset option certificates |
| SAVRS | — Select auction variable rate securities |
| SBA | — Small Business Authority |
| SDR | — Swedish depositary receipt |
| SFHR | — Single-family housing revenue |
| SFMR | — Single-family mortgage revenue |
| SIFMA | — Securities Industry and Financial Markets Association |
| SPA | — Standby purchase agreement |
| SPDR | — Standard & Poor’s Depositary Receipts |
| SPEAR | — Short Puttable Exempt Adjustable Receipts |
| STRIPS | — Separate trading of registered interest and |
| TAN | — Tax anticipation notes |
| TIPS | — Treasury inflation-protected securities |
| TRAN | — Tax revenue anticipation notes |
| TTFA | — Transportation Trust Fund Authority |
| TVA | — Tennessee Valley Authority |
This page is intentionally left blank.
This page is intentionally left blank.

For more information
More information about Wells Fargo Funds is available free upon request. To obtain literature, please write, email, visit the Fund’s website, or call:
Wells Fargo Funds
P.O. Box 8266
Boston, MA 02266-8266
Email: fundservice@wellsfargo.com
Website: wellsfargofunds.com
Individual investors: 1-800-222-8222
Retail investment professionals: 1-888-877-9275
Institutional investment professionals: 1-866-765-0778
This report and the financial statements contained herein are submitted for the general information of the shareholders of the Fund. If this report is used for promotional purposes, distribution of the report must be accompanied or preceded by a current prospectus. Before investing, please consider the investment objectives, risks, charges, and expenses of the investment. For a current prospectus and, if available, a summary prospectus, containing this information, call 1-800-222-8222 or visit the Fund’s website at wellsfargofunds.com. Read the prospectus carefully before you invest or send money.
Wells Fargo Asset Management (WFAM) is a trade name used by the asset management businesses of Wells Fargo & Company. Wells Fargo Funds Management, LLC, a wholly owned subsidiary of Wells Fargo & Company, provides investment advisory and administrative services for Wells Fargo Funds. Other affiliates of Wells Fargo & Company provide subadvisory and other services for the funds. The funds are distributed by Wells Fargo Funds Distributor, LLC, Member FINRA, an affiliate of Wells Fargo & Company. Neither Wells Fargo Funds Distributor nor Wells Fargo Funds Management holds fund shareholder accounts or assets. This material is for general informational and educational purposes only and is NOT intended to provide investment advice or a recommendation of any kind—including a recommendation for any specific investment, strategy, or plan.
NOT FDIC INSURED ◾ NO BANK GUARANTEE ◾ MAY LOSE VALUE
© 2018 Wells Fargo Funds Management, LLC. All rights reserved.
| | |
 | | 309117 03-18 SA209/SAR209 01-18 |
Semi-Annual Report
January 31, 2018

Wells Fargo Large Company Value Fund


Reduce clutter. Save trees.
Sign up for electronic delivery of prospectuses and shareholder reports at wellsfargo.com/advantagedelivery
Contents
The views expressed and any forward-looking statements are as of January 31, 2018, unless otherwise noted, and are those of the Fund managers and/or Wells Fargo Funds Management, LLC. Discussions of individual securities, or the markets generally, or any Wells Fargo Fund are not intended as individual recommendations. Future events or results may vary significantly from those expressed in any forward-looking statements. The views expressed are subject to change at any time in response to changing circumstances in the market. Wells Fargo Funds Management, LLC and the Fund disclaim any obligation to publicly update or revise any views expressed or forward-looking statements.
NOT FDIC INSURED ◾ NO BANK GUARANTEE ◾ MAY LOSE VALUE
| | | | |
| 2 | | Wells Fargo Large Company Value Fund | | Letter to shareholders (unaudited) |

Andrew Owen
President
Wells Fargo Funds
While investing in stocks and bonds generally delivered favorable returns during the past six months, fixed-income investments in the U.S. diverged from the global trend.
Dear Shareholder:
We are pleased to offer you this semi-annual report for the Wells Fargo Large Company Value Fund for the six-month period that ended January 31, 2018. While investing in stocks generally delivered favorable returns during the past six months, fixed-income investments in the U.S. diverged from the global trend. U.S. and international stocks delivered similar results, with returns of 15.43% and 13.50%, respectively, for the six-month period, as measured by the S&P 500 Index1 and the MSCI ACWI ex USA Index (Net)2, respectively. Within fixed income, the Bloomberg Barclays Global Aggregate ex-USD Index3 earned 4.50%. In the U.S., fixed-income investments, as measured by the Bloomberg Barclays U.S. Aggregate Bond Index4, fell 0.35% and the Bloomberg Barclays Municipal Bond Index5 declined 0.19%.
As global growth improved in the third quarter of 2017, investment markets advanced.
Globally, stocks moved higher during the late summer of 2017 as they were subject to the same positive economic conditions that influenced their advances during first half of the year: moderately accelerating global economic growth supported by improving corporate earnings as well as low inflation and interest rates. Brief episodes of geopolitical tensions, primarily associated with North Korea’s advancing nuclear missile program, flaring conflicts in the Middle East, and uncertainty surrounding the new U.S. administration’s trade policies, did not discourage investing activity. In the U.S., economic data released during the quarter reflected a generally healthy economy. Second-quarter economic output grew at a 3.1% annual rate.
Outside the U.S., stocks in international developed and emerging markets were supported by improved economic growth. Advances in emerging markets equity valuations slowed compared with the pace of the first half of 2017 but continued an upward path. Central banks in Europe, Asia, and Japan maintained low-interest-rate policies that supported business growth and equity investing.
In the U.S., Federal Reserve (Fed) officials announced in October plans to begin the process of unwinding its $4.5 trillion portfolio of bonds and other assets accumulated during rounds of quantitative easing conducted since the 2008–2009 recession. Still, restrained inflation kept long-term bond rates steady and the flattening of the yield curve persisted.
Positive economic and market news continued as 2017 closed and 2018 began.
During the fourth quarter of 2017, stock markets continued an upward trajectory. Synchronous economic expansion worldwide continued with mild inflation and low volatility. Data released during the quarter reflected a healthy U.S. economy.
| 1 | The S&P 500 Index consists of 500 stocks chosen for market size, liquidity, and industry group representation. It is a market-value-weighted index with each stock’s weight in the index proportionate to its market value. You cannot invest directly in an index. |
| 2 | The Morgan Stanley Capital International (MSCI) All Country World Index (ACWI) ex USA Index (Net) is a free-float-adjusted market-capitalization-weighted index that is designed to measure the equity market performance of developed markets, excluding the United States and Canada. Source: MSCI. MSCI makes no express or implied warranties or representations and shall have no liability whatsoever with respect to any MSCI data contained herein. The MSCI data may not be further redistributed or used as a basis for other indices or any securities or financial products. This report is not approved, reviewed, or produced by MSCI. You cannot invest directly in an index. |
| 3 | The Bloomberg Barclays Global Aggregate ex-USD Index is an unmanaged index that provides a broad-based measure of the global investment-grade fixed-income markets excluding the U.S.-dollar-denominated debt market. You cannot invest directly in an index. |
| 4 | The Bloomberg Barclays U.S. Aggregate Bond Index is a broad-based benchmark that measures the investment-grade, U.S. dollar-denominated, fixed-rate taxable bond market, including Treasuries, government-related and corporate securities, mortgage-backed securities (agency fixed-rate and hybrid adjustable-rate mortgage pass-throughs), asset-backed securities, and commercial mortgage-backed securities. You cannot invest directly in an index. |
| 5 | The Bloomberg Barclays Municipal Bond Index is an unmanaged index composed of long-term tax-exempt bonds with a minimum credit rating of Baa. You cannot invest directly in an index. |
| | | | | | |
| Letter to shareholders (unaudited) | | Wells Fargo Large Company Value Fund | | | 3 | |
Third-quarter economic output grew at a 3.2% annual rate. Increased hiring pushed the unemployment rate down to a 17-year low of 4.1%. Tax reform in the U.S. that passed as the year ended also encouraged increased spending among businesses and individuals. Signs of long-awaited wage growth appeared to emerge.
Outside the U.S., economies continued to strengthen. In December, the Organisation for Economic Co-operation and Development (OECD) reported that the global economy has been expanding at its fastest rate since 2010; all 35 countries the OECD follows were on track to expand for 2017. International economies have benefited from catalysts such as economic stimulus, improving employment, increased investment, accelerated trade growth, and the firming of prices for some of the commodities that are essential exports of many international economies.
October 2017 marked one year since regulatory reform of money market investing in the U.S. By December 2017, money market fund asset levels exceeded their December 2016 levels, reflecting continued investor demand for the short-term investment opportunities afforded them by money market funds.
In December 2017, the Fed raised the federal funds rate target to a range of 1.25% to 1.50%. The Fed also began reducing its bond portfolio. Long-term interest rates in the U.S. trended higher as the yield curve steepened—the 10-year Treasury rate moved from 2.46% to 2.84% and the 30-year rate moved from 2.81% to 3.08% during January 2018.
Don’t let short-term uncertainty derail long-term investment goals.
Periods of investment uncertainty can present challenges, but experience has taught us that maintaining long-term investment goals can be an effective way to plan for the future. To help you create a sound strategy based on your personal goals and risk tolerance, Wells Fargo Funds offers more than 100 mutual funds spanning a wide range of asset classes and investment styles. Although diversification cannot guarantee an investment profit or prevent losses, we believe it can be an effective way to manage investment risk and potentially smooth out overall portfolio performance. We encourage investors to know their investments and to understand that appropriate levels of risk-taking may unlock opportunities.
Thank you for choosing to invest with Wells Fargo Funds. We appreciate your confidence in us and remain committed to helping you meet your financial needs.
Sincerely,

Andrew Owen
President
Wells Fargo Funds
Although diversification cannot guarantee an investment profit or prevent losses, we believe it can be an effective way to manage investment risk and potentially smooth out overall portfolio performance.
For further information about your Fund, contact your investment professional, visit our website at wellsfargofunds.com, or call us directly at 1-800-222-8222.
| | | | |
| 4 | | Wells Fargo Large Company Value Fund | | Performance highlights (unaudited) |
Investment objective
The Fund seeks long-term capital appreciation.
Manager
Wells Fargo Funds Management, LLC
Subadviser
Analytic Investors, LLC
Portfolio managers
Dennis Bein, CFA®
Ryan Brown, CFA®
Hariandra de Silva, Ph.D., CFA®
Average annual total returns (%) as of January 31, 20181
| | | | | | | | | | | | | | | | | | | | | | | | | | | | | | | | | | |
| | | | | Including sales charge | | | Excluding sales charge | | | Expense ratios2 (%) | |
| | | Inception date | | 1 year | | | 5 year | | | 10 year | | | 1 year | | | 5 year | | | 10 year | | | Gross | | | Net3 | |
| Class A (WLCAX) | | 3-31-2008 | | | 11.90 | | | | 10.61 | | | | 6.34 | | | | 18.75 | | | | 11.93 | | | | 6.98 | | | | 0.94 | | | | 0.83 | |
| Class C (WFLVX) | | 3-31-2008 | | | 16.83 | | | | 11.09 | | | | 6.19 | | | | 17.83 | | | | 11.09 | | | | 6.19 | | | | 1.69 | | | | 1.58 | |
| Class R6 (WTLVX) | | 4-7-2017 | | | – | | | | – | | | | – | | | | 19.18 | | | | 12.39 | | | | 7.47 | | | | 0.51 | | | | 0.40 | |
| Administrator Class (WWIDX) | | 12-31-2001 | | | – | | | | – | | | | – | | | | 18.81 | | | | 12.13 | | | | 7.23 | | | | 0.86 | | | | 0.75 | |
| Institutional Class (WLCIX) | | 3-31-2008 | | | – | | | | – | | | | – | | | | 19.09 | | | | 12.38 | | | | 7.46 | | | | 0.61 | | | | 0.50 | |
| Russell 1000® Value Index4 | | – | | | – | | | | – | | | | – | | | | 17.22 | | | | 13.47 | | | | 7.95 | | | | – | | | | – | |
Figures quoted represent past performance, which is no guarantee of future results, and do not reflect taxes that a shareholder may pay on fund distributions or the redemption of fund shares. Investment return and principal value of an investment will fluctuate so that an investor’s shares, when redeemed, may be worth more or less than their original cost. Performance shown without sales charges would be lower if sales charges were reflected. Current performance may be lower or higher than the performance data quoted, which assumes the reinvestment of dividends and capital gains. Current month-end performance is available on the Fund’s website, wellsfargofunds.com.
Index returns do not include transaction costs associated with buying and selling securities, any mutual fund fees or expenses, or any taxes. It is not possible to invest directly in an index.
For Class A shares, the maximum front-end sales charge is 5.75%. For Class C shares, the maximum contingent deferred sales charge is 1.00%. Performance including a contingent deferred sales charge assumes the sales charge for the corresponding time period. Class R6, Administrator Class, and Institutional Class shares are sold without a front-end sales charge or contingent deferred sales charge.
Stock values fluctuate in response to the activities of individual companies and general market and economic conditions. Certain investment strategies tend to increase the total risk of an investment (relative to the broader market). The Fund is exposed to foreign investment risk. Consult the Fund’s prospectus for additional information on these and other risks.
Please see footnotes on page 5.
| | | | | | |
| Performance highlights (unaudited) | | Wells Fargo Large Company Value Fund | | | 5 | |
| | | | |
| Ten largest holdings (%) as of January 31, 20185 | |
Exxon Mobil Corporation | | | 4.77 | |
Berkshire Hathaway Incorporated Class B | | | 4.38 | |
Bank of America Corporation | | | 4.32 | |
Chevron Corporation | | | 3.35 | |
Wal-Mart Stores Incorporated | | | 3.17 | |
Medtronic plc | | | 2.82 | |
Baxter International Incorporated | | | 2.43 | |
Merck & Company Incorporated | | | 2.39 | |
Capital One Financial Corporation | | | 2.36 | |
Charter Communications Incorporated Class A | | | 2.29 | |
|
| Sector distribution as of January 31, 20186 |
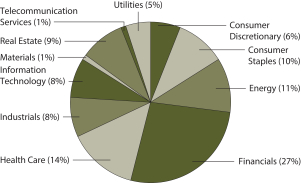
|
| 1 | Historical performance shown for Class A shares prior to their inception reflects the performance of the former Investor Class shares, and includes the higher expenses applicable to the former Investor Class shares (except during those periods in which the expenses of Class A shares would have been higher than those of the former Investor Class shares). If these expenses had not been included, returns for Class A shares would be higher. Historical performance shown for Class C shares prior to their inception reflects the performance of the former Investor Class shares, adjusted to reflect the higher expenses applicable to Class C shares. Historical performance for the Class R6 shares prior to their inception reflects the performance of the Institutional Class shares, and is not adjusted to reflect Class R6 expenses. If these expenses had been included, returns for Class R6 would be higher. Historical performance shown for Institutional Class shares prior to their inception reflects the performance of the Administrator Class shares and includes the higher expenses applicable to the Administrator Class shares. If these expenses had not been included, returns for Institutional Class shares would be higher. Historical performance shown for all classes of the Fund prior to March 21, 2008 does not reflect the Fund’s current investment objective and strategies. |
| 2 | Reflects the expense ratios as stated in the most recent prospectuses. The expense ratios shown are subject to change and may differ from the annualized expense ratios shown in the financial highlights of this report. |
| 3 | The manager has contractually committed through November 30, 2019, to waive fees and/or reimburse expenses to the extent necessary to cap the Fund’s Total Annual Fund Operating Expenses After Fee Waivers at the amounts shown. After this time, the cap may be increased or the commitment to maintain the cap may be terminated only with the approval of the Board of Trustees. Brokerage commissions, stamp duty fees, interest, taxes, acquired fund fees and expenses, and extraordinary expenses are excluded from the expense cap. Without this cap, the Fund’s returns would have been lower. The expense ratio paid by an investor is the net expense ratio or the Fund’s Total Annual Fund Operating Expenses After Fee Waivers, as stated in the prospectuses. |
| 4 | The Russell 1000® Value Index measures the performance of those Russell 1000 companies with lower price/book ratios and lower forecasted growth values. You cannot invest directly in an index. |
| 5 | The ten largest holdings, excluding cash and cash equivalents, are calculated based on the value of the investments divided by total net assets of the Fund. Holdings are subject to change and may have changed since the date specified. |
| 6 | Amounts are calculated based on the total long-term investments of the Fund. These amounts are subject to change and may have changed since the date specified. |
| | | | |
| 6 | | Wells Fargo Large Company Value Fund | | Fund expenses (unaudited) |
As a shareholder of the Fund, you incur two types of costs: (1) transaction costs, including sales charges (loads) on purchase payments and contingent deferred sales charges (if any) on redemptions and (2) ongoing costs, including management fees, distribution (12b-1) and/or shareholder servicing fees, and other Fund expenses. This example is intended to help you understand your ongoing costs (in dollars) of investing in the Fund and to compare these costs with the ongoing costs of investing in other mutual funds.
The example is based on an investment of $1,000 invested at the beginning of the six-month period and held for the entire period from August 1, 2017 to January 31, 2018.
Actual expenses
The “Actual” line of the table below provides information about actual account values and actual expenses. You may use the information in this line, together with the amount you invested, to estimate the expenses that you paid over the period. Simply divide your account value by $1,000 (for example, an $8,600 account value divided by $1,000 = 8.6), then multiply the result by the number in the “Actual” line under the heading entitled “Expenses paid during period” for your applicable class of shares to estimate the expenses you paid on your account during this period.
Hypothetical example for comparison purposes
The “Hypothetical” line of the table below provides information about hypothetical account values and hypothetical expenses based on the Fund’s actual expense ratio and an assumed rate of return of 5% per year before expenses, which is not the Fund’s actual return. The hypothetical account values and expenses may not be used to estimate the actual ending account balance or expenses you paid for the period. You may use this information to compare the ongoing costs of investing in the Fund and other funds. To do so, compare this 5% hypothetical example with the 5% hypothetical examples that appear in the shareholder reports of the other funds.
Please note that the expenses shown in the table are meant to highlight your ongoing costs only and do not reflect any transactional costs, such as sales charges (loads) and contingent deferred sales charges. Therefore, the “Hypothetical” line of the table is useful in comparing ongoing costs only and will not help you determine the relative total costs of owning different funds. In addition, if these transactional costs were included, your costs would have been higher.
| | | | | | | | | | | | | | | | |
| | | Beginning
account value
8-1-2017 | | | Ending
account value
1-31-2018 | | | Expenses
paid during
the period¹ | | | Annualized net
expense ratio | |
Class A | | | | | | | | | | | | | | | | |
Actual | | $ | 1,000.00 | | | $ | 1,123.72 | | | $ | 4.44 | | | | 0.83 | % |
Hypothetical (5% return before expenses) | | $ | 1,000.00 | | | $ | 1,021.02 | | | $ | 4.23 | | | | 0.83 | % |
Class C | | | | | | | | | | | | | | | | |
Actual | | $ | 1,000.00 | | | $ | 1,119.34 | | | $ | 8.44 | | | | 1.58 | % |
Hypothetical (5% return before expenses) | | $ | 1,000.00 | | | $ | 1,017.24 | | | $ | 8.03 | | | | 1.58 | % |
Class R6 | | | | | | | | | | | | | | | | |
Actual | | $ | 1,000.00 | | | $ | 1,126.03 | | | $ | 2.14 | | | | 0.40 | % |
Hypothetical (5% return before expenses) | | $ | 1,000.00 | | | $ | 1,023.19 | | | $ | 2.04 | | | | 0.40 | % |
Administrator Class | | | | | | | | | | | | | | | | |
Actual | | $ | 1,000.00 | | | $ | 1,123.86 | | | $ | 4.01 | | | | 0.75 | % |
Hypothetical (5% return before expenses) | | $ | 1,000.00 | | | $ | 1,021.42 | | | $ | 3.82 | | | | 0.75 | % |
Institutional Class | | | | | | | | | | | | | | | | |
Actual | | $ | 1,000.00 | | | $ | 1,125.87 | | | $ | 2.68 | | | | 0.50 | % |
Hypothetical (5% return before expenses) | | $ | 1,000.00 | | | $ | 1,022.68 | | | $ | 2.55 | | | | 0.50 | % |
| 1 | Expenses paid is equal to the annualized net expense ratio of each class multiplied by the average account value over the period, multiplied by the number of days in the most recent fiscal half-year divided by the number of days in the fiscal year (to reflect the one-half-year period). |
| | | | | | |
| Portfolio of investments—January 31, 2018 (unaudited) | | Wells Fargo Large Company Value Fund | | | 7 | |
| | | | | | | | | | | | | | | | |
| Security name | | | | | | | | Shares | | | Value | |
| | | | |
Common Stocks: 99.13% | | | | | | | | | | | | | | | | |
| | | | |
Consumer Discretionary: 5.44% | | | | | | | | | | | | | | | | |
| | | | |
| Hotels, Restaurants & Leisure: 1.07% | | | | | | | | | | | | | | | | |
Yum China Holdings Incorporated | | | | | | | | | | | 62,731 | | | $ | 2,910,091 | |
| | | | | | | | | | | | | | | | |
| | | | |
| Media: 4.37% | | | | | | | | | | | | | | | | |
Charter Communications Incorporated Class A † | | | | | | | | | | | 16,458 | | | | 6,208,781 | |
Comcast Corporation Class A | | | | | | | | | | | 18,853 | | | | 801,818 | |
Live Nation Incorporated † | | | | | | | | | | | 77,953 | | | | 3,512,562 | |
Viacom Incorporated Class B | | | | | | | | | | | 40,262 | | | | 1,345,556 | |
| | | | |
| | | | | | | | | | | | | | | 11,868,717 | |
| | | | | | | | | | | | | | | | |
| | | | |
Consumer Staples: 10.28% | | | | | | | | | | | | | | | | |
| | | | |
| Beverages: 2.09% | | | | | | | | | | | | | | | | |
PepsiCo Incorporated | | | | | | | | | | | 47,242 | | | | 5,683,213 | |
| | | | | | | | | | | | | | | | |
| | | | |
| Food & Staples Retailing: 5.45% | | | | | | | | | | | | | | | | |
Wal-Mart Stores Incorporated | | | | | | | | | | | 80,868 | | | | 8,620,529 | |
Walgreens Boots Alliance Incorporated | | | | | | | | | | | 81,994 | | | | 6,170,868 | |
| | | | |
| | | | | | | | | | | | | | | 14,791,397 | |
| | | | | | | | | | | | | | | | |
| | | | |
| Food Products: 0.73% | | | | | | | | | | | | | | | | |
Tyson Foods Incorporated Class A | | | | | | | | | | | 26,006 | | | | 1,979,317 | |
| | | | | | | | | | | | | | | | |
| | | | |
| Household Products: 2.01% | | | | | | | | | | | | | | | | |
The Procter & Gamble Company | | | | | | | | | | | 63,248 | | | | 5,460,832 | |
| | | | | | | | | | | | | | | | |
| | | | |
Energy: 10.60% | | | | | | | | | | | | | | | | |
| | | | |
| Oil, Gas & Consumable Fuels: 10.60% | | | | | | | | | | | | | | | | |
Chevron Corporation | | | | | | | | | | | 72,478 | | | | 9,085,117 | |
ConocoPhillips | | | | | | | | | | | 2,336 | | | | 137,380 | |
Devon Energy Corporation | | | | | | | | | | | 126,362 | | | | 5,227,596 | |
Exxon Mobil Corporation | | | | | | | | | | | 148,288 | | | | 12,945,542 | |
Valero Energy Corporation | | | | | | | | | | | 13,021 | | | | 1,249,625 | |
World Fuel Services Corporation | | | | | | | | | | | 4,635 | | | | 129,270 | |
| | | | |
| | | | | | | | | | | | | | | 28,774,530 | |
| | | | | | | | | | | | | | | | |
| | | | |
Financials: 26.92% | | | | | | | | | | | | | | | | |
| | | | |
| Banks: 12.03% | | | | | | | | | | | | | | | | |
Bank of America Corporation | | | | | | | | | | | 366,956 | | | | 11,742,592 | |
BB&T Corporation | | | | | | | | | | | 47,346 | | | | 2,613,026 | |
Citigroup Incorporated | | | | | | | | | | | 14 | | | | 1,099 | |
Comerica Incorporated | | | | | | | | | | | 50,911 | | | | 4,847,745 | |
Fifth Third Bancorp | | | | | | | | | | | 166,478 | | | | 5,510,422 | |
JPMorgan Chase & Company | | | | | | | | | | | 41,258 | | | | 4,772,313 | |
US Bancorp | | | | | | | | | | | 55,472 | | | | 3,169,670 | |
| | | | |
| | | | | | | | | | | | | | | 32,656,867 | |
| | | | | | | | | | | | | | | | |
| | | | |
| Capital Markets: 1.30% | | | | | | | | | | | | | | | | |
Bank of New York Mellon Corporation | | | | | | | | | | | 62,533 | | | | 3,545,621 | |
| | | | | | | | | | | | | | | | |
The accompanying notes are an integral part of these financial statements.
| | | | |
| 8 | | Wells Fargo Large Company Value Fund | | Portfolio of investments—January 31, 2018 (unaudited) |
| | | | | | | | | | | | | | | | |
| Security name | | | | | | | | Shares | | | Value | |
| | | | |
| Consumer Finance: 2.38% | | | | | | | | | | | | | | | | |
Capital One Financial Corporation | | | | | | | | | | | 61,743 | | | $ | 6,418,802 | |
Discover Financial Services | | | | | | | | | | | 410 | | | | 32,718 | |
| | | | |
| | | | | | | | | | | | | | | 6,451,520 | |
| | | | | | | | | | | | | | | | |
| | | | |
| Diversified Financial Services: 4.38% | | | | | | | | | | | | | | | | |
Berkshire Hathaway Incorporated Class B † | | | | | | | | | | | 55,472 | | | | 11,892,087 | |
| | | | | | | | | | | | | | | | |
| | | | |
| Insurance: 5.97% | | | | | | | | | | | | | | | | |
AFLAC Incorporated | | | | | | | | | | | 34,664 | | | | 3,057,365 | |
Assured Guaranty Limited | | | | | | | | | | | 17,858 | | | | 635,566 | |
Athene Holding Limited Class A † | | | | | | | | | | | 23,107 | | | | 1,159,047 | |
Chubb Limited | | | | | | | | | | | 924 | | | | 144,283 | |
CNO Financial Group Incorporated | | | | | | | | | | | 211,195 | | | | 5,193,285 | |
The Progressive Corporation | | | | | | | | | | | 96,262 | | | | 5,207,774 | |
The Travelers Companies Incorporated | | | | | | | | | | | 1,944 | | | | 291,444 | |
Unum Group | | | | | | | | | | | 9,970 | | | | 530,304 | |
| | | | |
| | | | | | | | | | | | | | | 16,219,068 | |
| | | | | | | | | | | | | | | | |
| | | | |
| Mortgage REITs: 0.86% | | | | | | | | | | | | | | | | |
Chimera Investment Corporation | | | | | | | | | | | 136,959 | | | | 2,326,933 | |
| | | | | | | | | | | | | | | | |
| | | | |
Health Care: 13.97% | | | | | | | | | | | | | | | | |
| | | | |
| Biotechnology: 3.97% | | | | | | | | | | | | | | | | |
AbbVie Incorporated | | | | | | | | | | | 2,635 | | | | 295,700 | |
Amgen Incorporated | | | | | | | | | | | 10,797 | | | | 2,008,782 | |
Biogen Incorporated | | | | | | | | | | | 15,924 | | | | 5,538,526 | |
Vertex Pharmaceuticals Incorporated † | | | | | | | | | | | 17,597 | | | | 2,936,411 | |
| | | | |
| | | | | | | | | | | | | | | 10,779,419 | |
| | | | | | | | | | | | | | | | |
| | | | |
| Health Care Equipment & Supplies: 5.25% | | | | | | | | | | | | | | | | |
Baxter International Incorporated | | | | | | | | | | | 91,633 | | | | 6,600,325 | |
Medtronic plc | | | | | | | | | | | 89,082 | | | | 7,651,253 | |
| | | | |
| | | | | | | | | | | | | | | 14,251,578 | |
| | | | | | | | | | | | | | | | |
| | | | |
| Health Care Providers & Services: 0.80% | | | | | | | | | | | | | | | | |
Express Scripts Holding Company † | | | | | | | | | | | 27,453 | | | | 2,173,729 | |
| | | | | | | | | | | | | | | | |
| | | | |
| Pharmaceuticals: 3.95% | | | | | | | | | | | | | | | | |
Catalent Incorporated † | | | | | | | | | | | 16,794 | | | | 781,593 | |
Johnson & Johnson | | | | | | | | | | | 24,878 | | | | 3,437,891 | |
Merck & Company Incorporated | | | | | | | | | | | 109,640 | | | | 6,496,170 | |
| | | | |
| | | | | | | | | | | | | | | 10,715,654 | |
| | | | | | | | | | | | | | | | |
| | | | |
Industrials: 8.27% | | | | | | | | | | | | | | | | |
| | | | |
| Aerospace & Defense: 3.17% | | | | | | | | | | | | | | | | |
General Dynamics Corporation | | | | | | | | | | | 10,996 | | | | 2,446,390 | |
Harris Corporation | | | | | | | | | | | 31,522 | | | | 5,023,976 | |
Raytheon Company | | | | | | | | | | | 4,705 | | | | 983,063 | |
The Boeing Company | | | | | | | | | | | 449 | | | | 159,112 | |
| | | | |
| | | | | | | | | | | | | | | 8,612,541 | |
| | | | | | | | | | | | | | | | |
The accompanying notes are an integral part of these financial statements.
| | | | | | |
| Portfolio of investments—January 31, 2018 (unaudited) | | Wells Fargo Large Company Value Fund | | | 9 | |
| | | | | | | | | | | | | | | | |
| Security name | | | | | | | | Shares | | | Value | |
| | | | |
| Airlines: 1.81% | | | | | | | | | | | | | | | | |
Delta Air Lines Incorporated | | | | | | | | | | | 2,195 | | | $ | 124,610 | |
Southwest Airlines Company | | | | | | | | | | | 78,675 | | | | 4,783,440 | |
| | | | |
| | | | | | | | | | | | | | | 4,908,050 | |
| | | | | | | | | | | | | | | | |
| | | | |
| Industrial Conglomerates: 2.64% | | | | | | | | | | | | | | | | |
General Electric Company | | | | | | | | | | | 194,971 | | | | 3,152,681 | |
Honeywell International Incorporated | | | | | | | | | | | 25,139 | | | | 4,013,944 | |
| | | | |
| | | | | | | | | | | | | | | 7,166,625 | |
| | | | | | | | | | | | | | | | |
| | | | |
| Machinery: 0.65% | | | | | | | | | | | | | | | | |
EnPro Industries Incorporated | | | | | | | | | | | 7,146 | | | | 628,777 | |
Ingersoll-Rand plc | | | | | | | | | | | 6,102 | | | | 577,432 | |
Mueller Industries Incorporated | | | | | | | | | | | 17,291 | | | | 572,159 | |
| | | | |
| | | | | | | | | | | | | | | 1,778,368 | |
| | | | | | | | | | | | | | | | |
| | | | |
Information Technology: 8.02% | | | | | | | | | | | | | | | | |
| | | | |
| Internet Software & Services: 1.91% | | | | | | | | | | | | | | | | |
eBay Incorporated † | | | | | | | | | | | 127,734 | | | | 5,183,446 | |
| | | | | | | | | | | | | | | | |
| | | | |
| IT Services: 3.64% | | | | | | | | | | | | | | | | |
Black Knight Incorporated † | | | | | | | | | | | 10,712 | | | | 530,244 | |
PayPal Holdings Incorporated † | | | | | | | | | | | 67,868 | | | | 5,790,498 | |
Worldpay Incorporated Class A † | | | | | | | | | | | 44,280 | | | | 3,556,127 | |
| | | | |
| | | | | | | | | | | | | | | 9,876,869 | |
| | | | | | | | | | | | | | | | |
| | | | |
| Semiconductors & Semiconductor Equipment: 2.47% | | | | | | | | | | | | | | | | |
Intel Corporation | | | | | | | | | | | 73,291 | | | | 3,528,229 | |
Micron Technology Incorporated † | | | | | | | | | | | 72,623 | | | | 3,175,078 | |
| | | | |
| | | | | | | | | | | | | | | 6,703,307 | |
| | | | | | | | | | | | | | | | |
| | | | |
Materials: 1.28% | | | | | | | | | | | | | | | | |
| | | | |
| Chemicals: 0.19% | | | | | | | | | | | | | | | | |
LyondellBasell Industries NV Class A | | | | | | | | | | | 4,367 | | | | 523,341 | |
| | | | | | | | | | | | | | | | |
| | | | |
| Metals & Mining: 0.36% | | | | | | | | | | | | | | | | |
Freeport-McMoRan Incorporated † | | | | | | | | | | | 6,744 | | | | 131,508 | |
Newmont Mining Corporation | | | | | | | | | | | 20,636 | | | | 835,964 | |
| | | | |
| | | | | | | | | | | | | | | 967,472 | |
| | | | | | | | | | | | | | | | |
| | | | |
| Paper & Forest Products: 0.73% | | | | | | | | | | | | | | | | |
Louisiana-Pacific Corporation † | | | | | | | | | | | 67,381 | | | | 1,995,151 | |
| | | | | | | | | | | | | | | | |
| | | | |
Real Estate: 8.76% | | | | | | | | | | | | | | | | |
| | | | |
| Equity REITs: 8.65% | | | | | | | | | | | | | | | | |
Apple Hospitality REIT Incorporated | | | | | | | | | | | 38,466 | | | | 749,702 | |
CoreCivic Incorporated | | | | | | | | | | | 203,646 | | | | 4,726,624 | |
Park Hotels & Resorts Incorporated | | | | | | | | | | | 188,682 | | | | 5,454,797 | |
Prologis Incorporated | | | | | | | | | | | 22,726 | | | | 1,479,690 | |
The accompanying notes are an integral part of these financial statements.
| | | | |
| 10 | | Wells Fargo Large Company Value Fund | | Portfolio of investments—January 31, 2018 (unaudited) |
| | | | | | | | | | | | | | | | |
| Security name | | | | | | | | Shares | | | Value | |
| | | | |
| Equity REITs (continued) | | | | | | | | | | | | | | | | |
SBA Communications Corporation † | | | | | | | | | | | 32,923 | | | $ | 5,745,064 | |
Weyerhaeuser Company | | | | | | | | | | | 30,559 | | | | 1,147,185 | |
Xenia Hotels & Resorts Incorporated | | | | | | | | | | | 187,974 | | | | 4,173,023 | |
| | | | |
| | | | | | | | | | | | | | | 23,476,085 | |
| | | | | | | | | | | | | | | | |
| | | | |
| Real Estate Management & Development: 0.11% | | | | | | | | | | | | | | | | |
CBRE Group Incorporated Class A † | | | | | | | | | | | 6,686 | | | | 305,483 | |
| | | | | | | | | | | | | | | | |
| | | | |
Telecommunication Services: 0.81% | | | | | | | | | | | | | | | | |
| | | | |
| Diversified Telecommunication Services: 0.81% | | | | | | | | | | | | | | | | |
Verizon Communications Incorporated | | | | | | | | | | | 40,714 | | | | 2,201,406 | |
| | | | | | | | | | | | | | | | |
| | | | |
Utilities: 4.78% | | | | | | | | | | | | | | | | |
| | | | |
| Electric Utilities: 2.18% | | | | | | | | | | | | | | | | |
Avangrid Incorporated | | | | | | | | | | | 45,353 | | | | 2,209,598 | |
Exelon Corporation | | | | | | | | | | | 13,687 | | | | 527,086 | |
PG&E Corporation | | | | | | | | | | | 56,713 | | | | 2,406,333 | |
PPL Corporation | | | | | | | | | | | 24,270 | | | | 773,485 | |
| | | | |
| | | | | | | | | | | | | | | 5,916,502 | |
| | | | | | | | | | | | | | | | |
| | | | |
| Gas Utilities: 0.76% | | | | | | | | | | | | | | | | |
UGI Corporation | | | | | | | | | | | 45,219 | | | | 2,069,674 | |
| | | | | | | | | | | | | | | | |
| | | | |
| Independent Power & Renewable Electricity Producers: 1.45% | | | | | | | | | | | | | | | | |
AES Corporation | | | | | | | | | | | 339,728 | | | | 3,927,256 | |
| | | | | | | | | | | | | | | | |
| | | | |
| Multi-Utilities: 0.39% | | | | | | | | | | | | | | | | |
MDU Resources Group Incorporated | | | | | | | | | | | 5,009 | | | | 132,638 | |
Vectren Corporation | | | | | | | | | | | 15,547 | | | | 942,615 | |
| | | | |
| | | | | | | | | | | | | | | 1,075,253 | |
| | | | | | | | | | | | | | | | |
| | | | |
Total Common Stocks (Cost $230,988,395) | | | | | | | | | | | | | | | 269,167,402 | |
| | | | | | | | | | | | | | | | |
| | | | |
| | | Yield | | | | | | | | | | |
| Short-Term Investments: 0.73% | | | | | | | | | | | | | | | | |
| | | | |
| Investment Companies: 0.73% | | | | | | | | | | | | | | | | |
Wells Fargo Government Money Market Fund Select Class (l)(u) | | | 1.24 | % | | | | | | | 1,996,427 | | | | 1,996,427 | |
| | | | | | | | | | | | | | | | |
| | | | |
Total Short-Term Investments (Cost $1,996,427) | | | | | | | | | | | | | | | 1,996,427 | |
| | | | | | | | | | | | | | | | |
| | | | | | | | |
| Total investments in securities (Cost $232,984,822) | | | 99.86 | % | | | 271,163,829 | |
Other assets and liabilities, net | | | 0.14 | | | | 371,515 | |
| | | | | | | | |
| Total net assets | | | 100.00 | % | | $ | 271,535,344 | |
| | | | | | | | |
| † | Non-income-earning security |
| (l) | The issuer of the security is an affiliated person of the Fund as defined in the Investment Company Act of 1940. |
| (u) | The rate represents the 7-day annualized yield at period end. |
The accompanying notes are an integral part of these financial statements.
| | | | | | |
| Portfolio of investments—January 31, 2018 (unaudited) | | Wells Fargo Large Company Value Fund | | | 11 | |
Futures Contracts
| | | | | | | | | | | | | | | | | | | | | | | | |
| Description | | Number of
contracts | | | Expiration
date | | | Notional
cost | | | Notional
value | | | Unrealized
gains | | | Unrealized
losses | |
Long | | | | | | | | | | | | | | | | | | | | | | | | |
S&P 500 E-Mini Index | | | 22 | | | | 3-16-2018 | | | $ | 2,944,905 | | | $ | 3,108,380 | | | $ | 163,475 | | | $ | 0 | |
Investments in Affiliates
An affiliated investment is an investment in which the Fund owns at least 5% of the outstanding voting shares of the issuer or as a result of other relationships, such as the Fund and the issuer having the same investment manager. Transactions with issuers that were either affiliated persons of the Fund at the beginning of the period or the end of the period were as follows:
| | | | | | | | | | | | | | | | | | | | | | | | | | | | | | | | | | | | |
| | | Shares,
beginning of
period | | | Shares
purchased | | | Shares
sold | | | Shares,
end of
period | | | Net
realized
gains
(losses) | | | Net
change in
unrealized
gains
(losses) | | | Income
from
affiliated
securities | | | Value,
end
of period | | | % of
net
assets | |
Short-Term Investments | | | | | | | | | | | | | | | | | | | | | | | | | | | | | | | | | | | | |
Investment Companies | | | | | | | | | | | | | | | | | | | | | | | | | | | | | | | | | | | | |
Wells Fargo Government Money Market Fund Select Class | | | 7,807,982 | | | | 29,509,427 | | | | 35,320,982 | | | | 1,996,427 | | | $ | 0 | | | $ | 0 | | | $ | 23,157 | | | $ | 1,996,427 | | | | 0.73 | % |
The accompanying notes are an integral part of these financial statements.
| | | | |
| 12 | | Wells Fargo Large Company Value Fund | | Statement of assets and liabilities—January 31, 2018 (unaudited) |
| | | | |
| | | | |
| |
Assets | | | | |
Investments in unaffiliated securities, at value (cost $230,988,395) | | $ | 269,167,402 | |
Investments in affiliated securities, at value (cost $1,996,427) | | | 1,996,427 | |
Segregated cash for futures transactions | | | 300,000 | |
Receivable for investments sold | | | 4,230,111 | |
Receivable for Fund shares sold | | | 47,162 | |
Receivable for dividends | | | 180,930 | |
Receivable for daily variation margin on open futures contracts | | | 1,430 | |
Prepaid expenses and other assets | | | 99,609 | |
| | | | |
Total assets | | | 276,023,071 | |
| | | | |
| |
Liabilities | | | | |
Payable for investments purchased | | | 4,121,021 | |
Payable for Fund shares redeemed | | | 201,559 | |
Management fee payable | | | 68,692 | |
Administration fees payable | | | 45,794 | |
Distribution fee payable | | | 2,273 | |
Trustees’ fees and expenses payable | | | 1,956 | |
Accrued expenses and other liabilities | | | 46,432 | |
| | | | |
Total liabilities | | | 4,487,727 | |
| | | | |
Total net assets | | $ | 271,535,344 | |
| | | | |
| |
NET ASSETS CONSIST OF | | | | |
Paid-in capital | | $ | 221,373,476 | |
Overdistributed net investment income | | | (57,003 | ) |
Accumulated net realized gains on investments | | | 11,876,389 | |
Net unrealized gains on investments | | | 38,342,482 | |
| | | | |
Total net assets | | $ | 271,535,344 | |
| | | | |
| |
COMPUTATION OF NET ASSET VALUE AND OFFERING PRICE PER SHARE | | | | |
Net assets – Class A | | $ | 231,363,860 | |
Shares outstanding – Class A1 | | | 15,538,908 | |
Net asset value per share – Class A | | | $14.89 | |
Maximum offering price per share – Class A2 | | | $15.80 | |
Net assets – Class C | | $ | 3,494,018 | |
Shares outstanding – Class C1 | | | 228,562 | |
Net asset value per share – Class C | | | $15.29 | |
Net assets – Class R6 | | $ | 23,241 | |
Shares outstanding – Class R61 | | | 1,549 | |
Net asset value per share – Class R6 | | | $15.00 | |
Net assets – Administrator Class | | $ | 18,317,572 | |
Shares outstanding – Administrator Class1 | | | 1,219,411 | |
Net asset value per share – Administrator Class | | | $15.02 | |
Net assets – Institutional Class | | $ | 18,336,653 | |
Shares outstanding – Institutional Class1 | | | 1,222,557 | |
Net asset value per share – Institutional Class | | | $15.00 | |
| 1 | The Fund has an unlimited number of authorized shares. |
| 2 | Maximum offering price is computed as 100/94.25 of net asset value. On investments of $50,000 or more, the offering price is reduced. |
The accompanying notes are an integral part of these financial statements.
| | | | | | |
| Statement of operations—six months ended January 31, 2018 (unaudited) | | Wells Fargo Large Company Value Fund | | | 13 | |
| | | | |
| | | | |
| |
Investment income | | | | |
Dividends | | $ | 2,955,946 | |
Income from affiliated securities | | | 23,157 | |
| | | | |
Total investment income | | | 2,979,103 | |
| | | | |
| |
Expenses | | | | |
Management fee | | | 527,740 | |
Administration fees | | | | |
Class A | | | 236,349 | |
Class C | | | 3,566 | |
Class R6 | | | 5 | |
Administrator Class | | | 11,836 | |
Institutional Class | | | 11,143 | |
Shareholder servicing fees | | | | |
Class A | | | 281,369 | |
Class C | | | 4,245 | |
Administrator Class | | | 22,761 | |
Distribution fee | | | | |
Class C | | | 12,735 | |
Custody and accounting fees | | | 6,333 | |
Professional fees | | | 20,376 | |
Registration fees | | | 36,734 | |
Shareholder report expenses | | | 20,858 | |
Trustees’ fees and expenses | | | 7,929 | |
Other fees and expenses | | | 4,850 | |
| | | | |
Total expenses | | | 1,208,829 | |
Less: Fee waivers and/or expense reimbursements | | | (136,662 | ) |
| | | | |
Net expenses | | | 1,072,167 | |
| | | | |
Net investment income | | | 1,906,936 | |
| | | | |
| |
REALIZED AND UNREALIZED GAINS (LOSSES) ON INVESTMENTS | | | | |
| |
Net realized gains on: | | | | |
Unaffiliated securities | | | 16,219,928 | |
Futures transactions | | | 518,965 | |
| | | | |
Net realized gains on investments | | | 16,738,893 | |
| | | | |
| |
Net change in unrealized gains (losses) on: | | | | |
Unaffiliated securities | | | 11,931,212 | |
Futures transactions | | | 163,475 | |
| | | | |
Net change in unrealized gains (losses) on investments | | | 12,094,687 | |
| | | | |
Net realized and unrealized gains (losses) on investments | | | 28,833,580 | |
| | | | |
Net increase in net assets resulting from operations | | $ | 30,740,516 | |
| | | | |
The accompanying notes are an integral part of these financial statements.
| | | | |
| 14 | | Wells Fargo Large Company Value Fund | | Statement of changes in net assets |
| | | | | | | | | | | | | | | | |
| | | Six months ended
January 31, 2018 (unaudited) | | | Year ended
July 31, 2017 | |
| | | | |
Operations | | | | | | | | | | | | | | | | |
Net investment income | | | | | | $ | 1,906,936 | | | | | | | $ | 2,348,357 | |
Net realized gains on investments | | | | | | | 16,738,893 | | | | | | | | 53,375,979 | |
Net change in unrealized gains (losses) on investments | | | | | | | 12,094,687 | | | | | | | | (21,739,472 | ) |
| | | | |
Net increase in net assets resulting from operations | | | | | | | 30,740,516 | | | | | | | | 33,984,864 | |
| | | | |
| | | | |
Distributions to shareholders from | | | | | | | | | | | | | | | | |
Net investment income | | | | | | | | | | | | | | | | |
Class A | | | | | | | (2,105,972 | ) | | | | | | | (1,529,974 | ) |
Class C | | | | | | | (9,843 | ) | | | | | | | (7,593 | ) |
Class R6 | | | | | | | (351 | ) | | | | | | | 0 | 1 |
Administrator Class | | | | | | | (178,186 | ) | | | | | | | (164,278 | ) |
Institutional Class | | | | | | | (203,016 | ) | | | | | | | (101,228 | ) |
Net realized gains | | | | | | | | | | | | | | | | |
Class A | | | | | | | (43,429,588 | ) | | | | | | | 0 | |
Class C | | | | | | | (647,269 | ) | | | | | | | 0 | |
Class R6 | | | | | | | (6,236 | ) | | | | | | | 0 | 1 |
Administrator Class | | | | | | | (3,454,920 | ) | | | | | | | 0 | |
Institutional Class | | | | | | | (3,302,668 | ) | | | | | | | 0 | |
| | | | |
Total distributions to shareholders | | | | | | | (53,338,049 | ) | | | | | | | (1,803,073 | ) |
| | | | |
| | | | |
Capital share transactions | | | Shares | | | | | | | | Shares | | | | | |
Proceeds from shares sold | | | | | | | | | | | | | | | | |
Class A | | | 105,642 | | | | 1,648,362 | | | | 184,685 | | | | 2,859,171 | |
Class C | | | 3,341 | | | | 55,571 | | | | 9,920 | | | | 159,103 | |
Class R6 | | | 297 | | | | 5,000 | | | | 1,549 | 1 | | | 25,000 | 1 |
Administrator Class | | | 7,730 | | | | 121,207 | | | | 52,078 | | | | 837,524 | |
Institutional Class | | | 79,900 | | | | 1,198,012 | | | | 466,653 | | | | 7,476,610 | |
| | | | |
| | | | | | | 3,028,152 | | | | | | | | 11,357,408 | |
| | | | |
Reinvestment of distributions | | | | | | | | | | | | | | | | |
Class A | | | 3,076,609 | | | | 44,106,734 | | | | 96,773 | | | | 1,482,398 | |
Class C | | | 42,101 | | | | 616,968 | | | | 431 | | | | 6,671 | |
Class R6 | | | 71 | | | | 1,037 | | | | 0 | 1 | | | 0 | 1 |
Administrator Class | | | 247,497 | | | | 3,581,182 | | | | 9,395 | | | | 144,443 | |
Institutional Class | | | 202,686 | | | | 2,931,264 | | | | 6,282 | | | | 97,208 | |
| | | | |
| | | | | | | 51,237,185 | | | | | | | | 1,730,720 | |
| | | | |
Payment for shares redeemed | | | | | | | | | | | | | | | | |
Class A | | | (1,017,742 | ) | | | (16,261,947 | ) | | | (1,924,557 | ) | | | (29,716,601 | ) |
Class C | | | (16,005 | ) | | | (258,546 | ) | | | (57,893 | ) | | | (914,888 | ) |
Class R6 | | | (368 | ) | | | (5,292 | ) | | | 0 | 1 | | | 0 | 1 |
Administrator Class | | | (134,140 | ) | | | (2,163,110 | ) | | | (609,704 | ) | | | (9,486,019 | ) |
Institutional Class | | | (40,088 | ) | | | (649,429 | ) | | | (130,275 | ) | | | (2,050,549 | ) |
| | | | |
| | | | | | | (19,338,324 | ) | | | | | | | (42,168,057 | ) |
| | | | |
Net increase (decrease) in net assets resulting from capital share transactions | | | | | | | 34,927,013 | | | | | | | | (29,079,929 | ) |
| | | | |
Total increase in net assets | | | | | | | 12,329,480 | | | | | | | | 3,101,862 | |
| | | | |
| | | | |
Net assets | | | | | | | | | | | | | | | | |
Beginning of period | | | | | | | 259,205,864 | | | | | | | | 256,104,002 | |
| | | | |
End of period | | | | | | $ | 271,535,344 | | | | | | | $ | 259,205,864 | |
| | | | |
Undistributed (overdistributed) net investment income | | | | | | $ | (57,003 | ) | | | | | | $ | 533,429 | |
| | | | |
| 1 | For the period from April 7, 2017 (commencement of class operations) to July 31, 2017 |
The accompanying notes are an integral part of these financial statements.
| | | | | | |
| Financial highlights | | Wells Fargo Large Company Value Fund | | | 15 | |
(For a share outstanding throughout each period)
| | | | | | | | | | | | | | | | | | | | | | | | |
| | | Six months ended
January 31, 2018 (unaudited) | | | Year ended July 31 | |
| CLASS A | | | 2017 | | | 2016 | | | 2015 | | | 2014 | | | 2013 | |
Net asset value, beginning of period | | | $16.54 | | | | $14.58 | | | | $16.10 | | | | $16.82 | | | | $16.39 | | | | $12.96 | |
Net investment income | | | 0.11 | | | | 0.14 | | | | 0.17 | | | | 0.13 | 1 | | | 0.10 | | | | 0.14 | |
Net realized and unrealized gains (losses) on investments | | | 1.77 | | | | 1.93 | | | | (0.41 | ) | | | 0.78 | | | | 2.04 | | | | 3.48 | |
| | | | | | | | | | | | | | | | | | | | | | | | |
Total from investment operations | | | 1.88 | | | | 2.07 | | | | (0.24 | ) | | | 0.91 | | | | 2.14 | | | | 3.62 | |
Distributions to shareholders from | | | | | | | | | | | | | | | | | | | | | | | | |
Net investment income | | | (0.15 | ) | | | (0.11 | ) | | | (0.16 | ) | | | (0.13 | ) | | | (0.09 | ) | | | (0.19 | ) |
Net realized gains | | | (3.38 | ) | | | 0.00 | | | | (1.12 | ) | | | (1.50 | ) | | | (1.62 | ) | | | 0.00 | |
| | | | | | | | | | | | | | | | | | | | | | | | |
Total distributions to shareholders | | | (3.53 | ) | | | (0.11 | ) | | | (1.28 | ) | | | (1.63 | ) | | | (1.71 | ) | | | (0.19 | ) |
Net asset value, end of period | | | $14.89 | | | | $16.54 | | | | $14.58 | | | | $16.10 | | | | $16.82 | | | | $16.39 | |
Total return2 | | | 12.37 | % | | | 14.24 | % | | | (0.98 | )% | | | 5.72 | % | | | 13.68 | % | | | 28.16 | % |
Ratios to average net assets (annualized) | | | | | | | | | | | | | | | | | | | | | | | | |
Gross expenses | | | 0.93 | % | | | 1.09 | % | | | 1.24 | % | | | 1.27 | % | | | 1.28 | % | | | 1.28 | % |
Net expenses | | | 0.83 | % | | | 0.96 | % | | | 1.10 | % | | | 1.10 | % | | | 1.10 | % | | | 1.10 | % |
Net investment income | | | 1.43 | % | | | 0.91 | % | | | 1.19 | % | | | 0.76 | % | | | 0.61 | % | | | 1.00 | % |
Supplemental data | | | | | | | | | | | | | | | | | | | | | | | | |
Portfolio turnover rate | | | 123 | % | | | 221 | % | | | 50 | % | | | 71 | % | | | 59 | % | | | 78 | % |
Net assets, end of period (000s omitted) | | | $231,364 | | | | $221,207 | | | | $218,922 | | | | $104,453 | | | | $116,398 | | | | $115,895 | |
| 1 | Calculated based upon average shares outstanding |
| 2 | Total return calculations do not include any sales charges. Returns for periods of less than one year are not annualized. |
The accompanying notes are an integral part of these financial statements.
| | | | |
| 16 | | Wells Fargo Large Company Value Fund | | Financial highlights |
(For a share outstanding throughout each period)
| | | | | | | | | | | | | | | | | | | | | | | | |
| | | Six months ended
January 31, 2018 (unaudited) | | | Year ended July 31 | |
| CLASS C | | | 2017 | | | 2016 | | | 2015 | | | 2014 | | | 2013 | |
Net asset value, beginning of period | | | $16.86 | | | | $14.90 | | | | $16.41 | | | | $17.12 | | | | $16.70 | | | | $13.21 | |
Net investment income (loss) | | | 0.06 | | | | 0.03 | 1 | | | 0.06 | | | | 0.00 | 2 | | | (0.02 | ) | | | 0.04 | |
Net realized and unrealized gains (losses) on investments | | | 1.79 | | | | 1.96 | | | | (0.40 | ) | | | 0.80 | | | | 2.07 | | | | 3.54 | |
| | | | | | | | | | | | | | | | | | | | | | | | |
Total from investment operations | | | 1.85 | | | | 1.99 | | | | (0.34 | ) | | | 0.80 | | | | 2.05 | | | | 3.58 | |
Distributions to shareholders from | | | | | | | | | | | | | | | | | | | | | | | | |
Net investment income | | | (0.04 | ) | | | (0.03 | ) | | | (0.05 | ) | | | (0.01 | ) | | | (0.01 | ) | | | (0.09 | ) |
Net realized gains | | | (3.38 | ) | | | 0.00 | | | | (1.12 | ) | | | (1.50 | ) | | | (1.62 | ) | | | 0.00 | |
| | | | | | | | | | | | | | | | | | | | | | | | |
Total distributions to shareholders | | | (3.42 | ) | | | (0.03 | ) | | | (1.17 | ) | | | (1.51 | ) | | | (1.63 | ) | | | (0.09 | ) |
Net asset value, end of period | | | $15.29 | | | | $16.86 | | | | $14.90 | | | | $16.41 | | | | $17.12 | | | | $16.70 | |
Total return3 | | | 11.93 | % | | | 13.40 | % | | | (1.68 | )% | | | 4.92 | % | | | 12.83 | % | | | 27.17 | % |
Ratios to average net assets (annualized) | | | | | | | | | | | | | | | | | | | | | | | | |
Gross expenses | | | 1.68 | % | | | 1.84 | % | | | 1.99 | % | | | 2.02 | % | | | 2.03 | % | | | 2.03 | % |
Net expenses | | | 1.58 | % | | | 1.72 | % | | | 1.85 | % | | | 1.85 | % | | | 1.85 | % | | | 1.85 | % |
Net investment income (loss) | | | 0.68 | % | | | 0.16 | % | | | 0.44 | % | | | 0.01 | % | | | (0.14 | )% | | | 0.25 | % |
Supplemental data | | | | | | | | | | | | | | | | | | | | | | | | |
Portfolio turnover rate | | | 123 | % | | | 221 | % | | | 50 | % | | | 71 | % | | | 59 | % | | | 78 | % |
Net assets, end of period (000s omitted) | | | $3,494 | | | | $3,356 | | | | $3,674 | | | | $4,488 | | | | $4,659 | | | | $4,543 | |
| 1 | Calculated based upon average shares outstanding |
| 2 | Amount is less than $0.005. |
| 3 | Total return calculations do not include any sales charges. Returns for periods of less than one year are not annualized. |
The accompanying notes are an integral part of these financial statements.
| | | | | | |
| Financial highlights | | Wells Fargo Large Company Value Fund | | | 17 | |
(For a share outstanding throughout each period)
| | | | | | | | |
| CLASS R6 | | Six months ended
January 31, 2018 (unaudited) | | | Year ended
July 31, 20171 | |
Net asset value, beginning of period | | | $16.66 | | | | $16.14 | |
Net investment income | | | 0.15 | | | | 0.03 | 2 |
Net realized and unrealized gains (losses) on investments | | | 1.77 | | | | 0.49 | |
| | | | | | | | |
Total from investment operations | | | 1.92 | | | | 0.52 | |
Distributions to shareholders from | | | | | | | | |
Net investment income | | | (0.20 | ) | | | 0.00 | |
Net realized gains | | | (3.38 | ) | | | 0.00 | |
| | | | | | | | |
Total distributions to shareholders | | | (3.58 | ) | | | 0.00 | |
Net asset value, end of period | | | $15.00 | | | | $16.66 | |
Total return3 | | | 12.60 | % | | | 3.22 | % |
Ratios to average net assets (annualized) | | | | | | | | |
Gross expenses | | | 0.50 | % | | | 0.49 | % |
Net expenses | | | 0.40 | % | | | 0.40 | % |
Net investment income | | | 1.87 | % | | | 0.52 | % |
Supplemental data | | | | | | | | |
Portfolio turnover rate | | | 123 | % | | | 221 | % |
Net assets, end of period (000s omitted) | | | $23 | | | | $26 | |
| 1 | For the period from April 7, 2017 (commencement of class operations) to July 31, 2017 |
| 2 | Calculated based upon average shares outstanding |
| 3 | Returns for periods of less than one year are not annualized. |
The accompanying notes are an integral part of these financial statements.
| | | | |
| 18 | | Wells Fargo Large Company Value Fund | | Financial highlights |
(For a share outstanding throughout each period)
| | | | | | | | | | | | | | | | | | | | | | | | |
| | | Six months ended
January 31, 2018 (unaudited) | | | Year ended July 31 | |
| ADMINISTRATOR CLASS | | | 2017 | | | 2016 | | | 2015 | | | 2014 | | | 2013 | |
Net asset value, beginning of period | | | $16.66 | | | | $14.68 | | | | $16.20 | | | | $16.93 | | | | $16.47 | | | | $13.02 | |
Net investment income | | | 0.12 | 1 | | | 0.16 | 1 | | | 0.20 | | | | 0.17 | | | | 0.15 | | | | 0.21 | |
Net realized and unrealized gains (losses) on investments | | | 1.77 | | | | 1.94 | | | | (0.41 | ) | | | 0.78 | | | | 2.05 | | | | 3.46 | |
| | | | | | | | | | | | | | | | | | | | | | | | |
Total from investment operations | | | 1.89 | | | | 2.10 | | | | (0.21 | ) | | | 0.95 | | | | 2.20 | | | | 3.67 | |
Distributions to shareholders from | | | | | | | | | | | | | | | | | | | | | | | | |
Net investment income | | | (0.15 | ) | | | (0.12 | ) | | | (0.19 | ) | | | (0.18 | ) | | | (0.12 | ) | | | (0.22 | ) |
Net realized gains | | | (3.38 | ) | | | 0.00 | | | | (1.12 | ) | | | (1.50 | ) | | | (1.62 | ) | | | 0.00 | |
| | | | | | | | | | | | | | | | | | | | | | | | |
Total distributions to shareholders | | | (3.53 | ) | | | (0.12 | ) | | | (1.31 | ) | | | (1.68 | ) | | | (1.74 | ) | | | (0.22 | ) |
Net asset value, end of period | | | $15.02 | | | | $16.66 | | | | $14.68 | | | | $16.20 | | | | $16.93 | | | | $16.47 | |
Total return2 | | | 12.39 | % | | | 14.35 | % | | | (0.79 | )% | | | 5.95 | % | | | 13.94 | % | | | 28.52 | % |
Ratios to average net assets (annualized) | | | | | | | | | | | | | | | | | | | | | | | | |
Gross expenses | | | 0.85 | % | | | 1.01 | % | | | 1.16 | % | | | 1.12 | % | | | 1.12 | % | | | 1.10 | % |
Net expenses | | | 0.75 | % | | | 0.87 | % | | | 0.93 | % | | | 0.85 | % | | | 0.85 | % | | | 0.85 | % |
Net investment income | | | 1.51 | % | | | 1.01 | % | | | 1.35 | % | | | 1.01 | % | | | 0.86 | % | | | 1.28 | % |
Supplemental data | | | | | | | | | | | | | | | | | | | | | | | | |
Portfolio turnover rate | | | 123 | % | | | 221 | % | | | 50 | % | | | 71 | % | | | 59 | % | | | 78 | % |
Net assets, end of period (000s omitted) | | | $18,318 | | | | $18,296 | | | | $24,164 | | | | $30,177 | | | | $36,002 | | | | $38,798 | |
| 1 | Calculated based upon average shares outstanding |
| 2 | Returns for periods of less than one year are not annualized. |
The accompanying notes are an integral part of these financial statements.
| | | | | | |
| Financial highlights | | Wells Fargo Large Company Value Fund | | | 19 | |
(For a share outstanding throughout each period)
| | | | | | | | | | | | | | | | | | | | | | | | |
| | | Six months ended
January 31, 2018 (unaudited) | | | Year ended July 31 | |
| INSTITUTIONAL CLASS | | | 2017 | | | 2016 | | | 2015 | | | 2014 | | | 2013 | |
Net asset value, beginning of period | | | $16.65 | | | | $14.66 | | | | $16.17 | | | | $16.91 | | | | $16.44 | | | | $13.00 | |
Net investment income | | | 0.13 | | | | 0.19 | 1 | | | 0.21 | 1 | | | 0.20 | 1 | | | 0.18 | 1 | | | 0.26 | 1 |
Net realized and unrealized gains (losses) on investments | | | 1.79 | | | | 1.94 | | | | (0.38 | ) | | | 0.78 | | | | 2.05 | | | | 3.45 | |
| | | | | | | | | | | | | | | | | | | | | | | | |
Total from investment operations | | | 1.92 | | | | 2.13 | | | | (0.17 | ) | | | 0.98 | | | | 2.23 | | | | 3.71 | |
Distributions to shareholders from | | | | | | | | | | | | | | | | | | | | | | | | |
Net investment income | | | (0.19 | ) | | | (0.14 | ) | | | (0.22 | ) | | | (0.22 | ) | | | (0.14 | ) | | | (0.27 | ) |
Net realized gains | | | (3.38 | ) | | | 0.00 | | | | (1.12 | ) | | | (1.50 | ) | | | (1.62 | ) | | | 0.00 | |
| | | | | | | | | | | | | | | | | | | | | | | | |
Total distributions to shareholders | | | (3.57 | ) | | | (0.14 | ) | | | (1.34 | ) | | | (1.72 | ) | | | (1.76 | ) | | | (0.27 | ) |
Net asset value, end of period | | | $15.00 | | | | $16.65 | | | | $14.66 | | | | $16.17 | | | | $16.91 | | | | $16.44 | |
Total return2 | | | 12.59 | % | | | 14.61 | % | | | (0.54 | )% | | | 6.14 | % | | | 14.16 | % | | | 28.93 | % |
Ratios to average net assets (annualized) | | | | | | | | | | | | | | | | | | | | | | | | |
Gross expenses | | | 0.60 | % | | | 0.74 | % | | | 0.91 | % | | | 0.85 | % | | | 0.85 | % | | | 0.84 | % |
Net expenses | | | 0.50 | % | | | 0.61 | % | | | 0.74 | % | | | 0.65 | % | | | 0.65 | % | | | 0.65 | % |
Net investment income | | | 1.75 | % | | | 1.21 | % | | | 1.52 | % | | | 1.23 | % | | | 1.10 | % | | | 1.83 | % |
Supplemental data | | | | | | | | | | | | | | | | | | | | | | | | |
Portfolio turnover rate | | | 123 | % | | | 221 | % | | | 50 | % | | | 71 | % | | | 59 | % | | | 78 | % |
Net assets, end of period (000s omitted) | | | $18,337 | | | | $16,321 | | | | $9,343 | | | | $1,483 | | | | $863 | | | | $3,299 | |
| 1 | Calculated based upon average shares outstanding |
| 2 | Returns for periods of less than one year are not annualized. |
The accompanying notes are an integral part of these financial statements.
| | | | |
| 20 | | Wells Fargo Large Company Value Fund | | Notes to financial statements (unaudited) |
1. ORGANIZATION
Wells Fargo Funds Trust (the “Trust”), a Delaware statutory trust organized on March 10, 1999, is an open-end management investment company registered under the Investment Company Act of 1940, as amended (the “1940 Act”). As an investment company, the Trust follows the accounting and reporting guidance in Financial Accounting Standards Board Accounting Standards Codification Topic 946, Financial Services – Investment Companies. These financial statements report on the Wells Fargo Large Cap Growth Fund (the “Fund”) which is a diversified series of the Trust.
2. SIGNIFICANT ACCOUNTING POLICIES
The following significant accounting policies, which are consistently followed in the preparation of the financial statements of the Fund, are in conformity with U.S. generally accepted accounting principles which require management to make estimates and assumptions that affect the reported amounts of assets and liabilities, disclosure of contingent assets and liabilities at the date of the financial statements, and the reported amounts of revenues and expenses during the reporting period. Actual results could differ from those estimates.
Securities valuation
All investments are valued each business day as of the close of regular trading on the New York Stock Exchange (generally 4 p.m. Eastern Time), although the Fund may deviate from this calculation time under unusual or unexpected circumstances.
Equity securities and futures that are listed on a foreign or domestic exchange or market are valued at the official closing price or, if none, the last sales price. If no sale occurs on the principal exchange or market that day, a fair value price will be determined in accordance with the Fund’s Valuation Procedures.
Investments in registered open-end investment companies are valued at net asset value. Interests in non-registered investment vehicles that are redeemable at net asset value are fair valued normally at net asset value.
Investments which are not valued using any of the methods discussed above are valued at their fair value, as determined in good faith by the Board of Trustees of the Fund. The Board of Trustees has established a Valuation Committee comprised of the Trustees and has delegated to it the authority to take any actions regarding the valuation of portfolio securities that the Valuation Committee deems necessary or appropriate, including determining the fair value of portfolio securities, unless the determination has been delegated to the Wells Fargo Asset Management Pricing Committee of Wells Fargo Funds Management, LLC (“Funds Management”). The Board of Trustees retains the authority to make or ratify any valuation decisions or approve any changes to the Valuation Procedures as it deems appropriate. On a quarterly basis, the Board of Trustees receives reports on any valuation actions taken by the Valuation Committee or the Wells Fargo Asset Management Pricing Committee which may include items for ratification.
Valuations of fair valued securities are compared to the next actual sales price when available, or other appropriate market values, to assess the continued appropriateness of the fair valuation methodologies used. These securities are fair valued on a day-to-day basis, taking into consideration changes to appropriate market information and any significant changes to the inputs considered in the valuation process until there is a readily available price provided on an exchange or by an independent pricing service. Valuations received from an independent pricing service or independent broker-dealer quotes are periodically validated by comparisons to most recent trades and valuations provided by other independent pricing services in addition to the review of prices by the manager and/or subadviser. Unobservable inputs used in determining fair valuations are identified based on the type of security, taking into consideration factors utilized by market participants in valuing the investment, knowledge about the issuer and the current market environment.
Security loans
The Fund may lend its securities from time to time in order to earn additional income in the form of fees or interest on securities received as collateral or the investment of any cash received as collateral. The Fund continues to receive interest or dividends on the securities loaned. The Fund receives collateral in the form of cash or securities with a value at least equal to the value of the securities on loan. The value of the loaned securities is determined at the close of each business day and any additional required collateral is delivered to the Fund on the next business day. In a securities lending transaction, the net asset value of the Fund will be affected by an increase or decrease in the value of the securities loaned and by an increase or decrease in the value of the instrument in which collateral is invested. The amount of securities lending activity undertaken by the Fund fluctuates from time to time. In the event of default or bankruptcy by the borrower, the Fund may be prevented from recovering the loaned securities or gaining access to the collateral or may experience delays or costs in doing so. In addition, the investment of any cash collateral received may lose all or part of its value. The Fund has the right under the lending agreement to recover the securities from the borrower on demand.
| | | | | | |
| Notes to financial statements (unaudited) | | Wells Fargo Large Company Value Fund | | | 21 | |
The Fund lends its securities through an unaffiliated securities lending agent. Cash collateral received in connection with its securities lending transactions is invested in Securities Lending Cash Investments, LLC (the “Securities Lending Fund”). The Securities Lending Fund is exempt from registration under Section 3(c)(7) of the 1940 Act and is managed by Funds Management and is subadvised by Wells Capital Management Incorporated (“WellsCap”), an affiliate of Funds Management and an indirect wholly owned subsidiary of Wells Fargo & Company (“Wells Fargo”). Funds Management receives an advisory fee starting at 0.05% and declining to 0.01% as the average daily net assets of the Securities Lending Fund increase. All of the fees received by Funds Management are paid to WellsCap for its services as subadviser. The Securities Lending Fund seeks to provide a positive return compared to the daily Fed Funds Open Rate by investing in high-quality, U.S. dollar-denominated short-term money market instruments. Securities Lending Fund investments are valued at the evaluated bid price provided by an independent pricing service. Income earned from investment in the Securities Lending Fund, if any, is included in income from affiliated securities on the Statement of Operations.
Futures contracts
The Fund is subject to equity price risk in the normal course of pursuing its investment objectives. The Fund may buy and sell futures contracts in order to gain exposure to, or protect against, changes in security values. The primary risks associated with the use of futures contracts are the imperfect correlation between changes in market values of securities held by the Fund and the prices of futures contracts, and the possibility of an illiquid market.
The aggregate principal amounts of the contracts are not recorded in the financial statements. Fluctuations in the value of the contracts are recorded in the Statement of Assets and Liabilities as an asset or liability and in the Statement of Operations as unrealized gains or losses until the contracts are closed, at which point they are recorded as net realized gains or losses on futures contracts. With futures contracts, there is minimal counterparty risk to the Fund since futures are exchange traded and the exchange’s clearinghouse, as counterparty to all exchange traded futures, guarantees the futures against default.
Security transactions and income recognition
Securities transactions are recorded on a trade date basis. Realized gains or losses are recorded on the basis of identified cost.
Dividend income is recognized on the ex-dividend date.
Distributions to shareholders
Distributions to shareholders from net investment income and net realized gains, if any, are recorded on the ex-dividend date. Such distributions are determined in accordance with income tax regulations and may differ from U.S. generally accepted accounting principles. Dividend sources are estimated at the time of declaration. The tax character of distributions is determined as of the Fund’s fiscal year end. Therefore, a portion of the Fund’s distributions made prior to the Fund’s fiscal year end may be categorized as a tax return of capital.
Federal and other taxes
The Fund intends to continue to qualify as a regulated investment company by distributing substantially all of its investment company taxable and any net realized capital gains (after reduction for capital loss carryforwards) sufficient to relieve it from all, or substantially all, federal income taxes. Accordingly, no provision for federal income taxes was required.
The Fund’s income and federal excise tax returns and all financial records supporting those returns for the prior three fiscal years are subject to examination by the federal and Delaware revenue authorities. Management has analyzed the Fund’s tax positions taken on federal, state, and foreign tax returns for all open tax years and does not believe that there are any uncertain tax positions that require recognition of a tax liability.
As of January 31, 2018, the aggregate cost of all investments for federal income tax purposes was $233,069,293 and the unrealized gains (losses) consisted of:
| | | | |
Gross unrealized gains | | $ | 40,515,537 | |
Gross unrealized losses | | | (2,257,526 | ) |
Net unrealized gains | | $ | 38,258,011 | |
Class allocations
The separate classes of shares offered by the Fund differ principally in applicable sales charges, distribution, shareholder servicing, and administration fees. Class specific expenses are charged directly to that share class. Investment income, common expenses, and realized and unrealized gains (losses) on investments are allocated daily to each class of shares based on the relative proportion of net assets of each class.
| | | | |
| 22 | | Wells Fargo Large Company Value Fund | | Notes to financial statements (unaudited) |
3. FAIR VALUATION MEASUREMENTS
Fair value measurements of investments are determined within a framework that has established a fair value hierarchy based upon the various data inputs utilized in determining the value of the Fund’s investments. The three-level hierarchy gives the highest priority to unadjusted quoted prices in active markets for identical assets or liabilities (Level 1) and the lowest priority to unobservable inputs (Level 3). The Fund’s investments are classified within the fair value hierarchy based on the lowest level of input that is significant to the fair value measurement. The inputs are summarized into three broad levels as follows:
| ∎ | | Level 1 – quoted prices in active markets for identical securities |
| ∎ | | Level 2 – other significant observable inputs (including quoted prices for similar securities, interest rates, prepayment speeds, credit risk, etc.) |
| ∎ | | Level 3 – significant unobservable inputs (including the Fund’s own assumptions in determining the fair value of investments) |
The inputs or methodologies used for valuing investments in securities are not necessarily an indication of the risk associated with investing in those securities.
The following is a summary of the inputs used in valuing the Fund’s assets and liabilities as of January 31, 2018:
| | | | | | | | | | | | | | | | |
| | | Quoted prices
(Level 1) | | | Other significant
observable inputs
(Level 2) | | | Significant
unobservable inputs (Level 3) | | | Total | |
Assets | | | | | | | | | | | | | | | | |
Investments in: | | | | | | | | | | | | | | | | |
| | | | |
Common stocks | | | | | | | | | | | | | | | | |
Consumer discretionary | | $ | 14,778,808 | | | $ | 0 | | | $ | 0 | | | $ | 14,778,808 | |
Consumer staples | | | 27,914,759 | | | | 0 | | | | 0 | | | | 27,914,759 | |
Energy | | | 28,774,530 | | | | 0 | | | | 0 | | | | 28,774,530 | |
Financials | | | 73,092,096 | | | | 0 | | | | 0 | | | | 73,092,096 | |
Health care | | | 37,920,380 | | | | 0 | | | | 0 | | | | 37,920,380 | |
Industrials | | | 22,465,584 | | | | 0 | | | | 0 | | | | 22,465,584 | |
Information technology | | | 21,763,622 | | | | 0 | | | | 0 | | | | 21,763,622 | |
Materials | | | 3,485,964 | | | | 0 | | | | 0 | | | | 3,485,964 | |
Real estate | | | 23,781,568 | | | | 0 | | | | 0 | | | | 23,781,568 | |
Telecommunication services | | | 2,201,406 | | | | 0 | | | | 0 | | | | 2,201,406 | |
Utilities | | | 12,988,685 | | | | 0 | | | | 0 | | | | 12,988,685 | |
| | | | |
Short-term investments | | | | | | | | | | | | | | | | |
Investment companies | | | 1,996,427 | | | | 0 | | | | 0 | | | | 1,996,427 | |
| | | 271,163,829 | | | | 0 | | | | 0 | | | | 271,163,829 | |
Futures contracts | | | 1,430 | | | | 0 | | | | 0 | | | | 1,430 | |
Total assets | | $ | 271,165,259 | | | $ | 0 | | | $ | 0 | | | $ | 271,165,259 | |
Futures contracts are reported at their variation margin at measurement date, which represents the amount due to the Fund at that date. All other assets and liabilities are reported at their market value at measurement date.
The Fund recognizes transfers between levels within the fair value hierarchy at the end of the reporting period. At January 31, 2018, the Fund did not have any transfers into/out of Level 1, Level 2, or Level 3.
4. TRANSACTIONS WITH AFFILIATES
Management fee
Funds Management, an indirect wholly owned subsidiary of Wells Fargo, is the manager of the Fund and provides advisory and fund-level administrative services under an investment management agreement. Under the investment management agreement, Funds Management is responsible for, among other services, implementing the investment objectives and strategies of the Fund, supervising the subadviser, providing fund-level administrative services in connection with the Fund’s operations, and providing any other fund-level administrative services reasonably necessary for the operation of the Fund. As
| | | | | | |
| Notes to financial statements (unaudited) | | Wells Fargo Large Company Value Fund | | | 23 | |
compensation for its services under the investment management agreement, Funds Management is entitled to receive an annual management fee starting at 0.40% and declining to 0.33% as the average daily net assets of the Fund increase. For the six months ended January 31, 2018, the management fee was equivalent to an annual rate of 0.40% of the Fund’s average daily net assets.
Funds Management has retained the services of a subadviser to provide daily portfolio management to the Fund. The fee for subadvisory services is borne by Funds Management. Analytic Investor LLC, an affiliate of Funds Management and an indirect wholly owned subsidiary of Wells Fargo, is the subadviser to the Fund and is entitled to receive a fee from Funds Management at an annual rate starting at 0.25% and declining to 0.15% as the average daily net assets of the Fund increase.
Administration fees
Under a class-level administration agreement, Funds Management provides class-level administrative services to the Fund, which includes paying fees and expenses for services provided by the transfer agent, sub-transfer agents, omnibus account servicers and record-keepers. As compensation for its services under the class-level administration agreement, Funds Management receives an annual fee which is calculated based on the average daily net assets of each class as follows:
| | | | |
| | | Class-level
administration fee | |
Class A, Class C | | | 0.21 | % |
Class R6 | | | 0.03 | |
Administrator Class, Institutional Class | | | 0.13 | |
Funds Management has contractually waived and/or reimbursed management and administration fees to the extent necessary to maintain certain net operating expense ratios for the Fund. Waiver of fees and/or reimbursement of expenses by Funds Management were made first from fund level expenses on a proportionate basis and then from class specific expenses. Funds Management has committed through November 30, 2019 to waive fees and/or reimburse expenses to the extent necessary to cap the Fund’s expenses at 0.83% for Class A shares, 1.58% for Class C shares, 0.40% for Class R6 shares, 0.75% for Administrator Class shares, and 0.50% for Institutional Class shares. After this time, the cap may be increased or the commitment to maintain the cap may be terminated only with the approval of the Board of Trustees.
Distribution fee
The Trust has adopted a distribution plan for Class C shares of the Fund pursuant to Rule 12b-1 under the 1940 Act. A distribution fee is charged to Class C shares and paid to Wells Fargo Funds Distributor, LLC (“Funds Distributor”), the principal underwriter, at an annual rate of 0.75% of the average daily net assets of Class C shares.
In addition, Funds Distributor is entitled to receive the front-end sales charge from the purchase of Class A shares and a contingent deferred sales charge on the redemption of certain Class A shares. Funds Distributor is also entitled to receive the contingent deferred sales charges from redemptions of Class C shares. For the six months January 31, 2018, Funds Distributor received $965 from the sale of Class A shares. No contingent deferred sales charges were incurred by Class A and Class C shares for the six months ended January 31, 2018.
Shareholder servicing fees
The Trust has entered into contracts with one or more shareholder servicing agents, whereby Class A, Class C, and Administrator Class of the Fund are charged a fee at an annual rate of 0.25% of the average daily net assets of each respective class.
A portion of these total shareholder servicing fees were paid to affiliates of Wells Fargo.
Interfund transactions
The Fund may purchase or sell portfolio investment securities to certain other Wells Fargo affiliates pursuant to Rule 17a-7 under the 1940 Act and under procedures adopted by the Board of Trustees. The procedures have been designed to ensure that these interfund transactions, which do not incur broker commissions, are effected at current market prices.
5. INVESTMENT PORTFOLIO TRANSACTIONS
Purchases and sales of investments, excluding U.S. government obligations (if any) and short-term securities, for the six months ended January 31, 2018 were $317,608,435 and $327,999,378, respectively.
| | | | |
| 24 | | Wells Fargo Large Company Value Fund | | Notes to financial statements (unaudited) |
6. DERIVATIVE TRANSACTIONS
During the six months ended January 31, 2018, the Fund entered into futures contracts to gain market exposure. The Fund had an average notional amount of $2,183,000 in long futures contracts during the six months ended January 31, 2018.
On January 31, 2018, the cumulative unrealized gains on futures contracts in the amount of $163,475 are reflected in net unrealized gains on investments on the Statement of Assets and Liabilities. The receivable for daily variation margin on open futures contracts reflected in the Statement of Assets and Liabilities only represents the current day’s variation margin. The realized gains and change in unrealized gains (losses) on futures contracts are reflected in the Statement of Operations.
For certain types of derivative transactions, the Fund has entered into International Swaps and Derivatives Association, Inc. master agreements (“ISDA Master Agreements”) or similar agreements with approved counterparties. The ISDA Master Agreements or similar agreements may have requirements to deliver/deposit securities or cash to/with an exchange or broker-dealer as collateral and allows the Fund to offset, with each counterparty, certain derivative financial instrument’s assets and/or liabilities with collateral held or pledged. Collateral requirements differ by type of derivative. Collateral or margin requirements are set by the broker or exchange clearinghouse for exchange traded derivatives while collateral terms are contract specific for over-the-counter traded derivatives. Cash collateral that has been pledged to cover obligations of the Fund under ISDA Master Agreements or similar agreements, if any, are reported separately in the Statement of Assets and Liabilities. Securities pledged as collateral, if any, are noted in the Portfolio of Investments. With respect to balance sheet offsetting, absent an event of default by the counterparty or a termination of the agreement, the reported amounts of financial assets and financial liabilities in the Statement of Assets and Liabilities are not offset across transactions between the Fund and the applicable counterparty. A reconciliation of the gross amounts on the Statement of Assets and Liabilities to the net amounts by derivative type, including any collateral exposure, is as follows:
| | | | | | | | | | | | |
| Counterparty | | Gross amounts
of assets in the
Statement of
Assets and
Liabilities | | Amounts
subject to
netting
agreements | | Collateral
received | | | Net amount
of assets | |
Morgan Stanley | | $1,430 | | $0 | | $ | 0 | | | $ | 1,430 | |
7. BANK BORROWINGS
The Trust (excluding the money market funds and certain other funds) and Wells Fargo Variable Trust are parties to a $280,000,000 revolving credit agreement whereby the Fund is permitted to use bank borrowings for temporary or emergency purposes, such as to fund shareholder redemption requests. Interest under the credit agreement is charged to the Fund based on a borrowing rate equal to the higher of the Federal Funds rate in effect on that day plus 1.25% or the overnight LIBOR rate in effect on that day plus 1.25%. In addition, an annual commitment fee equal to 0.25% of the unused balance is allocated to each participating fund. Prior to August 29, 2017, the revolving credit agreement amount was $250,000,000.
For the six months ended January 31, 2018, there were no borrowings by the Fund under the agreement.
8. CONCENTRATION RISK
Concentration risks result from exposure to a limited number of sectors. A fund that invests a substantial portion of its assets in any sector may be more affected by changes in that sector than would be a fund whose investments are not heavily weighted in any sector.
9. INDEMNIFICATION
Under the Trust’s organizational documents, the officers and Trustees have been granted certain indemnification rights against certain liabilities that may arise out of performance of their duties to the Trust. Additionally, in the normal course of business, the Trust may enter into contracts with service providers that contain a variety of indemnification clauses. The Trust’s maximum exposure under these arrangements is dependent on future claims that may be made against the Fund and, therefore, cannot be estimated.
| | | | | | |
| Other information (unaudited) | | Wells Fargo Large Company Value Fund | | | 25 | |
PROXY VOTING INFORMATION
A description of the policies and procedures that the Fund uses to determine how to vote proxies relating to portfolio securities is available, upon request, by calling 1-800-222-8222, visiting our website at wellsfargofunds.com, or visiting the SEC website at sec.gov. Information regarding how the Fund voted proxies relating to portfolio securities during the most recent 12-month period ended June 30 is available on the Fund’s website at wellsfargofunds.com or by visiting the SEC website at sec.gov.
PORTFOLIO HOLDINGS INFORMATION
The complete portfolio holdings for the Fund are publicly available monthly on the Fund’s website (wellsfargofunds.com), on a one-month delayed basis. In addition, top ten holdings information (excluding derivative positions) for the Fund is publicly available on the Fund’s website on a monthly, seven-day or more delayed basis. The Fund files its complete schedule of portfolio holdings with the SEC for the first and third quarters of each fiscal year on Form N-Q, which is available by visiting the SEC website at sec.gov. In addition, the Fund’s Form N-Q may be reviewed and copied at the SEC’s Public Reference Room in Washington, DC, and at regional offices in New York City, at 233 Broadway, and in Chicago, at 175 West Jackson Boulevard, Suite 900. Information about the Public Reference Room may be obtained by calling 1-800-SEC-0330.
| | | | |
| 26 | | Wells Fargo Large Company Value Fund | | Other information (unaudited) |
BOARD OF TRUSTEES AND OFFICERS
Each of the Trustees and Officers1 listed in the table below acts in identical capacities for each fund in the Wells Fargo family of funds, which consists of 153 mutual funds comprising the Wells Fargo Funds Trust, Wells Fargo Variable Trust, Wells Fargo Master Trust and four closed-end funds (collectively the “Fund Complex”). This table should be read in conjunction with the Prospectus and the Statement of Additional Information2. The mailing address of each Trustee and Officer is 525 Market Street, 12th Floor, San Francisco, CA 94105. Each Trustee and Officer serves an indefinite term, however, each Trustee serves such term until reaching the mandatory retirement age established by the Trustees.
Independent Trustees
| | | | | | |
Name and year of birth | | Position held and length of service* | | Principal occupations during past five years or longer | | Current other public company or
investment company
directorships |
William R. Ebsworth (Born 1957) | | Trustee, since 2015 | | Retired. From 1984 to 2013, equities analyst, portfolio manager, research director and chief investment officer at Fidelity Management and Research Company in Boston, Tokyo, and Hong Kong, and retired in 2013 as Chief Investment Officer of Fidelity Strategic Advisers, Inc. where he led a team of investment professionals managing client assets. Prior thereto, Board member of Hong Kong Securities Clearing Co., Hong Kong Options Clearing Corp., the Thailand International Fund, Ltd., Fidelity Investments Life Insurance Company, and Empire Fidelity Investments Life Insurance Company. Board member of the Forté Foundation (non-profit organization) and the Vincent Memorial Hospital Endowment (non-profit organization), where he serves on the Investment Committee and as a Chair of the Audit Committee. Mr. Ebsworth is a CFA® charterholder. | | Asset Allocation Trust |
Jane A. Freeman** (Born 1953) | | Trustee, since 2015; Chair Liaison, since 2018 | | Retired. From 2012 to 2014 and 1999 to 2008, Chief Financial Officer of Scientific Learning Corporation. From 2008 to 2012, Ms. Freeman provided consulting services related to strategic business projects. Prior to 1999, Portfolio Manager at Rockefeller & Co. and Scudder, Stevens & Clark. Board member of the Harding Loevner Funds from 1996 to 2014, serving as both Lead Independent Director and chair of the Audit Committee. Board member of the Russell Exchange Traded Funds Trust from 2011 to 2012 and the chair of the Audit Committee. Ms. Freeman is a Board Member of Ruth Bancroft Garden (non-profit organization) and the Glimmerglass Festival. She is also an inactive Chartered Financial Analyst. | | Asset Allocation Trust |
Isaiah Harris, Jr. (Born 1952) | | Trustee, since 2009 | | Retired. Chairman of the Board of CIGNA Corporation since 2009, and Director since 2005. From 2003 to 2011, Director of Deluxe Corporation. Prior thereto, President and CEO of BellSouth Advertising and Publishing Corp. from 2005 to 2007, President and CEO of BellSouth Enterprises from 2004 to 2005 and President of BellSouth Consumer Services from 2000 to 2003. Emeritus member of the Iowa State University Foundation Board of Governors. Emeritus Member of the Advisory Board of Iowa State University School of Business. Advisory Board Member, Palm Harbor Academy (charter school). Advisory Board Member, Child Evangelism Fellowship (non-profit). Mr. Harris is a certified public accountant (inactive status). | | CIGNA Corporation; Asset Allocation Trust |
Judith M. Johnson (Born 1949) | | Trustee, since 2008; Audit Committee Chairman, since 2008 | | Retired. Prior thereto, Chief Executive Officer and Chief Investment Officer of Minneapolis Employees Retirement Fund from 1996 to 2008. Ms. Johnson is an attorney, certified public accountant and a certified managerial accountant. | | Asset Allocation Trust |
David F. Larcker (Born 1950) | | Trustee, since 2009 | | James Irvin Miller Professor of Accounting at the Graduate School of Business, Stanford University, Director of the Corporate Governance Research Initiative and Senior Faculty of The Rock Center for Corporate Governance since 2006. From 2005 to 2008, Professor of Accounting at the Graduate School of Business, Stanford University. Prior thereto, Ernst & Young Professor of Accounting at The Wharton School, University of Pennsylvania from 1985 to 2005. | | Asset Allocation Trust |
| | | | | | |
| Other information (unaudited) | | Wells Fargo Large Company Value Fund | | | 27 | |
| | | | | | |
Name and year of birth | | Position held and length of service* | | Principal occupations during past five years or longer | | Current other public company or
investment company
directorships |
Olivia S. Mitchell*** (Born 1953) | | Trustee, since 2006; Governance Committee Chairman, since 2018 | | International Foundation of Employee Benefit Plans Professor, Wharton School of the University of Pennsylvania since 1993. Director of Wharton’s Pension Research Council and Boettner Center on Pensions & Retirement Research, and Research Associate at the National Bureau of Economic Research. Previously, Cornell University Professor from 1978 to 1993. | | Asset Allocation Trust |
| Timothy J. Penny**** (Born 1951) | | Trustee since 1996; Chairman, since 2018; Vice Chairman, from 2017 to 2018 | | President and Chief Executive Officer of Southern Minnesota Initiative Foundation, a non-profit organization, since 2007. Member of the Board of Trustees of NorthStar Education Finance, Inc., a non-profit organization, since 2007. | | Asset Allocation Trust |
James G. Polisson***** (Born 1959) | | Trustee, since 2018; Advisory Board Member, from 2017 to 2018 | | Retired. Chief Marketing Officer, Source (ETF) UK Services, Ltd, from 2015 to 2017. From 2012 to 2015, Principal of The Polisson Group, LLC, a management consulting, corporate advisory and principal investing company. Chief Executive Officer and Managing Director at Russell Investments, Global Exchange Traded Funds from 2010 to 2012. Managing Director of Barclays Global Investors from 1998 to 2010 and Global Chief Marketing Officer for iShares and Barclays Global Investors from 2000 to 2010. Trustee of the San Francisco Mechanics’ Institute, a non-profit organization, from 2013 to 2015. Board member of the Russell Exchange Traded Fund Trust from 2011 to 2012. Director of Barclays Global Investors Holdings Deutschland GmbH from 2006 to 2009. Mr. Polisson is an attorney and has a retired status with the Massachusetts and District of Columbia Bar Associations. | | Asset Allocation Trust |
Michael S. Scofield (Born 1943) | | Trustee, since 2010 | | Served on the Investment Company Institute’s Board of Governors and Executive Committee from 2008-2011 as well the Governing Council of the Independent Directors Council from 2006-2011 and the Independent Directors Council Executive Committee from 2008-2011. Trustee of the Evergreen Fund complex (and its predecessors) from 1984 to 2010. Chairman of the Evergreen Funds from 2000-2010. Former Trustee of the Mentor Funds. Retired Attorney, Law Offices of Michael S. Scofield. | | Asset Allocation Trust |
Pamela Wheelock***** (Born 1959) | | Trustee, since 2018; Advisory Board Member, from 2017 to 2018 | | Chief Operating Officer, Twin Cities Habitat for Humanity, since January, 2017. Vice President of University Services, University of Minnesota from 2012 to 2017. Prior thereto, Interim President and Chief Executive Officer of Blue Cross Blue Shield of Minnesota from 2010 to 2011, Chairman of the Board from 2009 to 2011 and Board Director from 2003 to 2015. Vice President, Leadership and Community Engagement, Bush Foundation, Saint Paul, Minnesota (a private foundation) from 2009 to 2011. Executive Vice President and Chief Financial Officer, Minnesota Sports and Entertainment from 2004 to 2009 and Senior Vice President from 2002 to 2004. Commissioner of Finance, State of Minnesota, from 1999 to 2002. Currently on the Board of Directors, Governance Committee and Finance Committee, for the Minnesota Philanthropy Partners (Saint Paul Foundation) since 2012 and Board Chair of the Minnesota Wild Foundation since 2010. | | Asset Allocation Trust |
| * | Length of service dates reflect the Trustee’s commencement of service with the Trust’s predecessor entities, where applicable. |
| ** | Jane Freeman became Chair Liaison effective January 1, 2018. |
| *** | Olivia Mitchell became Chairman of the Governance Committee effective January 1, 2018. |
| **** | Timothy Penny became Chairman effective January 1, 2018. |
| ***** | James Polisson and Pamela Wheelock each became a Trustee effective January 1, 2018. |
| | | | |
| 28 | | Wells Fargo Large Company Value Fund | | Other information (unaudited) |
Officers
| | | | | | |
Name and year of birth | | Position held and
length of service | | Principal occupations during past five years or longer | | |
Andrew Owen (Born 1960) | | President, since 2017 | | Executive Vice President of Wells Fargo & Company and Head of Affiliated Managers, Wells Fargo Asset Management, since 2014. In addition, Mr. Owen is currently President, Chief Executive Officer and Director of Wells Fargo Funds Management, LLC since 2017. Prior thereto, Executive Vice President responsible for marketing, investments and product development for Wells Fargo Funds Management, LLC, from 2009 to 2014. | | |
Jeremy DePalma1 (Born 1974) | | Treasurer, since 2012 | | Senior Vice President of Wells Fargo Funds Management, LLC since 2009. Senior Vice President of Evergreen Investment Management Company, LLC from 2008 to 2010 and head of the Fund Reporting and Control Team within Fund Administration from 2005 to 2010. | | |
C. David Messman (Born 1960) | | Secretary, since 2000; Chief Legal Officer, since 2003 | | Senior Vice President and Secretary of Wells Fargo Funds Management, LLC since 2001. Assistant General Counsel of Wells Fargo Bank, N.A. since 2013 and Vice President and Managing Counsel of Wells Fargo Bank, N.A. from 1996 to 2013. | | |
| Michael H. Whitaker (Born 1967) | | Chief Compliance Officer, since 2016 | | Senior Vice President and Chief Compliance Officer since 2016. Senior Vice President and Chief Compliance Officer for Fidelity Investments from 2007 to 2016. | | |
David Berardi (Born 1975) | | Assistant Treasurer, since 2009 | | Vice President of Wells Fargo Funds Management, LLC since 2009. Vice President of Evergreen Investment Management Company, LLC from 2008 to 2010. Manager of Fund Reporting and Control for Evergreen Investment Management Company, LLC from 2004 to 2010. | | |
| 1 | Jeremy DePalma acts as Treasurer of 76 funds and Assistant Treasurer of 77 funds in the Fund Complex. |
| 2 | The Statement of Additional Information includes additional information about the Trustees and is available, without charge, upon request, by calling 1-800-222-8222 or by visiting the website at wellsfargofunds.com. |
| | | | | | |
| List of abbreviations | | Wells Fargo Large Company Value Fund | | | 29 | |
The following is a list of common abbreviations for terms and entities that may have appeared in this report.
| ACA | — ACA Financial Guaranty Corporation |
| ADR | — American depositary receipt |
| ADS | — American depositary shares |
| AGC | — Assured Guaranty Corporation |
| AGM | — Assured Guaranty Municipal |
| Ambac | — Ambac Financial Group Incorporated |
| AMT | — Alternative minimum tax |
| BAN | — Bond anticipation notes |
| BHAC | — Berkshire Hathaway Assurance Corporation |
| CAB | — Capital appreciation bond |
| CCAB | — Convertible capital appreciation bond |
| CDA | — Community Development Authority |
| CDO | — Collateralized debt obligation |
| CLO | — Collateralized loan obligation |
| DRIVER | — Derivative inverse tax-exempt receipts |
| DW&P | — Department of Water & Power |
| DWR | — Department of Water Resources |
| ECFA | — Educational & Cultural Facilities Authority |
| EDA | — Economic Development Authority |
| EDFA | — Economic Development Finance Authority |
| ETF | — Exchange-traded fund |
| FDIC | — Federal Deposit Insurance Corporation |
| FFCB | — Federal Farm Credit Banks |
| FGIC | — Financial Guaranty Insurance Corporation |
| FHA | — Federal Housing Administration |
| FHLB | — Federal Home Loan Bank |
| FHLMC | — Federal Home Loan Mortgage Corporation |
| FICO | — The Financing Corporation |
| FNMA | — Federal National Mortgage Association |
| GDR | — Global depositary receipt |
| GNMA | — Government National Mortgage Association |
| HCFR | — Healthcare facilities revenue |
| HEFA | — Health & Educational Facilities Authority |
| HEFAR | — Higher education facilities authority revenue |
| HFA | — Housing Finance Authority |
| HFFA | — Health Facilities Financing Authority |
| HUD | — Department of Housing and Urban Development |
| IDA | — Industrial Development Authority |
| IDAG | — Industrial Development Agency |
| KRW | — Republic of Korea won |
| LIBOR | — London Interbank Offered Rate |
| LIFER | — Long Inverse Floating Exempt Receipts |
| LLC | — Limited liability company |
| LLLP | — Limited liability limited partnership |
| LLP | — Limited liability partnership |
| MBIA | — Municipal Bond Insurance Association |
| MFHR | — Multifamily housing revenue |
| MSTR | — Municipal securities trust receipts |
| MUD | — Municipal Utility District |
| National | — National Public Finance Guarantee Corporation |
| PCFA | — Pollution Control Financing Authority |
| PCL | — Public Company Limited |
| PCR | — Pollution control revenue |
| PFA | — Public Finance Authority |
| PFFA | — Public Facilities Financing Authority |
| PFOTER | — Puttable floating option tax-exempt receipts |
| PJSC | — Public Joint Stock Company |
| plc | — Public limited company |
| PUTTER | — Puttable tax-exempt receipts |
| R&D | — Research & development |
| Radian | — Radian Asset Assurance |
| RAN | — Revenue anticipation notes |
| RDA | — Redevelopment Agency |
| RDFA | — Redevelopment Finance Authority |
| REIT | — Real estate investment trust |
| ROC | — Reset option certificates |
| SAVRS | — Select auction variable rate securities |
| SBA | — Small Business Authority |
| SDR | — Swedish depositary receipt |
| SFHR | — Single-family housing revenue |
| SFMR | — Single-family mortgage revenue |
| SIFMA | — Securities Industry and Financial Markets Association |
| SPA | — Standby purchase agreement |
| SPDR | — Standard & Poor’s Depositary Receipts |
| SPEAR | — Short Puttable Exempt Adjustable Receipts |
| STRIPS | — Separate trading of registered interest and |
| TAN | — Tax anticipation notes |
| TIPS | — Treasury inflation-protected securities |
| TRAN | — Tax revenue anticipation notes |
| TTFA | — Transportation Trust Fund Authority |
| TVA | — Tennessee Valley Authority |
This page is intentionally left blank.
This page is intentionally left blank.
This page is intentionally left blank.

For more information
More information about Wells Fargo Funds is available free upon request. To obtain literature, please write, email, visit the Fund’s website, or call:
Wells Fargo Funds
P.O. Box 8266
Boston, MA 02266-8266
Email: fundservice@wellsfargo.com
Website: wellsfargofunds.com
Individual investors: 1-800-222-8222
Retail investment professionals: 1-888-877-9275
Institutional investment professionals:
1-866-765-0778
This report and the financial statements contained herein are submitted for the general information of the shareholders of the Fund. If this report is used for promotional purposes, distribution of the report must be accompanied or preceded by a current prospectus. Before investing, please consider the investment objectives, risks, charges, and expenses of the investment. For a current prospectus and, if available, a summary prospectus, containing this information, call 1-800-222-8222 or visit the Fund’s website at wellsfargofunds.com. Read the prospectus carefully before you invest or send money.
Wells Fargo Asset Management (WFAM) is a trade name used by the asset management businesses of Wells Fargo & Company. Wells Fargo Funds Management, LLC, a wholly owned subsidiary of Wells Fargo & Company, provides investment advisory and administrative services for Wells Fargo Funds. Other affiliates of Wells Fargo & Company provide subadvisory and other services for the funds. The funds are distributed by Wells Fargo Funds Distributor, LLC, Member FINRA, an affiliate of Wells Fargo & Company. Neither Wells Fargo Funds Distributor nor Wells Fargo Funds Management holds fund shareholder accounts or assets. This material is for general informational and educational purposes only and is NOT intended to provide investment advice or a recommendation of any kind—including a recommendation for any specific investment, strategy, or plan.
NOT FDIC INSURED ◾ NO BANK GUARANTEE ◾ MAY LOSE VALUE
© 2018 Wells Fargo Funds Management, LLC. All rights reserved.
| | |
 | | 309118 03-18 SA210/SAR210 01-18 |
Semi-Annual Report
January 31, 2018

Wells Fargo Low Volatility U.S. Equity Fund


Reduce clutter. Save trees.
Sign up for electronic delivery of prospectuses and shareholder reports at wellsfargo.com/advantagedelivery
Contents
The views expressed and any forward-looking statements are as of January 31, 2018, unless otherwise noted, and are those of the Fund managers and/or Wells Fargo Funds Management, LLC. Discussions of individual securities, or the markets generally, or any Wells Fargo Fund are not intended as individual recommendations. Future events or results may vary significantly from those expressed in any forward-looking statements. The views expressed are subject to change at any time in response to changing circumstances in the market. Wells Fargo Funds Management, LLC and the Fund disclaim any obligation to publicly update or revise any views expressed or forward-looking statements.
NOT FDIC INSURED ◾ NO BANK GUARANTEE ◾ MAY LOSE VALUE
| | | | |
| 2 | | Wells Fargo Low Volatility U.S. Equity Fund | | Letter to shareholders (unaudited) |

Andrew Owen
President
Wells Fargo Funds
While investing in stocks and bonds generally delivered favorable returns during the past six months, fixed-income investments in the U.S. diverged from the global trend.
Dear Shareholder:
We are pleased to offer you this semi-annual report for the Wells Fargo Low Volatility U.S. Equity Fund for the six-month period that ended January 31, 2018. While investing in stocks generally delivered favorable returns during the past six months, fixed-income investments in the U.S. diverged from the global trend. U.S. and international stocks delivered similar results, with returns of 15.43% and 13.50%, respectively, for the six-month period, as measured by the S&P 500 Index1 and the MSCI ACWI ex USA Index (Net)2, respectively. Within fixed income, the Bloomberg Barclays Global Aggregate ex-USD Index3 earned 4.50%. In the U.S., fixed-income investments, as measured by the Bloomberg Barclays U.S. Aggregate Bond Index4, fell 0.35% and the Bloomberg Barclays Municipal Bond Index5 declined 0.19%.
As global growth improved in the third quarter of 2017, investment markets advanced.
Globally, stocks moved higher during the late summer of 2017 as they were subject to the same positive economic conditions that influenced their advances during first half of the year: moderately accelerating global economic growth supported by improving corporate earnings as well as low inflation and interest rates. Brief episodes of geopolitical tensions, primarily associated with North Korea’s advancing nuclear missile program, flaring conflicts in the Middle East, and uncertainty surrounding the new U.S. administration’s trade policies, did not discourage investing activity. In the U.S., economic data released during the quarter reflected a generally healthy economy. Second-quarter economic output grew at a 3.1% annual rate.
Outside the U.S., stocks in international developed and emerging markets were supported by improved economic growth. Advances in emerging markets equity valuations slowed compared with the pace of the first half of 2017 but continued an upward path. Central banks in Europe, Asia, and Japan maintained low-interest-rate policies that supported business growth and equity investing.
In the U.S., Federal Reserve (Fed) officials announced in October plans to begin the process of unwinding its $4.5 trillion portfolio of bonds and other assets accumulated during rounds of quantitative easing conducted since the 2008–2009 recession. Still, restrained inflation kept long-term bond rates steady and the flattening of the yield curve persisted.
Positive economic and market news continued as 2017 closed and 2018 began.
During the fourth quarter of 2017, stock markets continued an upward trajectory. Synchronous economic expansion worldwide continued with mild inflation and low volatility. Data released during the quarter reflected a healthy U.S. economy.
| 1 | The S&P 500 Index consists of 500 stocks chosen for market size, liquidity, and industry group representation. It is a market-value-weighted index with each stock’s weight in the index proportionate to its market value. You cannot invest directly in an index. |
| 2 | The Morgan Stanley Capital International (MSCI) All Country World Index (ACWI) ex USA Index (Net) is a free-float-adjusted market-capitalization-weighted index that is designed to measure the equity market performance of developed markets, excluding the United States and Canada. Source: MSCI. MSCI makes no express or implied warranties or representations and shall have no liability whatsoever with respect to any MSCI data contained herein. The MSCI data may not be further redistributed or used as a basis for other indices or any securities or financial products. This report is not approved, reviewed, or produced by MSCI. You cannot invest directly in an index. |
| 3 | The Bloomberg Barclays Global Aggregate ex-USD Index is an unmanaged index that provides a broad-based measure of the global investment-grade fixed-income markets excluding the U.S.-dollar-denominated debt market. You cannot invest directly in an index. |
| 4 | The Bloomberg Barclays U.S. Aggregate Bond Index is a broad-based benchmark that measures the investment-grade, U.S. dollar-denominated, fixed-rate taxable bond market, including Treasuries, government-related and corporate securities, mortgage-backed securities (agency fixed-rate and hybrid adjustable-rate mortgage pass-throughs), asset-backed securities, and commercial mortgage-backed securities. You cannot invest directly in an index. |
| 5 | The Bloomberg Barclays Municipal Bond Index is an unmanaged index composed of long-term tax-exempt bonds with a minimum credit rating of Baa. You cannot invest directly in an index. |
| | | | | | |
| Letter to shareholders (unaudited) | | Wells Fargo Low Volatility U.S. Equity Fund | | | 3 | |
Third-quarter economic output grew at a 3.2% annual rate. Increased hiring pushed the unemployment rate down to a 17-year low of 4.1%. Tax reform in the U.S. that passed as the year ended also encouraged increased spending among businesses and individuals. Signs of long-awaited wage growth appeared to emerge.
Outside the U.S., economies continued to strengthen. In December, the Organisation for Economic Co-operation and Development (OECD) reported that the global economy has been expanding at its fastest rate since 2010; all 35 countries the OECD follows were on track to expand for 2017. International economies have benefited from catalysts such as economic stimulus, improving employment, increased investment, accelerated trade growth, and the firming of prices for some of the commodities that are essential exports of many international economies.
October 2017 marked one year since regulatory reform of money market investing in the U.S. By December 2017, money market fund asset levels exceeded their December 2016 levels, reflecting continued investor demand for the short-term investment opportunities afforded them by money market funds.
In December 2017, the Fed raised the federal funds rate target to a range of 1.25% to 1.50%. The Fed also began reducing its bond portfolio. Long-term interest rates in the U.S. trended higher as the yield curve steepened—the 10-year Treasury rate moved from 2.46% to 2.84% and the 30-year rate moved from 2.81% to 3.08% during January 2018.
Don’t let short-term uncertainty derail long-term investment goals.
Periods of investment uncertainty can present challenges, but experience has taught us that maintaining long-term investment goals can be an effective way to plan for the future. To help you create a sound strategy based on your personal goals and risk tolerance, Wells Fargo Funds offers more than 100 mutual funds spanning a wide range of asset classes and investment styles. Although diversification cannot guarantee an investment profit or prevent losses, we believe it can be an effective way to manage investment risk and potentially smooth out overall portfolio performance. We encourage investors to know their investments and to understand that appropriate levels of risk-taking may unlock opportunities.
Thank you for choosing to invest with Wells Fargo Funds. We appreciate your confidence in us and remain committed to helping you meet your financial needs.
Sincerely,

Andrew Owen
President
Wells Fargo Funds
Although diversification cannot guarantee an investment profit or prevent losses, we believe it can be an effective way to manage investment risk and potentially smooth out overall portfolio performance.
For further information about your Fund, contact your investment professional, visit our website at wellsfargofunds.com, or call us directly at 1-800-222-8222.
| | | | |
| 4 | | Wells Fargo Low Volatility U.S. Equity Fund | | Performance highlights (unaudited) |
Investment objective
The Fund seeks long-term capital appreciation.
Manager
Wells Fargo Funds Management, LLC
Subadviser
Analytic Investors, LLC
Portfolio managers
Dennis Bein, CFA®
Ryan Brown, CFA®
Harindra de Silva, Ph.D., CFA®
Average annual total returns (%) as of January 31, 2018
| | | | | | | | | | | | | | | | | | | | | | | | | | |
| | | | | Including sales charge | | | Excluding sales charge | | | Expense ratios1 (%) | |
| | | | | 1 year | | | Since inception | | | 1 year | | | Since
inception | | | Gross | | | Net2 | |
| Class A (WLVLX) | | 10-31-2016 | | | 7.25 | | | | 10.60 | | | | 13.77 | | | | 15.96 | | | | 1.64 | | | | 0.83 | |
| Class C (WLVKX) | | 10-31-2016 | | | 12.03 | | | | 15.09 | | | | 13.03 | | | | 15.09 | | | | 2.39 | | | | 1.58 | |
| Class R6 (WLVJX) | | 10-31-2016 | | | – | | | | – | | | | 14.39 | | | | 16.47 | | | | 1.21 | | | | 0.40 | |
| Administrator Class (WLVDX) | | 10-31-2016 | | | – | | | | – | | | | 13.92 | | | | 16.03 | | | | 1.56 | | | | 0.75 | |
| Institutional Class (WLVOX) | | 10-31-2016 | | | – | | | | – | | | | 14.22 | | | | 16.32 | | | | 1.31 | | | | 0.50 | |
| Russell 1000® Index3 | | – | | | – | | | | – | | | | 25.84 | | | | 27.79 | | | | – | | | | – | |
Figures quoted represent past performance, which is no guarantee of future results, and do not reflect taxes that a shareholder may pay on fund distributions or the redemption of fund shares. Investment return and principal value of an investment will fluctuate so that an investor’s shares, when redeemed, may be worth more or less than their original cost. Performance shown without sales charges would be lower if sales charges were reflected. Current performance may be lower or higher than the performance data quoted, which assumes the reinvestment of dividends and capital gains. Current month-end performance is available on the Fund’s website, wellsfargofunds.com.
Index returns do not include transaction costs associated with buying and selling securities, any mutual fund fees or expenses, or any taxes. It is not possible to invest directly in an index.
For Class A shares, the maximum front-end sales charge is 5.75%. For Class C shares, the maximum contingent deferred sales charge is 1.00%. Performance including a contingent deferred sales charge assumes the sales charge for the corresponding time period. Class R6, Administrator Class, and Institutional Class shares are sold without a front-end sales charge or contingent deferred sales charge.
Stock values fluctuate in response to the activities of individual companies and general market and economic conditions. Certain investment strategies tend to increase the total risk of an investment (relative to the broader market). The Fund is exposed to smaller-company securities risk. Consult the fund’s prospectus for additional information on these and other risks.
Please see footnotes on page 5.
| | | | | | |
| Performance highlights (unaudited) | | Wells Fargo Low Volatility U.S. Equity Fund | | | 5 | |
| | | | |
| Ten largest holdings (%) as of January 31, 20184 | |
CBOE Holdings Incorporated | | | 2.68 | |
Baxter International Incorporated | | | 2.60 | |
PepsiCo Incorporated | | | 2.52 | |
Waste Management Incorporated | | | 2.49 | |
McDonald’s Corporation | | | 2.42 | |
Altria Group Incorporated | | | 2.42 | |
The Progressive Corporation | | | 2.41 | |
Costco Wholesale Corporation | | | 2.39 | |
The Procter & Gamble Company | | | 2.35 | |
PPL Corporation | | | 2.28 | |
|
| Sector distribution as of January 31, 20185 |
|
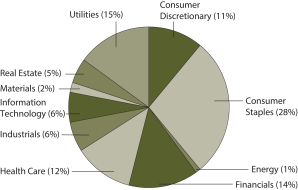
|
| 1 | Reflects the expense ratios as stated in the most recent prospectuses. The expense ratios shown are subject to change and may differ from the annualized expense ratios shown in the financial highlights of this report. |
| 2 | The manager has contractually committed through November 30, 2018, to waive fees and/or reimburse expenses to the extent necessary to cap the Fund’s Total Annual Fund Operating Expenses After Fee Waivers at the amounts shown. After this time, the cap may be increased or the commitment to maintain the cap may be terminated only with the approval of the Board of Trustees. Brokerage commissions, stamp duty fees, interest, taxes, acquired fund fees and expenses, and extraordinary expenses are excluded from the expense cap. Without this cap, the Fund’s returns would have been lower. The expense ratio paid by an investor is the net expense ratio or the Fund’s Total Annual Fund Operating Expenses After Fee Waivers, as stated in the prospectuses. |
| 3 | The Russell 1000® Index measures the performance of the 1,000 largest companies in the Russell 3000® Index, which represents approximately 92% of the total market capitalization of the Russell 3000® Index. You cannot invest directly in an index. |
| 4 | The ten largest holdings, excluding cash and cash equivalents, are calculated based on the value of the investments divided by total net assets of the Fund. Holdings are subject to change and may have changed since the date specified. |
| 5 | Amounts are calculated based on the total long-term investments of the Fund. These amounts are subject to change and may have changed since the date specified. |
| | | | |
| 6 | | Wells Fargo Low Volatility U.S. Equity Fund | | Fund expenses (unaudited) |
As a shareholder of the Fund, you incur two types of costs: (1) transaction costs, including sales charges (loads) on purchase payments and contingent deferred sales charges (if any) on redemptions and (2) ongoing costs, including management fees, distribution (12b-1) and/or shareholder servicing fees, and other Fund expenses. This example is intended to help you understand your ongoing costs (in dollars) of investing in the Fund and to compare these costs with the ongoing costs of investing in other mutual funds.
The example is based on an investment of $1,000 invested at the beginning of the six-month period and held for the entire period from August 1, 2017 to January 31, 2018.
Actual expenses
The “Actual” line of the table below provides information about actual account values and actual expenses. You may use the information in this line, together with the amount you invested, to estimate the expenses that you paid over the period. Simply divide your account value by $1,000 (for example, an $8,600 account value divided by $1,000 = 8.6), then multiply the result by the number in the “Actual” line under the heading entitled “Expenses paid during period” for your applicable class of shares to estimate the expenses you paid on your account during this period.
Hypothetical example for comparison purposes
The “Hypothetical” line of the table below provides information about hypothetical account values and hypothetical expenses based on the Fund’s actual expense ratio and an assumed rate of return of 5% per year before expenses, which is not the Fund’s actual return. The hypothetical account values and expenses may not be used to estimate the actual ending account balance or expenses you paid for the period. You may use this information to compare the ongoing costs of investing in the Fund and other funds. To do so, compare this 5% hypothetical example with the 5% hypothetical examples that appear in the shareholder reports of the other funds.
Please note that the expenses shown in the table are meant to highlight your ongoing costs only and do not reflect any transactional costs, such as sales charges (loads) and contingent deferred sales charges. Therefore, the “Hypothetical” line of the table is useful in comparing ongoing costs only and will not help you determine the relative total costs of owning different funds. In addition, if these transactional costs were included, your costs would have been higher.
| | | | | | | | | | | | | | | | |
| | | Beginning
account value
8-1-2017 | | | Ending
account value
1-31-2018 | | | Expenses
paid during
the period¹ | | | Annualized net
expense ratio | |
Class A | | | | | | | | | | | | | | | | |
Actual | | $ | 1,000.00 | | | $ | 1,069.66 | | | $ | 4.33 | | | | 0.83 | % |
Hypothetical (5% return before expenses) | | $ | 1,000.00 | | | $ | 1,021.02 | | | $ | 4.23 | | | | 0.83 | % |
Class C | | | | | | | | | | | | | | | | |
Actual | | $ | 1,000.00 | | | $ | 1,065.47 | | | $ | 8.23 | | | | 1.58 | % |
Hypothetical (5% return before expenses) | | $ | 1,000.00 | | | $ | 1,017.24 | | | $ | 8.03 | | | | 1.58 | % |
Class R6 | | | | | | | | | | | | | | | | |
Actual | | $ | 1,000.00 | | | $ | 1,071.64 | | | $ | 2.09 | | | | 0.40 | % |
Hypothetical (5% return before expenses) | | $ | 1,000.00 | | | $ | 1,023.19 | | | $ | 2.04 | | | | 0.40 | % |
Administrator Class | | | | | | | | | | | | | | | | |
Actual | | $ | 1,000.00 | | | $ | 1,070.06 | | | $ | 3.91 | | | | 0.75 | % |
Hypothetical (5% return before expenses) | | $ | 1,000.00 | | | $ | 1,021.42 | | | $ | 3.82 | | | | 0.75 | % |
Institutional Class | | | | | | | | | | | | | | | | |
Actual | | $ | 1,000.00 | | | $ | 1,071.02 | | | $ | 2.61 | | | | 0.50 | % |
Hypothetical (5% return before expenses) | | $ | 1,000.00 | | | $ | 1,022.68 | | | $ | 2.55 | | | | 0.50 | % |
| 1 | Expenses paid is equal to the annualized net expense ratio of each class multiplied by the average account value over the period, multiplied by the number of days in the most recent fiscal half-year divided by the number of days in the fiscal year (to reflect the one-half-year period). |
| | | | | | |
| Portfolio of investments—January 31, 2018 (unaudited) | | Wells Fargo Low Volatility U.S. Equity Fund | | | 7 | |
| | | | | | | | | | | | | | | | |
| Security name | | | | | | | | Shares | | | Value | |
| | | | |
Common Stocks: 97.67% | | | | | | | | | | | | | | | | |
| | | | |
Consumer Discretionary: 10.85% | | | | | | | | | | | | | | | | |
| | | | |
| Auto Components: 0.58% | | | | | | | | | | | | | | | | |
Lear Corporation | | | | | | | | | | | 529 | | | $ | 102,171 | |
Visteon Corporation † | | | | | | | | | | | 984 | | | | 127,999 | |
| | | | |
| | | | | | | | | | | | | | | 230,170 | |
| | | | | | | | | | | | | | | | |
| | | | |
| Diversified Consumer Services: 0.83% | | | | | | | | | | | | | | | | |
H&R Block Incorporated | | | | | | | | | | | 12,584 | | | | 333,979 | |
| | | | | | | | | | | | | | | | |
| | | | |
| Hotels, Restaurants & Leisure: 5.48% | | | | | | | | | | | | | | | | |
Aramark | | | | | | | | | | | 6,811 | | | | 312,012 | |
Darden Restaurants Incorporated | | | | | | | | | | | 5,270 | | | | 505,130 | |
Hilton Grand Vacations Incorporated † | | | | | | | | | | | 5,295 | | | | 238,116 | |
McDonald’s Corporation | | | | | | | | | | | 5,654 | | | | 967,626 | |
Yum China Holdings Incorporated | | | | | | | | | | | 3,668 | | | | 170,159 | |
| | | | |
| | | | | | | | | | | | | | | 2,193,043 | |
| | | | | | | | | | | | | | | | |
| | | | |
| Household Durables: 1.00% | | | | | | | | | | | | | | | | |
NVR Incorporated † | | | | | | | | | | | 126 | | | | 400,449 | |
| | | | | | | | | | | | | | | | |
| | | | |
| Media: 1.83% | | | | | | | | | | | | | | | | |
Lions Gate Entertainment Class B † | | | | | | | | | | | 2,648 | | | | 84,736 | |
Live Nation Incorporated † | | | | | | | | | | | 12,027 | | | | 541,937 | |
The Walt Disney Company | | | | | | | | | | | 955 | | | | 103,780 | |
| | | | |
| | | | | | | | | | | | | | | 730,453 | |
| | | | | | | | | | | | | | | | |
| | | | |
| Specialty Retail: 1.07% | | | | | | | | | | | | | | | | |
Best Buy Company Incorporated | | | | | | | | | | | 1,091 | | | | 79,708 | |
ULTA Beauty Incorporated † | | | | | | | | | | | 1,564 | | | | 347,364 | |
| | | | |
| | | | | | | | | | | | | | | 427,072 | |
| | | | | | | | | | | | | | | | |
| | | | |
| Textiles, Apparel & Luxury Goods: 0.06% | | | | | | | | | | | | | | | | |
Michael Kors Holdings Limited † | | | | | | | | | | | 14 | | | | 924 | |
PVH Corporation | | | | | | | | | | | 147 | | | | 22,797 | |
| | | | |
| | | | | | | | | | | | | | | 23,721 | |
| | | | | | | | | | | | | | | | |
| | | | |
Consumer Staples: 27.24% | | | | | | | | | | | | | | | | |
| | | | |
| Beverages: 5.93% | | | | | | | | | | | | | | | | |
Dr Pepper Snapple Group Incorporated | | | | | | | | | | | 6,787 | | | | 810,028 | |
Monster Beverage Corporation † | | | | | | | | | | | 5,141 | | | | 350,770 | |
PepsiCo Incorporated | | | | | | | | | | | 8,362 | | | | 1,005,949 | |
The Coca-Cola Company | | | | | | | | | | | 4,347 | | | | 206,874 | |
| | | | |
| | | | | | | | | | | | | | | 2,373,621 | |
| | | | | | | | | | | | | | | | |
| | | | |
| Food & Staples Retailing: 6.28% | | | | | | | | | | | | | | | | |
Costco Wholesale Corporation | | | | | | | | | | | 4,903 | | | | 955,448 | |
Sysco Corporation | | | | | | | | | | | 11,308 | | | | 710,934 | |
The accompanying notes are an integral part of these financial statements.
| | | | |
| 8 | | Wells Fargo Low Volatility U.S. Equity Fund | | Portfolio of investments—January 31, 2018 (unaudited) |
| | | | | | | | | | | | | | | | |
| Security name | | | | | | | | Shares | | | Value | |
| | | | |
| Food & Staples Retailing (continued) | | | | | | | | | | | | | | | | |
US Foods Holding Corporation † | | | | | | | | | | | 22,101 | | | $ | 710,105 | |
Wal-Mart Stores Incorporated | | | | | | | | | | | 1,250 | | | | 133,250 | |
| | | | |
| | | | | | | | | | | | | | | 2,509,737 | |
| | | | | | | | | | | | | | | | |
| | | | |
| Food Products: 4.35% | | | | | | | | | | | | | | | | |
Blue Buffalo Pet Products Incorporated † | | | | | | | | | | | 1,218 | | | | 41,388 | |
Bunge Limited | | | | | | | | | | | 4,481 | | | | 355,926 | |
Flowers Foods Incorporated | | | | | | | | | | | 11,878 | | | | 232,928 | |
Lamb Weston Holdings Incorporated | | | | | | | | | | | 6,495 | | | | 380,607 | |
Pilgrim’s Pride Corporation † | | | | | | | | | | | 197 | | | | 5,471 | |
The Hershey Company | | | | | | | | | | | 313 | | | | 34,533 | |
Tyson Foods Incorporated Class A | | | | | | | | | | | 9,047 | | | | 688,567 | |
| | | | |
| | | | | | | | | | | | | | | 1,739,420 | |
| | | | | | | | | | | | | | | | |
| | | | |
| Household Products: 6.15% | | | | | | | | | | | | | | | | |
Colgate-Palmolive Company | | | | | | | | | | | 7,821 | | | | 580,631 | |
Kimberly-Clark Corporation | | | | | | | | | | | 6,401 | | | | 748,917 | |
The Clorox Company | | | | | | | | | | | 1,354 | | | | 191,848 | |
The Procter & Gamble Company | | | | | | | | | | | 10,875 | | | | 938,948 | |
| | | | |
| | | | | | | | | | | | | | | 2,460,344 | |
| | | | | | | | | | | | | | | | |
| | | | |
| Tobacco: 4.53% | | | | | | | | | | | | | | | | |
Altria Group Incorporated | | | | | | | | | | | 13,744 | | | | 966,753 | |
Philip Morris International | | | | | | | | | | | 7,870 | | | | 843,900 | |
| | | | |
| | | | | | | | | | | | | | | 1,810,653 | |
| | | | | | | | | | | | | | | | |
| | | | |
Energy: 1.09% | | | | | | | | | | | | | | | | |
| | | | |
| Energy Equipment & Services: 0.28% | | | | | | | | | | | | | | | | |
Baker Hughes Incorporated | | | | | | | | | | | 3,549 | | | | 114,100 | |
| | | | | | | | | | | | | | | | |
| | | | |
| Oil, Gas & Consumable Fuels: 0.81% | | | | | | | | | | | | | | | | |
Antero Resources Corporation † | | | | | | | | | | | 5,014 | | | | 97,422 | |
Exxon Mobil Corporation | | | | | | | | | | | 2,589 | | | | 226,020 | |
| | | | |
| | | | | | | | | | | | | | | 323,442 | |
| | | | | | | | | | | | | | | | |
| | | | |
Financials: 13.62% | | | | | | | | | | | | | | | | |
| | | | |
| Banks: 0.73% | | | | | | | | | | | | | | | | |
US Bancorp | | | | | | | | | | | 5,095 | | | | 291,128 | |
| | | | | | | | | | | | | | | | |
| | | | |
| Capital Markets: 5.09% | | | | | | | | | | | | | | | | |
CBOE Holdings Incorporated | | | | | | | | | | | 7,969 | | | | 1,070,954 | |
CME Group Incorporated | | | | | | | | | | | 3,719 | | | | 570,792 | |
Intercontinental Exchange Incorporated | | | | | | | | | | | 4,127 | | | | 304,738 | |
LPL Financial Holdings Incorporated | | | | | | | | | | | 1,479 | | | | 88,237 | |
| | | | |
| | | | | | | | | | | | | | | 2,034,721 | |
| | | | | | | | | | | | | | | | |
The accompanying notes are an integral part of these financial statements.
| | | | | | |
| Portfolio of investments—January 31, 2018 (unaudited) | | Wells Fargo Low Volatility U.S. Equity Fund | | | 9 | |
| | | | | | | | | | | | | | | | |
| Security name | | | | | | | | Shares | | | Value | |
| | | | |
| Insurance: 6.34% | | | | | | | | | | | | | | | | |
American Financial Group Incorporated | | | | | | | | | | | 6,364 | | | $ | 721,296 | |
American National Insurance Company | | | | | | | | | | | 202 | | | | 25,531 | |
Aon plc | | | | | | | | | | | 1,358 | | | | 193,067 | |
Assurant Incorporated | | | | | | | | | | | 544 | | | | 49,765 | |
Everest Reinsurance Group Limited | | | | | | | | | | | 1,659 | | | | 381,238 | |
FNF Group | | | | | | | | | | | 2,069 | | | | 80,650 | |
ProAssurance Corporation | | | | | | | | | | | 324 | | | | 17,723 | |
The Progressive Corporation | | | | | | | | | | | 17,794 | | | | 962,655 | |
Unum Group | | | | | | | | | | | 1,936 | | | | 102,976 | |
| | | | |
| | | | | | | | | | | | | | | 2,534,901 | |
| | | | | | | | | | | | | | | | |
| | | | |
| Mortgage REITs: 1.46% | | | | | | | | | | | | | | | | |
Chimera Investment Corporation | | | | | | | | | | | 16,726 | | | | 284,175 | |
MFA Financial Incorporated | | | | | | | | | | | 42,071 | | | | 301,228 | |
| | | | |
| | | | | | | | | | | | | | | 585,403 | |
| | | | | | | | | | | | | | | | |
| | | | |
Health Care: 11.73% | | | | | | | | | | | | | | | | |
| | | | |
| Health Care Equipment & Supplies: 3.93% | | | | | | | | | | | | | | | | |
Baxter International Incorporated | | | | | | | | | | | 14,424 | | | | 1,038,961 | |
IDEXX Laboratories Incorporated † | | | | | | | | | | | 2,856 | | | | 534,186 | |
| | | | |
| | | | | | | | | | | | | | | 1,573,147 | |
| | | | | | | | | | | | | | | | |
| | | | |
| Health Care Providers & Services: 3.42% | | | | | | | | | | | | | | | | |
AmerisourceBergen Corporation | | | | | | | | | | | 4,041 | | | | 402,766 | |
Cigna Corporation | | | | | | | | | | | 228 | | | | 47,504 | |
Humana Incorporated | | | | | | | | | | | 3,067 | | | | 864,373 | |
Laboratory Corporation of America Holdings † | | | | | | | | | | | 295 | | | | 51,478 | |
| | | | |
| | | | | | | | | | | | | | | 1,366,121 | |
| | | | | | | | | | | | | | | | |
| | | | |
| Life Sciences Tools & Services: 0.76% | | | | | | | | | | | | | | | | |
Bio-Rad Laboratories Incorporated Class A † | | | | | | | | | | | 1,167 | | | | 301,705 | |
| | | | | | | | | | | | | | | | |
| | | | |
| Pharmaceuticals: 3.62% | | | | | | | | | | | | | | | | |
Eli Lilly & Company | | | | | | | | | | | 470 | | | | 38,282 | |
Johnson & Johnson | | | | | | | | | | | 1,166 | | | | 161,130 | |
Merck & Company Incorporated | | | | | | | | | | | 14,980 | | | | 887,565 | |
Mylan NV † | | | | | | | | | | | 8,445 | | | | 361,864 | |
| | | | |
| | | | | | | | | | | | | | | 1,448,841 | |
| | | | | | | | | | | | | | | | |
| | | | |
Industrials: 5.70% | | | | | | | | | | | | | | | | |
| | | | |
| Aerospace & Defense: 0.69% | | | | | | | | | | | | | | | | |
Lockheed Martin Corporation | | | | | | | | | | | 495 | | | | 175,651 | |
The Boeing Company | | | | | | | | | | | 282 | | | | 99,932 | |
| | | | |
| | | | | | | | | | | | | | | 275,583 | |
| | | | | | | | | | | | | | | | |
| | | | |
| Air Freight & Logistics: 1.12% | | | | | | | | | | | | | | | | |
Expeditors International of Washington Incorporated | | | | | | | | | | | 6,883 | | | | 447,051 | |
| | | | | | | | | | | | | | | | |
The accompanying notes are an integral part of these financial statements.
| | | | |
| 10 | | Wells Fargo Low Volatility U.S. Equity Fund | | Portfolio of investments—January 31, 2018 (unaudited) |
| | | | | | | | | | | | | | | | |
| Security name | | | | | | | | Shares | | | Value | |
| | | | |
| Airlines: 0.33% | | | | | | | | | | | | | | | | |
Southwest Airlines Company | | | | | | | | | | | 2,168 | | | $ | 131,814 | |
| | | | | | | | | | | | | | | | |
| | | | |
| Commercial Services & Supplies: 3.44% | | | | | | | | | | | | | | | | |
Republic Services Incorporated | | | | | | | | | | | 5,506 | | | | 378,813 | |
Waste Management Incorporated | | | | | | | | | | | 11,272 | | | | 996,783 | |
| | | | |
| | | | | | | | | | | | | | | 1,375,596 | |
| | | | | | | | | | | | | | | | |
| | | | |
| Machinery: 0.12% | | | | | | | | | | | | | | | | |
Fortive Corporation | | | | | | | | | | | 618 | | | | 46,980 | |
| | | | | | | | | | | | | | | | |
| | | | |
Information Technology: 5.52% | | | | | | | | | | | | | | | | |
| | | | |
| Internet Software & Services: 0.60% | | | | | | | | | | | | | | | | |
IAC Corporation † | | | | | | | | | | | 1,650 | | | | 239,201 | |
| | | | | | | | | | | | | | | | |
| | | | |
| IT Services: 3.39% | | | | | | | | | | | | | | | | |
Amdocs Limited | | | | | | | | | | | 10,291 | | | | 703,904 | |
Black Knight Incorporated † | | | | | | | | | | | 1,882 | | | | 93,159 | |
Booz Allen Hamilton Holding Corporation | | | | | | | | | | | 6,302 | | | | 246,912 | |
PayPal Holdings Incorporated † | | | | | | | | | | | 3,638 | | | | 310,394 | |
| | | | |
| | | | | | | | | | | | | | | 1,354,369 | |
| | | | | | | | | | | | | | | | |
| | | | |
| Software: 1.53% | | | | | | | | | | | | | | | | |
Atlassian Corporation plc Class A † | | | | | | | | | | | 2,944 | | | | 158,947 | |
Cadence Design Systems Incorporated † | | | | | | | | | | | 803 | | | | 36,023 | |
Dell Technologies Incorporated Class V † | | | | | | | | | | | 4,870 | | | | 349,179 | |
Synopsys Incorporated † | | | | | | | | | | | 150 | | | | 13,892 | |
Take-Two Interactive Software Incorporated † | | | | | | | | | | | 435 | | | | 55,101 | |
| | | | |
| | | | | | | | | | | | | | | 613,142 | |
| | | | | | | | | | | | | | | | |
| | | | |
Materials: 1.88% | | | | | | | | | | | | | | | | |
| | | | |
| Chemicals: 1.27% | | | | | | | | | | | | | | | | |
LyondellBasell Industries NV Class A | | | | | | | | | | | 4,232 | | | | 507,163 | |
| | | | | | | | | | | | | | | | |
| | | | |
| Containers & Packaging: 0.61% | | | | | | | | | | | | | | | | |
Avery Dennison Corporation | | | | | | | | | | | 791 | | | | 97,040 | |
Berry Global Group Incorporated † | | | | | | | | | | | 2,460 | | | | 145,607 | |
| | | | |
| | | | | | | | | | | | | | | 242,647 | |
| | | | | | | | | | | | | | | | |
| | | | |
Real Estate: 4.84% | | | | | | | | | | | | | | | | |
| | | | |
| Equity REITs: 4.84% | | | | | | | | | | | | | | | | |
Apple Hospitality REIT Incorporated | | | | | | | | | | | 11,685 | | | | 227,741 | |
Columbia Property Trust Incorporated | | | | | | | | | | | 3,886 | | | | 85,065 | |
Equity Commonwealth † | | | | | | | | | | | 11,457 | | | | 342,679 | |
Park Hotels & Resorts Incorporated | | | | | | | | | | | 9,518 | | | | 275,165 | |
Prologis Incorporated | | | | | | | | | | | 4,827 | | | | 314,286 | |
Rayonier Incorporated | | | | | | | | | | | 4,172 | | | | 135,423 | |
SBA Communications Corporation † | | | | | | | | | | | 3,184 | | | | 555,608 | |
| | | | |
| | | | | | | | | | | | | | | 1,935,967 | |
| | | | | | | | | | | | | | | | |
The accompanying notes are an integral part of these financial statements.
| | | | | | |
| Portfolio of investments—January 31, 2018 (unaudited) | | Wells Fargo Low Volatility U.S. Equity Fund | | | 11 | |
| | | | | | | | | | | | | | | | |
| Security name | | | | | | | | Shares | | | Value | |
| | | | |
Telecommunication Services: 0.31% | | | | | | | | | | | | | | | | |
| | | | |
| Diversified Telecommunication Services: 0.31% | | | | | | | | | | | | | | | | |
Verizon Communications Incorporated | | | | | | | | | | | 2,258 | | | $ | 122,090 | |
| | | | | | | | | | | | | | | | |
| | | | |
Utilities: 14.89% | | | | | | | | | | | | | | | | |
| | | | |
| Electric Utilities: 12.51% | | | | | | | | | | | | | | | | |
American Electric Power Company Incorporated | | | | | | | | | | | 12,800 | | | | 880,384 | |
Edison International | | | | | | | | | | | 1,622 | | | | 101,424 | |
Eversource Energy | | | | | | | | | | | 2,066 | | | | 130,344 | |
Exelon Corporation | | | | | | | | | | | 23,286 | | | | 896,744 | |
Hawaiian Electric Industries Incorporated | | | | | | | | | | | 23,066 | | | | 786,781 | |
NextEra Energy Incorporated | | | | | | | | | | | 2,389 | | | | 378,465 | |
PG&E Corporation | | | | | | | | | | | 10,280 | | | | 436,180 | |
Pinnacle West Capital Corporation | | | | | | | | | | | 3,661 | | | | 292,697 | |
PPL Corporation | | | | | | | | | | | 28,598 | | | | 911,418 | |
Xcel Energy Incorporated | | | | | | | | | | | 4,132 | | | | 188,584 | |
| | | | |
| | | | | | | | | | | | | | | 5,003,021 | |
| | | | | | | | | | | | | | | | |
| | | | |
| Gas Utilities: 0.69% | | | | | | | | | | | | | | | | |
UGI Corporation | | | | | | | | | | | 6,035 | | | | 276,222 | |
| | | | | | | | | | | | | | | | |
| | | | |
| Independent Power & Renewable Electricity Producers: 0.80% | | | | | | | | | | | | | | | | |
Vistra Energy Corporation † | | | | | | | | | | | 16,421 | | | | 320,210 | |
| | | | | | | | | | | | | | | | |
| | | | |
| Multi-Utilities: 0.89% | | | | | | | | | | | | | | | | |
CenterPoint Energy Incorporated | | | | | | | | | | | 1,170 | | | | 32,971 | |
CMS Energy Corporation | | | | | | | | | | | 7,178 | | | | 321,216 | |
| | | | |
| | | | | | | | | | | | | | | 354,187 | |
| | | | | | | | | | | | | | | | |
| | | | |
Total Common Stocks (Cost $35,256,844) | | | | | | | | | | | | | | | 39,051,414 | |
| | | | | | | | | | | | | | | | |
| | | | |
| | | Yield | | | | | | | | | | |
| Short-Term Investments: 1.96% | | | | | | | | | | | | | | | | |
| | | | |
| Investment Companies: 1.96% | | | | | | | | | | | | | | | | |
Wells Fargo Government Money Market Fund Select Class (l)(u) | | | 1.24 | % | | | | | | | 784,544 | | | | 784,544 | |
| | | | | | | | | | | | | | | | |
| | | | |
Total Short-Term Investments (Cost $784,544) | | | | | | | | | | | | | | | 784,544 | |
| | | | | | | | | | | | | | | | |
| | | | | | | | |
| Total investments in securities (Cost $36,041,388) | | | 99.63 | % | | | 39,835,958 | |
Other assets and liabilities, net | | | 0.37 | | | | 149,656 | |
| | | | | | | | |
| Total net assets | | | 100.00 | % | | $ | 39,985,614 | |
| | | | | | | | |
| † | Non-income-earning security |
| (l) | The issuer of the security is an affiliated person of the Fund as defined in the Investment Company Act of 1940. |
| (u) | The rate represents the 7-day annualized yield at period end. |
The accompanying notes are an integral part of these financial statements.
| | | | |
| 12 | | Wells Fargo Low Volatility U.S. Equity Fund | | Portfolio of investments—January 31, 2018 (unaudited) |
Investments in Affiliates
An affiliated investment is an investment in which the Fund owns at least 5% of the outstanding voting shares of the issuer or as a result of other relationships, such as the Fund and the issuer having the same investment manager. Transactions with issuers that were either affiliated persons of the Fund at the beginning of the period or the end of the period were as follows:
| | | | | | | | | | | | | | | | | | | | | | | | | | | | | | | | | | | | |
| | | Shares,
beginning of
period | | | Shares
purchased | | | Shares
sold | | | Shares,
end of
period | | | Net
realized
gains
(losses) | | | Net
change in
unrealized
gains
(losses) | | | Income
from
affiliated
securities | | | Value,
end
of period | | | % of
net
assets | |
Short-Term Investments | | | | | | | | | | | | | | | | | | | | | | | | | | | | | | | | | | | | |
Investment Companies | | | | | | | | | | | | | | | | | | | | | | | | | | | | | | | | | | | | |
Wells Fargo Government Money Market Fund Select Class | | | 1,095,727 | | | | 5,285,807 | | | | 5,596,990 | | | | 784,544 | | | $ | 0 | | | $ | 0 | | | $ | 5,123 | | | $ | 784,544 | | | | 1.96 | % |
The accompanying notes are an integral part of these financial statements.
| | | | | | |
| Statement of assets and liabilities—January 31, 2018 (unaudited) | | Wells Fargo Low Volatility U.S. Equity Fund | | | 13 | |
| | | | |
| | | | |
| |
Assets | | | | |
Investments in unaffiliated securities, at value (cost $35,256,844) | | $ | 39,051,414 | |
Investments in affiliated securities, at value (cost $784,544) | | | 784,544 | |
Receivable for investments sold | | | 375,847 | |
Receivable for Fund shares sold | | | 8,799 | |
Receivable for dividends | | | 20,998 | |
Receivable from manager | | | 8,298 | |
Prepaid expenses and other assets | | | 149,244 | |
| | | | |
Total assets | | | 40,399,144 | |
| | | | |
| |
Liabilities | | | | |
Payable for investments purchased | | | 340,420 | |
Shareholder report expenses payable | | | 35,016 | |
Professional fees payable | | | 24,469 | |
Administration fees payable | | | 4,400 | |
Trustees’ fees and expenses payable | | | 1,681 | |
Distribution fees payable | | | 75 | |
Accrued expenses and other liabilities | | | 7,469 | |
| | | | |
Total liabilities | | | 413,530 | |
| | | | |
Total net assets | | $ | 39,985,614 | |
| | | | |
| |
NET ASSETS CONSIST OF | | | | |
Paid-in capital | | $ | 35,326,221 | |
Undistributed net investment income | | | 5,918 | |
Accumulated net realized gains on investments | | | 858,905 | |
Net unrealized gains on investments | | | 3,794,570 | |
| | | | |
Total net assets | | $ | 39,985,614 | |
| | | | |
| |
COMPUTATION OF NET ASSET VALUE AND OFFERING PRICE PER SHARE | | | | |
Net assets – Class A | | $ | 1,360,019 | |
Shares outstanding – Class A1 | | | 116,934 | |
Net asset value per share – Class A | | | $11.63 | |
Maximum offering price per share – Class A2 | | | $12.34 | |
Net assets – Class C | | $ | 119,006 | |
Shares outstanding – Class C1 | | | 10,251 | |
Net asset value per share – Class C | | | $11.61 | |
Net assets – Class R6 | | $ | 1,168,342 | |
Shares outstanding – Class R61 | | | 100,480 | |
Net asset value per share – Class R6 | | | $11.63 | |
Net assets – Administrator Class | | $ | 116,706 | |
Shares outstanding – Administrator Class1 | | | 10,042 | |
Net asset value per share – Administrator Class | | | $11.62 | |
Net assets – Institutional Class | | $ | 37,221,541 | |
Shares outstanding – Institutional Class1 | | | 3,199,877 | |
Net asset value per share – Institutional Class | | | $11.63 | |
| 1 | The Fund has an unlimited number of authorized shares. |
| 2 | Maximum offering price is computed as 100/94.25 of net asset value. On investments of $50,000 or more, the offering price is reduced. |
The accompanying notes are an integral part of these financial statements.
| | | | |
| 14 | | Wells Fargo Low Volatility U.S. Equity Fund | | Statement of operations—six months ended January 31, 2018 (unaudited) |
| | | | |
| | | | |
| |
Investment income | | | | |
Dividends | | $ | 445,858 | |
Income from affiliated securities | | | 5,123 | |
| | | | |
Total investment income | | | 450,981 | |
| | | | |
| |
Expenses | | | | |
Management fee | | | 78,075 | |
Administration fees | | | | |
Class A | | | 1,291 | |
Class C | | | 128 | |
Class R | | | 68 | 1 |
Class R6 | | | 173 | |
Administrator Class | | | 75 | |
Institutional Class | | | 23,628 | |
Shareholder servicing fees | | | | |
Class A | | | 1,537 | |
Class C | | | 152 | |
Class R | | | 81 | 1 |
Administrator Class | | | 144 | |
Distribution fees | | | | |
Class C | | | 457 | |
Class R | | | 81 | 1 |
Custody and accounting fees | | | 6,414 | |
Professional fees | | | 26,890 | |
Registration fees | | | 44,933 | |
Shareholder report expenses | | | 35,503 | |
Trustees’ fees and expenses | | | 7,279 | |
Other fees and expenses | | | 2,560 | |
| | | | |
Total expenses | | | 229,469 | |
Less: Fee waivers and/or expense reimbursements | | | (129,435 | ) |
| | | | |
Net expenses | | | 100,034 | |
| | | | |
Net investment income | | | 350,947 | |
| | | | |
| |
REALIZED AND UNREALIZED GAINS (LOSSES) ON INVESTMENTS | | | | |
Net realized gains on investments | | | 1,061,405 | |
Net change in unrealized gains (losses) on investments | | | 1,314,391 | |
| | | | |
Net realized and unrealized gains (losses) on investments | | | 2,375,796 | |
| | | | |
Net increase in net assets resulting from operations | | $ | 2,726,743 | |
| | | | |
| 1 | For the period from August 1, 2017 to November 13, 2017. Effective at the close of business on November 13, 2017, Class R shares were liquidated and the class was subsequently closed. Class R shares are no longer offered by the Fund. |
The accompanying notes are an integral part of these financial statements.
| | | | | | |
| Statement of changes in net assets | | Wells Fargo Low Volatility U.S. Equity Fund | | | 15 | |
| | | | | | | | | | | | | | | | |
| | | Six months ended
January 31, 2018
(unaudited) | | | Year ended
July 31, 20171 | |
| | | | |
Operations | | | | | | | | | | | | | | | | |
Net investment income | | | | | | $ | 350,947 | | | | | | | $ | 486,714 | |
Net realized gains on investments | | | | | | | 1,061,405 | | | | | | | | 426,122 | |
Net change in unrealized gains (losses) on investments | | | | | | | 1,314,391 | | | | | | | | 2,480,179 | |
| | | | |
Net increase in net assets resulting from operations | | | | | | | 2,726,743 | | | | | | | | 3,393,015 | |
| | | | |
| | | | |
Distributions to shareholders from | | | | | | | | | | | | | | | | |
Net investment income | | | | | | | | | | | | | | | | |
Class A | | | | | | | (19,083 | ) | | | | | | | (1,837 | ) |
Class C | | | | | | | (941 | ) | | | | | | | (295 | ) |
Class R | | | | | | | 0 | 2 | | | | | | | (382 | ) |
Class R6 | | | | | | | (22,574 | ) | | | | | | | (5,028 | ) |
Administrator Class | | | | | | | (1,865 | ) | | | | | | | (441 | ) |
Institutional Class | | | | | | | (665,070 | ) | | | | | | | (114,483 | ) |
Net realized gains | | | | | | | | | | | | | | | | |
Class A | | | | | | | (20,121 | ) | | | | | | | 0 | |
Class C | | | | | | | (1,864 | ) | | | | | | | 0 | |
Class R6 | | | | | | | (18,434 | ) | | | | | | | 0 | |
Administrator Class | | | | | | | (1,842 | ) | | | | | | | 0 | |
Institutional Class | | | | | | | (586,361 | ) | | | | | | | 0 | |
| | | | |
Total distributions to shareholders | | | | | | | (1,338,155 | ) | | | | | | | (122,466 | ) |
| | | | |
| | | | |
Capital share transactions | | | Shares | | | | | | | | Shares | | | | | |
Proceeds from shares sold | | | | | | | | | | | | | | | | |
Class A | | | 16,136 | | | | 183,123 | | | | 114,026 | | | | 1,216,340 | |
Class C | | | 1,551 | | | | 17,372 | | | | 10,000 | | | | 100,000 | |
Class R | | | 0 | 2 | | | 0 | 2 | | | 10,000 | | | | 100,000 | |
Class R6 | | | 0 | | | | 0 | | | | 100,000 | | | | 1,000,000 | |
Administrator Class | | | 0 | | | | 0 | | | | 10,000 | | | | 100,000 | |
Institutional Class | | | 286,107 | | | | 3,216,419 | | | | 2,955,414 | | | | 30,144,185 | |
| | | | |
| | | | | | | 3,416,914 | | | | | | | | 32,660,525 | |
| | | | |
Reinvestment of distributions | | | | | | | | | | | | | | | | |
Class A | | | 3,092 | | | | 35,640 | | | | 175 | | | | 1,837 | |
Class C | | | 3 | | | | 37 | | | | 28 | | | | 295 | |
Class R | | | 0 | 2 | | | 0 | 2 | | | 37 | | | | 382 | |
Class R6 | | | 0 | | | | 0 | | | | 480 | | | | 5,028 | |
Administrator Class | | | 0 | | | | 0 | | | | 42 | | | | 441 | |
Institutional Class | | | 25,950 | | | | 299,171 | | | | 10,934 | | | | 114,483 | |
| | | | |
| | | | | | | 334,848 | | | | | | | | 122,466 | |
| | | | |
Payment for shares redeemed | | | | | | | | | | | | | | | | |
Class A | | | 0 | | | | 0 | | | | (16,495 | ) | | | (181,770 | ) |
Class C | | | (1,331 | ) | | | (15,125 | ) | | | 0 | | | | 0 | |
Class R | | | (10,037 | )2 | | | (114,115 | )2 | | | 0 | | | | 0 | |
Institutional Class | | | (65,714 | ) | | | (756,415 | ) | | | (12,814 | ) | | | (140,851 | ) |
| | | | |
| | | | | | | (885,655 | ) | | | | | | | (322,621 | ) |
| | | | |
Net increase in net assets resulting from capital share transactions | | | | | | | 2,866,107 | | | | | | | | 32,460,370 | |
| | | | |
Total increase in net assets | | | | | | | 4,254,695 | | | | | | | | 35,730,919 | |
| | | | |
| | | | |
Net assets | | | | | | | | | | | | | | | | |
Beginning of period | | | | | | | 35,730,919 | | | | | | | | 0 | |
| | | | |
End of period | | | | | | $ | 39,985,614 | | | | | | | $ | 35,730,919 | |
| | | | |
Undistributed net investment income | | | | | | $ | 5,918 | | | | | | | $ | 364,504 | |
| | | | |
| 1 | For the period from October 31, 2016 (commencement of operations) to July 31, 2017 |
| 2 | For the period from August 1, 2017 to November 13, 2017. Effective at the close of business on November 13, 2017, Class R shares were liquidated and the class was subsequently closed. Class R shares are no longer offered by the Fund. |
The accompanying notes are an integral part of these financial statements.
| | | | |
| 16 | | Wells Fargo Low Volatility U.S. Equity Fund | | Financial highlights |
(For a share outstanding throughout each period)
| | | | | | | | |
| CLASS A | | Six months ended
January 31, 2018 (unaudited) | | | Year ended July 31, 20171 | |
Net asset value, beginning of period | | | $11.21 | | | | $10.00 | |
Net investment income | | | 0.07 | | | | 0.13 | |
Net realized and unrealized gains (losses) on investments | | | 0.70 | | | | 1.12 | |
| | | | | | | | |
Total from investment operations | | | 0.77 | | | | 1.25 | |
Distributions to shareholders from | | | | | | | | |
Net investment income | | | (0.17 | ) | | | (0.04 | ) |
Net realized gains | | | (0.18 | ) | | | 0.00 | |
| | | | | | | | |
Total distributions to shareholders | | | (0.35 | ) | | | (0.04 | ) |
Net asset value, end of period | | | $11.63 | | | | $11.21 | |
Total return2 | | | 6.97 | % | | | 12.53 | % |
Ratios to average net assets (annualized) | | | | | | | | |
Gross expenses | | | 1.49 | % | | | 1.61 | % |
Net expenses | | | 0.83 | % | | | 0.82 | % |
Net investment income | | | 1.47 | % | | | 1.78 | % |
Supplemental data | | | | | | | | |
Portfolio turnover rate | | | 35 | % | | | 39 | % |
Net assets, end of period (000s omitted) | | | $1,360 | | | | $1,096 | |
| 1 | For the period from October 31, 2016 (commencement of class operations) to July 31, 2017 |
| 2 | Total return calculations do not include any sales charges. Returns for periods of less than one year are not annualized. |
The accompanying notes are an integral part of these financial statements.
| | | | | | |
| Financial highlights | | Wells Fargo Low Volatility U.S. Equity Fund | | | 17 | |
(For a share outstanding throughout each period)
| | | | | | | | |
| CLASS C | | Six months ended
January 31, 2018 (unaudited) | | | Year ended July 31, 20171 | |
Net asset value, beginning of period | | | $11.16 | | | | $10.00 | |
Net investment income | | | 0.04 | | | | 0.08 | |
Net realized and unrealized gains (losses) on investments | | | 0.68 | | | | 1.11 | |
| | | | | | | | |
Total from investment operations | | | 0.72 | | | | 1.19 | |
Distributions to shareholders from | | | | | | | | |
Net investment income | | | (0.09 | ) | | | (0.03 | ) |
Net realized gains | | | (0.18 | ) | | | 0.00 | |
| | | | | | | | |
Total distributions to shareholders | | | (0.27 | ) | | | (0.03 | ) |
Net asset value, end of period | | | $11.61 | | | | $11.16 | |
Total return2 | | | 6.55 | % | | | 11.91 | % |
Ratios to average net assets (annualized) | | | | | | | | |
Gross expenses | | | 2.25 | % | | | 2.40 | % |
Net expenses | | | 1.58 | % | | | 1.58 | % |
Net investment income | | | 0.74 | % | | | 1.01 | % |
Supplemental data | | | | | | | | |
Portfolio turnover rate | | | 35 | % | | | 39 | % |
Net assets, end of period (000s omitted) | | | $119 | | | | $112 | |
| 1 | For the period from October 31, 2016 (commencement of class operations) to July 31, 2017 |
| 2 | Total return calculations do not include any sales charges. Returns for periods of less than one year are not annualized. |
The accompanying notes are an integral part of these financial statements.
| | | | |
| 18 | | Wells Fargo Low Volatility U.S. Equity Fund | | Financial highlights |
(For a share outstanding throughout each period)
| | | | | | | | |
| CLASS R6 | | Six months ended
January 31, 2018 (unaudited) | | | Year ended July 31, 20171 | |
Net asset value, beginning of period | | | $11.24 | | | | $10.00 | |
Net investment income | | | 0.11 | | | | 0.18 | |
Net realized and unrealized gains (losses) on investments | | | 0.68 | | | | 1.11 | |
| | | | | | | | |
Total from investment operations | | | 0.79 | | | | 1.29 | |
Distributions to shareholders from | | | | | | | | |
Net investment income | | | (0.22 | ) | | | (0.05 | ) |
Net realized gains | | | (0.18 | ) | | | 0.00 | |
| | | | | | | | |
Total distributions to shareholders | | | (0.40 | ) | | | (0.05 | ) |
Net asset value, end of period | | | $11.63 | | | | $11.24 | |
Total return2 | | | 7.16 | % | | | 12.94 | % |
Ratios to average net assets (annualized) | | | | | | | | |
Gross expenses | | | 1.06 | % | | | 1.22 | % |
Net expenses | | | 0.40 | % | | | 0.40 | % |
Net investment income | | | 1.91 | % | | | 2.19 | % |
Supplemental data | | | | | | | | |
Portfolio turnover rate | | | 35 | % | | | 39 | % |
Net assets, end of period (000s omitted) | | | $1,168 | | | | $1,129 | |
| 1 | For the period from October 31, 2016 (commencement of class operations) to July 31, 2017 |
| 2 | Returns for periods of less than one year are not annualized. |
The accompanying notes are an integral part of these financial statements.
| | | | | | |
| Financial highlights | | Wells Fargo Low Volatility U.S. Equity Fund | | | 19 | |
(For a share outstanding throughout each period)
| | | | | | | | |
| ADMINISTRATOR CLASS | | Six months ended
January 31, 2018 (unaudited) | | | Year ended July 31, 20171 | |
Net asset value, beginning of period | | | $11.21 | | | | $10.00 | |
Net investment income | | | 0.09 | | | | 0.15 | |
Net realized and unrealized gains (losses) on investments | | | 0.69 | | | | 1.10 | |
| | | | | | | | |
Total from investment operations | | | 0.78 | | | | 1.25 | |
Distributions to shareholders from | | | | | | | | |
Net investment income | | | (0.19 | ) | | | (0.04 | ) |
Net realized gains | | | (0.18 | ) | | | 0.00 | |
| | | | | | | | |
Total distributions to shareholders | | | (0.37 | ) | | | (0.04 | ) |
Net asset value, end of period | | | $11.62 | | | | $11.21 | |
Total return2 | | | 7.01 | % | | | 12.57 | % |
Ratios to average net assets (annualized) | | | | | | | | |
Gross expenses | | | 1.41 | % | | | 1.57 | % |
Net expenses | | | 0.75 | % | | | 0.75 | % |
Net investment income | | | 1.56 | % | | | 1.84 | % |
Supplemental data | | | | | | | | |
Portfolio turnover rate | | | 35 | % | | | 39 | % |
Net assets, end of period (000s omitted) | | | $117 | | | | $113 | |
| 1 | For the period from October 31, 2016 (commencement of class operations) to July 31, 2017 |
| 2 | Returns for periods of less than one year are not annualized. |
The accompanying notes are an integral part of these financial statements.
| | | | |
| 20 | | Wells Fargo Low Volatility U.S. Equity Fund | | Financial highlights |
(For a share outstanding throughout each period)
| | | | | | | | |
| INSTITUTIONAL CLASS | | Six months ended
January 31, 2018 (unaudited) | | | Year ended July 31, 20171 | |
Net asset value, beginning of period | | | $11.23 | | | | $10.00 | |
Net investment income | | | 0.10 | 2 | | | 0.16 | |
Net realized and unrealized gains (losses) on investments | | | 0.69 | | | | 1.12 | |
| | | | | | | | |
Total from investment operations | | | 0.79 | | | | 1.28 | |
Distributions to shareholders from | | | | | | | | |
Net investment income | | | (0.21 | ) | | | (0.05 | ) |
Net realized gains | | | (0.18 | ) | | | 0.00 | |
| | | | | | | | |
Total distributions to shareholders | | | (0.39 | ) | | | (0.05 | ) |
Net asset value, end of period | | | $11.63 | | | | $11.23 | |
Total return3 | | | 7.10 | % | | | 12.82 | % |
Ratios to average net assets (annualized) | | | | | | | | |
Gross expenses | | | 1.16 | % | | | 1.31 | % |
Net expenses | | | 0.50 | % | | | 0.50 | % |
Net investment income | | | 1.81 | % | | | 2.09 | % |
Supplemental data | | | | | | | | |
Portfolio turnover rate | | | 35 | % | | | 39 | % |
Net assets, end of period (000s omitted) | | | $37,222 | | | | $33,169 | |
| 1 | For the period from October 31, 2016 (commencement of class operations) to July 31, 2017 |
| 2 | Calculated based upon average shares outstanding |
| 3 | Returns for periods of less than one year are not annualized. |
The accompanying notes are an integral part of these financial statements.
| | | | | | |
| Notes to financial statements (unaudited) | | Wells Fargo Low Volatility U.S. Equity Fund | | | 21 | |
1. ORGANIZATION
Wells Fargo Funds Trust (the “Trust”), a Delaware statutory trust organized on March 10, 1999, is an open-end management investment company registered under the Investment Company Act of 1940, as amended (the “1940 Act”). As an investment company, the Trust follows the accounting and reporting guidance in Financial Accounting Standards Board Accounting Standards Codification Topic 946, Financial Services – Investment Companies. These financial statements report on the Wells Fargo Low Volatility U.S. Equity Fund (the “Fund”) which is a diversified series of the Trust.
Effective at the close of business on November 13, 2017, Class R shares were liquidated and the class was subsequently closed. Class R shares are no longer offered by the Fund. Information for Class R shares reflected in the financial statements represents activity through November 13, 2017.
2. SIGNIFICANT ACCOUNTING POLICIES
The following significant accounting policies, which are consistently followed in the preparation of the financial statements of the Fund, are in conformity with U.S. generally accepted accounting principles which require management to make estimates and assumptions that affect the reported amounts of assets and liabilities, disclosure of contingent assets and liabilities at the date of the financial statements, and the reported amounts of revenues and expenses during the reporting period. Actual results could differ from those estimates.
Securities valuation
All investments are valued each business day as of the close of regular trading on the New York Stock Exchange (generally 4 p.m. Eastern Time), although the Fund may deviate from this calculation time under unusual or unexpected circumstances.
Equity securities that are listed on a foreign or domestic exchange or market are valued at the official closing price or, if none, the last sales price. If no sale occurs on the principal exchange or market that day, a fair value price will be determined in accordance with the Fund’s Valuation Procedures.
Investments in registered open-end investment companies are valued at net asset value.
Investments which are not valued using any of the methods discussed above are valued at their fair value, as determined in good faith by the Board of Trustees of the Fund. The Board of Trustees has established a Valuation Committee comprised of the Trustees and has delegated to it the authority to take any actions regarding the valuation of portfolio securities that the Valuation Committee deems necessary or appropriate, including determining the fair value of portfolio securities, unless the determination has been delegated the Wells Fargo Asset Management Pricing Committee of Wells Fargo Funds Management, LLC (“Funds Management”). The Board of Trustees retains the authority to make or ratify any valuation decisions or approve any changes to the Valuation Procedures as it deems appropriate. On a quarterly basis, the Board of Trustees receives reports on any valuation actions taken by the Valuation Committee or the Wells Fargo Asset Management Pricing Committee which may include items for ratification.
Valuations of fair valued securities are compared to the next actual sales price when available, or other appropriate market values, to assess the continued appropriateness of the fair valuation methodologies used. These securities are fair valued on a day-to-day basis, taking into consideration changes to appropriate market information and any significant changes to the inputs considered in the valuation process until there is a readily available price provided on an exchange or by an independent pricing service. Valuations received from an independent pricing service or independent broker-dealer quotes are periodically validated by comparisons to most recent trades and valuations provided by other independent pricing services in addition to the review of prices by the manager and/or subadviser. Unobservable inputs used in determining fair valuations are identified based on the type of security, taking into consideration factors utilized by market participants in valuing the investment, knowledge about the issuer and the current market environment.
Security transactions and income recognition
Securities transactions are recorded on a trade date basis. Realized gains or losses are recorded on the basis of identified cost.
Dividend income is recognized on the ex-dividend date.
Distributions to shareholders
Distributions to shareholders from net investment income and net realized gains, if any, are recorded on the ex-dividend date. Such distributions are determined in accordance with income tax regulations and may differ from U.S. generally
| | | | |
| 22 | | Wells Fargo Low Volatility U.S. Equity Fund | | Notes to financial statements (unaudited) |
accepted accounting principles. Dividend sources are estimated at the time of declaration. The tax character of distributions is determined as of the Fund’s fiscal year end. Therefore, a portion of the Fund’s distributions made prior to the Fund’s fiscal year end may be categorized as a tax return of capital.
Federal and other taxes
The Fund intends to continue to qualify as a regulated investment company by distributing substantially all of its investment company taxable income and any net realized capital gains (after reduction for capital loss carryforwards) sufficient to relieve it from all, or substantially all, federal income taxes. Accordingly, no provision for federal income taxes was required.
The Fund’s income and federal excise tax returns and all financial records supporting those returns for the fiscal years since commencement of operations are subject to examination by the federal and Delaware revenue authorities. Management has analyzed the Fund’s tax positions taken on federal, state, and foreign tax returns for all open tax years and does not believe that there are any uncertain tax positions that require recognition of a tax liability.
As of January 31, 2018, the aggregate cost of all investments for federal income tax purposes was $36,040,566 and the unrealized gains (losses) consisted of:
| | | | |
Gross unrealized gains | | $ | 4,474,935 | |
Gross unrealized losses | | | (679,543 | ) |
Net unrealized gains | | $ | 3,795,392 | |
Class allocations
The separate classes of shares offered by the Fund differ principally in applicable sales charges, distribution, shareholder servicing, and administration fees. Class specific expenses are charged directly to that share class. Investment income, common expenses, and realized and unrealized gains (losses) on investments are allocated daily to each class of shares based on the relative proportion of net assets of each class.
3. FAIR VALUATION MEASUREMENTS
Fair value measurements of investments are determined within a framework that has established a fair value hierarchy based upon the various data inputs utilized in determining the value of the Fund’s investments. The three-level hierarchy gives the highest priority to unadjusted quoted prices in active markets for identical assets or liabilities (Level 1) and the lowest priority to unobservable inputs (Level 3). The Fund’s investments are classified within the fair value hierarchy based on the lowest level of input that is significant to the fair value measurement. The inputs are summarized into three broad levels as follows:
| ∎ | | Level 1 – quoted prices in active markets for identical securities |
| ∎ | | Level 2 – other significant observable inputs (including quoted prices for similar securities, interest rates, prepayment speeds, credit risk, etc.) |
| ∎ | | Level 3 – significant unobservable inputs (including the Fund’s own assumptions in determining the fair value of investments) |
The inputs or methodologies used for valuing investments in securities are not necessarily an indication of the risk associated with investing in those securities.
| | | | | | |
| Notes to financial statements (unaudited) | | Wells Fargo Low Volatility U.S. Equity Fund | | | 23 | |
The following is a summary of the inputs used in valuing the Fund’s assets and liabilities as of January 31, 2018:
| | | | | | | | | | | | | | | | |
| | | Quoted prices
(Level 1) | | | Other significant
observable inputs
(Level 2) | | | Significant
unobservable inputs (Level 3) | | | Total | |
Assets | | | | | | | | | | | | | | | | |
Investments in: | | | | | | | | | | | | | | | | |
| | | | |
Common stocks | | | | | | | | | | | | | | | | |
Consumer discretionary | | $ | 4,338,887 | | | $ | 0 | | | $ | 0 | | | $ | 4,338,887 | |
Consumer staples | | | 10,893,775 | | | | 0 | | | | 0 | | | | 10,893,775 | |
Energy | | | 437,542 | | | | 0 | | | | 0 | | | | 437,542 | |
Financials | | | 5,446,153 | | | | 0 | | | | 0 | | | | 5,446,153 | |
Health care | | | 4,689,814 | | | | 0 | | | | 0 | | | | 4,689,814 | |
Industrials | | | 2,277,024 | | | | 0 | | | | 0 | | | | 2,277,024 | |
Information technology | | | 2,206,712 | | | | 0 | | | | 0 | | | | 2,206,712 | |
Materials | | | 749,810 | | | | 0 | | | | 0 | | | | 749,810 | |
Real estate | | | 1,935,967 | | | | 0 | | | | 0 | | | | 1,935,967 | |
Telecommunication services | | | 122,090 | | | | 0 | | | | 0 | | | | 122,090 | |
Utilities | | | 5,953,640 | | | | 0 | | | | 0 | | | | 5,953,640 | |
| | | | |
Short-term investments | | | | | | | | | | | | | | | | |
Investment companies | | | 784,544 | | | | 0 | | | | 0 | | | | 784,544 | |
Total assets | | $ | 39,835,958 | | | $ | 0 | | | $ | 0 | | | $ | 39,835,958 | |
The Fund recognizes transfers between levels within the fair value hierarchy at the end of the reporting period. At January 31, 2018, the Fund did not have any transfers into/out of Level 1, Level 2, or Level 3.
4. TRANSACTIONS WITH AFFILIATES
Management fee
Funds Management, an indirect wholly owned subsidiary of Wells Fargo & Company (“Wells Fargo”), is the manager of the Fund and provides advisory and fund-level administrative services under an investment management agreement. Under the investment management agreement, Funds Management is responsible for, among other services, implementing the investment objectives and strategies of the Fund, supervising the subadviser, providing fund-level administrative services in connection with the Fund’s operations, and providing any other fund-level administrative services reasonably necessary for the operation of the Fund. As compensation for its services under the investment management agreement, Funds Management is entitled to receive an annual management fee starting at 0.40% and declining to 0.33% as the average daily net assets of the Fund increase. For the six months ended January 31, 2018, the management fee was equivalent to an annual rate of 0.40% of the Fund’s average daily net assets.
Funds Management has retained the services of a subadviser to provide daily portfolio management to the Fund. The fee for subadvisory services is borne by Funds Management. Analytic Investors, LLC, an affiliate of Funds Management and an indirect, wholly owned subsidiary of Wells Fargo, is the subadviser to the Fund and is entitled to receive a fee from Funds Management at an annual rate starting at 0.20% and declining to 0.12% as the average daily net assets of the Fund increase.
Administration fees
Under a class-level administration agreement, Funds Management provides class-level administrative services to the Fund, which includes paying fees and expenses for services provided by the transfer agent, sub-transfer agents, omnibus account servicers and record-keepers. As compensation for its services under the class-level administration agreement, Funds Management receives an annual fee which is calculated based on the average daily net assets of each class as follows:
| | | | |
| | | Class-level
administration fee | |
Class A, Class C, Class R | | | 0.21 | % |
Class R6 | | | 0.03 | |
Administrator Class, Institutional Class | | | 0.13 | |
| | | | |
| 24 | | Wells Fargo Low Volatility U.S. Equity Fund | | Notes to financial statements (unaudited) |
Funds Management has contractually waived and/or reimbursed management and administration fees to the extent necessary to maintain certain net operating expense ratios for the Fund. Waiver of fees and/or reimbursement of expenses by Funds Management were made first from fund level expenses on a proportionate basis and then from class specific expenses. Funds Management has committed through November 30, 2018 to waive fees and/or reimburse expenses to the extent necessary to cap the Fund’s expenses at 0.83% for Class A shares, 1.58% for Class C shares, 0.40% for Class R6 shares, 0.75% for Administrator Class shares, and 0.50% for Institutional Class shares. After this time, the cap may be increased or the commitment to maintain the cap may be terminated only with the approval of the Board of Trustees.
Distribution fees
The Trust has adopted a distribution plan for Class C and Class R shares of the Fund pursuant to Rule 12b-1 under the 1940 Act. Distribution fees are charged to Class C and Class R shares and paid to Wells Fargo Funds Distributor, LLC (“Funds Distributor”), the principal underwriter, at an annual rate of 0.75% of the average daily net assets of Class C shares and 0.25% of the average daily net assets of Class R shares.
In addition, Funds Distributor is entitled to receive the front-end sales charge from the purchase of Class A shares and a contingent deferred sales charge on the redemption of certain Class A shares. Funds Distributor is also entitled to receive the contingent deferred sales charges from redemptions of Class C shares. For the six months ended January 31, 2018, Funds Distributor received $60 from the sale of Class A shares. No contingent deferred sales charges were incurred by Class A and Class C shares for the six months ended January 31, 2018.
Interfund transactions
The Fund may purchase or sell portfolio investment securities to certain other Wells Fargo affiliates pursuant to Rule 17a-7 under the 1940 Act and under procedures adopted by the Board of Trustees. The procedures have been designed to ensure that these interfund transactions, which do not incur broker commissions, are effected at current market prices.
Shareholder servicing fees
The Trust has entered into contracts with one or more shareholder servicing agents, whereby Class A, Class C, Class R, and Administrator Class of the Fund are charged a fee at an annual rate of 0.25% of the average daily net assets of each respective class.
A portion of these total shareholder servicing fees were paid to affiliates of Wells Fargo.
5. INVESTMENT PORTFOLIO TRANSACTIONS
Purchases and sales of investments, excluding U.S. government obligations (if any) and short-term securities, for the six months ended January 31, 2018 were $15,229,733 and $13,069,167, respectively.
6. CONCENTRATION RISK
Concentration risks result from exposure to a limited number of sectors. A fund that invests a substantial portion of its assets in any sector may be more affected by changes in that sector than would be a fund whose investments are not heavily weighted in any sector.
7. INDEMNIFICATION
Under the Trust’s organizational documents, the officers and Trustees have been granted certain indemnification rights against certain liabilities that may arise out of performance of their duties to the Trust. Additionally, in the normal course of business, the Trust may enter into contracts with service providers that contain a variety of indemnification clauses. The Trust’s maximum exposure under these arrangements is dependent on future claims that may be made against the Fund and, therefore, cannot be estimated.
| | | | | | |
| Other information (unaudited) | | Wells Fargo Low Volatility U.S. Equity Fund | | | 25 | |
PROXY VOTING INFORMATION
A description of the policies and procedures that the Fund uses to determine how to vote proxies relating to portfolio securities is available, upon request, by calling 1-800-222-8222, visiting our website at wellsfargofunds.com, or visiting the SEC website at sec.gov. Information regarding how the Fund voted proxies relating to portfolio securities during the most recent 12-month period ended June 30 is available on the Fund’s website at wellsfargofunds.com or by visiting the SEC website at sec.gov.
PORTFOLIO HOLDINGS INFORMATION
The complete portfolio holdings for the Fund are publicly available monthly on the Fund’s website (wellsfargofunds.com), on a one-month delayed basis. In addition, top ten holdings information (excluding derivative positions) for the Fund is publicly available on the Fund’s website on a monthly, seven-day or more delayed basis. The Fund files its complete schedule of portfolio holdings with the SEC for the first and third quarters of each fiscal year on Form N-Q, which is available by visiting the SEC website at sec.gov. In addition, the Fund’s Form N-Q may be reviewed and copied at the SEC’s Public Reference Room in Washington, DC, and at regional offices in New York City, at 233 Broadway, and in Chicago, at 175 West Jackson Boulevard, Suite 900. Information about the Public Reference Room may be obtained by calling 1-800-SEC-0330.
| | | | |
| 26 | | Wells Fargo Low Volatility U.S. Equity Fund | | Other information (unaudited) |
BOARD OF TRUSTEES AND OFFICERS
Each of the Trustees and Officers1 listed in the table below acts in identical capacities for each fund in the Wells Fargo family of funds, which consists of 153 mutual funds comprising the Wells Fargo Funds Trust, Wells Fargo Variable Trust, Wells Fargo Master Trust and four closed-end funds (collectively the “Fund Complex”). This table should be read in conjunction with the Prospectus and the Statement of Additional Information2. The mailing address of each Trustee and Officer is 525 Market Street, 12th Floor, San Francisco, CA 94105. Each Trustee and Officer serves an indefinite term, however, each Trustee serves such term until reaching the mandatory retirement age established by the Trustees.
Independent Trustees
| | | | | | |
Name and year of birth | | Position held and length of service* | | Principal occupations during past five years or longer | | Current other public company or
investment company
directorships |
William R. Ebsworth (Born 1957) | | Trustee, since 2015 | | Retired. From 1984 to 2013, equities analyst, portfolio manager, research director and chief investment officer at Fidelity Management and Research Company in Boston, Tokyo, and Hong Kong, and retired in 2013 as Chief Investment Officer of Fidelity Strategic Advisers, Inc. where he led a team of investment professionals managing client assets. Prior thereto, Board member of Hong Kong Securities Clearing Co., Hong Kong Options Clearing Corp., the Thailand International Fund, Ltd., Fidelity Investments Life Insurance Company, and Empire Fidelity Investments Life Insurance Company. Board member of the Forté Foundation (non-profit organization) and the Vincent Memorial Hospital Endowment (non-profit organization), where he serves on the Investment Committee and as a Chair of the Audit Committee. Mr. Ebsworth is a CFA® charterholder. | | Asset Allocation Trust |
Jane A. Freeman** (Born 1953) | | Trustee, since 2015; Chair Liaison, since 2018 | | Retired. From 2012 to 2014 and 1999 to 2008, Chief Financial Officer of Scientific Learning Corporation. From 2008 to 2012, Ms. Freeman provided consulting services related to strategic business projects. Prior to 1999, Portfolio Manager at Rockefeller & Co. and Scudder, Stevens & Clark. Board member of the Harding Loevner Funds from 1996 to 2014, serving as both Lead Independent Director and chair of the Audit Committee. Board member of the Russell Exchange Traded Funds Trust from 2011 to 2012 and the chair of the Audit Committee. Ms. Freeman is a Board Member of Ruth Bancroft Garden (non-profit organization) and the Glimmerglass Festival. She is also an inactive Chartered Financial Analyst. | | Asset Allocation Trust |
Isaiah Harris, Jr. (Born 1952) | | Trustee, since 2009 | | Retired. Chairman of the Board of CIGNA Corporation since 2009, and Director since 2005. From 2003 to 2011, Director of Deluxe Corporation. Prior thereto, President and CEO of BellSouth Advertising and Publishing Corp. from 2005 to 2007, President and CEO of BellSouth Enterprises from 2004 to 2005 and President of BellSouth Consumer Services from 2000 to 2003. Emeritus member of the Iowa State University Foundation Board of Governors. Emeritus Member of the Advisory Board of Iowa State University School of Business. Advisory Board Member, Palm Harbor Academy (charter school). Advisory Board Member, Child Evangelism Fellowship (non-profit). Mr. Harris is a certified public accountant (inactive status). | | CIGNA Corporation; Asset Allocation Trust |
Judith M. Johnson (Born 1949) | | Trustee, since 2008; Audit Committee Chairman, since 2008 | | Retired. Prior thereto, Chief Executive Officer and Chief Investment Officer of Minneapolis Employees Retirement Fund from 1996 to 2008. Ms. Johnson is an attorney, certified public accountant and a certified managerial accountant. | | Asset Allocation Trust |
David F. Larcker (Born 1950) | | Trustee, since 2009 | | James Irvin Miller Professor of Accounting at the Graduate School of Business, Stanford University, Director of the Corporate Governance Research Initiative and Senior Faculty of The Rock Center for Corporate Governance since 2006. From 2005 to 2008, Professor of Accounting at the Graduate School of Business, Stanford University. Prior thereto, Ernst & Young Professor of Accounting at The Wharton School, University of Pennsylvania from 1985 to 2005. | | Asset Allocation Trust |
| | | | | | |
| Other information (unaudited) | | Wells Fargo Low Volatility U.S. Equity Fund | | | 27 | |
| | | | | | |
Name and year of birth | | Position held and length of service* | | Principal occupations during past five years or longer | | Current other public company or
investment company
directorships |
Olivia S. Mitchell*** (Born 1953) | | Trustee, since 2006; Governance Committee Chairman, since 2018 | | International Foundation of Employee Benefit Plans Professor, Wharton School of the University of Pennsylvania since 1993. Director of Wharton’s Pension Research Council and Boettner Center on Pensions & Retirement Research, and Research Associate at the National Bureau of Economic Research. Previously, Cornell University Professor from 1978 to 1993. | | Asset Allocation Trust |
Timothy J. Penny**** (Born 1951) | | Trustee since 1996; Chairman, since 2018; Vice Chairman, from 2017 to 2018 | | President and Chief Executive Officer of Southern Minnesota Initiative Foundation, a non-profit organization, since 2007. Member of the Board of Trustees of NorthStar Education Finance, Inc., a non-profit organization, since 2007. | | Asset Allocation Trust |
James G. Polisson***** (Born 1959) | | Trustee, since 2018; Advisory Board Member, from 2017 to 2018 | | Retired. Chief Marketing Officer, Source (ETF) UK Services, Ltd, from 2015 to 2017. From 2012 to 2015, Principal of The Polisson Group, LLC, a management consulting, corporate advisory and principal investing company. Chief Executive Officer and Managing Director at Russell Investments, Global Exchange Traded Funds from 2010 to 2012. Managing Director of Barclays Global Investors from 1998 to 2010 and Global Chief Marketing Officer for iShares and Barclays Global Investors from 2000 to 2010. Trustee of the San Francisco Mechanics’ Institute, a non-profit organization, from 2013 to 2015. Board member of the Russell Exchange Traded Fund Trust from 2011 to 2012. Director of Barclays Global Investors Holdings Deutschland GmbH from 2006 to 2009. Mr. Polisson is an attorney and has a retired status with the Massachusetts and District of Columbia Bar Associations. | | Asset Allocation Trust |
Michael S. Scofield (Born 1943) | | Trustee, since 2010 | | Served on the Investment Company Institute’s Board of Governors and Executive Committee from 2008-2011 as well the Governing Council of the Independent Directors Council from 2006-2011 and the Independent Directors Council Executive Committee from 2008-2011. Trustee of the Evergreen Fund complex (and its predecessors) from 1984 to 2010. Chairman of the Evergreen Funds from 2000-2010. Former Trustee of the Mentor Funds. Retired Attorney, Law Offices of Michael S. Scofield. | | Asset Allocation Trust |
Pamela Wheelock***** (Born 1959) | | Trustee, since 2018; Advisory Board Member, from 2017 to 2018 | | Chief Operating Officer, Twin Cities Habitat for Humanity, since January, 2017. Vice President of University Services, University of Minnesota from 2012 to 2017. Prior thereto, Interim President and Chief Executive Officer of Blue Cross Blue Shield of Minnesota from 2010 to 2011, Chairman of the Board from 2009 to 2011 and Board Director from 2003 to 2015. Vice President, Leadership and Community Engagement, Bush Foundation, Saint Paul, Minnesota (a private foundation) from 2009 to 2011. Executive Vice President and Chief Financial Officer, Minnesota Sports and Entertainment from 2004 to 2009 and Senior Vice President from 2002 to 2004. Commissioner of Finance, State of Minnesota, from 1999 to 2002. Currently on the Board of Directors, Governance Committee and Finance Committee, for the Minnesota Philanthropy Partners (Saint Paul Foundation) since 2012 and Board Chair of the Minnesota Wild Foundation since 2010. | | Asset Allocation Trust |
| * | Length of service dates reflect the Trustee’s commencement of service with the Trust’s predecessor entities, where applicable. |
| ** | Jane Freeman became Chair Liaison effective January 1, 2018. |
| *** | Olivia Mitchell became Chairman of the Governance Committee effective January 1, 2018. |
| **** | Timothy Penny became Chairman effective January 1, 2018. |
| ***** | James Polisson and Pamela Wheelock each became a Trustee effective January 1, 2018. |
| | | | |
| 28 | | Wells Fargo Low Volatility U.S. Equity Fund | | Other information (unaudited) |
Officers
| | | | | | |
Name and year of birth | | Position held and
length of service | | Principal occupations during past five years or longer | | |
Andrew Owen (Born 1960) | | President, since 2017 | | Executive Vice President of Wells Fargo & Company and Head of Affiliated Managers, Wells Fargo Asset Management, since 2014. In addition, Mr. Owen is currently President, Chief Executive Officer and Director of Wells Fargo Funds Management, LLC since 2017. Prior thereto, Executive Vice President responsible for marketing, investments and product development for Wells Fargo Funds Management, LLC, from 2009 to 2014. | | |
Jeremy DePalma1 (Born 1974) | | Treasurer, since 2012 | | Senior Vice President of Wells Fargo Funds Management, LLC since 2009. Senior Vice President of Evergreen Investment Management Company, LLC from 2008 to 2010 and head of the Fund Reporting and Control Team within Fund Administration from 2005 to 2010. | | |
C. David Messman (Born 1960) | | Secretary, since 2000; Chief Legal Officer, since 2003 | | Senior Vice President and Secretary of Wells Fargo Funds Management, LLC since 2001. Assistant General Counsel of Wells Fargo Bank, N.A. since 2013 and Vice President and Managing Counsel of Wells Fargo Bank, N.A. from 1996 to 2013. | | |
Michael H. Whitaker (Born 1967) | | Chief Compliance Officer, since 2016 | | Senior Vice President and Chief Compliance Officer since 2016. Senior Vice President and Chief Compliance Officer for Fidelity Investments from 2007 to 2016. | | |
David Berardi (Born 1975) | | Assistant Treasurer, since 2009 | | Vice President of Wells Fargo Funds Management, LLC since 2009. Vice President of Evergreen Investment Management Company, LLC from 2008 to 2010. Manager of Fund Reporting and Control for Evergreen Investment Management Company, LLC from 2004 to 2010. | | |
| 1 | Jeremy DePalma acts as Treasurer of 76 funds and Assistant Treasurer of 77 funds in the Fund Complex. |
| 2 | The Statement of Additional Information includes additional information about the Trustees and is available, without charge, upon request, by calling 1-800-222-8222 or by visiting the website at wellsfargofunds.com. |
| | | | | | |
| List of abbreviations | | Wells Fargo Low Volatility U.S. Equity Fund | | | 29 | |
The following is a list of common abbreviations for terms and entities that may have appeared in this report.
| ACA | — ACA Financial Guaranty Corporation |
| ADR | — American depositary receipt |
| ADS | — American depositary shares |
| AGC | — Assured Guaranty Corporation |
| AGM | — Assured Guaranty Municipal |
| Ambac | — Ambac Financial Group Incorporated |
| AMT | — Alternative minimum tax |
| BAN | — Bond anticipation notes |
| BHAC | — Berkshire Hathaway Assurance Corporation |
| CAB | — Capital appreciation bond |
| CCAB | — Convertible capital appreciation bond |
| CDA | — Community Development Authority |
| CDO | — Collateralized debt obligation |
| CLO | — Collateralized loan obligation |
| DRIVER | — Derivative inverse tax-exempt receipts |
| DW&P | — Department of Water & Power |
| DWR | — Department of Water Resources |
| ECFA | — Educational & Cultural Facilities Authority |
| EDA | — Economic Development Authority |
| EDFA | — Economic Development Finance Authority |
| ETF | — Exchange-traded fund |
| FDIC | — Federal Deposit Insurance Corporation |
| FFCB | — Federal Farm Credit Banks |
| FGIC | — Financial Guaranty Insurance Corporation |
| FHA | — Federal Housing Administration |
| FHLB | — Federal Home Loan Bank |
| FHLMC | — Federal Home Loan Mortgage Corporation |
| FICO | — The Financing Corporation |
| FNMA | — Federal National Mortgage Association |
| GDR | — Global depositary receipt |
| GNMA | — Government National Mortgage Association |
| HCFR | — Healthcare facilities revenue |
| HEFA | — Health & Educational Facilities Authority |
| HEFAR | — Higher education facilities authority revenue |
| HFA | — Housing Finance Authority |
| HFFA | — Health Facilities Financing Authority |
| HUD | — Department of Housing and Urban Development |
| IDA | — Industrial Development Authority |
| IDAG | — Industrial Development Agency |
| KRW | — Republic of Korea won |
| LIBOR | — London Interbank Offered Rate |
| LIFER | — Long Inverse Floating Exempt Receipts |
| LLC | — Limited liability company |
| LLLP | — Limited liability limited partnership |
| LLP | — Limited liability partnership |
| MBIA | — Municipal Bond Insurance Association |
| MFHR | — Multifamily housing revenue |
| MSTR | — Municipal securities trust receipts |
| MUD | — Municipal Utility District |
| National | — National Public Finance Guarantee Corporation |
| PCFA | — Pollution Control Financing Authority |
| PCL | — Public Company Limited |
| PCR | — Pollution control revenue |
| PFA | — Public Finance Authority |
| PFFA | — Public Facilities Financing Authority |
| PFOTER | — Puttable floating option tax-exempt receipts |
| PJSC | — Public Joint Stock Company |
| plc | — Public limited company |
| PUTTER | — Puttable tax-exempt receipts |
| R&D | — Research & development |
| Radian | — Radian Asset Assurance |
| RAN | — Revenue anticipation notes |
| RDA | — Redevelopment Agency |
| RDFA | — Redevelopment Finance Authority |
| REIT | — Real estate investment trust |
| ROC | — Reset option certificates |
| SAVRS | — Select auction variable rate securities |
| SBA | — Small Business Authority |
| SDR | — Swedish depositary receipt |
| SFHR | — Single-family housing revenue |
| SFMR | — Single-family mortgage revenue |
| SIFMA | — Securities Industry and Financial Markets Association |
| SPA | — Standby purchase agreement |
| SPDR | — Standard & Poor’s Depositary Receipts |
| SPEAR | — Short Puttable Exempt Adjustable Receipts |
| STRIPS | — Separate trading of registered interest and |
| TAN | — Tax anticipation notes |
| TIPS | — Treasury inflation-protected securities |
| TRAN | — Tax revenue anticipation notes |
| TTFA | — Transportation Trust Fund Authority |
| TVA | — Tennessee Valley Authority |
This page is intentionally left blank.
This page is intentionally left blank.
This page is intentionally left blank.

For more information
More information about Wells Fargo Funds is available free upon request. To obtain literature, please write, email, visit the Fund’s website, or call:
Wells Fargo Funds
P.O. Box 8266
Boston, MA 02266-8266
Email: fundservice@wellsfargo.com
Website: wellsfargofunds.com
Individual investors: 1-800-222-8222
Retail investment professionals: 1-888-877-9275
Institutional investment professionals:
1-866-765-0778
This report and the financial statements contained herein are submitted for the general information of the shareholders of the Fund. If this report is used for promotional purposes, distribution of the report must be accompanied or preceded by a current prospectus. Before investing, please consider the investment objectives, risks, charges, and expenses of the investment. For a current prospectus and, if available, a summary prospectus, containing this information, call 1-800-222-8222 or visit the Fund’s website at wellsfargofunds.com. Read the prospectus carefully before you invest or send money.
Wells Fargo Asset Management (WFAM) is a trade name used by the asset management businesses of Wells Fargo & Company. Wells Fargo Funds Management, LLC, a wholly owned subsidiary of Wells Fargo & Company, provides investment advisory and administrative services for Wells Fargo Funds. Other affiliates of Wells Fargo & Company provide subadvisory and other services for the funds. The funds are distributed by Wells Fargo Funds Distributor, LLC, Member FINRA, an affiliate of Wells Fargo & Company. Neither Wells Fargo Funds Distributor nor Wells Fargo Funds Management holds fund shareholder accounts or assets. This material is for general informational and educational purposes only and is NOT intended to provide investment advice or a recommendation of any kind—including a recommendation for any specific investment, strategy, or plan.
NOT FDIC INSURED ◾ NO BANK GUARANTEE ◾ MAY LOSE VALUE
© 2018 Wells Fargo Funds Management, LLC. All rights reserved.
| | |
 | | 309120 03-18 SA270/SAR270 01-18 |
Semi-Annual Report
January 31, 2018

Wells Fargo Omega Growth Fund


Reduce clutter. Save trees.
Sign up for electronic delivery of prospectuses and shareholder reports at wellsfargo.com/advantagedelivery
Contents
The views expressed and any forward-looking statements are as of January 31, 2018, unless otherwise noted, and are those of the Fund managers and/or Wells Fargo Funds Management, LLC. Discussions of individual securities, or the markets generally, or any Wells Fargo Fund are not intended as individual recommendations. Future events or results may vary significantly from those expressed in any forward-looking statements. The views expressed are subject to change at any time in response to changing circumstances in the market. Wells Fargo Funds Management, LLC and the Fund disclaim any obligation to publicly update or revise any views expressed or forward-looking statements.
NOT FDIC INSURED ◾ NO BANK GUARANTEE ◾ MAY LOSE VALUE
| | | | |
| 2 | | Wells Fargo Omega Growth Fund | | Letter to shareholders (unaudited) |

Andrew Owen
President
Wells Fargo Funds
While investing in stocks and bonds generally delivered favorable returns during the past six months, fixed-income investments in the U.S. diverged from the global trend.
Dear Shareholder:
We are pleased to offer you this semi-annual report for the Wells Fargo Omega Growth Fund for the six-month period that ended January 31, 2018. While investing in stocks generally delivered favorable returns during the past six months, fixed-income investments in the U.S. diverged from the global trend. U.S. and international stocks delivered similar results, with returns of 15.43% and 13.50%, respectively, for the six-month period, as measured by the S&P 500 Index1 and the MSCI ACWI ex USA Index (Net)2, respectively. Within fixed income, the Bloomberg Barclays Global Aggregate ex-USD Index3 earned 4.50%. In the U.S., fixed-income investments, as measured by the Bloomberg Barclays U.S. Aggregate Bond Index4, fell 0.35% and the Bloomberg Barclays Municipal Bond Index5 declined 0.19%.
As global growth improved in the third quarter of 2017, investment markets advanced.
Globally, stocks moved higher during the late summer of 2017 as they were subject to the same positive economic conditions that influenced their advances during first half of the year: moderately accelerating global economic growth supported by improving corporate earnings as well as low inflation and interest rates. Brief episodes of geopolitical tensions, primarily associated with North Korea’s advancing nuclear missile program, flaring conflicts in the Middle East, and uncertainty surrounding the new U.S. administration’s trade policies, did not discourage investing activity. In the U.S., economic data released during the quarter reflected a generally healthy economy. Second-quarter economic output grew at a 3.1% annual rate.
Outside the U.S., stocks in international developed and emerging markets were supported by improved economic growth. Advances in emerging markets equity valuations slowed compared with the pace of the first half of 2017 but continued an upward path. Central banks in Europe, Asia, and Japan maintained low-interest-rate policies that supported business growth and equity investing.
In the U.S., Federal Reserve (Fed) officials announced in October plans to begin the process of unwinding its $4.5 trillion portfolio of bonds and other assets accumulated during rounds of quantitative easing conducted since the 2008–2009 recession. Still, restrained inflation kept long-term bond rates steady and the flattening of the yield curve persisted.
Positive economic and market news continued as 2017 closed and 2018 began.
During the fourth quarter of 2017, stock markets continued an upward trajectory. Synchronous economic expansion worldwide continued with mild inflation and low volatility. Data released during the quarter reflected a healthy U.S. economy.
| 1 | The S&P 500 Index consists of 500 stocks chosen for market size, liquidity, and industry group representation. It is a market-value-weighted index with each stock’s weight in the index proportionate to its market value. You cannot invest directly in an index. |
| 2 | The Morgan Stanley Capital International (MSCI) All Country World Index (ACWI) ex USA Index (Net) is a free-float-adjusted market-capitalization-weighted index that is designed to measure the equity market performance of developed markets, excluding the United States and Canada. Source: MSCI. MSCI makes no express or implied warranties or representations and shall have no liability whatsoever with respect to any MSCI data contained herein. The MSCI data may not be further redistributed or used as a basis for other indices or any securities or financial products. This report is not approved, reviewed, or produced by MSCI. You cannot invest directly in an index. |
| 3 | The Bloomberg Barclays Global Aggregate ex-USD Index is an unmanaged index that provides a broad-based measure of the global investment-grade fixed-income markets excluding the U.S.-dollar-denominated debt market. You cannot invest directly in an index. |
| 4 | The Bloomberg Barclays U.S. Aggregate Bond Index is a broad-based benchmark that measures the investment-grade, U.S. dollar-denominated, fixed-rate taxable bond market, including Treasuries, government-related and corporate securities, mortgage-backed securities (agency fixed-rate and hybrid adjustable-rate mortgage pass-throughs), asset-backed securities, and commercial mortgage-backed securities. You cannot invest directly in an index. |
| 5 | The Bloomberg Barclays Municipal Bond Index is an unmanaged index composed of long-term tax-exempt bonds with a minimum credit rating of Baa. You cannot invest directly in an index. |
| | | | | | |
| Letter to shareholders (unaudited) | | Wells Fargo Omega Growth Fund | | | 3 | |
Third-quarter economic output grew at a 3.2% annual rate. Increased hiring pushed the unemployment rate down to a 17-year low of 4.1%. Tax reform in the U.S. that passed as the year ended also encouraged increased spending among businesses and individuals. Signs of long-awaited wage growth appeared to emerge.
Outside the U.S., economies continued to strengthen. In December, the Organisation for Economic Co-operation and Development (OECD) reported that the global economy has been expanding at its fastest rate since 2010; all 35 countries the OECD follows were on track to expand for 2017. International economies have benefited from catalysts such as economic stimulus, improving employment, increased investment, accelerated trade growth, and the firming of prices for some of the commodities that are essential exports of many international economies.
October 2017 marked one year since regulatory reform of money market investing in the U.S. By December 2017, money market fund asset levels exceeded their December 2016 levels, reflecting continued investor demand for the short-term investment opportunities afforded them by money market funds.
In December 2017, the Fed raised the federal funds rate target to a range of 1.25% to 1.50%. The Fed also began reducing its bond portfolio. Long-term interest rates in the U.S. trended higher as the yield curve steepened—the 10-year Treasury rate moved from 2.46% to 2.84% and the 30-year rate moved from 2.81% to 3.08% during January 2018.
Don’t let short-term uncertainty derail long-term investment goals.
Periods of investment uncertainty can present challenges, but experience has taught us that maintaining long-term investment goals can be an effective way to plan for the future. To help you create a sound strategy based on your personal goals and risk tolerance, Wells Fargo Funds offers more than 100 mutual funds spanning a wide range of asset classes and investment styles. Although diversification cannot guarantee an investment profit or prevent losses, we believe it can be an effective way to manage investment risk and potentially smooth out overall portfolio performance. We encourage investors to know their investments and to understand that appropriate levels of risk-taking may unlock opportunities.
Thank you for choosing to invest with Wells Fargo Funds. We appreciate your confidence in us and remain committed to helping you meet your financial needs.
Sincerely,

Andrew Owen
President
Wells Fargo Funds
Although diversification cannot guarantee an investment profit or prevent losses, we believe it can be an effective way to manage investment risk and potentially smooth out overall portfolio performance.
For further information about your Fund, contact your investment professional, visit our website at wellsfargofunds.com, or call us directly at 1-800-222-8222.
| | | | |
| 4 | | Wells Fargo Omega Growth Fund | | Performance highlights (unaudited) |
Investment objective
The Fund seeks long-term capital appreciation.
Manager
Wells Fargo Funds Management, LLC
Subadviser
Wells Capital Management Incorporated
Portfolio managers
Michael T. Smith, CFA®
Christopher J. Warner, CFA®
Average annual total returns (%) as of January 31, 20181
| | | | | | | | | | | | | | | | | | | | | | | | | | | | | | | | | | |
| | | | | Including sales charge | | | Excluding sales charge | | | Expense ratios2 (%) | |
| | | Inception date | | 1 year | | | 5 year | | | 10 year | | | 1 year | | | 5 year | | | 10 year | | | Gross | | | Net3 | |
| Class A (EKOAX) | | 4-29-1968 | | | 31.41 | | | | 14.06 | | | | 11.45 | | | | 39.43 | | | | 15.42 | | | | 12.11 | | | | 1.28 | | | | 1.28 | |
| Class C (EKOCX) | | 8-2-1993 | | | 37.40 | | | | 14.56 | | | | 11.28 | | | | 38.40 | | | | 14.56 | | | | 11.28 | | | | 2.03 | | | | 2.03 | |
| Class R (EKORX) | | 10-10-2003 | | | – | | | | – | | | | – | | | | 39.08 | | | | 15.13 | | | | 11.84 | | | | 1.53 | | | | 1.53 | |
| Administrator Class (EOMYX) | | 1-13-1997 | | | – | | | | – | | | | – | | | | 39.69 | | | | 15.67 | | | | 12.38 | | | | 1.20 | | | | 1.10 | |
| Institutional Class (EKONX) | | 7-30-2010 | | | – | | | | – | | | | – | | | | 40.04 | | | | 15.96 | | | | 12.59 | | | | 0.95 | | | | 0.85 | |
| Russell 3000® Growth Index4 | | – | | | – | | | | – | | | | – | | | | 34.11 | | | | 17.69 | | | | 11.58 | | | | – | | | | – | |
Figures quoted represent past performance, which is no guarantee of future results, and do not reflect taxes that a shareholder may pay on fund distributions or the redemption of fund shares. Investment return and principal value of an investment will fluctuate so that an investor’s shares, when redeemed, may be worth more or less than their original cost. Performance shown without sales charges would be lower if sales charges were reflected. Current performance may be lower or higher than the performance data quoted, which assumes the reinvestment of dividends and capital gains. Current month-end performance is available on the Fund’s website, wellsfargofunds.com.
Please keep in mind that high double-digit returns were primarily achieved during favorable market conditions. You should not expect that such favorable returns can be consistently achieved. A fund’s performance, especially for short time periods, should not be the sole factor in making your investment decision.
Index returns do not include transaction costs associated with buying and selling securities, any mutual fund fees or expenses, or any taxes. It is not possible to invest directly in an index.
For Class A shares, the maximum front-end sales charge is 5.75%. For Class C shares, the maximum contingent deferred sales charge is 1.00%. Performance including a contingent deferred sales charge assumes the sales charge for the corresponding time period. Class R, Administrator Class, and Institutional Class shares are sold without a front-end sales charge or contingent deferred sales charge.
Stock values fluctuate in response to the activities of individual companies and general market and economic conditions. Certain investment strategies tend to increase the total risk of an investment (relative to the broader market). The Fund is exposed to foreign investment risk and smaller-company securities risk. Consult the Fund’s prospectus for additional information on these and other risks.
Please see footnotes on page 5.
| | | | | | |
| Performance highlights (unaudited) | | Wells Fargo Omega Growth Fund | | | 5 | |
| | | | |
| Ten largest holdings (%) as of January 31, 20185 | |
Amazon.com Incorporated | | | 6.14 | |
Microsoft Corporation | | | 5.50 | |
Alphabet Incorporated Class A | | | 3.93 | |
Visa Incorporated Class A | | | 3.71 | |
UnitedHealth Group Incorporated | | | 3.62 | |
The Home Depot Incorporated | | | 2.29 | |
Waste Connections Incorporated | | | 2.19 | |
Take-Two Interactive Software Incorporated | | | 2.07 | |
salesforce.com Incorporated | | | 2.00 | |
Intercontinental Exchange Incorporated | | | 1.62 | |
|
| Sector distribution as of January 31, 20186 |
|
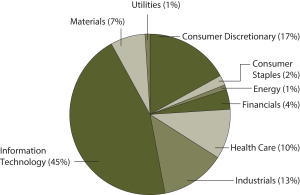 |
| 1 | Historical performance shown for Institutional Class shares prior to their inception reflects the performance of Administrator Class shares, and includes the higher expenses applicable to Administrator Class shares. If these expenses had not been included, returns for Institutional Class shares would be higher. Historical performance shown for all classes of the Fund prior to July 19, 2010, is based on the performance of the Fund’s predecessor, Evergreen Omega Fund. |
| 2 | Reflects the expense ratios as stated in the most recent prospectuses. The expense ratios shown are subject to change and may differ from the annualized expense ratios shown in the financial highlights of this report. |
| 3 | The manager has contractually committed through November 30, 2018, to waive fees and/or reimburse expenses to the extent necessary to cap the Fund’s Total Annual Fund Operating Expenses After Fee Waivers at 1.30% for Class A, 2.05% for Class C, 1.55% for Class R, 1.10% for Administrator Class, and 0.85% for Institutional Class. After this time, the cap may be increased or the commitment to maintain the cap may be terminated only with the approval of the Board of Trustees. Brokerage commissions, stamp duty fees, interest, taxes, acquired fund fees and expenses, and extraordinary expenses are excluded from the expense cap. Without this cap, the Fund’s returns would have been lower. The expense ratio paid by an investor is the net expense ratio or the Fund’s Total Annual Fund Operating Expenses After Fee Waivers, as stated in the prospectuses. |
| 4 | The Russell 3000® Growth Index measures the performance of those Russell 3000® Index companies with higher price/book ratios and higher forecasted growth values. You cannot invest directly in an index. |
| 5 | The ten largest holdings, excluding cash and cash equivalents, are calculated based on the value of the investments divided by total net assets of the Fund. Holdings are subject to change and may have changed since the date specified. |
| 6 | Amounts are calculated based on the total long-term investments of the Fund. These amounts are subject to change and may have changed since the date specified. |
| | | | |
| 6 | | Wells Fargo Omega Growth Fund | | Fund expenses (unaudited) |
As a shareholder of the Fund, you incur two types of costs: (1) transaction costs, including sales charges (loads) on purchase payments and contingent deferred sales charges (if any) on redemptions and (2) ongoing costs, including management fees, distribution (12b-1) and/or shareholder servicing fees, and other Fund expenses. This example is intended to help you understand your ongoing costs (in dollars) of investing in the Fund and to compare these costs with the ongoing costs of investing in other mutual funds.
The example is based on an investment of $1,000 invested at the beginning of the six-month period and held for the entire period from August 1, 2017 to January 31, 2018.
Actual expenses
The “Actual” line of the table below provides information about actual account values and actual expenses. You may use the information in this line, together with the amount you invested, to estimate the expenses that you paid over the period. Simply divide your account value by $1,000 (for example, an $8,600 account value divided by $1,000 = 8.6), then multiply the result by the number in the “Actual” line under the heading entitled “Expenses paid during period” for your applicable class of shares to estimate the expenses you paid on your account during this period.
Hypothetical example for comparison purposes
The “Hypothetical” line of the table below provides information about hypothetical account values and hypothetical expenses based on the Fund’s actual expense ratio and an assumed rate of return of 5% per year before expenses, which is not the Fund’s actual return. The hypothetical account values and expenses may not be used to estimate the actual ending account balance or expenses you paid for the period. You may use this information to compare the ongoing costs of investing in the Fund and other funds. To do so, compare this 5% hypothetical example with the 5% hypothetical examples that appear in the shareholder reports of the other funds.
Please note that the expenses shown in the table are meant to highlight your ongoing costs only and do not reflect any transactional costs, such as sales charges (loads) and contingent deferred sales charges. Therefore, the “Hypothetical” line of the table is useful in comparing ongoing costs only and will not help you determine the relative total costs of owning different funds. In addition, if these transactional costs were included, your costs would have been higher.
| | | | | | | | | | | | | | | | |
| | | Beginning
account value
8-1-2017 | | | Ending
account value
1-31-2018 | | | Expenses
paid during
the period¹ | | | Annualized net
expense ratio | |
Class A | | | | | | | | | | | | | | | | |
Actual | | $ | 1,000.00 | | | $ | 1,211.19 | | | $ | 7.13 | | | | 1.28 | % |
Hypothetical (5% return before expenses) | | $ | 1,000.00 | | | $ | 1,018.75 | | | $ | 6.51 | | | | 1.28 | % |
Class C | | | | | | | | | | | | | | | | |
Actual | | $ | 1,000.00 | | | $ | 1,206.48 | | | $ | 11.29 | | | | 2.03 | % |
Hypothetical (5% return before expenses) | | $ | 1,000.00 | | | $ | 1,014.97 | | | $ | 10.31 | | | | 2.03 | % |
Class R | | | | | | | | | | | | | | | | |
Actual | | $ | 1,000.00 | | | $ | 1,209.69 | | | $ | 8.47 | | | | 1.52 | % |
Hypothetical (5% return before expenses) | | $ | 1,000.00 | | | $ | 1,017.54 | | | $ | 7.73 | | | | 1.52 | % |
Administrator Class | | | | | | | | | | | | | | | | |
Actual | | $ | 1,000.00 | | | $ | 1,212.33 | | | $ | 6.13 | | | | 1.10 | % |
Hypothetical (5% return before expenses) | | $ | 1,000.00 | | | $ | 1,019.66 | | | $ | 5.60 | | | | 1.10 | % |
Institutional Class | | | | | | | | | | | | | | | | |
Actual | | $ | 1,000.00 | | | $ | 1,213.88 | | | $ | 4.74 | | | | 0.85 | % |
Hypothetical (5% return before expenses) | | $ | 1,000.00 | | | $ | 1,020.92 | | | $ | 4.33 | | | | 0.85 | % |
| 1 | Expenses paid is equal to the annualized net expense ratio of each class multiplied by the average account value over the period, multiplied by the number of days in the most recent fiscal half-year divided by the number of days in the fiscal year (to reflect the one-half-year period). |
| | | | | | |
| Portfolio of investments—January 31, 2018 (unaudited) | | Wells Fargo Omega Growth Fund | | | 7 | |
| | | | | | | | | | | | | | | | |
| Security name | | | | | | | | Shares | | | Value | |
| | | | |
Common Stocks: 99.59% | | | | | | | | | | | | | | | | |
| | | | |
Consumer Discretionary: 16.72% | | | | | | | | | | | | | | | | |
| | | | |
| Auto Components: 1.14% | | | | | | | | | | | | | | | | |
Aptiv plc | | | | | | | | | | | 99,400 | | | $ | 9,431,072 | |
| | | | | | | | | | | | | | | | |
| | | | |
| Automobiles: 0.76% | | | | | | | | | | | | | | | | |
Ferrari NV | | | | | | | | | | | 52,300 | | | | 6,249,850 | |
| | | | | | | | | | | | | | | | |
| | | | |
| Diversified Consumer Services: 2.99% | | | | | | | | | | | | | | | | |
Adtalem Global Education Incorporated † | | | | | | | | | | | 269,300 | | | | 12,387,800 | |
Bright Horizons Family Solutions Incorporated † | | | | | | | | | | | 125,957 | | | | 12,368,977 | |
| | | | |
| | | | | | | | | | | | | | | 24,756,777 | |
| | | | | | | | | | | | | | | | |
| | | | |
| Hotels, Restaurants & Leisure: 1.23% | | | | | | | | | | | | | | | | |
Vail Resorts Incorporated | | | | | | | | | | | 27,502 | | | | 6,010,837 | |
Wingstop Incorporated « | | | | | | | | | | | 85,845 | | | | 4,151,464 | |
| | | | |
| | | | | | | | | | | | | | | 10,162,301 | |
| | | | | | | | | | | | | | | | |
| | | | |
| Internet & Direct Marketing Retail: 7.64% | | | | | | | | | | | | | | | | |
Amazon.com Incorporated † | | | | | | | | | | | 35,000 | | | | 50,781,150 | |
Netflix Incorporated † | | | | | | | | | | | 46,000 | | | | 12,433,800 | |
| | | | |
| | | | | | | | | | | | | | | 63,214,950 | |
| | | | | | | | | | | | | | | | |
| | | | |
| Media: 0.67% | | | | | | | | | | | | | | | | |
Cinemark Holdings Incorporated « | | | | | | | | | | | 151,656 | | | | 5,580,941 | |
| | | | | | | | | | | | | | | | |
| | | | |
| Specialty Retail: 2.29% | | | | | | | | | | | | | | | | |
The Home Depot Incorporated | | | | | | | | | | | 94,200 | | | | 18,924,780 | |
| | | | | | | | | | | | | | | | |
| | | | |
Consumer Staples: 1.65% | | | | | | | | | | | | | | | | |
| | | | |
| Beverages: 0.93% | | | | | | | | | | | | | | | | |
Monster Beverage Corporation † | | | | | | | | | | | 112,300 | | | | 7,662,229 | |
| | | | | | | | | | | | | | | | |
| | | | |
| Food Products: 0.72% | | | | | | | | | | | | | | | | |
Lamb Weston Holdings Incorporated | | | | | | | | | | | 101,500 | | | | 5,947,900 | |
| | | | | | | | | | | | | | | | |
| | | | |
Energy: 0.69% | | | | | | | | | | | | | | | | |
| | | | |
| Oil, Gas & Consumable Fuels: 0.69% | | | | | | | | | | | | | | | | |
Pioneer Natural Resources Company | | | | | | | | | | | 31,400 | | | | 5,743,374 | |
| | | | | | | | | | | | | | | | |
| | | | |
Financials: 4.51% | | | | | | | | | | | | | | | | |
| | | | |
| Capital Markets: 3.14% | | | | | | | | | | | | | | | | |
Intercontinental Exchange Incorporated | | | | | | | | | | | 181,800 | | | | 13,424,112 | |
Raymond James Financial Incorporated | | | | | | | | | | | 130,302 | | | | 12,559,810 | |
| | | | |
| | | | | | | | | | | | | | | 25,983,922 | |
| | | | | | | | | | | | | | | | |
| | | | |
| Consumer Finance: 1.37% | | | | | | | | | | | | | | | | |
SLM Corporation † | | | | | | | | | | | 990,300 | | | | 11,329,032 | |
| | | | | | | | | | | | | | | | |
The accompanying notes are an integral part of these financial statements.
| | | | |
| 8 | | Wells Fargo Omega Growth Fund | | Portfolio of investments—January 31, 2018 (unaudited) |
| | | | | | | | | | | | | | | | |
| Security name | | | | | | | | Shares | | | Value | |
| | | | |
Health Care: 9.93% | | | | | | | | | | | | | | | | |
| | | | |
| Biotechnology: 2.66% | | | | | | | | | | | | | | | | |
Celgene Corporation † | | | | | | | | | | | 98,775 | | | $ | 9,992,079 | |
Exelixis Incorporated † | | | | | | | | | | | 231,000 | | | | 7,001,610 | |
Incyte Corporation † | | | | | | | | | | | 27,400 | | | | 2,473,946 | |
Puma Biotechnology Incorporated † | | | | | | | | | | | 37,600 | | | | 2,513,560 | |
| | | | |
| | | | | | | | | | | | | | | 21,981,195 | |
| | | | | | | | | | | | | | | | |
| | | | |
| Health Care Equipment & Supplies: 3.20% | | | | | | | | | | | | | | | | |
Baxter International Incorporated | | | | | | | | | | | 89,300 | | | | 6,432,279 | |
Edwards Lifesciences Corporation † | | | | | | | | | | | 60,000 | | | | 7,594,800 | |
Hologic Incorporated † | | | | | | | | | | | 292,400 | | | | 12,485,480 | |
| | | | |
| | | | | | | | | | | | | | | 26,512,559 | |
| | | | | | | | | | | | | | | | |
| | | | |
| Health Care Providers & Services: 4.07% | | | | | | | | | | | | | | | | |
Amedisys Incorporated † | | | | | | | | | | | 69,089 | | | | 3,704,552 | |
UnitedHealth Group Incorporated | | | | | | | | | | | 126,600 | | | | 29,976,348 | |
| | | | |
| | | | | | | | | | | | | | | 33,680,900 | |
| | | | | | | | | | | | | | | | |
| | | | |
Industrials: 13.27% | | | | | | | | | | | | | | | | |
| | | | |
| Aerospace & Defense: 2.80% | | | | | | | | | | | | | | | | |
BWX Technologies Incorporated | | | | | | | | | | | 194,000 | | | | 12,307,360 | |
Mercury Computer Systems Incorporated † | | | | | | | | | | | 225,700 | | | | 10,838,114 | |
| | | | |
| | | | | | | | | | | | | | | 23,145,474 | |
| | | | | | | | | | | | | | | | |
| | | | |
| Airlines: 0.66% | | | | | | | | | | | | | | | | |
Spirit Airlines Incorporated † | | | | | | | | | | | 130,100 | | | | 5,479,812 | |
| | | | | | | | | | | | | | | | |
| | | | |
| Commercial Services & Supplies: 3.76% | | | | | | | | | | | | | | | | |
Cintas Corporation | | | | | | | | | | | 77,400 | | | | 13,038,030 | |
Waste Connections Incorporated | | | | | | | | | | | 251,922 | | | | 18,093,038 | |
| | | | |
| | | | | | | | | | | | | | | 31,131,068 | |
| | | | | | | | | | | | | | | | |
| | | | |
| Electrical Equipment: 0.85% | | | | | | | | | | | | | | | | |
Rockwell Automation Incorporated | | | | | | | | | | | 35,700 | | | | 7,043,253 | |
| | | | | | | | | | | | | | | | |
| | | | |
| Machinery: 1.69% | | | | | | | | | | | | | | | | |
John Bean Technologies Corporation | | | | | | | | | | | 48,500 | | | | 5,516,875 | |
Nordson Corporation | | | | | | | | | | | 58,600 | | | | 8,421,992 | |
| | | | |
| | | | | | | | | | | | | | | 13,938,867 | |
| | | | | | | | | | | | | | | | |
| | | | |
| Professional Services: 0.79% | | | | | | | | | | | | | | | | |
TransUnion † | | | | | | | | | | | 110,235 | | | | 6,543,550 | |
| | | | | | | | | | | | | | | | |
| | | | |
| Trading Companies & Distributors: 2.72% | | | | | | | | | | | | | | | | |
Siteone Landscape Supply Incorporated † | | | | | | | | | | | 139,600 | | | | 10,631,936 | |
Univar Incorporated † | | | | | | | | | | | 396,228 | | | | 11,831,368 | |
| | | | |
| | | | | | | | | | | | | | | 22,463,304 | |
| | | | | | | | | | | | | | | | |
The accompanying notes are an integral part of these financial statements.
| | | | | | |
| Portfolio of investments—January 31, 2018 (unaudited) | | Wells Fargo Omega Growth Fund | | | 9 | |
| | | | | | | | | | | | | | | | |
| Security name | | | | | | | | Shares | | | Value | |
| | | | |
Information Technology: 45.02% | | | | | | | | | | | | | | | | |
| | | | |
| Electronic Equipment, Instruments & Components: 0.78% | | | | | | | | | | | | | | | | |
Littelfuse Incorporated | | | | | | | | | | | 29,600 | | | $ | 6,433,264 | |
| | | | | | | | | | | | | | | | |
| | | | |
| Internet Software & Services: 12.37% | | | | | | | | | | | | | | | | |
Alphabet Incorporated Class A † | | | | | | | | | | | 27,500 | | | | 32,511,050 | |
Alphabet Incorporated Class C † | | | | | | | | | | | 9,785 | | | | 11,447,863 | |
Box Incorporated Class A † | | | | | | | | | | | 549,200 | | | | 12,214,208 | |
Facebook Incorporated Class A † | | | | | | | | | | | 68,700 | | | | 12,839,343 | |
MercadoLibre Incorporated | | | | | | | | | | | 34,300 | | | | 13,277,530 | |
Tencent Holdings Limited ADR | | | | | | | | | | | 220,800 | | | | 13,064,736 | |
Yandex NV Class A † | | | | | | | | | | | 180,000 | | | | 6,971,400 | |
| | | | |
| | | | | | | | | | | | | | | 102,326,130 | |
| | | | | | | | | | | | | | | | |
| | | | |
| IT Services: 13.24% | | | | | | | | | | | | | | | | |
Black Knight Incorporated † | | | | | | | | | | | 168,900 | | | | 8,360,550 | |
EPAM Systems Incorporated † | | | | | | | | | | | 109,541 | | | | 12,868,877 | |
Euronet Worldwide Incorporated † | | | | | | | | | | | 125,600 | | | | 11,790,072 | |
Fidelity National Information Services Incorporated | | | | | | | | | | | 70,700 | | | | 7,236,852 | |
First Data Corporation Class A † | | | | | | | | | | | 364,200 | | | | 6,446,340 | |
FleetCor Technologies Incorporated † | | | | | | | | | | | 34,000 | | | | 7,225,000 | |
PayPal Holdings Incorporated † | | | | | | | | | | | 55,800 | | | | 4,760,856 | |
Total System Services Incorporated | | | | | | | | | | | 82,300 | | | | 7,313,178 | |
Visa Incorporated Class A | | | | | | | | | | | 247,204 | | | | 30,710,153 | |
WEX Incorporated † | | | | | | | | | | | 82,602 | | | | 12,787,616 | |
| | | | |
| | | | | | | | | | | | | | | 109,499,494 | |
| | | | | | | | | | | | | | | | |
| | | | |
| Semiconductors & Semiconductor Equipment: 3.47% | | | | | | | | | | | | | | | | |
Broadcom Limited | | | | | | | | | | | 43,100 | | | | 10,690,093 | |
Infineon Technologies AG ADR | | | | | | | | | | | 194,400 | | | | 5,669,287 | |
Teradyne Incorporated | | | | | | | | | | | 269,000 | | | | 12,330,960 | |
| | | | |
| | | | | | | | | | | | | | | 28,690,340 | |
| | | | | | | | | | | | | | | | |
| | | | |
| Software: 13.83% | | | | | | | | | | | | | | | | |
Activision Blizzard Incorporated | | | | | | | | | | | 116,200 | | | | 8,613,906 | |
Microsoft Corporation | | | | | | | | | | | 478,700 | | | | 45,481,287 | |
Nintendo Company Limited | | | | | | | | | | | 234,438 | | | | 13,381,721 | |
salesforce.com Incorporated † | | | | | | | | | | | 145,100 | | | | 16,528,341 | |
ServiceNow Incorporated † | | | | | | | | | | | 51,500 | | | | 7,666,805 | |
Take-Two Interactive Software Incorporated † | | | | | | | | | | | 135,300 | | | | 17,138,451 | |
Ultimate Software Group Incorporated † | | | | | | | | | | | 24,000 | | | | 5,589,360 | |
| | | | |
| | | | | | | | | | | | | | | 114,399,871 | |
| | | | | | | | | | | | | | | | |
| | | | |
| Technology Hardware, Storage & Peripherals: 1.33% | | | | | | | | | | | | | | | | |
NCR Corporation † | | | | | | | | | | | 294,800 | | | | 11,057,948 | |
| | | | | | | | | | | | | | | | |
| | | | |
Materials: 6.64% | | | | | | | | | | | | | | | | |
| | | | |
| Chemicals: 3.77% | | | | | | | | | | | | | | | | |
Air Products & Chemicals Incorporated | | | | | | | | | | | 71,900 | | | | 12,105,803 | |
Albemarle Corporation | | | | | | | | | | | 53,300 | | | | 5,947,747 | |
The accompanying notes are an integral part of these financial statements.
| | | | |
| 10 | | Wells Fargo Omega Growth Fund | | Portfolio of investments—January 31, 2018 (unaudited) |
| | | | | | | | | | | | | | | | |
| Security name | | | | | | | | Shares | | | Value | |
| | | | |
| Chemicals (continued) | | | | | | | | | | | | | | | | |
The Sherwin-Williams Company | | | | | | | | | | | 31,500 | | | $ | 13,138,965 | |
| | | | |
| | | | | | | | | | | | | | | 31,192,515 | |
| | | | | | | | | | | | | | | | |
| | | | |
| Construction Materials: 1.57% | | | | | | | | | | | | | | | | |
Vulcan Materials Company | | | | | | | | | | | 95,900 | | | | 12,984,860 | |
| | | | | | | | | | | | | | | | |
| | | | |
| Containers & Packaging: 1.30% | | | | | | | | | | | | | | | | |
Berry Global Group Incorporated † | | | | | | | | | | | 181,800 | | | | 10,760,742 | |
| | | | | | | | | | | | | | | | |
| | | | |
Real Estate: 0.43% | | | | | | | | | | | | | | | | |
| | | | |
| Equity REITs: 0.43% | | | | | | | | | | | | | | | | |
SBA Communications Corporation † | | | | | | | | | | | 20,500 | | | | 3,577,250 | |
| | | | | | | | | | | | | | | | |
| | | | |
Utilities: 0.73% | | | | | | | | | | | | | | | | |
| | | | |
| Water Utilities: 0.73% | | | | | | | | | | | | | | | | |
Evoqua Water Technologies Company † | | | | | | | | | | | 262,356 | | | | 5,997,458 | |
| | | | | | | | | | | | | | | | |
| | | | |
Total Common Stocks (Cost $535,713,271) | | | | | | | | | | | | | | | 823,826,982 | |
| | | | | | | | | | | | | | | | |
| | | | |
| | | Yield | | | | | | | | | | |
| Short-Term Investments: 0.94% | | | | | | | | | | | | | | | | |
| | | | |
| Investment Companies: 0.94% | | | | | | | | | | | | | | | | |
Securities Lending Cash Investment LLC (l)(r)(u) | | | 1.60 | % | | | | | | | 3,297,606 | | | | 3,297,935 | |
Wells Fargo Government Money Market Fund Select Class (l)(u) | | | 1.24 | | | | | | | | 4,490,615 | | | | 4,490,615 | |
| | | | |
Total Short-Term Investments (Cost $7,788,550) | | | | | | | | | | | | | | | 7,788,550 | |
| | | | | | | | | | | | | | | | |
| | | | | | | | |
| Total investments in securities (Cost $543,501,821) | | | 100.53 | % | | | 831,615,532 | |
Other assets and liabilities, net | | | (0.53 | ) | | | (4,422,179 | ) |
| | | | | | | | |
| Total net assets | | | 100.00 | % | | $ | 827,193,353 | |
| | | | | | | | |
| † | Non-income-earning security |
| « | All or a portion of this security is on loan. |
| (l) | The issuer of the security is an affiliated person of the Fund as defined in the Investment Company Act of 1940. |
| (r) | The investment is a non-registered investment company purchased with cash collateral received from securities on loan. |
| (u) | The rate represents the 7-day annualized yield at period end. |
Investments in Affiliates
An affiliated investment is an investment in which the Fund owns at least 5% of the outstanding voting shares of the issuer or as a result of other relationships, such as the Fund and the issuer having the same investment manager. Transactions with issuers that were either affiliated persons of the Fund at the beginning of the period or the end of the period were as follows:
| | | | | | | | | | | | | | | | | | | | | | | | | | | | | | | | | | | | |
| | | Shares,
beginning of
period | | | Shares
purchased | | | Shares sold | | | Shares, end of
period | | | Net
realized
gains
(losses) | | | Net
change in
unrealized
gains
(losses) | | | Income
from
affiliated
securities | | | Value, end of period | | | % of
net
assets | |
Short-Term Investments | | | | | | | | | | | | | | | | | | | | | | | | | | | | | | | | | | | | |
Investment Companies | | | | | | | | | | | | | | | | | | | | | | | | | | | | | | | | | | | | |
Securities Lending Cash Investment LLC | | | 3,211,364 | | | | 126,573,050 | | | | 126,486,808 | | | | 3,297,606 | | | $ | 0 | | | $ | 0 | | | $ | 21,214 | | | $ | 3,297,935 | | | | | |
Wells Fargo Government Money Market Fund Select Class | | | 370,082 | | | | 103,565,957 | | | | 99,445,424 | | | | 4,490,615 | | | | 0 | | | | 0 | | | | 28,174 | | | | 4,490,615 | | | | | |
| | | | | | | | | | | | | | | | | | | | | | | | | | | | | | | | | | | | |
| | | | | | | | | | | | | | | | | | $ | 0 | | | $ | 0 | | | $ | 49,388 | | | $ | 7,788,550 | | | | 0.94 | % |
| | | | | | | | | | | | | | | | | | | | | | | | | | | | | | | | | | | | |
The accompanying notes are an integral part of these financial statements.
| | | | | | |
| Statement of assets and liabilities—January 31, 2018 (unaudited) | | Wells Fargo Omega Growth Fund | | | 11 | |
| | | | |
| | | | |
| |
Assets | | | | |
Investments in unaffiliated securities (including $3,230,051 of securities loaned), at value (cost $535,713,271) | | $ | 823,826,982 | |
Investments in affiliated securities, at value (cost $7,788,550) | | | 7,788,550 | |
Receivable for Fund shares sold | | | 153,584 | |
Receivable for dividends | | | 14,146 | |
Receivable for securities lending income | | | 1,342 | |
Prepaid expenses and other assets | | | 73,383 | |
| | | | |
Total assets | | | 831,857,987 | |
| | | | |
| |
Liabilities | | | | |
Payable upon receipt of securities loaned | | | 3,297,900 | |
Management fee payable | | | 524,122 | |
Payable for Fund shares redeemed | | | 495,894 | |
Administration fees payable | | | 136,995 | |
Distribution fees payable | | | 43,827 | |
Trustees’ fees and expenses payable | | | 1,896 | |
Accrued expenses and other liabilities | | | 164,000 | |
| | | | |
Total liabilities | | | 4,664,634 | |
| | | | |
Total net assets | | $ | 827,193,353 | |
| | | | |
| |
NET ASSETS CONSIST OF | | | | |
Paid-in capital | | $ | 498,293,027 | |
Accumulated net investment loss | | | (5,375,988 | ) |
Accumulated net realized gains on investments | | | 46,162,603 | |
Net unrealized gains on investments | | | 288,113,711 | |
| | | | |
Total net assets | | $ | 827,193,353 | |
| | | | |
| |
COMPUTATION OF NET ASSET VALUE AND OFFERING PRICE PER SHARE | | | | |
Net assets – Class A | | $ | 663,405,122 | |
Shares outstanding – Class A1 | | | 12,686,296 | |
Net asset value per share – Class A | | | $52.29 | |
Maximum offering price per share – Class A2 | | | $55.48 | |
Net assets – Class C | | $ | 66,914,605 | |
Shares outstanding – Class C1 | | | 1,836,270 | |
Net asset value per share – Class C | | | $36.44 | |
Net assets – Class R | | $ | 8,095,971 | |
Shares outstanding – Class R1 | | | 163,102 | |
Net asset value per share – Class R | | | $49.64 | |
Net assets – Administrator Class | | $ | 23,156,337 | |
Shares outstanding – Administrator Class1 | | | 408,668 | |
Net asset value per share – Administrator Class | | | $56.66 | |
Net assets – Institutional Class | | $ | 65,621,318 | |
Shares outstanding – Institutional Class1 | | | 1,127,164 | |
Net asset value per share – Institutional Class | | | $58.22 | |
| 1 | The Fund has an unlimited number of authorized shares. |
| 2 | Maximum offering price is computed as 100/94.25 of net asset value. On investments of $50,000 or more, the offering price is reduced. |
The accompanying notes are an integral part of these financial statements.
| | | | |
| 12 | | Wells Fargo Omega Growth Fund | | Statement of operations—six months ended January 31, 2018 (unaudited) |
| | | | |
| | | | |
| |
Investment income | | | | |
Dividends (net of foreign withholding taxes of $10,914) | | $ | 2,213,223 | |
Income from affiliated securities | | | 49,388 | |
| | | | |
Total investment income | | | 2,262,611 | |
| | | | |
| |
Expenses | | | | |
Management fee | | | 2,972,992 | |
Administration fees | | | | |
Class A | | | 638,689 | |
Class C | | | 66,844 | |
Class R | | | 7,079 | |
Administrator Class | | | 12,769 | |
Institutional Class | | | 39,564 | |
Shareholder servicing fees | | | | |
Class A | | | 760,344 | |
Class C | | | 79,576 | |
Class R | | | 8,224 | |
Administrator Class | | | 24,557 | |
Distribution fees | | | | |
Class C | | | 238,728 | |
Class R | | | 8,428 | |
Custody and accounting fees | | | 21,383 | |
Professional fees | | | 26,303 | |
Registration fees | | | 42,636 | |
Shareholder report expenses | | | 19,912 | |
Trustees’ fees and expenses | | | 14,873 | |
Other fees and expenses | | | 7,038 | |
| | | | |
Total expenses | | | 4,989,939 | |
Less: Fee waivers and/or expense reimbursements | | | (39,406 | ) |
| | | | |
Net expenses | | | 4,950,533 | |
| | | | |
Net investment loss | | | (2,687,922 | ) |
| | | | |
| |
REALIZED AND UNREALIZED GAINS (LOSSES) ON INVESTMENTS | | | | |
Net realized gains on investments | | | 66,859,128 | |
Net change in unrealized gains (losses) on investments | | | 82,723,625 | |
| | | | |
Net realized and unrealized gains (losses) on investments | | | 149,582,753 | |
| | | | |
Net increase in net assets resulting from operations | | $ | 146,894,831 | |
| | | | |
The accompanying notes are an integral part of these financial statements.
| | | | | | |
| Statement of changes in net assets | | Wells Fargo Omega Growth Fund | | | 13 | |
| | | | | | | | | | | | | | | | |
| | | Six months ended
January 31, 2018 (unaudited) | | | Year ended
July 31, 2017 | |
| | | | |
Operations | | | | | | | | | | | | | | | | |
Net investment loss | | | | | | $ | (2,687,922 | ) | | | | | | $ | (3,775,501 | ) |
Net realized gains on investments | | | | | | | 66,859,128 | | | | | | | | 105,143,718 | |
Net change in unrealized gains (losses) on investments | | | | | | | 82,723,625 | | | | | | | | 20,481,932 | |
| | | | |
Net increase in net assets resulting from operations | | | | | | | 146,894,831 | | | | | | | | 121,850,149 | |
| | | | |
| | | | |
Distributions to shareholders from | | | | | | | | | | | | | | | | |
Net realized gains | | | | | | | | | | | | | | | | |
Class A | | | | | | | (78,031,972 | ) | | | | | | | (14,517,010 | ) |
Class B | | | | | | | N/A | | | | | | | | (74,045 | )1 |
Class C | | | | | | | (10,985,719 | ) | | | | | | | (2,315,756 | ) |
Class R | | | | | | | (974,995 | ) | | | | | | | (182,366 | ) |
Administrator Class | | | | | | | (2,304,666 | ) | | | | | | | (492,743 | ) |
Institutional Class | | | | | | | (6,956,178 | ) | | | | | | | (1,888,610 | ) |
| | | | |
Total distributions to shareholders | | | | | | | (99,253,530 | ) | | | | | | | (19,470,530 | ) |
| | | | |
| | | | |
Capital share transactions | | | Shares | | | | | | | | Shares | | | | | |
Proceeds from shares sold | | | | | | | | | | | | | | | | |
Class A | | | 227,325 | | | | 11,449,147 | | | | 386,109 | | | | 17,173,940 | |
Class B | | | N/A | | | | N/A | | | | 11 | 1 | | | 310 | 1 |
Class C | | | 37,282 | | | | 1,335,425 | | | | 78,754 | | | | 2,557,877 | |
Class R | | | 36,791 | | | | 1,779,354 | | | | 32,485 | | | | 1,390,762 | |
Administrator Class | | | 43,399 | | | | 2,404,258 | | | | 29,254 | | | | 1,389,488 | |
Institutional Class | | | 88,957 | | | | 5,044,912 | | | | 660,341 | | | | 31,392,598 | |
| | | | |
| | | | | | | 22,013,096 | | | | | | | | 53,904,975 | |
| | | | |
Reinvestment of distributions | | | | | | | | | | | | | | | | |
Class A | | | 1,554,465 | | | | 74,101,364 | | | | 328,215 | | | | 13,634,032 | |
Class B | | | N/A | | | | N/A | | | | 2,395 | 1 | | | 73,511 | 1 |
Class C | | | 318,920 | | | | 10,604,105 | | | | 68,889 | | | | 2,121,773 | |
Class R | | | 11,375 | | | | 514,829 | | | | 1,939 | | | | 77,183 | |
Administrator Class | | | 39,989 | | | | 2,065,019 | | | | 10,178 | | | | 452,700 | |
Institutional Class | | | 123,732 | | | | 6,562,759 | | | | 40,190 | | | | 1,825,826 | |
| | | | |
| | | | | | | 93,848,076 | | | | | | | | 18,185,025 | |
| | | | |
Payment for shares redeemed | | | | | | | | | | | | | | | | |
Class A | | | (868,772 | ) | | | (44,077,019 | ) | | | (2,356,992 | ) | | | (103,241,366 | ) |
Class B | | | N/A | | | | N/A | | | | (111,214 | )1 | | | (3,587,613 | )1 |
Class C | | | (234,610 | ) | | | (8,599,170 | ) | | | (751,077 | ) | | | (24,503,753 | ) |
Class R | | | (18,234 | ) | | | (864,679 | ) | | | (147,893 | ) | | | (6,089,364 | ) |
Administrator Class | | | (47,487 | ) | | | (2,569,202 | ) | | | (500,001 | ) | | | (22,798,416 | ) |
Institutional Class | | | (247,437 | ) | | | (13,748,926 | ) | | | (1,192,233 | ) | | | (56,958,674 | ) |
| | | | |
| | | | | | | (69,858,996 | ) | | | | | | | (217,179,186 | ) |
| | | | |
Net increase (decrease) in net assets resulting from capital share transactions | | | | | | | 46,002,176 | | | | | | | | (145,089,186 | ) |
| | | | |
Total increase (decrease) in net assets | | | | | | | 93,643,477 | | | | | | | | (42,709,567 | ) |
| | | | |
| | | | |
Net assets | | | | | | | | | | | | | | | | |
Beginning of period | | | | | | | 733,549,876 | | | | | | | | 776,259,443 | |
| | | | |
End of period | | | | | | $ | 827,193,353 | | | | | | | $ | 733,549,876 | |
| | | | |
Accumulated net investment loss | | | | | | $ | (5,375,988 | ) | | | | | | $ | (2,688,066 | ) |
| | | | |
| 1 | For the period from August 1, 2016 to May 5, 2017. Effective at the close of business on May 5, 2017, Class B shares were converted to Class A shares and are no longer offered by the Fund. |
The accompanying notes are an integral part of these financial statements.
| | | | |
| 14 | | Wells Fargo Omega Growth Fund | | Financial highlights |
(For a share outstanding throughout each period)
| | | | | | | | | | | | | | | | | | | | | | | | |
| | | Six months ended
January 31, 2018 (unaudited) | | | Year ended July 31 | |
| CLASS A | | | 2017 | | | 2016 | | | 2015 | | | 2014 | | | 2013 | |
Net asset value, beginning of period | | | $49.43 | | | | $42.73 | | | | $48.29 | | | | $49.99 | | | | $47.97 | | | | $39.09 | |
Net investment loss | | | (0.17 | )1 | | | (0.22 | )1 | | | (0.19 | )1 | | | (0.28 | )1 | | | (0.49 | ) | | | (0.02 | ) |
Net realized and unrealized gains (losses) on investments | | | 9.94 | | | | 8.07 | | | | (1.44 | ) | | | 5.12 | | | | 8.28 | | | | 10.31 | |
| | | | | | | | | | | | | | | | | | | | | | | | |
Total from investment operations | | | 9.77 | | | | 7.85 | | | | (1.63 | ) | | | 4.84 | | | | 7.79 | | | | 10.29 | |
Distributions to shareholders from | | | | | | | | | | | | | | | | | | | | | | | | |
Net realized gains | | | (6.91 | ) | | | (1.15 | ) | | | (3.93 | ) | | | (6.54 | ) | | | (5.77 | ) | | | (1.41 | ) |
Net asset value, end of period | | | $52.29 | | | | $49.43 | | | | $42.73 | | | | $48.29 | | | | $49.99 | | | | $47.97 | |
Total return2 | | | 21.12 | % | | | 18.88 | % | | | (3.07 | )% | | | 10.65 | % | | | 16.58 | % | | | 27.07 | % |
Ratios to average net assets (annualized) | | | | | | | | | | | | | | | | | | | | | | | | |
Gross expenses | | | 1.28 | % | | | 1.28 | % | | | 1.28 | % | | | 1.32 | % | | | 1.32 | % | | | 1.34 | % |
Net expenses | | | 1.28 | % | | | 1.28 | % | | | 1.28 | % | | | 1.30 | % | | | 1.30 | % | | | 1.30 | % |
Net investment loss | | | (0.68 | )% | | | (0.50 | )% | | | (0.47 | )% | | | (0.58 | )% | | | (0.84 | )% | | | (0.08 | )% |
Supplemental data | | | | | | | | | | | | | | | | | | | | | | | | |
Portfolio turnover rate | | | 30 | % | | | 76 | % | | | 84 | % | | | 94 | % | | | 101 | % | | | 88 | % |
Net assets, end of period (000s omitted) | | | $663,405 | | | | $581,967 | | | | $573,304 | | | | $685,005 | | | | $724,071 | | | | $668,992 | |
| 1 | Calculated based upon average shares outstanding |
| 2 | Total return calculations do not include any sales charges. Returns for periods of less than one year are not annualized. |
The accompanying notes are an integral part of these financial statements.
| | | | | | |
| Financial highlights | | Wells Fargo Omega Growth Fund | | | 15 | |
(For a share outstanding throughout each period)
| | | | | | | | | | | | | | | | | | | | | | | | |
| | | Six months ended
January 31, 2018 (unaudited) | | | Year ended July 31 | |
| CLASS C | | | 2017 | | | 2016 | | | 2015 | | | 2014 | | | 2013 | |
Net asset value, beginning of period | | | $36.47 | | | | $32.07 | | | | $37.55 | | | | $40.56 | | | | $40.15 | | | | $33.18 | |
Net investment loss | | | (0.27 | )1 | | | (0.41 | )1 | | | (0.39 | )1 | | | (0.51 | )1 | | | (0.65 | )1 | | | (0.31 | )1 |
Net realized and unrealized gains (losses) on investments | | | 7.15 | | | | 5.96 | | | | (1.16 | ) | | | 4.04 | | | | 6.83 | | | | 8.69 | |
| | | | | | | | | | | | | | | | | | | | | | | | |
Total from investment operations | | | 6.88 | | | | 5.55 | | | | (1.55 | ) | | | 3.53 | | | | 6.18 | | | | 8.38 | |
Distributions to shareholders from | | | | | | | | | | | | | | | | | | | | | | | | |
Net realized gains | | | (6.91 | ) | | | (1.15 | ) | | | (3.93 | ) | | | (6.54 | ) | | | (5.77 | ) | | | (1.41 | ) |
Net asset value, end of period | | | $36.44 | | | | $36.47 | | | | $32.07 | | | | $37.55 | | | | $40.56 | | | | $40.15 | |
Total return2 | | | 20.65 | % | | | 18.00 | % | | | (3.75 | )% | | | 9.79 | % | | | 15.73 | % | | | 26.11 | % |
Ratios to average net assets (annualized) | | | | | | | | | | | | | | | | | | | | | | | | |
Gross expenses | | | 2.03 | % | | | 2.03 | % | | | 2.03 | % | | | 2.07 | % | | | 2.07 | % | | | 2.09 | % |
Net expenses | | | 2.03 | % | | | 2.03 | % | | | 2.03 | % | | | 2.05 | % | | | 2.05 | % | | | 2.05 | % |
Net investment loss | | | (1.43 | )% | | | (1.24 | )% | | | (1.22 | )% | | | (1.33 | )% | | | (1.59 | )% | | | (0.85 | )% |
Supplemental data | | | | | | | | | | | | | | | | | | | | | | | | |
Portfolio turnover rate | | | 30 | % | | | 76 | % | | | 84 | % | | | 94 | % | | | 101 | % | | | 88 | % |
Net assets, end of period (000s omitted) | | | $66,915 | | | | $62,543 | | | | $74,337 | | | | $99,100 | | | | $108,073 | | | | $83,206 | |
| 1 | Calculated based upon average shares outstanding |
| 2 | Total return calculations do not include any sales charges. Returns for periods of less than one year are not annualized. |
The accompanying notes are an integral part of these financial statements.
| | | | |
| 16 | | Wells Fargo Omega Growth Fund | | Financial highlights |
(For a share outstanding throughout each period)
| | | | | | | | | | | | | | | | | | | | | | | | |
| | | Six months ended
January 31, 2018 (unaudited) | | | Year ended July 31 | |
| CLASS R | | | 2017 | | | 2016 | | | 2015 | | | 2014 | | | 2013 | |
Net asset value, beginning of period | | | $47.30 | | | | $41.04 | | | | $46.66 | | | | $48.62 | | | | $46.90 | | | | $38.35 | |
Net investment loss | | | (0.23 | )1 | | | (0.30 | )1 | | | (0.29 | )1 | | | (0.39 | )1 | | | (0.53 | )1 | | | (0.09 | ) |
Net realized and unrealized gains (losses) on investments | | | 9.48 | | | | 7.71 | | | | (1.40 | ) | | | 4.97 | | | | 8.02 | | | | 10.05 | |
| | | | | | | | | | | | | | | | | | | | | | | | |
Total from investment operations | | | 9.25 | | | | 7.41 | | | | (1.69 | ) | | | 4.58 | | | | 7.49 | | | | 9.96 | |
Distributions to shareholders from | | | | | | | | | | | | | | | | | | | | | | | | |
Net realized gains | | | (6.91 | ) | | | (1.15 | ) | | | (3.93 | ) | | | (6.54 | ) | | | (5.77 | ) | | | (1.41 | ) |
Net asset value, end of period | | | $49.64 | | | | $47.30 | | | | $41.04 | | | | $46.66 | | | | $48.62 | | | | $46.90 | |
Total return2 | | | 20.97 | % | | | 18.58 | % | | | (3.30 | )% | | | 10.38 | % | | | 16.30 | % | | | 26.73 | % |
Ratios to average net assets (annualized) | | | | | | | | | | | | | | | | | | | | | | | | |
Gross expenses | | | 1.52 | % | | | 1.53 | % | | | 1.53 | % | | | 1.57 | % | | | 1.57 | % | | | 1.59 | % |
Net expenses | | | 1.52 | % | | | 1.53 | % | | | 1.53 | % | | | 1.55 | % | | | 1.55 | % | | | 1.55 | % |
Net investment loss | | | (0.94 | )% | | | (0.72 | )% | | | (0.71 | )% | | | (0.83 | )% | | | (1.09 | )% | | | (0.38 | )% |
Supplemental data | | | | | | | | | | | | | | | | | | | | | | | | |
Portfolio turnover rate | | | 30 | % | | | 76 | % | | | 84 | % | | | 94 | % | | | 101 | % | | | 88 | % |
Net assets, end of period (000s omitted) | | | $8,096 | | | | $6,298 | | | | $10,122 | | | | $17,199 | | | | $20,095 | | | | $23,745 | |
| 1 | Calculated based upon average shares outstanding |
| 2 | Returns for periods of less than one year are not annualized. |
The accompanying notes are an integral part of these financial statements.
| | | | | | |
| Financial highlights | | Wells Fargo Omega Growth Fund | | | 17 | |
(For a share outstanding throughout each period)
| | | | | | | | | | | | | | | | | | | | | | | | |
| | | Six months ended
January 31, 2018 (unaudited) | | | Year ended July 31 | |
| ADMINISTRATOR CLASS | | | 2017 | | | 2016 | | | 2015 | | | 2014 | | | 2013 | |
Net asset value, beginning of period | | | $52.99 | | | | $45.65 | | | | $51.20 | | | | $52.50 | | | | $50.00 | | | | $40.60 | |
Net investment income (loss) | | | (0.14 | )1 | | | (0.12 | )1 | | | (0.12 | )1 | | | (0.17 | )1 | | | (0.31 | )1 | | | 0.07 | 1 |
Net realized and unrealized gains (losses) on investments | | | 10.72 | | | | 8.61 | | | | (1.50 | ) | | | 5.41 | | | | 8.58 | | | | 10.74 | |
| | | | | | | | | | | | | | | | | | | | | | | | |
Total from investment operations | | | 10.58 | | | | 8.49 | | | | (1.62 | ) | | | 5.24 | | | | 8.27 | | | | 10.81 | |
Distributions to shareholders from | | | | | | | | | | | | | | | | | | | | | | | | |
Net realized gains | | | (6.91 | ) | | | (1.15 | ) | | | (3.93 | ) | | | (6.54 | ) | | | (5.77 | ) | | | (1.41 | ) |
Net asset value, end of period | | | $56.66 | | | | $52.99 | | | | $45.65 | | | | $51.20 | | | | $52.50 | | | | $50.00 | |
Total return2 | | | 21.23 | % | | | 19.08 | % | | | (2.84 | )% | | | 10.91 | % | | | 16.89 | % | | | 27.35 | % |
Ratios to average net assets (annualized) | | | | | | | | | | | | | | | | | | | | | | | | |
Gross expenses | | | 1.20 | % | | | 1.20 | % | | | 1.19 | % | | | 1.15 | % | | | 1.15 | % | | | 1.17 | % |
Net expenses | | | 1.10 | % | | | 1.10 | % | | | 1.08 | % | | | 1.05 | % | | | 1.05 | % | | | 1.05 | % |
Net investment income (loss) | | | (0.50 | )% | | | (0.25 | )% | | | (0.27 | )% | | | (0.33 | )% | | | (0.59 | )% | | | 0.16 | % |
Supplemental data | | | | | | | | | | | | | | | | | | | | | | | | |
Portfolio turnover rate | | | 30 | % | | | 76 | % | | | 84 | % | | | 94 | % | | | 101 | % | | | 88 | % |
Net assets, end of period (000s omitted) | | | $23,156 | | | | $19,754 | | | | $38,039 | | | | $86,756 | | | | $115,281 | | | | $69,264 | |
| 1 | Calculated based upon average shares outstanding |
| 2 | Returns for periods of less than one year are not annualized. |
The accompanying notes are an integral part of these financial statements.
| | | | |
| 18 | | Wells Fargo Omega Growth Fund | | Financial highlights |
(For a share outstanding throughout each period)
| | | | | | | | | | | | | | | | | | | | | | | | |
| | | Six months ended
January 31, 2018 (unaudited) | | | Year ended July 31 | |
| INSTITUTIONAL CLASS | | | 2017 | | | 2016 | | | 2015 | | | 2014 | | | 2013 | |
Net asset value, beginning of period | | | $54.21 | | | | $46.55 | | | | $52.01 | | | | $53.10 | | | | $50.40 | | | | $40.81 | |
Net investment income (loss) | | | (0.07 | )1 | | | (0.03 | )1 | | | (0.00 | )2 | | | (0.04 | )1 | | | (0.24 | ) | | | 0.11 | 1 |
Net realized and unrealized gains (losses) on investments | | | 10.99 | | | | 8.84 | | | | (1.53 | ) | | | 5.49 | | | | 8.71 | | | | 10.89 | |
| | | | | | | | | | | | | | | | | | | | | | | | |
Total from investment operations | | | 10.92 | | | | 8.81 | | | | (1.53 | ) | | | 5.45 | | | | 8.47 | | | | 11.00 | |
Distributions to shareholders from | | | | | | | | | | | | | | | | | | | | | | | | |
Net realized gains | | | (6.91 | ) | | | (1.15 | ) | | | (3.93 | ) | | | (6.54 | ) | | | (5.77 | ) | | | (1.41 | ) |
Net asset value, end of period | | | $58.22 | | | | $54.21 | | | | $46.55 | | | | $52.01 | | | | $53.10 | | | | $50.40 | |
Total return3 | | | 21.39 | % | | | 19.40 | % | | | (2.61 | )% | | | 11.20 | % | | | 17.17 | % | | | 27.68 | % |
Ratios to average net assets (annualized) | | | | | | | | | | | | | | | | | | | | | | | | |
Gross expenses | | | 0.95 | % | | | 0.95 | % | | | 0.95 | % | | | 0.90 | % | | | 0.89 | % | | | 0.91 | % |
Net expenses | | | 0.85 | % | | | 0.85 | % | | | 0.83 | % | | | 0.80 | % | | | 0.80 | % | | | 0.80 | % |
Net investment income (loss) | | | (0.25 | )% | | | (0.06 | )% | | | (0.01 | )% | | | (0.09 | )% | | | (0.36 | )% | | | 0.24 | % |
Supplemental data | | | | | | | | | | | | | | | | | | | | | | | | |
Portfolio turnover rate | | | 30 | % | | | 76 | % | | | 84 | % | | | 94 | % | | | 101 | % | | | 88 | % |
Net assets, end of period (000s omitted) | | | $65,621 | | | | $62,987 | | | | $76,980 | | | | $87,085 | | | | $49,960 | | | | $3,507 | |
| 1 | Calculated based upon average shares outstanding |
| 2 | Amount is less than $0.005. |
| 3 | Returns for periods of less than one year are not annualized. |
The accompanying notes are an integral part of these financial statements.
| | | | | | |
| Notes to financial statements (unaudited) | | Wells Fargo Omega Growth Fund | | | 19 | |
1. ORGANIZATION
Wells Fargo Funds Trust (the “Trust”), a Delaware statutory trust organized on March 10, 1999, is an open-end management investment company registered under the Investment Company Act of 1940, as amended (the “1940 Act”). As an investment company, the Trust follows the accounting and reporting guidance in Financial Accounting Standards Board Accounting Standards Codification Topic 946, Financial Services – Investment Companies. These financial statements report on the Wells Fargo Omega Growth Fund (the “Fund”) which is a diversified series of the Trust.
Effective at the close of business on May 5, 2017, Class B shares were converted to Class A shares and are no longer offered by the Fund. Information for Class B shares reflected in the financial statements represents activity through May 5, 2017.
2. SIGNIFICANT ACCOUNTING POLICIES
The following significant accounting policies, which are consistently followed in the preparation of the financial statements of the Fund, are in conformity with U.S. generally accepted accounting principles which require management to make estimates and assumptions that affect the reported amounts of assets and liabilities, disclosure of contingent assets and liabilities at the date of the financial statements, and the reported amounts of revenues and expenses during the reporting period. Actual results could differ from those estimates.
Securities valuation
All investments are valued each business day as of the close of regular trading on the New York Stock Exchange (generally 4 p.m. Eastern Time), although the Fund may deviate from this calculation time under unusual or unexpected circumstances.
Equity securities that are listed on a foreign or domestic exchange or market are valued at the official closing price or, if none, the last sales price. If no sale occurs on the principal exchange or market that day, a fair value price will be determined in accordance with the Fund’s Valuation Procedures.
Investments in registered open-end investment companies are valued at net asset value. Interests in non-registered investment companies that are redeemable at net asset value are fair valued normally at net asset value.
Investments which are not valued using any of the methods discussed above are valued at their fair value, as determined in good faith by the Board of Trustees of the Fund. The Board of Trustees has established a Valuation Committee comprised of the Trustees and has delegated to it the authority to take any actions regarding the valuation of portfolio securities that the Valuation Committee deems necessary or appropriate, including determining the fair value of portfolio securities, unless the determination has been delegated to the Wells Fargo Asset Management Pricing Committee of Wells Fargo Funds Management, LLC (“Funds Management”). The Board of Trustees retains the authority to make or ratify any valuation decisions or approve any changes to the Valuation Procedures as it deems appropriate. On a quarterly basis, the Board of Trustees receives reports on any valuation actions taken by the Valuation Committee or the Wells Fargo Asset Management Pricing Committee which may include items for ratification.
Valuations of fair valued securities are compared to the next actual sales price when available, or other appropriate market values, to assess the continued appropriateness of the fair valuation methodologies used. These securities are fair valued on a day-to-day basis, taking into consideration changes to appropriate market information and any significant changes to the inputs considered in the valuation process until there is a readily available price provided on an exchange or by an independent pricing service. Valuations received from an independent pricing service or independent broker-dealer quotes are periodically validated by comparisons to most recent trades and valuations provided by other independent pricing services in addition to the review of prices by the manager and/or subadviser. Unobservable inputs used in determining fair valuations are identified based on the type of security, taking into consideration factors utilized by market participants in valuing the investment, knowledge about the issuer and the current market environment.
Security loans
The Fund may lend its securities from time to time in order to earn additional income in the form of fees or interest on securities received as collateral or the investment of any cash received as collateral. The Fund continues to receive interest or dividends on the securities loaned. The Fund receives collateral in the form of cash or securities with a value at least equal to the value of the securities on loan. The value of the loaned securities is determined at the close of each business day and any additional required collateral is delivered to the Fund on the next business day. In a securities lending transaction, the net asset value of the Fund will be affected by an increase or decrease in the value of the securities loaned and by an increase or decrease in the value of the instrument in which collateral is invested. The amount of securities lending activity undertaken by the Fund fluctuates from time to time. In the event of default or bankruptcy by the borrower, the Fund may be prevented from recovering the loaned securities or gaining access to the collateral or
| | | | |
| 20 | | Wells Fargo Omega Growth Fund | | Notes to financial statements (unaudited) |
may experience delays or costs in doing so. In addition, the investment of any cash collateral received may lose all or part of its value. The Fund has the right under the lending agreement to recover the securities from the borrower on demand.
The Fund lends its securities through an unaffiliated securities lending agent. Cash collateral received in connection with its securities lending transactions is invested in Securities Lending Cash Investments, LLC (the “Securities Lending Fund”). The Securities Lending Fund is exempt from registration under Section 3(c)(7) of the 1940 Act and is managed by Funds Management and is subadvised by Wells Capital Management Incorporated (“WellsCap”), an affiliate of Funds Management and an indirect wholly owned subsidiary of Wells Fargo & Company (“Wells Fargo”). Funds Management receives an advisory fee starting at 0.05% and declining to 0.01% as the average daily net assets of the Securities Lending Fund increase. All of the fees received by Funds Management are paid to WellsCap for its services as subadviser. The Securities Lending Fund seeks to provide a positive return compared to the daily Fed Funds Open Rate by investing in high-quality, U.S. dollar-denominated short-term money market instruments. Securities Lending Fund investments are valued at the evaluated bid price provided by an independent pricing service. Income earned from investment in the Securities Lending Fund is included in income from affiliated securities on the Statement of Operations.
Security transactions and income recognition
Securities transactions are recorded on a trade date basis. Realized gains or losses are recorded on the basis of identified cost.
Dividend income is recognized on the ex-dividend date. Dividend income is recorded net of foreign taxes withheld where recovery of such taxes is not assured.
Distributions to shareholders
Distributions to shareholders from net investment income and net realized gains, if any, are recorded on the ex-dividend date. Such distributions are determined in accordance with income tax regulations and may differ from U.S. generally accepted accounting principles. Dividend sources are estimated at the time of declaration. The tax character of distributions is determined as of the Fund’s fiscal year end. Therefore, a portion of the Fund’s distributions made prior to the Fund’s fiscal year end may be categorized as a tax return of capital.
Federal and other taxes
The Fund intends to continue to qualify as a regulated investment company by distributing substantially all of its investment company taxable income and any net realized capital gains (after reduction for capital loss carryforwards) sufficient to relieve it from all, or substantially all, federal income taxes. Accordingly, no provision for federal income taxes was required.
The Fund’s income and federal excise tax returns and all financial records supporting those returns for the prior three fiscal years are subject to examination by the federal and Delaware revenue authorities. Management has analyzed the Fund’s tax positions taken on federal, state, and foreign tax returns for all open tax years and does not believe that there are any uncertain tax positions that require recognition of a tax liability.
As of January 31, 2018, the aggregate cost of all investments for federal income tax purposes was $543,417,698 and the unrealized gains (losses) consisted of:
| | | | |
Gross unrealized gains | | $ | 294,724,616 | |
Gross unrealized losses | | | (6,526,782 | ) |
Net unrealized gains | | $ | 288,197,834 | |
As of July 31, 2017, the Fund had a qualified late-year ordinary loss of $2,664,388 which was recognized on the first day of the current fiscal year.
Class allocations
The separate classes of shares offered by the Fund differ principally in applicable sales charges, distribution, shareholder servicing, and administration fees. Class specific expenses are charged directly to that share class. Investment income, common expenses, and realized and unrealized gains (losses) on investments are allocated daily to each class of shares based on the relative proportion of net assets of each class.
3. FAIR VALUATION MEASUREMENTS
Fair value measurements of investments are determined within a framework that has established a fair value hierarchy based upon the various data inputs utilized in determining the value of the Fund’s investments. The three-level hierarchy
| | | | | | |
| Notes to financial statements (unaudited) | | Wells Fargo Omega Growth Fund | | | 21 | |
gives the highest priority to unadjusted quoted prices in active markets for identical assets or liabilities (Level 1) and the lowest priority to unobservable inputs (Level 3). The Fund’s investments are classified within the fair value hierarchy based on the lowest level of input that is significant to the fair value measurement. The inputs are summarized into three broad levels as follows:
| ∎ | | Level 1 – quoted prices in active markets for identical securities |
| ∎ | | Level 2 – other significant observable inputs (including quoted prices for similar securities, interest rates, prepayment speeds, credit risk, etc.) |
| ∎ | | Level 3 – significant unobservable inputs (including the Fund’s own assumptions in determining the fair value of investments) |
The inputs or methodologies used for valuing investments in securities are not necessarily an indication of the risk associated with investing in those securities.
The following is a summary of the inputs used in valuing the Fund’s assets and liabilities as of January 31, 2018:
| | | | | | | | | | | | | | | | |
| | | Quoted prices
(Level 1) | | | Other significant
observable inputs
(Level 2) | | | Significant
unobservable inputs (Level 3) | | | Total | |
Assets | | | | | | | | | | | | | | | | |
Investments in: | | | | | | | | | | | | | | | | |
| | | | |
Common stocks | | | | | | | | | | | | | | | | |
Consumer discretionary | | $ | 138,320,671 | | | $ | 0 | | | $ | 0 | | | $ | 138,320,671 | |
Consumer staples | | | 13,610,129 | | | | 0 | | | | 0 | | | | 13,610,129 | |
Energy | | | 5,743,374 | | | | 0 | | | | 0 | | | | 5,743,374 | |
Financials | | | 37,312,954 | | | | 0 | | | | 0 | | | | 37,312,954 | |
Health care | | | 82,174,654 | | | | 0 | | | | 0 | | | | 82,174,654 | |
Industrials | | | 109,745,328 | | | | 0 | | | | 0 | | | | 109,745,328 | |
Information technology | | | 372,407,047 | | | | 0 | | | | 0 | | | | 372,407,047 | |
Materials | | | 54,938,117 | | | | 0 | | | | 0 | | | | 54,938,117 | |
Real estate | | | 3,577,250 | | | | 0 | | | | 0 | | | | 3,577,250 | |
Utilities | | | 5,997,458 | | | | 0 | | | | 0 | | | | 5,997,458 | |
| | | | |
Short-term investments | | | | | | | | | | | | | | | | |
Investment companies | | | 4,490,615 | | | | 0 | | | | 0 | | | | 4,490,615 | |
Investments measured at net asset value* | | | | | | | | | | | | | | | 3,297,935 | |
Total assets | | $ | 828,317,597 | | | $ | 0 | | | $ | 0 | | | $ | 831,615,532 | |
| * | Investments that are measured at fair value using the net asset value per share (or its equivalent) as a practical expedient have not been categorized in the fair value hierarchy. The fair value amount presented in the table is intended to permit reconciliation of the fair value hierarchy to the amounts presented in the Statement of Assets and Liabilities. The Fund’s investment in Securities Lending Cash Investments, LLC valued at $3,297,935 does not have a redemption period notice, can be redeemed daily and does not have any unfunded commitments. |
The Fund recognizes transfers between levels within the fair value hierarchy at the end of the reporting period. At January 31, 2018, the Fund did not have any transfers into/out of Level 1, Level 2, or Level 3.
4. TRANSACTIONS WITH AFFILIATES
Management fee
Funds Management, an indirect wholly owned subsidiary of Wells Fargo, is the manager of the Fund and provides advisory and fund-level administrative services under an investment management agreement. Under the investment management agreement, Funds Management is responsible for, among other services, implementing the investment objectives and strategies of the Fund, supervising the subadviser, providing fund-level administrative services in connection with the Fund’s operations, and providing any other fund-level administrative services reasonably necessary for the operation of the Fund. As compensation for its services under the investment management agreement, Funds Management is entitled to receive an annual management fee starting at 0.80% and declining to 0.555% as the average daily net assets of the Fund increase. For the six months ended January 31, 2018, the management fee was equivalent to an annual rate of 0.78% of the Fund’s average daily net assets.
| | | | |
| 22 | | Wells Fargo Omega Growth Fund | | Notes to financial statements (unaudited) |
Funds Management has retained the services of a subadviser to provide daily portfolio management to the Fund. The fee for subadvisory services is borne by Funds Management. WellsCap is the subadviser to the Fund and is entitled to receive a fee from Funds Management at an annual rate starting at 0.45% and declining to 0.30% as the average daily net assets of the Fund increase.
Administration fees
Under a class-level administration agreement, Funds Management provides class-level administrative services to the Fund, which includes paying fees and expenses for services provided by the transfer agent, sub-transfer agents, omnibus account servicers and record-keepers. As compensation for its services under the class-level administration agreement, Funds Management receives an annual fee which is calculated based on the average daily net assets of each class as follows:
| | | | |
| | | Class-level
administration fee | |
Class A, Class C, Class R | | | 0.21 | % |
Administrator Class, Institutional Class | | | 0.13 | |
Funds Management has contractually waived and/or reimbursed management and administration fees to the extent necessary to maintain certain net operating expense ratios for the Fund. Waiver of fees and/or reimbursement of expenses by Funds Management were made first from fund level expenses on a proportionate basis and then from class specific expenses. Funds Management has committed through November 30, 2018 to waive fees and/or reimburse expenses to the extent necessary to cap the Fund’s expenses at 1.30% for Class A shares, 2.05% for Class C shares, 1.55% for Class R shares, 1.10% for Administrator Class shares, and 0.85% for Institutional Class shares. After this time, the cap may be increased or the commitment to maintain the cap may be terminated only with the approval of the Board of Trustees.
Distribution fees
The Trust has adopted a distribution plan for Class C and Class R shares of the Fund pursuant to Rule 12b-1 under the 1940 Act. Distribution fees are charged to Class C and Class R shares and paid to Wells Fargo Funds Distributor, LLC (“Funds Distributor”), the principal underwriter, at an annual rate of 0.75% of the average daily net assets of Class C shares and 0.25% of the average daily net assets of Class R shares.
In addition, Funds Distributor is entitled to receive the front-end sales charge from the purchase of Class A shares and a contingent deferred sales charge on the redemption of certain Class A shares. Funds Distributor is also entitled to receive the contingent deferred sales charges from redemptions of Class C shares. For the six months ended January 31, 2018, Funds Distributor received $8,000 from the sale of Class A shares and $58 in contingent deferred sales charges from redemptions of Class C shares, respectively. No contingent deferred sales charges were incurred by Class A for the six months ended January 31, 2018.
Shareholder servicing fees
The Trust has entered into contracts with one or more shareholder servicing agents, whereby Class A, Class C, Class R, and Administrator Class of the Fund are charged a fee at an annual rate of 0.25% of the average daily net assets of each respective class.
A portion of these total shareholder servicing fees were paid to affiliates of Wells Fargo.
Interfund transactions
The Fund may purchase or sell portfolio investment securities to certain other Wells Fargo affiliates pursuant to Rule 17a-7 under the 1940 Act and under procedures adopted by the Board of Trustees. The procedures have been designed to ensure that these interfund transactions, which do not incur broker commissions, are effected at current market prices.
5. INVESTMENT PORTFOLIO TRANSACTIONS
Purchases and sales of investments, excluding U.S. government obligations (if any) and short-term securities, for the six months ended January 31, 2018 were $223,178,007 and $284,733,908, respectively.
6. BANK BORROWINGS
The Trust (excluding the money market funds and certain other funds) and Wells Fargo Variable Trust are parties to a $280,000,000 revolving credit agreement whereby the Fund is permitted to use bank borrowings for temporary or
| | | | | | |
| Notes to financial statements (unaudited) | | Wells Fargo Omega Growth Fund | | | 23 | |
emergency purposes, such as to fund shareholder redemption requests. Interest under the credit agreement is charged to the Fund based on a borrowing rate equal to the higher of the Federal Funds rate in effect on that day plus 1.25% or the overnight LIBOR rate in effect on that day plus 1.25%. In addition, an annual commitment fee equal to 0.25% of the unused balance is allocated to each participating fund. Prior to August 29, 2017, the revolving credit agreement amount was $250,000,000.
For the six months ended January 31, 2018, there were no borrowings by the Fund under the agreement.
7. CONCENTRATION RISK
Concentration risks result from exposure to a limited number of sectors. A fund that invests a substantial portion of its assets in any sector may be more affected by changes in that sector than would be a fund whose investments are not heavily weighted in any sector.
8. INDEMNIFICATION
Under the Trust’s organizational documents, the officers and Trustees have been granted certain indemnification rights against certain liabilities that may arise out of performance of their duties to the Trust. Additionally, in the normal course of business, the Trust may enter into contracts with service providers that contain a variety of indemnification clauses. The Trust’s maximum exposure under these arrangements is dependent on future claims that may be made against the Fund and, therefore, cannot be estimated.
| | | | |
| 24 | | Wells Fargo Omega Growth Fund | | Other information (unaudited) |
PROXY VOTING INFORMATION
A description of the policies and procedures that the Fund uses to determine how to vote proxies relating to portfolio securities is available, upon request, by calling 1-800-222-8222, visiting our website at wellsfargofunds.com, or visiting the SEC website at sec.gov. Information regarding how the Fund voted proxies relating to portfolio securities during the most recent 12-month period ended June 30 is available on the Fund’s website at wellsfargofunds.com or by visiting the SEC website at sec.gov.
PORTFOLIO HOLDINGS INFORMATION
The complete portfolio holdings for the Fund are publicly available monthly on the Fund’s website (wellsfargofunds.com), on a one-month delayed basis. In addition, top ten holdings information (excluding derivative positions) for the Fund is publicly available on the Fund’s website on a monthly, seven-day or more delayed basis. The Fund files its complete schedule of portfolio holdings with the SEC for the first and third quarters of each fiscal year on Form N-Q, which is available by visiting the SEC website at sec.gov. In addition, the Fund’s Form N-Q may be reviewed and copied at the SEC’s Public Reference Room in Washington, DC, and at regional offices in New York City, at 233 Broadway, and in Chicago, at 175 West Jackson Boulevard, Suite 900. Information about the Public Reference Room may be obtained by calling 1-800-SEC-0330.
| | | | | | |
| Other information (unaudited) | | Wells Fargo Omega Growth Fund | | | 25 | |
BOARD OF TRUSTEES AND OFFICERS
Each of the Trustees and Officers1 listed in the table below acts in identical capacities for each fund in the Wells Fargo family of funds, which consists of 153 mutual funds comprising the Wells Fargo Funds Trust, Wells Fargo Variable Trust, Wells Fargo Master Trust and four closed-end funds (collectively the “Fund Complex”). This table should be read in conjunction with the Prospectus and the Statement of Additional Information2. The mailing address of each Trustee and Officer is 525 Market Street, 12th Floor, San Francisco, CA 94105. Each Trustee and Officer serves an indefinite term, however, each Trustee serves such term until reaching the mandatory retirement age established by the Trustees.
Independent Trustees
| | | | | | |
Name and year of birth | | Position held and length of service* | | Principal occupations during past five years or longer | | Current other public company or investment company
directorships |
William R. Ebsworth (Born 1957) | | Trustee, since 2015 | | Retired. From 1984 to 2013, equities analyst, portfolio manager, research director and chief investment officer at Fidelity Management and Research Company in Boston, Tokyo, and Hong Kong, and retired in 2013 as Chief Investment Officer of Fidelity Strategic Advisers, Inc. where he led a team of investment professionals managing client assets. Prior thereto, Board member of Hong Kong Securities Clearing Co., Hong Kong Options Clearing Corp., the Thailand International Fund, Ltd., Fidelity Investments Life Insurance Company, and Empire Fidelity Investments Life Insurance Company. Board member of the Forté Foundation (non-profit organization) and the Vincent Memorial Hospital Endowment (non-profit organization), where he serves on the Investment Committee and as a Chair of the Audit Committee. Mr. Ebsworth is a CFA® charterholder. | | Asset Allocation Trust |
Jane A. Freeman** (Born 1953) | | Trustee, since 2015; Chair Liaison, since 2018 | | Retired. From 2012 to 2014 and 1999 to 2008, Chief Financial Officer of Scientific Learning Corporation. From 2008 to 2012, Ms. Freeman provided consulting services related to strategic business projects. Prior to 1999, Portfolio Manager at Rockefeller & Co. and Scudder, Stevens & Clark. Board member of the Harding Loevner Funds from 1996 to 2014, serving as both Lead Independent Director and chair of the Audit Committee. Board member of the Russell Exchange Traded Funds Trust from 2011 to 2012 and the chair of the Audit Committee. Ms. Freeman is a Board Member of Ruth Bancroft Garden (non-profit organization) and the Glimmerglass Festival. She is also an inactive Chartered Financial Analyst. | | Asset Allocation Trust |
Isaiah Harris, Jr. (Born 1952) | | Trustee, since 2009 | | Retired. Chairman of the Board of CIGNA Corporation since 2009, and Director since 2005. From 2003 to 2011, Director of Deluxe Corporation. Prior thereto, President and CEO of BellSouth Advertising and Publishing Corp. from 2005 to 2007, President and CEO of BellSouth Enterprises from 2004 to 2005 and President of BellSouth Consumer Services from 2000 to 2003. Emeritus member of the Iowa State University Foundation Board of Governors. Emeritus Member of the Advisory Board of Iowa State University School of Business. Advisory Board Member, Palm Harbor Academy (charter school). Advisory Board Member, Child Evangelism Fellowship (non-profit). Mr. Harris is a certified public accountant (inactive status). | | CIGNA Corporation; Asset Allocation Trust |
Judith M. Johnson (Born 1949) | | Trustee, since 2008; Audit Committee Chairman, since 2008 | | Retired. Prior thereto, Chief Executive Officer and Chief Investment Officer of Minneapolis Employees Retirement Fund from 1996 to 2008. Ms. Johnson is an attorney, certified public accountant and a certified managerial accountant. | | Asset Allocation Trust |
David F. Larcker (Born 1950) | | Trustee, since 2009 | | James Irvin Miller Professor of Accounting at the Graduate School of Business, Stanford University, Director of the Corporate Governance Research Initiative and Senior Faculty of The Rock Center for Corporate Governance since 2006. From 2005 to 2008, Professor of Accounting at the Graduate School of Business, Stanford University. Prior thereto, Ernst & Young Professor of Accounting at The Wharton School, University of Pennsylvania from 1985 to 2005. | | Asset Allocation Trust |
| | | | |
| 26 | | Wells Fargo Omega Growth Fund | | Other information (unaudited) |
| | | | | | |
Name and year of birth | | Position held and length of service* | | Principal occupations during past five years or longer | | Current other public company or investment company
directorships |
Olivia S. Mitchell*** (Born 1953) | | Trustee, since 2006; Governance Committee Chairman, since 2018 | | International Foundation of Employee Benefit Plans Professor, Wharton School of the University of Pennsylvania since 1993. Director of Wharton’s Pension Research Council and Boettner Center on Pensions & Retirement Research, and Research Associate at the National Bureau of Economic Research. Previously, Cornell University Professor from 1978 to 1993. | | Asset Allocation Trust |
Timothy J. Penny**** (Born 1951) | | Trustee since 1996; Chairman, since 2018; Vice Chairman, from 2017 to 2018 | | President and Chief Executive Officer of Southern Minnesota Initiative Foundation, a non-profit organization, since 2007. Member of the Board of Trustees of NorthStar Education Finance, Inc., a non-profit organization, since 2007. | | Asset Allocation Trust |
James G. Polisson***** (Born 1959) | | Trustee, since 2018; Advisory Board Member, from 2017 to 2018 | | Retired. Chief Marketing Officer, Source (ETF) UK Services, Ltd, from 2015 to 2017. From 2012 to 2015, Principal of The Polisson Group, LLC, a management consulting, corporate advisory and principal investing company. Chief Executive Officer and Managing Director at Russell Investments, Global Exchange Traded Funds from 2010 to 2012. Managing Director of Barclays Global Investors from 1998 to 2010 and Global Chief Marketing Officer for iShares and Barclays Global Investors from 2000 to 2010. Trustee of the San Francisco Mechanics’ Institute, a non-profit organization, from 2013 to 2015. Board member of the Russell Exchange Traded Fund Trust from 2011 to 2012. Director of Barclays Global Investors Holdings Deutschland GmbH from 2006 to 2009. Mr. Polisson is an attorney and has a retired status with the Massachusetts and District of Columbia Bar Associations. | | Asset Allocation Trust |
Michael S. Scofield (Born 1943) | | Trustee, since 2010 | | Served on the Investment Company Institute’s Board of Governors and Executive Committee from 2008-2011 as well the Governing Council of the Independent Directors Council from 2006-2011 and the Independent Directors Council Executive Committee from 2008-2011. Trustee of the Evergreen Fund complex (and its predecessors) from 1984 to 2010. Chairman of the Evergreen Funds from 2000-2010. Former Trustee of the Mentor Funds. Retired Attorney, Law Offices of Michael S. Scofield. | | Asset Allocation Trust |
Pamela Wheelock***** (Born 1959) | | Trustee, since 2018; Advisory Board Member, from 2017 to 2018 | | Chief Operating Officer, Twin Cities Habitat for Humanity, since January, 2017. Vice President of University Services, University of Minnesota from 2012 to 2017. Prior thereto, Interim President and Chief Executive Officer of Blue Cross Blue Shield of Minnesota from 2010 to 2011, Chairman of the Board from 2009 to 2011 and Board Director from 2003 to 2015. Vice President, Leadership and Community Engagement, Bush Foundation, Saint Paul, Minnesota (a private foundation) from 2009 to 2011. Executive Vice President and Chief Financial Officer, Minnesota Sports and Entertainment from 2004 to 2009 and Senior Vice President from 2002 to 2004. Commissioner of Finance, State of Minnesota, from 1999 to 2002. Currently on the Board of Directors, Governance Committee and Finance Committee, for the Minnesota Philanthropy Partners (Saint Paul Foundation) since 2012 and Board Chair of the Minnesota Wild Foundation since 2010. | | Asset Allocation Trust |
| * | Length of service dates reflect the Trustee’s commencement of service with the Trust’s predecessor entities, where applicable. |
| ** | Jane Freeman became Chair Liaison effective January 1, 2018. |
| *** | Olivia Mitchell became Chairman of the Governance Committee effective January 1, 2018. |
| **** | Timothy Penny became Chairman effective January 1, 2018. |
| ***** | James Polisson and Pamela Wheelock each became a Trustee effective January 1, 2018. |
| | | | | | |
| Other information (unaudited) | | Wells Fargo Omega Growth Fund | | | 27 | |
Officers
| | | | | | |
Name and year of birth | | Position held and length of service | | Principal occupations during past five years or longer | | |
Andrew Owen (Born 1960) | | President, since 2017 | | Executive Vice President of Wells Fargo & Company and Head of Affiliated Managers, Wells Fargo Asset Management, since 2014. In addition, Mr. Owen is currently President, Chief Executive Officer and Director of Wells Fargo Funds Management, LLC since 2017. Prior thereto, Executive Vice President responsible for marketing, investments and product development for Wells Fargo Funds Management, LLC, from 2009 to 2014. | | |
Jeremy DePalma1 (Born 1974) | | Treasurer, since 2012 | | Senior Vice President of Wells Fargo Funds Management, LLC since 2009. Senior Vice President of Evergreen Investment Management Company, LLC from 2008 to 2010 and head of the Fund Reporting and Control Team within Fund Administration from 2005 to 2010. | | |
C. David Messman (Born 1960) | | Secretary, since 2000; Chief Legal Officer, since 2003 | | Senior Vice President and Secretary of Wells Fargo Funds Management, LLC since 2001. Assistant General Counsel of Wells Fargo Bank, N.A. since 2013 and Vice President and Managing Counsel of Wells Fargo Bank, N.A. from 1996 to 2013. | | |
Michael H. Whitaker (Born 1967) | | Chief Compliance Officer, since 2016 | | Senior Vice President and Chief Compliance Officer since 2016. Senior Vice President and Chief Compliance Officer for Fidelity Investments from 2007 to 2016. | | |
David Berardi (Born 1975) | | Assistant Treasurer, since 2009 | | Vice President of Wells Fargo Funds Management, LLC since 2009. Vice President of Evergreen Investment Management Company, LLC from 2008 to 2010. Manager of Fund Reporting and Control for Evergreen Investment Management Company, LLC from 2004 to 2010. | | |
| 1 | Jeremy DePalma acts as Treasurer of 76 funds and Assistant Treasurer of 77 funds in the Fund Complex. |
| 2 | The Statement of Additional Information includes additional information about the Trustees and is available, without charge, upon request, by calling 1-800-222-8222 or by visiting the website at wellsfargofunds.com. |
| | | | |
| 28 | | Wells Fargo Omega Growth Fund | | List of abbreviations |
The following is a list of common abbreviations for terms and entities that may have appeared in this report.
| ACA | — ACA Financial Guaranty Corporation |
| ADR | — American depositary receipt |
| ADS | — American depositary shares |
| AGC | — Assured Guaranty Corporation |
| AGM | — Assured Guaranty Municipal |
| Ambac | — Ambac Financial Group Incorporated |
| AMT | — Alternative minimum tax |
| BAN | — Bond anticipation notes |
| BHAC | — Berkshire Hathaway Assurance Corporation |
| CAB | — Capital appreciation bond |
| CCAB | — Convertible capital appreciation bond |
| CDA | — Community Development Authority |
| CDO | — Collateralized debt obligation |
| CLO | — Collateralized loan obligation |
| DRIVER | — Derivative inverse tax-exempt receipts |
| DW&P | — Department of Water & Power |
| DWR | — Department of Water Resources |
| ECFA | — Educational & Cultural Facilities Authority |
| EDA | — Economic Development Authority |
| EDFA | — Economic Development Finance Authority |
| ETF | — Exchange-traded fund |
| FDIC | — Federal Deposit Insurance Corporation |
| FFCB | — Federal Farm Credit Banks |
| FGIC | — Financial Guaranty Insurance Corporation |
| FHA | — Federal Housing Administration |
| FHLB | — Federal Home Loan Bank |
| FHLMC | — Federal Home Loan Mortgage Corporation |
| FICO | — The Financing Corporation |
| FNMA | — Federal National Mortgage Association |
| GDR | — Global depositary receipt |
| GNMA | — Government National Mortgage Association |
| HCFR | — Healthcare facilities revenue |
| HEFA | — Health & Educational Facilities Authority |
| HEFAR | — Higher education facilities authority revenue |
| HFA | — Housing Finance Authority |
| HFFA | — Health Facilities Financing Authority |
| HUD | — Department of Housing and Urban Development |
| IDA | — Industrial Development Authority |
| IDAG | — Industrial Development Agency |
| KRW | — Republic of Korea won |
| LIBOR | — London Interbank Offered Rate |
| LIFER | — Long Inverse Floating Exempt Receipts |
| LLC | — Limited liability company |
| LLLP | — Limited liability limited partnership |
| LLP | — Limited liability partnership |
| MBIA | — Municipal Bond Insurance Association |
| MFHR | — Multifamily housing revenue |
| MSTR | — Municipal securities trust receipts |
| MUD | — Municipal Utility District |
| National | — National Public Finance Guarantee Corporation |
| PCFA | — Pollution Control Financing Authority |
| PCL | — Public Company Limited |
| PCR | — Pollution control revenue |
| PFA | — Public Finance Authority |
| PFFA | — Public Facilities Financing Authority |
| PFOTER | — Puttable floating option tax-exempt receipts |
| PJSC | — Public Joint Stock Company |
| plc | — Public limited company |
| PUTTER | — Puttable tax-exempt receipts |
| R&D | — Research & development |
| Radian | — Radian Asset Assurance |
| RAN | — Revenue anticipation notes |
| RDA | — Redevelopment Agency |
| RDFA | — Redevelopment Finance Authority |
| REIT | — Real estate investment trust |
| ROC | — Reset option certificates |
| SAVRS | — Select auction variable rate securities |
| SBA | — Small Business Authority |
| SDR | — Swedish depositary receipt |
| SFHR | — Single-family housing revenue |
| SFMR | — Single-family mortgage revenue |
| SIFMA | — Securities Industry and Financial Markets Association |
| SPA | — Standby purchase agreement |
| SPDR | — Standard & Poor’s Depositary Receipts |
| SPEAR | — Short Puttable Exempt Adjustable Receipts |
| STRIPS | — Separate trading of registered interest and |
| TAN | — Tax anticipation notes |
| TIPS | — Treasury inflation-protected securities |
| TRAN | — Tax revenue anticipation notes |
| TTFA | — Transportation Trust Fund Authority |
| TVA | — Tennessee Valley Authority |

For more information
More information about Wells Fargo Funds is available free upon request. To obtain literature, please write, email, visit the Fund’s website, or call:
Wells Fargo Funds
P.O. Box 8266
Boston, MA 02266-8266
Email: fundservice@wellsfargo.com
Website: wellsfargofunds.com
Individual investors: 1-800-222-8222
Retail investment professionals: 1-888-877-9275
Institutional investment professionals:
1-866-765-0778
This report and the financial statements contained herein are submitted for the general information of the shareholders of the Fund. If this report is used for promotional purposes, distribution of the report must be accompanied or preceded by a current prospectus. Before investing, please consider the investment objectives, risks, charges, and expenses of the investment. For a current prospectus and, if available, a summary prospectus, containing this information, call 1-800-222-8222 or visit the Fund’s website at wellsfargofunds.com. Read the prospectus carefully before you invest or send money.
Wells Fargo Asset Management (WFAM) is a trade name used by the asset management businesses of Wells Fargo & Company. Wells Fargo Funds Management, LLC, a wholly owned subsidiary of Wells Fargo & Company, provides investment advisory and administrative services for Wells Fargo Funds. Other affiliates of Wells Fargo & Company provide subadvisory and other services for the funds. The funds are distributed by Wells Fargo Funds Distributor, LLC, Member FINRA, an affiliate of Wells Fargo & Company. Neither Wells Fargo Funds Distributor nor Wells Fargo Funds Management holds fund shareholder accounts or assets. This material is for general informational and educational purposes only and is NOT intended to provide investment advice or a recommendation of any kind—including a recommendation for any specific investment, strategy, or plan.
NOT FDIC INSURED ◾ NO BANK GUARANTEE ◾ MAY LOSE VALUE
© 2018 Wells Fargo Funds Management, LLC. All rights reserved.
| | |
 | | 309121 03-18 SA211/SAR211 01-18 |
Semi-Annual Report
January 31, 2018

Wells Fargo
Premier Large Company Growth Fund


Reduce clutter. Save trees.
Sign up for electronic delivery of prospectuses and shareholder reports at wellsfargo.com/advantagedelivery
Contents
The views expressed and any forward-looking statements are as of January 31, 2018, unless otherwise noted, and are those of the Fund managers and/or Wells Fargo Funds Management, LLC. Discussions of individual securities, or the markets generally, or any Wells Fargo Fund are not intended as individual recommendations. Future events or results may vary significantly from those expressed in any forward-looking statements. The views expressed are subject to change at any time in response to changing circumstances in the market. Wells Fargo Funds Management, LLC and the Fund disclaim any obligation to publicly update or revise any views expressed or forward-looking statements.
NOT FDIC INSURED ◾ NO BANK GUARANTEE ◾ MAY LOSE VALUE
| | | | |
| 2 | | Wells Fargo Premier Large Company Growth Fund | | Letter to shareholders (unaudited) |

Andrew Owen
President
Wells Fargo Funds
While investing in stocks and bonds generally delivered favorable returns during the past six months, fixed-income investments in the U.S. diverged from the global trend.
Dear Shareholder:
We are pleased to offer you this semi-annual report for the Wells Fargo Premier Large Company Growth Fund for the six-month period that ended January 31, 2018. While investing in stocks generally delivered favorable returns during the past six months, fixed-income investments in the U.S. diverged from the global trend. U.S. and international stocks delivered similar results, with returns of 15.43% and 13.50%, respectively, for the six-month period, as measured by the S&P 500 Index1 and the MSCI ACWI ex USA Index (Net)2, respectively. Within fixed income, the Bloomberg Barclays Global Aggregate ex-USD Index3 earned 4.50%. In the U.S., fixed-income investments, as measured by the Bloomberg Barclays U.S. Aggregate Bond Index4, fell 0.35% and the Bloomberg Barclays Municipal Bond Index5 declined 0.19%.
As global growth improved in the third quarter of 2017, investment markets advanced.
Globally, stocks moved higher during the late summer of 2017 as they were subject to the same positive economic conditions that influenced their advances during first half of the year: moderately accelerating global economic growth supported by improving corporate earnings as well as low inflation and interest rates. Brief episodes of geopolitical tensions, primarily associated with North Korea’s advancing nuclear missile program, flaring conflicts in the Middle East, and uncertainty surrounding the new U.S. administration’s trade policies, did not discourage investing activity. In the U.S., economic data released during the quarter reflected a generally healthy economy. Second-quarter economic output grew at a 3.1% annual rate.
Outside the U.S., stocks in international developed and emerging markets were supported by improved economic growth. Advances in emerging markets equity valuations slowed compared with the pace of the first half of 2017 but continued an upward path. Central banks in Europe, Asia, and Japan maintained low-interest-rate policies that supported business growth and equity investing.
In the U.S., Federal Reserve (Fed) officials announced in October plans to begin the process of unwinding its $4.5 trillion portfolio of bonds and other assets accumulated during rounds of quantitative easing conducted since the 2008–2009 recession. Still, restrained inflation kept long-term bond rates steady and the flattening of the yield curve persisted.
Positive economic and market news continued as 2017 closed and 2018 began.
During the fourth quarter of 2017, stock markets continued an upward trajectory. Synchronous economic expansion worldwide continued with mild inflation and low volatility. Data released during the quarter reflected a healthy U.S. economy.
| 1 | The S&P 500 Index consists of 500 stocks chosen for market size, liquidity, and industry group representation. It is a market-value-weighted index with each stock’s weight in the index proportionate to its market value. You cannot invest directly in an index. |
| 2 | The Morgan Stanley Capital International (MSCI) All Country World Index (ACWI) ex USA Index (Net) is a free-float-adjusted market-capitalization-weighted index that is designed to measure the equity market performance of developed markets, excluding the United States and Canada. Source: MSCI. MSCI makes no express or implied warranties or representations and shall have no liability whatsoever with respect to any MSCI data contained herein. The MSCI data may not be further redistributed or used as a basis for other indices or any securities or financial products. This report is not approved, reviewed, or produced by MSCI. You cannot invest directly in an index. |
| 3 | The Bloomberg Barclays Global Aggregate ex-USD Index is an unmanaged index that provides a broad-based measure of the global investment-grade fixed-income markets excluding the U.S.-dollar-denominated debt market. You cannot invest directly in an index. |
| 4 | The Bloomberg Barclays U.S. Aggregate Bond Index is a broad-based benchmark that measures the investment-grade, U.S. dollar-denominated, fixed-rate taxable bond market, including Treasuries, government-related and corporate securities, mortgage-backed securities (agency fixed-rate and hybrid adjustable-rate mortgage pass-throughs), asset-backed securities, and commercial mortgage-backed securities. You cannot invest directly in an index. |
| 5 | The Bloomberg Barclays Municipal Bond Index is an unmanaged index composed of long-term tax-exempt bonds with a minimum credit rating of Baa. You cannot invest directly in an index. |
| | | | | | |
| Letter to shareholders (unaudited) | | Wells Fargo Premier Large Company Growth Fund | | | 3 | |
Third-quarter economic output grew at a 3.2% annual rate. Increased hiring pushed the unemployment rate down to a 17-year low of 4.1%. Tax reform in the U.S. that passed as the year ended also encouraged increased spending among businesses and individuals. Signs of long-awaited wage growth appeared to emerge.
Outside the U.S., economies continued to strengthen. In December, the Organisation for Economic Co-operation and Development (OECD) reported that the global economy has been expanding at its fastest rate since 2010; all 35 countries the OECD follows were on track to expand for 2017. International economies have benefited from catalysts such as economic stimulus, improving employment, increased investment, accelerated trade growth, and the firming of prices for some of the commodities that are essential exports of many international economies.
October 2017 marked one year since regulatory reform of money market investing in the U.S. By December 2017, money market fund asset levels exceeded their December 2016 levels, reflecting continued investor demand for the short-term investment opportunities afforded them by money market funds.
In December 2017, the Fed raised the federal funds rate target to a range of 1.25% to 1.50%. The Fed also began reducing its bond portfolio. Long-term interest rates in the U.S. trended higher as the yield curve steepened—the 10-year Treasury rate moved from 2.46% to 2.84% and the 30-year rate moved from 2.81% to 3.08% during January 2018.
Don’t let short-term uncertainty derail long-term investment goals.
Periods of investment uncertainty can present challenges, but experience has taught us that maintaining long-term investment goals can be an effective way to plan for the future. To help you create a sound strategy based on your personal goals and risk tolerance, Wells Fargo Funds offers more than 100 mutual funds spanning a wide range of asset classes and investment styles. Although diversification cannot guarantee an investment profit or prevent losses, we believe it can be an effective way to manage investment risk and potentially smooth out overall portfolio performance. We encourage investors to know their investments and to understand that appropriate levels of risk-taking may unlock opportunities.
Thank you for choosing to invest with Wells Fargo Funds. We appreciate your confidence in us and remain committed to helping you meet your financial needs.
Sincerely,

Andrew Owen
President
Wells Fargo Funds
Although diversification cannot guarantee an investment profit or prevent losses, we believe it can be an effective way to manage investment risk and potentially smooth out overall portfolio performance.
For further information about your Fund, contact your investment professional, visit our website at wellsfargofunds.com, or call us directly at 1-800-222-8222.
| | | | |
| 4 | | Wells Fargo Premier Large Company Growth Fund | | Performance highlights (unaudited) |
Investment objective
The Fund seeks long-term capital appreciation.
Manager
Wells Fargo Funds Management, LLC
Subadviser
Wells Capital Management Incorporated
Portfolio managers
Joseph M. Eberhardy, CFA®, CPA
Bob Gruendyke, CFA®‡
Thomas C. Ognar, CFA®
Bruce C. Olson, CFA®*
Average annual total returns (%) as of January 31, 20181
| | | | | | | | | | | | | | | | | | | | | | | | | | | | | | | | | | |
| | | | | Including sales charge | | | Excluding sales charge | | | Expense ratios2 (%) | |
| | | Inception date | | 1 year | | | 5 year | | | 10 year | | | 1 year | | | 5 year | | | 10 year | | | Gross | | | Net3 | |
| Class A (EKJAX) | | 1-20-1998 | | | 31.01 | | | | 13.32 | | | | 11.02 | | | | 38.99 | | | | 14.68 | | | | 11.67 | | | | 1.14 | | | | 1.11 | |
| Class C (EKJCX) | | 1-22-1998 | | | 36.86 | | | | 13.80 | | | | 10.84 | | | | 37.86 | | | | 13.80 | | | | 10.84 | | | | 1.89 | | | | 1.86 | |
| Class R4 (EKJRX) | | 11-30-2012 | | | – | | | | – | | | | – | | | | 39.41 | | | | 15.01 | | | | 12.02 | | | | 0.86 | | | | 0.80 | |
| Class R6 (EKJFX) | | 11-30-2012 | | | – | | | | – | | | | – | | | | 39.58 | | | | 15.19 | | | | 12.11 | | | | 0.71 | | | | 0.65 | |
| Administrator Class (WFPDX) | | 7-16-2010 | | | – | | | | – | | | | – | | | | 39.15 | | | | 14.84 | | | | 11.81 | | | | 1.06 | | | | 1.00 | |
| Institutional Class (EKJYX) | | 6-30-1999 | | | – | | | | – | | | | – | | | | 39.58 | | | | 15.16 | | | | 12.09 | | | | 0.81 | | | | 0.70 | |
| Russell 1000® Growth Index4 | | – | | | – | | | | – | | | | – | | | | 34.89 | | | | 17.95 | | | | 11.65 | | | | – | | | | – | |
Figures quoted represent past performance, which is no guarantee of future results, and do not reflect taxes that a shareholder may pay on fund distributions or the redemption of fund shares. Investment return and principal value of an investment will fluctuate so that an investor’s shares, when redeemed, may be worth more or less than their original cost. Performance shown without sales charges would be lower if sales charges were reflected. Current performance may be lower or higher than the performance data quoted, which assumes the reinvestment of dividends and capital gains. Current month-end performance is available on the Fund’s website, wellsfargofunds.com.
Please keep in mind that high double-digit returns were primarily achieved during favorable market conditions. You should not expect that such favorable returns can be consistently achieved. A fund’s performance, especially for short time periods, should not be the sole factor in making your investment decision.
Index returns do not include transaction costs associated with buying and selling securities, any mutual fund fees or expenses, or any taxes. It is not possible to invest directly in an index.
For Class A shares, the maximum front-end sales charge is 5.75%. For Class C shares, the maximum contingent deferred sales charge is 1.00%. Performance including a contingent deferred sales charge assumes the sales charge for the corresponding time period. Class R4, Class R6, Administrator Class, and Institutional Class shares are sold without a front-end sales charge or contingent deferred sales charge.
Stock values fluctuate in response to the activities of individual companies and general market and economic conditions. Certain investment strategies tend to increase the total risk of an investment (relative to the broader market). The Fund is exposed to foreign investment risk. Consult the Fund’s prospectus for additional information on these and other risks.
Please see footnotes on page 5.
| | | | | | |
| Performance highlights (unaudited) | | Wells Fargo Premier Large Company Growth Fund | | | 5 | |
| | | | |
| Ten largest holdings (%) as of January 31, 20185 | |
Amazon.com Incorporated | | | 6.93 | |
Facebook Incorporated Class A | | | 5.38 | |
Alphabet Incorporated Class A | | | 5.21 | |
Microsoft Corporation | | | 4.41 | |
Visa Incorporated Class A | | | 3.38 | |
Microchip Technology Incorporated | | | 2.94 | |
MasterCard Incorporated Class A | | | 2.37 | |
PayPal Holdings Incorporated | | | 2.24 | |
Praxair Incorporated | | | 1.91 | |
Texas Instruments Incorporated | | | 1.91 | |
|
| Sector distribution as of January 31, 20186 |
|
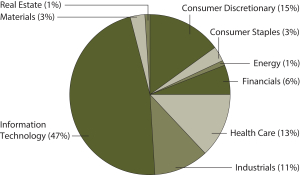
|
| ‡ | Mr. Gruendyke became a portfolio manager of the Fund on December 1, 2017. |
| * | Mr. Olson has announced his intention to retire from Wells Capital Management on April 30, 2018. |
| 1 | Historical performance shown for Class R4 shares prior to their inception reflects the performance of Institutional Class shares, adjusted to reflect the higher expenses applicable to Class R4 shares. Historical performance shown for Class R6 shares prior to their inception reflects the performance of Institutional Class shares and includes the higher expenses applicable to Institutional Class shares. If these expenses had not been included, returns for Class R6 shares would be higher. Historical performance shown for Administrator Class shares prior to their inception reflects the performance of Institutional Class shares, adjusted to reflect the higher expenses applicable to Administrator Class shares. Historical performance shown for all classes of the Fund prior to July 19, 2010, is based on the performance of the Fund’s predecessor, Evergreen Large Company Growth Fund. |
| 2 | Reflects the expense ratios as stated in the most recent prospectuses. The expense ratios shown are subject to change and may differ from the annualized expense ratios shown in the financial highlights of this report. |
| 3 | The manager has contractually committed through November 30, 2018, to waive fees and/or reimburse expenses to the extent necessary to cap the Fund’s Total Annual Fund Operating Expenses After Fee Waivers at the amounts shown. After this time, the cap may be increased or the commitment to maintain the cap may be terminated only with the approval of the Board of Trustees. Brokerage commissions, stamp duty fees, interest, taxes, acquired fund fees and expenses, and extraordinary expenses are excluded from the expense cap. Without this cap, the Fund’s returns would have been lower. The expense ratio paid by an investor is the net expense ratio or the Fund’s Total Annual Fund Operating Expenses After Fee Waivers, as stated in the prospectuses. |
| 4 | The Russell 1000® Growth Index measures the performance of those Russell 1000 companies with higher price/book ratios and higher forecasted growth values. You cannot invest directly in an index. |
| 5 | The ten largest holdings, excluding cash and cash equivalents, are calculated based on the value of the investments divided by total net assets of the Fund. Holdings are subject to change and may have changed since the date specified. |
| 6 | Amounts are calculated based on the total long-term investments of the Fund. These amounts are subject to change and may have changed since the date specified. |
| | | | |
| 6 | | Wells Fargo Premier Large Company Growth Fund | | Fund expenses (unaudited) |
As a shareholder of the Fund, you incur two types of costs: (1) transaction costs, including sales charges (loads) on purchase payments and contingent deferred sales charges (if any) on redemptions and (2) ongoing costs, including management fees, distribution (12b-1) and/or shareholder servicing fees, and other Fund expenses. This example is intended to help you understand your ongoing costs (in dollars) of investing in the Fund and to compare these costs with the ongoing costs of investing in other mutual funds.
The example is based on an investment of $1,000 invested at the beginning of the six-month period and held for the entire period from August 1, 2017 to January 31, 2018.
Actual expenses
The “Actual” line of the table below provides information about actual account values and actual expenses. You may use the information in this line, together with the amount you invested, to estimate the expenses that you paid over the period. Simply divide your account value by $1,000 (for example, an $8,600 account value divided by $1,000 = 8.6), then multiply the result by the number in the “Actual” line under the heading entitled “Expenses paid during period” for your applicable class of shares to estimate the expenses you paid on your account during this period.
Hypothetical example for comparison purposes
The “Hypothetical” line of the table below provides information about hypothetical account values and hypothetical expenses based on the Fund’s actual expense ratio and an assumed rate of return of 5% per year before expenses, which is not the Fund’s actual return. The hypothetical account values and expenses may not be used to estimate the actual ending account balance or expenses you paid for the period. You may use this information to compare the ongoing costs of investing in the Fund and other funds. To do so, compare this 5% hypothetical example with the 5% hypothetical examples that appear in the shareholder reports of the other funds.
Please note that the expenses shown in the table are meant to highlight your ongoing costs only and do not reflect any transactional costs, such as sales charges (loads) and contingent deferred sales charges. Therefore, the “Hypothetical” line of the table is useful in comparing ongoing costs only and will not help you determine the relative total costs of owning different funds. In addition, if these transactional costs were included, your costs would have been higher.
| | | | | | | | | | | | | | | | |
| | | Beginning
account value
8-1-2017 | | | Ending
account value
1-31-2018 | | | Expenses
paid during
the period¹ | | | Annualized net
expense ratio | |
Class A | | | | | | | | | | | | | | | | |
Actual | | $ | 1,000.00 | | | $ | 1,205.94 | | | $ | 6.17 | | | | 1.11 | % |
Hypothetical (5% return before expenses) | | $ | 1,000.00 | | | $ | 1,019.61 | | | $ | 5.65 | | | | 1.11 | % |
Class C | | | | | | | | | | | | | | | | |
Actual | | $ | 1,000.00 | | | $ | 1,201.75 | | | $ | 10.32 | | | | 1.86 | % |
Hypothetical (5% return before expenses) | | $ | 1,000.00 | | | $ | 1,015.83 | | | $ | 9.45 | | | | 1.86 | % |
Class R4 | | | | | | | | | | | | | | | | |
Actual | | $ | 1,000.00 | | | $ | 1,208.26 | | | $ | 4.45 | | | | 0.80 | % |
Hypothetical (5% return before expenses) | | $ | 1,000.00 | | | $ | 1,021.17 | | | $ | 4.08 | | | | 0.80 | % |
Class R6 | | | | | | | | | | | | | | | | |
Actual | | $ | 1,000.00 | | | $ | 1,209.32 | | | $ | 3.62 | | | | 0.65 | % |
Hypothetical (5% return before expenses) | | $ | 1,000.00 | | | $ | 1,021.93 | | | $ | 3.31 | | | | 0.65 | % |
Administrator Class | | | | | | | | | | | | | | | | |
Actual | | $ | 1,000.00 | | | $ | 1,206.77 | | | $ | 5.56 | | | | 1.00 | % |
Hypothetical (5% return before expenses) | | $ | 1,000.00 | | | $ | 1,020.16 | | | $ | 5.09 | | | | 1.00 | % |
Institutional Class | | | | | | | | | | | | | | | | |
Actual | | $ | 1,000.00 | | | $ | 1,208.96 | | | $ | 3.90 | | | | 0.70 | % |
Hypothetical (5% return before expenses) | | $ | 1,000.00 | | | $ | 1,021.68 | | | $ | 3.57 | | | | 0.70 | % |
| 1 | Expenses paid is equal to the annualized net expense ratio of each class multiplied by the average account value over the period, multiplied by the number of days in the most recent fiscal half-year divided by the number of days in the fiscal year (to reflect the one-half-year period). |
| | | | | | |
| Portfolio of investments—January 31, 2018 (unaudited) | | Wells Fargo Premier Large Company Growth Fund | | | 7 | |
| | | | | | | | | | | | | | | | |
| Security name | | | | | | | | Shares | | | Value | |
| | | | |
Common Stocks: 99.91% | | | | | | | | | | | | | | | | |
| | | | |
Consumer Discretionary: 14.64% | | | | | | | | | | | | | | | | |
| | | | |
| Hotels, Restaurants & Leisure: 0.97% | | | | | | | | | | | | | | | | |
Royal Caribbean Cruises Limited | | | | | | | | | | | 187,540 | | | $ | 25,045,967 | |
| | | | | | | | | | | | | | | | |
| | | | |
| Household Durables: 0.94% | | | | | | | | | | | | | | | | |
Mohawk Industries Incorporated † | | | | | | | | | | | 86,630 | | | | 24,348,228 | |
| | | | | | | | | | | | | | | | |
| | | | |
| Internet & Direct Marketing Retail: 8.05% | | | | | | | | | | | | | | | | |
Amazon.com Incorporated † | | | | | | | | | | | 123,550 | | | | 179,257,460 | |
Netflix Incorporated † | | | | | | | | | | | 106,280 | | | | 28,727,484 | |
| | | | |
| | | | | | | | | | | | | | | 207,984,944 | |
| | | | | | | | | | | | | | | | |
| | | | |
| Media: 0.85% | | | | | | | | | | | | | | | | |
Live Nation Incorporated † | | | | | | | | | | | 486,450 | | | | 21,919,437 | |
| | | | | | | | | | | | | | | | |
| | | | |
| Multiline Retail: 1.04% | | | | | | | | | | | | | | | | |
Dollar Tree Incorporated † | | | | | | | | | | | 233,790 | | | | 26,885,850 | |
| | | | | | | | | | | | | | | | |
| | | | |
| Specialty Retail: 2.79% | | | | | | | | | | | | | | | | |
Burlington Stores Incorporated † | | | | | | | | | | | 182,520 | | | | 22,214,509 | |
O’Reilly Automotive Incorporated † | | | | | | | | | | | 58,400 | | | | 15,457,896 | |
The Home Depot Incorporated | | | | | | | | | | | 172,200 | | | | 34,594,980 | |
| | | | |
| | | | | | | | | | | | | | | 72,267,385 | |
| | | | | | | | | | | | | | | | |
| | | | |
Consumer Staples: 3.10% | | | | | | | | | | | | | | | | |
| | | | |
| Beverages: 1.54% | | | | | | | | | | | | | | | | |
Constellation Brands Incorporated Class A | | | | | | | | | | | 181,450 | | | | 39,822,832 | |
| | | | | | | | | | | | | | | | |
| | | | |
| Food & Staples Retailing: 0.48% | | | | | | | | | | | | | | | | |
Costco Wholesale Corporation | | | | | | | | | | | 63,560 | | | | 12,385,937 | |
| | | | | | | | | | | | | | | | |
| | | | |
| Personal Products: 1.08% | | | | | | | | | | | | | | | | |
The Estee Lauder Companies Incorporated Class A | | | | | | | | | | | 206,710 | | | | 27,897,582 | |
| | | | | | | | | | | | | | | | |
| | | | |
Energy: 1.34% | | | | | | | | | | | | | | | | |
| | | | |
| Oil, Gas & Consumable Fuels: 1.34% | | | | | | | | | | | | | | | | |
Concho Resources Incorporated † | | | | | | | | | | | 155,500 | | | | 24,481,920 | |
RSP Permian Incorporated † | | | | | | | | | | | 254,200 | | | | 10,086,656 | |
| | | | |
| | | | | | | | | | | | | | | 34,568,576 | |
| | | | | | | | | | | | | | | | |
| | | | |
Financials: 6.37% | | | | | | | | | | | | | | | | |
| | | | |
| Banks: 0.25% | | | | | | | | | | | | | | | | |
Webster Financial Corporation | | | | | | | | | | | 113,550 | | | | 6,429,201 | |
| | | | | | | | | | | | | | | | |
| | | | |
| Capital Markets: 6.12% | | | | | | | | | | | | | | | | |
CME Group Incorporated | | | | | | | | | | | 241,230 | | | | 37,023,980 | |
MarketAxess Holdings Incorporated | | | | | | | | | | | 160,930 | | | | 31,576,075 | |
Morgan Stanley | | | | | | | | | | | 493,890 | | | | 27,929,480 | |
The accompanying notes are an integral part of these financial statements.
| | | | |
| 8 | | Wells Fargo Premier Large Company Growth Fund | | Portfolio of investments—January 31, 2018 (unaudited) |
| | | | | | | | | | | | | | | | |
| Security name | | | | | | | | Shares | | | Value | |
| | | | |
| Capital Markets (continued) | | | | | | | | | | | | | | | | |
Raymond James Financial Incorporated | | | | | | | | | | | 212,326 | | | $ | 20,466,103 | |
TD Ameritrade Holding Corporation | | | | | | | | | | | 237,540 | | | | 13,252,357 | |
The Charles Schwab Corporation | | | | | | | | | | | 523,350 | | | | 27,915,489 | |
| | | | |
| | | | | | | | | | | | | | | 158,163,484 | |
| | | | | | | | | | | | | | | | |
| | | | |
Health Care: 12.85% | | | | | | | | | | | | | | | | |
| | | | |
| Biotechnology: 4.02% | | | | | | | | | | | | | | | | |
BioMarin Pharmaceutical Incorporated † | | | | | | | | | | | 211,890 | | | | 19,118,835 | |
Exelixis Incorporated † | | | | | | | | | | | 532,340 | | | | 16,135,225 | |
Incyte Corporation † | | | | | | | | | | | 19,410 | | | | 1,752,529 | |
Neurocrine Biosciences Incorporated † | | | | | | | | | | | 199,610 | | | | 17,060,667 | |
Sage Therapeutics Incorporated † | | | | | | | | | | | 33,900 | | | | 6,456,170 | |
Vertex Pharmaceuticals Incorporated † | | | | | | | | | | | 260,520 | | | | 43,472,972 | |
| | | | |
| | | | | | | | | | | | | | | 103,996,398 | |
| | | | | | | | | | | | | | | | |
| | | | |
| Health Care Equipment & Supplies: 3.56% | | | | | | | | | | | | | | | | |
Boston Scientific Corporation † | | | | | | | | | | | 1,040,910 | | | | 29,103,844 | |
Edwards Lifesciences Corporation † | | | | | | | | | | | 257,020 | | | | 32,533,592 | |
Intuitive Surgical Incorporated † | | | | | | | | | | | 31,290 | | | | 13,506,954 | |
West Pharmaceutical Services Incorporated | | | | | | | | | | | 168,780 | | | | 16,911,756 | |
| | | | |
| | | | | | | | | | | | | | | 92,056,146 | |
| | | | | | | | | | | | | | | | |
| | | | |
| Health Care Technology: 0.62% | | | | | | | | | | | | | | | | |
Veeva Systems Incorporated Class A † | | | | | | | | | | | 255,470 | | | | 16,058,844 | |
| | | | | | | | | | | | | | | | |
| | | | |
| Life Sciences Tools & Services: 1.80% | | | | | | | | | | | | | | | | |
Agilent Technologies Incorporated | | | | | | | | | | | 284,550 | | | | 20,894,507 | |
PRA Health Sciences Incorporated † | | | | | | | | | | | 281,350 | | | | 25,619,731 | |
| | | | |
| | | | | | | | | | | | | | | 46,514,238 | |
| | | | | | | | | | | | | | | | |
| | | | |
| Pharmaceuticals: 2.85% | | | | | | | | | | | | | | | | |
Bristol-Myers Squibb Company | | | | | | | | | | | 333,960 | | | | 20,905,896 | |
Catalent Incorporated † | | | | | | | | | | | 227,000 | | | | 10,564,580 | |
Zoetis Incorporated | | | | | | | | | | | 549,438 | | | | 42,158,378 | |
| | | | |
| | | | | | | | | | | | | | | 73,628,854 | |
| | | | | | | | | | | | | | | | |
| | | | |
Industrials: 11.03% | | | | | | | | | | | | | | | | |
| | | | |
| Aerospace & Defense: 1.66% | | | | | | | | | | | | | | | | |
Raytheon Company | | | | | | | | | | | 158,110 | | | | 33,035,503 | |
The Boeing Company | | | | | | | | | | | 27,960 | | | | 9,908,185 | |
| | | | |
| | | | | | | | | | | | | | | 42,943,688 | |
| | | | | | | | | | | | | | | | |
| | | | |
| Air Freight & Logistics: 1.53% | | | | | | | | | | | | | | | | |
FedEx Corporation | | | | | | | | | | | 126,300 | | | | 33,151,224 | |
XPO Logistics Incorporated † | | | | | | | | | | | 66,520 | | | | 6,282,149 | |
| | | | |
| | | | | | | | | | | | | | | 39,433,373 | |
| | | | | | | | | | | | | | | | |
The accompanying notes are an integral part of these financial statements.
| | | | | | |
| Portfolio of investments—January 31, 2018 (unaudited) | | Wells Fargo Premier Large Company Growth Fund | | | 9 | |
| | | | | | | | | | | | | | | | |
| Security name | | | | | | | | Shares | | | Value | |
| | | | |
| Commercial Services & Supplies: 2.28% | | | | | | | | | | | | | | | | |
KAR Auction Services Incorporated | | | | | | | | | | | 449,907 | | | $ | 24,537,928 | |
Waste Connections Incorporated | | | | | | | | | | | 480,595 | | | | 34,516,333 | |
| | | | |
| | | | | | | | | | | | | | | 59,054,261 | |
| | | | | | | | | | | | | | | | |
| | | | |
| Industrial Conglomerates: 1.22% | | | | | | | | | | | | | | | | |
Honeywell International Incorporated | | | | | | | | | | | 197,860 | | | | 31,592,306 | |
| | | | | | | | | | | | | | | | |
| | | | |
| Machinery: 1.15% | | | | | | | | | | | | | | | | |
Fortive Corporation | | | | | | | | | | | 311,435 | | | | 23,675,289 | |
Nordson Corporation | | | | | | | | | | | 42,490 | | | | 6,106,663 | |
| | | | |
| | | | | | | | | | | | | | | 29,781,952 | |
| | | | | | | | | | | | | | | | |
| | | | |
| Professional Services: 0.43% | | | | | | | | | | | | | | | | |
TransUnion † | | | | | | | | | | | 184,970 | | | | 10,979,819 | |
| | | | | | | | | | | | | | | | |
| | | | |
| Road & Rail: 2.76% | | | | | | | | | | | | | | | | |
CSX Corporation | | | | | | | | | | | 92,780 | | | | 5,267,121 | |
Norfolk Southern Corporation | | | | | | | | | | | 159,590 | | | | 24,078,939 | |
Union Pacific Corporation | | | | | | | | | | | 314,220 | | | | 41,948,370 | |
| | | | |
| | | | | | | | | | | | | | | 71,294,430 | |
| | | | | | | | | | | | | | | | |
| | | | |
Information Technology: 46.82% | | | | | | | | | | | | | | | | |
| | | | |
| Electronic Equipment, Instruments & Components: 0.62% | | | | | | | | | | | | | | | | |
TE Connectivity Limited | | | | | | | | | | | 155,400 | | | | 15,933,162 | |
| | | | | | | | | | | | | | | | |
| | | | |
| Internet Software & Services: 16.32% | | | | | | | | | | | | | | | | |
Alibaba Group Holding Limited ADR †« | | | | | | | | | | | 43,420 | | | | 8,870,272 | |
Alphabet Incorporated Class A † | | | | | | | | | | | 113,820 | | | | 134,560,280 | |
Alphabet Incorporated Class C † | | | | | | | | | | | 21,978 | | | | 25,712,941 | |
CoStar Group Incorporated † | | | | | | | | | | | 69,480 | | | | 24,047,723 | |
eBay Incorporated † | | | | | | | | | | | 642,750 | | | | 26,082,795 | |
Facebook Incorporated Class A † | | | | | | | | | | | 743,470 | | | | 138,947,108 | |
LogMeIn Incorporated | | | | | | | | | | | 213,080 | | | | 26,805,464 | |
MercadoLibre Incorporated | | | | | | | | | | | 59,870 | | | | 23,175,677 | |
Shopify Incorporated Class A † | | | | | | | | | | | 106,230 | | | | 13,588,942 | |
| | | | |
| | | | | | | | | | | | | | | 421,791,202 | |
| | | | | | | | | | | | | | | | |
| | | | |
| IT Services: 10.66% | | | | | | | | | | | | | | | | |
Euronet Worldwide Incorporated † | | | | | | | | | | | 257,596 | | | | 24,180,537 | |
Global Payments Incorporated | | | | | | | | | | | 145,610 | | | | 16,276,286 | |
MasterCard Incorporated Class A | | | | | | | | | | | 362,700 | | | | 61,296,300 | |
PayPal Holdings Incorporated † | | | | | | | | | | | 679,650 | | | | 57,987,738 | |
Square Incorporated Class A †« | | | | | | | | | | | 444,790 | | | | 20,865,099 | |
Switch Incorporated Class A | | | | | | | | | | | 474,848 | | | | 7,702,035 | |
Visa Incorporated Class A | | | | | | | | | | | 703,130 | | | | 87,349,840 | |
| | | | |
| | | | | | | | | | | | | | | 275,657,835 | |
| | | | | | | | | | | | | | | | |
The accompanying notes are an integral part of these financial statements.
| | | | |
| 10 | | Wells Fargo Premier Large Company Growth Fund | | Portfolio of investments—January 31, 2018 (unaudited) |
| | | | | | | | | | | | | | | | |
| Security name | | | | | | | | Shares | | | Value | |
| | | | |
| Semiconductors & Semiconductor Equipment: 6.35% | | | | | | | | | | | | | | | | |
Broadcom Limited | | | | | | | | | | | 156,683 | | | $ | 38,862,084 | |
Microchip Technology Incorporated | | | | | | | | | | | 799,230 | | | | 76,102,681 | |
Texas Instruments Incorporated | | | | | | | | | | | 449,960 | | | | 49,347,113 | |
| | | | |
| | | | | | | | | | | | | | | 164,311,878 | |
| | | | | | | | | | | | | | | | |
| | | | |
| Software: 12.17% | | | | | | | | | | | | | | | | |
Activision Blizzard Incorporated | | | | | | | | | | | 245,940 | | | | 18,231,532 | |
Adobe Systems Incorporated † | | | | | | | | | | | 195,439 | | | | 39,040,895 | |
Microsoft Corporation | | | | | | | | | | | 1,199,110 | | | | 113,927,441 | |
Proofpoint Incorporated † | | | | | | | | | | | 193,580 | | | | 19,749,032 | |
salesforce.com Incorporated † | | | | | | | | | | | 324,430 | | | | 36,955,821 | |
ServiceNow Incorporated † | | | | | | | | | | | 257,810 | | | | 38,380,175 | |
Splunk Incorporated † | | | | | | | | | | | 66,965 | | | | 6,185,557 | |
Take-Two Interactive Software Incorporated † | | | | | | | | | | | 132,620 | | | | 16,798,975 | |
Ultimate Software Group Incorporated † | | | | | | | | | | | 108,802 | | | | 25,338,898 | |
| | | | |
| | | | | | | | | | | | | | | 314,608,326 | |
| | | | | | | | | | | | | | | | |
| | | | |
| Technology Hardware, Storage & Peripherals: 0.70% | | | | | | | | | | | | | | | | |
Apple Incorporated | | | | | | | | | | | 108,510 | | | | 18,167,829 | |
| | | | | | | | | | | | | | | | |
| | | | |
Materials: 2.91% | | | | | | | | | | | | | | | | |
| | | | |
| Chemicals: 2.91% | | | | | | | | | | | | | | | | |
Ecolab Incorporated | | | | | | | | | | | 186,660 | | | | 25,699,349 | |
Praxair Incorporated | | | | | | | | | | | 306,200 | | | | 49,448,238 | |
| | | | |
| | | | | | | | | | | | | | | 75,147,587 | |
| | | | | | | | | | | | | | | | |
| | | | |
Real Estate: 0.85% | | | | | | | | | | | | | | | | |
| | | | |
| Equity REITs: 0.85% | | | | | | | | | | | | | | | | |
American Tower Corporation | | | | | | | | | | | 149,970 | | | | 22,150,566 | |
| | | | | | | | | | | | | | | | |
| | | | |
Total Common Stocks (Cost $1,328,997,478) | | | | | | | | | | | | | | | 2,582,822,117 | |
| | | | | | | | | | | | | | | | |
| | | | |
| | | Yield | | | | | | | | | | |
| Short-Term Investments: 1.07% | | | | | | | | | | | | | | | | |
| | | | |
| Investment Companies: 1.07% | | | | | | | | | | | | | | | | |
Securities Lending Cash Investment LLC (l)(r)(u) | | | 1.60 | % | | | | | | | 13,804,031 | | | | 13,805,411 | |
Wells Fargo Government Money Market Fund Select Class (l)(u) | | | 1.24 | | | | | | | | 13,810,798 | | | | 13,810,798 | |
| | | | |
Total Short-Term Investments (Cost $27,616,209) | | | | | | | | | | | | | | | 27,616,209 | |
| | | | | | | | | | | | | | | | |
| | | | | | | | |
| Total investments in securities (Cost $1,356,613,687) | | | 100.98 | % | | | 2,610,438,326 | |
Other assets and liabilities, net | | | (0.98 | ) | | | (25,459,981 | ) |
| | | | | | | | |
| Total net assets | | | 100.00 | % | | $ | 2,584,978,345 | |
| | | | | | | | |
| † | Non-income-earning security |
| « | All or a portion of this security is on loan. |
| (l) | The issuer of the security is an affiliated person of the Fund as defined in the Investment Company Act of 1940. |
| (r) | The investment is a non-registered investment company purchased with cash collateral received from securities on loan. |
| (u) | The rate represents the 7-day annualized yield at period end. |
The accompanying notes are an integral part of these financial statements.
| | | | | | |
| Portfolio of investments—January 31, 2018 (unaudited) | | Wells Fargo Premier Large Company Growth Fund | | | 11 | |
Investments in Affiliates
An affiliated investment is an investment in which the Fund owns at least 5% of the outstanding voting shares of the issuer or as a result of other relationships, such as the Fund and the issuer having the same investment manager. Transactions with issuers that were either affiliated persons of the Fund at the beginning of the period or the end of the period were as follows:
| | | | | | | | | | | | | | | | | | | | | | | | | | | | | | | | | | | | |
| | | Shares,
beginning of
period | | | Shares
purchased | | | Shares
sold | | | Shares,
end of
period | | | Net
realized
gains
(losses) | | | Net
change in
unrealized gains
(losses) | | | Income
from
affiliated
securities | | | Value,
end
of period | | | % of
net
assets | |
Short-Term Investments | | | | | | | | | | | | | | | | | | | | | | | | | | | | | | | | | | | | |
Investment Companies | | | | | | | | | | | | | | | | | | | | | | | | | | | | | | | | | | | | |
Securities Lending Cash Investment LLC | | | 46,026,258 | | | | 199,910,746 | | | | 232,132,973 | | | | 13,804,031 | | | $ | 1,723 | | | $ | (1,715 | ) | | $ | 43,290 | | | $ | 13,805,411 | | | | | |
Wells Fargo Government Money Market Fund Select Class | | | 9,162,823 | | | | 357,474,711 | | | | 352,826,736 | | | | 13,810,798 | | | | 0 | | | | 0 | | | | 67,024 | | | | 13,810,798 | | | | | |
| | | | | | | | | | | | | | | | | | | | | | | | | | | | | | | | | | | | |
| | | | | | | | | | | | | | | | | | $ | 1,723 | | | $ | (1,715 | ) | | $ | 110,314 | | | $ | 27,616,209 | | | | 1.07 | % |
| | | | | | | | | | | | | | | | | | | | | | | | | | | | | | | | | | | | |
The accompanying notes are an integral part of these financial statements.
| | | | |
| 12 | | Wells Fargo Premier Large Company Growth Fund | | Statement of assets and liabilities—January 31, 2018 (unaudited) |
| | | | |
| | | | |
| |
Assets | | | | |
Investments in unaffiliated securities (including $13,519,968 of securities loaned), at value (cost $1,328,997,478) | | $ | 2,582,822,117 | |
Investments in affiliated securities, at value (cost $27,616,209) | | | 27,616,209 | |
Receivable for investments sold | | | 2,783,690 | |
Receivable for Fund shares sold | | | 1,619,535 | |
Receivable for dividends | | | 859,673 | |
Receivable for securities lending income | | | 5,347 | |
Prepaid expenses and other assets | | | 166,931 | |
| | | | |
Total assets | | | 2,615,873,502 | |
| | | | |
| |
Liabilities | | | | |
Payable upon receipt of securities loaned | | | 13,802,450 | |
Payable for investments purchased | | | 9,385,664 | |
Payable for Fund shares redeemed | | | 5,418,113 | |
Management fee payable | | | 1,263,784 | |
Administration fees payable | | | 348,747 | |
Distribution fee payable | | | 132,239 | |
Trustees’ fees and expenses payable | | | 1,868 | |
Accrued expenses and other liabilities | | | 542,292 | |
| | | | |
Total liabilities | | | 30,895,157 | |
| | | | |
Total net assets | | $ | 2,584,978,345 | |
| | | | |
| |
NET ASSETS CONSIST OF | | | | |
Paid-in capital | | $ | 1,229,735,101 | |
Accumulated net investment loss | | | (3,810,290 | ) |
Accumulated net realized gains on investments | | | 105,228,895 | |
Net unrealized gains on investments | | | 1,253,824,639 | |
| | | | |
Total net assets | | $ | 2,584,978,345 | |
| | | | |
| |
COMPUTATION OF NET ASSET VALUE AND OFFERING PRICE PER SHARE | | | | |
Net assets – Class A | | $ | 1,081,226,624 | |
Shares outstanding – Class A1 | | | 75,128,519 | |
Net asset value per share – Class A | | | $14.39 | |
Maximum offering price per share – Class A2 | | | $15.27 | |
Net assets – Class C | | $ | 212,272,762 | |
Shares outstanding – Class C1 | | | 18,698,145 | |
Net asset value per share – Class C | | | $11.35 | |
Net assets – Class R4 | | $ | 3,800,814 | |
Share outstanding – Class R41 | | | 254,682 | |
Net asset value per share – Class R4 | | | $14.92 | |
Net assets – Class R6 | | $ | 190,542,394 | |
Shares outstanding – Class R61 | | | 12,634,125 | |
Net asset value per share – Class R6 | | | $15.08 | |
Net assets – Administrator Class | | $ | 83,229,552 | |
Shares outstanding – Administrator Class1 | | | 5,692,692 | |
Net asset value per share – Administrator Class | | | $14.62 | |
Net assets – Institutional Class | | $ | 1,013,906,199 | |
Shares outstanding – Institutional Class1 | | | 67,406,138 | |
Net asset value per share – Institutional Class | | | $15.04 | |
| 1 | The Fund has an unlimited number of authorized shares. |
| 2 | Maximum offering price is computed as 100/94.25 of net asset value. On investments of $50,000 or more, the offering price is reduced. |
The accompanying notes are an integral part of these financial statements.
| | | | | | |
| Statement of operations—six months ended January 31, 2018 (unaudited) | | Wells Fargo Premier Large Company Growth Fund | | | 13 | |
| | | | |
| | | | |
| |
Investment income | | | | |
Dividends (net of foreign withholding taxes of $18,244) | | $ | 9,887,000 | |
Income from affiliated securities | | | 110,314 | |
| | | | |
Total investment income | | | 9,997,314 | |
| | | | |
| |
Expenses | | | | |
Management fee | | | 8,118,874 | |
Administration fees | | | | |
Class A | | | 1,070,803 | |
Class C | | | 216,445 | |
Class R4 | | | 1,430 | |
Class R6 | | | 25,839 | |
Administrator Class | | | 53,982 | |
Institutional Class | | | 631,834 | |
Shareholder servicing fees | | | | |
Class A | | | 1,274,765 | |
Class C | | | 257,673 | |
Class R4 | | | 1,787 | |
Administrator Class | | | 103,812 | |
Distribution fee | | | | |
Class C | | | 773,019 | |
Custody and accounting fees | | | 85,786 | |
Professional fees | | | 27,197 | |
Registration fees | | | 65,662 | |
Shareholder report expenses | | | 106,418 | |
Trustees’ fees and expenses | | | 14,356 | |
Other fees and expenses | | | 39,937 | |
| | | | |
Total expenses | | | 12,869,619 | |
Less: Fee waivers and/or expense reimbursements | | | (900,994 | ) |
| | | | |
Net expenses | | | 11,968,625 | |
| | | | |
Net investment loss | | | (1,971,311 | ) |
| | | | |
| |
REALIZED AND UNREALIZED GAINS (LOSSES) ON INVESTMENTS | | | | |
| |
Net realized gains on: | | | | |
Unaffiliated securities | | | 197,774,208 | |
Affiliated securities | | | 1,723 | |
| | | | |
Net realized gains on investments | | | 197,775,931 | |
| | | | |
| |
Net change in unrealized gains (losses) on: | | | | |
Unaffiliated securities | | | 267,538,546 | |
Affiliated securities | | | (1,715 | ) |
| | | | |
Net change in unrealized gains (losses) on investments | | | 267,536,831 | |
| | | | |
Net realized and unrealized gains (losses) on investments | | | 465,312,762 | |
| | | | |
Net increase in net assets resulting from operations | | $ | 463,341,451 | |
| | | | |
The accompanying notes are an integral part of these financial statements.
| | | | |
| 14 | | Wells Fargo Premier Large Company Growth Fund | | Statement of changes in net assets |
| | | | | | | | | | | | | | | | |
| | | Six months ended
January 31, 2018
(unaudited) | | | Year ended
July 31, 2017 | |
| | | | |
Operations | | | | | | | | | | | | | | | | |
Net investment loss | | | | | | $ | (1,971,311 | ) | | | | | | $ | (2,578,112 | ) |
Net realized gains on investments | | | | | | | 197,775,931 | | | | | | | | 573,282,638 | |
Net change in unrealized gains (losses) on investments | | | | | | | 267,536,831 | | | | | | | | (214,116,686 | ) |
| | | | |
Net increase in net assets resulting from operations | | | | | | | 463,341,451 | | | | | | | | 356,587,840 | |
| | | | |
| | | | |
Distributions to shareholders from | | | | | | | | | | | | | | | | |
Net realized gains | | | | | | | | | | | | | | | | |
Class A | | | | | | | (227,679,727 | ) | | | | | | | (141,609,478 | ) |
Class B | | | | | | | N/A | | | | | | | | (64,503 | )1 |
Class C | | | | | | | (54,543,209 | ) | | | | | | | (28,218,921 | ) |
Class R4 | | | | | | | (746,155 | ) | | | | | | | (356,581 | ) |
Class R6 | | | | | | | (37,680,602 | ) | | | | | | | (14,601,788 | ) |
Administrator Class | | | | | | | (18,099,486 | ) | | | | | | | (11,817,935 | ) |
Institutional Class | | | | | | | (222,234,431 | ) | | | | | | | (94,245,557 | ) |
| | | | |
Total distributions to shareholders | | | | | | | (560,983,610 | ) | | | | | | | (290,914,763 | ) |
| | | | |
| | | | |
Capital share transactions | | | Shares | | | | | | | | Shares | | | | | |
Proceeds from shares sold | | | | | | | | | | | | | | | | |
Class A | | | 1,912,792 | | | | 27,389,485 | | | | 6,001,464 | | | | 83,780,770 | |
Class B | | | N/A | | | | N/A | | | | 657 | 1 | | | 7,221 | 1 |
Class C | | | 1,112,398 | | | | 12,193,247 | | | | 1,164,251 | | | | 13,390,566 | |
Class R4 | | | 51,735 | | | | 803,859 | | | | 67,177 | | | | 939,076 | |
Class R6 | | | 838,391 | | | | 13,734,759 | | | | 1,591,648 | | | | 23,787,894 | |
Administrator Class | | | 248,551 | | | | 3,833,815 | | | | 991,894 | | | | 14,305,839 | |
Institutional Class | | | 7,688,342 | | | | 125,373,032 | | | | 28,960,656 | | | | 420,855,765 | |
| | | | |
| | | | | | | 183,328,197 | | | | | | | | 557,067,131 | |
| | | | |
Reinvestment of distributions | | | | | | | | | | | | | | | | |
Class A | | | 15,972,127 | | | | 209,554,313 | | | | 10,164,417 | | | | 132,137,425 | |
Class B | | | N/A | | | | N/A | | | | 4,868 | 1 | | | 53,503 | 1 |
Class C | | | 4,459,739 | | | | 46,202,895 | | | | 2,029,580 | | | | 22,223,900 | |
Class R4 | | | 54,558 | | | | 741,983 | | | | 26,770 | | | | 356,581 | |
Class R6 | | | 2,631,345 | | | | 36,154,683 | | | | 1,045,350 | | | | 14,018,149 | |
Administrator Class | | | 1,320,910 | | | | 17,607,730 | | | | 870,110 | | | | 11,433,242 | |
Institutional Class | | | 14,695,688 | | | | 201,477,896 | | | | 5,849,310 | | | | 78,322,263 | |
| | | | |
| | | | | | | 511,739,500 | | | | | | | | 258,545,063 | |
| | | | |
Payment for shares redeemed | | | | | | | | | | | | | | | | |
Class A | | | (7,099,702 | ) | | | (106,618,015 | ) | | | (67,446,125 | ) | | | (941,219,557 | ) |
Class B | | | N/A | | | | N/A | | | | (74,169 | )1 | | | (895,170 | )1 |
Class C | | | (2,892,046 | ) | | | (35,267,685 | ) | | | (10,665,863 | ) | | | (126,947,986 | ) |
Class R4 | | | (77,517 | ) | | | (1,243,585 | ) | | | (133,927 | ) | | | (1,970,170 | ) |
Class R6 | | | (1,586,717 | ) | | | (25,296,891 | ) | | | (3,768,974 | ) | | | (55,499,096 | ) |
Administrator Class | | | (1,225,555 | ) | | | (18,640,507 | ) | | | (16,274,337 | ) | | | (233,767,928 | ) |
Institutional Class | | | (14,898,468 | ) | | | (224,755,144 | ) | | | (47,785,920 | ) | | | (691,184,624 | ) |
| | | | |
| | | | | | | (411,821,827 | ) | | | | | | | (2,051,484,531 | ) |
| | | | |
Net increase (decrease) in net assets resulting from capital share transactions | | | | | | | 283,245,870 | | | | | | | | (1,235,872,337 | ) |
| | | | |
Total increase (decrease) in net assets | | | | | | | 185,603,711 | | | | | | | | (1,170,199,260 | ) |
| | | | |
| | | | |
Net assets | | | | | | | | | | | | | | | | |
Beginning of period | | | | | | | 2,399,374,634 | | | | | | | | 3,569,573,894 | |
| | | | |
End of period | | | | | | $ | 2,584,978,345 | | | | | | | $ | 2,399,374,634 | |
| | | | |
Accumulated net investment loss | | | | | | $ | (3,810,290 | ) | | | | | | $ | (1,838,979 | ) |
| | | | |
| 1 | For the period from August 1, 2016 to May 5, 2017. Effective at the close of business on May 5, 2017, Class B shares were converted to Class A shares and are no longer offered by the Fund. |
The accompanying notes are an integral part of these financial statements.
| | | | | | |
| Financial highlights | | Wells Fargo Premier Large Company Growth Fund | | | 15 | |
(For a share outstanding throughout each period)
| | | | | | | | | | | | | | | | | | | | | | | | |
| | | Six months ended
January 31, 2018
(unaudited) | | | Year ended July 31 | |
| CLASS A | | | 2017 | | | 2016 | | | 2015 | | | 2014 | | | 2013 | |
Net asset value, beginning of period | | | $15.34 | | | | $14.68 | | | | $16.28 | | | | $14.55 | | | | $12.57 | | | | $10.21 | |
Net investment loss | | | (0.02 | ) | | | (0.03 | )1 | | | (0.03 | ) | | | (0.03 | ) | | | (0.05 | ) | | | (0.02 | ) |
Net realized and unrealized gains (losses) on investments | | | 2.82 | | | | 2.12 | | | | (0.52 | ) | | | 1.97 | | | | 2.03 | | | | 2.38 | |
| | | | | | | | | | | | | | | | | | | | | | | | |
Total from investment operations | | | 2.80 | | | | 2.09 | | | | (0.55 | ) | | | 1.94 | | | | 1.98 | | | | 2.36 | |
Distributions to shareholders from | | | | | | | | | | | | | | | | | | | | | | | | |
Net realized gains | | | (3.75 | ) | | | (1.43 | ) | | | (1.05 | ) | | | (0.21 | ) | | | 0.00 | | | | 0.00 | |
Net asset value, end of period | | | $14.39 | | | | $15.34 | | | | $14.68 | | | | $16.28 | | | | $14.55 | | | | $12.57 | |
Total return2 | | | 20.59 | % | | | 16.01 | % | | | (3.22 | )% | | | 13.46 | % | | | 15.75 | % | | | 23.11 | % |
Ratios to average net assets (annualized) | | | | | | | | | | | | | | | | | | | | | | | | |
Gross expenses | | | 1.15 | % | | | 1.14 | % | | | 1.13 | % | | | 1.16 | % | | | 1.17 | % | | | 1.19 | % |
Net expenses | | | 1.11 | % | | | 1.11 | % | | | 1.11 | % | | | 1.12 | % | | | 1.12 | % | | | 1.12 | % |
Net investment loss | | | (0.30 | )% | | | (0.20 | )% | | | (0.17 | )% | | | (0.18 | )% | | | (0.36 | )% | | | (0.15 | )% |
Supplemental data | | | | | | | | | | | | | | | | | | | | | | | | |
Portfolio turnover rate | | | 18 | % | | | 65 | % | | | 47 | % | | | 44 | % | | | 37 | % | | | 32 | % |
Net assets, end of period (000s omitted) | | | $1,081,227 | | | | $986,791 | | | | $1,697,746 | | | | $2,280,107 | | | | $1,908,455 | | | | $1,515,862 | |
| 1 | Calculated based upon average shares outstanding |
| 2 | Total return calculations do not include any sales charges. Returns for periods of less than one year are not annualized. |
The accompanying notes are an integral part of these financial statements.
| | | | |
| 16 | | Wells Fargo Premier Large Company Growth Fund | | Financial highlights |
(For a share outstanding throughout each period)
| | | | | | | | | | | | | | | | | | | | | | | | |
| | | Six months ended
January 31, 2018
(unaudited) | | | Year ended July 31 | |
| CLASS C | | | 2017 | | | 2016 | | | 2015 | | | 2014 | | | 2013 | |
Net asset value, beginning of period | | | $12.86 | | | | $12.64 | | | | $14.27 | | | | $12.87 | | | | $11.20 | | | | $9.17 | |
Net investment loss | | | (0.07 | )1 | | | (0.12 | )1 | | | (0.12 | )1 | | | (0.13 | )1 | | | (0.14 | )1 | | | (0.09 | )1 |
Net realized and unrealized gains (losses) on investments | | | 2.31 | | | | 1.77 | | | | (0.46 | ) | | | 1.74 | | | | 1.81 | | | | 2.12 | |
| | | | | | | | | | | | | | | | | | | | | | | | |
Total from investment operations | | | 2.24 | | | | 1.65 | | | | (0.58 | ) | | | 1.61 | | | | 1.67 | | | | 2.03 | |
Distributions to shareholders from | | | | | | | | | | | | | | | | | | | | | | | | |
Net realized gains | | | (3.75 | ) | | | (1.43 | ) | | | (1.05 | ) | | | (0.21 | ) | | | 0.00 | | | | 0.00 | |
Net asset value, end of period | | | $11.35 | | | | $12.86 | | | | $12.64 | | | | $14.27 | | | | $12.87 | | | | $11.20 | |
Total return2 | | | 20.17 | % | | | 15.05 | % | | | (3.92 | )% | | | 12.65 | % | | | 14.91 | % | | | 22.14 | % |
Ratios to average net assets (annualized) | | | | | | | | | | | | | | | | | | | | | | | | |
Gross expenses | | | 1.90 | % | | | 1.89 | % | | | 1.88 | % | | | 1.91 | % | | | 1.92 | % | | | 1.94 | % |
Net expenses | | | 1.86 | % | | | 1.86 | % | | | 1.86 | % | | | 1.87 | % | | | 1.87 | % | | | 1.87 | % |
Net investment loss | | | (1.05 | )% | | | (0.95 | )% | | | (0.92 | )% | | | (0.93 | )% | | | (1.11 | )% | | | (0.91 | )% |
Supplemental data | | | | | | | | | | | | | | | | | | | | | | | | |
Portfolio turnover rate | | | 18 | % | | | 65 | % | | | 47 | % | | | 44 | % | | | 37 | % | | | 32 | % |
Net assets, end of period (000s omitted) | | | $212,273 | | | | $206,026 | | | | $296,896 | | | | $388,290 | | | | $374,136 | | | | $279,203 | |
| 1 | Calculated based upon average shares outstanding |
| 2 | Total return calculations do not include any sales charges. Returns for periods of less than one year are not annualized. |
The accompanying notes are an integral part of these financial statements.
| | | | | | |
| Financial highlights | | Wells Fargo Premier Large Company Growth Fund | | | 17 | |
(For a share outstanding throughout each period)
| | | | | | | | | | | | | | | | | | | | | | | | |
| | | Six months ended
January 31, 2018
(unaudited) | | | Year ended July 31 | |
| CLASS R4 | | | 2017 | | | 2016 | | | 2015 | | | 2014 | | | 20131 | |
Net asset value, beginning of period | | | $15.75 | | | | $15.00 | | | | $16.56 | | | | $14.75 | | | | $12.70 | | | | $10.81 | |
Net investment income (loss) | | | 0.00 | 2,3 | | | 0.01 | 2 | | | 0.02 | 2 | | | 0.02 | | | | (0.01 | ) | | | 0.00 | 3 |
Net realized and unrealized gains (losses) on investments | | | 2.92 | | | | 2.17 | | | | (0.53 | ) | | | 2.00 | | | | 2.06 | | | | 1.89 | |
| | | | | | | | | | | | | | | | | | | | | | | | |
Total from investment operations | | | 2.92 | | | | 2.18 | | | | (0.51 | ) | | | 2.02 | | | | 2.05 | | | | 1.89 | |
Distributions to shareholders from | | | | | | | | | | | | | | | | | | | | | | | | |
Net realized gains | | | (3.75 | ) | | | (1.43 | ) | | | (1.05 | ) | | | (0.21 | ) | | | 0.00 | | | | 0.00 | |
Net asset value, end of period | | | $14.92 | | | | $15.75 | | | | $15.00 | | | | $16.56 | | | | $14.75 | | | | $12.70 | |
Total return4 | | | 20.83 | % | | | 16.30 | % | | | (2.91 | )% | | | 13.82 | % | | | 16.14 | % | | | 17.48 | % |
Ratios to average net assets (annualized) | | | | | | | | | | | | | | | | | | | | | | | | |
Gross expenses | | | 0.87 | % | | | 0.86 | % | | | 0.85 | % | | | 0.83 | % | | | 0.84 | % | | | 0.85 | % |
Net expenses | | | 0.80 | % | | | 0.80 | % | | | 0.80 | % | | | 0.80 | % | | | 0.80 | % | | | 0.80 | % |
Net investment income (loss) | | | 0.02 | % | | | 0.09 | % | | | 0.13 | % | | | 0.13 | % | | | (0.11 | )% | | | 0.06 | % |
Supplemental data | | | | | | | | | | | | | | | | | | | | | | | | |
Portfolio turnover rate | | | 18 | % | | | 65 | % | | | 47 | % | | | 44 | % | | | 37 | % | | | 32 | % |
Net assets, end of period (000s omitted) | | | $3,801 | | | | $3,559 | | | | $3,988 | | | | $2,129 | | | | $765 | | | | $131 | |
| 1 | For the period from November 30, 2012 (commencement of class operations) to July 31, 2013 |
| 2 | Calculated based upon average shares outstanding |
| 3 | Amount is less than $0.005. |
| 4 | Returns for periods of less than one year are not annualized. |
The accompanying notes are an integral part of these financial statements.
| | | | |
| 18 | | Wells Fargo Premier Large Company Growth Fund | | Financial highlights |
(For a share outstanding throughout each period)
| | | | | | | | | | | | | | | | | | | | | | | | |
| | | Six months ended
January 31, 2018
(unaudited) | | | Year ended July 31 | |
| CLASS R6 | | | 2017 | | | 2016 | | | 2015 | | | 2014 | | | 20131 | |
Net asset value, beginning of period | | | $15.87 | | | | $15.08 | | | | $16.62 | | | | $14.77 | | | | $12.71 | | | | $10.81 | |
Net investment income | | | 0.01 | 2 | | | 0.03 | 2 | | | 0.04 | 2 | | | 0.05 | | | | 0.01 | | | | 0.00 | 3 |
Net realized and unrealized gains (losses) on investments | | | 2.95 | | | | 2.19 | | | | (0.53 | ) | | | 2.01 | | | | 2.05 | | | | 1.90 | |
| | | | | | | | | | | | | | | | | | | | | | | | |
Total from investment operations | | | 2.96 | | | | 2.22 | | | | (0.49 | ) | | | 2.06 | | | | 2.06 | | | | 1.90 | |
Distributions to shareholders from | | | | | | | | | | | | | | | | | | | | | | | | |
Net realized gains | | | (3.75 | ) | | | (1.43 | ) | | | (1.05 | ) | | | (0.21 | ) | | | 0.00 | | | | 0.00 | |
Net asset value, end of period | | | $15.08 | | | | $15.87 | | | | $15.08 | | | | $16.62 | | | | $14.77 | | | | $12.71 | |
Total return4 | | | 20.93 | % | | | 16.48 | % | | | (2.78 | )% | | | 14.00 | % | | | 16.29 | % | | | 17.58 | % |
Ratios to average net assets (annualized) | | | | | | | | | | | | | | | | | | | | | | | | |
Gross expenses | | | 0.72 | % | | | 0.71 | % | | | 0.70 | % | | | 0.68 | % | | | 0.69 | % | | | 0.71 | % |
Net expenses | | | 0.65 | % | | | 0.65 | % | | | 0.65 | % | | | 0.65 | % | | | 0.65 | % | | | 0.65 | % |
Net investment income | | | 0.17 | % | | | 0.25 | % | | | 0.28 | % | | | 0.29 | % | | | 0.09 | % | | | 0.05 | % |
Supplemental data | | | | | | | | | | | | | | | | | | | | | | | | |
Portfolio turnover rate | | | 18 | % | | | 65 | % | | | 47 | % | | | 44 | % | | | 37 | % | | | 32 | % |
Net assets, end of period (000s omitted) | | | $190,542 | | | | $170,657 | | | | $179,198 | | | | $166,768 | | | | $163,871 | | | | $4,629 | |
| 1 | For the period from November 30, 2012 (commencement of class operations) to July 31, 2013 |
| 2 | Calculated based upon average shares outstanding |
| 3 | Amount is less than $0.005. |
| 4 | Returns for periods of less than one year are not annualized. |
The accompanying notes are an integral part of these financial statements.
| | | | | | |
| Financial highlights | | Wells Fargo Premier Large Company Growth Fund | | | 19 | |
(For a share outstanding throughout each period)
| | | | | | | | | | | | | | | | | | | | | | | | |
| | | Six months ended
January 31, 2018
(unaudited) | | | Year ended July 31 | |
| ADMINISTRATOR CLASS | | | 2017 | | | 2016 | | | 2015 | | | 2014 | | | 2013 | |
Net asset value, beginning of period | | | $15.52 | | | | $14.82 | | | | $16.41 | | | | $14.63 | | | | $12.62 | | | | $10.24 | |
Net investment loss | | | (0.01 | )1 | | | (0.01 | )1 | | | (0.00 | )1,2 | | | (0.00 | )2 | | | (0.02 | ) | | | (0.00 | )2 |
Net realized and unrealized gains (losses) on investments | | | 2.86 | | | | 2.14 | | | | (0.54 | ) | | | 1.99 | | | | 2.03 | | | | 2.38 | |
| | | | | | | | | | | | | | | | | | | | | | | | |
Total from investment operations | | | 2.85 | | | | 2.13 | | | | (0.54 | ) | | | 1.99 | | | | 2.01 | | | | 2.38 | |
Distributions to shareholders from | | | | | | | | | | | | | | | | | | | | | | | | |
Net realized gains | | | (3.75 | ) | | | (1.43 | ) | | | (1.05 | ) | | | (0.21 | ) | | | 0.00 | | | | 0.00 | |
Net asset value, end of period | | | $14.62 | | | | $15.52 | | | | $14.82 | | | | $16.41 | | | | $14.63 | | | | $12.62 | |
Total return3 | | | 20.68 | % | | | 16.14 | % | | | (3.13 | )% | | | 13.73 | % | | | 15.93 | % | | | 23.24 | % |
Ratios to average net assets (annualized) | | | | | | | | | | | | | | | | | | | | | | | | |
Gross expenses | | | 1.07 | % | | | 1.06 | % | | | 1.04 | % | | | 1.00 | % | | | 1.00 | % | | | 1.04 | % |
Net expenses | | | 1.00 | % | | | 1.00 | % | | | 0.98 | % | | | 0.95 | % | | | 0.95 | % | | | 0.95 | % |
Net investment loss | | | (0.19 | )% | | | (0.06 | )% | | | (0.02 | )% | | | (0.01 | )% | | | (0.19 | )% | | | (0.01 | )% |
Supplemental data | | | | | | | | | | | | | | | | | | | | | | | | |
Portfolio turnover rate | | | 18 | % | | | 65 | % | | | 47 | % | | | 44 | % | | | 37 | % | | | 32 | % |
Net assets, end of period (000s omitted) | | | $83,230 | | | | $82,998 | | | | $292,900 | | | | $1,129,970 | | | | $1,325,864 | | | | $640,494 | |
| 1 | Calculated based upon average shares outstanding |
| 2 | Amount is less than $0.005. |
| 3 | Returns for periods of less than one year are not annualized. |
The accompanying notes are an integral part of these financial statements.
| | | | |
| 20 | | Wells Fargo Premier Large Company Growth Fund | | Financial highlights |
(For a share outstanding throughout each period)
| | | | | | | | | | | | | | | | | | | | | | | | |
| | | Six months ended
January 31, 2018
(unaudited) | | | Year ended July 31 | |
| INSTITUTIONAL CLASS | | | 2017 | | | 2016 | | | 2015 | | | 2014 | | | 2013 | |
Net asset value, beginning of period | | | $15.84 | | | | $15.06 | | | | $16.61 | | | | $14.77 | | | | $12.71 | | | | $10.28 | |
Net investment income | | | 0.01 | 1 | | | 0.02 | 1 | | | 0.03 | 1 | | | 0.03 | | | | 0.01 | 1 | | | 0.00 | 2 |
Net realized and unrealized gains (losses) on investments | | | 2.94 | | | | 2.19 | | | | (0.53 | ) | | | 2.02 | | | | 2.05 | | | | 2.43 | |
| | | | | | | | | | | | | | | | | | | | | | | | |
Total from investment operations | | | 2.95 | | | | 2.21 | | | | (0.50 | ) | | | 2.05 | | | | 2.06 | | | | 2.43 | |
Distributions to shareholders from | | | | | | | | | | | | | | | | | | | | | | | | |
Net realized gains | | | (3.75 | ) | | | (1.43 | ) | | | (1.05 | ) | | | (0.21 | ) | | | 0.00 | | | | 0.00 | |
Net asset value, end of period | | | $15.04 | | | | $15.84 | | | | $15.06 | | | | $16.61 | | | | $14.77 | | | | $12.71 | |
Total return3 | | | 20.90 | % | | | 16.44 | % | | | (2.85 | )% | | | 14.01 | % | | | 16.21 | % | | | 23.64 | % |
Ratios to average net assets (annualized) | | | | | | | | | | | | | | | | | | | | | | | | |
Gross expenses | | | 0.82 | % | | | 0.81 | % | | | 0.80 | % | | | 0.74 | % | | | 0.74 | % | | | 0.76 | % |
Net expenses | | | 0.70 | % | | | 0.70 | % | | | 0.70 | % | | | 0.70 | % | | | 0.70 | % | | | 0.71 | % |
Net investment income | | | 0.12 | % | | | 0.19 | % | | | 0.23 | % | | | 0.23 | % | | | 0.07 | % | | | 0.16 | % |
Supplemental data | | | | | | | | | | | | | | | | | | | | | | | | |
Portfolio turnover rate | | | 18 | % | | | 65 | % | | | 47 | % | | | 44 | % | | | 37 | % | | | 32 | % |
Net assets, end of period (000s omitted) | | | $1,013,906 | | | | $949,344 | | | | $1,097,976 | | | | $1,313,281 | | | | $1,031,979 | | | | $1,328,994 | |
| 1 | Calculated based upon average shares outstanding |
| 2 | Amount is less than $0.005. |
| 3 | Returns for periods of less than one year are not annualized. |
The accompanying notes are an integral part of these financial statements.
| | | | | | |
| Notes to financial statements (unaudited) | | Wells Fargo Premier Large Company Growth Fund | | | 21 | |
1. ORGANIZATION
Wells Fargo Funds Trust (the “Trust”), a Delaware statutory trust organized on March 10, 1999, is an open-end management investment company registered under the Investment Company Act of 1940, as amended (the “1940 Act”). As an investment company, the Trust follows the accounting and reporting guidance in Financial Accounting Standards Board Accounting Standards Codification Topic 946, Financial Services – Investment Companies. These financial statements report on the Wells Fargo Premier Large Company Growth Fund (the “Fund”) which is a diversified series of the Trust.
Effective at the close of business on May 5, 2017, Class B shares were converted to Class A shares and are no longer offered by the Fund. Information for Class B shares reflected in the financial statements represents activity through May 5, 2017.
2. SIGNIFICANT ACCOUNTING POLICIES
The following significant accounting policies, which are consistently followed in the preparation of the financial statements of the Fund, are in conformity with U.S. generally accepted accounting principles which require management to make estimates and assumptions that affect the reported amounts of assets and liabilities, disclosure of contingent assets and liabilities at the date of the financial statements, and the reported amounts of revenues and expenses during the reporting period. Actual results could differ from those estimates.
Securities valuation
All investments are valued each business day as of the close of regular trading on the New York Stock Exchange (generally 4 p.m. Eastern Time), although the Fund may deviate from this calculation time under unusual or unexpected circumstances.
Equity securities that are listed on a foreign or domestic exchange or market are valued at the official closing price or, if none, the last sales price. If no sale occurs on the principal exchange or market that day, a fair value price will be determined in accordance with the Fund’s Valuation Procedures.
Investments in registered open-end investment companies are valued at net asset value. Interests in non-registered investment companies that are redeemable at net asset value are fair valued normally at net asset value.
Investments which are not valued using any of the methods discussed above are valued at their fair value, as determined in good faith by the Board of Trustees of the Fund. The Board of Trustees has established a Valuation Committee comprised of the Trustees and has delegated to it the authority to take any actions regarding the valuation of portfolio securities that the Valuation Committee deems necessary or appropriate, including determining the fair value of portfolio securities, unless the determination has been delegated to the Wells Fargo Asset Management Pricing Committee of Wells Fargo Funds Management, LLC (“Funds Management”). The Board of Trustees retains the authority to make or ratify any valuation decisions or approve any changes to the Valuation Procedures as it deems appropriate. On a quarterly basis, the Board of Trustees receives reports on any valuation actions taken by the Valuation Committee or the Wells Fargo Asset Management Pricing Committee which may include items for ratification.
Valuations of fair valued securities are compared to the next actual sales price when available, or other appropriate market values, to assess the continued appropriateness of the fair valuation methodologies used. These securities are fair valued on a day-to-day basis, taking into consideration changes to appropriate market information and any significant changes to the inputs considered in the valuation process until there is a readily available price provided on an exchange or by an independent pricing service. Valuations received from an independent pricing service or independent broker-dealer quotes are periodically validated by comparisons to most recent trades and valuations provided by other independent pricing services in addition to the review of prices by the manager and/or subadviser. Unobservable inputs used in determining fair valuations are identified based on the type of security, taking into consideration factors utilized by market participants in valuing the investment, knowledge about the issuer and the current market environment.
Security loans
The Fund may lend its securities from time to time in order to earn additional income in the form of fees or interest on securities received as collateral or the investment of any cash received as collateral. The Fund continues to receive interest or dividends on the securities loaned. The Fund receives collateral in the form of cash or securities with a value at least equal to the value of the securities on loan. The value of the loaned securities is determined at the close of each business day and any additional required collateral is delivered to the Fund on the next business day. In a securities lending transaction, the net asset value of the Fund will be affected by an increase or decrease in the value of the securities loaned and by an increase or decrease in the value of the instrument in which collateral is invested. The amount of securities lending activity undertaken by the Fund fluctuates from time to time. In the event of default or bankruptcy by the borrower, the Fund may be prevented from recovering the loaned securities or gaining access to the collateral or
| | | | |
| 22 | | Wells Fargo Premier Large Company Growth Fund | | Notes to financial statements (unaudited) |
may experience delays or costs in doing so. In addition, the investment of any cash collateral received may lose all or part of its value. The Fund has the right under the lending agreement to recover the securities from the borrower on demand.
The Fund lends its securities through an unaffiliated securities lending agent. Cash collateral received in connection with its securities lending transactions is invested in Securities Lending Cash Investments, LLC (the “Securities Lending Fund”). The Securities Lending Fund is exempt from registration under Section 3(c)(7) of the 1940 Act and is managed by Funds Management and is subadvised by Wells Capital Management Incorporated (“WellsCap”), an affiliate of Funds Management and an indirect wholly owned subsidiary of Wells Fargo & Company (“Wells Fargo”). Funds Management receives an advisory fee starting at 0.05% and declining to 0.01% as the average daily net assets of the Securities Lending Fund increase. All of the fees received by Funds Management are paid to WellsCap for its services as subadviser. The Securities Lending Fund seeks to provide a positive return compared to the daily Fed Funds Open Rate by investing in high-quality, U.S. dollar-denominated short-term money market instruments. Securities Lending Fund investments are valued at the evaluated bid price provided by an independent pricing service. Income earned from investment in the Securities Lending Fund is included in income from affiliated securities on the Statement of Operations.
Security transactions and income recognition
Securities transactions are recorded on a trade date basis. Realized gains or losses are recorded on the basis of identified cost.
Dividend income is recognized on the ex-dividend date. Dividend income is recorded net of foreign taxes withheld where recovery of such taxes is not assured.
Distributions to shareholders
Distributions to shareholders from net investment income and net realized gains, if any, are recorded on the ex-dividend date. Such distributions are determined in accordance with income tax regulations and may differ from U.S. generally accepted accounting principles. Dividend sources are estimated at the time of declaration. The tax character of distributions is determined as of the Fund’s fiscal year end. Therefore, a portion of the Fund’s distributions made prior to the Fund’s fiscal year end may be categorized as a tax return of capital.
Federal and other taxes
The Fund intends to continue to qualify as a regulated investment company by distributing substantially all of its investment company taxable and income and any net realized capital gains (after reduction for capital loss carryforwards) sufficient to relieve it from all, or substantially all, federal income taxes. Accordingly, no provision for federal income taxes was required.
The Fund’s income and federal excise tax returns and all financial records supporting those returns for the prior three fiscal years are subject to examination by the federal and Delaware revenue authorities. Management has analyzed the Fund’s tax positions taken on federal, state, and foreign tax returns for all open tax years and does not believe that there are any uncertain tax positions that require recognition of a tax liability.
As of January 31, 2018, the aggregate cost of all investments for federal income tax purposes was $1,358,182,936 and the unrealized gains (losses) consisted of:
| | | | |
Gross unrealized gains | | $ | 1,257,677,623 | |
Gross unrealized losses | | | (5,422,233 | ) |
Net unrealized gains | | $ | 1,252,255,390 | |
As of July 31, 2017, the Fund had a qualified late-year ordinary loss of $1,820,726 which was recognized on the first day of the current fiscal year.
Class allocations
The separate classes of shares offered by the Fund differ principally in applicable sales charges, distribution, shareholder servicing, and administration fees. Class specific expenses are charged directly to that share class. Investment income, common expenses, and realized and unrealized gains (losses) on investments are allocated daily to each class of shares based on the relative proportion of net assets of each class.
3. FAIR VALUATION MEASUREMENTS
Fair value measurements of investments are determined within a framework that has established a fair value hierarchy based upon the various data inputs utilized in determining the value of the Fund’s investments. The three-level hierarchy gives the highest priority to unadjusted quoted prices in active markets for identical assets or liabilities (Level 1) and the
| | | | | | |
| Notes to financial statements (unaudited) | | Wells Fargo Premier Large Company Growth Fund | | | 23 | |
lowest priority to unobservable inputs (Level 3). The Fund’s investments are classified within the fair value hierarchy based on the lowest level of input that is significant to the fair value measurement. The inputs are summarized into three broad levels as follows:
| ∎ | | Level 1 – quoted prices in active markets for identical securities |
| ∎ | | Level 2 – other significant observable inputs (including quoted prices for similar securities, interest rates, prepayment speeds, credit risk, etc.) |
| ∎ | | Level 3 – significant unobservable inputs (including the Fund’s own assumptions in determining the fair value of investments) |
The inputs or methodologies used for valuing investments in securities are not necessarily an indication of the risk associated with investing in those securities.
The following is a summary of the inputs used in valuing the Fund’s assets and liabilities as of January 31, 2018:
| | | | | | | | | | | | | | | | |
| | | Quoted prices
(Level 1) | | | Other significant
observable inputs
(Level 2) | | | Significant
unobservable inputs (Level 3) | | | Total | |
Assets | | | | | | | | | | | | | | | | |
Investments in: | | | | | | | | | | | | | | | | |
| | | | |
Common stocks | | | | | | | | | | | | | | | | |
Consumer discretionary | | $ | 378,451,811 | | | $ | 0 | | | $ | 0 | | | $ | 378,451,811 | |
Consumer staples | | | 80,106,351 | | | | 0 | | | | 0 | | | | 80,106,351 | |
Energy | | | 34,568,576 | | | | 0 | | | | 0 | | | | 34,568,576 | |
Financials | | | 164,592,685 | | | | 0 | | | | 0 | | | | 164,592,685 | |
Health care | | | 332,254,480 | | | | 0 | | | | 0 | | | | 332,254,480 | |
Industrials | | | 285,079,829 | | | | 0 | | | | 0 | | | | 285,079,829 | |
Information technology | | | 1,210,470,232 | | | | 0 | | | | 0 | | | | 1,210,470,232 | |
Materials | | | 75,147,587 | | | | 0 | | | | 0 | | | | 75,147,587 | |
Real estate | | | 22,150,566 | | | | 0 | | | | 0 | | | | 22,150,566 | |
| | | | |
Short-term investments | | | | | | | | | | | | | | | | |
Investment companies | | | 13,810,798 | | | | 0 | | | | 0 | | | | 13,810,798 | |
Investments measured at net asset value* | | | | | | | | | | | | | | | 13,805,411 | |
Total assets | | $ | 2,596,632,915 | | | $ | 0 | | | $ | 0 | | | $ | 2,610,438,326 | |
| * | Investments that are measured at fair value using the net asset value per share (or its equivalent) as a practical expedient have not been categorized in the fair value hierarchy. The fair value amount presented in the table is intended to permit reconciliation of the fair value hierarchy to the amounts presented in the Statement of Assets and Liabilities. The Fund’s investment in Securities Lending Cash Investments, LLC valued at $13,805,411 does not have a redemption period notice, can be redeemed daily and does not have any unfunded commitments. |
The Fund recognizes transfers between levels within the fair value hierarchy at the end of the reporting period. At January 31, 2018, the Fund did not have any transfers into/out of Level 1, Level 2, or Level 3.
4. TRANSACTIONS WITH AFFILIATES
Management fee
Funds Management, an indirect wholly owned subsidiary of Wells Fargo, is the manager of the Fund and provides advisory and fund-level administrative services under an investment management agreement. Under the investment management agreement, Funds Management is responsible for, among other services, implementing the investment objectives and strategies of the Fund, supervising the subadviser, providing fund-level administrative services in connection with the Fund’s operations, and providing any other fund-level administrative services reasonably necessary for the operation of the Fund. As compensation for its services under the investment management agreement, Funds Management is entitled to receive an annual management fee starting at 0.70% and declining to 0.505% as the average daily net assets of the Fund increase. For the six months ended January 31, 2018, the management fee was equivalent to an annual rate of 0.66% of the Fund’s average daily net assets.
| | | | |
| 24 | | Wells Fargo Premier Large Company Growth Fund | | Notes to financial statements (unaudited) |
Funds Management has retained the services of a subadviser to provide daily portfolio management to the Fund. The fee for subadvisory services is borne by Funds Management. WellsCap is the subadviser to the Fund and is entitled to receive a fee from Funds Management at an annual rate starting at 0.35% and declining to 0.275% as the average daily net assets of the Fund increase.
Administration fees
Under a class-level administration agreement, Funds Management provides class-level administrative services to the Fund, which includes paying fees and expenses for services provided by the transfer agent, sub-transfer agents, omnibus account servicers and record-keepers. As compensation for its services under the class-level administration agreement, Funds Management receives an annual fee which is calculated based on the average daily net assets of each class as follows:
| | | | |
| | | Class-level
administration fee | |
Class A, Class C | | | 0.21 | % |
Class R4 | | | 0.08 | |
Class R6 | | | 0.03 | |
Administrator Class, Institutional Class | | | 0.13 | |
Funds Management has contractually waived and/or reimbursed management and administration fees to the extent necessary to maintain certain net operating expense ratios for the Fund. Waiver of fees and/or reimbursement of expenses by Funds Management were made first from fund level expenses on a proportionate basis and then from class specific expenses. Funds Management has committed through November 30, 2018 to waive fees and/or reimburse expenses to the extent necessary to cap the Fund’s expenses at 1.11% for Class A shares, 1.86% for Class C shares, 0.80% for Class R4 shares, 0.65% for Class R6 shares, 1.00% for Administrator Class shares, and 0.70% for Institutional Class shares. After this time, the cap may be increased or the commitment to maintain the cap may be terminated only with the approval of the Board of Trustees.
Distribution fee
The Trust has adopted a distribution plan for Class C shares of the Fund pursuant to Rule 12b-1 under the 1940 Act. A distribution fee is charged to Class C shares and paid to Wells Fargo Funds Distributor, LLC (“Funds Distributor”), the principal underwriter, at an annual rate of 0.75% of the average daily net assets of Class C shares.
In addition, Funds Distributor is entitled to receive the front-end sales charge from the purchase of Class A shares and a contingent deferred sales charge on the redemption of certain Class A shares. Funds Distributor is also entitled to receive the contingent deferred sales charges from redemptions of Class C shares. For the six months ended January 31, 2018, Funds Distributor received $15,400 from the sale of Class A shares and $140 in contingent deferred sales charges from redemptions of Class C shares. No contingent deferred sales charges were incurred by Class A shares for the six months ended January 31, 2018.
Shareholder servicing fees
The Trust has entered into contracts with one or more shareholder servicing agents, whereby Class A, Class C, and Administrator Class of the Fund are charged a fee at an annual rate of 0.25% of the average daily net assets of each respective class. Class R4 is charged a fee at an annual rate of 0.10% of its average daily net assets.
A portion of these total shareholder servicing fees were paid to affiliates of Wells Fargo.
Interfund transactions
The Fund may purchase or sell portfolio investment securities to certain other Wells Fargo affiliates pursuant to Rule 17a-7 under the 1940 Act and under procedures adopted by the Board of Trustees. The procedures have been designed to ensure that these interfund transactions, which do not incur broker commissions, are effected at current market prices.
5. INVESTMENT PORTFOLIO TRANSACTIONS
Purchases and sales of investments, excluding U.S. government obligations (if any) and short-term securities, for the six months ended January 31, 2018 were $442,977,852 and $731,765,677 respectively.
| | | | | | |
| Notes to financial statements (unaudited) | | Wells Fargo Premier Large Company Growth Fund | | | 25 | |
6. BANK BORROWINGS
The Trust (excluding the money market funds and certain other funds) and Wells Fargo Variable Trust are parties to a $280,000,000 revolving credit agreement whereby the Fund is permitted to use bank borrowings for temporary or emergency purposes, such as to fund shareholder redemption requests. Interest under the credit agreement is charged to the Fund based on a borrowing rate equal to the higher of the Federal Funds rate in effect on that day plus 1.25% or the overnight LIBOR rate in effect on that day plus 1.25%. In addition, an annual commitment fee equal to 0.25% of the unused balance is allocated to each participating fund. Prior to August 29, 2017, the revolving credit agreement amount was $250,000,000.
For the six months ended January 31, 2018, there were no borrowings by the Fund under the agreement.
7. CONCENTRATION RISK
Concentration risks result from exposure to a limited number of sectors. A fund that invests a substantial portion of its assets in any sector may be more affected by changes in that sector than would be a fund whose investments are not heavily weighted in any sector.
8. INDEMNIFICATION
Under the Trust’s organizational documents, the officers and Trustees have been granted certain indemnification rights against certain liabilities that may arise out of performance of their duties to the Trust. Additionally, in the normal course of business, the Trust may enter into contracts with service providers that contain a variety of indemnification clauses. The Trust’s maximum exposure under these arrangements is dependent on future claims that may be made against the Fund and, therefore, cannot be estimated.
| | | | |
| 26 | | Wells Fargo Premier Large Company Growth Fund | | Other information (unaudited) |
PROXY VOTING INFORMATION
A description of the policies and procedures that the Fund uses to determine how to vote proxies relating to portfolio securities is available, upon request, by calling 1-800-222-8222, visiting our website at wellsfargofunds.com, or visiting the SEC website at sec.gov. Information regarding how the Fund voted proxies relating to portfolio securities during the most recent 12-month period ended June 30 is available on the Fund’s website at wellsfargofunds.com or by visiting the SEC website at sec.gov.
PORTFOLIO HOLDINGS INFORMATION
The complete portfolio holdings for the Fund are publicly available monthly on the Fund’s website (wellsfargofunds.com), on a one-month delayed basis. In addition, top ten holdings information (excluding derivative positions) for the Fund is publicly available on the Fund’s website on a monthly, seven-day or more delayed basis. The Fund files its complete schedule of portfolio holdings with the SEC for the first and third quarters of each fiscal year on Form N-Q, which is available by visiting the SEC website at sec.gov. In addition, the Fund’s Form N-Q may be reviewed and copied at the SEC’s Public Reference Room in Washington, DC, and at regional offices in New York City, at 233 Broadway, and in Chicago, at 175 West Jackson Boulevard, Suite 900. Information about the Public Reference Room may be obtained by calling 1-800-SEC-0330.
| | | | | | |
| Other information (unaudited) | | Wells Fargo Premier Large Company Growth Fund | | | 27 | |
BOARD OF TRUSTEES AND OFFICERS
Each of the Trustees and Officers1 listed in the table below acts in identical capacities for each fund in the Wells Fargo family of funds, which consists of 153 mutual funds comprising the Wells Fargo Funds Trust, Wells Fargo Variable Trust, Wells Fargo Master Trust and four closed-end funds (collectively the “Fund Complex”). This table should be read in conjunction with the Prospectus and the Statement of Additional Information2. The mailing address of each Trustee and Officer is 525 Market Street, 12th Floor, San Francisco, CA 94105. Each Trustee and Officer serves an indefinite term, however, each Trustee serves such term until reaching the mandatory retirement age established by the Trustees.
Independent Trustees
| | | | | | |
Name and
year of birth | | Position held and
length of service* | | Principal occupations during past five years or longer | | Current other
public company or
investment company
directorships |
William R. Ebsworth (Born 1957) | | Trustee, since 2015 | | Retired. From 1984 to 2013, equities analyst, portfolio manager, research director and chief investment officer at Fidelity Management and Research Company in Boston, Tokyo, and Hong Kong, and retired in 2013 as Chief Investment Officer of Fidelity Strategic Advisers, Inc. where he led a team of investment professionals managing client assets. Prior thereto, Board member of Hong Kong Securities Clearing Co., Hong Kong Options Clearing Corp., the Thailand International Fund, Ltd., Fidelity Investments Life Insurance Company, and Empire Fidelity Investments Life Insurance Company. Board member of the Forté Foundation (non-profit organization) and the Vincent Memorial Hospital Endowment (non-profit organization), where he serves on the Investment Committee and as a Chair of the Audit Committee. Mr. Ebsworth is a CFA® charterholder. | | Asset Allocation Trust |
Jane A. Freeman** (Born 1953) | | Trustee, since 2015; Chair Liaison, since 2018 | | Retired. From 2012 to 2014 and 1999 to 2008, Chief Financial Officer of Scientific Learning Corporation. From 2008 to 2012, Ms. Freeman provided consulting services related to strategic business projects. Prior to 1999, Portfolio Manager at Rockefeller & Co. and Scudder, Stevens & Clark. Board member of the Harding Loevner Funds from 1996 to 2014, serving as both Lead Independent Director and chair of the Audit Committee. Board member of the Russell Exchange Traded Funds Trust from 2011 to 2012 and the chair of the Audit Committee. Ms. Freeman is a Board Member of Ruth Bancroft Garden (non-profit organization) and the Glimmerglass Festival. She is also an inactive Chartered Financial Analyst. | | Asset Allocation Trust |
Isaiah Harris, Jr. (Born 1952) | | Trustee, since 2009 | | Retired. Chairman of the Board of CIGNA Corporation since 2009, and Director since 2005. From 2003 to 2011, Director of Deluxe Corporation. Prior thereto, President and CEO of BellSouth Advertising and Publishing Corp. from 2005 to 2007, President and CEO of BellSouth Enterprises from 2004 to 2005 and President of BellSouth Consumer Services from 2000 to 2003. Emeritus member of the Iowa State University Foundation Board of Governors. Emeritus Member of the Advisory Board of Iowa State University School of Business. Advisory Board Member, Palm Harbor Academy (charter school). Advisory Board Member, Child Evangelism Fellowship (non-profit). Mr. Harris is a certified public accountant (inactive status). | | CIGNA Corporation; Asset Allocation Trust |
Judith M. Johnson (Born 1949) | | Trustee, since 2008; Audit Committee Chairman, since 2008 | | Retired. Prior thereto, Chief Executive Officer and Chief Investment Officer of Minneapolis Employees Retirement Fund from 1996 to 2008. Ms. Johnson is an attorney, certified public accountant and a certified managerial accountant. | | Asset Allocation Trust |
David F. Larcker (Born 1950) | | Trustee, since 2009 | | James Irvin Miller Professor of Accounting at the Graduate School of Business, Stanford University, Director of the Corporate Governance Research Initiative and Senior Faculty of The Rock Center for Corporate Governance since 2006. From 2005 to 2008, Professor of Accounting at the Graduate School of Business, Stanford University. Prior thereto, Ernst & Young Professor of Accounting at The Wharton School, University of Pennsylvania from 1985 to 2005. | | Asset Allocation Trust |
| | | | |
| 28 | | Wells Fargo Premier Large Company Growth Fund | | Other information (unaudited) |
| | | | | | |
Name and
year of birth | | Position held and
length of service* | | Principal occupations during past five years or longer | | Current other
public company or
investment company
directorships |
Olivia S. Mitchell*** (Born 1953) | | Trustee, since 2006; Governance Committee Chairman, since 2018 | | International Foundation of Employee Benefit Plans Professor, Wharton School of the University of Pennsylvania since 1993. Director of Wharton’s Pension Research Council and Boettner Center on Pensions & Retirement Research, and Research Associate at the National Bureau of Economic Research. Previously, Cornell University Professor from 1978 to 1993. | | Asset Allocation Trust |
Timothy J. Penny**** (Born 1951) | | Trustee since 1996; Chairman, since 2018; Vice Chairman, from 2017 to 2018 | | President and Chief Executive Officer of Southern Minnesota Initiative Foundation, a non-profit organization, since 2007. Member of the Board of Trustees of NorthStar Education Finance, Inc., a non-profit organization, since 2007. | | Asset Allocation Trust |
James G. Polisson***** (Born 1959) | | Trustee, since 2018; Advisory Board Member, from 2017 to 2018 | | Retired. Chief Marketing Officer, Source (ETF) UK Services, Ltd, from 2015 to 2017. From 2012 to 2015, Principal of The Polisson Group, LLC, a management consulting, corporate advisory and principal investing company. Chief Executive Officer and Managing Director at Russell Investments, Global Exchange Traded Funds from 2010 to 2012. Managing Director of Barclays Global Investors from 1998 to 2010 and Global Chief Marketing Officer for iShares and Barclays Global Investors from 2000 to 2010. Trustee of the San Francisco Mechanics’ Institute, a non-profit organization, from 2013 to 2015. Board member of the Russell Exchange Traded Fund Trust from 2011 to 2012. Director of Barclays Global Investors Holdings Deutschland GmbH from 2006 to 2009. Mr. Polisson is an attorney and has a retired status with the Massachusetts and District of Columbia Bar Associations. | | Asset Allocation Trust |
Michael S. Scofield (Born 1943) | | Trustee, since 2010 | | Served on the Investment Company Institute’s Board of Governors and Executive Committee from 2008-2011 as well the Governing Council of the Independent Directors Council from 2006-2011 and the Independent Directors Council Executive Committee from 2008-2011. Trustee of the Evergreen Fund complex (and its predecessors) from 1984 to 2010. Chairman of the Evergreen Funds from 2000-2010. Former Trustee of the Mentor Funds. Retired Attorney, Law Offices of Michael S. Scofield. | | Asset Allocation Trust |
Pamela Wheelock***** (Born 1959) | | Trustee, since 2018; Advisory Board Member, from 2017 to 2018 | | Chief Operating Officer, Twin Cities Habitat for Humanity, since January, 2017. Vice President of University Services, University of Minnesota from 2012 to 2017. Prior thereto, Interim President and Chief Executive Officer of Blue Cross Blue Shield of Minnesota from 2010 to 2011, Chairman of the Board from 2009 to 2011 and Board Director from 2003 to 2015. Vice President, Leadership and Community Engagement, Bush Foundation, Saint Paul, Minnesota (a private foundation) from 2009 to 2011. Executive Vice President and Chief Financial Officer, Minnesota Sports and Entertainment from 2004 to 2009 and Senior Vice President from 2002 to 2004. Commissioner of Finance, State of Minnesota, from 1999 to 2002. Currently on the Board of Directors, Governance Committee and Finance Committee, for the Minnesota Philanthropy Partners (Saint Paul Foundation) since 2012 and Board Chair of the Minnesota Wild Foundation since 2010. | | Asset Allocation Trust |
| * | Length of service dates reflect the Trustee’s commencement of service with the Trust’s predecessor entities, where applicable. |
| ** | Jane Freeman became Chair Liaison effective January 1, 2018. |
| *** | Olivia Mitchell became Chairman of the Governance Committee effective January 1, 2018. |
| **** | Timothy Penny became Chairman effective January 1, 2018. |
| ***** | James Polisson and Pamela Wheelock each became a Trustee effective January 1, 2018. |
| | | | | | |
| Other information (unaudited) | | Wells Fargo Premier Large Company Growth Fund | | | 29 | |
Officers
| | | | | | |
Name and
year of birth | | Position held and
length of service | | Principal occupations during past five years or longer | | |
Andrew Owen (Born 1960) | | President, since 2017 | | Executive Vice President of Wells Fargo & Company and Head of Affiliated Managers, Wells Fargo Asset Management, since 2014. In addition, Mr. Owen is currently President, Chief Executive Officer and Director of Wells Fargo Funds Management, LLC since 2017. Prior thereto, Executive Vice President responsible for marketing, investments and product development for Wells Fargo Funds Management, LLC, from 2009 to 2014. | | |
Jeremy DePalma1 (Born 1974) | | Treasurer, since 2012 | | Senior Vice President of Wells Fargo Funds Management, LLC since 2009. Senior Vice President of Evergreen Investment Management Company, LLC from 2008 to 2010 and head of the Fund Reporting and Control Team within Fund Administration from 2005 to 2010. | | |
C. David Messman (Born 1960) | | Secretary, since 2000; Chief Legal Officer, since 2003 | | Senior Vice President and Secretary of Wells Fargo Funds Management, LLC since 2001. Assistant General Counsel of Wells Fargo Bank, N.A. since 2013 and Vice President and Managing Counsel of Wells Fargo Bank, N.A. from 1996 to 2013. | | |
Michael H. Whitaker (Born 1967) | | Chief Compliance Officer, since 2016 | | Senior Vice President and Chief Compliance Officer since 2016. Senior Vice President and Chief Compliance Officer for Fidelity Investments from 2007 to 2016. | | |
David Berardi (Born 1975) | | Assistant Treasurer, since 2009 | | Vice President of Wells Fargo Funds Management, LLC since 2009. Vice President of Evergreen Investment Management Company, LLC from 2008 to 2010. Manager of Fund Reporting and Control for Evergreen Investment Management Company, LLC from 2004 to 2010. | | |
| 1 | Jeremy DePalma acts as Treasurer of 76 funds and Assistant Treasurer of 77 funds in the Fund Complex. |
| 2 | The Statement of Additional Information includes additional information about the Trustees and is available, without charge, upon request, by calling 1-800-222-8222 or by visiting the website at wellsfargofunds.com. |
| | | | |
| 30 | | Wells Fargo Premier Large Company Growth Fund | | List of abbreviations |
The following is a list of common abbreviations for terms and entities that may have appeared in this report.
| ACA | — ACA Financial Guaranty Corporation |
| ADR | — American depositary receipt |
| ADS | — American depositary shares |
| AGC | — Assured Guaranty Corporation |
| AGM | — Assured Guaranty Municipal |
| Ambac | — Ambac Financial Group Incorporated |
| AMT | — Alternative minimum tax |
| BAN | — Bond anticipation notes |
| BHAC | — Berkshire Hathaway Assurance Corporation |
| CAB | — Capital appreciation bond |
| CCAB | — Convertible capital appreciation bond |
| CDA | — Community Development Authority |
| CDO | — Collateralized debt obligation |
| CLO | — Collateralized loan obligation |
| DRIVER | — Derivative inverse tax-exempt receipts |
| DW&P | — Department of Water & Power |
| DWR | — Department of Water Resources |
| ECFA | — Educational & Cultural Facilities Authority |
| EDA | — Economic Development Authority |
| EDFA | — Economic Development Finance Authority |
| ETF | — Exchange-traded fund |
| FDIC | — Federal Deposit Insurance Corporation |
| FFCB | — Federal Farm Credit Banks |
| FGIC | — Financial Guaranty Insurance Corporation |
| FHA | — Federal Housing Administration |
| FHLB | — Federal Home Loan Bank |
| FHLMC | — Federal Home Loan Mortgage Corporation |
| FICO | — The Financing Corporation |
| FNMA | — Federal National Mortgage Association |
| GDR | — Global depositary receipt |
| GNMA | — Government National Mortgage Association |
| HCFR | — Healthcare facilities revenue |
| HEFA | — Health & Educational Facilities Authority |
| HEFAR | — Higher education facilities authority revenue |
| HFA | — Housing Finance Authority |
| HFFA | — Health Facilities Financing Authority |
| HUD | — Department of Housing and Urban Development |
| IDA | — Industrial Development Authority |
| IDAG | — Industrial Development Agency |
| KRW | — Republic of Korea won |
| LIBOR | — London Interbank Offered Rate |
| LIFER | — Long Inverse Floating Exempt Receipts |
| LLC | — Limited liability company |
| LLLP | — Limited liability limited partnership |
| LLP | — Limited liability partnership |
| MBIA | — Municipal Bond Insurance Association |
| MFHR | — Multifamily housing revenue |
| MSTR | — Municipal securities trust receipts |
| MUD | — Municipal Utility District |
| National | — National Public Finance Guarantee Corporation |
| PCFA | — Pollution Control Financing Authority |
| PCL | — Public Company Limited |
| PCR | — Pollution control revenue |
| PFA | — Public Finance Authority |
| PFFA | — Public Facilities Financing Authority |
| PFOTER | — Puttable floating option tax-exempt receipts |
| PJSC | — Public Joint Stock Company |
| plc | — Public limited company |
| PUTTER | — Puttable tax-exempt receipts |
| R&D | — Research & development |
| Radian | — Radian Asset Assurance |
| RAN | — Revenue anticipation notes |
| RDA | — Redevelopment Agency |
| RDFA | — Redevelopment Finance Authority |
| REIT | — Real estate investment trust |
| ROC | — Reset option certificates |
| SAVRS | — Select auction variable rate securities |
| SBA | — Small Business Authority |
| SDR | — Swedish depositary receipt |
| SFHR | — Single-family housing revenue |
| SFMR | — Single-family mortgage revenue |
| SIFMA | — Securities Industry and Financial Markets Association |
| SPA | — Standby purchase agreement |
| SPDR | — Standard & Poor’s Depositary Receipts |
| SPEAR | — Short Puttable Exempt Adjustable Receipts |
| STRIPS | — Separate trading of registered interest and |
| TAN | — Tax anticipation notes |
| TIPS | — Treasury inflation-protected securities |
| TRAN | — Tax revenue anticipation notes |
| TTFA | — Transportation Trust Fund Authority |
| TVA | — Tennessee Valley Authority |
This page is intentionally left blank.
This page is intentionally left blank.

For more information
More information about Wells Fargo Funds is available free upon request. To obtain literature, please write, email, visit the Fund’s website, or call:
Wells Fargo Funds
P.O. Box 8266
Boston, MA 02266-8266
Email: fundservice@wellsfargo.com
Website: wellsfargofunds.com
Individual investors: 1-800-222-8222
Retail investment professionals: 1-888-877-9275
Institutional investment professionals:
1-866-765-0778
This report and the financial statements contained herein are submitted for the general information of the shareholders of the Fund. If this report is used for promotional purposes, distribution of the report must be accompanied or preceded by a current prospectus. Before investing, please consider the investment objectives, risks, charges, and expenses of the investment. For a current prospectus and, if available, a summary prospectus, containing this information, call 1-800-222-8222 or visit the Fund’s website at wellsfargofunds.com. Read the prospectus carefully before you invest or send money.
Wells Fargo Asset Management (WFAM) is a trade name used by the asset management businesses of Wells Fargo & Company. Wells Fargo Funds Management, LLC, a wholly owned subsidiary of Wells Fargo & Company, provides investment advisory and administrative services for Wells Fargo Funds. Other affiliates of Wells Fargo & Company provide subadvisory and other services for the funds. The funds are distributed by Wells Fargo Funds Distributor, LLC, Member FINRA, an affiliate of Wells Fargo & Company. Neither Wells Fargo Funds Distributor nor Wells Fargo Funds Management holds fund shareholder accounts or assets. This material is for general informational and educational purposes only and is NOT intended to provide investment advice or a recommendation of any kind—including a recommendation for any specific investment, strategy, or plan.
NOT FDIC INSURED ◾ NO BANK GUARANTEE ◾ MAY LOSE VALUE
© 2018 Wells Fargo Funds Management, LLC. All rights reserved.
| | |
 | | 309122 03-18 SA212/SAR212 01-18 |
Not applicable.
| ITEM 3. | AUDIT COMMITTEE FINANCIAL EXPERT |
Not applicable.
| ITEM 4. | PRINCIPAL ACCOUNTANT FEES AND SERVICES |
Not applicable.
| ITEM 5. | AUDIT COMMITTEE OF LISTED REGISTRANTS |
Not applicable.
A Portfolio of Investments for each series of Wells Fargo Funds Trust is included as part of the report to shareholders filed under Item 1 of this Form.
| ITEM 7. | DISCLOSURE OF PROXY VOTING POLICIES AND PROCEDURES FOR CLOSED-END MANAGEMENT INVESTMENT COMPANIES |
Not applicable.
| ITEM 8. | PORTFOLIO MANAGERS OF CLOSED-END MANAGEMENT INVESTMENT COMPANIES |
Not applicable.
| ITEM 9. | PURCHASES OF EQUITY SECURITIES BY CLOSED-END MANAGEMEENT INVESTMENT COMPANY AND AFFILIATED PURCHASERS |
Not applicable.
| ITEM 10. | SUBMISSION OF MATTERS TO A VOTE OF SECURITY HOLDERS |
There have been no material changes to the procedures by which shareholders may recommend nominees to the registrant’s Board of Trustees that have been implemented since the registrant’s last provided disclosure in response to the requirements of this Item.
| ITEM 11. | CONTROLS AND PROCEDURES |
(a) The President and Treasurer have concluded that the Wells Fargo Funds Trust (the “Trust”) disclosure controls and procedures (as defined in Rule 30a-3(c) under the Investment Company Act of 1940) provide reasonable assurances that material information relating to the Trust is made known to them by the appropriate persons, based on their evaluation of these controls and procedures as of a date within 90 days of the filing of this report.
(b) There were no significant changes in the Trust’s internal controls over financial reporting (as defined in Rule 30a-3(d) under the Investment Company Act of 1940) that occurred during the second fiscal quarter of the period covered by this report that materially affected, or is reasonably likely to materially affect, the registrant’s internal control over financial reporting.
(a)(1) Not applicable.
(a)(2) Certification pursuant to Rule 30a-2(a) under the Investment Company Act of 1940 (17 CFR 270.30a-2(a)) is filed and attached hereto as Exhibit 99.CERT.
(a)(3) Not applicable.
(b) Certification pursuant to Rule 30a-2(b) under the Investment Company Act of 1940 (17 CFR 270.30a-2(b)) is filed and attached hereto as Exhibit 99.906CERT.
SIGNATURES
Pursuant to the requirements of the Securities Exchange Act of 1934 and the Investment Company Act of 1940, the registrant has duly caused this report to be signed on its behalf by the undersigned, thereunto duly authorized.
| | |
| Wells Fargo Funds Trust |
| |
By: | | /s/ Andrew Owen |
| |
| | Andrew Owen |
| | President |
Pursuant to the requirements of the Securities Exchange Act of 1934 and the Investment Company Act of 1940, this report has been signed below by the following persons on behalf of the registrant and in the capacities and on the date indicated.
| | |
| Wells Fargo Funds Trust |
| |
By: | | /s/ Andrew Owen |
| |
| | Andrew Owen |
| | President |
| | |
By: | | /s/ Jeremy DePalma |
| |
| | Jeremy DePalma |
| | Treasurer |