
UNITED STATES
SECURITIES AND EXCHANGE COMMISSION
Washington, D.C. 20549
FORMN-CSR
CERTIFIED SHAREHOLDER REPORT OF REGISTERED
MANAGEMENT INVESTMENT COMPANIES
Investment Company Act file number:811-09253
Wells Fargo Funds Trust
(Exact name of registrant as specified in charter)
525 Market St., San Francisco, CA 94105
(Address of principal executive offices) (Zip code)
Alexander Kymn
Wells Fargo Funds Management, LLC
525 Market St., San Francisco, CA 94105
(Name and address of agent for service)
Registrant’s telephone number, including area code:800-222-8222
Date of fiscal year end: March 31
Registrant is making a filing for 8 of its series:
Wells Fargo Intrinsic Small Cap Value Fund, Wells Fargo Disciplined Small Cap Fund, Wells Fargo Small Cap Value Fund, Wells Fargo Special Small Cap Value Fund, Wells Fargo Traditional Small Cap Growth Fund, Wells Fargo Precious Metals Fund, Wells Fargo Specialized Technology Fund, and Wells Fargo Utility and Telecommunications Fund.
Date of reporting period: March 31, 2019
ITEM 1. REPORT TO STOCKHOLDERS
Annual Report
March 31, 2019

Wells Fargo Intrinsic Small Cap Value Fund

Beginning on January 1, 2021, as permitted by new regulations adopted by the Securities and Exchange Commission, paper copies of the Wells Fargo Funds’ annual and semi-annual shareholder reports issued after this date will no longer be sent by mail, unless you specifically request paper copies of the reports. Instead, the reports will be made available on the Funds’ website, and you will be notified by mail each time a report is posted and provided with a website address to access the report.
If you already elected to receive shareholder reports electronically, you will not be affected by this change and you need not take any action. You may elect to receive shareholder reports and other communications from the Fund electronically at any time by contacting your financial intermediary (such as a broker-dealer or bank) or, if you are a direct investor, by calling 1-800-222-8222 or by enrolling at wellsfargo.com/advantagedelivery.
You may elect to receive all future reports in paper free of charge. If you invest through a financial intermediary, you can contact your financial intermediary to request that you continue to receive paper copies of your shareholder reports; if you invest directly with the Fund, you can call 1-800-222-8222. Your election to receive reports in paper will apply to all Wells Fargo Funds held in your account with your financial intermediary or, if you are a direct investor, to all Wells Fargo Funds that you hold.

Reduce clutter. Save trees.
Sign up for electronic delivery of prospectuses and shareholder reports atwellsfargo.com/advantagedelivery
Contents
The views expressed and any forward-looking statements are as of March 31, 2019, unless otherwise noted, and are those of the Fund managers and/or Wells Fargo Asset Management. Discussions of individual securities, or the markets generally, or any Wells Fargo Fund are not intended as individual recommendations. Future events or results may vary significantly from those expressed in any forward-looking statements. The views expressed are subject to change at any time in response to changing circumstances in the market. Wells Fargo and the Fund disclaim any obligation to publicly update or revise any views expressed or forward-looking statements.
INVESTMENT PRODUCTS: NOT FDIC INSURED ◾ NO BANK GUARANTEE ◾ MAY LOSE VALUE
| | | | |
| 2 | | Wells Fargo Intrinsic Small Cap Value Fund | | Letter to shareholders (unaudited) |

Andrew Owen
President
Wells Fargo Funds
Global trade tensions escalated during the second quarter of 2018.
Dear Shareholder:
We are pleased to offer you this annual report for the Wells Fargo Intrinsic Small Cap Value Fund for the 12-month period that ended March 31, 2019. An upward trend for short-term interest rates, inflation concerns, trade tensions, and geopolitical events contributed to investment market volatility for much of 2018. Equity investor sentiment improved during the first quarter of 2019 thanks to a shift in U.S. Federal Reserve (Fed) policy and consistent if not spectacular economic and business growth metrics.
For the period, U.S. stocks, as measured by the S&P 500 Index,1 gained 9.50% and international stocks, as measured by the MSCI ACWI ex USA Index (Net),2 declined 4.22%. Based on the MSCI EM Index (Net),3 emerging market stocks fell 7.41%. For bond investors, the Bloomberg Barclays U.S. Aggregate Bond Index4 added 4.48% while the Bloomberg Barclays Global Aggregate ex-USD Index5 lost 4.13%. The Bloomberg Barclays Municipal Bond Index6 added 5.38%, and the ICE BofAML U.S. High Yield Index7 gained 5.94%.
Trade tensions and U.S. interest rates influenced markets.
Global trade tensions escalated during the second quarter of 2018. A tit-for-tat tariff spat intensified between the U.S. and other governments. The Fed raised the federal funds rate by 25 basis points (bps; 100 bps equal 1.00%) to a target range of between 1.75% and 2.00% in June 2018. Market index results reflected the global concerns. The MSCI ACWI ex USA Index (Net) lost 2.61%, while the Bloomberg Barclays Global Aggregate ex-USD Index dropped 4.76%.
Not all news was bad. The U.S. Bureau of Economic Analysis reported second-quarter annualized gross domestic product (GDP) growth of 4.2%. Hiring improved. Unemployment declined. Consumer confidence and spending increased. The S&P 500 Index recorded a 3.43% second-quarter gain. Stocks of companies with smaller capitalizations did even better, as measured by the Russell 2000® Index,8 adding 7.75%.
| 1 | The S&P 500 Index consists of 500 stocks chosen for market size, liquidity, and industry group representation. It is a market-value-weighted index with each stock’s weight in the index proportionate to its market value. You cannot invest directly in an index. |
| 2 | The Morgan Stanley Capital International (MSCI) All Country World Index (ACWI) ex USA Index (Net) is a free-float-adjusted market-capitalization-weighted index that is designed to measure the equity market performance of developed markets, excluding the United States and Canada. Source: MSCI. MSCI makes no express or implied warranties or representations and shall have no liability whatsoever with respect to any MSCI data contained herein. The MSCI data may not be further redistributed or used as a basis for other indices or any securities or financial products. This report is not approved, reviewed, or produced by MSCI. You cannot invest directly in an index. |
| 3 | The MSCI Emerging Markets (EM) Index (Net) is a free-float-adjusted market-capitalization-weighted index that is designed to measure large- and mid-cap equity market performance of emerging markets. The MSCI EM Index (Net) consists of the following 24 emerging market country indices: Brazil, Chile, China, Colombia, Czech Republic, Egypt, Greece, Hungary, India, Indonesia, Korea, Malaysia, Mexico, Pakistan, Peru, the Philippines, Poland, Qatar, Russia, South Africa, Taiwan, Thailand, Turkey, and the United Arab Emirates. You cannot invest directly in an index. |
| 4 | The Bloomberg Barclays U.S. Aggregate Bond Index is a broad-based benchmark that measures the investment-grade, U.S. dollar-denominated, fixed-rate taxable bond market, including Treasuries, government-related and corporate securities, mortgage-backed securities (agency fixed-rate and hybrid adjustable-rate mortgage pass-throughs), asset-backed securities, and commercial mortgage-backed securities. You cannot invest directly in an index. |
| 5 | The Bloomberg Barclays Global Aggregate ex-USD Index is an unmanaged index that provides a broad-based measure of the global investment-grade fixed-income markets excluding the U.S. dollar-denominated debt market. You cannot invest directly in an index. |
| 6 | The Bloomberg Barclays Municipal Bond Index is an unmanaged index composed of long-term tax-exempt bonds with a minimum credit rating of Baa. You cannot invest directly in an index. |
| 7 | The ICE BofAML U.S. High Yield Index is a market-capitalization-weighted index of domestic and Yankee high-yield bonds. The index tracks the performance of high-yield securities traded in the U.S. bond market. You cannot invest directly in an index. Copyright 2019. ICE Data Indices, LLC. All rights reserved. |
| 8 | The Russell 2000® Index measures the performance of the 2,000 smallest companies in the Russell 3000® Index, which represents approximately 8% of the total market capitalization of the Russell 3000® Index. You cannot invest directly in an index. |
| | | | | | |
| Letter to shareholders (unaudited) | | Wells Fargo Intrinsic Small Cap Value Fund | | | 3 | |
Investors appeared to shake off lingering concerns during the third quarter.
Favorable third-quarter economic indicators and corporate earnings reports encouraged domestic stock investors. U.S. trade negotiations with Mexico and Canada progressed. The Conference Board Consumer Confidence Index®9 reached its highest level in 18 years during September 2018. The Fed raised the federal funds rate by 25 bps to a target range of between 2.00% and 2.25% in September 2018. For the quarter that ended September 30, 2018, the S&P 500 Index added 7.71%.
Investors in international markets were not as confident. Tensions between the U.S. and China increased. The U.S. imposed $200 billion in tariffs on Chinese goods. China reacted with $60 billion in tariffs on U.S. goods. Economic growth in China caused concern. The Bank of England raised its monetary policy rate to 0.75% in August 2018. During the quarter, the MSCI ACWI ex USA Index (Net) gained 0.71%. The MSCI EM Index (Net) declined 1.09%. In fixed-income markets, U.S. bonds were flat, as measured by the Bloomberg Barclays U.S. Aggregate Bond Index. The Bloomberg Barclays Global Aggregate ex-USD Index fell 1.74%.
Conflicting data unsettled markets during the fourth quarter.
November’s U.S. midterm elections shifted control of the House of Representatives from Republicans to Democrats, presaging potential partisan clashes. Third-quarter U.S. GDP was announced at an annualized 3.4% rate, lower than the second-quarter rate. Brexit efforts stalled ahead of the March 2019 deadline. The People’s Bank of China cut reserve requirement ratios, accelerated infrastructure spending, and cut taxes even as the value of the yuan declined to low levels last seen in 2008.
December’s S&P 500 Index performance was the worst since 1931. Globally,fixed-income investments fared better than stocks during the last two months of the year. The Fed increased the federal funds rate by 25 bps in December 2018 to a target range of between 2.25% and 2.50% and softened its outlook for 2019 rate increases.
The market climbs a wall of worry.
Investors entered 2019 with reasons to be concerned. A partial U.S. government shutdown driven by partisan spending and immigration policy disputes extended into January. Investors expected high levels of stock market volatility to continue based on the VIX10.
January’s returns tended to support the investing adage that markets climb a wall of worry. The S&P 500 Index gained 8.01% for the month that ended January 31, 2019, its best monthly performance in 30 years. Returns for the MSCI ACWI ex USA Index (Net), the Bloomberg Barclays U.S. Aggregate Bond Index, and the Bloomberg Barclays Global Aggregate ex-USD Index also were positive. The Fed indicated that it would pause its program of regular rate increases during 2019 as inflation remained low. Businesses and investors responded positively to the shift in policy.
In February, concerns over slowing global growth reemerged. The Bureau of Economic Analysis announced fourth-quarter 2018 GDP grew at an annualized 2.2% rate, down from the 4.2% annualized rate for the second quarter and the 3.4% annualized rate for the third quarter. Analysts attributed the lower growth rate to a slowing housing market and larger trade deficit. The U.S. Department of
Favorable third-quarter economic indicators and corporate earnings reports encouraged domestic stock investors.
| 9 | The Conference Board Consumer Confidence Index® measures the degree of optimism on the state of the U.S. economy that consumers are expressing through their activities of savings and spending. You cannot invest directly in an index. |
| 10 | The Chicago Board Options Exchange Market Volatility Index (VIX) is a popular measure of the implied volatility of S&P 500 Index options. It represents one measure of the market’s expectation of stock market volatility over the next 30-day period. You cannot invest directly in an index. |
| | | | |
| 4 | | Wells Fargo Intrinsic Small Cap Value Fund | | Letter to shareholders (unaudited) |
Labor said that the economy created just 20,000 jobs in February 2019. In a February report, the Bank of England forecast the slowest growth since the financial crisis for 2019. China and the U.S., while putting future tariffs on hold for the time being, continued to wrangle over trade issues.
By the end of March 2019, the combination of dovish Fed sentiment and consistent, if not spectacular, economic and business metrics reinforced investors’ enthusiasm for equity investing. Monthly job creation data regained its momentum. Corporate profits, while lower than 2018’s lofty levels, remained consistent. Inflation rates were relatively low in the U.S., Europe, and Japan. China announced a roughly $300 billion stimulus package through tax and fee cuts intended to reinvigorate economic growth.
Don’t let short-term uncertainty derail long-term investment goals.
Periods of investment uncertainty can present challenges, but experience has taught us that maintaining long-term investment goals can be an effective way to plan for the future. To help you create a sound strategy based on your personal goals and risk tolerance, Wells Fargo Funds offers more than 100 mutual funds spanning a wide range of asset classes and investment styles. Although diversification cannot guarantee an investment profit or prevent losses, we believe it can be an effective way to manage investment risk and potentially smooth out overall portfolio performance. We encourage investors to know their investments and to understand that appropriate levels of risk-taking may unlock opportunities.
Thank you for choosing to invest with Wells Fargo Funds. We appreciate your confidence in us and remain committed to helping you meet your financial needs.
Sincerely,

Andrew Owen
President
Wells Fargo Funds
For further information about your Fund, contact your investment professional, visit our website atwfam.com, or call us directly at1-800-222-8222.
This page is intentionally left blank.
| | | | |
| 6 | | Wells Fargo Intrinsic Small Cap Value Fund | | Performance highlights (unaudited) |
Investment objective
The Fund seeks long-term capital appreciation.
Manager
Wells Fargo Funds Management, LLC
Subadviser
Wells Capital Management Incorporated
Portfolio managers
Ann Miletti
Christopher G. Miller, CFA®‡
Average annual total returns (%) as of March 31, 2019
| | | | | | | | | | | | | | | | | | | | | | | | | | | | | | | | | | |
| | | | | Including sales charge | | | Excluding sales charge | | | Expense ratios1 (%) | |
| | | Inception date | | 1 year | | | 5 year | | | 10 year | | | 1 year | | | 5 year | | | 10 year | | | Gross | | | Net2 | |
| | | | | | | | | |
| Class A (WFSMX) | | 3-31-2008 | | | -9.32 | | | | 4.14 | | | | 12.28 | | | | -3.78 | | | | 5.38 | | | | 12.95 | | | | 1.55 | | | | 1.36 | |
| | | | | | | | | |
| Class C (WSCDX) | | 3-31-2008 | | | -5.51 | | | | 4.60 | | | | 12.11 | | | | -4.51 | | | | 4.60 | | | | 12.11 | | | | 2.30 | | | | 2.11 | |
| | | | | | | | | |
| Administrator Class (WFSDX) | | 4-8-2005 | | | – | | | | – | | | | – | | | | -3.65 | | | | 5.55 | | | | 13.18 | | | | 1.47 | | | | 1.21 | |
| | | | | | | | | |
| Institutional Class (WFSSX) | | 4-8-2005 | | | – | | | | – | | | | – | | | | -3.45 | | | | 5.77 | | | | 13.41 | | | | 1.22 | | | | 1.01 | |
| | | | | | | | | |
| Russell 2000® Value Index3 | | – | | | – | | | | – | | | | – | | | | 0.17 | | | | 5.59 | | | | 14.12 | | | | – | | | | – | |
Figures quoted represent past performance, which is no guarantee of future results, and do not reflect taxes that a shareholder may pay on fund distributions or the redemption of fund shares. Investment return and principal value of an investment will fluctuate so that an investor’s shares, when redeemed, may be worth more or less than their original cost. Performance shown without sales charges would be lower if sales charges were reflected. Current performance may be lower or higher than the performance data quoted, which assumes the reinvestment of dividends and capital gains. Current month-end performance is available on the Fund’s website, wfam.com
Index returns do not include transaction costs associated with buying and selling securities, any mutual fund fees or expenses, or any taxes. It is not possible to invest directly in an index.
For Class A shares, the maximum front-end sales charge is 5.75%. For Class C shares, the maximum contingent deferred sales charge is 1.00%. Performance including a contingent deferred sales charge assumes the sales charge for the corresponding time period. Administrator Class and Institutional Class shares are sold without a front-end sales charge or contingent deferred sales charge.
Stock values fluctuate in response to the activities of individual companies and general market and economic conditions. Smaller-company stocks tend to be more volatile and less liquid than those of larger companies. Certain investment strategies tend to increase the total risk of an investment (relative to the broader market). Consult the Fund’s prospectus for additional information on these and other risks.
Please see footnotes on page 7.
| | | | | | |
| Performance highlights (unaudited) | | Wells Fargo Intrinsic Small Cap Value Fund | | | 7 | |
|
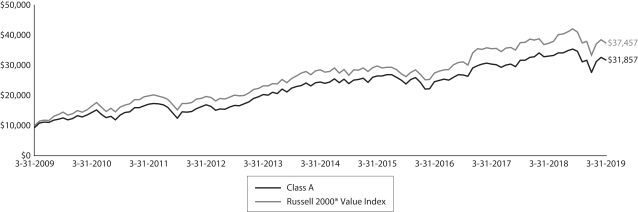
| Growth of $10,000 investment as of March 31, 20194 |
|
 |
| ‡ | CFA® and Chartered Financial Analyst® are trademarks owned by CFA Institute. |
| 1 | Reflects the expense ratios as stated in the most recent prospectuses, which include the impact of 0.01% in acquired fund fees and expenses. The expense ratios shown are subject to change and may differ from the annualized expense ratios shown in the financial highlights of this report, which do not include acquired fund fees and expenses. |
| 2 | The manager has contractually committed through July 31, 2019, to waive fees and/or reimburse expenses to the extent necessary to cap the expenses of each class after fee waivers at 1.35% for Class A, 2.10% for Class C, 1.20% for Administrator Class, and 1.00% for Institutional Class. Brokerage commissions, stamp duty fees, interest, taxes, acquired fund fees and expenses (if any), and extraordinary expenses are excluded from the expense cap. Prior to or after the commitment expiration date, the cap may be increased or the commitment to maintain the cap may be terminated only with the approval of the Board of Trustees. Without this cap, the Fund’s returns would have been lower. The expense ratio paid by an investor is the net expense ratio (the total annual fund operating expenses after fee waivers) as stated in the prospectuses. |
| 3 | The Russell 2000® Value Index measures the performance of those Russell 2000 companies with lower price/book ratios and lower forecasted growth values. You cannot invest directly in an index. |
| 4 | The chart compares the performance of Class A shares for the most recent ten years with the Russell 2000® Value Index. The chart assumes a hypothetical investment of $10,000 in Class A shares and reflects all operating expenses and assumes the maximum initial sales charge of 5.75%. |
| 5 | The ten largest holdings, excluding cash, cash equivalents and any money market funds, are calculated based on the value of the investments divided by total net assets of the Fund. Holdings are subject to change and may have changed since the date specified. |
| 6 | Amounts are calculated based on the total long-term investments of the Fund. These amounts are subject to change and may have changed since the date specified. |
| * | This security was no longer held at the end of the reporting period. |
| | | | |
| 8 | | Wells Fargo Intrinsic Small Cap Value Fund | | Performance highlights (unaudited) |
MANAGER’S DISCUSSION
Fund highlights
| ∎ | | The Fund underperformed its benchmark, the Russell 2000® Value Index, for the 12-month period that ended March 31, 2019. |
| ∎ | | Stock selection in the financials and information technology (IT) sectors were the largest detractors from performance relative to the benchmark. |
| ∎ | | Stock selection in the health care and consumer staples sectors contributed the most to performance relative to the benchmark. |
Volatility was notable at times in the small-cap market during the period.
The small-cap value segment of the U.S. stock market, represented by the benchmark Russell 2000® Value Index, moved sharply in both directions during the reporting period. The benchmark rose 10% during the second and third quarters of 2018, declined 19% during the fourth quarter of 2018, and then rebounded 12% in the first quarter of 2019 to end the reporting period just 0.17% above where it began. The utilities, communication services, and real estate sectors rose the most while the energy, materials, and consumer staples sectors declined the most during the reporting period. Volatility spiked when the markets declined but remained relatively low for the rest of the period. Across the broader market spectrum, larger-cap and growth stocks generally outperformed smaller-cap and value stocks.
The lowering of corporate taxes, reduction in burdensome regulations, and other progrowth government policies fueled optimism among U.S. businesses and bolstered overall economic activity to continue the nearly 10-year-old economic expansion. U.S. equity markets also benefited from the repatriation of cash held overseas, a significant ramp-up in share buybacks, increased capital spending, initial public offerings, and high-profile merger and acquisition activity. The U.S. economy remained resilient, with the gross domestic product having increased for 19 quarters in a row, unemployment reaching recovery lows, and job openings at recovery highs. Lower personal income taxes and household debt ratios, combined with higher household net worth and new housing starts, contributed to consumer confidence and optimism. However, investor sentiment turned negative during the fourth quarter of 2018 over concerns about inflation, interest rates, trade disputes, and the slowing of global economic growth. While the U.S. government has negotiated agreements with its North American neighbors and Europe, trade discussions with China are still ongoing and creating uncertainty in the market. The U.S. Federal Reserve (Fed) raised its benchmark interest rate three times during the reporting period, most recently to a range of 2.25% to 2.50% at its December 2018 meeting. However, the Fed has pivoted its posture since then and has not raised rates any further. It also has indicated a slowdown in reducing balance sheet assets. The yield curve continued to flatten for most of the reporting period, with the spread between the 3-month and 10-year U.S. Treasury yields briefly inverting in March 2019.
| | | | |
| Ten largest holdings (%) as of March 31, 20195 | |
| |
AngioDynamics Incorporated | | | 2.43 | |
| |
Steris plc | | | 2.33 | |
| |
Bio-Rad Laboratories Incorporated Class A | | | 2.30 | |
| |
Webster Financial Corporation | | | 2.22 | |
| |
Sterling Bancorp | | | 2.04 | |
| |
WPX Energy Incorporated | | | 2.02 | |
| |
National General Holdings Corporation | | | 2.01 | |
| |
Cimarex Energy Company | | | 1.98 | |
| |
Four Corners Property Trust Incorporated | | | 1.97 | |
| |
Essent Group Limited | | | 1.94 | |
Throughout all of the market and economic events that occurred during the reporting period, we continued to seek well-positioned companies—those with good business models, strong management teams, and healthy cash flows—trading at attractive discounts to their private market valuations (PMVs). The PMV represents the expected price an investor would pay for the entire company as a stand-alone private entity.
Portfolio holdings in the financials and IT sectors were the largest detractors from relative performance.
Within the financials sector, banks and insurance company holdings underperformed their peers. Banks suffered from the flattening and brief inversion of the
yield curve, declining valuation multiples, and generally less lending from late-cycle fears. Regional banks including Ameris Bancorp, Sterling Bancorp, and PacWest Bancorp were the largest detractors. Maiden Holdings, Limited*, a reinsurance company, had ongoing issues with its commercial automobile insurance reserves. When the chief executive officer and chief financial officer were replaced, we lost confidence in the company’s ability to fix these issues and exited our position. Within
Please see footnotes on page 7.
| | | | | | |
| Performance highlights (unaudited) | | Wells Fargo Intrinsic Small Cap Value Fund | | | 9 | |
the IT sector, holdings in equipment and peripherals underperformed their peers. Infinera Corporation, a provider of optical networking equipment, was affected by negative investor sentiment related to integration risk and indebtedness from a large acquisition. We exited our position in Diebold Nixdorf, Incorporated, best known for its ATM machines, as it continued to report weak financial results and disappointing forecasts. Utilities were the best-performing sector in the benchmark, rising over 21% during the period, and a lack of exposure to this sector in the portfolio hurt relative performance.
|
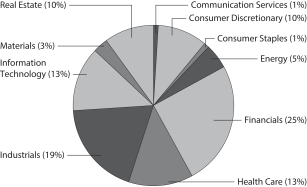
| Sector distribution as of March 31, 20196 |
|
 |
Stock selection in the health care and consumer staples sectors contributed the most to relative performance.
Holdings in the health care equipment and life sciences industries benefited from the market recognizing their ability to grow profits while keeping up with product innovation. STERIS plc, a medical/surgical equipment company; AngioDynamics, Incorporated, and Integer Holdings Corporation, both medical device providers; and Bio-Rad Laboratories, Incorporated, a life sciences research company, were a few of our holdings that outperformed their peers. In the consumer staples sector, TreeHouse Foods, Incorporated, is a food and beverage manufacturing company that specializes in the
production of private-label products. The company had been dealing with competitive pressures that caused the stock to decline in the prior year. However, we retained conviction in the company as a new management team was able to turn around operations and profitability, and we benefited from a 69% gain in the stock for the reporting period.
Our methodology includes buying stocks at a discount to their estimated PMV and selling stocks as they approach or exceed the upper end of their PMV range.
Our disciplined, bottom-up investment process leads us to be overweight or underweight certain sectors. This positioning changes over time based on macroeconomic and industry-specific factors. During the reporting period, our process led us to be overweight the industrials and health care sectors while being underweight the utilities and financials sectors. Through our investment process, we remain keenly aware of both price and enterprise values on a company-by-company basis. Our proprietary database of company acquisitions across industries, sectors, and time frames enables us to maintain a steady foundation for assessing the PMVs of companies compared with their public stock prices. We strive to take advantage of those price discrepancies for the benefit of Fund shareholders by purchasing stocks when we believe they are selling at a discount to their PMV.
Some of these themes may prevail into 2019.
Looking ahead into 2019, interest rates, the policies of the U.S. government, energy prices, and global trade agreements may likely be themes that influence the overall market and the relative performance of the Fund. Lower taxes and reduced regulations already have had an effect on the overall U.S. economy, but a divided U.S. Congress after the 2018 midterm elections may slow down the pace and direction of reform. The U.S. and China are in the middle of intense trade negotiations that could affect bilateral as well as global trade. The U.S. economy is on its way to the longest expansion in history and the aging economic cycle is a constant factor in investor sentiment, but there are still indicators that do not foreshadow a recession in the near future. Most major global economies are expected to slow down, in contrast to the synchronized growth of previous years. The Fed has signaled no further interest rate hikes in the near future as well as a slowdown in the reduction to its balance sheet, which could have a positive effect on the markets.
Please see footnotes on page 7.
| | | | |
| 10 | | Wells Fargo Intrinsic Small Cap Value Fund | | Fund expenses (unaudited) |
As a shareholder of the Fund, you incur two types of costs: (1) transaction costs, including sales charges (loads) on purchase payments and contingent deferred sales charges (if any) on redemptions and (2) ongoing costs, including management fees, distribution (12b-1) and/or shareholder servicing fees, and other Fund expenses. This example is intended to help you understand your ongoing costs (in dollars) of investing in the Fund and to compare these costs with the ongoing costs of investing in other mutual funds.
The example is based on an investment of $1,000 invested at the beginning of the six-month period and held for the entire period from October 1, 2018 to March 31, 2019.
Actual expenses
The “Actual” line of the table below provides information about actual account values and actual expenses. You may use the information in this line, together with the amount you invested, to estimate the expenses that you paid over the period. Simply divide your account value by $1,000 (for example, an $8,600 account value divided by $1,000 = 8.6), then multiply the result by the number in the “Actual” line under the heading entitled “Expenses paid during period” for your applicable class of shares to estimate the expenses you paid on your account during this period.
Hypothetical example for comparison purposes
The “Hypothetical” line of the table below provides information about hypothetical account values and hypothetical expenses based on the Fund’s actual expense ratio and an assumed rate of return of 5% per year before expenses, which is not the Fund’s actual return. The hypothetical account values and expenses may not be used to estimate the actual ending account balance or expenses you paid for the period. You may use this information to compare the ongoing costs of investing in the Fund and other funds. To do so, compare this 5% hypothetical example with the 5% hypothetical examples that appear in the shareholder reports of the other funds.
Please note that the expenses shown in the table are meant to highlight your ongoing costs only and do not reflect any transactional costs, such as sales charges (loads) and contingent deferred sales charges. Therefore, the “Hypothetical” line of the table is useful in comparing ongoing costs only and will not help you determine the relative total costs of owning different funds. In addition, if these transactional costs were included, your costs would have been higher.
| | | | | | | | | | | | | | | | |
| | | Beginning
account value
10-1-2018 | | | Ending
account value
3-31-2019 | | | Expenses
paid during
the period¹ | | | Annualized net
expense ratio | |
Class A | | | | | | | | | | | | | | | | |
| | | | |
Actual | | $ | 1,000.00 | | | $ | 917.83 | | | $ | 6.45 | | | | 1.35 | % |
| | | | |
Hypothetical (5% return before expenses) | | $ | 1,000.00 | | | $ | 1,018.20 | | | $ | 6.79 | | | | 1.35 | % |
Class C | | | | | | | | | | | | | | | | |
| | | | |
Actual | | $ | 1,000.00 | | | $ | 914.38 | | | $ | 10.02 | | | | 2.10 | % |
| | | | |
Hypothetical (5% return before expenses) | | $ | 1,000.00 | | | $ | 1,014.46 | | | $ | 10.55 | | | | 2.10 | % |
Administrator Class | | | | | | | | | | | | | | | | |
| | | | |
Actual | | $ | 1,000.00 | | | $ | 918.25 | | | $ | 5.74 | | | | 1.20 | % |
| | | | |
Hypothetical (5% return before expenses) | | $ | 1,000.00 | | | $ | 1,018.95 | | | $ | 6.04 | | | | 1.20 | % |
Institutional Class | | | | | | | | | | | | | | | | |
| | | | |
Actual | | $ | 1,000.00 | | | $ | 919.31 | | | $ | 4.79 | | | | 1.00 | % |
| | | | |
Hypothetical (5% return before expenses) | | $ | 1,000.00 | | | $ | 1,019.95 | | | $ | 5.04 | | | | 1.00 | % |
| 1 | Expenses paid is equal to the annualized net expense ratio of each class multiplied by the average account value over the period, multiplied by the number of days in the most recent fiscal half-year divided by the number of days in the fiscal year (to reflect the one-half-year period). |
| | | | | | |
| Portfolio of investments—March 31, 2019 | | Wells Fargo Intrinsic Small Cap Value Fund | | | 11 | |
| | | | | | | | | | | | | | | | |
| Security name | | | | | | | | Shares | | | Value | |
| | | | |
Common Stocks: 96.13% | | | | | | | | | | | | | | | | |
| | | | |
Communication Services: 0.93% | | | | | | | | | | | | | | | | |
| | | | |
| Entertainment: 0.93% | | | | | | | | | | | | | | | | |
| | | | |
Lions Gate Entertainment Class B | | | | | | | | | | | 41,451 | | | $ | 625,914 | |
| | | | | | | | | | | | | | | | |
| | | | |
Consumer Discretionary: 9.75% | | | | | | | | | | | | | | | | |
| | | | |
| Auto Components: 3.58% | | | | | | | | | | | | | | | | |
| | | | |
American Axle & Manufacturing Holdings Incorporated † | | | | | | | | | | | 60,228 | | | | 861,863 | |
| | | | |
Dana Incorporated | | | | | | | | | | | 52,301 | | | | 927,820 | |
| | | | |
Gentherm Incorporated † | | | | | | | | | | | 16,641 | | | | 613,387 | |
| | | | |
| | | | | | | | | | | | | | | 2,403,070 | |
| | | | | | | | | | | | | | | | |
| | | | |
| Diversified Consumer Services: 0.81% | | | | | | | | | | | | | | | | |
| | | | |
Houghton Mifflin Harcourt Company † | | | | | | | | | | | 74,219 | | | | 539,572 | |
| | | | | | | | | | | | | | | | |
| | | | |
| Hotels, Restaurants & Leisure: 1.78% | | | | | | | | | | | | | | | | |
| | | | |
Jack in the Box Incorporated | | | | | | | | | | | 10,524 | | | | 853,075 | |
| | | | |
Playa Hotels & Resorts NV † | | | | | | | | | | | 44,283 | | | | 337,879 | |
| | | | |
| | | | | | | | | | | | | | | 1,190,954 | |
| | | | | | | | | | | | | | | | |
| | | | |
| Internet & Direct Marketing Retail: 1.05% | | | | | | | | | | | | | | | | |
| | | | |
Groupon Incorporated † | | | | | | | | | | | 198,630 | | | | 705,137 | |
| | | | | | | | | | | | | | | | |
| | | | |
| Specialty Retail: 1.30% | | | | | | | | | | | | | | | | |
| | | | |
National Vision Holdings Incorporated † | | | | | | | | | | | 27,834 | | | | 874,823 | |
| | | | | | | | | | | | | | | | |
| | | | |
| Textiles, Apparel & Luxury Goods: 1.23% | | | | | | | | | | | | | | | | |
| | | | |
Carter’s Incorporated | | | | | | | | | | | 8,205 | | | | 826,982 | |
| | | | | | | | | | | | | | | | |
| | | | |
Consumer Staples: 1.24% | | | | | | | | | | | | | | | | |
| | | | |
| Food Products: 1.24% | | | | | | | | | | | | | | | | |
| | | | |
TreeHouse Foods Incorporated † | | | | | | | | | | | 12,929 | | | | 834,567 | |
| | | | | | | | | | | | | | | | |
| | | | |
Energy: 4.89% | | | | | | | | | | | | | | | | |
| | | | |
| Oil, Gas & Consumable Fuels: 4.89% | | | | | | | | | | | | | | | | |
| | | | |
Cimarex Energy Company | | | | | | | | | | | 18,987 | | | | 1,327,191 | |
| | | | |
Concho Resources Incorporated | | | | | | | | | | | 3,594 | | | | 398,790 | |
| | | | |
Matador Resources Company † | | | | | | | | | | | 10,431 | | | | 201,631 | |
| | | | |
WPX Energy Incorporated † | | | | | | | | | | | 103,168 | | | | 1,352,532 | |
| | | | |
| | | | | | | | | | | | | | | 3,280,144 | |
| | | | | | | | | | | | | | | | |
| | | | |
Financials: 24.20% | | | | | | | | | | | | | | | | |
| | | | |
| Banks: 15.99% | | | | | | | | | | | | | | | | |
| | | | |
Ameris Bancorp | | | | | | | | | | | 28,641 | | | | 983,818 | |
| | | | |
LegacyTexas Financial Group | | | | | | | | | | | 26,264 | | | | 982,011 | |
| | | | |
PacWest Bancorp | | | | | | | | | | | 26,358 | | | | 991,324 | |
| | | | |
Pinnacle Financial Partners Incorporated | | | | | | | | | | | 18,969 | | | | 1,037,604 | |
| | | | |
Renasant Corporation | | | | | | | | | | | 27,650 | | | | 935,953 | |
The accompanying notes are an integral part of these financial statements.
| | | | |
| 12 | | Wells Fargo Intrinsic Small Cap Value Fund | | Portfolio of investments—March 31, 2019 |
| | | | | | | | | | | | | | | | |
| Security name | | | | | | | | Shares | | | Value | |
| | | | |
| Banks(continued) | | | | | | | | | | | | | | | | |
| | | | |
Sterling Bancorp | | | | | | | | | | | 73,407 | | | $ | 1,367,572 | |
| | | | |
United Community Bank | | | | | | | | | | | 33,897 | | | | 845,052 | |
| | | | |
Webster Financial Corporation | | | | | | | | | | | 29,399 | | | | 1,489,647 | |
| | | | |
Wintrust Financial Corporation | | | | | | | | | | | 13,637 | | | | 918,179 | |
| | | | |
Zions Bancorporation | | | | | | | | | | | 26,016 | | | | 1,181,387 | |
| | | | |
| | | | | | | | | | | | | | | 10,732,547 | |
| | | | | | | | | | | | | | | | |
| | | | |
| Capital Markets: 1.07% | | | | | | | | | | | | | | | | |
| | | | |
Stifel Financial Corporation | | | | | | | | | | | 13,648 | | | | 720,068 | |
| | | | | | | | | | | | | | | | |
| | | | |
| Insurance: 5.19% | | | | | | | | | | | | | | | | |
| | | | |
CNO Financial Group Incorporated | | | | | | | | | | | 67,835 | | | | 1,097,570 | |
| | | | |
First American Financial Corporation | | | | | | | | | | | 20,109 | | | | 1,035,614 | |
| | | | |
National General Holdings Corporation | | | | | | | | | | | 56,950 | | | | 1,351,424 | |
| | | | |
| | | | | | | | | | | | | | | 3,484,608 | |
| | | | | | | | | | | | | | | | |
| | | | |
| Thrifts & Mortgage Finance: 1.95% | | | | | | | | | | | | | | | | |
| | | | |
Essent Group Limited † | | | | | | | | | | | 30,018 | | | | 1,304,282 | |
| | | | | | | | | | | | | | | | |
| | | | |
Health Care: 11.99% | | | | | | | | | | | | | | | | |
| | | | |
| Health Care Equipment & Supplies: 7.74% | | | | | | | | | | | | | | | | |
| | | | |
AngioDynamics Incorporated † | | | | | | | | | | | 71,418 | | | | 1,632,615 | |
| | | | |
Haemonetics Corporation † | | | | | | | | | | | 10,912 | | | | 954,582 | |
| | | | |
Integer Holdings Corporation † | | | | | | | | | | | 13,882 | | | | 1,046,980 | |
| | | | |
Steris plc | | | | | | | | | | | 12,208 | | | | 1,562,990 | |
| | | | |
| | | | | | | | | | | | | | | 5,197,167 | |
| | | | | | | | | | | | | | | | |
| | | | |
| Health Care Providers & Services: 0.55% | | | | | | | | | | | | | | | | |
| | | | |
MEDNAX Incorporated † | | | | | | | | | | | 13,502 | | | | 366,849 | |
| | | | | | | | | | | | | | | | |
| | | | |
| Life Sciences Tools & Services: 3.70% | | | | | | | | | | | | | | | | |
| | | | |
Bio-Rad Laboratories Incorporated Class A † | | | | | | | | | | | 5,047 | | | | 1,542,767 | |
| | | | |
Bruker Corporation | | | | | | | | | | | 24,467 | | | | 940,511 | |
| | | | |
| | | | | | | | | | | | | | | 2,483,278 | |
| | | | | | | | | | | | | | | | |
| | | | |
Industrials: 18.35% | | | | | | | | | | | | | | | | |
| | | | |
| Airlines: 1.13% | | | | | | | | | | | | | | | | |
| | | | |
Spirit Airlines Incorporated † | | | | | | | | | | | 14,334 | | | | 757,695 | |
| | | | | | | | | | | | | | | | |
| | | | |
| Building Products: 1.39% | | | | | | | | | | | | | | | | |
| | | | |
Masonite International Corporation † | | | | | | | | | | | 18,717 | | | | 933,791 | |
| | | | | | | | | | | | | | | | |
| | | | |
| Commercial Services & Supplies: 5.03% | | | | | | | | | | | | | | | | |
| | | | |
Advanced Disposal Services Incorporated † | | | | | | | | | | | 28,946 | | | | 810,488 | |
| | | | |
Interface Incorporated | | | | | | | | | | | 59,017 | | | | 904,140 | |
| | | | |
KAR Auction Services Incorporated | | | | | | | | | | | 15,518 | | | | 796,229 | |
| | | | |
Knoll Incorporated | | | | | | | | | | | 45,909 | | | | 868,139 | |
| | | | |
| | | | | | | | | | | | | | | 3,378,996 | |
| | | | | | | | | | | | | | | | |
The accompanying notes are an integral part of these financial statements.
| | | | | | |
| Portfolio of investments—March 31, 2019 | | Wells Fargo Intrinsic Small Cap Value Fund | | | 13 | |
| | | | | | | | | | | | | | | | |
| Security name | | | | | | | | Shares | | | Value | |
| | | | |
| Machinery: 6.21% | | | | | | | | | | | | | | | | |
| | | | |
Altra Holdings Incorporated | | | | | | | | | | | 31,322 | | | $ | 972,548 | |
| | | | |
ITT Incorporated | | | | | | | | | | | 17,956 | | | | 1,041,448 | |
| | | | |
Rexnord Corporation † | | | | | | | | | | | 38,864 | | | | 977,041 | |
| | | | |
SPX Corporation † | | | | | | | | | | | 33,793 | | | | 1,175,658 | |
| | | | |
| | | | | | | | | | | | | | | 4,166,695 | |
| | | | | | | | | | | | | | | | |
| | | | |
| Road & Rail: 2.07% | | | | | | | | | | | | | | | | |
| | | | |
Avis Budget Group Incorporated † | | | | | | | | | | | 11,599 | | | | 404,341 | |
| | | | |
Genesee & Wyoming Incorporated Class A † | | | | | | | | | | | 11,284 | | | | 983,288 | |
| | | | |
| | | | | | | | | | | | | | | 1,387,629 | |
| | | | | | | | | | | | | | | | |
| | | | |
| Trading Companies & Distributors: 2.52% | | | | | | | | | | | | | | | | |
| | | | |
Air Lease Corporation | | | | | | | | | | | 25,203 | | | | 865,723 | |
| | | | |
MRC Global Incorporated † | | | | | | | | | | | 47,383 | | | | 828,255 | |
| | | | |
| | | | | | | | | | | | | | | 1,693,978 | |
| | | | | | | | | | | | | | | | |
| | | | |
Information Technology: 12.29% | | | | | | | | | | | | | | | | |
| | | | |
| Communications Equipment: 0.86% | | | | | | | | | | | | | | | | |
| | | | |
Infinera Corporation † | | | | | | | | | | | 133,086 | | | | 577,593 | |
| | | | | | | | | | | | | | | | |
| | | | |
| Electronic Equipment, Instruments & Components: 6.04% | | | | | | | | | | | | | | | | |
| | | | |
Anixter International Incorporated † | | | | | | | | | | | 16,401 | | | | 920,260 | |
| | | | |
Avnet Incorporated | | | | | | | | | | | 24,937 | | | | 1,081,518 | |
| | | | |
SYNNEX Corporation | | | | | | | | | | | 9,300 | | | | 887,127 | |
| | | | |
Zebra Technologies Corporation Class A † | | | | | | | | | | | 5,558 | | | | 1,164,568 | |
| | | | |
| | | | | | | | | | | | | | | 4,053,473 | |
| | | | | | | | | | | | | | | | |
| | | | |
| IT Services: 2.37% | | | | | | | | | | | | | | | | |
| | | | |
Conduent Incorporated † | | | | | | | | | | | 58,283 | | | | 806,054 | |
| | | | |
WEX Incorporated † | | | | | | | | | | | 4,092 | | | | 785,623 | |
| | | | |
| | | | | | | | | | | | | | | 1,591,677 | |
| | | | | | | | | | | | | | | | |
| | | | |
| Semiconductors & Semiconductor Equipment: 1.41% | | | | | | | | | | | | | | | | |
| | | | |
Brooks Automation Incorporated | | | | | | | | | | | 32,338 | | | | 948,474 | |
| | | | | | | | | | | | | | | | |
| | | | |
| Software: 1.61% | | | | | | | | | | | | | | | | |
| | | | |
Mimecast Limited † | | | | | | | | | | | 22,734 | | | | 1,076,455 | |
| | | | | | | | | | | | | | | | |
| | | | |
Materials: 2.85% | | | | | | | | | | | | | | | | |
| | | | |
| Metals & Mining: 2.85% | | | | | | | | | | | | | | | | |
| | | | |
Reliance Steel & Aluminum Company | | | | | | | | | | | 11,255 | | | | 1,015,876 | |
| | | | |
Royal Gold Incorporated | | | | | | | | | | | 9,847 | | | | 895,388 | |
| | | | |
| | | | | | | | | | | | | | | 1,911,264 | |
| | | | | | | | | | | | | | | | |
| | | | |
Real Estate: 9.64% | | | | | | | | | | | | | | | | |
| | | | |
| Equity REITs: 9.64% | | | | | | | | | | | | | | | | |
| | | | |
Cousins Properties Incorporated | | | | | | | | | | | 117,840 | | | | 1,138,334 | |
| | | | |
Four Corners Property Trust Incorporated | | | | | | | | | �� | | 44,663 | | | | 1,322,025 | |
The accompanying notes are an integral part of these financial statements.
| | | | |
| 14 | | Wells Fargo Intrinsic Small Cap Value Fund | | Portfolio of investments—March 31, 2019 |
| | | | | | | | | | | | | | | | |
| Security name | | | | | | | | Shares | | | Value | |
| | | | |
| Equity REITs(continued) | | | | | | | | | | | | | | | | |
| | | | |
Hudson Pacific Properties Incorporated | | | | | | | | | | | 28,467 | | | $ | 979,834 | |
| | | | |
Physicians Realty Trust | | | | | | | | | | | 62,200 | | | | 1,169,982 | |
| | | | |
Retail Opportunity Investment Corporation | | | | | | | | | | | 63,850 | | | | 1,107,159 | |
| | | | |
Taubman Centers Incorporated | | | | | | | | | | | 14,288 | | | | 755,549 | |
| | | | |
| | | | | | | | | | | | | | | 6,472,883 | |
| | | | | | | | | | | | | | | | |
| | | | |
Total Common Stocks (Cost $56,658,497) | | | | | | | | | | | | | | | 64,520,565 | |
| | | | | | | | | | | | | | | | |
| | | | |
| | | Yield | | | | | | | | | | |
| Short-Term Investments: 4.26% | | | | | | | | | | | | | | | | |
| | | | |
| Investment Companies: 4.26% | | | | | | | | | | | | | | | | |
| | | | |
Wells Fargo Government Money Market Fund Select Class (l)(u) | | | 2.38 | % | | | | | | | 2,859,333 | | | | 2,859,333 | |
| | | | | | | | | | | | | | | | |
| | | | |
Total Short-Term Investments (Cost $2,859,333) | | | | | | | | | | | | | | | 2,859,333 | |
| | | | | | | | | | | | | | | | |
| | | | | | | | |
| Total investments in securities (Cost $59,517,830) | | | 100.39 | % | | | 67,379,898 | |
| | |
Other assets and liabilities, net | | | (0.39 | ) | | | (262,677 | ) |
| | | | | | | | |
| Total net assets | | | 100.00 | % | | $ | 67,117,221 | |
| | | | | | | | |
| † | Non-income-earning security |
| (l) | The issuer of the security is an affiliated person of the Fund as defined in the Investment Company Act of 1940. |
| (u) | The rate represents the 7-day annualized yield at period end. |
Abbreviations:
| REIT | Real estate investment trust |
Investments in Affiliates
An affiliated investment is an investment in which the Fund owns at least 5% of the outstanding voting shares of the issuer or as a result of other relationships, such as the Fund and the issuer having the same investment manager. Transactions with issuers that were either affiliated persons of the Portfolio at the beginning of the period or the end of the period were as follows:
| | | | | | | | | | | | | | | | | | | | | | | | | | | | | | | | | | | | |
| | | Shares,
beginning of
period | | | Shares
purchased | | | Shares sold | | | Shares,
end of
period | | | Net
realized
gains
(losses) | | | Net
change in
unrealized
gains
(losses) | | | Income
from
affiliated
securities | | | Value, end
of period | | | % of
net
assets | |
Short-Term Investments | | | | | | | | | | | | | | | | | | | | | | | | | | | | | | | | | | | | |
Investment Companies | | | | | | | | | | | | | | | | | | | | | | | | | | | | | | | | | | | | |
Securities Lending Cash Investments LLC * | | | 4,579,892 | | | | 14,874,073 | | | | 19,453,965 | | | | 0 | | | $ | 37 | | | $ | 69 | | | $ | 30,454 | | | $ | 0 | | | | | |
Wells Fargo Government Money Market Fund Select Class | | | 893,311 | | | | 19,621,400 | | | | 17,655,378 | | | | 2,859,333 | | | | 0 | | | | 0 | | | | 34,285 | | | | 2,859,333 | | | | | |
| | | | | | | | | | | | | | | | | | | | | | | | | | | | | | | | | | | | |
| | | | | | | | | |
| | | | | | | | | | | | | | | | | | $ | 37 | | | $ | 69 | | | $ | 64,739 | | | $ | 2,859,333 | | | | 4.26 | % |
| | | | | | | | | | | | | | | | | | | | | | | | | | | | | | | | | | | | |
| | * | No longer held at the end of the period. |
The accompanying notes are an integral part of these financial statements.
| | | | | | |
| Statement of assets and liabilities—March 31, 2019 | | Wells Fargo Intrinsic Small Cap Value Fund | | | 15 | |
| | | | |
| | | | |
| |
Assets | | | | |
Investments in unaffiliated securities, at value (cost $56,658,497) | | $ | 64,520,565 | |
Investments in affiliated securities, at value (cost $2,859,333) | | | 2,859,333 | |
Receivable for investments sold | | | 581,788 | |
Receivable for Fund shares sold | | | 22,040 | |
Receivable for dividends | | | 45,748 | |
Prepaid expenses and other assets | | | 29,333 | |
| | | | |
Total assets | | | 68,058,807 | |
| | | | |
| |
Liabilities | | | | |
Payable for investments purchased | | | 788,280 | |
Payable for Fund shares redeemed | | | 46,243 | |
Management fee payable | | | 36,944 | |
Administration fees payable | | | 10,675 | |
Trustees’ fees and expenses payable | | | 1,928 | |
Distribution fee payable | | | 346 | |
Accrued expenses and other liabilities | | | 57,170 | |
| | | | |
Total liabilities | | | 941,586 | |
| | | | |
Total net assets | | $ | 67,117,221 | |
| | | | |
| |
NET ASSETS CONSIST OF | | | | |
Paid-in capital | | $ | 55,685,693 | |
Total distributable earnings | | | 11,431,528 | |
| | | | |
Total net assets | | $ | 67,117,221 | |
| | | | |
| |
COMPUTATION OF NET ASSET VALUE AND OFFERING PRICE PER SHARE | | | | |
Net assets – Class A | | $ | 44,028,005 | |
Shares outstanding – Class A1 | | | 1,454,513 | |
Net asset value per share – Class A | | | $30.27 | |
Maximum offering price per share – Class A2 | | | $32.12 | |
Net assets – Class C | | $ | 526,121 | |
Shares outstanding – Class C1 | | | 18,802 | |
Net asset value per share – Class C | | | $27.98 | |
Net assets – Administrator Class | | $ | 1,164,886 | |
Shares outstanding – Administrator Class1 | | | 37,707 | |
Net asset value per share – Administrator Class | | | $30.89 | |
Net assets – Institutional Class | | $ | 21,398,209 | |
Shares outstanding – Institutional Class1 | | | 682,901 | |
Net asset value per share – Institutional Class | | | $31.33 | |
| 1 | The Fund has an unlimited number of authorized shares. |
| 2 | Maximum offering price is computed as 100/94.25 of net asset value. On investments of $50,000 or more, the offering price is reduced. |
The accompanying notes are an integral part of these financial statements.
| | | | |
| 16 | | Wells Fargo Intrinsic Small Cap Value Fund | | Statement of operations—year ended March 31, 2019 |
| | | | |
| | | | |
| |
Investment income | | | | |
Dividends (net of foreign withholding taxes of $872) | | $ | 884,140 | |
Income from affiliated securities | | | 44,493 | |
| | | | |
Total investment income | | | 928,633 | |
| | | | |
| |
Expenses | | | | |
Management fee | | | 637,288 | |
Administration fees | | | | |
Class A | | | 99,941 | |
Class C | | | 1,500 | |
Administrator Class | | | 1,548 | |
Institutional Class | | | 33,123 | |
Shareholder servicing fees | | | | |
Class A | | | 118,978 | |
Class C | | | 1,785 | |
Administrator Class | | | 2,977 | |
Distribution fee | | | | |
Class C | | | 5,356 | |
Custody and accounting fees | | | 4,652 | |
Professional fees | | | 38,210 | |
Registration fees | | | 60,209 | |
Shareholder report expenses | | | 36,575 | |
Trustees’ fees and expenses | | | 22,368 | |
Other fees and expenses | | | 11,535 | |
| | | | |
Total expenses | | | 1,076,045 | |
Less: Fee waivers and/or expense reimbursements | | | (149,490 | ) |
| | | | |
Net expenses | | | 926,555 | |
| | | | |
Net investment income | | | 2,078 | |
| | | | |
| |
REALIZED AND UNREALIZED GAINS (LOSSES) ON INVESTMENTS | | | | |
| |
Net realized gains on: | | | | |
Unaffiliated securities | | | 4,077,425 | |
Affiliated securities | | | 37 | |
| | | | |
Net realized gains on investments | | | 4,077,462 | |
| | | | |
| |
Net change in unrealized gains (losses) on: | | | | |
Unaffiliated securities | | | (6,626,673 | ) |
Affiliated securities | | | (69 | ) |
| | | | |
Net change in unrealized gains (losses) on investments | | | (6,626,742 | ) |
| | | | |
Net realized and unrealized gains (losses) on investments | | | (2,549,280 | ) |
| | | | |
Net decrease in net assets resulting from operations | | $ | (2,547,202 | ) |
| | | | |
The accompanying notes are an integral part of these financial statements.
| | | | | | |
| Statement of changes in net assets | | Wells Fargo Intrinsic Small Cap Value Fund | | | 17 | |
| | | | | | | | | | | | | | | | |
| | | Year ended March 31, 2019 | | | Year ended March 31, 2018 | |
| | | | |
Operations | | | | | | | | | | | | | | | | |
Net investment income (loss) | | | | | | $ | 2,078 | | | | | | | $ | (122,689 | ) |
Net realized gains on investments | | | | | | | 4,077,462 | | | | | | | | 8,079,158 | |
Net change in unrealized gains (losses) on investments | | | | | | | (6,626,742 | ) | | | | | | | (1,592,607 | ) |
| | | | |
Net increase (decrease) in net assets resulting from operations | | | | | | | (2,547,202 | ) | | | | | | | 6,363,862 | |
| | | | |
| | | | |
Capital share transactions | | | Shares | | | | | | | | Shares | | | | | |
Proceeds from shares sold | | | | | | | | | | | | | | | | |
Class A | | | 32,828 | | | | 1,010,693 | | | | 56,287 | | | | 1,697,291 | |
Class C | | | 1,268 | | | | 37,710 | | | | 3,291 | | | | 88,944 | |
Administrator Class | | | 13,111 | | | | 411,209 | | | | 9,745 | | | | 302,977 | |
Institutional Class | | | 40,538 | | | | 1,300,358 | | | | 134,112 | | | | 4,360,186 | |
| | | | |
| | | | |
| | | | | | | 2,759,970 | | | | | | | | 6,449,398 | |
| | | | |
Payment for shares redeemed | | | | | | | | | | | | | | | | |
Class A | | | (199,126 | ) | | | (6,242,566 | ) | | | (261,867 | ) | | | (7,767,468 | ) |
Class C | | | (11,127 | ) | | | (325,796 | ) | | | (11,065 | ) | | | (298,907 | ) |
Administrator Class | | | (17,407 | ) | | | (542,222 | ) | | | (115,713 | ) | | | (3,702,140 | ) |
Institutional Class | | | (221,373 | ) | | | (7,195,900 | ) | | | (1,288,079 | ) | | | (37,985,828 | ) |
| | | | |
| | | | |
| | | | | | | (14,306,484 | ) | | | | | | | (49,754,343 | ) |
| | | | |
Net decrease in net assets resulting from capital share transactions | | | | | | | (11,546,514 | ) | | | | | | | (43,304,945 | ) |
| | | | |
Total decrease in net assets | | | | | | | (14,093,716 | ) | | | | | | | (36,941,083 | ) |
| | | | |
| | | | |
Net assets | | | | | | | | | | | | | | | | |
Beginning of period | | | | | | | 81,210,937 | | | | | | | | 118,152,020 | |
| | | | |
End of period | | | | | | $ | 67,117,221 | | | | | | | $ | 81,210,937 | |
| | | | |
The accompanying notes are an integral part of these financial statements.
| | | | |
| 18 | | Wells Fargo Intrinsic Small Cap Value Fund | | Financial highlights |
(For a share outstanding throughout each period)
| | | | | | | | | | | | | | | | | | | | |
| | | Year ended March 31 | |
| CLASS A | | 2019 | | | 2018 | | | 2017 | | | 2016 | | | 2015 | |
Net asset value, beginning of period | | | $31.46 | | | | $28.92 | | | | $23.49 | | | | $25.50 | | | | $23.53 | |
Net investment income (loss) | | | (0.04 | )1 | | | (0.08 | )1 | | | (0.15 | )1 | | | 0.22 | 1 | | | 0.04 | |
Net realized and unrealized gains (losses) on investments | | | (1.15 | ) | | | 2.62 | | | | 5.71 | | | | (2.09 | ) | | | 1.93 | |
| | | | | | | | | | | | | | | | | | | | |
Total from investment operations | | | (1.19 | ) | | | 2.54 | | | | 5.56 | | | | (1.87 | ) | | | 1.97 | |
Distributions to shareholders from | | | | | | | | | | | | | | | | | | | | |
Net investment income | | | 0.00 | | | | 0.00 | | | | (0.13 | ) | | | (0.14 | ) | | | 0.00 | |
Net asset value, end of period | | | $30.27 | | | | $31.46 | | | | $28.92 | | | | $23.49 | | | | $25.50 | |
Total return2 | | | (3.78 | )% | | | 8.78 | % | | | 23.68 | % | | | (7.36 | )% | | | 8.37 | % |
Ratios to average net assets (annualized) | | | | | | | | | | | | | | | | | | | | |
Gross expenses | | | 1.54 | % | | | 1.54 | % | | | 1.48 | % | | | 1.47 | % | | | 1.46 | % |
Net expenses | | | 1.35 | % | | | 1.35 | % | | | 1.35 | % | | | 1.35 | % | | | 1.40 | % |
Net investment income (loss) | | | (0.11 | )% | | | (0.26 | )% | | | (0.57 | )% | | | 0.95 | % | | | 0.15 | % |
Supplemental data | | | | | | | | | | | | | | | | | | | | |
Portfolio turnover rate | | | 34 | % | | | 27 | % | | | 142 | % | | | 66 | % | | | 60 | % |
Net assets, end of period (000s omitted) | | | $44,028 | | | | $50,993 | | | | $52,817 | | | | $49,898 | | | | $817 | |
| 1 | Calculated based upon average shares outstanding |
| 2 | Total return calculations do not include any sales charges. |
The accompanying notes are an integral part of these financial statements.
| | | | | | |
| Financial highlights | | Wells Fargo Intrinsic Small Cap Value Fund | | | 19 | |
(For a share outstanding throughout each period)
| | | | | | | | | | | | | | | | | | | | |
| | | Year ended March 31 | |
| CLASS C | | 2019 | | | 2018 | | | 2017 | | | 2016 | | | 2015 | |
Net asset value, beginning of period | | | $29.30 | | | | $27.14 | | | | $22.11 | | | | $24.04 | | | | $22.35 | |
Net investment loss | | | (0.25 | )1 | | | (0.28 | )1 | | | (0.39 | )1 | | | (0.00 | )1,2 | | | (0.14 | )1 |
Net realized and unrealized gains (losses) on investments | | | (1.07 | ) | | | 2.44 | | | | 5.42 | | | | (1.93 | ) | | | 1.83 | |
| | | | | | | | | | | | | | | | | | | | |
Total from investment operations | | | (1.32 | ) | | | 2.16 | | | | 5.03 | | | | (1.93 | ) | | | 1.69 | |
Net asset value, end of period | | | $27.98 | | | | $29.30 | | | | $27.14 | | | | $22.11 | | | | $24.04 | |
Total return3 | | | (4.51 | )% | | | 7.96 | % | | | 22.75 | % | | | (8.03 | )% | | | 7.56 | % |
Ratios to average net assets (annualized) | | | | | | | | | | | | | | | | | | | | |
Gross expenses | | | 2.29 | % | | | 2.29 | % | | | 2.22 | % | | | 2.22 | % | | | 2.21 | % |
Net expenses | | | 2.10 | % | | | 2.10 | % | | | 2.10 | % | | | 2.12 | % | | | 2.15 | % |
Net investment loss | | | (0.85 | )% | | | (1.02 | )% | | | (1.52 | )% | | | (0.00 | )% | | | (0.62 | )% |
Supplemental data | | | | | | | | | | | | | | | | | | | | |
Portfolio turnover rate | | | 34 | % | | | 27 | % | | | 142 | % | | | 66 | % | | | 60 | % |
Net assets, end of period (000s omitted) | | | $526 | | | | $840 | | | | $989 | | | | $285 | | | | $304 | |
| 1 | Calculated based upon average shares outstanding |
| 2 | Amount is more than $(0.005). |
| 3 | Total return calculations do not include any sales charges. |
The accompanying notes are an integral part of these financial statements.
| | | | |
| 20 | | Wells Fargo Intrinsic Small Cap Value Fund | | Financial highlights |
(For a share outstanding throughout each period)
| | | | | | | | | | | | | | | | | | | | |
| | | Year ended March 31 | |
| ADMINISTRATOR CLASS | | 2019 | | | 2018 | | | 2017 | | | 2016 | | | 2015 | |
Net asset value, beginning of period | | | $32.06 | | | | $29.43 | | | | $23.89 | | | | $25.95 | | | | $23.90 | |
Net investment income (loss) | | | 0.01 | 1 | | | (0.03 | )1 | | | (0.10 | )1 | | | 0.22 | 1 | | | 0.07 | 1 |
Net realized and unrealized gains (losses) on investments | | | (1.18 | ) | | | 2.66 | | | | 5.80 | | | | (2.08 | ) | | | 1.98 | |
| | | | | | | | | | | | | | | | | | | | |
Total from investment operations | | | (1.17 | ) | | | 2.63 | | | | 5.70 | | | | (1.86 | ) | | | 2.05 | |
Distributions to shareholders from | | | | | | | | | | | | | | | | | | | | |
Net investment income | | | 0.00 | | | | 0.00 | | | | (0.16 | ) | | | (0.20 | ) | | | 0.00 | |
Net asset value, end of period | | | $30.89 | | | | $32.06 | | | | $29.43 | | | | $23.89 | | | | $25.95 | |
Total return | | | (3.65 | )% | | | 8.94 | % | | | 23.86 | % | | | (7.17 | )% | | | 8.58 | % |
Ratios to average net assets (annualized) | | | | | | | | | | | | | | | | | | | | |
Gross expenses | | | 1.46 | % | | | 1.46 | % | | | 1.40 | % | | | 1.37 | % | | | 1.30 | % |
Net expenses | | | 1.20 | % | | | 1.20 | % | | | 1.20 | % | | | 1.20 | % | | | 1.20 | % |
Net investment income (loss) | | | 0.05 | % | | | (0.10 | )% | | | (0.38 | )% | | | 0.91 | % | | | 0.27 | % |
Supplemental data | | | | | | | | | | | | | | | | | | | | |
Portfolio turnover rate | | | 34 | % | | | 27 | % | | | 142 | % | | | 66 | % | | | 60 | % |
Net assets, end of period (000s omitted) | | | $1,165 | | | | $1,347 | | | | $4,355 | | | | $4,893 | | | | $5,110 | |
| 1 | Calculated based upon average shares outstanding |
The accompanying notes are an integral part of these financial statements.
| | | | | | |
| Financial highlights | | Wells Fargo Intrinsic Small Cap Value Fund | | | 21 | |
(For a share outstanding throughout each period)
| | | | | | | | | | | | | | | | | | | | |
| | | Year ended March 31 | |
| INSTITUTIONAL CLASS | | 2019 | | | 2018 | | | 2017 | | | 2016 | | | 2015 | |
Net asset value, beginning of period | | | $32.45 | | | | $29.73 | | | | $24.13 | | | | $26.22 | | | | $24.19 | |
Net investment income (loss) | | | 0.08 | 1 | | | 0.03 | 1 | | | (0.07 | )1 | | | 0.33 | | | | 0.14 | 1 |
Net realized and unrealized gains (losses) on investments | | | (1.20 | ) | | | 2.69 | | | | 5.89 | | | | (2.17 | ) | | | 1.99 | |
| | | | | | | | | | | | | | | | | | | | |
Total from investment operations | | | (1.12 | ) | | | 2.72 | | | | 5.82 | | | | (1.84 | ) | | | 2.13 | |
Distributions to shareholders from | | | | | | | | | | | | | | | | | | | | |
Net investment income | | | 0.00 | | | | 0.00 | | | | (0.22 | ) | | | (0.25 | ) | | | (0.10 | ) |
Net asset value, end of period | | | $31.33 | | | | $32.45 | | | | $29.73 | | | | $24.13 | | | | $26.22 | |
Total return | | | (3.45 | )% | | | 9.15 | % | | | 24.14 | % | | | (7.02 | )% | | | 8.83 | % |
Ratios to average net assets (annualized) | | | | | | | | | | | | | | | | | | | | |
Gross expenses | | | 1.21 | % | | | 1.21 | % | | | 1.15 | % | | | 1.12 | % | | | 1.03 | % |
Net expenses | | | 1.00 | % | | | 1.00 | % | | | 1.00 | % | | | 1.00 | % | | | 1.00 | % |
Net investment income (loss) | | | 0.24 | % | | | 0.08 | % | | | (0.26 | )% | | | 1.10 | % | | | 0.57 | % |
Supplemental data | | | | | | | | | | | | | | | | | | | | |
Portfolio turnover rate | | | 34 | % | | | 27 | % | | | 142 | % | | | 66 | % | | | 60 | % |
Net assets, end of period (000s omitted) | | | $21,398 | | | | $28,032 | | | | $59,991 | | | | $71,072 | | | | $84,563 | |
| 1 | Calculated based upon average shares outstanding |
The accompanying notes are an integral part of these financial statements.
| | | | |
| 22 | | Wells Fargo Intrinsic Small Cap Value Fund | | Notes to financial statements |
1. ORGANIZATION
Wells Fargo Funds Trust (the “Trust”), a Delaware statutory trust organized on March 10, 1999, is an open-end management investment company registered under the Investment Company Act of 1940, as amended (the “1940 Act”). As an investment company, the Trust follows the accounting and reporting guidance in Financial Accounting Standards Board (“FASB”) Accounting Standards Codification Topic 946, Financial Services – Investment Companies. These financial statements report on the Wells Fargo Intrinsic Small Cap Value Fund (the “Fund”) which is a diversified series of the Trust.
2. SIGNIFICANT ACCOUNTING POLICIES
The following significant accounting policies, which are consistently followed in the preparation of the financial statements of the Fund, are in conformity with U.S. generally accepted accounting principles which require management to make estimates and assumptions that affect the reported amounts of assets and liabilities, disclosure of contingent assets and liabilities at the date of the financial statements, and the reported amounts of revenues and expenses during the reporting period. Actual results could differ from those estimates.
Securities valuation
All investments are valued each business day as of the close of regular trading on the New York Stock Exchange (generally 4 p.m. Eastern Time), although the Fund may deviate from this calculation time under unusual or unexpected circumstances.
Equity securities that are listed on a foreign or domestic exchange or market are valued at the official closing price or, if none, the last sales price. If no sale occurs on the primary exchange or market that day, the prior day’s price will be deemed “stale” and a fair value price will be determined in accordance with the Fund’s Valuation Procedures.
Investments in registered open-end investment companies are valued at net asset value. Interests in non-registered investment companies that are redeemable at net asset value are fair valued normally at net asset value.
Investments which are not valued using any of the methods discussed above are valued at their fair value, as determined in good faith by the Board of Trustees of the Fund. The Board of Trustees has established a Valuation Committee comprised of the Trustees and has delegated to it the authority to take any actions regarding the valuation of portfolio securities that the Valuation Committee deems necessary or appropriate, including determining the fair value of portfolio securities, unless the determination has been delegated to the Wells Fargo Asset Management Pricing Committee at Wells Fargo Funds Management, LLC (“Funds Management”). The Board of Trustees retains the authority to make or ratify any valuation decisions or approve any changes to the Valuation Procedures as it deems appropriate. On a quarterly basis, the Board of Trustees receives reports on any valuation actions taken by the Valuation Committee or the Wells Fargo Asset Management Pricing Committee which may include items for ratification.
Securities lending
The Fund may lend its securities from time to time in order to earn additional income in the form of fees or interest on securities received as collateral or the investment of any cash received as collateral. The Fund continues to receive interest or dividends on the securities loaned. The Fund receives collateral in the form of cash or securities with a value at least equal to the value of the securities on loan. The value of the loaned securities is determined at the close of each business day and any additional required collateral is delivered to the Fund on the next business day. In a securities lending transaction, the net asset value of the Fund will be affected by an increase or decrease in the value of the securities loaned and by an increase or decrease in the value of the instrument in which collateral is invested. The amount of securities lending activity undertaken by the Fund fluctuates from time to time. In the event of default or bankruptcy by the borrower, the Fund may be prevented from recovering the loaned securities or gaining access to the collateral or may experience delays or costs in doing so. In addition, the investment of any cash collateral received may lose all or part of its value. The Fund has the right under the lending agreement to recover the securities from the borrower on demand.
The Fund lends its securities through an unaffiliated securities lending agent. Cash collateral received in connection with its securities lending transactions is invested in Securities Lending Cash Investments, LLC (the “Securities Lending Fund”). The Securities Lending Fund is exempt from registration under Section 3(c)(7) of the 1940 Act and is managed by Funds Management and is subadvised by Wells Capital Management Incorporated (“WellsCap”), an affiliate of Funds Management and an indirect wholly owned subsidiary of Wells Fargo & Company (“Wells Fargo”). Funds Management receives an advisory fee starting at 0.05% and declining to 0.01% as the average daily net assets of the Securities Lending Fund increase. All of the fees received by Funds Management are paid to WellsCap for its services as subadviser. The Securities Lending Fund seeks to provide a positive return compared to the daily Fed Funds Open Rate by investing in high-quality, U.S. dollar-denominated short-term money market instruments. Securities Lending Fund investments are
| | | | | | |
| Notes to financial statements | | Wells Fargo Intrinsic Small Cap Value Fund | | | 23 | |
valued at the evaluated bid price provided by an independent pricing service. Income earned from investment in the Securities Lending Fund (net of fees and rebates), if any, is included in income from affiliated securities on the Statement of Operations.
Security transactions and income recognition
Securities transactions are recorded on a trade date basis. Realized gains or losses are recorded on the basis of identified cost.
Dividend income is recognized on the ex-dividend date. Dividend income is recorded net of foreign taxes withheld where recovery of such taxes is not assured.
Distributions to shareholders
Distributions to shareholders from net investment income and any net realized gains are recorded on the ex-dividend date and paid at least annually. Such distributions are determined in accordance with income tax regulations and may differ from U.S. generally accepted accounting principles. Dividend sources are estimated at the time of declaration. The tax character of distributions is determined as of the Fund’s fiscal year end. Therefore, a portion of the Fund’s distributions made prior to the Fund’s fiscal year end may be categorized as a tax return of capital at year end.
Federal and other taxes
The Fund intends to continue to qualify as a regulated investment company by distributing substantially all of its investment company taxable income and any net realized capital gains (after reduction for capital loss carryforwards) sufficient to relieve it from all, or substantially all, federal income taxes. Accordingly, no provision for federal income taxes was required.
The Fund’s income and federal excise tax returns and all financial records supporting those returns for the prior three fiscal years are subject to examination by the federal and Delaware revenue authorities. Management has analyzed the Fund’s tax positions taken on federal, state, and foreign tax returns for all open tax years and does not believe that there are any uncertain tax positions that require recognition of a tax liability.
As of March 31, 2019, the aggregate cost of all investments for federal income tax purposes was $60,005,271 and the unrealized gains (losses) consisted of:
| | | | |
| |
Gross unrealized gains | | $ | 11,896,999 | |
| |
Gross unrealized losses | | | (4,522,372 | ) |
| |
Net unrealized gains | | $ | 7,374,627 | |
Class allocations
The separate classes of shares offered by the Fund differ principally in applicable sales charges, distribution, shareholder servicing, and administration fees. Class specific expenses are charged directly to that share class. Investment income, common expenses, and realized and unrealized gains (losses) on investments are allocated daily to each class of shares based on the relative proportion of net assets of each class.
3. FAIR VALUATION MEASUREMENTS
Fair value measurements of investments are determined within a framework that has established a fair value hierarchy based upon the various data inputs utilized in determining the value of the Fund’s investments. The three-level hierarchy gives the highest priority to unadjusted quoted prices in active markets for identical assets or liabilities (Level 1) and the lowest priority to unobservable inputs (Level 3). The Fund’s investments are classified within the fair value hierarchy based on the lowest level of input that is significant to the fair value measurement. The inputs are summarized into three broad levels as follows:
| ∎ | | Level 1 – quoted prices in active markets for identical securities |
| ∎ | | Level 2 – other significant observable inputs (including quoted prices for similar securities, interest rates, prepayment speeds, credit risk, etc.) |
| ∎ | | Level 3 – significant unobservable inputs (including the Fund’s own assumptions in determining the fair value of investments) |
| | | | |
| 24 | | Wells Fargo Intrinsic Small Cap Value Fund | | Notes to financial statements |
The inputs or methodologies used for valuing investments in securities are not necessarily an indication of the risk associated with investing in those securities.
The following is a summary of the inputs used in valuing the Fund’s assets and liabilities as of March 31, 2019:
| | | | | | | | | | | | | | | | |
| | | | |
| | | Quoted prices
(Level 1) | | | Other significant
observable inputs
(Level 2) | | | Significant
unobservable inputs
(Level 3) | | | Total | |
| | | | |
Assets | | | | | | | | | | | | | | | | |
Investments in: | | | | | | | | | | | | | | | | |
| | | | |
Common stocks | | | | | | | | | | | | | | | | |
| | | | |
Communication services | | $ | 625,914 | | | $ | 0 | | | $ | 0 | | | $ | 625,914 | |
| | | | |
Consumer discretionary | | | 6,540,538 | | | | 0 | | | | 0 | | | | 6,540,538 | |
| | | | |
Consumer staples | | | 834,567 | | | | 0 | | | | 0 | | | | 834,567 | |
| | | | |
Energy | | | 3,280,144 | | | | 0 | | | | 0 | | | | 3,280,144 | |
| | | | |
Financials | | | 16,241,505 | | | | 0 | | | | 0 | | | | 16,241,505 | |
| | | | |
Health care | | | 8,047,294 | | | | 0 | | | | 0 | | | | 8,047,294 | |
| | | | |
Industrials | | | 12,318,784 | | | | 0 | | | | 0 | | | | 12,318,784 | |
| | | | |
Information technology | | | 8,247,672 | | | | 0 | | | | 0 | | | | 8,247,672 | |
| | | | |
Materials | | | 1,911,264 | | | | 0 | | | | 0 | | | | 1,911,264 | |
| | | | |
Real estate | | | 6,472,883 | | | | 0 | | | | 0 | | | | 6,472,883 | |
| | | | |
Short-term investments | | | | | | | | | | | | | | | | |
| | | | |
Investment companies | | | 2,859,333 | | | | 0 | | | | 0 | | | | 2,859,333 | |
| | | | |
Total assets | | $ | 67,379,898 | | | $ | 0 | | | $ | 0 | | | $ | 67,379,898 | |
Additional sector, industry or geographic detail is included in the Portfolio of Investments.
At March 31, 2019, the Fund did not have any transfers into/out of Level 3.
4. TRANSACTIONS WITH AFFILIATES
Management fee
Funds Management, an indirect wholly owned subsidiary of Wells Fargo, is the manager of the Fund and provides advisory and fund-level administrative services under an investment management agreement. Under the investment management agreement, Funds Management is responsible for, among other services, implementing the investment objectives and strategies of the Fund, supervising the subadviser and providing fund-level administrative services in connection with the Fund’s operations. As compensation for its services under the investment management agreement, Funds Management is entitled to receive a management fee at the following annual rate based on the Fund’s average daily net assets:
| | | | |
| |
| Average daily net assets | | Management fee | |
| |
First $500 million | | | 0.850 | % |
| |
Next $500 million | | | 0.825 | |
| |
Next $1 billion | | | 0.800 | |
| |
Next $1 billion | | | 0.775 | |
| |
Next $1 billion | | | 0.750 | |
| |
Next $1 billion | | | 0.730 | |
| |
Next $5 billion | | | 0.720 | |
| |
Over $10 billion | | | 0.710 | |
For the year ended March 31, 2019, the management fee was equivalent to an annual rate of 0.85% of the Fund’s average daily net assets.
| | | | | | |
| Notes to financial statements | | Wells Fargo Intrinsic Small Cap Value Fund | | | 25 | |
Funds Management has retained the services of a subadviser to provide daily portfolio management to the Fund. The fee for subadvisory services is borne by Funds Management. WellsCap is the subadviser to the Fund and is entitled to receive a fee from Funds Management at an annual rate starting at 0.55% and declining to 0.40% as the average daily net assets of the Fund increase.
Administration fees
Under a class-level administration agreement, Funds Management provides class-level administrative services to the Fund, which includes paying fees and expenses for services provided by the transfer agent, sub-transfer agents, omnibus account servicers and record-keepers. As compensation for its services under the class-level administration agreement, Funds Management receives an annual fee which is calculated based on the average daily net assets of each class as follows:
| | | | |
| | | Class-level
administration fee | |
| |
Class A, Class C | | | 0.21 | % |
| |
Administrator Class, Institutional Class | | | 0.13 | |
Funds Management has contractually waived and/or reimbursed management and administration fees to the extent necessary to maintain certain net operating expense ratios for the Fund. When each class of the Fund has exceeded its expense cap, Funds Management has waived fees and/or reimbursed expenses from fund level expenses on a proportionate basis and then from class specific expenses. When only certain classes exceed their expense caps, waivers and/or reimbursements are applied against class specific expenses before fund level expenses. Funds Management has committed through July 31, 2019 to waive fees and/or reimburse expenses to the extent necessary to cap the Fund’s expenses at 1.35% for Class A shares, 2.10% for Class C shares, and 1.20% for Administrator Class shares, and 1.00% for Institutional Class shares. Prior to or after the commitment expiration date, the cap may be increased or the commitment to maintain the cap may be terminated only with the approval of the Board of Trustees.
Distribution fee
The Trust has adopted a Distribution Plan for Class C shares of the Fund pursuant to Rule 12b-1 under the 1940 Act. A distribution fee is charged to Class C shares and paid to Wells Fargo Funds Distributor, LLC (“Funds Distributor”), the principal underwriter, at an annual rate of 0.75% of the average daily net assets of Class C shares.
In addition, Funds Distributor is entitled to receive the front-end sales charge from the purchase of Class A shares and a contingent deferred sales charge on the redemption of certain Class A shares. Funds Distributor is also entitled to receive the contingent deferred sales charges from redemptions of Class C shares. For the year ended March 31, 2019, Funds Distributor received $105 from the sale of Class A shares. No contingent deferred sales charges were incurred by Class A and Class C shares for the year ended March 31, 2019.
Shareholder servicing fees
The Trust has entered into contracts with one or more shareholder servicing agents, whereby Class A, Class C, and Administrator Class of the Fund is charged a fee at an annual rate of 0.25% of the average daily net assets of each respective class. A portion of these total shareholder servicing fees were paid to affiliates of Wells Fargo.
Interfund transactions
The Fund may purchase or sell portfolio investment securities to certain other Wells Fargo affiliates pursuant toRule 17a-7 under the 1940 Act and under procedures adopted by the Board of Trustees. The procedures have been designed to ensure that these interfund transactions, which do not incur broker commissions, are effected at current market prices.
5. INVESTMENT PORTFOLIO TRANSACTIONS
Purchases and sales of investments, excluding U.S. government obligations (if any) and short-term securities, for the year ended March 31, 2019 were $24,545,859 and $37,288,789, respectively.
6. BANK BORROWINGS
The Trust (excluding the money market funds), Wells Fargo Master Trust and Wells Fargo Variable Trust are parties to a $280,000,000 revolving credit agreement whereby the Fund is permitted to use bank borrowings for temporary or emergency purposes, such as to fund shareholder redemption requests. Interest under the credit agreement is charged to the Fund based on a borrowing rate equal to the higher of the Federal Funds rate in effect on that day plus 1.25% or the overnight LIBOR rate in effect on that day plus 1.25%. In addition, an annual commitment fee equal to 0.25% of the unused balance is allocated to each participating fund.
| | | | |
| 26 | | Wells Fargo Intrinsic Small Cap Value Fund | | Notes to financial statements |
For the year ended March 31, 2019, there were no borrowings by the Fund under the agreement.
7. DISTRIBUTIONS TO SHAREHOLDERS
For the years ended March 31, 2019 and March 31, 2018, the Fund did not have any distributions paid to shareholders.
As of March 31, 2019, the components of distributable earnings on a tax basis were as follows:
| | | | |
Undistributed
ordinary
income | | Undistributed
long-term
gain | | Unrealized
gains |
| | |
| $920,734 | | $3,136,167 | | $7,374,627 |
8. CONCENTRATION RISK
Concentration risk result from exposure to a limited number of sectors. A fund that invests a substantial portion of its assets in any sector may be more affected by changes in that sector than would be a fund whose investments are not heavily weighted in any sector.
9. INDEMNIFICATION
Under the Trust’s organizational documents, the officers and Trustees have been granted certain indemnification rights against certain liabilities that may arise out of performance of their duties to the Trust. Additionally, in the normal course of business, the Trust may enter into contracts with service providers that contain a variety of indemnification clauses. The Trust’s maximum exposure under these arrangements is dependent on future claims that may be made against the Fund and, therefore, cannot be estimated.
10. NEW ACCOUNTING PRONOUNCEMENT
In August 2018, FASB issued Accounting Standards Update (“ASU”) No. 2018-13, Fair Value Measurement (Topic 820)Disclosure Framework—Changes to the Disclosure Requirements for Fair Value Measurement. ASU 2018-13 updates the disclosure requirements for fair value measurements by modifying or removing certain disclosures and adding certain new disclosures. The amendments are effective for fiscal years, and interim periods within those fiscal years, beginning after December 15, 2019. Early adoption is permitted. Management has adopted the removal and modification of disclosures early, as permitted, and will adopt the additional new disclosures at the effective date.
| | | | | | |
| Report of independent registered public accounting firm | | Wells Fargo Intrinsic Small Cap Value Fund | | | 27 | |
TO THE SHAREHOLDERS OF THE FUND AND BOARD OF TRUSTEES OF WELLS FARGO FUNDS TRUST:
Opinion on the Financial Statements
We have audited the accompanying statement of assets and liabilities of Wells Fargo Intrinsic Small Cap Value Fund (the Fund), one of the funds constituting Wells Fargo Funds Trust, including the portfolio of investments, as of March 31, 2019, the related statement of operations for the year then ended, the statements of changes in net assets for each of the years in the two-year period then ended, and the related notes (collectively, the financial statements) and the financial highlights for each of the years in the five-year period then ended. In our opinion, the financial statements and financial highlights present fairly, in all material respects, the financial position of the Fund as of March 31, 2019, the results of its operations for the year then ended, the changes in its net assets for each of the years in the two-year period then ended, and the financial highlights for each of the years in the five-year period then ended, in conformity with U.S. generally accepted accounting principles.
Basis for Opinion
These financial statements and financial highlights are the responsibility of the Fund’s management. Our responsibility is to express an opinion on these financial statements and financial highlights based on our audits. We are a public accounting firm registered with the Public Company Accounting Oversight Board (United States) (PCAOB) and are required to be independent with respect to the Fund in accordance with the U.S. federal securities laws and the applicable rules and regulations of the Securities and Exchange Commission and the PCAOB.
We conducted our audits in accordance with the standards of the PCAOB. Those standards require that we plan and perform the audit to obtain reasonable assurance about whether the financial statements and financial highlights are free of material misstatement, whether due to error or fraud. Our audits included performing procedures to assess the risks of material misstatement of the financial statements and financial highlights, whether due to error or fraud, and performing procedures that respond to those risks. Such procedures included examining, on a test basis, evidence regarding the amounts and disclosures in the financial statements and financial highlights. Such procedures also included confirmation of securities owned as of March 31, 2019, by correspondence with the custodian and brokers, or by other appropriate auditing procedures. Our audits also included evaluating the accounting principles used and significant estimates made by management, as well as evaluating the overall presentation of the financial statements and financial highlights. We believe that our audits provide a reasonable basis for our opinion.

We have not been able to determine the specific year that we began serving as the auditor of one or more Wells Fargo Funds investment companies; however we are aware that we have served as the auditor of one or more Wells Fargo Funds investment companies since at least 1955.
Boston, Massachusetts
May 24, 2019
| | | | |
| 28 | | Wells Fargo Intrinsic Small Cap Value Fund | | Other information (unaudited) |
PROXY VOTING INFORMATION
A description of the policies and procedures used to determine how to vote proxies relating to portfolio securities is available, upon request, by calling1-800-222-8222, visiting our website atwfam.com, or visiting the SEC website at sec.gov. Information regarding how the Fund voted proxies relating to portfolio securities during the most recent12-month period ended June 30 is available on the Fund’s website atwfam.comor by visiting the SEC website at sec.gov.
PORTFOLIO HOLDINGS INFORMATION
The complete portfolio holdings for the Fund are publicly available monthly on the Fund’s website (wfam.com), on a one-month delayed basis. In addition, top ten holdings information (excluding derivative positions) for the Fund is publicly available on the Fund’s website on a monthly, seven-day or more delayed basis. The Fund files its complete schedule of portfolio holdings with the SEC for the first and third quarters of each fiscal year on Form N-Q, which is available by visiting the SEC website at sec.gov. In addition, the Fund’s Form N-Q may be reviewed and copied at the SEC’s Public Reference Room in Washington, DC, and at regional offices in New York City, at 233 Broadway, and in Chicago, at 175 West Jackson Boulevard, Suite 900. Information about the Public Reference Room may be obtained by calling 1-800-SEC-0330.
| | | | | | |
| Other information (unaudited) | | Wells Fargo Intrinsic Small Cap Value Fund | | | 29 | |
BOARD OF TRUSTEES AND OFFICERS
Each of the Trustees and Officers1 listed in the table below acts in identical capacities for each fund in the Wells Fargo family of funds, which consists of 151 mutual funds comprising the Wells Fargo Funds Trust, Wells Fargo Variable Trust, Wells Fargo Master Trust and four closed-end funds (collectively the “Fund Complex”). This table should be read in conjunction with the Prospectus and the Statement of Additional Information2. The mailing address of each Trustee and Officer is 525 Market Street, 12th Floor, San Francisco, CA 94105. Each Trustee and Officer serves an indefinite term, however, each Trustee serves such term until reaching the mandatory retirement age established by the Trustees.
Independent Trustees
| | | | | | |
Name and year of birth | | Position held and length of service* | | Principal occupations during past five years or longer | | Current other
public company or
investment company
directorships |
| | | |
William R. Ebsworth (Born 1957) | | Trustee, since 2015 | | Retired. From 1984 to 2013, equities analyst, portfolio manager, research director and chief investment officer at Fidelity Management and Research Company in Boston, Tokyo, and Hong Kong, and retired in 2013 as Chief Investment Officer of Fidelity Strategic Advisers, Inc. where he led a team of investment professionals managing client assets. Prior thereto, Board member of Hong Kong Securities Clearing Co., Hong Kong Options Clearing Corp., the Thailand International Fund, Ltd., Fidelity Investments Life Insurance Company, and Empire Fidelity Investments Life Insurance Company. Audit Committee Chair and Investment Committee Chair of the Vincent Memorial Hospital Endowment (non-profit organization). Mr. Ebsworth is a CFA® charterholder. | | N/A |
| | | |
Jane A. Freeman (Born 1953) | | Trustee, since 2015; Chair Liaison, since 2018 | | Retired. From 2012 to 2014 and 1999 to 2008, Chief Financial Officer of Scientific Learning Corporation. From 2008 to 2012, Ms. Freeman provided consulting services related to strategic business projects. Prior to 1999, Portfolio Manager at Rockefeller & Co. and Scudder, Stevens & Clark. Board member of the Harding Loevner Funds from 1996 to 2014, serving as both Lead Independent Director and chair of the Audit Committee. Board member of the Russell Exchange Traded Funds Trust from 2011 to 2012 and the chair of the Audit Committee. Ms. Freeman is a Board Member of The Ruth Bancroft Garden (non-profit organization). She is also an inactive Chartered Financial Analyst. | | N/A |
| | | |
Isaiah Harris, Jr.3 (Born 1952) | | Trustee, since 2009; Audit Committee Chairman, since 2019 | | Retired. Chairman of the Board of CIGNA Corporation since 2009, and Director since 2005. From 2003 to 2011, Director of Deluxe Corporation. Prior thereto, President and CEO of BellSouth Advertising and Publishing Corp. from 2005 to 2007, President and CEO of BellSouth Enterprises from 2004 to 2005 and President of BellSouth Consumer Services from 2000 to 2003. Emeritus member of the Iowa State University Foundation Board of Governors. Emeritus Member of the Advisory Board of Iowa State University School of Business. Advisory Board Member, Palm Harbor Academy (private school). Advisory Board Member, Child Evangelism Fellowship (non-profit). Mr. Harris is a certified public accountant (inactive status). | | CIGNA Corporation |
| | | |
Judith M. Johnson (Born 1949) | | Trustee, since 2008; Audit Committee Chairman, from 2009 to 2018 | | Retired. Prior thereto, Chief Executive Officer and Chief Investment Officer of Minneapolis Employees Retirement Fund from 1996 to 2008. Ms. Johnson is an attorney, certified public accountant and a certified managerial accountant. | | N/A |
| | | | |
| 30 | | Wells Fargo Intrinsic Small Cap Value Fund | | Other information (unaudited) |
| | | | | | |
Name and year of birth | | Position held and length of service* | | Principal occupations during past five years or longer | | Current other
public company or
investment company
directorships |
| | | |
David F. Larcker (Born 1950) | | Trustee, since 2009 | | James Irvin Miller Professor of Accounting at the Graduate School of Business, Stanford University, Director of the Corporate Governance Research Initiative and Senior Faculty of The Rock Center for Corporate Governance since 2006. From 2005 to 2008, Professor of Accounting at the Graduate School of Business, Stanford University. Prior thereto, Ernst & Young Professor of Accounting at The Wharton School, University of Pennsylvania from 1985 to 2005. | | N/A |
| | | |
Olivia S. Mitchell (Born 1953) | | Trustee, since 2006; Nominating and Governance Committee Chairman, since 2018 | | International Foundation of Employee Benefit Plans Professor, Wharton School of the University of Pennsylvania since 1993. Director of Wharton’s Pension Research Council and Boettner Center on Pensions & Retirement Research, and Research Associate at the National Bureau of Economic Research. Previously, Cornell University Professor from 1978 to 1993. | | N/A |
| | | |
Timothy J. Penny (Born 1951) | | Trustee, since 1996; Chairman, since 2018 | | President and Chief Executive Officer of Southern Minnesota Initiative Foundation, a non-profit organization, since 2007. Member of the Board of Trustees of NorthStar Education Finance, Inc., a non-profit organization, since 2007. | | N/A |
| | | |
James G. Polisson (Born 1959) | | Trustee, since 2018 | | Retired. Chief Marketing Officer, Source (ETF) UK Services, Ltd, from 2015 to 2017. From 2012 to 2015, Principal of The Polisson Group, LLC, a management consulting, corporate advisory and principal investing company. Chief Executive Officer and Managing Director at Russell Investments, Global Exchange Traded Funds from 2010 to 2012. Managing Director of Barclays Global Investors from 1998 to 2010 and Global Chief Marketing Officer for iShares and Barclays Global Investors from 2000 to 2010. Trustee of the San Francisco Mechanics’ Institute, a non-profit organization, from 2013 to 2015. Board member of the Russell Exchange Traded Fund Trust from 2011 to 2012. Director of Barclays Global Investors Holdings Deutschland GmbH from 2006 to 2009. Mr. Polisson is an attorney and has a retired status with the Massachusetts and District of Columbia Bar Associations. | | N/A |
| | | |
Pamela Wheelock (Born 1959) | | Trustee, since 2018 | | Board member of the Destination Medical Center Economic Development Agency, Rochester, Minnesota since 2019. Chief Operating Officer, Twin Cities Habitat for Humanity from 2017 to 2019. Vice President of University Services, University of Minnesota from 2012 to 2016. Prior thereto, on the Board of Directors, Governance Committee and Finance Committee for the Minnesota Philanthropy Partners (Saint Paul Foundation) from 2012 to 2018, Interim Chief Executive Officer of Blue Cross Blue Shield of Minnesota from 2011 to 2012, Chairman of the Board from 2009 to 2012 and Board Director from 2003 to 2015. Vice President, Leadership and Community Engagement, Bush Foundation, Saint Paul, Minnesota (a private foundation) from 2009 to 2011. Executive Vice President and Chief Financial Officer, Minnesota Sports and Entertainment from 2004 to 2009 and Senior Vice President from 2002 to 2004. Executive Vice President of the Minnesota Wild Foundation from 2004 to 2008. Commissioner of Finance, State of Minnesota, from 1999 to 2002. Currently Board Chair of the Minnesota Wild Foundation since 2010. | | N/A |
| * | Length of service dates reflect the Trustee’s commencement of service with the Trust’s predecessor entities, where applicable. |
| | | | | | |
| Other information (unaudited) | | Wells Fargo Intrinsic Small Cap Value Fund | | | 31 | |
Officers
| | | | | | |
Name and year of birth | | Position held and length of service | | Principal occupations during past five years or longer | | |
| | | |
Andrew Owen (Born 1960) | | President, since 2017 | | Executive Vice President of Wells Fargo & Company and Head of Affiliated Managers, Wells Fargo Asset Management, since 2014. In addition, Mr. Owen is currently President, Chief Executive Officer and Director of Wells Fargo Funds Management, LLC since 2017. Prior thereto, Executive Vice President responsible for marketing, investments and product development for Wells Fargo Funds Management, LLC, from 2009 to 2014. | | |
| | | |
Nancy Wiser1 (Born 1967) | | Treasurer, since 2012 | | Executive Vice President of Wells Fargo Funds Management, LLC since 2011. Chief Operating Officer and Chief Compliance Officer at LightBox Capital Management LLC, from 2008 to 2011. | | |
| | | |
Alexander Kymn (Born 1973) | | Secretary and Chief Legal Officer, since 2018 | | Senior Company Counsel of Wells Fargo Bank, N.A. since 2018 (previously Senior Counsel from 2007 to 2018). Vice President of Wells Fargo Funds Management, LLC from 2008 to 2014. | | |
| | | |
Michael H. Whitaker (Born 1967) | | Chief Compliance Officer, since 2016 | | Senior Vice President and Chief Compliance Officer since 2016. Senior Vice President and Chief Compliance Officer for Fidelity Investments from 2007 to 2016. | | |
| | | |
David Berardi (Born 1975) | | Assistant Treasurer, since 2009 | | Vice President of Wells Fargo Funds Management, LLC since 2009. Vice President of Evergreen Investment Management Company, LLC from 2008 to 2010. Manager of Fund Reporting and Control for Evergreen Investment Management Company, LLC from 2004 to 2010. | | |
| | | |
Jeremy DePalma1 (Born 1974) | | Assistant Treasurer, since 2009 | | Senior Vice President of Wells Fargo Funds Management, LLC since 2009. Senior Vice President of Evergreen Investment Management Company, LLC from 2008 to 2010 and head of the Fund Reporting and Control Team within Fund Administration from 2005 to 2010. | | |
| 1 | Nancy Wiser acts as Treasurer of 65 funds in the Fund Complex. Jeremy DePalma acts as Treasurer of 86 funds and Assistant Treasurer of 65 funds in the Fund Complex. |
| 2 | The Statement of Additional Information includes additional information about the Trustees and is available, without charge, upon request, by calling 1-800-222-8222 or by visiting the website atwfam.com. |
| 3 | Mr. Harris became Chairman of the Audit Committee effective January 1, 2019. |
| | | | |
| 32 | | Wells Fargo Intrinsic Small Cap Value Fund | | Appendix A (unaudited) |
SALES CHARGE REDUCTIONS AND WAIVERS FOR CERTAIN INTERMEDIARIES
Raymond James & Associates, Inc., Raymond James Financial Services & Raymond James affiliates (“Raymond James”)
Effective on or about March 1, 2019, shareholders purchasing Fund shares through a Raymond James platform or account will be eligible only for the following load waivers (front-end sales charge waivers and contingent deferred, or back-end, sales charge waivers) and discounts, which may differ from those disclosed elsewhere in the Fund’s Prospectus or SAI.
Front-end Sales Load Waivers on Class A shares Available at Raymond James
| | • | | Shares purchased in an investment advisory program. |
| | • | | Shares purchased through reinvestment of capital gains distributions and dividend reinvestment when purchasing shares of the same fund (but not any other fund within the fund family). |
| | • | | Employees and registered representatives of Raymond James or its affiliates and their family members as designated by Raymond James. |
| | • | | Shares purchased from the proceeds of redemptions within the same fund family, provided (1) the repurchase occurs within 90 days following the redemption, (2) the redemption and purchase occur in the same account, and (3) redeemed shares were subject to a front-end or deferred sales load (known as Rights of Reinstatement). |
| | • | | A shareholder in the fund’s Class C shares will have their shares automatically exchanged at net asset value to Class A shares (or the appropriate share class) of the fund if the shares are no longer subject to a CDSC and the exchange is in line with the policies and procedures of Raymond James. |
CDSC Waivers on Class A and C Shares Available at Raymond James
| | • | | Death or disability of the shareholder. |
| | • | | Shares sold as part of a systematic withdrawal plan as described in the Fund’s Prospectus. |
| | • | | Return of excess contributions from an IRA Account. |
| | • | | Shares sold as part of a required minimum distribution for IRA and retirement accounts due to the shareholder reaching age 70½ as described in the Fund’s prospectus. |
| | • | | Shares sold to pay Raymond James fees but only if the transaction is initiated by Raymond James. |
| | • | | Shares acquired through a right of reinstatement. |
Front-end Load Discounts Available at Raymond James: Breakpoints, and/or Rights of Accumulation
| | • | | Breakpoints as described in the Fund’s Prospectus. |
| | • | | Rights of accumulation which entitle shareholders to breakpoint discounts will be automatically calculated based on the aggregated holding of fund family assets held by accounts within the purchaser’s household at Raymond James. Eligible fund family assets not held at Raymond James may be included in the rights of accumulation calculation only if the shareholder notifies his or her financial advisor about such assets. |

For more information
More information about Wells Fargo Funds is available free upon request. To obtain literature, please write, visit the Fund’s website, or call:
Wells Fargo Funds
P.O. Box 219967
Kansas City, MO 64121-9967
Website: wfam.com
Individual investors: 1-800-222-8222
Retail investment professionals: 1-888-877-9275
Institutional investment professionals:1-866-765-0778
This report and the financial statements contained herein are submitted for the general information of the shareholders of the Fund. If this report is used for promotional purposes, distribution of the report must be accompanied or preceded by a current prospectus. Before investing, please consider the investment objectives, risks, charges, and expenses of the investment. For a current prospectus and, if available, a summary prospectus, containing this information, call1-800-222-8222 or visit the Fund’s website atwfam.com. Read the prospectus carefully before you invest or send money.
Wells Fargo Asset Management (WFAM) is the trade name for certain investment advisory/management firms owned by Wells Fargo & Company. These firms include but are not limited to Wells Capital Management Incorporated and Wells Fargo Funds Management, LLC. Certain products managed by WFAM entities are distributed by Wells Fargo Funds Distributor, LLC (a broker-dealer and Member FINRA).
This material is for general informational and educational purposes only and is NOT intended to provide investment advice or a recommendation of any kind—including a recommendation for any specific investment, strategy, or plan.
INVESTMENT PRODUCTS: NOT FDIC INSURED ◾ NO BANK GUARANTEE ◾ MAY LOSE VALUE
© 2019 Wells Fargo Funds Management, LLC. All rights reserved.
| | |
 | | 401591 05-19 A242/AR242 03-19 |
Annual Report
March 31, 2019

Wells Fargo Disciplined Small Cap Fund
(formerly, Wells Fargo Small Cap Opportunities Fund)

Beginning on January 1, 2021, as permitted by new regulations adopted by the Securities and Exchange Commission, paper copies of the Wells Fargo Funds’ annual and semi-annual shareholder reports issued after this date will no longer be sent by mail, unless you specifically request paper copies of the reports. Instead, the reports will be made available on the Funds’ website, and you will be notified by mail each time a report is posted and provided with a website address to access the report.
If you already elected to receive shareholder reports electronically, you will not be affected by this change and you need not take any action. You may elect to receive shareholder reports and other communications from the Fund electronically at any time by contacting your financial intermediary (such as a broker-dealer or bank) or, if you are a direct investor, by calling 1-800-222-8222 or by enrolling at wellsfargo.com/advantagedelivery.
You may elect to receive all future reports in paper free of charge. If you invest through a financial intermediary, you can contact your financial intermediary to request that you continue to receive paper copies of your shareholder reports; if you invest directly with the Fund, you can call 1-800-222-8222. Your election to receive reports in paper will apply to all Wells Fargo Funds held in your account with your financial intermediary or, if you are a direct investor, to all Wells Fargo Funds that you hold.

Reduce clutter. Save trees.
Sign up for electronic delivery of prospectuses and shareholder reports atwellsfargo.com/advantagedelivery
Contents
The views expressed and any forward-looking statements are as of March 31, 2019, unless otherwise noted, and are those of the Fund managers and/or Wells Fargo Asset Management. Discussions of individual securities, or the markets generally, or any Wells Fargo Fund are not intended as individual recommendations. Future events or results may vary significantly from those expressed in any forward-looking statements. The views expressed are subject to change at any time in response to changing circumstances in the market. Wells Fargo and the Fund disclaim any obligation to publicly update or revise any views expressed or forward-looking statements.
INVESTMENT PRODUCTS: NOT FDIC INSURED ◾ NO BANK GUARANTEE ◾ MAY LOSE VALUE
| | | | |
| 2 | | Wells Fargo Disciplined Small Cap Fund | | Letter to shareholders (unaudited) |

Andrew Owen
President
Wells Fargo Funds
Global trade tensions escalated during the second quarter of 2018.
Dear Shareholder:
We are pleased to offer you this annual report for the Wells Fargo Disciplined Small Cap Fund for the12-month period that ended March 31, 2019. Effective June 27, 2018, the Fund changed its name from Wells Fargo Small Cap Opportunities Fund to Wells Fargo Disciplined Small Cap Fund. An upward trend for short-term interest rates, inflation concerns, trade tensions, and geopolitical events contributed to investment market volatility for much of 2018. Equity investor sentiment improved during the first quarter of 2019 thanks to a shift in U.S. Federal Reserve (Fed) policy and consistent if not spectacular economic and business growth metrics.
For the period, U.S. stocks, as measured by the S&P 500 Index,1 gained 9.50% and international stocks, as measured by the MSCI ACWI ex USA Index (Net),2 declined 4.22%. Based on the MSCI EM Index (Net),3 emerging market stocks fell 7.41%. For bond investors, the Bloomberg Barclays U.S. Aggregate Bond Index4 added 4.48% while the Bloomberg Barclays Global Aggregateex-USD Index5 lost 4.13%. The Bloomberg Barclays Municipal Bond Index6 added 5.38%, and the ICE BofAML U.S. High Yield Index7 gained 5.94%.
Trade tensions and U.S. interest rates influenced markets.
Global trade tensions escalated during the second quarter of 2018. Atit-for-tat tariff spat intensified between the U.S. and other governments. The Fed raised the federal funds rate by 25 basis points (bps; 100 bps equal 1.00%) to a target range of between 1.75% and 2.00% in June 2018. Market index results reflected the global concerns. The MSCI ACWI ex USA Index (Net) lost 2.61%, while the Bloomberg Barclays Global Aggregateex-USD Index dropped 4.76%.
Not all news was bad. The U.S. Bureau of Economic Analysis reported second-quarter annualized gross domestic product (GDP) growth of 4.2%. Hiring improved. Unemployment declined. Consumer confidence and spending increased. The S&P 500 Index recorded a 3.43% second-quarter gain. Stocks of companies with smaller capitalizations did even better, as measured by the Russell 2000® Index,8 adding 7.75%.
| 1 | The S&P 500 Index consists of 500 stocks chosen for market size, liquidity, and industry group representation. It is a market-value-weighted index with each stock’s weight in the index proportionate to its market value. You cannot invest directly in an index. |
| 2 | The Morgan Stanley Capital International (MSCI) All Country World Index (ACWI) ex USA Index (Net) is a free-float-adjusted market-capitalization-weighted index that is designed to measure the equity market performance of developed markets, excluding the United States and Canada. Source: MSCI. MSCI makes no express or implied warranties or representations and shall have no liability whatsoever with respect to any MSCI data contained herein. The MSCI data may not be further redistributed or used as a basis for other indices or any securities or financial products. This report is not approved, reviewed, or produced by MSCI. You cannot invest directly in an index. |
| 3 | The MSCI Emerging Markets (EM) Index (Net) is a free-float-adjusted market-capitalization-weighted index that is designed to measure large- andmid-cap equity market performance of emerging markets. The MSCI EM Index (Net) consists of the following 24 emerging market country indices: Brazil, Chile, China, Colombia, Czech Republic, Egypt, Greece, Hungary, India, Indonesia, Korea, Malaysia, Mexico, Pakistan, Peru, the Philippines, Poland, Qatar, Russia, South Africa, Taiwan, Thailand, Turkey, and the United Arab Emirates. You cannot invest directly in an index. |
| 4 | The Bloomberg Barclays U.S. Aggregate Bond Index is a broad-based benchmark that measures the investment-grade, U.S. dollar-denominated, fixed-rate taxable bond market, including Treasuries, government-related and corporate securities, mortgage-backed securities (agency fixed-rate and hybrid adjustable-rate mortgage pass-throughs), asset-backed securities, and commercial mortgage-backed securities. You cannot invest directly in an index. |
| 5 | The Bloomberg Barclays Global Aggregateex-USD Index is an unmanaged index that provides a broad-based measure of the global investment-grade fixed-income markets excluding the U.S. dollar-denominated debt market. You cannot invest directly in an index. |
| 6 | The Bloomberg Barclays Municipal Bond Index is an unmanaged index composed of long-termtax-exempt bonds with a minimum credit rating of Baa. You cannot invest directly in an index. |
| 7 | The ICE BofAML U.S. High Yield Index is a market-capitalization-weighted index of domestic and Yankee high-yield bonds. The index tracks the performance of high-yield securities traded in the U.S. bond market. You cannot invest directly in an index. Copyright 2019. ICE Data Indices, LLC. All rights reserved. |
| 8 | The Russell 2000® Index measures the performance of the 2,000 smallest companies in the Russell 3000® Index, which represents approximately 8% of the total market capitalization of the Russell 3000® Index. You cannot invest directly in an index. |
| | | | | | |
| Letter to shareholders (unaudited) | | Wells Fargo Disciplined Small Cap Fund | | | 3 | |
Investors appeared to shake off lingering concerns during the third quarter.
Favorable third-quarter economic indicators and corporate earnings reports encouraged domestic stock investors. U.S. trade negotiations with Mexico and Canada progressed. The Conference Board Consumer Confidence Index®9 reached its highest level in 18 years during September 2018. The Fed raised the federal funds rate by 25 bps to a target range of between 2.00% and 2.25% in September 2018. For the quarter that ended September 30, 2018, the S&P 500 Index added 7.71%.
Investors in international markets were not as confident. Tensions between the U.S. and China increased. The U.S. imposed $200 billion in tariffs on Chinese goods. China reacted with $60 billion in tariffs on U.S. goods. Economic growth in China caused concern. The Bank of England raised its monetary policy rate to 0.75% in August 2018. During the quarter, the MSCI ACWI ex USA Index (Net) gained 0.71%. The MSCI EM Index (Net) declined 1.09%. In fixed-income markets, U.S. bonds were flat, as measured by the Bloomberg Barclays U.S. Aggregate Bond Index. The Bloomberg Barclays Global Aggregateex-USD Index fell 1.74%.
Conflicting data unsettled markets during the fourth quarter.
November’s U.S. midterm elections shifted control of the House of Representatives from Republicans to Democrats, presaging potential partisan clashes. Third-quarter U.S. GDP was announced at an annualized 3.4% rate, lower than the second-quarter rate. Brexit efforts stalled ahead of the March 2019 deadline. The People’s Bank of China cut reserve requirement ratios, accelerated infrastructure spending, and cut taxes even as the value of the yuan declined to low levels last seen in 2008.
December’s S&P 500 Index performance was the worst since 1931. Globally,fixed-income investments fared better than stocks during the last two months of the year. The Fed increased the federal funds rate by 25 bps in December 2018 to a target range of between 2.25% and 2.50% and softened its outlook for 2019 rate increases.
The market climbs a wall of worry.
Investors entered 2019 with reasons to be concerned. A partial U.S. government shutdown driven by partisan spending and immigration policy disputes extended into January. Investors expected high levels of stock market volatility to continue based on the VIX10.
January’s returns tended to support the investing adage that markets climb a wall of worry. The S&P 500 Index gained 8.01% for the month that ended January 31, 2019, its best monthly performance in 30 years. Returns for the MSCI ACWI ex USA Index (Net), the Bloomberg Barclays U.S. Aggregate Bond Index, and the Bloomberg Barclays Global Aggregateex-USD Index also were positive. The Fed indicated that it would pause its program of regular rate increases during 2019 as inflation remained low. Businesses and investors responded positively to the shift in policy.
In February, concerns over slowing global growth reemerged. The Bureau of Economic Analysis announced fourth-quarter 2018 GDP grew at an annualized 2.2% rate, down from the 4.2% annualized rate for the second quarter and the 3.4% annualized rate for the third quarter. Analysts attributed the lower growth rate to a slowing housing market and larger trade deficit. The U.S. Department of
Favorable third-quarter economic indicators and corporate earnings reports encouraged domestic stock investors.
| 9 | The Conference Board Consumer Confidence Index® measures the degree of optimism on the state of the U.S. economy that consumers are expressing through their activities of savings and spending. You cannot invest directly in an index. |
| 10 | The Chicago Board Options Exchange Market Volatility Index (VIX) is a popular measure of the implied volatility of S&P 500 Index options. It represents one measure of the market’s expectation of stock market volatility over the next30-day period. You cannot invest directly in an index. |
| | | | |
| 4 | | Wells Fargo Disciplined Small Cap Fund | | Letter to shareholders (unaudited) |
Labor said that the economy created just 20,000 jobs in February 2019. In a February report, the Bank of England forecast the slowest growth since the financial crisis for 2019. China and the U.S., while putting future tariffs on hold for the time being, continued to wrangle over trade issues.
By the end of March 2019, the combination of dovish Fed sentiment and consistent, if not spectacular, economic and business metrics reinforced investors’ enthusiasm for equity investing. Monthly job creation data regained its momentum. Corporate profits, while lower than 2018’s lofty levels, remained consistent. Inflation rates were relatively low in the U.S., Europe, and Japan. China announced a roughly $300 billion stimulus package through tax and fee cuts intended to reinvigorate economic growth.
Don’t let short-term uncertainty derail long-term investment goals.
Periods of investment uncertainty can present challenges, but experience has taught us that maintaining long-term investment goals can be an effective way to plan for the future. To help you create a sound strategy based on your personal goals and risk tolerance, Wells Fargo Funds offers more than 100 mutual funds spanning a wide range of asset classes and investment styles. Although diversification cannot guarantee an investment profit or prevent losses, we believe it can be an effective way to manage investment risk and potentially smooth out overall portfolio performance. We encourage investors to know their investments and to understand that appropriate levels of risk-taking may unlock opportunities.
Thank you for choosing to invest with Wells Fargo Funds. We appreciate your confidence in us and remain committed to helping you meet your financial needs.
Sincerely,

Andrew Owen
President
Wells Fargo Funds
For further information about your Fund, contact your investment professional, visit our website atwfam.com, or call us directly at1-800-222-8222.
This page is intentionally left blank.
| | | | |
| 6 | | Wells Fargo Disciplined Small Cap Fund | | Performance highlights (unaudited) |
Investment objective
The Fund seeks long-term capital appreciation.
Manager
Wells Fargo Funds Management, LLC
Subadviser
Wells Capital Management Incorporated*
Portfolio managers+
Justin P. Carr, CFA®‡
Greg G. Golden, CFA®‡
Robert M. Wicentowski, CFA®‡
Average annual total returns (%) as of March 31, 2019
| | | | | | | | | | | | | | | | | | | | | | | | | | | | | | | | | | |
| | | | | Including sales charge | | | Excluding sales charge | | | Expense ratios1 (%) | |
| | | Inception date | | 1 year | | | 5 year | | | 10 year | | | 1 year | | | 5 year | | | 10 year | | | Gross | | | Net2 | |
| | | | | | | | | |
| Class A (WDSAX)3 | | 7-31-2018 | | | -12.28 | | | | 4.43 | | | | 12.51 | | | | -6.93 | | | | 5.68 | | | | 13.18 | | | | 1.10 | | | | 0.99 | |
| | | | | | | | | |
| Class R6 (WSCJX)4 | | 10-31-2016 | | | – | | | | – | | | | – | | | | -6.75 | | | | 5.94 | | | | 13.32 | | | | 0.67 | | | | 0.56 | |
| | | | | | | | | |
| Administrator Class (NVSOX) | | 8-1-1993 | | | – | | | | – | | | | – | | | | -7.01 | | | | 5.66 | | | | 13.17 | | | | 1.02 | | | | 0.91 | |
| | | | | | | | | |
| Institutional Class (WSCOX)5 | | 10-31-2014 | | | – | | | | – | | | | – | | | | -6.79 | | | | 5.90 | | | | 13.29 | | | | 0.77 | | | | 0.66 | |
| | | | | | | | | |
| Russell 2000® Index6 | | – | | | – | | | | – | | | | – | | | | 2.05 | | | | 7.05 | | | | 15.36 | | | | – | | | | – | |
Figures quoted represent past performance, which is no guarantee of future results,and do not reflect taxes that a shareholder may pay on fund distributions or the redemption of fund shares. Investment return and principal value of an investment will fluctuate so that an investor’s shares, when redeemed, may be worth more or less than their original cost. Performance shown without sales charges would be lower if sales charges were reflected. Current performance may be lower or higher than the performance data quoted, which assumes the reinvestment of dividends and capital gains. Currentmonth-end performance is available on the Fund’s website, wfam.com
Index returns do not include transaction costs associated with buying and selling securities, any mutual fund fees or expenses, or any taxes. It is not possible to invest directly in an index.
For Class A shares, the maximumfront-end sales charge is 5.75%. Performance including a contingent deferred sales charge assumes the sales charge for the corresponding time period. Class R6, Administrator Class, and Institutional Class shares are sold without afront-end sales charge or contingent deferred sales charge.
Stock values fluctuate in response to the activities of individual companies and general market and economic conditions. Smaller-company stocks tend to be more volatile and less liquid than those of larger companies. The use of derivatives may reduce returns and/or increase volatility. Consult the Fund’s prospectus for additional information on these and other risks.
Please see footnotes on page 7.
| | | | | | |
| Performance highlights (unaudited) | | Wells Fargo Disciplined Small Cap Fund | | | 7 | |
|
| Growth of $10,000 investment as of March 31, 20197 |
|
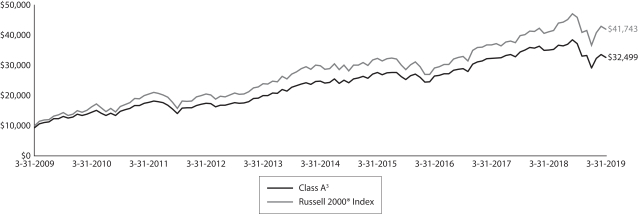 |
| * | Wells Capital Management Incorporated became the subadviser of the Fund on June 27, 2018. |
| + | Mr. Carr, Mr. Golden, and Mr. Wicentowski became portfolio managers of the Fund on June 27, 2018. |
| ‡ | CFA® and Chartered Financial Analyst®are trademarks owned by CFA Institute. |
| 1 | Reflects the expense ratios as stated in the most recent prospectuses, which include the impact of 0.06% in acquired fund fees and expenses. The expense ratios shown are subject to change and may differ from the annualized expense ratios shown in the financial highlights of this report, which do not include acquired fund fees and expenses. |
| 2 | The manager has contractually committed through July 31, 2019 (July 31, 2020 for Class A shares), to waive fees and/or reimburse expenses to the extent necessary to cap the expenses of each class after fee waivers at 0.93% for Class A, 0.50% for Class R6, 0.85% for Administrator Class, and 0.60% for Institutional Class. Brokerage commissions, stamp duty fees, interest, taxes, acquired fund fees and expenses (if any), and extraordinary expenses are excluded from the expense cap. Prior to or after the commitment expiration date, the cap may be increased or the commitment to maintain the cap may be terminated only with the approval of the Board of Trustees. Without this cap, the Fund’s returns would have been lower. The expense ratio paid by an investor is the net expense ratio (the total annual fund operating expenses after fee waivers) as stated in the prospectuses. |
| 3 | Historical performance shown for Class A shares prior to their inception reflects the performance of the Administrator Class shares, and is adjusted to reflect the higher expenses and sales charges of the Class A shares. |
| 4 | Historical performance shown for Class R6 shares prior to their inception reflects the performance of the Institutional Class shares, and is not adjusted to reflect the expenses of Class R6. If these expenses had been included, returns for Class R6 would be higher. |
| 5 | Historical performance shown for the Institutional Class shares prior to their inception reflects the performance of the Administrator Class shares, and is not adjusted to reflect the expenses of the Institutional Class. If these expenses had been included, returns for the Institutional Class shares would be higher. |
| 6 | The Russell 2000® Index measures the performance of the 2,000 smallest companies in the Russell 3000® Index, which represents approximately 8% of the total market capitalization of the Russell 3000® Index. You cannot invest directly in an index. |
| 7 | The S&P 500 Index consists of 500 stocks chosen for market size, liquidity, and industry group representation. It is a market-value-weighted index with each stock’s weight in the index proportionate to its market value. You cannot invest directly in an index. |
| 8 | The ten largest holdings, excluding cash, cash equivalents and any money market funds, are calculated based on the value of the investments divided by total net assets of the Fund. Holdings are subject to change and may have changed since the date specified. |
| 9 | Amounts are calculated based on the total long-term investments of the Fund. These amounts are subject to change and may have changed since the date specified. |
| | | | |
| 8 | | Wells Fargo Disciplined Small Cap Fund | | Performance highlights (unaudited) |
MANAGER’S DISCUSSION
Fund highlights
| ∎ | | The Fund underperformed its benchmark, the Russell 2000® Index, for the12-month period that ended March 31, 2019. |
| ∎ | | Negative stock selection occurred most significantly within the information technology (IT), consumer discretionary, and materials sectors. |
| ∎ | | The Fund benefited from positive stock selection in the health care, real estate, and consumer staples sectors. |
A strong economy and tax bill stimulus sent U.S. stocks climbing higher.
The global economy appears to be losing steam. According to Capital Economics, global gross domestic product growth has slowed from 3.8% in the first quarter of 2018 to around 3.0% in the first quarter of 2019, a level the International Monetary Fund considers a perilously slow growth rate. The slowdown has been particularly severe in Europe and, to a lesser extent, in Asia. Manufacturing has slowed markedly along with the sharp decline in global trade, while the service sector has been more resilient.
Thev-shaped recovery in the equity markets from the fourth quarter of 2018 through the first quarter of 2019 was driven by a dovish pivot from the Federal Open Market Committee (FOMC), expectations for a trade deal between the U.S. and China, and better-than-expected corporate earnings. On the trade front, the planned early-March increase in the tariff rate on $200 billion of Chinese imports was delayed and talk of a summit between U.S. President Donald Trump and People’s Republic of China President Xi Jinping boosted confidence. However, the summit did not materialize as progress on a trade deal stalled. On the earnings front during the first quarter of 2019, the S&P 500 Index7 registered the fifth-straight quarter of double-digit earnings growth, indicating greater resilience than expected at the end of 2018. The Russell 2000® Index rose by 2.05% for the reporting period. The broadersmall-cap equity market was driven by periods of high growth and high beta followed by reversal. Quality also outperformed.
| | | | |
| Ten largest holdings (%) as of March 31, 20198 | |
| |
Performance Food Group Company | | | 0.88 | |
| |
Verint Systems Incorporated | | | 0.88 | |
| |
J2 Global Incorporated | | | 0.83 | |
| |
Ryman Hospitality Properties Incorporated | | | 0.83 | |
| |
Steven Madden Limited | | | 0.80 | |
| |
SYNNEX Corporation | | | 0.78 | |
| |
MGIC Investment Corporation | | | 0.74 | |
| |
CACI International Incorporated Class A | | | 0.73 | |
| |
EMCOR Group Incorporated | | | 0.73 | |
| |
Horizon Pharma plc | | | 0.72 | |
Changes to the Fund’s portfolio during the period were minimal.
Investor concerns about the duration of the economic expansion and slowing economic growth caused crowding into a narrow segment of the market. There has been a preference for growth, even at high valuations, and quality. Value, however, has drastically underperformed. With the changes in investors’ attitudes toward risk assets, sentiment drove rallies in the market that were characterized byrisk-on sentiment during the first quarter of 2019 andrisk-off sentiment during the last quarter of 2018. Significant and well-timed exposures to risk factors has been the recipe for successful performance. Fundamental factors largely have been ineffective, making this the most challenging period in
the history of the Fund. Our past experience demonstrates that fundamentally weighted strategies that invest in relatively inexpensive companies with improving fundamentals reward long-term investors. We continue to build portfolios that adhere to this philosophy while recognizing that pervasive macroeconomic risks require an elevated emphasis on risk controls, particularly as it relates to industry exposures and secular growth.
Please see footnotes on page 7.
| | | | | | |
| Performance highlights (unaudited) | | Wells Fargo Disciplined Small Cap Fund | | | 9 | |
| | |
| Sector distribution as of March 31, 20199 |
|
 |
Stock selection was strongest in health care, real estate, and consumer staples.
Stock selection was strongest in the health care, real estate, and consumer staples sectors. Within health care, the Fund benefited from not owning Nektar Therapeutics, a previously high-flying name that declined on setbacks in its pipeline and competition. An overweight to Horizon Pharma plc, which commercializes late-stage biopharmaceutical therapies, was a consistent performer all year with results that bested consensus estimates on the top and bottom lines. Gout treatment Krystexxa experienced double-digit growth and continues to be strong. Teprotumumab, which treats thyroid eye disease, is also tracking well. In real estate,
NexPoint Residential Trust, Incorporated, which operates multifamily properties throughout the southeast and southwest, delivered strong growth despite mixed results relative to consensus expectations. Fundamentals in the apartment sector remain strong. Across consumer staples, Medifast, Incorporated, was thetop-performing name. While the company has finished higher for the year, prudent trimming of the position preserved some gains as the stock demonstrated weakness in the back half of the year. Overall, the company delivered double-digit earnings and revenue growth while raising guidance early in the year.
Stock selection was weakest in IT, consumer discretionary, and materials.
The strategy’s risk-control discipline and its focus onbottom-up stock selection tend to limit the effect of sector allocations on relative performance. Though the cumulative effect of generally neutral sector positioning was small, it was not immaterial this period. Stock selection was weakest in IT, consumer discretionary, and materials. Across consumer discretionary, particularly within specialty retail, names such as Tailored Brands, Incorporated, detracted from relative performance. Stronger growth prospects led internet retail stocks higher, while valuation multiples for traditionalbrick-and-mortar retail names contracted tomid-single digits. Late-cycle industries in the IT sector lagged over supply and margin concerns. As an example, the Fund’s overweight exposure to Ultra Clean Holdings, Incorporated, a supplier of critical subsystems in the semiconductor manufacturing process, detracted from relative performance. Trinseo S.A., a manufacturer of polymers and plastics in the materials sector’s chemical industry, detracted from relative performance on global macroeconomic weakness, particularly in Europe, and foreign currency exchange headwinds.
We will continue to diligently focus on company fundamentals and disciplined portfolio risk management.
Though U.S. economic growth is expected to be lower than in 2018, it is most likely to remain positive in the coming months as unemployment remains near a record low, consumer confidence remains high, and personal incomes are growing. Corporate fundamentals have deteriorated somewhat as the earnings outlook has weakened; however, investment spending and corporate balance sheets remain healthy. With the downward revision to earnings expectations over the past several months, consensus estimates have been lowered to a point that they may lead to an upside surprise. However, we recognize that the largest source of risk to earnings is linked to uncertainty regarding trade sanctions, which have the potential to result in higher input costs, higher labor costs, and profit margin compression. Further delays to a negotiated trade settlement could cause market disappointment, while the resolution of the dispute may only provide a small positive catalyst.
The risk of slow economic growth for several quarters or an economic downturn has increased. However, the combination of weak core inflation and slower economic growth will likely keep the FOMC on hold in 2019 with a bias toward loosening monetary policy. As we monitor the macroeconomic environment, we will continue to diligently focus on company fundamentals and disciplined portfolio risk management.
Please see footnotes on page 7.
| | | | |
| 10 | | Wells Fargo Disciplined Small Cap Fund | | Fund expenses (unaudited) |
As a shareholder of the Fund, you incur two types of costs: (1) transaction costs, including sales charges (loads) on purchase payments and contingent deferred sales charges (if any) on redemptions and (2) ongoing costs, including management fees, shareholder servicing fees, and other Fund expenses. This example is intended to help you understand your ongoing costs (in dollars) of investing in the Fund and to compare these costs with the ongoing costs of investing in other mutual funds.
The example is based on an investment of $1,000 invested at the beginning of thesix-month period and held for the entire period from October 1, 2018 to March 31, 2019.
Actual expenses
The “Actual” line of the table below provides information about actual account values and actual expenses. You may use
the information in this line, together with the amount you invested, to estimate the expenses that you paid over the period. Simply divide your account value by $1,000 (for example, an $8,600 account value divided by $1,000 = 8.6), then multiply the result by the number in the “Actual” line under the heading entitled “Expenses paid during period” for your applicable class of shares to estimate the expenses you paid on your account during this period.
Hypothetical example for comparison purposes
The “Hypothetical” line of the table below provides information about hypothetical account values and hypothetical expenses based on the Fund’s actual expense ratio and an assumed rate of return of 5% per year before expenses, which is not the Fund’s actual return. The hypothetical account values and expenses may not be used to estimate the actual ending account balance or expenses you paid for the period. You may use this information to compare the ongoing costs of investing in the Fund and other funds. To do so, compare this 5% hypothetical example with the 5% hypothetical examples that appear in the shareholder reports of the other funds.
Please note that the expenses shown in the table are meant to highlight your ongoing costs only and do not reflect any
transactional costs, such as sales charges (loads) and contingent deferred sales charges. Therefore, the “Hypothetical” line
of the table is useful in comparing ongoing costs only and will not help you determine the relative total costs of owning
different funds. In addition, if these transactional costs were included, your costs would have been higher.
| | | | | | | | | | | | | | | | |
| | | Beginning
account value
10-1-2018 | | | Ending
account value
3-31-2019 | | | Expenses
paid during
the period¹ | | | Annualized net
expense ratio | |
Class A | | | | | | | | | | | | | | | | |
| | | | |
Actual | | $ | 1,000.00 | | | $ | 878.87 | | | $ | 4.31 | | | | 0.92 | % |
| | | | |
Hypothetical (5% return before expenses) | | $ | 1,000.00 | | | $ | 1,020.35 | | | $ | 4.63 | | | | 0.92 | % |
Class R6 | | | | | | | | | | | | | | | | |
| | | | |
Actual | | $ | 1,000.00 | | | $ | 878.91 | | | $ | 2.34 | | | | 0.50 | % |
| | | | |
Hypothetical (5% return before expenses) | | $ | 1,000.00 | | | $ | 1,022.44 | | | $ | 2.52 | | | | 0.50 | % |
Administrator Class | | | | | | | | | | | | | | | | |
| | | | |
Actual | | $ | 1,000.00 | | | $ | 877.65 | | | $ | 3.98 | | | | 0.85 | % |
| | | | |
Hypothetical (5% return before expenses) | | $ | 1,000.00 | | | $ | 1,020.69 | | | $ | 4.28 | | | | 0.85 | % |
Institutional Class | | | | | | | | | | | | | | | | |
| | | | |
Actual | | $ | 1,000.00 | | | $ | 878.88 | | | $ | 2.81 | | | | 0.60 | % |
| | | | |
Hypothetical (5% return before expenses) | | $ | 1,000.00 | | | $ | 1,021.94 | | | $ | 3.02 | | | | 0.60 | % |
| 1 | Expenses paid is equal to the annualized net expense ratio of each class multiplied by the average account value over the period, multiplied by the number of days in the most recent fiscal half-year divided by the number of days in the fiscal year (to reflect theone-half-year period). |
| | | | | | |
| Portfolio of investments—March 31, 2019 | | Wells Fargo Disciplined Small Cap Fund | | | 11 | |
| | | | | | | | | | | | | | | | |
| Security name | | | | | | | | Shares | | | Value | |
| | | | |
Common Stocks: 98.95% | | | | | | | | | | | | | | | | |
| | | | |
Communication Services: 2.85% | | | | | | | | | | | | | | | | |
| | | | |
| Diversified Telecommunication Services: 0.33% | | | | | | | | | | | | | | | | |
| | | | |
Vonage Holdings Corporation † | | | | | | | | | | | 26,155 | | | $ | 262,596 | |
| | | | | | | | | | | | | | | | |
| | | | |
| Entertainment: 0.61% | | | | | | | | | | | | | | | | |
| | | | |
Marcus Corporation | | | | | | | | | | | 6,121 | | | | 245,146 | |
| | | | |
World Wrestling Entertainment Incorporated Class A | | | | | | | | | | | 2,787 | | | | 241,856 | |
| | | | |
| | | | | | | | | | | | | | | 487,002 | |
| | | | | | | | | | | | | | | | |
| | | | |
| Interactive Media & Services: 0.54% | | | | | | | | | | | | | | | | |
| | | | |
QuinStreet Incorporated † | | | | | | | | | | | 26,190 | | | | 350,684 | |
| | | | |
Yelp Incorporated † | | | | | | | | | | | 2,319 | | | | 80,006 | |
| | | | |
| | | | | | | | | | | | | | | 430,690 | |
| | | | | | | | | | | | | | | | |
| | | | |
| Media: 1.29% | | | | | | | | | | | | | | | | |
| | | | |
Gray Television Incorporated † | | | | | | | | | | | 13,126 | | | | 280,371 | |
| | | | |
MSG Networks Incorporated Class A † | | | | | | | | | | | 13,144 | | | | 285,882 | |
| | | | |
Nexstar Media Group Incorporated Class A | | | | | | | | | | | 4,266 | | | | 462,306 | |
| | | | |
| | | | | | | | | | | | | | | 1,028,559 | |
| | | | | | | | | | | | | | | | |
| | | | |
| Wireless Telecommunication Services: 0.08% | | | | | | | | | | | | | | | | |
| | | | |
Boingo Wireless Incorporated † | | | | | | | | | | | 2,565 | | | | 59,713 | |
| | | | | | | | | | | | | | | | |
| | | | |
Consumer Discretionary: 11.36% | | | | | | | | | | | | | | | | |
| | | | |
| Auto Components: 0.77% | | | | | | | | | | | | | | | | |
| | | | |
Dana Incorporated | | | | | | | | | | | 18,667 | | | | 331,153 | |
| | | | |
Modine Manufacturing Company † | | | | | | | | | | | 13,504 | | | | 187,300 | |
| | | | |
Tower International Incorporated | | | | | | | | | | | 4,561 | | | | 95,918 | |
| | | | |
| | | | | | | | | | | | | | | 614,371 | |
| | | | | | | | | | | | | | | | |
| | | | |
| Diversified Consumer Services: 1.17% | | | | | | | | | | | | | | | | |
| | | | |
Career Education Corporation † | | | | | | | | | | | 17,102 | | | | 282,525 | |
| | | | |
Grand Canyon Education Incorporated † | | | | | | | | | | | 3,171 | | | | 363,111 | |
| | | | |
K12 Incorporated † | | | | | | | | | | | 8,419 | | | | 287,340 | |
| | | | |
| | | | | | | | | | | | | | | 932,976 | |
| | | | | | | | | | | | | | | | |
| | | | |
| Hotels, Restaurants & Leisure: 3.06% | | | | | | | | | | | | | | | | |
| | | | |
Bloomin’ Brands Incorporated | | | | | | | | | | | 12,197 | | | | 249,429 | |
| | | | |
Brinker International Incorporated | | | | | | | | | | | 11,555 | | | | 512,811 | |
| | | | |
Dave & Buster’s Entertainment Incorporated | | | | | | | | | | | 6,779 | | | | 338,069 | |
| | | | |
Marriott Vacations Worldwide Corporation | | | | | | | | | | | 2,731 | | | | 255,349 | |
| | | | |
Planet Fitness Incorporated Class A † | | | | | | | | | | | 7,561 | | | | 519,592 | |
| | | | |
Playags Incorporated † | | | | | | | | | | | 9,526 | | | | 227,957 | |
| | | | |
Ruth’s Chris Steak House Incorporated | | | | | | | | | | | 12,838 | | | | 328,524 | |
| | | | |
| | | | | | | | | | | | | | | 2,431,731 | |
| | | | | | | | | | | | | | | | |
The accompanying notes are an integral part of these financial statements.
| | | | |
| 12 | | Wells Fargo Disciplined Small Cap Fund | | Portfolio of investments—March 31, 2019 |
| | | | | | | | | | | | | | | | |
| Security name | | | | | | | | Shares | | | Value | |
| | | | |
| Household Durables: 1.43% | | | | | | | | | | | | | | | | |
| | | | |
Helen of Troy Limited † | | | | | | | | | | | 4,834 | | | $ | 560,551 | |
| | | | |
La-Z-Boy Incorporated | | | | | | | | | | | 7,179 | | | | 236,835 | |
| | | | |
Universal Electronics Incorporated † | | | | | | | | | | | 9,153 | | | | 340,034 | |
| | | | |
| | | | | | | | | | | | | | | 1,137,420 | |
| | | | | | | | | | | | | | | | |
| | | | |
| Internet & Direct Marketing Retail: 0.60% | | | | | | | | | | | | | | | | |
| | | | |
Etsy Incorporated † | | | | | | | | | | | 4,285 | | | | 288,038 | |
| | | | |
Stamps.com Incorporated † | | | | | | | | | | | 2,319 | | | | 188,790 | |
| | | | |
| | | | | | | | | | | | | | | 476,828 | |
| | | | | | | | | | | | | | | | |
| | | | |
| Specialty Retail: 2.20% | | | | | | | | | | | | | | | | |
| | | | |
American Eagle Outfitters Incorporated | | | | | | | | | | | 14,411 | | | | 319,492 | |
| | | | |
Caleres Incorporated | | | | | | | | | | | 9,695 | | | | 239,370 | |
| | | | |
Children’s Place Retail Stores Incorporated | | | | | | | | | | | 2,297 | | | | 223,452 | |
| | | | |
Designer Brands Incorporated | | | | | | | | | | | 12,255 | | | | 272,306 | |
| | | | |
Five Below Incorporated † | | | | | | | | | | | 1,014 | | | | 125,990 | |
| | | | |
Tailored Brands Incorporated | | | | | | | | | | | 7,140 | | | | 55,978 | |
| | | | |
Tilly’s Incorporated Class A | | | | | | | | | | | 29,232 | | | | 325,352 | |
| | | | |
Zumiez Incorporated † | | | | | | | | | | | 7,736 | | | | 192,549 | |
| | | | |
| | | | | | | | | | | | | | | 1,754,489 | |
| | | | | | | | | | | | | | | | |
| | | | |
| Textiles, Apparel & Luxury Goods: 2.13% | | | | | | | | | | | | | | | | |
| | | | |
G-III Apparel Group Limited † | | | | | | | | | | | 8,956 | | | | 357,882 | |
| | | | |
Movado Group Incorporated | | | | | | | | | | | 11,782 | | | | 428,629 | |
| | | | |
Skechers U.S.A. Incorporated Class A † | | | | | | | | | | | 8,042 | | | | 270,292 | |
| | | | |
Steven Madden Limited | | | | | | | | | | | 18,938 | | | | 640,862 | |
| | | | |
| | | | | | | | | | | | | | | 1,697,665 | |
| | | | | | | | | | | | | | | | |
| | | | |
Consumer Staples: 3.01% | | | | | | | | | | | | | | | | |
| | | | |
| Food & Staples Retailing: 0.88% | | | | | | | | | | | | | | | | |
| | | | |
Performance Food Group Company † | | | | | | | | | | | 17,731 | | | | 702,857 | |
| | | | | | | | | | | | | | | | |
| | | | |
| Food Products: 0.91% | | | | | | | | | | | | | | | | |
| | | | |
Fresh Del Monte Produce Incorporated | | | | | | | | | | | 14,516 | | | | 392,367 | |
| | | | |
Simply Good Foods Company † | | | | | | | | | | | 16,006 | | | | 329,564 | |
| | | | |
| | | | | | | | | | | | | | | 721,931 | |
| | | | | | | | | | | | | | | | |
| | | | |
| Personal Products: 0.71% | | | | | | | | | | | | | | | | |
| | | | |
Medifast Incorporated | | | | | | | | | | | 2,410 | | | | 307,396 | |
| | | | |
USANA Health Sciences Incorporated † | | | | | | | | | | | 3,086 | | | | 258,823 | |
| | | | |
| | | | | | | | | | | | | | | 566,219 | |
| | | | | | | | | | | | | | | | |
| | | | |
| Tobacco: 0.51% | | | | | | | | | | | | | | | | |
| | | | |
Turning Point Brands Incorporated | | | | | | | | | | | 8,805 | | | | 405,822 | |
| | | | | | | | | | | | | | | | |
| | | | |
Energy: 4.01% | | | | | | | | | | | | | | | | |
| | | | |
| Energy Equipment & Services: 1.45% | | | | | | | | | | | | | | | | |
| | | | |
Archrock Incorporated | | | | | | | | | | | 41,607 | | | | 406,916 | |
| | | | |
Helix Energy Solutions Group Incorporated † | | | | | | | | | | | 36,654 | | | | 289,933 | |
The accompanying notes are an integral part of these financial statements.
| | | | | | |
| Portfolio of investments—March 31, 2019 | | Wells Fargo Disciplined Small Cap Fund | | | 13 | |
| | | | | | | | | | | | | | | | |
| Security name | | | | | | | | Shares | | | Value | |
| | | | |
| Energy Equipment & Services(continued) | | | | | | | | | | | | | | | | |
| | | | |
ProPetro Holding Corporation † | | | | | | | | | | | 17,252 | | | $ | 388,860 | |
| | | | |
Tetra Technologies Incorporated † | | | | | | | | | | | 28,806 | | | | 67,406 | |
| | | | |
| | | | | | | | | | | | | | | 1,153,115 | |
| | | | | | | | | | | | | | | | |
| | | | |
| Oil, Gas & Consumable Fuels: 2.56% | | | | | | | | | | | | | | | | |
| | | | |
Abraxas Petroleum Corporation † | | | | | | | | | | | 82,264 | | | | 102,830 | |
| | | | |
Callon Petroleum Company † | | | | | | | | | | | 15,640 | | | | 118,082 | |
| | | | |
Delek US Holdings Incorporated | | | | | | | | | | | 13,565 | | | | 494,037 | |
| | | | |
Denbury Resources Incorporated † | | | | | | | | | | | 42,907 | | | | 87,959 | |
| | | | |
HighPoint Resources Corporation † | | | | | | | | | | | 30,518 | | | | 67,445 | |
| | | | |
Northern Oil & Gas Incorporated † | | | | | | | | | | | 50,836 | | | | 139,291 | |
| | | | |
Oasis Petroleum Incorporated † | | | | | | | | | | | 20,963 | | | | 126,617 | |
| | | | |
Par Pacific Holdings Incorporated † | | | | | | | | | | | 11,349 | | | | 202,126 | |
| | | | |
Renewable Energy Group Incorporated † | | | | | | | | | | | 14,149 | | | | 310,712 | |
| | | | |
SRC Energy Incorporated † | | | | | | | | | | | 31,112 | | | | 159,293 | |
| | | | |
World Fuel Services Corporation | | | | | | | | | | | 7,854 | | | | 226,902 | |
| | | | |
| | | | | | | | | | | | | | | 2,035,294 | |
| | | | | | | | | | | | | | | | |
| | | | |
Financials: 16.83% | | | | | | | | | | | | | | | | |
| | | | |
| Banks: 7.49% | | | | | | | | | | | | | | | | |
| | | | |
Bank of N.T. Butterfield & Son Limited | | | | | | | | | | | 9,006 | | | | 323,135 | |
| | | | |
Central Pacific Financial Company | | | | | | | | | | | 5,470 | | | | 157,755 | |
| | | | |
CNB Financial Corporation | | | | | | | | | | | 7,238 | | | | 182,904 | |
| | | | |
Enterprise Financial Service | | | | | | | | | | | 9,225 | | | | 376,103 | |
| | | | |
First Bancorp of North Carolina | | | | | | | | | | | 11,113 | | | | 386,288 | |
| | | | |
First Financial Bancorp | | | | | | | | | | | 6,712 | | | | 161,491 | |
| | | | |
First Financial Corporation | | | | | | | | | | | 6,530 | | | | 274,260 | |
| | | | |
First Interstate BancSystem Class A | | | | | | | | | | | 8,844 | | | | 352,168 | |
| | | | |
First Merchants Corporation | | | | | | | | | | | 7,379 | | | | 271,916 | |
| | | | |
Great Southern Bancorp Incorporated | | | | | | | | | | | 7,278 | | | | 377,728 | |
| | | | |
Great Western Bancorp Incorporated | | | | | | | | | | | 7,943 | | | | 250,919 | |
| | | | |
Hancock Holding Company | | | | | | | | | | | 11,539 | | | | 466,176 | |
| | | | |
Heritage Commerce Corporation | | | | | | | | | | | 11,406 | | | | 138,013 | |
| | | | |
IBERIABANK Corporation | | | | | | | | | | | 984 | | | | 70,563 | |
| | | | |
Independent Bank Corporation | | | | | | | | | | | 10,142 | | | | 218,053 | |
| | | | |
Mercantile Bank Corporation | | | | | | | | | | | 8,482 | | | | 277,531 | |
| | | | |
NBT Bancorp Incorporated | | | | | | | | | | | 5,895 | | | | 212,279 | |
| | | | |
Peoples Bancorp Incorporated | | | | | | | | | | | 11,428 | | | | 353,925 | |
| | | | |
Preferred Bank (Los Angeles) | | | | | | | | | | | 6,966 | | | | 313,261 | |
| | | | |
Shore Bancshares Incorporated | | | | | | | | | | | 3,781 | | | | 56,375 | |
| | | | |
Simmons First National Corporation Class A | | | | | | | | | | | 1,887 | | | | 46,194 | |
| | | | |
Sterling Bancorp | | | | | | | | | | | 6,059 | | | | 112,879 | |
| | | | |
TriCo Bancshares | | | | | | | | | | | 4,246 | | | | 166,825 | |
| | | | |
Umpqua Holdings Corporation | | | | | | | | | | | 16,774 | | | | 276,771 | |
| | | | |
WesBanco Incorporated | | | | | | | | | | | 3,498 | | | | 139,046 | |
| | | | |
| | | | | | | | | | | | | | | 5,962,558 | |
| | | | | | | | | | | | | | | | |
| | | | |
| Capital Markets: 2.57% | | | | | | | | | | | | | | | | |
| | | | |
BGC Partners Incorporated Class A | | | | | | | | | | | 27,820 | | | | 147,724 | |
| | | | |
Blucora Incorporated † | | | | | | | | | | | 14,599 | | | | 487,315 | |
The accompanying notes are an integral part of these financial statements.
| | | | |
| 14 | | Wells Fargo Disciplined Small Cap Fund | | Portfolio of investments—March 31, 2019 |
| | | | | | | | | | | | | | | | |
| Security name | | | | | | | | Shares | | | Value | |
| | | | |
| Capital Markets(continued) | | | | | | | | | | | | | | | | |
| | | | |
BrightSphere Investment Group Incorporated | | | | | | | | | | | 22,927 | | | $ | 310,890 | |
| | | | |
Evercore Partners Incorporated Class A | | | | | | | | | | | 4,576 | | | | 416,416 | |
| | | | |
Houlihan Lokey Incorporated | | | | | | | | | | | 10,430 | | | | 478,216 | |
| | | | |
Stifel Financial Corporation | | | | | | | | | | | 3,930 | | | | 207,347 | |
| | | | |
| | | | | | | | | | | | | | | 2,047,908 | |
| | | | | | | | | | | | | | | | |
| | | | |
| Consumer Finance: 0.72% | | | | | | | | | | | | | | | | |
| | | | |
Enova International Incorporated † | | | | | | | | | | | 15,573 | | | | 355,376 | |
| | | | |
Regional Management Corporation † | | | | | | | | | | | 8,934 | | | | 218,168 | |
| | | | |
| | | | | | | | | | | | | | | 573,544 | |
| | | | | | | | | | | | | | | | |
| | | | |
| Diversified Financial Services: 0.29% | | | | | | | | | | | | | | | | |
| | | | |
On Deck Capital Incorporated † | | | | | | | | | | | 42,673 | | | | 231,288 | |
| | | | | | | | | | | | | | | | |
| | | | |
| Insurance: 2.88% | | | | | | | | | | | | | | | | |
| | | | |
Argo Group International Holdings Limited | | | | | | | | | | | 3,351 | | | | 236,782 | |
| | | | |
FBL Financial Group Incorporated | | | | | | | | | | | 3,774 | | | | 236,705 | |
| | | | |
Health Insurance Innovations Incorporated Class A Ǡ | | | | | | | | | | | 4,929 | | | | 132,196 | |
| | | | |
Kemper Corporation | | | | | | | | | | | 6,883 | | | | 524,072 | |
| | | | |
National General Holdings Corporation | | | | | | | | | | | 17,681 | | | | 419,570 | |
| | | | |
Selective Insurance Group Incorporated | | | | | | | | | | | 5,609 | | | | 354,938 | |
| | | | |
Universal Insurance Holdings Company | | | | | | | | | | | 12,454 | | | | 386,074 | |
| | | | |
| | | | | | | | | | | | | | | 2,290,337 | |
| | | | | | | | | | | | | | | | |
| | | | |
| Thrifts & Mortgage Finance: 2.88% | | | | | | | | | | | | | | | | |
| | | | |
Essent Group Limited † | | | | | | | | | | | 12,078 | | | | 524,789 | |
| | | | |
First Defiance Financial Corporation | | | | | | | | | | | 6,587 | | | | 189,310 | |
| | | | |
MGIC Investment Corporation † | | | | | | | | | | | 44,479 | | | | 586,678 | |
| | | | |
Provident Financial Services Incorporated | | | | | | | | | | | 7,543 | | | | 195,288 | |
| | | | |
Radian Group Incorporated | | | | | | | | | | | 27,188 | | | | 563,879 | |
| | | | |
Walker & Dunlop Incorporated | | | | | | | | | | | 4,519 | | | | 230,062 | |
| | | | |
| | | | | | | | | | | | | | | 2,290,006 | |
| | | | | | | | | | | | | | | | |
| | | | |
Health Care: 15.51% | | | | | | | | | | | | | | | | |
| | | | |
| Biotechnology: 5.57% | | | | | | | | | | | | | | | | |
| | | | |
Akebia Therapeutics Incorporated † | | | | | | | | | | | 18,264 | | | | 149,582 | |
| | | | |
Arena Pharmaceuticals Incorporated † | | | | | | | | | | | 5,176 | | | | 232,040 | |
| | | | |
Array BioPharma Incorporated † | | | | | | | | | | | 19,010 | | | | 463,464 | |
| | | | |
CytomX Therapeutics Incorporated † | | | | | | | | | | | 3,377 | | | | 36,303 | |
| | | | |
Emergent BioSolutions Incorporated † | | | | | | | | | | | 5,026 | | | | 253,914 | |
| | | | |
Exelixis Incorporated † | | | | | | | | | | | 11,378 | | | | 270,796 | |
| | | | |
Fibrogen Incorporated † | | | | | | | | | | | 7,517 | | | | 408,549 | |
| | | | |
Halozyme Therapeutics Incorporated † | | | | | | | | | | | 13,024 | | | | 209,686 | |
| | | | |
Heron Therapeutics Incorporated † | | | | | | | | | | | 11,175 | | | | 273,117 | |
| | | | |
Inovio Pharmaceuticals Incorporated Ǡ | | | | | | | | | | | 32,454 | | | | 121,053 | |
| | | | |
Intercept Pharmaceuticals Incorporated † | | | | | | | | | | | 2,049 | | | | 229,201 | |
| | | | |
Ligand Pharmaceuticals Incorporated † | | | | | | | | | | | 2,208 | | | | 277,568 | |
| | | | |
Pfenex Incorporated † | | | | | | | | | | | 26,209 | | | | 161,972 | |
| | | | |
REGENXBIO Incorporated † | | | | | | | | | | | 4,345 | | | | 249,012 | |
The accompanying notes are an integral part of these financial statements.
| | | | | | |
| Portfolio of investments—March 31, 2019 | | Wells Fargo Disciplined Small Cap Fund | | | 15 | |
| | | | | | | | | | | | | | | | |
| Security name | | | | | | | | Shares | | | Value | |
| | | | |
| Biotechnology(continued) | | | | | | | | | | | | | | | | |
| | | | |
Repligen Corporation † | | | | | | | | | | | 2,076 | | | $ | 122,650 | |
| | | | |
Rigel Pharmaceuticals Incorporated † | | | | | | | | | | | 76,575 | | | | 196,798 | |
| | | | |
Sangamo Therapeutics Incorporated † | | | | | | | | | | | 12,277 | | | | 117,123 | |
| | | | |
Spectrum Pharmaceuticals Incorporated † | | | | | | | | | | | 4,382 | | | | 46,844 | |
| | | | |
Ultragenyx Pharmaceutical Incorporated † | | | | | | | | | | | 1,843 | | | | 127,830 | |
| | | | |
Vanda Pharmaceuticals Incorporated † | | | | | | | | | | | 11,465 | | | | 210,956 | |
| | | | |
Vericel Corporation † | | | | | | | | | | | 15,760 | | | | 275,958 | |
| | | | |
| | | | | | | | | | | | | | | 4,434,416 | |
| | | | | | | | | | | | | | | | |
| | | | |
| Health Care Equipment & Supplies: 3.40% | | | | | | | | | | | | | | | | |
| | | | |
Globus Medical Incorporated Class A † | | | | | | | | | | | 7,061 | | | | 348,884 | |
| | | | |
Haemonetics Corporation † | | | | | | | | | | | 2,569 | | | | 224,736 | |
| | | | |
Inogen Incorporated † | | | | | | | | | | | 2,768 | | | | 263,984 | |
| | | | |
Merit Medical Systems Incorporated † | | | | | | | | | | | 7,736 | | | | 478,317 | |
| | | | |
Novocure Limited † | | | | | | | | | | | 6,313 | | | | 304,097 | |
| | | | |
Orthofix Medical Incorporated † | | | | | | | | | | | 4,014 | | | | 226,430 | |
| | | | |
Seaspine Holdings Corporation † | | | | | | | | | | | 16,275 | | | | 245,427 | |
| | | | |
STAAR Surgical Company † | | | | | | | | | | | 9,332 | | | | 319,061 | |
| | | | |
Wright Medical Group NV † | | | | | | | | | | | 9,531 | | | | 299,750 | |
| | | | |
| | | | | | | | | | | | | | | 2,710,686 | |
| | | | | | | | | | | | | | | | |
| | | | |
| Health Care Providers & Services: 2.77% | | | | | | | | | | | | | | | | |
| | | | |
Amedisys Incorporated † | | | | | | | | | | | 2,589 | | | | 319,120 | |
| | | | |
BioTelemetry Incorporated † | | | | | | | | | | | 6,720 | | | | 420,806 | |
| | | | |
Centene Corporation † | | | | | | | | | | | 5,904 | | | | 313,502 | |
| | | | |
Encompass Health Corporation | | | | | | | | | | | 4,172 | | | | 243,645 | |
| | | | |
Ensign Group Incorporated | | | | | | | | | | | 8,997 | | | | 460,556 | |
| | | | |
Magellan Health Services Incorporated † | | | | | | | | | | | 1,342 | | | | 88,465 | |
| | | | |
R1 RCM Incorporated † | | | | | | | | | | | 37,153 | | | | 359,270 | |
| | | | |
| | | | | | | | | | | | | | | 2,205,364 | |
| | | | | | | | | | | | | | | | |
| | | | |
| Health Care Technology: 0.32% | | | | | | | | | | | | | | | | |
| | | | |
Omnicell Incorporated † | | | | | | | | | | | 3,111 | | | | 251,493 | |
| | | | | | | | | | | | | | | | |
| | | | |
| Life Sciences Tools & Services: 0.70% | | | | | | | | | | | | | | | | |
| | | | |
Medpace Holdings Incorporated † | | | | | | | | | | | 4,733 | | | | 279,105 | |
| | | | |
PRA Health Sciences Incorporated † | | | | | | | | | | | 2,519 | | | | 277,821 | |
| | | | |
| | | | | | | | | | | | | | | 556,926 | |
| | | | | | | | | | | | | | | | |
| | | | |
| Pharmaceuticals: 2.75% | | | | | | | | | | | | | | | | |
| | | | |
ANI Pharmaceuticals Incorporated † | | | | | | | | | | | 3,909 | | | | 275,741 | |
| | | | |
Catalent Incorporated † | | | | | | | | | | | 8,633 | | | | 350,413 | |
| | | | |
Horizon Pharma plc † | | | | | | | | | | | 21,581 | | | | 570,386 | |
| | | | |
Intersect ENT Incorporated † | | | | | | | | | | | 8,361 | | | | 268,806 | |
| | | | |
Mallinckrodt plc † | | | | | | | | | | | 14,722 | | | | 320,056 | |
| | | | |
Supernus Pharmaceuticals Incorporated † | | | | | | | | | | | 11,578 | | | | 405,693 | |
| | | | |
| | | | | | | | | | | | | | | 2,191,095 | |
| | | | | | | | | | | | | | | | |
The accompanying notes are an integral part of these financial statements.
| | | | |
| 16 | | Wells Fargo Disciplined Small Cap Fund | | Portfolio of investments—March 31, 2019 |
| | | | | | | | | | | | | | | | |
| Security name | | | | | | | | Shares | | | Value | |
| | | | |
Industrials: 14.90% | | | | | | | | | | | | | | | | |
| | | | |
| Aerospace & Defense: 0.78% | | | | | | | | | | | | | | | | |
| | | | |
Ducommun Incorporated † | | | | | | | | | | | 5,320 | | | $ | 231,526 | |
| | | | |
Moog Incorporated Class A | | | | | | | | | | | 4,472 | | | | 388,840 | |
| | | | |
| | | | | | | | | | | | | | | 620,366 | |
| | | | | | | | | | | | | | | | |
| | | | |
| Airlines: 0.61% | | | | | | | | | | | | | | | | |
| | | | |
SkyWest Incorporated | | | | | | | | | | | 9,002 | | | | 488,719 | |
| | | | | | | | | | | | | | | | |
| | | | |
| Building Products: 0.77% | | | | | | | | | | | | | | | | |
| | | | |
Builders FirstSource Incorporated † | | | | | | | | | | | 14,693 | | | | 196,005 | |
| | | | |
CSW Industrials Incorporated † | | | | | | | | | | | 5,013 | | | | 287,195 | |
| | | | |
NCI Building Systems Incorporated † | | | | | | | | | | | 7,809 | | | | 48,103 | |
| | | | |
Patrick Industries Incorporated † | | | | | | | | | | | 1,857 | | | | 84,159 | |
| | | | |
| | | | | | | | | | | | | | | 615,462 | |
| | | | | | | | | | | | | | | | |
| | | | |
| Commercial Services & Supplies: 2.67% | | | | | | | | | | | | | | | | |
| | | | |
Ennis Incorporated | | | | | | | | | | | 11,521 | | | | 239,176 | |
| | | | |
Knoll Incorporated | | | | | | | | | | | 13,645 | | | | 258,027 | |
| | | | |
McGrath RentCorp | | | | | | | | | | | 7,270 | | | | 411,264 | |
| | | | |
Tetra Tech Incorporated | | | | | | | | | | | 9,422 | | | | 561,457 | |
| | | | |
UniFirst Corporation | | | | | | | | | | | 895 | | | | 137,383 | |
| | | | |
Viad Corporation | | | | | | | | | | | 9,227 | | | | 519,388 | |
| | | | |
| | | | | | | | | | | | | | | 2,126,695 | |
| | | | | | | | | | | | | | | | |
| | | | |
| Construction & Engineering: 2.23% | | | | | | | | | | | | | | | | |
| | | | |
Ameresco Incorporated Class A † | | | | | | | | | | | 15,844 | | | | 256,356 | |
| | | | |
Comfort Systems Incorporated | | | | | | | | | | | 4,537 | | | | 237,693 | |
| | | | |
EMCOR Group Incorporated | | | | | | | | | | | 7,899 | | | | 577,259 | |
| | | | |
MasTec Incorporated † | | | | | | | | | | | 8,770 | | | | 421,837 | |
| | | | |
Primoris Services Corporation | | | | | | | | | | | 9,365 | | | | 193,668 | |
| | | | |
Sterling Construction Company Incorporated † | | | | | | | | | | | 7,087 | | | | 88,729 | |
| | | | |
| | | | | | | | | | | | | | | 1,775,542 | |
| | | | | | | | | | | | | | | | |
| | | | |
| Electrical Equipment: 1.29% | | | | | | | | | | | | | | | | |
| | | | |
Atkore International Incorporated † | | | | | | | | | | | 19,282 | | | | 415,141 | |
| | | | |
Encore Wire Corporation | | | | | | | | | | | 5,592 | | | | 319,974 | |
| | | | |
EnerSys | | | | | | | | | | | 4,422 | | | | 288,138 | |
| | | | |
| | | | | | | | | | | | | | | 1,023,253 | |
| | | | | | | | | | | | | | | | |
| | | | |
| Electronic Equipment, Instruments & Components: 0.47% | | | | | | | | | | | | | | | | |
| | | | |
ScanSource Incorporated † | | | | | | | | | | | 10,404 | | | | 372,671 | |
| | | | | | | | | | | | | | | | |
| | | | |
| Machinery: 2.71% | | | | | | | | | | | | | | | | |
| | | | |
EnPro Industries Incorporated | | | | | | | | | | | 4,401 | | | | 283,644 | |
| | | | |
Global Brass & Copper Holdings Incorporated | | | | | | | | | | | 10,018 | | | | 345,020 | |
| | | | |
Kadant Incorporated | | | | | | | | | | | 3,215 | | | | 282,791 | |
| | | | |
Kennametal Incorporated | | | | | | | | | | | 12,073 | | | | 443,683 | |
| | | | |
Meritor Incorporated † | | | | | | | | | | | 23,837 | | | | 485,083 | |
The accompanying notes are an integral part of these financial statements.
| | | | | | |
| Portfolio of investments—March 31, 2019 | | Wells Fargo Disciplined Small Cap Fund | | | 17 | |
| | | | | | | | | | | | | | | | |
| Security name | | | | | | | | Shares | | | Value | |
| | | | |
| Machinery(continued) | | | | | | | | | | | | | | | | |
| | | | |
Park Ohio Holdings Corporation | | | | | | | | | | | 9,867 | | | $ | 319,493 | |
| | | | |
| | | | | | | | | | | | | | | 2,159,714 | |
| | | | | | | | | | | | | | | | |
| | | | |
| Professional Services: 1.57% | | | | | | | | | | | | | | | | |
| | | | |
BG Staffing Incorporated | | | | | | | | | | | 7,877 | | | | 172,034 | |
| | | | |
CBIZ Incorporated † | | | | | | | | | | | 7,806 | | | | 157,993 | |
| | | | |
Insperity Incorporated | | | | | | | | | | | 4,151 | | | | 513,313 | |
| | | | |
TriNet Group Incorporated † | | | | | | | | | | | 6,760 | | | | 403,842 | |
| | | | |
| | | | | | | | | | | | | | | 1,247,182 | |
| | | | | | | | | | | | | | | | |
| | | | |
| Road & Rail: 0.38% | | | | | | | | | | | | | | | | |
| | | | |
Covenant Transport Incorporated Class A † | | | | | | | | | | | 5,991 | | | | 113,709 | |
| | | | |
USA Truck Incorporated † | | | | | | | | | | | 13,262 | | | | 191,503 | |
| | | | |
| | | | | | | | | | | | | | | 305,212 | |
| | | | | | | | | | | | | | | | |
| | | | |
| Trading Companies & Distributors: 1.42% | | | | | | | | | | | | | | | | |
| | | | |
Applied Industrial Technologies Incorporated | | | | | | | | | | | 5,777 | | | | 343,558 | |
| | | | |
DXP Enterprises Incorporated † | | | | | | | | | | | 11,009 | | | | 428,470 | |
| | | | |
Rush Enterprises Incorporated | | | | | | | | | | | 8,513 | | | | 355,929 | |
| | | | |
| | | | | | | | | | | | | | | 1,127,957 | |
| | | | | | | | | | | | | | | | |
| | | | |
Information Technology: 16.19% | | | | | | | | | | | | | | | | |
| | | | |
| Communications Equipment: 1.40% | | | | | | | | | | | | | | | | |
| | | | |
Ciena Corporation † | | | | | | | | | | | 13,208 | | | | 493,187 | |
| | | | |
Extreme Networks Incorporated † | | | | | | | | | | | 38,305 | | | | 286,904 | |
| | | | |
Quantenna Communications Incorporated † | | | | | | | | | | | 13,702 | | | | 333,370 | |
| | | | |
| | | | | | | | | | | | | | | 1,113,461 | |
| | | | | | | | | | | | | | | | |
| | | | |
| Electronic Equipment, Instruments & Components: 3.15% | | | | | | | | | | | | | | | | |
| | | | |
Control4 Corporation † | | | | | | | | | | | 3,809 | | | | 64,486 | |
| | | | |
Fabrinet † | | | | | | | | | | | 7,549 | | | | 395,266 | |
| | | | |
Insight Enterprises Incorporated † | | | | | | | | | | | 5,647 | | | | 310,924 | |
| | | | |
Kemet Corporation | | | | | | | | | | | 13,970 | | | | 237,071 | |
| | | | |
Plexus Corporation † | | | | | | | | | | | 2,740 | | | | 167,003 | |
| | | | |
SYNNEX Corporation | | | | | | | | | | | 6,491 | | | | 619,176 | |
| | | | |
TTM Technologies Incorporated † | | | | | | | | | | | 27,279 | | | | 319,983 | |
| | | | |
Vishay Precision Group † | | | | | | | | | | | 11,645 | | | | 398,375 | |
| | | | |
| | | | | | | | | | | | | | | 2,512,284 | |
| | | | | | | | | | | | | | | | |
| | | | |
| IT Services: 4.95% | | | | | | | | | | | | | | | | |
| | | | |
CACI International Incorporated Class A † | | | | | | | | | | | 3,204 | | | | 583,192 | |
| | | | |
Cardtronics Incorporated Class A † | | | | | | | | | | | 9,161 | | | | 325,948 | |
| | | | |
CSG Systems International Incorporated | | | | | | | | | | | 9,633 | | | | 407,476 | |
| | | | |
EPAM Systems Incorporated † | | | | | | | | | | | 2,994 | | | | 506,375 | |
| | | | |
Evertec Incorporated | | | | | | | | | | | 10,834 | | | | 301,294 | |
| | | | |
MAXIMUS Incorporated | | | | | | | | | | | 5,606 | | | | 397,914 | |
| | | | |
Perficient Incorporated † | | | | | | | | | | | 14,305 | | | | 391,814 | |
| | | | |
The Trade Desk Incorporated † | | | | | | | | | | | 1,652 | | | | 327,013 | |
The accompanying notes are an integral part of these financial statements.
| | | | |
| 18 | | Wells Fargo Disciplined Small Cap Fund | | Portfolio of investments—March 31, 2019 |
| | | | | | | | | | | | | | | | |
| Security name | | | | | | | | Shares | | | Value | |
| | | | |
| IT Services(continued) | | | | | | | | | | | | | | | | |
| | | | |
Unisys Corporation † | | | | | | | | | | | 14,511 | | | $ | 169,343 | |
| | | | |
Virtusa Corporation † | | | | | | | | | | | 9,895 | | | | 528,888 | |
| | | | |
| | | | | | | | | | | | | | | 3,939,257 | |
| | | | | | | | | | | | | | | | |
| | | | |
| Semiconductors & Semiconductor Equipment: 2.09% | | | | | | | | | | | | | | | | |
| | | | |
Diodes Incorporated † | | | | | | | | | | | 6,399 | | | | 222,045 | |
| | | | |
Entegris Incorporated | | | | | | | | | | | 9,603 | | | | 342,731 | |
| | | | |
Ichor Holdings Limited Ǡ | | | | | | | | | | | 12,943 | | | | 292,253 | |
| | | | |
MKS Instruments Incorporated | | | | | | | | | | | 1,536 | | | | 142,925 | |
| | | | |
Rudolph Technologies Incorporated † | | | | | | | | | | | 3,740 | | | | 85,272 | |
| | | | |
Ultra Clean Holdings Incorporated † | | | | | | | | | | | 14,742 | | | | 152,580 | |
| | | | |
Xperi Corporation | | | | | | | | | | | 18,396 | | | | 430,466 | |
| | | | |
| | | | | | | | | | | | | | | 1,668,272 | |
| | | | | | | | | | | | | | | | |
| | | | |
| Software: 4.46% | | | | | | | | | | | | | | | | |
| | | | |
ACI Worldwide Incorporated † | | | | | | | | | | | 4,546 | | | | 149,427 | |
| | | | |
Amber Road Incorporated † | | | | | | | | | | | 27,718 | | | | 240,315 | |
| | | | |
American Software Incorporated Class A | | | | | | | | | | | 9,238 | | | | 110,394 | |
| | | | |
AppFolio Incorporated Class A † | | | | | | | | | | | 5,046 | | | | 400,652 | |
| | | | |
HubSpot Incorporated † | | | | | | | | | | | 1,400 | | | | 232,694 | |
| | | | |
J2 Global Incorporated | | | | | | | | | | | 7,606 | | | | 658,680 | |
| | | | |
New Relic Incorporated † | | | | | | | | | | | 2,715 | | | | 267,971 | |
| | | | |
Qualys Incorporated † | | | | | | | | | | | 1,298 | | | | 107,397 | |
| | | | |
SPS Commerce Incorporated † | | | | | | | | | | | 4,532 | | | | 480,664 | |
| | | | |
Upland Software Incorporated † | | | | | | | | | | | 4,783 | | | | 202,608 | |
| | | | |
Verint Systems Incorporated † | | | | | | | | | | | 11,640 | | | | 696,770 | |
| | | | |
| | | | | | | | | | | | | | | 3,547,572 | |
| | | | | | | | | | | | | | | | |
| | | | |
| Technology Hardware, Storage & Peripherals: 0.14% | | | | | | | | | | | | | | | | |
| | | | |
Immersion Corporation † | | | | | | | | | | | 13,289 | | | | 112,026 | |
| | | | | | | | | | | | | | | | |
| | | | |
Materials: 3.64% | | | | | | | | | | | | | | | | |
| | | | |
| Chemicals: 1.53% | | | | | | | | | | | | | | | | |
| | | | |
Ferro Corporation † | | | | | | | | | | | 6,643 | | | | 125,752 | |
| | | | |
Innospec Incorporated | | | | | | | | | | | 5,781 | | | | 481,846 | |
| | | | |
Kraton Performance Polymers Incorporated † | | | | | | | | | | | 4,029 | | | | 129,653 | |
| | | | |
PolyOne Corporation | | | | | | | | | | | 8,180 | | | | 239,756 | |
| | | | |
Trinseo SA | | | | | | | | | | | 5,358 | | | | 242,717 | |
| | | | |
| | | | | | | | | | | | | | | 1,219,724 | |
| | | | | | | | | | | | | | | | |
| | | | |
| Containers & Packaging: 0.55% | | | | | | | | | | | | | | | | |
| | | | |
Berry Global Group Incorporated † | | | | | | | | | | | 4,256 | | | | 229,271 | |
| | | | |
Greif Incorporated Class A | | | | | | | | | | | 4,979 | | | | 205,384 | |
| | | | |
| | | | | | | | | | | | | | | 434,655 | |
| | | | | | | | | | | | | | | | |
| | | | |
| Metals & Mining: 0.22% | | | | | | | | | | | | | | | | |
| | | | |
Suncoke Energy Incorporated † | | | | | | | | | | | 20,698 | | | | 175,726 | |
| | | | | | | | | | | | | | | | |
The accompanying notes are an integral part of these financial statements.
| | | | | | |
| Portfolio of investments—March 31, 2019 | | Wells Fargo Disciplined Small Cap Fund | | | 19 | |
| | | | | | | | | | | | | | | | |
| Security name | | | | | | | | Shares | | | Value | |
| | | | |
| Paper & Forest Products: 1.34% | | | | | | | | | | | | | | | | |
| | | | |
Boise Cascade Company | | | | | | | | | | | 5,698 | | | $ | 152,478 | |
| | | | |
Louisiana-Pacific Corporation | | | | | | | | | | | 13,776 | | | | 335,859 | |
| | | | |
Schweitzer-Mauduit International Incorporated | | | | | | | | | | | 5,695 | | | | 220,510 | |
| | | | |
Verso Corporation Class A † | | | | | | | | | | | 16,922 | | | | 362,469 | |
| | | | |
| | | | | | | | | | | | | | | 1,071,316 | |
| | | | | | | | | | | | | | | | |
| | | | |
Real Estate: 7.21% | | | | | | | | | | | | | | | | |
| | | | |
| Equity REITs: 6.33% | | | | | | | | | | | | | | | | |
| | | | |
Ashford Hospitality Trust Incorporated | | | | | | | | | | | 27,599 | | | | 131,095 | |
| | | | |
Catchmark Timber Trust Incorporated Class A | | | | | | | | | | | 30,163 | | | | 296,201 | |
| | | | |
CoreCivic Incorporated | | | | | | | | | | | 8,761 | | | | 170,401 | |
| | | | |
CyrusOne Incorporated | | | | | | | | | | | 7,451 | | | | 390,730 | |
| | | | |
Digital Realty Trust Incorporated | | | | | | | | | | | 4,369 | | | | 519,911 | |
| | | | |
Global Medical REIT Incorporated | | | | | | | | | | | 28,229 | | | | 277,209 | |
| | | | |
NexPoint Residential Trust Incorporated | | | | | | | | | | | 9,801 | | | | 375,770 | |
| | | | |
Piedmont Office Realty Trust Incorporated Class A | | | | | | | | | | | 21,838 | | | | 455,322 | |
| | | | |
Preferred Apartment Communities Incorporated Class A | | | | | | | | | | | 29,803 | | | | 441,680 | |
| | | | |
Ryman Hospitality Properties Incorporated | | | | | | | | | | | 7,995 | | | | 657,509 | |
| | | | |
STAG Industrial Incorporated | | | | | | | | | | | 16,335 | | | | 484,333 | |
| | | | |
Tier Incorporated | | | | | | | | | | | 11,906 | | | | 341,226 | |
| | | | |
Xenia Hotels & Resorts Incorporated | | | | | | | | | | | 22,517 | | | | 493,347 | |
| | | | |
| | | | | | | | | | | | | | | 5,034,734 | |
| | | | | | | | | | | | | | | | |
| | | | |
| Real Estate Management & Development: 0.88% | | | | | | | | | | | | | | | | |
| | | | |
Kennedy Wilson Holdings Incorporated | | | | | | | | | | | 15,244 | | | | 326,069 | |
| | | | |
Newmark Group Incorporated Class A | | | | | | | | | | | 45,239 | | | | 377,293 | |
| | | | |
| | | | | | | | | | | | | | | 703,362 | |
| | | | | | | | | | | | | | | | |
| | | | |
Utilities: 3.44% | | | | | | | | | | | | | | | | |
| | | | |
| Electric Utilities: 2.43% | | | | | | | | | | | | | | | | |
| | | | |
IDACORP Incorporated | | | | | | | | | | | 4,254 | | | | 423,443 | |
| | | | |
Otter Tail Corporation | | | | | | | | | | | 8,704 | | | | 433,633 | |
| | | | |
PNM Resources Incorporated | | | | | | | | | | | 6,122 | | | | 289,815 | |
| | | | |
Portland General Electric Company | | | | | | | | | | | 10,822 | | | | 561,012 | |
| | | | |
Spark Energy Incorporated Class A | | | | | | | | | | | 25,063 | | | | 223,311 | |
| | | | |
| | | | | | | | | | | | | | | 1,931,214 | |
| | | | | | | | | | | | | | | | |
| | | | |
| Gas Utilities: 0.50% | | | | | | | | | | | | | | | | |
| | | | |
Southwest Gas Corporation | | | | | | | | | | | 4,791 | | | | 394,108 | |
| | | | | | | | | | | | | | | | |
| | | | |
| Independent Power & Renewable Electricity Producers: 0.32% | | | | | | | | | | | | | | | | |
| | | | |
Clearway Energy Incorporated | | | | | | | | | | | 17,774 | | | | 258,438 | |
| | | | | | | | | | | | | | | | |
| | | | |
| Water Utilities: 0.19% | | | | | | | | | | | | | | | | |
| | | | |
Consolidated Water Company | | | | | | | | | | | 12,018 | | | | 154,672 | |
| | | | | | | | | | | | | | | | |
| | | | |
Total Common Stocks (Cost $81,667,238) | | | | | | | | | | | | | | | 78,778,493 | |
| | | | | | | | | | | | | | | | |
The accompanying notes are an integral part of these financial statements.
| | | | |
| 20 | | Wells Fargo Disciplined Small Cap Fund | | Portfolio of investments—March 31, 2019 |
| | | | | | | | | | | | | | | | |
| Security name | | Yield | | | | | | Shares | | | Value | |
|
Short-Term Investments: 1.90% | |
|
| Investment Companies: 1.74% | |
| | | | |
Securities Lending Cash Investments LLC (l)(r)(u) | | | 2.55 | % | | | | | | | 533,068 | | | $ | 533,142 | |
| | | | |
Wells Fargo Government Money Market Fund Select Class (l)(u) | | | 2.38 | | | | | | | | 849,992 | | | | 849,992 | |
| | | | |
| | | | | | | | | | | | | | | 1,383,134 | |
| | | | | | | | | | | | | | | | |
| | | | |
| | | | | | Maturity date | | | Principal | | | | |
|
| U.S. Treasury Securities: 0.16% | |
| | | | |
Treasury Bill (z)# | | | 2.44 | | | | 7-5-2019 | | | $ | 130,000 | | | | 129,189 | |
| | | | | | | | | | | | | | | | |
| |
Total Short-Term Investments (Cost $1,512,294) | | | | 1,512,323 | |
| | | | | | | | | | | | | | | | |
| | | | | | | | |
| Total investments in securities (Cost $83,179,532) | | | 100.85 | % | | | 80,290,816 | |
| | |
Other assets and liabilities, net | | | (0.85 | ) | | | (673,856 | ) |
| | | | | | | | |
| Total net assets | | | 100.00 | % | | $ | 79,616,960 | |
| | | | | | | | |
| † | Non-income-earning security |
| « | All or a portion of this security is on loan. |
| (l) | The issuer of the security is an affiliated person of the Fund as defined in the Investment Company Act of 1940. |
| (r) | The investment is anon-registered investment company purchased with cash collateral received from securities on loan. |
| (u) | The rate represents the7-day annualized yield at period end. |
| (z) | Zero coupon security. The rate represents the current yield to maturity. |
| # | All or a portion of this security is segregated as collateral for investments in derivative instruments. |
Abbreviations:
| REIT | Real estate investment trust |
Futures Contracts
| | | | | | | | | | | | | | | | | | | | | | | | |
| Description | | Number of
contracts | | | Expiration
date | | | Notional
cost | | | Notional
value | | | Unrealized
gains | | | Unrealized
losses | |
| | | | | | |
Long | | | | | | | | | | | | | | | | | | | | | | | | |
| | | | | | |
Russell 2000E-Mini Index | | | 8 | | | | 6-21-2019 | | | $ | 621,444 | | | $ | 617,520 | | | $ | 0 | | | $ | (3,924 | ) |
Investments in Affiliates
An affiliated investment is an investment in which the Fund owns at least 5% of the outstanding voting shares of the issuer or as a result of other relationships, such as the Fund and the issuer having the same investment manager. Transactions with issuers that were either affiliated persons of the Fund at the beginning of the period or the end of the period were as follows:
| | | | | | | | | | | | | | | | | | | | | | | | | | | | | | | | | | | | |
| | | Shares,
beginning of
period | | | Shares
purchased | | | Shares
sold | | | Shares,
end of
period | | | Net
realized
gains
(losses) | | | Net
change in
unrealized
gains
(losses) | | | Income
from
affiliated
securities | | | Value,
end
of period | | | % of
net
assets | |
Short-Term Investments | | | | | | | | | | | | | | | | | | | | | | | | | | | | | | | | | | | | |
Investment Companies | | | | | | | | | | | | | | | | | | | | | | | | | | | | | | | | | | | | |
Securities Lending Cash Investments LLC | | | 13,754,682 | | | | 55,235,285 | | | | 68,456,899 | | | | 533,068 | | | $ | 0 | | | $ | 0 | | | $ | 97,828 | | | $ | 533,142 | | | | | |
Wells Fargo Government Money Market Fund Select Class | | | 14,793,357 | | | | 49,632,418 | | | | 63,575,783 | | | | 849,992 | | | | 0 | | | | 0 | | | | 73,626 | | | | 849,992 | | | | | |
| | | | | | | | | | | | | | | | | | | | | | | | | | | | | | | | | | | | |
| | | | | | | | | |
| | | | | | | | | | | | | | | | | | $ | 0 | | | $ | 0 | | | $ | 171,454 | | | $ | 1,383,134 | | | | 1.74 | % |
| | | | | | | | | | | | | | | | | | | | | | | | | | | | | | | | | | | | |
The accompanying notes are an integral part of these financial statements.
| | | | | | |
| Statement of assets and liabilities—March 31, 2019 | | Wells Fargo Disciplined Small Cap Fund | | | 21 | |
| | | | |
| | | | |
| |
Assets | | | | |
Investments in unaffiliated securities (including $525,426 of securities loaned), at value (cost $81,796,398) | | $ | 78,907,682 | |
Investments in affiliated securities, at value (cost $1,383,134) | | | 1,383,134 | |
Cash | | | 2,927 | |
Receivable for Fund shares sold | | | 52,071 | |
Receivable for dividends | | | 76,161 | |
Receivable for daily variation margin on open futures contracts | | | 1,440 | |
Receivable for securities lending income | | | 57 | |
Prepaid expenses and other assets | | | 30,859 | |
| | | | |
Total assets | | | 80,454,331 | |
| | | | |
| |
Liabilities | | | | |
Payable upon receipt of securities loaned | | | 531,851 | |
Payable for Fund shares redeemed | | | 214,918 | |
Management fee payable | | | 15,081 | |
Administration fees payable | | | 8,597 | |
Trustees’ fees and expenses payable | | | 1,912 | |
Accrued expenses and other liabilities | | | 65,012 | |
| | | | |
Total liabilities | | | 837,371 | |
| | | | |
Total net assets | | $ | 79,616,960 | |
| | | | |
| |
NET ASSETS CONSIST OF | | | | |
Paid-in capital | | $ | 84,999,865 | |
Total distributable loss | | | (5,382,905 | ) |
| | | | |
Total net assets | | $ | 79,616,960 | |
| | | | |
| |
COMPUTATION OF NET ASSET VALUE AND OFFERING PRICE PER SHARE1 | | | | |
Net assets – Class A | | $ | 34,499 | |
Shares outstanding – Class A1 | | | 4,114 | |
Net asset value per share – Class A | | | $8.39 | |
Maximum offering price per share – Class A2 | | | $8.90 | |
Net assets – Class R6 | | $ | 4,013,530 | |
Shares outstanding – Class R61 | | | 472,030 | |
Net asset value per share – Class R6 | | | $8.50 | |
Net assets – Administrator Class | | $ | 49,911,392 | |
Shares outstanding – Administrator Class1 | | | 5,941,030 | |
Net asset value per share – Administrator Class | | | $8.40 | |
Net assets – Institutional Class | | $ | 25,657,539 | |
Shares outstanding – Institutional Class1 | | | 3,024,737 | |
Net asset value per share – Institutional Class | | | $8.48 | |
| 1 | The Fund has an unlimited number of authorized shares. |
| 2 | Maximum offering price is computed as 100/94.25 of net asset value. On investments of $50,000 or more, the offering price is reduced. |
The accompanying notes are an integral part of these financial statements.
| | | | |
| 22 | | Wells Fargo Disciplined Small Cap Fund | | Statement of operations—year ended March 31, 2019 |
| | | | |
| | | | |
| |
Investment income | | | | |
Dividends (net of foreign withholding taxes of $1,600) | | $ | 1,463,483 | |
Income from affiliated securities | | | 113,864 | |
| | | | |
Total investment income | | | 1,577,347 | |
| | | | |
| |
Expenses | | | | |
Management fee | | | 859,735 | |
Administration fees | | | | |
Class A | | | 41 | 1 |
Class R6 | | | 3,999 | |
Administrator Class | | | 97,776 | |
Institutional Class | | | 68,899 | |
Shareholder servicing fees | | | | |
Class A | | | 48 | 1 |
Administrator Class | | | 186,592 | |
Custody and accounting fees | | | 19,480 | |
Professional fees | | | 46,392 | |
Registration fees | | | 73,526 | |
Shareholder report expenses | | | 39,777 | |
Trustees’ fees and expenses | | | 22,693 | |
Other fees and expenses | | | 12,688 | |
| | | | |
Total expenses | | | 1,431,646 | |
Less: Fee waivers and/or expense reimbursements | | | (255,682 | ) |
| | | | |
Net expenses | | | 1,175,964 | |
| | | | |
Net investment income | | | 401,383 | |
| | | | |
| |
REALIZED AND UNREALIZED GAINS (LOSSES) ON INVESTMENTS | | | | |
| |
Net realized gains (losses) on: | | | | |
Unaffiliated securities | | | 28,906,757 | |
Futures contracts | | | (296,940 | ) |
| | | | |
Net realized gains on investments | | | 28,609,817 | |
| | | | |
| |
Net change in unrealized gains (losses) on: | | | | |
Unaffiliated securities | | | (38,974,894 | ) |
Futures contracts | | | (3,924 | ) |
| | | | |
Net change in unrealized gains (losses) on investments | | | (38,978,818 | ) |
| | | | |
Net realized and unrealized gains (losses) on investments | | | (10,369,001 | ) |
| | | | |
Net decrease in net assets resulting from operations | | $ | (9,967,618 | ) |
| | | | |
| 1 | For the period from July 31, 2018 (commencement of class operations) to March 31, 2019 |
The accompanying notes are an integral part of these financial statements.
| | | | | | |
| Statement of changes in net assets | | Wells Fargo Disciplined Small Cap Fund | | | 23 | |
| | | | | | | | | | | | | | | | |
| | | Year ended
March 31, 2019 | | | Year ended
March 31, 20181 | |
| | | | |
Operations | | | | | | | | | | | | | | | | |
Net investment income | | | | | | $ | 401,383 | | | | | | | $ | 502,956 | |
Net realized gains on investments | | | | | | | 28,609,817 | | | | | | | | 54,267,385 | |
Net change in unrealized gains (losses) on investments | | | | | | | (38,978,818 | ) | | | | | | | (28,401,505 | ) |
| | | | |
Net increase (decrease) in net assets resulting from operations | | | | | | | (9,967,618 | ) | | | | | | | 26,368,836 | |
| | | | |
| | | | |
Distributions to shareholders from net investment income and net realized gains | | | | | | | | | | | | | | | | |
Class A | | | | | | | (23,529 | )2 | | | | | | | N/A | |
Class R6 | | | | | | | (4,570,209 | ) | | | | | | | (265,386 | ) |
Administrator Class | | | | | | | (37,650,733 | ) | | | | | | | (27,391,629 | ) |
Institutional Class | | | | | | | (22,694,010 | ) | | | | | | | (10,224,030 | ) |
| | | | |
Total distributions to shareholders | | | | | | | (64,938,481 | ) | | | | | | | (37,881,045 | ) |
| | | | |
| | | | |
Capital share transactions | | | Shares | | | | | | | | Shares | | | | | |
Proceeds from shares sold | | | | | | | | | | | | | | | | |
Class A | | | 2,960 | 2 | | | 51,409 | 2 | | | N/A | | | | N/A | |
Class R6 | | | 220,833 | | | | 4,395,129 | | | | 1,016,892 | �� | | | 23,696,710 | |
Administrator Class | | | 348,961 | | | | 5,660,352 | | | | 1,003,396 | | | | 24,583,627 | |
Institutional Class | | | 657,651 | | | | 12,223,841 | | | | 1,609,570 | | | | 39,079,106 | |
| | | | |
| | | | | | | 22,330,731 | | | | | | | | 87,359,443 | |
| | | | |
Reinvestment of distributions | | | | | | | | | | | | | | | | |
Class A | | | 1,361 | 2 | | | 10,912 | 2 | | | N/A | | | | N/A | |
Class R6 | | | 523,136 | | | | 4,271,599 | | | | 11,427 | | | | 261,336 | |
Administrator Class | | | 4,686,419 | | | | 37,625,033 | | | | 1,202,741 | | | | 27,387,299 | |
Institutional Class | | | 2,679,230 | | | | 21,773,661 | | | | 386,831 | | | | 8,839,448 | |
| | | | |
| | | | | | | 63,681,205 | | | | | | | | 36,488,083 | |
| | | | |
Payment for shares redeemed | | | | | | | | | | | | | | | | |
Class A | | | (207 | )2 | | | (1,692 | )2 | | | N/A | | | | N/A | |
Class R6 | | | (1,326,785 | ) | | | (24,323,015 | ) | | | (41,737 | ) | | | (978,591 | ) |
Administrator Class | | | (3,156,760 | ) | | | (42,530,327 | ) | | | (7,857,302 | ) | | | (184,787,406 | ) |
Institutional Class | | | (3,311,260 | ) | | | (47,808,217 | ) | | | (1,280,303 | ) | | | (30,434,668 | ) |
| | | | |
| | | | | | | (114,663,251 | ) | | | | | | | (216,200,665 | ) |
| | | | |
Net decrease in net assets resulting from capital share transactions | | | | | | | (28,651,315 | ) | | | | | | | (92,353,139 | ) |
| | | | |
Total decrease in net assets | | | | | | | (103,557,414 | ) | | | | | | | (103,865,348 | ) |
| | | | |
| | | | |
Net assets | | | | | | | | | | | | | | | | |
Beginning of period | | | | | | | 183,174,374 | | | | | | | | 287,039,722 | |
| | | | |
End of period | | | | | | $ | 79,616,960 | | | | | | | $ | 183,174,374 | |
| | | | |
| 1 | Effective for all filings after November 4, 2018, the SEC prospectively eliminated the requirement to parenthetically disclose undistributed net investment income at the end of the period and permitted the aggregation of distributions, with the exception of tax basis returns of capital. Undistributed net investment income at March 31, 2018 was $168,078. The disaggregated distributions information for the year ended March 31, 2018 is included in Note 7,Distributions to Shareholders,in the notes to the financial statements. |
| 2 | For the period from July 31, 2018 (commencement of class operations) to March 31, 2019 |
The accompanying notes are an integral part of these financial statements.
| | | | |
| 24 | | Wells Fargo Disciplined Small Cap Fund | | Financial highlights |
(For a share outstanding throughout each period)
| | | | |
| CLASS A | | Year ended
March 31, 20191 | |
Net asset value, beginning of period | | | $23.70 | |
Net investment income | | | 0.02 | |
Net realized and unrealized gains (losses) on investments | | | (3.37 | ) |
| | | | |
Total from investment operations | | | (3.35 | ) |
Distributions to shareholders from | | | | |
Net investment income | | | (0.04 | ) |
Net realized gains | | | (11.92 | ) |
| | | | |
Total distributions to shareholders | | | (11.96 | ) |
Net asset value, end of period | | | $8.39 | |
Total return2 | | | (11.52 | )% |
Ratios to average net assets (annualized) | | | | |
Gross expenses | | | 1.14 | % |
Net expenses | | | 0.92 | % |
Net investment income | | | 0.16 | % |
Supplemental data | | | | |
Portfolio turnover rate | | | 176 | % |
Net assets, end of period (000s omitted) | | | $34 | |
| 1 | For the period from July 31, 2018 (commencement of class operations) to March 31, 2019 |
| 2 | Total return calculations do not include any sales charges. Returns for periods of less than one year are not annualized. |
The accompanying notes are an integral part of these financial statements.
| | | | | | |
| Financial highlights | | Wells Fargo Disciplined Small Cap Fund | | | 25 | |
(For a share outstanding throughout each period)
| | | | | | | | | | | | |
| | | Year ended March 31 | |
| CLASS R6 | | 2019 | | | 2018 | | | 20171 | |
Net asset value, beginning of period | | | $22.63 | | | | $23.82 | | | | $22.43 | |
Net investment income | | | 0.06 | | | | 0.07 | | | | 0.14 | |
Net realized and unrealized gains (losses) on investments | | | (2.19 | ) | | | 2.08 | | | | 3.32 | |
| | | | | | | | | | | | |
Total from investment operations | | | (2.13 | ) | | | 2.15 | | | | 3.46 | |
Distributions to shareholders from | | | | | | | | | | | | |
Net investment income | | | (0.08 | ) | | | (0.06 | ) | | | (0.14 | ) |
Net realized gains | | | (11.92 | ) | | | (3.28 | ) | | | (1.93 | ) |
| | | | | | | | | | | | |
Total distributions to shareholders | | | (12.00 | ) | | | (3.34 | ) | | | (2.07 | ) |
Net asset value, end of period | | | $8.50 | | | | $22.63 | | | | $23.82 | |
Total return2 | | | (6.75 | )% | | | 8.95 | % | | | 15.63 | % |
Ratios to average net assets (annualized) | | | | | | | | | | | | |
Gross expenses | | | 0.82 | % | | | 1.06 | % | | | 0.92 | % |
Net expenses | | | 0.64 | % | | | 0.85 | % | | | 0.85 | % |
Net investment income | | | 0.48 | % | | | 0.14 | % | | | 0.67 | % |
Supplemental data | | | | | | | | | | | | |
Portfolio turnover rate | | | 176 | % | | | 48 | % | | | 73 | % |
Net assets, end of period (000s omitted) | | | $4,014 | | | | $23,871 | | | | $1,626 | |
| 1 | For the period from October 31, 2016 (commencement of class operations) to March 31, 2017 |
| 2 | Return for periods of less than one year are not annualized. |
The accompanying notes are an integral part of these financial statements.
| | | | |
| 26 | | Wells Fargo Disciplined Small Cap Fund | | Financial highlights |
(For a share outstanding throughout each period)
| | | | | | | | | | | | | | | | | | | | |
| | | Year ended March 31 | |
| ADMINISTRATOR CLASS | | 2019 | | | 2018 | | | 2017 | | | 2016 | | | 2015 | |
Net asset value, beginning of period | | | $22.53 | | | | $23.79 | | | | $21.15 | | | | $25.19 | | | | $37.93 | |
Net investment income | | | 0.03 | 1 | | | 0.06 | | | | 0.08 | 1 | | | 0.06 | | | | 0.02 | |
Net realized and unrealized gains (losses) on investments | | | (2.21 | ) | | | 2.00 | | | | 4.56 | | | | (1.24 | ) | | | 3.13 | |
| | | | | | | | | | | | | | | | | | | | |
Total from investment operations | | | (2.18 | ) | | | 2.06 | | | | 4.64 | | | | (1.18 | ) | | | 3.15 | |
Distributions to shareholders from | | | | | | | | | | | | | | | | | | | | |
Net investment income | | | (0.03 | ) | | | (0.04 | ) | | | (0.07 | ) | | | (0.02 | ) | | | 0.00 | |
Net realized gains | | | (11.92 | ) | | | (3.28 | ) | | | (1.93 | ) | | | (2.84 | ) | | | (15.89 | ) |
| | | | | | | | | | | | | | | | | | | | |
Total distributions to shareholders | | | (11.95 | ) | | | (3.32 | ) | | | (2.00 | ) | | | (2.86 | ) | | | (15.89 | ) |
Net asset value, end of period | | | $8.40 | | | | $22.53 | | | | $23.79 | | | | $21.15 | | | | $25.19 | |
Total return | | | (7.01 | )% | | | 8.52 | % | | | 22.13 | % | | | (4.39 | )% | | | 11.75 | % |
Ratios to average net assets (annualized) | | | | | | | | | | | | | | | | | | | | |
Gross expenses | | | 1.13 | % | | | 1.30 | % | | | 1.28 | % | | | 1.29 | % | | | 1.24 | % |
Net expenses | | | 0.95 | % | | | 1.20 | % | | | 1.20 | % | | | 1.20 | % | | | 1.20 | % |
Net investment income | | | 0.16 | % | | | 0.12 | % | | | 0.36 | % | | | 0.25 | % | | | 0.06 | % |
Supplemental data | | | | | | | | | | | | | | | | | | | | |
Portfolio turnover rate | | | 176 | % | | | 48 | % | | | 73 | % | | | 59 | % | | | 60 | % |
Net assets, end of period (000s omitted) | | | $49,911 | | | | $91,506 | | | | $231,039 | | | | $264,560 | | | | $306,628 | |
| 1 | Calculated based upon average shares outstanding |
The accompanying notes are an integral part of these financial statements.
| | | | | | |
| Financial highlights | | Wells Fargo Disciplined Small Cap Fund | | | 27 | |
(For a share outstanding throughout each period)
| | | | | | | | | | | | | | | | | | | | |
| | | Year ended March 31 | |
| INSTITUTIONAL CLASS | | 2019 | | | 2018 | | | 2017 | | | 2016 | | | 20151 | |
Net asset value, beginning of period | | | $22.61 | | | | $23.82 | | | | $21.18 | | | | $25.22 | | | | $39.04 | |
Net investment income | | | 0.07 | 2 | | | 0.09 | | | | 0.09 | | | | 0.16 | 2 | | | 0.06 | |
Net realized and unrealized gains (losses) on investments | | | (2.22 | ) | | | 2.03 | | | | 4.61 | | | | (1.28 | ) | | | 2.01 | |
| | | | | | | | | | | | | | | | | | | | |
Total from investment operations | | | (2.15 | ) | | | 2.12 | | | | 4.70 | | | | (1.12 | ) | | | 2.07 | |
Distributions to shareholders from | | | | | | | | | | | | | | | | | | | | |
Net investment income | | | (0.06 | ) | | | (0.05 | ) | | | (0.13 | ) | | | (0.08 | ) | | | 0.00 | |
Net realized gains | | | (11.92 | ) | | | (3.28 | ) | | | (1.93 | ) | | | (2.84 | ) | | | (15.89 | ) |
| | | | | | | | | | | | | | | | | | | | |
Total distributions to shareholders | | | (11.98 | ) | | | (3.33 | ) | | | (2.06 | ) | | | (2.92 | ) | | | (15.89 | ) |
Net asset value, end of period | | | $8.48 | | | | $22.61 | | | | $23.82 | | | | $21.18 | | | | $25.22 | |
Total return3 | | | (6.79 | )% | | | 8.81 | % | | | 22.43 | % | | | (4.12 | )% | | | 8.68 | % |
Ratios to average net assets (annualized) | | | | | | | | | | | | | | | | | | | | |
Gross expenses | | | 0.89 | % | | | 1.07 | % | | | 1.03 | % | | | 1.05 | % | | | 0.92 | % |
Net expenses | | | 0.71 | % | | | 0.95 | % | | | 0.95 | % | | | 0.95 | % | | | 0.92 | % |
Net investment income | | | 0.41 | % | | | 0.37 | % | | | 0.56 | % | | | 0.71 | % | | | 0.59 | % |
Supplemental data | | | | | | | | | | | | | | | | | | | | |
Portfolio turnover rate | | | 176 | % | | | 48 | % | | | 73 | % | | | 59 | % | | | 60 | % |
Net assets, end of period (000s omitted) | | | $25,658 | | | | $67,798 | | | | $54,375 | | | | $263 | | | | $11 | |
| 1 | For the period from October 31, 2014 (commencement of class operations) to March 31, 2015 |
| 2 | Calculated based upon average shares outstanding |
| 3 | Returns for periods of less than one year are not annualized. |
The accompanying notes are an integral part of these financial statements.
| | | | |
| 28 | | Wells Fargo Disciplined Small Cap Fund | | Notes to financial statements |
1. ORGANIZATION
Wells Fargo Funds Trust (the “Trust”), a Delaware statutory trust organized on March 10, 1999, is anopen-end management investment company registered under the Investment Company Act of 1940, as amended (the “1940 Act”). As an investment company, the Trust follows the accounting and reporting guidance in Financial Accounting Standards Board (“FASB”) Accounting Standards Codification Topic 946, Financial Services – Investment Companies. These financial statements report on the Wells Fargo Disciplined Small Cap Fund (the “Fund”), (formerly, Wells Fargo Small Cap Opportunities Fund) which is a diversified series of the Trust.
2. SIGNIFICANT ACCOUNTING POLICIES
The following significant accounting policies, which are consistently followed in the preparation of the financial statements of the Fund, are in conformity with U.S. generally accepted accounting principles which require management to make estimates and assumptions that affect the reported amounts of assets and liabilities, disclosure of contingent assets and liabilities at the date of the financial statements, and the reported amounts of revenues and expenses during the reporting period. Actual results could differ from those estimates.
Securities valuation
All investments are valued each business day as of the close of regular trading on the New York Stock Exchange (generally 4 p.m. Eastern Time), although the Fund may deviate from this calculation time under unusual or unexpected circumstances.
Equity securities and futures contracts that are listed on a foreign or domestic exchange or market are valued at the official closing price or, if none, the last sales price. If no sale occurs on the principal exchange or market that day, a fair value price will be determined in accordance with the Fund’s Valuation Procedures.
The values of securities denominated in foreign currencies are translated into U.S. dollars at rates provided by an independent foreign currency pricing source at a time each business day specified by the Wells Fargo Asset Management Pricing Committee at Wells Fargo Funds Management, LLC (“Funds Management”).
Many securities markets and exchanges outside the U.S. close prior to the close of the New York Stock Exchange and therefore may not fully reflect trading or events that occur after the close of the principal exchange in which the foreign securities are traded, but before the close of the New York Stock Exchange. If such trading or events are expected to materially affect the value of such securities, then fair value pricing procedures approved by the Board of Trustees of the Fund are applied. These procedures take into account multiple factors including movements in U.S. securities markets after foreign exchanges close. Foreign securities that are fair valued under these procedures are categorized as Level 2 and the application of these procedures may result in transfers between Level 1 and Level 2. Depending on market activity, such fair valuations may be frequent. Such fair value pricing may result in net asset values that are higher or lower than net asset values based on the last reported sales price or latest quoted bid price. On March 31, 2019, such fair value pricing was not used in pricing foreign securities.
Investments in registeredopen-end investment companies are valued at net asset value. Interests innon-registered investment companies that are redeemable at net asset value are fair valued normally at net asset value.
Investments which are not valued using any of the methods discussed above are valued at their fair value, as determined in good faith by the Board of Trustees. The Board of Trustees has established a Valuation Committee comprised of the Trustees and has delegated to it the authority to take any actions regarding the valuation of portfolio securities that the Valuation Committee deems necessary or appropriate, including determining the fair value of portfolio securities, unless the determination has been delegated to the Wells Fargo Asset Management Pricing Committee. The Board of Trustees retains the authority to make or ratify any valuation decisions or approve any changes to the Valuation Procedures as it deems appropriate. On a quarterly basis, the Board of Trustees receives reports on any valuation actions taken by the Valuation Committee or the Wells Fargo Asset Management Pricing Committee which may include items for ratification.
Foreign currency translation
The accounting records of the Fund are maintained in U.S. dollars. The values of other assets and liabilities denominated in foreign currencies are translated into U.S. dollars at rates provided by an independent foreign currency pricing source at a time each business day specified by the Wells Fargo Asset Management Pricing Committee. Purchases and sales of securities, and income and expenses are converted at the rate of exchange on the respective dates of such transactions. Net realized foreign exchange gains or losses arise from sales of foreign currencies, currency gains or losses realized between the trade and settlement dates on securities transactions, and the difference between the amounts of dividends, interest and
| | | | | | |
| Notes to financial statements | | Wells Fargo Disciplined Small Cap Fund | | | 29 | |
foreign withholding taxes recorded and the U.S. dollar equivalent of the amounts actually paid or received. Net unrealized foreign exchange gains and losses arise from changes in the fair value of assets and liabilities other than investments in securities resulting from changes in exchange rates. The changes in net assets arising from changes in exchange rates of securities and the changes in net assets resulting from changes in market prices of securities are not separately presented. Such changes are included in net realized and unrealized gains or losses from investments.
Securities lending
The Fund may lend its securities from time to time in order to earn additional income in the form of fees or interest on securities received as collateral or the investment of any cash received as collateral. The Fund continues to receive interest or dividends on the securities loaned. The Fund receives collateral in the form of cash or securities with a value at least equal to the value of the securities on loan. The value of the loaned securities is determined at the close of each business day and any additional required collateral is delivered to the Fund on the next business day. In a securities lending transaction, the net asset value of the Fund will be affected by an increase or decrease in the value of the securities loaned and by an increase or decrease in the value of the instrument in which collateral is invested. The amount of securities lending activity undertaken by the Fund fluctuates from time to time. In the event of default or bankruptcy by the borrower, the Fund may be prevented from recovering the loaned securities or gaining access to the collateral or may experience delays or costs in doing so. In addition, the investment of any cash collateral received may lose all or part of its value. The Fund has the right under the lending agreement to recover the securities from the borrower on demand.
The Fund lends its securities through an unaffiliated securities lending agent. Cash collateral received in connection with its securities lending transactions is invested in Securities Lending Cash Investments, LLC (the “Securities Lending Fund”). The Securities Lending Fund is exempt from registration under Section 3(c)(7) of the 1940 Act and is managed by Funds Management and is subadvised by Wells Capital Management Incorporated (“WellsCap”), an affiliate of Funds Management and an indirect wholly owned subsidiary of Wells Fargo & Company (“Wells Fargo”). Funds Management receives an advisory fee starting at 0.05% and declining to 0.01% as the average daily net assets of the Securities Lending Fund increase. All of the fees received by Funds Management are paid to WellsCap for its services as subadviser. The Securities Lending Fund seeks to provide a positive return compared to the daily Fed Funds Open Rate by investing in high-quality, U.S. dollar-denominated short-term money market instruments. Securities Lending Fund investments are valued at the evaluated bid price provided by an independent pricing service. Income earned from investment in the Securities Lending Fund (net of fees and rebates), if any, is included in income from affiliated securities on the Statement of Operations.
Futures contracts
The Fund is subject to equity price risk in the normal course of pursuing its investment objectives. Futures contracts are agreements between the Fund and a counterparty to buy or sell a specific amount of a commodity, financial instrument or currency at specified price and on a specified date. The Fund may buy and sell futures contracts in order to gain exposure to, or protect against, changes in security values. The primary risks associated with the use of futures contracts are the imperfect correlation between changes in market values of securities held by the Fund and the prices of futures contracts, and the possibility of an illiquid market. Futures contracts are generally entered into on a regulated futures exchange and cleared through a clearinghouse associated with the exchange. With futures contracts, there is minimal counterparty risk to the Fund since futures contracts are exchange traded and the exchange’s clearinghouse, as counterparty to all exchange traded futures, guarantees the futures contracts against default.
Upon entering into a futures contracts, the Fund is required to deposit either cash or securities (initial margin) with the broker in an amount equal to a certain percentage of the contract value. Subsequent payments (variation margin) are paid to or from the broker each day equal to the daily changes in the contract value. Such payments are recorded as unrealized gains or losses and, if any, shown as variation margin receivable (payable) in the Statement of Assets and Liabilities. Should the Fund fail to make requested variation margin payments, the broker can gain access to the initial margin to satisfy the Fund’s payment obligations. When the contracts are closed, a realized gain or loss is recorded in the Statement of Operations.
Security transactions and income recognition
Securities transactions are recorded on a trade date basis. Realized gains or losses are recorded on the basis of identified cost.
Dividend income is recognized on the ex-dividend date, except for certain dividends from foreign securities, which are recorded as soon as the custodian verifies the ex-dividend date. Dividend income from foreign securities is recorded net of foreign taxes withheld where recovery of such taxes is not assured.
| | | | |
| 30 | | Wells Fargo Disciplined Small Cap Fund | | Notes to financial statements |
Income dividends and capital gain distributions from investment companies are recorded on theex-dividend date. Capital gain distributions from investment companies are treated as realized gains.
Distributions to shareholders
Distributions to shareholders from net investment income and any net realized gains are recorded on theex-dividend date and paid at least annually. Such distributions are determined in accordance with income tax regulations and may differ from U.S. generally accepted accounting principles. Dividend sources are estimated at the time of declaration. The tax character of distributions is determined as of the Fund’s fiscal year end. Therefore, a portion of the Fund’s distributions made prior to the Fund’s fiscal year end may be categorized as a tax return of capital at year end.
Federal and other taxes
The Fund intends to continue to qualify as a regulated investment company by distributing substantially all of its investment company taxable income and any net realized capital gains (after reduction for capital loss carryforwards) sufficient to relieve it from all, or substantially all, federal income taxes. Accordingly, no provision for federal income taxes was required.
The Fund’s income and federal excise tax returns and all financial records supporting those returns for the prior three fiscal years are subject to examination by the federal and Delaware revenue authorities. Management has analyzed the Fund’s tax positions taken on federal, state, and foreign tax returns for all open tax years and does not believe that there are any uncertain tax positions that require recognition of a tax liability.
As of March 31, 2019, the aggregate cost of all investments for federal income tax purposes was $83,780,500 and the unrealized gains (losses) consisted of:
| | | | |
| |
Gross unrealized gains | | $ | 5,766,477 | |
| |
Gross unrealized losses | | | (9,260,085 | ) |
| |
Net unrealized losses | | $ | (3,493,608 | ) |
As of March 31, 2019, the Fund had current year net deferred post-October capital losses consisting of $1,969,221 in short-term losses which will be recognized on the first day of the following fiscal year.
Class allocations
The separate classes of shares offered by the Fund differ principally in applicable sales charges, shareholder servicing, and administration fees. Class specific expenses are charged directly to that share class. Investment income, common expenses, and realized and unrealized gains (losses) on investments are allocated daily to each class of shares based on the relative proportion of net assets of each class.
3. FAIR VALUATION MEASUREMENTS
Fair value measurements of investments are determined within a framework that has established a fair value hierarchy based upon the various data inputs utilized in determining the value of the Fund’s investments. The three-level hierarchy gives the highest priority to unadjusted quoted prices in active markets for identical assets or liabilities (Level 1) and the lowest priority to unobservable inputs (Level 3). The Fund’s investments are classified within the fair value hierarchy based on the lowest level of input that is significant to the fair value measurement. The inputs are summarized into three broad levels as follows:
| ∎ | | Level 1 – quoted prices in active markets for identical securities |
| ∎ | | Level 2 – other significant observable inputs (including quoted prices for similar securities, interest rates, prepayment speeds, credit risk, etc.) |
| ∎ | | Level 3 – significant unobservable inputs (including the Fund’s own assumptions in determining the fair value of investments) |
The inputs or methodologies used for valuing investments in securities are not necessarily an indication of the risk associated with investing in those securities.
| | | | | | |
| Notes to financial statements | | Wells Fargo Disciplined Small Cap Fund | | | 31 | |
The following is a summary of the inputs used in valuing the Fund’s assets and liabilities as of March 31, 2019:
| | | | | | | | | | | | | | | | |
| | | | |
| | | Quoted prices
(Level 1) | | | Other significant
observable inputs
(Level 2) | | | Significant
unobservable inputs (Level 3) | | | Total | |
| | | | |
Assets | | | | | | | | | | | | | | | | |
Investments in: | | | | | | | | | | | | | | | | |
| | | | |
Common stocks | | | | | | | | | | | | | | | | |
| | | | |
Communication services | | $ | 2,268,560 | | | $ | 0 | | | $ | 0 | | | $ | 2,268,560 | |
| | | | |
Consumer discretionary | | | 9,045,480 | | | | 0 | | | | 0 | | | | 9,045,480 | |
| | | | |
Consumer staples | | | 2,396,829 | | | | 0 | | | | 0 | | | | 2,396,829 | |
| | | | |
Energy | | | 3,188,409 | | | | 0 | | | | 0 | | | | 3,188,409 | |
| | | | |
Financials | | | 13,395,641 | | | | 0 | | | | 0 | | | | 13,395,641 | |
| | | | |
Health care | | | 12,349,980 | | | | 0 | | | | 0 | | | | 12,349,980 | |
| | | | |
Industrials | | | 11,862,773 | | | | 0 | | | | 0 | | | | 11,862,773 | |
| | | | |
Information technology | | | 12,892,872 | | | | 0 | | | | 0 | | | | 12,892,872 | |
| | | | |
Materials | | | 2,901,421 | | | | 0 | | | | 0 | | | | 2,901,421 | |
| | | | |
Real estate | | | 5,738,096 | | | | 0 | | | | 0 | | | | 5,738,096 | |
| | | | |
Utilities | | | 2,738,432 | | | | 0 | | | | 0 | | | | 2,738,432 | |
| | | | |
Short-term investments | | | | | | | | | | | | | | | | |
| | | | |
Investment companies | | | 849,992 | | | | 533,142 | | | | 0 | | | | 1,383,134 | |
| | | | |
U.S. Treasury securities | | | 129,189 | | | | 0 | | | | 0 | | | | 129,189 | |
| | | | |
Total assets | | $ | 79,757,674 | | | $ | 533,142 | | | $ | 0 | | | $ | 80,290,816 | |
Liabilities | | | | | | | | | | | | | | | | |
| | | | |
Futures contracts | | $ | 3,924 | | | $ | 0 | | | $ | 0 | | | $ | 3,924 | |
| | | | |
Total liabilities | | $ | 3,924 | | | $ | 0 | | | $ | 0 | | | $ | 3,924 | |
Futures contracts are reported at their cumulative unrealized gains (losses) at measurement date as reported in the table following the Portfolio of Investments. For futures contracts, the current day’s variation margin is reported on the Statement of Assets and Liabilities. All other assets and liabilities are reported at their market value at measurement date.
Additional sector, industry or geographic detail is included in the Portfolio of Investments.
At March 31, 2019, the Fund did not have any transfers into/out of Level 3.
4. TRANSACTIONS WITH AFFILIATES AND OTHER EXPENSES
Management fee
Funds Management, an indirect wholly owned subsidiary of Wells Fargo, is the manager of the Fund and provides advisory and fund-level administrative services under an investment management agreement. Under the investment management agreement, Funds Management is responsible for, among other services, implementing the investment objectives and strategies of the Fund, supervising the subadviser and providing fund-level administrative services in connection with the Fund’s operations. As compensation for its services under the investment management agreement, Funds Management is entitled to receive a management fee at the following annual rate based on the Fund’s average daily net assets:
| | | | |
| Average daily net assets | | Management fee | |
| |
First $1 billion | | | 0.500 | % |
| |
Next $4 billion | | | 0.475 | |
| |
Next $5 billion | | | 0.440 | |
| |
Over $10 billion | | | 0.430 | |
| | | | |
| 32 | | Wells Fargo Disciplined Small Cap Fund | | Notes to financial statements |
Prior to June 27, 2018, the management fee rate was as follows:
| | | | |
| Average daily net assets | | Management fee | |
| |
First $500 million | | | 0.850 | % |
| |
Next $500 million | | | 0.825 | |
| |
Next $1 billion | | | 0.800 | |
| |
Next $1 billion | | | 0.775 | |
| |
Next $1 billion | | | 0.750 | |
| |
Next $1 billion | | | 0.730 | |
| |
Next $5 billion | | | 0.720 | |
| |
Over $10 billion | | | 0.710 | |
For the year ended March 31, 2019, the management fee was equivalent to an annual rate of 0.61% of the Fund’s average daily net assets.
Funds Management has retained the services of a subadviser to provide daily portfolio management to the Fund. The fee for subadvisory services is borne by Funds Management. WellsCap is the subadviser to the Fund and is entitled to receive a fee from Funds Management at an annual rate starting at 0.35% and declining to 0.25% as the average daily net assets of the Fund increase. Prior to June 27, 2018, Schroder Investment Management North America Inc., which is not an affiliate of Funds Management, was the subadviser to the fund and was entitled to receive a fee from Funds Management at an annual rate which started at 0.50% and declined to 0.45% as the average daily net assets of the Fund increased
Administration fees
Under a class-level administration agreement, Funds Management provides class-level administrative services to the Fund, which includes paying fees and expenses for services provided by the transfer agent,sub-transfer agents, omnibus account servicers and record-keepers. As compensation for its services under the class-level administration agreement, Funds Management receives an annual fee which is calculated based on the average daily net assets of each class as follows:
| | | | |
| | | Class-level
administration fee | |
| |
Class A | | | 0.21 | % |
| |
Class R6 | | | 0.03 | |
| |
Administrator Class, Institutional Class | | | 0.13 | |
Funds Management has contractually waived and/or reimbursed management and administration fees to the extent necessary to maintain certain net operating expense ratios for the Fund. When each class of the Fund has exceeded its expense cap, Funds Management has waived fees and/or reimbursed expenses from fund level expenses on a proportionate basis and then from class specific expenses. When only certain classes exceed their expense caps, waivers and/or reimbursements are applied against class specific expenses before fund level expenses. Funds Management has committed to waive fees and/or reimburse expenses to the extent necessary to cap expenses as follows:
| | | | | | | | |
| | | Expense ratio cap | | | Expiration date | |
| | |
Class A | | | 0.93 | % | | | July 31, 2020 | |
| | |
Class R6 | | | 0.50 | % | | | July 31, 2019 | |
| | |
Administrator Class | | | 0.85 | % | | | July 31, 2019 | |
| | |
Institutional Class | | | 0.60 | % | | | July 31, 2019 | |
Prior to or after the commitment expiration date, the cap may be increased or the commitment to maintain the cap may be terminated only with the approval of the Board of Trustees.Prior to June 27, 2018, the Fund’s expenses were capped at 0.85% for Class R6 shares, 1.20% for Administrator Class shares, and 0.95% for Institutional Class shares.
| | | | | | |
| Notes to financial statements | | Wells Fargo Disciplined Small Cap Fund | | | 33 | |
Sales charges
Wells Fargo Funds Distributor, LLC (“Funds Distributor’), the principal underwriter, is entitled to receive thefront-end sales charge from the purchase of Class A shares and a contingent deferred sales charge on the redemption of certain Class A shares. Funds Distributor did not receive anyfront-end or contingent deferred sales charges from Class A shares for the year ended March 31, 2019.
Shareholder servicing fees
The Trust has entered into contracts with one or more shareholder servicing agents, whereby Class A and Administrator Class of the Fund are charged a fee at an annual rate of 0.25% of the average daily net assets of each respective class. A portion of these total shareholder servicing fees were paid to affiliates of Wells Fargo.
Interfund transactions
The Fund may purchase or sell portfolio investment securities to certain other Wells Fargo affiliates pursuant toRule 17a-7 under the 1940 Act and under procedures adopted by the Board of Trustees. The procedures have been designed to ensure that these interfund transactions, which do not incur broker commissions, are effected at current market prices.
5. INVESTMENT PORTFOLIO TRANSACTIONS
Purchases and sales of investments, excluding U.S. government obligations (if any) and short-term securities, for the year ended March 31, 2019 were $238,956,435 and $317,379,696, respectively.
6. DERIVATIVE TRANSACTIONS
During the year ended March 31, 2019, the Fund entered into futures contracts for economic hedging purposes. The Fund had an average notional amount of $674,718 in long futures contracts during the year ended March 31, 2019.
The fair value, realized gains or losses and change in unrealized gains or losses, if any, on derivative instruments are reflected in the corresponding financial statement captions.
6. BANK BORROWINGS
The Trust (excluding the money market funds), Wells Fargo Master Trust and Wells Fargo Variable Trust are parties to a $280,000,000 revolving credit agreement whereby the Fund is permitted to use bank borrowings for temporary or emergency purposes, such as to fund shareholder redemption requests. Interest under the credit agreement is charged to the Fund based on a borrowing rate equal to the higher of the Federal Funds rate in effect on that day plus 1.25% or the overnight LIBOR rate in effect on that day plus 1.25%. In addition, an annual commitment fee equal to 0.25% of the unused balance is allocated to each participating fund.
For the year ended March 31, 2019, there were no borrowings by the Fund under the agreement.
7. DISTRIBUTIONS TO SHAREHOLDERS
The tax character of distributions paid during the years ended March 31, 2019 and March 31, 2018 were as follows:
| | | | | | | | |
| | | Year ended March 31 | |
| | |
| | | 2019 | | | 2018 | |
| | |
Ordinary income | | $ | 1,060,055 | | | $ | 4,968,700 | |
| | |
Long-term capital gain | | | 63,878,426 | | | | 32,912,345 | |
As of March 31, 2019, the components of distributable earnings on a tax basis were as follows:
| | | | |
Undistributed ordinary income | | Unrealized losses | | Post-October capital losses deferred |
| | |
| $79,924 | | $(3,493,608) | | $(1,969,221) |
Effective for all filings after November 4, 2018, the Securities and Exchange Commission eliminated the requirement to separately state the components of distributions to shareholders under U.S. generally accepted accounting principles. The amounts of distributions to shareholders for the year ended March 31, 2018 were as follows:
| | | | | | | | |
| | | Net investment
income | | | Net realized
gains | |
| | |
Class R6 | | $ | 5,027 | | | $ | 260,359 | |
| | |
Administrator Class | | | 339,109 | | | | 27,052,520 | |
| | |
Institutional Class | | | 183,973 | | | | 10,040,057 | |
| | | | |
| 34 | | Wells Fargo Disciplined Small Cap Fund | | Notes to financial statements |
8. INDEMNIFICATION
Under the Trust’s organizational documents, the officers and Trustees have been granted certain indemnification rights against certain liabilities that may arise out of performance of their duties to the Trust. Additionally, in the normal course of business, the Trust may enter into contracts with service providers that contain a variety of indemnification clauses. The Trust’s maximum exposure under these arrangements is dependent on future claims that may be made against the Fund and, therefore, cannot be estimated.
9. NEW ACCOUNTING PRONOUNCEMENT
In August 2018, FASB issued Accounting Standards Update (“ASU”)No. 2018-13, Fair Value Measurement (Topic 820)Disclosure Framework—Changes to the Disclosure Requirements for Fair Value Measurement. ASU2018-13 updates the disclosure requirements for fair value measurements by modifying or removing certain disclosures and adding certain new disclosures. The amendments are effective for fiscal years, and interim periods within those fiscal years, beginning after December 15, 2019. Early adoption is permitted. Management has adopted the removal and modification of disclosures early, as permitted, and will adopt the additional new disclosures at the effective date.
| | | | | | |
| Report of independent registered public accounting firm | | Wells Fargo Disciplined Small Cap Fund | | | 35 | |
TO THE SHAREHOLDERS OF THE FUND AND BOARD OF TRUSTEES OF WELLS FARGO FUNDS TRUST:
Opinion on the Financial Statements
We have audited the accompanying statement of assets and liabilities of Wells Fargo Disciplined Small Cap Fund (formerly known as Wells Fargo Small Cap Opportunities Fund) (the Fund), one of the funds constituting Wells Fargo Funds Trust, including the portfolio of investments, as of March 31, 2019, the related statement of operations for the year then ended, the statements of changes in net assets for each of the years in the two-year period then ended, and the related notes (collectively, the financial statements) and the financial highlights for each of the years or periods in the five-year period then ended. In our opinion, the financial statements and financial highlights present fairly, in all material respects, the financial position of the Fund as of March 31, 2019, the results of its operations for the year then ended, the changes in its net assets for each of the years in the two-year period then ended, and the financial highlights for each of the years or periods in the five-year period then ended, in conformity with U.S. generally accepted accounting principles.
Basis for Opinion
These financial statements and financial highlights are the responsibility of the Fund’s management. Our responsibility is to express an opinion on these financial statements and financial highlights based on our audits. We are a public accounting firm registered with the Public Company Accounting Oversight Board (United States) (PCAOB) and are required to be independent with respect to the Fund in accordance with the U.S. federal securities laws and the applicable rules and regulations of the Securities and Exchange Commission and the PCAOB.
We conducted our audits in accordance with the standards of the PCAOB. Those standards require that we plan and perform the audit to obtain reasonable assurance about whether the financial statements and financial highlights are free of material misstatement, whether due to error or fraud. Our audits included performing procedures to assess the risks of material misstatement of the financial statements and financial highlights, whether due to error or fraud, and performing procedures that respond to those risks. Such procedures included examining, on a test basis, evidence regarding the amounts and disclosures in the financial statements and financial highlights. Such procedures also included confirmation of securities owned as of March 31, 2019, by correspondence with the custodian and brokers, or by other appropriate auditing procedures. Our audits also included evaluating the accounting principles used and significant estimates made by management, as well as evaluating the overall presentation of the financial statements and financial highlights. We believe that our audits provide a reasonable basis for our opinion.

We have not been able to determine the specific year that we began serving as the auditor of one or more Wells Fargo Funds investment companies; however we are aware that we have served as the auditor of one or more Wells Fargo Funds investment companies since at least 1955.
Boston, Massachusetts
May 24, 2019
| | | | |
| 36 | | Wells Fargo Disciplined Small Cap Fund | | Other information (unaudited) |
TAX INFORMATION
For corporate shareholders, pursuant to Section 854 of the Internal Revenue Code, 100% of ordinary income dividends qualify for the corporate dividends-received deduction for the fiscal year ended March 31, 2019.
Pursuant to Section 852 of the Internal Revenue Code, $63,878,426 was designated as a 20% rate gain distribution for the fiscal year ended March 31, 2019.
Pursuant to Section 854 of the Internal Revenue Code, $1,060,055 of income dividends paid during the fiscal year ended March 31, 2019 has been designated as qualified dividend income (QDI).
For the fiscal year ended March 31, 2019, $30,175 has been designated as interest-related dividends for nonresident alien shareholders pursuant to Section 871 of the Internal Revenue Code.
For the fiscal year ended March 31, 2019, $493,040 has been designated as short-term capital gain dividends for nonresident alien shareholders pursuant to Section 871 of the Internal Revenue Code.
PROXY VOTING INFORMATION
A description of the policies and procedures used to determine how to vote proxies relating to portfolio securities is available, upon request, by calling1-800-222-8222, visiting our website atwfam.com, or visiting the SEC website at sec.gov. Information regarding how the Fund voted proxies relating to portfolio securities during the most recent12-month period ended June 30 is available on the Fund’s website atwfam.comor by visiting the SEC website at sec.gov.
PORTFOLIO HOLDINGS INFORMATION
The complete portfolio holdings for the Fund are publicly available monthly on the Fund’s website (wfam.com), on aone-month delayed basis. In addition, top ten holdings information (excluding derivative positions) for the Fund is publicly available on the Fund’s website on a monthly,seven-day or more delayed basis. The Fund files its complete schedule of portfolio holdings with the SEC for the first and third quarters of each fiscal year on FormN-Q, which is available by visiting the SEC website at sec.gov. In addition, the Fund’s FormN-Q may be reviewed and copied at the SEC’s Public Reference Room in Washington, DC, and at regional offices in New York City, at 233 Broadway, and in Chicago, at 175 West Jackson Boulevard, Suite 900. Information about the Public Reference Room may be obtained by calling1-800-SEC-0330.
| | | | | | |
| Other information (unaudited) | | Wells Fargo Disciplined Small Cap Fund | | | 37 | |
BOARD OF TRUSTEES AND OFFICERS
Each of the Trustees and Officers1 listed in the table below acts in identical capacities for each fund in the Wells Fargo family of funds, which consists of 151 mutual funds comprising the Wells Fargo Funds Trust, Wells Fargo Variable Trust, Wells Fargo Master Trust and fourclosed-end funds (collectively the “Fund Complex”). This table should be read in conjunction with the Prospectus and the Statement of Additional Information2. The mailing address of each Trustee and Officer is 525 Market Street, 12th Floor, San Francisco, CA 94105. Each Trustee and Officer serves an indefinite term, however, each Trustee serves such term until reaching the mandatory retirement age established by the Trustees.
Independent Trustees
| | | | | | |
Name and
year of birth | | Position held and
length of service* | | Principal occupations during past five years or longer | | Current other
public company or
investment company
directorships |
| | | |
| William R. Ebsworth (Born 1957) | | Trustee, since 2015 | | Retired. From 1984 to 2013, equities analyst, portfolio manager, research director and chief investment officer at Fidelity Management and Research Company in Boston, Tokyo, and Hong Kong, and retired in 2013 as Chief Investment Officer of Fidelity Strategic Advisers, Inc. where he led a team of investment professionals managing client assets. Prior thereto, Board member of Hong Kong Securities Clearing Co., Hong Kong Options Clearing Corp., the Thailand International Fund, Ltd., Fidelity Investments Life Insurance Company, and Empire Fidelity Investments Life Insurance Company. Audit Committee Chair and Investment Committee Chair of the Vincent Memorial Hospital Endowment(non-profit organization). Mr. Ebsworth is a CFA® charterholder. | | N/A |
| | | |
Jane A. Freeman
(Born 1953) | | Trustee, since 2015; Chair Liaison, since 2018 | | Retired. From 2012 to 2014 and 1999 to 2008, Chief Financial Officer of Scientific Learning Corporation. From 2008 to 2012, Ms. Freeman provided consulting services related to strategic business projects. Prior to 1999, Portfolio Manager at Rockefeller & Co. and Scudder, Stevens & Clark. Board member of the Harding Loevner Funds from 1996 to 2014, serving as both Lead Independent Director and chair of the Audit Committee. Board member of the Russell Exchange Traded Funds Trust from 2011 to 2012 and the chair of the Audit Committee. Ms. Freeman is a Board Member of The Ruth Bancroft Garden(non-profit organization). She is also an inactive Chartered Financial Analyst. | | N/A |
| | | |
Isaiah Harris, Jr.3 (Born 1952) | | Trustee, since 2009; Audit Committee Chairman, since 2019 | | Retired. Chairman of the Board of CIGNA Corporation since 2009, and Director since 2005. From 2003 to 2011, Director of Deluxe Corporation. Prior thereto, President and CEO of BellSouth Advertising and Publishing Corp. from 2005 to 2007, President and CEO of BellSouth Enterprises from 2004 to 2005 and President of BellSouth Consumer Services from 2000 to 2003. Emeritus member of the Iowa State University Foundation Board of Governors. Emeritus Member of the Advisory Board of Iowa State University School of Business. Advisory Board Member, Palm Harbor Academy (private school). Advisory Board Member, Child Evangelism Fellowship(non-profit). Mr. Harris is a certified public accountant (inactive status). | | CIGNA Corporation |
| | | |
Judith M. Johnson
(Born 1949) | | Trustee, since 2008; Audit Committee Chairman, from 2009 to 2018 | | Retired. Prior thereto, Chief Executive Officer and Chief Investment Officer of Minneapolis Employees Retirement Fund from 1996 to 2008. Ms. Johnson is an attorney, certified public accountant and a certified managerial accountant. | | N/A |
| | | | |
| 38 | | Wells Fargo Disciplined Small Cap Fund | | Other information (unaudited) |
| | | | | | |
Name and
year of birth | | Position held and
length of service* | | Principal occupations during past five years or longer | | Current other
public company or
investment company
directorships |
| | | |
David F. Larcker
(Born 1950) | | Trustee, since 2009 | | James Irvin Miller Professor of Accounting at the Graduate School of Business, Stanford University, Director of the Corporate Governance Research Initiative and Senior Faculty of The Rock Center for Corporate Governance since 2006. From 2005 to 2008, Professor of Accounting at the Graduate School of Business, Stanford University. Prior thereto, Ernst & Young Professor of Accounting at The Wharton School, University of Pennsylvania from 1985 to 2005. | | N/A |
| | | |
Olivia S. Mitchell
(Born 1953) | | Trustee, since 2006; Nominating and Governance Committee Chairman, since 2018 | | International Foundation of Employee Benefit Plans Professor, Wharton School of the University of Pennsylvania since 1993. Director of Wharton’s Pension Research Council and Boettner Center on Pensions & Retirement Research, and Research Associate at the National Bureau of Economic Research. Previously, Cornell University Professor from 1978 to 1993. | | N/A |
| | | |
Timothy J. Penny
(Born 1951) | | Trustee, since 1996; Chairman, since 2018 | | President and Chief Executive Officer of Southern Minnesota Initiative Foundation, anon-profit organization, since 2007. Member of the Board of Trustees of NorthStar Education Finance, Inc., anon-profit organization, since 2007. | | N/A |
| | | |
James G. Polisson
(Born 1959) | | Trustee, since 2018 | | Retired. Chief Marketing Officer, Source (ETF) UK Services, Ltd, from 2015 to 2017. From 2012 to 2015, Principal of The Polisson Group, LLC, a management consulting, corporate advisory and principal investing company. Chief Executive Officer and Managing Director at Russell Investments, Global Exchange Traded Funds from 2010 to 2012. Managing Director of Barclays Global Investors from 1998 to 2010 and Global Chief Marketing Officer for iShares and Barclays Global Investors from 2000 to 2010. Trustee of the San Francisco Mechanics’ Institute, anon-profit organization, from 2013 to 2015. Board member of the Russell Exchange Traded Fund Trust from 2011 to 2012. Director of Barclays Global Investors Holdings Deutschland GmbH from 2006 to 2009. Mr. Polisson is an attorney and has a retired status with the Massachusetts and District of Columbia Bar Associations. | | N/A |
| | | |
Pamela Wheelock
(Born 1959) | | Trustee, since 2018 | | Board member of the Destination Medical Center Economic Development Agency, Rochester, Minnesota since 2019. Chief Operating Officer, Twin Cities Habitat for Humanity from 2017 to 2019. Vice President of University Services, University of Minnesota from 2012 to 2016. Prior thereto, on the Board of Directors, Governance Committee and Finance Committee for the Minnesota Philanthropy Partners (Saint Paul Foundation) from 2012 to 2018, Interim Chief Executive Officer of Blue Cross Blue Shield of Minnesota from 2011 to 2012, Chairman of the Board from 2009 to 2012 and Board Director from 2003 to 2015. Vice President, Leadership and Community Engagement, Bush Foundation, Saint Paul, Minnesota (a private foundation) from 2009 to 2011. Executive Vice President and Chief Financial Officer, Minnesota Sports and Entertainment from 2004 to 2009 and Senior Vice President from 2002 to 2004. Executive Vice President of the Minnesota Wild Foundation from 2004 to 2008. Commissioner of Finance, State of Minnesota, from 1999 to 2002. Currently Board Chair of the Minnesota Wild Foundation since 2010. | | N/A |
| * | Length of service dates reflect the Trustee’s commencement of service with the Trust’s predecessor entities, where applicable. |
| | | | | | |
| Other information (unaudited) | | Wells Fargo Disciplined Small Cap Fund | | | 39 | |
Officers
| | | | | | |
Name and year of birth | | Position held and
length of service | | Principal occupations during past five years or longer | | |
| | | |
Andrew Owen
(Born 1960) | | President, since 2017 | | Executive Vice President of Wells Fargo & Company and Head of Affiliated Managers, Wells Fargo Asset Management, since 2014. In addition, Mr. Owen is currently President, Chief Executive Officer and Director of Wells Fargo Funds Management, LLC since 2017. Prior thereto, Executive Vice President responsible for marketing, investments and product development for Wells Fargo Funds Management, LLC, from 2009 to 2014. | | |
| | | |
Nancy Wiser1
(Born 1967) | | Treasurer, since 2012 | | Executive Vice President of Wells Fargo Funds Management, LLC since 2011. Chief Operating Officer and Chief Compliance Officer at LightBox Capital Management LLC, from 2008 to 2011. | | |
| | | |
Alexander Kymn
(Born 1973) | | Secretary and
Chief Legal Officer, since 2018 | | Senior Company Counsel of Wells Fargo Bank, N.A. since 2018 (previously Senior Counsel from 2007 to 2018). Vice President of Wells Fargo Funds Management, LLC from 2008 to 2014. | | |
| | | |
Michael H. Whitaker
(Born 1967) | | Chief Compliance Officer, since 2016 | | Senior Vice President and Chief Compliance Officer since 2016. Senior Vice President and Chief Compliance Officer for Fidelity Investments from 2007 to 2016. | | |
| | | |
David Berardi
(Born 1975) | | Assistant Treasurer, since 2009 | | Vice President of Wells Fargo Funds Management, LLC since 2009. Vice President of Evergreen Investment Management Company, LLC from 2008 to 2010. Manager of Fund Reporting and Control for Evergreen Investment Management Company, LLC from 2004 to 2010. | | |
| | | |
Jeremy DePalma1
(Born 1974) | | Assistant Treasurer, since 2009 | | Senior Vice President of Wells Fargo Funds Management, LLC since 2009. Senior Vice President of Evergreen Investment Management Company, LLC from 2008 to 2010 and head of the Fund Reporting and Control Team within Fund Administration from 2005 to 2010. | | |
| 1 | Nancy Wiser acts as Treasurer of 65 funds in the Fund Complex. Jeremy DePalma acts as Treasurer of 86 funds and Assistant Treasurer of 65 funds in the Fund Complex. |
| 2 | The Statement of Additional Information includes additional information about the Trustees and is available, without charge, upon request, by calling1-800-222-8222 or by visiting the website atwfam.com. |
| 3 | Mr. Harris became Chairman of the Audit Committee effective January 1, 2019. |
| | | | |
| 40 | | Wells Fargo Disciplined Small Cap Fund | | Appendix A (unaudited) |
SALES CHARGE REDUCTIONS AND WAIVERS FOR CERTAIN INTERMEDIARIES
Raymond James & Associates, Inc., Raymond James Financial Services & Raymond James affiliates (“Raymond James”)
Effective on or about March 1, 2019, shareholders purchasing Fund shares through a Raymond James platform or account will be eligible only for the following load waivers(front-end sales charge waivers and contingent deferred, orback-end, sales charge waivers) and discounts, which may differ from those disclosed elsewhere in the Fund’s Prospectus or SAI.
Front-end Sales Load Waivers on Class A shares Available at Raymond James
| | • | | Shares purchased in an investment advisory program. |
| | • | | Shares purchased through reinvestment of capital gains distributions and dividend reinvestment when purchasing shares of the same fund (but not any other fund within the fund family). |
| | • | | Employees and registered representatives of Raymond James or its affiliates and their family members as designated by Raymond James. |
| | • | | Shares purchased from the proceeds of redemptions within the same fund family, provided (1) the repurchase occurs within 90 days following the redemption, (2) the redemption and purchase occur in the same account, and (3) redeemed shares were subject to afront-end or deferred sales load (known as Rights of Reinstatement). |
| | • | | A shareholder in the fund’s Class C shares will have their shares automatically exchanged at net asset value to Class A shares (or the appropriate share class) of the fund if the shares are no longer subject to a CDSC and the exchange is in line with the policies and procedures of Raymond James. |
CDSC Waivers on Class A and C Shares Available at Raymond James
| | • | | Death or disability of the shareholder. |
| | • | | Shares sold as part of a systematic withdrawal plan as described in the Fund’s Prospectus. |
| | • | | Return of excess contributions from an IRA Account. |
| | • | | Shares sold as part of a required minimum distribution for IRA and retirement accounts due to the shareholder reaching age 70½ as described in the Fund’s prospectus. |
| | • | | Shares sold to pay Raymond James fees but only if the transaction is initiated by Raymond James. |
| | • | | Shares acquired through a right of reinstatement. |
Front-end Load Discounts Available at Raymond James: Breakpoints, and/or Rights of Accumulation
| | • | | Breakpoints as described in the Fund’s Prospectus. |
| | • | | Rights of accumulation which entitle shareholders to breakpoint discounts will be automatically calculated based on the aggregated holding of fund family assets held by accounts within the purchaser’s household at Raymond James. Eligible fund family assets not held at Raymond James may be included in the rights of accumulation calculation only if the shareholder notifies his or her financial advisor about such assets. |

For more information
More information about Wells Fargo Funds is available free upon request. To obtain literature, please write, visit the Fund’s website, or call:
Wells Fargo Funds
P.O. Box 219967
Kansas City, MO 64121-9967
Website: wfam.com
Individual investors: 1-800-222-8222
Retail investment professionals: 1-888-877-9275
Institutional investment professionals: 1-866-765-0778
This report and the financial statements contained herein are submitted for the general information of the shareholders of the Fund. If this report is used for promotional purposes, distribution of the report must be accompanied or preceded by a current prospectus. Before investing, please consider the investment objectives, risks, charges, and expenses of the investment. For a current prospectus and, if available, a summary prospectus, containing this information, call1-800-222-8222 or visit the Fund’s website atwfam.com. Read the prospectus carefully before you invest or send money.
Wells Fargo Asset Management (WFAM) is the trade name for certain investment advisory/management firms owned by Wells Fargo & Company. These firms include but are not limited to Wells Capital Management Incorporated and Wells Fargo Funds Management, LLC. Certain products managed by WFAM entities are distributed by Wells Fargo Funds Distributor, LLC (a broker-dealer and Member FINRA).
This material is for general informational and educational purposes only and is NOT intended to provide investment advice or a recommendation of any kind—including a recommendation for any specific investment, strategy, or plan.
INVESTMENT PRODUCTS: NOT FDIC INSURED ◾ NO BANK GUARANTEE ◾ MAY LOSE VALUE
© 2019 Wells Fargo Funds Management, LLC. All rights reserved.
| | |
 | | 401592 05-19 A243/AR243 03-19 |
Annual Report
March 31, 2019

Wells Fargo Small Cap Value Fund

Beginning on January 1, 2021, as permitted by new regulations adopted by the Securities and Exchange Commission, paper copies of the Wells Fargo Funds’ annual and semi-annual shareholder reports issued after this date will no longer be sent by mail, unless you specifically request paper copies of the reports. Instead, the reports will be made available on the Funds’ website, and you will be notified by mail each time a report is posted and provided with a website address to access the report.
If you already elected to receive shareholder reports electronically, you will not be affected by this change and you need not take any action. You may elect to receive shareholder reports and other communications from the Fund electronically at any time by contacting your financial intermediary (such as a broker-dealer or bank) or, if you are a direct investor, by calling 1-800-222-8222 or by enrolling at wellsfargo.com/advantagedelivery.
You may elect to receive all future reports in paper free of charge. If you invest through a financial intermediary, you can contact your financial intermediary to request that you continue to receive paper copies of your shareholder reports; if you invest directly with the Fund, you can call 1-800-222-8222. Your election to receive reports in paper will apply to all Wells Fargo Funds held in your account with your financial intermediary or, if you are a direct investor, to all Wells Fargo Funds that you hold.

Reduce clutter. Save trees.
Sign up for electronic delivery of prospectuses and shareholder reports atwellsfargo.com/advantagedelivery
Contents
The views expressed and any forward-looking statements are as of March 31, 2019, unless otherwise noted, and are those of the Fund managers and/or Wells Fargo Asset Management. Discussions of individual securities, or the markets generally, or any Wells Fargo Fund are not intended as individual recommendations. Future events or results may vary significantly from those expressed in any forward-looking statements. The views expressed are subject to change at any time in response to changing circumstances in the market. Wells Fargo and the Fund disclaim any obligation to publicly update or revise any views expressed or forward-looking statements.
INVESTMENT PRODUCTS: NOT FDIC INSURED ◾ NO BANK GUARANTEE ◾ MAY LOSE VALUE
| | | | |
| 2 | | Wells Fargo Small Cap Value Fund | | Letter to shareholders (unaudited) |

Andrew Owen
President
Wells Fargo Funds
Global trade tensions escalated during the second quarter of 2018.
Dear Shareholder:
We are pleased to offer you this annual report for the Wells Fargo Small Cap Value Fund for the 12-month period that ended March 31, 2019. An upward trend for short-term interest rates, inflation concerns, trade tensions, and geopolitical events contributed to investment market volatility for much of 2018. Equity investor sentiment improved during the first quarter of 2019 thanks to a shift in U.S. Federal Reserve (Fed) policy and consistent if not spectacular economic and business growth metrics.
For the period, U.S. stocks, as measured by the S&P 500 Index,1 gained 9.50% and international stocks, as measured by the MSCI ACWI ex USA Index (Net),2 declined 4.22%. Based on the MSCI EM Index (Net),3 emerging market stocks fell 7.41%. For bond investors, the Bloomberg Barclays U.S. Aggregate Bond Index4 added 4.48% while the Bloomberg Barclays Global Aggregate ex-USD Index5 lost 4.13%. The Bloomberg Barclays Municipal Bond Index6 added 5.38%, and the ICE BofAML U.S. High Yield Index7 gained 5.94%.
Trade tensions and U.S. interest rates influenced markets.
Global trade tensions escalated during the second quarter of 2018. A tit-for-tat tariff spat intensified between the U.S. and other governments. The Fed raised the federal funds rate by 25 basis points (bps; 100 bps equal 1.00%) to a target range of between 1.75% and 2.00% in June 2018. Market index results reflected the global concerns. The MSCI ACWI ex USA Index (Net) lost 2.61%, while the Bloomberg Barclays Global Aggregate ex-USD Index dropped 4.76%.
Not all news was bad. The U.S. Bureau of Economic Analysis reported second-quarter annualized gross domestic product (GDP) growth of 4.2%. Hiring improved. Unemployment declined. Consumer confidence and spending increased. The S&P 500 Index recorded a 3.43% second-quarter gain. Stocks of companies with smaller capitalizations did even better, as measured by the Russell 2000® Index,8 adding 7.75%.
| 1 | The S&P 500 Index consists of 500 stocks chosen for market size, liquidity, and industry group representation. It is a market-value-weighted index with each stock’s weight in the index proportionate to its market value. You cannot invest directly in an index. |
| 2 | The Morgan Stanley Capital International (MSCI) All Country World Index (ACWI) ex USA Index (Net) is a free-float-adjusted market-capitalization-weighted index that is designed to measure the equity market performance of developed markets, excluding the United States and Canada. Source: MSCI. MSCI makes no express or implied warranties or representations and shall have no liability whatsoever with respect to any MSCI data contained herein. The MSCI data may not be further redistributed or used as a basis for other indices or any securities or financial products. This report is not approved, reviewed, or produced by MSCI. You cannot invest directly in an index. |
| 3 | The MSCI Emerging Markets (EM) Index (Net) is a free-float-adjusted market-capitalization-weighted index that is designed to measure large- and mid-cap equity market performance of emerging markets. The MSCI EM Index (Net) consists of the following 24 emerging market country indices: Brazil, Chile, China, Colombia, Czech Republic, Egypt, Greece, Hungary, India, Indonesia, Korea, Malaysia, Mexico, Pakistan, Peru, the Philippines, Poland, Qatar, Russia, South Africa, Taiwan, Thailand, Turkey, and the United Arab Emirates. You cannot invest directly in an index. |
| 4 | The Bloomberg Barclays U.S. Aggregate Bond Index is a broad-based benchmark that measures the investment-grade, U.S. dollar-denominated, fixed-rate taxable bond market, including Treasuries, government-related and corporate securities, mortgage-backed securities (agency fixed-rate and hybrid adjustable-rate mortgage pass-throughs), asset-backed securities, and commercial mortgage-backed securities. You cannot invest directly in an index. |
| 5 | The Bloomberg Barclays Global Aggregate ex-USD Index is an unmanaged index that provides a broad-based measure of the global investment-grade fixed-income markets excluding the U.S. dollar-denominated debt market. You cannot invest directly in an index. |
| 6 | The Bloomberg Barclays Municipal Bond Index is an unmanaged index composed of long-term tax-exempt bonds with a minimum credit rating of Baa. You cannot invest directly in an index. |
| 7 | The ICE BofAML U.S. High Yield Index is a market-capitalization-weighted index of domestic and Yankee high-yield bonds. The index tracks the performance of high-yield securities traded in the U.S. bond market. You cannot invest directly in an index. Copyright 2019. ICE Data Indices, LLC. All rights reserved. |
| 8 | The Russell 2000® Index measures the performance of the 2,000 smallest companies in the Russell 3000® Index, which represents approximately 8% of the total market capitalization of the Russell 3000® Index. You cannot invest directly in an index. |
| | | | | | |
| Letter to shareholders (unaudited) | | Wells Fargo Small Cap Value Fund | | | 3 | |
Investors appeared to shake off lingering concerns during the third quarter.
Favorable third-quarter economic indicators and corporate earnings reports encouraged domestic stock investors. U.S. trade negotiations with Mexico and Canada progressed. The Conference Board Consumer Confidence Index®9 reached its highest level in 18 years during September 2018. The Fed raised the federal funds rate by 25 bps to a target range of between 2.00% and 2.25% in September 2018. For the quarter that ended September 30, 2018, the S&P 500 Index added 7.71%.
Investors in international markets were not as confident. Tensions between the U.S. and China increased. The U.S. imposed $200 billion in tariffs on Chinese goods. China reacted with $60 billion in tariffs on U.S. goods. Economic growth in China caused concern. The Bank of England raised its monetary policy rate to 0.75% in August 2018. During the quarter, the MSCI ACWI ex USA Index (Net) gained 0.71%. The MSCI EM Index (Net) declined 1.09%. In fixed-income markets, U.S. bonds were flat, as measured by the Bloomberg Barclays U.S. Aggregate Bond Index. The Bloomberg Barclays Global Aggregate ex-USD Index fell 1.74%.
Conflicting data unsettled markets during the fourth quarter.
November’s U.S. midterm elections shifted control of the House of Representatives from Republicans to Democrats, presaging potential partisan clashes. Third-quarter U.S. GDP was announced at an annualized 3.4% rate, lower than the second-quarter rate. Brexit efforts stalled ahead of the March 2019 deadline. The People’s Bank of China cut reserve requirement ratios, accelerated infrastructure spending, and cut taxes even as the value of the yuan declined to low levels last seen in 2008.
December’s S&P 500 Index performance was the worst since 1931. Globally,fixed-income investments fared better than stocks during the last two months of the year. The Fed increased the federal funds rate by 25 bps in December 2018 to a target range of between 2.25% and 2.50% and softened its outlook for 2019 rate increases.
The market climbs a wall of worry.
Investors entered 2019 with reasons to be concerned. A partial U.S. government shutdown driven by partisan spending and immigration policy disputes extended into January. Investors expected high levels of stock market volatility to continue based on the VIX10.
January’s returns tended to support the investing adage that markets climb a wall of worry. The S&P 500 Index gained 8.01% for the month that ended January 31, 2019, its best monthly performance in 30 years. Returns for the MSCI ACWI ex USA Index (Net), the Bloomberg Barclays U.S. Aggregate Bond Index, and the Bloomberg Barclays Global Aggregate ex-USD Index also were positive. The Fed indicated that it would pause its program of regular rate increases during 2019 as inflation remained low. Businesses and investors responded positively to the shift in policy.
In February, concerns over slowing global growth reemerged. The Bureau of Economic Analysis announced fourth-quarter 2018 GDP grew at an annualized 2.2% rate, down from the 4.2% annualized rate for the second quarter and the 3.4% annualized rate for the third quarter. Analysts attributed the lower growth rate to a slowing housing market and larger trade deficit. The U.S. Department of
Favorable third-quarter economic indicators and corporate earnings reports encouraged domestic stock investors.
| 9 | The Conference Board Consumer Confidence Index® measures the degree of optimism on the state of the U.S. economy that consumers are expressing through their activities of savings and spending. You cannot invest directly in an index. |
| 10 | The Chicago Board Options Exchange Market Volatility Index (VIX) is a popular measure of the implied volatility of S&P 500 Index options. It represents one measure of the market’s expectation of stock market volatility over the next 30-day period. You cannot invest directly in an index. |
| | | | |
| 4 | | Wells Fargo Small Cap Value Fund | | Letter to shareholders (unaudited) |
Labor said that the economy created just 20,000 jobs in February 2019. In a February report, the Bank of England forecast the slowest growth since the financial crisis for 2019. China and the U.S., while putting future tariffs on hold for the time being, continued to wrangle over trade issues.
By the end of March 2019, the combination of dovish Fed sentiment and consistent, if not spectacular, economic and business metrics reinforced investors’ enthusiasm for equity investing. Monthly job creation data regained its momentum. Corporate profits, while lower than 2018’s lofty levels, remained consistent. Inflation rates were relatively low in the U.S., Europe, and Japan. China announced a roughly $300 billion stimulus package through tax and fee cuts intended to reinvigorate economic growth.
Don’t let short-term uncertainty derail long-term investment goals.
Periods of investment uncertainty can present challenges, but experience has taught us that maintaining long-term investment goals can be an effective way to plan for the future. To help you create a sound strategy based on your personal goals and risk tolerance, Wells Fargo Funds offers more than 100 mutual funds spanning a wide range of asset classes and investment styles. Although diversification cannot guarantee an investment profit or prevent losses, we believe it can be an effective way to manage investment risk and potentially smooth out overall portfolio performance. We encourage investors to know their investments and to understand that appropriate levels of risk-taking may unlock opportunities.
Thank you for choosing to invest with Wells Fargo Funds. We appreciate your confidence in us and remain committed to helping you meet your financial needs.
Sincerely,

Andrew Owen
President
Wells Fargo Funds
For further information about your Fund, contact your investment professional, visit our website atwfam.com, or call us directly at1-800-222-8222.
This page is intentionally left blank.
| | | | |
| 6 | | Wells Fargo Small Cap Value Fund | | Performance highlights (unaudited) |
Investment objective
The Fund seeks long-term capital appreciation.
Manager
Wells Fargo Funds Management, LLC
Subadviser
Wells Capital Management Incorporated
Portfolio managers*
Jeff Goverman
Garth R. Nisbet, CFA®‡
Craig Pieringer, CFA®‡
Average annual total returns (%) as of March 31, 2019
| | | | | | | | | | | | | | | | | | | | | | | | | | | | | | | | | | |
| | | | | Including sales charge | | | Excluding sales charge | | | Expense ratios1 (%) | |
| | | Inception date | | 1 year | | | 5 year | | | 10 year | | | 1 year | | | 5 year | | | 10 year | | | Gross | | | Net2 | |
| | | | | | | | | |
| Class A (SMVAX) | | 11-30-2000 | | | -12.34 | | | | 2.05 | | | | 10.78 | | | | -7.00 | | | | 3.27 | | | | 11.43 | | | | 1.34 | | | | 1.29 | |
| | | | | | | | | |
| Class C (SMVCX) | | 11-30-2000 | | | -8.67 | | | | 2.49 | | | | 10.60 | | | | -7.67 | | | | 2.49 | | | | 10.60 | | | | 2.09 | | | | 2.04 | |
| | | | | | | | | |
| Class R6 (SMVRX)3 | | 6-28-2013 | | | – | | | | – | | | | – | | | | -6.55 | | | | 3.73 | | | | 11.92 | | | | 0.91 | | | | 0.84 | |
| | | | | | | | | |
| Administrator Class (SMVDX)4 | | 7-30-2010 | | | – | | | | – | | | | – | | | | -6.85 | | | | 3.46 | | | | 11.67 | | | | 1.26 | | | | 1.09 | |
| | | | | | | | | |
| Institutional Class (WFSVX) | | 7-31-2007 | | | – | | | | – | | | | – | | | | -6.61 | | | | 3.68 | | | | 11.89 | | | | 1.01 | | | | 0.89 | |
| | | | | | | | | |
| Russell 2000® Value Index5 | | – | | | – | | | | – | | | | – | | | | 0.17 | | | | 5.59 | | | | 14.12 | | | | – | | | | – | |
Figures quoted represent past performance, which is no guarantee of future results, and do not reflect taxes that a shareholder may pay on fund distributions or the redemption of fund shares. Investment return and principal value of an investment will fluctuate so that an investor’s shares, when redeemed, may be worth more or less than their original cost. Performance shown without sales charges would be lower if sales charges were reflected. Current performance may be lower or higher than the performance data quoted, which assumes the reinvestment of dividends and capital gains. Current month-end performance is available on the Fund’s website, wfam.com.
Index returns do not include transaction costs associated with buying and selling securities, any mutual fund fees or expenses, or any taxes. It is not possible to invest directly in an index.
For Class A shares, the maximum front-end sales charge is 5.75%. For Class C shares, the maximum contingent deferred sales charge is 1.00%. Performance including a contingent deferred sales charge assumes the sales charge for the corresponding time period. Class R6, Administrator Class, and Institutional Class shares are sold without a front-end sales charge or contingent deferred sales charge.
Stock values fluctuate in response to the activities of individual companies and general market and economic conditions. Smaller-company stocks tend to be more volatile and less liquid than those of larger companies. The use of derivatives may reduce returns and/or increase volatility. Certain investment strategies tend to increase the total risk of an investment (relative to the broader market). The Fund is exposed to foreign investment risk. Consult the Fund’s prospectus for additional information on these and other risks.
Please see footnotes on page 7.
| | | | | | |
| Performance highlights (unaudited) | | Wells Fargo Small Cap Value Fund | | | 7 | |
|
| Growth of $10,000 investment as of March 31, 20196 |
|
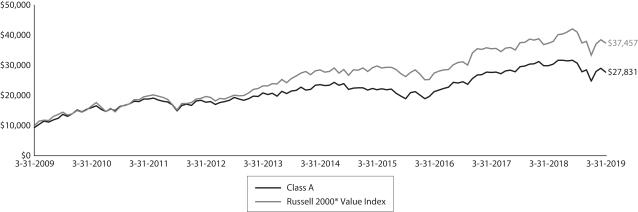 |
| * | Mr. Goverman, Mr. Nisbet and Mr. Pieringer became portfolio managers of the Fund on May 23, 2019. |
| ‡ | CFA® and Chartered Financial Analyst® are trademarks owned by CFA Institute. |
| 1 | Reflects the expense ratios as stated in the most recent prospectuses, which include the impact of 0.01% in acquired fund fees and expenses. The expense ratios shown are subject to change and may differ from the annualized expense ratios shown in the financial highlights of this report, which do not include acquired fund fees and expenses. |
| 2 | The manager has contractually committed through July 31, 2019, to waive fees and/or reimburse expenses to the extent necessary to cap the expenses of each class after fee waivers at 1.28% for Class A, 2.03% for Class C, 0.83% for Class R6, 1.08% for Administrator Class, and 0.88% for Institutional Class. Brokerage commissions, stamp duty fees, interest, taxes, acquired fund fees and expenses (if any), and extraordinary expenses are excluded from the expense cap. Prior to or after the commitment expiration date, the cap may be increased or the commitment to maintain the cap may be terminated only with the approval of the Board of Trustees. Without this cap, the Fund’s returns would have been lower. The expense ratio paid by an investor is the net expense ratio (the total annual fund operating expenses after fee waivers) as stated in the prospectuses. |
| 3 | Historical performance shown for Class R6 shares prior to their inception reflects the performance of Institutional Class shares and includes the higher expenses applicable to Institutional Class shares. If these expenses had not been included, returns for Class R6 shares would be higher. |
| 4 | Historical performance shown for Administrator Class shares prior to their inception reflects the performance of Institutional Class shares and has been adjusted to reflect the higher expenses applicable to Administrator Class shares. |
| 5 | The Russell 2000® Value Index measures the performance of those Russell 2000 companies with lower price/book ratios and lower forecasted growth values. You cannot invest directly in an index. |
| 6 | The chart compares the performance of Class A shares for the most recent ten years with the Russell 2000® Value Index. The chart assumes a hypothetical investment of $10,000 in Class A shares and reflects all operating expenses. |
| 7 | The ten largest holdings, excluding cash, cash equivalents and any money market funds, are calculated based on the value of the investments divided by total net assets of the Fund. Holdings are subject to change and may have changed since the date specified. |
| 8 | Amounts are calculated based on the total long-term investments of the Fund. These amounts are subject to change and may have changed since the date specified. |
| | | | |
| 8 | | Wells Fargo Small Cap Value Fund | | Performance highlights (unaudited) |
MANAGER’S DISCUSSION
Fund highlights
| ∎ | | The Fund underperformed its benchmark, the Russell 2000® Value Index, for the 12-month period that ended March 31, 2019. |
| ∎ | | Weakness in our industrials and financials holdings detracted from performance. |
| ∎ | | Strong stock selection in the materials, information technology (IT), and communication services sectors contributed to performance. |
Small-cap stock performance ranged widely during the period.
U.S. small-cap stocks performed poorly in the back half of 2018, driven by fears of a recession in the U.S., potential trade wars, increased interest rates, and a slowing global economy. Stocks have rebounded since the beginning of 2019 as these fears have abated. The U.S. economy remains on sound footing; it appears increasingly likely the U.S. will sign a trade deal with China; the U.S. Federal Reserve (Fed) has halted its program of interest rate increases; and while global growth has slowed, it may have bottomed and could improve from here. Given the strong recent performance of equities, stocks may pause for a quarter or two in order to digest recent gains. Nevertheless, our outlook is cautiously optimistic and we believe many of our investments are trading at extremely attractive valuations.
We increased the Fund’s industrials weight and modestly trimmed materials sector holdings.
We are bottom-up stock pickers, so sector weights are a reflection of individual stock selection. Over the past year, the Fund’s weighting in industrials increased materially. We initiated positions in Air Lease Corporation and Seaspan Corporation and are encouraged about both opportunities. Air Lease is an aircraft leasing company that stands to benefit from an improvement in lease rates due to healthy airline passenger trends and the aging of the existing fleet. Seaspan is an owner of containerships and is benefiting from an inflection in time charter rates and the expansion of its containership and infrastructure footprint. We also decreased our exposure to select materials sector stocks; however, we still remain overweight the sector. The decreased weight was driven primarily by the exit of our steel investments during the year.
Weakness in our industrials and financials holdings detracted from performance.
Industrials were a relative underperformer during the period, with the top detractors being ACCO Brands Corporation and FreightCar America, Incorporated. ACCO, a provider of office and computer supplies, was hurt in late 2018 by margin pressure due to tariffs and the destocking of inventory by its wholesale customers. FreightCar America, which manufactures freight cars for the railroad industry, made good progress on its operational turnaround in the first half of the year but took a step back in the third quarter as margins were hit by higher costs related to manufacturing a new railcar model.
Our overweight to banks hurt our performance. Macro concerns increased investors’ caution toward credit-exposed entities, including banks. Late-cycle fears also sent interest rates lower and flattened the yield curve—negatives for banks. Nevertheless, we remain overweight banks. We believe the underperformance is overdone. We believe the stocks are very cheap, expect earnings to be solid, and believe merger and acquisition (M&A) activity is likely to increase, driven by an improved regulatory backdrop.
Also affecting relative performance was our underweight to both the utilities and real estate sectors. Strong performance in these sectors was driven by the Fed’s signal to stop increasing interest rates, driving yield stocks higher.
Strong stock selection in the materials, IT, and communication services sectors contributed to performance.
Strong stock selection in the materials sector helped the Fund’s performance. Key contributors were our largest gold positions, Randgold Resources Limited and Sandstorm Gold Limited. Randgold announced a merger with Barrick Gold Corporation that closed at year-end to form a company that will have the lowest total cash cost position among its peers and will own a diversified asset portfolio. Sandstorm, a gold-streaming and royalty company, has a strong portfolio of underlying mines and has had strong recent results.
Within the IT and communication services sectors, the Fund’s holdings contributed to performance. OSI Systems, Incorporated, provides security and inspection systems for airports and border stations and also has a health care business. Shares improved, driven by continued positive results within its security business. Iridium Communications Incorporated, which operates a satellite communications network, recently completed the launch of its new satellite constellation, creating a highly competitive network.
| | | | | | |
| Performance highlights (unaudited) | | Wells Fargo Small Cap Value Fund | | | 9 | |
We are cautiously optimistic.
We remain positive on how the portfolio is positioned. Despite the strong start to the year, we believe many of our stocks continue to trade at extremely attractive valuations. This includes our bank investments, which have underperformed the market for most of the past two years and continue to appear undervalued to us. We expect our bank holdings to benefit from deregulation and increased M&A activity. Although gold has lagged the recent market upturn, this is not surprising, as the gold price often lags other asset classes in a risk-on environment. We believe our investments in the gold miners can provide the Fund with important diversification benefits in times of market volatility.
| | | | |
| Ten largest holdings (%) as of March 31, 20197 | |
| |
Navigator Holdings Limited | | | 4.13 | |
| |
Barrick Gold Corporation | | | 3.75 | |
| |
The Bancorp Incorporated | | | 3.63 | |
| |
National General Holdings Corporation | | | 3.60 | |
| |
IBERIABANK Corporation | | | 3.44 | |
| |
Cray Incorporated | | | 3.41 | |
| |
Century Casinos Incorporated | | | 3.04 | |
| |
Air Lease Corporation | | | 2.85 | |
| |
Sterling Bancorp | | | 2.70 | |
| |
Sandstorm Gold Limited | | | 2.62 | |
|
| Sector distribution as of March 31, 20198 |
|
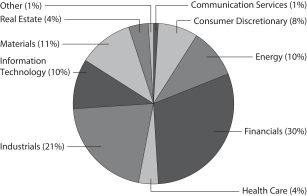 |
Please see footnotes on page 7.
| | | | |
| 10 | | Wells Fargo Small Cap Value Fund | | Fund expenses (unaudited) |
As a shareholder of the Fund, you incur two types of costs: (1) transaction costs, including sales charges (loads) on purchase payments and contingent deferred sales charges (if any) on redemptions and (2) ongoing costs, including management fees, distribution (12b-1) and/or shareholder servicing fees, and other Fund expenses. This example is intended to help you understand your ongoing costs (in dollars) of investing in the Fund and to compare these costs with the ongoing costs of investing in other mutual funds.
The example is based on an investment of $1,000 invested at the beginning of the six-month period and held for the entire period from October 1, 2018 to March 31, 2019.
Actual expenses
The “Actual” line of the table below provides information about actual account values and actual expenses. You may use the information in this line, together with the amount you invested, to estimate the expenses that you paid over the period. Simply divide your account value by $1,000 (for example, an $8,600 account value divided by $1,000 = 8.6), then multiply the result by the number in the “Actual” line under the heading entitled “Expenses paid during period” for your applicable class of shares to estimate the expenses you paid on your account during this period.
Hypothetical example for comparison purposes
The “Hypothetical” line of the table below provides information about hypothetical account values and hypothetical expenses based on the Fund’s actual expense ratio and an assumed rate of return of 5% per year before expenses, which is not the Fund’s actual return. The hypothetical account values and expenses may not be used to estimate the actual ending account balance or expenses you paid for the period. You may use this information to compare the ongoing costs of investing in the Fund and other funds. To do so, compare this 5% hypothetical example with the 5% hypothetical examples that appear in the shareholder reports of the other funds.
Please note that the expenses shown in the table are meant to highlight your ongoing costs only and do not reflect any transactional costs, such as sales charges (loads) and contingent deferred sales charges. Therefore, the “Hypothetical” line of the table is useful in comparing ongoing costs only and will not help you determine the relative total costs of owning different funds. In addition, if these transactional costs were included, your costs would have been higher.
| | | | | | | | | | | | | | | | |
| | | Beginning
account value
10-1-2018 | | | Ending
account value
3-31-2019 | | | Expenses
paid during
the period¹ | | | Annualized net
expense ratio | |
Class A | | | | | | | | | | | | | | | | |
| | | | |
Actual | | $ | 1,000.00 | | | $ | 904.04 | | | $ | 6.08 | | | | 1.28 | % |
| | | | |
Hypothetical (5% return before expenses) | | $ | 1,000.00 | | | $ | 1,018.55 | | | $ | 6.44 | | | | 1.28 | % |
Class C | | | | | | | | | | | | | | | | |
| | | | |
Actual | | $ | 1,000.00 | | | $ | 899.98 | | | $ | 9.62 | | | | 2.03 | % |
| | | | |
Hypothetical (5% return before expenses) | | $ | 1,000.00 | | | $ | 1,014.81 | | | $ | 10.20 | | | | 2.03 | % |
Class R6 | | | | | | | | | | | | | | | | |
| | | | |
Actual | | $ | 1,000.00 | | | $ | 906.17 | | | $ | 3.94 | | | | 0.83 | % |
| | | | |
Hypothetical (5% return before expenses) | | $ | 1,000.00 | | | $ | 1,020.79 | | | $ | 4.18 | | | | 0.83 | % |
Administrator Class | | | | | | | | | | | | | | | | |
| | | | |
Actual | | $ | 1,000.00 | | | $ | 904.35 | | | $ | 5.13 | | | | 1.08 | % |
| | | | |
Hypothetical (5% return before expenses) | | $ | 1,000.00 | | | $ | 1,019.55 | | | $ | 5.44 | | | | 1.08 | % |
Institutional Class | | | | | | | | | | | | | | | | |
| | | | |
Actual | | $ | 1,000.00 | | | $ | 906.00 | | | $ | 4.18 | | | | 0.88 | % |
| | | | |
Hypothetical (5% return before expenses) | | $ | 1,000.00 | | | $ | 1,020.54 | | | $ | 4.43 | | | | 0.88 | % |
| 1 | Expenses paid is equal to the annualized net expense ratio of each class multiplied by the average account value over the period, multiplied by the number of days in the most recent fiscal half-year divided by the number of days in the fiscal year (to reflect the one-half-year period). |
| | | | | | |
| Portfolio of investments—March 31, 2019 | | Wells Fargo Small Cap Value Fund | | | 11 | |
| | | | | | | | | | | | | | | | |
| Security name | | | | | | | | Shares | | | Value | |
| | | | |
Common Stocks: 99.02% | | | | | | | | | | | | | | | | |
| | | | |
Communication Services: 0.74% | | | | | | | | | | | | | | | | |
| | | | |
| Diversified Telecommunication Services: 0.74% | | | | | | | | | | | | | | | | |
| | | | |
Iridium Communications Incorporated † | | | | | | | | | | | 120,760 | | | $ | 3,192,894 | |
| | | | | | | | | | | | | | | | |
| | | | |
Consumer Discretionary: 8.22% | | | | | | | | | | | | | | | | |
| | | | |
| Auto Components: 0.39% | | | | | | | | | | | | | | | | |
| | | | |
Modine Manufacturing Company † | | | | | | | | | | | 122,073 | | | | 1,693,153 | |
| | | | | | | | | | | | | | | | |
| | | | |
| Automobiles: 0.05% | | | | | | | | | | | | | | | | |
| | | | |
Thor Industries Incorporated | | | | | | | | | | | 3,600 | | | | 224,532 | |
| | | | | | | | | | | | | | | | |
| | | | |
| Hotels, Restaurants & Leisure: 3.79% | | | | | | | | | | | | | | | | |
| | | | |
Century Casinos Incorporated † | | | | | | | | | | | 1,439,000 | | | | 13,037,340 | |
| | | | |
Scientific Games Corporation † | | | | | | | | | | | 156,900 | | | | 3,203,898 | |
| | | | |
| | | | | | | | | | | | | | | 16,241,238 | |
| | | | | | | | | | | | | | | | |
| | | | |
| Household Durables: 3.30% | | | | | | | | | | | | | | | | |
| | | | |
Cavco Industries Incorporated † | | | | | | | | | | | 28,100 | | | | 3,302,593 | |
| | | | |
Nobility Homes Incorporated | | | | | | | | | | | 89,800 | | | | 2,020,500 | |
| | | | |
Skyline Champion Corporation | | | | | | | | | | | 86,692 | | | | 1,647,148 | |
| | | | |
Taylor Morrison Home Corporation Class A † | | | | | | | | | | | 181,000 | | | | 3,212,750 | |
| | | | |
The New Home Company Incorporated † | | | | | | | | | | | 829,800 | | | | 3,949,848 | |
| | | | |
| | | | | | | | | | | | | | | 14,132,839 | |
| | | | | | | | | | | | | | | | |
| | | | |
| Leisure Products: 0.65% | | | | | | | | | | | | | | | | |
| | | | |
Vista Outdoor Incorporated † | | | | | | | | | | | 349,800 | | | | 2,801,898 | |
| | | | | | | | | | | | | | | | |
| | | | |
| Textiles, Apparel & Luxury Goods: 0.04% | | | | | | | | | | | | | | | | |
| | | | |
G-III Apparel Group Limited † | | | | | | | | | | | 4,000 | | | | 159,840 | |
| | | | | | | | | | | | | | | | |
| | | | |
Energy: 9.95% | | | | | | | | | | | | | | | | |
| | | | |
| Energy Equipment & Services: 3.68% | | | | | | | | | | | | | | | | |
| | | | |
CARBO Ceramics Incorporated † | | | | | | | | | | | 717,700 | | | | 2,511,950 | |
| | | | |
Newpark Resources Incorporated † | | | | | | | | | | | 575,800 | | | | 5,274,328 | |
| | | | |
Parker Drilling Company † | | | | | | | | | | | 8,360 | | | | 129,581 | |
| | | | |
Smart Sand Incorporated † | | | | | | | | | | | 466,300 | | | | 2,075,035 | |
| | | | |
Tidewater Incorporated † | | | | | | | | | | | 249,400 | | | | 5,783,586 | |
| | | | |
| | | | | | | | | | | | | | | 15,774,480 | |
| | | | | | | | | | | | | | | | |
| | | | |
| Oil, Gas & Consumable Fuels: 6.27% | | | | | | | | | | | | | | | | |
| | | | |
Navigator Holdings Limited † | | | | | | | | | | | 1,609,400 | | | | 17,703,400 | |
| | | | |
Nordic American Tanker Limited | | | | | | | | | | | 692,500 | | | | 1,398,850 | |
| | | | |
Oasis Petroleum Incorporated † | | | | | | | | | | | 342,800 | | | | 2,070,512 | |
| | | | |
Paramount Resources Limited Class A † | | | | | | | | | | | 266,500 | | | | 1,420,445 | |
| | | | |
Range Resources Corporation | | | | | | | | | | | 306,100 | | | | 3,440,564 | |
| | | | |
Southwestern Energy Company † | | | | | | | | | | | 184,900 | | | | 867,181 | |
| | | | |
| | | | | | | | | | | | | | | 26,900,952 | |
| | | | | | | | | | | | | | | | |
The accompanying notes are an integral part of these financial statements.
| | | | |
| 12 | | Wells Fargo Small Cap Value Fund | | Portfolio of investments—March 31, 2019 |
| | | | | | | | | | | | | | | | |
| Security name | | | | | | | | Shares | | | Value | |
| | | | |
Financials: 30.33% | | | | | | | | | | | | | | | | |
| | | | |
| Banks: 24.10% | | | | | | | | | | | | | | | | |
| | | | |
Ameris Bancorp | | | | | | | | | | | 233,600 | | | $ | 8,024,160 | |
| | | | |
Bank OZK | | | | | | | | | | | 189,800 | | | | 5,500,404 | |
| | | | |
BankUnited Incorporated | | | | | | | | | | | 245,400 | | | | 8,196,360 | |
| | | | |
CenterState Banks Incorporated | | | | | | | | | | | 404,000 | | | | 9,619,240 | |
| | | | |
First Horizon National Corporation | | | | | | | | | | | 586,300 | | | | 8,196,474 | |
| | | | |
Hanmi Financial Corporation | | | | | | | | | | | 194,900 | | | | 4,145,523 | |
| | | | |
Hope Bancorp Incorporated | | | | | | | | | | | 677,200 | | | | 8,857,776 | |
| | | | |
IBERIABANK Corporation | | | | | | | | | | | 206,000 | | | | 14,772,260 | |
| | | | |
LegacyTexas Financial Group | | | | | | | | | | | 216,400 | | | | 8,091,196 | |
| | | | |
Sterling Bancorp | | | | | | | | | | | 620,900 | | | | 11,567,367 | |
| | | | |
The Bancorp Incorporated † | | | | | | | | | | | 1,924,400 | | | | 15,549,152 | |
| | | | |
Valley National Bancorp | | | | | | | | | | | 91,200 | | | | 873,696 | |
| | | | |
| | | | | | | | | | | | | | | 103,393,608 | |
| | | | | | | | | | | | | | | | |
| | | | |
| Consumer Finance: 0.80% | | | | | | | | | | | | | | | | |
| | | | |
Enova International Incorporated † | | | | | | | | | | | 149,600 | | | | 3,413,872 | |
| | | | | | | | | | | | | | | | |
| | | | |
| Insurance: 3.62% | | | | | | | | | | | | | | | | |
| | | | |
First Acceptance Corporation † | | | | | | | | | | | 83,100 | | | | 103,875 | |
| | | | |
National General Holdings Corporation | | | | | | | | | | | 650,500 | | | | 15,436,365 | |
| | | | |
| | | | | | | | | | | | | | | 15,540,240 | |
| | | | | | | | | | | | | | | | |
| | | | |
| Mortgage REITs: 0.13% | | | | | | | | | | | | | | | | |
| | | | |
Redwood Trust Incorporated | | | | | | | | | | | 35,100 | | | | 566,865 | |
| | | | | | | | | | | | | | | | |
| | | | |
| Thrifts & Mortgage Finance: 1.68% | | | | | | | | | | | | | | | | |
| | | | |
Axos Financial Incorporated † | | | | | | | | | | | 91,500 | | | | 2,649,840 | |
| | | | |
Essent Group Limited † | | | | | | | | | | | 99,700 | | | | 4,331,965 | |
| | | | |
NMI Holdings Incorporated Class A † | | | | | | | | | | | 8,400 | | | | 217,308 | |
| | | | |
| | | | | | | | | | | | | | | 7,199,113 | |
| | | | | | | | | | | | | | | | |
| | | | |
Health Care: 3.93% | | | | | | | | | | | | | | | | |
| | | | |
| Health Care Equipment & Supplies: 0.41% | | | | | | | | | | | | | | | | |
| | | | |
Hologic Incorporated † | | | | | | | | | | | 32,500 | | | | 1,573,000 | |
| | | | |
Lantheus Holdings Incorporated † | | | | | | | | | | | 7,381 | | | | 180,687 | |
| | | | |
| | | | | | | | | | | | | | | 1,753,687 | |
| | | | | | | | | | | | | | | | |
| | | | |
| Health Care Providers & Services: 1.45% | | | | | | | | | | | | | | | | |
| | | | |
Cross Country Healthcare Incorporated † | | | | | | | | | | | 43,300 | | | | 304,399 | |
| | | | |
Tivity Health Incorporated † | | | | | | | | | | | 337,900 | | | | 5,933,524 | |
| | | | |
| | | | | | | | | | | | | | | 6,237,923 | |
| | | | | | | | | | | | | | | | |
| | | | |
| Health Care Technology: 1.30% | | | | | | | | | | | | | | | | |
| | | | |
Allscripts Healthcare Solutions Incorporated † | | | | | | | | | | | 582,300 | | | | 5,555,142 | |
| | | | | | | | | | | | | | | | |
| | | | |
| Pharmaceuticals: 0.77% | | | | | | | | | | | | | | | | |
| | | | |
Prestige Consumer Healthcare Incorporated † | | | | | | | | | | | 110,300 | | | | 3,299,073 | |
| | | | | | | | | | | | | | | | |
The accompanying notes are an integral part of these financial statements.
| | | | | | |
| Portfolio of investments—March 31, 2019 | | Wells Fargo Small Cap Value Fund | | | 13 | |
| | | | | | | | | | | | | | | | |
| Security name | | | | | | | | Shares | | | Value | |
| | | | |
Industrials: 21.44% | | | | | | | | | | | | | | | | |
| | | | |
| Air Freight & Logistics: 1.04% | | | | | | | | | | | | | | | | |
| | | | |
Atlas Air Worldwide Holdings Incorporated † | | | | | | | | | | | 87,800 | | | $ | 4,439,168 | |
| | | | | | | | | | | | | | | | |
| | | | |
| Building Products: 4.46% | | | | | | | | | | | | | | | | |
| | | | |
Armstrong Flooring Incorporated † | | | | | | | | | | | 379,900 | | | | 5,166,640 | |
| | | | |
Builders FirstSource Incorporated † | | | | | | | | | | | 777,500 | | | | 10,371,850 | |
| | | | |
CSW Industrials Incorporated † | | | | | | | | | | | 62,900 | | | | 3,603,541 | |
| | | | |
| | | | | | | | | | | | | | | 19,142,031 | |
| | | | | | | | | | | | | | | | |
| | | | |
| Commercial Services & Supplies: 2.71% | | | | | | | | | | | | | | | | |
| | | | |
ABM Industries Incorporated | | | | | | | | | | | 98,100 | | | | 3,565,935 | |
| | | | |
ACCO Brands Corporation | | | | | | | | | | | 881,700 | | | | 7,547,352 | |
| | | | |
Healthcare Services Group Incorporated | | | | | | | | | | | 5,400 | | | | 178,146 | |
| | | | |
Hudson Technologies Incorporated † | | | | | | | | | | | 180,500 | | | | 348,365 | |
| | | | |
| | | | | | | | | | | | | | | 11,639,798 | |
| | | | | | | | | | | | | | | | |
| | | | |
| Construction & Engineering: 1.98% | | | | | | | | | | | | | | | | |
| | | | |
Bird Construction Incorporated (a) | | | | | | | | | | | 250,500 | | | | 1,469,908 | |
| | | | |
IES Holdings Incorporated † | | | | | | | | | | | 104,000 | | | | 1,848,080 | |
| | | | |
Tutor Perini Corporation † | | | | | | | | | | | 302,500 | | | | 5,178,800 | |
| | | | |
| | | | | | | | | | | | | | | 8,496,788 | |
| | | | | | | | | | | | | | | | |
| | | | |
| Machinery: 3.13% | | | | | | | | | | | | | | | | |
| | | | |
FreightCar America Incorporated (l)† | | | | | | | | | | | 736,700 | | | | 4,538,072 | |
| | | | |
Milacron Holdings Corporation † | | | | | | | | | | | 309,000 | | | | 3,497,880 | |
| | | | |
Mueller Water Products Incorporated Class A | | | | | | | | | | | 536,100 | | | | 5,382,444 | |
| | | | |
| | | | | | | | | | | | | | | 13,418,396 | |
| | | | | | | | | | | | | | | | |
| | | | |
| Marine: 1.20% | | | | | | | | | | | | | | | | |
| | | | |
Seaspan Corporation | | | | | | | | | | | 592,700 | | | | 5,156,490 | |
| | | | | | | | | | | | | | | | |
| | | | |
| Professional Services: 1.10% | | | | | | | | | | | | | | | | |
| | | | |
Hill International Incorporated † | | | | | | | | | | | 1,609,700 | | | | 4,700,324 | |
| | | | | | | | | | | | | | | | |
| | | | |
| Trading Companies & Distributors: 5.82% | | | | | | | | | | | | | | | | |
| | | | |
Air Lease Corporation | | | | | | | | | | | 355,800 | | | | 12,221,730 | |
| | | | |
Applied Industrial Technologies Incorporated | | | | | | | | | | | 77,500 | | | | 4,608,925 | |
| | | | |
Beacon Roofing Supply Incorporated † | | | | | | | | | | | 90,500 | | | | 2,910,480 | |
| | | | |
BMC Stock Holdings Incorporated † | | | | | | | | | | | 205,400 | | | | 3,629,418 | |
| | | | |
Textainer Group Holdings Limited † | | | | | | | | | | | 166,300 | | | | 1,604,795 | |
| | | | |
| | | | | | | | | | | | | | | 24,975,348 | |
| | | | | | | | | | | | | | | | |
| | | | |
Information Technology: 9.95% | | | | | | | | | | | | | | | | |
| | | | |
| Communications Equipment: 2.01% | | | | | | | | | | | | | | | | |
| | | | |
Finisar Corporation † | | | | | | | | | | | 127,400 | | | | 2,951,858 | |
| | | | |
Harmonic Incorporated † | | | | | | | | | | | 1,042,400 | | | | 5,649,808 | |
| | | | |
| | | | | | | | | | | | | | | 8,601,666 | |
| | | | | | | | | | | | | | | | |
The accompanying notes are an integral part of these financial statements.
| | | | |
| 14 | | Wells Fargo Small Cap Value Fund | | Portfolio of investments—March 31, 2019 |
| | | | | | | | | | | | | | | | |
| Security name | | | | | | | | Shares | | | Value | |
| | | | |
| Electronic Equipment, Instruments & Components: 1.25% | | | | | | | | | | | | | | | | |
| | | | |
Coherent Incorporated † | | | | | | | | | | | 19,200 | | | $ | 2,721,024 | |
| | | | |
OSI Systems Incorporated † | | | | | | | | | | | 30,100 | | | | 2,636,760 | |
| | | | |
| | | | | | | | | | | | | | | 5,357,784 | |
| | | | | | | | | | | | | | | | |
| | | | |
| IT Services: 1.40% | | | | | | | | | | | | | | | | |
| | | | |
CACI International Incorporated Class A † | | | | | | | | | | | 7,900 | | | | 1,437,958 | |
| | | | |
Net 1 UEPS Technologies Incorporated † | | | | | | | | | | | 384,700 | | | | 1,381,073 | |
| | | | |
Unisys Corporation † | | | | | | | | | | | 274,300 | | | | 3,201,081 | |
| | | | |
| | | | | | | | | | | | | | | 6,020,112 | |
| | | | | | | | | | | | | | | | |
| | | | |
| Semiconductors & Semiconductor Equipment: 0.92% | | | | | | | | | | | | | | | | |
| | | | |
Ichor Holdings Limited † | | | | | | | | | | | 52,200 | | | | 1,178,676 | |
| | | | |
Tower Semiconductor Limited † | | | | | | | | | | | 166,200 | | | | 2,752,272 | |
| | | | |
| | | | | | | | | | | | | | | 3,930,948 | |
| | | | | | | | | | | | | | | | |
| | | | |
| Technology Hardware, Storage & Peripherals: 4.37% | | | | | | | | | | | | | | | | |
| | | | |
Cray Incorporated † | | | | | | | | | | | 562,000 | | | | 14,640,100 | |
| | | | |
Quantum Corporation (l)† | | | | | | | | | | | 1,733,100 | | | | 4,124,778 | |
| | | | |
| | | | | | | | | | | | | | | 18,764,878 | |
| | | | | | | | | | | | | | | | |
| | | | |
Materials: 10.98% | | | | | | | | | | | | | | | | |
| | | | |
| Containers & Packaging: 1.07% | | | | | | | | | | | | | | | | |
| | | | |
Intertape Polymer Group Incorporated (a) | | | | | | | | | | | 338,200 | | | | 4,570,952 | |
| | | | | | | | | | | | | | | | |
| | | | |
| Metals & Mining: 9.91% | | | | | | | | | | | | | | | | |
| | | | |
Agnico Eagle Mines Limited-U.S. Exchange Traded Shares | | | | | | | | | | | 5,000 | | | | 217,500 | |
| | | | |
Argonaut Gold Incorporated † | | | | | | | | | | | 534,600 | | | | 748,440 | |
| | | | |
Barrick Gold Corporation | | | | | | | | | | | 1,173,301 | | | | 16,085,957 | |
| | | | |
Carpenter Technology Corporation | | | | | | | | | | | 90,100 | | | | 4,131,085 | |
| | | | |
Eldorado Gold Corporation † | | | | | | | | | | | 172,860 | | | | 800,342 | |
| | | | |
Haynes International Incorporated | | | | | | | | | | | 202,500 | | | | 6,648,075 | |
| | | | |
NovaGold Resources Incorporated † | | | | | | | | | | | 153,800 | | | | 641,346 | |
| | | | |
Olympic Steel Incorporated | | | | | | | | | | | 4,900 | | | | 77,763 | |
| | | | |
Sandstorm Gold Limited † | | | | | | | | | | | 2,052,034 | | | | 11,245,146 | |
| | | | |
Schnitzer Steel Industries Incorporated Class A | | | | | | | | | | | 9,400 | | | | 225,600 | |
| | | | |
SSR Mining Incorporated † | | | | | | | | | | | 130,800 | | | | 1,655,929 | |
| | | | |
TimkenSteel Corporation † | | | | | | | | | | | 4,100 | | | | 44,526 | |
| | | | |
| | | | | | | | | | | | | | | 42,521,709 | |
| | | | | | | | | | | | | | | | |
| | | | |
Real Estate: 3.48% | | | | | | | | | | | | | | | | |
| | | | |
| Equity REITs: 3.48% | | | | | | | | | | | | | | | | |
| | | | |
PotlatchDeltic Corporation | | | | | | | | | | | 169,800 | | | | 6,416,742 | |
| | | | |
UMH Properties Incorporated | | | | | | | | | | | 603,300 | | | | 8,494,464 | |
| | | | |
| | | | | | | | | | | | | | | 14,911,206 | |
| | | | | | | | | | | | | | | | |
| | | | |
Total Common Stocks (Cost $408,033,400) | | | | | | | | | | | | | | | 424,728,947 | |
| | | | | | | | | | | | | | | | |
The accompanying notes are an integral part of these financial statements.
| | | | | | |
| Portfolio of investments—March 31, 2019 | | Wells Fargo Small Cap Value Fund | | | 15 | |
| | | | | | | | | | | | | | | | |
| Security name | | | | | | | | Shares | | | Value | |
| | | | |
Exchange-Traded Funds: 0.85% | | | | | | | | | | | | | | | | |
| | | | |
SPDR S&P Regional Banking ETF | | | | | | | | | | | 22,400 | | | $ | 1,150,016 | |
| | | | |
VanEck Vectors Gold Miners ETF | | | | | | | | | | | 72,300 | | | | 1,620,966 | |
| | | | |
VanEck Vectors Junior Gold Miners ETF | | | | | | | | | | | 27,000 | | | | 856,710 | |
| | | | |
Total Exchange-Traded Funds (Cost $2,927,612) | | | | | | | | | | | | | | | 3,627,692 | |
| | | | | | | | | | | | | | | | |
| | | | |
| | | Yield | | | | | | | | | | |
| Short-Term Investments: 0.16% | | | | | | | | | | | | | | | | |
| | | | |
| Investment Companies: 0.16% | | | | | | | | | | | | | | | | |
| | | | |
Wells Fargo Government Money Market Fund Select Class (l)(u) | | | 2.38 | % | | | | | | | 681,307 | | | | 681,307 | |
| | | | | | | | | | | | | | | | |
| | | | |
Total Short-Term Investments (Cost $681,307) | | | | | | | | | | | | | | | 681,307 | |
| | | | | | | | | | | | | | | | |
| | | | | | | | |
| Total investments in securities (Cost $411,642,319) | | | 100.03 | % | | | 429,037,946 | |
| | |
Other assets and liabilities, net | | | (0.03 | ) | | | (123,363 | ) |
| | | | | | | | |
| Total net assets | | | 100.00 | % | | $ | 428,914,583 | |
| | | | | | | | |
| † | Non-income-earning security |
| (a) | The security is fair valued in accordance with procedures approved by the Board of Trustees. |
| (l) | The issuer of the security is an affiliated person of the Fund as defined in the Investment Company Act of 1940. |
| (u) | The rate represents the 7-day annualized yield at period end. |
Abbreviations:
| REIT | Real estate investment trust |
The accompanying notes are an integral part of these financial statements.
| | | | |
| 16 | | Wells Fargo Small Cap Value Fund | | Portfolio of investments—March 31, 2019 |
Investments in Affiliates
An affiliated investment is an investment in which the Fund owns at least 5% of the outstanding voting shares of the issuer or as a result of other relationships, such as the Fund and the issuer having the same investment manager. Transactions with issuers that were either affiliated persons of the Fund at the beginning of the period or the end of the period were as follows:
| | | | | | | | | | | | | | | | | | | | | | | | | | | | | | | | | | | | |
| | | Shares,
beginning of
period | | | Shares
purchased | | | Shares
sold | | | Shares,
end of
period | | | Net
realized
gains
(losses) | | | Net
change in
unrealized
gains
(losses) | | | Income
from
affiliated
securities | | | Value,
end
of period | | | % of
net
assets | |
Common Stocks | | | | | | | | | | | | | | | | | | | | | | | | | | | | | | | | | | | | |
Industrials | | | | | | | | | | | | | | | | | | | | | | | | | | | | | | | | | | | | |
Machinery | | | | | | | | | | | | | | | | | | | | | | | | | | | | | | | | | | | | |
FreightCar America Incorporated † | | | 697,800 | | | | 38,900 | | | | 0 | | | | 736,700 | | | $ | 0 | | | $ | (5,434,331 | ) | | $ | 0 | | | $ | 4,538,072 | | | | | |
| | | | | | | | | |
Information Technology | | | | | | | | | | | | | | | | | | | | | | | | | | | | | | | | | | | | |
Technology Hardware, Storage & Peripherals | | | | | | | | | | | | | | | | | | | | | | | | | | | | | | | | | | | | |
Quantum Corporation † | | | 1,090,300 | | | | 642,800 | | | | 0 | | | | 1,733,100 | | | | 0 | | | | (9,885,880 | ) | | | 0 | | | | 4,124,778 | | | | | |
| | | | | | | | | |
Financials | | | | | | | | | | | | | | | | | | | | | | | | | | | | | | | | | | | | |
Capital Markets | | | | | | | | | | | | | | | | | | | | | | | | | | | | | | | | | | | | |
Medley Management Incorporated Class A * | | | 323,400 | | | | 0 | | | | 323,400 | | | | 0 | | | | (3,574,301 | ) | | | 3,438,521 | | | | 121,160 | | | | 0 | | | | | |
| | | | | | | | | |
| | | | | | | | | | | | | | | | | | | | | | | | | | | | | | | 8,662,850 | | | | 2.02 | % |
| | | | | | | | | | | | | | | | | | | | | | | | | | | | | | | | | | | | |
| | | | | | | | | |
Short-Term Investments | | | | | | | | | | | | | | | | | | | | | | | | | | | | | | | | | | | | |
Investment Companies | | | | | | | | | | | | | | | | | | | | | | | | | | | | | | | | | | | | |
Wells Fargo Government Money Market Fund Select Class | | | 1,673,791 | | | | 93,580,781 | | | | 94,573,265 | | | | 681,307 | | | | 0 | | | | 0 | | | | 43,998 | | | | 681,307 | | | | 0.16 | |
| | | | | | | | | | | | | | | | | | | | | | | | | | | | | | | | | | | | |
| | | | | | | | | |
| | | | | | | | | | | | | | | | | | $ | (3,574,301 | ) | | $ | (11,881,690 | ) | | $ | 165,158 | | | $ | 9,344,157 | | | | 2.18 | % |
| | | | | | | | | | | | | | | | | | | | | | | | | | | | | | | | | | | | |
| | * | No longer held at the end of the period. |
| | † | Non-income-earning security |
The accompanying notes are an integral part of these financial statements.
| | | | | | |
| Statement of assets and liabilities—March 31, 2019 | | Wells Fargo Small Cap Value Fund | | | 17 | |
| | | | |
| | | | |
| |
Assets | | | | |
Investments in unaffiliated securities, at value (cost $385,770,621) | | $ | 419,693,789 | |
Investments in affiliated securities, at value (cost $25,871,698) | | | 9,344,157 | |
Receivable for investments sold | | | 1,623,466 | |
Receivable for Fund shares sold | | | 439,411 | |
Receivable for dividends | | | 298,611 | |
Prepaid expenses and other assets | | | 37,506 | |
| | | | |
Total assets | | | 431,436,940 | |
| | | | |
| |
Liabilities | | | | |
Payable for investments purchased | | | 1,516,761 | |
Payable for Fund shares redeemed | | | 336,750 | |
Management fee payable | | | 276,718 | |
Due to custodian bank | | | 114,727 | |
Administration fees payable | | | 70,872 | |
Distribution fee payable | | | 7,078 | |
Trustees’ fees and expenses payable | | | 1,906 | |
Accrued expenses and other liabilities | | | 197,545 | |
| | | | |
Total liabilities | | | 2,522,357 | |
| | | | |
Total net assets | | $ | 428,914,583 | |
| | | | |
| |
NET ASSETS CONSIST OF | | | | |
Paid-in capital | | $ | 381,795,977 | |
Total distributable earnings | | | 47,118,606 | |
| | | | |
Total net assets | | $ | 428,914,583 | |
| | | | |
| |
COMPUTATION OF NET ASSET VALUE AND OFFERING PRICE PER SHARE | | | | |
Net assets – Class A | | $ | 353,030,781 | |
Shares outstanding – Class A1 | | | 27,997,544 | |
Net asset value per share – Class A | | | $12.61 | |
Maximum offering price per share – Class A2 | | | $13.38 | |
Net assets – Class C | | $ | 10,609,857 | |
Shares outstanding – Class C1 | | | 1,433,231 | |
Net asset value per share – Class C | | | $7.40 | |
Net assets – Class R6 | | $ | 34,135,544 | |
Shares outstanding – Class R61 | | | 2,435,079 | |
Net asset value per share – Class R6 | | | $14.02 | |
Net assets – Administrator Class | | $ | 7,571,408 | |
Shares outstanding – Administrator Class1 | | | 548,482 | |
Net asset value per share – Administrator Class | | | $13.80 | |
Net assets – Institutional Class | | $ | 23,566,993 | |
Shares outstanding – Institutional Class1 | | | 1,685,998 | |
Net asset value per share – Institutional Class | | | $13.98 | |
| 1 | The Fund has an unlimited number of authorized shares. |
| 2 | Maximum offering price is computed as 100/94.25 of net asset value. On investments of $50,000 or more, the offering price is reduced. |
The accompanying notes are an integral part of these financial statements.
| | | | |
| 18 | | Wells Fargo Small Cap Value Fund | | Statement of operations—year ended March 31, 2019 |
| | | | |
| | | | |
| |
Investment income | | | | |
Dividends (net of foreign withholding taxes of $36,631) | | $ | 4,713,069 | |
Income from affiliated securities | | | 165,158 | |
| | | | |
Total investment income | | | 4,878,227 | |
| | | | |
| |
Expenses | | | | |
Management fee | | | 4,247,020 | |
Administration fees | | | | |
Class A | | | 846,172 | |
Class C | | | 42,359 | |
Class R6 | | | 11,977 | |
Administrator Class | | | 11,695 | |
Institutional Class | | | 36,962 | |
Shareholder servicing fees | | | | |
Class A | | | 1,007,347 | |
Class C | | | 50,427 | |
Administrator Class | | | 22,257 | |
Distribution fee | | | | |
Class C | | | 151,282 | |
Custody and accounting fees | | | 31,260 | |
Professional fees | | | 57,228 | |
Registration fees | | | 73,587 | |
Shareholder report expenses | | | 92,725 | |
Trustees’ fees and expenses | | | 22,721 | |
Other fees and expenses | | | 26,130 | |
| | | | |
Total expenses | | | 6,731,149 | |
Less: Fee waivers and/or expense reimbursements | | | (485,332 | ) |
| | | | |
Net expenses | | | 6,245,817 | |
| | | | |
Net investment loss | | | (1,367,590 | ) |
| | | | |
| |
REALIZED AND UNREALIZED GAINS (LOSSES) ON INVESTMENTS | | | | |
| |
Net realized gains (losses) on: | | | | |
Unaffiliated securities | | | 54,825,615 | |
Affiliated securities | | | (3,574,301 | ) |
| | | | |
Net realized gains on investments | | | 51,251,314 | |
| | | | |
| |
Net change in unrealized gains (losses) on: | | | | |
Unaffiliated securities | | | (72,028,665 | ) |
Affiiliated securities | | | (11,881,690 | ) |
| | | | |
Net change in unrealized gains (losses) on investments | | | (83,910,355 | ) |
| | | | |
Net realized and unrealized gains (losses) on investments | | | (32,659,041 | ) |
| | | | |
Net decrease in net assets resulting from operations | | $ | (34,026,631 | ) |
| | | | |
The accompanying notes are an integral part of these financial statements.
| | | | | | |
| Statement of changes in net assets | | Wells Fargo Small Cap Value Fund | | | 19 | |
| | | | | | | | | | | | | | | | |
| | | Year ended
March 31, 2019 | | | Year ended
March 31, 20181 | |
| | | |
Operations | | | | | | | | | | | | |
Net investment loss | | | | | | $ | (1,367,590 | ) | | | | | | $ | (2,802,360 | ) |
Net realized gains on investments | | | | | | | 51,251,314 | | | | | | | | 316,315,049 | |
Net change in unrealized gains (losses) on investments | | | | | | | (83,910,355 | ) | | | | | | | (259,345,164 | ) |
| | | | |
Net increase (decrease) in net assets resulting from operations | | | | | | | (34,026,631 | ) | | | | | | | 54,167,525 | |
| | | | |
|
Distributions to shareholders from net investment income and net realized gains | |
Class A | | | | | | | (71,877,689 | ) | | | | | | | (139,185,621 | ) |
Class C | | | | | | | (5,381,139 | ) | | | | | | | (11,577,587 | ) |
Class R6 | | | | | | | (6,938,699 | ) | | | | | | | (18,852,432 | ) |
Administrator Class | | | | | | | (1,539,465 | ) | | | | | | | (3,280,317 | ) |
Institutional Class | | | | | | | (4,505,760 | ) | | | | | | | (59,214,889 | ) |
| | | | |
Total distributions to shareholders | | | | | | | (90,242,752 | ) | | | | | | | (232,110,846 | ) |
| | | | |
| | | | |
Capital share transactions | | | Shares | | | | | | | | Shares | | | | | |
Proceeds from shares sold | | | | | | | | | | | | | | | | |
Class A | | | 1,378,910 | | | | 19,869,995 | | | | 1,049,139 | | | | 20,283,556 | |
Class C | | | 85,413 | | | | 760,928 | | | | 82,745 | | | | 1,093,645 | |
Class R6 | | | 314,495 | | | | 4,957,498 | | | | 362,552 | | | | 7,674,684 | |
Administrator Class | | | 72,948 | | | | 1,228,586 | | | | 79,721 | | | | 1,605,699 | |
Institutional Class | | | 371,588 | | | | 6,490,839 | | | | 453,494 | | | | 9,352,699 | |
| | | | |
| | | | |
| | | | | | | 33,307,846 | | | | | | | | 40,010,283 | |
| | | | |
Reinvestment of distributions | | | | | | | | | | | | | | | | |
Class A | | | 5,855,579 | | | | 70,149,839 | | | | 7,549,312 | | | | 135,464,919 | |
Class C | | | 724,350 | | | | 5,106,665 | | | | 870,426 | | | | 10,955,100 | |
Class R6 | | | 477,445 | | | | 6,350,028 | | | | 964,823 | | | | 18,847,152 | |
Administrator Class | | | 101,619 | | | | 1,332,230 | | | | 144,268 | | | | 2,762,509 | |
Institutional Class | | | 327,365 | | | | 4,340,864 | | | | 2,910,455 | | | | 57,830,989 | |
| | | | |
| | | | |
| | | | | | | 87,279,626 | | | | | | | | 225,860,669 | |
| | | | |
Payment for shares redeemed | | | | | | | | | | | | | | | | |
Class A | | | (4,853,428 | ) | | | (75,405,593 | ) | | | (5,792,964 | ) | | | (110,590,516 | ) |
Class C | | | (1,548,014 | ) | | | (13,673,784 | ) | | | (909,855 | ) | | | (12,886,548 | ) |
Class R6 | | | (714,540 | ) | | | (11,020,449 | ) | | | (2,930,324 | ) | | | (61,212,656 | ) |
Administrator Class | | | (167,945 | ) | | | (2,777,438 | ) | | | (251,974 | ) | | | (5,114,206 | ) |
Institutional Class | | | (781,425 | ) | | | (13,646,724 | ) | | | (19,803,060 | ) | | | (399,900,378 | ) |
| | | | |
| | | | |
| | | | | | | (116,523,988 | ) | | | | | | | (589,704,304 | ) |
| | | | |
Net increase (decrease) in net assets resulting from capital share transactions | | | | | | | 4,063,484 | | | | | | | | (323,833,352 | ) |
| | | | |
Total decrease in net assets | | | | | | | (120,205,899 | ) | | | | | | | (501,776,673 | ) |
| | | | |
| | |
Net assets | | | | | | | | |
Beginning of period | | | | | | | 549,120,482 | | | | | | | | 1,050,897,155 | |
| | | | |
End of period | | | | | | $ | 428,914,583 | | | | | | | $ | 549,120,482 | |
| | | | |
| 1 | Effective for all filings after November 4, 2018, the SEC prospectively eliminated the requirement to parenthetically disclose undistributed net investment income at the end of the period and permitted the aggregation of distributions, with the exception of tax basis returns of capital. Accumulated net investment loss at March 31, 2018 was $666,360. The disaggregated distributions information for the year ended March 31, 2018 is included in Note 7,Distributions to Shareholders, in the notes to the financial statements. |
The accompanying notes are an integral part of these financial statements.
| | | | |
| 20 | | Wells Fargo Small Cap Value Fund | | Financial highlights |
(For a share outstanding throughout each period)
| | | | | | | | | | | | | | | | | | | | |
| | | Year ended March 31 | |
| CLASS A | | 2019 | | | 2018 | | | 2017 | | | 2016 | | | 2015 | |
Net asset value, beginning of period | | | $17.09 | | | | $21.68 | | | | $18.84 | | | | $27.51 | | | | $35.74 | |
Net investment income (loss) | | | (0.05 | )1 | | | (0.09 | )1 | | | (0.11 | ) | | | (0.06 | )1 | | | 0.01 | 1 |
Net realized and unrealized gains (losses) on investments | | | (1.31 | ) | | | 1.62 | | | | 5.45 | | | | (1.19 | ) | | | (2.55 | ) |
| | | | | | | | | | | | | | | | | | | | |
Total from investment operations | | | (1.36 | ) | | | 1.53 | | | | 5.34 | | | | (1.25 | ) | | | (2.54 | ) |
Distributions to shareholders from | | | | | | | | | | | | | | | | | | | | |
Net investment income | | | 0.00 | | | | 0.00 | | | | 0.00 | | | | 0.00 | | | | (0.13 | ) |
Net realized gains | | | (3.12 | ) | | | (6.12 | ) | | | (2.50 | ) | | | (7.42 | ) | | | (5.56 | ) |
| | | | | | | | | | | | | | | | | | | | |
Total distributions to shareholders | | | (3.12 | ) | | | (6.12 | ) | | | (2.50 | ) | | | (7.42 | ) | | | (5.69 | ) |
Net asset value, end of period | | | $12.61 | | | | $17.09 | | | | $21.68 | | | | $18.84 | | | | $27.51 | |
Total return2 | | | (7.00 | )% | | | 7.97 | % | | | 29.92 | % | | | (2.90 | )% | | | (7.29 | )% |
Ratios to average net assets (annualized) | | | | | | | | | | | | | | | | | | | | |
Gross expenses | | | 1.37 | % | | | 1.33 | % | | | 1.32 | % | | | 1.36 | % | | | 1.35 | % |
Net expenses | | | 1.28 | % | | | 1.28 | % | | | 1.28 | % | | | 1.28 | % | | | 1.29 | % |
Net investment income (loss) | | | (0.31 | )% | | | (0.47 | )% | | | (0.48 | )% | | | (0.27 | )% | | | 0.02 | % |
Supplemental data | | | | | | | | | | | | | | | | | | | | |
Portfolio turnover rate | | | 37 | % | | | 36 | % | | | 31 | % | | | 16 | % | | | 9 | % |
Net assets, end of period (000s omitted) | | | $353,031 | | | | $437,704 | | | | $494,607 | | | | $441,679 | | | | $289,669 | |
| 1 | Calculated based upon average shares outstanding |
| 2 | Total return calculations do not include any sales charges. |
The accompanying notes are an integral part of these financial statements.
| | | | | | |
| Financial highlights | | Wells Fargo Small Cap Value Fund | | | 21 | |
(For a share outstanding throughout each period)
| | | | | | | | | | | | | | | | | | | | |
| | | Year ended March 31 | |
| CLASS C | | 2019 | | | 2018 | | | 2017 | | | 2016 | | | 2015 | |
Net asset value, beginning of period | | | $11.56 | | | | $16.67 | | | | $15.09 | | | | $23.80 | | | | $31.89 | |
Net investment loss | | | (0.11 | )1 | | | (0.17 | )1 | | | (0.20 | )1 | | | (0.24 | )1 | | | (0.20 | )1 |
Net realized and unrealized gains (losses) on investments | | | (0.93 | ) | | | 1.18 | | | | 4.28 | | | | (1.05 | ) | | | (2.27 | ) |
| | | | | | | | | | | | | | | | | | | | |
Total from investment operations | | | (1.04 | ) | | | 1.01 | | | | 4.08 | | | | (1.29 | ) | | | (2.47 | ) |
Distributions to shareholders from | | | | | | | | | | | | | | | | | | | | |
Net investment income | | | 0.00 | | | | 0.00 | | | | 0.00 | | | | 0.00 | | | | (0.06 | ) |
Net realized gains | | | (3.12 | ) | | | (6.12 | ) | | | (2.50 | ) | | | (7.42 | ) | | | (5.56 | ) |
| | | | | | | | | | | | | | | | | | | | |
Total distributions to shareholders | | | (3.12 | ) | | | (6.12 | ) | | | (2.50 | ) | | | (7.42 | ) | | | (5.62 | ) |
Net asset value, end of period | | | $7.40 | | | | $11.56 | | | | $16.67 | | | | $15.09 | | | | $23.80 | |
Total return2 | | | (7.67 | )% | | | 7.08 | % | | | 28.93 | % | | | (3.58 | )% | | | (8.00 | )% |
Ratios to average net assets (annualized) | | | | | | | | | | | | | | | | | | | | |
Gross expenses | | | 2.12 | % | | | 2.08 | % | | | 2.07 | % | | | 2.11 | % | | | 2.10 | % |
Net expenses | | | 2.03 | % | | | 2.03 | % | | | 2.03 | % | | | 2.03 | % | | | 2.04 | % |
Net investment loss | | | (1.02 | )% | | | (1.23 | )% | | | (1.23 | )% | | | (1.18 | )% | | | (0.70 | )% |
Supplemental data | | | | | | | | | | | | | | | | | | | | |
Portfolio turnover rate | | | 37 | % | | | 36 | % | | | 31 | % | | | 16 | % | | | 9 | % |
Net assets, end of period (000s omitted) | | | $10,610 | | | | $25,111 | | | | $35,470 | | | | $33,601 | | | | $80,969 | |
| 1 | Calculated based upon average shares outstanding |
| 2 | Total return calculations do not include any sales charges. |
The accompanying notes are an integral part of these financial statements.
| | | | |
| 22 | | Wells Fargo Small Cap Value Fund | | Financial highlights |
(For a share outstanding throughout each period)
| | | | | | | | | | | | | | | | | | | | |
| | | Year ended March 31 | |
| CLASS R6 | | 2019 | | | 2018 | | | 2017 | | | 2016 | | | 2015 | |
Net asset value, beginning of period | | | $18.52 | | | | $22.93 | | | | $19.72 | | | | $28.29 | | | | $36.52 | |
Net investment income (loss) | | | 0.03 | 1 | | | (0.00 | )1,2 | | | (0.01 | )1 | | | 0.03 | 1 | | | 0.23 | 1 |
Net realized and unrealized gains (losses) on investments | | | (1.41 | ) | | | 1.71 | | | | 5.72 | | | | (1.18 | ) | | | (2.69 | ) |
| | | | | | | | | | | | | | | | | | | | |
Total from investment operations | | | (1.38 | ) | | | 1.71 | | | | 5.71 | | | | (1.15 | ) | | | (2.46 | ) |
Distributions to shareholders from | | | | | | | | | | | | | | | | | | | | |
Net investment income | | | 0.00 | | | | 0.00 | | | | 0.00 | | | | 0.00 | | | | (0.21 | ) |
Net realized gains | | | (3.12 | ) | | | (6.12 | ) | | | (2.50 | ) | | | (7.42 | ) | | | (5.56 | ) |
| | | | | | | | | | | | | | | | | | | | |
Total distributions to shareholders | | | (3.12 | ) | | | (6.12 | ) | | | (2.50 | ) | | | (7.42 | ) | | | (5.77 | ) |
Net asset value, end of period | | | $14.02 | | | | $18.52 | | | | $22.93 | | | | $19.72 | | | | $28.29 | |
Total return | | | (6.55 | )% | | | 8.38 | % | | | 30.50 | % | | | (2.43 | )% | | | (6.90 | )% |
Ratios to average net assets (annualized) | | | | | | | | | | | | | | | | | | | | |
Gross expenses | | | 0.94 | % | | | 0.89 | % | | | 0.89 | % | | | 0.92 | % | | | 0.87 | % |
Net expenses | | | 0.83 | % | | | 0.83 | % | | | 0.83 | % | | | 0.83 | % | | | 0.83 | % |
Net investment income (loss) | | | 0.15 | % | | | (0.01 | )% | | | (0.03 | )% | | | 0.12 | % | | | 0.72 | % |
Supplemental data | | | | | | | | | | | | | | | | | | | | |
Portfolio turnover rate | | | 37 | % | | | 36 | % | | | 31 | % | | | 16 | % | | | 9 | % |
Net assets, end of period (000s omitted) | | | $34,136 | | | | $43,671 | | | | $90,809 | | | | $92,929 | | | | $52,613 | |
| 1 | Calculated based upon average shares outstanding |
| 2 | Amount is more than $(0.005). |
The accompanying notes are an integral part of these financial statements.
| | | | | | |
| Financial highlights | | Wells Fargo Small Cap Value Fund | | | 23 | |
(For a share outstanding throughout each period)
| | | | | | | | | | | | | | | | | | | | |
| | | Year ended March 31 | |
| ADMINISTRATOR CLASS | | 2019 | | | 2018 | | | 2017 | | | 2016 | | | 2015 | |
Net asset value, beginning of period | | | $18.34 | | | | $22.80 | | | | $19.66 | | | | $28.30 | | | | $36.40 | |
Net investment income (loss) | | | (0.02 | )1 | | | (0.06 | )1 | | | (0.07 | )1 | | | (0.06 | )1 | | | 0.01 | 1 |
Net realized and unrealized gains (losses) on investments | | | (1.40 | ) | | | 1.72 | | | | 5.71 | | | | (1.16 | ) | | | (2.55 | ) |
| | | | | | | | | | | | | | | | | | | | |
Total from investment operations | | | (1.42 | ) | | | 1.66 | | | | 5.64 | | | | (1.22 | ) | | | (2.54 | ) |
Distributions to shareholders from | | | | | | | | | | | | | | | | | | | | |
Net realized gains | | | (3.12 | ) | | | (6.12 | ) | | | (2.50 | ) | | | (7.42 | ) | | | (5.56 | ) |
Net asset value, end of period | | | $13.80 | | | | $18.34 | | | | $22.80 | | | | $19.66 | | | | $28.30 | |
Total return | | | (6.85 | )% | | | 8.18 | % | | | 30.22 | % | | | (2.70 | )% | | | (7.16 | )% |
Ratios to average net assets (annualized) | | | | | | | | | | | | | | | | | | | | |
Gross expenses | | | 1.29 | % | | | 1.24 | % | | | 1.24 | % | | | 1.25 | % | | | 1.19 | % |
Net expenses | | | 1.08 | % | | | 1.08 | % | | | 1.08 | % | | | 1.08 | % | | | 1.09 | % |
Net investment income (loss) | | | (0.11 | )% | | | (0.28 | )% | | | (0.31 | )% | | | (0.24 | )% | | | 0.03 | % |
Supplemental data | | | | | | | | | | | | | | | | | | | | |
Portfolio turnover rate | | | 37 | % | | | 36 | % | | | 31 | % | | | 16 | % | | | 9 | % |
Net assets, end of period (000s omitted) | | | $7,571 | | | | $9,936 | | | | $12,994 | | | | $24,927 | | | | $74,820 | |
| 1 | Calculated based upon average shares outstanding |
The accompanying notes are an integral part of these financial statements.
| | | | |
| 24 | | Wells Fargo Small Cap Value Fund | | Financial highlights |
(For a share outstanding throughout each period)
| | | | | | | | | | | | | | | | | | | | |
| | | Year ended March 31 | |
| INSTITUTIONAL CLASS | | 2019 | | | 2018 | | | 2017 | | | 2016 | | | 2015 | |
Net asset value, beginning of period | | | $18.49 | | | | $22.90 | | | | $19.71 | | | | $28.29 | | | | $36.53 | |
Net investment income (loss) | | | 0.02 | 1 | | | (0.02 | )1 | | | (0.01 | )1 | | | (0.01 | )1 | | | 0.17 | 1 |
Net realized and unrealized gains (losses) on investments | | | (1.41 | ) | | | 1.73 | | | | 5.70 | | | | (1.15 | ) | | | (2.65 | ) |
| | | | | | | | | | | | | | | | | | | | |
Total from investment operations | | | (1.39 | ) | | | 1.71 | | | | 5.69 | | | | (1.16 | ) | | | (2.48 | ) |
Distributions to shareholders from | | | | | | | | | | | | | | | | | | | | |
Net investment income | | | 0.00 | | | | 0.00 | | | | 0.00 | | | | 0.00 | | | | (0.20 | ) |
Net realized gains | | | (3.12 | ) | | | (6.12 | ) | | | (2.50 | ) | | | (7.42 | ) | | | (5.56 | ) |
| | | | | | | | | | | | | | | | | | | | |
Total distributions to shareholders | | | (3.12 | ) | | | (6.12 | ) | | | (2.50 | ) | | | (7.42 | ) | | | (5.76 | ) |
Net asset value, end of period | | | $13.98 | | | | $18.49 | | | | $22.90 | | | | $19.71 | | | | $28.29 | |
Total return | | | (6.61 | )% | | | 8.39 | % | | | 30.41 | % | | | (2.46 | )% | | | (6.95 | )% |
Ratios to average net assets (annualized) | | | | | | | | | | | | | | | | | | | | |
Gross expenses | | | 1.04 | % | | | 0.99 | % | | | 0.99 | % | | | 0.99 | % | | | 0.92 | % |
Net expenses | | | 0.88 | % | | | 0.88 | % | | | 0.88 | % | | | 0.88 | % | | | 0.89 | % |
Net investment income (loss) | | | 0.09 | % | | | (0.11 | )% | | | (0.06 | )% | | | (0.03 | )% | | | 0.52 | % |
Supplemental data | | | | | | | | | | | | | | | | | | | | |
Portfolio turnover rate | | | 37 | % | | | 36 | % | | | 31 | % | | | 16 | % | | | 9 | % |
Net assets, end of period (000s omitted) | | | $23,567 | | | | $32,699 | | | | $417,018 | | | | $283,728 | | | | $1,017,115 | |
| 1 | Calculated based upon average shares outstanding |
The accompanying notes are an integral part of these financial statements.
| | | | | | |
| Notes to financial statements | | Wells Fargo Small Cap Value Fund | | | 25 | |
1. ORGANIZATION
Wells Fargo Funds Trust (the “Trust”), a Delaware statutory trust organized on March 10, 1999, is an open-end management investment company registered under the Investment Company Act of 1940, as amended (the “1940 Act”). As an investment company, the Trust follows the accounting and reporting guidance in Financial Accounting Standards Board (“FASB”) Accounting Standards Codification Topic 946, Financial Services – Investment Companies. These financial statements report on the Wells Fargo Small Cap Value Fund (the “Fund”) which is a diversified series of the Trust.
2. SIGNIFICANT ACCOUNTING POLICIES
The following significant accounting policies, which are consistently followed in the preparation of the financial statements of the Fund, are in conformity with U.S. generally accepted accounting principles which require management to make estimates and assumptions that affect the reported amounts of assets and liabilities, disclosure of contingent assets and liabilities at the date of the financial statements, and the reported amounts of revenues and expenses during the reporting period. Actual results could differ from those estimates.
Securities valuation
All investments are valued each business day as of the close of regular trading on the New York Stock Exchange (generally 4 p.m. Eastern Time), although the Fund may deviate from this calculation time under unusual or unexpected circumstances.
Equity securities that are listed on a foreign or domestic exchange or market are valued at the official closing price or, if none, the last sales price. If no sale occurs on the principal exchange or market that day, a fair value price will be determined in accordance with the Fund’s Valuation Procedures.
Investments in registered open-end investment companies are valued at net asset value.
Investments which are not valued using any of the methods discussed above are valued at their fair value, as determined in good faith by the Board of Trustees of the Fund. The Board of Trustees has established a Valuation Committee comprised of the Trustees and has delegated to it the authority to take any actions regarding the valuation of portfolio securities that the Valuation Committee deems necessary or appropriate, including determining the fair value of portfolio securities, unless the determination has been delegated to the Wells Fargo Asset Management Pricing Committee at Wells Fargo Funds Management, LLC (“Funds Management”). The Board of Trustees retains the authority to make or ratify any valuation decisions or approve any changes to the Valuation Procedures as it deems appropriate. On a quarterly basis, the Board of Trustees receives reports on any valuation actions taken by the Valuation Committee or the Wells Fargo Asset Management Pricing Committee which may include items for ratification.
Foreign currency translation
The accounting records of the Fund are maintained in U.S. dollars. The values of other assets and liabilities denominated in foreign currencies are translated into U.S. dollars at rates provided by an independent foreign currency pricing source at a time each business day specified by the Wells Fargo Asset Management Pricing Committee. Purchases and sales of securities, and income and expenses are converted at the rate of exchange on the respective dates of such transactions. Net realized foreign exchange gains or losses arise from sales of foreign currencies, currency gains or losses realized between the trade and settlement dates on securities transactions, and the difference between the amounts of dividends, interest and foreign withholding taxes recorded and the U.S. dollar equivalent of the amounts actually paid or received. Net unrealized foreign exchange gains and losses arise from changes in the fair value of assets and liabilities other than investments in securities resulting from changes in exchange rates. The changes in net assets arising from changes in exchange rates of securities and the changes in net assets resulting from changes in market prices of securities are not separately presented. Such changes are included in net realized and unrealized gains or losses from investments.
Security transactions and income recognition
Securities transactions are recorded on a trade date basis. Realized gains or losses are recorded on the basis of identified cost.
Dividend income is recognized on the ex-dividend date. Dividend income is recorded net of foreign taxes withheld where recovery of such taxes is not assured.
Income dividends and capital gain distributions from investment companies are recorded on the ex-dividend date. Capital gain distributions from investment companies are treated as realized gains.
| | | | |
| 26 | | Wells Fargo Small Cap Value Fund | | Notes to financial statements |
Distributions to shareholders
Distributions to shareholders from net investment income and any net realized gains are recorded on the ex-dividend date and paid at least annually. Such distributions are determined in accordance with income tax regulations and may differ from U.S. generally accepted accounting principles. Dividend sources are estimated at the time of declaration. The tax character of distributions is determined as of the Fund’s fiscal year end. Therefore, a portion of the Fund’s distributions made prior to the Fund’s fiscal year end may be categorized as a tax return of capital at year end.
Federal and other taxes
The Fund intends to continue to qualify as a regulated investment company by distributing substantially all of its investment company taxable income and any net realized capital gains (after reduction for capital loss carryforwards) sufficient to relieve it from all, or substantially all, federal income taxes. Accordingly, no provision for federal income taxes was required.
The Fund’s income and federal excise tax returns and all financial records supporting those returns for the prior three fiscal years are subject to examination by the federal and Delaware revenue authorities. Management has analyzed the Fund’s tax positions taken on federal, state, and foreign tax returns for all open tax years and does not believe that there are any uncertain tax positions that require recognition of a tax liability.
As of March 31, 2019, the aggregate cost of all investments for federal income tax purposes was $412,555,210 and the unrealized gains (losses) consisted of:
| | | | |
| |
Gross unrealized gains | | $ | 82,633,669 | |
| |
Gross unrealized losses | | | (66,150,933 | ) |
| |
Net unrealized gains | | $ | 16,482,736 | |
Class allocations
The separate classes of shares offered by the Fund differ principally in applicable sales charges, distribution, shareholder servicing, and administration fees. Class specific expenses are charged directly to that share class. Investment income, common expenses, and realized and unrealized gains (losses) on investments are allocated daily to each class of shares based on the relative proportion of net assets of each class.
3. FAIR VALUATION MEASUREMENTS
Fair value measurements of investments are determined within a framework that has established a fair value hierarchy based upon the various data inputs utilized in determining the value of the Fund’s investments. The three-level hierarchy gives the highest priority to unadjusted quoted prices in active markets for identical assets or liabilities (Level 1) and the lowest priority to unobservable inputs (Level 3). The Fund’s investments are classified within the fair value hierarchy based on the lowest level of input that is significant to the fair value measurement. The inputs are summarized into three broad levels as follows:
| ∎ | | Level 1 – quoted prices in active markets for identical securities |
| ∎ | | Level 2 – other significant observable inputs (including quoted prices for similar securities, interest rates, prepayment speeds, credit risk, etc.) |
| ∎ | | Level 3 – significant unobservable inputs (including the Fund’s own assumptions in determining the fair value of investments) |
The inputs or methodologies used for valuing investments in securities are not necessarily an indication of the risk associated with investing in those securities.
| | | | | | |
| Notes to financial statements | | Wells Fargo Small Cap Value Fund | | | 27 | |
The following is a summary of the inputs used in valuing the Fund’s assets and liabilities as of March 31, 2019:
| | | | | | | | | | | | | | | | |
| | | | |
| | | Quoted prices
(Level 1) | | | Other significant
observable inputs
(Level 2) | | | Significant
unobservable inputs (Level 3) | | | Total | |
| | | | |
Assets | | | | | | | | | | | | | | | | |
Investments in: | | | | | | | | | | | | | | | | |
| | | | |
Common stocks | | | | | | | | | | | | | | | | |
| | | | |
Communication services | | $ | 3,192,894 | | | $ | 0 | | | $ | 0 | | | $ | 3,192,894 | |
| | | | |
Consumer discretionary | | | 33,233,000 | | | | 2,020,500 | | | | 0 | | | | 35,253,500 | |
| | | | |
Energy | | | 42,675,432 | | | | 0 | | | | 0 | | | | 42,675,432 | |
| | | | |
Financials | | | 130,113,698 | | | | 0 | | | | 0 | | | | 130,113,698 | |
| | | | |
Health care | | | 16,845,825 | | | | 0 | | | | 0 | | | | 16,845,825 | |
| | | | |
Industrials | | | 90,498,435 | | | | 1,469,908 | | | | 0 | | | | 91,968,343 | |
| | | | |
Information technology | | | 42,675,388 | | | | 0 | | | | 0 | | | | 42,675,388 | |
| | | | |
Materials | | | 42,521,709 | | | | 4,570,952 | | | | 0 | | | | 47,092,661 | |
| | | | |
Real estate | | | 14,911,206 | | | | 0 | | | | 0 | | | | 14,911,206 | |
| | | | |
Exchange-traded funds | | | 3,627,692 | | | | 0 | | | | 0 | | | | 3,627,692 | |
| | | | |
Short-term investments | | | | | | | | | | | | | | | | |
| | | | |
Investment companies | | | 681,307 | | | | 0 | | | | 0 | | | | 681,307 | |
| | | | |
Total assets | | $ | 420,976,586 | | | $ | 8,061,360 | | | $ | 0 | | | $ | 429,037,946 | |
Additional sector, industry or geographic detail is included in the Portfolio of Investments.
At March 31, 2019, the Fund did not have any transfers into/out of Level 3.
4. TRANSACTIONS WITH AFFILIATES
Management fee
Funds Management, an indirect wholly owned subsidiary of Wells Fargo & Company (“Wells Fargo”), is the manager of the Fund and provides advisory and fund-level administrative services under an investment management agreement. Under the investment management agreement, Funds Management is responsible for, among other services, implementing the investment objectives and strategies of the Fund, supervising the subadviser and providing fund-level administrative services in connection with the Fund’s operations. As compensation for its services under the investment management agreement, Funds Management is entitled to receive a management fee at the following annual rate based on the Fund’s average daily net assets:
| | | | |
| |
| Average daily net assets | | Management fee | |
| |
First $500 million | | | 0.850 | % |
| |
Next $500 million | | | 0.825 | |
| |
Next $1 billion | | | 0.800 | |
| |
Next $1 billion | | | 0.775 | |
| |
Next $1 billion | | | 0.750 | |
| |
Next $1 billion | | | 0.730 | |
| |
Next $5 billion | | | 0.720 | |
| |
Over $10 billion | | | 0.710 | |
For the year ended March 31, 2019, the management fee was equivalent to an annual rate of 0.85% of the Fund’s average daily net assets.
Funds Management has retained the services of a subadviser to provide daily portfolio management to the Fund. The fee for subadvisory services is borne by Funds Management. Wells Capital Management Incorporated, an affiliate of Funds Management and an indirect wholly owned subsidiary of Wells Fargo, is the subadviser to the Fund and is entitled to receive a fee from Funds Management at an annual rate starting at 0.55% and declining to 0.40% as the average daily net assets of the Fund increase.
| | | | |
| 28 | | Wells Fargo Small Cap Value Fund | | Notes to financial statements |
Administration fees
Under a class-level administration agreement, Funds Management provides class-level administrative services to the Fund, which includes paying fees and expenses for services provided by the transfer agent, sub-transfer agents, omnibus account servicers and record-keepers. As compensation for its services under the class-level administration agreement, Funds Management receives an annual fee which is calculated based on the average daily net assets of each class as follows:
| | | | |
| | | Class-level
administration fee | |
| |
Class A, Class C | | | 0.21 | % |
| |
Class R6 | | | 0.03 | |
| |
Administrator Class, Institutional Class | | | 0.13 | |
Funds Management has contractually waived and/or reimbursed management and administration fees to the extent necessary to maintain certain net operating expense ratios for the Fund. When each class of the Fund has exceeded its expense cap, Funds Management has waived fees and/or reimbursed expenses from fund level expenses on a proportionate basis and then from class specific expenses. When only certain classes exceed their expense caps, waivers and/or reimbursements are applied against class specific expenses before fund level expenses. Funds Management has committed through July 31, 2019 to waive fees and/or reimburse expenses to the extent necessary to cap the Fund’s expenses at 1.28% for Class A shares, 2.03% for Class C shares, 0.83% for Class R6 shares, 1.08% for Administrator Class shares, and 0.88% for Institutional Class shares. Prior to or after the commitment expiration date, the cap may be increased or the commitment to maintain the cap may be terminated only with the approval of the Board of Trustees.
Distribution fee
The Trust has adopted a distribution plan for Class C shares of the Fund pursuant to Rule 12b-1 under the 1940 Act. A distribution fee is charged to Class C shares and paid to Wells Fargo Funds Distributor, LLC (“Funds Distributor”), the principal underwriter, at an annual rate of 0.75% of the average daily net assets of Class C shares.
In addition, Funds Distributor is entitled to receive the front-end sales charge from the purchase of Class A shares and a contingent deferred sales charge on the redemption of certain Class A shares. Funds Distributor is also entitled to receive the contingent deferred sales charges from redemptions of Class C shares. For the year ended March 31, 2019, Funds Distributor received $371 from the sale of Class A shares. No contingent deferred sales charges were incurred by Class A and Class C shares for the year ended March 31, 2019.
Shareholder servicing fees
The Trust has entered into contracts with one or more shareholder servicing agents, whereby Class A, Class C, and Administrator Class of the Fund are charged a fee at an annual rate of 0.25% of the average daily net assets of each respective class. A portion of these total shareholder servicing fees were paid to affiliates of Wells Fargo.
Interfund transactions
The Fund may purchase or sell portfolio investment securities to certain other Wells Fargo affiliates pursuant toRule 17a-7 under the 1940 Act and under procedures adopted by the Board of Trustees. The procedures have been designed to ensure that these interfund transactions, which do not incur broker commissions, are effected at current market prices.
5. INVESTMENT PORTFOLIO TRANSACTIONS
Purchases and sales of investments, excluding U.S. government obligations (if any) and short-term securities, for the year ended March 31, 2019 were $183,716,277 and $267,978,201, respectively.
6. BANK BORROWINGS
The Trust (excluding the money market funds), Wells Fargo Master Trust and Wells Fargo Variable Trust are parties to a $280,000,000 revolving credit agreement whereby the Fund is permitted to use bank borrowings for temporary or emergency purposes, such as to fund shareholder redemption requests. Interest under the credit agreement is charged to the Fund based on a borrowing rate equal to the higher of the Federal Funds rate in effect on that day plus 1.25% or the overnight LIBOR rate in effect on that day plus 1.25%. In addition, an annual commitment fee equal to 0.25% of the unused balance is allocated to each participating fund.
For the year ended March 31, 2019, there were no borrowings by the Fund under the agreement.
| | | | | | |
| Notes to financial statements | | Wells Fargo Small Cap Value Fund | | | 29 | |
7. DISTRIBUTIONS TO SHAREHOLDERS
The tax character of distributions paid during the years ended March 31, 2019 and March 31, 2018 were as follows:
| | | | | | | | |
| | | Year ended March 31 | |
| | |
| | | 2019 | | | 2018 | |
| | |
Ordinary income | | $ | 0 | | | $ | 1,352,843 | |
| | |
Long-term capital gain | | | 90,242,752 | | | | 230,758,003 | |
As of March 31, 2019, the components of distributable earnings on a tax basis were as follows:
| | | | |
Undistributed
ordinary
income | | Undistributed
long-term gain | | Unrealized
gains |
| | |
| $14,978,067 | | $15,657,779 | | $16,482,760 |
Effective for all filings after November 4, 2018, the Securities and Exchange Commission eliminated the requirement to separately state the components of distributions to shareholders under U.S. generally accepted accounting principles. The amounts of distributions to shareholders for the year ended March 31, 2018 were as follows:
| | | | |
| | | Net realized
gains | |
| |
Class A | | | $139,185,621 | |
| |
Class C | | | 11,577,587 | |
| |
Class R6 | | | 18,852,432 | |
| |
Administrator Class | | | 3,280,317 | |
| |
Institutional Class | | | 59,214,889 | |
8. CONCENTRATION RISK
Concentration risks result from exposure to a limited number of sectors. A fund that invests a substantial portion of its assets in any sector may be more affected by changes in that sector than would be a fund whose investments are not heavily weighted in any sector.
9. INDEMNIFICATION
Under the Trust’s organizational documents, the officers and Trustees have been granted certain indemnification rights against certain liabilities that may arise out of performance of their duties to the Trust. Additionally, in the normal course of business, the Trust may enter into contracts with service providers that contain a variety of indemnification clauses. The Trust’s maximum exposure under these arrangements is dependent on future claims that may be made against the Fund and, therefore, cannot be estimated.
10. REDEMPTION IN-KIND
After the close of business on July 7, 2017, the Fund redeemed assets through an in-kind redemption. In the redemption transaction, the Fund issued securities with a value of $317,068,893 and cash in the amount of $17,087,078. The Fund recognized gains in the amount of $145,197,411. The redemptionin-kind by a shareholder of the Institutional Class represented 34% of the Fund and is reflected on the Statement of Changes in Net Assets.
11. NEW ACCOUNTING PRONOUNCEMENT
In August 2018, FASB issued Accounting Standards Update (“ASU”) No. 2018-13, Fair Value Measurement (Topic 820)Disclosure Framework—Changes to the Disclosure Requirements for Fair Value Measurement. ASU 2018-13 updates the disclosure requirements for fair value measurements by modifying or removing certain disclosures and adding certain new disclosures. The amendments are effective for fiscal years, and interim periods within those fiscal years, beginning after December 15, 2019. Early adoption is permitted. Management has adopted the removal and modification of disclosures early, as permitted, and will adopt the additional new disclosures at the effective date.
| | | | |
| 30 | | Wells Fargo Small Cap Value Fund | | Notes to financial statements |
12. SUBSEQUENT EVENT
At a regular meeting of the Board of Trustees held on May 21-22, 2019, the Trustees of the Fund approved the merger of the Fund into Wells Fargo Small Company Value Fund. As a result of the merger, Wells Fargo Small Company Value Fund will acquire the assets and assume the liabilities of the Fund in exchange for shares of Wells Fargo Small Company Value Fund. The merger does not require approval by the Fund’s shareholders.
Shareholders of the Fund will receive a prospectus/information statement with information on the principal aspects of the merger of the Fund into Wells Fargo Small Company Value Fund in June 2019. The merger is scheduled to take place on or about September 20, 2019.
| | | | | | |
| Report of independent registered public accounting firm | | Wells Fargo Small Cap Value Fund | | | 31 | |
TO THE SHAREHOLDERS OF THE FUND AND BOARD OF TRUSTEES OF WELLS FARGO FUNDS TRUST:
Opinion on the Financial Statements
We have audited the accompanying statement of assets and liabilities of Wells Fargo Small Cap Value Fund (the Fund), one of the funds constituting Wells Fargo Funds Trust, including the portfolio of investments, as of March 31, 2019, the related statement of operations for the year then ended, the statements of changes in net assets for each of the years in the two-year period then ended, and the related notes (collectively, the financial statements) and the financial highlights for each of the years in the five-year period then ended. In our opinion, the financial statements and financial highlights present fairly, in all material respects, the financial position of the Fund as of March 31, 2019, the results of its operations for the year then ended, the changes in its net assets for each of the years in the two-year period then ended, and the financial highlights for each of the years in the five-year period then ended, in conformity with U.S. generally accepted accounting principles.
Basis for Opinion
These financial statements and financial highlights are the responsibility of the Fund’s management. Our responsibility is to express an opinion on these financial statements and financial highlights based on our audits. We are a public accounting firm registered with the Public Company Accounting Oversight Board (United States) (PCAOB) and are required to be independent with respect to the Fund in accordance with the U.S. federal securities laws and the applicable rules and regulations of the Securities and Exchange Commission and the PCAOB.
We conducted our audits in accordance with the standards of the PCAOB. Those standards require that we plan and perform the audit to obtain reasonable assurance about whether the financial statements and financial highlights are free of material misstatement, whether due to error or fraud. Our audits included performing procedures to assess the risks of material misstatement of the financial statements and financial highlights, whether due to error or fraud, and performing procedures that respond to those risks. Such procedures included examining, on a test basis, evidence regarding the amounts and disclosures in the financial statements and financial highlights. Such procedures also included confirmation of securities owned as of March 31, 2019, by correspondence with the custodian and brokers, or by other appropriate auditing procedures. Our audits also included evaluating the accounting principles used and significant estimates made by management, as well as evaluating the overall presentation of the financial statements and financial highlights. We believe that our audits provide a reasonable basis for our opinion.

We have not been able to determine the specific year that we began serving as the auditor of one or more Wells Fargo Funds investment companies; however we are aware that we have served as the auditor of one or more Wells Fargo Funds investment companies since at least 1955.
Boston, Massachusetts
May 29, 2019
| | | | |
| 32 | | Wells Fargo Small Cap Value Fund | | Other information (unaudited) |
TAX INFORMATION
Pursuant to Section 852 of the Internal Revenue Code, $90,242,752 was designated as a 20% rate gain distribution for the fiscal year ended March 31, 2019.
PROXY VOTING INFORMATION
A description of the policies and procedures used to determine how to vote proxies relating to portfolio securities is available, upon request, by calling1-800-222-8222, visiting our website atwfam.com, or visiting the SEC website at sec.gov. Information regarding how the Fund voted proxies relating to portfolio securities during the most recent12-month period ended June 30 is available on the Fund’s website atwfam.comor by visiting the SEC website at sec.gov.
PORTFOLIO HOLDINGS INFORMATION
The complete portfolio holdings for the Fund are publicly available monthly on the Fund’s website (wfam.com), on a one-month delayed basis. In addition, top ten holdings information (excluding derivative positions) for the Fund is publicly available on the Fund’s website on a monthly, seven-day or more delayed basis. The Fund files its complete schedule of portfolio holdings with the SEC for the first and third quarters of each fiscal year on Form N-Q, which is available by visiting the SEC website at sec.gov. In addition, the Fund’s Form N-Q may be reviewed and copied at the SEC’s Public Reference Room in Washington, DC, and at regional offices in New York City, at 233 Broadway, and in Chicago, at 175 West Jackson Boulevard, Suite 900. Information about the Public Reference Room may be obtained by calling 1-800-SEC-0330.
| | | | | | |
| Other information (unaudited) | | Wells Fargo Small Cap Value Fund | | | 33 | |
BOARD OF TRUSTEES AND OFFICERS
Each of the Trustees and Officers1 listed in the table below acts in identical capacities for each fund in the Wells Fargo family of funds, which consists of 151 mutual funds comprising the Wells Fargo Funds Trust, Wells Fargo Variable Trust, Wells Fargo Master Trust and four closed-end funds (collectively the “Fund Complex”). This table should be read in conjunction with the Prospectus and the Statement of Additional Information2. The mailing address of each Trustee and Officer is 525 Market Street, 12th Floor, San Francisco, CA 94105. Each Trustee and Officer serves an indefinite term, however, each Trustee serves such term until reaching the mandatory retirement age established by the Trustees.
Independent Trustees
| | | | | | |
Name and
year of birth | | Position held and
length of service* | | Principal occupations during past five years or longer | | Current other
public company or
investment company
directorships |
| | | |
William R. Ebsworth
(Born 1957) | | Trustee, since 2015 | | Retired. From 1984 to 2013, equities analyst, portfolio manager, research director and chief investment officer at Fidelity Management and Research Company in Boston, Tokyo, and Hong Kong, and retired in 2013 as Chief Investment Officer of Fidelity Strategic Advisers, Inc. where he led a team of investment professionals managing client assets. Prior thereto, Board member of Hong Kong Securities Clearing Co., Hong Kong Options Clearing Corp., the Thailand International Fund, Ltd., Fidelity Investments Life Insurance Company, and Empire Fidelity Investments Life Insurance Company. Audit Committee Chair and Investment Committee Chair of the Vincent Memorial Hospital Endowment (non-profit organization). Mr. Ebsworth is a CFA® charterholder. | | N/A |
| | | |
Jane A. Freeman
(Born 1953) | | Trustee, since 2015; Chair Liaison, since 2018 | | Retired. From 2012 to 2014 and 1999 to 2008, Chief Financial Officer of Scientific Learning Corporation. From 2008 to 2012, Ms. Freeman provided consulting services related to strategic business projects. Prior to 1999, Portfolio Manager at Rockefeller & Co. and Scudder, Stevens & Clark. Board member of the Harding Loevner Funds from 1996 to 2014, serving as both Lead Independent Director and chair of the Audit Committee. Board member of the Russell Exchange Traded Funds Trust from 2011 to 2012 and the chair of the Audit Committee. Ms. Freeman is a Board Member of The Ruth Bancroft Garden (non-profit organization). She is also an inactive Chartered Financial Analyst. | | N/A |
| | | |
Isaiah Harris, Jr.3
(Born 1952) | | Trustee, since 2009; Audit Committee Chairman, since 2019 | | Retired. Chairman of the Board of CIGNA Corporation since 2009, and Director since 2005. From 2003 to 2011, Director of Deluxe Corporation. Prior thereto, President and CEO of BellSouth Advertising and Publishing Corp. from 2005 to 2007, President and CEO of BellSouth Enterprises from 2004 to 2005 and President of BellSouth Consumer Services from 2000 to 2003. Emeritus member of the Iowa State University Foundation Board of Governors. Emeritus Member of the Advisory Board of Iowa State University School of Business. Advisory Board Member, Palm Harbor Academy (private school). Advisory Board Member, Child Evangelism Fellowship (non-profit). Mr. Harris is a certified public accountant (inactive status). | | CIGNA Corporation |
| | | |
Judith M. Johnson
(Born 1949) | | Trustee, since 2008; Audit Committee Chairman, from 2009 to 2018 | | Retired. Prior thereto, Chief Executive Officer and Chief Investment Officer of Minneapolis Employees Retirement Fund from 1996 to 2008. Ms. Johnson is an attorney, certified public accountant and a certified managerial accountant. | | N/A |
| | | | |
| 34 | | Wells Fargo Small Cap Value Fund | | Other information (unaudited) |
| | | | | | |
Name and
year of birth | | Position held and
length of service* | | Principal occupations during past five years or longer | | Current other
public company or
investment company
directorships |
| | | |
David F. Larcker
(Born 1950) | | Trustee, since 2009 | | James Irvin Miller Professor of Accounting at the Graduate School of Business, Stanford University, Director of the Corporate Governance Research Initiative and Senior Faculty of The Rock Center for Corporate Governance since 2006. From 2005 to 2008, Professor of Accounting at the Graduate School of Business, Stanford University. Prior thereto, Ernst & Young Professor of Accounting at The Wharton School, University of Pennsylvania from 1985 to 2005. | | N/A |
| | | |
Olivia S. Mitchell
(Born 1953) | | Trustee, since 2006; Nominating and Governance Committee Chairman, since 2018 | | International Foundation of Employee Benefit Plans Professor, Wharton School of the University of Pennsylvania since 1993. Director of Wharton’s Pension Research Council and Boettner Center on Pensions & Retirement Research, and Research Associate at the National Bureau of Economic Research. Previously, Cornell University Professor from 1978 to 1993. | | N/A |
| | | |
Timothy J. Penny
(Born 1951) | | Trustee, since 1996; Chairman, since 2018 | | President and Chief Executive Officer of Southern Minnesota Initiative Foundation, a non-profit organization, since 2007. Member of the Board of Trustees of NorthStar Education Finance, Inc., a non-profit organization, since 2007. | | N/A |
| | | |
James G. Polisson
(Born 1959) | | Trustee, since 2018 | | Retired. Chief Marketing Officer, Source (ETF) UK Services, Ltd, from 2015 to 2017. From 2012 to 2015, Principal of The Polisson Group, LLC, a management consulting, corporate advisory and principal investing company. Chief Executive Officer and Managing Director at Russell Investments, Global Exchange Traded Funds from 2010 to 2012. Managing Director of Barclays Global Investors from 1998 to 2010 and Global Chief Marketing Officer for iShares and Barclays Global Investors from 2000 to 2010. Trustee of the San Francisco Mechanics’ Institute, a non-profit organization, from 2013 to 2015. Board member of the Russell Exchange Traded Fund Trust from 2011 to 2012. Director of Barclays Global Investors Holdings Deutschland GmbH from 2006 to 2009. Mr. Polisson is an attorney and has a retired status with the Massachusetts and District of Columbia Bar Associations. | | N/A |
| | | |
Pamela Wheelock
(Born 1959) | | Trustee, since 2018 | | Board member of the Destination Medical Center Economic Development Agency, Rochester, Minnesota since 2019. Chief Operating Officer, Twin Cities Habitat for Humanity from 2017 to 2019. Vice President of University Services, University of Minnesota from 2012 to 2016. Prior thereto, on the Board of Directors, Governance Committee and Finance Committee for the Minnesota Philanthropy Partners (Saint Paul Foundation) from 2012 to 2018, Interim Chief Executive Officer of Blue Cross Blue Shield of Minnesota from 2011 to 2012, Chairman of the Board from 2009 to 2012 and Board Director from 2003 to 2015. Vice President, Leadership and Community Engagement, Bush Foundation, Saint Paul, Minnesota (a private foundation) from 2009 to 2011. Executive Vice President and Chief Financial Officer, Minnesota Sports and Entertainment from 2004 to 2009 and Senior Vice President from 2002 to 2004. Executive Vice President of the Minnesota Wild Foundation from 2004 to 2008. Commissioner of Finance, State of Minnesota, from 1999 to 2002. Currently Board Chair of the Minnesota Wild Foundation since 2010. | | N/A |
| * | Length of service dates reflect the Trustee’s commencement of service with the Trust’s predecessor entities, where applicable. |
| | | | | | |
| Other information (unaudited) | | Wells Fargo Small Cap Value Fund | | | 35 | |
Officers
| | | | | | |
Name and
year of birth | | Position held and
length of service | | Principal occupations during past five years or longer | | |
| | | |
Andrew Owen
(Born 1960) | | President, since 2017 | | Executive Vice President of Wells Fargo & Company and Head of Affiliated Managers, Wells Fargo Asset Management, since 2014. In addition, Mr. Owen is currently President, Chief Executive Officer and Director of Wells Fargo Funds Management, LLC since 2017. Prior thereto, Executive Vice President responsible for marketing, investments and product development for Wells Fargo Funds Management, LLC, from 2009 to 2014. | | |
| | | |
Nancy Wiser1
(Born 1967) | | Treasurer, since 2012 | | Executive Vice President of Wells Fargo Funds Management, LLC since 2011. Chief Operating Officer and Chief Compliance Officer at LightBox Capital Management LLC, from 2008 to 2011. | | |
| | | |
Alexander Kymn
(Born 1973) | | Secretary and Chief Legal Officer, since 2018 | | Senior Company Counsel of Wells Fargo Bank, N.A. since 2018 (previously Senior Counsel from 2007 to 2018). Vice President of Wells Fargo Funds Management, LLC from 2008 to 2014. | | |
| | | |
Michael H. Whitaker
(Born 1967) | | Chief Compliance Officer, since 2016 | | Senior Vice President and Chief Compliance Officer since 2016. Senior Vice President and Chief Compliance Officer for Fidelity Investments from 2007 to 2016. | | |
| | | |
David Berardi
(Born 1975) | | Assistant Treasurer, since 2009 | | Vice President of Wells Fargo Funds Management, LLC since 2009. Vice President of Evergreen Investment Management Company, LLC from 2008 to 2010. Manager of Fund Reporting and Control for Evergreen Investment Management Company, LLC from 2004 to 2010. | | |
| | | |
Jeremy DePalma1
(Born 1974) | | Assistant Treasurer, since 2009 | | Senior Vice President of Wells Fargo Funds Management, LLC since 2009. Senior Vice President of Evergreen Investment Management Company, LLC from 2008 to 2010 and head of the Fund Reporting and Control Team within Fund Administration from 2005 to 2010. | | |
| 1 | Nancy Wiser acts as Treasurer of 65 funds in the Fund Complex. Jeremy DePalma acts as Treasurer of 86 funds and Assistant Treasurer of 65 funds in the Fund Complex. |
| 2 | The Statement of Additional Information includes additional information about the Trustees and is available, without charge, upon request, by calling 1-800-222-8222 or by visiting the website atwfam.com. |
| 3 | Mr. Harris became Chairman of the Audit Committee effective January 1, 2019. |
| | | | |
| 36 | | Wells Fargo Small Cap Value Fund | | Appendix A (unaudited) |
SALES CHARGE REDUCTIONS AND WAIVERS FOR CERTAIN INTERMEDIARIES
Raymond James & Associates, Inc., Raymond James Financial Services & Raymond James affiliates (“Raymond James”)
Effective on or about March 1, 2019, shareholders purchasing Fund shares through a Raymond James platform or account will be eligible only for the following load waivers (front-end sales charge waivers and contingent deferred, or back-end, sales charge waivers) and discounts, which may differ from those disclosed elsewhere in the Fund’s Prospectus or SAI.
Front-end Sales Load Waivers on Class A shares Available at Raymond James
| | • | | Shares purchased in an investment advisory program. |
| | • | | Shares purchased through reinvestment of capital gains distributions and dividend reinvestment when purchasing shares of the same fund (but not any other fund within the fund family). |
| | • | | Employees and registered representatives of Raymond James or its affiliates and their family members as designated by Raymond James. |
| | • | | Shares purchased from the proceeds of redemptions within the same fund family, provided (1) the repurchase occurs within 90 days following the redemption, (2) the redemption and purchase occur in the same account, and (3) redeemed shares were subject to a front-end or deferred sales load (known as Rights of Reinstatement). |
| | • | | A shareholder in the fund’s Class C shares will have their shares automatically exchanged at net asset value to Class A shares (or the appropriate share class) of the fund if the shares are no longer subject to a CDSC and the exchange is in line with the policies and procedures of Raymond James. |
CDSC Waivers on Class A and C Shares Available at Raymond James
| | • | | Death or disability of the shareholder. |
| | • | | Shares sold as part of a systematic withdrawal plan as described in the Fund’s Prospectus. |
| | • | | Return of excess contributions from an IRA Account. |
| | • | | Shares sold as part of a required minimum distribution for IRA and retirement accounts due to the shareholder reaching age 70½ as described in the Fund’s prospectus. |
| | • | | Shares sold to pay Raymond James fees but only if the transaction is initiated by Raymond James. |
| | • | | Shares acquired through a right of reinstatement. |
Front-end Load Discounts Available at Raymond James: Breakpoints, and/or Rights of Accumulation
| | • | | Breakpoints as described in the Fund’s Prospectus. |
| | • | | Rights of accumulation which entitle shareholders to breakpoint discounts will be automatically calculated based on the aggregated holding of fund family assets held by accounts within the purchaser’s household at Raymond James. Eligible fund family assets not held at Raymond James may be included in the rights of accumulation calculation only if the shareholder notifies his or her financial advisor about such assets. |

For more information
More information about Wells Fargo Funds is available free upon request. To obtain literature, please write, visit the Fund’s website, or call:
Wells Fargo Funds
P.O. Box 219967
Kansas City, MO 64121-9967
Website: wfam.com
Individual investors: 1-800-222-8222
Retail investment professionals: 1-888-877-9275
Institutional investment professionals:
1-866-765-0778
This report and the financial statements contained herein are submitted for the general information of the shareholders of the Fund. If this report is used for promotional purposes, distribution of the report must be accompanied or preceded by a current prospectus. Before investing, please consider the investment objectives, risks, charges, and expenses of the investment. For a current prospectus and, if available, a summary prospectus, containing this information, call1-800-222-8222 or visit the Fund’s website atwfam.com. Read the prospectus carefully before you invest or send money.
Wells Fargo Asset Management (WFAM) is the trade name for certain investment advisory/management firms owned by Wells Fargo & Company. These firms include but are not limited to Wells Capital Management Incorporated and Wells Fargo Funds Management, LLC. Certain products managed by WFAM entities are distributed by Wells Fargo Funds Distributor, LLC (a broker-dealer and Member FINRA).
This material is for general informational and educational purposes only and is NOT intended to provide investment advice or a recommendation of any kind—including a recommendation for any specific investment, strategy, or plan.
INVESTMENT PRODUCTS: NOT FDIC INSURED ◾ NO BANK GUARANTEE ◾ MAY LOSE VALUE
© 2019 Wells Fargo Funds Management, LLC. All rights reserved.
| | |
 | | 401593 05-19 A244/AR244 03-19 |
Annual Report
March 31, 2019

Wells Fargo Special Small Cap Value Fund

Beginning on January 1, 2021, as permitted by new regulations adopted by the Securities and Exchange Commission, paper copies of the Wells Fargo Funds’ annual and semi-annual shareholder reports issued after this date will no longer be sent by mail, unless you specifically request paper copies of the reports. Instead, the reports will be made available on the Funds’ website, and you will be notified by mail each time a report is posted and provided with a website address to access the report.
If you already elected to receive shareholder reports electronically, you will not be affected by this change and you need not take any action. You may elect to receive shareholder reports and other communications from the Fund electronically at any time by contacting your financial intermediary (such as a broker-dealer or bank) or, if you are a direct investor, by calling 1-800-222-8222 or by enrolling at wellsfargo.com/advantagedelivery.
You may elect to receive all future reports in paper free of charge. If you invest through a financial intermediary, you can contact your financial intermediary to request that you continue to receive paper copies of your shareholder reports; if you invest directly with the Fund, you can call 1-800-222-8222. Your election to receive reports in paper will apply to all Wells Fargo Funds held in your account with your financial intermediary or, if you are a direct investor, to all Wells Fargo Funds that you hold.

Reduce clutter. Save trees.
Sign up for electronic delivery of prospectuses and shareholder reports atwellsfargo.com/advantagedelivery
Contents
The views expressed and any forward-looking statements are as of March 31, 2019, unless otherwise noted, and are those of the Fund managers and/or Wells Fargo Asset Management. Discussions of individual securities, or the markets generally, or any Wells Fargo Fund are not intended as individual recommendations. Future events or results may vary significantly from those expressed in any forward-looking statements. The views expressed are subject to change at any time in response to changing circumstances in the market. Wells Fargo and the Fund disclaim any obligation to publicly update or revise any views expressed or forward-looking statements.
INVESTMENT PRODUCTS: NOT FDIC INSURED ◾ NO BANK GUARANTEE ◾ MAY LOSE VALUE
| | | | |
| 2 | | Wells Fargo Special Small Cap Value Fund | | Letter to shareholders (unaudited) |

Andrew Owen
President
Wells Fargo Funds
Global trade tensions escalated during the second quarter of 2018.
Dear Shareholder:
We are pleased to offer you this annual report for the Wells Fargo Special Small Cap Value Fund for the 12-month period that ended March 31, 2019. An upward trend for short-term interest rates, inflation concerns, trade tensions, and geopolitical events contributed to investment market volatility for much of 2018. Equity investor sentiment improved during the first quarter of 2019 thanks to a shift in U.S. Federal Reserve (Fed) policy and consistent if not spectacular economic and business growth metrics.
For the period, U.S. stocks, as measured by the S&P 500 Index,1 gained 9.50% and international stocks, as measured by the MSCI ACWI ex USA Index (Net),2 declined 4.22%. Based on the MSCI EM Index (Net),3 emerging market stocks fell 7.41%. For bond investors, the Bloomberg Barclays U.S. Aggregate Bond Index4 added 4.48% while the Bloomberg Barclays Global Aggregate ex-USD Index5 lost 4.13%. The Bloomberg Barclays Municipal Bond Index6 added 5.38%, and the ICE BofAML U.S. High Yield Index7 gained 5.94%.
Trade tensions and U.S. interest rates influenced markets.
Global trade tensions escalated during the second quarter of 2018. A tit-for-tat tariff spat intensified between the U.S. and other governments. The Fed raised the federal funds rate by 25 basis points (bps; 100 bps equal 1.00%) to a target range of between 1.75% and 2.00% in June 2018. Market index results reflected the global concerns. The MSCI ACWI ex USA Index (Net) lost 2.61%, while the Bloomberg Barclays Global Aggregate ex-USD Index dropped 4.76%.
Not all news was bad. The U.S. Bureau of Economic Analysis reported second-quarter annualized gross domestic product (GDP) growth of 4.2%. Hiring improved. Unemployment declined. Consumer confidence and spending increased. The S&P 500 Index recorded a 3.43% second-quarter gain. Stocks of companies with smaller capitalizations did even better, as measured by the Russell 2000® Index,8 adding 7.75%.
| 1 | The S&P 500 Index consists of 500 stocks chosen for market size, liquidity, and industry group representation. It is a market-value-weighted index with each stock’s weight in the index proportionate to its market value. You cannot invest directly in an index. |
| 2 | The Morgan Stanley Capital International (MSCI) All Country World Index (ACWI) ex USA Index (Net) is a free-float-adjusted market-capitalization-weighted index that is designed to measure the equity market performance of developed markets, excluding the United States and Canada. Source: MSCI. MSCI makes no express or implied warranties or representations and shall have no liability whatsoever with respect to any MSCI data contained herein. The MSCI data may not be further redistributed or used as a basis for other indices or any securities or financial products. This report is not approved, reviewed, or produced by MSCI. You cannot invest directly in an index. |
| 3 | The MSCI Emerging Markets (EM) Index (Net) is a free-float-adjusted market-capitalization-weighted index that is designed to measure large- and mid-cap equity market performance of emerging markets. The MSCI EM Index (Net) consists of the following 24 emerging market country indices: Brazil, Chile, China, Colombia, Czech Republic, Egypt, Greece, Hungary, India, Indonesia, Korea, Malaysia, Mexico, Pakistan, Peru, the Philippines, Poland, Qatar, Russia, South Africa, Taiwan, Thailand, Turkey, and the United Arab Emirates. You cannot invest directly in an index. |
| 4 | The Bloomberg Barclays U.S. Aggregate Bond Index is a broad-based benchmark that measures the investment-grade, U.S. dollar-denominated, fixed-rate taxable bond market, including Treasuries, government-related and corporate securities, mortgage-backed securities (agency fixed-rate and hybrid adjustable-rate mortgage pass-throughs), asset-backed securities, and commercial mortgage-backed securities. You cannot invest directly in an index. |
| 5 | The Bloomberg Barclays Global Aggregate ex-USD Index is an unmanaged index that provides a broad-based measure of the global investment-grade fixed-income markets excluding the U.S. dollar-denominated debt market. You cannot invest directly in an index. |
| 6 | The Bloomberg Barclays Municipal Bond Index is an unmanaged index composed of long-term tax-exempt bonds with a minimum credit rating of Baa. You cannot invest directly in an index. |
| 7 | The ICE BofAML U.S. High Yield Index is a market-capitalization-weighted index of domestic and Yankee high-yield bonds. The index tracks the performance of high-yield securities traded in the U.S. bond market. You cannot invest directly in an index. Copyright 2019. ICE Data Indices, LLC. All rights reserved. |
| 8 | The Russell 2000® Index measures the performance of the 2,000 smallest companies in the Russell 3000® Index, which represents approximately 8% of the total market capitalization of the Russell 3000® Index. You cannot invest directly in an index. |
| | | | | | |
| Letter to shareholders (unaudited) | | Wells Fargo Special Small Cap Value Fund | | | 3 | |
Investors appeared to shake off lingering concerns during the third quarter.
Favorable third-quarter economic indicators and corporate earnings reports encouraged domestic stock investors. U.S. trade negotiations with Mexico and Canada progressed. The Conference Board Consumer Confidence Index®9 reached its highest level in 18 years during September 2018. The Fed raised the federal funds rate by 25 bps to a target range of between 2.00% and 2.25% in September 2018. For the quarter that ended September 30, 2018, the S&P 500 Index added 7.71%.
Investors in international markets were not as confident. Tensions between the U.S. and China increased. The U.S. imposed $200 billion in tariffs on Chinese goods. China reacted with $60 billion in tariffs on U.S. goods. Economic growth in China caused concern. The Bank of England raised its monetary policy rate to 0.75% in August 2018. During the quarter, the MSCI ACWI ex USA Index (Net) gained 0.71%. The MSCI EM Index (Net) declined 1.09%. In fixed-income markets, U.S. bonds were flat, as measured by the Bloomberg Barclays U.S. Aggregate Bond Index. The Bloomberg Barclays Global Aggregate ex-USD Index fell 1.74%.
Conflicting data unsettled markets during the fourth quarter.
November’s U.S. midterm elections shifted control of the House of Representatives from Republicans to Democrats, presaging potential partisan clashes. Third-quarter U.S. GDP was announced at an annualized 3.4% rate, lower than the second-quarter rate. Brexit efforts stalled ahead of the March 2019 deadline. The People’s Bank of China cut reserve requirement ratios, accelerated infrastructure spending, and cut taxes even as the value of the yuan declined to low levels last seen in 2008.
December’s S&P 500 Index performance was the worst since 1931. Globally,fixed-income investments fared better than stocks during the last two months of the year. The Fed increased the federal funds rate by 25 bps in December 2018 to a target range of between 2.25% and 2.50% and softened its outlook for 2019 rate increases.
The market climbs a wall of worry.
Investors entered 2019 with reasons to be concerned. A partial U.S. government shutdown driven by partisan spending and immigration policy disputes extended into January. Investors expected high levels of stock market volatility to continue based on the VIX10.
January’s returns tended to support the investing adage that markets climb a wall of worry. The S&P 500 Index gained 8.01% for the month that ended January 31, 2019, its best monthly performance in 30 years. Returns for the MSCI ACWI ex USA Index (Net), the Bloomberg Barclays U.S. Aggregate Bond Index, and the Bloomberg Barclays Global Aggregate ex-USD Index also were positive. The Fed indicated that it would pause its program of regular rate increases during 2019 as inflation remained low. Businesses and investors responded positively to the shift in policy.
In February, concerns over slowing global growth reemerged. The Bureau of Economic Analysis announced fourth-quarter 2018 GDP grew at an annualized 2.2% rate, down from the 4.2% annualized rate for the second quarter and the 3.4% annualized rate for the third quarter. Analysts attributed the lower growth rate to a slowing housing market and larger trade deficit. The U.S. Department of
Favorable third-quarter economic indicators and corporate earnings reports encouraged domestic stock investors.
| 9 | The Conference Board Consumer Confidence Index® measures the degree of optimism on the state of the U.S. economy that consumers are expressing through their activities of savings and spending. You cannot invest directly in an index. |
| 10 | The Chicago Board Options Exchange Market Volatility Index (VIX) is a popular measure of the implied volatility of S&P 500 Index options. It represents one measure of the market’s expectation of stock market volatility over the next 30-day period. You cannot invest directly in an index. |
| | | | |
| 4 | | Wells Fargo Special Small Cap Value Fund | | Letter to shareholders (unaudited) |
Labor said that the economy created just 20,000 jobs in February 2019. In a February report, the Bank of England forecast the slowest growth since the financial crisis for 2019. China and the U.S., while putting future tariffs on hold for the time being, continued to wrangle over trade issues.
By the end of March 2019, the combination of dovish Fed sentiment and consistent, if not spectacular, economic and business metrics reinforced investors’ enthusiasm for equity investing. Monthly job creation data regained its momentum. Corporate profits, while lower than 2018’s lofty levels, remained consistent. Inflation rates were relatively low in the U.S., Europe, and Japan. China announced a roughly $300 billion stimulus package through tax and fee cuts intended to reinvigorate economic growth.
Don’t let short-term uncertainty derail long-term investment goals.
Periods of investment uncertainty can present challenges, but experience has taught us that maintaining long-term investment goals can be an effective way to plan for the future. To help you create a sound strategy based on your personal goals and risk tolerance, Wells Fargo Funds offers more than 100 mutual funds spanning a wide range of asset classes and investment styles. Although diversification cannot guarantee an investment profit or prevent losses, we believe it can be an effective way to manage investment risk and potentially smooth out overall portfolio performance. We encourage investors to know their investments and to understand that appropriate levels of risk-taking may unlock opportunities.
Thank you for choosing to invest with Wells Fargo Funds. We appreciate your confidence in us and remain committed to helping you meet your financial needs.
Sincerely,

Andrew Owen
President
Wells Fargo Funds
For further information about your Fund, contact your investment professional, visit our website atwfam.com, or call us directly at1-800-222-8222.
This page is intentionally left blank.
| | | | |
| 6 | | Wells Fargo Special Small Cap Value Fund | | Performance highlights (unaudited) |
The Fund is currently closed to most new investors.1
Investment objective
The Fund seeks long-term capital appreciation.
Manager
Wells Fargo Funds Management, LLC
Subadviser
Wells Capital Management Incorporated
Portfolio managers
Robert Rifkin, CFA®‡
James M. Tringas, CFA®‡
Bryant VanCronkhite, CFA®‡, CPA
Average annual total returns (%) as of March 31, 2019
| | | | | | | | | | | | | | | | | | | | | | | | | | | | | | | | | | |
| | | | | Including sales charge | | | Excluding sales charge | | | Expense ratios2 (%) | |
| | | Inception date | | 1 year | | | 5 year | | | 10 year | | | 1 year | | | 5 year | | | 10 year | | | Gross | | | Net3 | |
| | | | | | | | | |
| Class A (ESPAX)4 | | 5-7-1993 | | | -6.57 | | | | 5.43 | | | | 14.36 | | | | -0.87 | | | | 6.69 | | | | 15.03 | | | | 1.31 | | | | 1.31 | |
| | | | | | | | | |
| Class C (ESPCX)4 | | 12-12-2000 | | | -2.59 | | | | 5.89 | | | | 14.17 | | | | -1.59 | * | | | 5.89 | | | | 14.17 | | | | 2.06 | | | | 2.06 | |
| | | | | | | | | |
| Class R (ESPHX)5 | | 9-30-2015 | | | – | | | | – | | | | – | | | | -1.08 | * | | | 6.44 | | | | 14.73 | | | | 1.56 | | | | 1.56 | |
| | | | | | | | | |
| Class R6 (ESPRX)6 | | 10-31-2014 | | | – | | | | – | | | | – | | | | -0.42 | | | | 7.14 | | | | 15.49 | | | | 0.88 | | | | 0.88 | |
| | | | | | | | | |
| Administrator Class (ESPIX)4 | | 7-23-1996 | | | – | | | | – | | | | – | | | | -0.77 | | | | 6.84 | | | | 15.27 | | | | 1.23 | | | | 1.20 | |
| | | | | | | | | |
| Institutional Class (ESPNX)7 | | 7-30-2010 | | | – | | | | – | | | | – | | | | -0.50 | * | | | 7.10 | | | | 15.46 | | | | 0.98 | | | | 0.94 | |
| | | | | | | | | |
| Russell 2000® Value Index8 | | – | | | – | | | | – | | | | – | | | | 0.17 | | | | 5.59 | | | | 14.12 | | | | – | | | | – | |
| * | | Total return differs from the return in the Financial Highlights in this report. The total return presented is calculated based on the NAV at which the shareholder transactions were processed. The NAV and total return presented in the Financial Highlights reflects certain adjustments made to the net assets of the Fund that are necessary under U.S. generally accepted accounting principles. |
Figures quoted represent past performance, which is no guarantee of future results, and do not reflect taxes that a shareholder may pay on fund distributions or the redemption of fund shares. Investment return and principal value of an investment will fluctuate so that an investor’s shares, when redeemed, may be worth more or less than their original cost. Performance shown without sales charges would be lower if sales charges were reflected. Current performance may be lower or higher than the performance data quoted, which assumes the reinvestment of dividends and capital gains. Current month-end performance is available on the Fund’s website,wfam.com.
Index returns do not include transaction costs associated with buying and selling securities, any mutual fund fees or expenses, or any taxes. It is not possible to invest directly in an index.
For Class A shares, the maximum front-end sales charge is 5.75%. For Class C shares, the maximum contingent deferred sales charge is 1.00%. Performance including a contingent deferred sales charge assumes the sales charge for the corresponding time period. Class R, Class R6, Administrator Class, and Institutional Class shares are sold without a front-end sales charge or contingent deferred sales charge.
Stock values fluctuate in response to the activities of individual companies and general market and economic conditions. Smaller-company stocks tend to be more volatile and less liquid than those of larger companies. Consult the Fund’s prospectus for additional information on these and other risks.
Please see footnotes on page 7.
| | | | | | |
| Performance highlights (unaudited) | | Wells Fargo Special Small Cap Value Fund | | | 7 | |
|
| Growth of $10,000 investment as of March 31, 20199 |
|
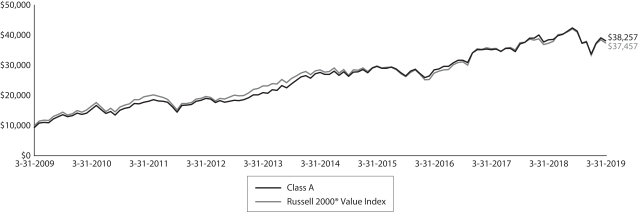 |
| ‡ | CFA® and Chartered Financial Analyst® are trademarks owned by CFA Institute. |
| 1 | Please see the Fund’s current Statement of Additional Information for further details. |
| 2 | Reflects the expense ratios as stated in the most recent prospectuses. The expense ratios shown are subject to change and may differ from the annualized expense ratios shown in the financial highlights of this report. |
| 3 | The manager has contractually committed through July 31, 2019, to waive fees and/or reimburse expenses to the extent necessary to cap the expenses of each class after fee waivers at 1.34% for Class A, 2.09% for Class C, 1.59% for Class R, 0.89% for Class R6, 1.20% for Administrator Class, and 0.94% for Institutional Class. Brokerage commissions, stamp duty fees, interest, taxes, acquired fund fees and expenses (if any), and extraordinary expenses are excluded from the expense cap. Prior to or after the commitment expiration date, the cap may be increased or the commitment to maintain the cap may be terminated only with the approval of the Board of Trustees. Without this cap, the Fund’s returns would have been lower. The expense ratio paid by an investor is the net expense ratio (the total annual fund operating expenses after fee waivers) as stated in the prospectuses. |
| 4 | Historical performance shown for this class prior to July 19, 2010, is based on the performance of the same class of the Fund’s predecessor, Evergreen Special Values Fund. |
| 5 | Historical performance shown for Class R shares prior to their inception reflects the performance of the Institutional Class shares adjusted to reflect the higher expenses applicable to Class R shares. |
| 6 | Historical performance for Class R6 shares prior to their inception reflects the performance of the Institutional Class shares, and includes the higher expenses applicable to Institutional Class shares. If these expenses had not been included, returns for Class R6 shares would be higher. |
| 7 | Historical performance shown for Institutional Class shares prior to their inception reflects the performance of Administrator Class shares, and includes the higher expenses applicable to Administrator Class shares. If these expenses had not been included, returns for Institutional Class shares would be higher. |
| 8 | The Russell 2000® Value Index measures the performance of those Russell 2000 companies with lower price/book ratios and lower forecasted growth values. You cannot invest directly in an index. |
| 9 | The chart compares the performance of Class A shares for the most recent ten years with the Russell 2000® Value Index. The chart assumes a hypothetical investment of $10,000 in Class A shares and reflects all operating expenses and assumes the maximum initial sales charge of 5.75%. |
| 10 | The ten largest holdings, excluding cash, cash equivalents and any money market funds, are calculated based on the value of the investments divided by total net assets of the Fund. Holdings are subject to change and may have changed since the date specified. |
| 11 | Amounts are calculated based on the total long-term investments of the Fund. These amounts are subject to change and may have changed since the date specified. |
| | | | |
| 8 | | Wells Fargo Special Small Cap Value Fund | | Performance highlights (unaudited) |
MANAGER’S DISCUSSION
Fund highlights
| ∎ | | The Fund underperformed its benchmark, the Russell 2000® Value Index, for the 12-month period that ended March 31, 2019. |
| ∎ | | Stock selection in the information technology (IT) sector and an underweight to the real estate sector detracted from performance. |
| ∎ | | Stock selection in the consumer discretionary and industrials sectors contributed to relative performance. |
Equity markets saw significant volatility over the period.
Over the 12-month reporting period, equity markets saw significant volatility, but the Russell 2000® Value Index posted a benign return of 0.17%. The first five months of the period saw small-cap value stocks post healthy returns as many investors believed small-cap stocks would benefit from the new U.S. corporate tax reform legislation as well as insulation from global trade disputes. The last four months of 2018 saw volatility increase and stocks moved sharply lower, driven by a fear of rising interest rates, rising trade tensions, and high-yield credit spreads widening. These concerns began to subside as 2018 came to a close. Small-cap stocks rallied in early 2019, largely due to the Federal Open Market Committee stating that it would pause and evaluate the need for future interest rate increases and the administration saying it would allow for more time to negotiate a trade agreement with China.
| | | | |
| Ten largest holdings (%) as of March 31, 201910 | |
| |
Mueller Industries Incorporated | | | 2.53 | |
| |
Dine Brands Global Incorporated | | | 2.51 | |
| |
Innospec Incorporated | | | 2.50 | |
| |
Eagle Materials Incorporated | | | 2.37 | |
| |
Denny’s Corporation | | | 2.35 | |
| |
Neenah Paper Incorporated | | | 2.18 | |
| |
UMB Financial Corporation | | | 2.14 | |
| |
Nomad Foods Limited | | | 1.95 | |
| |
Franklin Electric Company Incorporated | | | 1.94 | |
| |
Simpson Manufacturing Company Incorporated | | | 1.89 | |
Recent market volatility strengthens our belief that it is always prudent to protect downside risks. Our bottom-up process is designed to seek out companies that can control their own destiny via their clear competitive advantages, strong and sustainable free cash flows, and flexible balance sheets that can be used to grow shareholder value regardless of the macro environment. We did not make any major changes to portfolio positioning during the reporting period; however, we did adjust individual positions as reward/risk levels changed. We continue to emphasize companies that can control their destiny by using their balance sheets to protect capital during periods of volatility and also be offensive when their competitors are forced to be defensive.
Key contributors included stock selection within the consumer discretionary and industrials sectors.
Stock selection in the consumer discretionary sector contributed to relative performance. Full-service restaurant operator, Dine Brands Global, Incorporated, was a top contributor. The manager of restaurant brands IHOP and Applebee’s reported several strong quarters that highlighted much improved same-store growth comparisons from its Applebee’s unit. We continue to like the company’s franchise model, which generates significant free cash flow, requires minimal capital investments, and allows for shareholder value appreciation via future capital deployment opportunities. In the industrials sector, copper tubing and piping systems manufacturer Mueller Industries, Incorporated, contributed to results as the company’s gross margins benefited from its operational improvement initiatives and the company continues to make accretive acquisitions to diversify and strengthen its market share.
Detractors from performance included stock selection in the IT sector and an underweight to real estate.
Security selection in the IT sector detracted from relative performance. Belden Incorporated designs and manufactures signal transmission solutions worldwide. The company had a volatile year as investors’ fears of industrial end markets softening increased. Although we are disappointed with the stock’s performance, we continue to see an attractive reward/risk opportunity going forward. The company continues to diversify and has ample dry powder on the balance sheet to continue to pursue its diversification strategy and provide further value creation. The Fund’s underweight to the real estate sector detracted from relative performance. The sector outperformed as investors preferred more defensive stocks during the volatile fourth quarter of 2018 and as Treasury yields declined in early 2019. Our decision to underweight the sector is based on the view that there are more attractive long-term reward/risk opportunities outside of the sector that possess more attractive long-term prospects.
Please see footnotes on page 7.
| | | | | | |
| Performance highlights (unaudited) | | Wells Fargo Special Small Cap Value Fund | | | 9 | |
Our outlook is cautious yet confident.
As we look out over the next 12 months, we expect volatility could remain elevated. We believe it is prudent to protect the Fund’s downside risks as we look for investment opportunities to present themselves. We do not focus on forecasting future macroeconomic news or the short-term direction of the market. Through our bottom-up stock-selection process, we focus on investing in companies that we believe have the potential to generate strong cash flows and have the balance sheet flexibility to make intelligent investment decisions. In our view, this approach may better position our investments to reap outsized rewards relative to other stocks. Because of this disciplined investment process, we remain confident in our ability to navigate all economic environments over the long term.
|
| Sector distribution as of March 31, 201911 |
|
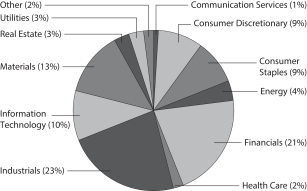
|
Please see footnotes on page 7.
| | | | |
| 10 | | Wells Fargo Special Small Cap Value Fund | | Fund expenses (unaudited) |
As a shareholder of the Fund, you incur two types of costs: (1) transaction costs, including sales charges (loads) on purchase payments and contingent deferred sales charges (if any) on redemptions and (2) ongoing costs, including management fees, distribution (12b-1) and/or shareholder servicing fees, and other Fund expenses. This example is intended to help you understand your ongoing costs (in dollars) of investing in the Fund and to compare these costs with the ongoing costs of investing in other mutual funds.
The example is based on an investment of $1,000 invested at the beginning of the six-month period and held for the entire period from October 1, 2018 to March 31, 2019.
Actual expenses
The “Actual” line of the table below provides information about actual account values and actual expenses. You may use the information in this line, together with the amount you invested, to estimate the expenses that you paid over the period. Simply divide your account value by $1,000 (for example, an $8,600 account value divided by $1,000 = 8.6), then multiply the result by the number in the “Actual” line under the heading entitled “Expenses paid during period” for your applicable class of shares to estimate the expenses you paid on your account during this period.
Hypothetical example for comparison purposes
The “Hypothetical” line of the table below provides information about hypothetical account values and hypothetical expenses based on the Fund’s actual expense ratio and an assumed rate of return of 5% per year before expenses, which is not the Fund’s actual return. The hypothetical account values and expenses may not be used to estimate the actual ending account balance or expenses you paid for the period. You may use this information to compare the ongoing costs of investing in the Fund and other funds. To do so, compare this 5% hypothetical example with the 5% hypothetical examples that appear in the shareholder reports of the other funds.
Please note that the expenses shown in the table are meant to highlight your ongoing costs only and do not reflect any transactional costs, such as sales charges (loads) and contingent deferred sales charges. Therefore, the “Hypothetical” line of the table is useful in comparing ongoing costs only and will not help you determine the relative total costs of owning different funds. In addition, if these transactional costs were included, your costs would have been higher.
| | | | | | | | | | | | | | | | |
| | | Beginning
account value
10-1-2018 | | | Ending
account value
3-31-2019 | | | Expenses
paid during
the period¹ | | | Annualized net
expense ratio | |
Class A | | | | | | | | | | | | | | | | |
| | | | |
Actual | | $ | 1,000.00 | | | $ | 924.15 | | | $ | 6.20 | | | | 1.29 | % |
| | | | |
Hypothetical (5% return before expenses) | | $ | 1,000.00 | | | $ | 1,018.49 | | | $ | 6.50 | | | | 1.29 | % |
Class C | | | | | | | | | | | | | | | | |
| | | | |
Actual | | $ | 1,000.00 | | | $ | 920.91 | | | $ | 9.78 | | | | 2.04 | % |
| | | | |
Hypothetical (5% return before expenses) | | $ | 1,000.00 | | | $ | 1,014.75 | | | $ | 10.25 | | | | 2.04 | % |
Class R | | | | | | | | | | | | | | | | |
| | | | |
Actual | | $ | 1,000.00 | | | $ | 923.39 | | | $ | 7.41 | | | | 1.54 | % |
| | | | |
Hypothetical (5% return before expenses) | | $ | 1,000.00 | | | $ | 1,017.23 | | | $ | 7.77 | | | | 1.54 | % |
Class R6 | | | | | | | | | | | | | | | | |
| | | | |
Actual | | $ | 1,000.00 | | | $ | 926.20 | | | $ | 4.15 | | | | 0.86 | % |
| | | | |
Hypothetical (5% return before expenses) | | $ | 1,000.00 | | | $ | 1,020.62 | | | $ | 4.36 | | | | 0.86 | % |
Administrator Class | | | | | | | | | | | | | | | | |
| | | | |
Actual | | $ | 1,000.00 | | | $ | 924.56 | | | $ | 5.76 | | | | 1.20 | % |
| | | | |
Hypothetical (5% return before expenses) | | $ | 1,000.00 | | | $ | 1,018.95 | | | $ | 6.04 | | | | 1.20 | % |
Institutional Class | | | | | | | | | | | | | | | | |
| | | | |
Actual | | $ | 1,000.00 | | | $ | 925.98 | | | $ | 4.51 | | | | 0.94 | % |
| | | | |
Hypothetical (5% return before expenses) | | $ | 1,000.00 | | | $ | 1,020.24 | | | $ | 4.74 | | | | 0.94 | % |
| 1 | Expenses paid is equal to the annualized net expense ratio of each class multiplied by the average account value over the period, multiplied by the number of days in the most recent fiscal half-year divided by the number of days in the fiscal year (to reflect the one-half-year period). |
| | | | | | |
| Portfolio of investments—March 31, 2019 | | Wells Fargo Special Small Cap Value Fund | | | 11 | |
| | | | | | | | | | | | | | | | |
| Security name | | | | | | | | Shares | | | Value | |
| | | | |
Common Stocks: 92.49% | | | | | | | | | | | | | | | | |
| | | | |
Communication Services: 1.11% | | | | | | | | | | | | | | | | |
| | | | |
| Media: 1.11% | | | | | | | | | | | | | | | | |
| | | | |
A.H. Belo Corporation Class A (l) | | | | | | | | | | | 1,658,289 | | | $ | 6,168,835 | |
| | | | |
Gannett Company Incorporated | | | | | | | | | | | 1,220,821 | | | | 12,867,453 | |
| | | | |
New Media Investment Group Incorporated | | | | | | | | | | | 935,139 | | | | 9,818,960 | |
| | | | |
| | | | | | | | | | | | | | | 28,855,248 | |
| | | | | | | | | | | | | | | | |
| | | | |
Consumer Discretionary: 8.89% | | | | | | | | | | | | | | | | |
| | | | |
| Diversified Consumer Services: 0.10% | | | | | | | | | | | | | | | | |
| | | | |
Liberty Tax Incorporated « | | | | | | | | | | | 274,046 | | | | 2,710,315 | |
| | | | | | | | | | | | | | | | |
| | | | |
| Hotels, Restaurants & Leisure: 6.09% | | | | | | | | | | | | | | | | |
| | | | |
Denny’s Corporation (l)† | | | | | | | | | | | 3,316,971 | | | | 60,866,418 | |
| | | | |
Dine Brands Global Incorporated | | | | | | | | | | | 713,300 | | | | 65,117,157 | |
| | | | |
The Wendy’s Company | | | | | | | | | | | 1,797,800 | | | �� | 32,162,642 | |
| | | | |
| | | | | | | | | | | | | | | 158,146,217 | |
| | | | | | | | | | | | | | | | |
| | | | |
| Household Durables: 1.24% | | | | | | | | | | | | | | | | |
| | | | |
Dixie Group Incorporated † | | | | | | | | | | | 616,935 | | | | 579,919 | |
| | | | |
Helen of Troy Limited † | | | | | | | | | | | 271,400 | | | | 31,471,544 | |
| | | | |
| | | | | | | | | | | | | | | 32,051,463 | |
| | | | | | | | | | | | | | | | |
| | | | |
| Specialty Retail: 0.17% | | | | | | | | | | | | | | | | |
| | | | |
Christopher & Banks Corporation Ǡ | | | | | | | | | | | 1,086,348 | | | | 370,445 | |
| | | | |
The Buckle Incorporated « | | | | | | | | | | | 210,120 | | | | 3,933,446 | |
| | | | |
| | | | | | | | | | | | | | | 4,303,891 | |
| | | | | | | | | | | | | | | | |
| | | | |
| Textiles, Apparel & Luxury Goods: 1.29% | | | | | | | | | | | | | | | | |
| | | | |
Delta Apparel Incorporated (l)† | | | | | | | | | | | 519,692 | | | | 11,547,556 | |
| | | | |
Steven Madden Limited | | | | | | | | | | | 648,100 | | | | 21,931,704 | |
| | | | |
| | | | | | | | | | | | | | | 33,479,260 | |
| | | | | | | | | | | | | | | | |
| | | | |
Consumer Staples: 8.53% | | | | | | | | | | | | | | | | |
| | | | |
| Beverages: 1.03% | | | | | | | | | | | | | | | | |
| | | | |
Cott Corporation | | | | | | | | | | | 1,822,700 | | | | 26,629,647 | |
| | | | | | | | | | | | | | | | |
| | | | |
| Food Products: 5.12% | | | | | | | | | | | | | | | | |
| | | | |
Hostess Brands Incorporated † | | | | | | | | | | | 1,541,623 | | | | 19,270,288 | |
| | | | |
J & J Snack Foods Corporation | | | | | | | | | | | 264,600 | | | | 42,029,064 | |
| | | | |
Nomad Foods Limited † | | | | | | | | | | | 2,469,330 | | | | 50,497,799 | |
| | | | |
TreeHouse Foods Incorporated † | | | | | | | | | | | 328,985 | | | | 21,235,982 | |
| | | | |
| | | | | | | | | | | | | | | 133,033,133 | |
| | | | | | | | | | | | | | | | |
| | | | |
| Household Products: 2.38% | | | | | | | | | | | | | | | | |
| | | | |
Central Garden & Pet Company (l)Ǡ | | | | | | | | | | | 743,522 | | | | 19,004,422 | |
| | | | |
Central Garden & Pet Company Class A † | | | | | | | | | | | 735,533 | | | | 17,101,142 | |
| | | | |
Spectrum Brands Holdings Incorporated | | | | | | | | | | | 470,001 | | | | 25,746,655 | |
| | | | |
| | | | | | | | | | | | | | | 61,852,219 | |
| | | | | | | | | | | | | | | | |
The accompanying notes are an integral part of these financial statements.
| | | | |
| 12 | | Wells Fargo Special Small Cap Value Fund | | Portfolio of investments—March 31, 2019 |
| | | | | | | | | | | | | | | | |
| Security name | | | | | | | | Shares | | | Value | |
| | | | |
Energy: 4.02% | | | | | | | | | | | | | | | | |
| | | | |
| Energy Equipment & Services: 2.07% | | | | | | | | | | | | | | | | |
| | | | |
C&J Energy Services Incorporated † | | | | | | | | | | | 547,074 | | | $ | 8,490,588 | |
| | | | |
Forum Energy Technologies Incorporated † | | | | | | | | | | | 871,000 | | | | 4,450,810 | |
| | | | |
Oil States International Incorporated † | | | | | | | | | | | 594,100 | | | | 10,075,936 | |
| | | | |
Patterson-UTI Energy Incorporated | | | | | | | | | | | 1,799,010 | | | | 25,222,120 | |
| | | | |
Tetra Technologies Incorporated † | | | | | | | | | | | 2,372,700 | | | | 5,552,118 | |
| | | | |
| | | | | | | | | | | | | | | 53,791,572 | |
| | | | | | | | | | | | | | | | |
| | | | |
| Oil, Gas & Consumable Fuels: 1.95% | | | | | | | | | | | | | | | | |
| | | | |
Berry Petroleum Corporation | | | | | | | | | | | 590,242 | | | | 6,811,393 | |
| | | | |
Callon Petroleum Company † | | | | | | | | | | | 1,083,400 | | | | 8,179,670 | |
| | | | |
Magnolia Oil & Gas Corporation † | | | | | | | | | | | 501,100 | | | | 6,013,200 | |
| | | | |
Penn Virginia Corporation † | | | | | | | | | | | 217,000 | | | | 9,569,700 | |
| | | | |
QEP Resources Incorporated † | | | | | | | | | | | 2,582,300 | | | | 20,116,117 | |
| | | | |
| | | | | | | | | | | | | | | 50,690,080 | |
| | | | | | | | | | | | | | | | |
| | | | |
Financials: 19.62% | | | | | | | | | | | | | | | | |
| | | | |
| Banks: 10.66% | | | | | | | | | | | | | | | | |
| | | | |
Associated Banc Corporation | | | | | | | | | | | 1,591,500 | | | | 33,978,525 | |
| | | | |
First Citizens BancShares Corporation Class A | | | | | | | | | | | 97,950 | | | | 39,885,240 | |
| | | | |
First Hawaiian Incorporated | | | | | | | | | | | 1,049,100 | | | | 27,329,055 | |
| | | | |
Hancock Holding Company | | | | | | | | | | | 757,245 | | | | 30,592,698 | |
| | | | |
IBERIABANK Corporation | | | | | | | | | | | 399,800 | | | | 28,669,658 | |
| | | | |
Renasant Corporation | | | | | | | | | | | 1,005,645 | | | | 34,041,083 | |
| | | | |
South State Corporation | | | | | | | | | | | 391,800 | | | | 26,775,612 | |
| | | | |
UMB Financial Corporation | | | | | | | | | | | 866,286 | | | | 55,476,955 | |
| | | | |
| | | | | | | | | | | | | | | 276,748,826 | |
| | | | | | | | | | | | | | | | |
| | | | |
| Capital Markets: 3.24% | | | | | | | | | | | | | | | | |
| | | | |
Apollo Investment Corporation « | | | | | | | | | | | 1,255,636 | | | | 19,010,329 | |
| | | | |
Artisan Partners Asset Management Incorporated Class A | | | | | | | | | | | 1,126,695 | | | | 28,358,913 | |
| | | | |
New Mountain Finance Corporation | | | | | | | | | | | 1,574,526 | | | | 21,366,318 | |
| | | | |
Westwood Holdings Group Incorporated | | | | | | | | | | | 436,883 | | | | 15,408,863 | |
| | | | |
| | | | | | | | | | | | | | | 84,144,423 | |
| | | | | | | | | | | | | | | | |
| | | | |
| Insurance: 4.22% | | | | | | | | | | | | | | | | |
| | | | |
ProAssurance Corporation | | | | | | | | | | | 875,400 | | | | 30,297,594 | |
| | | | |
Stewart Information Services Corporation | | | | | | | | | | | 707,507 | | | | 30,203,474 | |
| | | | |
The Hanover Insurance Group Incorporated | | | | | | | | | | | 217,091 | | | | 24,785,279 | |
| | | | |
White Mountains Insurance Group Limited | | | | | | | | | | | 26,100 | | | | 24,155,028 | |
| | | | |
| | | | | | | | | | | | | | | 109,441,375 | |
| | | | | | | | | | | | | | | | |
| | | | |
| Mortgage REITs: 1.50% | | | | | | | | | | | | | | | | |
| | | | |
Apollo Commercial Real Estate Finance Incorporated | | | | | | | | | | | 1,117,037 | | | | 20,330,073 | |
| | | | |
Invesco Mortgage Capital Incorporated | | | | | | | | | | | 605,880 | | | | 9,572,904 | |
| | | | |
Two Harbors Investment Corporation | | | | | | | | | | | 665,000 | | | | 8,997,450 | |
| | | | |
| | | | | | | | | | | | | | | 38,900,427 | |
| | | | | | | | | | | | | | | | |
The accompanying notes are an integral part of these financial statements.
| | | | | | |
| Portfolio of investments—March 31, 2019 | | Wells Fargo Special Small Cap Value Fund | | | 13 | |
| | | | | | | | | | | | | | | | |
| Security name | | | | | | | | Shares | | | Value | |
| | | | |
Health Care: 2.16% | | | | | | | | | | | | | | | | |
| | | | |
| Health Care Equipment & Supplies: 0.39% | | | | | | | | | | | | | | | | |
| | | | |
Avanos Medical Incorporated † | | | | | | | | | | | 233,700 | | | $ | 9,974,316 | |
| | | | | | | | | | | | | | | | |
| | | | |
| Health Care Providers & Services: 0.49% | | | | | | | | | | | | | | | | |
| | | | |
Hanger Incorporated † | | | | | | | | | | | 667,280 | | | | 12,711,684 | |
| | | | | | | | | | | | | | | | |
| | | | |
| Pharmaceuticals: 1.28% | | | | | | | | | | | | | | | | |
| | | | |
Innoviva Incorporated † | | | | | | | | | | | 900,702 | | | | 12,636,849 | |
| | | | |
Prestige Consumer Healthcare Incorporated † | | | | | | | | | | | 691,300 | | | | 20,676,783 | |
| | | | |
| | | | | | | | | | | | | | | 33,313,632 | |
| | | | | | | | | | | | | | | | |
| | | | |
Industrials: 21.36% | | | | | | | | | | | | | | | | |
| | | | |
| Building Products: 4.75% | | | | | | | | | | | | | | | | |
| | | | |
CSW Industrials Incorporated (l)† | | | | | | | | | | | 759,969 | | | | 43,538,624 | |
| | | | |
Griffon Corporation | | | | | | | | | | | 649,185 | | | | 11,996,939 | |
| | | | |
Quanex Building Products Corporation | | | | | | | | | | | 1,179,133 | | | | 18,736,423 | |
| | | | |
Simpson Manufacturing Company Incorporated | | | | | | | | | | | 828,896 | | | | 49,128,666 | |
| | | | |
| | | | | | | | | | | | | | | 123,400,652 | |
| | | | | | | | | | | | | | | | |
| | | | |
| Commercial Services & Supplies: 4.26% | | | | | | | | | | | | | | | | |
| | | | |
ACCO Brands Corporation | | | | | | | | | | | 1,492,561 | | | | 12,776,322 | |
| | | | |
Brady Corporation Class A | | | | | | | | | | | 319,009 | | | | 14,805,208 | |
| | | | |
Deluxe Corporation | | | | | | | | | | | 692,931 | | | | 30,294,943 | |
| | | | |
Ennis Incorporated | | | | | | | | | | | 1,223,593 | | | | 25,401,791 | |
| | | | |
Viad Corporation | | | | | | | | | | | 484,050 | | | | 27,247,175 | |
| | | | |
| | | | | | | | | | | | | | | 110,525,439 | |
| | | | | | | | | | | | | | | | |
| | | | |
| Electrical Equipment: 2.14% | | | | | | | | | | | | | | | | |
| | | | |
Atkore International Incorporated † | | | | | | | | | | | 1,525,890 | | | | 32,852,412 | |
| | | | |
EnerSys | | | | | | | | | | | 346,135 | | | | 22,554,157 | |
| | | | |
| | | | | | | | | | | | | | | 55,406,569 | |
| | | | | | | | | | | | | | | | |
| | | | |
| Machinery: 9.29% | | | | | | | | | | | | | | | | |
| | | | |
Douglas Dynamics Incorporated | | | | | | | | | | | 714,847 | | | | 27,214,225 | |
| | | | |
Franklin Electric Company Incorporated | | | | | | | | | | | 983,936 | | | | 50,269,290 | |
| | | | |
Global Brass & Copper Holdings Incorporated | | | | | | | | | | | 1,074,272 | | | | 36,997,928 | |
| | | | |
Hillenbrand Incorporated | | | | | | | | | | | 712,776 | | | | 29,601,587 | |
| | | | |
Kadant Incorporated | | | | | | | | | | | 268,384 | | | | 23,607,057 | |
| | | | |
Mueller Industries Incorporated | | | | | | | | | | | 2,095,171 | | | | 65,662,661 | |
| | | | |
NN Incorporated | | | | | | | | | | | 1,026,510 | | | | 7,688,560 | |
| | | | |
| | | | | | | | | | | | | | | 241,041,308 | |
| | | | | | | | | | | | | | | | |
| | | | |
| Professional Services: 0.62% | | | | | | | | | | | | | | | | |
| | | | |
Korn/Ferry International | | | | | | | | | | | 361,832 | | | | 16,202,837 | |
| | | | | | | | | | | | | | | | |
| | | | |
| Trading Companies & Distributors: 0.30% | | | | | | | | | | | | | | | | |
| | | | |
Aircastle Limited | | | | | | | | | | | 385,800 | | | | 7,808,592 | |
| | | | | | | | | | | | | | | | |
The accompanying notes are an integral part of these financial statements.
| | | | |
| 14 | | Wells Fargo Special Small Cap Value Fund | | Portfolio of investments—March 31, 2019 |
| | | | | | | | | | | | | | | | |
| Security name | | | | | | | | Shares | | | Value | |
| | | | |
Information Technology: 9.09% | | | | | | | | | | | | | | | | |
| | | | |
| Communications Equipment: 0.59% | | | | | | | | | | | | | | | | |
| | | | |
NETGEAR Incorporated | | | | | | | | | | | 463,802 | | | $ | 15,361,122 | |
| | | | | | | | | | | | | | | | |
| | | | |
| Electronic Equipment, Instruments & Components: 3.47% | | | | | | | | | | | | | | | | |
| | | | |
AVX Corporation | | | | | | | | | | | 1,043,630 | | | | 18,096,544 | |
| | | | |
Badger Meter Incorporated | | | | | | | | | | | 184,477 | | | | 10,264,300 | |
| | | | |
Belden Incorporated | | | | | | | | | | | 388,268 | | | | 20,849,992 | |
| | | | |
Coherent Incorporated † | | | | | | | | | | | 49,900 | | | | 7,071,828 | |
| | | | |
Novanta Incorporated † | | | | | | | | | | | 399,285 | | | | 33,831,418 | |
| | | | |
| | | | | | | | | | | | | | | 90,114,082 | |
| | | | | | | | | | | | | | | | |
| | | | |
| IT Services: 1.40% | | | | | | | | | | | | | | | | |
| | | | |
Conduent Incorporated † | | | | | | | | | | | 368,300 | | | | 5,093,589 | |
| | | | |
MAXIMUS Incorporated | | | | | | | | | | | 139,500 | | | | 9,901,710 | |
| | | | |
Sykes Enterprises Incorporated † | | | | | | | | | | | 755,200 | | | | 21,357,056 | |
| | | | |
| | | | | | | | | | | | | | | 36,352,355 | |
| | | | | | | | | | | | | | | | |
| | | | |
| Semiconductors & Semiconductor Equipment: 2.44% | | | | | | | | | | | | | | | | |
| | | | |
Brooks Automation Incorporated | | | | | | | | | | | 395,200 | | | | 11,591,216 | |
| | | | |
Cabot Microelectronics Corporation | | | | | | | | | | | 305,213 | | | | 34,171,647 | |
| | | | |
DSP Group Incorporated † | | | | | | | | | | | 659,148 | | | | 9,274,212 | |
| | | | |
KLA-Tencor Corporation | | | | | | | | | | | 69,557 | | | | 8,305,801 | |
| | | | |
| | | | | | | | | | | | | | | 63,342,876 | |
| | | | | | | | | | | | | | | | |
| | | | |
| Software: 0.64% | | | | | | | | | | | | | | | | |
| | | | |
ACI Worldwide Incorporated † | | | | | | | | | | | 282,300 | | | | 9,279,201 | |
| | | | |
Cision Limited † | | | | | | | | | | | 534,201 | | | | 7,355,948 | |
| | | | |
| | | | | | | | | | | | | | | 16,635,149 | |
| | | | | | | | | | | | | | | | |
| | | | |
| Technology Hardware, Storage & Peripherals: 0.55% | | | | | | | | | | | | | | | | |
| | | | |
Glassbridge Enterprises Incorporated (l)Ǡ | | | | | | | | | | | 305,421 | | | | 61,084 | |
| | | | |
NCR Corporation † | | | | | | | | | | | 514,700 | | | | 14,046,163 | |
| | | | |
| | | | | | | | | | | | | | | 14,107,247 | |
| | | | | | | | | | | | | | | | |
| | | | |
Materials: 12.36% | | | | | | | | | | | | | | | | |
| | | | |
| Chemicals: 4.58% | | | | | | | | | | | | | | | | |
| | | | |
Element Solutions Incorporated † | | | | | | | | | | | 299,200 | | | | 3,021,920 | |
| | | | |
Innospec Incorporated | | | | | | | | | | | 777,572 | | | | 64,810,626 | |
| | | | |
PolyOne Corporation | | | | | | | | | | | 656,401 | | | | 19,239,113 | |
| | | | |
PQ Group Holdings Incorporated † | | | | | | | | | | | 566,273 | | | | 8,590,361 | |
| | | | |
Sensient Technologies Corporation | | | | | | | | | | | 341,468 | | | | 23,148,116 | |
| | | | |
| | | | | | | | | | | | | | | 118,810,136 | |
| | | | | | | | | | | | | | | | |
| | | | |
| Construction Materials: 2.37% | | | | | | | | | | | | | | | | |
| | | | |
Eagle Materials Incorporated | | | | | | | | | | | 730,300 | | | | 61,564,290 | |
| | | | | | | | | | | | | | | | |
| | | | |
| Containers & Packaging: 1.60% | | | | | | | | | | | | | | | | |
| | | | |
Silgan Holdings Incorporated | | | | | | | | | | | 1,399,542 | | | | 41,468,429 | |
| | | | | | | | | | | | | | | | |
The accompanying notes are an integral part of these financial statements.
| | | | | | |
| Portfolio of investments—March 31, 2019 | | Wells Fargo Special Small Cap Value Fund | | | 15 | |
| | | | | | | | | | | | | | | | |
| Security name | | | | | | | | Shares | | | Value | |
| | | | |
| Metals & Mining: 0.42% | | | | | | | | | | | | | | | | |
| | | | |
Compass Minerals International Incorporated | | | | | | | | | | | 199,800 | | | $ | 10,863,126 | |
| | | | | | | | | | | | | | | | |
| | | | |
| Paper & Forest Products: 3.39% | | | | | | | | | | | | | | | | |
| | | | |
Neenah Paper Incorporated (l) | | | | | | | | | | | 877,121 | | | | 56,451,508 | |
| | | | |
Schweitzer-Mauduit International Incorporated | | | | | | | | | | | 814,387 | | | | 31,533,065 | |
| | | | |
| | | | | | | | | | | | | | | 87,984,573 | |
| | | | | | | | | | | | | | | | |
| | | | |
Real Estate: 2.59% | | | | | | | | | | | | | | | | |
| | | | |
| Equity REITs: 2.59% | | | | | | | | | | | | | | | | |
| | | | |
Acadia Realty Trust | | | | | | | | | | | 648,300 | | | | 17,679,141 | |
| | | | |
Pebblebrook Hotel Trust | | | | | | | | | | | 764,280 | | | | 23,738,537 | |
| | | | |
Washington REIT | | | | | | | | | | | 908,562 | | | | 25,784,990 | |
| | | | |
| | | | | | | | | | | | | | | 67,202,668 | |
| | | | | | | | | | | | | | | | |
| | | | |
Utilities: 2.76% | | | | | | | | | | | | | | | | |
| | | | |
| Electric Utilities: 2.76% | | | | | | | | | | | | | | | | |
| | | | |
Hawaiian Electric Industries Incorporated | | | | | | | | | | | 1,091,637 | | | | 44,506,040 | |
| | | | |
IDACORP Incorporated | | | | | | | | | | | 272,500 | | | | 27,124,650 | |
| | | | |
| | | | | | | | | | | | | | | 71,630,690 | |
| | | | | | | | | | | | | | | | |
| | | | |
Total Common Stocks (Cost $2,258,733,643) | | | | | | | | | | | | | | | 2,400,599,868 | |
| | | | | | | | | | | | | | | | |
| | | | |
Exchange-Traded Funds: 1.45% | | | | | | | | | | | | | | | | |
| | | | |
iShares Russell 2000 Index ETF « | | | | | | | | | | | 135,500 | | | | 20,743,695 | |
| | | | |
iShares Russell 2000 Value Index ETF « | | | | | | | | | | | 140,400 | | | | 16,833,960 | |
| | | | |
Total Exchange-Traded Funds (Cost $38,073,683) | | | | | | | | | | | | | | | 37,577,655 | |
| | | | | | | | | | | | | | | | |
| | | | |
| | | Dividend yield | | | | | | | | | | |
| Preferred Stocks: 0.35% | | | | | | | | | | | | | | | | |
| | | | |
Industrials: 0.35% | | | | | | | | | | | | | | | | |
| | | | |
| Industrial Conglomerates: 0.35% | | | | | | | | | | | | | | | | |
| | | | |
Steel Partners Holdings LP | | | 6.93 | % | | | | | | | 419,586 | | | | 9,075,645 | |
| | | | | | | | | | | | | | | | |
| | | | |
Total Preferred Stocks (Cost $9,312,343) | | | | | | | | | | | | | | | 9,075,645 | |
| | | | | | | | | | | | | | | | |
| | | | |
| | | | | | Expiration date | | | | | | | |
| Rights: 0.01% | | | | | | | | | | | | | | | | |
| | | | |
Financials: 0.01% | | | | | | | | | | | | | | | | |
| | | | |
| Diversified Financial Services: 0.01% | | | | | | | | | | | | | | | | |
| | | | |
Schulman Incorporated Class A †(a)‡ | | | | | | | 12-31-2099 | | | | 593,658 | | | | 257,054 | |
| | | | | | | | | | | | | | | | |
| | | | |
Total Rights (Cost $257,054) | | | | | | | | | | | | | | | 257,054 | |
| | | | | | | | | | | | | | | | |
The accompanying notes are an integral part of these financial statements.
| | | | |
| 16 | | Wells Fargo Special Small Cap Value Fund | | Portfolio of investments—March 31, 2019 |
| | | | | | | | | | | | | | | | |
| | | Yield | | | | | | Shares | | | Value | |
| | | | |
Short-Term Investments: 7.20% | | | | | | | | | | | | | | | | |
| | | | |
| Investment Companies: 7.20% | | | | | | | | | | | | | | | | |
| | | | |
Securities Lending Cash Investments LLC (l)(r)(u) | | | 2.55 | % | | | | | | | 57,964,218 | | | $ | 57,970,015 | |
| | | | |
Wells Fargo Government Money Market Fund Select Class (l)(u) | | | 2.38 | | | | | | | | 128,767,336 | | | | 128,767,336 | |
| | | | |
Total Short-Term Investments (Cost $186,737,351) | | | | | | | | | | | | | | | 186,737,351 | |
| | | | | | | | | | | | | | | | |
| | | | | | | | |
| Total investments in securities (Cost $2,493,114,074) | | | 101.50 | % | | | 2,634,247,573 | |
| | |
Other assets and liabilities, net | | | (1.50 | ) | | | (38,818,369 | ) |
| | | | | | | | |
| Total net assets | | | 100.00 | % | | $ | 2,595,429,204 | |
| | | | | | | | |
| (l) | The issuer of the security is an affiliated person of the Fund as defined in the Investment Company Act of 1940. |
| « | All or a portion of this security is on loan. |
| † | Non-income-earning security |
| (a) | The security is fair valued in accordance with procedures approved by the Board of Trustees. |
| ‡ | Security is valued using significant unobservable inputs. |
| (r) | The investment is a non-registered investment company purchased with cash collateral received from securities on loan. |
| (u) | The rate represents the 7-day annualized yield at period end. |
Abbreviations:
| REIT | Real estate investment trust |
The accompanying notes are an integral part of these financial statements.
| | | | | | |
| Portfolio of investments—March 31, 2019 | | Wells Fargo Special Small Cap Value Fund | | | 17 | |
Investments in Affiliates
An affiliated investment is an investment in which the Fund owns at least 5% of the outstanding voting shares of the issuer or as a result of other relationships, such as the Fund and the issuer having the same investment manager. Transactions with issuers that were either affiliated persons of the Fund at the beginning of the period or the end of the period were as follows:
| | | | | | | | | | | | | | | | | | | | | | | | | | | | | | | | | | | | |
| | | Shares, beginning of period | | | Shares
purchased | | | Shares
sold | | | Shares,
end of
period | | | Net
realized
gains
(losses) | | | Net change in
unrealized gains (losses) | | | Income from affiliated securities | | | Value, end of period | | | % of net assets | |
Common Stocks | | | | | | | | | | | | | | | | | | | | | | | | | | | | | | | | | | | | |
Communication Services | | | | | | | | | | | | | | | | | | | | | | | | | | | | | | | | | | | | |
Media | | | | | | | | | | | | | | | | | | | | | | | | | | | | | | | | | | | | |
A.H. Belo Corporation Class A | | | 1,423,589 | | | | 234,700 | | | | 0 | | | | 1,658,289 | | | $ | 0 | | | $ | (2,245,390 | ) | | $ | 494,660 | | | $ | 6,168,835 | | | | | |
Consumer Discretionary | | | | | | | | | | | | | | | | | | | | | | | | | | | | | | | | | | | | |
Hotels, Restaurants & Leisure | | | | | | | | | | | | | | | | | | | | | | | | | | | | | | | | | | | | |
Denny’s Corporation † | | | 2,668,018 | | | | 946,753 | | | | 297,800 | | | | 3,316,971 | | | | 758,602 | | | | 22,219,311 | | | | 0 | | | | 60,866,418 | | | | | |
Textiles, Apparel & Luxury Goods | | | | | | | | | | | | | | | | | | | | | | | | | | | | | | | | | | | | |
Delta Apparel Incorporated † | | | 459,492 | | | | 60,200 | | | | 0 | | | | 519,692 | | | | 0 | | | | 2,150,944 | | | | 0 | | | | 11,547,556 | | | | | |
Consumer Staples | | | | | | | | | | | | | | | | | | | | | | | | | | | | | | | | | | | | |
Household Products | | | | | | | | | | | | | | | | | | | | | | | | | | | | | | | | | | | | |
Central Garden & Pet Company † | | | 553,580 | | | | 194,042 | | | | 4,100 | | | | 743,522 | | | | (24,132 | ) | | | 3,002,444 | | | | 0 | | | | 19,004,422 | | | | | |
Industrials | | | | | | | | | | | | | | | | | | | | | | | | | | | | | | | | | | | | |
Building Products | | | | | | | | | | | | | | | | | | | | | | | | | | | | | | | | | | | | |
CSW Industrials Incorporated † | | | 664,244 | | | | 95,725 | | | | 0 | | | | 759,969 | | | | 0 | | | | 15,478,835 | | | | 0 | | | | 43,538,624 | | | | | |
Commercial Services & Supplies | | | | | | | | | | | | | | | | | | | | | | | | | | | | | | | | | | | | |
Ennis Incorporated * | | | 1,320,620 | | | | 163,273 | | | | 260,300 | | | | 1,223,593 | | | | 140,786 | | | | 1,370,302 | | | | 1,186,963 | | | | 25,401,791 | | | | | |
Information Technology | | | | | | | | | | | | | | | | | | | | | | | | | | | | | | | | | | | | |
Technology Hardware, Storage & Peripherals | | | | | | | | | | | | | | | | | | | | | | | | | | | | | | | | | | | | |
Glassbridge Enterprises Incorporated † | | | 305,221 | | | | 200 | | | | 0 | | | | 305,421 | | | | 0 | | | | (302,317 | ) | | | 0 | | | | 61,084 | | | | | |
Materials | | | | | | | | | | | | | | | | | | | | | | | | | | | | | | | | | | | | |
Paper and Forest Products | | | | | | | | | | | | | | | | | | | | | | | | | | | | | | | | | | | | |
Neenah Paper Incorporated | | | 623,520 | | | | 255,201 | | | | 1,600 | | | | 877,121 | | | | (27,006 | ) | | | (5,753,520 | ) | | | 1,211,644 | | | | 56,451,508 | | | | | |
| | | | | | | | | |
| | | | | | | | | | | | | | | | | | | | | | | | | | | | | | | 223,040,238 | | | | 8.59 | % |
| | | | | | | | | | | | | | | | | | | | | | | | | | | | | | | | | | | | |
| | | | | | | | | |
Short-Term Investments | | | | | | | | | | | | | | | | | | | | | | | | | | | | | | | | | | | | |
Investment Companies | | | | | | | | | | | | | | | | | | | | | | | | | | | | | | | | | | | | |
Securities Lending Cash Investments LLC | | | 81,074,217 | | | | 311,429,137 | | | | 334,539,136 | | | | 57,964,218 | | | | 242 | | | | 0 | | | | 1,009,779 | | | | 57,970,015 | | | | | |
Wells Fargo Government Money Market Fund Select Class | | | 139,485,748 | | | | 863,750,440 | | | | 874,468,852 | | | | 128,767,336 | | | | 0 | | | | 0 | | | | 3,237,079 | | | | 128,767,336 | | | | | |
| | | | | | | | | |
| | | | | | | | | | | | | | | | | | | | | | | | | | | | | | | 186,737,351 | | | | 7.20 | |
| | | | | | | | | | | | | | | | | | | | | | | | | | | | | | | | | | | | |
| | | | | | | | | |
| | | | | | | | | | | | | | | | | | $ | 848,492 | | | $ | 35,920,609 | | | $ | 7,140,125 | | | $ | 409,777,589 | | | | 15.79 | % |
| | | | | | | | | | | | | | | | | | | | | | | | | | | | | | | | | | | | |
| | * | No longer an affiliate of the Fund at the end of the period. |
| | † | Non-income-earning security |
The accompanying notes are an integral part of these financial statements.
| | | | |
| 18 | | Wells Fargo Special Small Cap Value Fund | | Statement of assets and liabilities—March 31, 2019 |
| | | | |
| | | | |
| |
Assets | | | | |
Investments in unaffiliated securities (including $56,429,332 of securities loaned), at value (cost $2,094,878,838) | | $ | 2,224,469,984 | |
Investments in affiliated securities, at value (cost $398,235,236) | | | 409,777,589 | |
Cash | | | 59 | |
Receivable for investments sold | | | 19,538,111 | |
Receivable for Fund shares sold | | | 7,868,960 | |
Receivable for dividends | | | 5,049,477 | |
Receivable for securities lending income | | | 2,609 | |
Prepaid expenses and other assets | | | 80,225 | |
| | | | |
Total assets | | | 2,666,787,014 | |
| | | | |
| |
Liabilities | | | | |
Payable upon receipt of securities loaned | | | 57,965,377 | |
Payable for investments purchased | | | 6,941,261 | |
Payable for Fund shares redeemed | | | 4,079,974 | |
Management fee payable | | | 1,775,525 | |
Administration fees payable | | | 284,064 | |
Distribution fees payable | | | 17,277 | |
Trustees’ fees and expenses payable | | | 1,908 | |
Accrued expenses and other liabilities | | | 292,424 | |
| | | | |
Total liabilities | | | 71,357,810 | |
| | | | |
Total net assets | | $ | 2,595,429,204 | |
| | | | |
| |
NET ASSETS CONSIST OF | | | | |
Paid-in capital | | $ | 2,446,401,127 | |
Total distributable earnings | | | 149,028,077 | |
| | | | |
Total net assets | | $ | 2,595,429,204 | |
| | | | |
| |
COMPUTATION OF NET ASSET VALUE AND OFFERING PRICE PER SHARE | | | | |
Net assets – Class A | | $ | 526,655,658 | |
Shares outstanding – Class A1 | | | 16,593,124 | |
Net asset value per share – Class A | | | $31.74 | |
Maximum offering price per share – Class A2 | | | $33.68 | |
Net assets – Class C | | $ | 24,333,942 | |
Shares outstanding – Class C1 | | | 853,987 | |
Net asset value per share – Class C | | | $28.49 | |
Net assets – Class R | | $ | 6,655,998 | |
Shares outstanding – Class R1 | | | 206,688 | |
Net asset value per share – Class R | | | $32.20 | |
Net assets – Class R6 | | $ | 518,377,158 | |
Shares outstanding – Class R61 | | | 15,926,919 | |
Net asset value per share – Class R6 | | | $32.55 | |
Net assets – Administrator Class | | $ | 160,368,773 | |
Shares outstanding – Administrator Class1 | | | 4,926,477 | |
Net asset value per share – Administrator Class | | | $32.55 | |
Net assets – Institutional Class | | $ | 1,359,037,675 | |
Shares outstanding – Institutional Class1 | | | 41,735,490 | |
Net asset value per share – Institutional Class | | | $32.56 | |
| 1 | The Fund has an unlimited number of authorized shares. |
| 2 | Maximum offering price is computed as 100/94.25 of net asset value. On investments of $50,000 or more, the offering price is reduced. |
The accompanying notes are an integral part of these financial statements.
| | | | | | |
| Statement of operations—year ended March 31, 2019 | | Wells Fargo Special Small Cap Value Fund | | | 19 | |
| | | | |
| | | | |
| |
Investment income | | | | |
Dividends (net of foreign withholding taxes of $55,162) | | $ | 42,702,888 | |
Income from affiliated securities | | | 7,352,809 | |
Interest | | | 499 | |
| | | | |
Total investment income | | | 50,056,196 | |
| | | | |
| |
Expenses | | | | |
Management fee | | | 20,420,941 | |
Administration fees | | | | |
Class A | | | 1,141,115 | |
Class C | | | 98,047 | |
Class R | | | 12,045 | |
Class R6 | | | 118,377 | |
Administrator Class | | | 246,173 | |
Institutional Class | | | 1,745,380 | |
Shareholder servicing fees | | | | |
Class A | | | 1,358,470 | |
Class C | | | 116,722 | |
Class R | | | 14,339 | |
Administrator Class | | | 470,993 | |
Distribution fees | | | | |
Class C | | | 350,167 | |
Class R | | | 14,339 | |
Custody and accounting fees | | | 79,311 | |
Professional fees | | | 52,873 | |
Registration fees | | | 202,601 | |
Shareholder report expenses | | | 216,811 | |
Trustees’ fees and expenses | | | 22,719 | |
Interest expense | | | 1,197 | |
Other fees and expenses | | | 38,193 | |
| | | | |
Total expenses | | | 26,720,813 | |
Less: Fee waivers and/or expense reimbursements | | | (351,006 | ) |
| | | | |
Net expenses | | | 26,369,807 | |
| | | | |
Net investment income | | | 23,686,389 | |
| | | | |
| |
REALIZED AND UNREALIZED GAINS (LOSSES) ON INVESTMENTS | | | | |
| |
Net realized gains on: | | | | |
Unaffiliated securities | | | 70,020,020 | |
Affiliated securities | | | 848,492 | |
| | | | |
Net realized gains on investments | | | 70,868,512 | |
| | | | |
| |
Net change in unrealized gains (losses) on: | | | | |
Unaffiliated securities | | | (168,401,892 | ) |
Affiliated securities | | | 35,920,609 | |
| | | | |
Net change in unrealized gains (losses) on investments | | | (132,481,283 | ) |
| | | | |
Net realized and unrealized gains (losses) on investments | | | (61,612,771 | ) |
| | | | |
Net decrease in net assets resulting from operations | | $ | (37,926,382 | ) |
| | | | |
The accompanying notes are an integral part of these financial statements.
| | | | |
| 20 | | Wells Fargo Special Small Cap Value Fund | | Statement of changes in net assets |
| | | | | | | | | | | | | | | | |
| | | Year ended
March 31, 2019 | | | Year ended
March 31, 20181 | |
| | | |
Operations | | | | | | | | | | | | |
Net investment income | | | | | | $ | 23,686,389 | | | | | | | $ | 18,358,131 | |
Net realized gains on investments | | | | | | | 70,868,512 | | | | | | | | 148,275,813 | |
Net change in unrealized gains (losses) on investments | | | | | | | (132,481,283 | ) | | | | | | | 21,367,502 | |
| | | | |
Net increase (decrease) in net assets resulting from operations | | | | | | | (37,926,382 | ) | | | | | | | 188,001,446 | |
| | | | |
| | | | |
Distributions to shareholders from net investment income and net realized gains | | | | | | | | | | | | | | | | |
Class A | | | | | | | (34,950,655 | ) | | | | | | | (28,923,817 | ) |
Class C | | | | | | | (3,190,299 | ) | | | | | | | (2,701,391 | ) |
Class R | | | | | | | (404,926 | ) | | | | | | | (151,245 | ) |
Class R6 | | | | | | | (29,776,704 | ) | | | | | | | (13,961,093 | ) |
Administrator Class | | | | | | | (10,505,173 | ) | | | | | | | (11,096,481 | ) |
Institutional Class | | | | | | | (92,413,835 | ) | | | | | | | (59,336,216 | ) |
| | | | |
Total distributions to shareholders | | | | | | | (171,241,592 | ) | | | | | | | (116,170,243 | ) |
| | | | |
| | | | |
Capital share transactions | | | Shares | | | | | | | | Shares | | | | | |
Proceeds from shares sold | | | | | | | | | | | | | | | | |
Class A | | | 4,399,455 | | | | 147,434,144 | | | | 2,772,875 | | | | 94,731,826 | |
Class C | | | 176,335 | | | | 5,606,048 | | | | 191,743 | | | | 5,942,942 | |
Class R | | | 108,771 | | | | 3,732,400 | | | | 122,899 | | | | 4,239,675 | |
Class R6 | | | 10,731,533 | | | | 369,575,214 | | | | 4,147,795 | | | | 146,057,838 | |
Administrator Class | | | 1,731,106 | | | | 60,553,466 | | | | 2,707,738 | | | | 94,110,194 | |
Institutional Class | | | 25,518,350 | | | | 892,397,775 | | | | 15,040,023 | | | | 526,877,607 | |
| | | | |
| | | | |
| | | | | | | 1,479,299,047 | | | | | | | | 871,960,082 | |
| | | | |
Reinvestment of distributions | | | | | | | | | | | | | | | | |
Class A | | | 1,076,242 | | | | 31,879,046 | | | | 772,732 | | | | 26,881,022 | |
Class C | | | 114,907 | | | | 3,053,065 | | | | 82,534 | | | | 2,591,651 | |
Class R | | | 13,400 | | | | 402,776 | | | | 4,226 | | | | 149,401 | |
Class R6 | | | 757,094 | | | | 23,032,048 | | | | 360,421 | | | | 12,863,108 | |
Administrator Class | | | 339,786 | | | | 10,323,048 | | | | 304,887 | | | | 10,860,280 | |
Institutional Class | | | 2,401,764 | | | | 73,095,306 | | | | 1,252,402 | | | | 44,708,634 | |
| | | | |
| | | | |
| | | | | | | 141,785,289 | | | | | | | | 98,054,096 | |
| | | | |
Payment for shares redeemed | | | | | | | | | | | | | | | | |
Class A | | | (4,558,516 | ) | | | (151,304,840 | ) | | | (5,222,764 | ) | | | (178,462,050 | ) |
Class B | | | N/A | | | | N/A | | | | (11,387 | )2 | | | (339,787 | )2 |
Class C | | | (1,140,298 | ) | | | (33,300,231 | ) | | | (568,844 | ) | | | (17,485,661 | ) |
Class R | | | (48,026 | ) | | | (1,606,676 | ) | | | (17,869 | ) | | | (617,184 | ) |
Class R6 | | | (2,789,106 | ) | | | (93,680,041 | ) | | | (2,479,153 | ) | | | (87,096,747 | ) |
Administrator Class | | | (3,674,115 | ) | | | (131,798,914 | ) | | | (2,360,366 | ) | | | (81,310,178 | ) |
Institutional Class | | | (20,110,486 | ) | | | (683,366,611 | ) | | | (9,522,751 | ) | | | (332,025,710 | ) |
| | | | |
| | | | |
| | | | | | | (1,095,057,313 | ) | | | | | | | (697,337,317 | ) |
| | | | |
Net increase in net assets resulting from capital share transactions | | | | | | | 526,027,023 | | | | | | | | 272,676,861 | |
| | | | |
Total increase in net assets | | | | | | | 316,859,049 | | | | | | | | 344,508,064 | |
| | | | |
| | |
Net assets | | | | | | | | |
Beginning of period | | | | | | | 2,278,570,155 | | | | | | | | 1,934,062,091 | |
| | | | |
End of period | | | | | | $ | 2,595,429,204 | | | | | | | $ | 2,278,570,155 | |
| | | | |
| 1 | Effective for all filings after November 4, 2018, the SEC prospectively eliminated the requirement to parenthetically disclose undistributed net investment income at the end of the period and permitted the aggregation of distributions, with the exception of tax basis returns of capital. Undistributed net investment income at March 31, 2018 was $3,571,012. The disaggregated distributions information for the period ended March 31, 2018 is included in Note 7,Distributions to Shareholders, in the notes to the financial statements. |
| 2 | For the period from April 1, 2017 to May 5, 2017. Effective at the close of business on May 5, 2017, Class B shares were converted to Class A shares and are no longer offered by the Fund. |
The accompanying notes are an integral part of these financial statements.
| | | | | | |
| Financial highlights | | Wells Fargo Special Small Cap Value Fund | | | 21 | |
(For a share outstanding throughout each period)
| | | | | | | | | | | | | | | | | | | | |
| | | Year ended March 31 | |
| CLASS A | | 2019 | | | 2018 | | | 2017 | | | 2016 | | | 2015 | |
Net asset value, beginning of period | | | $34.42 | �� | | | $33.15 | | | | $27.40 | | | | $29.27 | | | | $32.59 | |
Net investment income | | | 0.22 | | | | 0.24 | | | | 0.35 | 1 | | | 0.20 | | | | 0.26 | |
Net realized and unrealized gains (losses) on investments | | | (0.69 | ) | | | 2.89 | | | | 6.15 | | | | (1.46 | ) | | | 1.81 | |
| | | | | | | | | | | | | | | | | | | | |
Total from investment operations | | | (0.47 | ) | | | 3.13 | | | | 6.50 | | | | (1.26 | ) | | | 2.07 | |
Distributions to shareholders from | | | | | | | | | | | | | | | | | | | | |
Net investment income | | | (0.15 | ) | | | (0.32 | ) | | | (0.18 | ) | | | (0.19 | ) | | | (0.21 | ) |
Net realized gains | | | (2.06 | ) | | | (1.54 | ) | | | (0.57 | ) | | | (0.42 | ) | | | (5.18 | ) |
| | | | | | | | | | | | | | | | | | | | |
Total distributions to shareholders | | | (2.21 | ) | | | (1.86 | ) | | | (0.75 | ) | | | (0.61 | ) | | | (5.39 | ) |
Net asset value, end of period | | | $31.74 | | | | $34.42 | | | | $33.15 | | | | $27.40 | | | | $29.27 | |
Total return2 | | | (0.87 | )% | | | 9.42 | % | | | 23.69 | % | | | (4.21 | )% | | | 7.56 | % |
Ratios to average net assets (annualized) | | | | | | | | | | | | | | | | | | | | |
Gross expenses | | | 1.29 | % | | | 1.31 | % | | | 1.32 | % | | | 1.36 | % | | | 1.39 | % |
Net expenses | | | 1.29 | % | | | 1.31 | % | | | 1.32 | % | | | 1.34 | % | | | 1.34 | % |
Net investment income | | | 0.67 | % | | | 0.66 | % | | | 1.14 | % | | | 0.73 | % | | | 0.90 | % |
Supplemental data | | | | | | | | | | | | | | | | | | | | |
Portfolio turnover rate | | | 32 | % | | | 41 | % | | | 51 | % | | | 46 | % | | | 79 | % |
Net assets, end of period (000s omitted) | | | $526,656 | | | | $539,499 | | | | $575,269 | | | | $417,161 | | | | $448,980 | |
| 1 | Calculated based upon average shares outstanding |
| 2 | Total return calculations do not include any sales charges. |
The accompanying notes are an integral part of these financial statements.
| | | | |
| 22 | | Wells Fargo Special Small Cap Value Fund | | Financial highlights |
(For a share outstanding throughout each period)
| | | | | | | | | | | | | | | | | | | | |
| | | Year ended March 31 | |
| CLASS C | | 2019 | | | 2018 | | | 2017 | | | 2016 | | | 2015 | |
Net asset value, beginning of period | | | $31.21 | | | | $30.19 | | | | $25.05 | | | | $26.81 | | | | $30.31 | |
Net investment income (loss) | | | (0.05 | )1 | | | (0.03 | )1 | | | 0.12 | 1 | | | (0.03 | ) | | | 0.04 | 1 |
Net realized and unrealized gains (losses) on investments | | | (0.61 | ) | | | 2.64 | | | | 5.59 | | | | (1.31 | ) | | | 1.65 | |
| | | | | | | | | | | | | | | | | | | | |
Total from investment operations | | | (0.66 | ) | | | 2.61 | | | | 5.71 | | | | (1.34 | ) | | | 1.69 | |
Distributions to shareholders from | | | | | | | | | | | | | | | | | | | | |
Net investment income | | | 0.00 | | | | (0.05 | ) | | | 0.00 | | | | 0.00 | | | | (0.01 | ) |
Net realized gains | | | (2.06 | ) | | | (1.54 | ) | | | (0.57 | ) | | | (0.42 | ) | | | (5.18 | ) |
| | | | | | | | | | | | | | | | | | | | |
Total distributions to shareholders | | | (2.06 | ) | | | (1.59 | ) | | | (0.57 | ) | | | (0.42 | ) | | | (5.19 | ) |
Net asset value, end of period | | | $28.49 | | | | $31.21 | | | | $30.19 | | | | $25.05 | | | | $26.81 | |
Total return2 | | | (1.63 | )% | | | 8.60 | % | | | 22.75 | % | | | (4.93 | )% | | | 6.75 | % |
Ratios to average net assets (annualized) | | | | | | | | | | | | | | | | | | | | |
Gross expenses | | | 2.04 | % | | | 2.06 | % | | | 2.07 | % | | | 2.11 | % | | | 2.14 | % |
Net expenses | | | 2.04 | % | | | 2.06 | % | | | 2.07 | % | | | 2.09 | % | | | 2.09 | % |
Net investment income (loss) | | | (0.13 | )% | | | (0.10 | )% | | | 0.42 | % | | | (0.02 | )% | | | 0.15 | % |
Supplemental data | | | | | | | | | | | | | | | | | | | | |
Portfolio turnover rate | | | 32 | % | | | 41 | % | | | 51 | % | | | 46 | % | | | 79 | % |
Net assets, end of period (000s omitted) | | | $24,334 | | | | $53,145 | | | | $60,309 | | | | $40,512 | | | | $44,327 | |
| 1 | Calculated based upon average shares outstanding |
| 2 | Total return calculations do not include any sales charges. |
The accompanying notes are an integral part of these financial statements.
| | | | | | |
| Financial highlights | | Wells Fargo Special Small Cap Value Fund | | | 23 | |
(For a share outstanding throughout each period)
| | | | | | | | | | | | | | | | |
| | | Year ended March 31 | |
| CLASS R | | 2019 | | | 2018 | | | 2017 | | | 20161 | |
Net asset value, beginning of period | | | $34.94 | | | | $33.73 | | | | $27.97 | | | | $26.72 | |
Net investment income | | | 0.18 | | | | 0.17 | | | | 0.63 | 2 | | | 0.08 | 2 |
Net realized and unrealized gains (losses) on investments | | | (0.74 | ) | | | 2.92 | | | | 5.94 | | | | 1.87 | |
| | | | | | | | | | | | | | | | |
Total from investment operations | | | (0.56 | ) | | | 3.09 | | | | 6.57 | | | | 1.95 | |
Distributions to shareholders from | | | | | | | | | | | | | | | | |
Net investment income | | | (0.12 | ) | | | (0.34 | ) | | | (0.24 | ) | | | (0.28 | ) |
Net realized gains | | | (2.06 | ) | | | (1.54 | ) | | | (0.57 | ) | | | (0.42 | ) |
| | | | | | | | | | | | | | | | |
Total distributions to shareholders | | | (2.18 | ) | | | (1.88 | ) | | | (0.81 | ) | | | (0.70 | ) |
Net asset value, end of period | | | $32.20 | | | | $34.94 | | | | $33.73 | | | | $27.97 | |
Total return3 | | | (1.11 | )% | | | 9.13 | % | | | 23.47 | % | | | 7.40 | % |
Ratios to average net assets (annualized) | | | | | | | | | | | | | | | | |
Gross expenses | | | 1.55 | % | | | 1.57 | % | | | 1.56 | % | | | 1.59 | % |
Net expenses | | | 1.55 | % | | | 1.56 | % | | | 1.56 | % | | | 1.58 | % |
Net investment income | | | 0.47 | % | | | 0.43 | % | | | 1.86 | % | | | 0.56 | % |
Supplemental data | | | | | | | | | | | | | | | | |
Portfolio turnover rate | | | 32 | % | | | 41 | % | | | 51 | % | | | 46 | % |
Net assets, end of period (000s omitted) | | | $6,656 | | | | $4,631 | | | | $785 | | | | $27 | |
| 1 | For the period from September 30, 2015 (commencement of class operations) to March 31, 2016. |
| 2 | Calculated based upon average shares outstanding |
| 3 | Returns for periods of less than one year are not annualized. |
The accompanying notes are an integral part of these financial statements.
| | | | |
| 24 | | Wells Fargo Special Small Cap Value Fund | | Financial highlights |
(For a share outstanding throughout each period)
| | | | | | | | | | | | | | | | | | | | |
| | | Year ended March 31 | |
| CLASS R6 | | 2019 | | | 2018 | | | 2017 | | | 2016 | | | 20151 | |
Net asset value, beginning of period | | | $35.25 | | | | $33.93 | | | | $28.01 | | | | $29.91 | | | | $33.38 | |
Net investment income | | | 0.38 | | | | 0.38 | 2 | | | 0.61 | 2 | | | 0.39 | | | | 0.26 | 2 |
Net realized and unrealized gains (losses) on investments | | | (0.72 | ) | | | 2.97 | | | | 6.18 | | | | (1.54 | ) | | | 1.80 | |
| | | | | | | | | | | | | | | | | | | | |
Total from investment operations | | | (0.34 | ) | | | 3.35 | | | | 6.79 | | | | (1.15 | ) | | | 2.06 | |
Distributions to shareholders from | | | | | | | | | | | | | | | | | | | | |
Net investment income | | | (0.30 | ) | | | (0.49 | ) | | | (0.30 | ) | | | (0.33 | ) | | | (0.35 | ) |
Net realized gains | | | (2.06 | ) | | | (1.54 | ) | | | (0.57 | ) | | | (0.42 | ) | | | (5.18 | ) |
| | | | | | | | | | | | | | | | | | | | |
Total distributions to shareholders | | | (2.36 | ) | | | (2.03 | ) | | | (0.87 | ) | | | (0.75 | ) | | | (5.53 | ) |
Net asset value, end of period | | | $32.55 | | | | $35.25 | | | | $33.93 | | | | $28.01 | | | | $29.91 | |
Total return3 | | | (0.42 | )% | | | 9.85 | % | | | 24.22 | % | | | (3.74 | )% | | | 7.42 | % |
Ratios to average net assets (annualized) | | | | | | | | | | | | | | | | | | | | |
Gross expenses | | | 0.86 | % | | | 0.88 | % | | | 0.89 | % | | | 0.93 | % | | | 0.89 | % |
Net expenses | | | 0.86 | % | | | 0.88 | % | | | 0.89 | % | | | 0.89 | % | | | 0.89 | % |
Net investment income | | | 1.16 | % | | | 1.10 | % | | | 1.87 | % | | | 1.56 | % | | | 2.19 | % |
Supplemental data | | | | | | | | | | | | | | | | | | | | |
Portfolio turnover rate | | | 32 | % | | | 41 | % | | | 51 | % | | | 46 | % | | | 79 | % |
Net assets, end of period (000s omitted) | | | $518,377 | | | | $254,801 | | | | $176,362 | | | | $36,344 | | | | $27 | |
| 1 | For the period from October 31, 2014 (commencement of class operations) to March 31, 2015 |
| 2 | Calculated based upon average shares outstanding |
| 3 | Returns for periods of less than one year are not annualized. |
The accompanying notes are an integral part of these financial statements.
| | | | | | |
| Financial highlights | | Wells Fargo Special Small Cap Value Fund | | | 25 | |
(For a share outstanding throughout each period)
| | | | | | | | | | | | | | | | | | | | |
| | | Year ended March 31 | |
| ADMINISTRATOR CLASS | | 2019 | | | 2018 | | | 2017 | | | 2016 | | | 2015 | |
Net asset value, beginning of period | | | $35.22 | | | | $33.90 | | | | $28.02 | | | | $29.94 | | | | $33.21 | |
Net investment income | | | 0.27 | 1 | | | 0.27 | 1 | | | 0.44 | 1 | | | 0.26 | 1 | | | 0.35 | 1 |
Net realized and unrealized gains (losses) on investments | | | (0.71 | ) | | | 2.97 | | | | 6.24 | | | | (1.49 | ) | | | 1.83 | |
| | | | | | | | | | | | | | | | | | | | |
Total from investment operations | | | (0.44 | ) | | | 3.24 | | | | 6.68 | | | | (1.23 | ) | | | 2.18 | |
Distributions to shareholders from | | | | | | | | | | | | | | | | | | | | |
Net investment income | | | (0.17 | ) | | | (0.38 | ) | | | (0.23 | ) | | | (0.27 | ) | | | (0.27 | ) |
Net realized gains | | | (2.06 | ) | | | (1.54 | ) | | | (0.57 | ) | | | (0.42 | ) | | | (5.18 | ) |
| | | | | | | | | | | | | | | | | | | | |
Total distributions to shareholders | | | (2.23 | ) | | | (1.92 | ) | | | (0.80 | ) | | | (0.69 | ) | | | (5.45 | ) |
Net asset value, end of period | | | $32.55 | | | | $35.22 | | | | $33.90 | | | | $28.02 | | | | $29.94 | |
Total return | | | (0.77 | )% | | | 9.52 | % | | | 23.82 | % | | | (4.01 | )% | | | 7.78 | % |
Ratios to average net assets (annualized) | | | | | | | | | | | | | | | | | | | | |
Gross expenses | | | 1.21 | % | | | 1.23 | % | | | 1.24 | % | | | 1.26 | % | | | 1.23 | % |
Net expenses | | | 1.20 | % | | | 1.20 | % | | | 1.20 | % | | | 1.17 | % | | | 1.09 | % |
Net investment income | | | 0.74 | % | | | 0.76 | % | | | 1.36 | % | | | 0.95 | % | | | 1.10 | % |
Supplemental data | | | | | | | | | | | | | | | | | | | | |
Portfolio turnover rate | | | 32 | % | | | 41 | % | | | 51 | % | | | 46 | % | | | 79 | % |
Net assets, end of period (000s omitted) | | | $160,369 | | | | $229,992 | | | | $199,262 | | | | $95,030 | | | | $70,100 | |
| 1 | Calculated based upon average shares outstanding |
The accompanying notes are an integral part of these financial statements.
| | | | |
| 26 | | Wells Fargo Special Small Cap Value Fund | | Financial highlights |
(For a share outstanding throughout each period)
| | | | | | | | | | | | | | | | | | | | |
| | | Year ended March 31 | |
| INSTITUTIONAL CLASS | | 2019 | | | 2018 | | | 2017 | | | 2016 | | | 2015 | |
Net asset value, beginning of period | | | $35.27 | | | | $33.94 | | | | $28.03 | | | | $29.93 | | | | $33.21 | |
Net investment income | | | 0.33 | | | | 0.33 | | | | 0.60 | 1 | | | 0.30 | | | | 0.43 | 1 |
Net realized and unrealized gains (losses) on investments | | | (0.70 | ) | | | 3.01 | | | | 6.17 | | | | (1.46 | ) | | | 1.80 | |
| | | | | | | | | | | | | | | | | | | | |
Total from investment operations | | | (0.37 | ) | | | 3.34 | | | | 6.77 | | | | (1.16 | ) | | | 2.23 | |
Distributions to shareholders from | | | | | | | | | | | | | | | | | | | | |
Net investment income | | | (0.28 | ) | | | (0.47 | ) | | | (0.29 | ) | | | (0.32 | ) | | | (0.33 | ) |
Net realized gains | | | (2.06 | ) | | | (1.54 | ) | | | (0.57 | ) | | | (0.42 | ) | | | (5.18 | ) |
| | | | | | | | | | | | | | | | | | | | |
Total distributions to shareholders | | | (2.34 | ) | | | (2.01 | ) | | | (0.86 | ) | | | (0.74 | ) | | | (5.51 | ) |
Net asset value, end of period | | | $32.56 | | | | $35.27 | | | | $33.94 | | | | $28.03 | | | | $29.93 | |
Total return | | | (0.53 | )% | | | 9.82 | % | | | 24.13 | % | | | (3.79 | )% | | | 7.96 | % |
Ratios to average net assets (annualized) | | | | | | | | | | | | | | | | | | | | |
Gross expenses | | | 0.96 | % | | | 0.98 | % | | | 0.99 | % | | | 1.01 | % | | | 0.96 | % |
Net expenses | | | 0.94 | % | | | 0.94 | % | | | 0.94 | % | | | 0.94 | % | | | 0.94 | % |
Net investment income | | | 1.04 | % | | | 1.02 | % | | | 1.86 | % | | | 1.17 | % | | | 1.36 | % |
Supplemental data | | | | | | | | | | | | | | | | | | | | |
Portfolio turnover rate | | | 32 | % | | | 41 | % | | | 51 | % | | | 46 | % | | | 79 | % |
Net assets, end of period (000s omitted) | | | $1,359,038 | | | | $1,196,501 | | | | $921,732 | | | | $256,190 | | | | $189,965 | |
| 1 | Calculated based upon average shares outstanding |
The accompanying notes are an integral part of these financial statements.
| | | | | | |
| Notes to financial statements | | Wells Fargo Special Small Cap Value Fund | | | 27 | |
1. ORGANIZATION
Wells Fargo Funds Trust (the “Trust”), a Delaware statutory trust organized on March 10, 1999, is an open-end management investment company registered under the Investment Company Act of 1940, as amended (the “1940 Act”). As an investment company, the Trust follows the accounting and reporting guidance in Financial Accounting Standards Board (“FASB”) Accounting Standards Codification Topic 946, Financial Services – Investment Companies. These financial statements report on the Wells Fargo Special Small Cap Value Fund (the “Fund”) which is a diversified series of the Trust.
Effective at the close of business on May 5, 2017, Class B shares were converted to Class A shares and are no longer offered by the Fund. Information for Class B shares reflected in the financial statements represents activity through May 5, 2017.
2. SIGNIFICANT ACCOUNTING POLICIES
The following significant accounting policies, which are consistently followed in the preparation of the financial statements of the Fund, are in conformity with U.S. generally accepted accounting principles which require management to make estimates and assumptions that affect the reported amounts of assets and liabilities, disclosure of contingent assets and liabilities at the date of the financial statements, and the reported amounts of revenues and expenses during the reporting period. Actual results could differ from those estimates.
Securities valuation
All investments are valued each business day as of the close of regular trading on the New York Stock Exchange (generally 4 p.m. Eastern Time), although the Fund may deviate from this calculation time under unusual or unexpected circumstances.
Equity securities and futures contracts that are listed on a foreign or domestic exchange or market are valued at the official closing price or, if none, the last sales price. If no sale occurs on the principal exchange or market that day, a fair value price will be determined in accordance with the Fund’s Valuation Procedures.
Investments in registered open-end investment companies are valued at net asset value. Interests in non-registered investment companies that are redeemable at net asset value are fair valued normally at net asset value.
Investments which are not valued using any of the methods discussed above are valued at their fair value, as determined in good faith by the Board of Trustees of the Fund. The Board of Trustees has established a Valuation Committee comprised of the Trustees and has delegated to it the authority to take any actions regarding the valuation of portfolio securities that the Valuation Committee deems necessary or appropriate, including determining the fair value of portfolio securities, unless the determination has been delegated to the Wells Fargo Asset Management Pricing Committee at Wells Fargo Funds Management, LLC (“Funds Management”). The Board of Trustees retains the authority to make or ratify any valuation decisions or approve any changes to the Valuation Procedures as it deems appropriate. On a quarterly basis, the Board of Trustees receives reports on any valuation actions taken by the Valuation Committee or the Wells Fargo Asset Management Pricing Committee which may include items for ratification.
Securities lending
The Fund may lend its securities from time to time in order to earn additional income in the form of fees or interest on securities received as collateral or the investment of any cash received as collateral. The Fund continues to receive interest or dividends on the securities loaned. The Fund receives collateral in the form of cash or securities with a value at least equal to the value of the securities on loan. The value of the loaned securities is determined at the close of each business day and any additional required collateral is delivered to the Fund on the next business day. In a securities lending transaction, the net asset value of the Fund will be affected by an increase or decrease in the value of the securities loaned and by an increase or decrease in the value of the instrument in which collateral is invested. The amount of securities lending activity undertaken by the Fund fluctuates from time to time. In the event of default or bankruptcy by the borrower, the Fund may be prevented from recovering the loaned securities or gaining access to the collateral or may experience delays or costs in doing so. In addition, the investment of any cash collateral received may lose all or part of its value. The Fund has the right under the lending agreement to recover the securities from the borrower on demand.
The Fund lends its securities through an unaffiliated securities lending agent. Cash collateral received in connection with its securities lending transactions is invested in Securities Lending Cash Investments, LLC (the “Securities Lending Fund”). The Securities Lending Fund is exempt from registration under Section 3(c)(7) of the 1940 Act and is managed by Funds Management and is subadvised by Wells Capital Management Incorporated (“WellsCap”), an affiliate of Funds Management and an indirect wholly owned subsidiary of Wells Fargo & Company (“Wells Fargo”). Funds Management receives an advisory fee starting at 0.05% and declining to 0.01% as the average daily net assets of the Securities Lending Fund increase. All of the
| | | | |
| 28 | | Wells Fargo Special Small Cap Value Fund | | Notes to financial statements |
fees received by Funds Management are paid to WellsCap for its services as subadviser. The Securities Lending Fund seeks to provide a positive return compared to the daily Fed Funds Open Rate by investing in high-quality, U.S. dollar-denominated short-term money market instruments. Securities Lending Fund investments are valued at the evaluated bid price provided by an independent pricing service. Income earned from investment in the Securities Lending Fund (net of fees and rebates), if any, is included in income from affiliated securities on the Statement of Operations.
Futures contracts
The Fund is subject to equity price risk in the normal course of pursuing its investment objectives. Futures contracts are agreements between the Fund and a counterparty to buy or sell a specific amount of a commodity, financial instrument or currency at specified price and on a specified date. The Fund may buy and sell futures contracts in order to gain exposure to, or protect against, changes in security values. The primary risks associated with the use of futures contracts are the imperfect correlation between changes in market values of securities held by the Fund and the prices of futures contracts, and the possibility of an illiquid market. Futures contracts are generally entered into on a regulated futures exchange and cleared through a clearinghouse associated with the exchange. With futures contracts, there is minimal counterparty risk to the Fund since futures contracts are exchange traded and the exchange’s clearinghouse, as counterparty to all exchange traded futures, guarantees the futures contracts against default.
Upon entering into a futures contracts, the Fund is required to deposit either cash or securities (initial margin) with the broker in an amount equal to a certain percentage of the contract value. Subsequent payments (variation margin) are paid to or from the broker each day equal to the daily changes in the contract value. Such payments are recorded as unrealized gains or losses and, if any, shown as variation margin receivable (payable) in the Statement of Assets and Liabilities. Should the Fund fail to make requested variation margin payments, the broker can gain access to the initial margin to satisfy the Fund’s payment obligations. When the contracts are closed, a realized gain or loss is recorded in the Statement of Operations.
Security transactions and income recognition
Securities transactions are recorded on a trade date basis. Realized gains or losses are recorded on the basis of identified cost.
Dividend income is recognized on the ex-dividend date. Dividend income is recorded net of foreign taxes withheld where recovery of such taxes is not assured.
Income dividends and capital gain distributions from investment companies are recorded on the ex-dividend date. Capital gain distributions from investment companies are treated as realized gains.
Distributions to shareholders
Distributions to shareholders from net investment income and any net realized gains are recorded on the ex-dividend date and paid at least annually. Such distributions are determined in accordance with income tax regulations and may differ from U.S. generally accepted accounting principles. Dividend sources are estimated at the time of declaration. The tax character of distributions is determined as of the Fund’s fiscal year end. Therefore, a portion of the Fund’s distributions made prior to the Fund’s fiscal year end may be categorized as a tax return of capital at year end.
Federal and other taxes
The Fund intends to continue to qualify as a regulated investment company by distributing substantially all of its investment company taxable income and any net realized capital gains (after reduction for capital loss carryforwards) sufficient to relieve it from all, or substantially all, federal income taxes. Accordingly, no provision for federal income taxes was required.
The Fund’s income and federal excise tax returns and all financial records supporting those returns for the prior three fiscal years are subject to examination by the federal and Delaware revenue authorities. Management has analyzed the Fund’s tax positions taken on federal, state, and foreign tax returns for all open tax years and does not believe that there are any uncertain tax positions that require recognition of a tax liability.
As of March 31, 2019, the aggregate cost of all investments for federal income tax purposes was $2,506,347,059 and the unrealized gains (losses) consisted of:
| | | | |
| |
Gross unrealized gains | | $ | 346,870,587 | |
| |
Gross unrealized losses | | | (218,970,073 | ) |
| |
Net unrealized gains | | $ | 127,900,514 | |
| | | | | | |
| Notes to financial statements | | Wells Fargo Special Small Cap Value Fund | | | 29 | |
Class allocations
The separate classes of shares offered by the Fund differ principally in applicable sales charges, distribution, shareholder servicing, and administration fees. Class specific expenses are charged directly to that share class. Investment income, common expenses, and realized and unrealized gains (losses) on investments are allocated daily to each class of shares based on the relative proportion of net assets of each class.
3. FAIR VALUATION MEASUREMENTS
Fair value measurements of investments are determined within a framework that has established a fair value hierarchy based upon the various data inputs utilized in determining the value of the Fund’s investments. The three-level hierarchy gives the highest priority to unadjusted quoted prices in active markets for identical assets or liabilities (Level 1) and the lowest priority to unobservable inputs (Level 3). The Fund’s investments are classified within the fair value hierarchy based on the lowest level of input that is significant to the fair value measurement. The inputs are summarized into three broad levels as follows:
| ∎ | | Level 1 – quoted prices in active markets for identical securities |
| ∎ | | Level 2 – other significant observable inputs (including quoted prices for similar securities, interest rates, prepayment speeds, credit risk, etc.) |
| ∎ | | Level 3 – significant unobservable inputs (including the Fund’s own assumptions in determining the fair value of investments) |
The inputs or methodologies used for valuing investments in securities are not necessarily an indication of the risk associated with investing in those securities.
The following is a summary of the inputs used in valuing the Fund’s assets and liabilities as of March 31, 2019:
| | | | | | | | | | | | | | | | |
| | | | |
| | | Quoted prices
(Level 1) | | | Other significant
observable inputs
(Level 2) | | | Significant
unobservable inputs (Level 3) | | | Total | |
| | | | |
Assets | | | | | | | | | | | | | | | | |
Investments in: | | | | | | | | | | | | | | | | |
| | | | |
Common stocks | | | | | | | | | | | | | | | | |
| | | | |
Communication services | | $ | 28,855,248 | | | $ | 0 | | | $ | 0 | | | $ | 28,855,248 | |
| | | | |
Consumer discretionary | | | 230,691,146 | | | | 0 | | | | 0 | | | | 230,691,146 | |
| | | | |
Consumer staples | | | 221,514,999 | | | | 0 | | | | 0 | | | | 221,514,999 | |
| | | | |
Energy | | | 104,481,652 | | | | 0 | | | | 0 | | | | 104,481,652 | |
| | | | |
Financials | | | 509,235,051 | | | | 0 | | | | 0 | | | | 509,235,051 | |
| | | | |
Health care | | | 55,999,632 | | | | 0 | | | | 0 | | | | 55,999,632 | |
| | | | |
Industrials | | | 554,385,397 | | | | 0 | | | | 0 | | | | 554,385,397 | |
| | | | |
Information technology | | | 235,851,747 | | | | 61,084 | | | | 0 | | | | 235,912,831 | |
| | | | |
Materials | | | 320,690,554 | | | | 0 | | | | 0 | | | | 320,690,554 | |
| | | | |
Real estate | | | 67,202,668 | | | | 0 | | | | 0 | | | | 67,202,668 | |
| | | | |
Utilities | | | 71,630,690 | | | | 0 | | | | 0 | | | | 71,630,690 | |
| | | | |
Exchange-traded funds | | | 37,577,655 | | | | 0 | | | | 0 | | | | 37,577,655 | |
| | | | |
Preferred stocks | | | | | | | | | | | | | | | | |
| | | | |
Industrials | | | 9,075,645 | | | | 0 | | | | 0 | | | | 9,075,645 | |
| | | | |
Rights | | | | | | | | | | | | | | | | |
| | | | |
Financials | | | 0 | | | | 0 | | | | 257,054 | | | | 257,054 | |
| | | | |
Short-term investments | | | | | | | | | | | | | | | | |
| | | | |
Investment companies | | | 128,767,336 | | | | 57,970,015 | | | | 0 | | | | 186,737,351 | |
| | | | |
Total assets | | $ | 2,575,959,420 | | | $ | 58,031,099 | | | $ | 257,054 | | | $ | 2,634,247,573 | |
Additional sector, industry or geographic detail is included in the Portfolio of Investments.
At March 31, 2019, the Fund did not have any transfers into/out of Level 3.
| | | | |
| 30 | | Wells Fargo Special Small Cap Value Fund | | Notes to financial statements |
4. TRANSACTIONS WITH AFFILIATES
Management fee
Funds Management, an indirect wholly owned subsidiary of Wells Fargo, is the manager of the Fund and provides advisory and fund-level administrative services under an investment management agreement. Under the investment management agreement, Funds Management is responsible for, among other services, implementing the investment objectives and strategies of the Fund, supervising the subadviser and providing fund-level administrative services in connection with the Fund’s operations. As compensation for its services under the investment management agreement, Funds Management is entitled to receive a management fee at the following annual rate based on the Fund’s average daily net assets:
| | | | |
| |
| Average daily net assets | | Management fee | |
| |
First $500 million | | | 0.850 | % |
| |
Next $500 million | | | 0.825 | |
| |
Next $1 billion | | | 0.800 | |
| |
Next $1 billion | | | 0.775 | |
| |
Next $1 billion | | | 0.750 | |
| |
Next $1 billion | | | 0.730 | |
| |
Next $5 billion | | | 0.720 | |
| |
Over $10 billion | | | 0.710 | |
For the year ended March 31, 2019, the management fee was equivalent to an annual rate of 0.81% of the Fund’s average daily net assets.
Funds Management has retained the services of a subadviser to provide daily portfolio management to the Fund. The fee for subadvisory services is borne by Funds Management. WellsCap is the subadviser to the Fund and is entitled to receive a fee from Funds Management at an annual rate starting at 0.55% and declining to 0.40% as the average daily net assets of the Fund increase.
Administration fees
Under a class-level administration agreement, Funds Management provides class-level administrative services to the Fund, which includes paying fees and expenses for services provided by the transfer agent, sub-transfer agents, omnibus account servicers and record-keepers. As compensation for its services under the class-level administration agreement, Funds Management receives an annual fee which is calculated based on the average daily net assets of each class as follows:
| | | | |
| | | Class-level
administration fee | |
| |
Class A, Class C, Class R | | | 0.21 | % |
| |
Class R6 | | | 0.03 | |
| |
Administrator Class, Institutional Class | | | 0.13 | |
Funds Management has contractually waived and/or reimbursed management and administration fees to the extent necessary to maintain certain net operating expense ratios for the Fund. When each class of the Fund has exceeded its expense cap, Funds Management has waived fees and/or reimbursed expenses from fund level expenses on a proportionate basis and then from class specific expenses. When only certain classes exceed their expense caps, waivers and/or reimbursements are applied against class specific expenses before fund level expenses. Funds Management has committed through July 31, 2019 to waive fees and/or reimburse expenses to the extent necessary to cap the Fund’s expenses at 1.34% for Class A shares, 2.09% for Class C shares, 1.59% for Class R shares, 0.89% for Class R6 shares, 1.20% for Administrator Class shares, and 0.94% for Institutional Class shares. Prior to or after the commitment expiration date, the cap may be increased or the commitment to maintain the cap may be terminated only with the approval of the Board of Trustees.
Distribution fees
The Trust has adopted a distribution plan for Class C and Class R shares of the Fund pursuant to Rule 12b-1 under the 1940 Act. Distribution fees are charged to Class C and Class R shares and paid to Wells Fargo Funds Distributor, LLC (“Funds Distributor”), the principal underwriter, at an annual rate of 0.75% of the average daily net assets of Class C shares and 0.25% of the average daily net assets of Class R shares.
| | | | | | |
| Notes to financial statements | | Wells Fargo Special Small Cap Value Fund | | | 31 | |
In addition, Funds Distributor is entitled to receive the front-end sales charge from the purchase of Class A shares and a contingent deferred sales charge on the redemption of certain Class A shares. Funds Distributor is also entitled to receive the contingent deferred sales charges from redemptions of Class C shares. For the year ended March 31, 2019, Funds Distributor received $20,435 from the sale of Class A shares and $11 in contingent deferred sales charges from redemptions of Class C shares. No contingent deferred sales charges were incurred by Class A for the year ended March 31, 2019.
Shareholder servicing fees
The Trust has entered into contracts with one or more shareholder servicing agents, whereby Class A, Class C, Class R, and Administrator Class of the Fund are charged a fee at an annual rate of 0.25% of the average daily net assets of each respective class. A portion of these total shareholder servicing fees were paid to affiliates of Wells Fargo.
Interfund transactions
The Fund may purchase or sell portfolio investment securities to certain other Wells Fargo affiliates pursuant toRule 17a-7 under the 1940 Act and under procedures adopted by the Board of Trustees. The procedures have been designed to ensure that these interfund transactions, which do not incur broker commissions, are effected at current market prices. Pursuant to these procedures, the Fund had $36,052,084 and $11,514 in interfund purchases and sales, respectively, during the year ended March 31, 2019.
5. INVESTMENT PORTFOLIO TRANSACTIONS
Purchases and sales of investments, excluding U.S. government obligations (if any) and short-term securities, for the year ended March 31, 2019 were $1,236,453,350 and $755,764,306, respectively.
6. BANK BORROWINGS
The Trust (excluding the money market funds), Wells Fargo Master Trust and Wells Fargo Variable Trust are parties to a $280,000,000 revolving credit agreement whereby the Fund is permitted to use bank borrowings for temporary or emergency purposes, such as to fund shareholder redemption requests. Interest under the credit agreement is charged to the Fund based on a borrowing rate equal to the higher of the Federal Funds rate in effect on that day plus 1.25% or the overnight LIBOR rate in effect on that day plus 1.25%. In addition, an annual commitment fee equal to 0.25% of the unused balance is allocated to each participating fund.
During the year ended March 31, 2019, the Fund had average borrowings outstanding of $33,909 at an average interest rate of 3.53% and paid interest in the amount of $1,197.
7. DISTRIBUTIONS TO SHAREHOLDERS
The tax character of distributions paid during the years ended March 31, 2019 and March 31, 2018 were as follows:
| | | | | | | | |
| | | Year ended March 31 | |
| | |
| | | 2019 | | | 2018 | |
| | |
Ordinary income | | $ | 30,852,484 | | | $ | 55,288,780 | |
| | |
Long-term capital gain | | | 140,389,108 | | | | 60,881,463 | |
As of March 31, 2019, the components of distributable earnings on a tax basis were as follows:
| | | | |
Undistributed
ordinary
income | | Undistributed
long-term
gain | | Unrealized
gains |
| | |
| $8,534,901 | | $12,628,316 | | $127,900,514 |
| | | | |
| 32 | | Wells Fargo Special Small Cap Value Fund | | Notes to financial statements |
Effective for all filings after November 4, 2018, the Securities and Exchange Commission eliminated the requirement to separately state the components of distributions to shareholders under U.S. generally accepted accounting principles. The amounts of distributions to shareholders for the year ended March 31, 2018 were as follows:
| | | | | | | | |
| | | Net investment
income | | | Net realized
gains | |
| | |
Class A | | | $5,156,558 | | | | $23,767,259 | |
| | |
Class C | | | 80,902 | | | | 2,620,489 | |
| | |
Class R | | | 28,233 | | | | 123,012 | |
| | |
Class R6 | | | 3,491,795 | | | | 10,469,298 | |
| | |
Administrator Class | | | 2,253,608 | | | | 8,842,873 | |
| | |
Institutional Class | | | 14,206,922 | | | | 45,129,294 | |
8. INDEMNIFICATION
Under the Trust’s organizational documents, the officers and Trustees have been granted certain indemnification rights against certain liabilities that may arise out of performance of their duties to the Trust. Additionally, in the normal course of business, the Trust may enter into contracts with service providers that contain a variety of indemnification clauses. The Trust’s maximum exposure under these arrangements is dependent on future claims that may be made against the Fund and, therefore, cannot be estimated.
9. NEW ACCOUNTING PRONOUNCEMENT
In August 2018, FASB issued Accounting Standards Update (“ASU”) No. 2018-13, Fair Value Measurement (Topic 820)Disclosure Framework—Changes to the Disclosure Requirements for Fair Value Measurement.ASU 2018-13 updates the disclosure requirements for fair value measurements by modifying or removing certain disclosures and adding certain new disclosures. The amendments are effective for fiscal years, and interim periods within those fiscal years, beginning after December 15, 2019. Early adoption is permitted. Management has adopted the removal and modification of disclosures early, as permitted, and will adopt the additional new disclosures at the effective date.
| | | | | | |
| Report of independent registered public accounting firm | | Wells Fargo Special Small Cap Value Fund | | | 33 | |
TO THE SHAREHOLDERS OF THE FUND AND BOARD OF TRUSTEES OF WELLS FARGO FUNDS TRUST:
Opinion on the Financial Statements
We have audited the accompanying statement of assets and liabilities of Wells Fargo Special Small Cap Value Fund (the Fund), one of the funds constituting Wells Fargo Funds Trust, including the portfolio of investments, as of March 31, 2019, the related statement of operations for the year then ended, the statements of changes in net assets for each of the years in the two-year period then ended, and the related notes (collectively, the financial statements) and the financial highlights for each of the years or periods in the five-year period then ended. In our opinion, the financial statements and financial highlights present fairly, in all material respects, the financial position of the Fund as of March 31, 2019, the results of its operations for the year then ended, the changes in its net assets for each of the years in the two-year period then ended, and the financial highlights for each of the years or periods in the five-year period then ended, in conformity with U.S. generally accepted accounting principles.
Basis for Opinion
These financial statements and financial highlights are the responsibility of the Fund’s management. Our responsibility is to express an opinion on these financial statements and financial highlights based on our audits. We are a public accounting firm registered with the Public Company Accounting Oversight Board (United States) (PCAOB) and are required to be independent with respect to the Fund in accordance with the U.S. federal securities laws and the applicable rules and regulations of the Securities and Exchange Commission and the PCAOB.
We conducted our audits in accordance with the standards of the PCAOB. Those standards require that we plan and perform the audit to obtain reasonable assurance about whether the financial statements and financial highlights are free of material misstatement, whether due to error or fraud. Our audits included performing procedures to assess the risks of material misstatement of the financial statements and financial highlights, whether due to error or fraud, and performing procedures that respond to those risks. Such procedures included examining, on a test basis, evidence regarding the amounts and disclosures in the financial statements and financial highlights. Such procedures also included confirmation of securities owned as of March 31, 2019, by correspondence with the custodian and brokers, or by other appropriate auditing procedures. Our audits also included evaluating the accounting principles used and significant estimates made by management, as well as evaluating the overall presentation of the financial statements and financial highlights. We believe that our audits provide a reasonable basis for our opinion.

We have not been able to determine the specific year that we began serving as the auditor of one or more Wells Fargo Funds investment companies; however we are aware that we have served as the auditor of one or more Wells Fargo Funds investment companies since at least 1955.
Boston, Massachusetts
May 24, 2019
| | | | |
| 34 | | Wells Fargo Special Small Cap Value Fund | | Other information (unaudited) |
TAX INFORMATION
For corporate shareholders, pursuant to Section 854 of the Internal Revenue Code, 79.55% of ordinary income dividends qualify for the corporate dividends-received deduction for the fiscal year ended March 31, 2019.
Pursuant to Section 852 of the Internal Revenue Code, $140,389,108 was designated as a 20% rate gain distribution for the fiscal year ended March 31, 2019.
Pursuant to Section 854 of the Internal Revenue Code, $24,887,510 of income dividends paid during the fiscal year ended March 31, 2019 has been designated as qualified dividend income (QDI).
For the fiscal year ended March 31, 2019, $1,095,299 has been designated as interest-related dividends for nonresident alien shareholders pursuant to Section 871 of the Internal Revenue Code.
For the fiscal year ended March 31, 2019, $12,094,330 has been designated as short-term capital gain dividends for nonresident alien shareholders pursuant to Section 871 of the Internal Revenue Code.
PROXY VOTING INFORMATION
A description of the policies and procedures used to determine how to vote proxies relating to portfolio securities is available, upon request, by calling1-800-222-8222, visiting our website atwfam.com, or visiting the SEC website at sec.gov. Information regarding how the Fund voted proxies relating to portfolio securities during the most recent 12-month period ended June 30 is available on the Fund’s website atwfam.comor by visiting the SEC website at sec.gov.
PORTFOLIO HOLDINGS INFORMATION
The complete portfolio holdings for the Fund are publicly available monthly on the Fund’s website (wfam.com), on a one-month delayed basis. In addition, top ten holdings information (excluding derivative positions) for the Fund is publicly available on the Fund’s website on a monthly, seven-day or more delayed basis. The Fund files its complete schedule of portfolio holdings with the SEC for the first and third quarters of each fiscal year on Form N-Q, which is available by visiting the SEC website at sec.gov. In addition, the Fund’s Form N-Q may be reviewed and copied at the SEC’s Public Reference Room in Washington, DC, and at regional offices in New York City, at 233 Broadway, and in Chicago, at 175 West Jackson Boulevard, Suite 900. Information about the Public Reference Room may be obtained by calling 1-800-SEC-0330.
| | | | | | |
| Other information (unaudited) | | Wells Fargo Special Small Cap Value Fund | | | 35 | |
BOARD OF TRUSTEES AND OFFICERS
Each of the Trustees and Officers1 listed in the table below acts in identical capacities for each fund in the Wells Fargo family of funds, which consists of 151 mutual funds comprising the Wells Fargo Funds Trust, Wells Fargo Variable Trust, Wells Fargo Master Trust and four closed-end funds (collectively the “Fund Complex”). This table should be read in conjunction with the Prospectus and the Statement of Additional Information2. The mailing address of each Trustee and Officer is 525 Market Street, 12th Floor, San Francisco, CA 94105. Each Trustee and Officer serves an indefinite term, however, each Trustee serves such term until reaching the mandatory retirement age established by the Trustees.
Independent Trustees
| | | | | | |
Name and
year of birth | | Position held and
length of service* | | Principal occupations during past five years or longer | | Current other
public company or
investment company
directorships |
| | | |
William R. Ebsworth
(Born 1957) | | Trustee, since 2015 | | Retired. From 1984 to 2013, equities analyst, portfolio manager, research director and chief investment officer at Fidelity Management and Research Company in Boston, Tokyo, and Hong Kong, and retired in 2013 as Chief Investment Officer of Fidelity Strategic Advisers, Inc. where he led a team of investment professionals managing client assets. Prior thereto, Board member of Hong Kong Securities Clearing Co., Hong Kong Options Clearing Corp., the Thailand International Fund, Ltd., Fidelity Investments Life Insurance Company, and Empire Fidelity Investments Life Insurance Company. Audit Committee Chair and Investment Committee Chair of the Vincent Memorial Hospital Endowment (non-profit organization). Mr. Ebsworth is a CFA® charterholder. | | N/A |
| | | |
Jane A. Freeman (Born 1953) | | Trustee, since 2015; Chair Liaison, since 2018 | | Retired. From 2012 to 2014 and 1999 to 2008, Chief Financial Officer of Scientific Learning Corporation. From 2008 to 2012, Ms. Freeman provided consulting services related to strategic business projects. Prior to 1999, Portfolio Manager at Rockefeller & Co. and Scudder, Stevens & Clark. Board member of the Harding Loevner Funds from 1996 to 2014, serving as both Lead Independent Director and chair of the Audit Committee. Board member of the Russell Exchange Traded Funds Trust from 2011 to 2012 and the chair of the Audit Committee. Ms. Freeman is a Board Member of The Ruth Bancroft Garden (non-profit organization). She is also an inactive Chartered Financial Analyst. | | N/A |
| | | |
Isaiah Harris, Jr.3 (Born 1952) | | Trustee, since 2009; Audit Committee Chairman, since 2019 | | Retired. Chairman of the Board of CIGNA Corporation since 2009, and Director since 2005. From 2003 to 2011, Director of Deluxe Corporation. Prior thereto, President and CEO of BellSouth Advertising and Publishing Corp. from 2005 to 2007, President and CEO of BellSouth Enterprises from 2004 to 2005 and President of BellSouth Consumer Services from 2000 to 2003. Emeritus member of the Iowa State University Foundation Board of Governors. Emeritus Member of the Advisory Board of Iowa State University School of Business. Advisory Board Member, Palm Harbor Academy (private school). Advisory Board Member, Child Evangelism Fellowship (non-profit). Mr. Harris is a certified public accountant (inactive status). | | CIGNA Corporation |
| | | |
Judith M. Johnson
(Born 1949) | | Trustee, since 2008; Audit Committee Chairman, from 2009 to 2018 | | Retired. Prior thereto, Chief Executive Officer and Chief Investment Officer of Minneapolis Employees Retirement Fund from 1996 to 2008. Ms. Johnson is an attorney, certified public accountant and a certified managerial accountant. | | N/A |
| | | | |
| 36 | | Wells Fargo Special Small Cap Value Fund | | Other information (unaudited) |
| | | | | | |
Name and
year of birth | | Position held and
length of service* | | Principal occupations during past five years or longer | | Current other
public company or
investment company
directorships |
| | | |
David F. Larcker
(Born 1950) | | Trustee, since 2009 | | James Irvin Miller Professor of Accounting at the Graduate School of Business, Stanford University, Director of the Corporate Governance Research Initiative and Senior Faculty of The Rock Center for Corporate Governance since 2006. From 2005 to 2008, Professor of Accounting at the Graduate School of Business, Stanford University. Prior thereto, Ernst & Young Professor of Accounting at The Wharton School, University of Pennsylvania from 1985 to 2005. | | N/A |
| | | |
Olivia S. Mitchell
(Born 1953) | | Trustee, since 2006; Nominating and Governance Committee Chairman, since 2018 | | International Foundation of Employee Benefit Plans Professor, Wharton School of the University of Pennsylvania since 1993. Director of Wharton’s Pension Research Council and Boettner Center on Pensions & Retirement Research, and Research Associate at the National Bureau of Economic Research. Previously, Cornell University Professor from 1978 to 1993. | | N/A |
| | | |
Timothy J. Penny
(Born 1951) | | Trustee, since 1996; Chairman, since 2018 | | President and Chief Executive Officer of Southern Minnesota Initiative Foundation, a non-profit organization, since 2007. Member of the Board of Trustees of NorthStar Education Finance, Inc., a non-profit organization, since 2007. | | N/A |
| | | |
James G. Polisson
(Born 1959) | | Trustee, since 2018 | | Retired. Chief Marketing Officer, Source (ETF) UK Services, Ltd, from 2015 to 2017. From 2012 to 2015, Principal of The Polisson Group, LLC, a management consulting, corporate advisory and principal investing company. Chief Executive Officer and Managing Director at Russell Investments, Global Exchange Traded Funds from 2010 to 2012. Managing Director of Barclays Global Investors from 1998 to 2010 and Global Chief Marketing Officer for iShares and Barclays Global Investors from 2000 to 2010. Trustee of the San Francisco Mechanics’ Institute, a non-profit organization, from 2013 to 2015. Board member of the Russell Exchange Traded Fund Trust from 2011 to 2012. Director of Barclays Global Investors Holdings Deutschland GmbH from 2006 to 2009. Mr. Polisson is an attorney and has a retired status with the Massachusetts and District of Columbia Bar Associations. | | N/A |
| | | |
Pamela Wheelock
(Born 1959) | | Trustee, since 2018 | | Board member of the Destination Medical Center Economic Development Agency, Rochester, Minnesota since 2019. Chief Operating Officer, Twin Cities Habitat for Humanity from 2017 to 2019. Vice President of University Services, University of Minnesota from 2012 to 2016. Prior thereto, on the Board of Directors, Governance Committee and Finance Committee for the Minnesota Philanthropy Partners (Saint Paul Foundation) from 2012 to 2018, Interim Chief Executive Officer of Blue Cross Blue Shield of Minnesota from 2011 to 2012, Chairman of the Board from 2009 to 2012 and Board Director from 2003 to 2015. Vice President, Leadership and Community Engagement, Bush Foundation, Saint Paul, Minnesota (a private foundation) from 2009 to 2011. Executive Vice President and Chief Financial Officer, Minnesota Sports and Entertainment from 2004 to 2009 and Senior Vice President from 2002 to 2004. Executive Vice President of the Minnesota Wild Foundation from 2004 to 2008. Commissioner of Finance, State of Minnesota, from 1999 to 2002. Currently Board Chair of the Minnesota Wild Foundation since 2010. | | N/A |
| * | Length of service dates reflect the Trustee’s commencement of service with the Trust’s predecessor entities, where applicable. |
| | | | | | |
| Other information (unaudited) | | Wells Fargo Special Small Cap Value Fund | | | 37 | |
Officers
| | | | | | |
Name and
year of birth | | Position held and
length of service | | Principal occupations during past five years or longer | | |
| | | |
Andrew Owen
(Born 1960) | | President, since 2017 | | Executive Vice President of Wells Fargo & Company and Head of Affiliated Managers, Wells Fargo Asset Management, since 2014. In addition, Mr. Owen is currently President, Chief Executive Officer and Director of Wells Fargo Funds Management, LLC since 2017. Prior thereto, Executive Vice President responsible for marketing, investments and product development for Wells Fargo Funds Management, LLC, from 2009 to 2014. | | |
| | | |
Nancy Wiser1
(Born 1967) | | Treasurer, since 2012 | | Executive Vice President of Wells Fargo Funds Management, LLC since 2011. Chief Operating Officer and Chief Compliance Officer at LightBox Capital Management LLC, from 2008 to 2011. | | |
| | | |
Alexander Kymn
(Born 1973) | | Secretary and Chief Legal Officer, since 2018 | | Senior Company Counsel of Wells Fargo Bank, N.A. since 2018 (previously Senior Counsel from 2007 to 2018). Vice President of Wells Fargo Funds Management, LLC from 2008 to 2014. | | |
| | | |
Michael H. Whitaker
(Born 1967) | | Chief Compliance Officer, since 2016 | | Senior Vice President and Chief Compliance Officer since 2016. Senior Vice President and Chief Compliance Officer for Fidelity Investments from 2007 to 2016. | | |
| | | |
David Berardi
(Born 1975) | | Assistant Treasurer, since 2009 | | Vice President of Wells Fargo Funds Management, LLC since 2009. Vice President of Evergreen Investment Management Company, LLC from 2008 to 2010. Manager of Fund Reporting and Control for Evergreen Investment Management Company, LLC from 2004 to 2010. | | |
| | | |
Jeremy DePalma1
(Born 1974) | | Assistant Treasurer, since 2009 | | Senior Vice President of Wells Fargo Funds Management, LLC since 2009. Senior Vice President of Evergreen Investment Management Company, LLC from 2008 to 2010 and head of the Fund Reporting and Control Team within Fund Administration from 2005 to 2010. | | |
| 1 | Nancy Wiser acts as Treasurer of 65 funds in the Fund Complex. Jeremy DePalma acts as Treasurer of 86 funds and Assistant Treasurer of 65 funds in the Fund Complex. |
| 2 | The Statement of Additional Information includes additional information about the Trustees and is available, without charge, upon request, by calling1-800-222-8222 or by visiting the website atwfam.com. |
| 3 | Mr. Harris became Chairman of the Audit Committee effective January 1, 2019. |
| | | | |
| 38 | | Wells Fargo Special Small Cap Value Fund | | Appendix A (unaudited) |
SALES CHARGE REDUCTIONS AND WAIVERS FOR CERTAIN INTERMEDIARIES
Raymond James & Associates, Inc., Raymond James Financial Services & Raymond James affiliates (“Raymond James”)
Effective on or about March 1, 2019, shareholders purchasing Fund shares through a Raymond James platform or account will be eligible only for the following load waivers (front-end sales charge waivers and contingent deferred, or back-end, sales charge waivers) and discounts, which may differ from those disclosed elsewhere in the Fund’s Prospectus or SAI.
Front-end Sales Load Waivers on Class A shares Available at Raymond James
| | • | | Shares purchased in an investment advisory program. |
| | • | | Shares purchased through reinvestment of capital gains distributions and dividend reinvestment when purchasing shares of the same fund (but not any other fund within the fund family). |
| | • | | Employees and registered representatives of Raymond James or its affiliates and their family members as designated by Raymond James. |
| | • | | Shares purchased from the proceeds of redemptions within the same fund family, provided (1) the repurchase occurs within 90 days following the redemption, (2) the redemption and purchase occur in the same account, and (3) redeemed shares were subject to a front-end or deferred sales load (known as Rights of Reinstatement). |
| | • | | A shareholder in the fund’s Class C shares will have their shares automatically exchanged at net asset value to Class A shares (or the appropriate share class) of the fund if the shares are no longer subject to a CDSC and the exchange is in line with the policies and procedures of Raymond James. |
CDSC Waivers on Class A and C Shares Available at Raymond James
| | • | | Death or disability of the shareholder. |
| | • | | Shares sold as part of a systematic withdrawal plan as described in the Fund’s Prospectus. |
| | • | | Return of excess contributions from an IRA Account. |
| | • | | Shares sold as part of a required minimum distribution for IRA and retirement accounts due to the shareholder reaching age 70½ as described in the Fund’s prospectus. |
| | • | | Shares sold to pay Raymond James fees but only if the transaction is initiated by Raymond James. |
| | • | | Shares acquired through a right of reinstatement. |
Front-end Load Discounts Available at Raymond James: Breakpoints, and/or Rights of Accumulation
| | • | | Breakpoints as described in the Fund’s Prospectus. |
| | • | | Rights of accumulation which entitle shareholders to breakpoint discounts will be automatically calculated based on the aggregated holding of fund family assets held by accounts within the purchaser’s household at Raymond James. Eligible fund family assets not held at Raymond James may be included in the rights of accumulation calculation only if the shareholder notifies his or her financial advisor about such assets. |
This page is intentionally left blank.
This page is intentionally left blank.

For more information
More information about Wells Fargo Funds is available free upon request. To obtain literature, please write, visit the Fund’s website, or call:
Wells Fargo Funds
P.O. Box 219967
Kansas City, MO 64121-9967
Website: wfam.com
Individual investors: 1-800-222-8222
Retail investment professionals: 1-888-877-9275
Institutional investment professionals:1-866-765-0778
This report and the financial statements contained herein are submitted for the general information of the shareholders of the Fund. If this report is used for promotional purposes, distribution of the report must be accompanied or preceded by a current prospectus. Before investing, please consider the investment objectives, risks, charges, and expenses of the investment. For a current prospectus and, if available, a summary prospectus, containing this information, call1-800-222-8222 or visit the Fund’s website atwfam.com. Read the prospectus carefully before you invest or send money.
Wells Fargo Asset Management (WFAM) is the trade name for certain investment advisory/management firms owned by Wells Fargo & Company. These firms include but are not limited to Wells Capital Management Incorporated and Wells Fargo Funds Management, LLC. Certain products managed by WFAM entities are distributed by Wells Fargo Funds Distributor, LLC (a broker-dealer and Member FINRA).
This material is for general informational and educational purposes only and is NOT intended to provide investment advice or a recommendation of any kind—including a recommendation for any specific investment, strategy, or plan.
INVESTMENT PRODUCTS: NOT FDIC INSURED ◾ NO BANK GUARANTEE ◾ MAY LOSE VALUE
© 2019 Wells Fargo Funds Management, LLC. All rights reserved.
| | |
 | | 401594 05-19 A246/AR246 03-19 |
Annual Report
March 31, 2019

Wells Fargo Traditional Small Cap Growth Fund

Beginning on January 1, 2021, as permitted by new regulations adopted by the Securities and Exchange Commission, paper copies of the Wells Fargo Funds’ annual and semi-annual shareholder reports issued after this date will no longer be sent by mail, unless you specifically request paper copies of the reports. Instead, the reports will be made available on the Funds’ website, and you will be notified by mail each time a report is posted and provided with a website address to access the report.
If you already elected to receive shareholder reports electronically, you will not be affected by this change and you need not take any action. You may elect to receive shareholder reports and other communications from the Fund electronically at any time by contacting your financial intermediary (such as a broker-dealer or bank) or, if you are a direct investor, by calling 1-800-222-8222 or by enrolling at wellsfargo.com/advantagedelivery.
You may elect to receive all future reports in paper free of charge. If you invest through a financial intermediary, you can contact your financial intermediary to request that you continue to receive paper copies of your shareholder reports; if you invest directly with the Fund, you can call 1-800-222-8222. Your election to receive reports in paper will apply to all Wells Fargo Funds held in your account with your financial intermediary or, if you are a direct investor, to all Wells Fargo Funds that you hold.

Reduce clutter. Save trees.
Sign up for electronic delivery of prospectuses and shareholder reports atwellsfargo.com/advantagedelivery
Contents
The views expressed and any forward-looking statements are as of March 31, 2019, unless otherwise noted, and are those of the Fund managers and/or Wells Fargo Asset Management. Discussions of individual securities, or the markets generally, or any Wells Fargo Fund are not intended as individual recommendations. Future events or results may vary significantly from those expressed in any forward-looking statements. The views expressed are subject to change at any time in response to changing circumstances in the market. Wells Fargo and the Fund disclaim any obligation to publicly update or revise any views expressed or forward-looking statements.
INVESTMENT PRODUCTS: NOT FDIC INSURED ◾ NO BANK GUARANTEE ◾ MAY LOSE VALUE
| | | | |
| 2 | | Wells Fargo Traditional Small Cap Growth Fund | | Letter to shareholders (unaudited) |

Andrew Owen
President
Wells Fargo Funds
Global trade tensions escalated during the second quarter of 2018.
Dear Shareholder:
We are pleased to offer you this annual report for the Wells Fargo Traditional Small Cap Growth Fund for the12-month period that ended March 31, 2019. An upward trend for short-term interest rates, inflation concerns, trade tensions, and geopolitical events contributed to investment market volatility for much of 2018. Equity investor sentiment improved during the first quarter of 2019 thanks to a shift in U.S. Federal Reserve (Fed) policy and consistent if not spectacular economic and business growth metrics.
For the period, U.S. stocks, as measured by the S&P 500 Index,1 gained 9.50% and international stocks, as measured by the MSCI ACWI ex USA Index (Net),2 declined 4.22%. Based on the MSCI EM Index (Net),3 emerging market stocks fell 7.41%. For bond investors, the Bloomberg Barclays U.S. Aggregate Bond Index4 added 4.48% while the Bloomberg Barclays Global Aggregateex-USD Index5 lost 4.13%. The Bloomberg Barclays Municipal Bond Index6 added 5.38%, and the ICE BofAML U.S. High Yield Index7 gained 5.94%.
Trade tensions and U.S. interest rates influenced markets.
Global trade tensions escalated during the second quarter of 2018. Atit-for-tat tariff spat intensified between the U.S. and other governments. The Fed raised the federal funds rate by 25 basis points (bps; 100 bps equal 1.00%) to a target range of between 1.75% and 2.00% in June 2018. Market index results reflected the global concerns. The MSCI ACWI ex USA Index (Net) lost 2.61%, while the Bloomberg Barclays Global Aggregateex-USD Index dropped 4.76%.
Not all news was bad. The U.S. Bureau of Economic Analysis reported second-quarter annualized gross domestic product (GDP) growth of 4.2%. Hiring improved. Unemployment declined. Consumer confidence and spending increased. The S&P 500 Index recorded a 3.43% second-quarter gain. Stocks of companies with smaller capitalizations did even better, as measured by the Russell 2000® Index,8 adding 7.75%.
| 1 | The S&P 500 Index consists of 500 stocks chosen for market size, liquidity, and industry group representation. It is a market-value-weighted index with each stock’s weight in the index proportionate to its market value. You cannot invest directly in an index. |
| 2 | The Morgan Stanley Capital International (MSCI) All Country World Index (ACWI) ex USA Index (Net) is a free-float-adjusted market-capitalization-weighted index that is designed to measure the equity market performance of developed markets, excluding the United States and Canada. Source: MSCI. MSCI makes no express or implied warranties or representations and shall have no liability whatsoever with respect to any MSCI data contained herein. The MSCI data may not be further redistributed or used as a basis for other indices or any securities or financial products. This report is not approved, reviewed, or produced by MSCI. You cannot invest directly in an index. |
| 3 | The MSCI Emerging Markets (EM) Index (Net) is a free-float-adjusted market-capitalization-weighted index that is designed to measure large- andmid-cap equity market performance of emerging markets. The MSCI EM Index (Net) consists of the following 24 emerging market country indices: Brazil, Chile, China, Colombia, Czech Republic, Egypt, Greece, Hungary, India, Indonesia, Korea, Malaysia, Mexico, Pakistan, Peru, the Philippines, Poland, Qatar, Russia, South Africa, Taiwan, Thailand, Turkey, and the United Arab Emirates. You cannot invest directly in an index. |
| 4 | The Bloomberg Barclays U.S. Aggregate Bond Index is a broad-based benchmark that measures the investment-grade, U.S. dollar-denominated, fixed-rate taxable bond market, including Treasuries, government-related and corporate securities, mortgage-backed securities (agency fixed-rate and hybrid adjustable-rate mortgage pass-throughs), asset-backed securities, and commercial mortgage-backed securities. You cannot invest directly in an index. |
| 5 | The Bloomberg Barclays Global Aggregateex-USD Index is an unmanaged index that provides a broad-based measure of the global investment-grade fixed-income markets excluding the U.S. dollar-denominated debt market. You cannot invest directly in an index. |
| 6 | The Bloomberg Barclays Municipal Bond Index is an unmanaged index composed of long-termtax-exempt bonds with a minimum credit rating of Baa. You cannot invest directly in an index. |
| 7 | The ICE BofAML U.S. High Yield Index is a market-capitalization-weighted index of domestic and Yankee high-yield bonds. The index tracks the performance of high-yield securities traded in the U.S. bond market. You cannot invest directly in an index. Copyright 2019. ICE Data Indices, LLC. All rights reserved. |
| 8 | The Russell 2000® Index measures the performance of the 2,000 smallest companies in the Russell 3000® Index, which represents approximately 8% of the total market capitalization of the Russell 3000® Index. You cannot invest directly in an index. |
| | | | | | |
| Letter to shareholders (unaudited) | | Wells Fargo Traditional Small Cap Growth Fund | | | 3 | |
Investors appeared to shake off lingering concerns during the third quarter.
Favorable third-quarter economic indicators and corporate earnings reports encouraged domestic stock investors. U.S. trade negotiations with Mexico and Canada progressed. The Conference Board Consumer Confidence Index®9 reached its highest level in 18 years during September 2018. The Fed raised the federal funds rate by 25 bps to a target range of between 2.00% and 2.25% in September 2018. For the quarter that ended September 30, 2018, the S&P 500 Index added 7.71%.
Investors in international markets were not as confident. Tensions between the U.S. and China increased. The U.S. imposed $200 billion in tariffs on Chinese goods. China reacted with $60 billion in tariffs on U.S. goods. Economic growth in China caused concern. The Bank of England raised its monetary policy rate to 0.75% in August 2018. During the quarter, the MSCI ACWI ex USA Index (Net) gained 0.71%. The MSCI EM Index (Net) declined 1.09%. In fixed-income markets, U.S. bonds were flat, as measured by the Bloomberg Barclays U.S. Aggregate Bond Index. The Bloomberg Barclays Global Aggregateex-USD Index fell 1.74%.
Conflicting data unsettled markets during the fourth quarter.
November’s U.S. midterm elections shifted control of the House of Representatives from Republicans to Democrats, presaging potential partisan clashes. Third-quarter U.S. GDP was announced at an annualized 3.4% rate, lower than the second-quarter rate. Brexit efforts stalled ahead of the March 2019 deadline. The People’s Bank of China cut reserve requirement ratios, accelerated infrastructure spending, and cut taxes even as the value of the yuan declined to low levels last seen in 2008.
December’s S&P 500 Index performance was the worst since 1931. Globally,fixed-income investments fared better than stocks during the last two months of the year. The Fed increased the federal funds rate by 25 bps in December 2018 to a target range of between 2.25% and 2.50% and softened its outlook for 2019 rate increases.
The market climbs a wall of worry.
Investors entered 2019 with reasons to be concerned. A partial U.S. government shutdown driven by partisan spending and immigration policy disputes extended into January. Investors expected high levels of stock market volatility to continue based on the VIX10.
January’s returns tended to support the investing adage that markets climb a wall of worry. The S&P 500 Index gained 8.01% for the month that ended January 31, 2019, its best monthly performance in 30 years. Returns for the MSCI ACWI ex USA Index (Net), the Bloomberg Barclays U.S. Aggregate Bond Index, and the Bloomberg Barclays Global Aggregateex-USD Index also were positive. The Fed indicated that it would pause its program of regular rate increases during 2019 as inflation remained low. Businesses and investors responded positively to the shift in policy.
In February, concerns over slowing global growth reemerged. The Bureau of Economic Analysis announced fourth-quarter 2018 GDP grew at an annualized 2.2% rate, down from the 4.2% annualized rate for the second quarter and the 3.4% annualized rate for the third quarter. Analysts attributed the lower growth rate to a slowing housing market and larger trade deficit. The U.S. Department of
Favorable third-quarter economic indicators and corporate earnings reports encouraged domestic stock investors.
| 9 | The Conference Board Consumer Confidence Index® measures the degree of optimism on the state of the U.S. economy that consumers are expressing through their activities of savings and spending. You cannot invest directly in an index. |
| 10 | The Chicago Board Options Exchange Market Volatility Index (VIX) is a popular measure of the implied volatility of S&P 500 Index options. It represents one measure of the market’s expectation of stock market volatility over the next30-day period. You cannot invest directly in an index. |
| | | | |
| 4 | | Wells Fargo Traditional Small Cap Growth Fund | | Letter to shareholders (unaudited) |
Labor said that the economy created just 20,000 jobs in February 2019. In a February report, the Bank of England forecast the slowest growth since the financial crisis for 2019. China and the U.S., while putting future tariffs on hold for the time being, continued to wrangle over trade issues.
By the end of March 2019, the combination of dovish Fed sentiment and consistent, if not spectacular, economic and business metrics reinforced investors’ enthusiasm for equity investing. Monthly job creation data regained its momentum. Corporate profits, while lower than 2018’s lofty levels, remained consistent. Inflation rates were relatively low in the U.S., Europe, and Japan. China announced a roughly $300 billion stimulus package through tax and fee cuts intended to reinvigorate economic growth.
Don’t let short-term uncertainty derail long-term investment goals.
Periods of investment uncertainty can present challenges, but experience has taught us that maintaining long-term investment goals can be an effective way to plan for the future. To help you create a sound strategy based on your personal goals and risk tolerance, Wells Fargo Funds offers more than 100 mutual funds spanning a wide range of asset classes and investment styles. Although diversification cannot guarantee an investment profit or prevent losses, we believe it can be an effective way to manage investment risk and potentially smooth out overall portfolio performance. We encourage investors to know their investments and to understand that appropriate levels of risk-taking may unlock opportunities.
Thank you for choosing to invest with Wells Fargo Funds. We appreciate your confidence in us and remain committed to helping you meet your financial needs.
Sincerely,

Andrew Owen
President
Wells Fargo Funds
For further information about your Fund, contact your investment professional, visit our website atwfam.com, or call us directly at1-800-222-8222.
This page is intentionally left blank.
| | | | |
| 6 | | Wells Fargo Traditional Small Cap Growth Fund | | Performance highlights (unaudited) |
Investment objective
The Fund seeks long-term capital appreciation.
Manager
Wells Fargo Funds Management, LLC
Subadviser
Wells Capital Management Incorporated
Portfolio managers
Michael T. Smith, CFA®‡
Christopher J. Warner, CFA®‡
Average annual total returns (%) as of March 31, 2019
| | | | | | | | | | | | | | | | | | | | | | | | | | | | | | | | | | |
| | | | | Including sales charge | | | Excluding sales charge | | | Expense ratios1 (%) | |
| | | Inception date | | 1 year | | | 5 year | | | 10 year | | | 1 year | | | 5 year | | | 10 year | | | Gross | | | Net3 | |
| | | | | | | | | |
| Class A (EGWAX)3 | | 6-5-1995 | | | 10.74 | | | | 7.51 | | | | 15.01 | | | | 17.46 | | | | 8.78 | | | | 15.69 | | | | 1.54 | | | | 1.25 | |
| | | | | | | | | |
| Class C (EGWCX)4 | | 7-30-2010 | | | 15.69 | | | | 7.99 | | | | 14.84 | | | | 16.69 | | | | 7.99 | | | | 14.84 | | | | 2.29 | | | | 2.00 | |
| | | | | | | | | |
| Administrator Class (EGWDX)5 | | 7-30-2010 | | | – | | | | – | | | | – | | | | 17.59 | | | | 8.97 | | | | 15.86 | | | | 1.46 | | | | 1.17 | |
| | | | | | | | | |
| Institutional Class (EGRYX)3 | | 11-19-1997 | | | – | | | | – | | | | – | | | | 17.85 | | | | 9.16 | | | | 16.08 | | | | 1.21 | | | | 0.92 | |
| | | | | | | | | |
| Russell 2000®Growth Index6 | | – | | | – | | | | – | | | | – | | | | 3.85 | | | | 8.41 | | | | 16.52 | | | | – | | | | – | |
Figures quoted represent past performance, which is no guarantee of future results, and do not reflect taxes that a shareholder may pay on fund distributions or the redemption of fund shares. Investment return and principal value of an investment will fluctuate so that an investor’s shares, when redeemed, may be worth more or less than their original cost. Performance shown without sales charges would be lower if sales charges were reflected. Current performance may be lower or higher than the performance data quoted, which assumes the reinvestment of dividends and capital gains. Currentmonth-end performance is available on the Fund’s website, wfam.com.
Index returns do not include transaction costs associated with buying and selling securities, any mutual fund fees or expenses, or any taxes. It is not possible to invest directly in an index.
For Class A shares, the maximumfront-end sales charge is 5.75%. For Class C shares, the maximum contingent deferred sales charge is 1.00%. Performance including a contingent deferred sales charge assumes the sales charge for the corresponding time period. Administrator Class and Institutional Class shares are sold without afront-end sales charge or contingent deferred sales charge.
Stock values fluctuate in response to the activities of individual companies and general market and economic conditions. Smaller-company stocks tend to be more volatile and less liquid than those of larger companies. Consult the Fund’s prospectus for additional information on these and other risks.
Please see footnotes on page 7.
| | | | | | |
| Performance highlights (unaudited) | | Wells Fargo Traditional Small Cap Growth Fund | | | 7 | |
|
| Growth of $10,000 investment as of March 31, 20197 |
|
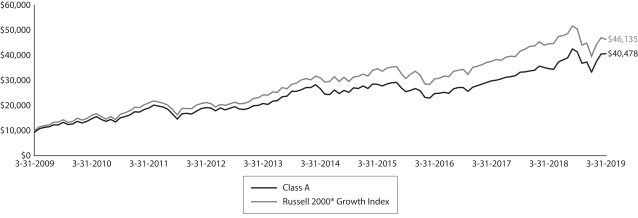 |
| ‡ | CFA® and Chartered Financial Analyst®are trademarks owned by CFA Institute. |
| 1 | Reflects the expense ratios as stated in the most recent prospectuses, which include the impact of 0.02% in acquired fund fees and expenses. The expense ratios shown are subject to change and may differ from the annualized expense ratios shown in the financial highlights of this report, which do not include acquired fund fees and expenses. |
| 2 | The manager has contractually committed through July 31, 2019, to waive fees and/or reimburse expenses to the extent necessary to cap the expenses of each class after fee waivers at 1.23% for Class A, 1.98% for Class C, 1.15% for Administrator Class, and 0.90% for Institutional Class. Brokerage commissions, stamp duty fees, interest, taxes, acquired fund fees and expenses (if any), and extraordinary expenses are excluded from the expense cap. Prior to or after the commitment expiration date, the cap may be increased or the commitment to maintain the cap may be terminated only with the approval of the Board of Trustees. Without this cap, the Fund’s returns would have been lower. The expense ratio paid by an investor is the net expense ratio (the total annual fund operating expenses after fee waivers) as stated in the prospectuses. |
| 3 | Historical performance shown for this class prior to July 19, 2010, is based on the performance of the same class of the Fund’s predecessor, Evergreen Growth Fund. |
| 4 | Historical performance shown for Class C shares prior to their inception reflects the performance of Class A shares and has been adjusted to reflect the higher expenses applicable to Class C shares. |
| 5 | Historical performance shown for Administrator Class shares prior to their inception reflects the performance of Institutional Class shares and has been adjusted to reflect the higher expenses applicable to Administrator Class shares. |
| 6 | The Russell 2000® Growth Index measures the performance of those Russell 2000 companies with higher price/book ratios and higher forecasted growth values. You cannot invest directly in an index. |
| 7 | The chart compares the performance of Class A shares for the most recent ten years with the Russell 2000® Growth Index. The chart assumes a hypothetical investment of $10,000 in Class A shares and reflects all operating expenses and assumes the maximum initial sales charge of 5.75%. |
| 8 | The ten largest holdings, excluding cash, cash equivalents and any money market funds, are calculated based on the value of the investments divided by total net assets of the Fund. Holdings are subject to change and may have changed since the date specified. |
| 9 | Amounts are calculated based on the total long-term investments of the Fund. These amounts are subject to change and may have changed since the date specified. |
| * | This security was no longer held at the end of the reporting period. |
| | | | |
| 8 | | Wells Fargo Traditional Small Cap Growth Fund | | Performance highlights (unaudited) |
MANAGER’S DISCUSSION
Fund highlights
| ∎ | | The Fund outperformed its benchmark, the Russell 2000® Growth Index, for the12-month period that ended March 31, 2019. |
| ∎ | | Security selection within the health care and consumer discretionary sectors contributed to the Fund’s performance. |
| ∎ | | Select holdings within the consumer staples and industrials sectors negatively affected performance. |
Volatility reemerged during the second half of the12-month period.
A year that began with optimism for synchronized global economic growth eventually evolved into a decidedlyrisk-off equity market over the past year. The change in sentiment was driven by escalating uncertainty and fears as the year progressed. Mounting geopolitical concerns, the chaos with Brexit, rising domestic interest rates, concern over the stability of select emerging market economies, and escalating fears of a trade war with China were all contributing factors. These events contributed to a spike in downward volatility toward the end of 2018. The Federal Reserve’s (Fed’s) shift toward a dovish policy stance provided a tailwind for equities to recover most of their losses during the first quarter of 2019. With the exception of the volatile fourth quarter of 2018, domestic stocks were largely tied to company-specific fundamentals. This backdrop proved beneficial to the Fund’s positioning.
In terms of portfolio positioning of the Fund, we continue to emphasize companies with a secular rather than a cyclical growth profile. The Fund remains positioned toward companies with high visibility of earnings growth and those positioned toward innovation and disruption. We consider these businesses to be on the right side of change. We believe this strategy will prove beneficial in the months to come.
Select holdings in the health care and consumer discretionary sectors contributed to performance.
The Fund’s outperformance in the health care sector was driven in large part by the Fund’s holdings in idiosyncratic growth companies. OrthoPediatrics Corporation, a medical device company, launched new products designed to grow with children’s bones. Increasing market penetration drove a high rate of revenue growth during the year. Additionally within health care, Amedisys, Incorporated*, is the largest player within the home health market and added to returns in the sector. The company benefited from a favorable demand environment as patient care migrated away from nursing homes to anat-home setting where care is more customized and realized at lower costs. A greater focus on cost controls, along with the improved organic sales growth, led to considerable profit expansion during our time holding the shares.
Within the consumer discretionary sector, Etsy, Incorporated, benefited from the ongoing strength ofe-commercevis-a-vis traditional brick and mortar retailers. Etsy operates a global online marketplace for unique and creative goods. Over the past year, the company reported better-than-expected revenue and earnings growth, which helped propel shares sharply higher. The company is benefiting from two vectors of growth as its current customer base has increased its activity while at the same time attracting new customers to its platform. During the period, Etsy was also able to raise its transaction fees without a material impact to business trends.
Select holdings in consumer staples and industrials detracted from Fund performance.
The underperformance in the consumer staples sector was partially driven by the Fund’s position in National Beverage Corporation*. The company benefited from rapid growth of its La Croix sparkling water brand. However, a combination of growing competition, rising input costs, and scrutiny of ingredients caused an unexpected slowdown in sales of La Croix. The shares underperformed as growth expectations were revised lower.
Within the industrials sector, water treatment and technology company Evoqua Water Technologies Corporation* saw its shares decline after reporting disappointing results and announcing a restructuring plan. Evoqua unexpectedly undertook longer, capital-intensive projects that affected the stable revenue stream we expected. Additionally, rising raw material costs have negatively affected margins. These factors contributed to the underperformance and compromised our investment thesis in the holding.
While market volatility may continue in 2019, we remain confident in the Fund’s positioning.
As we look toward the balance of 2019, our viewpoint remains consistent. We believe the U.S. economy will avoid recessionary pressures and continue to expand. However, central to our outlook is that investors should expect a new
Please see footnotes on page 7.
| | | | | | |
| Performance highlights (unaudited) | | Wells Fargo Traditional Small Cap Growth Fund | | | 9 | |
normal of prolonged levels of slow economic growth. Strong evidence to support this view arrived in early 2019 as policymakers in China launched stimulus programs and the Fed changed course. Expectations from the Fed went from further rate hikes to a brief pause in policy normalization and then to expectations of interest rate cuts in 2019.
From an investing standpoint, innovative companies on the right side of change have benefited from this environment. This is largely due to scarcity. These businesses are not reliant on cyclicality or policy stimulus. In our view,right-side-of-change companies can produce predictable earnings and cash flows into the future—characteristics hard to find in the current economy. In a world starved of growth, investors tend to seek out that which is more certain and reward these attributes with a scarcity premium.
| | | | |
| Ten largest holdings (%) as of March 31, 20198 | |
| |
WNS Holdings Limited ADR | | | 2.72 | |
| |
Casella Waste Systems Incorporated Class A | | | 2.54 | |
| |
Envestnet Incorporated | | | 2.11 | |
| |
Globant SA | | | 1.99 | |
| |
World Wrestling Entertainment Incorporated Class A | | | 1.89 | |
| |
MSA Safety Incorporated | | | 1.87 | |
| |
The Brink’s Company | | | 1.86 | |
| |
Eldorado Resorts Incorporated | | | 1.79 | |
| |
Ingevity Corporation | | | 1.79 | |
| |
Haemonetics Corporation | | | 1.60 | |
|
| Sector distribution as of March 31, 20199 |
|
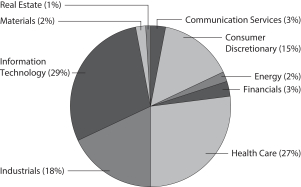
|
Please see footnotes on page 7.
| | | | |
| 10 | | Wells Fargo Traditional Small Cap Growth Fund | | Fund expenses (unaudited) |
As a shareholder of the Fund, you incur two types of costs: (1) transaction costs, including sales charges (loads) on purchase payments and contingent deferred sales charges (if any) on redemptions and (2) ongoing costs, including management fees, distribution(12b-1) and/or shareholder servicing fees, and other Fund expenses. This example is intended to help you understand your ongoing costs (in dollars) of investing in the Fund and to compare these costs with the ongoing costs of investing in other mutual funds.
The example is based on an investment of $1,000 invested at the beginning of thesix-month period and held for the entire period from October 1, 2018 to March 31, 2019.
Actual expenses
The “Actual” line of the table below provides information about actual account values and actual expenses. You may use the information in this line, together with the amount you invested, to estimate the expenses that you paid over the period. Simply divide your account value by $1,000 (for example, an $8,600 account value divided by $1,000 = 8.6), then multiply the result by the number in the “Actual” line under the heading entitled “Expenses paid during period” for your applicable class of shares to estimate the expenses you paid on your account during this period.
Hypothetical example for comparison purposes
The “Hypothetical” line of the table below provides information about hypothetical account values and hypothetical expenses based on the Fund’s actual expense ratio and an assumed rate of return of 5% per year before expenses, which is not the Fund’s actual return. The hypothetical account values and expenses may not be used to estimate the actual ending account balance or expenses you paid for the period. You may use this information to compare the ongoing costs of investing in the Fund and other funds. To do so, compare this 5% hypothetical example with the 5% hypothetical examples that appear in the shareholder reports of the other funds.
Please note that the expenses shown in the table are meant to highlight your ongoing costs only and do not reflect any transactional costs, such as sales charges (loads) and contingent deferred sales charges. Therefore, the “Hypothetical” line of the table is useful in comparing ongoing costs only and will not help you determine the relative total costs of owning different funds. In addition, if these transactional costs were included, your costs would have been higher.
| | | | | | | | | | | | | | | | |
| | | Beginning
account value
10-1-2018 | | | Ending
account value
3-31-2019 | | | Expenses
paid during
the period¹ | | | Annualized net
expense ratio | |
Class A | | | | | | | | | | | | | | | | |
| | | | |
Actual | | $ | 1,000.00 | | | $ | 982.24 | | | $ | 6.08 | | | | 1.23 | % |
| | | | |
Hypothetical (5% return before expenses) | | $ | 1,000.00 | | | $ | 1,018.80 | | | $ | 6.19 | | | | 1.23 | % |
Class C | | | | | | | | | | | | | | | | |
| | | | |
Actual | | $ | 1,000.00 | | | $ | 979.32 | | | $ | 9.77 | | | | 1.98 | % |
| | | | |
Hypothetical (5% return before expenses) | | $ | 1,000.00 | | | $ | 1,015.06 | | | $ | 9.95 | | | | 1.98 | % |
Administrator Class | | | | | | | | | | | | | | | | |
| | | | |
Actual | | $ | 1,000.00 | | | $ | 982.67 | | | $ | 5.68 | | | | 1.15 | % |
| | | | |
Hypothetical (5% return before expenses) | | $ | 1,000.00 | | | $ | 1,019.20 | | | $ | 5.78 | | | | 1.15 | % |
Institutional Class | | | | | | | | | | | | | | | | |
| | | | |
Actual | | $ | 1,000.00 | | | $ | 983.80 | | | $ | 4.45 | | | | 0.90 | % |
| | | | |
Hypothetical (5% return before expenses) | | $ | 1,000.00 | | | $ | 1,020.45 | | | $ | 4.53 | | | | 0.90 | % |
| 1 | Expenses paid is equal to the annualized net expense ratio of each class multiplied by the average account value over the period, multiplied by the number of days in the most recent fiscal half-year divided by the number of days in the fiscal year (to reflect theone-half-year period). |
| | | | | | |
| Portfolio of investments—March 31, 2019 | | Wells Fargo Traditional Small Cap Growth Fund | | | 11 | |
| | | | | | | | | | | | | | | | |
| Security name | | | | | | | | Shares | | | Value | |
| | | |
Common Stocks: 96.42% | | | | | | | | | | | | | |
| | | | |
Communication Services: 3.22% | | | | | | | | | | | | | | | | |
| | | |
| Entertainment: 3.22% | | | | | | | | | | | | | |
| | | | |
CD Projekt SA † | | | | | | | | | | | 24,054 | | | $ | 1,278,839 | |
| | | | |
World Wrestling Entertainment Incorporated Class A | | | | | | | | | | | 20,957 | | | | 1,818,648 | |
| | | | |
| | | | | | | | | | | | | | | 3,097,487 | |
| | | | | | | | | | | | | | | | |
|
Consumer Discretionary: 14.14% | |
|
| Auto Components: 1.58% | |
| | | | |
Stoneridge Incorporated † | | | | | | | | | | | 52,508 | | | | 1,515,381 | |
| | | | | | | | | | | | | | | | |
|
| Diversified Consumer Services: 5.47% | |
| | | | |
Adtalem Global Education Incorporated † | | | | | | | | | | | 29,722 | | | | 1,376,723 | |
| | | | |
Bright Horizons Family Solutions Incorporated † | | | | | | | | | | | 11,178 | | | | 1,420,836 | |
| | | | |
Chegg Incorporated † | | | | | | | | | | | 39,305 | | | | 1,498,307 | |
| | | | |
OneSpaWorld Holdings Limited Ǡ | | | | | | | | | | | 70,696 | | | | 965,707 | |
| | | | |
| | | | | | | | | | | | | | | 5,261,573 | |
| | | | | | | | | | | | | | | | |
|
| Hotels, Restaurants & Leisure: 1.79% | |
| | | | |
Eldorado Resorts Incorporated † | | | | | | | | | | | 36,888 | | | | 1,722,301 | |
| | | | | | | | | | | | | | | | |
|
| Household Durables: 1.09% | |
| | | | |
Skyline Champion Corporation | | | | | | | | | | | 54,972 | | | | 1,044,468 | |
| | | | | | | | | | | | | | | | |
|
| Internet & Direct Marketing Retail: 3.03% | |
| | | | |
Etsy Incorporated † | | | | | | | | | | | 18,811 | | | | 1,264,475 | |
| | | | |
Waitr Holdings Incorporated † | | | | | | | | | | | 64,659 | | | | 794,659 | |
| | | | |
Zooplus AG Ǡ | | | | | | | | | | | 7,539 | | | | 859,219 | |
| | | | |
| | | | | | | | | | | | | | | 2,918,353 | |
| | | | | | | | | | | | | | | | |
|
| Leisure Products: 1.18% | |
| | | | |
Games Workshop Group plc | | | | | | | | | | | 27,720 | | | | 1,135,468 | |
| | | | | | | | | | | | | | | | |
|
Energy: 2.10% | |
|
| Oil, Gas & Consumable Fuels: 2.10% | |
| | | | |
Texas Pacific Land Trust « | | | | | | | | | | | 930 | | �� | | 719,495 | |
| | | | |
Viper Energy Partners LP | | | | | | | | | | | 39,054 | | | | 1,295,031 | |
| | | | |
| | | | | | | | | | | | | | | 2,014,526 | |
| | | | | | | | | | | | | | | | |
|
Financials: 2.85% | |
|
| Consumer Finance: 2.85% | |
| | | | |
Green Dot Corporation Class A † | | | | | | | | | | | 24,680 | | | | 1,496,842 | |
| | | | |
SLM Corporation | | | | | | | | | | | 125,251 | | | | 1,241,237 | |
| | | | |
| | | | | | | | | | | | | | | 2,738,079 | |
| | | | | | | | | | | | | | | | |
|
Health Care: 26.43% | |
|
| Biotechnology: 10.41% | |
| | | | |
AnaptysBio Incorporated † | | | | | | | | | | | 7,451 | | | | 544,296 | |
| | | | |
Array BioPharma Incorporated † | | | | | | | | | | | 48,957 | | | | 1,193,572 | |
The accompanying notes are an integral part of these financial statements.
| | | | |
| 12 | | Wells Fargo Traditional Small Cap Growth Fund | | Portfolio of investments—March 31, 2019 |
| | | | | | | | | | | | | | | | |
| Security name | | | | | | | | Shares | | | Value | |
| | | |
| Biotechnology(continued) | | | | | | | | | | | | | |
| | | | |
CareDx Incorporated † | | | | | | | | | | | 20,757 | | | $ | 654,261 | |
| | | | |
Coherus Biosciences Incorporated † | | | | | | | | | | | 41,723 | | | | 569,102 | |
| | | | |
CRISPR Therapeutics AG Ǡ | | | | | | | | | | | 9,429 | | | | 336,804 | |
| | | | |
Deciphera Pharmaceuticals Incorporated † | | | | | | | | | | | 10,463 | | | | 242,846 | |
| | | | |
Heron Therapeutics Incorporated † | | | | | | | | | | | 13,917 | | | | 340,131 | |
| | | | |
Immunomedics Incorporated Ǡ | | | | | | | | | | | 35,110 | | | | 674,463 | |
| | | | |
Invitae Corporation † | | | | | | | | | | | 35,371 | | | | 828,389 | |
| | | | |
KalVista Pharmaceuticals Incorporated † | | | | | | | | | | | 26,680 | | | | 763,582 | |
| | | | |
Mirati Therapeutics Incorporated † | | | | | | | | | | | 8,724 | | | | 639,469 | |
| | | | |
Precision BioSciences Incorporated † | | | | | | | | | | | 13,144 | | | | 235,935 | |
| | | | |
Stemline Therapeutics Incorporated † | | | | | | | | | | | 41,937 | | | | 538,890 | |
| | | | |
Veracyte Incorporated † | | | | | | | | | �� | | 37,832 | | | | 946,557 | |
| | | | |
Vericel Corporation † | | | | | | | | | | | 58,762 | | | | 1,028,923 | |
| | | | |
Zai Lab Limited ADR Ǡ | | | | | | | | | | | 16,022 | | | | 472,809 | |
| | | |
| | | | | | | | | | | | 10,010,029 | |
| | | | | | | | | | | | | | | | |
|
| Health Care Equipment & Supplies: 10.98% | |
| | | | |
Avanos Medical Incorporated † | | | | | | | | | | | 23,977 | | | | 1,023,338 | |
| | | | |
Axonics Modulation Technologies Incorporated † | | | | | | | | | | | 31,824 | | | | 762,185 | |
| | | | |
BioLife Solutions Incorporated † | | | | | | | | | | | 74,400 | | | | 1,331,016 | |
| | | | |
ConforMIS Incorporated Ǡ | | | | | | | | | | | 262,429 | | | | 755,796 | |
| | | | |
Haemonetics Corporation † | | | | | | | | | | | 17,605 | | | | 1,540,084 | |
| | | | |
ICU Medical Incorporated † | | | | | | | | | | | 5,327 | | | | 1,274,911 | |
| | | | |
Insulet Corporation † | | | | | | | | | | | 15,895 | | | | 1,511,456 | |
| | | | |
iRhythm Technologies Incorporated † | | | | | | | | | | | 15,348 | | | | 1,150,486 | |
| | | | |
Orthopediatrics Corporation † | | | | | | | | | | | 27,243 | | | | 1,204,958 | |
| | | |
| | | | | | | | | | | | 10,554,230 | |
| | | | | | | | | | | | | | | | |
|
| Health Care Providers & Services: 1.09% | |
| | | | |
HealthEquity Incorporated † | | | | | | | | | | | 14,137 | | | | 1,045,855 | |
| | | | | | | | | | | | | | | | |
|
| Health Care Technology: 0.86% | |
| | | | |
Inspire Medical Systems Incorporated † | | | | | | | | | | | 14,620 | | | | 830,124 | |
| | | | | | | | | | | | | | | | |
|
| Life Sciences Tools & Services: 2.08% | |
| | | | |
Fluidigm Corporation † | | | | | | | | | | | 106,806 | | | | 1,419,452 | |
| | | | |
Quanterix Corporation † | | | | | | | | | | | 22,649 | | | | 585,024 | |
| | | |
| | | | | | | | | | | | 2,004,476 | |
| | | | | | | | | | | | | | | | |
|
| Pharmaceuticals: 1.01% | |
| | | | |
GW Pharmaceuticals plc ADR Ǡ | | | | | | | | | | | 2,978 | | | | 502,001 | |
| | | | |
Wave Life Sciences Limited Ǡ | | | | | | | | | | | 12,128 | | | | 471,173 | |
| | | |
| | | | | | | | | | | | 973,174 | |
| | | | | | | | | | | | | | | | |
|
Industrials: 17.15% | |
|
| Aerospace & Defense: 4.60% | |
| | | | |
Aerojet Rocketdyne Holdings † | | | | | | | | | | | 42,905 | | | | 1,524,415 | |
| | | | |
Axon Enterprise Incorporated † | | | | | | | | | | | 27,960 | | | | 1,521,304 | |
| | | | |
Mercury Computer Systems Incorporated † | | | | | | | | | | | 21,473 | | | | 1,375,990 | |
| | | |
| | | | | | | | | | | | 4,421,709 | |
| | | | | | | | | | | | | | | | |
The accompanying notes are an integral part of these financial statements.
| | | | | | |
| Portfolio of investments—March 31, 2019 | | Wells Fargo Traditional Small Cap Growth Fund | | | 13 | |
| | | | | | | | | | | | | | | | |
| Security name | | | | | | | | Shares | | | Value | |
|
| Airlines: 1.03% | |
| | | | |
Spirit Airlines Incorporated † | | | | | | | | | | | 18,766 | | | $ | 991,971 | |
| | | | | | | | | | | | | | | | |
|
| Commercial Services & Supplies: 6.27% | |
| | | | |
Casella Waste Systems Incorporated Class A † | | | | | | | | | | | 68,681 | | | | 2,442,296 | |
| | | | |
MSA Safety Incorporated | | | | | | | | | | | 17,417 | | | | 1,800,918 | |
| | | | |
The Brink’s Company | | | | | | | | | | | 23,656 | | | | 1,783,899 | |
| | | |
| | | | | | | | | | | | 6,027,113 | |
| | | | | | | | | | | | | | | | |
| | | |
| Construction & Engineering: 1.46% | | | | | | | | | | | | | |
| | | | |
WillScot Corporation † | | | | | | | | | | | 127,134 | | | | 1,409,916 | |
| | | | | | | | | | | | | | | | |
|
| Road & Rail: 1.58% | |
| | | | |
Saia Incorporated † | | | | | | | | | | | 24,874 | | | | 1,519,801 | |
| | | | | | | | | | | | | | | | |
|
| Trading Companies & Distributors: 2.21% | |
| | | | |
SiteOne Landscape Supply Incorporated † | | | | | | | | | | | 15,746 | | | | 899,884 | |
| | | | |
Univar Incorporated † | | | | | | | | | | | 55,270 | | | | 1,224,783 | |
| | | |
| | | | | | | | | | | | 2,124,667 | |
| | | | | | | | | | | | | | | | |
|
Information Technology: 27.59% | |
|
| Electronic Equipment, Instruments & Components: 4.03% | |
| | | | |
Littelfuse Incorporated | | | | | | | | | | | 7,060 | | | | 1,288,309 | |
| | | | |
Novanta Incorporated † | | | | | | | | | | | 17,040 | | | | 1,443,799 | |
| | | | |
Rogers Corporation † | | | | | | | | | | | 7,212 | | | | 1,145,843 | |
| | | |
| | | | | | | | | | | | 3,877,951 | |
| | | | | | | | | | | | | | | | |
|
| IT Services: 9.52% | |
| | | | |
EPAM Systems Incorporated † | | | | | | | | | | | 8,805 | | | | 1,489,190 | |
| | | | |
Euronet Worldwide Incorporated † | | | | | | | | | | | 10,282 | | | | 1,466,110 | |
| | | | |
InterXion Holding NV † | | | | | | | | | | | 6,302 | | | | 420,532 | |
| | | | |
Keywords Studios plc | | | | | | | | | | | 68,944 | | | | 1,038,042 | |
| | | | |
Okta Incorporated † | | | | | | | | | | | 8,406 | | | | 695,428 | |
| | | | |
WEX Incorporated † | | | | | | | | | | | 7,451 | | | | 1,430,517 | |
| | | | |
WNS Holdings Limited ADR † | | | | | | | | | | | 49,038 | | | | 2,612,253 | |
| | | |
| | | | | | | | | | | | 9,152,072 | |
| | | | | | | | | | | | | | | | |
|
| Semiconductors & Semiconductor Equipment: 0.63% | |
| | | | |
Universal Display Corporation « | | | | | | | | | | | 3,933 | | | | 601,159 | |
| | | | | | | | | | | | | | | | |
|
| Software: 12.07% | |
| | | | |
2U Incorporated † | | | | | | | | | | | 10,202 | | | | 722,812 | |
| | | | |
Avalara Incorporated † | | | | | | | | | | | 18,886 | | | | 1,053,650 | |
| | | | |
Blue Prism Group plc Ǡ | | | | | | | | | | | 34,943 | | | | 754,581 | |
| | | | |
Bottomline Technologies (de) Incorporated † | | | | | | | | | | | 24,702 | | | | 1,237,323 | |
| | | | |
Envestnet Incorporated † | | | | | | | | | | | 30,975 | | | | 2,025,455 | |
| | | | |
Globant SA † | | | | | | | | | | | 26,827 | | | | 1,915,448 | |
| | | | |
LivePerson Incorporated † | | | | | | | | | | | 47,066 | | | | 1,365,855 | |
| | | | |
Model N Incorporated † | | | | | | | | | | | 71,501 | | | | 1,254,127 | |
| | | | |
Pluralsight Incorporated Class A † | | | | | | | | | | | 40,236 | | | | 1,277,091 | |
| | | |
| | | | | | | | | | | | 11,606,342 | |
| | | | | | | | | | | | | | | | |
The accompanying notes are an integral part of these financial statements.
| | | | |
| 14 | | Wells Fargo Traditional Small Cap Growth Fund | | Portfolio of investments—March 31, 2019 |
| | | | | | | | | | | | | | | | |
| Security name | | | | | | | | Shares | | | Value | |
|
| Technology Hardware, Storage & Peripherals: 1.34% | |
| | | | |
NCR Corporation † | | | | | | | | | | | 47,273 | | | $ | 1,290,080 | |
| | | | | | | | | | | | | | | | |
|
Materials: 1.79% | |
|
| Chemicals: 1.79% | |
| | | | |
Ingevity Corporation † | | | | | | | | | | | 16,264 | | | | 1,717,641 | |
| | | | | | | | | | | | | | | | |
|
Real Estate: 1.15% | |
|
| Equity REITs: 1.15% | |
| | | | |
Innovative Industrial Properties Incorporated « | | | | | | | | | | | 13,507 | | | | 1,103,387 | |
| | | | | | | | | | | | | | | | |
| |
Total Common Stocks (Cost $77,133,761) | | | | 92,709,333 | |
| | | | | | | | | | | | | | | | |
| | | | |
| | | Yield | | | | | | | | | | |
| Short-Term Investments: 9.61% | | | | | | | | | | | | | | | | |
| | | | |
| Investment Companies: 9.61% | | | | | | | | | | | | | | | | |
| | | | |
Securities Lending Cash Investments LLC (l)(r)(u) | | | 2.55 | % | | | | | | | 6,840,260 | | | | 6,840,944 | |
| | | | |
Wells Fargo Government Money Market Fund Select Class (l)(u) | | | 2.38 | | | | | | | | 2,404,400 | | | | 2,404,400 | |
| | | | |
Total Short-Term Investments (Cost $9,245,344) | | | | | | | | | | | | | | | 9,245,344 | |
| | | | | | | | | | | | | | | | |
| | | | | | | | |
| Total investments in securities (Cost $86,379,105) | | | 106.03 | % | | | 101,954,677 | |
| | |
Other assets and liabilities, net | | | (6.03 | ) | | | (5,801,660 | ) |
| | | | | | | | |
| Total net assets | | | 100.00 | % | | $ | 96,153,017 | |
| | | | | | | | |
| † | Non-income-earning security |
| « | All or a portion of this security is on loan. |
| (l) | The issuer of the security is an affiliated person of the Fund as defined in the Investment Company Act of 1940. |
| (r) | The investment is anon-registered investment company purchased with cash collateral received from securities on loan. |
| (u) | The rate represents the7-day annualized yield at period end. |
Abbreviations:
| ADR | American depositary receipt |
| REIT | Real estate investment trust |
Investments in Affiliates
An affiliated investment is an investment in which the Fund owns at least 5% of the outstanding voting shares of the issuer or as a result of other relationships, such as the Fund and the issuer having the same investment manager. Transactions with issuers that were either affiliated persons of the Fund at the beginning of the period or the end of the period were as follows:
| | | | | | | | | | | | | | | | | | | | | | | | | | | | | | | | | | | | |
| | | Shares,
beginning of
period | | | Shares
purchased | | | Shares
sold | | | Shares,
end of
period | | | Net
realized
gains
(losses) | | | Net
change in
unrealized
gains
(losses) | | | Income
from
affiliated
securities | | | Value,
end
of period | | | % of
net
assets | |
Short-Term Investments | | | | | | | | | | | | | | | | | | | | | | | | | | | | | | | | | | | | |
Investment Companies | | | | | | | | | | | | | | | | | | | | | | | | | | | | | | | | | | | | |
Securities Lending Cash Investments LLC | | | 10,521,186 | | | | 77,494,522 | | | | 81,175,448 | | | | 6,840,260 | | | $ | 689 | | | $ | 0 | | | $ | 203,560 | | | $ | 6,840,944 | | | | | |
Wells Fargo Government Money Market Fund Select Class | | | 870,700 | | | | 45,126,108 | | | | 43,592,408 | | | | 2,404,400 | | | | 0 | | | | 0 | | | | 54,377 | | | | 2,404,400 | | | | | |
| | | | | | | | | | | | | | | | | | | | | | | | | | | | | | | | | | | | |
| | | | | | | | | |
| | | | | | | | | | | | | | | | | | $ | 689 | | | $ | 0 | | | $ | 257,937 | | | $ | 9,245,344 | | | | 9.61 | % |
| | | | | | | | | | | | | | | | | | | | | | | | | | | | | | | | | | | | |
The accompanying notes are an integral part of these financial statements.
| | | | | | |
| Statement of assets and liabilities—March 31, 2019 | | Wells Fargo Traditional Small Cap Growth Fund | | | 15 | |
| | | | |
| | | | |
| |
Assets | | | | |
Investments in unaffiliated securities (including $6,708,374 of securities loaned), at value (cost $77,133,761) | | $ | 92,709,333 | |
Investments in affiliated securities, at value (cost $9,245,344) | | | 9,245,344 | |
Foreign currency, at value (cost $335) | | | 323 | |
Receivable for investments sold | | | 2,884,803 | |
Receivable for Fund shares sold | | | 6,800 | |
Receivable for dividends | | | 12,236 | |
Receivable for securities lending income | | | 5,273 | |
Prepaid expenses and other assets | | | 22,884 | |
| | | | |
Total assets | | | 104,886,996 | |
| | | | |
| |
Liabilities | | | | |
Payable upon receipt of securities loaned | | | 6,839,267 | |
Payable for investments purchased | | | 1,464,922 | |
Due to custodian bank | | | 164,815 | |
Payable for Fund shares redeemed | | | 133,086 | |
Management fee payable | | | 46,240 | |
Administration fees payable | | | 16,457 | |
Trustees’ fees and expenses payable | | | 1,959 | |
Distribution fee payable | | | 216 | |
Accrued expenses and other liabilities | | | 67,017 | |
| | | | |
Total liabilities | | | 8,733,979 | |
| | | | |
Total net assets | | $ | 96,153,017 | |
| | | | |
| |
NET ASSETS CONSIST OF | | | | |
Paid-in capital | | $ | 78,700,529 | |
Total distributable earnings | | | 17,452,488 | |
| | | | |
Total net assets | | $ | 96,153,017 | |
| | | | |
| |
COMPUTATION OF NET ASSET VALUE AND OFFERING PRICE PER SHARE | | | | |
Net assets – Class A | | $ | 86,005,510 | |
Shares outstanding – Class A1 | | | 6,475,613 | |
Net asset value per share – Class A | | | $13.28 | |
Maximum offering price per share – Class A2 | | | $14.09 | |
Net assets – Class C | | $ | 348,701 | |
Shares outstanding – Class C1 | | | 30,179 | |
Net asset value per share – Class C | | | $11.55 | |
Net assets – Administrator Class | | $ | 103,999 | |
Shares outstanding – Administrator Class1 | | | 6,738 | |
Net asset value per share – Administrator Class | | | $15.43 | |
Net assets – Institutional Class | | $ | 9,694,807 | |
Shares outstanding – Institutional Class1 | | | 608,087 | |
Net asset value per share – Institutional Class | | | $15.94 | |
| 1 | The Fund has an unlimited number of authorized shares. |
| 2 | Maximum offering price is computed as 100/94.25 of net asset value. On investments of $50,000 or more, the offering price is reduced. |
The accompanying notes are an integral part of these financial statements.
| | | | |
| 16 | | Wells Fargo Traditional Small Cap Growth Fund | | Statement of operations—year ended March 31, 2019 |
| | | | |
| | | | |
| |
Investment income | | | | |
Dividends | | $ | 327,148 | |
Securities lending income from affiliates, net | | | 95,026 | |
Income from affiliated securities | | | 54,377 | |
| | | | |
Total investment income | | | 476,551 | |
| | | | |
| |
Expenses | | | | |
Management fee | | | 824,401 | |
Administration fees | | | | |
Class A | | | 182,299 | |
Class C | | | 657 | |
Administrator Class | | | 170 | |
Institutional Class | | | 12,656 | |
Shareholder servicing fees | | | | |
Class A | | | 217,023 | |
Class C | | | 783 | |
Administrator Class | | | 326 | |
Distribution fee | | | | |
Class C | | | 2,348 | |
Custody and accounting fees | | | 8,248 | |
Professional fees | | | 52,349 | |
Registration fees | | | 60,991 | |
Shareholder report expenses | | | 43,714 | |
Trustees’ fees and expenses | | | 22,578 | |
Other fees and expenses | | | 8,180 | |
| | | | |
Total expenses | | | 1,436,723 | |
Less: Fee waivers and/or expense reimbursements | | | (273,650 | ) |
| | | | |
Net expenses | | | 1,163,073 | |
| | | | |
Net investment loss | | | (686,522 | ) |
| | | | |
| |
REALIZED AND UNREALIZED GAINS (LOSSES) ON INVESTMENTS | | | | |
| |
Net realized gains on: | | | | |
Unaffiliated securities | | | 22,169,810 | |
Affiliated securities | | | 689 | |
| | | | |
Net realized gains on investments | | | 22,170,499 | |
Net change in unrealized gains (losses) on investments | | | (6,083,970 | ) |
| | | | |
Net realized and unrealized gains (losses) on investments | | | 16,086,529 | |
| | | | |
Net increase in net assets resulting from operations | | $ | 15,400,007 | |
| | | | |
The accompanying notes are an integral part of these financial statements.
| | | | | | |
| Statement of changes in net assets | | Wells Fargo Traditional Small Cap Growth Fund | | | 17 | |
| | | | | | | | | | | | | | | | |
| | | Year ended
March 31, 2019 | | | Year ended
March 31, 2018¹ | |
| | | | |
Operations | | | | | | | | | | | | | | | | |
Net investment loss | | | | | | $ | (686,522 | ) | | | | | | $ | (710,379 | ) |
Net realized gains on investments | | | | | | | 22,170,499 | | | | | | | | 6,532,249 | |
Net change in unrealized gains (losses) on investments | | | | | | | (6,083,970 | ) | | | | | | | 8,067,432 | |
| | | | |
Net increase in net assets resulting from operations | | | | | | | 15,400,007 | | | | | | | | 13,889,302 | |
| | | | |
| | | | |
Distributions to shareholders from net investment income and net realized gains | | | | | | | | | | | | | | | | |
Class A | | | | | | | (20,884,975 | ) | | | | | | | (5,360,360 | ) |
Class C | | | | | | | (93,417 | ) | | | | | | | (16,142 | ) |
Administrator Class | | | | | | | (53,408 | ) | | | | | | | (7,844 | ) |
Institutional Class | | | | | | | (2,160,122 | ) | | | | | | | (468,228 | ) |
| | | | |
Total distributions to shareholders | | | | | | | (23,191,922 | ) | | | | | | | (5,852,574 | ) |
| | | | |
| | | | |
Capital share transactions | | | Shares | | | | | | | | Shares | | | | | |
Proceeds from shares sold | | | | | | | | | | | | | | | | |
Class A | | | 264,201 | | | | 3,988,191 | | | | 100,773 | | | | 1,525,252 | |
Class C | | | 11,256 | | | | 157,108 | | | | 3,801 | | | | 52,022 | |
Administrator Class | | | 8,969 | | | | 158,898 | | | | 6,799 | | | | 114,428 | |
Institutional Class | | | 202,779 | | | | 3,570,799 | | | | 85,364 | | | | 1,472,577 | |
| | | | |
| | | | | | | 7,874,996 | | | | | | | | 3,164,279 | |
| | | | |
Reinvestment of distributions | | | | | | | | | | | | | | | | |
Class A | | | 1,770,518 | | | | 20,467,178 | | | | 352,388 | | | | 5,243,537 | |
Class C | | | 8,060 | | | | 81,241 | | | | 975 | | | | 13,232 | |
Administrator Class | | | 3,408 | | | | 45,808 | | | | 362 | | | | 6,032 | |
Institutional Class | | | 129,330 | | | | 1,792,511 | | | | 26,092 | | | | 443,822 | |
| | | | |
| | | | | | | 22,386,738 | | | | | | | | 5,706,623 | |
| | | | |
Payment for shares redeemed | | | | | | | | | | | | | | | | |
Class A | | | (1,090,350 | ) | | | (16,060,877 | ) | | | (795,898 | ) | | | (11,972,813 | ) |
Class C | | | (8,765 | ) | | | (106,912 | ) | | | (2,471 | ) | | | (34,576 | ) |
Administrator Class | | | (13,374 | ) | | | (189,489 | ) | | | (10,531 | ) | | | (172,453 | ) |
Institutional Class | | | (230,424 | ) | | | (3,981,806 | ) | | | (107,067 | ) | | | (1,838,265 | ) |
| | | | |
| | | | | | | (20,339,084 | ) | | | | | | | (14,018,107 | ) |
| | | | |
Net increase (decrease) in net assets resulting from capital share transactions | | | | | | | 9,922,650 | | | | | | | | (5,147,205 | ) |
| | | | |
Total increase in net assets | | | | | | | 2,130,735 | | | | | | | | 2,889,523 | |
| | | | |
| | | | |
Net assets | | | | | | | | | | | | | | | | |
Beginning of period | | | | | | | 94,022,282 | | | | | | | | 91,132,759 | |
| | | | |
End of period | | | | | | $ | 96,153,017 | | | | | | | $ | 94,022,282 | |
| | | | |
| 1 | Effective for all filings after November 4, 2018, the SEC prospectively eliminated the requirement to parenthetically disclose undistributed net investment income at the end of the period and permitted the aggregation of distributions, with the exception of tax basis returns of capital. Accumulated net investment loss at March 31, 2018 was $73,600. The disaggregated distributions information for the year ended March 31, 2018 is included in Note 7,Distributions to Shareholders,in the notes to the financial statements. |
The accompanying notes are an integral part of these financial statements.
| | | | |
| 18 | | Wells Fargo Traditional Small Cap Growth Fund | | Financial highlights |
(For a share outstanding throughout each period)
| | | | | | | | | | | | | | | | | | | | |
| | | Year ended March 31 | |
| CLASS A | | 2019 | | | 2018 | | | 2017 | | | 2016 | | | 2015 | |
Net asset value, beginning of period | | | $15.32 | | | | $14.08 | | | | $12.05 | | | | $18.04 | | | | $20.37 | |
Net investment loss | | | (0.11 | )1 | | | (0.12 | )1 | | | (0.10 | )1 | | | (0.12 | )1 | | | (0.18 | ) |
Net realized and unrealized gains (losses) on investments | | | 2.17 | | | | 2.35 | | | | 2.51 | | | | (2.13 | ) | | | 1.33 | |
| | | | | | | | | | | | | | | | | | | | |
Total from investment operations | | | 2.06 | | | | 2.23 | | | | 2.41 | | | | (2.25 | ) | | | 1.15 | |
Distributions to shareholders from | | | | | | | | | | | | | | | | | | | | |
Net realized gains | | | (4.10 | ) | | | (0.99 | ) | | | (0.38 | ) | | | (3.74 | ) | | | (3.48 | ) |
Net asset value, end of period | | | $13.28 | | | | $15.32 | | | | $14.08 | | | | $12.05 | | | | $18.04 | |
Total return2 | | | 17.46 | % | | | 16.08 | % | | | 20.10 | % | | | (12.86 | )% | | | 6.77 | % |
Ratios to average net assets (annualized) | | | | | | | | | | | | | | | | | | | | |
Gross expenses | | | 1.51 | % | | | 1.52 | % | | | 1.51 | % | | | 1.50 | % | | | 1.47 | % |
Net expenses | | | 1.23 | % | | | 1.33 | % | | | 1.33 | % | | | 1.33 | % | | | 1.33 | % |
Net investment loss | | | (0.74 | )% | | | (0.79 | )% | | | (0.77 | )% | | | (0.74 | )% | | | (0.87 | )% |
Supplemental data | | | | | | | | | | | | | | | | | | | | |
Portfolio turnover rate | | | 155 | % | | | 44 | % | | | 113 | % | | | 123 | % | | | 73 | % |
Net assets, end of period (000s omitted) | | | $86,006 | | | | $84,738 | | | | $82,734 | | | | $84,139 | | | | $123,712 | |
| 1 | Calculated based upon average shares outstanding |
| 2 | Total return calculations do not include any sales charges. |
The accompanying notes are an integral part of these financial statements.
| | | | | | |
| Financial highlights | | Wells Fargo Traditional Small Cap Growth Fund | | | 19 | |
(For a share outstanding throughout each period)
| | | | | | | | | | | | | | | | | | | | |
| | | Year ended March 31 | |
| CLASS C | | 2019 | | | 2018 | | | 2017 | | | 2016 | | | 2015 | |
Net asset value, beginning of period | | | $13.94 | | | | $12.99 | | | | $11.22 | | | | $17.21 | | | | $19.73 | |
Net investment loss | | | (0.20 | )1 | | | (0.21 | )1 | | | (0.18 | )1 | | | (0.18 | )1 | | | (0.29 | )1 |
Net realized and unrealized gains (losses) on investments | | | 1.91 | | | | 2.15 | | | | 2.33 | | | | (2.07 | ) | | | 1.25 | |
| | | | | | | | | | | | | | | | | | | | |
Total from investment operations | | | 1.71 | | | | 1.94 | | | | 2.15 | | | | (2.25 | ) | | | 0.96 | |
Distributions to shareholders from | | | | | | | | | | | | | | | | | | | | |
Net realized gains | | | (4.10 | ) | | | (0.99 | ) | | | (0.38 | ) | | | (3.74 | ) | | | (3.48 | ) |
Net asset value, end of period | | | $11.55 | | | | $13.94 | | | | $12.99 | | | | $11.22 | | | | $17.21 | |
Total return2 | | | 16.69 | % | | | 15.17 | % | | | 19.26 | % | | | (13.55 | )% | | | 5.98 | % |
Ratios to average net assets (annualized) | | | | | | | | | | | | | | | | | | | | |
Gross expenses | | | 2.26 | % | | | 2.27 | % | | | 2.26 | % | | | 2.25 | % | | | 2.22 | % |
Net expenses | | | 1.98 | % | | | 2.08 | % | | | 2.08 | % | | | 2.08 | % | | | 2.08 | % |
Net investment loss | | | (1.48 | )% | | | (1.54 | )% | | | (1.52 | )% | | | (1.49 | )% | | | (1.61 | )% |
Supplemental data | | | | | | | | | | | | | | | | | | | | |
Portfolio turnover rate | | | 155 | % | | | 44 | % | | | 113 | % | | | 123 | % | | | 73 | % |
Net assets, end of period (000s omitted) | | | $349 | | | | $274 | | | | $225 | | | | $162 | | | | $232 | |
| 1 | Calculated based upon average shares outstanding |
| 2 | Total return calculations do not include any sales charges. |
The accompanying notes are an integral part of these financial statements.
| | | | |
| 20 | | Wells Fargo Traditional Small Cap Growth Fund | | Financial highlights |
(For a share outstanding throughout each period)
| | | | | | | | | | | | | | | | | | | | |
| | | Year ended March 31 | |
| ADMINISTRATOR CLASS | | 2019 | | | 2018 | | | 2017 | | | 2016 | | | 2015 | |
Net asset value, beginning of period | | | $17.14 | | | | $15.63 | | | | $13.29 | | | | $19.44 | | | | $21.65 | |
Net investment loss | | | (0.11 | )1 | | | (0.11 | )1 | | | (0.09 | )1 | | | (0.10 | )1 | | | (0.15 | )1 |
Net realized and unrealized gains (losses) on investments | | | 2.50 | | | | 2.61 | | | | 2.81 | | | | (2.31 | ) | | | 1.42 | |
| | | | | | | | | | | | | | | | | | | | |
Total from investment operations | | | 2.39 | | | | 2.50 | | | | 2.72 | | | | (2.41 | ) | | | 1.27 | |
Distributions to shareholders from | | | | | | | | | | | | | | | | | | | | |
Net realized gains | | | (4.10 | ) | | | (0.99 | ) | | | (0.38 | ) | | | (3.74 | ) | | | (3.48 | ) |
Net asset value, end of period | | | $15.43 | | | | $17.14 | | | | $15.63 | | | | $13.29 | | | | $19.44 | |
Total return | | | 17.59 | % | | | 16.21 | % | | | 20.56 | % | | | (12.76 | )% | | | 6.93 | % |
Ratios to average net assets (annualized) | | | | | | | | | | | | | | | | | | | | |
Gross expenses | | | 1.43 | % | | | 1.44 | % | | | 1.43 | % | | | 1.39 | % | | | 1.29 | % |
Net expenses | | | 1.15 | % | | | 1.20 | % | | | 1.20 | % | | | 1.20 | % | | | 1.19 | % |
Net investment loss | | | (0.63 | )% | | | (0.66 | )% | | | (0.64 | )% | | | (0.61 | )% | | | (0.73 | )% |
Supplemental data | | | | | | | | | | | | | | | | | | | | |
Portfolio turnover rate | | | 155 | % | | | 44 | % | | | 113 | % | | | 123 | % | | | 73 | % |
Net assets, end of period (000s omitted) | | | $104 | | | | $133 | | | | $174 | | | | $2,413 | | | | $3,128 | |
| 1 | Calculated based upon average shares outstanding |
The accompanying notes are an integral part of these financial statements.
| | | | | | |
| Financial highlights | | Wells Fargo Traditional Small Cap Growth Fund | | | 21 | |
(For a share outstanding throughout each period)
| | | | | | | | | | | | | | | | | | | | |
| | | Year ended March 31 | |
| INSTITUTIONAL CLASS | | 2019 | | | 2018 | | | 2017 | | | 2016 | | | 2015 | |
Net asset value, beginning of period | | | $17.53 | | | | $15.94 | | | | $13.54 | | | | $19.69 | | | | $21.84 | |
Net investment loss | | | (0.07 | )1 | | | (0.08 | )1 | | | (0.06 | )1 | | | (0.07 | )1 | | | (0.11 | )1 |
Net realized and unrealized gains (losses) on investments | | | 2.58 | | | | 2.66 | | | | 2.84 | | | | (2.34 | ) | | | 1.44 | |
| | | | | | | | | | | | | | | | | | | | |
Total from investment operations | | | 2.51 | | | | 2.58 | | | | 2.78 | | | | (2.41 | ) | | | 1.33 | |
Distributions to shareholders from | | | | | | | | | | | | | | | | | | | | |
Net realized gains | | | (4.10 | ) | | | (0.99 | ) | | | (0.38 | ) | | | (3.74 | ) | | | (3.48 | ) |
Net asset value, end of period | | | $15.94 | | | | $17.53 | | | | $15.94 | | | | $13.54 | | | | $19.69 | |
Total return | | | 17.85 | % | | | 16.40 | % | | | 20.62 | % | | | (12.58 | )% | | | 7.16 | % |
Ratios to average net assets (annualized) | | | | | | | | | | | | | | | | | | | | |
Gross expenses | | | 1.18 | % | | | 1.19 | % | | | 1.18 | % | | | 1.14 | % | | | 1.04 | % |
Net expenses | | | 0.90 | % | | | 0.98 | % | | | 0.98 | % | | | 0.98 | % | | | 0.98 | % |
Net investment loss | | | (0.41 | )% | | | (0.44 | )% | | | (0.43 | )% | | | (0.39 | )% | | | (0.52 | )% |
Supplemental data | | | | | | | | | | | | | | | | | | | | |
Portfolio turnover rate | | | 155 | % | | | 44 | % | | | 113 | % | | | 123 | % | | | 73 | % |
Net assets, end of period (000s omitted) | | | $9,695 | | | | $8,878 | | | | $8,001 | | | | $8,980 | | | | $11,812 | |
| 1 | Calculated based upon average shares outstanding |
The accompanying notes are an integral part of these financial statements.
| | | | |
| 22 | | Wells Fargo Traditional Small Cap Growth Fund | | Notes to financial statements |
1. ORGANIZATION
Wells Fargo Funds Trust (the “Trust”), a Delaware statutory trust organized on March 10, 1999, is anopen-end management investment company registered under the Investment Company Act of 1940, as amended (the “1940 Act”). As an investment company, the Trust follows the accounting and reporting guidance in Financial Accounting Standards Board (“FASB”)Accounting Standards Codification Topic 946, Financial Services – Investment Companies. These financial statements report on the Wells Fargo Traditional Small Cap Growth Fund (the “Fund”) which is a diversified series of the Trust.
2. SIGNIFICANT ACCOUNTING POLICIES
The following significant accounting policies, which are consistently followed in the preparation of the financial statements of the Fund, are in conformity with U.S. generally accepted accounting principles which require management to make estimates and assumptions that affect the reported amounts of assets and liabilities, disclosure of contingent assets and liabilities at the date of the financial statements, and the reported amounts of revenues and expenses during the reporting period. Actual results could differ from those estimates.
Securities valuation
All investments are valued each business day as of the close of regular trading on the New York Stock Exchange (generally 4 p.m. Eastern Time), although the Fund may deviate from this calculation time under unusual or unexpected circumstances.
Equity securities that are listed on a foreign or domestic exchange or market are valued at the official closing price or, if none, the last sales price. If no sale occurs on the principal exchange or market that day, a fair value price will be determined in accordance with the Fund’s Valuation Procedures.
Investments in registeredopen-end investment companies are valued at net asset value. Interests innon-registered investment companies that are redeemable at net asset value are fair valued normally at net asset value.
Many securities markets and exchanges outside the U.S. close prior to the close of the New York Stock Exchange and therefore may not fully reflect trading or events that occur after the close of the principal exchange in which the foreign securities are traded, but before the close of the New York Stock Exchange. If such trading or events are expected to materially affect the value of such securities, then fair value pricing procedures approved by the Board of Trustees of the Fund are applied. These procedures take into account multiple factors including movements in U.S. securities markets after foreign exchanges close. Foreign securities that are fair valued under these procedures are categorized as Level 2 and the application of these procedures may result in transfers between Level 1 and Level 2. Depending on market activity, such fair valuations may be frequent. Such fair value pricing may result in net asset values that are higher or lower than net asset values based on the last reported sales price or latest quoted bid price. On March 31, 2019, such fair value pricing was not used in pricing foreign securities.
Investments which are not valued using any of the methods discussed above are valued at their fair value, as determined in good faith by the Board of Trustees. The Board of Trustees has established a Valuation Committee comprised of the Trustees and has delegated to it the authority to take any actions regarding the valuation of portfolio securities that the Valuation Committee deems necessary or appropriate, including determining the fair value of portfolio securities, unless the determination has been delegated to the Wells Fargo Asset Management Pricing Committee at Wells Fargo Funds Management, LLC (“Funds Management”). The Board of Trustees retains the authority to make or ratify any valuation decisions or approve any changes to the Valuation Procedures as it deems appropriate. On a quarterly basis, the Board of Trustees receives reports on any valuation actions taken by the Valuation Committee or the Wells Fargo Asset Management Pricing Committee which may include items for ratification.
Foreign currency translation
The accounting records of the Fund are maintained in U.S. dollars. The values of other assets and liabilities denominated in foreign currencies are translated into U.S. dollars at rates provided by an independent foreign currency pricing source at a time each business day specified by the Wells Fargo Asset Management Pricing Committee. Purchases and sales of securities, and income and expenses are converted at the rate of exchange on the respective dates of such transactions. Net realized foreign exchange gains or losses arise from sales of foreign currencies, currency gains or losses realized between the trade and settlement dates on securities transactions, and the difference between the amounts of dividends, interest and foreign withholding taxes recorded and the U.S. dollar equivalent of the amounts actually paid or received. Net unrealized foreign exchange gains and losses arise from changes in the fair value of assets and liabilities other than investments in securities resulting from changes in exchange rates. The changes in net assets arising from
| | | | | | |
| Notes to financial statements | | Wells Fargo Traditional Small Cap Growth Fund | | | 23 | |
changes in exchange rates of securities and the changes in net assets resulting from changes in market prices of securities are not separately presented. Such changes are included in net realized and unrealized gains or losses from investments.
Securities lending
The Fund may lend its securities from time to time in order to earn additional income in the form of fees or interest on securities received as collateral or the investment of any cash received as collateral. The Fund continues to receive interest or dividends on the securities loaned. The Fund receives collateral in the form of cash or securities with a value at least equal to the value of the securities on loan. The value of the loaned securities is determined at the close of each business day and any additional required collateral is delivered to the Fund on the next business day. In a securities lending transaction, the net asset value of the Fund will be affected by an increase or decrease in the value of the securities loaned and by an increase or decrease in the value of the instrument in which collateral is invested. The amount of securities lending activity undertaken by the Fund fluctuates from time to time. In the event of default or bankruptcy by the borrower, the Fund may be prevented from recovering the loaned securities or gaining access to the collateral or may experience delays or costs in doing so. In addition, the investment of any cash collateral received may lose all or part of its value. The Fund has the right under the lending agreement to recover the securities from the borrower on demand.
The Fund lends its securities through an unaffiliated securities lending agent. Cash collateral received in connection with its securities lending transactions is invested in Securities Lending Cash Investments, LLC (the “Securities Lending Fund”). The Securities Lending Fund is exempt from registration under Section 3(c)(7) of the 1940 Act and is managed by Funds Management and is subadvised by Wells Capital Management Incorporated (“WellsCap”), an affiliate of Funds Management and an indirect wholly owned subsidiary of Wells Fargo & Company (“Wells Fargo”). Funds Management receives an advisory fee starting at 0.05% and declining to 0.01% as the average daily net assets of the Securities Lending Fund increase. All of the fees received by Funds Management are paid to WellsCap for its services as subadviser. The Securities Lending Fund seeks to provide a positive return compared to the daily Fed Funds Open Rate by investing in high-quality, U.S. dollar-denominated short-term money market instruments. Securities Lending Fund investments are valued at the evaluated bid price provided by an independent pricing service. Income earned from investment in the Securities Lending Fund, if any, is included in securities lending income from affiliates (net of fees and rebates) on the Statement of Operations.
Security transactions and income recognition
Securities transactions are recorded on a trade date basis. Realized gains or losses are recorded on the basis of identified cost.
Dividend income is recognized on theex-dividend date. Dividend income is recorded net of foreign taxes withheld where recovery of such taxes is not assured.
Distributions to shareholders
Distributions to shareholders from net investment income and any net realized gains are recorded on theex-dividend date and paid at least annually. Such distributions are determined in accordance with income tax regulations and may differ from U.S. generally accepted accounting principles. Dividend sources are estimated at the time of declaration. The tax character of distributions is determined as of the Fund’s fiscal year end. Therefore, a portion of the Fund’s distributions made prior to the Fund’s fiscal year end may be categorized as a tax return of capital at year end.
Federal and other taxes
The Fund intends to continue to qualify as a regulated investment company by distributing substantially all of its investment company taxable income and any net realized capital gains (after reduction for capital loss carryforwards) sufficient to relieve it from all, or substantially all, federal income taxes. Accordingly, no provision for federal income taxes was required.
The Fund’s income and federal excise tax returns and all financial records supporting those returns for the prior three fiscal years are subject to examination by the federal and Delaware revenue authorities. Management has analyzed the Fund’s tax positions taken on federal, state, and foreign tax returns for all open tax years and does not believe that there are any uncertain tax positions that require recognition of a tax liability.
As of March 31, 2019, the aggregate cost of all investments for federal income tax purposes was $86,540,150 and the unrealized gains (losses) consisted of:
| | | | |
| |
Gross unrealized gains | | $ | 19,042,189 | |
| |
Gross unrealized losses | | | (3,627,662 | ) |
| |
Net unrealized gains | | $ | 15,414,527 | |
| | | | |
| 24 | | Wells Fargo Traditional Small Cap Growth Fund | | Notes to financial statements |
Reclassifications are made to the Fund’s capital accounts for permanent tax differences to reflect income and gains available for distribution (or available capital loss carryforwards) under federal income tax regulations. U.S. generally accepted accounting principles require that certain components of net assets be adjusted to reflect permanent differences between financial and tax reporting. In addition, the Fund may utilize equalization accounting for tax purposes and designate earnings and profits, including net realized gains distributed to shareholders on redemption of shares, as a part of the dividends paid deduction for income tax purposes. These reclassifications have no effect on net assets or net asset values per share. At March 31, 2019, as a result of permanentbook-to-tax differences, the following reclassification adjustments were made on the Statement of Assets and Liabilities:
| | |
| Paid-in capital | | Total distributable earnings |
| |
| $(1,501) | | $1,501 |
Class allocations
The separate classes of shares offered by the Fund differ principally in applicable sales charges, distribution, shareholder servicing, and administration fees. Class specific expenses are charged directly to that share class. Investment income, common expenses, and realized and unrealized gains (losses) on investments are allocated daily to each class of shares based on the relative proportion of net assets of each class.
3. FAIR VALUATION MEASUREMENTS
Fair value measurements of investments are determined within a framework that has established a fair value hierarchy based upon the various data inputs utilized in determining the value of the Fund’s investments. The three-level hierarchy gives the highest priority to unadjusted quoted prices in active markets for identical assets or liabilities (Level 1) and the lowest priority to unobservable inputs (Level 3). The Fund’s investments are classified within the fair value hierarchy based on the lowest level of input that is significant to the fair value measurement. The inputs are summarized into three broad levels as follows:
| ∎ | | Level 1 – quoted prices in active markets for identical securities |
| ∎ | | Level 2 – other significant observable inputs (including quoted prices for similar securities, interest rates, prepayment speeds, credit risk, etc.) |
| ∎ | | Level 3 – significant unobservable inputs (including the Fund’s own assumptions in determining the fair value of investments) |
The inputs or methodologies used for valuing investments in securities are not necessarily an indication of the risk associated with investing in those securities.
The following is a summary of the inputs used in valuing the Fund’s assets and liabilities as of March 31, 2019:
| | | | | | | | | | | | | | | | |
| | | | |
| | | Quoted prices
(Level 1) | | | Other significant
observable inputs
(Level 2) | | | Significant
unobservable inputs (Level 3) | | | Total | |
| | | | |
Assets | | | | | | | | | | | | | | | | |
Investments in: | | | | | | | | | | | | | | | | |
| | | | |
Common stocks | | | | | | | | | | | | | | | | |
| | | | |
Communication services | | $ | 3,097,487 | | | $ | 0 | | | $ | 0 | | | $ | 3,097,487 | |
| | | | |
Consumer discretionary | | | 13,597,544 | | | | 0 | | | | 0 | | | | 13,597,544 | |
| | | | |
Energy | | | 2,014,526 | | | | 0 | | | | 0 | | | | 2,014,526 | |
| | | | |
Financials | | | 2,738,079 | | | | 0 | | | | 0 | | | | 2,738,079 | |
| | | | |
Health care | | | 25,417,888 | | | | 0 | | | | 0 | | | | 25,417,888 | |
| | | | |
Industrials | | | 16,495,177 | | | | 0 | | | | 0 | | | | 16,495,177 | |
| | | | |
Information technology | | | 26,527,604 | | | | 0 | | | | 0 | | | | 26,527,604 | |
| | | | |
Materials | | | 1,717,641 | | | | 0 | | | | 0 | | | | 1,717,641 | |
| | | | |
Real estate | | | 1,103,387 | | | | 0 | | | | 0 | | | | 1,103,387 | |
| | | | |
Short-term investments | | | | | | | | | | | | | | | | |
| | | | |
Investment companies | | | 2,404,400 | | | | 6,840,944 | | | | 0 | | | | 9,245,344 | |
| | | | |
Total assets | | $ | 95,113,733 | | | $ | 6,840,944 | | | $ | 0 | | | $ | 101,954,677 | |
| | | | | | |
| Notes to financial statements | | Wells Fargo Traditional Small Cap Growth Fund | | | 25 | |
Additional sector, industry or geographic detail is included in the Portfolio of Investments.
At March 31, 2019, the Fund did not have any transfers into/out of Level 3.
4. TRANSACTIONS WITH AFFILIATES
Management fee
Funds Management, an indirect wholly owned subsidiary of Wells Fargo, is the manager of the Fund and provides advisory and fund-level administrative services under an investment management agreement. Under the investment management agreement, Funds Management is responsible for, among other services, implementing the investment objectives and strategies of the Fund, supervising the subadviser and providing fund-level administrative services in connection with the Fund’s operations. As compensation for its services under the investment management agreement, Funds Management is entitled to receive a management fee at the following annual rate based on the Fund’s average daily net assets:
| | | | |
| Average daily net assets | | Management fee | |
| |
First $500 million | | | 0.850 | % |
| |
Next $500 million | | | 0.825 | |
| |
Next $1 billion | | | 0.800 | |
| |
Next $1 billion | | | 0.775 | |
| |
Next $1 billion | | | 0.750 | |
| |
Next $1 billion | | | 0.730 | |
| |
Next $5 billion | | | 0.720 | |
| |
Over $10 billion | | | 0.710 | |
For the year ended March 31, 2019, the management fee was equivalent to an annual rate of 0.85% of the Fund’s average daily net assets.
Funds Management has retained the services of a subadviser to provide daily portfolio management to the Fund. The fee for subadvisory services is borne by Funds Management. WellsCap is the subadviser to the Fund and is entitled to receive a fee from Funds Management at an annual rate starting at 0.55% and declining to 0.40% as the average daily net assets of the Fund increase.
Administration fees
Under a class-level administration agreement, Funds Management provides class-level administrative services to the Fund, which includes paying fees and expenses for services provided by the transfer agent,sub-transfer agents, omnibus account servicers and record-keepers. As compensation for its services under the class-level administration agreement, Funds Management receives an annual fee which is calculated based on the average daily net assets of each class as follows:
| | | | |
| | | Class-level
administration fee | |
| |
Class A, Class C | | | 0.21 | % |
| |
Administrator Class, Institutional Class | | | 0.13 | |
Funds Management has contractually waived and/or reimbursed management and administration fees to the extent necessary to maintain certain net operating expense ratios for the Fund. When each class of the Fund has exceeded its expense cap, Funds Management has waived fees and/or reimbursed expenses from fund level expenses on a proportionate basis and then from class specific expenses. When only certain classes exceed their expense caps, waivers and/or reimbursements are applied against class specific expenses before fund level expenses. Funds Management has committed through July 31, 2019 to waive fees and/or reimburse expenses to the extent necessary to cap the Fund’s expenses at 1.23% for Class A shares, 1.98% for Class C shares, 1.15% for Administrator Class shares, and 0.90% for Institutional Class shares. Prior to or after the commitment expiration date, the cap may be increased or the commitment to maintain the cap may be terminated only with the approval of the Board of Trustees.Prior to April 2, 2018, the Fund’s expenses were capped at 1.33% for Class A shares, 2.08% for Class C shares, 1.20% for Administrator Class shares, and 0.98% for Institutional Class shares.
| | | | |
| 26 | | Wells Fargo Traditional Small Cap Growth Fund | | Notes to financial statements |
Distribution fee
The Trust has adopted a distribution plan for Class C shares of the Fund pursuant to Rule12b-1 under the 1940 Act. A distribution fee is charged to Class C shares and paid to Wells Fargo Funds Distributor, LLC (“Funds Distributor”), the principal underwriter, at an annual rate of 0.75% of the average daily net assets of Class C shares.
In addition, Funds Distributor is entitled to receive thefront-end sales charge from the purchase of Class A shares and a contingent deferred sales charge on the redemption of certain Class A shares. Funds Distributor is also entitled to receive the contingent deferred sales charges from redemptions of Class C shares. For the year ended March 31, 2019, Funds Distributor received $1,157 from the sale of Class A shares. No contingent deferred sales charges were incurred by Class A and Class C shares for the year ended March 31, 2019.
Shareholder servicing fees
The Trust has entered into contracts with one or more shareholder servicing agents, whereby Class A, Class C, and Administrator Class of the Fund are charged a fee at an annual rate of 0.25% of the average daily net assets of each respective class. A portion of these total shareholder servicing fees were paid to affiliates of Wells Fargo.
Interfund transactions
The Fund may purchase or sell portfolio investment securities to certain other Wells Fargo affiliates pursuant to Rule17a-7 under the 1940 Act and under procedures adopted by the Board of Trustees. The procedures have been designed to ensure that these interfund transactions, which do not incur broker commissions, are effected at current market prices.
5. INVESTMENT PORTFOLIO TRANSACTIONS
Purchases and sales of investments, excluding U.S. government obligations (if any) and short-term securities, for the year ended March 31, 2019 were $146,347,146 and $161,867,540, respectively.
6. BANK BORROWINGS
The Trust (excluding the money market funds), Wells Fargo Master Trust and Wells Fargo Variable Trust are parties to a $280,000,000 revolving credit agreement whereby the Fund is permitted to use bank borrowings for temporary or emergency purposes, such as to fund shareholder redemption requests. Interest under the credit agreement is charged to the Fund based on a borrowing rate equal to the higher of the Federal Funds rate in effect on that day plus 1.25% or the overnight LIBOR rate in effect on that day plus 1.25%. In addition, an annual commitment fee equal to 0.25% of the unused balance is allocated to each participating fund.
For the year ended March 31, 2019, there were no borrowings by the Fund under the agreement.
7. DISTRIBUTIONS TO SHAREHOLDERS
The tax character of distributions paid during the years ended March 31, 2019 and March 31, 2018 were as follows:
| | | | | | | | |
| | | Year ended March 31 | |
| | |
| | | 2019 | | | 2018 | |
| | |
Ordinary income | | $ | 2,828,951 | | | $ | 2,191,875 | |
| | |
Long-term capital gain | | | 20,362,971 | | | | 3,660,699 | |
As of March 31, 2019, the components of distributable earnings on a tax basis were as follows:
| | | | |
Undistributed ordinary
income | | Undistributed long-term
gain | | Unrealized gains |
| | |
| $1,713,085 | | $336,969 | | $15,414,514 |
| | | | | | |
| Notes to financial statements | | Wells Fargo Traditional Small Cap Growth Fund | | | 27 | |
Effective for all filings after November 4, 2018, the Securities and Exchange Commission eliminated the requirement to separately state the components of distributions to shareholders under U.S. generally accepted accounting principles. The amounts of distributions to shareholders for the year ended March 31, 2018 were as follows:
| | | | |
| | | Net realized
gains | |
| |
Class A | | $ | 5,360,360 | |
| |
Class C | | | 16,142 | |
| |
Administrator Class | | | 7,844 | |
| |
Institutional Class | | | 468,228 | |
8. CONCENTRATION RISK
Concentration risk result from exposure to a limited number of sectors. A fund that invests a substantial portion of its assets in any sector may be more affected by changes in that sector than would be a fund whose investments are not heavily weighted in any sector.
9. INDEMNIFICATION
Under the Trust’s organizational documents, the officers and Trustees have been granted certain indemnification rights against certain liabilities that may arise out of performance of their duties to the Trust. Additionally, in the normal course of business, the Trust may enter into contracts with service providers that contain a variety of indemnification clauses. The Trust’s maximum exposure under these arrangements is dependent on future claims that may be made against the Fund and, therefore, cannot be estimated.
10. NEW ACCOUNTING PRONOUNCEMENT
In August 2018, FASB issued Accounting Standards Update (“ASU”)No. 2018-13, Fair Value Measurement (Topic 820)Disclosure Framework—Changes to the Disclosure Requirements for Fair Value Measurement. ASU2018-13 updates the disclosure requirements for fair value measurements by modifying or removing certain disclosures and adding certain new disclosures. The amendments are effective for fiscal years, and interim periods within those fiscal years, beginning after December 15, 2019. Early adoption is permitted. Management has adopted the removal and modification of disclosures early, as permitted, and will adopt the additional new disclosures at the effective date.
| | | | |
| 28 | | Wells Fargo Traditional Small Cap Growth Fund | | Report of independent registered public accounting firm |
TO THE SHAREHOLDERS OF THE FUND AND BOARD OF TRUSTEES OF WELLS FARGO FUNDS TRUST:
Opinion on the Financial Statements
We have audited the accompanying statement of assets and liabilities of Wells Fargo Traditional Small Cap Growth Fund (the Fund), one of the funds constituting Wells Fargo Funds Trust, including the portfolio of investments, as of March 31, 2019, the related statement of operations for the year then ended, the statements of changes in net assets for each of the years in the two-year period then ended, and the related notes (collectively, the financial statements) and the financial highlights for each of the years in the five-year period then ended. In our opinion, the financial statements and financial highlights present fairly, in all material respects, the financial position of the Fund as of March 31, 2019, the results of its operations for the year then ended, the changes in its net assets for each of the years in the two-year period then ended, and the financial highlights for each of the years in the five-year period then ended, in conformity with U.S. generally accepted accounting principles.
Basis for Opinion
These financial statements and financial highlights are the responsibility of the Fund’s management. Our responsibility is to express an opinion on these financial statements and financial highlights based on our audits. We are a public accounting firm registered with the Public Company Accounting Oversight Board (United States) (PCAOB) and are required to be independent with respect to the Fund in accordance with the U.S. federal securities laws and the applicable rules and regulations of the Securities and Exchange Commission and the PCAOB.
We conducted our audits in accordance with the standards of the PCAOB. Those standards require that we plan and perform the audit to obtain reasonable assurance about whether the financial statements and financial highlights are free of material misstatement, whether due to error or fraud. Our audits included performing procedures to assess the risks of material misstatement of the financial statements and financial highlights, whether due to error or fraud, and performing procedures that respond to those risks. Such procedures included examining, on a test basis, evidence regarding the amounts and disclosures in the financial statements and financial highlights. Such procedures also included confirmation of securities owned as of March 31, 2019, by correspondence with the custodian and brokers, or by other appropriate auditing procedures. Our audits also included evaluating the accounting principles used and significant estimates made by management, as well as evaluating the overall presentation of the financial statements and financial highlights. We believe that our audits provide a reasonable basis for our opinion.

We have not been able to determine the specific year that we began serving as the auditor of one or more Wells Fargo Funds investment companies; however we are aware that we have served as the auditor of one or more Wells Fargo Funds investment companies since at least 1955.
Boston, Massachusetts
May 24, 2019
| | | | | | |
| Other information (unaudited) | | Wells Fargo Traditional Small Cap Growth Fund | | | 29 | |
TAX INFORMATION
For corporate shareholders, pursuant to Section 854 of the Internal Revenue Code, 2.35% of ordinary income dividends qualify for the corporate dividends-received deduction for the fiscal year ended March 31, 2019.
Pursuant to Section 852 of the Internal Revenue Code, $20,362,971 was designated as a 20% rate gain distribution for the fiscal year ended March 31, 2019.
Pursuant to Section 854 of the Internal Revenue Code, $86,566 of income dividends paid during the fiscal year ended March 31, 2019 has been designated as qualified dividend income (QDI).
For the fiscal year ended March 31, 2019, $2,828,951 has been designated as short-term capital gain dividends for nonresident alien shareholders pursuant to Section 871 of the Internal Revenue Code.
PROXY VOTING INFORMATION
A description of the policies and procedures used to determine how to vote proxies relating to portfolio securities is available, upon request, by calling1-800-222-8222, visiting our website atwfam.com, or visiting the SEC website at sec.gov. Information regarding how the Fund voted proxies relating to portfolio securities during the most recent12-month period ended June 30 is available on the Fund’s website atwfam.comor by visiting the SEC website at sec.gov.
PORTFOLIO HOLDINGS INFORMATION
The complete portfolio holdings for the Fund are publicly available monthly on the Fund’s website (wfam.com), on aone-month delayed basis. In addition, top ten holdings information (excluding derivative positions) for the Fund is publicly available on the Fund’s website on a monthly,seven-day or more delayed basis. The Fund files its complete schedule of portfolio holdings with the SEC for the first and third quarters of each fiscal year on FormN-Q, which is available by visiting the SEC website at sec.gov. In addition, the Fund’s FormN-Q may be reviewed and copied at the SEC’s Public Reference Room in Washington, DC, and at regional offices in New York City, at 233 Broadway, and in Chicago, at 175 West Jackson Boulevard, Suite 900. Information about the Public Reference Room may be obtained by calling1-800-SEC-0330.
| | | | |
| 30 | | Wells Fargo Traditional Small Cap Growth Fund | | Other information (unaudited) |
BOARD OF TRUSTEES AND OFFICERS
Each of the Trustees and Officers1 listed in the table below acts in identical capacities for each fund in the Wells Fargo family of funds, which consists of 151 mutual funds comprising the Wells Fargo Funds Trust, Wells Fargo Variable Trust, Wells Fargo Master Trust and fourclosed-end funds (collectively the “Fund Complex”). This table should be read in conjunction with the Prospectus and the Statement of Additional Information2. The mailing address of each Trustee and Officer is 525 Market Street, 12th Floor, San Francisco, CA 94105. Each Trustee and Officer serves an indefinite term, however, each Trustee serves such term until reaching the mandatory retirement age established by the Trustees.
Independent Trustees
| | | | | | |
Name and year of birth | | Position held and length of service* | | Principal occupations during past five years or longer | | Current other public company or investment company directorships |
| | | |
| William R. Ebsworth (Born 1957) | | Trustee, since 2015 | | Retired. From 1984 to 2013, equities analyst, portfolio manager, research director and chief investment officer at Fidelity Management and Research Company in Boston, Tokyo, and Hong Kong, and retired in 2013 as Chief Investment Officer of Fidelity Strategic Advisers, Inc. where he led a team of investment professionals managing client assets. Prior thereto, Board member of Hong Kong Securities Clearing Co., Hong Kong Options Clearing Corp., the Thailand International Fund, Ltd., Fidelity Investments Life Insurance Company, and Empire Fidelity Investments Life Insurance Company. Audit Committee Chair and Investment Committee Chair of the Vincent Memorial Hospital Endowment(non-profit organization). Mr. Ebsworth is a CFA® charterholder. | | N/A |
| | | |
Jane A. Freeman (Born 1953) | | Trustee, since 2015;
Chair Liaison, since 2018 | | Retired. From 2012 to 2014 and 1999 to 2008, Chief Financial Officer of Scientific Learning Corporation. From 2008 to 2012, Ms. Freeman provided consulting services related to strategic business projects. Prior to 1999, Portfolio Manager at Rockefeller & Co. and Scudder, Stevens & Clark. Board member of the Harding Loevner Funds from 1996 to 2014, serving as both Lead Independent Director and chair of the Audit Committee. Board member of the Russell Exchange Traded Funds Trust from 2011 to 2012 and the chair of the Audit Committee. Ms. Freeman is a Board Member of The Ruth Bancroft Garden(non-profit organization). She is also an inactive Chartered Financial Analyst. | | N/A |
| | | |
Isaiah Harris, Jr.3 (Born 1952) | | Trustee, since 2009;
Audit Committee Chairman, since 2019 | | Retired. Chairman of the Board of CIGNA Corporation since 2009, and Director since 2005. From 2003 to 2011, Director of Deluxe Corporation. Prior thereto, President and CEO of BellSouth Advertising and Publishing Corp. from 2005 to 2007, President and CEO of BellSouth Enterprises from 2004 to 2005 and President of BellSouth Consumer Services from 2000 to 2003. Emeritus member of the Iowa State University Foundation Board of Governors. Emeritus Member of the Advisory Board of Iowa State University School of Business. Advisory Board Member, Palm Harbor Academy (private school). Advisory Board Member, Child Evangelism Fellowship(non-profit). Mr. Harris is a certified public accountant (inactive status). | | CIGNA Corporation |
| | | |
Judith M. Johnson (Born 1949) | | Trustee, since 2008;
Audit Committee Chairman, from 2009 to 2018 | | Retired. Prior thereto, Chief Executive Officer and Chief Investment Officer of Minneapolis Employees Retirement Fund from 1996 to 2008. Ms. Johnson is an attorney, certified public accountant and a certified managerial accountant. | | N/A |
| | | | | | |
| Other information (unaudited) | | Wells Fargo Traditional Small Cap Growth Fund | | | 31 | |
| | | | | | |
Name and year of birth | | Position held and length of service* | | Principal occupations during past five years or longer | | Current other public company or investment company directorships |
| | | |
David F. Larcker
(Born 1950) | | Trustee, since 2009 | | James Irvin Miller Professor of Accounting at the Graduate School of Business, Stanford University, Director of the Corporate Governance Research Initiative and Senior Faculty of The Rock Center for Corporate Governance since 2006. From 2005 to 2008, Professor of Accounting at the Graduate School of Business, Stanford University. Prior thereto, Ernst & Young Professor of Accounting at The Wharton School, University of Pennsylvania from 1985 to 2005. | | N/A |
| | | |
Olivia S. Mitchell
(Born 1953) | | Trustee, since 2006; Nominating and Governance Committee Chairman, since 2018 | | International Foundation of Employee Benefit Plans Professor, Wharton School of the University of Pennsylvania since 1993. Director of Wharton’s Pension Research Council and Boettner Center on Pensions & Retirement Research, and Research Associate at the National Bureau of Economic Research. Previously, Cornell University Professor from 1978 to 1993. | | N/A |
| | | |
Timothy J. Penny
(Born 1951) | | Trustee, since 1996; Chairman, since 2018 | | President and Chief Executive Officer of Southern Minnesota Initiative Foundation, anon-profit organization, since 2007. Member of the Board of Trustees of NorthStar Education Finance, Inc., anon-profit organization, since 2007. | | N/A |
| | | |
James G. Polisson
(Born 1959) | | Trustee, since 2018 | | Retired. Chief Marketing Officer, Source (ETF) UK Services, Ltd, from 2015 to 2017. From 2012 to 2015, Principal of The Polisson Group, LLC, a management consulting, corporate advisory and principal investing company. Chief Executive Officer and Managing Director at Russell Investments, Global Exchange Traded Funds from 2010 to 2012. Managing Director of Barclays Global Investors from 1998 to 2010 and Global Chief Marketing Officer for iShares and Barclays Global Investors from 2000 to 2010. Trustee of the San Francisco Mechanics’ Institute, anon-profit organization, from 2013 to 2015. Board member of the Russell Exchange Traded Fund Trust from 2011 to 2012. Director of Barclays Global Investors Holdings Deutschland GmbH from 2006 to 2009. Mr. Polisson is an attorney and has a retired status with the Massachusetts and District of Columbia Bar Associations. | | N/A |
| | | |
Pamela Wheelock
(Born 1959) | | Trustee, since 2018 | | Board member of the Destination Medical Center Economic Development Agency, Rochester, Minnesota since 2019. Chief Operating Officer, Twin Cities Habitat for Humanity from 2017 to 2019. Vice President of University Services, University of Minnesota from 2012 to 2016. Prior thereto, on the Board of Directors, Governance Committee and Finance Committee for the Minnesota Philanthropy Partners (Saint Paul Foundation) from 2012 to 2018, Interim Chief Executive Officer of Blue Cross Blue Shield of Minnesota from 2011 to 2012, Chairman of the Board from 2009 to 2012 and Board Director from 2003 to 2015. Vice President, Leadership and Community Engagement, Bush Foundation, Saint Paul, Minnesota (a private foundation) from 2009 to 2011. Executive Vice President and Chief Financial Officer, Minnesota Sports and Entertainment from 2004 to 2009 and Senior Vice President from 2002 to 2004. Executive Vice President of the Minnesota Wild Foundation from 2004 to 2008. Commissioner of Finance, State of Minnesota, from 1999 to 2002. Currently the Board Chair of Minnesota Wild Foundation since 2010. | | N/A |
| * | Length of service dates reflect the Trustee’s commencement of service with the Trust’s predecessor entities, where applicable. |
| | | | |
| 32 | | Wells Fargo Traditional Small Cap Growth Fund | | Other information (unaudited) |
Officers
| | | | | | |
Name and
year of birth | | Position held and
length of service | | Principal occupations during past five years or longer | | |
| | | |
Andrew Owen (Born 1960) | | President, since 2017 | | Executive Vice President of Wells Fargo & Company and Head of Affiliated Managers, Wells Fargo Asset Management, since 2014. In addition, Mr. Owen is currently President, Chief Executive Officer and Director of Wells Fargo Funds Management, LLC since 2017. Prior thereto, Executive Vice President responsible for marketing, investments and product development for Wells Fargo Funds Management, LLC, from 2009 to 2014. | | |
| | | |
Nancy Wiser1 (Born 1967) | | Treasurer, since 2012 | | Executive Vice President of Wells Fargo Funds Management, LLC since 2011. Chief Operating Officer and Chief Compliance Officer at LightBox Capital Management LLC, from 2008 to 2011. | | |
| | | |
Alexander Kymn (Born 1973) | | Secretary and
Chief Legal Officer, since 2018 | | Senior Company Counsel of Wells Fargo Bank, N.A. since 2018 (previously Senior Counsel from 2007 to 2018). Vice President of Wells Fargo Funds Management, LLC from 2008 to 2014. | | |
| | | |
Michael H. Whitaker (Born 1967) | | Chief Compliance Officer, since 2016 | | Senior Vice President and Chief Compliance Officer since 2016. Senior Vice President and Chief Compliance Officer for Fidelity Investments from 2007 to 2016. | | |
| | | |
David Berardi (Born 1975) | | Assistant Treasurer, since 2009 | | Vice President of Wells Fargo Funds Management, LLC since 2009. Vice President of Evergreen Investment Management Company, LLC from 2008 to 2010. Manager of Fund Reporting and Control for Evergreen Investment Management Company, LLC from 2004 to 2010. | | |
| | | |
Jeremy DePalma1 (Born 1974) | | Assistant Treasurer, since 2009 | | Senior Vice President of Wells Fargo Funds Management, LLC since 2009. Senior Vice President of Evergreen Investment Management Company, LLC from 2008 to 2010 and head of the Fund Reporting and Control Team within Fund Administration from 2005 to 2010. | | |
| 1 | Nancy Wiser acts as Treasurer of 65 funds in the Fund Complex. Jeremy DePalma acts as Treasurer of 86 funds and Assistant Treasurer of 65 funds in the Fund Complex. |
| 2 | The Statement of Additional Information includes additional information about the Trustees and is available, without charge, upon request, by calling1-800-222-8222 or by visiting the website atwfam.com. |
| 3 | Mr. Harris became Chairman of the Audit Committee effective January 1, 2019. |
| | | | | | |
| Appendix A (unaudited) | | Wells Fargo Traditional Small Cap Growth Fund | | | 33 | |
SALES CHARGE REDUCTIONS AND WAIVERS FOR CERTAIN INTERMEDIARIES
Raymond James & Associates, Inc., Raymond James Financial Services & Raymond James affiliates (“Raymond James”)
Effective on or about March 1, 2019, shareholders purchasing Fund shares through a Raymond James platform or account will be eligible only for the following load waivers(front-end sales charge waivers and contingent deferred, orback-end, sales charge waivers) and discounts, which may differ from those disclosed elsewhere in the Fund’s Prospectus or SAI.
Front-end Sales Load Waivers on Class A shares Available at Raymond James
| | • | | Shares purchased in an investment advisory program. |
| | • | | Shares purchased through reinvestment of capital gains distributions and dividend reinvestment when purchasing shares of the same fund (but not any other fund within the fund family). |
| | • | | Employees and registered representatives of Raymond James or its affiliates and their family members as designated by Raymond James. |
| | • | | Shares purchased from the proceeds of redemptions within the same fund family, provided (1) the repurchase occurs within 90 days following the redemption, (2) the redemption and purchase occur in the same account, and (3) redeemed shares were subject to afront-end or deferred sales load (known as Rights of Reinstatement). |
| | • | | A shareholder in the fund’s Class C shares will have their shares automatically exchanged at net asset value to Class A shares (or the appropriate share class) of the fund if the shares are no longer subject to a CDSC and the exchange is in line with the policies and procedures of Raymond James. |
CDSC Waivers on Class A and C Shares Available at Raymond James
| | • | | Death or disability of the shareholder. |
| | • | | Shares sold as part of a systematic withdrawal plan as described in the Fund’s Prospectus. |
| | • | | Return of excess contributions from an IRA Account. |
| | • | | Shares sold as part of a required minimum distribution for IRA and retirement accounts due to the shareholder reaching age 70½ as described in the Fund’s prospectus. |
| | • | | Shares sold to pay Raymond James fees but only if the transaction is initiated by Raymond James. |
| | • | | Shares acquired through a right of reinstatement. |
Front-end Load Discounts Available at Raymond James: Breakpoints, and/or Rights of Accumulation
| | • | | Breakpoints as described in the Fund’s Prospectus. |
| | • | | Rights of accumulation which entitle shareholders to breakpoint discounts will be automatically calculated based on the aggregated holding of fund family assets held by accounts within the purchaser’s household at Raymond James. Eligible fund family assets not held at Raymond James may be included in the rights of accumulation calculation only if the shareholder notifies his or her financial advisor about such assets. |
This page is intentionally left blank.
This page is intentionally left blank.
This page is intentionally left blank.

For more information
More information about Wells Fargo Funds is available free upon request. To obtain literature, please write, visit the Fund’s website, or call:
Wells Fargo Funds
P.O. Box 219967
Kansas City, MO 64121-9967
Website: wfam.com
Individual investors: 1-800-222-8222
Retail investment professionals: 1-888-877-9275
Institutional investment professionals: 1-866-765-0778
This report and the financial statements contained herein are submitted for the general information of the shareholders of the Fund. If this report is used for promotional purposes, distribution of the report must be accompanied or preceded by a current prospectus. Before investing, please consider the investment objectives, risks, charges, and expenses of the investment. For a current prospectus and, if available, a summary prospectus, containing this information, call1-800-222-8222 or visit the Fund’s website atwfam.com. Read the prospectus carefully before you invest or send money.
Wells Fargo Asset Management (WFAM) is the trade name for certain investment advisory/management firms owned by Wells Fargo & Company. These firms include but are not limited to Wells Capital Management Incorporated and Wells Fargo Funds Management, LLC. Certain products managed by WFAM entities are distributed by Wells Fargo Funds Distributor, LLC (a broker-dealer and Member FINRA).
This material is for general informational and educational purposes only and is NOT intended to provide investment advice or a recommendation of any kind—including a recommendation for any specific investment, strategy, or plan.
INVESTMENT PRODUCTS: NOT FDIC INSURED ◾ NO BANK GUARANTEE ◾ MAY LOSE VALUE
© 2019 Wells Fargo Funds Management, LLC. All rights reserved.
| | |
 | | 401595 05-19 A247/AR247 03-19 |
Annual Report
March 31, 2019

Wells Fargo Precious Metals Fund

Beginning on January 1, 2021, as permitted by new regulations adopted by the Securities and Exchange Commission, paper copies of the Wells Fargo Funds’ annual and semi-annual shareholder reports issued after this date will no longer be sent by mail, unless you specifically request paper copies of the reports. Instead, the reports will be made available on the Funds’ website, and you will be notified by mail each time a report is posted and provided with a website address to access the report.
If you already elected to receive shareholder reports electronically, you will not be affected by this change and you need not take any action. You may elect to receive shareholder reports and other communications from the Fund electronically at any time by contacting your financial intermediary (such as a broker-dealer or bank) or, if you are a direct investor, by calling 1-800-222-8222 or by enrolling at wellsfargo.com/advantagedelivery.
You may elect to receive all future reports in paper free of charge. If you invest through a financial intermediary, you can contact your financial intermediary to request that you continue to receive paper copies of your shareholder reports; if you invest directly with the Fund, you can call 1-800-222-8222. Your election to receive reports in paper will apply to all Wells Fargo Funds held in your account with your financial intermediary or, if you are a direct investor, to all Wells Fargo Funds that you hold.

Reduce clutter. Save trees.
Sign up for electronic delivery of prospectuses and shareholder reports atwellsfargo.com/advantagedelivery
Contents
The views expressed and any forward-looking statements are as of March 31, 2019, unless otherwise noted, and are those of the Fund managers and/or Wells Fargo Asset Management. Discussions of individual securities, or the markets generally, or any Wells Fargo Fund are not intended as individual recommendations. Future events or results may vary significantly from those expressed in any forward-looking statements. The views expressed are subject to change at any time in response to changing circumstances in the market. Wells Fargo and the Fund disclaim any obligation to publicly update or revise any views expressed or forward-looking statements.
INVESTMENT PRODUCTS: NOT FDIC INSURED ◾ NO BANK GUARANTEE ◾ MAY LOSE VALUE
| | | | |
| 2 | | Wells Fargo Precious Metals Fund | | Letter to shareholders (unaudited) |

Andrew Owen
President
Wells Fargo Funds
Global trade tensions escalated during the second quarter of 2018.
Dear Shareholder:
We are pleased to offer you this annual report for the Wells Fargo Precious Metals Fund for the 12-month period that ended March 31, 2019. An upward trend for short-term interest rates, inflation concerns, trade tensions, and geopolitical events contributed to investment market volatility for much of 2018. Equity investor sentiment improved during the first quarter of 2019 thanks to a shift in U.S. Federal Reserve (Fed) policy and consistent if not spectacular economic and business growth metrics.
For the period, U.S. stocks, as measured by the S&P 500 Index,1 gained 9.50% and international stocks, as measured by the MSCI ACWI ex USA Index (Net),2 declined 4.22%. Based on the MSCI EM Index (Net),3 emerging market stocks fell 7.41%. For bond investors, the Bloomberg Barclays U.S. Aggregate Bond Index4 added 4.48% while the Bloomberg Barclays Global Aggregate ex-USD Index5 lost 4.13%. The Bloomberg Barclays Municipal Bond Index6 added 5.38%, and the ICE BofAML U.S. High Yield Index7 gained 5.94%.
Trade tensions and U.S. interest rates influenced markets.
Global trade tensions escalated during the second quarter of 2018. A tit-for-tat tariff spat intensified between the U.S. and other governments. The Fed raised the federal funds rate by 25 basis points (bps; 100 bps equal 1.00%) to a target range of between 1.75% and 2.00% in June 2018. Market index results reflected the global concerns. The MSCI ACWI ex USA Index (Net) lost 2.61%, while the Bloomberg Barclays Global Aggregate ex-USD Index dropped 4.76%.
Not all news was bad. The U.S. Bureau of Economic Analysis reported second-quarter annualized gross domestic product (GDP) growth of 4.2%. Hiring improved. Unemployment declined. Consumer confidence and spending increased. The S&P 500 Index recorded a 3.43% second-quarter gain. Stocks of companies with smaller capitalizations did even better, as measured by the Russell 2000® Index,8 adding 7.75%.
| 1 | The S&P 500 Index consists of 500 stocks chosen for market size, liquidity, and industry group representation. It is a market-value-weighted index with each stock’s weight in the index proportionate to its market value. You cannot invest directly in an index. |
| 2 | The Morgan Stanley Capital International (MSCI) All Country World Index (ACWI) ex USA Index (Net) is a free-float-adjusted market-capitalization-weighted index that is designed to measure the equity market performance of developed markets, excluding the United States and Canada. Source: MSCI. MSCI makes no express or implied warranties or representations and shall have no liability whatsoever with respect to any MSCI data contained herein. The MSCI data may not be further redistributed or used as a basis for other indices or any securities or financial products. This report is not approved, reviewed, or produced by MSCI. You cannot invest directly in an index. |
| 3 | The MSCI Emerging Markets (EM) Index (Net) is a free-float-adjusted market-capitalization-weighted index that is designed to measure large- and mid-cap equity market performance of emerging markets. The MSCI EM Index (Net) consists of the following 24 emerging market country indices: Brazil, Chile, China, Colombia, Czech Republic, Egypt, Greece, Hungary, India, Indonesia, Korea, Malaysia, Mexico, Pakistan, Peru, the Philippines, Poland, Qatar, Russia, South Africa, Taiwan, Thailand, Turkey, and the United Arab Emirates. You cannot invest directly in an index. |
| 4 | The Bloomberg Barclays U.S. Aggregate Bond Index is a broad-based benchmark that measures the investment-grade, U.S. dollar-denominated, fixed-rate taxable bond market, including Treasuries, government-related and corporate securities, mortgage-backed securities (agency fixed-rate and hybrid adjustable-rate mortgage pass-throughs), asset-backed securities, and commercial mortgage-backed securities. You cannot invest directly in an index. |
| 5 | The Bloomberg Barclays Global Aggregate ex-USD Index is an unmanaged index that provides a broad-based measure of the global investment-grade fixed-income markets excluding the U.S. dollar-denominated debt market. You cannot invest directly in an index. |
| 6 | The Bloomberg Barclays Municipal Bond Index is an unmanaged index composed of long-term tax-exempt bonds with a minimum credit rating of Baa. You cannot invest directly in an index. |
| 7 | The ICE BofAML U.S. High Yield Index is a market-capitalization-weighted index of domestic and Yankee high-yield bonds. The index tracks the performance of high-yield securities traded in the U.S. bond market. You cannot invest directly in an index. Copyright 2019. ICE Data Indices, LLC. All rights reserved. |
| 8 | The Russell 2000® Index measures the performance of the 2,000 smallest companies in the Russell 3000® Index, which represents approximately 8% of the total market capitalization of the Russell 3000® Index. You cannot invest directly in an index. |
| | | | | | |
| Letter to shareholders (unaudited) | | Wells Fargo Precious Metals Fund | | | 3 | |
Investors appeared to shake off lingering concerns during the third quarter.
Favorable third-quarter economic indicators and corporate earnings reports encouraged domestic stock investors. U.S. trade negotiations with Mexico and Canada progressed. The Conference Board Consumer Confidence Index®9 reached its highest level in 18 years during September 2018. The Fed raised the federal funds rate by 25 bps to a target range of between 2.00% and 2.25% in September 2018. For the quarter that ended September 30, 2018, the S&P 500 Index added 7.71%.
Investors in international markets were not as confident. Tensions between the U.S. and China increased. The U.S. imposed $200 billion in tariffs on Chinese goods. China reacted with $60 billion in tariffs on U.S. goods. Economic growth in China caused concern. The Bank of England raised its monetary policy rate to 0.75% in August 2018. During the quarter, the MSCI ACWI ex USA Index (Net) gained 0.71%. The MSCI EM Index (Net) declined 1.09%. In fixed-income markets, U.S. bonds were flat, as measured by the Bloomberg Barclays U.S. Aggregate Bond Index. The Bloomberg Barclays Global Aggregate ex-USD Index fell 1.74%.
Conflicting data unsettled markets during the fourth quarter.
November’s U.S. midterm elections shifted control of the House of Representatives from Republicans to Democrats, presaging potential partisan clashes. Third-quarter U.S. GDP was announced at an annualized 3.4% rate, lower than the second-quarter rate. Brexit efforts stalled ahead of the March 2019 deadline. The People’s Bank of China cut reserve requirement ratios, accelerated infrastructure spending, and cut taxes even as the value of the yuan declined to low levels last seen in 2008.
December’s S&P 500 Index performance was the worst since 1931. Globally,fixed-income investments fared better than stocks during the last two months of the year. The Fed increased the federal funds rate by 25 bps in December 2018 to a target range of between 2.25% and 2.50% and softened its outlook for 2019 rate increases.
The market climbs a wall of worry.
Investors entered 2019 with reasons to be concerned. A partial U.S. government shutdown driven by partisan spending and immigration policy disputes extended into January. Investors expected high levels of stock market volatility to continue based on the VIX10.
January’s returns tended to support the investing adage that markets climb a wall of worry. The S&P 500 Index gained 8.01% for the month that ended January 31, 2019, its best monthly performance in 30 years. Returns for the MSCI ACWI ex USA Index (Net), the Bloomberg Barclays U.S. Aggregate Bond Index, and the Bloomberg Barclays Global Aggregate ex-USD Index also were positive. The Fed indicated that it would pause its program of regular rate increases during 2019 as inflation remained low. Businesses and investors responded positively to the shift in policy.
In February, concerns over slowing global growth reemerged. The Bureau of Economic Analysis announced fourth-quarter 2018 GDP grew at an annualized 2.2% rate, down from the 4.2% annualized rate for the second quarter and the 3.4% annualized rate for the third quarter. Analysts attributed the lower growth rate to a slowing housing market and larger trade deficit. The U.S. Department of
Favorable third-quarter economic indicators and corporate earnings reports encouraged domestic stock investors.
| 9 | The Conference Board Consumer Confidence Index® measures the degree of optimism on the state of the U.S. economy that consumers are expressing through their activities of savings and spending. You cannot invest directly in an index. |
| 10 | The Chicago Board Options Exchange Market Volatility Index (VIX) is a popular measure of the implied volatility of S&P 500 Index options. It represents one measure of the market’s expectation of stock market volatility over the next 30-day period. You cannot invest directly in an index. |
| | | | |
| 4 | | Wells Fargo Precious Metals Fund | | Letter to shareholders (unaudited) |
Labor said that the economy created just 20,000 jobs in February 2019. In a February report, the Bank of England forecast the slowest growth since the financial crisis for 2019. China and the U.S., while putting future tariffs on hold for the time being, continued to wrangle over trade issues.
By the end of March 2019, the combination of dovish Fed sentiment and consistent, if not spectacular, economic and business metrics reinforced investors’ enthusiasm for equity investing. Monthly job creation data regained its momentum. Corporate profits, while lower than 2018’s lofty levels, remained consistent. Inflation rates were relatively low in the U.S., Europe, and Japan. China announced a roughly $300 billion stimulus package through tax and fee cuts intended to reinvigorate economic growth.
Don’t let short-term uncertainty derail long-term investment goals.
Periods of investment uncertainty can present challenges, but experience has taught us that maintaining long-term investment goals can be an effective way to plan for the future. To help you create a sound strategy based on your personal goals and risk tolerance, Wells Fargo Funds offers more than 100 mutual funds spanning a wide range of asset classes and investment styles. Although diversification cannot guarantee an investment profit or prevent losses, we believe it can be an effective way to manage investment risk and potentially smooth out overall portfolio performance. We encourage investors to know their investments and to understand that appropriate levels of risk-taking may unlock opportunities.
Thank you for choosing to invest with Wells Fargo Funds. We appreciate your confidence in us and remain committed to helping you meet your financial needs.
Sincerely,

Andrew Owen
President
Wells Fargo Funds
For further information about your Fund, contact your investment professional, visit our website atwfam.com, or call us directly at1-800-222-8222.
This page is intentionally left blank.
| | | | |
| 6 | | Wells Fargo Precious Metals Fund | | Performance highlights (unaudited) |
Investment objective
The Fund seeks long-term capital appreciation.
Manager
Wells Fargo Funds Management, LLC
Subadviser
Wells Capital Management Incorporated
Portfolio managers
Michael Bradshaw, CFA®‡
Oleg Makhorine
Average annual total returns (%) as of March 31, 2019
| | | | | | | | | | | | | | | | | | | | | | | | | | | | | | | | | | | | | | |
| | | | | Including sales charge | | | Excluding sales charge | | | | | | Expense ratios1 (%) | |
| | | Inception date | | 1 year | | | 5 year | | | 10 year | | | 1 year | | | 5 year | | | 10 year | | | | | | Gross | | | Net2 | |
| | | | | | | | | | |
| Class A (EKWAX)3 | | 1-20-1998 | | | -2.47 | | | | -2.18 | | | | -3.07 | | | | 3.48 | | | | -1.02 | | | | -2.49 | | | | | | | | 1.21 | | | | 1.09 | |
| | | | | | | | | | |
| Class C (EKWCX)3 | | 1-29-1998 | | | 1.72 | | | | -1.75 | | | | -3.21 | | | | 2.72 | | | | -1.75 | | | | -3.21 | | | | | | | | 1.96 | | | | 1.84 | |
| | | | | | | | | | |
| Administrator Class (EKWDX)4 | | 7-30-2010 | | | – | | | | – | | | | – | | | | 3.63 | | | | -0.87 | | | | -2.35 | | | | | | | | 1.13 | | | | 0.95 | |
| | | | | | | | | | |
| Institutional Class (EKWYX)3 | | 2-29-2000 | | | – | | | | – | | | | – | | | | 3.81 | | | | -0.72 | | | | -2.19 | | | | | | | | 0.88 | | | | 0.79 | |
| | | | | | | | | | |
| FTSE Gold Mines Index5 | | – | | | – | | | | – | | | | – | | | | 2.29 | | | | 0.76 | | | | -4.31 | | | | | | | | – | | | | – | |
| | | | | | | | | | |
| S&P 500 Index6 | | – | | | – | | | | – | | | | – | | | | 9.50 | | | | 10.91 | | | | 15.92 | | | | | | | | – | | | | – | |
Figures quoted represent past performance, which is no guarantee of future results, and do not reflect taxes that a shareholder may pay on fund distributions or the redemption of fund shares.Investment return and principal value of an investment will fluctuate so that an investor’s shares, when redeemed, may be worth more or less than their original cost. Performance shown without sales charges would be lower if sales charges were reflected. Current performance may be lower or higher than the performance data quoted, which assumes the reinvestment of dividends and capital gains. Currentmonth-end performance is available on the Fund’s website, wfam.com.
While the S&P 500 Index is comprised of U.S. equity securities of companies diversified across ten sectors, the Fund’s holdings are concentrated primarily in precious metals related stocks. Therefore, the performance of the S&P 500 Index is displayed only to show how the concentrated Fund performed compared with a diversified selection of U.S. equity securities.
Index returns do not include transaction costs associated with buying and selling securities, any mutual fund fees or expenses, or any taxes. It is not possible to invest directly in an index.
For Class A shares, the maximumfront-end sales charge is 5.75%. For Class C shares, the maximum contingent deferred sales charge is 1.00%. Performance including a contingent deferred sales charge assumes the sales charge for the corresponding time period. Administrator Class and Institutional Class shares are sold without afront-end sales charge or contingent deferred sales charge.
Stock values fluctuate in response to the activities of individual companies and general market and economic conditions. Bond values fluctuate in response to the financial condition of individual issuers, general market and economic conditions, and changes in interest rates. Changes in market conditions and government policies may lead to periods of heightened volatility in the bond market and reduced liquidity for certain bonds held by the Fund. In general, when interest rates rise, bond values fall and investors may lose principal value. Interest rate changes and their impact on the Fund and its share price can be sudden and unpredictable. Funds that concentrate their investments in limited sectors, much as gold-related investments, are more vulnerable to adverse market, economic, regulatory, political, or other developments affecting those sectors. Certain investment strategies tend to increase the total risk of an investment (relative to the broader market). The Fund is exposed to foreign investment risk, geographic,non-diversification risk, smaller-company securities risk, and subsidiary risk. Consult the Fund’s prospectus for additional information on these and other risks.
Please see footnotes on page 7.
| | | | | | |
| Performance highlights (unaudited) | | Wells Fargo Precious Metals Fund | | | 7 | |
|
| Growth of $10,000 investment as of March 31, 20197 |
|
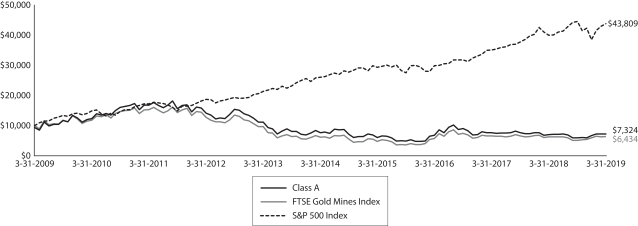 |
| ‡ | CFA® and Chartered Financial Analyst®are trademarks owned by CFA Institute. |
| 1 | Reflect the expense ratios as stated in the most recent prospectuses. The expense ratios are subject to change and may differ from the annualized expense ratios shown in the financial highlights of this report. |
| 2 | The manager has contractually committed through July 31, 2019, to waive fees and/or reimburse expenses to the extent necessary to cap the expenses of each class after fee waivers at the amounts shown. Brokerage commissions, stamp duty fees, interest, taxes, acquired fund fees and expenses (if any), and extraordinary expenses are excluded from the expense cap. Prior to or after the commitment expiration date, the cap may be increased or the commitment to maintain the cap may be terminated only with the approval of the Board of Trustees. Without this cap, the Fund’s returns would have been lower. The expense ratio paid by an investor is the net expense ratio (the total annual fund operating expenses after fee waivers) as stated in the prospectuses. |
| 3 | Historical performance shown for this class prior to July 19, 2010, is based on the performance of the same class of the Fund’s predecessor, Evergreen Precious Metals Fund. |
| 4 | Historical performance shown for Administrator Class shares prior to their inception reflects the performance of Institutional Class shares and has been adjusted to reflect the higher expenses applicable to Administrator Class shares. |
| 5 | FTSE Gold Mines Index is an unmanaged, open-ended index designed to reflect the performance of the worldwide market in the shares of companies whose principal activity is the mining of gold. You cannot invest directly in an index. |
| 6 | The S&P 500 Index consists of 500 stocks chosen for market size, liquidity, and industry group representation. It is a market-value weighted index with each stock’s weight in the index proportionate to its market value. You cannot invest directly in an index. |
| 7 | The chart compares the performance of Class A shares for the most recent ten years with the FTSE Gold Mines Index and the S&P 500 Index. The chart assumes a hypothetical investment of $10,000 in Class A shares and reflects all operating expenses and assumes the maximum initial sales charge of 5.75%. |
| 8 | The ten largest holdings, excluding cash, cash equivalents and any money market funds, are calculated based on the value of the investments divided by total net assets of the Fund. Holdings are subject to change and may have changed since the date specified. |
| 9 | Amounts are calculated based on the total long-term investments of the Fund. These amounts are subject to change and may have changed since the date specified. |
| | | | |
| 8 | | Wells Fargo Precious Metals Fund | | Performance highlights (unaudited) |
MANAGER’S DISCUSSION
Fund highlights
| ∎ | | The Fund outperformed its benchmark, the FTSE Gold Mines Index, for the12-month period that ended March 31, 2019. |
| ∎ | | The Fund’s positions in Torex Gold Resources Incorporated and Wheaton Precious Metals Corporation aided results, as did its overweight to Kirkland Lake Gold Limited. Underweights to Goldcorp Incorporated and Newmont Mining Corporation also helped results. |
| ∎ | | The Fund’s overweights to Fresnillo plc, IAMGOLD Corporation, and Detour Gold Corporation detracted from results during the period. Underweights to Anglogold Ashanti Limited, Barrick Gold Corporation, and Newcrest Mining Limited also detracted from results. |
| ∎ | | The price of gold fell approximately 2.6% during the12-month period, and the share prices of precious metals stocks outperformed the gold price. |
Gold prices fell during the first half of the period and increased during the second half.
The price of gold declined 10% during the first two quarters of the reporting period. Positive U.S. economic data including higher gross domestic product growth and lower unemployment caused the U.S. Federal Reserve (Fed) to raise interest rates, pushing bond yields and the U.S. dollar higher and the gold price lower. During the third and fourth quarters of the reporting period, gold prices rose 8.4%. The gold price was propelled higher during the fall and winter months by a weakening global economy. The economic weakness caused a decline in stock and commodity markets as well as bond yields.
| | | | |
| Ten largest holdings (%) as of March 31, 20198 | |
| |
Barrick Gold Corporation | | | 7.81 | |
| |
Newmont Mining Corporation | | | 7.34 | |
| |
Royal Gold Incorporated | | | 5.77 | |
| |
Kirkland Lake Gold Limited | | | 5.64 | |
| |
Newcrest Mining Limited | | | 5.55 | |
| |
Kinross Gold Corporation | | | 4.65 | |
| |
Agnico Eagle MinesLimited-U.S. Exchange Traded Shares | | | 4.53 | |
| |
Gold Bullion | | | 4.45 | |
| |
Wheaton Precious MetalsCorporation-U.S. Exchange Traded Shares | | | 4.45 | |
| |
Franco-Nevada Corporation-Legend Shares | | | 3.81 | |
Purchases and sales of gold exchange-traded funds (ETFs) have an impact on gold prices. Purchases of gold ETFs declined during the first half of the reporting period, negatively affecting the price of gold. During the second half of the reporting period, gold-backed ETF purchases accelerated as rising economic uncertainty caused the stock market and bond yields to fall and physical demand for gold to rise.
Gold-mining stocks outperformed relative to the price of gold.
The prices of gold-mining stocks typically rise or fall more sharply than the price of gold. However, this was not the case during the12-month reporting period. Companies that delivered better-than-expected operating and financial results fared the best.
Torex Gold’s share price more than doubled during the reporting period. The company benefited from the successful restart of its El Limon Mine in Mexico. As a result, production guidance was raised for both 2018 and 2019. Kirkland Lake Gold was one of the Fund’s best contributors as multiple revisions to guidance caused the stock to outperform. Wheaton Precious Metals was another key contributor, rising on news of a positive tax settlement with the Canada Revenue Agency.
Please see footnotes on page 7.
| | | | | | |
| Performance highlights (unaudited) | | Wells Fargo Precious Metals Fund | | | 9 | |
|
| Country allocation as of March 31, 20199 |
|
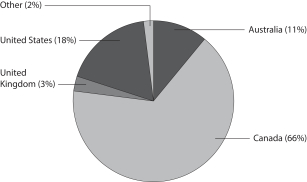
|
Three of the Fund’s most noteworthy detractors were Fresnillo, IAMGOLD, and Detour Gold. Fresnillo declined after the firm announced that 2019 production would be lower than expected and that its Juanicipio development project would be delayed. IAMGOLD dropped on news that the company would be deferring the development of its Cote Lake Mine until market conditions improved. The Fund’s underweight to Barrick Gold also detracted from performance as the company benefited from the positive market reaction to its announced merger with Randgold Resources Limited.
In our view, investment in gold and precious metals companies likely will remain a perceived hedge against economic and political uncertainty.
We believe the short-term outlook for gold prices depends largely on economic data and their resulting impact on U.S. interest rates and the U.S. dollar. With economic growth slowing during the fourth quarter of the reporting period and inflation expectations falling, the Fed removed its previous outlook of additional interest rate increases in 2019. Should this occur, we believe the economic environment likely would continue to support gold prices and gold stocks.
Over the longer term, we believe the primary drivers of gold are positive. First, rising fiscal deficits in the U.S. could cause the dollar to weaken. Second, increasing inflation in the U.S., caused by a tight labor market and higher-cost imported goods, could benefit the price of gold. And finally, increased stock market volatility from rising geopolitical risks may cause investors to offset this risk by adding gold to their investment portfolios.
We believe gold-related stocks may have better appreciation potential than the metal itself. However, stock selection will remain important because, in our view, company fundamentals tend to drive stock prices. We believe higher-quality companies with internal growth catalysts, such as effective execution of business plans and mining successes, are most likely to outperform their peers.
Please see footnotes on page 7.
| | | | |
| 10 | | Wells Fargo Precious Metals Fund | | Fund expenses (unaudited) |
As a shareholder of the Fund, you incur two types of costs: (1) transaction costs, including sales charges (loads) on purchase payments and contingent deferred sales charges (if any) on redemptions and (2) ongoing costs, including management fees, distribution(12b-1) and/or shareholder servicing fees, and other Fund expenses. This example is intended to help you understand your ongoing costs (in dollars) of investing in the Fund and to compare these costs with the ongoing costs of investing in other mutual funds.
The example is based on an investment of $1,000 invested at the beginning of thesix-month period and held for the entire period from October 1, 2018 to March 31, 2019.
Actual expenses
The “Actual” line of the table below provides information about actual account values and actual expenses. You may use the information in this line, together with the amount you invested, to estimate the expenses that you paid over the period. Simply divide your account value by $1,000 (for example, an $8,600 account value divided by $1,000 = 8.6), then multiply the result by the number in the “Actual” line under the heading entitled “Expenses paid during period” for your applicable class of shares to estimate the expenses you paid on your account during this period.
Hypothetical example for comparison purposes
The “Hypothetical” line of the table below provides information about hypothetical account values and hypothetical expenses based on the Fund’s actual expense ratio and an assumed rate of return of 5% per year before expenses, which is not the Fund’s actual return. The hypothetical account values and expenses may not be used to estimate the actual ending account balance or expenses you paid for the period. You may use this information to compare the ongoing costs of investing in the Fund and other funds. To do so, compare this 5% hypothetical example with the 5% hypothetical examples that appear in the shareholder reports of the other funds.
Please note that the expenses shown in the table are meant to highlight your ongoing costs only and do not reflect any transactional costs, such as sales charges (loads) and contingent deferred sales charges. Therefore, the “Hypothetical” line of the table is useful in comparing ongoing costs only and will not help you determine the relative total costs of owning different funds. In addition, if these transactional costs were included, your costs would have been higher.
| | | | | | | | | | | | | | | | |
| | | Beginning
account value
10-1-2018 | | | Ending
account value
3-31-2019 | | | Expenses
paid during
the period¹ | | | Annualized net
expense ratio | |
Class A | | | | | | | | | | | | | | | | |
| | | | |
Actual | | $ | 1,000.00 | | | $ | 1,213.88 | | | $ | 6.02 | | | | 1.09 | % |
| | | | |
Hypothetical (5% return before expenses) | | $ | 1,000.00 | | | $ | 1,019.50 | | | $ | 5.49 | | | | 1.09 | % |
Class C | | | | | | | | | | | | | | | | |
| | | | |
Actual | | $ | 1,000.00 | | | $ | 1,209.72 | | | $ | 10.14 | | | | 1.84 | % |
| | | | |
Hypothetical (5% return before expenses) | | $ | 1,000.00 | | | $ | 1,015.76 | | | $ | 9.25 | | | | 1.84 | % |
Administrator Class | | | | | | | | | | | | | | | | |
| | | | |
Actual | | $ | 1,000.00 | | | $ | 1,215.10 | | | $ | 5.25 | | | | 0.95 | % |
| | | | |
Hypothetical (5% return before expenses) | | $ | 1,000.00 | | | $ | 1,020.19 | | | $ | 4.78 | | | | 0.95 | % |
Institutional Class | | | | | | | | | | | | | | | | |
| | | | |
Actual | | $ | 1,000.00 | | | $ | 1,215.97 | | | $ | 4.36 | | | | 0.79 | % |
| | | | |
Hypothetical (5% return before expenses) | | $ | 1,000.00 | | | $ | 1,020.99 | | | $ | 3.98 | | | | 0.79 | % |
| 1 | Expenses paid is equal to the annualized net expense ratio of each class multiplied by the average account value over the period, multiplied by the number of days in the most recent fiscal half-year divided by the number of days in the fiscal year (to reflect theone-half-year period). |
| | | | | | |
| Consolidated portfolio of investments—March 31, 2019 | | Wells Fargo Precious Metals Fund | | | 11 | |
| | | | | | | | | | | | | | | | |
| Security name | | | | | | | | Shares | | | Value | |
|
Common Stocks: 94.47% | |
|
| Australia: 10.79% | |
| | | | |
Evolution Mining Limited (Materials, Metals & Mining) | | | | | | | | | | | 2,800,000 | | | $ | 7,276,590 | |
| | | | |
Newcrest Mining Limited (Materials, Metals & Mining) | | | | | | | | | | | 862,294 | | | | 15,619,050 | |
| | | | |
Northern Star Resources Limited (Materials, Metals & Mining) | | | | | | | | | | | 1,175,000 | | | | 7,467,061 | |
| | | | |
| | | | | | | | | | | | | | | 30,362,701 | |
| | | | | | | | | | | | | | | | |
|
| Canada: 65.57% | |
| | | | |
Agnico-Eagle Mines Limited (Materials, Metals & Mining) | | | | | | | | | | | 225,370 | | | | 9,798,329 | |
| | | | |
Agnico-Eagle Mines Limited-Legend Shares (Materials, Metals & Mining) | | | | | | | | | | | 35,000 | | | | 1,522,500 | |
| | | | |
Agnico-Eagle MinesLimited-U.S. Exchange Traded Shares (Materials, Metals & Mining) | | | | | | | | | | | 293,164 | | | | 12,752,634 | |
| | | | |
Alamos Gold Incorporated Class A (Materials, Metals & Mining) | | | | | | | | | | | 813,980 | | | | 4,129,745 | |
| | | | |
B2Gold Corporation (Materials, Metals & Mining) † | | | | | | | | | | | 2,650,000 | | | | 7,416,470 | |
| | | | |
Barrick Gold Corporation (Materials, Metals & Mining) | | | | | | | | | | | 1,601,723 | | | | 21,959,622 | |
| | | | |
Centerra Gold Incorporated-Legend Shares (Materials, Metals & Mining) 144A | | | | | | | | | | | 350,000 | | | | 1,835,971 | |
| | | | |
Continental Gold Incorporated (Materials, Metals & Mining) † | | | | | | | | | | | 1,200,000 | | | | 2,595,129 | |
| | | | |
Detour Gold Corporation (Materials, Metals & Mining) † | | | | | | | | | | | 221,057 | | | | 2,074,348 | |
| | | | |
Detour Gold Corporation-Legend Shares (Materials, Metals & Mining) 144A | | | | | | | | | | | 525,000 | | | | 4,926,479 | |
| | | | |
Detour Gold Corporation-Legend Shares (Materials, Metals & Mining) | | | | | | | | | | | 90,000 | | | | 844,539 | |
| | | | |
Endeavour Mining Corporation (Materials, Metals & Mining) † | | | | | | | | | | | 410,000 | | | | 6,154,525 | |
| | | | |
Franco-Nevada Corporation-Legend Shares (Materials, Metals & Mining) 144A | | | | | | | | | | | 142,948 | | | | 10,717,222 | |
| | | | |
Goldcorp Incorporated (Materials, Metals & Mining) | | | | | | | | | | | 500,454 | | | | 5,726,001 | |
| | | | |
GoldcorpIncorporated-U.S. Exchange Traded Shares (Materials, Metals & Mining) | | | | | | | | | | | 165,694 | | | | 1,895,539 | |
| | | | |
IAMGOLD Corporation (Materials, Metals & Mining) † | | | | | | | | | | | 1,955,000 | | | | 6,773,413 | |
| | | | |
Kinross Gold Corporation (Materials, Metals & Mining) † | | | | | | | | | | | 3,800,553 | | | | 13,082,309 | |
| | | | |
Kirkland Lake Gold Limited (Materials, Metals & Mining) | | | | | | | | | | | 522,000 | | | | 15,874,644 | |
| | | | |
Mag Silver Corporation (Materials, Metals & Mining) † | | | | | | | | | | | 590,000 | | | | 6,300,221 | |
| | | | |
Mag Silver Corporation-Legend Shares (Materials, Metals & Mining) | | | | | | | | | | | 100,000 | | | | 1,067,834 | |
| | | | |
OceanaGold Corporation (Materials, Metals & Mining) | | | | | | | | | | | 1,450,000 | | | | 4,557,189 | |
| | | | |
Osisko Gold Royalties Limited (Materials, Metals & Mining) | | | | | | | | | | | 246,700 | | | | 2,770,956 | |
| | | | |
Pan American Silver Corporation (Materials, Metals & Mining) | | | | | | | | | | | 160,000 | | | | 2,120,000 | |
| | | | |
Pretium Resources Incorporated (Materials, Metals & Mining) † | | | | | | | | | | | 175,000 | | | | 1,495,491 | |
| | | | |
Semafo Incorporated (Materials, Metals & Mining) † | | | | | | | | | | | 2,660,400 | | | | 7,385,853 | |
| | | | |
SSR Mining Incorporated (Materials, Metals & Mining) † | | | | | | | | | | | 500,000 | | | | 6,330,000 | |
| | | | |
Torex Gold Resources Incorporated (Materials, Metals & Mining) † | | | | | | | | | | | 160,000 | | | | 2,013,844 | |
| | | | |
Torex Gold Resources Incorporated-Legend Shares (Materials, Metals & Mining) 144A | | | | | | | | | | | 185,000 | | | | 2,328,507 | |
| | | | |
Torex Gold Resources Incorporated-Legend Shares (Materials, Metals & Mining) | | | | | | | | | | | 266,250 | | | | 3,351,162 | |
| | | | |
Wheaton Precious Metals Corporation (Materials, Metals & Mining) | | | | | | | | | | | 12,950 | | | | 308,257 | |
| | | | |
Wheaton Precious MetalsCorporation-U.S. Exchange Traded Shares (Materials, Metals & Mining) | | | | | | | | | | | 525,000 | | | | 12,505,500 | |
| | | | |
Yamana Gold Incorporated (Materials, Metals & Mining) | | | | | | | | | | | 700,000 | | | | 1,822,876 | |
| | | | |
| | | | | | | | | | | | | | | 184,437,109 | |
| | | | | | | | | | | | | | | | |
|
| Peru: 0.77% | |
| | | | |
Compania de Minas Buenaventura SA ADR (Materials, Metals & Mining) | | | | | | | | | | | 125,000 | | | | 2,160,000 | |
| | | | | | | | | | | | | | | | |
|
| South Africa: 1.00% | |
| | | | |
AngloGold Ashanti Limited ADR (Materials, Metals & Mining) | | | | | | | | | | | 215,591 | | | | 2,824,242 | |
| | | | | | | | | | | | | | | | |
|
| United Kingdom: 3.23% | |
| | | | |
Fresnillo plc (Materials, Metals & Mining) | | | | | | | | | | | 800,000 | | | | 9,073,385 | |
| | | | | | | | | | | | | | | | |
The accompanying notes are an integral part of these financial statements.
| | | | |
| 12 | | Wells Fargo Precious Metals Fund | | Consolidated portfolio of investments—March 31, 2019 |
| | | | | | | | | | | | | | | | |
| Security name | | | | | | | | Shares | | | Value | |
|
| United States: 13.11% | |
| | | | |
Newmont Mining Corporation (Materials, Metals & Mining) | | | | | | | | | | | 577,455 | | | $ | 20,655,565 | |
| | | | |
Royal Gold Incorporated (Materials, Metals & Mining) | | | | | | | | | | | 178,436 | | | | 16,225,186 | |
| | | | |
| | | | | | | | | | | | | | | 36,880,751 | |
| | | | | | | | | | | | | | | | |
| |
Total Common Stocks (Cost $185,181,486) | | | | 265,738,188 | |
| | | | | |
| | | | |
| | | | | | | | | Troy ounces | | | | |
| Commodities: 4.45% | | | | | | | | | | | | | | | | |
| | | | |
Gold Bullion †** | | | | | | | | | | | 5,352 | | | | 12,522,932 | |
| | | | | | | | | | | | | | | | |
| | | | |
Total Commodities (Cost $5,772,407) | | | | | | | | | | | | | | | 12,522,932 | |
| | | | | | | | | | | | | | | | |
| | | | |
| | | Yield | | | | | | Shares | | | | |
| Short-Term Investments: 1.19% | | | | | | | | | | | | | | | | |
| | | | |
| Investment Companies: 1.19% | | | | | | | | | | | | | | | | |
| | | | |
Wells Fargo Government Money Market Fund Select Class (l)(u) | | | 2.38 | % | | | | | | | 3,331,397 | | | | 3,331,397 | |
| | | | | | | | | | | | | | | | |
| | | | |
Total Short-Term Investments (Cost $3,331,397) | | | | | | | | | | | | | | | 3,331,397 | |
| | | | | | | | | | | | | | | | |
| | | | | | | | |
| Total investments (Cost $194,285,290) | | | 100.11 | % | | | 281,592,517 | |
| | |
Other assets and liabilities, net | | | (0.11 | ) | | | (308,088 | ) |
| | | | | | | | |
| Total net assets | | | 100.00 | % | | $ | 281,284,429 | |
| | | | | | | | |
| † | Non-income-earning security |
| 144A | The security may be resold in transactions exempt from registration, normally to qualified institutional buyers, pursuant to Rule 144A under the Securities Act of 1933. |
| ** | Represents an investment held in Special Investments (Cayman) SPC, the consolidated entity. |
| (l) | The issuer of the security is an affiliated person of the Fund as defined in the Investment Company Act of 1940. |
| (u) | The rate represents the7-day annualized yield at period end. |
Investments in Affiliates
An affiliated investment is an investment in which the Fund owns at least 5% of the outstanding voting shares of the issuer or as a result of other relationships, such as the Fund and the issuer having the same investment manager. Transactions with issuers that were either affiliated persons of the Fund at the beginning of the period or the end of the period were as follows:
| | | | | | | | | | | | | | | | | | | | | | | | | | | | | | | | | | | | |
| | | Shares,
beginning of
period | | | Shares
purchased | | | Shares
sold | | | Shares,
end of
period | | | Net
realized
gains
(losses) | | | Net
change in
unrealized
gains
(losses) | | | Income
from
affiliated
securities | | | Value,
end
of period | | | % of
net
assets | |
Short-Term Investments | | | | | | | | | | | | | | | | | | | | | | | | | | | | | | | | | | | | |
Investment Companies | | | | | | | | | | | | | | | | | | | | | | | | | | | | | | | | | | | | |
Wells Fargo Government Money Market Fund Select Class | | | 4,941,346 | | | | 80,329,061 | | | | 81,939,010 | | | | 3,331,397 | | | $ | 0 | | | $ | 0 | | | $ | 87,990 | | | $ | 3,331,397 | | | | 1.19 | % |
The accompanying notes are an integral part of these financial statements.
| | | | | | |
| Consolidated statement of assets and liabilities—March 31, 2019 | | Wells Fargo Precious Metals Fund | | | 13 | |
| | | | |
| | | | |
| |
Assets | | | | |
Investments in unaffiliated securities, at value (cost $185,181,486) | | $ | 265,738,188 | |
Investments in commodities, at value (cost $5,772,407) | | | 12,522,932 | |
Investments in affiliated securities, at value (cost $3,331,397) | | | 3,331,397 | |
Cash | | | 28,311 | |
Foreign currency, at value (cost $642,186) | | | 642,853 | |
Receivable for investments sold | | | 1,369 | |
Receivable for Fund shares sold | | | 489,829 | |
Receivable for dividends | | | 104,942 | |
Prepaid expenses and other assets | | | 50,609 | |
| | | | |
Total assets | | | 282,910,430 | |
| | | | |
| |
Liabilities | | | | |
Payable for Fund shares redeemed | | | 1,166,274 | |
Management fee payable | | | 126,266 | |
Administration fees payable | | | 43,423 | |
Distribution fee payable | | | 9,677 | |
Trustees’ fees and expenses payable | | | 1,943 | |
Accrued expenses and other liabilities | | | 278,418 | |
| | | | |
Total liabilities | | | 1,626,001 | |
| | | | |
Total net assets | | $ | 281,284,429 | |
| | | | |
| |
NET ASSETS CONSIST OF | | | | |
Paid-in capital | | $ | 392,405,441 | |
Total distributable loss | | | (111,121,012 | ) |
| | | | |
Total net assets | | $ | 281,284,429 | |
| | | | |
| |
COMPUTATION OF NET ASSET VALUE AND OFFERING PRICE PER SHARE | | | | |
Net assets – Class A | | $ | 162,859,665 | |
Shares outstanding – Class A1 | | | 4,797,891 | |
Net asset value per share – Class A | | | $33.94 | |
Maximum offering price per share – Class A2 | | | $36.01 | |
Net assets – Class C | | $ | 14,907,629 | |
Shares outstanding – Class C1 | | | 498,981 | |
Net asset value per share – Class C | | | $29.88 | |
Net assets – Administrator Class | | $ | 8,085,717 | |
Shares outstanding – Administrator Class1 | | | 235,832 | |
Net asset value per share – Administrator Class | | | $34.29 | |
Net assets – Institutional Class | | $ | 95,431,418 | |
Shares outstanding – Institutional Class1 | | | 2,760,746 | |
Net asset value per share – Institutional Class | | | $34.57 | |
| 1 | The Fund has an unlimited number of authorized shares. |
| 2 | Maximum offering price is computed as 100/94.25 of net asset value. On investments of $50,000 or more, the offering price is reduced. |
The accompanying notes are an integral part of these financial statements.
| | | | |
| 14 | | Wells Fargo Precious Metals Fund | | Consolidated statement of operations—year ended March 31, 2019 |
| | | | |
| | | | |
| |
Investment income | | | | |
Dividends (net of foreign withholding taxes of $144,223) | | $ | 2,671,723 | |
Income of affiliated securities | | | 87,990 | |
| | | | |
Total investment income | | | 2,759,713 | |
| | | | |
| |
Expenses | | | | |
Management fee | | | 1,821,506 | |
Administration fees | |
Class A | | | 328,820 | |
Class C | | | 54,450 | |
Administrator Class | | | 11,071 | |
Institutional Class | | | 115,968 | |
Shareholder servicing fees | |
Class A | | | 391,452 | |
Class C | | | 64,822 | |
Administrator Class | | | 21,289 | |
Distribution fee | |
Class C | | | 194,466 | |
Custody and accounting fees | | | 47,968 | |
Professional fees | | | 65,435 | |
Registration fees | | | 70,721 | |
Shareholder report expenses | | | 77,123 | |
Trustees’ fees and expenses | | | 22,579 | |
Transfer agent fees | | | 7,733 | |
Other fees and expenses | | | 23,294 | |
| | | | |
Total expenses | | | 3,318,697 | |
Less: Fee waivers and/or expense reimbursements | | | (344,379 | ) |
| | | | |
Net expenses | | | 2,974,318 | |
| | | | |
Net investment loss | | | (214,605 | ) |
| | | | |
| |
REALIZED AND UNREALIZED GAINS (LOSSES) ON INVESTMENTS | | | | |
| |
Net realized losses on investments | | | (7,313,853 | ) |
|
Net change in unrealized gains (losses) on: | |
Unaffiliated securities | | | 15,057,413 | |
Commodities | | | (331,112 | ) |
| | | | |
Net change in unrealized gains (losses) on investments | | | 14,726,301 | |
| | | | |
Net realized and unrealized gains (losses) on investments | | | 7,412,448 | |
| | | | |
Net increase in net assets resulting from operations | | $ | 7,197,843 | |
| | | | |
The accompanying notes are an integral part of these financial statements.
| | | | | | |
| Consolidated statement of changes in net assets | | Wells Fargo Precious Metals Fund | | | 15 | |
| | | | | | | | | | | | | | | | |
| | | Year ended
March 31, 2019 | | | Year ended
March 31, 20181 | |
| |
Operations | | | | | |
Net investment loss | | | | | | $ | (214,605 | ) | | | | | | $ | (1,185,623 | ) |
Net realized losses on investments | | | | | | | (7,313,853 | ) | | | | | | | (589,728 | ) |
Net change in unrealized gains (losses) on investments | | | | | | | 14,726,301 | | | | | | | | (24,177,396 | ) |
| | | | |
Net increase (decrease) in net assets resulting from operations | | | | | | | 7,197,843 | | | | | | | | (25,952,747 | ) |
| | | | |
| |
Distributions to shareholders from net investment income and net realized gains | | | | | |
Class A | | | | | | | 0 | | | | | | | | (2,808,058 | ) |
Class C | | | | | | | 0 | | | | | | | | (414,068 | ) |
Administrator Class | | | | | | | 0 | | | | | | | | (169,120 | ) |
Institutional Class | | | | | | | 0 | | | | | | | | (1,238,811 | ) |
| | | | |
Total distributions to shareholders | | | | | | | 0 | | | | | | | | (4,630,057 | ) |
| | | | |
| | | | |
Capital share transactions | | | Shares | | | | | | | | Shares | | | | | |
Proceeds from shares sold | |
Class A | | | 1,198,292 | | | | 37,973,472 | | | | 1,343,343 | | | | 47,874,671 | |
Class C | | | 42,566 | | | | 1,175,460 | | | | 71,931 | | | | 2,255,869 | |
Administrator Class | | | 22,524 | | | | 739,042 | | | | 312,074 | | | | 11,409,031 | |
Institutional Class | | | 1,646,466 | | | | 53,786,635 | | | | 1,240,353 | | | | 44,707,060 | |
| | | | |
| | | | | | | 93,674,609 | | | | | | | | 106,246,631 | |
| | | | |
Reinvestment of distributions | |
Class A | | | 0 | | | | 0 | | | | 76,499 | | | | 2,579,538 | |
Class C | | | 0 | | | | 0 | | | | 12,259 | | | | 367,387 | |
Administrator Class | | | 0 | | | | 0 | | | | 4,880 | | | | 165,920 | |
Institutional Class | | | 0 | | | | 0 | | | | 34,049 | | | | 1,164,824 | |
| | | | |
| | | | | | | 0 | | | | | | | | 4,277,669 | |
| | | | |
Payment for shares redeemed | |
Class A | | | (1,822,759 | ) | | | (56,867,045 | ) | | | (2,732,751 | ) | | | (97,070,775 | ) |
Class B | | | N/A | | | | N/A | | | | (9,235 | )2 | | | (291,832 | )2 |
Class C | | | (678,903 | ) | | | (19,431,951 | ) | | | (467,766 | ) | | | (14,797,679 | ) |
Administrator Class | | | (63,191 | ) | | | (2,054,168 | ) | | | (463,024 | ) | | | (16,820,569 | ) |
Institutional Class | | | (1,367,558 | ) | | | (43,913,813 | ) | | | (1,251,776 | ) | | | (44,720,355 | ) |
| | | | |
| | | | | | | (122,266,977 | ) | | | | | | | (173,701,210 | ) |
| | | | |
Net decrease in net assets resulting from capital share transactions | | | | | | | (28,592,368 | ) | | | | | | | (63,176,910 | ) |
| | | | |
Total decrease in net assets | | | | | | | (21,394,525 | ) | | | | | | | (93,759,714 | ) |
| | | | |
| | |
Net assets | | | | | | | | |
Beginning of period | | | | | | | 302,678,954 | | | | | | | | 396,438,668 | |
| | | | |
End of period | | | | | | $ | 281,284,429 | | | | | | | $ | 302,678,954 | |
| | | | |
| 1 | Effective for all filings after November 4, 2018, the SEC prospectively eliminated the requirement to parenthetically disclose undistributed net investment income at the end of the period and to disaggregate distributions to shareholders between distributions from net investment income and distributions from realized gains. Accumulated net investment loss at March 31, 2018 was $12,736. The disaggregated distributions information for the year ended March 31, 2018 is included in Note 8,Distributions to Shareholders, in the notes to the financial statements. |
| 2 | For the period from April 1, 2017 to May 5, 2017. Effective at the close of business on May 5, 2017, Class B shares were converted to Class A shares and are no longer offered by the Fund. |
The accompanying notes are an integral part of these financial statements.
| | | | |
| 16 | | Wells Fargo Precious Metals Fund | | Consolidated financial highlights |
(For a share outstanding throughout each period)
| | | | | | | | | | | | | | | | | | | | |
| | | Year ended March 31 | |
| CLASS A | | 2019 | | | 2018 | | | 2017 | | | 2016 | | | 2015 | |
Net asset value, beginning of period | | | $32.80 | | | | $35.99 | | | | $32.73 | | | | $28.99 | | | | $36.65 | |
Net investment loss | | | (0.03 | )1 | | | (0.11 | )1 | | | (0.22 | )1 | | | (0.05 | ) | | | (0.11 | )1 |
Net realized and unrealized gains (losses) on investments | | | 1.17 | | | | (2.60 | ) | | | 3.85 | | | | 3.79 | | | | (7.55 | ) |
| | | | | | | | | | | | | | | | | | | | |
Total from investment operations | | | 1.14 | | | | (2.71 | ) | | | 3.63 | | | | 3.74 | | | | (7.66 | ) |
Distributions to shareholders from net investment income | | | 0.00 | | | | (0.48 | ) | | | (0.37 | ) | | | 0.00 | | | | 0.00 | |
Net asset value, end of period | | | $33.94 | | | | $32.80 | | | | $35.99 | | | | $32.73 | | | | $28.99 | |
Total return2 | | | 3.48 | % | | | (7.56 | )% | | | 11.24 | % | | | 12.90 | % | | | (20.90 | )% |
Ratios to average net assets (annualized) | | | | | | | | | | | | | | | | | | | | |
Gross expenses | | | 1.22 | % | | | 1.21 | % | | | 1.20 | % | | | 1.23 | % | | | 1.23 | % |
Net expenses | | | 1.09 | % | | | 1.04 | % | | | 1.09 | % | | | 1.10 | % | | | 1.10 | % |
Net investment loss | | | (0.11 | )% | | | (0.32 | )% | | | (0.57 | )% | | | (0.24 | )% | | | (0.30 | )% |
Supplemental data | | | | | | | | | | | | | | | | | | | | |
Portfolio turnover rate3 | | | 19 | % | | | 27 | % | | | 21 | % | | | 18 | % | | | 9 | % |
Net assets, end of period (000s omitted) | | | $162,860 | | | | $177,859 | | | | $242,423 | | | | $236,310 | | | | $211,477 | |
| 1 | Calculated based upon average shares outstanding |
| 2 | Total return calculations do not include any sales charges. |
| 3 | Portfolio turnover rate includes the purchases and sales transactions of its wholly-owned subsidiary. |
The accompanying notes are an integral part of these financial statements.
| | | | | | |
| Consolidated financial highlights | | Wells Fargo Precious Metals Fund | | | 17 | |
(For a share outstanding throughout each period)
| | | | | | | | | | | | | | | | | | | | |
| | | Year ended March 31 | |
| CLASS C | | 2019 | | | 2018 | | | 2017 | | | 2016 | | | 2015 | |
Net asset value, beginning of period | | | $29.09 | | | | $32.07 | | | | $29.10 | | | | $25.97 | | | | $33.08 | |
Net investment loss | | | (0.24 | )1 | | | (0.33 | )1 | | | (0.46 | )1 | | | (0.24 | )1 | | | (0.35 | )1 |
Net realized and unrealized gains (losses) on investments | | | 1.03 | | | | (2.30 | ) | | | 3.49 | | | | 3.37 | | | | (6.76 | ) |
| | | | | | | | | | | | | | | | | | | | |
Total from investment operations | | | 0.79 | | | | (2.63 | ) | | | 3.03 | | | | 3.13 | | | | (7.11 | ) |
Distributions to shareholders from net investment income | | | 0.00 | | | | (0.35 | ) | | | (0.06 | ) | | | 0.00 | | | | 0.00 | |
Net asset value, end of period | | | $29.88 | | | | $29.09 | | | | $32.07 | | | | $29.10 | | | | $25.97 | |
Total return2 | | | 2.72 | % | | | (8.24 | )% | | | 10.42 | % | | | 12.05 | % | | | (21.49 | )% |
Ratios to average net assets (annualized) | | | | | | | | | | | | | | | | | | | | |
Gross expenses | | | 1.97 | % | | | 1.96 | % | | | 1.95 | % | | | 1.99 | % | | | 1.98 | % |
Net expenses | | | 1.84 | % | | | 1.79 | % | | | 1.84 | % | | | 1.85 | % | | | 1.85 | % |
Net investment loss | | | (0.88 | )% | | | (1.07 | )% | | | (1.32 | )% | | | (0.99 | )% | | | (1.06 | )% |
Supplemental data | | | | | | | | | | | | | | | | | | | | |
Portfolio turnover rate3 | | | 19 | % | | | 27 | % | | | 21 | % | | | 18 | % | | | 9 | % |
Net assets, end of period (000s omitted) | | | $14,908 | | | | $33,022 | | | | $48,710 | | | | $52,648 | | | | $59,074 | |
| 1 | Calculated based upon average shares outstanding |
| 2 | Total return calculations do not include any sales charges. |
| 3 | Portfolio turnover rate includes the purchases and sales transactions of its wholly-owned subsidiary. |
The accompanying notes are an integral part of these financial statements.
| | | | |
| 18 | | Wells Fargo Precious Metals Fund | | Consolidated financial highlights |
(For a share outstanding throughout each period)
| | | | | | | | | | | | | | | | | | | | |
| | | Year ended March 31 | |
| ADMINISTRATOR CLASS | | 2019 | | | 2018 | | | 2017 | | | 2016 | | | 2015 | |
Net asset value, beginning of period | | | $33.09 | | | | $36.27 | | | | $32.98 | | | | $29.17 | | | | $36.82 | |
Net investment income (loss) | | | 0.01 | 1 | | | (0.09 | )1 | | | (0.17 | )1 | | | (0.03 | )1 | | | (0.06 | )1 |
Net realized and unrealized gains (losses) on investments | | | 1.19 | | | | (2.59 | ) | | | 3.87 | | | | 3.84 | | | | (7.59 | ) |
| | | | | | | | | | | | | | | | | | | | |
Total from investment operations | | | 1.20 | | | | (2.68 | ) | | | 3.70 | | | | 3.81 | | | | (7.65 | ) |
Distributions to shareholders from net investment income | | | 0.00 | | | | (0.50 | ) | | | (0.41 | ) | | | 0.00 | | | | 0.00 | |
Net asset value, end of period | | | $34.29 | | | | $33.09 | | | | $36.27 | | | | $32.98 | | | | $29.17 | |
Total return | | | 3.63 | % | | | (7.40 | )% | | | 11.37 | % | | | 13.06 | % | | | (20.78 | )% |
Ratios to average net assets (annualized) | | | | | | | | | | | | | | | | | | | | |
Gross expenses | | | 1.14 | % | | | 1.15 | % | | | 1.12 | % | | | 1.13 | % | | | 1.07 | % |
Net expenses | | | 0.95 | % | | | 0.91 | % | | | 0.95 | % | | | 0.96 | % | | | 0.96 | % |
Net investment income (loss) | | | 0.04 | % | | | (0.25 | )% | | | (0.44 | )% | | | (0.10 | )% | | | (0.17 | )% |
Supplemental data | | | | | | | | | | | | | | | | | | | | |
Portfolio turnover rate2 | | | 19 | % | | | 27 | % | | | 21 | % | | | 18 | % | | | 9 | % |
Net assets, end of period (000s omitted) | | | $8,086 | | | | $9,148 | | | | $15,325 | | | | $16,114 | | | | $21,917 | |
| 1 | Calculated based upon average shares outstanding |
| 2 | Portfolio turnover rate includes the purchases and sales transactions of its wholly-owned subsidiary. |
The accompanying notes are an integral part of these financial statements.
| | | | | | |
| Consolidated financial highlights | | Wells Fargo Precious Metals Fund | | | 19 | |
(For a share outstanding throughout each period)
| | | | | | | | | | | | | | | | | | | | |
| | | Year ended March 31 | |
| INSTITUTIONAL CLASS | | 2019 | | | 2018 | | | 2017 | | | 2016 | | | 2015 | |
Net asset value, beginning of period | | | $33.30 | | | | $36.47 | | | | $33.21 | | | | $29.33 | | | | $36.96 | |
Net investment income (loss) | | | 0.04 | | | | 0.02 | | | | (0.09 | )1 | | | 0.02 | 1 | | | 0.01 | 1 |
Net realized and unrealized gains (losses) on investments | | | 1.23 | | | | (2.67 | ) | | | 3.85 | | | | 3.86 | | | | (7.64 | ) |
| | | | | | | | | | | | | | | | | | | | |
Total from investment operations | | | 1.27 | | | | (2.65 | ) | | | 3.76 | | | | 3.88 | | | | (7.63 | ) |
Distributions to shareholders from net investment income | | | 0.00 | | | | (0.52 | ) | | | (0.50 | ) | | | 0.00 | | | | 0.00 | |
Net asset value, end of period | | | $34.57 | | | | $33.30 | | | | $36.47 | | | | $33.21 | | | | $29.33 | |
Total return | | | 3.81 | % | | | (7.27 | )% | | | 11.49 | % | | | 13.23 | % | | | (20.64 | )% |
Ratios to average net assets (annualized) | | | | | | | | | | | | | | | | | | | | |
Gross expenses | | | 0.89 | % | | | 0.88 | % | | | 0.88 | % | | | 0.88 | % | | | 0.80 | % |
Net expenses | | | 0.79 | % | | | 0.73 | % | | | 0.79 | % | | | 0.80 | % | | | 0.79 | % |
Net investment income (loss) | | | 0.21 | % | | | 0.01 | % | | | (0.24 | )% | | | 0.06 | % | | | 0.03 | % |
Supplemental data | | | | | | | | | | | | | | | | | | | | |
Portfolio turnover rate2 | | | 19 | % | | | 27 | % | | | 21 | % | | | 18 | % | | | 9 | % |
Net assets, end of period (000s omitted) | | | $95,431 | | | | $82,650 | | | | $89,680 | | | | $60,156 | | | | $43,014 | |
| 1 | Calculated based upon average shares outstanding. |
| 2 | Portfolio turnover rate includes the purchases and sales transactions of its wholly-owned subsidiary. |
The accompanying notes are an integral part of these financial statements.
| | | | |
| 20 | | Wells Fargo Precious Metals Fund | | Notes to consolidated financial statements |
1. ORGANIZATION
Wells Fargo Funds Trust (the “Trust”), a Delaware statutory trust organized on March 10, 1999, is anopen-end management investment company registered under the Investment Company Act of 1940, as amended (the “1940 Act”). As an investment company, the Trust follows the accounting and reporting guidance in Financial Accounting Standards Board(“FASB”)Accounting Standards Codification Topic 946, Financial Services – Investment Companies. These financial statements report on the Wells Fargo Precious Metals Fund (the “Fund”) which is anon-diversified series of the Trust.
Effective at the close of business on May 5, 2017, Class B shares were converted to Class A shares and are no longer offered by the Fund. Information for Class B shares reflected in the financial statements represents activity through May 5, 2017.
2. INVESTMENT IN SUBSIDIARY
The Fund invests in precious metals and minerals through Special Investments (Cayman) SPC (the “Subsidiary”), a wholly-owned subsidiary incorporated on May 3, 2005 under the laws of the Cayman Islands as an exempted segregated portfolio company with limited liability. As of March 31, 2019, the Subsidiary held $12,522,932 in gold bullion representing 99.59% of its net assets. The Fund is the sole shareholder of the Subsidiary. As of March 31, 2019, the Fund held $12,471,591 in the Subsidiary, representing 4.43% of the Fund’s net assets prior to consolidation.
The consolidated financial statements of the Fund include the financial results of its wholly-owned subsidiary. The Consolidated Portfolio of Investments includes positions of the Fund and the Subsidiary and the consolidated financial statements include the accounts of the Fund and the Subsidiary. Accordingly, all interfund balances and transactions between the Fund and the Subsidiary have been eliminated in consolidation.
3. SIGNIFICANT ACCOUNTING POLICIES
The following significant accounting policies, which are consistently followed in the preparation of the consolidated financial statements of the Fund, are in conformity with U.S. generally accepted accounting principles which require management to make estimates and assumptions that affect the reported amounts of assets and liabilities, disclosure of contingent assets and liabilities at the date of the financial statements, and the reported amounts of revenues and expenses during the reporting period. Actual results could differ from those estimates.
Securities valuation
All investments are valued each business day as of the close of regular trading on the New York Stock Exchange (generally 4 p.m. Eastern Time), although the Fund may deviate from this calculation time under unusual or unexpected circumstances.
Equity securities that are listed on a foreign or domestic exchange or market are valued at the official closing price or, if none, the last sales price. If no sale occurs on the principal exchange or market that day, a fair value price will be determined in accordance with the Fund’s Valuation Procedures.
Investments in commodities are valued at their last traded price.
The values of securities denominated in foreign currencies are translated into U.S. dollars at rates provided by an independent foreign currency pricing source at a time each business day specified by the Wells Fargo Asset Management Pricing Committee at Wells Fargo Funds Management, LLC (“Funds Management”)
Many securities markets and exchanges outside the U.S. close prior to the close of the New York Stock Exchange and therefore may not fully reflect trading or events that occur after the close of the principal exchange in which the foreign securities are traded, but before the close of the New York Stock Exchange. If such trading or events are expected to materially affect the value of such securities, then fair value pricing procedures approved by the Board of Trustees of the Fund are applied. These procedures take into account multiple factors including movements in U.S. securities markets after foreign exchanges close. Foreign securities that are fair valued under these procedures are categorized as Level 2 and the application of these procedures may result in transfers between Level 1 and Level 2. Depending on market activity, such fair valuations may be frequent. Such fair value pricing may result in net asset values that are higher or lower than net asset values based on the last reported sales price or latest quoted bid price. On March 31, 2019, such fair value pricing was not used in pricing foreign securities.
Investments in registeredopen-end investment companies are valued at net asset value.
Investments which are not valued using any of the methods discussed above are valued at their fair value, as determined in good faith by the Board of Trustees. The Board of Trustees has established a Valuation Committee comprised of the
| | | | | | |
| Notes to consolidated financial statements | | Wells Fargo Precious Metals Fund | | | 21 | |
Trustees and has delegated to it the authority to take any actions regarding the valuation of portfolio securities that the Valuation Committee deems necessary or appropriate, including determining the fair value of portfolio securities, unless the determination has been delegated to the Wells Fargo Asset Management Pricing Committee.The Board of Trustees retains the authority to make or ratify any valuation decisions or approve any changes to the Valuation Procedures as it deems appropriate. On a quarterly basis, the Board of Trustees receives reports on any valuation actions taken by the Valuation Committee or the Wells Fargo Asset Management Pricing Committee which may include items for ratification.
Foreign currency translation
The accounting records of the Fund are maintained in U.S. dollars. The values of other assets and liabilities denominated in foreign currencies are translated into U.S. dollars at rates provided by an independent foreign currency pricing source at a time each business day specified by the Wells Fargo Asset Management Pricing Committee. Purchases and sales of securities, and income and expenses are converted at the rate of exchange on the respective dates of such transactions. Net realized foreign exchange gains or losses arise from sales of foreign currencies, currency gains or losses realized between the trade and settlement dates on securities transactions, and the difference between the amounts of dividends, interest and foreign withholding taxes recorded and the U.S. dollar equivalent of the amounts actually paid or received. Net unrealized foreign exchange gains and losses arise from changes in the fair value of assets and liabilities other than investments in securities resulting from changes in exchange rates. The changes in net assets arising from changes in exchange rates of securities and the changes in net assets resulting from changes in market prices of securities are not separately presented. Such changes are included in net realized and unrealized gains or losses from investments.
Security transactions and income recognition
Securities transactions and commodities are recorded on a trade date basis. Realized gains or losses are recorded on the basis of identified cost.
Dividend income is recognized on theex-dividend date, except for certain dividends from foreign securities, which are recorded as soon as the custodian verifies theex-dividend date. Dividend income from foreign securities is recorded net of foreign taxes withheld where recovery of such taxes is not assured.
Distributions to shareholders
Distributions to shareholders from net investment income and any net realized gains are recorded on theex-dividend date and paid at least annually. Such distributions are determined in accordance with income tax regulations and may differ from U.S. generally accepted accounting principles. Dividend sources are estimated at the time of declaration. The tax character of distributions is determined as of the Fund’s fiscal year end. Therefore, a portion of the Fund’s distributions made prior to the Fund’s fiscal year end may be categorized as a tax return of capital at year end.
Federal and other taxes
The Fund intends to continue to qualify as a regulated investment company by distributing substantially all of its investment company taxable income and any net realized capital gains (after reduction for capital loss carryforwards) sufficient to relieve it from all, or substantially all, federal income taxes. Accordingly, no provision for federal income taxes was required.
The Subsidiary is classified as a controlled foreign corporation under Subchapter N of the Internal Revenue Code. Therefore, the Fund is required to increase its taxable income by its share of the Subsidiary’s income. Net investment losses of the Subsidiary cannot be deducted by the Fund in the current period nor carried forward to offset taxable income in future periods.
The Fund’s income and federal excise tax returns and all financial records supporting those returns for the prior three fiscal years are subject to examination by the federal and Delaware revenue authorities. Management has analyzed the Fund’s tax positions taken on federal, state, and foreign tax returns for all open tax years and does not believe that there are any uncertain tax positions that require recognition of a tax liability.
As of March 31, 2019, the aggregate cost of all investments for federal income tax purposes was $205,447,674 and the unrealized gains (losses) consisted of:
| | | | |
| |
Gross unrealized gains | | $ | 95,510,022 | |
| |
Gross unrealized losses | | | (19,365,179 | ) |
| |
Net unrealized gains | | $ | 76,144,843 | |
Reclassifications are made to the Fund’s capital accounts for permanent tax differences to reflect income and gains available for distribution (or available capital loss carryforwards) under federal income tax regulations. U.S. generally accepted accounting
| | | | |
| 22 | | Wells Fargo Precious Metals Fund | | Notes to consolidated financial statements |
principles require that certain components of net assets be adjusted to reflect permanent differences between financial and tax reporting. These reclassifications have no effect on net assets or net asset values per share. At March 31, 2019, as a result of permanentbook-to-tax differences, the following reclassification adjustments were made on the Statement of Assets and Liabilities:
| | |
| Paid-in capital | | Total distributable
loss |
| |
| $(4,866) | | $4,866 |
As of March 31, 2019, the Fund had capital loss carryforwards which consist of $29,456,427 in short-term capital losses and $158,488,084 in long-term capital losses.
Class allocations
The separate classes of shares offered by the Fund differ principally in applicable sales charges, distribution, shareholder servicing, and administration fees. Class specific expenses are charged directly to that share class. Investment income, common expenses, and realized and unrealized gains (losses) on investments are allocated daily to each class of shares based on the relative proportion of net assets of each class.
4. FAIR VALUATION MEASUREMENTS
Fair value measurements of investments are determined within a framework that has established a fair value hierarchy based upon the various data inputs utilized in determining the value of the Fund’s investments. The three-level hierarchy gives the highest priority to unadjusted quoted prices in active markets for identical assets or liabilities (Level 1) and the lowest priority to unobservable inputs (Level 3). The Fund’s investments are classified within the fair value hierarchy based on the lowest level of input that is significant to the fair value measurement. The inputs are summarized into three broad levels as follows:
| ∎ | | Level 1 – quoted prices in active markets for identical securities |
| ∎ | | Level 2 – other significant observable inputs (including quoted prices for similar securities, interest rates, prepayment speeds, credit risk, etc.) |
| ∎ | | Level 3 – significant unobservable inputs (including the Fund’s own assumptions in determining the fair value of investments) |
The inputs or methodologies used for valuing investments in securities are not necessarily an indication of the risk associated with investing in those securities.
The following is a summary of the inputs used in valuing the Fund’s assets and liabilities as of March 31, 2019:
| | | | | | | | | | | | | | | | |
| | | | |
| | | Quoted prices
(Level 1) | | | Other significant
observable inputs
(Level 2) | | | Significant
unobservable inputs
(Level 3) | | | Total | |
| | | | |
Assets | | | | | | | | | | | | | | | | |
Investments in: | | | | | | | | | | | | | | | | |
| | | | |
Common stocks | | | | | | | | | | | | | | | | |
| | | | |
Australia | | $ | 30,362,701 | | | $ | 0 | | | $ | 0 | | | $ | 30,362,701 | |
| | | | |
Canada | | | 157,842,895 | | | | 26,594,214 | | | | 0 | | | | 184,437,109 | |
| | | | |
Peru | | | 2,160,000 | | | | 0 | | | | 0 | | | | 2,160,000 | |
| | | | |
South Africa | | | 2,824,242 | | | | 0 | | | | 0 | | | | 2,824,242 | |
| | | | |
United Kingdom | | | 9,073,385 | | | | 0 | | | | 0 | | | | 9,073,385 | |
| | | | |
United States | | | 36,880,751 | | | | 0 | | | | 0 | | | | 36,880,751 | |
| | | | |
Commodities | | | 12,522,932 | | | | 0 | | | | 0 | | | | 12,522,932 | |
| | | | |
Short-term investments | | | | | | | | | | | | | | | | |
| | | | |
Investment companies | | | 3,331,397 | | | | 0 | | | | 0 | | | | 3,331,397 | |
| | | | |
Total assets | | $ | 254,998,303 | | | $ | 26,594,214 | | | $ | 0 | | | $ | 281,592,517 | |
Additional sector, industry or geographic detail is included in the Portfolio of Investments.
At March 31, 2019 the Fund did not have any transfers into/out of Level 3.
| | | | | | |
| Notes to consolidated financial statements | | Wells Fargo Precious Metals Fund | | | 23 | |
5. TRANSACTIONS WITH AFFILIATES
Management fee
Funds Management, an indirect wholly owned subsidiary of Wells Fargo & Company (“Wells Fargo”), is the manager of the Fund and provides advisory and fund-level administrative services under an investment management agreement. Under the investment management agreement, Funds Management is responsible for, among other services, implementing the investment objectives and strategies of the Fund, supervising the subadviser and providing fund-level administrative services in connection with the Fund’s operations. As compensation for its services under the investment management agreement, Funds Management is entitled to receive a management fee at the following annual rate based on the Fund’s average daily net assets:
| | | | |
| Average daily net assets | | Annual fee rate | |
| |
First $500 million | | | 0.650 | % |
| |
Next $500 million | | | 0.600 | |
| |
Next $1 billion | | | 0.550 | |
| |
Next $2 billion | | | 0.525 | |
| |
Next $1 billion | | | 0.500 | |
| |
Next $5 billion | | | 0.490 | |
| |
Over $10 billion | | | 0.480 | |
For the year ended March 31, 2019, the management fee was equivalent to an annual rate of 0.65% of the Fund’s average daily net assets.
The Subsidiary has entered into a separate advisory contract with Funds Management to manage the investment and reinvestment of its assets in conformity with its investment objectives and restrictions. Under this agreement, the Subsidiary does not pay Funds Management a fee for its services.
Funds Management has retained the services of a subadviser to provide daily portfolio management to the Fund. The fee for subadvisory services is borne by Funds Management. Wells Capital Management Incorporated, an affiliate of Funds Management and an indirect wholly owned subsidiary of Wells Fargo, is the subadviser to the Fund and is entitled to receive a fee from Funds Management at an annual rate starting at 0.40% and declining to 0.30% as the average daily net assets of the Fund increase.
Administration fees
Under a class-level administration agreement, Funds Management provides class-level administrative services to the Fund, which includes paying fees and expenses for services provided by the transfer agent,sub-transfer agents, omnibus account servicers and record-keepers. As compensation for its services under the class-level administration agreement, Funds Management receives an annual fee which is calculated based on the average daily net assets of each class as follows:
| | | | |
| | | Class-level
administration fee | |
| |
Class A, Class C | | | 0.21 | % |
| |
Administrator Class , Institutional Class | | | 0.13 | |
Funds Management has contractually waived and/or reimbursed management and administration fees to the extent necessary to maintain certain net operating expense ratios for the Fund. When each class of the Fund has exceeded its expense cap, Funds Management has waived fees and/or reimbursed expenses from fund level expenses on a proportionate basis and then from class specific expenses. When only certain classes exceed their expense caps, waivers and/or reimbursements are applied against class specific expenses before fund level expenses. Funds Management has committed through July 31, 2019 to waive fees and/or reimburse expenses to the extent necessary to cap the Fund’s expenses at 1.09% for Class A shares, 1.84% for Class C shares, 0.95% for Administrator Class shares, and 0.79% for Institutional Class shares. Prior to or after the commitment expiration date, the cap may be increased or the commitment to maintain the cap may be terminated only with the approval of the Board of Trustees.
Distribution fee
The Trust has adopted a distribution plan for Class C shares of the Fund pursuant to Rule12b-1 under the 1940 Act. A distribution fee is charged to Class C shares and paid to Wells Fargo Funds Distributor, LLC (“Funds Distributor”), the principal underwriter, at an annual rate of 0.75% of the average daily net assets of Class C shares.
| | | | |
| 24 | | Wells Fargo Precious Metals Fund | | Notes to consolidated financial statements |
In addition, Funds Distributor is entitled to receive thefront-end sales charge from the purchase of Class A shares and a contingent deferred sales charge on the redemption of certain Class A shares. Funds Distributor is also entitled to receive the contingent deferred sales charges from redemptions of Class C shares. For the year ended March 31, 2019, Funds Distributor received $3,469 from the sale of Class A shares. No contingent deferred sales charges were incurred by Class A and Class C shares for the year ended March 31, 2019.
Shareholder servicing fees
The Trust has entered into contracts with one or more shareholder servicing agents, whereby Class A, Class C, and Administrator Class of the Fund are charged a fee at an annual rate of 0.25% of the average daily net assets of each respective class. A portion of these total shareholder servicing fees were paid to affiliates of Wells Fargo.
Interfund transactions
The Fund may purchase or sell portfolio investment securities to certain other Wells Fargo affiliates pursuant toRule 17a-7 under the 1940 Act and under procedures adopted by the Board of Trustees. The procedures have been designed to ensure that these interfund transactions, which do not incur broker commissions, are effected at current market prices.
6. INVESTMENT PORTFOLIO TRANSACTIONS
Purchases and sales of investments, excluding U.S. government obligations (if any) and short-term securities, for the year ended March 31, 2019 were $53,125,477 and $78,885,162, respectively. These amounts include purchases and sales transactions of the Subsidiary.
7. BANK BORROWINGS
The Trust (excluding the money market funds), Wells Fargo Master Trust and Wells Fargo Variable Trust are parties to a $280,000,000 revolving credit agreement whereby the Fund is permitted to use bank borrowings for temporary or emergency purposes, such as to fund shareholder redemption requests. Interest under the credit agreement is charged to the Fund based on a borrowing rate equal to the higher of the Federal Funds rate in effect on that day plus 1.25% or the overnight LIBOR rate in effect on that day plus 1.25%. In addition, an annual commitment fee equal to 0.25% of the unused balance is allocated to each participating fund.
For the year ended March 31, 2019, there were no borrowings by the Fund under the agreement.
8. DISTRIBUTIONS TO SHAREHOLDERS
For the year ended March 31, 2019, the Fund did not have any distributions paid to shareholders. The tax character of distributions paid for the year ended March 31, 2018 was $4,630,057 of ordinary income.
As of March 31, 2019, the components of distributable earnings on a tax basis were as follows:
| | | | |
Undistributed
ordinary
income | | Unrealized
gains (losses) | | Capital loss
carryforward |
| | |
| $690,503 | | $76,145,579 | | $(187,944,511) |
Effective for all filings after November 4, 2018, the Securities and Exchange Commission eliminated the requirement to separately state the components of distributions to shareholders under U.S. generally accepted accounting principles. The amounts of distributions to shareholders for the year ended March 31, 2018 were as follows:
| | | | |
| | | Net investment
income | |
| |
Class A | | | $2,808,058 | |
| |
Class C | | | 414,068 | |
| |
Administrator Class | | | 169,120 | |
| |
Institutional Class | | | 1,238,811 | |
9. CONCENTRATION RISK
The Fund invests a substantial portion of its assets in precious metals companies and, therefore, may be more affected by changes in the precious metals sector than a fund whose investments are not heavily weighted in any sector.
| | | | | | |
| Notes to consolidated financial statements | | Wells Fargo Precious Metals Fund | | | 25 | |
10. INDEMNIFICATION
Under the Trust’s organizational documents, the officers and Trustees have been granted certain indemnification rights against certain liabilities that may arise out of performance of their duties to the Trust. Additionally, in the normal course of business, the Trust may enter into contracts with service providers that contain a variety of indemnification clauses. The Trust’s maximum exposure under these arrangements is dependent on future claims that may be made against the Fund and, therefore, cannot be estimated.
11. NEW ACCOUNTING PRONOUNCEMENT
In August 2018, FASB issued Accounting Standards Update (“ASU”)No. 2018-13, Fair Value Measurement (Topic 820)Disclosure Framework – Changes to the Disclosure Requirements for Fair Value Measurement.ASU2018-13 updates the disclosure requirements for fair value measurements by modifying or removing certain disclosures and adding certain new disclosures. The amendments are effective for fiscal years, and interim periods within those fiscal years, beginning after December 15, 2019. Early adoption is permitted. Management has early adopted the removal and modification disclosures, as permitted, and will adopt the additional new disclosures at the effective date.
| | | | |
| 26 | | Wells Fargo Precious Metals Fund | | Report of independent registered public accounting firm |
TO THE SHAREHOLDERS OF THE FUND AND BOARD OF TRUSTEES OF WELLS FARGO FUNDS TRUST:
Opinion on the Financial Statements
We have audited the accompanying consolidated statement of assets and liabilities of Wells Fargo Precious Metals Fund and subsidiary (the Fund), one of the funds constituting Wells Fargo Funds Trust, including the consolidated portfolio of investments, as of March 31, 2019, the related consolidated statement of operations for the year then ended, the consolidated statements of changes in net assets for each of the years in the two-year period then ended, and the related consolidated notes (collectively, the consolidated financial statements) and the consolidated financial highlights for each of the years in the five-year period then ended. In our opinion, the consolidated financial statements and consolidated financial highlights present fairly, in all material respects, the consolidated financial position of the Fund as of March 31, 2019, the results of their operations for the year then ended, the changes in their net assets for each of the years in the two-year period then ended, and the financial highlights for each of the years in the five-year period then ended, in conformity with U.S. generally accepted accounting principles.
Basis for Opinion
These consolidated financial statements and consolidated financial highlights are the responsibility of the Fund’s management. Our responsibility is to express an opinion on these consolidated financial statements and consolidated financial highlights based on our audits. We are a public accounting firm registered with the Public Company Accounting Oversight Board (United States) (PCAOB) and are required to be independent with respect to the Fund in accordance with the U.S. federal securities laws and the applicable rules and regulations of the Securities and Exchange Commission and the PCAOB.
We conducted our audits in accordance with the standards of the PCAOB. Those standards require that we plan and perform the audit to obtain reasonable assurance about whether the consolidated financial statements and consolidated financial highlights are free of material misstatement, whether due to error or fraud. Our audits included performing procedures to assess the risks of material misstatement of the consolidated financial statements and consolidated financial highlights, whether due to error or fraud, and performing procedures that respond to those risks. Such procedures included examining, on a test basis, evidence regarding the amounts and disclosures in the consolidated financial statements and consolidated financial highlights. Such procedures also included confirmation of securities owned as of March 31, 2019, by correspondence with the custodian and brokers, or by other appropriate auditing procedures. Our audits also included evaluating the accounting principles used and significant estimates made by management, as well as evaluating the overall presentation of the consolidated financial statements and consolidated financial highlights. We believe that our audits provide a reasonable basis for our opinion.

We have not been able to determine the specific year that we began serving as the auditor of one or more Wells Fargo Funds investment companies; however we are aware that we have served as the auditor of one or more Wells Fargo Funds investment companies since at least 1955.
Boston, Massachusetts
May 24, 2019
| | | | | | |
| Other information (unaudited) | | Wells Fargo Precious Metals Fund | | | 27 | |
TAX INFORMATION
Pursuant to Section 853 of the Internal Revenue Code, the Fund expects to designate amounts as foreign taxes paid for the fiscal year ended March 31, 2019. Additional details will be available in the semiannual report.
PROXY VOTING INFORMATION
A description of the policies and procedures used to determine how to vote proxies relating to portfolio securities is available, upon request, by calling1-800-222-8222, visiting our website atwfam.com, or visiting the SEC website at sec.gov. Information regarding how the Fund voted proxies relating to portfolio securities during the most recent12-month period ended June 30 is available on the Fund’s website atwfam.comor by visiting the SEC website at sec.gov.
PORTFOLIO HOLDINGS INFORMATION
The complete portfolio holdings for the Fund are publicly available monthly on the Fund’s website (wfam.com), on aone-month delayed basis. In addition, top ten holdings information (excluding derivative positions) for the Fund is publicly available on the Fund’s website on a monthly,seven-day or more delayed basis. The Fund files its complete schedule of portfolio holdings with the SEC for the first and third quarters of each fiscal year on FormN-Q, which is available by visiting the SEC website at sec.gov. In addition, the Fund’s FormN-Q may be reviewed and copied at the SEC’s Public Reference Room in Washington, DC, and at regional offices in New York City, at 233 Broadway, and in Chicago, at 175 West Jackson Boulevard, Suite 900. Information about the Public Reference Room may be obtained by calling1-800-SEC-0330.
| | | | |
| 28 | | Wells Fargo Precious Metals Fund | | Other information (unaudited) |
BOARD OF TRUSTEES AND OFFICERS
Each of the Trustees and Officers1 listed in the table below acts in identical capacities for each fund in the Wells Fargo family of funds, which consists of 151 mutual funds comprising the Wells Fargo Funds Trust, Wells Fargo Variable Trust, Wells Fargo Master Trust and fourclosed-end funds (collectively the “Fund Complex”). This table should be read in conjunction with the Prospectus and the Statement of Additional Information2. The mailing address of each Trustee and Officer is 525 Market Street, 12th Floor, San Francisco, CA 94105. Each Trustee and Officer serves an indefinite term, however, each Trustee serves such term until reaching the mandatory retirement age established by the Trustees.
Independent Trustees
| | | | | | |
Name and
year of birth | | Position held and
length of service* | | Principal occupations during past five years or longer | | Current other
public company or
investment company
directorships |
| | | |
William R. Ebsworth
(Born 1957) | | Trustee, since 2015 | | Retired. From 1984 to 2013, equities analyst, portfolio manager, research director and chief investment officer at Fidelity Management and Research Company in Boston, Tokyo, and Hong Kong, and retired in 2013 as Chief Investment Officer of Fidelity Strategic Advisers, Inc. where he led a team of investment professionals managing client assets. Prior thereto, Board member of Hong Kong Securities Clearing Co., Hong Kong Options Clearing Corp., the Thailand International Fund, Ltd., Fidelity Investments Life Insurance Company, and Empire Fidelity Investments Life Insurance Company. Audit Committee Chair and Investment Committee Chair of the Vincent Memorial Hospital Endowment(non-profit organization). Mr. Ebsworth is a CFA® charterholder. | | N/A |
| | | |
Jane A. Freeman (Born 1953) | | Trustee, since 2015; Chair Liaison, since 2018 | | Retired. From 2012 to 2014 and 1999 to 2008, Chief Financial Officer of Scientific Learning Corporation. From 2008 to 2012, Ms. Freeman provided consulting services related to strategic business projects. Prior to 1999, Portfolio Manager at Rockefeller & Co. and Scudder, Stevens & Clark. Board member of the Harding Loevner Funds from 1996 to 2014, serving as both Lead Independent Director and chair of the Audit Committee. Board member of the Russell Exchange Traded Funds Trust from 2011 to 2012 and the chair of the Audit Committee. Ms. Freeman is a Board Member of The Ruth Bancroft Garden(non-profit organization). She is also an inactive Chartered Financial Analyst. | | N/A |
| | | |
Isaiah Harris, Jr.3 (Born 1952) | | Trustee, since 2009; Audit Committee Chairman, since 2019 | | Retired. Chairman of the Board of CIGNA Corporation since 2009, and Director since 2005. From 2003 to 2011, Director of Deluxe Corporation. Prior thereto, President and CEO of BellSouth Advertising and Publishing Corp. from 2005 to 2007, President and CEO of BellSouth Enterprises from 2004 to 2005 and President of BellSouth Consumer Services from 2000 to 2003. Emeritus member of the Iowa State University Foundation Board of Governors. Emeritus Member of the Advisory Board of Iowa State University School of Business. Advisory Board Member, Palm Harbor Academy (private school). Advisory Board Member, Child Evangelism Fellowship(non-profit). Mr. Harris is a certified public accountant (inactive status). | | CIGNA Corporation |
| | | |
Judith M. Johnson (Born 1949) | | Trustee, since 2008; Audit Committee Chairman, from 2009 to 2018 | | Retired. Prior thereto, Chief Executive Officer and Chief Investment Officer of Minneapolis Employees Retirement Fund from 1996 to 2008. Ms. Johnson is an attorney, certified public accountant and a certified managerial accountant. | | N/A |
| | | | | | |
| Other information (unaudited) | | Wells Fargo Precious Metals Fund | | | 29 | |
| | | | | | |
Name and
year of birth | | Position held and
length of service* | | Principal occupations during past five years or longer | | Current other
public company or
investment company
directorships |
| | | |
David F. Larcker (Born 1950) | | Trustee, since 2009 | | James Irvin Miller Professor of Accounting at the Graduate School of Business, Stanford University, Director of the Corporate Governance Research Initiative and Senior Faculty of The Rock Center for Corporate Governance since 2006. From 2005 to 2008, Professor of Accounting at the Graduate School of Business, Stanford University. Prior thereto, Ernst & Young Professor of Accounting at The Wharton School, University of Pennsylvania from 1985 to 2005. | | N/A |
| | | |
Olivia S. Mitchell (Born 1953) | | Trustee, since 2006; Nominating and Governance Committee Chairman, since 2018 | | International Foundation of Employee Benefit Plans Professor, Wharton School of the University of Pennsylvania since 1993. Director of Wharton’s Pension Research Council and Boettner Center on Pensions & Retirement Research, and Research Associate at the National Bureau of Economic Research. Previously, Cornell University Professor from 1978 to 1993. | | N/A |
| | | |
Timothy J. Penny (Born 1951) | | Trustee, since 1996; Chairman, since 2018 | | President and Chief Executive Officer of Southern Minnesota Initiative Foundation, anon-profit organization, since 2007. Member of the Board of Trustees of NorthStar Education Finance, Inc., anon-profit organization, since 2007. | | N/A |
| | | |
James G. Polisson (Born 1959) | | Trustee, since 2018 | | Retired. Chief Marketing Officer, Source (ETF) UK Services, Ltd, from 2015 to 2017. From 2012 to 2015, Principal of The Polisson Group, LLC, a management consulting, corporate advisory and principal investing company. Chief Executive Officer and Managing Director at Russell Investments, Global Exchange Traded Funds from 2010 to 2012. Managing Director of Barclays Global Investors from 1998 to 2010 and Global Chief Marketing Officer for iShares and Barclays Global Investors from 2000 to 2010. Trustee of the San Francisco Mechanics’ Institute, anon-profit organization, from 2013 to 2015. Board member of the Russell Exchange Traded Fund Trust from 2011 to 2012. Director of Barclays Global Investors Holdings Deutschland GmbH from 2006 to 2009. Mr. Polisson is an attorney and has a retired status with the Massachusetts and District of Columbia Bar Associations. | | N/A |
| | | |
Pamela Wheelock (Born 1959) | | Trustee, since 2018 | | Board member of the Destination Medical Center Economic Development Agency, Rochester, Minnesota since 2019. Chief Operating Officer, Twin Cities Habitat for Humanity from 2017 to 2019. Vice President of University Services, University of Minnesota from 2012 to 2016. Prior thereto, on the Board of Directors, Governance Committee and Finance Committee for the Minnesota Philanthropy Partners (Saint Paul Foundation) from 2012 to 2018, Interim Chief Executive Officer of Blue Cross Blue Shield of Minnesota from 2011 to 2012, Chairman of the Board from 2009 to 2012 and Board Director from 2003 to 2015. Vice President, Leadership and Community Engagement, Bush Foundation, Saint Paul, Minnesota (a private foundation) from 2009 to 2011. Executive Vice President and Chief Financial Officer, Minnesota Sports and Entertainment from 2004 to 2009 and Senior Vice President from 2002 to 2004. Executive Vice President of the Minnesota Wild Foundation from 2004 to 2008. Commissioner of Finance, State of Minnesota, from 1999 to 2002. Currently Board Chair of the Minnesota Wild Foundation since 2010. | | N/A |
| * | Length of service dates reflect the Trustee’s commencement of service with the Trust’s predecessor entities, where applicable. |
| | | | |
| 30 | | Wells Fargo Precious Metals Fund | | Other information (unaudited) |
Officers
| | | | | | |
Name and
year of birth | | Position held and
length of service | | Principal occupations during past five years or longer | | |
| | | |
Andrew Owen
(Born 1960) | | President, since 2017 | | Executive Vice President of Wells Fargo & Company and Head of Affiliated Managers, Wells Fargo Asset Management, since 2014. In addition, Mr. Owen is currently President, Chief Executive Officer and Director of Wells Fargo Funds Management, LLC since 2017. Prior thereto, Executive Vice President responsible for marketing, investments and product development for Wells Fargo Funds Management, LLC, from 2009 to 2014. | | |
| | | |
Nancy Wiser1 (Born 1967) | | Treasurer, since 2012 | | Executive Vice President of Wells Fargo Funds Management, LLC since 2011. Chief Operating Officer and Chief Compliance Officer at LightBox Capital Management LLC, from 2008 to 2011. | | |
| | | |
| Alexander Kymn (Born 1973) | | Secretary and Chief Legal Officer, since 2018 | | Senior Company Counsel of Wells Fargo Bank, N.A. since 2018 (previously Senior Counsel from 2007 to 2018). Vice President of Wells Fargo Funds Management, LLC from 2008 to 2014. | | |
| | | |
| Michael H. Whitaker(Born 1967) | | Chief Compliance Officer, since 2016 | | Senior Vice President and Chief Compliance Officer since 2016. Senior Vice President and Chief Compliance Officer for Fidelity Investments from 2007 to 2016. | | |
| | | |
David Berardi (Born 1975) | | Assistant Treasurer, since 2009 | | Vice President of Wells Fargo Funds Management, LLC since 2009. Vice President of Evergreen Investment Management Company, LLC from 2008 to 2010. Manager of Fund Reporting and Control for Evergreen Investment Management Company, LLC from 2004 to 2010. | | |
| | | |
Jeremy DePalma1 (Born 1974) | | Assistant Treasurer, since 2009 | | Senior Vice President of Wells Fargo Funds Management, LLC since 2009. Senior Vice President of Evergreen Investment Management Company, LLC from 2008 to 2010 and head of the Fund Reporting and Control Team within Fund Administration from 2005 to 2010. | | |
| 1 | Nancy Wiser acts as Treasurer of 65 funds in the Fund Complex. Jeremy DePalma acts as Treasurer of 86 funds and Assistant Treasurer of 65 funds in the Fund Complex. |
| 2 | The Statement of Additional Information includes additional information about the Trustees and is available, without charge, upon request, by calling1-800-222-8222 or by visiting the website atwfam.com. |
| 3 | Mr. Harris became Chairman of the Audit Committee effective January 1, 2019. |
| | | | | | |
| Appendix A (unaudited) | | Wells Fargo Precious Metals Fund | | | 31 | |
SALES CHARGE REDUCTIONS AND WAIVERS FOR CERTAIN INTERMEDIARIES
Raymond James & Associates, Inc., Raymond James Financial Services & Raymond James affiliates (“Raymond James”)
Effective on or about March 1, 2019, shareholders purchasing Fund shares through a Raymond James platform or account will be eligible only for the following load waivers (front-end sales charge waivers and contingent deferred, or back-end, sales charge waivers) and discounts, which may differ from those disclosed elsewhere in the Fund’s Prospectus or SAI.
Front-end Sales Load Waivers on Class A shares Available at Raymond James
| | • | | Shares purchased in an investment advisory program. |
| | • | | Shares purchased through reinvestment of capital gains distributions and dividend reinvestment when purchasing shares of the same fund (but not any other fund within the fund family). |
| | • | | Employees and registered representatives of Raymond James or its affiliates and their family members as designated by Raymond James. |
| | • | | Shares purchased from the proceeds of redemptions within the same fund family, provided (1) the repurchase occurs within 90 days following the redemption, (2) the redemption and purchase occur in the same account, and (3) redeemed shares were subject to a front-end or deferred sales load (known as Rights of Reinstatement). |
| | • | | A shareholder in the fund’s Class C shares will have their shares automatically exchanged at net asset value to Class A shares (or the appropriate share class) of the fund if the shares are no longer subject to a CDSC and the exchange is in line with the policies and procedures of Raymond James. |
CDSC Waivers on Class A and C Shares Available at Raymond James
| | • | | Death or disability of the shareholder. |
| | • | | Shares sold as part of a systematic withdrawal plan as described in the Fund’s Prospectus. |
| | • | | Return of excess contributions from an IRA Account. |
| | • | | Shares sold as part of a required minimum distribution for IRA and retirement accounts due to the shareholder reaching age 70½ as described in the Fund’s prospectus. |
| | • | | Shares sold to pay Raymond James fees but only if the transaction is initiated by Raymond James. |
| | • | | Shares acquired through a right of reinstatement. |
Front-end Load Discounts Available at Raymond James: Breakpoints, and/or Rights of Accumulation
| | • | | Breakpoints as described in the Fund’s Prospectus. |
| | • | | Rights of accumulation which entitle shareholders to breakpoint discounts will be automatically calculated based on the aggregated holding of fund family assets held by accounts within the purchaser’s household at Raymond James. Eligible fund family assets not held at Raymond James may be included in the rights of accumulation calculation only if the shareholder notifies his or her financial advisor about such assets. |
This page is intentionally left blank.

For more information
More information about Wells Fargo Funds is available free upon request. To obtain literature, please write, visit the Fund’s website, or call:
Wells Fargo Funds
P.O. Box 219967
Kansas City, MO 64121-9967
Website: wfam.com
Individual investors: 1-800-222-8222
Retail investment professionals: 1-888-877-9275
Institutional investment professionals:
1-866-765-0778
This report and the financial statements contained herein are submitted for the general information of the shareholders of the Fund. If this report is used for promotional purposes, distribution of the report must be accompanied or preceded by a current prospectus. Before investing, please consider the investment objectives, risks, charges, and expenses of the investment. For a current prospectus and, if available, a summary prospectus, containing this information, call1-800-222-8222 or visit the Fund’s website atwfam.com. Read the prospectus carefully before you invest or send money.
Wells Fargo Asset Management (WFAM) is the trade name for certain investment advisory/management firms owned by Wells Fargo & Company. These firms include but are not limited to Wells Capital Management Incorporated and Wells Fargo Funds Management, LLC. Certain products managed by WFAM entities are distributed by Wells Fargo Funds Distributor, LLC (a broker-dealer and Member FINRA).
This material is for general informational and educational purposes only and is NOT intended to provide investment advice or a recommendation of any kind—including a recommendation for any specific investment, strategy, or plan.
INVESTMENT PRODUCTS: NOT FDIC INSURED ◾ NO BANK GUARANTEE ◾ MAY LOSE VALUE
© 2019 Wells Fargo Funds Management, LLC. All rights reserved.
| | |
 | | 401596 05-19 A316/AR316 03-19 |
Annual Report
March 31, 2019

Wells Fargo Specialized Technology Fund

Beginning on January 1, 2021, as permitted by new regulations adopted by the Securities and Exchange Commission, paper copies of the Wells Fargo Funds’ annual and semi-annual shareholder reports issued after this date will no longer be sent by mail, unless you specifically request paper copies of the reports. Instead, the reports will be made available on the Funds’ website, and you will be notified by mail each time a report is posted and provided with a website address to access the report.
If you already elected to receive shareholder reports electronically, you will not be affected by this change and you need not take any action. You may elect to receive shareholder reports and other communications from the Fund electronically at any time by contacting your financial intermediary (such as a broker-dealer or bank) or, if you are a direct investor, by calling 1-800-222-8222 or by enrolling at wellsfargo.com/advantagedelivery.
You may elect to receive all future reports in paper free of charge. If you invest through a financial intermediary, you can contact your financial intermediary to request that you continue to receive paper copies of your shareholder reports; if you invest directly with the Fund, you can call 1-800-222-8222. Your election to receive reports in paper will apply to all Wells Fargo Funds held in your account with your financial intermediary or, if you are a direct investor, to all Wells Fargo Funds that you hold.

Reduce clutter. Save trees.
Sign up for electronic delivery of prospectuses and shareholder reports atwellsfargo.com/advantagedelivery
Contents
The views expressed and any forward-looking statements are as of March 31, 2019, unless otherwise noted, and are those of the Fund managers and/or Wells Fargo Asset Management. Discussions of individual securities, or the markets generally, or any Wells Fargo Fund are not intended as individual recommendations. Future events or results may vary significantly from those expressed in any forward-looking statements. The views expressed are subject to change at any time in response to changing circumstances in the market. Wells Fargo and the Fund disclaim any obligation to publicly update or revise any views expressed or forward-looking statements.
INVESTMENT PRODUCTS: NOT FDIC INSURED ◾ NO BANK GUARANTEE ◾ MAY LOSE VALUE
| | | | |
| 2 | | Wells Fargo Specialized Technology Fund | | Letter to shareholders (unaudited) |

Andrew Owen
President
Wells Fargo Funds
Global trade tensions escalated during the second quarter of 2018.
Dear Shareholder:
We are pleased to offer you this annual report for the Wells Fargo Specialized Technology Fund for the 12-month period that ended March 31, 2019. An upward trend for short-term interest rates, inflation concerns, trade tensions, and geopolitical events contributed to investment market volatility for much of 2018. Equity investor sentiment improved during the first quarter of 2019 thanks to a shift in U.S. Federal Reserve (Fed) policy and consistent if not spectacular economic and business growth metrics.
For the period, U.S. stocks, as measured by the S&P 500 Index,1 gained 9.50% and international stocks, as measured by the MSCI ACWI ex USA Index (Net),2 declined 4.22%. Based on the MSCI EM Index (Net),3 emerging market stocks fell 7.41%. For bond investors, the Bloomberg Barclays U.S. Aggregate Bond Index4 added 4.48% while the Bloomberg Barclays Global Aggregate ex-USD Index5 lost 4.13%. The Bloomberg Barclays Municipal Bond Index6 added 5.38%, and the ICE BofAML U.S. High Yield Index7 gained 5.94%.
Trade tensions and U.S. interest rates influenced markets.
Global trade tensions escalated during the second quarter of 2018. A tit-for-tat tariff spat intensified between the U.S. and other governments. The Fed raised the federal funds rate by 25 basis points (bps; 100 bps equal 1.00%) to a target range of between 1.75% and 2.00% in June 2018. Market index results reflected the global concerns. The MSCI ACWI ex USA Index (Net) lost 2.61%, while the Bloomberg Barclays Global Aggregate ex-USD Index dropped 4.76%.
Not all news was bad. The U.S. Bureau of Economic Analysis reported second-quarter annualized gross domestic product (GDP) growth of 4.2%. Hiring improved. Unemployment declined. Consumer confidence and spending increased. The S&P 500 Index recorded a 3.43% second-quarter gain. Stocks of companies with smaller capitalizations did even better, as measured by the Russell 2000® Index,8 adding 7.75%.
| 1 | The S&P 500 Index consists of 500 stocks chosen for market size, liquidity, and industry group representation. It is a market-value-weighted index with each stock’s weight in the index proportionate to its market value. You cannot invest directly in an index. |
| 2 | The Morgan Stanley Capital International (MSCI) All Country World Index (ACWI) ex USA Index (Net) is a free-float-adjusted market-capitalization-weighted index that is designed to measure the equity market performance of developed markets, excluding the United States and Canada. Source: MSCI. MSCI makes no express or implied warranties or representations and shall have no liability whatsoever with respect to any MSCI data contained herein. The MSCI data may not be further redistributed or used as a basis for other indices or any securities or financial products. This report is not approved, reviewed, or produced by MSCI. You cannot invest directly in an index. |
| 3 | The MSCI Emerging Markets (EM) Index (Net) is a free-float-adjusted market-capitalization-weighted index that is designed to measure large- and mid-cap equity market performance of emerging markets. The MSCI EM Index (Net) consists of the following 24 emerging market country indices: Brazil, Chile, China, Colombia, Czech Republic, Egypt, Greece, Hungary, India, Indonesia, Korea, Malaysia, Mexico, Pakistan, Peru, the Philippines, Poland, Qatar, Russia, South Africa, Taiwan, Thailand, Turkey, and the United Arab Emirates. You cannot invest directly in an index. |
| 4 | The Bloomberg Barclays U.S. Aggregate Bond Index is a broad-based benchmark that measures the investment-grade, U.S. dollar-denominated, fixed-rate taxable bond market, including Treasuries, government-related and corporate securities, mortgage-backed securities (agency fixed-rate and hybrid adjustable-rate mortgage pass-throughs), asset-backed securities, and commercial mortgage-backed securities. You cannot invest directly in an index. |
| 5 | The Bloomberg Barclays Global Aggregate ex-USD Index is an unmanaged index that provides a broad-based measure of the global investment-grade fixed-income markets excluding the U.S. dollar-denominated debt market. You cannot invest directly in an index. |
| 6 | The Bloomberg Barclays Municipal Bond Index is an unmanaged index composed of long-term tax-exempt bonds with a minimum credit rating of Baa. You cannot invest directly in an index. |
| 7 | The ICE BofAML U.S. High Yield Index is a market-capitalization-weighted index of domestic and Yankee high-yield bonds. The index tracks the performance of high-yield securities traded in the U.S. bond market. You cannot invest directly in an index. Copyright 2019. ICE Data Indices, LLC. All rights reserved. |
| 8 | The Russell 2000® Index measures the performance of the 2,000 smallest companies in the Russell 3000® Index, which represents approximately 8% of the total market capitalization of the Russell 3000® Index. You cannot invest directly in an index. |
| | | | | | |
| Letter to shareholders (unaudited) | | Wells Fargo Specialized Technology Fund | | | 3 | |
Investors appeared to shake off lingering concerns during the third quarter.
Favorable third-quarter economic indicators and corporate earnings reports encouraged domestic stock investors. U.S. trade negotiations with Mexico and Canada progressed. The Conference Board Consumer Confidence Index®9 reached its highest level in 18 years during September 2018. The Fed raised the federal funds rate by 25 bps to a target range of between 2.00% and 2.25% in September 2018. For the quarter that ended September 30, 2018, the S&P 500 Index added 7.71%.
Investors in international markets were not as confident. Tensions between the U.S. and China increased. The U.S. imposed $200 billion in tariffs on Chinese goods. China reacted with $60 billion in tariffs on U.S. goods. Economic growth in China caused concern. The Bank of England raised its monetary policy rate to 0.75% in August 2018. During the quarter, the MSCI ACWI ex USA Index (Net) gained 0.71%. The MSCI EM Index (Net) declined 1.09%. In fixed-income markets, U.S. bonds were flat, as measured by the Bloomberg Barclays U.S. Aggregate Bond Index. The Bloomberg Barclays Global Aggregate ex-USD Index fell 1.74%.
Conflicting data unsettled markets during the fourth quarter.
November’s U.S. midterm elections shifted control of the House of Representatives from Republicans to Democrats, presaging potential partisan clashes. Third-quarter U.S. GDP was announced at an annualized 3.4% rate, lower than the second-quarter rate. Brexit efforts stalled ahead of the March 2019 deadline. The People’s Bank of China cut reserve requirement ratios, accelerated infrastructure spending, and cut taxes even as the value of the yuan declined to low levels last seen in 2008.
December’s S&P 500 Index performance was the worst since 1931. Globally,fixed-income investments fared better than stocks during the last two months of the year. The Fed increased the federal funds rate by 25 bps in December 2018 to a target range of between 2.25% and 2.50% and softened its outlook for 2019 rate increases.
The market climbs a wall of worry.
Investors entered 2019 with reasons to be concerned. A partial U.S. government shutdown driven by partisan spending and immigration policy disputes extended into January. Investors expected high levels of stock market volatility to continue based on the VIX10.
January’s returns tended to support the investing adage that markets climb a wall of worry. The S&P 500 Index gained 8.01% for the month that ended January 31, 2019, its best monthly performance in 30 years. Returns for the MSCI ACWI ex USA Index (Net), the Bloomberg Barclays U.S. Aggregate Bond Index, and the Bloomberg Barclays Global Aggregate ex-USD Index also were positive. The Fed indicated that it would pause its program of regular rate increases during 2019 as inflation remained low. Businesses and investors responded positively to the shift in policy.
In February, concerns over slowing global growth reemerged. The Bureau of Economic Analysis announced fourth-quarter 2018 GDP grew at an annualized 2.2% rate, down from the 4.2% annualized rate for the second quarter and the 3.4% annualized rate for the third quarter. Analysts attributed the lower growth rate to a slowing housing market and larger trade deficit. The U.S. Department of
Favorable third-quarter economic indicators and corporate earnings reports encouraged domestic stock investors.
| 9 | The Conference Board Consumer Confidence Index® measures the degree of optimism on the state of the U.S. economy that consumers are expressing through their activities of savings and spending. You cannot invest directly in an index. |
| 10 | The Chicago Board Options Exchange Market Volatility Index (VIX) is a popular measure of the implied volatility of S&P 500 Index options. It represents one measure of the market’s expectation of stock market volatility over the next 30-day period. You cannot invest directly in an index. |
| | | | |
| 4 | | Wells Fargo Specialized Technology Fund | | Letter to shareholders (unaudited) |
Labor said that the economy created just 20,000 jobs in February 2019. In a February report, the Bank of England forecast the slowest growth since the financial crisis for 2019. China and the U.S., while putting future tariffs on hold for the time being, continued to wrangle over trade issues.
By the end of March 2019, the combination of dovish Fed sentiment and consistent, if not spectacular, economic and business metrics reinforced investors’ enthusiasm for equity investing. Monthly job creation data regained its momentum. Corporate profits, while lower than 2018’s lofty levels, remained consistent. Inflation rates were relatively low in the U.S., Europe, and Japan. China announced a roughly $300 billion stimulus package through tax and fee cuts intended to reinvigorate economic growth.
Don’t let short-term uncertainty derail long-term investment goals.
Periods of investment uncertainty can present challenges, but experience has taught us that maintaining long-term investment goals can be an effective way to plan for the future. To help you create a sound strategy based on your personal goals and risk tolerance, Wells Fargo Funds offers more than 100 mutual funds spanning a wide range of asset classes and investment styles. Although diversification cannot guarantee an investment profit or prevent losses, we believe it can be an effective way to manage investment risk and potentially smooth out overall portfolio performance. We encourage investors to know their investments and to understand that appropriate levels of risk-taking may unlock opportunities.
Thank you for choosing to invest with Wells Fargo Funds. We appreciate your confidence in us and remain committed to helping you meet your financial needs.
Sincerely,

Andrew Owen
President
Wells Fargo Funds
For further information about your Fund, contact your investment professional, visit our website atwfam.com, or call us directly at1-800-222-8222.
This page is intentionally left blank.
| | | | |
| 6 | | Wells Fargo Specialized Technology Fund | | Performance highlights (unaudited) |
Investment objective
The Fund seeks long-term capital appreciation.
Manager
Wells Fargo Funds Management, LLC
Subadviser
Allianz Global Investors U.S. LLC
Portfolio managers
Huachen Chen, CFA®‡
Walter C. Price, Jr., CFA®‡
Michael A. Seidenberg*
Average annual total returns (%) as of March 31, 2019
| | | | | | | | | | | | | | | | | | | | | | | | | | | | | | | | | | |
| | | | | Including sales charge | | | Excluding sales charge | | | Expense ratios1 (%) | |
| | | Inception date | | 1 year | | | 5 year | | | 10 year | | | 1 year | | | 5 year | | | 10 year | | | Gross | | | Net2 | |
| | | | | | | | | |
| Class A (WFSTX) | | 9-18-2000 | | | 10.07 | | | | 16.19 | | | | 19.89 | | | | 16.80 | | | | 17.57 | | | | 20.59 | | | | 1.42 | | | | 1.39 | |
| | | | | | | | | |
| Class C (WFTCX) | | 9-18-2000 | | | 15.01 | | | | 16.72 | | | | 19.70 | | | | 16.01 | | | | 16.72 | | | | 19.70 | | | | 2.17 | | | | 2.14 | |
| | | | | | | | | |
| Administrator Class (WFTDX)3 | | 7-30-2010 | | | – | | | | – | | | | – | | | | 17.02 | | | | 17.72 | | | | 20.76 | | | | 1.34 | | | | 1.29 | |
| | | | | | | | | |
| Institutional Class (WFTIX)4 | | 10-31-2016 | | | – | | | | – | | | | – | | | | 17.25 | | | | 17.83 | | | | 20.81 | | | | 1.09 | | | | 1.04 | |
| | | | | | | | | |
| S&P North American Technology Index5 | | – | | | – | | | | – | | | | – | | | | 15.70 | | | | 19.15 | | | | 20.77 | | | | – | | | | – | |
| | | | | | | | | |
| S&P 500 Index6 | | – | | | – | | | | – | | | | – | | | | 9.50 | | | | 10.91 | | | | 15.92 | | | | – | | | | – | |
Figures quoted represent past performance, which is no guarantee of future results,and do not reflect taxes that a shareholder may pay on fund distributions or the redemption of fund shares.Investment return and principal value of an investment will fluctuate so that an investor’s shares, when redeemed, may be worth more or less than their original cost. Performance shown without sales charges would be lower if sales charges were reflected. Current performance may be lower or higher than the performance data quoted, which assumes the reinvestment of dividends and capital gains. Currentmonth-end performance is available on the Fund’s website,wfam.com.
While the S&P 500 Index is comprised of U.S. equity securities of companies diversified across ten sectors, the Fund’s holdings are concentrated primarily in technology related stocks. Therefore, the performance of the S&P 500 Index is displayed only to show how the concentrated Fund performed compared with a diversified selection of U.S. equity securities.
Index returns do not include transaction costs associated with buying and selling securities, any mutual fund fees or expenses, or any taxes. It is not possible to invest directly in an index.
For Class A shares, the maximumfront-end sales charge is 5.75%. For Class C shares, the maximum contingent deferred sales charge is 1.00%. Performance including a contingent deferred sales charge assumes the sales charge for the corresponding time period. Administrator Class and Institutional Class shares are sold without afront-end sales charge or contingent deferred sales charge.
Stock values fluctuate in response to the activities of individual companies and general market and economic conditions. Funds that concentrate their investments in limited sectors, such as information technology, are more vulnerable to adverse market, economic, regulatory, political, or other developments affecting those sectors. Certain investment strategies tend to increase the total risk of an investment (relative to the broader market). The Fund is exposed to convertible securities risk, foreign investment risk,non-diversification risk, and smaller-company securities risk. Consult the Fund’s prospectus for additional information on these and other risks.
Please see footnotes on page 7.
| | | | | | |
| Performance highlights (unaudited) | | Wells Fargo Specialized Technology Fund | | | 7 | |
|
| Growth of $10,000 investment as of March 31, 20197 |
|
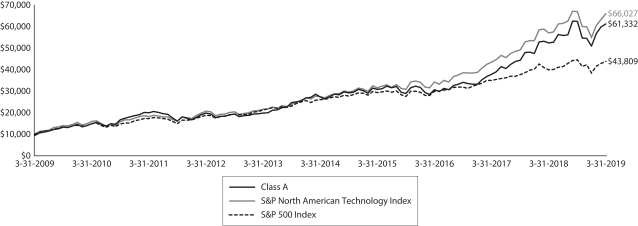 |
| ‡ | CFA® and Chartered Financial Analyst® are trademarks owned by CFA Institute. |
| * | Mr. Seidenberg became a portfolio manager of the Fund on August 1, 2018. |
| 1 | Reflects the expense ratios as stated in the most recent prospectuses, which include the impact of 0.01% in acquired fund fees and expenses. The expense ratios shown are subject to change and may differ from the annualized expense ratios shown in the financial highlights of this report, which do not include acquired fund fees and expenses. |
| 2 | The manager has contractually committed through July 31, 2019, to waive fees and/or reimburse expenses to the extent necessary to cap the expenses of each class after fee waivers at 1.38% for Class A, 2.13% for Class C, 1.28% for Administrator Class, and 1.03% for Institutional Class. Brokerage commissions, stamp duty fees, interest, taxes, acquired fund fees and expenses (if any), and extraordinary expenses are excluded from the expense cap. Prior to or after the commitment expiration date, the cap may be increased or the commitment to maintain the cap may be terminated only with the approval of the Board of Trustees. Without this cap, the Fund’s returns would have been lower. The expense ratio paid by an investor is the net expense ratio (the total annual fund operating expenses after fee waivers) as stated in the prospectuses. |
| 3 | Historical performance shown for Administrator Class shares prior to their inception reflects the performance of Class A shares, and includes the higher expenses applicable to Class A shares. If these expenses had not been included, returns for Administrator Class shares would be higher. |
| 4 | Historical performance shown for the Institutional Class shares prior to their inception reflects the performance of the Administrator Class shares, and is not adjusted to reflect Institutional Class expenses. If these expenses had been included, returns for Institutional Class shares would be higher. |
| 5 | The S&P North American Technology Index is a modified market-capitalization-weighted index of select technology stocks. You cannot invest directly in an index. |
| 6 | The S&P 500 Index consists of 500 stocks chosen for market size, liquidity, and industry group representation. It is a market-value weighted index with each stock’s weight in the index proportionate to its market value. You cannot invest directly in an index. |
| 7 | The chart compares the performance of Class A shares for the most recent ten years with the S&P North American Technology Index and the S&P 500 Index. The chart assumes a hypothetical investment of $10,000 in Class A shares and reflects all operating expenses and assumes the maximum initial sales charge of 5.75%. |
| 8 | The ten largest holdings, excluding cash, cash equivalents and any money market funds, are calculated based on the value of the investments divided by total net assets of the Fund. Holdings are subject to change and may have changed since the date specified. |
| 9 | Amounts are calculated based on the total long-term investments of the Fund. These amounts are subject to change and may have changed since the date specified. |
| | | | |
| 8 | | Wells Fargo Specialized Technology Fund | | Performance highlights (unaudited) |
MANAGER’S DISCUSSION
Fund highlights
| ∎ | | The Fund outperformed the S&P North American Technology Index for the12-month period that ended March 31, 2019. |
| ∎ | | The primary drivers for the Fund’s absolute and relative performance included our overweights to select high-growth software companies. |
| ∎ | | The Fund’s overweights to certain hardware and semiconductor companies detracted from relative returns. |
Information technology continues to be a rich source of investment returns.
Information technology (IT) companies continued to demonstrate strong earnings growth and delivered solid stock returns relative to the broad market. Despite the increased market volatility and sharpsell-off in the fourth quarter of 2018, underlying fundamentals remain strong for many IT companies. Suppliers of innovative technologies should continue to benefit as businesses across the economy look to invest in solutions that help increase productivity and enhance efficiency.
We believe one of the most attractive qualities of the IT sector is the regular emergence of new and disruptive trends. Many of these new technologies potentially could expand the influence of technology into other areas of the economy as well as draw value from predecessor technologies within the sector. Our primary goal continues to be to identify these major trends ahead of the crowd and invest in the emerging leaders.
Over the12-month period, we increased our exposure to select software companies benefiting from the accelerating adoption of cloud computing andsoftware-as-a-service (SaaS) solutions. Many of these stocks performed well due to higher demand for their innovative product offerings, which led to consistently strong earnings growth. We also added exposure to payments companies in the period. Conversely, the team reduced exposure to the more cyclical segments of the IT sector, including semiconductors, hardware, and communications equipment. These segments were negatively affected by weaker global growth and the ongoing trade dispute between the U.S. and China.
Overweights to Twilio Incorporated and Paycom Software, Incorporated, were the largest contributors.
Our position in Twilio Incorporated was a top contributor during the period. The company provides a cloud-based platform that enables developers to build, scale, and operate real-time communications within software applications as apay-as-you-go service. Twilio’s platform is being increasingly leveraged by companies that are building artificial intelligence applications to enable them to design more intimate, real-time interactions with their customers. We believe the company is extending its lead in the communicationsplatform-as-a-service market, driven by differentiated solutions and strong developer relationships.
Paycom Software, Incorporated, was also among the top contributors. Paycom provides cloud-based payroll and human capital management software in a SaaS format to small andmedium-size businesses in the U.S. Paycom’s software provides unique value to customers because it typically replaces multiple systems and helps manage complex compliance requirements. We see the company as a unique cloud asset modernizing the payroll market, which gives it the opportunity to rapidly grow revenue over the next few years while maintaining abest-in-class earnings before interest, tax, depreciation, and amortization (EBITDA) margin.
Other top contributors to relative returns included overweights to MongoDB, Incorporated; Okta, Incorporated; and Square, Incorporated.
The portfolio’s overweight to DXC Technology Company was the largest detractor as the company faced challenges staffing its sales team, which led to slower revenue growth. While orders have been strong, service delivery has been limited due to this staffing issue. We believe the company is solving this problem via internal adjustments and a recent acquisition. DXC offers a variety of solutions for customers, including analytics, applications, and cloud-workload consulting. In our view, cash flow should continue to increase as DXC improves efficiencies across the company, and valuation remains compelling.
Nutanix, Incorporated, was also among the top detractors. The company provides enterprise cloud-platform solutions that converge traditional silos of server, virtualization, and storage into one integrated solution. Shares have been weak recently amid the company’s transition to a subscription- and cloud-based business model. This process has led to a realignment of the sales and marketing function, as well as other investments that have limited earnings growth. We believe the business model transition and recent investments should be positive for the company’s earnings growth longer term.
Please see footnotes on page 7.
| | | | | | |
| Performance highlights (unaudited) | | Wells Fargo Specialized Technology Fund | | | 9 | |
Other top detractors from relative returns included overweights to Micron Technology, Incorporated, and Microchip Technology Incorporated and an underweight to Cisco Systems, Incorporated.
We retain an optimistic outlook for the IT sector and for the Fund.
Looking forward, we continue to believe the IT sector may provide some of the stock markets’ best absolute- and relative-return opportunities, especially forbottom-up stock pickers like us. We have observed a wave of innovation within the sector that we believe could produce attractive returns for companies offeringbest-in-class solutions. We also see a number of companies with present valuations that, in our view, do not fully reflect positive company-specific and/or industry-specific tailwinds. We believe some of the attractive growth themes include cloud computing, auto technology, artificial intelligence, robotics, and cybersecurity.
| | | | |
| Ten largest holdings (%) as of March 31, 20198 | |
| |
Facebook Incorporated Class A | | | 5.37 | |
| |
ServiceNow Incorporated | | | 5.06 | |
| |
Amazon.com Incorporated | | | 4.89 | |
| |
Microsoft Corporation | | | 4.83 | |
| |
Paycom Software Incorporated | | | 4.80 | |
| |
Twilio Incorporated Class A | | | 4.48 | |
| |
NetApp Incorporated | | | 3.59 | |
| |
Okta Incorporated | | | 3.39 | |
| |
RingCentral Incorporated Class A | | | 3.00 | |
| |
Square Incorporated Class A | | | 2.88 | |
|
| Industry distribution as of March 31, 20199 |
|
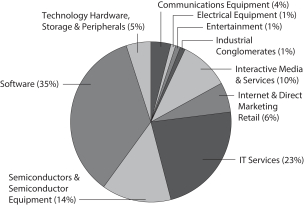 |
Please see footnotes on page 7.
| | | | |
| 10 | | Wells Fargo Specialized Technology Fund | | Fund expenses (unaudited) |
As a shareholder of the Fund, you incur two types of costs: (1) transaction costs, including sales charges (loads) on purchase payments and contingent deferred sales charges (if any) on redemptions and (2) ongoing costs, including management fees, distribution(12b-1) and/or shareholder servicing fees, and other Fund expenses. This example is intended to help you understand your ongoing costs (in dollars) of investing in the Fund and to compare these costs with the ongoing costs of investing in other mutual funds.
The example is based on an investment of $1,000 invested at the beginning of thesix-month period and held for the entire period from October 1, 2018 to March 31, 2019.
Actual expenses
The “Actual” line of the table below provides information about actual account values and actual expenses. You may use the information in this line, together with the amount you invested, to estimate the expenses that you paid over the period. Simply divide your account value by $1,000 (for example, an $8,600 account value divided by $1,000 = 8.6), then multiply the result by the number in the “Actual” line under the heading entitled “Expenses paid during period” for your applicable class of shares to estimate the expenses you paid on your account during this period.
Hypothetical example for comparison purposes
The “Hypothetical” line of the table below provides information about hypothetical account values and hypothetical expenses based on the Fund’s actual expense ratio and an assumed rate of return of 5% per year before expenses, which is not the Fund’s actual return. The hypothetical account values and expenses may not be used to estimate the actual ending account balance or expenses you paid for the period. You may use this information to compare the ongoing costs of investing in the Fund and other funds. To do so, compare this 5% hypothetical example with the 5% hypothetical examples that appear in the shareholder reports of the other funds.
Please note that the expenses shown in the table are meant to highlight your ongoing costs only and do not reflect any transactional costs, such as sales charges (loads) and contingent deferred sales charges. Therefore, the “Hypothetical” line of the table is useful in comparing ongoing costs only and will not help you determine the relative total costs of owning different funds. In addition, if these transactional costs were included, your costs would have been higher.
| | | | | | | | | | | | | | | | |
| | | Beginning
account value
10-1-2018 | | | Ending
account value
3-31-2019 | | | Expenses
paid during
the period¹ | | | Annualized net
expense ratio | |
Class A | | | | | | | | | | | | | | | | |
| | | | |
Actual | | $ | 1,000.00 | | | $ | 982.38 | | | $ | 6.82 | | | | 1.38 | % |
| | | | |
Hypothetical (5% return before expenses) | | $ | 1,000.00 | | | $ | 1,018.05 | | | $ | 6.94 | | | | 1.38 | % |
Class C | | | | | | | | | | | | | | | | |
| | | | |
Actual | | $ | 1,000.00 | | | $ | 979.34 | | | $ | 10.51 | | | | 2.13 | % |
| | | | |
Hypothetical (5% return before expenses) | | $ | 1,000.00 | | | $ | 1,014.31 | | | $ | 10.70 | | | | 2.13 | % |
Administrator Class | | | | | | | | | | | | | | | | |
| | | | |
Actual | | $ | 1,000.00 | | | $ | 982.98 | | | $ | 6.33 | | | | 1.28 | % |
| | | | |
Hypothetical (5% return before expenses) | | $ | 1,000.00 | | | $ | 1,018.55 | | | $ | 6.44 | | | | 1.28 | % |
Institutional Class | | | | | | | | | | | | | | | | |
| | | | |
Actual | | $ | 1,000.00 | | | $ | 984.19 | | | $ | 5.10 | | | | 1.03 | % |
| | | | |
Hypothetical (5% return before expenses) | | $ | 1,000.00 | | | $ | 1,019.80 | | | $ | 5.19 | | | | 1.03 | % |
| 1 | Expenses paid is equal to the annualized net expense ratio of each class multiplied by the average account value over the period, multiplied by the number of days in the most recent fiscal half-year divided by the number of days in the fiscal year (to reflect theone-half-year period). |
| | | | | | |
| Portfolio of investments—March 31, 2019 | | Wells Fargo Specialized Technology Fund | | | 11 | |
| | | | | | | | | | | | | | | | |
| Security name | | | | | | | | Shares | | | Value | |
| | | | |
Common Stocks: 96.59% | | | | | | | | | | | | | | | | |
| | | | |
Communication Services: 10.67% | | | | | | | | | | | | | | | | |
| | | | |
| Entertainment: 1.32% | | | | | | | | | | | | | | | | |
| | | | |
Electronic Arts Incorporated † | | | | | | | | | | | 15,990 | | | $ | 1,625,064 | |
| | | | |
Netflix Incorporated † | | | | | | | | | | | 13,515 | | | | 4,818,908 | |
| | | | |
Tencent Music ADR (a) | | | | | | | | | | | 3 | | | | 54 | |
| | | | |
| | | | | | | | | | | | | | | 6,444,026 | |
| | | | | | | | | | | | | | | | |
| | | | |
| Interactive Media & Services: 9.35% | | | | | | | | | | | | | | | | |
| | | | |
Alphabet Incorporated Class A † | | | | | | | | | | | 8,720 | | | | 10,262,481 | |
| | | | |
Alphabet Incorporated Class C † | | | | | | | | | | | 6,540 | | | | 7,673,447 | |
| | | | |
Facebook Incorporated Class A † | | | | | | | | | | | 156,965 | | | | 26,164,496 | |
| | | | |
Tencent Holdings Limited | | | | | | | | | | | 12,915 | | | | 593,929 | |
| | | | |
Yandex NV Class A † | | | | | | | | | | | 25,570 | | | | 878,074 | |
| | | | |
| | | | | | | | | | | | | | | 45,572,427 | |
| | | | | | | | | | | | | | | | |
| | | | |
Consumer Discretionary: 5.68% | | | | | | | | | | | | | | | | |
| | | | |
| Automobiles: 0.30% | | | | | | | | | | | | | | | | |
| | | | |
Tesla Motors Incorporated †« | | | | | | | | | | | 5,210 | | | | 1,458,071 | |
| | | | | | | | | | | | | | | | |
| | | | |
| Internet & Direct Marketing Retail: 5.38% | | | | | | | | | | | | | | | | |
| | | | |
Alibaba Group Holding Limited ADR † | | | | | | | | | | | 11,095 | | | | 2,024,283 | |
| | | | |
Amazon.com Incorporated † | | | | | | | | | | | 13,380 | | | | 23,826,435 | |
| | | | |
GrubHub Incorporated † | | | | | | | | | | | 5,660 | | | | 393,200 | |
| | | | |
| | | | | | | | | | | | | | | 26,243,918 | |
| | | | | | | | | | | | | | | | |
| | | | |
Health Care: 0.29% | | | | | | | | | | | | | | | | |
| | | | |
| Health Care Technology: 0.29% | | | | | | | | | | | | | | | | |
| | | | |
Veeva Systems Incorporated Class A † | | | | | | | | | | | 10,975 | | | | 1,392,289 | |
| | | | | | | | | | | | | | | | |
| | | | |
Industrials: 1.07% | | | | | | | | | | | | | | | | |
| | | | |
| Electrical Equipment: 0.64% | | | | | | | | | | | | | | | | |
| | | | |
Bloom Energy Corporation Class A †« | | | | | | | | | | | 240,765 | | | | 3,110,684 | |
| | | | | | | | | | | | | | | | |
| | | | |
| Industrial Conglomerates: 0.43% | | | | | | | | | | | | | | | | |
| | | | |
Roper Industries Incorporated | | | | | | | | | | | 6,130 | | | | 2,096,276 | |
| | | | | | | | | | | | | | | | |
| | | | |
Information Technology: 78.88% | | | | | | | | | | | | | | | | |
| | | | |
| Communications Equipment: 3.52% | | | | | | | | | | | | | | | | |
| | | | |
Arista Networks Incorporated † | | | | | | | | | | | 20,945 | | | | 6,586,365 | |
| | | | |
Cisco Systems Incorporated | | | | | | | | | | | 28,730 | | | | 1,551,133 | |
| | | | |
Nokia Corporation ADR « | | | | | | | | | | | 69,540 | | | | 397,769 | |
| | | | |
Palo Alto Networks Incorporated † | | | | | | | | | | | 33,590 | | | | 8,158,339 | |
| | | | |
Viavi Solutions Incorporated † | | | | | | | | | | | 36,625 | | | | 453,418 | |
| | | | |
| | | | | | | | | | | | | | | 17,147,024 | |
| | | | | | | | | | | | | | | | |
| | | | |
| Electronic Equipment, Instruments & Components: 0.16% | | | | | | | | | | | | | | | | |
| | | | |
Cognex Corporation | | | | | | | | | | | 14,875 | | | | 756,543 | |
| | | | | | | | | | | | | | | | |
The accompanying notes are an integral part of these financial statements.
| | | | |
| 12 | | Wells Fargo Specialized Technology Fund | | Portfolio of investments—March 31, 2019 |
| | | | | | | | | | | | | | | | |
| Security name | | | | | | | | Shares | | | Value | |
| | | | |
| IT Services: 22.54% | | | | | | | | | | | | | | | | |
| | | | |
Capgemini SA | | | | | | | | | | | 11,450 | | | $ | 1,388,441 | |
| | | | |
DXC Technology Company | | | | | | | | | | | 133,915 | | | | 8,612,074 | |
| | | | |
First Data Corporation Class A † | | | | | | | | | | | 33,230 | | | | 872,952 | |
| | | | |
Fiserv Incorporated † | | | | | | | | | | | 6,700 | | | | 591,476 | |
| | | | |
MasterCard Incorporated Class A | | | | | | | | | | | 52,845 | | | | 12,442,355 | |
| | | | |
MongoDB Incorporated †« | | | | | | | | | | | 77,525 | | | | 11,397,726 | |
| | | | |
Okta Incorporated † | | | | | | | | | | | 199,710 | | | | 16,522,008 | |
| | | | |
PayPal Holdings Incorporated † | | | | | | | | | | | 93,170 | | | | 9,674,773 | |
| | | | |
Square Incorporated Class A † | | | | | | | | | | | 187,245 | | | | 14,028,395 | |
| | | | |
Twilio Incorporated Class A † | | | | | | | | | | | 169,140 | | | | 21,849,505 | |
| | | | |
Visa Incorporated Class A | | | | | | | | | | | 69,750 | | | | 10,894,253 | |
| | | | |
Worldpay Incorporated Class A † | | | | | | | | | | | 13,955 | | | | 1,583,893 | |
| | | | |
| | | | | | | | | | | | | | | 109,857,851 | |
| | | | | | | | | | | | | | | | |
| | | | |
| Semiconductors & Semiconductor Equipment: 13.29% | | | | | | | | | | | | | | | | |
| | | | |
Analog Devices Incorporated | | | | | | | | | | | 31,035 | | | | 3,267,054 | |
| | | | |
Broadcom Incorporated | | | | | | | | | | | 37,070 | | | | 11,147,320 | |
| | | | |
Cree Incorporated † | | | | | | | | | | | 198,645 | | | | 11,366,467 | |
| | | | |
Cypress Semiconductor Corporation | | | | | | | | | | | 102,850 | | | | 1,534,522 | |
| | | | |
Infineon Technologies AG | | | | | | | | | | | 95,250 | | | | 1,889,584 | |
| | | | |
Intel Corporation | | | | | | | | | | | 38,880 | | | | 2,087,856 | |
| | | | |
KLA-Tencor Corporation | | | | | | | | | | | 37,200 | | | | 4,442,052 | |
| | | | |
Lam Research Corporation | | | | | | | | | | | 2,725 | | | | 487,802 | |
| | | | |
Microchip Technology Incorporated « | | | | | | | | | | | 97,455 | | | | 8,084,867 | |
| | | | |
Micron Technology Incorporated † | | | | | | | | | | | 64,165 | | | | 2,651,939 | |
| | | | |
ON Semiconductor Corporation † | | | | | | | | | | | 545,900 | | | | 11,229,163 | |
| | | | |
Taiwan Semiconductor Manufacturing Company Limited ADR | | | | | | | | | | | 11,485 | | | | 470,426 | |
| | | | |
Teradyne Incorporated | | | | | | | | | | | 54,395 | | | | 2,167,097 | |
| | | | |
Texas Instruments Incorporated | | | | | | | | | | | 36,905 | | | | 3,914,513 | |
| | | | |
| | | | | | | | | | | | | | | 64,740,662 | |
| | | | | | | | | | | | | | | | |
| | | | |
| Software: 34.22% | | | | | | | | | | | | | | | | |
| | | | |
Adobe Systems Incorporated † | | | | | | | | | | | 7,510 | | | | 2,001,340 | |
| | | | |
Aspen Technology Incorporated † | | | | | | | | | | | 4,725 | | | | 492,629 | |
| | | | |
Atlassian Corporation plc Class A † | | | | | | | | | | | 44,260 | | | | 4,974,381 | |
| | | | |
Autodesk Incorporated † | | | | | | | | | | | 3,425 | | | | 533,684 | |
| | | | |
AVEVA Group plc | | | | | | | | | | | 51,435 | | | | 2,161,146 | |
| | | | |
CyberArk Software Limited † | | | | | | | | | | | 14,065 | | | | 1,674,438 | |
| | | | |
DocuSign Incorporated † | | | | | | | | | | | 8,175 | | | | 423,792 | |
| | | | |
Elastic NV † | | | | | | | | | | | 31,639 | | | | 2,527,007 | |
| | | | |
FireEye Incorporated † | | | | | | | | | | | 24,710 | | | | 414,881 | |
| | | | |
ForeScout Technologies Incorporated † | | | | | | | | | | | 42,185 | | | | 1,767,973 | |
| | | | |
Fortinet Incorporated † | | | | | | | | | | | 34,975 | | | | 2,936,851 | |
| | | | |
Guidewire Software Incorporated † | | | | | | | | | | | 4,540 | | | | 441,106 | |
| | | | |
HubSpot Incorporated † | | | | | | | | | | | 6,810 | | | | 1,131,890 | |
| | | | |
Intuit Incorporated | | | | | | | | | | | 3,920 | | | | 1,024,727 | |
| | | | |
Micro Focus International plc | | | | | | | | | | | 22,920 | | | | 595,998 | |
| | | | |
Microsoft Corporation | | | | | | | | | | | 199,730 | | | | 23,556,156 | |
| | | | |
New Relic Incorporated † | | | | | | | | | | | 8,760 | | | | 864,612 | |
The accompanying notes are an integral part of these financial statements.
| | | | | | |
| Portfolio of investments—March 31, 2019 | | Wells Fargo Specialized Technology Fund | | | 13 | |
| | | | | | | | | | | | | | | | |
| Security name | | | | | | | | Shares | | | Value | |
| | | | |
| Software(continued) | | | | | | | | | | | | | | | | |
| | | | |
Nutanix Incorporated Class A † | | | | | | | | | | | 197,135 | | | $ | 7,439,875 | |
| | | | |
Oracle Corporation | | | | | | | | | | | 55,360 | | | | 2,973,386 | |
| | | | |
Paycom Software Incorporated † | | | | | | | | | | | 123,645 | | | | 23,384,979 | |
| | | | |
Proofpoint Incorporated † | | | | | | | | | | | 69,530 | | | | 8,443,028 | |
| | | | |
Rapid7 Incorporated † | | | | | | | | | | | 28,400 | | | | 1,437,324 | |
| | | | |
RealPage Incorporated † | | | | | | | | | | | 14,150 | | | | 858,764 | |
| | | | |
RingCentral Incorporated Class A † | | | | | | | | | | | 135,435 | | | | 14,599,893 | |
| | | | |
Salesforce.com Incorporated † | | | | | | | | | | | 62,179 | | | | 9,847,288 | |
| | | | |
ServiceNow Incorporated † | | | | | | | | | | | 99,965 | | | | 24,640,373 | |
| | | | |
Smartsheet Incorporated Class A † | | | | | | | | | | | 10,590 | | | | 431,966 | |
| | | | |
Sophos Group plc 144A | | | | | | | | | | | 90,370 | | | | 354,049 | |
| | | | |
Tableau Software Incorporated Class A † | | | | | | | | | | | 51,525 | | | | 6,558,102 | |
| | | | |
Temenos Group AG | | | | | | | | | | | 6,550 | | | | 965,644 | |
| | | | |
Workday Incorporated Class A † | | | | | | | | | | | 60,500 | | | | 11,667,425 | |
| | | | |
Zendesk Incorporated † | | | | | | | | | | | 15,150 | | | | 1,287,750 | |
| | | | |
Zscaler Incorporated † | | | | | | | | | | | 51,425 | | | | 3,647,575 | |
| | | | |
Zynga Incorporated Class A † | | | | | | | | | | | 134,955 | | | | 719,310 | |
| | | | |
| | | | | | | | | | | | | | | 166,779,342 | |
| | | | | | | | | | | | | | | | |
| | | | |
| Technology Hardware, Storage & Peripherals: 5.15% | | | | | | | | | | | | | | | | |
| | | | |
Apple Incorporated | | | | | | | | | | | 26,350 | | | | 5,005,183 | |
| | | | |
NetApp Incorporated | | | | | | | | | | | 252,580 | | | | 17,513,894 | |
| | | | |
Pure Storage Incorporated Class A † | | | | | | | | | | | 48,310 | | | | 1,052,675 | |
| | | | |
Samsung Electronics Company Limited | | | | | | | | | | | 38,780 | | | | 1,525,440 | |
| | | | |
| | | | | | | | | | | | | | | 25,097,192 | |
| | | | | | | | | | | | | | | | |
| | | | |
Total Common Stocks (Cost $291,921,823) | | | | | | | | | | | | | | | 470,696,305 | |
| | | | | | | | | | | | | | | | |
| | | | |
| | | Yield | | | | | | | | | | |
| Short-Term Investments: 8.04% | |
|
| Investment Companies: 8.04% | |
| | | | |
Securities Lending Cash Investments LLC (l)(r)(u) | | | 2.55 | % | | | | | | | 20,473,818 | | | | 20,475,865 | |
| | | | |
Wells Fargo Government Money Market Fund Select Class (l)(u) | | | 2.38 | | | | | | | | 18,717,955 | | | | 18,717,955 | |
| |
Total Short-Term Investments (Cost $39,193,820) | | | | 39,193,820 | |
| | | | | | | | | | | | | | | | |
| | | | | | | | |
| Total investments in securities (Cost $331,115,643) | | | 104.63 | % | | | 509,890,125 | |
| | |
Other assets and liabilities, net | | | (4.63 | ) | | | (22,581,999 | ) |
| | | | | | | | |
| Total net assets | | | 100.00 | % | | $ | 487,308,126 | |
| | | | | | | | |
| † | Non-income-earning security |
| (a) | The security is fair valued in accordance with procedures approved by the Board of Trustees. |
| « | All or a portion of this security is on loan. |
| 144A | The security may be resold in transactions exempt from registration, normally to qualified institutional buyers, pursuant to Rule 144A under the Securities Act of 1933. |
| (l) | The issuer of the security is an affiliated person of the Fund as defined in the Investment Company Act of 1940. |
| (r) | The investment is anon-registered investment company purchased with cash collateral received from securities on loan. |
| (u) | The rate represents the7-day annualized yield at period end. |
Abbreviations:
| ADR | American depositary receipt |
The accompanying notes are an integral part of these financial statements.
| | | | |
| 14 | | Wells Fargo Specialized Technology Fund | | Portfolio of investments—March 31, 2019 |
Investments in Affiliates
An affiliated investment is an investment in which the Fund owns at least 5% of the outstanding voting shares of the issuer or as a result of other relationships, such as the Fund and the issuer having the same investment manager. Transactions with issuers that were either affiliated persons of the Fund at the beginning of the period or the end of the period were as follows:
| | | | | | | | | | | | | | | | | | | | | | | | | | | | | | | | | | | | |
| | | Shares,
beginning of
period | | | Shares
purchased | | | Shares
sold | | | Shares,
end of
period | | | Net
realized
gains
(losses) | | | Net
change in
unrealized
gains
(losses) | | | Income
from
affiliated
securities | | | Value,
end
of period | | | % of
net
assets | |
Short-Term Investments | | | | | | | | | | | | | | | | | | | | | | | | | | | | | | | | | | | | |
Investment Companies | | | | | | | | | | | | | | | | | | | | | | | | | | | | | | | | | | | | |
Securities Lending Cash Investments LLC | | | 23,934,530 | | | | 229,767,809 | | | | 233,228,521 | | | | 20,473,818 | | | $ | 33 | | | $ | 0 | | | $ | 410,387 | | | $ | 20,475,865 | | | | | |
Wells Fargo Government Money Market Fund Select Class | | | 2,705,051 | | | | 221,415,282 | | | | 205,402,378 | | | | 18,717,955 | | | | 0 | | | | 0 | | | | 502,234 | | | | 18,717,955 | | | | | |
| | | | | | | | | | | | | | | | | | | | | | | | | | | | | | | | | | | | |
| | | | | | | | | |
| | | | | | | | | | | | | | | | | | $ | 33 | | | $ | 0 | | | $ | 912,621 | | | $ | 39,193,820 | | | | 8.04 | % |
| | | | | | | | | | | | | | | | | | | | | | | | | | | | | | | | | | | | |
The accompanying notes are an integral part of these financial statements.
| | | | | | |
| Statement of assets and liabilities—March 31, 2019 | | Wells Fargo Specialized Technology Fund | | | 15 | |
| | | | |
| | | | |
| |
Assets | | | | |
Investments in unaffiliated securities (including $20,369,187 of securities loaned), at value (cost $291,921,823) | | $ | 470,696,305 | |
Investments in affiliated securities, at value (cost $39,193,820) | | | 39,193,820 | |
Foreign currency, at value (cost $29) | | | 29 | |
Receivable for investments sold | | | 3,180,559 | |
Receivable for Fund shares sold | | | 443,120 | |
Receivable for dividends | | | 100,885 | |
Prepaid expenses and other assets | | | 23,609 | |
| | | | |
Total assets | | | 513,638,327 | |
| | | | |
| |
Liabilities | | | | |
Payable upon receipt of securities loaned | | | 20,475,809 | |
Payable for investments purchased | | | 4,702,599 | |
Payable for Fund shares redeemed | | | 536,446 | |
Management fee payable | | | 350,318 | |
Administration fees payable | | | 80,790 | |
Distribution fee payable | | | 7,461 | |
Trustees’ fees and expenses payable | | | 1,983 | |
Accrued expenses and other liabilities | | | 174,795 | |
| | | | |
Total liabilities | | | 26,330,201 | |
| | | | |
Total net assets | | $ | 487,308,126 | |
| | | | |
| |
NET ASSETS CONSIST OF | | | | |
Paid-in capital | | $ | 275,565,237 | |
Total distributable earnings | | | 211,742,889 | |
| | | | |
Total net assets | | $ | 487,308,126 | |
| | | | |
| |
COMPUTATION OF NET ASSET VALUE AND OFFERING PRICE PER SHARE | | | | |
Net assets – Class A | | $ | 401,989,600 | |
Shares outstanding – Class A1 | | | 30,148,807 | |
Net asset value per share – Class A | | | $13.33 | |
Maximum offering price per share – Class A2 | | | $14.14 | |
Net assets – Class C | | $ | 11,614,934 | |
Shares outstanding – Class C1 | | | 1,151,623 | |
Net asset value per share – Class C | | | $10.09 | |
Net assets – Administrator Class | | $ | 22,480,114 | |
Shares outstanding – Administrator Class1 | | | 1,647,217 | |
Net asset value per share – Administrator Class | | | $13.65 | |
Net assets – Institutional Class | | $ | 51,223,478 | |
Shares outstanding – Institutional Class1 | | | 3,730,800 | |
Net asset value per share – Institutional Class | | | $13.73 | |
| 1 | The Fund has an unlimited number of authorized shares. |
| 2 | Maximum offering price is computed as 100/94.25 of net asset value. On investments of $50,000 or more, the offering price is reduced. |
The accompanying notes are an integral part of these financial statements.
| | | | |
| 16 | | Wells Fargo Specialized Technology Fund | | Statement of operations—year ended March 31, 2019 |
| | | | |
| | | | |
| |
Investment income | | | | |
Dividends (net of foreign withholding taxes of $17,340) | | $ | 2,216,653 | |
Income from affiliated securities | | | 622,307 | |
| | | | |
Total investment income | | | 2,838,960 | |
| | | | |
| |
Expenses | | | | |
Management fee | | | 4,054,138 | |
Administration fees | | | | |
Class A | | | 798,092 | |
Class C | | | 32,757 | |
Administrator Class | | | 29,225 | |
Institutional Class | | | 55,364 | |
Shareholder servicing fees | | | | |
Class A | | | 950,110 | |
Class C | | | 38,997 | |
Administrator Class | | | 55,972 | |
Distribution fee | | | | |
Class C | | | 116,991 | |
Custody and accounting fees | | | 30,861 | |
Professional fees | | | 46,434 | |
Registration fees | | | 89,365 | |
Shareholder report expenses | | | 71,916 | |
Trustees’ fees and expenses | | | 22,726 | |
Other fees and expenses | | | 25,145 | |
| | | | |
Total expenses | | | 6,418,093 | |
Less: Fee waivers and/or expense reimbursements | | | (79,499 | ) |
| | | | |
Net expenses | | | 6,338,594 | |
| | | | |
Net investment loss | | | (3,499,634 | ) |
| | | | |
| |
REALIZED AND UNREALIZED GAINS (LOSSES) ON INVESTMENTS | | | | |
| |
Net realized gains on: | | | | |
Unaffiliated securities | | | 35,765,223 | |
Affiliated securities | | | 33 | |
Forward foreign currency contracts | | | 1,464 | |
| | | | |
Net realized gains on investments | | | 35,766,720 | |
| | | | |
| |
Net change in unrealized gains (losses) on: | | | | |
Unaffiliated securities | | | 32,209,674 | |
Forward foreign currency contracts | | | (860 | ) |
| | | | |
Net change in unrealized gains (losses) on investments | | | 32,208,814 | |
| | | | |
Net realized and unrealized gains (losses) on investments | | | 67,975,534 | |
| | | | |
Net increase in net assets resulting from operations | | $ | 64,475,900 | |
| | | | |
The accompanying notes are an integral part of these financial statements.
| | | | | | |
| Statement of changes in net assets | | Wells Fargo Specialized Technology Fund | | | 17 | |
| | | | | | | | | | | | | | | | |
| | | Year ended
March 31, 2019 | | | Year ended
March 31, 20181 | |
| | | |
Operations | | | | | | | | | | | | |
Net investment loss | | | | | | $ | (3,499,634 | ) | | | | | | $ | (2,968,325 | ) |
Net realized gains on investments | | | | | | | 35,766,720 | | | | | | | | 85,463,589 | |
Net change in unrealized gains (losses) on investments | | | | | | | 32,208,814 | | | | | | | | 45,515,664 | |
| | | | |
Net increase in net assets resulting from operations | | | | | | | 64,475,900 | | | | | | | | 128,010,928 | |
| | | | |
|
Distributions to shareholders from net investment income and net realized gains | |
Class A | | | | | | | (67,273,231 | ) | | | | | | | (22,775,603 | ) |
Class C | | | | | | | (3,624,112 | ) | | | | | | | (1,248,847 | ) |
Administrator Class | | | | | | | (4,975,885 | ) | | | | | | | (3,999,359 | ) |
Institutional Class | | | | | | | (7,475,902 | ) | | | | | | | (1,741,744 | ) |
| | | | |
Total distributions to shareholders | | | | | | | (83,349,130 | ) | | | | | | | (29,765,553 | ) |
| | | | |
| | | | |
Capital share transactions | | | Shares | | | | | | | | Shares | | | | | |
Proceeds from shares sold | |
Class A | | | 4,113,717 | | | | 60,597,284 | | | | 2,084,687 | | | | 27,533,950 | |
Class C | | | 268,796 | | | | 3,062,171 | | | | 192,101 | | | | 2,045,595 | |
Administrator Class | | | 1,538,764 | | | | 23,150,690 | | | | 1,546,441 | | | | 19,850,044 | |
Institutional Class | | | 2,894,403 | | | | 42,700,368 | | | | 564,328 | | | | 7,724,961 | |
| | | | |
| | | | |
| | | | | | | 129,510,513 | | | | | | | | 57,154,550 | |
| | | | |
Reinvestment of distributions | |
Class A | | | 5,657,801 | | | | 65,404,176 | | | | 1,731,116 | | | | 22,071,725 | |
Class C | | | 398,400 | | | | 3,489,984 | | | | 116,005 | | | | 1,198,329 | |
Administrator Class | | | 419,248 | | | | 4,955,513 | | | | 307,642 | | | | 3,990,121 | |
Institutional Class | | | 620,076 | | | | 7,372,701 | | | | 123,913 | | | | 1,610,864 | |
| | | | |
| | | | |
| | | | | | | 81,222,374 | | | | | | | | 28,871,039 | |
| | | | |
Payment for shares redeemed | |
Class A | | | (4,727,403 | ) | | | (66,144,891 | ) | | | (3,040,823 | ) | | | (38,796,202 | ) |
Class C | | | (914,962 | ) | | | (9,401,210 | ) | | | (323,924 | ) | | | (3,371,408 | ) |
Administrator Class | | | (1,645,125 | ) | | | (21,244,618 | ) | | | (4,102,652 | ) | | | (57,561,216 | ) |
Institutional Class | | | (1,697,391 | ) | | | (23,893,325 | ) | | | (561,375 | ) | | | (7,267,274 | ) |
| | | | |
| | | | |
| | | | | | | (120,684,044 | ) | | | | | | | (106,996,100 | ) |
| | | | |
Net increase (decrease) in net assets resulting from capital share transactions | | | | | | | 90,048,843 | | | | | | | | (20,970,511 | ) |
| | | | |
Total increase in net assets | | | | | | | 71,175,613 | | | | | | | | 77,274,864 | |
| | | | |
| | |
Net assets | | | | | | | | |
Beginning of period | | | | | | | 416,132,513 | | | | | | | | 338,857,649 | |
| | | | |
End of period | | | | | | $ | 487,308,126 | | | | | | | $ | 416,132,513 | |
| | | | |
| 1 | Effective for all filings after November 4, 2018, the SEC prospectively eliminated the requirement to parenthetically disclose undistributed net investment income at the end of the period and permitted the aggregation of distributions, with the exception of tax basis returns of capital. Accumulated net investment loss at March 31, 2018 was $860. The disaggregated distributions information for the year ended March 31, 2018 is included in Note 7,Distributions to Shareholders,in the notes to the financial statements. |
The accompanying notes are an integral part of these financial statements.
| | | | |
| 18 | | Wells Fargo Specialized Technology Fund | | Financial highlights |
(For a share outstanding throughout each period)
| | | | | | | | | | | | | | | | | | | | |
| | | Year ended March 31 | |
| CLASS A | | 2019 | | | 2018 | | | 2017 | | | 2016 | | | 2015 | |
Net asset value, beginning of period | | | $14.08 | | | | $10.95 | | | | $9.39 | | | | $10.74 | | | | $10.65 | |
Net investment loss | | | (0.11 | ) | | | (0.10 | )1 | | | (0.03 | )1 | | | (0.06 | ) | | | (0.06 | ) |
Net realized and unrealized gains (losses) on investments | | | 2.06 | | | | 4.20 | | | | 2.17 | | | | 0.02 | | | | 1.43 | |
| | | | | | | | | | | | | | | | | | | | |
Total from investment operations | | | 1.95 | | | | 4.10 | | | | 2.14 | | | | (0.04 | ) | | | 1.37 | |
Distributions to shareholders from | | | | | | | | | | | | | | | | | | | | |
Net realized gains | | | (2.70 | ) | | | (0.97 | ) | | | (0.58 | ) | | | (1.31 | ) | | | (1.28 | ) |
Net asset value, end of period | | | $13.33 | | | | $14.08 | | | | $10.95 | | | | $9.39 | | | | $10.74 | |
Total return2 | | | 16.80 | % | | | 38.41 | % | | | 23.55 | % | | | (0.66 | )% | | | 13.24 | % |
Ratios to average net assets (annualized) | | | | | | | | | | | | | | | | | | | | |
Gross expenses | | | 1.40 | % | | | 1.41 | % | | | 1.44 | % | | | 1.45 | % | | | 1.52 | % |
Net expenses | | | 1.39 | % | | | 1.41 | % | | | 1.44 | % | | | 1.45 | % | | | 1.51 | % |
Net investment loss | | | (0.77 | )% | | | (0.75 | )% | | | (0.28 | )% | | | (0.53 | )% | | | (0.58 | )% |
Supplemental data | | | | | | | | | | | | | | | | | | | | |
Portfolio turnover rate | | | 107 | % | | | 109 | % | | | 131 | % | | | 153 | % | | | 119 | % |
Net assets, end of period (000s omitted) | | | $401,990 | | | | $353,552 | | | | $266,329 | | | | $267,811 | | | | $168,108 | |
| 1 | Calculated based upon average shares outstanding |
| 2 | Total return calculations do not include any sales charges. |
The accompanying notes are an integral part of these financial statements.
| | | | | | |
| Financial highlights | | Wells Fargo Specialized Technology Fund | | | 19 | |
(For a share outstanding throughout each period)
| | | | | | | | | | | | | | | | | | | | |
| | | Year ended March 31 | |
| CLASS C | | 2019 | | | 2018 | | | 2017 | | | 2016 | | | 2015 | |
Net asset value, beginning of period | | | $11.38 | | | | $9.06 | | | | $7.92 | | | | $9.33 | | | | $9.47 | |
Net investment loss | | | (0.17 | )1 | | | (0.16 | ) | | | (0.09 | )1 | | | (0.12 | )1 | | | (0.13 | )1 |
Net realized and unrealized gains (losses) on investments | | | 1.58 | | | | 3.45 | | | | 1.81 | | | | 0.02 | | | | 1.27 | |
| | | | | | | | | | | | | | | | | | | | |
Total from investment operations | | | 1.41 | | | | 3.29 | | | | 1.72 | | | | (0.10 | ) | | | 1.14 | |
Distributions to shareholders from | | | | | | | | | | | | | | | | | | | | |
Net realized gains | | | (2.70 | ) | | | (0.97 | ) | | | (0.58 | ) | | | (1.31 | ) | | | (1.28 | ) |
Net asset value, end of period | | | $10.09 | | | | $11.38 | | | | $9.06 | | | | $7.92 | | | | $9.33 | |
Total return2 | | | 16.01 | % | | | 37.45 | % | | | 22.59 | % | | | (1.45 | )% | | | 12.44 | % |
Ratios to average net assets (annualized) | | | | | | | | | | | | | | | | | | | | |
Gross expenses | | | 2.15 | % | | | 2.16 | % | | | 2.19 | % | | | 2.20 | % | | | 2.27 | % |
Net expenses | | | 2.14 | % | | | 2.16 | % | | | 2.19 | % | | | 2.20 | % | | | 2.26 | % |
Net investment loss | | | (1.52 | )% | | | (1.49 | )% | | | (1.03 | )% | | | (1.34 | )% | | | (1.33 | )% |
Supplemental data | | | | | | | | | | | | | | | | | | | | |
Portfolio turnover rate | | | 107 | % | | | 109 | % | | | 131 | % | | | 153 | % | | | 119 | % |
Net assets, end of period (000s omitted) | | | $11,615 | | | | $15,932 | | | | $12,827 | | | | $13,797 | | | | $14,143 | |
| 1 | Calculated based upon average shares outstanding |
| 2 | Total return calculations do not include any sales charges. |
The accompanying notes are an integral part of these financial statements.
| | | | |
| 20 | | Wells Fargo Specialized Technology Fund | | Financial highlights |
(For a share outstanding throughout each period)
| | | | | | | | | | | | | | | | | | | | |
| | | Year ended March 31 | |
| ADMINISTRATOR CLASS | | 2019 | | | 2018 | | | 2017 | | | 2016 | | | 2015 | |
Net asset value, beginning of period | | | $14.34 | | | | $11.12 | | | | $9.52 | | | | $10.86 | | | | $10.74 | |
Net investment loss | | | (0.09 | )1 | | | (0.09 | )1 | | | (0.02 | ) | | | (0.05 | ) | | | (0.05 | ) |
Net realized and unrealized gains (losses) on investments | | | 2.10 | | | | 4.28 | | | | 2.20 | | | | 0.02 | | | | 1.45 | |
| | | | | | | | | | | | | | | | | | | | |
Total from investment operations | | | 2.01 | | | | 4.19 | | | | 2.18 | | | | (0.03 | ) | | | 1.40 | |
Distributions to shareholders from | | | | | | | | | | | | | | | | | | | | |
Net realized gains | | | (2.70 | ) | | | (0.97 | ) | | | (0.58 | ) | | | (1.31 | ) | | | (1.28 | ) |
Net asset value, end of period | | | $13.65 | | | | $14.34 | | | | $11.12 | | | | $9.52 | | | | $10.86 | |
Total return | | | 17.02 | % | | | 38.55 | % | | | 23.65 | % | | | (0.56 | )% | | | 13.42 | % |
Ratios to average net assets (annualized) | | | | | | | | | | | | | | | | | | | | |
Gross expenses | | | 1.32 | % | | | 1.33 | % | | | 1.36 | % | | | 1.35 | % | | | 1.36 | % |
Net expenses | | | 1.29 | % | | | 1.32 | % | | | 1.33 | % | | | 1.33 | % | | | 1.35 | % |
Net investment loss | | | (0.65 | )% | | | (0.66 | )% | | | (0.17 | )% | | | (0.48 | )% | | | (0.42 | )% |
Supplemental data | | | | | | | | | | | | | | | | | | | | |
Portfolio turnover rate | | | 107 | % | | | 109 | % | | | 131 | % | | | 153 | % | | | 119 | % |
Net assets, end of period (000s omitted) | | | $22,480 | | | | $19,140 | | | | $39,833 | | | | $32,373 | | | | $31,842 | |
| 1 | Calculated based upon average shares outstanding |
The accompanying notes are an integral part of these financial statements.
| | | | | | |
| Financial highlights | | Wells Fargo Specialized Technology Fund | | | 21 | |
(For a share outstanding throughout each period)
| | | | | | | | | | | | |
| | | Year ended March 31 | |
| INSTITUTIONAL CLASS | | 2019 | | | 2018 | | | 20171 | |
Net asset value, beginning of period | | | $14.37 | | | | $11.12 | | | | $10.42 | |
Net investment income (loss) | | | (0.07 | ) | | | (0.05 | ) | | | 0.01 | 2 |
Net realized and unrealized gains (losses) on investments | | | 2.13 | | | | 4.27 | | | | 1.27 | |
| | | | | | | | | | | | |
Total from investment operations | | | 2.06 | | | | 4.22 | | | | 1.28 | |
Distributions to shareholders from | | | | | | | | | | | | |
Net realized gains | | | (2.70 | ) | | | (0.97 | ) | | | (0.58 | ) |
Net asset value, end of period | | | $13.73 | | | | $14.37 | | | | $11.12 | |
Total return3 | | | 17.25 | % | | | 38.91 | % | | | 12.97 | % |
Ratios to average net assets (annualized) | | | | | | | | | | | | |
Gross expenses | | | 1.07 | % | | | 1.08 | % | | | 1.11 | % |
Net expenses | | | 1.04 | % | | | 1.07 | % | | | 1.08 | % |
Net investment income (loss) | | | (0.42 | )% | | | (0.40 | )% | | | 0.17 | % |
Supplemental data | | | | | | | | | | | | |
Portfolio turnover rate | | | 107 | % | | | 109 | % | | | 131 | % |
Net assets, end of period (000s omitted) | | | $51,223 | | | | $27,509 | | | | $19,869 | |
| 1 | For the period from October 31, 2016 (commencement of class operations) to March 31, 2017 |
| 2 | Calculated based upon average shares outstanding |
| 3 | Returns for periods of less than one year are not annualized. |
The accompanying notes are an integral part of these financial statements.
| | | | |
| 22 | | Wells Fargo Specialized Technology Fund | | Notes to financial statements |
1. ORGANIZATION
Wells Fargo Funds Trust (the “Trust”), a Delaware statutory trust organized on March 10, 1999, is anopen-end management investment company registered under the Investment Company Act of 1940, as amended (the “1940 Act”). As an investment company, the Trust follows the accounting and reporting guidance in Financial Accounting Standards Board(“FASB”)Accounting Standards Codification Topic 946, Financial Services – Investment Companies. These financial statements report on the Wells Fargo Specialized Technology Fund (the “Fund”) which is anon-diversified series of the Trust.
2. SIGNIFICANT ACCOUNTING POLICIES
The following significant accounting policies, which are consistently followed in the preparation of the financial statements of the Fund, are in conformity with U.S. generally accepted accounting principles which require management to make estimates and assumptions that affect the reported amounts of assets and liabilities, disclosure of contingent assets and liabilities at the date of the financial statements, and the reported amounts of revenues and expenses during the reporting period. Actual results could differ from those estimates.
Securities valuation
All investments are valued each business day as of the close of regular trading on the New York Stock Exchange (generally 4 p.m. Eastern Time), although the Fund may deviate from this calculation time under unusual or unexpected circumstances.
Equity securities that are listed on a foreign or domestic exchange or market are valued at the official closing price or, if none, the last sales price. If no sale occurs on the principal exchange or market that day, a fair value price will be determined in accordance with the Fund’s Valuation Procedures.
The values of securities denominated in foreign currencies are translated into U.S. dollars at rates provided by an independent foreign currency pricing source at a time each business day specified by the Wells Fargo Asset Management Pricing Committee at Wells Fargo Funds Management, LLC (“Funds Management”).
Many securities markets and exchanges outside the U.S. close prior to the close of the New York Stock Exchange and therefore may not fully reflect trading or events that occur after the close of the principal exchange in which the foreign securities are traded, but before the close of the New York Stock Exchange. If such trading or events are expected to materially affect the value of such securities, then fair value pricing procedures approved by the Board of Trustees of the Fund are applied. These procedures take into account multiple factors including movements in U.S. securities markets after foreign exchanges close. Foreign securities that are fair valued under these procedures are categorized as Level 2 and the application of these procedures may result in transfers between Level 1 and Level 2. Depending on market activity, such fair valuations may be frequent. Such fair value pricing may result in net asset values that are higher or lower than net asset values based on the last reported sales price or latest quoted bid price. On March 31, 2019, such fair value pricing was not used in pricing foreign securities.
Investments in registeredopen-end investment companies are valued at net asset value. Interests innon-registered investment companies that are redeemable at net asset value are fair valued normally at net asset value.
Investments which are not valued using any of the methods discussed above are valued at their fair value, as determined in good faith by the Board of Trustees. The Board of Trustees has established a Valuation Committee comprised of the Trustees and has delegated to it the authority to take any actions regarding the valuation of portfolio securities that the Valuation Committee deems necessary or appropriate, including determining the fair value of portfolio securities, unless the determination has been delegated to the Wells Fargo Asset Management Pricing Committee. The Board of Trustees retains the authority to make or ratify any valuation decisions or approve any changes to the Valuation Procedures as it deems appropriate. On a quarterly basis, the Board of Trustees receives reports on any valuation actions taken by the Valuation Committee or the Wells Fargo Asset Management Pricing Committee which may include items for ratification.
Foreign currency translation
The accounting records of the Fund are maintained in U.S. dollars. The values of other assets and liabilities denominated in foreign currencies are translated into U.S. dollars at rates provided by an independent foreign currency pricing source at a time each business day specified by the Wells Fargo Asset Management Pricing Committee. Purchases and sales of securities, and income and expenses are converted at the rate of exchange on the respective dates of such transactions. Net realized foreign exchange gains or losses arise from sales of foreign currencies, currency gains or losses realized between the trade and settlement dates on securities transactions, and the difference between the amounts of dividends, interest and
| | | | | | |
| Notes to financial statements | | Wells Fargo Specialized Technology Fund | | | 23 | |
foreign withholding taxes recorded and the U.S. dollar equivalent of the amounts actually paid or received. Net unrealized foreign exchange gains and losses arise from changes in the fair value of assets and liabilities other than investments in securities resulting from changes in exchange rates. The changes in net assets arising from changes in exchange rates of securities and the changes in net assets resulting from changes in market prices of securities are not separately presented. Such changes are included in net realized and unrealized gains or losses from investments.
Forward foreign currency contracts
The Fund is subject to foreign currency risk in the normal course of pursuing its investment objectives. A forward foreign currency contract is an agreement between two parties to purchase or sell a specific currency for an agreed-upon price at a future date. The Fund enters into forward foreign currency contracts to facilitate transactions in foreign-denominated securities and to attempt to minimize the risk to the Fund from adverse changes in the relationship between currencies. Forward foreign currency contracts are recorded at the forward rate andmarked-to-market daily. When the contracts are closed, realized gains and losses arising from such transactions are recorded as realized gains or losses on forward foreign currency contracts. The Fund could be exposed to risks if the counterparties to the contracts are unable to meet the terms of their contracts or if the value of the foreign currency changes unfavorably. The Fund’s maximum risk of loss from counterparty credit risk is the unrealized gains on the contracts. This risk may be mitigated if there is a master netting arrangement between the Fund and the counterparty.
Securities lending
The Fund may lend its securities from time to time in order to earn additional income in the form of fees or interest on securities received as collateral or the investment of any cash received as collateral. The Fund continues to receive interest or dividends on the securities loaned. The Fund receives collateral in the form of cash or securities with a value at least equal to the value of the securities on loan. The value of the loaned securities is determined at the close of each business day and any additional required collateral is delivered to the Fund on the next business day. In a securities lending transaction, the net asset value of the Fund will be affected by an increase or decrease in the value of the securities loaned and by an increase or decrease in the value of the instrument in which collateral is invested. The amount of securities lending activity undertaken by the Fund fluctuates from time to time. In the event of default or bankruptcy by the borrower, the Fund may be prevented from recovering the loaned securities or gaining access to the collateral or may experience delays or costs in doing so. In addition, the investment of any cash collateral received may lose all or part of its value. The Fund has the right under the lending agreement to recover the securities from the borrower on demand.
The Fund lends its securities through an unaffiliated securities lending agent. Cash collateral received in connection with its securities lending transactions is invested in Securities Lending Cash Investments, LLC (the “Securities Lending Fund”). The Securities Lending Fund is exempt from registration under Section 3(c)(7) of the 1940 Act and is managed by Funds Management and is subadvised by Wells Capital Management Incorporated (“WellsCap”), an affiliate of Funds Management and an indirect wholly owned subsidiary of Wells Fargo & Company (“Wells Fargo”). Funds Management receives an advisory fee starting at 0.05% and declining to 0.01% as the average daily net assets of the Securities Lending Fund increase. All of the fees received by Funds Management are paid to WellsCap for its services as subadviser. The Securities Lending Fund seeks to provide a positive return compared to the daily Fed Funds Open Rate by investing in high-quality, U.S. dollar-denominated short-term money market instruments. Securities Lending Fund investments are valued at the evaluated bid price provided by an independent pricing service. Income earned from investment in the Securities Lending Fund (net of fees and rebates), if any, is included in income from affiliated securities on the Statement of Operations.
Security transactions and income recognition
Securities transactions are recorded on a trade date basis. Realized gains or losses are recorded on the basis of identified cost.
Dividend income is recognized on theex-dividend date, except for certain dividends from foreign securities, which are recorded as soon as the custodian verifies theex-dividend date. Dividend income from foreign securities is recorded net of foreign taxes withheld where recovery of such taxes is not assured.
Distributions to shareholders
Distributions to shareholders from net investment income and any net realized gains are recorded on theex-dividend date and paid at least annually. Such distributions are determined in accordance with income tax regulations and may differ from U.S. generally accepted accounting principles. Dividend sources are estimated at the time of declaration. The tax character of distributions is determined as of the Fund’s fiscal year end. Therefore, a portion of the Fund’s distributions made prior to the Fund’s fiscal year end may be categorized as a tax return of capital at year end.
| | | | |
| 24 | | Wells Fargo Specialized Technology Fund | | Notes to financial statements |
Federal and other taxes
The Fund intends to continue to qualify as a regulated investment company by distributing substantially all of its investment company taxable income and any net realized capital gains (after reduction for capital loss carryforwards) sufficient to relieve it from all, or substantially all, federal income taxes. Accordingly, no provision for federal income taxes was required.
The Fund’s income and federal excise tax returns and all financial records supporting those returns for the prior three fiscal years are subject to examination by the federal and Delaware revenue authorities. Management has analyzed the Fund’s tax positions taken on federal, state, and foreign tax returns for all open tax years and does not believe that there are any uncertain tax positions that require recognition of a tax liability.
As of March 31, 2019, the aggregate cost of all investments for federal income tax purposes was $334,334,452 and the unrealized gains (losses) consisted of:
| | | | |
| |
Gross unrealized gains | | $ | 178,565,548 | |
| |
Gross unrealized losses | | | (3,009,875 | ) |
| |
Net unrealized gains | | $ | 175,555,673 | |
Reclassifications are made to the Fund’s capital accounts for permanent tax differences to reflect income and gains available for distribution (or available capital loss carryforwards) under federal income tax regulations. U.S. generally accepted accounting principles require that certain components of net assets be adjusted to reflect permanent differences between financial and tax reporting. These reclassifications have no effect on net assets or net asset values per share. The primary permanent difference causing such reclassification is due to net operating losses. At March 31, 2019, as a result of permanentbook-to-tax differences, the following reclassification adjustments were made on the Statement of Assets and Liabilities:
| | |
| Paid-in capital | | Total distributable earnings |
| |
| $(2,760,676) | | $2,760,676 |
As of March 31, 2019, the Fund had a qualified late-year ordinary loss of $783,694 which will be recognized on the first day of the following fiscal year.
Class allocations
The separate classes of shares offered by the Fund differ principally in applicable sales charges, distribution, shareholder servicing, and administration fees. Class specific expenses are charged directly to that share class. Investment income, common expenses, and realized and unrealized gains (losses) on investments are allocated daily to each class of shares based on the relative proportion of net assets of each class.
3. FAIR VALUATION MEASUREMENTS
Fair value measurements of investments are determined within a framework that has established a fair value hierarchy based upon the various data inputs utilized in determining the value of the Fund’s investments. The three-level hierarchy gives the highest priority to unadjusted quoted prices in active markets for identical assets or liabilities (Level 1) and the lowest priority to unobservable inputs (Level 3). The Fund’s investments are classified within the fair value hierarchy based on the lowest level of input that is significant to the fair value measurement. The inputs are summarized into three broad levels as follows:
| ∎ | | Level 1 – quoted prices in active markets for identical securities |
| ∎ | | Level 2 – other significant observable inputs (including quoted prices for similar securities, interest rates, prepayment speeds, credit risk, etc.) |
| ∎ | | Level 3 – significant unobservable inputs (including the Fund’s own assumptions in determining the fair value of investments) |
The inputs or methodologies used for valuing investments in securities are not necessarily an indication of the risk associated with investing in those securities.
| | | | | | |
| Notes to financial statements | | Wells Fargo Specialized Technology Fund | | | 25 | |
The following is a summary of the inputs used in valuing the Fund’s assets and liabilities as of March 31, 2019:
| | | | | | | | | | | | | | | | |
| | | | |
| | | Quoted prices
(Level 1) | | | Other significant
observable inputs
(Level 2) | | | Significant
unobservable inputs (Level 3) | | | Total | |
| | | | |
Assets | | | | | | | | | | | | | | | | |
Investments in: | | | | | | | | | | | | | | | | |
| | | | |
Common stocks | | | | | | | | | | | | | | | | |
| | | | |
Communication services | | $ | 52,016,399 | | | $ | 54 | | | $ | 0 | | | $ | 52,016,453 | |
| | | | |
Consumer discretionary | | | 27,701,989 | | | | 0 | | | | 0 | | | | 27,701,989 | |
| | | | |
Health care | | | 1,392,289 | | | | 0 | | | | 0 | | | | 1,392,289 | |
| | | | |
Industrials | | | 5,206,960 | | | | 0 | | | | 0 | | | | 5,206,960 | |
| | | | |
Information technology | | | 384,378,614 | | | | 0 | | | | 0 | | | | 384,378,614 | |
| | | | |
Short-term investments | | | | | | | | | | | | | | | | |
| | | | |
Investment companies | | | 18,717,955 | | | | 20,475,865 | | | | 0 | | | | 39,193,820 | |
| | | | |
Total assets | | $ | 489,414,206 | | | $ | 20,475,919 | | | $ | 0 | | | $ | 509,890,125 | |
Additional sector, industry or geographic detail is included in the Portfolio of Investments.
At March 31, 2019, the Fund did not have any transfers into/out of Level 3.
4. TRANSACTIONS WITH AFFILIATES AND OTHER EXPENSES
Management fee
Funds Management, an indirect wholly owned subsidiary of Wells Fargo, is the manager of the Fund and provides advisory and fund-level administrative services under an investment management agreement. Under the investment management agreement, Funds Management is responsible for, among other services, implementing the investment objectives and strategies of the Fund, supervising the subadviser and providing fund-level administrative services in connection with the Fund’s operations. As compensation for its services under the investment management agreement, Funds Management is entitled to receive a management fee at the following annual rate based on the Fund’s average daily net assets:
| | | | |
| Average daily net assets | | Management fee | |
| |
First $500 million | | | 0.880 | % |
| |
Next $500 million | | | 0.875 | |
| |
Next $1 billion | | | 0.850 | |
| |
Next $2 billion | | | 0.825 | |
| |
Next $1 billion | | | 0.800 | |
| |
Next $5 billion | | | 0.790 | |
| |
Over $10 billion | | | 0.780 | |
For the year ended March 31, 2019, the management fee was equivalent to an annual rate of 0.88% of the Fund’s average daily net assets.
Funds Management has retained the services of a subadviser to provide daily portfolio management to the Fund. The fee for subadvisory services is borne by Funds Management. Allianz Global Investors U.S. LLC, which is not an affiliate of Funds Management, is the subadviser to the Fund and is entitled to receive a fee from Funds Management at an annual rate starting at 0.80% and declining to 0.55% as the average daily net assets of the Fund increase.
| | | | |
| 26 | | Wells Fargo Specialized Technology Fund | | Notes to financial statements |
Administration fees
Under a class-level administration agreement, Funds Management provides class-level administrative services to the Fund, which includes paying fees and expenses for services provided by the transfer agent,sub-transfer agents, omnibus account servicers and record-keepers. As compensation for its services under the class-level administration agreement, Funds Management receives an annual fee which is calculated based on the average daily net assets of each class as follows:
| | | | |
| | | Class-level
administration fee | |
| |
Class A, Class C | | | 0.21 | % |
| |
Administrator Class, Institutional Class | | | 0.13 | |
Funds Management has contractually waived and/or reimbursed management and administration fees to the extent necessary to maintain certain net operating expense ratios for the Fund. When each class of the Fund has exceeded its expense cap, Funds Management has waived fees and/or reimbursed expenses from fund level expenses on a proportionate basis and then from class specific expenses. When only certain classes exceed their expense caps, waivers and/or reimbursements are applied against class specific expenses before fund level expenses. Funds Management has committed through July 31, 2019 to waive fees and/or reimburse expenses to the extent necessary to cap the Fund’s expenses at 1.38% for Class A shares, 2.13% for Class C shares, 1.28% for Administrator Class shares, and 1.03% for Institutional Class shares. Prior to or after the commitment expiration date, the cap may be increased or the commitment to maintain the cap may be terminated only with the approval of the Board of Trustees. Prior to August 1, 2018, the Fund’s expenses were capped at 1.41% for Class A shares, 2.16% for Class C shares, 1.31% for Administrator Class shares and 1.06% for Institutional Class shares.
Distribution fee
The Trust has adopted a distribution plan for Class C shares of the Fund pursuant to Rule12b-1 under the 1940 Act. A distribution fee is charged to Class C shares and paid to Wells Fargo Funds Distributor, LLC (“Funds Distributor”), the principal underwriter, at an annual rate of 0.75% of the average daily net assets of Class C shares.
In addition, Funds Distributor is entitled to receive thefront-end sales charge from the purchase of Class A shares and a contingent deferred sales charge on the redemption of certain Class A shares. Funds Distributor is also entitled to receive the contingent deferred sales charges from redemptions of Class C shares. For the year ended March 31, 2019, Funds Distributor received $26,790 from the sale of Class A shares and $178 in contingent deferred sales charges from redemptions of Class C shares. No contingent deferred sales charges were incurred by Class A for the year ended March 31, 2019.
Shareholder servicing fees
The Trust has entered into contracts with one or more shareholder servicing agents, whereby Class A, Class C, and Administrator Class of the Fund are charged a fee at an annual rate of 0.25% of the average daily net assets of each respective class. A portion of these total shareholder servicing fees were paid to affiliates of Wells Fargo.
Interfund transactions
The Fund may purchase or sell portfolio investment securities to certain other Wells Fargo affiliates pursuant to Rule17a-7 under the 1940 Act and under procedures adopted by the Board of Trustees. The procedures have been designed to ensure that these interfund transactions, which do not incur broker commissions, are effected at current market prices.
5. INVESTMENT PORTFOLIO TRANSACTIONS
Purchases and sales of investments, excluding U.S. government obligations (if any) and short-term securities, for the year ended March 31, 2019 were $471,617,981 and $466,911,864 respectively.
6. DERIVATIVE TRANSACTIONS
During the year ended March 31, 2019, the Fund entered into forward foreign currency contracts for economic hedging purposes. The Fund had average contract amounts of $3,278 in forward foreign currency contracts to sell during the year ended March 31, 2019.
The fair value, realized gains or losses and change in unrealized gains or losses, if any, on derivative instruments are reflected in the corresponding financial statement captions.
| | | | | | |
| Notes to financial statements | | Wells Fargo Specialized Technology Fund | | | 27 | |
7. BANK BORROWINGS
The Trust (excluding the money market funds), Wells Fargo Master Trust and Wells Fargo Variable Trust are parties to a $280,000,000 revolving credit agreement whereby the Fund is permitted to use bank borrowings for temporary or emergency purposes, such as to fund shareholder redemption requests. Interest under the credit agreement is charged to the Fund based on a borrowing rate equal to the higher of the Federal Funds rate in effect on that day plus 1.25% or the overnight LIBOR rate in effect on that day plus 1.25%. In addition, an annual commitment fee equal to 0.25% of the unused balance is allocated to each participating fund.
For the year ended March 31, 2019, there were no borrowings by the Fund under the agreement.
8. DISTRIBUTIONS TO SHAREHOLDERS
The tax character of distributions paid during the years ended March 31, 2018 and March 31, 2017 were as follows:
| | | | | | | | |
| | | Year ended March 31 | |
| | |
| | | 2019 | | | 2018 | |
| | |
Ordinary income | | $ | 30,325,807 | | | $ | 7,805,610 | |
| | |
Long-term capital gain | | | 53,023,323 | | | | 21,959,943 | |
As of March 31, 2019, the components of distributable earnings on a tax basis were as follows:
| | | | |
Undistributed long-term gains | | Late-year ordinary losses deferred | | Unrealized gains |
| | |
| $36,973,608 | | $(783,694) | | $175,552,975 |
Effective for all filings after November 4, 2018, the Securities and Exchange Commission eliminated the requirement to separately state the components of distributions to shareholders under U.S. generally accepted accounting principles. The amounts of distributions to shareholders for the year ended March 31, 2018 were as follows:
| | | | |
| | | Net realized
gains | |
| |
Class A | | | $22,775,603 | |
| |
Class C | | | 1,248,847 | |
| |
Administrator Class | | | 3,999,359 | |
| |
Institutional Class | | | 1,741,744 | |
9. CONCENTRATION RISK
The Fund invests a substantial portion of its assets in technology companies and, therefore, would be more affected by changes in the technology sector than would be a fund whose investments are not heavily weighted in the sector.
10. INDEMNIFICATION
Under the Trust’s organizational documents, the officers and Trustees have been granted certain indemnification rights against certain liabilities that may arise out of performance of their duties to the Trust. Additionally, in the normal course of business, the Trust may enter into contracts with service providers that contain a variety of indemnification clauses. The Trust’s maximum exposure under these arrangements is dependent on future claims that may be made against the Fund and, therefore, cannot be estimated.
11. NEW ACCOUNTING PRONOUNCEMENT
In August 2018, FASB issued Accounting Standards Update (“ASU”)No. 2018-13, Fair Value Measurement (Topic 820)Disclosure Framework—Changes to the Disclosure Requirements for Fair Value Measurement. ASU2018-13 updates the disclosure requirements for fair value measurements by modifying or removing certain disclosures and adding certain new disclosures. The amendments are effective for fiscal years, and interim periods within those fiscal years, beginning after December 15, 2019. Early adoption is permitted. Management has adopted the removal and modification of disclosures early, as permitted, and will adopt the additional new disclosures at the effective date.
| | | | |
| 28 | | Wells Fargo Specialized Technology Fund | | Report of independent registered public accounting firm |
TO THE SHAREHOLDERS OF THE FUND AND BOARD OF TRUSTEES OF WELLS FARGO FUNDS TRUST:
Opinion on the Financial Statements
We have audited the accompanying statement of assets and liabilities of Wells Fargo Specialized Technology Fund (the Fund), one of the funds constituting Wells Fargo Funds Trust, including the portfolio of investments, as of March 31, 2019, the related statement of operations for the year then ended, the statements of changes in net assets for each of the years in the two-year period then ended, and the related notes (collectively, the financial statements) and the financial highlights for each of the years or periods in the five-year period then ended. In our opinion, the financial statements and financial highlights present fairly, in all material respects, the financial position of the Fund as of March 31, 2019, the results of its operations for the year then ended, the changes in its net assets for each of the years in the two-year period then ended, and the financial highlights for each of the years or periods in the five-year period then ended, in conformity with U.S. generally accepted accounting principles.
Basis for Opinion
These financial statements and financial highlights are the responsibility of the Fund’s management. Our responsibility is to express an opinion on these financial statements and financial highlights based on our audits. We are a public accounting firm registered with the Public Company Accounting Oversight Board (United States) (PCAOB) and are required to be independent with respect to the Fund in accordance with the U.S. federal securities laws and the applicable rules and regulations of the Securities and Exchange Commission and the PCAOB.
We conducted our audits in accordance with the standards of the PCAOB. Those standards require that we plan and perform the audit to obtain reasonable assurance about whether the financial statements and financial highlights are free of material misstatement, whether due to error or fraud. Our audits included performing procedures to assess the risks of material misstatement of the financial statements and financial highlights, whether due to error or fraud, and performing procedures that respond to those risks. Such procedures included examining, on a test basis, evidence regarding the amounts and disclosures in the financial statements and financial highlights. Such procedures also included confirmation of securities owned as of March 31, 2019, by correspondence with the custodian and brokers, or by other appropriate auditing procedures. Our audits also included evaluating the accounting principles used and significant estimates made by management, as well as evaluating the overall presentation of the financial statements and financial highlights. We believe that our audits provide a reasonable basis for our opinion.

We have not been able to determine the specific year that we began serving as the auditor of one or more Wells Fargo Funds investment companies; however we are aware that we have served as the auditor of one or more Wells Fargo Funds investment companies since at least 1955.
Boston, Massachusetts
May 24, 2019
| | | | | | |
| Other information (unaudited) | | Wells Fargo Specialized Technology Fund | | | 29 | |
TAX INFORMATION
For corporate shareholders, pursuant to Section 854 of the Internal Revenue Code, 5.83% of ordinary income dividends qualify for the corporate dividends-received deduction for the fiscal year ended March 31, 2019.
Pursuant to Section 852 of the Internal Revenue Code, $53,023,323 was designated as a 20% rate gain distribution for the fiscal year ended March 31, 2019.
Pursuant to Section 854 of the Internal Revenue Code, $2,265,338 of income dividends paid during the fiscal year ended March 31, 2019 has been designated as qualified dividend income (QDI).
For the fiscal year ended March 31, 2019, $30,325,807 has been designated as short-term capital gain dividends for nonresident alien shareholders pursuant to Section 871 of the Internal Revenue Code.
PROXY VOTING INFORMATION
A description of the policies and procedures used to determine how to vote proxies relating to portfolio securities is available, upon request, by calling1-800-222-8222, visiting our website atwfam.com, or visiting the SEC website at sec.gov. Information regarding how the Fund voted proxies relating to portfolio securities during the most recent12-month period ended June 30 is available on the Fund’s website atwfam.comor by visiting the SEC website at sec.gov.
PORTFOLIO HOLDINGS INFORMATION
The complete portfolio holdings for the Fund are publicly available monthly on the Fund’s website (wfam.com), on aone-month delayed basis. In addition, top ten holdings information (excluding derivative positions) for the Fund is publicly available on the Fund’s website on a monthly,seven-day or more delayed basis. The Fund files its complete schedule of portfolio holdings with the SEC for the first and third quarters of each fiscal year on FormN-Q, which is available by visiting the SEC website at sec.gov. In addition, the Fund’s FormN-Q may be reviewed and copied at the SEC’s Public Reference Room in Washington, DC, and at regional offices in New York City, at 233 Broadway, and in Chicago, at 175 West Jackson Boulevard, Suite 900. Information about the Public Reference Room may be obtained by calling1-800-SEC-0330.
| | | | |
| 30 | | Wells Fargo Specialized Technology Fund | | Other information (unaudited) |
BOARD OF TRUSTEES AND OFFICERS
Each of the Trustees and Officers1 listed in the table below acts in identical capacities for each fund in the Wells Fargo family of funds, which consists of 151 mutual funds comprising the Wells Fargo Funds Trust, Wells Fargo Variable Trust, Wells Fargo Master Trust and fourclosed-end funds (collectively the “Fund Complex”). This table should be read in conjunction with the Prospectus and the Statement of Additional Information2. The mailing address of each Trustee and Officer is 525 Market Street, 12th Floor, San Francisco, CA 94105. Each Trustee and Officer serves an indefinite term, however, each Trustee serves such term until reaching the mandatory retirement age established by the Trustees.
Independent Trustees
| | | | | | |
Name and year of birth | | Position held and length of service* | | Principal occupations during past five years or longer | | Current other public company or
investment company
directorships |
| | | |
William R. Ebsworth (Born 1957) | | Trustee, since 2015 | | Retired. From 1984 to 2013, equities analyst, portfolio manager, research director and chief investment officer at Fidelity Management and Research Company in Boston, Tokyo, and Hong Kong, and retired in 2013 as Chief Investment Officer of Fidelity Strategic Advisers, Inc. where he led a team of investment professionals managing client assets. Prior thereto, Board member of Hong Kong Securities Clearing Co., Hong Kong Options Clearing Corp., the Thailand International Fund, Ltd., Fidelity Investments Life Insurance Company, and Empire Fidelity Investments Life Insurance Company. Audit Committee Chair and Investment Committee Chair of the Vincent Memorial Hospital Endowment(non-profit organization). Mr. Ebsworth is a CFA® charterholder. | | N/A |
| | | |
Jane A. Freeman (Born 1953) | | Trustee, since 2015; Chair Liaison, since 2018 | | Retired. From 2012 to 2014 and 1999 to 2008, Chief Financial Officer of Scientific Learning Corporation. From 2008 to 2012, Ms. Freeman provided consulting services related to strategic business projects. Prior to 1999, Portfolio Manager at Rockefeller & Co. and Scudder, Stevens & Clark. Board member of the Harding Loevner Funds from 1996 to 2014, serving as both Lead Independent Director and chair of the Audit Committee. Board member of the Russell Exchange Traded Funds Trust from 2011 to 2012 and the chair of the Audit Committee. Ms. Freeman is a Board Member of The Ruth Bancroft Garden(non-profit organization). She is also an inactive Chartered Financial Analyst. | | N/A |
| | | |
Isaiah Harris, Jr.3 (Born 1952) | | Trustee, since 2009; Audit Committee Chairman, since 2019 | | Retired. Chairman of the Board of CIGNA Corporation since 2009, and Director since 2005. From 2003 to 2011, Director of Deluxe Corporation. Prior thereto, President and CEO of BellSouth Advertising and Publishing Corp. from 2005 to 2007, President and CEO of BellSouth Enterprises from 2004 to 2005 and President of BellSouth Consumer Services from 2000 to 2003. Emeritus member of the Iowa State University Foundation Board of Governors. Emeritus Member of the Advisory Board of Iowa State University School of Business. Advisory Board Member, Palm Harbor Academy (private school). Advisory Board Member, Child Evangelism Fellowship(non-profit). Mr. Harris is a certified public accountant (inactive status). | | CIGNA Corporation |
| | | |
Judith M. Johnson (Born 1949) | | Trustee, since 2008; Audit Committee Chairman, from 2009 to 2018 | | Retired. Prior thereto, Chief Executive Officer and Chief Investment Officer of Minneapolis Employees Retirement Fund from 1996 to 2008. Ms. Johnson is an attorney, certified public accountant and a certified managerial accountant. | | N/A |
| | | | | | |
| Other information (unaudited) | | Wells Fargo Specialized Technology Fund | | | 31 | |
| | | | | | |
Name and year of birth | | Position held and length of service* | | Principal occupations during past five years or longer | | Current other public company or
investment company
directorships |
| | | |
David F. Larcker (Born 1950) | | Trustee, since 2009 | | James Irvin Miller Professor of Accounting at the Graduate School of Business, Stanford University, Director of the Corporate Governance Research Initiative and Senior Faculty of The Rock Center for Corporate Governance since 2006. From 2005 to 2008, Professor of Accounting at the Graduate School of Business, Stanford University. Prior thereto, Ernst & Young Professor of Accounting at The Wharton School, University of Pennsylvania from 1985 to 2005. | | N/A |
| | | |
Olivia S. Mitchell (Born 1953) | | Trustee, since 2006; Nominating and Governance Committee Chairman, since 2018 | | International Foundation of Employee Benefit Plans Professor, Wharton School of the University of Pennsylvania since 1993. Director of Wharton’s Pension Research Council and Boettner Center on Pensions & Retirement Research, and Research Associate at the National Bureau of Economic Research. Previously, Cornell University Professor from 1978 to 1993. | | N/A |
| | | |
Timothy J. Penny (Born 1951) | | Trustee, since 1996; Chairman, since 2018 | | President and Chief Executive Officer of Southern Minnesota Initiative Foundation, anon-profit organization, since 2007. Member of the Board of Trustees of NorthStar Education Finance, Inc., anon-profit organization, since 2007. | | N/A |
| | | |
James G. Polisson (Born 1959) | | Trustee, since 2018 | | Retired. Chief Marketing Officer, Source (ETF) UK Services, Ltd, from 2015 to 2017. From 2012 to 2015, Principal of The Polisson Group, LLC, a management consulting, corporate advisory and principal investing company. Chief Executive Officer and Managing Director at Russell Investments, Global Exchange Traded Funds from 2010 to 2012. Managing Director of Barclays Global Investors from 1998 to 2010 and Global Chief Marketing Officer for iShares and Barclays Global Investors from 2000 to 2010. Trustee of the San Francisco Mechanics’ Institute, anon-profit organization, from 2013 to 2015. Board member of the Russell Exchange Traded Fund Trust from 2011 to 2012. Director of Barclays Global Investors Holdings Deutschland GmbH from 2006 to 2009. Mr. Polisson is an attorney and has a retired status with the Massachusetts and District of Columbia Bar Associations. | | N/A |
| | | |
Pamela Wheelock (Born 1959) | | Trustee, since 2018 | | Board member of the Destination Medical Center Economic Development Agency, Rochester, Minnesota since 2019. Chief Operating Officer, Twin Cities Habitat for Humanity from 2017 to 2019. Vice President of University Services, University of Minnesota from 2012 to 2016. Prior thereto, on the Board of Directors, Governance Committee and Finance Committee for the Minnesota Philanthropy Partners (Saint Paul Foundation) from 2012 to 2018, Interim Chief Executive Officer of Blue Cross Blue Shield of Minnesota from 2011 to 2012, Chairman of the Board from 2009 to 2012 and Board Director from 2003 to 2015. Vice President, Leadership and Community Engagement, Bush Foundation, Saint Paul, Minnesota (a private foundation) from 2009 to 2011. Executive Vice President and Chief Financial Officer, Minnesota Sports and Entertainment from 2004 to 2009 and Senior Vice President from 2002 to 2004. Executive Vice President of the Minnesota Wild Foundation from 2004 to 2008. Commissioner of Finance, State of Minnesota, from 1999 to 2002. Currently Board Chair of the Minnesota Wild Foundation since 2010. | | N/A |
| * | Length of service dates reflect the Trustee’s commencement of service with the Trust’s predecessor entities, where applicable. |
| | | | |
| 32 | | Wells Fargo Specialized Technology Fund | | Other information (unaudited) |
Officers
| | | | | | |
Name and year of birth | | Position held and
length of service | | Principal occupations during past five years or longer | | |
| | | |
Andrew Owen (Born 1960) | | President, since 2017 | | Executive Vice President of Wells Fargo & Company and Head of Affiliated Managers, Wells Fargo Asset Management, since 2014. In addition, Mr. Owen is currently President, Chief Executive Officer and Director of Wells Fargo Funds Management, LLC since 2017. Prior thereto, Executive Vice President responsible for marketing, investments and product development for Wells Fargo Funds Management, LLC, from 2009 to 2014. | | |
| | | |
Nancy Wiser1 (Born 1967) | | Treasurer, since 2012 | | Executive Vice President of Wells Fargo Funds Management, LLC since 2011. Chief Operating Officer and Chief Compliance Officer at LightBox Capital Management LLC, from 2008 to 2011. | | |
| | | |
Alexander Kymn (Born 1973) | | Secretary and Chief Legal Officer, since 2018 | | Senior Company Counsel of Wells Fargo Bank, N.A. since 2018 (previously Senior Counsel from 2007 to 2018). Vice President of Wells Fargo Funds Management, LLC from 2008 to 2014. | | |
| | | |
Michael H. Whitaker (Born 1967) | | Chief Compliance Officer, since 2016 | | Senior Vice President and Chief Compliance Officer since 2016. Senior Vice President and Chief Compliance Officer for Fidelity Investments from 2007 to 2016. | | |
| | | |
David Berardi (Born 1975) | | Assistant Treasurer, since 2009 | | Vice President of Wells Fargo Funds Management, LLC since 2009. Vice President of Evergreen Investment Management Company, LLC from 2008 to 2010. Manager of Fund Reporting and Control for Evergreen Investment Management Company, LLC from 2004 to 2010. | | |
| | | |
Jeremy DePalma1 (Born 1974) | | Assistant Treasurer, since 2009 | | Senior Vice President of Wells Fargo Funds Management, LLC since 2009. Senior Vice President of Evergreen Investment Management Company, LLC from 2008 to 2010 and head of the Fund Reporting and Control Team within Fund Administration from 2005 to 2010. | | |
| 1 | Nancy Wiser acts as Treasurer of 65 funds in the Fund Complex. Jeremy DePalma acts as Treasurer of 86 funds and Assistant Treasurer of 65 funds in the Fund Complex. |
| 2 | The Statement of Additional Information includes additional information about the Trustees and is available, without charge, upon request, by calling1-800-222-8222 or by visiting the website atwfam.com. |
| 3 | Mr. Harris became Chairman of the Audit Committee effective January 1, 2019. |
| | | | | | |
| Appendix A (unaudited) | | Wells Fargo Specialized Technology Fund | | | 33 | |
SALES CHARGE REDUCTIONS AND WAIVERS FOR CERTAIN INTERMEDIARIES
Raymond James & Associates, Inc., Raymond James Financial Services & Raymond James affiliates (“Raymond James”)
Effective on or about March 1, 2019, shareholders purchasing Fund shares through a Raymond James platform or account will be eligible only for the following load waivers(front-end sales charge waivers and contingent deferred, orback-end, sales charge waivers) and discounts, which may differ from those disclosed elsewhere in the Fund’s Prospectus or SAI.
Front-end Sales Load Waivers on Class A shares Available at Raymond James
| | • | | Shares purchased in an investment advisory program. |
| | • | | Shares purchased through reinvestment of capital gains distributions and dividend reinvestment when purchasing shares of the same fund (but not any other fund within the fund family). |
| | • | | Employees and registered representatives of Raymond James or its affiliates and their family members as designated by Raymond James. |
| | • | | Shares purchased from the proceeds of redemptions within the same fund family, provided (1) the repurchase occurs within 90 days following the redemption, (2) the redemption and purchase occur in the same account, and (3) redeemed shares were subject to afront-end or deferred sales load (known as Rights of Reinstatement). |
| | • | | A shareholder in the fund’s Class C shares will have their shares automatically exchanged at net asset value to Class A shares (or the appropriate share class) of the fund if the shares are no longer subject to a CDSC and the exchange is in line with the policies and procedures of Raymond James. |
CDSC Waivers on Class A and C Shares Available at Raymond James
| | • | | Death or disability of the shareholder. |
| | • | | Shares sold as part of a systematic withdrawal plan as described in the Fund’s Prospectus. |
| | • | | Return of excess contributions from an IRA Account. |
| | • | | Shares sold as part of a required minimum distribution for IRA and retirement accounts due to the shareholder reaching age 70½ as described in the Fund’s prospectus. |
| | • | | Shares sold to pay Raymond James fees but only if the transaction is initiated by Raymond James. |
| | • | | Shares acquired through a right of reinstatement. |
Front-end Load Discounts Available at Raymond James: Breakpoints, and/or Rights of Accumulation
| | • | | Breakpoints as described in the Fund’s Prospectus. |
| | • | | Rights of accumulation which entitle shareholders to breakpoint discounts will be automatically calculated based on the aggregated holding of fund family assets held by accounts within the purchaser’s household at Raymond James. Eligible fund family assets not held at Raymond James may be included in the rights of accumulation calculation only if the shareholder notifies his or her financial advisor about such assets. |
This page is intentionally left blank.
This page is intentionally left blank.
This page is intentionally left blank.

For more information
More information about Wells Fargo Funds is available free upon request. To obtain literature, please write, visit the Fund’s website, or call:
Wells Fargo Funds
P.O. Box 219967
Kansas City, MO 64121-9967
Website: wfam.com
Individual investors: 1-800-222-8222
Retail investment professionals: 1-888-877-9275
Institutional investment professionals:
1-866-765-0778
This report and the financial statements contained herein are submitted for the general information of the shareholders of the Fund. If this report is used for promotional purposes, distribution of the report must be accompanied or preceded by a current prospectus. Before investing, please consider the investment objectives, risks, charges, and expenses of the investment. For a current prospectus and, if available, a summary prospectus, containing this information, call1-800-222-8222 or visit the Fund’s website atwfam.com. Read the prospectus carefully before you invest or send money.
Wells Fargo Asset Management (WFAM) is the trade name for certain investment advisory/management firms owned by Wells Fargo & Company. These firms include but are not limited to Wells Capital Management Incorporated and Wells Fargo Funds Management, LLC. Certain products managed by WFAM entities are distributed by Wells Fargo Funds Distributor, LLC (a broker-dealer and Member FINRA).
This material is for general informational and educational purposes only and is NOT intended to provide investment advice or a recommendation of any kind—including a recommendation for any specific investment, strategy, or plan.
INVESTMENT PRODUCTS: NOT FDIC INSURED ◾ NO BANK GUARANTEE ◾ MAY LOSE VALUE
© 2019 Wells Fargo Funds Management, LLC. All rights reserved.
| | |
 | | 401597 05-19 A317/AR317 03-19 |
Annual Report
March 31, 2019

Wells Fargo Utility and Telecommunications Fund

Beginning on January 1, 2021, as permitted by new regulations adopted by the Securities and Exchange Commission, paper copies of the Wells Fargo Funds’ annual and semi-annual shareholder reports issued after this date will no longer be sent by mail, unless you specifically request paper copies of the reports. Instead, the reports will be made available on the Funds’ website, and you will be notified by mail each time a report is posted and provided with a website address to access the report.
If you already elected to receive shareholder reports electronically, you will not be affected by this change and you need not take any action. You may elect to receive shareholder reports and other communications from the Fund electronically at any time by contacting your financial intermediary (such as a broker-dealer or bank) or, if you are a direct investor, by calling 1-800-222-8222 or by enrolling at wellsfargo.com/advantagedelivery.
You may elect to receive all future reports in paper free of charge. If you invest through a financial intermediary, you can contact your financial intermediary to request that you continue to receive paper copies of your shareholder reports; if you invest directly with the Fund, you can call 1-800-222-8222. Your election to receive reports in paper will apply to all Wells Fargo Funds held in your account with your financial intermediary or, if you are a direct investor, to all Wells Fargo Funds that you hold.

Reduce clutter. Save trees.
Sign up for electronic delivery of prospectuses and shareholder reports atwellsfargo.com/advantagedelivery
Contents
The views expressed and any forward-looking statements are as of March 31, 2019, unless otherwise noted, and are those of the Fund managers and/or Wells Fargo Asset Management. Discussions of individual securities, or the markets generally, or any Wells Fargo Fund are not intended as individual recommendations. Future events or results may vary significantly from those expressed in any forward-looking statements. The views expressed are subject to change at any time in response to changing circumstances in the market. Wells Fargo and the Fund disclaim any obligation to publicly update or revise any views expressed or forward-looking statements.
INVESTMENT PRODUCTS: NOT FDIC INSURED ◾ NO BANK GUARANTEE ◾ MAY LOSE VALUE
| | | | |
| 2 | | Wells Fargo Utility and Telecommunications Fund | | Letter to shareholders (unaudited) |

Andrew Owen
President
Wells Fargo Funds
Global trade tensions escalated during the second quarter of 2018.
Dear Shareholder:
We are pleased to offer you this annual report for the Wells Fargo Utility and Telecommunications Fund for the 12-month period that ended March 31, 2019. An upward trend for short-term interest rates, inflation concerns, trade tensions, and geopolitical events contributed to investment market volatility for much of 2018. Equity investor sentiment improved during the first quarter of 2019 thanks to a shift in U.S. Federal Reserve (Fed) policy and consistent if not spectacular economic and business growth metrics.
For the period, U.S. stocks, as measured by the S&P 500 Index,1 gained 9.50% and international stocks, as measured by the MSCI ACWI ex USA Index (Net),2 declined 4.22%. Based on the MSCI EM Index (Net),3 emerging market stocks fell 7.41%. For bond investors, the Bloomberg Barclays U.S. Aggregate Bond Index4 added 4.48% while the Bloomberg Barclays Global Aggregate ex-USD Index5 lost 4.13%. The Bloomberg Barclays Municipal Bond Index6 added 5.38%, and the ICE BofAML U.S. High Yield Index7 gained 5.94%.
Trade tensions and U.S. interest rates influenced markets.
Global trade tensions escalated during the second quarter of 2018. A tit-for-tat tariff spat intensified between the U.S. and other governments. The Fed raised the federal funds rate by 25 basis points (bps; 100 bps equal 1.00%) to a target range of between 1.75% and 2.00% in June 2018. Market index results reflected the global concerns. The MSCI ACWI ex USA Index (Net) lost 2.61%, while the Bloomberg Barclays Global Aggregate ex-USD Index dropped 4.76%.
Not all news was bad. The U.S. Bureau of Economic Analysis reported second-quarter annualized gross domestic product (GDP) growth of 4.2%. Hiring improved. Unemployment declined. Consumer confidence and spending increased. The S&P 500 Index recorded a 3.43% second-quarter gain. Stocks of companies with smaller capitalizations did even better, as measured by the Russell 2000® Index,8 adding 7.75%.
| 1 | The S&P 500 Index consists of 500 stocks chosen for market size, liquidity, and industry group representation. It is a market-value-weighted index with each stock’s weight in the index proportionate to its market value. You cannot invest directly in an index. |
| 2 | The Morgan Stanley Capital International (MSCI) All Country World Index (ACWI) ex USA Index (Net) is a free-float-adjusted market-capitalization-weighted index that is designed to measure the equity market performance of developed markets, excluding the United States and Canada. Source: MSCI. MSCI makes no express or implied warranties or representations and shall have no liability whatsoever with respect to any MSCI data contained herein. The MSCI data may not be further redistributed or used as a basis for other indices or any securities or financial products. This report is not approved, reviewed, or produced by MSCI. You cannot invest directly in an index. |
| 3 | The MSCI Emerging Markets (EM) Index (Net) is a free-float-adjusted market-capitalization-weighted index that is designed to measure large- and mid-cap equity market performance of emerging markets. The MSCI EM Index (Net) consists of the following 24 emerging market country indices: Brazil, Chile, China, Colombia, Czech Republic, Egypt, Greece, Hungary, India, Indonesia, Korea, Malaysia, Mexico, Pakistan, Peru, the Philippines, Poland, Qatar, Russia, South Africa, Taiwan, Thailand, Turkey, and the United Arab Emirates. You cannot invest directly in an index. |
| 4 | The Bloomberg Barclays U.S. Aggregate Bond Index is a broad-based benchmark that measures the investment-grade, U.S. dollar-denominated, fixed-rate taxable bond market, including Treasuries, government-related and corporate securities, mortgage-backed securities (agency fixed-rate and hybrid adjustable-rate mortgage pass-throughs), asset-backed securities, and commercial mortgage-backed securities. You cannot invest directly in an index. |
| 5 | The Bloomberg Barclays Global Aggregate ex-USD Index is an unmanaged index that provides a broad-based measure of the global investment-grade fixed-income markets excluding the U.S. dollar-denominated debt market. You cannot invest directly in an index. |
| 6 | The Bloomberg Barclays Municipal Bond Index is an unmanaged index composed of long-term tax-exempt bonds with a minimum credit rating of Baa. You cannot invest directly in an index. |
| 7 | The ICE BofAML U.S. High Yield Index is a market-capitalization-weighted index of domestic and Yankee high-yield bonds. The index tracks the performance of high-yield securities traded in the U.S. bond market. You cannot invest directly in an index. Copyright 2019. ICE Data Indices, LLC. All rights reserved. |
| 8 | The Russell 2000® Index measures the performance of the 2,000 smallest companies in the Russell 3000® Index, which represents approximately 8% of the total market capitalization of the Russell 3000® Index. You cannot invest directly in an index. |
| | | | | | |
| Letter to shareholders (unaudited) | | Wells Fargo Utility and Telecommunications Fund | | | 3 | |
Investors appeared to shake off lingering concerns during the third quarter.
Favorable third-quarter economic indicators and corporate earnings reports encouraged domestic stock investors. U.S. trade negotiations with Mexico and Canada progressed. The Conference Board Consumer Confidence Index®9 reached its highest level in 18 years during September 2018. The Fed raised the federal funds rate by 25 bps to a target range of between 2.00% and 2.25% in September 2018. For the quarter that ended September 30, 2018, the S&P 500 Index added 7.71%.
Investors in international markets were not as confident. Tensions between the U.S. and China increased. The U.S. imposed $200 billion in tariffs on Chinese goods. China reacted with $60 billion in tariffs on U.S. goods. Economic growth in China caused concern. The Bank of England raised its monetary policy rate to 0.75% in August 2018. During the quarter, the MSCI ACWI ex USA Index (Net) gained 0.71%. The MSCI EM Index (Net) declined 1.09%. In fixed-income markets, U.S. bonds were flat, as measured by the Bloomberg Barclays U.S. Aggregate Bond Index. The Bloomberg Barclays Global Aggregate ex-USD Index fell 1.74%.
Conflicting data unsettled markets during the fourth quarter.
November’s U.S. midterm elections shifted control of the House of Representatives from Republicans to Democrats, presaging potential partisan clashes. Third-quarter U.S. GDP was announced at an annualized 3.4% rate, lower than the second-quarter rate. Brexit efforts stalled ahead of the March 2019 deadline. The People’s Bank of China cut reserve requirement ratios, accelerated infrastructure spending, and cut taxes even as the value of the yuan declined to low levels last seen in 2008.
December’s S&P 500 Index performance was the worst since 1931. Globally,fixed-income investments fared better than stocks during the last two months of the year. The Fed increased the federal funds rate by 25 bps in December 2018 to a target range of between 2.25% and 2.50% and softened its outlook for 2019 rate increases.
The market climbs a wall of worry.
Investors entered 2019 with reasons to be concerned. A partial U.S. government shutdown driven by partisan spending and immigration policy disputes extended into January. Investors expected high levels of stock market volatility to continue based on the VIX10.
January’s returns tended to support the investing adage that markets climb a wall of worry. The S&P 500 Index gained 8.01% for the month that ended January 31, 2019, its best monthly performance in 30 years. Returns for the MSCI ACWI ex USA Index (Net), the Bloomberg Barclays U.S. Aggregate Bond Index, and the Bloomberg Barclays Global Aggregate ex-USD Index also were positive. The Fed indicated that it would pause its program of regular rate increases during 2019 as inflation remained low. Businesses and investors responded positively to the shift in policy.
In February, concerns over slowing global growth reemerged. The Bureau of Economic Analysis announced fourth-quarter 2018 GDP grew at an annualized 2.2% rate, down from the 4.2% annualized rate for the second quarter and the 3.4% annualized rate for the third quarter. Analysts attributed the lower growth rate to a slowing housing market and larger trade deficit. The U.S. Department of
Favorable third-quarter economic indicators and corporate earnings reports encouraged domestic stock investors.
| 9 | The Conference Board Consumer Confidence Index® measures the degree of optimism on the state of the U.S. economy that consumers are expressing through their activities of savings and spending. You cannot invest directly in an index. |
| 10 | The Chicago Board Options Exchange Market Volatility Index (VIX) is a popular measure of the implied volatility of S&P 500 Index options. It represents one measure of the market’s expectation of stock market volatility over the next 30-day period. You cannot invest directly in an index. |
| | | | |
| 4 | | Wells Fargo Utility and Telecommunications Fund | | Letter to shareholders (unaudited) |
Labor said that the economy created just 20,000 jobs in February 2019. In a February report, the Bank of England forecast the slowest growth since the financial crisis for 2019. China and the U.S., while putting future tariffs on hold for the time being, continued to wrangle over trade issues.
By the end of March 2019, the combination of dovish Fed sentiment and consistent, if not spectacular, economic and business metrics reinforced investors’ enthusiasm for equity investing. Monthly job creation data regained its momentum. Corporate profits, while lower than 2018’s lofty levels, remained consistent. Inflation rates were relatively low in the U.S., Europe, and Japan. China announced a roughly $300 billion stimulus package through tax and fee cuts intended to reinvigorate economic growth.
Don’t let short-term uncertainty derail long-term investment goals.
Periods of investment uncertainty can present challenges, but experience has taught us that maintaining long-term investment goals can be an effective way to plan for the future. To help you create a sound strategy based on your personal goals and risk tolerance, Wells Fargo Funds offers more than 100 mutual funds spanning a wide range of asset classes and investment styles. Although diversification cannot guarantee an investment profit or prevent losses, we believe it can be an effective way to manage investment risk and potentially smooth out overall portfolio performance. We encourage investors to know their investments and to understand that appropriate levels of risk-taking may unlock opportunities.
Thank you for choosing to invest with Wells Fargo Funds. We appreciate your confidence in us and remain committed to helping you meet your financial needs.
Sincerely,

Andrew Owen
President
Wells Fargo Funds
For further information about your Fund, contact your investment professional, visit our website atwfam.com, or call us directly at1-800-222-8222.
This page is intentionally left blank.
| | | | |
| 6 | | Wells Fargo Utility and Telecommunications Fund | | Performance highlights (unaudited) |
Investment objective
The Fund seeks total return, consisting of current income and capital appreciation.
Manager
Wells Fargo Funds Management, LLC
Subadviser
Crow Point Partners, LLC
Portfolio manager
Timothy P. O’Brien , CFA®‡
Average annual total returns (%) as of March 31, 2019
| | | | | | | | | | | | | | | | | | | | | | | | | | | | | | | | | | |
| | | | | Including sales charge | | | Excluding sales charge | | | Expense ratios1 (%) | |
| | | Inception date | | 1 year | | | 5 year | | | 10 year | | | 1 year | | | 5 year | | | 10 year | | | Gross | | | Net2 | |
| | | | | | | | | |
| Class A (EVUAX)3 | | 1-4-1994 | | | 12.71 | | | | 6.89 | | | | 11.40 | | | | 19.59 | | | | 8.16 | | | | 12.07 | | | | 1.17 | | | | 1.14 | |
| | | | | | | | | |
| Class C (EVUCX)3 | | 9-2-1994 | | | 17.65 | | | | 7.34 | | | | 11.23 | | | | 18.65 | | | | 7.34 | | | | 11.23 | | | | 1.92 | | | | 1.89 | |
| | | | | | | | | |
| Administrator Class (EVUDX)4 | | 7-30-2010 | | | – | | | | – | | | | – | | | | 19.80 | | | | 8.35 | | | | 12.26 | | | | 1.09 | | | | 0.95 | |
| | | | | | | | | |
| Institutional Class (EVUYX)3 | | 2-28-1994 | | | – | | | | – | | | | – | | | | 20.03 | | | | 8.51 | | | | 12.43 | | | | 0.84 | | | | 0.78 | |
| | | | | | | | | |
| S&P 500 Utilities Index5 | | – | | | – | | | | – | | | | – | | | | 19.33 | | | | 10.89 | | | | 12.88 | | | | – | | | | – | |
| | | | | | | | | |
| S&P 500 Index6 | | – | | | – | | | | – | | | | – | | | | 9.50 | | | | 10.91 | | | | 15.92 | | | | – | | | | – | |
Figures quoted represent past performance, which is no guarantee of future results, and do not reflect taxes that a shareholder may pay on fund distributions or the redemption of fund shares. Investment return and principal value of an investment will fluctuate so that an investor’s shares, when redeemed, may be worth more or less than their original cost. Performance shown without sales charges would be lower if sales charges were reflected. Current performance may be lower or higher than the performance data quoted, which assumes the reinvestment of dividends and capital gains. Current month-end performance is available on the Fund’s website,wfam.com.
While the S&P 500 Index is comprised of U.S. equity securities of companies diversified across ten sectors, the Fund’s holdings are concentrated primarily in utilities and telecommunication services stocks. Therefore, the performance of the S&P 500 Index is displayed only to show how the concentrated Fund performed compared with a diversified selection of U.S. equity securities.
Index returns do not include transaction costs associated with buying and selling securities, any mutual fund fees or expenses, or any taxes. It is not possible to invest directly in an index.
For Class A shares, the maximum front-end sales charge is 5.75%. For Class C shares, the maximum contingent deferred sales charge is 1.00%. Performance including a contingent deferred sales charge assumes the sales charge for the corresponding time period. Administrator Class and Institutional Class shares are sold without a front-end sales charge or contingent deferred sales charge.
Stock values fluctuate in response to the activities of individual companies and general market and economic conditions. Bond values fluctuate in response to the financial condition of individual issuers, general market and economic conditions, and changes in interest rates. Changes in market conditions and government policies may lead to periods of heightened volatility in the bond market and reduced liquidity for certain bonds held by the Fund. In general, when interest rates rise, bond values fall and investors may lose principal value. Interest rate changes and their impact on the Fund and its share price can be sudden and unpredictable. The use of derivatives may reduce returns and/or increase volatility. Funds that concentrate their investments in limited sectors, such as utilities and telecommunication services, are more vulnerable to adverse market, economic, regulatory, political, or other developments affecting those sectors. Certain investment strategies tend to increase the total risk of an investment (relative to the broader market). The Fund is exposed to convertible securities risk, foreign investment risk, high-yield securities risk, smaller-company securities risk, non-diversification risk and subsidiary risk. Consult the Fund’s prospectus for additional information on these and other risks.
Please see footnotes on page 7.
| | | | | | |
| Performance highlights (unaudited) | | Wells Fargo Utility and Telecommunications Fund | | | 7 | |
|
| Growth of $10,000 investment as of March 31, 20197 |
|
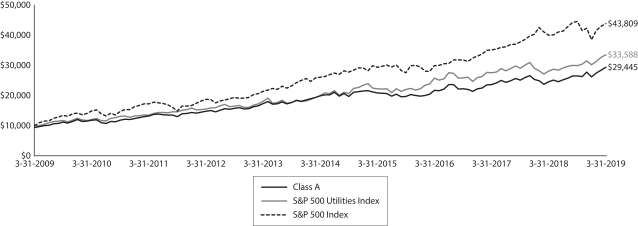 |
| ‡ | CFA® and Chartered Financial Analyst® are trademarks owned by CFA Institute. |
| 1 | Reflects the expense ratios as stated in the most recent prospectuses. The expense ratios shown are subject to change and may differ from the annualized expense ratios shown in the financial highlights of this report. |
| 2 | The manager has contractually committed through July 31, 2019, to waive fees and/or reimburse expenses to the extent necessary to cap the expenses of each class after fee waivers at the amounts shown. Brokerage commissions, stamp duty fees, interest, taxes, acquired fund fees and expenses (if any), and extraordinary expenses are excluded from the expense cap. Prior to or after the commitment expiration date, the cap may be increased or the commitment to maintain the cap may be terminated only with the approval of the Board of Trustees. Without this cap, the Fund’s returns would have been lower. The expense ratio paid by an investor is the net expense ratio (the total annual fund operating expenses after fee waivers) as stated in the prospectuses. |
| 3 | Historical performance shown for this class prior to July 19, 2010, is based on the performance of the same class of the Fund’s predecessor, Evergreen Utility and Telecommunications Fund. |
| 4 | Historical performance shown for Administrator Class shares prior to their inception reflects the performance of Institutional Class shares and has been adjusted to reflect the higher expenses applicable to Administrator Class shares. |
| 5 | The S&P 500 Utilities Index is a market-value-weighted index that measures the performance of all stocks within the utilities sector of the S&P 500 Index. You cannot invest directly in an index. |
| 6 | The S&P 500 Index consists of 500 stocks chosen for market size, liquidity, and industry group representation. It is a market-value-weighted index with each stock’s weight in the index proportionate to its market value. You cannot invest directly in an index. |
| 7 | The chart compares the performance of Class A shares for the most recent ten years with the S&P 500 Utilities Index and the S&P 500 Index. The chart assumes a hypothetical investment of $10,000 in Class A shares and reflects all operating expenses and assumes the maximum initial sales charge of 5.75%. |
| 8 | The ten largest holdings, excluding cash, cash equivalents and any money market funds, are calculated based on the value of the investments divided by total net assets of the Fund. Holdings are subject to change and may have changed since the date specified. |
| 9 | Amounts are calculated based on the total long-term investments of the Fund. These amounts are subject to change and may have changed since the date specified. |
| | | | |
| 8 | | Wells Fargo Utility and Telecommunications Fund | | Performance highlights (unaudited) |
MANAGER’S DISCUSSION
Fund highlights
| ∎ | | The Fund (Class A, excluding sales charges) outperformed its benchmark, the S&P 500 Utilities Index, for the 12-month period that ended March 31, 2019. |
| ∎ | | The Fund benefited from strength in a number of regulated utilities stocks, certain telecommunication services companies, and two payment network companies. |
| ∎ | | A Southern California electric utility, a couple of other U.S. utilities, and an Italian multiutility detracted from performance. |
A strong economy for much of the period accompanied rising energy prices and interest rates.
Energy prices recovered substantially during the 12-month reporting period. Oil prices rose following producer-output reductions and modestly higher demand. The recovery in natural gas prices was less impressive, with demand depressed by comparatively warm winter weather. Interest rates rose during the year on the short end but actually fell about 30 basis points (bps; 100 bps equal 1.00%) on the long end, and the yield curve ended the year very flat. Lower bond yields made the higher dividends of utility stocks relatively more attractive to income-oriented investors and contributed to the relatively strong performance of utility shares in the year just ended.
We made only moderate changes to the Fund during the reporting period.
The Fund’s composition did not change dramatically during the reporting period, and turnover remained low. We initiated positions in CMS Energy Corporation and NextEra Energy Capital Holdings, Incorporated. We increased our positions in A-Mark Precious Metals Incorporated; Perma-Pipe International Holdings, Incorporated; and Shenandoah Telecommunications Company. We sold ALLETE, Incorporated; Preferred Apartment Communities, Incorporated, a real estate investment trust; CenterPoint Energy, Incorporated; Northwestern Corporation; Spark Energy, Incorporated, common shares (although we still hold Spark Energy preferred shares); AT&T Incorporated; and Wheeler Real Estate Investment Trust, Incorporated.
Some of the Fund’s best-performing utility holdings included American Water Works Company, Incorporated, and PNM Resources, Incorporated, both for the second consecutive year. Utility Eversource Energy also contributed to performance. Shenandoah performed particularly well, as did the Visa Incorporated and MasterCard Incorporated positions. The Fund’s lack of exposure to California utility PG&E Corporation, a major weight in the Fund’s benchmark index, also aided relative performance.
Detractors included A-Mark, Perma-Pipe, Edison International, Spark Energy, and Hera S.p.A.
Our outlook for utilities remains, on balance, favorable.
In our view, the fundamentals of regulated network utilities appear strong. Regulated utilities have abundant opportunities to invest in their core businesses at returns we view as attractive. While the U.S. retains adequate power-generation capacity, current regulatory mandates are requiring utilities to increase renewable energy sources and reduce the country’s historical reliance on fossil fuels in general and coal in particular. The development of U.S. shale-gas production has been providing investors with opportunities to make investments in gas gathering, processing, and transportation infrastructure. Overall, utilities may be growing faster than at any time since the 1950s, due to a combination of the drive toward renewables and a massive replacement capital spending cycle, and their growth could be sustainable for the intermediate term or longer. Our outlook for telecommunication services companies generally is less robust, with the legacy local-exchange telephone business in secular decline, cable under pressure, and wireless approaching saturation; however, select telecommunication services stocks likely present opportunities.
Short-term interest rates have begun to normalize after years of central-bank suppression, although the U.S. Federal Reserve now looks to be on hold for the balance of 2019, spooked by the economic hiccup and market swoon in the fourth quarter of calendar-year 2018. We do not believe that rates are likely to go up much on the short or the long end of the yield curve, as inflation seems well contained. A continued low interest rate environment likely should help support the prices of utilities stocks because income-seeking investors favor their relatively generous and growing dividends. Also, the tax environment has remained reasonably favorable for utilities investors. While the tax rate on qualified dividend income increased to 23.8% from 15.0% in 2013, it remains well below the top marginal tax rate for ordinary income and has had little visible impact on the performance of utilities stocks. For now, we view the outlook for utilities as reasonably bright, with many important positives outweighing a few limited concerns.
| | | | | | |
| Performance highlights (unaudited) | | Wells Fargo Utility and Telecommunications Fund | | | 9 | |
| | | | |
| Ten largest holdings (%) as of March 31, 20198 | |
| |
Visa Incorporated Class A | | | 10.41 | |
| |
NextEra Energy Incorporated | | | 8.35 | |
| |
CMS Energy Corporation | | | 8.22 | |
| |
Eversource Energy | | | 7.44 | |
| |
PNM Resources Incorporated | | | 7.01 | |
| |
Alliant Energy Corporation | | | 6.84 | |
| |
Shenandoah Telecommunications Company | | | 6.40 | |
| |
Sempra Energy | | | 6.21 | |
| |
MasterCard Incorporated Class A | | | 5.52 | |
| |
American Water Works Company Incorporated | | | 5.15 | |
|
| Industry distribution as of March 31, 20199 |
|
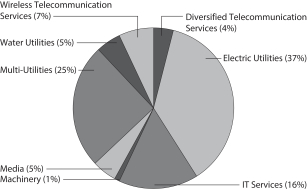
|
Please see footnotes on page 7.
| | | | |
| 10 | | Wells Fargo Utility and Telecommunications Fund | | Fund expenses (unaudited) |
As a shareholder of the Fund, you incur two types of costs: (1) transaction costs, including sales charges (loads) on purchase payments and contingent deferred sales charges (if any) on redemptions and (2) ongoing costs, including management fees, distribution (12b-1) and/or shareholder servicing fees, and other Fund expenses. This example is intended to help you understand your ongoing costs (in dollars) of investing in the Fund and to compare these costs with the ongoing costs of investing in other mutual funds.
The example is based on an investment of $1,000 invested at the beginning of the six-month period and held for the entire period from October 1, 2018 to March 31, 2019.
Actual expenses
The “Actual” line of the table below provides information about actual account values and actual expenses. You may use the information in this line, together with the amount you invested, to estimate the expenses that you paid over the period. Simply divide your account value by $1,000 (for example, an $8,600 account value divided by $1,000 = 8.6), then multiply the result by the number in the “Actual” line under the heading entitled “Expenses paid during period” for your applicable class of shares to estimate the expenses you paid on your account during this period.
Hypothetical example for comparison purposes
The “Hypothetical” line of the table below provides information about hypothetical account values and hypothetical expenses based on the Fund’s actual expense ratio and an assumed rate of return of 5% per year before expenses, which is not the Fund’s actual return. The hypothetical account values and expenses may not be used to estimate the actual ending account balance or expenses you paid for the period. You may use this information to compare the ongoing costs of investing in the Fund and other funds. To do so, compare this 5% hypothetical example with the 5% hypothetical examples that appear in the shareholder reports of the other funds.
Please note that the expenses shown in the table are meant to highlight your ongoing costs only and do not reflect any transactional costs, such as sales charges (loads) and contingent deferred sales charges. Therefore, the “Hypothetical” line of the table is useful in comparing ongoing costs only and will not help you determine the relative total costs of owning different funds. In addition, if these transactional costs were included, your costs would have been higher.
| | | | | | | | | | | | | | | | |
| | | Beginning
account value
10-1-2018 | | | Ending
account value
3-31-2019 | | | Expenses
paid during
the period¹ | | | Annualized net
expense ratio | |
Class A | | | | | | | | | | | | | | | | |
| | | | |
Actual | | $ | 1,000.00 | | | $ | 1,108.78 | | | $ | 5.99 | | | | 1.14 | % |
| | | | |
Hypothetical (5% return before expenses) | | $ | 1,000.00 | | | $ | 1,019.25 | | | $ | 5.74 | | | | 1.14 | % |
Class C | | | | | | | | | | | | | | | | |
| | | | |
Actual | | $ | 1,000.00 | | | $ | 1,104.46 | | | $ | 9.92 | | | | 1.89 | % |
| | | | |
Hypothetical (5% return before expenses) | | $ | 1,000.00 | | | $ | 1,015.51 | | | $ | 9.50 | | | | 1.89 | % |
Administrator Class | | | | | | | | | | | | | | | | |
| | | | |
Actual | | $ | 1,000.00 | | | $ | 1,109.76 | | | $ | 5.00 | | | | 0.95 | % |
| | | | |
Hypothetical (5% return before expenses) | | $ | 1,000.00 | | | $ | 1,020.19 | | | $ | 4.78 | | | | 0.95 | % |
Institutional Class | | | | | | | | | | | | | | | | |
| | | | |
Actual | | $ | 1,000.00 | | | $ | 1,110.82 | | | $ | 4.10 | | | | 0.78 | % |
| | | | |
Hypothetical (5% return before expenses) | | $ | 1,000.00 | | | $ | 1,021.04 | | | $ | 3.93 | | | | 0.78 | % |
| 1 | Expenses paid is equal to the annualized net expense ratio of each class multiplied by the average account value over the period, multiplied by the number of days in the most recent fiscal half-year divided by the number of days in the fiscal year (to reflect the one-half-year period). |
| | | | | | |
| Portfolio of investments—March 31, 2019 | | Wells Fargo Utility and Telecommunications Fund | | | 11 | |
| | | | | | | | | | | | | | | | |
| Security name | | | | | | | | Shares | | | Value | |
| | | | |
Common Stocks: 94.63% | | | | | | | | | | | | | | | | |
| | | | |
Communication Services: 14.50% | | | | | | | | | | | | | | | | |
| | | | |
| Diversified Telecommunication Services: 3.65% | | | | | | | | | | | | | | | | |
| | | | |
Verizon Communications Incorporated | | | | | | | | | | | 250,000 | | | $ | 14,782,500 | |
| | | | | | | | | | | | | | | | |
| | | | |
| Media: 4.44% | | | | | | | | | | | | | | | | |
| | | | |
Comcast Corporation Class A | | | | | | | | | | | 450,200 | | | | 17,998,996 | |
| | | | | | | | | | | | | | | | |
| | | | |
| Wireless Telecommunication Services: 6.41% | | | | | | | | | | | | | | | | |
| | | | |
Shenandoah Telecommunications Company | | | | | | | | | | | 585,000 | | | | 25,950,600 | |
| | | | | | | | | | | | | | | | |
| | | | |
Financials: 0.32% | | | | | | | | | | | | | | | | |
| | | | |
| Diversified Financial Services: 0.32% | | | | | | | | | | | | | | | | |
| | | | |
A-Mark Precious Metals Incorporated † | | | | | | | | | | | 109,999 | | | | 1,308,988 | |
| | | | | | | | | | | | | | | | |
| | | | |
Industrials: 0.58% | | | | | | | | | | | | | | | | |
| | | | |
| Machinery: 0.58% | | | | | | | | | | | | | | | | |
| | | | |
Perma-Pipe International Holdings Incorporated † | | | | | | | | | | | 266,500 | | | | 2,342,535 | |
| | | | | | | | | | | | | | | | |
| | | | |
Information Technology: 15.93% | | | | | | | | | | | | | | | | |
| | | | |
| IT Services: 15.93% | | | | | | | | | | | | | | | | |
| | | | |
MasterCard Incorporated Class A | | | | | | | | | | | 95,000 | | | | 22,367,750 | |
| | | | |
Visa Incorporated Class A | | | | | | | | | | | 270,000 | | | | 42,171,300 | |
| | | | |
| | | | | | | | | | | | | | | 64,539,050 | |
| | | | | | | | | | | | | | | | |
| | | | |
Utilities: 63.30% | | | | | | | | | | | | | | | | |
| | | | |
| Electric Utilities: 34.78% | | | | | | | | | | | | | | | | |
| | | | |
Alliant Energy Corporation | | | | | | | | | | | 588,000 | | | | 27,712,440 | |
| | | | |
American Electric Power Company Incorporated | | | | | | | | | | | 175,000 | | | | 14,656,250 | |
| | | | |
Edison International | | | | | | | | | | | 100,000 | | | | 6,192,000 | |
| | | | |
Eversource Energy | | | | | | | | | | | 425,000 | | | | 30,153,750 | |
| | | | |
NextEra Energy Incorporated | | | | | | | | | | | 175,000 | | | | 33,831,000 | |
| | | | |
PNM Resources Incorporated | | | | | | | | | | | 600,000 | | | | 28,404,000 | |
| | | | |
| | | | | | | | | | | | | | | 140,949,440 | |
| | | | | | | | | | | | | | | | |
| | | | |
| Gas Utilities: 0.02% | | | | | | | | | | | | | | | | |
| | | | |
Spire Incorporated | | | | | | | | | | | 1,000 | | | | 82,290 | |
| | | | | | | | | | | | | | | | |
| | | | |
| Multi-Utilities: 23.35% | | | | | | | | | | | | | | | | |
| | | | |
CMS Energy Corporation | | | | | | | | | | | 600,000 | | | | 33,324,000 | |
| | | | |
Dominion Energy Incorporated | | | | | | | | | | | 269,000 | | | | 20,621,540 | |
| | | | |
Hera SpA | | | | | | | | | | | 1,000,000 | | | | 3,616,523 | |
| | | | |
Public Service Enterprise Group Incorporated | | | | | | | | | | | 200,000 | | | | 11,882,000 | |
| | | | |
Sempra Energy | | | | | | | | | | | 200,000 | | | | 25,172,000 | |
| | | | |
| | | | | | | | | | | | | | | 94,616,063 | |
| | | | | | | | | | | | | | | | |
| | | | |
| Water Utilities: 5.15% | | | | | | | | | | | | | | | | |
| | | | |
American Water Works Company Incorporated | | | | | | | | | | | 200,000 | | | | 20,852,000 | |
| | | | | | | | | | | | | | | | |
| | | | |
Total Common Stocks (Cost $135,737,220) | | | | | | | | | | | | | | | 383,422,462 | |
| | | | | | | | | | | | | | | | |
The accompanying notes are an integral part of these financial statements.
| | | | |
| 12 | | Wells Fargo Utility and Telecommunications Fund | | Portfolio of investments—March 31, 2019 |
| | | | | | | | | | | | | | | | |
| Security name | | Dividend yield | | | | | | Shares | | | Value | |
| | | | |
Preferred Stocks: 2.47% | | | | | | | | | | | | | | | | |
| | | | |
Utilities: 2.47% | | | | | | | | | | | | | | | | |
| | | | |
| Electric Utilities: 0.86% | | | | | | | | | | | | | | | | |
| | | | |
Spark Energy Incorporated « | | | 9.41 | % | | | | | | | 150,000 | | | $ | 3,487,500 | |
| | | | | | | | | | | | | | | | |
| | | | |
| Independent Power & Renewable Electricity Producers: 0.31% | | | | | | | | | | | | | | | | |
| | | | |
NextEra Energy Capital Holdings Incorporated † | | | 0.00 | | | | | | | | 50,000 | | | | 1,268,500 | |
| | | | | | | | | | | | | | | | |
| | | | |
| Multi-Utilities: 1.30% | | | | | | | | | | | | | | | | |
| | | | |
CMS Energy Corporation † | | | 0.00 | | | | | | | | 205,000 | | | | 5,278,750 | |
| | | | | | | | | | | | | | | | |
| | | | |
Total Preferred Stocks (Cost $10,187,100) | | | | | | | | | | | | | | | 10,034,750 | |
| | | | | | | | | | | | | | | | |
| | | | |
| | | Yield | | | | | | | | | | |
| Short-Term Investments: 2.63% | | | | | | | | | | | | | | | | |
| | | | |
| Investment Companies: 2.63% | | | | | | | | | | | | | | | | |
| | | | |
Securities Lending Cash Investments LLC (l)(r)(u) | | | 2.55 | | | | | | | | 137,186 | | | | 137,200 | |
| | | | |
Wells Fargo Government Money Market Fund Select Class (l)(u) | | | 2.38 | | | | | | | | 10,518,041 | | | | 10,518,041 | |
| | | | |
Total Short-Term Investments (Cost $10,655,241) | | | | | | | | | | | | | | | 10,655,241 | |
| | | | | | | | | | | | | | | | |
| | | | | | | | |
| Total investments in securities (Cost $156,579,561) | | | 99.73 | % | | | 404,112,453 | |
| | |
Other assets and liabilities, net | | | 0.27 | | | | 1,076,890 | |
| | | | | | | | |
| Total net assets | | | 100.00 | % | | $ | 405,189,343 | |
| | | | | | | | |
| † | Non-income-earning security |
| « | All or a portion of this security is on loan. |
| (l) | The issuer of the security is an affiliated person of the Fund as defined in the Investment Company Act of 1940. |
| (r) | The investment is a non-registered investment company purchased with cash collateral received from securities on loan. |
| (u) | The rate represents the 7-day annualized yield at period end. |
Investments in Affiliates
An affiliated investment is an investment in which the Fund owns at least 5% of the outstanding voting shares of the issuer or as a result of other relationships, such as the Fund and the issuer having the same investment manager. Transactions with issuers that were either affiliated persons of the Portfolio at the beginning of the period or the end of the period were as follows:
| | | | | | | | | | | | | | | | | | | | | | | | | | | | | | | | | | | | |
| | | Shares,
beginning of
period | | | Shares
purchased | | | Shares
sold | | | Shares,
end of
period | | | Net
realized
gains
(losses) | | | Net change in
unrealized
gains
(losses) | | | Income
from
affiliated
securities | | | Value, end of period | | | % of net assets | |
Common Stocks | | | | | | | | | | | | | | | | | | | | | | | | | | | | | | | | | | | | |
Utilities | | | | | | | | | | | | | | | | | | | | | | | | | | | | | | | | | | | | |
Electric Utilities | | | | | | | | | | | | | | | | | | | | | | | | | | | | | | | | | | | | |
Spark Energy Incorporated Class A * | | | 729,006 | | | | 0 | | | | 729,006 | | | | 0 | | | $ | (158,537 | ) | | $ | (1,882,680 | ) | | $ | 132,132 | | | $ | 0 | | | | 0.00 | % |
| | | | | | | | | |
Short-Term Investments | | | | | | | | | | | | | | | | | | | | | | | | | | | | | | | | | | | | |
Investment Companies | | | | | | | | | | | | | | | | | | | | | | | | | | | | | | | | | | | | |
Securities Lending Cash Investments LLC | | | 1,328,142 | | | | 3,009,753 | | | | 4,200,709 | | | | 137,186 | | | | 0 | | | | 0 | | | | 14,907 | | | | 137,200 | | | | | |
Wells Fargo Government Money Market Fund Select Class | | | 9,340,273 | | | | 63,203,650 | | | | 62,025,882 | | | | 10,518,041 | | | | 0 | | | | 0 | | | | 130,359 | | | | 10,518,041 | | | | | |
| | | | | | | | | | | | | | | | | | | | | | | | | | | | | | | | | | | | |
| | | | | | | | | |
| | | | | | | | | | | | | | | | | | $ | (158,537 | ) | | $ | (1,882,680 | ) | | $ | 277,398 | | | $ | 10,655,241 | | | | 2.63 | % |
| | | | | | | | | | | | | | | | | | | | | | | | | | | | | | | | | | | | |
| | * | No longer held at the end of the period. |
The accompanying notes are an integral part of these financial statements.
| | | | | | |
| Statement of assets and liabilities—March 31, 2019 | | Wells Fargo Utility and Telecommunications Fund | | | 13 | |
| | | | |
| | | | |
| |
Assets | | | | |
Investments in unaffiliated securities (including $131,264 of securities loaned), at value (cost $145,924,320) | | $ | 393,457,212 | |
Investments in affiliated securities, at value (cost $10,655,241) | | | 10,655,241 | |
Foreign currency, at value (cost $276,123) | | | 256,532 | |
Receivable for investments sold | | | 1,100,725 | |
Receivable for Fund shares sold | | | 196,834 | |
Receivable for dividends | | | 348,401 | |
Prepaid expenses and other assets | | | 2,604 | |
| | | | |
Total assets | | | 406,017,549 | |
| | | | |
| |
Liabilities | | | | |
Payable for Fund shares redeemed | | | 227,202 | |
Management fee payable | | | 205,120 | |
Payable upon receipt of securities loaned | | | 137,150 | |
Shareholder servicing fees payable | | | 76,263 | |
Administration fees payable | | | 68,317 | |
Distribution fee payable | | | 12,594 | |
Trustees’ fees and expenses payable | | | 1,901 | |
Accrued expenses and other liabilities | | | 99,659 | |
| | | | |
Total liabilities | | | 828,206 | |
| | | | |
Total net assets | | $ | 405,189,343 | |
| | | | |
| |
NET ASSETS CONSIST OF | | | | |
Paid-in capital | | $ | 154,376,469 | |
Total distributable earnings | | | 250,812,874 | |
| | | | |
Total net assets | | $ | 405,189,343 | |
| | | | |
| |
COMPUTATION OF NET ASSET VALUE AND OFFERING PRICE PER SHARE | | | | |
Net assets – Class A | | $ | 337,847,827 | |
Shares outstanding – Class A1 | | | 14,061,576 | |
Net asset value per share – Class A | | | $24.03 | |
Maximum offering price per share – Class A2 | | | $25.50 | |
Net assets – Class C | | $ | 19,618,235 | |
Shares outstanding – Class C1 | | | 815,307 | |
Net asset value per share – Class C | | | $24.06 | |
Net assets – Administrator Class | | $ | 5,295,969 | |
Shares outstanding – Administrator Class1 | | | 220,187 | |
Net asset value per share – Administrator Class | | | $24.05 | |
Net assets – Institutional Class | | $ | 42,427,312 | |
Shares outstanding – Institutional Class1 | | | 1,766,720 | |
Net asset value per share – Institutional Class | | | $24.01 | |
| 1 | The Fund has an unlimited number of authorized shares. |
| 2 | Maximum offering price is computed as 100/94.25 of net asset value. On investments of $50,000 or more, the offering price is reduced. |
The accompanying notes are an integral part of these financial statements.
| | | | |
| 14 | | Wells Fargo Utility and Telecommunications Fund | | Statement of operations—year ended March 31, 2019 |
| | | | |
| | | | |
| |
Investment income | | | | |
Dividends (net of foreign withholding taxes of $16,751) | | $ | 9,426,980 | |
Income from affiliated securities | | | 295,665 | |
| | | | |
Total investment income | | | 9,722,645 | |
| | | | |
| |
Expenses | | | | |
Management fee | | | 2,419,206 | |
Administration fees | | | | |
Class A | | | 621,830 | |
Class C | | | 77,483 | |
Administrator Class | | | 6,016 | |
Institutional Class | | | 44,918 | |
Shareholder servicing fees | | | | |
Class A | | | 740,274 | |
Class C | | | 92,241 | |
Administrator Class | | | 11,569 | |
Distribution fee | | | | |
Class C | | | 276,723 | |
Custody and accounting fees | | | 23,673 | |
Professional fees | | | 53,193 | |
Registration fees | | | 90,282 | |
Shareholder report expenses | | | 82,294 | |
Trustees’ fees and expenses | | | 22,972 | |
Other fees and expenses | | | 12,887 | |
| | | | |
Total expenses | | | 4,575,561 | |
Less: Fee waivers and/or expense reimbursements | | | (190,558 | ) |
| | | | |
Net expenses | | | 4,385,003 | |
| | | | |
Net investment income | | | 5,337,642 | |
| | | | |
| |
REALIZED AND UNREALIZED GAINS (LOSSES) ON INVESTMENTS | | | | |
| |
Net realized gains (losses) on: | | | | |
Unaffiliated securities | | | 14,229,639 | |
Affiliated securities | | | (158,537 | ) |
| | | | |
Net realized gains on investments | | | 14,071,102 | |
| | | | |
| |
Net change in unrealized gains (losses) on: | | | | |
Unaffiliated securities | | | 50,020,960 | |
Affiliated securities | | | (1,882,680 | ) |
| | | | |
Net change in unrealized gains (losses) on investments | | | 48,138,280 | |
| | | | |
Net realized and unrealized gains (losses) on investments | | | 62,209,382 | |
| | | | |
Net increase in net assets resulting from operations | | $ | 67,547,024 | |
| | | | |
The accompanying notes are an integral part of these financial statements.
| | | | | | |
| Statement of changes in net assets | | Wells Fargo Utility and Telecommunications Fund | | | 15 | |
| | | | | | | | | | | | | | | | |
| | | Year ended
March 31, 2019 | | | Year ended
March 31, 20181 | |
| | | | |
Operations | | | | | | | | | | | | | | | | |
Net investment income | | | | | | $ | 5,337,642 | | | | | | | $ | 5,986,877 | |
Net realized gains (losses) on investments | | | | | | | 14,071,102 | | | | | | | | (3,563,384 | ) |
Net change in unrealized gains (losses) on investments | | | | | | | 48,138,280 | | | | | | | | 13,369,403 | |
| | | | |
Net increase in net assets resulting from operations | | | | | | | 67,547,024 | | | | | | | | 15,792,896 | |
| | | | |
| | | | |
Distributions to shareholders from net investment income and net realized gains | | | | | | | | | | | | | | | | |
Class A | | | | | | | (5,340,753 | ) | | | | | | | (5,216,624 | ) |
Class C | | | | | | | (367,071 | ) | | | | | | | (426,300 | ) |
Administrator Class | | | | | | | (93,347 | ) | | | | | | | (90,935 | ) |
Institutional Class | | | | | | | (753,499 | ) | | | | | | | (572,093 | ) |
| | | | |
Total distributions to shareholders | | | | | | | (6,554,670 | ) | | | | | | | (6,305,952 | ) |
| | | | |
| | | | |
Capital share transactions | | | Shares | | | | | | | | Shares | | | | | |
Proceeds from shares sold | | | | | | | | | | | | | | | | |
Class A | | | 1,320,405 | | | | 29,507,498 | | | | 516,687 | | | | 10,873,178 | |
Class C | | | 54,882 | | | | 1,186,781 | | | | 32,953 | | | | 695,831 | |
Administrator Class | | | 45,614 | | | | 1,005,325 | | | | 69,039 | | | | 1,434,536 | |
Institutional Class | | | 635,353 | | | | 13,820,300 | | | | 667,149 | | | | 13,862,735 | |
| | | | |
| | | | |
| | | | | | | 45,519,904 | | | | | | | | 26,866,280 | |
| | | | |
Reinvestment of distributions | | | | | | | | | | | | | | | | |
Class A | | | 229,766 | | | | 5,021,772 | | | | 231,217 | | | | 4,823,724 | |
Class C | | | 16,325 | | | | 353,472 | | | | 19,292 | | | | 401,388 | |
Administrator Class | | | 4,234 | | | | 92,538 | | | | 4,175 | | | | 87,094 | |
Institutional Class | | | 33,858 | | | | 740,651 | | | | 25,626 | | | | 532,962 | |
| | | | |
| | | | |
| | | | | | | 6,208,433 | | | | | | | | 5,845,168 | |
| | | | |
Payment for shares redeemed | | | | | | | | | | | | | | | | |
Class A | | | (1,517,053 | ) | | | (32,912,173 | ) | | | (2,125,163 | ) | | | (44,280,111 | ) |
Class B | | | N/A | | | | N/A | | | | (34,601 | )2 | | | (704,872 | )2 |
Class C | | | (1,294,523 | ) | | | (28,777,618 | ) | | | (568,843 | ) | | | (11,910,983 | ) |
Administrator Class | | | (59,230 | ) | | | (1,267,063 | ) | | | (101,645 | ) | | | (2,105,048 | ) |
Institutional Class | | | (445,017 | ) | | | (9,601,338 | ) | | | (379,011 | ) | | | (7,884,279 | ) |
| | | | |
| | | | |
| | | | | | | (72,558,192 | ) | | | | | | | (66,885,293 | ) |
| | | | |
Net decrease in net assets resulting from capital share transactions | | | | | | | (20,829,855 | ) | | | | | | | (34,173,845 | ) |
| | | | |
Total increase (decrease) in net assets | | | | | | | 40,162,499 | | | | | | | | (24,686,901 | ) |
| | | | |
| | | | |
Net assets | | | | | | | | | | | | | | | | |
Beginning of period | | | | | | | 365,026,844 | | | | | | | | 389,713,745 | |
| | | | |
End of period | | | | | | $ | 405,189,343 | | | | | | | $ | 365,026,844 | |
| | | | |
| 1 | Effective for all filings after November 4, 2018, the SEC prospectively eliminated the requirement to parenthetically disclose undistributed net investment income at the end of the period and permitted the aggregation of distributions, with the exception of tax basis returns of capital. Undistributed net investment income at March 31, 2018 was $451,894. The disaggregated distributions information for the year ended March 31, 2018 is included in Note 7,Distributions to Shareholders, in the notes to the financial statements. |
| 2 | For the period from April 1, 2017 to May 5, 2017. Effective at the close of business on May 5, 2017, Class B shares were converted to Class A shares and are no longer offered by the Fund. |
The accompanying notes are an integral part of these financial statements.
| | | | |
| 16 | | Wells Fargo Utility and Telecommunications Fund | | Financial highlights |
(For a share outstanding throughout each period)
| | | | | | | | | | | | | | | | | | | | |
| | | Year ended March 31 | |
| CLASS A | | 2019 | | | 2018 | | | 2017 | | | 2016 | | | 2015 | |
Net asset value, beginning of period | | | $20.46 | | | | $20.01 | | | | $18.70 | | | | $18.23 | | | | $17.71 | |
Net investment income | | | 0.32 | | | | 0.34 | | | | 0.35 | | | | 0.31 | | | | 0.29 | |
Net realized and unrealized gains (losses) on investments | | | 3.65 | | | | 0.47 | | | | 1.30 | | | | 0.45 | | | | 0.57 | |
| | | | | | | | | | | | | | | | | | | | |
Total from investment operations | | | 3.97 | | | | 0.81 | | | | 1.65 | | | | 0.76 | | | | 0.86 | |
Distributions to shareholders from | | | | | | | | | | | | | | | | | | | | |
Net investment income | | | (0.34 | ) | | | (0.36 | ) | | | (0.34 | ) | | | (0.29 | ) | | | (0.34 | ) |
Net realized gains | | | (0.06 | ) | | | 0.00 | | | | 0.00 | | | | 0.00 | | | | 0.00 | |
| | | | | | | | | | | | | | | | | | | | |
Total distributions to shareholders | | | (0.40 | ) | | | (0.36 | ) | | | (0.34 | ) | | | (0.29 | ) | | | (0.34 | ) |
Net asset value, end of period | | | $24.03 | | | | $20.46 | | | | $20.01 | | | | $18.70 | | | | $18.23 | |
Total return1 | | | 19.59 | % | | | 4.00 | % | | | 8.87 | % | | | 4.30 | % | | | 4.82 | % |
Ratios to average net assets (annualized) | | | | | | | | | | | | | | | | | | | | |
Gross expenses | | | 1.19 | % | | | 1.17 | % | | | 1.18 | % | | | 1.20 | % | | | 1.22 | % |
Net expenses | | | 1.14 | % | | | 1.14 | % | | | 1.14 | % | | | 1.14 | % | | | 1.14 | % |
Net investment income | | | 1.47 | % | | | 1.60 | % | | | 1.79 | % | | | 1.73 | % | | | 1.57 | % |
Supplemental data | | | | | | | | | | | | | | | | | | | | |
Portfolio turnover rate | | | 10 | % | | | 7 | % | | | 22 | % | | | 15 | % | | | 29 | % |
Net assets, end of period (000s omitted) | | | $337,848 | | | | $287,047 | | | | $308,152 | | | | $315,238 | | | | $341,342 | |
| 1 | Total return calculations do not include any sales charges. |
The accompanying notes are an integral part of these financial statements.
| | | | | | |
| Financial highlights | | Wells Fargo Utility and Telecommunications Fund | | | 17 | |
(For a share outstanding throughout each period)
| | | | | | | | | | | | | | | | | | | | |
| | | Year ended March 31 | |
| CLASS C | | 2019 | | | 2018 | | | 2017 | | | 2016 | | | 2015 | |
Net asset value, beginning of period | | | $20.47 | | | | $20.01 | | | | $18.70 | | | | $18.25 | | | | $17.73 | |
Net investment income | | | 0.16 | 1 | | | 0.13 | | | | 0.16 | | | | 0.17 | 1 | | | 0.15 | |
Net realized and unrealized gains (losses) on investments | | | 3.63 | | | | 0.52 | | | | 1.34 | | | | 0.45 | | | | 0.57 | |
| | | | | | | | | | | | | | | | | | | | |
Total from investment operations | | | 3.79 | | | | 0.65 | | | | 1.50 | | | | 0.62 | | | | 0.72 | |
Distributions to shareholders from | | | | | | | | | | | | | | | | | | | | |
Net investment income | | | (0.14 | ) | | | (0.19 | ) | | | (0.19 | ) | | | (0.17 | ) | | | (0.20 | ) |
Net realized gains | | | (0.06 | ) | | | 0.00 | | | | 0.00 | | | | 0.00 | | | | 0.00 | |
| | | | | | | | | | | | | | | | | | | | |
Total distributions to shareholders | | | (0.20 | ) | | | (0.19 | ) | | | (0.19 | ) | | | (0.17 | ) | | | (0.20 | ) |
Net asset value, end of period | | | $24.06 | | | | $20.47 | | | | $20.01 | | | | $18.70 | | | | $18.25 | |
Total return2 | | | 18.65 | % | | | 3.24 | % | | | 8.04 | % | | | 3.49 | % | | | 4.04 | % |
Ratios to average net assets (annualized) | | | | | | | | | | | | | | | | | | | | |
Gross expenses | | | 1.94 | % | | | 1.92 | % | | | 1.93 | % | | | 1.95 | % | | | 1.97 | % |
Net expenses | | | 1.89 | % | | | 1.89 | % | | | 1.89 | % | | | 1.89 | % | | | 1.89 | % |
Net investment income | | | 0.74 | % | | | 0.85 | % | | | 1.02 | % | | | 0.99 | % | | | 0.82 | % |
Supplemental data | | | | | | | | | | | | | | | | | | | | |
Portfolio turnover rate | | | 10 | % | | | 7 | % | | | 22 | % | | | 15 | % | | | 29 | % |
Net assets, end of period (000s omitted) | | | $19,618 | | | | $41,729 | | | | $51,123 | | | | $57,431 | | | | $63,632 | |
| 1 | Calculated based upon average shares outstanding |
| 2 | Total return calculations do not include any sales charges. |
The accompanying notes are an integral part of these financial statements.
| | | | |
| 18 | | Wells Fargo Utility and Telecommunications Fund | | Financial highlights |
(For a share outstanding throughout each period)
| | | | | | | | | | | | | | | | | | | | |
| | | Year ended March 31 | |
| ADMINISTRATOR CLASS | | 2019 | | | 2018 | | | 2017 | | | 2016 | | | 2015 | |
Net asset value, beginning of period | | | $20.48 | | | | $20.03 | | | | $18.72 | | | | $18.25 | | | | $17.73 | |
Net investment income | | | 0.36 | | | | 0.37 | | | | 0.38 | | | | 0.34 | | | | 0.33 | |
Net realized and unrealized gains (losses) on investments | | | 3.65 | | | | 0.48 | | | | 1.30 | | | | 0.45 | | | | 0.56 | |
| | | | | | | | | | | | | | | | | | | | |
Total from investment operations | | | 4.01 | | | | 0.85 | | | | 1.68 | | | | 0.79 | | | | 0.89 | |
Distributions to shareholders from | | | | | | | | | | | | | | | | | | | | |
Net investment income | | | (0.38 | ) | | | (0.40 | ) | | | (0.37 | ) | | | (0.32 | ) | | | (0.37 | ) |
Net realized gains | | | (0.06 | ) | | | 0.00 | | | | 0.00 | | | | 0.00 | | | | 0.00 | |
| | | | | | | | | | | | | | | | | | | | |
Total distributions to shareholders | | | (0.44 | ) | | | (0.40 | ) | | | (0.37 | ) | | | (0.32 | ) | | | (0.37 | ) |
Net asset value, end of period | | | $24.05 | | | | $20.48 | | | | $20.03 | | | | $18.72 | | | | $18.25 | |
Total return | | | 19.80 | % | | | 4.21 | % | | | 9.04 | % | | | 4.49 | % | | | 5.01 | % |
Ratios to average net assets (annualized) | | | | | | | | | | | | | | | | | | | | |
Gross expenses | | | 1.11 | % | | | 1.09 | % | | | 1.10 | % | | | 1.09 | % | | | 1.06 | % |
Net expenses | | | 0.95 | % | | | 0.95 | % | | | 0.95 | % | | | 0.95 | % | | | 0.95 | % |
Net investment income | | | 1.66 | % | | | 1.80 | % | | | 1.93 | % | | | 1.93 | % | | | 1.79 | % |
Supplemental data | | | | | | | | | | | | | | | | | | | | |
Portfolio turnover rate | | | 10 | % | | | 7 | % | | | 22 | % | | | 15 | % | | | 29 | % |
Net assets, end of period (000s omitted) | | | $5,296 | | | | $4,702 | | | | $5,168 | | | | $6,740 | | | | $8,365 | |
The accompanying notes are an integral part of these financial statements.
| | | | | | |
| Financial highlights | | Wells Fargo Utility and Telecommunications Fund | | | 19 | |
(For a share outstanding throughout each period)
| | | | | | | | | | | | | | | | | | | | |
| | | Year ended March 31 | |
| INSTITUTIONAL CLASS | | 2019 | | | 2018 | | | 2017 | | | 2016 | | | 2015 | |
Net asset value, beginning of period | | | $20.45 | | | | $20.00 | | | | $18.69 | | | | $18.23 | | | | $17.74 | |
Net investment income | | | 0.41 | | | | 0.41 | | | | 0.42 | | | | 0.36 | 1 | | | 0.35 | 1 |
Net realized and unrealized gains (losses) on investments | | | 3.62 | | | | 0.47 | | | | 1.30 | | | | 0.45 | | | | 0.54 | |
| | | | | | | | | | | | | | | | | | | | |
Total from investment operations | | | 4.03 | | | | 0.88 | | | | 1.72 | | | | 0.81 | | | | 0.89 | |
Distributions to shareholders from | | | | | | | | | | | | | | | | | | | | |
Net investment income | | | (0.41 | ) | | | (0.43 | ) | | | (0.41 | ) | | | (0.35 | ) | | | (0.40 | ) |
Net realized gains | | | (0.06 | ) | | | 0.00 | | | | 0.00 | | | | 0.00 | | | | 0.00 | |
| | | | | | | | | | | | | | | | | | | | |
Total distributions to shareholders | | | (0.47 | ) | | | (0.43 | ) | | | (0.41 | ) | | | (0.35 | ) | | | (0.40 | ) |
Net asset value, end of period | | | $24.01 | | | | $20.45 | | | | $20.00 | | | | $18.69 | | | | $18.23 | |
Total return | | | 20.03 | % | | | 4.38 | % | | | 9.26 | % | | | 4.63 | % | | | 5.02 | % |
Ratios to average net assets (annualized) | | | | | | | | | | | | | | | | | | | | |
Gross expenses | | | 0.86 | % | | | 0.84 | % | | | 0.85 | % | | | 0.84 | % | | | 0.79 | % |
Net expenses | | | 0.78 | % | | | 0.78 | % | | | 0.78 | % | | | 0.78 | % | | | 0.78 | % |
Net investment income | | | 1.83 | % | | | 1.95 | % | | | 2.18 | % | | | 2.03 | % | | | 1.89 | % |
Supplemental data | | | | | | | | | | | | | | | | | | | | |
Portfolio turnover rate | | | 10 | % | | | 7 | % | | | 22 | % | | | 15 | % | | | 29 | % |
Net assets, end of period (000s omitted) | | | $42,427 | | | | $31,548 | | | | $24,575 | | | | $15,295 | | | | $14,156 | |
| 1 | Calculated based upon average shares outstanding |
The accompanying notes are an integral part of these financial statements.
| | | | |
| 20 | | Wells Fargo Utility and Telecommunications Fund | | Notes to financial statements |
1. ORGANIZATION
Wells Fargo Funds Trust (the “Trust”), a Delaware statutory trust organized on March 10, 1999, is an open-end management investment company registered under the Investment Company Act of 1940, as amended (the “1940 Act”). As an investment company, the Trust follows the accounting and reporting guidance in Financial Accounting Standards Board (“FASB”) Accounting Standards Codification Topic 946, Financial Services – Investment Companies. These financial statements report on the Wells Fargo Utility and Telecomunications Fund (the “Fund”) which is a non-diversified series of the Trust.
Effective at the close of business on May 5, 2017, Class B shares were converted to Class A shares and are no longer offered by the Fund. Information for Class B shares reflected in the financial statements represents activity through May 5, 2017.
2. SIGNIFICANT ACCOUNTING POLICIES
The following significant accounting policies, which are consistently followed in the preparation of the financial statements of the Fund, are in conformity with U.S. generally accepted accounting principles which require management to make estimates and assumptions that affect the reported amounts of assets and liabilities, disclosure of contingent assets and liabilities at the date of the financial statements, and the reported amounts of revenues and expenses during the reporting period. Actual results could differ from those estimates.
Securities valuation
All investments are valued each business day as of the close of regular trading on the New York Stock Exchange (generally 4 p.m. Eastern Time), although the Fund may deviate from this calculation time under unusual or unexpected circumstances.
Equity securities that are listed on a foreign or domestic exchange or market are valued at the official closing price or, if none, the last sales price. If no sale occurs on the principal exchange or market that day, a fair value price will be determined in accordance with the Fund’s Valuation Procedures.
The values of securities denominated in foreign currencies are translated into U.S. dollars at rates provided by an independent foreign currency pricing source at a time each business day specified by the Wells Fargo Asset Management Pricing Committee at Wells Fargo Funds Management, LLC (“Funds Management”).
Many securities markets and exchanges outside the U.S. close prior to the close of the New York Stock Exchange and therefore may not fully reflect trading or events that occur after the close of the principal exchange in which the foreign securities are traded, but before the close of the New York Stock Exchange. If such trading or events are expected to materially affect the value of such securities, then fair value pricing procedures approved by the Board of Trustees of the Fund are applied. These procedures take into account multiple factors including movements in U.S. securities markets after foreign exchanges close. Foreign securities that are fair valued under these procedures are categorized as Level 2 and the application of these procedures may result in transfers between Level 1 and Level 2. Depending on market activity, such fair valuations may be frequent. Such fair value pricing may result in net asset values that are higher or lower than net asset values based on the last reported sales price or latest quoted bid price. On March 31, 2019 such fair value pricing was not used in pricing foreign securities.
Investments in registered open-end investment companies are valued at net asset value. Interests in non-registered investment companies that are redeemable at net asset value are fair valued normally at net asset value.
Investments which are not valued using any of the methods discussed above are valued at their fair value, as determined in good faith by the Board of Trustees. The Board of Trustees has established a Valuation Committee comprised of the Trustees and has delegated to it the authority to take any actions regarding the valuation of portfolio securities that the Valuation Committee deems necessary or appropriate, including determining the fair value of portfolio securities, unless the determination has been delegated to the Wells Fargo Asset Management Pricing Committee. The Board of Trustees retains the authority to make or ratify any valuation decisions or approve any changes to the Valuation Procedures as it deems appropriate. On a quarterly basis, the Board of Trustees receives reports on any valuation actions taken by the Valuation Committee or the Wells Fargo Asset Management Pricing Committee which may include items for ratification.
Foreign currency translation
The accounting records of the Fund are maintained in U.S. dollars. The values of other assets and liabilities denominated in foreign currencies are translated into U.S. dollars at rates provided by an independent foreign currency pricing source at a time each business day specified by the Wells Fargo Asset Management Pricing Committee. Purchases and sales of
| | | | | | |
| Notes to financial statements | | Wells Fargo Utility and Telecommunications Fund | | | 21 | |
securities, and income and expenses are converted at the rate of exchange on the respective dates of such transactions. Net realized foreign exchange gains or losses arise from sales of foreign currencies, currency gains or losses realized between the trade and settlement dates on securities transactions, and the difference between the amounts of dividends, interest and foreign withholding taxes recorded and the U.S. dollar equivalent of the amounts actually paid or received. Net unrealized foreign exchange gains and losses arise from changes in the fair value of assets and liabilities other than investments in securities resulting from changes in exchange rates. The changes in net assets arising from changes in exchange rates of securities and the changes in net assets resulting from changes in market prices of securities are not separately presented. Such changes are included in net realized and unrealized gains or losses from investments.
Securities lending
The Fund may lend its securities from time to time in order to earn additional income in the form of fees or interest on securities received as collateral or the investment of any cash received as collateral. The Fund continues to receive interest or dividends on the securities loaned. The Fund receives collateral in the form of cash or securities with a value at least equal to the value of the securities on loan. The value of the loaned securities is determined at the close of each business day and any additional required collateral is delivered to the Fund on the next business day. In a securities lending transaction, the net asset value of the Fund will be affected by an increase or decrease in the value of the securities loaned and by an increase or decrease in the value of the instrument in which collateral is invested. The amount of securities lending activity undertaken by the Fund fluctuates from time to time. In the event of default or bankruptcy by the borrower, the Fund may be prevented from recovering the loaned securities or gaining access to the collateral or may experience delays or costs in doing so. In addition, the investment of any cash collateral received may lose all or part of its value. The Fund has the right under the lending agreement to recover the securities from the borrower on demand.
The Fund lends its securities through an unaffiliated securities lending agent. Cash collateral received in connection with its securities lending transactions is invested in Securities Lending Cash Investments, LLC (the “Securities Lending Fund”). The Securities Lending Fund is exempt from registration under Section 3(c)(7) of the 1940 Act and is managed by Funds Management and is subadvised by Wells Capital Management Incorporated (“WellsCap”), an affiliate of Funds Management and an indirect wholly owned subsidiary of Wells Fargo & Company (“Wells Fargo”). Funds Management receives an advisory fee starting at 0.05% and declining to 0.01% as the average daily net assets of the Securities Lending Fund increase. All of the fees received by Funds Management are paid to WellsCap for its services as subadviser. The Securities Lending Fund seeks to provide a positive return compared to the daily Fed Funds Open Rate by investing in high-quality, U.S. dollar-denominated short-term money market instruments. Securities Lending Fund investments are valued at the evaluated bid price provided by an independent pricing service. Income earned from investment in the Securities Lending Fund (net of fees and rebates), if any, is included in income from affiliated securities on the Statement of Operations.
Security transactions and income recognition
Securities transactions are recorded on a trade date basis. Realized gains or losses are recorded on the basis of identified cost.
Dividend income is recognized on the ex-dividend date, except for certain dividends from foreign securities, which are recorded as soon as the custodian verifies the ex-dividend date. Dividend income from foreign securities is recorded net of foreign taxes withheld where recovery of such taxes is not assured.
Distributions to shareholders
Distributions to shareholders are recorded on the ex-dividend date and paid from net investment income quarterly and any net realized gains are paid at least annually. Such distributions are determined in accordance with income tax regulations and may differ from U.S. generally accepted accounting principles. Dividend sources are estimated at the time of declaration. The tax character of distributions is determined as of the Fund’s fiscal year end. Therefore, a portion of the Fund’s distributions made prior to the Fund’s fiscal year end may be categorized as a tax return of capital at year end.
Federal and other taxes
The Fund intends to continue to qualify as a regulated investment company by distributing substantially all of its investment company taxable income and any net realized capital gains (after reduction for capital loss carryforwards) sufficient to relieve it from all, or substantially all, federal income taxes. Accordingly, no provision for federal income taxes was required.
| | | | |
| 22 | | Wells Fargo Utility and Telecommunications Fund | | Notes to financial statements |
The Fund’s income and federal excise tax returns and all financial records supporting those returns for the prior three fiscal years are subject to examination by the federal and Delaware revenue authorities. Management has analyzed the Fund’s tax positions taken on federal, state, and foreign tax returns for all open tax years and does not believe that there are any uncertain tax positions that require recognition of a tax liability.
As of March 31, 2019, the aggregate cost of all investments for federal income tax purposes was $156,602,275 and the unrealized gains (losses) consisted of:
| | | | |
| |
Gross unrealized gains | | $ | 247,869,899 | |
| |
Gross unrealized losses | | | (359,721 | ) |
| |
Net unrealized gains | | $ | 247,510,178 | |
Class allocations
The separate classes of shares offered by the Fund differ principally in applicable sales charges, distribution, shareholder servicing, and administration fees. Class specific expenses are charged directly to that share class. Investment income, common expenses, and realized and unrealized gains (losses) on investments are allocated daily to each class of shares based on the relative proportion of net assets of each class.
3. FAIR VALUATION MEASUREMENTS
Fair value measurements of investments are determined within a framework that has established a fair value hierarchy based upon the various data inputs utilized in determining the value of the Fund’s investments. The three-level hierarchy gives the highest priority to unadjusted quoted prices in active markets for identical assets or liabilities (Level 1) and the lowest priority to unobservable inputs (Level 3). The Fund’s investments are classified within the fair value hierarchy based on the lowest level of input that is significant to the fair value measurement. The inputs are summarized into three broad levels as follows:
| ∎ | | Level 1 – quoted prices in active markets for identical securities |
| ∎ | | Level 2 – other significant observable inputs (including quoted prices for similar securities, interest rates, prepayment speeds, credit risk, etc.) |
| ∎ | | Level 3 – significant unobservable inputs (including the Fund’s own assumptions in determining the fair value of investments) |
The inputs or methodologies used for valuing investments in securities are not necessarily an indication of the risk associated with investing in those securities.
The following is a summary of the inputs used in valuing the Fund’s assets and liabilities as of March 31, 2019:
| | | | | | | | | | | | | | | | |
| | | | |
| | | Quoted prices (Level 1) | | | Other significant
observable inputs
(Level 2) | | | Significant
unobservable inputs (Level 3) | | | Total | |
| | | | |
Assets | | | | | | | | | | | | | | | | |
Investments in: | | | | | | | | | | | | | | | | |
| | | | |
Common stocks | | | | | | | | | | | | | | | | |
| | | | |
Communication services | | $ | 58,732,096 | | | $ | 0 | | | $ | 0 | | | $ | 58,732,096 | |
| | | | |
Financials | | | 1,308,988 | | | | 0 | | | | 0 | | | | 1,308,988 | |
| | | | |
Industrials | | | 2,342,535 | | | | 0 | | | | 0 | | | | 2,342,535 | |
| | | | |
Information technology | | | 64,539,050 | | | | 0 | | | | 0 | | | | 64,539,050 | |
| | | | |
Utilities | | | 256,499,793 | | | | 0 | | | | 0 | | | | 256,499,793 | |
| | | | |
Preferred stocks | | | | | | | | | | | | | | | | |
| | | | |
Utilities | | | 10,034,750 | | | | 0 | | | | 0 | | | | 10,034,750 | |
| | | | |
Short-term investments | | | | | | | | | | | | | | | | |
| | | | |
Investment companies | | | 10,518,041 | | | | 137,200 | | | | 0 | | | | 10,655,241 | |
| | | | |
Total assets | | $ | 403,975,253 | | | $ | 137,200 | | | $ | 0 | | | $ | 404,112,453 | |
Additional sector, industry or geographic detail is included in the Portfolio of Investments.
At March 31, 2019, the Fund did not have any transfers into/out of Level 3.
| | | | | | |
| Notes to financial statements | | Wells Fargo Utility and Telecommunications Fund | | | 23 | |
4. TRANSACTIONS WITH AFFILIATES AND OTHER EXPENSES
Management fee
Funds Management, an indirect wholly owned subsidiary of Wells Fargo, is the manager of the Fund and provides advisory and fund-level administrative services under an investment management agreement. Under the investment management agreement, Funds Management is responsible for, among other services, implementing the investment objectives and strategies of the Fund, supervising the subadviser and providing fund-level administrative services in connection with the Fund’s operations. As compensation for its services under the investment management agreement, Funds Management is entitled to receive a management fee at the following annual rate based on the Fund’s average daily net assets:
| | | | |
| Average daily net assets | | Management fee | |
| |
First $500 million | | | 0.650 | % |
| |
Next $500 million | | | 0.600 | % |
| |
Next $1 billion | | | 0.550 | % |
| |
Next $2 billion | | | 0.525 | % |
| |
Next $1 billion | | | 0.500 | % |
| |
Next $5 billion | | | 0.490 | % |
| |
Over $10 billion | | | 0.480 | % |
For the year ended March 31, 2019, the management fee was equivalent to an annual rate of 0.65% of the Fund’s average daily net assets.
Funds Management has retained the services of a subadviser to provide daily portfolio management to the Fund. The fee for subadvisory services is borne by Funds Management. Crow Point Partners, LLC, which is not an affiliate of Funds Management, is the subadviser to the Fund and is entitled to receive a fee from Funds Management at an annual rate starting at 0.20% and declining to 0.10% as the average daily net assets of the Fund increase.
Administration fees
Under a class-level administration agreement, Funds Management provides class-level administrative services to the Fund, which includes paying fees and expenses for services provided by the transfer agent, sub-transfer agents, omnibus account servicers and record-keepers. As compensation for its services under the class-level administration agreement, Funds Management receives an annual fee which is calculated based on the average daily net assets of each class as follows:
| | | | |
| | | Class-level
administration fee | |
| |
Class A, Class C | | | 0.21 | % |
| |
Administrator Class, Institutional Class | | | 0.13 | |
Funds Management has contractually waived and/or reimbursed management and administration fees to the extent necessary to maintain certain net operating expense ratios for the Fund. When each class of the Fund has exceeded its expense cap, Funds Management has waived fees and/or reimbursed expenses from fund level expenses on a proportionate basis and then from class specific expenses. When only certain classes exceed their expense caps, waivers and/or reimbursements are applied against class specific expenses before fund level expenses. Funds Management has committed through July 31, 2019 to waive fees and/or reimburse expenses to the extent necessary to cap the Fund’s expenses at 1.14% for Class A shares, 1.89% for Class C shares, and 0.95% for Administrator Class shares, and 0.78% for Institutional Class. Prior to or after the commitment expiration date, the cap may be increased or the commitment to maintain the cap may be terminated only with the approval of the Board of Trustees.
Distribution fee
The Trust has adopted a distribution plan for Class C shares of the Fund pursuant to Rule 12b-1 under the 1940 Act. A distribution fee is charged to Class C shares and paid to Wells Fargo Funds Distributor, LLC (“Funds Distributor”), the principal underwriter, at an annual rate of 0.75% of the average daily net assets of Class C shares.
In addition, Funds Distributor is entitled to receive the front-end sales charge from the purchase of Class A shares and a contingent deferred sales charge on the redemption of certain Class A shares. Funds Distributor is also entitled to receive
| | | | |
| 24 | | Wells Fargo Utility and Telecommunications Fund | | Notes to financial statements |
the contingent deferred sales charges from redemptions of Class C shares. For the year ended March 31, 2019, Funds Distributor received $12,077 from the sale of Class A shares. No contingent deferred sales charges were incurred by Class A and Class C shares for the year ended March 31, 2019.
Shareholder servicing fees
The Trust has entered into contracts with one or more shareholder servicing agents, whereby Class A, Class C, and Administrator Class of the Fund are charged a fee at an annual rate of 0.25% of the average daily net assets of each respective class. A portion of these total shareholder servicing fees were paid to affiliates of Wells Fargo.
Interfund transactions
The Fund may purchase or sell portfolio investment securities to certain other Wells Fargo affiliates pursuant to Rule 17a-7 under the 1940 Act and under procedures adopted by the Board of Trustees. The procedures have been designed to ensure that these interfund transactions, which do not incur broker commissions, are effected at current market prices. Pursuant to these procedures, the Fund had $5,316,910 and $9,503,004 in interfund purchases and sales, respectively, during the year ended March 31, 2019.
5. INVESTMENT PORTFOLIO TRANSACTIONS
Purchases and sales of investments, excluding U.S. government obligations (if any) and short-term securities, for the year ended March 31, 2019 were $36,756,795 and $57,035,066, respectively.
6. BANK BORROWINGS
The Trust (excluding the money market funds), Wells Fargo Master Trust and Wells Fargo Variable Trust are parties to a $280,000,000 revolving credit agreement whereby the Fund is permitted to use bank borrowings for temporary or emergency purposes, such as to fund shareholder redemption requests. Interest under the credit agreement is charged to the Fund based on a borrowing rate equal to the higher of the Federal Funds rate in effect on that day plus 1.25% or the overnight LIBOR rate in effect on that day plus 1.25%. In addition, an annual commitment fee equal to 0.25% of the unused balance is allocated to each participating fund.
For the ended March 31, 2019, there were no borrowings by the Fund under the agreement.
7. DISTRIBUTIONS TO SHAREHOLDERS
The tax character of distributions paid during the years ended March 31, 2019 and March 31, 2018 were as follows:
| | | | | | | | |
| | | Year ended March 31 | |
| | |
| | | 2019 | | | 2018 | |
| | |
Ordinary income | | $ | 5,554,488 | | | $ | 6,305,952 | |
| | |
Long-term capital gain | | | 1,000,182 | | | | 0 | |
As of March 31, 2019, the components of distribution earnings on a tax basis were as follows:
| | | | |
Undistributed ordinary income | | Undistributed long-term gain | | Unrealized gains |
| | |
| $250,975 | | $3,079,037 | | $247,490,587 |
Effective for all filings after November 4, 2018, the Securities and Exchange Commission eliminated the requirement to separately state the components of distributions to shareholders under U.S. generally accepted accounting principles. The amounts of distributions to shareholders for the year ended March 31, 2018 were as follows:
| | | | |
| | | Net investment
income | |
| |
Class A | | | $5,216,624 | |
| |
Class C | | | 426,300 | |
| |
Administrator Class | | | 90,935 | |
| |
Institutional Class | | | 572,093 | |
8. CONCENTRATION RISK
The Fund invests a substantial portion of its assets in utility companies and, therefore, may be more affected by changes in the utility sector than would be a fund whose investments are not heavily weighted in any sector.
| | | | | | |
| Notes to financial statements | | Wells Fargo Utility and Telecommunications Fund | | | 25 | |
9. INDEMNIFICATION
Under the Trust’s organizational documents, the officers and Trustees have been granted certain indemnification rights against certain liabilities that may arise out of performance of their duties to the Trust. Additionally, in the normal course of business, the Trust may enter into contracts with service providers that contain a variety of indemnification clauses. The Trust’s maximum exposure under these arrangements is dependent on future claims that may be made against the Fund and, therefore, cannot be estimated.
10. NEW ACCOUNTING PRONOUNCEMENT
In August 2018, FASB issued Accounting Standards Update (“ASU”) No. 2018-13, Fair Value Measurement (Topic 820)Disclosure Framework – Changes to the Disclosure Requirements for Fair Value Measurement. ASU 2018-13 updates the disclosure requirements for fair value measurements by modifying or removing certain disclosures and adding certain new disclosures. The amendments are effective for fiscal years, and interim periods within those fiscal years, beginning after December 15, 2019. Early adoption is permitted. Management has adopted the removal and modification of disclosures early, as permitted, and will adopt the additional new disclosures at the effective date.
| | | | |
| 26 | | Wells Fargo Utility and Telecommunications Fund | | Report of independent registered public accounting firm |
TO THE SHAREHOLDERS OF THE FUND AND BOARD OF TRUSTEES OF WELLS FARGO FUNDS TRUST:
Opinion on the Financial Statements
We have audited the accompanying statement of assets and liabilities of Wells Fargo Utility and Telecommunications Fund (the Fund), one of the funds constituting Wells Fargo Funds Trust, including the portfolio of investments, as of March 31, 2019, the related statement of operations for the year then ended, the statements of changes in net assets for each of the years in the two-year period then ended, and the related notes (collectively, the financial statements) and the financial highlights for each of the years in the five-year period then ended. In our opinion, the financial statements and financial highlights present fairly, in all material respects, the financial position of the Fund as of March 31, 2019, the results of its operations for the year then ended, the changes in its net assets for each of the years in the two-year period then ended, and the financial highlights for each of the years in the five-year period then ended, in conformity with U.S. generally accepted accounting principles.
Basis for Opinion
These financial statements and financial highlights are the responsibility of the Fund’s management. Our responsibility is to express an opinion on these financial statements and financial highlights based on our audits. We are a public accounting firm registered with the Public Company Accounting Oversight Board (United States) (PCAOB) and are required to be independent with respect to the Fund in accordance with the U.S. federal securities laws and the applicable rules and regulations of the Securities and Exchange Commission and the PCAOB.
We conducted our audits in accordance with the standards of the PCAOB. Those standards require that we plan and perform the audit to obtain reasonable assurance about whether the financial statements and financial highlights are free of material misstatement, whether due to error or fraud. Our audits included performing procedures to assess the risks of material misstatement of the financial statements and financial highlights, whether due to error or fraud, and performing procedures that respond to those risks. Such procedures included examining, on a test basis, evidence regarding the amounts and disclosures in the financial statements and financial highlights. Such procedures also included confirmation of securities owned as of March 31, 2019, by correspondence with the custodian and brokers, or by other appropriate auditing procedures. Our audits also included evaluating the accounting principles used and significant estimates made by management, as well as evaluating the overall presentation of the financial statements and financial highlights. We believe that our audits provide a reasonable basis for our opinion.

We have not been able to determine the specific year that we began serving as the auditor of one or more Wells Fargo Funds investment companies; however we are aware that we have served as the auditor of one or more Wells Fargo Funds investment companies since at least 1955.
Boston, Massachusetts
May 29, 2019
| | | | | | |
| Other information (unaudited) | | Wells Fargo Utility and Telecommunications Fund | | | 27 | |
TAX INFORMATION
For corporate shareholders, pursuant to Section 854 of the Internal Revenue Code, 100% of ordinary income dividends qualify for the corporate dividends-received deduction for the fiscal year ended March 31, 2019.
Pursuant to Section 852 of the Internal Revenue Code, $1,000,182 was designated as a 20% rate gain distribution for the fiscal year ended March 31, 2019.
Pursuant to Section 854 of the Internal Revenue Code, $5,554,488 of income dividends paid during the fiscal year ended March 31, 2019 has been designated as qualified dividend income (QDI).
For the fiscal year ended March 31, 2019, $71,806 has been designed as interest-related dividends for nonresident alien shareholders pursuant to Section 871 of the Internal Revenue Code.
PROXY VOTING INFORMATION
A description of the policies and procedures used to determine how to vote proxies relating to portfolio securities is available, upon request, by calling1-800-222-8222, visiting our website at wfam.com, or visiting the SEC website at sec.gov. Information regarding how the Fund voted proxies relating to portfolio securities during the most recent 12-month period ended June 30 is available on the Fund’s website atwfam.comor by visiting the SEC website at sec.gov.
PORTFOLIO HOLDINGS INFORMATION
The complete portfolio holdings for the Fund are publicly available monthly on the Fund’s website (wfam.com), on a one-month delayed basis. In addition, top ten holdings information (excluding derivative positions) for the Fund is publicly available on the Fund’s website on a monthly, seven-day or more delayed basis. The Fund files its complete schedule of portfolio holdings with the SEC for the first and third quarters of each fiscal year on Form N-Q, which is available by visiting the SEC website at sec.gov. In addition, the Fund’s Form N-Q may be reviewed and copied at the SEC’s Public Reference Room in Washington, DC, and at regional offices in New York City, at 233 Broadway, and in Chicago, at 175 West Jackson Boulevard, Suite 900. Information about the Public Reference Room may be obtained by calling 1-800-SEC-0330.
| | | | |
| 28 | | Wells Fargo Utility and Telecommunications Fund | | Other information (unaudited) |
BOARD OF TRUSTEES AND OFFICERS
Each of the Trustees and Officers1 listed in the table below acts in identical capacities for each fund in the Wells Fargo family of funds, which consists of 151 mutual funds comprising the Wells Fargo Funds Trust, Wells Fargo Variable Trust, Wells Fargo Master Trust and four closed-end funds (collectively the “Fund Complex”). This table should be read in conjunction with the Prospectus and the Statement of Additional Information2. The mailing address of each Trustee and Officer is 525 Market Street, 12th Floor, San Francisco, CA 94105. Each Trustee and Officer serves an indefinite term, however, each Trustee serves such term until reaching the mandatory retirement age established by the Trustees.
Independent Trustees
| | | | | | |
Name and year of birth | | Position held and length of service* | | Principal occupations during past five years or longer | | Current other public company or
investment company
directorships |
| | | |
William R. Ebsworth (Born 1957) | | Trustee, since 2015 | | Retired. From 1984 to 2013, equities analyst, portfolio manager, research director and chief investment officer at Fidelity Management and Research Company in Boston, Tokyo, and Hong Kong, and retired in 2013 as Chief Investment Officer of Fidelity Strategic Advisers, Inc. where he led a team of investment professionals managing client assets. Prior thereto, Board member of Hong Kong Securities Clearing Co., Hong Kong Options Clearing Corp., the Thailand International Fund, Ltd., Fidelity Investments Life Insurance Company, and Empire Fidelity Investments Life Insurance Company. Audit Committee Chair and Investment Committee Chair of the Vincent Memorial Hospital Endowment (non-profit organization). Mr. Ebsworth is a CFA® charterholder. | | N/A |
| | | |
Jane A. Freeman (Born 1953) | | Trustee, since 2015; Chair Liaison, since 2018 | | Retired. From 2012 to 2014 and 1999 to 2008, Chief Financial Officer of Scientific Learning Corporation. From 2008 to 2012, Ms. Freeman provided consulting services related to strategic business projects. Prior to 1999, Portfolio Manager at Rockefeller & Co. and Scudder, Stevens & Clark. Board member of the Harding Loevner Funds from 1996 to 2014, serving as both Lead Independent Director and chair of the Audit Committee. Board member of the Russell Exchange Traded Funds Trust from 2011 to 2012 and the chair of the Audit Committee. Ms. Freeman is a Board Member of The Ruth Bancroft Garden (non-profit organization). She is also an inactive Chartered Financial Analyst. | | N/A |
| | | |
Isaiah Harris, Jr.3 (Born 1952) | | Trustee, since 2009; Audit Committee Chairman, since 2019 | | Retired. Chairman of the Board of CIGNA Corporation since 2009, and Director since 2005. From 2003 to 2011, Director of Deluxe Corporation. Prior thereto, President and CEO of BellSouth Advertising and Publishing Corp. from 2005 to 2007, President and CEO of BellSouth Enterprises from 2004 to 2005 and President of BellSouth Consumer Services from 2000 to 2003. Emeritus member of the Iowa State University Foundation Board of Governors. Emeritus Member of the Advisory Board of Iowa State University School of Business. Advisory Board Member, Palm Harbor Academy (private school). Advisory Board Member, Child Evangelism Fellowship (non-profit). Mr. Harris is a certified public accountant (inactive status). | | CIGNA Corporation |
| | | |
Judith M. Johnson (Born 1949) | | Trustee, since 2008; Audit Committee Chairman, from 2009 to 2018 | | Retired. Prior thereto, Chief Executive Officer and Chief Investment Officer of Minneapolis Employees Retirement Fund from 1996 to 2008. Ms. Johnson is an attorney, certified public accountant and a certified managerial accountant. | | N/A |
| | | | | | |
| Other information (unaudited) | | Wells Fargo Utility and Telecommunications Fund | | | 29 | |
| | | | | | |
Name and year of birth | | Position held and length of service* | | Principal occupations during past five years or longer | | Current other public company or
investment company
directorships |
| | | |
David F. Larcker (Born 1950) | | Trustee, since 2009 | | James Irvin Miller Professor of Accounting at the Graduate School of Business, Stanford University, Director of the Corporate Governance Research Initiative and Senior Faculty of The Rock Center for Corporate Governance since 2006. From 2005 to 2008, Professor of Accounting at the Graduate School of Business, Stanford University. Prior thereto, Ernst & Young Professor of Accounting at The Wharton School, University of Pennsylvania from 1985 to 2005. | | N/A |
| | | |
Olivia S. Mitchell (Born 1953) | | Trustee, since 2006; Nominating and Governance Committee Chairman, since 2018 | | International Foundation of Employee Benefit Plans Professor, Wharton School of the University of Pennsylvania since 1993. Director of Wharton’s Pension Research Council and Boettner Center on Pensions & Retirement Research, and Research Associate at the National Bureau of Economic Research. Previously, Cornell University Professor from 1978 to 1993. | | N/A |
| | | |
Timothy J. Penny (Born 1951) | | Trustee, since 1996; Chairman, since 2018 | | President and Chief Executive Officer of Southern Minnesota Initiative Foundation, a non-profit organization, since 2007. Member of the Board of Trustees of NorthStar Education Finance, Inc., a non-profit organization, since 2007. | | N/A |
| | | |
James G. Polisson (Born 1959) | | Trustee, since 2018 | | Retired. Chief Marketing Officer, Source (ETF) UK Services, Ltd, from 2015 to 2017. From 2012 to 2015, Principal of The Polisson Group, LLC, a management consulting, corporate advisory and principal investing company. Chief Executive Officer and Managing Director at Russell Investments, Global Exchange Traded Funds from 2010 to 2012. Managing Director of Barclays Global Investors from 1998 to 2010 and Global Chief Marketing Officer for iShares and Barclays Global Investors from 2000 to 2010. Trustee of the San Francisco Mechanics’ Institute, a non-profit organization, from 2013 to 2015. Board member of the Russell Exchange Traded Fund Trust from 2011 to 2012. Director of Barclays Global Investors Holdings Deutschland GmbH from 2006 to 2009. Mr. Polisson is an attorney and has a retired status with the Massachusetts and District of Columbia Bar Associations. | | N/A |
| | | |
Pamela Wheelock (Born 1959) | | Trustee, since 2018 | | Board member of the Destination Medical Center Economic Development Agency, Rochester, Minnesota since 2019. Chief Operating Officer, Twin Cities Habitat for Humanity from 2017 to 2019. Vice President of University Services, University of Minnesota from 2012 to 2016. Prior thereto, on the Board of Directors, Governance Committee and Finance Committee for the Minnesota Philanthropy Partners (Saint Paul Foundation) from 2012 to 2018, Interim Chief Executive Officer of Blue Cross Blue Shield of Minnesota from 2011 to 2012, Chairman of the Board from 2009 to 2012 and Board Director from 2003 to 2015. Vice President, Leadership and Community Engagement, Bush Foundation, Saint Paul, Minnesota (a private foundation) from 2009 to 2011. Executive Vice President and Chief Financial Officer, Minnesota Sports and Entertainment from 2004 to 2009 and Senior Vice President from 2002 to 2004. Executive Vice President of the Minnesota Wild Foundation from 2004 to 2008. Commissioner of Finance, State of Minnesota, from 1999 to 2002. Currently Board Chair of the Minnesota Wild Foundation since 2010. | | N/A |
| * | Length of service dates reflect the Trustee’s commencement of service with the Trust’s predecessor entities, where applicable. |
| | | | |
| 30 | | Wells Fargo Utility and Telecommunications Fund | | Other information (unaudited) |
Officers
| | | | | | |
Name and year of birth | | Position held and length of service | | Principal occupations during past five years or longer | | |
| | | |
Andrew Owen (Born 1960) | | President, since 2017 | | Executive Vice President of Wells Fargo & Company and Head of Affiliated Managers, Wells Fargo Asset Management, since 2014. In addition, Mr. Owen is currently President, Chief Executive Officer and Director of Wells Fargo Funds Management, LLC since 2017. Prior thereto, Executive Vice President responsible for marketing, investments and product development for Wells Fargo Funds Management, LLC, from 2009 to 2014. | | |
| | | |
Nancy Wiser1 (Born 1967) | | Treasurer, since 2012 | | Executive Vice President of Wells Fargo Funds Management, LLC since 2011. Chief Operating Officer and Chief Compliance Officer at LightBox Capital Management LLC, from 2008 to 2011. | | |
| | | |
Alexander Kymn (Born 1973) | | Secretary and Chief Legal Officer, since 2018 | | Senior Company Counsel of Wells Fargo Bank, N.A. since 2018 (previously Senior Counsel from 2007 to 2018). Vice President of Wells Fargo Funds Management, LLC from 2008 to 2014. | | |
| | | |
Michael H. Whitaker (Born 1967) | | Chief Compliance Officer, since 2016 | | Senior Vice President and Chief Compliance Officer since 2016. Senior Vice President and Chief Compliance Officer for Fidelity Investments from 2007 to 2016. | | |
| | | |
David Berardi (Born 1975) | | Assistant Treasurer, since 2009 | | Vice President of Wells Fargo Funds Management, LLC since 2009. Vice President of Evergreen Investment Management Company, LLC from 2008 to 2010. Manager of Fund Reporting and Control for Evergreen Investment Management Company, LLC from 2004 to 2010. | | |
| | | |
Jeremy DePalma1 (Born 1974) | | Assistant Treasurer, since 2009 | | Senior Vice President of Wells Fargo Funds Management, LLC since 2009. Senior Vice President of Evergreen Investment Management Company, LLC from 2008 to 2010 and head of the Fund Reporting and Control Team within Fund Administration from 2005 to 2010. | | |
| 1 | Nancy Wiser acts as Treasurer of 65 funds in the Fund Complex. Jeremy DePalma acts as Treasurer of 86 funds and Assistant Treasurer of 65 funds in the Fund Complex. |
| 2 | The Statement of Additional Information includes additional information about the Trustees and is available, without charge, upon request, by calling 1-800-222-8222 or by visiting the website atwfam.com. |
| 3 | Mr. Harris became Chairman of the Audit Committee effective January 1, 2019. |
| | | | | | |
| Appendix A (unaudited) | | Wells Fargo Utility and Telecommunications Fund | | | 31 | |
SALES CHARGE REDUCTIONS AND WAIVERS FOR CERTAIN INTERMEDIARIES
Raymond James & Associates, Inc., Raymond James Financial Services & Raymond James affiliates (“Raymond James”)
Effective on or about March 1, 2019, shareholders purchasing Fund shares through a Raymond James platform or account will be eligible only for the following load waivers (front-end sales charge waivers and contingent deferred, or back-end, sales charge waivers) and discounts, which may differ from those disclosed elsewhere in the Fund’s Prospectus or SAI.
Front-end Sales Load Waivers on Class A shares Available at Raymond James
| | • | | Shares purchased in an investment advisory program. |
| | • | | Shares purchased through reinvestment of capital gains distributions and dividend reinvestment when purchasing shares of the same fund (but not any other fund within the fund family). |
| | • | | Employees and registered representatives of Raymond James or its affiliates and their family members as designated by Raymond James. |
| | • | | Shares purchased from the proceeds of redemptions within the same fund family, provided (1) the repurchase occurs within 90 days following the redemption, (2) the redemption and purchase occur in the same account, and (3) redeemed shares were subject to a front-end or deferred sales load (known as Rights of Reinstatement). |
| | • | | A shareholder in the fund’s Class C shares will have their shares automatically exchanged at net asset value to Class A shares (or the appropriate share class) of the fund if the shares are no longer subject to a CDSC and the exchange is in line with the policies and procedures of Raymond James. |
CDSC Waivers on Class A and C Shares Available at Raymond James
| | • | | Death or disability of the shareholder. |
| | • | | Shares sold as part of a systematic withdrawal plan as described in the Fund’s Prospectus. |
| | • | | Return of excess contributions from an IRA Account. |
| | • | | Shares sold as part of a required minimum distribution for IRA and retirement accounts due to the shareholder reaching age 70½ as described in the Fund’s prospectus. |
| | • | | Shares sold to pay Raymond James fees but only if the transaction is initiated by Raymond James. |
| | • | | Shares acquired through a right of reinstatement. |
Front-end Load Discounts Available at Raymond James: Breakpoints, and/or Rights of Accumulation
| | • | | Breakpoints as described in the Fund’s Prospectus. |
| | • | | Rights of accumulation which entitle shareholders to breakpoint discounts will be automatically calculated based on the aggregated holding of fund family assets held by accounts within the purchaser’s household at Raymond James. Eligible fund family assets not held at Raymond James may be included in the rights of accumulation calculation only if the shareholder notifies his or her financial advisor about such assets. |
This page is intentionally left blank.

For more information
More information about Wells Fargo Funds is available free upon request. To obtain literature, please write, visit the Fund’s website, or call:
Wells Fargo Funds
P.O. Box 219967
Kansas City, MO 64121-9967
Website: wfam.com
Individual investors: 1-800-222-8222
Retail investment professionals: 1-888-877-9275
Institutional investment professionals:
1-866-765-0778
This report and the financial statements contained herein are submitted for the general information of the shareholders of the Fund. If this report is used for promotional purposes, distribution of the report must be accompanied or preceded by a current prospectus. Before investing, please consider the investment objectives, risks, charges, and expenses of the investment. For a current prospectus and, if available, a summary prospectus, containing this information, call1-800-222-8222 or visit the Fund’s website atwfam.com. Read the prospectus carefully before you invest or send money.
Wells Fargo Asset Management (WFAM) is the trade name for certain investment advisory/management firms owned by Wells Fargo & Company. These firms include but are not limited to Wells Capital Management Incorporated and Wells Fargo Funds Management, LLC. Certain products managed by WFAM entities are distributed by Wells Fargo Funds Distributor, LLC (a broker-dealer and Member FINRA).
This material is for general informational and educational purposes only and is NOT intended to provide investment advice or a recommendation of any kind—including a recommendation for any specific investment, strategy, or plan.
INVESTMENT PRODUCTS: NOT FDIC INSURED ◾ NO BANK GUARANTEE ◾ MAY LOSE VALUE
© 2019 Wells Fargo Funds Management, LLC. All rights reserved.
| | |
 | | 401598 05-19 A318/AR318 03-19 |
ITEM 2. CODE OF ETHICS
(a) As of the end of the period covered by the report, Wells Fargo Funds Trust has adopted a code of ethics that applies to its President and Treasurer. A copy of the code of ethics is filed as an exhibit to this FormN-CSR.
(c) During the period covered by this report, there were no amendments to the provisions of the code of ethics adopted in Item 2(a) above.
(d) During the period covered by this report, there were no implicit or explicit waivers to the provisions of the code of ethics adopted in Item 2(a) above.
ITEM 3. AUDIT COMMITTEE FINANCIAL EXPERT
The Board of Trustees of Wells Fargo Funds Trust has determined that Judith Johnson is an audit committee financial expert, as defined in Item 3 of FormN-CSR. Mrs. Johnson is independent for purposes of Item 3 of FormN-CSR.
ITEM 4. PRINCIPAL ACCOUNTANT FEES AND SERVICES
(a), (b), (c), (d) The following table presents aggregate fees billed in each of the last two fiscal years for services rendered to the Registrant by the Registrant’s principal accountant. These fees were billed to the registrant and were approved by the Registrant’s audit committee.
| | | | | | | | |
| | | Fiscal
year ended
March 31, 2019 | | | Fiscal
year ended
March 31, 2018 | |
Audit fees | | $ | 299,890 | | | $ | 295,730 | |
Audit-related fees | | | — | | | | — | |
Tax fees (1) | | | 41,385 | | | | 40,565 | |
All other fees | | | — | | | | — | |
| | | | | | | | |
| | $ | 341,275 | | | $ | 336,295 | |
| | | | | | | | |
| (1) | Tax fees consist of fees for tax compliance, tax advice, tax planning and excise tax. |
(e) The Chairman of the Audit Committees is authorized topre-approve: (1) audit services for the mutual funds of Wells Fargo Funds Trust;(2) non-audit tax or compliance consulting or training services provided to the Funds by the independent auditors (“Auditors”) if the fees for any particular engagement are not anticipated to exceed $50,000; and(3) non-audit tax or compliance consulting or training services provided by the Auditors to a Fund’s investment adviser and its controlling entities (wherepre-approval is required because the engagement relates directly to the operations and financial reporting of the Fund) if the fee to the Auditors for any particular engagement is not anticipated to exceed $50,000. For any suchpre-approval sought from the Chairman, Management shall prepare a brief description of the proposed services. If the Chairman approves of such service, he or she shall sign the statement prepared by Management. Such written statement shall be presented to the full Committees at their next regularly scheduled meetings.
(f) Not applicable
(g) Not applicable
(h) Not applicable
ITEM 5. AUDIT COMMITTEE OF LISTED REGISTRANTS
Not applicable.
ITEM 6. INVESTMENTS
A Portfolio of Investments for each series of Wells Fargo Funds Trust is included as part of the report to shareholders filed under Item 1 of this Form.
ITEM 7. DISCLOSURE OF PROXY VOTING POLICIES AND PROCEDURES FORCLOSED-END MANAGEMENT INVESTMENT COMPANIES
Not applicable.
ITEM 8. PORTFOLIO MANAGERS OFCLOSED-END MANAGEMENT INVESTMENT COMPANIES
Not applicable.
ITEM 9. PURCHASES OF EQUITY SECURITIES BYCLOSED-END MANAGEMENT INVESTMENT COMPANY AND AFFILIATED PURCHASERS
Not applicable.
ITEM 10. SUBMISSION OF MATTERS TO A VOTE OF SECURITY HOLDERS
There have been no material changes to the procedures by which shareholders may recommend nominees to the registrant’s Board of Trustees that have been implemented since the registrant’s last provided disclosure in response to the requirements of this Item.
ITEM 11. CONTROLS AND PROCEDURES
(a) The President and Treasurer have concluded that the Wells Fargo Funds Trust disclosure controls and procedures (as defined inRule 30a-3(c) under the Investment Company Act of 1940) provide reasonable assurances that material information relating to the registrant is made known to them by the appropriate persons based on their evaluation of these controls and procedures as of a date within 90 days of the filing of this report.
(b) There were no significant changes in the registrant’s internal controls over financial reporting (as defined in Rule30a-3(d) under the Investment Company Act of 1940) that occurred during the most recent fiscal quarter of the period covered by this report that materially affected, or is reasonably likely to materially affect, the registrant’s internal control over financial reporting.
ITEM 12. DISCLOSURES OF SECURITIES LENDING ACTIVITES FORCLOSED-END MANAGEMENT INVESTMENT COMPANIES
Not applicable.
ITEM 13. EXHIBITS
(a)(1) Code of Ethics pursuant to Item 2 of FormN-CSR is filed and attached hereto as Exhibit COE.
(a)(2) Certification pursuant to Rule30a-2(a) under the Investment Company Act of 1940 (17 CFR270.30a-2(a)) is filed and attached hereto as Exhibit 99.CERT.
(b) Certification pursuant to Rule30a-2(b) under the Investment Company Act of 1940 (17 CFR270.30a-2(b)) is filed and attached hereto as Exhibit 99.906CERT.
SIGNATURES
Pursuant to the requirements of the Securities Exchange Act of 1934 and the Investment Company Act of 1940, the registrant has duly caused this report to be signed on its behalf by the undersigned, thereunto duly authorized.
| | |
| Wells Fargo Funds Trust |
| |
| By: | | |
| | /s/ Andrew Owen |
| |
| | Andrew Owen |
| | President |
| |
| Date: | | May 29, 2019 |
Pursuant to the requirements of the Securities Exchange Act of 1934 and the Investment Company Act of 1940, this report has been signed below by the following persons on behalf of the registrant and in the capacities and on the date indicated.
| | |
| Wells Fargo Funds Trust |
| |
| By: | | |
| | /s/ Andrew Owen |
| |
| | Andrew Owen |
| | President |
| |
| Date: | | May 29, 2019 |
| |
| By: | | |
| | /s/ Nancy Wiser |
| |
| | Nancy Wiser |
| | Treasurer |
| |
| Date: | | May 29, 2019 |